
UNITED STATES
SECURITIES AND EXCHANGE COMMISSION
Washington, D.C. 20549
FORMN-CSR
CERTIFIED SHAREHOLDER REPORT OF REGISTERED
MANAGEMENT INVESTMENT COMPANIES
Investment Company Act file number:811-09253
Wells Fargo Funds Trust
(Exact name of registrant as specified in charter)
525 Market St., San Francisco, CA 94105
(Address of principal executive offices) (Zip code)
Alexander Kymn
Wells Fargo Funds Management, LLC
525 Market St., San Francisco, CA 94105
(Name and address of agent for service)
Registrant’s telephone number, including area code:800-222-8222
Date of fiscal year end: May 31
Registrant is making a filing for 16 of its series:
Wells Fargo Growth Balanced Fund, Wells Fargo Moderate Balanced Fund, Wells Fargo C&B Large Cap Value Fund, Wells Fargo Diversified Equity Fund, Wells Fargo Emerging Growth Fund, Wells Fargo Index Fund, Wells Fargo International Value Fund, Wells Fargo Small Company Growth Fund, Wells Fargo Small Company Value Fund, Wells Fargo Core Bond Fund, Wells Fargo Real Return Fund, Wells Fargo WealthBuilder Conservative Allocation Fund, Wells Fargo WealthBuilder Growth Allocation Fund, Wells Fargo WealthBuilder Growth Balanced Fund, Wells Fargo WealthBuilder Moderate Balanced Fund, Wells Fargo WealthBuilder Equity Fund.
Date of reporting period: May 31, 2019
| ITEM 1. | REPORT TO STOCKHOLDERS |
Annual Report
May 31, 2019

Wells Fargo Growth Balanced Fund

Beginning on January 1, 2021, as permitted by new regulations adopted by the Securities and Exchange Commission, paper copies of the Wells Fargo Funds’ annual and semi-annual shareholder reports issued after this date will no longer be sent by mail, unless you specifically request paper copies of the reports. Instead, the reports will be made available on the Funds’ website, and you will be notified by mail each time a report is posted and provided with a website address to access the report.
If you already elected to receive shareholder reports electronically, you will not be affected by this change and you need not take any action. You may elect to receive shareholder reports and other communications from the Fund electronically at any time by contacting your financial intermediary (such as a broker-dealer or bank) or, if you are a direct investor, by calling 1-800-222-8222 or by enrolling at wellsfargo.com/advantagedelivery.
You may elect to receive all future reports in paper free of charge. If you invest through a financial intermediary, you can contact your financial intermediary to request that you continue to receive paper copies of your shareholder reports; if you invest directly with the Fund, you can call 1-800-222-8222. Your election to receive reports in paper will apply to all Wells Fargo Funds held in your account with your financial intermediary or, if you are a direct investor, to all Wells Fargo Funds that you hold.

Reduce clutter. Save trees.
Sign up for electronic delivery of prospectuses and shareholder reports atwellsfargo.com/advantagedelivery
Contents
The views expressed and any forward-looking statements are as of May 31, 2019, unless otherwise noted, and are those of the Fund managers and/or Wells Fargo Asset Management. Discussions of individual securities, or the markets generally, or any Wells Fargo Fund are not intended as individual recommendations. Future events or results may vary significantly from those expressed in any forward-looking statements. The views expressed are subject to change at any time in response to changing circumstances in the market. Wells Fargo Asset Management and the Fund disclaim any obligation to publicly update or revise any views expressed or forward-looking statements.
INVESTMENT PRODUCTS: NOT FDIC INSURED ◾ NO BANK GUARANTEE ◾ MAY LOSE VALUE
| | | | |
| 2 | | Wells Fargo Growth Balanced Fund | | Letter to shareholders (unaudited) |

Andrew Owen
President
Wells Fargo Funds
Dear Shareholder:
We are pleased to offer you this annual report for the Wells Fargo Growth Balanced Fund for the 12-month period that ended May 31, 2019. Highershort-term interest rates, inflation concerns, trade tensions, and geopolitical events drove investment market volatility for much of 2018, particularly for international stocks. Early 2019 saw stocks and bonds gain with renewed business and investor confidence, but volatility returned late in the period as global growth slowed and geopolitical concerns persisted.
For the period, U.S. stocks, based on the S&P 500 Index,1 gained 3.78% and international stocks, as measured by the MSCI ACWI ex USA Index (Net),2 fell 6.26%. Based on the MSCI EM Index (Net),3 emerging market stocks fell 8.70%. Bond investors saw the Bloomberg Barclays U.S. Aggregate Bond Index4 add 6.40% while the Bloomberg Barclays Global Aggregate ex-USD Index5 rose 0.39%. The Bloomberg Barclays Municipal Bond Index6 added 6.40%, and the ICE BofAML U.S. High Yield Index7 was up 5.37%.
Results for investment indices reflected global concerns.
Global trade tensions escalated during the second quarter of 2018. A tit-for-tat tariff spat intensified between the U.S. and other governments. The U.S. Federal Reserve (Fed) raised the federal funds rate by 25 basis points (bps; 100 bps equal 1.00%) to a target range of between 1.75% and 2.00% in June. Market index results reflected the global concerns. The MSCI ACWI ex USA Index (Net) lost 2.61%, while the Bloomberg Barclays Global Aggregate ex-USD Index dropped 4.76%.
Not all news was bad. The U.S. Bureau of Economic Analysis reported second-quarter annualized gross domestic product (GDP) growth of 4.2%. Hiring improved. Unemployment declined. Consumer confidence and spending increased. The S&P 500 Index recorded a 3.43% second-quarter gain. Stocks of companies with smaller capitalizations did even better, as measured by the Russell 2000® Index,8 adding 7.75%.
| 1 | The S&P 500 Index consists of 500 stocks chosen for market size, liquidity, and industry group representation. It is a market-value-weighted index with each stock’s weight in the index proportionate to its market value. You cannot invest directly in an index. |
| 2 | The Morgan Stanley Capital International (MSCI) All Country World Index (ACWI) ex USA Index (Net) is a free-float-adjusted market-capitalization-weighted index that is designed to measure the equity market performance of developed and emerging markets, excluding the U.S. Source: MSCI. MSCI makes no express or implied warranties or representations and shall have no liability whatsoever with respect to any MSCI data contained herein. The MSCI data may not be further redistributed or used as a basis for other indices or any securities or financial products. This report is not approved, reviewed, or produced by MSCI. You cannot invest directly in an index. |
| 3 | The MSCI Emerging Markets (EM) Index (Net) is a free-float-adjusted market-capitalization-weighted index that is designed to measure the equity market performance of emerging markets. You cannot invest directly in an index. |
| 4 | The Bloomberg Barclays U.S. Aggregate Bond Index is a broad-based benchmark that measures the investment-grade, U.S.-dollar-denominated, fixed-rate taxable bond market, including Treasuries, government-related and corporate securities, mortgage-backed securities (agency fixed-rate and hybrid adjustable-rate mortgage pass-throughs), asset-backed securities, and commercial mortgage-backed securities. You cannot invest directly in an index. |
| 5 | The Bloomberg Barclays Global Aggregate ex-USD Index is an unmanaged index that provides a broad-based measure of the global investment-grade fixed-income markets excluding the U.S.-dollar-denominated debt market. You cannot invest directly in an index. |
| 6 | The Bloomberg Barclays Municipal Bond Index is an unmanaged index composed of long-term tax-exempt bonds with a minimum credit rating of Baa. You cannot invest directly in an index. |
| 7 | The ICE BofAML U.S. High Yield Index is a market-capitalization-weighted index of domestic and Yankee high-yield bonds. The index tracks the performance of high-yield securities traded in the U.S. bond market. You cannot invest directly in an index. Copyright 2019. ICE Data Indices, LLC. All rights reserved. |
| 8 | The Russell 2000® Index measures the performance of the 2,000 smallest companies in the Russell 3000® Index, which represents approximately 8% of the total market capitalization of the Russell 3000® Index. You cannot invest directly in an index. |
| | | | | | |
| Letter to shareholders (unaudited) | | Wells Fargo Growth Balanced Fund | | | 3 | |
Investors appeared to shake off lingering concerns during the third quarter.
Favorable third-quarter economic indicators and corporate earnings reports encouraged domestic stock investors. U.S. trade negotiations with Mexico and Canada progressed. The Conference Board Consumer Confidence Index®9 reached its highest level in 18 years during September 2018. The Fed raised the federal funds rate by 25 bps to a target range of between 2.00% and 2.25% in September. For the quarter that ended September 30, 2018, the S&P 500 Index added 7.71%.
Investors in international markets were not as confident. Tensions between the U.S. and China increased. The U.S. imposed $200 billion in tariffs on Chinese goods. China reacted with $60 billion in tariffs on U.S. goods. Economic growth in China caused concern. The Bank of England (BoE) raised its monetary policy rate to 0.75% in August 2018. During the quarter, the MSCI ACWI ex USA Index (Net) gained 0.71%. The MSCI EM Index (Net) declined 1.09%. In fixed-income markets, U.S. bonds were flat, as measured by the Bloomberg Barclays U.S. Aggregate Bond Index. The Bloomberg Barclays Global Aggregate ex-USD Index fell 1.74%.
Conflicting data unsettled markets during the fourth quarter.
November’s U.S. midterm elections shifted control of the House of Representatives from Republicans to Democrats, presaging potential partisan clashes. Third-quarter U.S. GDP was announced at an annualized 3.4% rate, lower than the second-quarter rate. Brexit efforts stalled ahead of the March 2019 deadline. The People’s Bank of China cut reserve requirement ratios, accelerated infrastructure spending, and cut taxes even as the value of the yuan declined to low levels last seen in 2008.
December’s S&P 500 Index performance was the worst since 1931. Globally,fixed-income investments fared better than stocks during the last two months of the year. The Fed increased the federal funds rate by 25 bps in December 2018 to a target range of between 2.25% and 2.50%.
The market climbs a wall of worry.
Investors entered 2019 with reasons to be concerned. A partial U.S. government shutdown driven by partisan policy disputes extended into January. Investment returns appeared to reaffirm the adage that markets climb a wall of worry. The S&P 500 Index gained 8.01% for the month of January, the best monthly performance in 30 years. Returns for the MSCI ACWI ex USA Index (Net), the Bloomberg Barclays U.S. Aggregate Bond Index, and the Bloomberg Barclays Global Aggregate ex-USD Index also were positive. The Fed indicated that it would pause its program of regular rate increases during 2019 as inflation remained low.
In February 2019, concerns over slowing global growth reemerged. The Bureau of Economic Analysis announced fourth-quarter 2018 GDP grew at an annualized 2.2% rate, down from levels of the prior two quarters. In a February report, the BoE forecast the slowest growth since the financial crisis for 2019. China and the U.S. continued to wrangle over trade issues.
By the end of March 2019, the combination of dovish Fed sentiment and consistent, if not spectacular, economic and business metrics reinforced investors’ confidence. Monthly job creation data regained momentum. Corporate profits, while lower than 2018’s lofty levels, remained solid. China announced a roughly $300 billion stimulus package through tax and fee cuts intended to reinvigorate economic growth.
December’s S&P 500 Index performance was the worst since 1931.
The S&P 500 Index gained 8.01% for the month of January, the best monthly performance in 30 years.
| 9 | The Conference Board Consumer Confidence Index® measures the degree of optimism on the state of the U.S. economy that consumers are expressing through their activities of saving and spending. You cannot invest directly in an index. |
| | | | |
| 4 | | Wells Fargo Growth Balanced Fund | | Letter to shareholders (unaudited) |
During April 2019, several broad-based U.S. equity indices reached or approached highs as investors drew confidence from favorable economic projections, sustained low inflation, and solid employment data. First-quarter GDP showed the economy grew at an annualized rate of 3.2% on improvement in business investment and exports. Favorable sentiment extended to foreign markets as the MSCI ACWI ex USA Index (Net) gained 2.64% and the MSCI EM Index (Net) added 2.11% for the month.
May 2019 presented investors with mixed signals in the economy, in the markets, and politically. In the U.S., partisan wrangling ramped up as Democrats and Republicans set their sights on 2020 presidential politics. In the U.K., the Brexit stalemate resulted in the resignation of Prime Minister Theresa May. The European Commission downgraded the 2019 growth forecast for the block of countries to 1.2%. The U.S. increased tariffs on products from China, China responded, and then talks broke down. Ending the month, equities, as measured by the MSCI ACWI (Net),10 dropped 5.93% while bonds, often considered a less risky investment, gained 1.04%, as measured by the Bloomberg Barclays Global Aggregate ex-USD Index.
Don’t let short-term uncertainty derail long-term investment goals.
Periods of investment uncertainty can present challenges, but experience has taught us that maintaining long-term investment goals can be an effective way to plan for the future. To help you create a sound strategy based on your personal goals and risk tolerance, Wells Fargo Funds offers more than 100 mutual funds spanning a wide range of asset classes and investment styles. Although diversification cannot guarantee an investment profit or prevent losses, we believe it can be an effective way to manage investment risk and potentially smooth out overall portfolio performance. We encourage investors to know their investments and to understand that appropriate levels of risk-taking may unlock opportunities.
Thank you for choosing to invest with Wells Fargo Funds. We appreciate your confidence in us and remain committed to helping you meet your financial needs.
Sincerely,

Andrew Owen
President
Wells Fargo Funds
For further information about your Fund, contact your investment professional, visit our website atwfam.com, or call us directly at1-800-222-8222.
| 10 | The MSCI ACWI (Net) is a free-float-adjusted market-capitalization-weighted index that is designed to measure the equity market performance of developed and emerging markets. You cannot invest directly in an index. |
This page is intentionally left blank.
| | | | |
| 6 | | Wells Fargo Growth Balanced Fund | | Performance highlights (unaudited) |
Investment objective
The Fund seeks total return, consisting of capital appreciation and current income.
Manager
Wells Fargo Funds Management, LLC
Subadviser
Wells Capital Management Incorporated
Portfolio managers
Kandarp R. Acharya, CFA®‡, FRM
Petros N. Bocray, CFA®‡, FRM
Christian L. Chan, CFA®‡
Average annual total returns (%) as of May 31, 2019
| | | | | | | | | | | | | | | | | | | | | | | | | | | | | | | | | | |
| | | | | Including sales charge | | | Excluding sales charge | | | Expense ratios1 (%) | |
| | | Inception date | | 1 year | | | 5 year | | | 10 year | | | 1 year | | | 5 year | | | 10 year | | | Gross | | | Net2 | |
| | | | | | | | | |
| Class A (WFGBX) | | 10-14-1998 | | | -5.24 | | | | 3.97 | | | | 9.05 | | | | 0.53 | | | | 5.21 | | | | 9.70 | | | | 1.35 | | | | 1.13 | |
| | | | | | | | | |
| Class C (WFGWX) | | 10-1-1998 | | | -1.23 | | | | 4.43 | | | | 8.88 | | | | -0.23 | | | | 4.43 | | | | 8.88 | | | | 2.10 | | | | 1.88 | |
| | | | | | | | | |
| Administrator Class (NVGBX) | | 11-11-1994 | | | – | | | | – | | | | – | | | | 0.70 | | | | 5.46 | | | | 9.96 | | | | 1.27 | | | | 0.95 | |
| | | | | | | | | |
| Growth Balanced Blended Index3 | | – | | | – | | | | – | | | | – | | | | 2.43 | | | | 6.08 | | | | 9.66 | | | | – | | | | – | |
| | | | | | | | | |
| Bloomberg Barclays U.S. Aggregate Bond Index4 | | – | | | – | | | | – | | | | – | | | | 6.40 | | | | 2.70 | | | | 3.83 | | | | – | | | | – | |
| | | | | | | | | |
| MSCI ACWI ex USA Index (Net)5 | | – | | | – | | | | – | | | | – | | | | -6.26 | | | | 1.31 | | | | 5.80 | | | | – | | | | – | |
| | | | | | | | | |
| Russell 3000® Index6 | | – | | | – | | | | – | | | | – | | | | 2.50 | | | | 9.25 | | | | 13.93 | | | | – | | | | – | |
Figures quoted represent past performance, which is no guarantee of future results, and do not reflect taxes that a shareholder may pay on fund distributions or the redemption of fund shares. Investment return and principal value of an investment will fluctuate so that an investor’s shares, when redeemed, may be worth more or less than their original cost. Performance shown without sales charges would be lower if sales charges were reflected. Current performance may be lower or higher than the performance data quoted, which assumes the reinvestment of dividends and capital gains. Current month-end performance is available on the Fund’s website,wfam.com.
Index returns do not include transaction costs associated with buying and selling securities, any mutual fund fees or expenses, or any taxes. It is not possible to invest directly in an index.
For Class A shares, the maximum front-end sales charge is 5.75%. For Class C shares, the maximum contingent deferred sales charge is 1.00%. Performance including a contingent deferred sales charge assumes the sales charge for the corresponding time period. Administrator Class shares are sold without a front-end sales charge or contingent deferred sales charge.
Balanced funds may invest in stocks and bonds. Stock values fluctuate in response to the activities of individual companies and general market and economic conditions. The use of derivatives may reduce returns and/or increase volatility. Certain investment strategies tend to increase the total risk of an investment (relative to the broader market). Bond values fluctuate in response to the financial condition of individual issuers, general market and economic conditions, and changes in interest rates. Changes in market conditions and government policies may lead to periods of heightened volatility in the bond market and reduced liquidity for certain bonds held by the Fund. In general, when interest rates rise, bond values fall and investors may lose principal value. Interest rate changes and their impact on the Fund and its share price can be sudden and unpredictable. The Fund is exposed to foreign investment risk, mortgage- and asset-backed securities risk, and smaller-company securities risk. Consult the Fund’s prospectus for additional information on these and other risks.
Please see footnotes on page 7.
| | | | | | |
| Performance highlights (unaudited) | | Wells Fargo Growth Balanced Fund | | | 7 | |
|
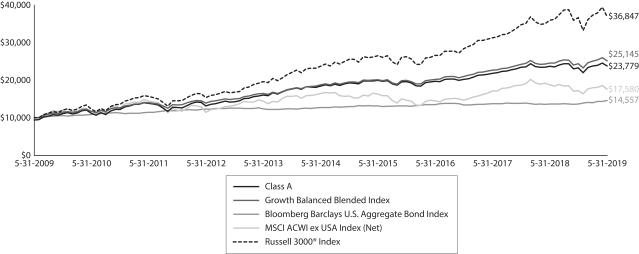
| Growth of $10,000 investment as of May 31, 20197 |
|
 |
| ‡ | CFA® and Chartered Financial Analyst® are trademarks owned by CFA Institute. |
| 1 | Reflects the expense ratios as stated in the most recent prospectuses, which include the impact of 0.51% in acquired fund fees and expenses. The expense ratios shown are subject to change and may differ from the annualized expense ratios shown in the financial highlights of this report, which do not include acquired fund fees and expenses. |
| 2 | The manager has contractually committed through September 30, 2019, to waive fees and/or reimburse expenses to the extent necessary to cap the expenses of each class after fee waivers at the amounts shown. Brokerage commissions, stamp duty fees, interest, taxes, acquired fund fees and expenses (if any) from funds in which the affiliated master portfolios and funds invest and from any money market funds, and extraordinary expenses are excluded from the expense cap. All other acquired fund fees and expenses from the affiliated master portfolios and funds are included in the expense caps. Prior to or after the commitment expiration date, the cap may be increased or the commitment to maintain the cap may be terminated only with the approval of the Board of Trustees. Without this cap, the Fund’s returns would have been lower. The expense ratio paid by an investor is the net expense ratio (the total annual fund operating expenses after fee waivers) as stated in the prospectuses. |
| 3 | Source: Wells Fargo Funds Management, LLC. The Growth Balanced Blended Index is composed 45% of the Russell 3000® Index, 35% of the Bloomberg Barclays U.S. Aggregate Bond Index, and 20% of the MSCI ACWI ex USA Index (Net). Prior to November 30, 2017, the Growth Balanced Blended Index was composed 35% of the Bloomberg Barclays U.S. Aggregate Bond Index, 16.25% of the Russell 1000® Growth Index, 16.25% of the Russell 1000® Value Index, 16.25% of the S&P 500 Index, 9.75% of the MSCI EAFE Index (Net), and 6.50% of the Russell 2000® Index. You cannot invest directly in an index. |
| 4 | The Bloomberg Barclays U.S. Aggregate Bond Index is a broad-based benchmark that measures the investment-grade, U.S. dollar–denominated, fixed-rate taxable bond market, including Treasuries, government-related and corporate securities, mortgage-backed securities (agency fixed-rate and hybrid adjustable-rate mortgage pass-throughs), asset-backed securities, and commercial mortgage-backed securities. You cannot invest directly in an index. |
| 5 | The Morgan Stanley Capital International (MSCI) All Country World Index (ACWI) ex USA Index (Net) is a free-float-adjusted market-capitalization-weighted index that is designed to measure the equity market performance of developed and emerging markets, excluding the U.S. Source: MSCI. MSCI makes no express or implied warranties or representations and shall have no liability whatsoever with respect to any MSCI data contained herein. The MSCI data may not be further redistributed or used as a basis for other indices or any securities or financial products. This report is not approved, reviewed, or produced by MSCI. You cannot invest directly in an index. |
| 6 | The Russell 3000® Index measures the performance of the 3,000 largest U.S. companies based on total market capitalization, which represents approximately 98% of the investable U.S. equity market. You cannot invest directly in an index. |
| 7 | The chart compares the performance of Class A shares for the most recent ten years with the Growth Balanced Blended Index, the Bloomberg Barclays U.S. Aggregate Bond Index, the MSCI ACWI ex USA Index (Net), and the Russell 3000® Index. The chart assumes a hypothetical $10,000 investment in Class A and reflects all operating expenses and assumes the maximum initial sales charge of 5.75%. |
| 8 | The ten largest holdings, excluding cash, cash equivalents and any money market funds, are calculated based on the value of the investments dividend by total net assets of the Fund. Holdings are subject to change and may have changed since the date specified. |
| 9 | Effective allocation includes the effect of any tactical futures overlay that may be in place. Effective cash is comprised of the net impact of long and/or short futures contracts held as part of a dynamic risk management strategy. These amounts are subject to change and may have changed since the date specified. |
| | | | |
| 8 | | Wells Fargo Growth Balanced Fund | | Performance highlights (unaudited) |
MANAGER’S DISCUSSION
Fund highlights
| ∎ | | The Fund underperformed the Growth Balanced Blended Index for the 12-month period that ended May 31, 2019. |
| ∎ | | Relative underperformance by two of the underlying domestic equity investments and one of the underlying international equity investments was the most significant detractor from performance over the period. |
| ∎ | | On a relative basis, one-third of underlying investments outperformed their respective benchmarks. |
| ∎ | | The tactical asset allocation (TAA) overlay, a futures strategy, added to performance through the period. |
Positive economic data and increased market volatility ruled most of the period.
The 12-month period that ended May 31, 2019, saw the U.S. economy continue on a positive trajectory, producing moderate average gross domestic product growth of 3.1% with a core inflation rate of 2.0%, while unemployment reached a low of 3.6%, the lowest level since 1969.
Over the last 12 months, the financial markets experienced more volatility than the favorable economic environment might have suggested. Looking back at the financial markets, we saw equities experience a significant decline during the fourth quarter of 2018, as concerns over a partial U.S. government shutdown, central bank tightening, trade tensions, and slowing economic growth shook investors’ confidence. The market volatility of the fourth quarter gave way to a first-quarter 2019 rebound where both equity and fixed-income markets rallied. The two markets seemed joined at the hip as the Federal Reserve’s (Fed’s) updated script signaled an easier policy path for the balance of 2019. Market participants were caught offside by this evolution in the projected policy path, which has resulted in a broader opportunity set for sector rotation in equities and yield curve trades. We saw a return of volatility toward the end of the 12-month period as concerns over trade (primarily with China and Mexico) caused concerns over global growth to weigh on investors’ minds.
| | | | |
| Ten largest holdings (%) as of May 31, 20198 | |
| |
Wells Fargo Managed Fixed Income Portfolio | | | 25.56 | |
| |
Wells Fargo Disciplined U.S. Core Fund Class R6 | | | 12.55 | |
| |
Wells Fargo Large Company Value Portfolio | | | 10.02 | |
| |
Wells Fargo International Value Portfolio | | | 9.83 | |
| |
Wells Fargo Diversified Large Cap Growth Portfolio | | | 9.50 | |
| |
Wells Fargo International Growth Portfolio | | | 9.03 | |
| |
Wells Fargo Core Bond Portfolio | | | 7.30 | |
| |
Wells Fargo Real Return Portfolio | | | 3.64 | |
| |
Wells Fargo C&B Large Cap Value Portfolio | | | 2.97 | |
| |
Wells Fargo Small Company Value Portfolio | | | 2.68 | |
Portfolio management addressed Fund allocations throughout the period.
Over the period, we made one significant change to the underlying portfolios used within the Fund. In the fourth quarter of 2018, we added three dedicated emerging market holdings to the portfolio. This change reflects our belief that gaining direct emerging market exposure from dedicated emerging market portfolio managers is preferable to relying on our developed market managers alone.
Within the Fund’s underlying holdings, the fixed-income holdings were the strongest contributors to performance on both a relative and an absolute basis. The Managed Fixed Income Portfolio is the largest fixed-income
holding in the portfolio. It returned more than 7% and outperformed the Bloomberg Barclays U.S. Aggregate Bond Index by 82 basis points (bps; 100 bps equal 1.00%). The underlying developed market international equity funds produced negative absolute returns and mixed relative performance results. The U.S. equity funds tended to produce positive absolute performance with mixed relative performance results. Poor relative performance from two U.S.-focused and two international equity managers was the primary detractor from performance.
| | | | | | | | |
| Allocations (%) as of May 31, 2019 | |
| | | Effective allocation9 | | | Neutral allocation | |
| | |
Bonds | | | 35 | | | | 35 | |
| | |
Stocks | | | 60 | | | | 65 | |
| | |
Effective Cash | | | 5 | | | | 0 | |
At the start of the period, the Fund’s targeted TAA overlay was 5.00% long in the S&P 500 futures contract. Due to volatility concerns, in early September, 2018, we reduced the position by 2.50%. In October, 2018, we added a total of 2.50%, bringing the position back to 5.00% long. During early November, 2018, we covered 1.25%. In early December, 2018, we added 2.50%, bringing the position
Please see footnotes on page 7.
| | | | | | |
| Performance highlights (unaudited) | | Wells Fargo Growth Balanced Fund | | | 9 | |
to 6.25%. As January, 2019, drew to a close, we covered 2.50%. In early February, 2019, we covered the remaining 3.75% and exited the position. With respect to the 10-year Treasury contract activity, we started the period short 2.50% and covered the position in early October, 2018. In mid-December, 2018, we established a new 2.50% short position and exited it in early March, 2019.
Looking ahead, we are somewhat cautiously optimistic.
Our macroeconomic view is that growth will remain positive but it will be slower over the next 12 months than it was over the preceding 12 months. However, we still hold that absent an exogenous shock—likely an implemented shift in trade policy—a U.S. recession is unlikely in 2019. As always, that view could change with new data. We are concerned about growth prospects in Europe and in the rest of the world but are most concerned about the U.S. trade negotiations with major trading partners. Until the trade negotiations move toward détente and more certainty builds to invoke more aggressive business planning resulting in further growth, we are taking a bit more of a cautious approach to the markets and have started to reduce some risks in the portfolios. Like the Fed, we remain very data dependent and acknowledge that while the U.S. economy may be softening, the levels of growth remain robust and 2019 should remain a target rich environment for investors.
| | | | |
| 10 | | Wells Fargo Growth Balanced Fund | | Fund expenses (unaudited) |
As a shareholder of the Fund, you incur two types of costs: (1) transaction costs, including sales charges (loads) on purchase payments and contingent deferred sales charges (if any) on redemptions and (2) ongoing costs, including management fees, distribution (12b-1) and/or shareholder servicing fees, and other Fund expenses. This example is intended to help you understand your ongoing costs (in dollars) of investing in the Fund and to compare these costs with the ongoing costs of investing in other mutual funds.
The example is based on an investment of $1,000 invested at the beginning of the six-month period and held for the entire period from December 1, 2018 to May 31, 2019.
Actual expenses
The “Actual” line of the table below provides information about actual account values and actual expenses. You may use the information in this line, together with the amount you invested, to estimate the expenses that you paid over the period. Simply divide your account value by $1,000 (for example, an $8,600 account value divided by $1,000 = 8.6), then multiply the result by the number in the “Actual” line under the heading entitled “Expenses paid during period” for your applicable class of shares to estimate the expenses you paid on your account during this period.
Hypothetical example for comparison purposes
The “Hypothetical” line of the table below provides information about hypothetical account values and hypothetical expenses based on the Fund’s actual expense ratio and an assumed rate of return of 5% per year before expenses, which is not the Fund’s actual return. The hypothetical account values and expenses may not be used to estimate the actual ending account balance or expenses you paid for the period. You may use this information to compare the ongoing costs of investing in the Fund and other funds. To do so, compare this 5% hypothetical example with the 5% hypothetical examples that appear in the shareholder reports of the other funds.
Please note that the expenses shown in the table are meant to highlight your ongoing costs only and do not reflect any transactional costs, such as sales charges (loads) and contingent deferred sales charges. Therefore, the “Hypothetical” line of the table is useful in comparing ongoing costs only and will not help you determine the relative total costs of owning different funds. In addition, if these transactional costs were included, your costs would have been higher.
| | | | | | | | | | | | | | | | |
| | | Beginning account value 12-1-2018 | | | Ending account value 5-31-2019 | | | Expenses paid during the period1,2 | | | Annualized net
expense ratio1 | |
Class A | | | | | | | | | | | | | | | | |
| | | | |
Actual | | $ | 1,000.00 | | | $ | 1,021.79 | | | $ | 5.36 | | | | 1.06 | % |
| | | | |
Hypothetical (5% return before expenses) | | $ | 1,000.00 | | | $ | 1,019.63 | | | $ | 5.36 | | | | 1.06 | % |
Class C | | | | | | | | | | | | | | | | |
| | | | |
Actual | | $ | 1,000.00 | | | $ | 1,018.14 | | | $ | 9.14 | | | | 1.82 | % |
| | | | |
Hypothetical (5% return before expenses) | | $ | 1,000.00 | | | $ | 1,015.88 | | | $ | 9.13 | | | | 1.82 | % |
Administrator Class | | | | | | | | | | | | | | | | |
| | | | |
Actual | | $ | 1,000.00 | | | $ | 1,022.79 | | | $ | 4.46 | | | | 0.88 | % |
| | | | |
Hypothetical (5% return before expenses) | | $ | 1,000.00 | | | $ | 1,020.52 | | | $ | 4.45 | | | | 0.88 | % |
| 1 | Amounts reflect net expenses allocated from the affiliated Master Portfolios in which the Fund invests. |
| 2 | Expenses paid is equal to the annualized net expense ratio of each class multiplied by the average account value over the period, multiplied by the number of days in the most recent fiscal half-year divided by the number of days in the fiscal year (to reflect the one-half-year period). |
| | | | | | |
| Portfolio of investments—May 31, 2019 | | Wells Fargo Growth Balanced Fund | | | 11 | |
| | | | | | | | | | | | | | | | |
| Security name | | | | | | | | Shares | | | Value | |
| | | | |
Exchange-Traded Funds: 2.38% | | | | | | | | | | | | | | | | |
| | | | |
Consumer Staples Select Sector SPDR Fund | | | | | | | | | | | 93,876 | | | $ | 5,220,443 | |
| | | | | | | | | | | | | | | | |
| | | | |
Total Exchange-Traded Funds (Cost $4,729,969) | | | | | | | | | | | | | | | 5,220,443 | |
| | | | | | | | | | | | | | | | |
| | | | |
Investment Companies: 99.38% | | | | | | | | | | | | | | | | |
| | | | |
| Affiliated Master Portfolios: 84.13% | | | | | | | | | | | | | | | | |
| | | | |
Wells Fargo C&B Large Cap Value Portfolio | | | | | | | | | | | | | | | 6,498,849 | |
| | | | |
Wells Fargo Core Bond Portfolio | | | | | | | | | | | | | | | 15,999,064 | |
| | | | |
Wells Fargo Diversified Large Cap Growth Portfolio | | | | | | | | | | | | | | | 20,815,550 | |
| | | | |
Wells Fargo Emerging Growth Portfolio | | | | | | | | | | | | | | | 2,466,780 | |
| | | | |
Wells Fargo Factor Enhanced Emerging Markets Portfolio | | | | | | | | | | | | | | | 2,966,177 | |
| | | | |
Wells Fargo International Growth Portfolio | | | | | | | | | | | | | | | 19,771,348 | |
| | | | |
Wells Fargo International Value Portfolio | | | | | | | | | | | | | | | 21,532,496 | |
| | | | |
Wells Fargo Large Company Value Portfolio | | | | | | | | | | | | | | | 21,943,619 | |
| | | | |
Wells Fargo Managed Fixed Income Portfolio | | | | | | | | | | | | | | | 55,996,700 | |
| | | | |
Wells Fargo Real Return Portfolio | | | | | | | | | | | | | | | 7,970,523 | |
| | | | |
Wells Fargo Small Company Growth Portfolio | | | | | | | | | | | | | | | 2,445,424 | |
| | | | |
Wells Fargo Small Company Value Portfolio | | | | | | | | | | | | | | | 5,876,983 | |
| | | | |
| | | | | | | | | | | | | | | 184,283,513 | |
| | | | | | | | | | | | | | | | |
| | | | |
| Affiliated Stock Funds: 15.25% | | | | | | | | | | | | | | | | |
| | | | |
Wells Fargo Disciplined U.S. Core Fund Class R6 | | | | | | | | | | | 1,688,112 | | | | 27,499,351 | |
| | | | |
Wells Fargo Emerging Markets Equity Fund Class R6 | | | | | | | | | | | 123,717 | | | | 2,927,150 | |
| | | | |
Wells Fargo Emerging Markets Equity Income Fund Class R6 | | | | | | | | | | | 279,883 | | | | 2,983,558 | |
| | | | |
| | | | | | | | | | | | | | | 33,410,059 | |
| | | | | | | | | | | | | | | | |
| | | | |
Total Investment Companies (Cost $197,877,832) | | | | | | | | | | | | | | | 217,693,572 | |
| | | | | | | | | | | | | | | | |
| | | | |
| | | Yield | | | Maturity date | | | Principal | | | | |
| Short-Term Investments: 0.31% | | | | | | | | | | | | | | | | |
| | | | |
| U.S. Treasury Securities: 0.31% | | | | | | | | | | | | | | | | |
| | | | |
U.S. Treasury Bill #(z) | | | 2.07 | % | | | 6-25-2019 | | | $ | 677,000 | | | | 676,055 | |
| | | | | | | | | | | | | | | | |
| | | | |
Total Short-Term Investments (Cost $676,030) | | | | | | | | | | | | | | | 676,055 | |
| | | | | | | | | | | | | | | | |
| | | | | | | | |
| Total investments in securities (Cost $203,283,831) | | | 102.07 | % | | | 223,590,070 | |
| | |
Other assets and liabilities, net | | | (2.07 | ) | | | (4,535,530 | ) |
| | | | | | | | |
| Total net assets | | | 100.00 | % | | $ | 219,054,540 | |
| | | | | | | | |
| # | All or a portion of this security is segregated as collateral for investments in derivative instruments. |
| (z) | Zero coupon security. The rate represents the current yield to maturity. |
Futures Contracts
| | | | | | | | | | | | | | | | | | | | | | | | |
| Description | | Number of
contracts | | | Expiration date | | | Notional cost | | | Notional value | | | Unrealized gains | | | Unrealized losses | |
| | | | | | |
Long | | | | | | | | | | | | | | | | | | | | | | | | |
| | | | | | |
Japanese Yen Futures | | | 101 | | | | 6-17-2019 | | | $ | 11,487,452 | | | $ | 11,661,082 | | | $ | 173,630 | | | $ | 0 | |
| | | | | | |
Short | | | | | | | | | | | | | | | | | | | | | | | | |
| | | | | | |
S&P 500 E-Mini Index | | | (73) | | | | 6-21-2019 | | | | (10,266,808 | ) | | | (10,046,990 | ) | | | 219,818 | | | | 0 | |
| | | | | | | | | | | | | | | | | | | | | | | | |
| | | | | | |
| | | | | | | | | | | | | | | | | | $ | 393,448 | | | $ | 0 | |
| | | | | | | | | | | | | | | | | | | | | | | | |
The accompanying notes are an integral part of these financial statements.
| | | | |
| 12 | | Wells Fargo Growth Balanced Fund | | Portfolio of investments—May 31, 2019 |
Investments in Affiliates
An affiliated investment is an investment in which the Fund owns at least 5% of the outstanding voting shares of the issuer or as a result of other relationships, such as the Fund and the issuer having the same investment manager or adviser. Transactions with issuers that were either affiliated persons of the Fund at the beginning of the period or the end of the period were as follows:
| | | | | | | | | | | | | | | | | | | | | | | | | | | | | | | | | | | | | | | | |
| | | Shares, beginning of period | | | Shares purchased | | | Shares sold | | | Shares, end of
period | | | Net realized gains (losses) on
affiliated
Underlying
Funds | | | Net realized
gains
(losses) on
capital gain
distributions
from
affiliated
Underlying
Funds | | | Net change in unrealized gains (losses) on
affiliated
Underlying
Funds | | | Dividends
from
affiliated
Underlying
Funds | | | Value, end of period | | | % of net assets | |
Investment Companies | | | | | | | | | | | | | | | | | | | | | | | | | | | | | | | | | | | | | | | | |
Affiliated Stock Funds | | | | | | | | | | | | | | | | | | | | | | | | | | | | | | | | | | | | | | | | |
Wells Fargo Disciplined U.S. Core Fund Class R6 | | | 1,767,866 | | | | 283,947 | | | | 363,701 | | | | 1,688,112 | | | $ | (394,227 | ) | | $ | 1,412,734 | | | $ | (1,306,671 | ) | | $ | 481,806 | | | $ | 27,499,351 | | | | | |
Wells Fargo Emerging Markets Equity Fund Class R6 | | | 0 | | | | 137,838 | | | | 14,121 | | | | 123,717 | | | | 37,670 | | | | 0 | | | | 208,150 | | | | 0 | | | | 2,927,150 | | | | | |
Wells Fargo Emerging Markets Equity Income Fund Class R6 | | | 0 | | | | 298,160 | | | | 18,277 | | | | 279,883 | | | | 16,810 | | | | 0 | | | | 100,213 | | | | 16,044 | | | | 2,983,558 | | | | | |
| | | | | | | | | | | | | | | | | | | | | | | | | | | | | | | | | | | | | | | | |
| | | | | | | | | | |
| | | | | | | | | | | | | | | | | | $ | (339,747 | ) | | $ | 1,412,734 | | | $ | (998,308 | ) | | $ | 497,850 | | | $ | 33,410,059 | | | | 15.25 | % |
| | | | | | | | | | | | | | | | | | | | | | | | | | | | | | | | | | | | | | | | |
Transactions with the affiliated Master Portfolios were as follows:
| | | | | | | | | | | | | | | | | | | | | | | | | | | | | | | | | | | | |
| | | % of
ownership,
beginning
of period | | | % of
ownership,
end of
period | | | Net realized
gains
(losses) on
securities
transactions
allocated
from
affiliated
Master
Portfolios | | | Net change in
unrealized
gains
(losses) on
securities
transactions
allocated
from
affiliated
Master
Portfolios | | | Interest
allocated
from
affiliated
Master
Portfolios | | | Dividends
allocated
from
affiliated
Master
Portfolios | | | Affiliated
income
allocated
from
affiliates
Master
Portfolios | | | Value, end of period | | | % of net
assets | |
Wells Fargo C&B Large Cap Value Portfolio | | | 1.66 | % | | | 1.85 | % | | $ | 1,047,347 | | | $ | (946,873 | ) | | $ | 0 | | | $ | 125,668 | | | $ | 3,313 | | | $ | 6,498,849 | | | | | |
Wells Fargo Core Bond Portfolio | | | 0.29 | | | | 0.27 | | | | (67,198 | ) | | | 554,143 | | | | 528,512 | | | | 0 | | | | 6,187 | | | | 15,999,064 | | | | | |
Wells Fargo Diversified Large Cap Growth Portfolio | | | 32.89 | | | | 8.30 | | | | 1,721,188 | | | | (1,845,418 | ) | | | 0 | | | | 319,716 | | | | 7,801 | | | | 20,815,550 | | | | | |
Wells Fargo Emerging Growth Portfolio | | | 0.41 | | | | 0.30 | | | | 520,363 | | | | (619,815 | ) | | | 0 | | | | 3,929 | | | | 3,996 | | | | 2,466,780 | | | | | |
Wells Fargo Factor Enhanced Emerging Markets Portfolio | | | 0.00 | | | | 1.17 | | | | 55,790 | | | | (14,788 | ) | | | 225 | | | | 30,930 | | | | 1,037 | | | | 2,966,177 | | | | | |
Wells Fargo International Growth Portfolio | | | 58.68 | | | | 9.46 | | | | (1,522,924 | ) | | | 734,497 | | | | 0 | | | | 477,782 | | | | 31,846 | | | | 19,771,348 | | | | | |
Wells Fargo International Value Portfolio | | | 2.89 | | | | 2.01 | | | | (618,057 | ) | | | (3,092,202 | ) | | | 0 | | | | 973,155 | | | | 36,132 | | | | 21,532,496 | | | | | |
Wells Fargo Large Company Value Portfolio | | | 34.77 | | | | 8.81 | | | | (210,528 | ) | | | (404,708 | ) | | | 1,501 | | | | 574,882 | | | | 7,571 | | | | 21,943,619 | | | | | |
Wells Fargo Managed Fixed Income Portfolio | | | 54.46 | | | | 9.61 | | | | (19,151 | ) | | | 2,038,948 | | | | 1,997,788 | | | | 0 | | | | 90,349 | | | | 55,996,700 | | | | | |
Wells Fargo Real Return Portfolio | | | 5.72 | | | | 4.36 | | | | (56,479 | ) | | | 92,383 | | | | 187,013 | | | | 33,937 | | | | 1,838 | | | | 7,970,523 | | | | | |
Wells Fargo Small Company Growth Portfolio | | | 0.18 | | | | 0.14 | | | | 593,689 | | | | (874,013 | ) | | | 0 | | | | 18,810 | | | | 3,320 | | | | 2,445,424 | | | | | |
Wells Fargo Small Company Value Portfolio | | | 4.45 | | | | 4.60 | | | | (457,710 | ) | | | (661,401 | ) | | | 0 | | | | 100,120 | | | | 4,941 | | | | 5,876,983 | | | | | |
| | | | | | | | | | | | | | | | | | | | | | | | | | | | | | | | | | | | |
| | | | | | | | | |
| | | | | | | | | | $ | 986,330 | | | $ | (5,039,247 | ) | | $ | 2,715,039 | | | $ | 2,658,929 | | | $ | 198,331 | | | $ | 184,283,513 | | | | 84.13 | % |
| | | | | | | | | | | | | | | | | | | | | | | | | | | | | | | | | | | | |
The accompanying notes are an integral part of these financial statements.
| | | | | | |
| Statement of assets and liabilities—May 31, 2019 | | Wells Fargo Growth Balanced Fund | | | 13 | |
| | | | |
| | | | |
| |
Assets | | | | |
Investments in affiliated Master Portfolios, at value (cost $162,666,261) | | $ | 184,283,513 | |
Investments in affiliated Underlying Funds, at value (cost $35,211,571) | | | 33,410,059 | |
Investments in unaffiliated securities, at value (cost $5,405,999) | | | 5,896,498 | |
Receivable for daily variation margin on open futures contracts | | | 261,064 | |
Cash | | | 50,000 | |
Receivable for Fund shares sold | | | 24,937 | |
Receivable from manager | | | 5,909 | |
Prepaid expenses and other assets | | | 23,180 | |
| | | | |
Total assets | | | 223,955,160 | |
| | | | |
| |
Liabilities | | | | |
Payable for Fund shares redeemed | | | 4,766,010 | |
Administration fees payable | | | 32,607 | |
Distribution fee payable | | | 7,870 | |
Accrued expenses and other liabilities | | | 94,133 | |
| | | | |
Total liabilities | | | 4,900,620 | |
| | | | |
Total net assets | | $ | 219,054,540 | |
| | | | |
| |
NET ASSETS CONSIST OF | | | | |
Paid-in capital | | $ | 200,244,086 | |
Total distributable earnings | | | 18,810,454 | |
| | | | |
Total net assets | | $ | 219,054,540 | |
| | | | |
| |
COMPUTATION OF NET ASSET VALUE AND OFFERING PRICE PER SHARE | | | | |
Net assets – Class A | | $ | 68,831,779 | |
Shares outstanding – Class A1 | | | 1,524,570 | |
Net asset value per share – Class A | | | $45.15 | |
Maximum offering price per share – Class A² | | | $47.90 | |
Net assets – Class C | | $ | 11,434,364 | |
Shares outstanding – Class C1 | | | 293,589 | |
Net asset value per share – Class C | | | $38.95 | |
Net assets – Administrator Class | | $ | 138,788,397 | |
Shares outstanding – Administrator Class1 | | | 3,475,835 | |
Net asset value per share – Administrator Class | | | $39.93 | |
| 1 | The Fund has an unlimited number of authorized shares. |
| 2 | Maximum offering price is computed as 100/94.25 of net asset value. On investments of $50,000 or more, the offering price is reduced. |
The accompanying notes are an integral part of these financial statements.
| | | | |
| 14 | | Wells Fargo Growth Balanced Fund | | Statement of operations—year ended May 31, 2019 |
| | | | |
| | | | |
| |
Investment income | | | | |
Interest allocated from affiliated Master Portfolios (net of foreign withholding taxes of $207) | | $ | 2,715,039 | |
Dividends allocated from affiliated Master Portfolios (net of foreign withholding taxes of $210,572) | | | 2,658,929 | |
Dividends from affiliated Underlying Funds | | | 497,850 | |
Affiliated income allocated from affiliated Master Portfolios | | | 198,331 | |
Dividends | | | 35,684 | |
Interest | | | 11,565 | |
Expenses allocated from affiliated Master Portfolios | | | (1,158,816 | ) |
Waivers allocated from affiliated Master Portfolios | | | 54,439 | |
| | | | |
Total investment income | | | 5,013,021 | |
| | | | |
| |
Expenses | | | | |
Management fee | | | 698,979 | |
Administration fees | | | | |
Class A | | | 138,253 | |
Class C | | | 32,823 | |
Administrator Class | | | 196,987 | |
Shareholder servicing fees | | | | |
Class A | | | 164,587 | |
Class C | | | 39,075 | |
Administrator Class | | | 378,312 | |
Distribution fee | | | | |
Class C | | | 117,225 | |
Custody and accounting fees | | | 10,588 | |
Professional fees | | | 29,890 | |
Registration fees | | | 71,291 | |
Shareholder report expenses | | | 66,941 | |
Trustees’ fees and expenses | | | 21,301 | |
Other fees and expenses | | | 15,825 | |
| | | | |
Total expenses | | | 1,982,077 | |
Less: Fee waivers and/or expense reimbursements | | | (747,371 | ) |
| | | | |
Net expenses | | | 1,234,706 | |
| | | | |
Net investment income | | | 3,778,315 | |
| | | | |
| |
REALIZED AND UNREALIZED GAINS (LOSSES) ON INVESTMENTS | | | | |
| |
Net realized gains (losses) on: | | | | |
Securities transactions allocated from affiliated Master Portfolios | | | 986,330 | |
Affiliated Underlying Funds | | | (339,747 | ) |
Capital gain distributions from affiliated Underlying Funds | | | 1,412,734 | |
Unaffiliated securities | | | 4,982 | |
Futures contracts | | | 264,697 | |
| | | | |
Net realized gains on investments | | | 2,328,996 | |
| | | | |
| |
Net change in unrealized gains (losses) on: | | | | |
Securities transactions allocated from affiliated Master Portfolios | | | (5,039,247 | ) |
Affiliated Underlying Funds | | | (998,308 | ) |
Unaffiliated securities | | | 490,494 | |
Futures contracts | | | 802,726 | |
| | | | |
Net change in unrealized gains (losses) on investments | | | (4,744,335 | ) |
| | | | |
Net realized and unrealized gains (losses) on investments | | | (2,415,339 | ) |
| | | | |
Net increase in net assets resulting from operations | | $ | 1,362,976 | |
| | | | |
The accompanying notes are an integral part of these financial statements.
| | | | | | |
| Statement of changes in net assets | | Wells Fargo Growth Balanced Fund | | | 15 | |
| | | | | | | | | | | | | | | | |
| | | Year ended May 31, 2019 | | | Year ended
May 31, 2018¹ | |
| | | | |
Operations | | | | | | | | | | | | | | | | |
Net investment income | | | | | | $ | 3,778,315 | | | | | | | $ | 3,364,678 | |
Net realized gains on investments | | | | | | | 2,328,996 | | | | | | | | 20,771,494 | |
Net change in unrealized gains (losses) on investments | | | | | | | (4,744,335 | ) | | | | | | | (4,196,293 | ) |
| | | | |
Net increase in net assets resulting from operations | | | | | | | 1,362,976 | | | | | | | | 19,939,879 | |
| | | | |
| | | | |
Distributions to shareholders from net investment income and net realized gains | | | | | | | | | | | | | | | | |
Class A | | | | | | | (2,868,465 | ) | | | | | | | (642,776 | ) |
Class C | | | | | | | (821,665 | ) | | | | | | | (65,094 | ) |
Administrator Class | | | | | | | (8,192,333 | ) | | | | | | | (2,153,514 | ) |
| | | | |
Total distributions to shareholders | | | | | | | (11,882,463 | ) | | | | | | | (2,861,384 | ) |
| | | | |
| | | | |
Capital share transactions | | | Shares | | | | | | | | Shares | | | | | |
Proceeds from shares sold | | | | | | | | | | | | | | | | |
Class A | | | 351,190 | | | | 16,023,191 | | | | 115,548 | | | | 5,374,981 | |
Class C | | | 127,101 | | | | 5,033,403 | | | | 58,262 | | | | 2,349,912 | |
Administrator Class | | | 235,971 | | | | 9,699,484 | | | | 446,522 | | | | 18,569,677 | |
| | | | |
| | | | |
| | | | | | | 30,756,078 | | | | | | | | 26,294,570 | |
| | | | |
Reinvestment of distributions | | | | | | | | | | | | | | | | |
Class A | | | 65,968 | | | | 2,829,512 | | | | 13,522 | | | | 633,356 | |
Class C | | | 21,059 | | | | 783,461 | | | | 1,496 | | | | 60,971 | |
Administrator Class | | | 215,612 | | | | 8,181,819 | | | | 51,482 | | | | 2,148,876 | |
| | | | |
| | | | |
| | | | | | | 11,794,792 | | | | | | | | 2,843,203 | |
| | | | |
Payment for shares redeemed | | | | | | | | | | | | | | | | |
Class A | | | (218,329 | ) | | | (9,976,679 | ) | | | (295,375 | ) | | | (13,781,479 | ) |
Class C | | | (262,051 | ) | | | (10,188,823 | ) | | | (83,888 | ) | | | (3,339,189 | ) |
Administrator Class | | | (731,787 | ) | | | (29,822,377 | ) | | | (890,059 | ) | | | (36,753,685 | ) |
| | | | |
| | | | |
| | | | | | | (49,987,879 | ) | | | | | | | (53,874,353 | ) |
| | | | |
Net decrease in net assets resulting from capital share transactions | | | | | | | (7,437,009 | ) | | | | | | | (24,736,580 | ) |
| | | | |
Total decrease in net assets | | | | | | | (17,956,496 | ) | | | | | | | (7,658,085 | ) |
| | | | |
| | | | |
Net assets | | | | | | | | | | | | | | | | |
Beginning of period | | | | | | | 237,011,036 | | | | | | | | 244,669,121 | |
| | | | |
End of period | | | | | | $ | 219,054,540 | | | | | | | $ | 237,011,036 | |
| | | | |
| 1 | Effective for all fillings after November 4, 2018, the SEC prospectively eliminated the requirement to parenthetically disclose undistributed net investment income at the end of the period and permitted the aggregation of distributions, with the exception of tax basis returns of capital. Undistributed net investment income at May 31, 2018 was $3,562,101. The disaggregated distributions information for the year ended May 31, 2018 is included in Note 8,Distributions to Shareholders, in the notes to the financial statements. |
The accompanying notes are an integral part of these financial statements.
| | | | |
| 16 | | Wells Fargo Growth Balanced Fund | | Financial highlights |
(For a share outstanding throughout each period)
| | | | | | | | | | | | | | | | | | | | |
| | | Year ended May 31 | |
| CLASS A | | 2019 | | | 2018 | | | 2017 | | | 2016 | | | 2015 | |
Net asset value, beginning of period | | | $47.12 | | | | $43.91 | | | | $39.99 | | | | $40.80 | | | | $37.96 | |
Net investment income | | | 0.72 | 1 | | | 0.53 | | | | 0.41 | | | | 0.46 | | | | 0.36 | |
Net realized and unrealized gains (losses) on investments | | | (0.60 | ) | | | 3.13 | | | | 3.93 | | | | (0.94 | ) | | | 2.65 | |
| | | | | | | | | | | | | | | | | | | | |
Total from investment operations | | | 0.12 | | | | 3.66 | | | | 4.34 | | | | (0.48 | ) | | | 3.01 | |
Distributions to shareholders from | | | | | | | | | | | | |
Net investment income | | | (1.26 | ) | | | (0.45 | ) | | | (0.42 | ) | | | (0.33 | ) | | | (0.17 | ) |
Net realized gains | | | (0.83 | ) | | | 0.00 | | | | 0.00 | | | | 0.00 | | | | 0.00 | |
| | | | | | | | | | | | | | | | | | | | |
Total distributions to shareholders | | | (2.09 | ) | | | (0.45 | ) | | | (0.42 | ) | | | (0.33 | ) | | | (0.17 | ) |
Net asset value, end of period | | | $45.15 | | | | $47.12 | | | | $43.91 | | | | $39.99 | | | | $40.80 | |
Total return2 | | | 0.53 | % | | | 8.34 | % | | | 10.93 | % | | | (1.14 | )% | | | 7.94 | % |
Ratios to average net assets (annualized) | | | | | | | | | | | | |
Gross expenses3 | | | 1.33 | % | | | 1.35 | % | | | 1.34 | % | | | 1.35 | % | | | 1.40 | % |
Net expenses3 | | | 1.07 | % | | | 1.17 | % | | | 1.20 | % | | | 1.20 | % | | | 1.20 | % |
Net investment income3 | | | 1.55 | % | | | 1.27 | % | | | 1.10 | % | | | 1.10 | % | | | 0.97 | % |
Supplemental data | | | | | | | | | | | | |
Portfolio turnover rate4 | | | 149 | % | | | 114 | % | | | 114 | % | | | 79 | % | | | 75 | % |
Net assets, end of period (000s omitted) | | | $68,832 | | | | $62,473 | | | | $65,514 | | | | $65,866 | | | | $64,223 | |
| 1 | Calculated based upon average shares outstanding |
| 2 | Total return calculations do not include any sales charges. |
| 3 | Ratios include only the net expenses allocated from the affiliated Master Portfolios and do not include expenses from any other Underlying Funds. Net expenses allocated from the affiliated Master Portfolios included in the ratios were as follows: |
| | | | |
Year ended May 31, 2019 | | | 0.47 | % |
Year ended May 31, 2018 | | | 0.51 | % |
Year ended May 31, 2017 | | | 0.50 | % |
Year ended May 31, 2016 | | | 0.51 | % |
Year ended May 31, 2015 | | | 0.51 | % |
| 4 | Portfolio turnover rate is calculated by multiplying the Fund’s ownership percentage in the respective affiliated Master Portfolio by the corresponding affiliated Master Portfolio’s purchases and sales. These purchases and sales amounts are aggregated with the direct purchases and sales in the affiliated Underlying Funds and unaffiliated securities and included in the portfolio turnover calculation. |
The accompanying notes are an integral part of these financial statements.
| | | | | | |
| Financial highlights | | Wells Fargo Growth Balanced Fund | | | 17 | |
(For a share outstanding throughout each period)
| | | | | | | | | | | | | | | | | | | | |
| | | Year ended May 31 | |
| CLASS C | | 2019 | | | 2018 | | | 2017 | | | 2016 | | | 2015 | |
Net asset value, beginning of period | | | $40.86 | | | | $38.14 | | | | $34.82 | | | | $35.63 | | | | $33.33 | |
Net investment income | | | 0.37 | 1 | | | 0.14 | | | | 0.13 | 1 | | | 0.12 | 1 | | | 0.08 | 1 |
Net realized and unrealized gains (losses) on investments | | | (0.56 | ) | | | 2.74 | | | | 3.38 | | | | (0.79 | ) | | | 2.30 | |
| | | | | | | | | | | | | | | | | | | | |
Total from investment operations | | | (0.19 | ) | | | 2.88 | | | | 3.51 | | | | (0.67 | ) | | | 2.38 | |
Distributions to shareholders from | | | | | | | | | | | | |
Net investment income | | | (0.89 | ) | | | (0.16 | ) | | | (0.19 | ) | | | (0.14 | ) | | | (0.08 | ) |
Net realized gains | | | (0.83 | ) | | | 0.00 | | | | 0.00 | | | | 0.00 | | | | 0.00 | |
| | | | | | | | | | | | | | | | | | | | |
Total distributions to shareholders | | | (1.72 | ) | | | (0.16 | ) | | | (0.19 | ) | | | (0.14 | ) | | | (0.08 | ) |
Net asset value, end of period | | | $38.95 | | | | $40.86 | | | | $38.14 | | | | $34.82 | | | | $35.63 | |
Total return2 | | | (0.23 | )% | | | 7.55 | % | | | 10.10 | % | | | (1.88 | )% | | | 7.13 | % |
Ratios to average net assets (annualized) | | | | | | | | | | | | |
Gross expenses3 | | | 2.08 | % | | | 2.10 | % | | | 2.09 | % | | | 2.10 | % | | | 2.15 | % |
Net expenses3 | | | 1.82 | % | | | 1.92 | % | | | 1.95 | % | | | 1.95 | % | | | 1.95 | % |
Net investment income3 | | | 0.93 | % | | | 0.52 | % | | | 0.35 | % | | | 0.36 | % | | | 0.22 | % |
Supplemental data | | | | | | | | | | | | |
Portfolio turnover rate4 | | | 149 | % | | | 114 | % | | | 114 | % | | | 79 | % | | | 75 | % |
Net assets, end of period (000s omitted) | | | $11,434 | | | | $16,649 | | | | $16,463 | | | | $16,225 | | | | $14,349 | |
| 1 | Calculated based upon average shares outstanding |
| 2 | Total return calculations do not include any sales charges. |
| 3 | Ratios include only the net expenses allocated from the affiliated Master Portfolios and do not include expenses from any other Underlying Funds. Net expenses allocated from the affiliated Master Portfolios included in the ratios were as follows: |
| | | | |
Year ended May 31, 2019 | | | 0.48 | % |
Year ended May 31, 2018 | | | 0.51 | % |
Year ended May 31, 2017 | | | 0.50 | % |
Year ended May 31, 2016 | | | 0.50 | % |
Year ended May 31, 2015 | | | 0.51 | % |
| 4 | Portfolio turnover rate is calculated by multiplying the Fund’s ownership percentage in the respective affiliated Master Portfolio by the corresponding affiliated Master Portfolio’s purchases and sales. These purchases and sales amounts are aggregated with the direct purchases and sales in the affiliated Underlying Funds and unaffiliated securities and included in the portfolio turnover calculation. |
The accompanying notes are an integral part of these financial statements.
| | | | |
| 18 | | Wells Fargo Growth Balanced Fund | | Financial highlights |
(For a share outstanding throughout each period)
| | | | | | | | | | | | | | | | | | | | |
| | | Year ended May 31 | |
| ADMINISTRATOR CLASS | | 2019 | | | 2018 | | | 2017 | | | 2016 | | | 2015 | |
Net asset value, beginning of period | | | $42.04 | | | | $39.22 | | | | $35.78 | | | | $36.54 | | | | $33.98 | |
Net investment income | | | 1.05 | | | | 0.75 | | | | 0.50 | 1 | | | 0.49 | | | | 0.45 | |
Net realized and unrealized gains (losses) on investments | | | (0.90 | ) | | | 2.63 | | | | 3.47 | | | | (0.82 | ) | | | 2.32 | |
| | | | | | | | | | | | | | | | | | | | |
Total from investment operations | | | 0.15 | | | | 3.38 | | | | 3.97 | | | | (0.33 | ) | | | 2.77 | |
Distributions to shareholders from | | | | | | | | | | | | |
Net investment income | | | (1.43 | ) | | | (0.56 | ) | | | (0.53 | ) | | | (0.43 | ) | | | (0.21 | ) |
Net realized gains | | | (0.83 | ) | | | 0.00 | | | | 0.00 | | | | 0.00 | | | | 0.00 | |
| | | | | | | | | | | | | | | | | | | | |
Total distributions to shareholders | | | (2.26 | ) | | | (0.56 | ) | | | (0.53 | ) | | | (0.43 | ) | | | (0.21 | ) |
Net asset value, end of period | | | $39.93 | | | | $42.04 | | | | $39.22 | | | | $35.78 | | | | $36.54 | |
Total return | | | 0.70 | % | | | 8.63 | % | | | 11.19 | % | | | (0.86 | )% | | | 8.16 | % |
Ratios to average net assets (annualized) | | | | | | | | | | | | |
Gross expenses2 | | | 1.25 | % | | | 1.27 | % | | | 1.26 | % | | | 1.27 | % | | | 1.24 | % |
Net expenses2 | | | 0.89 | % | | | 0.92 | % | | | 0.95 | % | | | 0.95 | % | | | 0.95 | % |
Net investment income2 | | | 1.72 | % | | | 1.51 | % | | | 1.34 | % | | | 1.35 | % | | | 1.22 | % |
Supplemental data | | | | | | | | | | | | |
Portfolio turnover rate3 | | | 149 | % | | | 114 | % | | | 114 | % | | | 79 | % | | | 75 | % |
Net assets, end of period (000s omitted) | | | $138,788 | | | | $157,889 | | | | $162,693 | | | | $175,715 | | | | $182,373 | |
| 1 | Calculated based upon average shares outstanding |
| 2 | Ratios include only the net expenses allocated from the affiliated Master Portfolios and do not include expenses from any other Underlying Funds. Net expenses allocated from the affiliated Master Portfolios included in the ratios were as follows: |
| | | | |
Year ended May 31, 2019 | | | 0.47 | % |
Year ended May 31, 2018 | | | 0.51 | % |
Year ended May 31, 2017 | | | 0.50 | % |
Year ended May 31, 2016 | | | 0.50 | % |
Year ended May 31, 2015 | | | 0.51 | % |
| 3 | Portfolio turnover rate is calculated by multiplying the Fund’s ownership percentage in the respective affiliated Master Portfolio by the corresponding affiliated Master Portfolio’s purchases and sales. These purchases and sales amounts are aggregated with the direct purchases and sales in the affiliated Underlying Funds and unaffiliated securities and included in the portfolio turnover calculation. |
The accompanying notes are an integral part of these financial statements.
| | | | | | |
| Notes to financial statements | | Wells Fargo Growth Balanced Fund | | | 19 | |
1. ORGANIZATION
Wells Fargo Funds Trust (the “Trust”), a Delaware statutory trust organized on March 10, 1999, is an open-end management investment company registered under the Investment Company Act of 1940, as amended (the “1940 Act”). As an investment company, the Trust follows the accounting and reporting guidance in Financial Accounting Standards Board (“FASB”) Accounting Standards Codification Topic 946, Financial Services – Investment Companies. These financial statements report on the Wells Fargo Growth Balanced Fund (the “Fund”) which is a diversified series of the Trust.
The Fund is a fund-of-funds that invests in various affiliated mutual funds (“Underlying Funds”) employing a multi-asset, multi-style investment approach designed to reduce the price and return volatility of the Fund and to provide more consistent returns. The Underlying Funds incur separate expenses in seeking to achieve their investment objectives. Investments in affiliated Underlying Funds may also include investments in one or more separate diversified portfolios (collectively, the “affiliated Master Portfolios”) of Wells Fargo Master Trust, a registered open-end management investment company. Each affiliated Master Portfolio directly acquires portfolio securities, and the Fund acquires an indirect interest in those securities. The Fund accounts for its investments in the affiliated Master Portfolios as partnership investments and records on a daily basis its share of each affiliated Master Portfolio’s income, expense and realized and unrealized gains and losses. The financial statements of the affiliated Master Portfolios are presented in separate financial statements and may be obtained free of charge by contacting Investor Services or by visiting the SEC website at sec.gov. The financial statements of the affiliated Master Portfolios are filed with the SEC under Wells Fargo Master Trust. The financial statements for all other Underlying Funds are also publicly available on the SEC website at sec.gov.
2. SIGNIFICANT ACCOUNTING POLICIES
The following significant accounting policies, which are consistently followed in the preparation of the financial statements of the Fund, are in conformity with U.S. generally accepted accounting principles which require management to make estimates and assumptions that affect the reported amounts of assets and liabilities, disclosure of contingent assets and liabilities at the date of the financial statements, and the reported amounts of revenues and expenses during the reporting period. Actual results could differ from those estimates.
Securities valuation
All investments are valued each business day as of the close of regular trading on the New York Stock Exchange (generally 4 p.m. Eastern Time), although the Fund may deviate from this calculation time under unusual or unexpected circumstances.
Investments in the affiliated Master Portfolios are valued daily based on the Fund’s proportionate share of each affiliated Master Portfolio’s net assets, which are also valued daily.
Investments in underlying mutual funds are valued at net asset per share as reported by the Underlying Funds as of the close of the regular trading on the New York Stock Exchange on each day the exchange is open for trading.
Debt securities are valued at the evaluated bid price provided by an independent pricing service (e.g. taking into account various factors, including yields, maturities, or credit ratings) or, if a reliable price is not available, the quoted bid price from an independent broker-dealer.
Equity securities and futures contracts that are listed on a foreign or domestic exchange or market are valued at the official closing price or, if none, the last sales price. If no sale occurs on the principal exchange or market that day, a fair value price will be determined in accordance with the Fund’s Valuation Procedures.
Investments which are not valued using any of the methods discussed above are valued at their fair value, as determined in good faith by the Board of Trustees of the Fund. The Board of Trustees has established a Valuation Committee comprised of the Trustees and has delegated to it the authority to take any actions regarding the valuation of portfolio securities that the Valuation Committee deems necessary or appropriate, including determining the fair value of portfolio securities, unless the determination has been delegated to the Wells Fargo Asset Management Pricing Committee at Wells Fargo Funds Management, LLC (“Funds Management”). The Board of Trustees retains the authority to make or ratify any valuation decisions or approve any changes to the Valuation Procedures as it deems appropriate. On a quarterly basis, the Board of Trustees receives reports on any valuation actions taken by the Valuation Committee or the Wells Fargo Asset Management Pricing Committee which may include items for ratification.
Futures contracts
Futures contracts are agreements between the Fund and a counterparty to buy or sell a specific amount of a commodity, financial instrument or currency at specified price and on a specified date. The Fund may buy and sell futures contracts in order to gain exposure to, or protect against, changes in interest rates, security values, and foreign exchange rates and is
| | | | |
| 20 | | Wells Fargo Growth Balanced Fund | | Notes to financial statements |
subject to interest rate risk, equity price risk, and foreign currency risk. The primary risks associated with the use of futures contracts are the imperfect correlation between changes in market values of securities held by the Fund and the prices of futures contracts, and the possibility of an illiquid market. Futures contracts are generally entered into on a regulated futures exchange and cleared through a clearinghouse associated with the exchange. With futures contracts, there is minimal counterparty risk to the Fund since futures contracts are exchange traded and the exchange’s clearinghouse, as counterparty to all exchange traded futures, guarantees the futures contracts against default.
Upon entering into a futures contracts, the Fund is required to deposit either cash or securities (initial margin) with the broker in an amount equal to a certain percentage of the contract value. Subsequent payments (variation margin) are paid to or from the broker each day equal to the daily changes in the contract value. Such payments are recorded as unrealized gains or losses and, if any, shown as variation margin receivable (payable) in the Statement of Assets and Liabilities. Should the Fund fail to make requested variation margin payments, the broker can gain access to the initial margin to satisfy the Fund’s payment obligations. When the contracts are closed, a realized gain or loss is recorded in the Statement of Operations.
Investment transactions, income and expenses
Investments in the affiliated Master Portfolios are recorded on a trade basis. The Fund records daily its proportionate share of each affiliated Master Portfolio’s interest and dividend income, expenses, and realized and unrealized gains or losses. The Fund also accrues its own expenses.
Interest income is accrued daily and bond discounts are accreted and premiums are amortized daily. To the extent debt obligations are placed on non-accrual status, any related interest income may be reduced by writing off interest receivables when the collection of all or a portion of interest has been determined to be doubtful based on consistently applied procedures and the fair value has decreased. If the issuer subsequently resumes interest payments or when the collectability of interest is reasonably assured, the debt obligation is removed from non-accrual status.
Securities transactions are recorded on a trade date basis. Realized gains or losses are recorded on the basis of identified cost.
Income dividends and capital gain distributions from investment companies are recorded on the ex-dividend date. Capital gain distributions from investment companies are treated as realized gains.
Distributions to shareholders
Distributions to shareholders from net investment income and any net realized gains are recorded on the ex-dividend date and paid at least annually. Such distributions are determined in accordance with income tax regulations and may differ from U.S. generally accepted accounting principles. Dividend sources are estimated at the time of declaration. The tax character of distributions is determined as of the Fund’s fiscal year end. Therefore, a portion of the Fund’s distributions made prior to the Fund’s fiscal year end may be categorized as a tax return of capital at year end.
Federal and other taxes
The Fund intends to continue to qualify as a regulated investment company by distributing substantially all of its investment company taxable income and any net realized capital gains (after reduction for capital loss carryforwards) sufficient to relieve it from all, or substantially all, federal income taxes. Accordingly, no provision for federal income taxes was required.
The Fund’s income and federal excise tax returns and all financial records supporting those returns for the prior three fiscal years are subject to examination by the federal and Delaware revenue authorities. Management has analyzed the Fund’s tax positions taken on federal, state, and foreign tax returns for all open tax years and does not believe that there are any uncertain tax positions that require recognition of a tax liability.
As of May 31, 2019, the aggregate cost of all investments for federal income tax purposes was $204,381,429 and the unrealized gains (losses) consisted of:
| | | | |
| |
Gross unrealized gains | | $ | 24,382,280 | |
| |
Gross unrealized losses | | | (4,780,191 | ) |
| |
Net unrealized gains | | $ | 19,602,089 | |
Reclassifications are made to the Fund’s capital accounts for permanent tax differences to reflect income and gains available for distribution (or available capital loss carryforwards) under federal income tax regulations. U.S. generally accepted accounting principles require that certain components of net assets be adjusted to reflect permanent
| | | | | | |
| Notes to financial statements | | Wells Fargo Growth Balanced Fund | | | 21 | |
differences between financial and tax reporting. These reclassifications have no effect on net assets or net asset values per share. At May 31, 2019, as a result of permanent book-to-tax differences, the following reclassification adjustments were made on the Statement of Assets and Liabilities:
| | |
| Paid-in capital | | Total distributable earnings |
| |
| $3,505 | | $(3,505) |
As of May 31, 2019, the Fund had current year deferred post-October capital losses consisting of $1,995,047 in short-term losses and $978,854 in long-term gains which will be recognized on the first day of the following fiscal year.
Class allocations
The separate classes of shares offered by the Fund differ principally in applicable sales charges, distribution, shareholder servicing, and administration fees. Class specific expenses are charged directly to that share class. Investment income, common expenses, and realized and unrealized gains (losses) on investments are allocated daily to each class of shares based on the relative proportion of net assets of each class.
3. FAIR VALUATION MEASUREMENTS
Fair value measurements of investments are determined within a framework that has established a fair value hierarchy based upon the various data inputs utilized in determining the value of the Fund’s investments. The three-level hierarchy gives the highest priority to unadjusted quoted prices in active markets for identical assets or liabilities (Level 1) and the lowest priority to unobservable inputs (Level 3). The Fund’s investments are classified within the fair value hierarchy based on the lowest level of input that is significant to the fair value measurement. The inputs are summarized into three broad levels as follows:
| ∎ | | Level 1 – quoted prices in active markets for identical securities |
| ∎ | | Level 2 – other significant observable inputs (including quoted prices for similar securities, interest rates, prepayment speeds, credit risk, etc.) |
| ∎ | | Level 3 – significant unobservable inputs (including the Fund’s own assumptions in determining the fair value of investments) |
The inputs or methodologies used for valuing investments in securities are not necessarily an indication of the risk associated with investing in those securities.
The following is a summary of the inputs used in valuing the Fund’s assets and liabilities as of May 31, 2019:
| | | | | | | | | | | | | | | | |
| | | | |
| | | Quoted prices (Level 1) | | | Other significant
observable inputs
(Level 2) | | | Significant
unobservable inputs (Level 3) | | | Total | |
| | | | |
Assets | | | | | | | | | | | | | | | | |
Investments in: | | | | | | | | | | | | | | | | |
| | | | |
Exchange-traded funds | | $ | 5,220,443 | | | $ | 0 | | | $ | 0 | | | $ | 5,220,443 | |
| | | | |
Investment companies | | | 33,410,059 | | | | 0 | | | | 0 | | | | 33,410,059 | |
| | | | |
Short-term investments | | | | | | | | | | | | | | | | |
| | | | |
U.S. Treasury securities | | | 676,055 | | | | 0 | | | | 0 | | | | 676,055 | |
| | | | |
Investments measured at net asset value* | | | | | | | | | | | | | | | 184,283,513 | |
| | | | |
| | | 39,306,557 | | | | 0 | | | | 0 | | | | 223,590,070 | |
| | | | |
Futures contracts | | | 393,448 | | | | 0 | | | | 0 | | | | 393,448 | |
| | | | |
Total assets | | $ | 39,700,005 | | | $ | 0 | | | $ | 0 | | | $ | 223,983,518 | |
| * | Investments that are measured at fair value using the net asset value per share (or its equivalent) as a practical expedient have not been categorized in the fair value hierarchy. The fair value amount presented in the table is intended to permit reconciliation of the fair value hierarchy to the amounts presented in the Statement of Assets and Liabilities. The Fund’s investments in the affiliated Master Portfolios are valued at $184,283,513. Each affiliated Master Portfolio does not have a redemption period notice, can be redeemed daily and does not have any unfunded commitments. |
| | | | |
| 22 | | Wells Fargo Growth Balanced Fund | | Notes to financial statements |
Futures contracts are reported at their cumulative unrealized gains (losses) at measurement date as reported in the table following the Portfolio of Investments. For futures contracts, the current day’s variation margin is reported on the Statement of Assets and Liabilities. All other assets and liabilities are reported at their market value at measurement date.
At May 31, 2019, the Fund did not have any transfers into/out of Level 3.
The investment objective of each affiliated Master Portfolio is as follows:
| | |
| |
| Affiliated Master Portfolio | | Investment objective |
| |
Wells Fargo C&B Large Cap Value Portfolio | | Seeks maximum long-term total return (current income and capital appreciation), consistent with minimizing risk to principal |
| |
Wells Fargo Core Bond Portfolio | | Seeks total return, consisting of income and capital appreciation |
| |
Wells Fargo Diversified Large Cap Growth Portfolio | | Seeks long-term capital appreciation |
| |
Wells Fargo Emerging Growth Portfolio | | Seeks long-term capital appreciation |
| |
Wells Fargo Factor Enhanced Emerging Markets Portfolio | | Seeks long-term capital appreciation |
| |
Wells Fargo International Growth Portfolio | | Seeks long-term capital appreciation |
| |
Wells Fargo International Value Portfolio | | Seeks long-term capital appreciation |
| |
Wells Fargo Large Company Value Portfolio | | Seeks long-term capital appreciation |
| |
Wells Fargo Managed Fixed Income Portfolio | | Seeks consistent fixed-income returns |
| |
Wells Fargo Real Return Portfolio | | Seeks returns that exceed the rate of inflation over the long-term |
| |
Wells Fargo Small Company Growth Portfolio | | Seeks long-term capital appreciation |
| |
Wells Fargo Small Company Value Portfolio | | Seeks long-term capital appreciation |
4. TRANSACTIONS WITH AFFILIATES
Management fee
Funds Management, an indirect wholly owned subsidiary of Wells Fargo & Company (“Wells Fargo”), is the manager of the Fund and provides advisory and fund-level administrative services under an investment management agreement. Under the investment management agreement, Funds Management is responsible for, among other services, implementing the investment objectives and strategies of the Fund, supervising the subadviser and providing fund-level administrative services in connection with the Fund’s operations. As compensation for its services under the investment management agreement, Funds Management is entitled to receive a management fee at the following annual rate based on the Fund’s average daily net assets:
| | | | |
| Average daily net assets | | Management fee | |
| |
First $500 million | | | 0.30 | % |
| |
Next $500 million | | | 0.28 | |
| |
Next $2 billion | | | 0.26 | |
| |
Next $2 billion | | | 0.24 | |
| |
Next $5 billion | | | 0.23 | |
| |
Over $10 billion | | | 0.22 | |
For the year ended May 31, 2019, the management fee was equivalent to an annual rate of 0.30% of the Fund’s average daily net assets.
Funds Management also serves as the adviser to each affiliated Master Portfolio and is entitled to receive a fee from each affiliated Master Portfolio for those services.
Funds Management has retained the services of a subadviser to provide daily portfolio management to the Fund. The fee for subadvisory services is borne by Funds Management. Wells Capital Management Incorporated, an affiliate of Funds Management and an indirect wholly owned subsidiary of Wells Fargo, is the subadviser to the Fund and is entitled to receive a fee from Funds Management at an annual rate starting at 0.10% and declining to 0.05% as the average daily net assets of the Fund increase.
| | | | | | |
| Notes to financial statements | | Wells Fargo Growth Balanced Fund | | | 23 | |
Administration fees
Under a class-level administration agreement, Funds Management provides class-level administrative services to the Fund, which includes paying fees and expenses for services provided by the transfer agent, sub-transfer agents, omnibus account servicers and record-keepers. As compensation for its services under the class-level administration agreement, Funds Management receives an annual fee which is calculated based on the average daily net assets of each class as follows:
| | | | |
| | | Class-level
administration fee | |
| |
Class A, Class C | | | 0.21 | % |
| |
Administrator Class | | | 0.13 | |
Funds Management has contractually waived and/or reimbursed management and administration fees to the extent necessary to maintain certain net operating expense ratios for the Fund. When each class of the Fund has exceeded its expense cap, Funds Management has waived fees and/or reimbursed expenses from fund level expenses on a proportionate basis and then from class specific expenses. When only certain classes exceed their expense caps, waivers and/or reimbursements are applied against class specific expenses before fund level expenses. Net expenses from the affiliated Master Portfolios are included in the expense caps. Funds Management has committed through September 30, 2019 to waive fees and/or reimburse expenses to the extent necessary to cap the Fund’s expenses at 1.13% for Class A shares, 1.88% for Class C shares, and 0.95% for Administrator Class shares. Prior to or after the commitment expiration date, the cap may be increased or the commitment to maintain the cap may be terminated only with the approval of the Board of Trustees. Funds Management voluntarily waived additional expenses of the Fund. Prior to June 15, 2018, the Fund’s expenses were capped at 1.20% for Class A shares and 1.95% for Class C shares.
Distribution fee
The Trust has adopted a distribution plan for Class C shares of the Fund pursuant to Rule 12b-1 under the 1940 Act. A distribution fee is charged to Class C shares and paid to Wells Fargo Funds Distributor, LLC (“Funds Distributor”), the principal underwriter, at an annual rate of 0.75% of the average daily net assets of Class C shares.
In addition, Funds Distributor is entitled to receive the front-end sales charge from the purchase of Class A shares and a contingent deferred sales charge on the redemption of certain Class A shares. Funds Distributor is also entitled to receive the contingent deferred sales charges from redemptions of Class C shares. For the year ended May 31, 2019, Funds Distributor received $8,442 from the sale of Class A shares and $13 in contingent deferred sales charges from redemptions of Class C shares. No contingent deferred sales charges were incurred by Class A shares for the year ended May 31, 2019.
Shareholder servicing fees
The Trust has entered into contracts with one or more shareholder servicing agents, whereby Class A, Class C, and Administrator Class of the Fund are charged a fee at an annual rate of 0.25% of the average daily net assets of each respective class. A portion of these total shareholder servicing fees were paid to affiliates of Wells Fargo.
5. INVESTMENT PORTFOLIO TRANSACTIONS
The Fund seeks to achieve its investment objective by investing substantially all of its investable assets in multiple affiliated Master Portfolios. Purchases and sales related to these investments have been calculated by aggregating the results of multiplying the Fund’s ownership percentage in the respective affiliated Master Portfolio by the corresponding affiliated Master Portfolio’s purchases and sales. Purchases and sales of unaffiliated securities in which the Fund invests are actual purchases and sale of those securities. Purchases and sales of investments, excluding short-term securities, for the year ended May 31, 2019 were as follows:
| | | | | | |
Purchases at cost | | Sales proceeds |
U.S. government | | Non-U.S. government | | U.S. government | | Non-U.S. government |
| $218,104,149 | | $237,084,571 | | $203,152,883 | | $154,781,763 |
6. DERIVATIVE TRANSACTIONS
During the year ended May 31, 2019, the Fund entered into futures contracts to gain market exposure to certain asset classes consistent with an active asset allocation strategy. The Fund had an average notional amount of $10,141,536 in long futures contracts and $5,199,570 in short futures contracts during the year ended May 31, 2019.
A summary of the location of derivative instruments on the financial statements by risk is outlined in the following tables.
| | | | |
| 24 | | Wells Fargo Growth Balanced Fund | | Notes to financial statements |
The fair value of derivative instruments as of May 31, 2019 was as follows for the Fund:
| | | | | | | | | | | | |
| | | Asset derivatives | | | Liability derivatives | |
| | | Statement of Assets and
Liabilities location | | Fair value | | | Statement of Assets and
Liabilities location | | Fair value | |
| | | | |
Equity risk | | Unrealized gains on futures contracts | | $ | 219,818 | * | | Unrealized losses on futures contracts | | $ | 0 | * |
| | | | |
Foreign currency risk | | Unrealized gains on futures contracts | | | 173,630 | * | | Unrealized losses on futures contracts | | | 0 | * |
| | | | |
| | | | | $ | 393,448 | | | | | $ | 0 | |
| * | Amount represents cumulative unrealized gains (losses) as reported in the table following the Portfolio of Investments. Only the current day’s variation margin as of May 31, 2019 is reported separately on the Statement of Assets and Liabilities. |
The effect of derivative instruments on the Statement of Operations for the year ended May 31, 2019 was as follows for the Fund:
| | | | | | | | |
| | | Amount of realized
gains on derivatives | | | Change in unrealized
gains (losses) on derivatives | |
| | |
Equity risk | | $ | 168,406 | | | $ | 586,958 | |
| | |
Interest rate risk | | | 80,377 | | | | 42,138 | |
| | |
Foreign currency risk | | | 15,914 | | | | 173,630 | |
| | |
| | | $ | 264,697 | | | $ | 802,726 | |
7. BANK BORROWINGS
The Trust (excluding the money market funds), Wells Fargo Master Trust and Wells Fargo Variable Trust are parties to a $280,000,000 revolving credit agreement whereby the Fund is permitted to use bank borrowings for temporary or emergency purposes, such as to fund shareholder redemption requests. Interest under the credit agreement is charged to the Fund based on a borrowing rate equal to the higher of the Federal Funds rate in effect on that day plus 1.25% or the overnight LIBOR rate in effect on that day plus 1.25%. In addition, an annual commitment fee equal to 0.25% of the unused balance is allocated to each participating fund.
For the year ended May 31, 2019, there were no borrowings by the Fund under the agreement.
8. DISTRIBUTIONS TO SHAREHOLDERS
The tax character of distributions paid during the years ended May 31, 2019 and May 31, 2018 were as follows:
| | | | | | | | |
| | | Year ended May 31 | |
| | |
| | | 2019 | | | 2018 | |
| | |
Ordinary income | | $ | 8,735,539 | | | $ | 2,861,384 | |
| | |
Long-term capital gain | | | 3,146,924 | | | | 0 | |
As of May 31, 2019, the components of distributable earnings on a tax basis were as follows:
| | | | | | |
Undistributed ordinary income | | Undistributed long-term gain | | Unrealized gains | | Post-October capital losses deferred |
| | | |
| $213,521 | | $11,037 | | $19,602,089 | | $(1,016,193) |
Effective for all filings after November 4, 2018, the Securities and Exchange Commission eliminated the requirement to separately state the components of distributions to shareholders under U.S. generally accepted accounting principles. The amounts of distributions to shareholders for the year ended May 31, 2018 were as follows:
| | | | |
| | | Net investment income | |
| |
Class A | | | $ 642,776 | |
| |
Class C | | | 65,094 | |
| |
Administrator Class | | | 2,153,514 | |
| | | | | | |
| Notes to financial statements | | Wells Fargo Growth Balanced Fund | | | 25 | |
9. INDEMNIFICATION
Under the Trust’s organizational documents, the officers and Trustees have been granted certain indemnification rights against certain liabilities that may arise out of performance of their duties to the Trust. Additionally, in the normal course of business, the Trust may enter into contracts with service providers that contain a variety of indemnification clauses. The Trust’s maximum exposure under these arrangements is dependent on future claims that may be made against the Fund and, therefore, cannot be estimated.
10. NEW ACCOUNTING PRONOUNCEMENT
In August 2018, FASB issued Accounting Standards Update (“ASU”) No. 2018-13, Fair Value Measurement (Topic 820)Disclosure Framework—Changes to the Disclosure Requirements for Fair Value Measurement. ASU 2018-13 updates the disclosure requirements for fair value measurements by modifying or removing certain disclosures and adding certain new disclosures. The amendments are effective for fiscal years, and interim periods within those fiscal years, beginning after December 15, 2019. Early adoption is permitted. Management has adopted the removal and modification of disclosures early, as permitted, and will adopt the additional new disclosures at the effective date.
| | | | |
| 26 | | Wells Fargo Growth Balanced Fund | | Report of independent registered public accounting firm |
TO THE SHAREHOLDERS OF THE FUND AND BOARD OF TRUSTEES OF WELLS FARGO FUNDS TRUST:
Opinion on the Financial Statements
We have audited the accompanying statement of assets and liabilities of Wells Fargo Growth Balanced Fund (the Fund), one of the funds constituting Wells Fargo Funds Trust, including the portfolio of investments, as of May 31, 2019, the related statement of operations for the year then ended, the statements of changes in net assets for each of the years in the two-year period then ended, and the related notes (collectively, the financial statements) and the financial highlights for each of the years in the five-year period then ended. In our opinion, the financial statements and financial highlights present fairly, in all material respects, the financial position of the Fund as of May 31, 2019, the results of its operations for the year then ended, the changes in its net assets for each of the years in the two-year period then ended, and the financial highlights for each of the years in the five-year period then ended, in conformity with U.S. generally accepted accounting principles.
Basis for Opinion
These financial statements and financial highlights are the responsibility of the Fund’s management. Our responsibility is to express an opinion on these financial statements and financial highlights based on our audits. We are a public accounting firm registered with the Public Company Accounting Oversight Board (United States) (PCAOB) and are required to be independent with respect to the Fund in accordance with the U.S. federal securities laws and the applicable rules and regulations of the Securities and Exchange Commission and the PCAOB.
We conducted our audits in accordance with the standards of the PCAOB. Those standards require that we plan and perform the audit to obtain reasonable assurance about whether the financial statements and financial highlights are free of material misstatement, whether due to error or fraud. Our audits included performing procedures to assess the risks of material misstatement of the financial statements and financial highlights, whether due to error or fraud, and performing procedures that respond to those risks. Such procedures included examining, on a test basis, evidence regarding the amounts and disclosures in the financial statements and financial highlights. Such procedures also included confirmation of securities owned as of May 31, 2019, by correspondence with the custodian, brokers and transfer agents, or by other appropriate auditing procedures. Our audits also included evaluating the accounting principles used and significant estimates made by management, as well as evaluating the overall presentation of the financial statements and financial highlights. We believe that our audits provide a reasonable basis for our opinion.

We have not been able to determine the specific year that we began serving as the auditor of one or more Wells Fargo Funds investment companies; however we are aware that we have served as the auditor of one or more Wells Fargo Funds investment companies since at least 1955.
Boston, Massachusetts
July 26, 2019
| | | | | | |
| Other information (unaudited) | | Wells Fargo Growth Balanced Fund | | | 27 | |
TAX INFORMATION
For corporate shareholders, pursuant to Section 854 of the Internal Revenue Code, 25.50% of ordinary income dividends qualify for the corporate dividends-received deduction for the fiscal year ended May 31, 2019.
Pursuant to Section 852 of the Internal Revenue Code, $3,146,924 was designated as a 20% rate gain distribution for the fiscal year ended May 31, 2019.
Pursuant to Section 854 of the Internal Revenue Code, $4,665,650 of income dividends paid during the fiscal year ended May 31, 2019 has been designated as qualified dividend income (QDI).
For the fiscal year ended May 31, 2019, $3,256,307 has been designated as interest-related dividends for nonresident alien shareholders pursuant to Section 871 of the Internal Revenue Code.
For the fiscal year ended May 31, 2019, $1,348,767 has been designated as short-term capital gain dividends for nonresident alien shareholders pursuant to Section 871 of the Internal Revenue Code.
For the fiscal year ended May 31, 2019, 5.96% of the ordinary income distributed was derived from interest on U.S. government securities.
PROXY VOTING INFORMATION
A description of the policies and procedures used to determine how to vote proxies relating to portfolio securities is available, upon request, by calling1-800-222-8222, visiting our website at wfam.com, or visiting the SEC website at sec.gov. Information regarding how the Fund voted proxies relating to portfolio securities during the most recent12-month period ended June 30 is available on the Fund’s website atwfam.comor by visiting the SEC website at sec.gov.
QUARTERLY PORTFOLIO HOLDINGS
The Fund files its complete schedule of portfolio holdings with the SEC for the first and third quarters of each fiscal year on Form N-Q, which is available by visiting the SEC website at sec.gov. Those forms may be reviewed and copied at the SEC’s Public Reference Room in Washington, DC. Information on the operation of the Public Reference Room may be obtained by calling 1-800-SEC-0330.
| | | | |
| 28 | | Wells Fargo Growth Balanced Fund | | Other information (unaudited) |
BOARD OF TRUSTEES AND OFFICERS
Each of the Trustees and Officers1 listed in the table below acts in identical capacities for each fund in the Wells Fargo family of funds, which consists of 151 mutual funds comprising the Wells Fargo Funds Trust, Wells Fargo Variable Trust, Wells Fargo Master Trust and four closed-end funds (collectively the “Fund Complex”). This table should be read in conjunction with the Prospectus and the Statement of Additional Information2. The mailing address of each Trustee and Officer is 525 Market Street, 12th Floor, San Francisco, CA 94105. Each Trustee and Officer serves an indefinite term, however, each Trustee serves such term until reaching the mandatory retirement age established by the Trustees.
Independent Trustees
| | | | | | |
Name and year of birth | | Position held and length of service* | | Principal occupations during past five years or longer | | Current other public company or investment company
directorships |
| | | |
William R. Ebsworth (Born 1957) | | Trustee, since 2015 | | Retired. From 1984 to 2013, equities analyst, portfolio manager, research director and chief investment officer at Fidelity Management and Research Company in Boston, Tokyo, and Hong Kong, and retired in 2013 as Chief Investment Officer of Fidelity Strategic Advisers, Inc. where he led a team of investment professionals managing client assets. Prior thereto, Board member of Hong Kong Securities Clearing Co., Hong Kong Options Clearing Corp., the Thailand International Fund, Ltd., Fidelity Investments Life Insurance Company, and Empire Fidelity Investments Life Insurance Company. Audit Committee Chair and Investment Committee Chair of the Vincent Memorial Hospital Endowment (non-profit organization). Mr. Ebsworth is a CFA® charterholder. | | N/A |
| | | |
Jane A. Freeman (Born 1953) | | Trustee, since 2015; Chair Liaison, since 2018 | | Retired. From 2012 to 2014 and 1999 to 2008, Chief Financial Officer of Scientific Learning Corporation. From 2008 to 2012, Ms. Freeman provided consulting services related to strategic business projects. Prior to 1999, Portfolio Manager at Rockefeller & Co. and Scudder, Stevens & Clark. Board member of the Harding Loevner Funds from 1996 to 2014, serving as both Lead Independent Director and chair of the Audit Committee. Board member of the Russell Exchange Traded Funds Trust from 2011 to 2012 and the chair of the Audit Committee. Ms. Freeman is a Board Member of The Ruth Bancroft Garden (non-profit organization). She is also an inactive Chartered Financial Analyst. | | N/A |
| | | |
Isaiah Harris, Jr. (Born 1952) | | Trustee, since 2009; Audit Committee Chairman, since 2019 | | Retired. Chairman of the Board of CIGNA Corporation since 2009, and Director since 2005. From 2003 to 2011, Director of Deluxe Corporation. Prior thereto, President and CEO of BellSouth Advertising and Publishing Corp. from 2005 to 2007, President and CEO of BellSouth Enterprises from 2004 to 2005 and President of BellSouth Consumer Services from 2000 to 2003. Emeritus member of the Iowa State University Foundation Board of Governors. Emeritus Member of the Advisory Board of Iowa State University School of Business. Advisory Board Member, Palm Harbor Academy (private school). Advisory Board Member, Child Evangelism Fellowship (non-profit). Mr. Harris is a certified public accountant (inactive status). | | CIGNA Corporation |
| | | |
Judith M. Johnson (Born 1949) | | Trustee, since 2008; Audit Committee Chairman, from 2009 to 2018 | | Retired. Prior thereto, Chief Executive Officer and Chief Investment Officer of Minneapolis Employees Retirement Fund from 1996 to 2008. Ms. Johnson is an attorney, certified public accountant and a certified managerial accountant. | | N/A |
| | | | | | |
| Other information (unaudited) | | Wells Fargo Growth Balanced Fund | | | 29 | |
| | | | | | |
Name and year of birth | | Position held and length of service* | | Principal occupations during past five years or longer | | Current other public company or investment company
directorships |
| | | |
David F. Larcker (Born 1950) | | Trustee, since 2009 | | James Irvin Miller Professor of Accounting at the Graduate School of Business, Stanford University, Director of the Corporate Governance Research Initiative and Senior Faculty of The Rock Center for Corporate Governance since 2006. From 2005 to 2008, Professor of Accounting at the Graduate School of Business, Stanford University. Prior thereto, Ernst & Young Professor of Accounting at The Wharton School, University of Pennsylvania from 1985 to 2005. | | N/A |
| | | |
Olivia S. Mitchell (Born 1953) | | Trustee, since 2006; Nominating and Governance Committee Chairman, since 2018 | | International Foundation of Employee Benefit Plans Professor, Wharton School of the University of Pennsylvania since 1993. Director of Wharton’s Pension Research Council and Boettner Center on Pensions & Retirement Research, and Research Associate at the National Bureau of Economic Research. Previously, Cornell University Professor from 1978 to 1993. | | N/A |
| | | |
Timothy J. Penny (Born 1951) | | Trustee, since 1996; Chairman, since 2018 | | President and Chief Executive Officer of Southern Minnesota Initiative Foundation, a non-profit organization, since 2007. Member of the Board of Trustees of NorthStar Education Finance, Inc., a non-profit organization, since 2007. | | N/A |
| | | |
James G. Polisson (Born 1959) | | Trustee, since 2018 | | Retired. Chief Marketing Officer, Source (ETF) UK Services, Ltd, from 2015 to 2017. From 2012 to 2015, Principal of The Polisson Group, LLC, a management consulting, corporate advisory and principal investing company. Chief Executive Officer and Managing Director at Russell Investments, Global Exchange Traded Funds from 2010 to 2012. Managing Director of Barclays Global Investors from 1998 to 2010 and Global Chief Marketing Officer for iShares and Barclays Global Investors from 2000 to 2010. Trustee of the San Francisco Mechanics’ Institute, a non-profit organization, from 2013 to 2015. Board member of the Russell Exchange Traded Fund Trust from 2011 to 2012. Director of Barclays Global Investors Holdings Deutschland GmbH from 2006 to 2009. Mr. Polisson is an attorney and has a retired status with the Massachusetts and District of Columbia Bar Associations. | | N/A |
| * | Length of service dates reflect the Trustee’s commencement of service with the Trust’s predecessor entities, where applicable. |
| | | | |
| 30 | | Wells Fargo Growth Balanced Fund | | Other information (unaudited) |
Officers
| | | | | | |
Name and year of birth | | Position held and length of service | | Principal occupations during past five years or longer | | |
| | | |
Andrew Owen (Born 1960) | | President, since 2017 | | Executive Vice President of Wells Fargo & Company and Head of Affiliated Managers, Wells Fargo Asset Management, since 2014. In addition, Mr. Owen is currently President, Chief Executive Officer and Director of Wells Fargo Funds Management, LLC since 2017. Prior thereto, Executive Vice President responsible for marketing, investments and product development for Wells Fargo Funds Management, LLC, from 2009 to 2014. | | |
| | | |
Jeremy DePalma1 (Born 1974) | | Treasurer, since 2012 | | Senior Vice President of Wells Fargo Funds Management, LLC since 2009. Senior Vice President of Evergreen Investment Management Company, LLC from 2008 to 2010 and head of the Fund Reporting and Control Team within Fund Administration from 2005 to 2010. | | |
| | | |
Alexander Kymn (Born 1973) | | Secretary and Chief Legal Officer, since 2018 | | Senior Company Counsel of Wells Fargo Bank, N.A. since 2018 (previously Senior Counsel from 2007 to 2018). Vice President of Wells Fargo Funds Management, LLC from 2008 to 2014. | | |
| | | |
Michael H. Whitaker (Born 1967) | | Chief Compliance Officer, since 2016 | | Senior Vice President and Chief Compliance Officer since 2016. Senior Vice President and Chief Compliance Officer for Fidelity Investments from 2007 to 2016. | | |
| | | |
David Berardi (Born 1975) | | Assistant Treasurer, since 2009 | | Vice President of Wells Fargo Funds Management, LLC since 2009. Vice President of Evergreen Investment Management Company, LLC from 2008 to 2010. Manager of Fund Reporting and Control for Evergreen Investment Management Company, LLC from 2004 to 2010. | | |
| 1 | Jeremy DePalma acts as Treasurer of 86 funds and Assistant Treasurer of 65 funds in the Fund Complex. |
| 2 | The Statement of Additional Information includes additional information about the Trustees and is available, without charge, upon request, by calling 1-800-222-8222 or by visiting the website atwfam.com. |
| | | | | | |
| Other information (unaudited) | | Wells Fargo Growth Balanced Fund | | | 31 | |
BOARD CONSIDERATION OF INVESTMENT MANAGEMENT AND SUB-ADVISORY AGREEMENTS:
Wells Fargo Growth Balanced Fund
Under the Investment Company Act of 1940 (the “1940 Act”), the Board of Trustees (the “Board”) of Wells Fargo Funds Trust (the “Trust”) must determine annually whether to approve the continuation of the Trust’s investment management and sub-advisory agreements. In this regard, at an in-person meeting held on May 21-22, 2019 (the “Meeting”), the Board, all the members of which have no direct or indirect interest in the investment management and sub-advisory agreements and are not “interested persons” of the Trust, as defined in the 1940 Act (the “Independent Trustees”), reviewed and approved for Wells Fargo Growth Balanced Fund (the “Fund”): (i) an investment management agreement (the “Management Agreement”) with Wells Fargo Funds Management, LLC (“Funds Management”); and (ii) an investment sub-advisory agreement (the “Sub-Advisory Agreement”) with Wells Capital Management Incorporated (the “Sub-Adviser”), an affiliate of Funds Management. The Management Agreement and the Sub-Advisory Agreement are collectively referred to as the “Advisory Agreements.” The Fund is a fund-of-funds that invests all of its assets in multiple portfolios of Wells Fargo Master Trust.
At the Meeting, the Board considered the factors and reached the conclusions described below relating to the selection of Funds Management and the Sub-Adviser and the approval of the Advisory Agreements. Prior to the Meeting, including at an in-person meeting in April 2019, the Trustees conferred extensively among themselves and with representatives of Funds Management about these matters. Also, the Board has adopted a team-based approach, with each team consisting of asub-set of Trustees, to assist the full Board in the discharge of its duties in reviewing investment performance and other matters throughout the year. The Independent Trustees were assisted in their evaluation of the Advisory Agreements by independent legal counsel, from whom they received separate legal advice and with whom they met separately.
In providing information to the Board, Funds Management and the Sub-Adviser were guided by a detailed set of requests for information submitted to them by independent legal counsel on behalf of the Independent Trustees at the start of the Board’s annual contract renewal process earlier in 2019. In considering and approving the Advisory Agreements, the Trustees considered the information they believed relevant, including but not limited to the information discussed below. The Board considered not only the specific information presented in connection with the Meeting, but also the knowledge gained over time through interaction with Funds Management and the Sub-Adviser about various topics. In this regard, the Board reviewed reports of Funds Management at each of its quarterly meetings, which included, among other things, portfolio reviews and investment performance reports. In addition, the Board and the teams mentioned above confer with portfolio managers at various times throughout the year. The Board did not identify any particular information or consideration that was all-important or controlling, and each individual Trustee may have attributed different weights to various factors.
After its deliberations, the Board unanimously approved the continuation of the Advisory Agreements for a one-year term and determined that the compensation payable to Funds Management and the Sub-Adviser under each of the Advisory Agreements was reasonable. The Board considered the approval of the Advisory Agreements for the Fund as part of its consideration of agreements for funds across the complex, but its approvals were made on a fund-by-fund basis. The following summarizes a number of important, but not necessarily all, factors considered by the Board in support of its approvals.
Nature, extent and quality of services
The Board received and considered various information regarding the nature, extent and quality of services provided to the Fund by Funds Management and the Sub-Adviser under the Advisory Agreements. This information included a description of the investment advisory services and Fund-level administrative services covered by the Management Agreement, as well as, among other things, a summary of the background and experience of senior management of Wells Fargo Asset Management (“WFAM”), of which Funds Management and the Sub-Adviser are a part, a summary of investments made in the business of WFAM, a summary of certain organizational and personnel changes involving Funds Management and the Sub-Adviser, and a description of Funds Management’s and the Sub-Adviser’s business continuity planning programs and of their approaches to data privacy and cybersecurity. The Board received and reviewed information about Funds Management’s role as administrator of the Fund’s liquidity risk management program. The Board also considered the qualifications, background, tenure and responsibilities of each of the portfolio managers primarily responsible for the day-to-day portfolio management of the Fund.
The Board evaluated the ability of Funds Management and the Sub-Adviser to attract and retain qualified investment professionals, including research, advisory and supervisory personnel. The Board further considered the compliance programs and compliance records of Funds Management and the Sub-Adviser. In addition, the Board took into account the full range of services provided to the Fund by Funds Management and its affiliates.
| | | | |
| 32 | | Wells Fargo Growth Balanced Fund | | Other information (unaudited) |
Fund investment performance and expenses
The Board considered the investment performance results for the Fund over various time periods ended December 31, 2018. The Board considered these results in comparison to the investment performance of funds in a universe that was determined by Broadridge Inc. (“Broadridge”) to be similar to the Fund (the “Universe”), and in comparison to the Fund’s benchmark index and to other comparative data. Broadridge is an independent provider of investment company data. The Board received a description of the methodology used by Broadridge to select the mutual funds in the performance Universe. The Board noted that the investment performance of the Fund (Administrator Class) was higher than the average investment performance of the Universe for the one-, five- and ten-year periods under review, and lower than the average investment performance of the Universe for the three-year period under review. The Board also noted that the investment performance of the Fund was lower than its benchmark index, the Growth Balanced Blended Index, for the one-, three- and five-year periods under review, but higher than its benchmark for the ten-year period under review.
The Board received information concerning, and discussed factors contributing to, the underperformance of the Fund relative to the Universe and benchmark for the periods identified above. The Board took note of the explanations for the relative underperformance during these periods, including with respect to investment decisions and market factors that affected the Fund’s investment performance. The Board also took note of the Fund’s outperformance relative to the Universe and benchmark over the longer time periods under review.
The Board also received and considered information regarding the Fund’s net operating expense ratios and their various components, including actual management fees, custodian and other non-management fees, and Rule 12b-1 and non-Rule 12b-1 shareholder service fees. The Board considered these ratios in comparison to the median ratios of funds in class-specific expense groups that were determined by Broadridge to be similar to the Fund (the “Groups”). The Board received a description of the methodology used by Broadridge to select the mutual funds in the expense Groups and an explanation of how funds comprising expense groups and their expense ratios may vary from year-to-year. Based on the Broadridge reports, the Board noted that the net operating expense ratios of the Fund were lower than the median net operating expense ratios of the expense Groups for each share class.
The Board took into account the Fund’s investment performance and expense information provided to it among the factors considered in deciding to re-approve the Advisory Agreements.
Investment management and sub-advisory fee rates
The Board reviewed and considered the contractual fee rates payable by the Fund to Funds Management under the Management Agreement, as well as the contractual fee rates payable by the Fund to Funds Management for class-level administrative services under a Class-Level Administration Agreement, which include, among other things, class-level transfer agency and sub-transfer agency costs (collectively, the “Management Rates”). The Board also reviewed and considered the contractual investment sub-advisory fee rates that are payable by Funds Management to the Sub-Adviser for investment sub-advisory services.
Among other information reviewed by the Board was a comparison of the Fund’s Management Rates, which include the advisory fees paid at the master portfolio level, with the average contractual investment management fee rates of funds in the expense Groups at a common asset level as well as transfer agency costs of the funds in the expense Groups. The Board noted that the Management Rates of the Fund were lower than the sum of these average rates for the Fund’s expense Groups for all share classes.
The Board also received and considered information about the portion of the total management fee that was retained by Funds Management after payment of the fee to the Sub-Adviser for sub-advisory services. In assessing the reasonableness of this amount, the Board received and evaluated information about the nature and extent of responsibilities retained and risks assumed by Funds Management and not delegated to or assumed by the Sub-Adviser, and about Funds Management’son-going oversight services. Given the affiliation between Funds Management and the Sub-Adviser, the Board ascribed limited relevance to the allocation of fees between them.
The Board also received and considered information about the nature and extent of services offered and fee rates charged by Funds Management and the Sub-Adviser to other types of clients with investment strategies similar to those of the Fund. In this regard, the Board received information about the significantly greater scope of services, and compliance, reporting and other legal burdens and risks of managing proprietary mutual funds compared with those associated with managing assets of other types of clients, including third-party sub-advised fund clients and non-mutual fund clients such as institutional separate accounts.
Based on its consideration of the factors and information it deemed relevant, including those described here, the Board determined that the compensation payable to Funds Management under the Management Agreement and to theSub-Adviser under the Sub-Advisory Agreement was reasonable.
| | | | | | |
| Other information (unaudited) | | Wells Fargo Growth Balanced Fund | | | 33 | |
Profitability
The Board received and considered information concerning the profitability of Funds Management, as well as the profitability of both WFAM and Wells Fargo & Co. (“Wells Fargo”) from providing services to the fund family as a whole. The Board noted that the Sub-Adviser’s profitability information with respect to providing services to the Fund and other funds in the family was subsumed in the WFAM and Wells Fargo profitability analysis.
Funds Management reported on the methodologies and estimates used in calculating profitability, including a description of the methodology used to allocate certain expenses. Among other things, the Board noted that the levels of profitability reported on a fund-by-fund basis varied widely, depending on factors such as the size, type and age of fund. Based on its review, the Board did not deem the profits reported by Funds Management, WFAM or Wells Fargo from services provided to the Fund to be at a level that would prevent it from approving the continuation of the Advisory Agreements.
Economies of scale
The Board received and considered information about the potential for Funds Management to experience economies of scale in the provision of management services to the Fund, the difficulties of calculating economies of scale at an individual fund level, and the extent to which potential scale benefits are shared with shareholders. The Board noted the existence of breakpoints in the Fund’s management fee structure, which operate generally to reduce the Fund’s expense ratios as the Fund grows in size. The Board considered that in addition to management fee breakpoints, Funds Management shares potential economies of scale from its management business in a variety of ways, including through fee waiver and expense reimbursement arrangements, services that benefit shareholders, competitive management fee rates set at the outset without regard to breakpoints, and investments in the business intended to enhance services available to shareholders.
The Board concluded that Funds Management’s arrangements with respect to the Fund, including contractual breakpoints, constituted a reasonable approach to sharing potential economies of scale with the Fund and its shareholders.
Other benefits to Funds Management and the Sub-Adviser
The Board received and considered information regarding potential “fall-out” or ancillary benefits received by Funds Management and its affiliates, including the Sub-Adviser, as a result of their relationships with the Fund. Ancillary benefits could include, among others, benefits directly attributable to other relationships with the Fund and benefits potentially derived from an increase in Funds Management’s and the Sub-Adviser’s business as a result of their relationships with the Fund. The Board noted that various affiliates of Funds Management may receive distribution-related fees, shareholder servicing payments and sub-transfer agency fees in respect of shares sold or held through them and services provided.
The Board also reviewed information about soft dollar credits earned and utilized by the Sub-Adviser, fees earned by Funds Management and the Sub-Adviser from managing a private investment vehicle for the fund family’s securities lending collateral, and commissions earned by an affiliated broker from portfolio transactions.
Based on its consideration of the factors and information it deemed relevant, including those described here, the Board did not find that any ancillary benefits received by Funds Management and its affiliates, including the Sub-Adviser, were unreasonable.
Conclusion
At the Meeting, after considering the above-described factors and based on its deliberations and its evaluation of the information described above, the Board unanimously approved the continuation of the Advisory Agreements for a one-year term and determined that the compensation payable to Funds Management and the Sub-Adviser under each of the Advisory Agreements was reasonable.
This page is intentionally left blank.
This page is intentionally left blank.
This page is intentionally left blank.

For more information
More information about Wells Fargo Funds is available free upon request. To obtain literature, please write, visit the Fund’s website, or call:
Wells Fargo Funds
P.O. Box 219967
Kansas City, MO 64121-9967
Website: wfam.com
Individual investors: 1-800-222-8222
Retail investment professionals: 1-888-877-9275
Institutional investment professionals:1-866-765-0778
This report and the financial statements contained herein are submitted for the general information of the shareholders of the Fund. If this report is used for promotional purposes, distribution of the report must be accompanied or preceded by a current prospectus. Before investing, please consider the investment objectives, risks, charges, and expenses of the investment. For a current prospectus and, if available, a summary prospectus, containing this information, call1-800-222-8222 or visit the Fund’s website atwfam.com. Read the prospectus carefully before you invest or send money.
Wells Fargo Asset Management (WFAM) is the trade name for certain investment advisory/management firms owned by Wells Fargo & Company. These firms include but are not limited to Wells Capital Management Incorporated and Wells Fargo Funds Management, LLC. Certain products managed by WFAM entities are distributed by Wells Fargo Funds Distributor, LLC (a broker-dealer and Member FINRA).
This material is for general informational and educational purposes only and is NOT intended to provide investment advice or a recommendation of any kind—including a recommendation for any specific investment, strategy, or plan.
INVESTMENT PRODUCTS: NOT FDIC INSURED ◾ NO BANK GUARANTEE ◾ MAY LOSE VALUE
© 2019 Wells Fargo Funds Management, LLC. All rights reserved.
| | |
 | | 403192 07-19 A278/AR278 05-19 |
Annual Report
May 31, 2019

Wells Fargo Moderate Balanced Fund

Beginning on January 1, 2021, as permitted by new regulations adopted by the Securities and Exchange Commission, paper copies of the Wells Fargo Funds’ annual and semi-annual shareholder reports issued after this date will no longer be sent by mail, unless you specifically request paper copies of the reports. Instead, the reports will be made available on the Funds’ website, and you will be notified by mail each time a report is posted and provided with a website address to access the report.
If you already elected to receive shareholder reports electronically, you will not be affected by this change and you need not take any action. You may elect to receive shareholder reports and other communications from the Fund electronically at any time by contacting your financial intermediary (such as a broker-dealer or bank) or, if you are a direct investor, by calling 1-800-222-8222 or by enrolling at wellsfargo.com/advantagedelivery.
You may elect to receive all future reports in paper free of charge. If you invest through a financial intermediary, you can contact your financial intermediary to request that you continue to receive paper copies of your shareholder reports; if you invest directly with the Fund, you can call 1-800-222-8222. Your election to receive reports in paper will apply to all Wells Fargo Funds held in your account with your financial intermediary or, if you are a direct investor, to all Wells Fargo Funds that you hold.

Reduce clutter. Save trees.
Sign up for electronic delivery of prospectuses and shareholder reports atwellsfargo.com/advantagedelivery
Contents
The views expressed and any forward-looking statements are as of May 31, 2019, unless otherwise noted, and are those of the Fund managers and/or Wells Fargo Asset Management. Discussions of individual securities, or the markets generally, or any Wells Fargo Fund are not intended as individual recommendations. Future events or results may vary significantly from those expressed in any forward-looking statements. The views expressed are subject to change at any time in response to changing circumstances in the market. Wells Fargo Asset Management and the Fund disclaim any obligation to publicly update or revise any views expressed or forward-looking statements.
INVESTMENT PRODUCTS: NOT FDIC INSURED ◾ NO BANK GUARANTEE ◾ MAY LOSE VALUE
| | | | |
| 2 | | Wells Fargo Moderate Balanced Fund | | Letter to shareholders (unaudited) |

Andrew Owen
President
Wells Fargo Funds
Dear Shareholder:
We are pleased to offer you this annual report for the Wells Fargo Moderate Balanced Fund for the 12-month period that ended May 31, 2019. Highershort-term interest rates, inflation concerns, trade tensions, and geopolitical events drove investment market volatility for much of 2018, particularly for international stocks. Early 2019 saw stocks and bonds gain with renewed business and investor confidence, but volatility returned late in the period as global growth slowed and geopolitical concerns persisted.
For the period, U.S. stocks, based on the S&P 500 Index,1 gained 3.78% and international stocks, as measured by the MSCI ACWI ex USA Index (Net),2 fell 6.26%. Based on the MSCI EM Index (Net),3 emerging market stocks fell 8.70%. Bond investors saw the Bloomberg Barclays U.S. Aggregate Bond Index4 add 6.40% while the Bloomberg Barclays Global Aggregate ex-USD Index5 rose 0.39%. The Bloomberg Barclays Municipal Bond Index6 added 6.40%, and the ICE BofAML U.S. High Yield Index7 was up 5.37%.
Results for investment indices reflected global concerns.
Global trade tensions escalated during the second quarter of 2018. A tit-for-tat tariff spat intensified between the U.S. and other governments. The U.S. Federal Reserve (Fed) raised the federal funds rate by 25 basis points (bps; 100 bps equal 1.00%) to a target range of between 1.75% and 2.00% in June. Market index results reflected the global concerns. The MSCI ACWI ex USA Index (Net) lost 2.61%, while the Bloomberg Barclays Global Aggregate ex-USD Index dropped 4.76%.
Not all news was bad. The U.S. Bureau of Economic Analysis reported second-quarter annualized gross domestic product (GDP) growth of 4.2%. Hiring improved. Unemployment declined. Consumer confidence and spending increased. The S&P 500 Index recorded a 3.43% second-quarter gain. Stocks of companies with smaller capitalizations did even better, as measured by the Russell 2000® Index,8 adding 7.75%.
| 1 | The S&P 500 Index consists of 500 stocks chosen for market size, liquidity, and industry group representation. It is a market-value-weighted index with each stock’s weight in the index proportionate to its market value. You cannot invest directly in an index. |
| 2 | The Morgan Stanley Capital International (MSCI) All Country World Index (ACWI) ex USA Index (Net) is a free-float-adjusted market-capitalization-weighted index that is designed to measure the equity market performance of developed and emerging markets, excluding the U.S. Source: MSCI. MSCI makes no express or implied warranties or representations and shall have no liability whatsoever with respect to any MSCI data contained herein. The MSCI data may not be further redistributed or used as a basis for other indices or any securities or financial products. This report is not approved, reviewed, or produced by MSCI. You cannot invest directly in an index. |
| 3 | The MSCI Emerging Markets (EM) Index (Net) is a free-float-adjusted market-capitalization-weighted index that is designed to measure the equity market performance of emerging markets. You cannot invest directly in an index. |
| 4 | The Bloomberg Barclays U.S. Aggregate Bond Index is a broad-based benchmark that measures the investment-grade, U.S.-dollar-denominated, fixed-rate taxable bond market, including Treasuries, government-related and corporate securities, mortgage-backed securities (agency fixed-rate and hybrid adjustable-rate mortgage pass-throughs), asset-backed securities, and commercial mortgage-backed securities. You cannot invest directly in an index. |
| 5 | The Bloomberg Barclays Global Aggregate ex-USD Index is an unmanaged index that provides a broad-based measure of the global investment-grade fixed-income markets excluding the U.S.-dollar-denominated debt market. You cannot invest directly in an index. |
| 6 | The Bloomberg Barclays Municipal Bond Index is an unmanaged index composed of long-term tax-exempt bonds with a minimum credit rating of Baa. You cannot invest directly in an index. |
| 7 | The ICE BofAML U.S. High Yield Index is a market-capitalization-weighted index of domestic and Yankee high-yield bonds. The index tracks the performance of high-yield securities traded in the U.S. bond market. You cannot invest directly in an index. Copyright 2019. ICE Data Indices, LLC. All rights reserved. |
| 8 | The Russell 2000® Index measures the performance of the 2,000 smallest companies in the Russell 3000® Index, which represents approximately 8% of the total market capitalization of the Russell 3000® Index. You cannot invest directly in an index. |
| | | | | | |
| Letter to shareholders (unaudited) | | Wells Fargo Moderate Balanced Fund | | | 3 | |
Investors appeared to shake off lingering concerns during the third quarter.
Favorable third-quarter economic indicators and corporate earnings reports encouraged domestic stock investors. U.S. trade negotiations with Mexico and Canada progressed. The Conference Board Consumer Confidence Index®9 reached its highest level in 18 years during September 2018. The Fed raised the federal funds rate by 25 bps to a target range of between 2.00% and 2.25% in September. For the quarter that ended September 30, 2018, the S&P 500 Index added 7.71%.
Investors in international markets were not as confident. Tensions between the U.S. and China increased. The U.S. imposed $200 billion in tariffs on Chinese goods. China reacted with $60 billion in tariffs on U.S. goods. Economic growth in China caused concern. The Bank of England (BoE) raised its monetary policy rate to 0.75% in August 2018. During the quarter, the MSCI ACWI ex USA Index (Net) gained 0.71%. The MSCI EM Index (Net) declined 1.09%. In fixed-income markets, U.S. bonds were flat, as measured by the Bloomberg Barclays U.S. Aggregate Bond Index. The Bloomberg Barclays Global Aggregate ex-USD Index fell 1.74%.
Conflicting data unsettled markets during the fourth quarter.
November’s U.S. midterm elections shifted control of the House of Representatives from Republicans to Democrats, presaging potential partisan clashes. Third-quarter U.S. GDP was announced at an annualized 3.4% rate, lower than the second-quarter rate. Brexit efforts stalled ahead of the March 2019 deadline. The People’s Bank of China cut reserve requirement ratios, accelerated infrastructure spending, and cut taxes even as the value of the yuan declined to low levels last seen in 2008.
December’s S&P 500 Index performance was the worst since 1931. Globally,fixed-income investments fared better than stocks during the last two months of the year. The Fed increased the federal funds rate by 25 bps in December 2018 to a target range of between 2.25% and 2.50%.
The market climbs a wall of worry.
Investors entered 2019 with reasons to be concerned. A partial U.S. government shutdown driven by partisan policy disputes extended into January. Investment returns appeared to reaffirm the adage that markets climb a wall of worry. The S&P 500 Index gained 8.01% for the month of January, the best monthly performance in 30 years. Returns for the MSCI ACWI ex USA Index (Net), the Bloomberg Barclays U.S. Aggregate Bond Index, and the Bloomberg Barclays Global Aggregate ex-USD Index also were positive. The Fed indicated that it would pause its program of regular rate increases during 2019 as inflation remained low.
In February 2019, concerns over slowing global growth reemerged. The Bureau of Economic Analysis announced fourth-quarter 2018 GDP grew at an annualized 2.2% rate, down from levels of the prior two quarters. In a February report, the BoE forecast the slowest growth since the financial crisis for 2019. China and the U.S. continued to wrangle over trade issues.
By the end of March 2019, the combination of dovish Fed sentiment and consistent, if not spectacular, economic and business metrics reinforced investors’ confidence. Monthly job creation data regained momentum. Corporate profits, while lower than 2018’s lofty levels, remained solid. China announced a roughly $300 billion stimulus package through tax and fee cuts intended to reinvigorate economic growth.
December’s S&P 500 Index performance was the worst since 1931.
The S&P 500 Index gained 8.01% for the month of January, the best monthly performance in 30 years.
| 9 | The Conference Board Consumer Confidence Index® measures the degree of optimism on the state of the U.S. economy that consumers are expressing through their activities of saving and spending. You cannot invest directly in an index. |
| | | | |
| 4 | | Wells Fargo Moderate Balanced Fund | | Letter to shareholders (unaudited) |
During April, several broad-based U.S. equity indices reached or approached highs as investors drew confidence from favorable economic projections, sustained low inflation, and solid employment data. First-quarter GDP showed the economy grew at an annualized rate of 3.2% on improvement in business investment and exports. Favorable sentiment extended to foreign markets as the MSCI ACWI ex USA Index (Net) gained 2.64% and the MSCI EM Index (Net) added 2.11% for the month.
May 2019 presented investors with mixed signals in the economy, in the markets, and politically. In the U.S., partisan wrangling ramped up as Democrats and Republicans set their sights on 2020 presidential politics. In the U.K., the Brexit stalemate resulted in the resignation of Prime Minister Theresa May. The European Commission downgraded the 2019 growth forecast for the block of countries to 1.2%. The U.S. increased tariffs on products from China, China responded, and then talks broke down. Ending the month, equities, as measured by the MSCI ACWI (Net),10 dropped 5.93% while bonds, often considered a less risky investment, gained 1.04%, as measured by the Bloomberg Barclays Global Aggregate ex-USD Index.
Don’t let short-term uncertainty derail long-term investment goals.
Periods of investment uncertainty can present challenges, but experience has taught us that maintaining long-term investment goals can be an effective way to plan for the future. To help you create a sound strategy based on your personal goals and risk tolerance, Wells Fargo Funds offers more than 100 mutual funds spanning a wide range of asset classes and investment styles. Although diversification cannot guarantee an investment profit or prevent losses, we believe it can be an effective way to manage investment risk and potentially smooth out overall portfolio performance. We encourage investors to know their investments and to understand that appropriate levels of risk-taking may unlock opportunities.
Thank you for choosing to invest with Wells Fargo Funds. We appreciate your confidence in us and remain committed to helping you meet your financial needs.
Sincerely,

Andrew Owen
President
Wells Fargo Funds
For further information about your Fund, contact your investment professional, visit our website atwfam.com, or call us directly at1-800-222-8222.
| 10 | The MSCI ACWI (Net) is a free-float-adjusted market-capitalization-weighted index that is designed to measure the equity market performance of developed and emerging markets. You cannot invest directly in an index. |
This page is intentionally left blank.
| | | | |
| 6 | | Wells Fargo Moderate Balanced Fund | | Performance highlights (unaudited) |
Investment objective
The Fund seeks total return, consisting of current income and capital appreciation.
Manager
Wells Fargo Funds Management, LLC
Subadviser
Wells Capital Management Incorporated
Portfolio managers
Kandarp R. Acharya, CFA®‡ , FRM
Petros N. Bocray, CFA®‡ , FRM
Christian L. Chan, CFA®‡
Average annual total returns (%) as of May 31, 2019
| | | | | | | | | | | | | | | | | | | | | | | | | | | | | | | | | | |
| | | | | Including sales charge | | | Excluding sales charge | | | Expense ratios1 (%) | |
| | | Inception date | | 1 year | | | 5 year | | | 10 year | | | 1 year | | | 5 year | | | 10 year | | | Gross | | | Net2 | |
| | | | | | | | | |
| Class A (WFMAX) | | 1-30-2004 | | | -3.22 | | | | 3.06 | | | | 6.94 | | | | 2.68 | | | | 4.29 | | | | 7.58 | | | | 1.32 | | | | 1.15 | |
| | | | | | | | | |
| Class C (WFBCX) | | 1-30-2004 | | | 0.90 | | | | 3.50 | | | | 6.76 | | | | 1.90 | | | | 3.50 | | | | 6.76 | | | | 2.07 | | | | 1.90 | |
| | | | | | | | | |
| Administrator Class (NVMBX) | | 11-11-1994 | | | – | | | | – | | | | – | | | | 2.95 | | | | 4.55 | | | | 7.83 | | | | 1.24 | | | | 0.90 | |
| | | | | | | | | |
| Institutional Class (WFMYX)3 | | 7-31-2018 | | | – | | | | – | | | | – | | | | 3.05 | | | | 4.57 | | | | 7.85 | | | | 0.99 | | | | 0.80 | |
| | | | | | | | | |
| Moderate Balanced Blended Index4 | | – | | | – | | | | – | | | | – | | | | 3.99 | | | | 4.73 | | | | 7.07 | | | | – | | | | – | |
| | | | | | | | | |
| Bloomberg Barclays U.S. Aggregate Bond Index5 | | – | | | – | | | | – | | | | – | | | | 6.40 | | | | 2.70 | | | | 3.83 | | | | – | | | | – | |
| | | | | | | | | |
| Bloomberg Barclays U.S. Short Treasury 9-12 Months Index6 | | – | | | – | | | | – | | | | – | | | | 2.62 | | | | 0.98 | | | | 0.71 | | | | – | | | | – | |
| | | | | | | | | |
| MSCI EAFE Index (Net)7 | | – | | | – | | | | – | | | | – | | | | -5.75 | | | | 1.27 | | | | 6.23 | | | | – | | | | – | |
| | | | | | | | | |
| Russell 1000® Growth Index8 | | – | | | – | | | | – | | | | – | | | | 5.39 | | | | 12.33 | | | | 15.64 | | | | – | | | | – | |
| | | | | | | | | |
| Russell 1000® Value Index9 | | – | | | – | | | | – | | | | – | | | | 1.45 | | | | 6.53 | | | | 12.33 | | | | – | | | | – | |
| | | | | | | | | |
| Russell 2000® Index10 | | – | | | – | | | | – | | | | – | | | | -9.04 | | | | 6.71 | | | | 12.84 | | | | – | | | | – | |
| | | | | | | | | |
| S&P 500 Index11 | | – | | | – | | | | – | | | | – | | | | 3.78 | | | | 9.66 | | | | 13.95 | | | | – | | | | – | |
Figures quoted represent past performance, which is no guarantee of future results, and do not reflect taxes that a shareholder may pay on fund distributions or the redemption of fund shares. Investment return and principal value of an investment will fluctuate so that an investor’s shares, when redeemed, may be worth more or less than their original cost. Performance shown without sales charges would be lower if sales charges were reflected. Current performance may be lower or higher than the performance data quoted, which assumes the reinvestment of dividends and capital gains. Current month-end performance is available on the Fund’s website,wfam.com.
Index returns do not include transaction costs associated with buying and selling securities, any mutual fund fees or expenses, or any taxes. It is not possible to invest directly in an index.
For Class A shares, the maximum front-end sales charge is 5.75%. For Class C shares, the maximum contingent deferred sales charge is 1.00%. Performance including a contingent deferred sales charge assumes the sales charge for the corresponding time period. Administrator Class and Institutional Class shares are sold without a front-end sales charge or contingent deferred sales charge.
Balanced funds may invest in stocks and bonds. Stock values fluctuate in response to the activities of individual companies and general market and economic conditions. Bond values fluctuate in response to the financial condition of individual issuers, general market and economic conditions, and changes in interest rates. Changes in market conditions and government policies may lead to periods of heightened volatility in the bond market and reduced liquidity for certain bonds held by the Fund. In general, when interest rates rise, bond values fall and investors may lose principal value. Interest rate changes and their impact on the fund and its share price can be sudden and unpredictable. The use of derivatives may reduce returns and/or increase volatility. Certain investment strategies tend to increase the total risk of an investment (relative to the broader market). The Fund is exposed to mortgage- and asset-backed securities risk. Consult the Fund’s prospectus for additional information on these and other risks.
Please see footnotes on page 7.
| | | | | | |
| Performance highlights (unaudited) | | Wells Fargo Moderate Balanced Fund | | | 7 | |
|
| Growth of $10,000 investment as of May 31, 201911 |
|
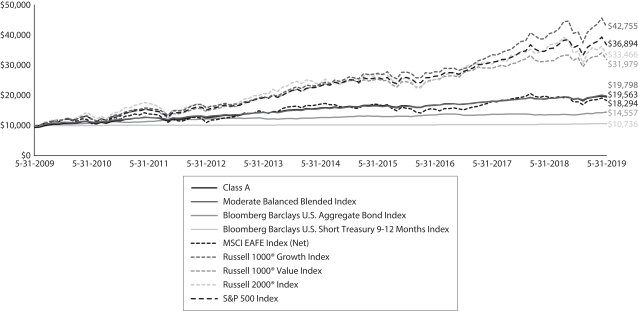 |
| ‡ | CFA® and Chartered Financial Analyst® are trademarks owned by CFA Institute. |
| 1 | Reflects the expense ratios as stated in the most recent prospectuses, which include the impact of 0.44% in acquired fund fees and expenses. The expense ratios shown are subject to change and may differ from the annualized expense ratios shown in the financial highlights of this report, which do not include acquired fund fees and expenses. |
| 2 | The manager has contractually committed through September 30, 2019, to waive fees and/or reimburse expenses to the extent necessary to cap the expenses of each class after fee waivers at the amounts shown. Brokerage commissions, stamp duty fees, interest, taxes, acquired fund fees and expenses (if any) from funds in which the affiliated master portfolios and funds invest and from any money market funds, and extraordinary expenses are excluded from the expense cap. All other acquired fund fees and expenses from the affiliated master portfolios and funds are included in the expense caps. Prior to or after the commitment expiration date, the cap may be increased or the commitment to maintain the cap may be terminated only with the approval of the Board of Trustees. Without this cap, the Fund’s returns would have been lower. The expense ratio paid by an investor is the net expense ratio (the total annual fund operating expenses after fee waivers) as stated in the prospectuses. |
| 3 | Historical performance shown for the Institutional Class shares prior to their inception reflects the performance of the Administrator Class shares, and is not adjusted to reflect Institutional Class share expenses. If these expenses had been included, returns for Institutional Class shares would be higher. The Administrator Class annual returns are substantially similar to what the Institutional Class annual returns would be because the Administrator and Institutional Class shares are invested in the same portfolio and their returns differ only to the extent that they do not have the same expenses. |
| 4 | Source: Wells Fargo Funds Management, LLC. The Moderate Balanced Blended Index is composed 45% of the Bloomberg Barclays U.S. Aggregate Bond Index, 15% of the Bloomberg Barclays U.S. Short Treasury 9-12 Months Index, 10% of the Russell 1000® Growth Index, 10% of the Russell 1000® Value Index, 10% of the S&P 500 Index, 6% of the MSCI EAFE Index (Net), and 4% of the Russell 2000® Index. You cannot invest directly in an index. |
| 5 | The Bloomberg Barclays U.S. Aggregate Bond Index is a broad-based benchmark that measures the investment-grade, U.S. dollar–denominated, fixed-rate taxable bond market, including Treasuries, government-related and corporate securities, mortgage-backed securities (agency fixed-rate and hybrid adjustable-rate mortgage pass-throughs), asset-backed securities, and commercial mortgage backed securities. You cannot invest directly in an index. |
| 6 | The Bloomberg Barclays U.S. Short Treasury 9–12 Months Index is an unmanaged index that includes aged U.S. Treasury bills, notes, and bonds with a remaining maturity from 9 up to (but not including) 12 months. It excludes zero-coupon STRIPS. You cannot invest directly in an index. |
| 7 | The Morgan Stanley Capital International (MSCI) Europe, Australasia, Far East (EAFE) Index (Net) is a free-float-adjusted market-capitalization-weighted index that is designed to measure the equity market performance of developed markets, excluding the U.S. and Canada. Source: MSCI. MSCI makes no representations and shall have no liability whatsoever with respect to any MSCI data contained herein. The MSCI data may not be further redistributed or used as a basis for other indices or any securities or financial products. This report is not approved, reviewed, or produced by MSCI. You cannot invest directly in an index. |
| 8 | The Russell 1000® Growth Index measures the performance of those Russell 1000 companies with higher price/book ratios and higher forecasted growth values. You cannot invest directly in an index. |
| 9 | The Russell 1000® Value Index measures the performance of those Russell 1000 companies with lower price/book ratios and lower forecasted growth values. You cannot invest directly in an index. |
| 10 | The Russell 2000® Index measures the performance of the 2,000 smallest companies in the Russell 3000® Index, which represents approximately 8% of the total market capitalization of the Russell 3000® Index. You cannot invest directly in an index. |
| 11 | The S&P 500 Index consists of 500 stocks chosen for market size, liquidity, and industry group representation. It is a market-value-weighted index with each stock’s weight in the index proportionate to its market value. You cannot invest directly in an index. |
| 12 | The chart compares the performance of Class A shares for the most recent ten years with the Moderate Balanced Blended Index, the Bloomberg Barclays U.S. Aggregate Bond Index, Bloomberg Barclays U.S. Short Treasury 9–12 Months Index, the MSCI EAFE Index (Net), the Russell 1000® Growth Index, the Russell 1000® Value Index, the Russell 2000® Index, and the S&P 500 Index. The chart assumes a hypothetical $10,000 investment in Class A and reflects all operating expenses and assumes the maximum initial sales charge of 5.75%. |
| 13 | The ten largest holdings, excluding cash and cash equivalents and any money market funds, are calculated based on the value of the investments divided by the total net assets of the Fund. Holdings are subject to change and may have changed since the date specified. |
| 14 | Effective allocation includes the effect of any tactical futures overlay that may be in place. Effective cash is comprised of the net impact of long and/or short futures contracts held as part of a dynamic risk management strategy. These amounts are subject to change and may have changed since the date specified. |
| | | | |
| 8 | | Wells Fargo Moderate Balanced Fund | | Performance highlights (unaudited) |
MANAGER’S DISCUSSION
Fund highlights
| ∎ | | The Fund underperformed the Moderate Balanced Blended Index for the 12-month period that ended May 31, 2019. |
| ∎ | | Relative underperformance by two of the underlying domestic equity investments and one of the underlying international equity investments were the most significant detractors from performance over the period. |
| ∎ | | On a relative basis, one-third of underlying investments outperformed their respective benchmarks. |
| ∎ | | The tactical asset allocation (TAA) overlay, a futures strategy, added to performance through the period. |
Positive economic data and increased market volatility ruled most of the period.
The 12-month period that ended May 31, 2019, saw the U.S. economy continue on a positive trajectory, producing moderate average gross domestic product growth of 3.1% with a core inflation rate of 2.0%, while unemployment reached a low of 3.6%, the lowest level since 1969.
Over the last 12 months, the financial markets experienced more volatility than the favorable economic environment might have suggested. Looking back at the financial markets, we saw equities experience a significant decline during the fourth quarter of 2018, as concerns over a partial U.S. government shutdown, central bank tightening, trade tensions, and slowing economic growth shook investors’ confidence. The market volatility of the fourth quarter gave way to a first-quarter 2019 rebound where both equity and fixed-income markets rallied. The two markets seemed joined at the hip as the Federal Reserve’s (Fed’s) updated script signaled an easier policy path for the balance of 2019. Market participants were caught offside by this evolution in the projected policy path, which has resulted in a broader opportunity set for sector rotation in equities and yield curve trades. We saw a return of volatility toward the end of the 12-month period as concerns over trade (primarily with China and Mexico) caused concerns over global growth to weigh on investors’ minds.
| | | | |
| Ten largest holdings (%) as of May 31, 201913 | |
| |
Wells Fargo Managed Fixed Income Portfolio | | | 32.00 | |
| |
Wells Fargo Conservative Income Fund Institutional Class | | | 15.10 | |
| |
Wells Fargo Disciplined Large Cap Portfolio | | | 9.40 | |
| |
Wells Fargo Core Bond Portfolio | | | 9.14 | |
| |
Wells Fargo Diversified Large Cap Growth Portfolio | | | 6.68 | |
| |
Wells Fargo Large Company Value Portfolio | | | 6.46 | |
| |
Wells Fargo Real Return Portfolio | | | 4.56 | |
| |
Wells Fargo C&B Large Cap Value Portfolio | | | 3.21 | |
| |
Wells Fargo International Growth Portfolio | | | 2.98 | |
| |
Wells Fargo International Value Portfolio | | | 2.94 | |
| | | | | | | | |
| Allocations (%) as of May 31, 2019 | |
| | | Effective
allocation14 | | | Neutral
allocation | |
| | |
Bonds | | | 60 | | | | 60 | |
| | |
Stocks | | | 36 | | | | 40 | |
| | |
Effective Cash | | | 4 | | | | 0 | |
Portfolio management addressed Fund allocations throughout the period.
Over the period, we made one significant change to the underlying portfolios used within the Fund. In the fourth quarter of 2018, we added three dedicated emerging market holdings to the portfolio. This change reflects our belief that gaining direct emerging market exposure from dedicated emerging market portfolio managers is preferable to relying on our developed market managers alone.
Within the Fund’s underlying holdings, the fixed-income holdings were the strongest contributors to performance on both a relative and an absolute basis. The Managed Fixed Income Portfolio is the largest single underlying holding in the portfolio. It returned more than 7% and outperformed its benchmark by 82 basis points (bps; 100 bps equal 1.00%). The underlying developed market international equity funds produced negative absolute returns and mixed relative performance results. The U.S. equity funds tended to produce positive absolute performance with mixed relative performance results. Poor relative performance from two U.S.-focused and two international equity managers was the primary detractor from performance.
Please see footnotes on page 7.
| | | | | | |
| Performance highlights (unaudited) | | Wells Fargo Moderate Balanced Fund | | | 9 | |
At the start of the period, the Fund’s targeted TAA overlay was 5.00% long in the S&P 500 futures contract. Due to volatility concerns, in early September, 2018, we reduced the position by 2.50%. In October, 2018, we added a total of 2.50%, bringing the position back to 5.00% long. During early November, 2018, we covered 1.25%. In early December, 2018, we added 2.50%, bringing the position to 6.25%. As January, 2019, drew to a close, we covered 2.50%. In early February, 2019, we covered the remaining 3.75% and exited the position. With respect to the 10-year Treasury contract activity, we started the period short 2.50% and covered the position in early October, 2018. In mid-December, 2018, we established a new 2.50% short position and exited it in early March, 2019.
Looking ahead, we are somewhat cautiously optimistic.
Our macroeconomic view is that growth will remain positive but it will be slower over the next 12 months than it was over the preceding 12 months. However, we still hold that absent an exogenous shock—likely an implemented shift in trade policy—a U.S. recession is unlikely in 2019. As always, that view could change with new data. We are concerned about growth prospects in Europe and in the rest of the world but are most concerned about the U.S. trade negotiations with major trading partners. Until the trade negotiations move toward détente and more certainty builds to invoke more aggressive business planning resulting in further growth, we are taking a bit more of a cautious approach to the markets and have started to reduce some risks in the portfolios. Like the Fed, we remain very data dependent and acknowledge that while the U.S. economy may be softening, the levels of growth remain robust and 2019 should remain a target-rich environment for investors.
| | | | |
| 10 | | Wells Fargo Moderate Balanced Fund | | Fund expenses (unaudited) |
As a shareholder of the Fund, you incur two types of costs: (1) transaction costs, including sales charges (loads) on purchase payments and contingent deferred sales charges (if any) on redemptions and (2) ongoing costs, including management fees, distribution (12b-1) and/or shareholder servicing fees, and other Fund expenses. This example is intended to help you understand your ongoing costs (in dollars) of investing in the Fund and to compare these costs with the ongoing costs of investing in other mutual funds.
The example is based on an investment of $1,000 invested at the beginning of the six-month period and held for the entire period from December 1, 2018 to May 31, 2019.
Actual expenses
The “Actual” line of the table below provides information about actual account values and actual expenses. You may use the information in this line, together with the amount you invested, to estimate the expenses that you paid over the period. Simply divide your account value by $1,000 (for example, an $8,600 account value divided by $1,000 = 8.6), then multiply the result by the number in the “Actual” line under the heading entitled “Expenses paid during period” for your applicable class of shares to estimate the expenses you paid on your account during this period.
Hypothetical example for comparison purposes
The “Hypothetical” line of the table below provides information about hypothetical account values and hypothetical expenses based on the Fund’s actual expense ratio and an assumed rate of return of 5% per year before expenses, which is not the Fund’s actual return. The hypothetical account values and expenses may not be used to estimate the actual ending account balance or expenses you paid for the period. You may use this information to compare the ongoing costs of investing in the Fund and other funds. To do so, compare this 5% hypothetical example with the 5% hypothetical examples that appear in the shareholder reports of the other funds.
Please note that the expenses shown in the table are meant to highlight your ongoing costs only and do not reflect any transactional costs, such as sales charges (loads) and contingent deferred sales charges. Therefore, the “Hypothetical” line of the table is useful in comparing ongoing costs only and will not help you determine the relative total costs of owning different funds. In addition, if these transactional costs were included, your costs would have been higher.
| | | | | | | | | | | | | | | | |
| | | Beginning
account value
12-1-2018 | | | Ending
account value
5-31-2019 | | | Expenses
paid during
the period1,2 | | | Annualized net
expense ratio1 | |
Class A | | | | | | | | | | | | | | | | |
| | | | |
Actual | | $ | 1,000.00 | | | $ | 1,031.79 | | | $ | 5.59 | | | | 1.10 | % |
| | | | |
Hypothetical (5% return before expenses) | | $ | 1,000.00 | | | $ | 1,019.43 | | | $ | 5.56 | | | | 1.10 | % |
Class C | | | | | | | | | | | | | | | | |
| | | | |
Actual | | $ | 1,000.00 | | | $ | 1,027.82 | | | $ | 9.37 | | | | 1.85 | % |
| | | | |
Hypothetical (5% return before expenses) | | $ | 1,000.00 | | | $ | 1,015.69 | | | $ | 9.32 | | | | 1.85 | % |
Administrator Class | | | | | | | | | | | | | | | | |
| | | | |
Actual | | $ | 1,000.00 | | | $ | 1,033.12 | | | $ | 4.33 | | | | 0.85 | % |
| | | | |
Hypothetical (5% return before expenses) | | $ | 1,000.00 | | | $ | 1,020.67 | | | $ | 4.30 | | | | 0.85 | % |
Institutional Class | | | | | | | | | | | | | | | | |
| | | | |
Actual | | $ | 1,000.00 | | | $ | 1,033.69 | | | $ | 3.82 | | | | 0.75 | % |
| | | | |
Hypothetical (5% return before expenses) | | $ | 1,000.00 | | | $ | 1,021.17 | | | $ | 3.80 | | | | 0.75 | % |
| 1 | Amounts reflect net expenses allocated from the affiliated Master Portfolios in which the Fund invests. |
| 2 | Expenses paid is equal to the annualized net expense ratio of each class multiplied by the average account value over the period, multiplied by the number of days in the most recent fiscal half-year divided by the number of days in the fiscal year (to reflect the one-half-year period). |
| | | | | | |
| Portfolio of investments—May 31, 2019 | | Wells Fargo Moderate Balanced Fund | | | 11 | |
| | | | | | | | | | | | | | | | |
| Security name | | | | | | | | Shares | | | Value | |
| | | | |
Exchange-Traded Funds: 0.78% | | | | | | | | | | | | | | | | |
| | | | |
Consumer Staples Select Sector SPDR Fund | | | | | | | | | | | 17,718 | | | $ | 985,298 | |
| | | | | | | | | | | | | | | | |
| | | | |
Total Exchange-Traded Funds (Cost $899,457) | | | | | | | | | | | | | | | 985,298 | |
| | | | | | | | | | | | | | | | |
| | | | |
Investment Companies: 98.76% | | | | | | | | | | | | | | | | |
| | | | |
| Affiliated Master Portfolios: 82.02% | | | | | | | | | | | | | | | | |
| | | | |
Wells Fargo C&B Large Cap Value Portfolio | | | | | | | | | | | | | | | 4,032,490 | |
| | | | |
Wells Fargo Core Bond Portfolio | | | | | | | | | | | | | | | 11,494,859 | |
| | | | |
Wells Fargo Disciplined Large Cap Portfolio | | | | | | | | | | | | | | | 11,818,312 | |
| | | | |
Wells Fargo Diversified Large Cap Growth Portfolio | | | | | | | | | | | | | | | 8,395,498 | |
| | | | |
Wells Fargo Emerging Growth Portfolio | | | | | | | | | | | | | | | 1,221,632 | |
| | | | |
Wells Fargo Factor Enhanced Emerging Markets Portfolio | | | | | | | | | | | | | | | 1,044,370 | |
| | | | |
Wells Fargo International Growth Portfolio | | | | | | | | | | | | | | | 3,752,691 | |
| | | | |
Wells Fargo International Value Portfolio | | | | | | | | | | | | | | | 3,690,039 | |
| | | | |
Wells Fargo Large Company Value Portfolio | | | | | | | | | | | | | | | 8,121,273 | |
| | | | |
Wells Fargo Managed Fixed Income Portfolio | | | | | | | | | | | | | | | 40,231,988 | |
| | | | |
Wells Fargo Real Return Portfolio | | | | | | | | | | | | | | | 5,731,509 | |
| | | | |
Wells Fargo Small Company Growth Portfolio | | | | | | | | | | | | | | | 1,202,070 | |
| | | | |
Wells Fargo Small Company Value Portfolio | | | | | | | | | | | | | | | 2,380,550 | |
| | | | |
| | | | | | | | | | | | | | | 103,117,281 | |
| | | | | | | | | | | | | | | | |
| | | | |
| Affiliated Stock Funds: 16.74% | | | | | | | | | | | | | | | | |
| | | | |
Wells Fargo Conservative Income Fund Institutional Class | | | | | | | | | | | 1,900,364 | | | | 18,984,634 | |
| | | | |
Wells Fargo Emerging Markets Equity Fund Class R6 | | | | | | | | | | | 43,068 | | | | 1,019,000 | |
| | | | |
Wells Fargo Emerging Markets Equity Income Fund Class R6 | | | | | | | | | | | 97,693 | | | | 1,041,406 | |
| | | | |
| | | | | | | | | | | | | | | 21,045,040 | |
| | | | | | | | | | | | | | | | |
| | | | |
Total Investment Companies (Cost $115,404,819) | | | | | | | | | | | | | | | 124,162,321 | |
| | | | | | | | | | | | | | | | |
| | | | |
| | | Yield | | | Maturity date | | | Principal | | | | |
| Short-Term Investments: 0.30% | | | | | | | | | | | | | | | | |
| | | | |
| U.S. Treasury Securities: 0.30% | | | | | | | | | | | | | | | | |
| | | | |
U.S. Treasury Bill #(z) | | | 2.07 | % | | | 6-25-2019 | | | $ | 379,000 | | | | 378,471 | |
| | | | | | | | | | | | | | | | |
| | | | |
Total Short-Term Investments (Cost $378,457) | | | | | | | | | | | | | | | 378,471 | |
| | | | | | | | | | | | | | | | |
| | | | | | | | |
| Total investments in securities (Cost $116,682,733) | | | 99.84 | % | | | 125,526,090 | |
| | |
Other assets and liabilities, net | | | 0.16 | | | | 195,349 | |
| | | | | | | | |
| Total net assets | | | 100.00 | % | | $ | 125,721,439 | |
| | | | | | | | |
| # | All or a portion of this security is segregated as collateral for investments in derivative instruments. |
| (z) | Zero coupon security. The rate represents the current yield to maturity. |
Futures Contracts
| | | | | | | | | | | | | | | | | | | | | | | | |
| Description | | Number of
contracts | | | Expiration
date | | | Notional
cost | | | Notional
value | | | Unrealized
gains | | | Unrealized
losses | |
| | | | | | |
Long | | | | | | | | | | | | | | | | | | | | | | | | |
| | | | | | |
Japanese Yen Futures | | | 56 | | | | 6-17-2019 | | | $ | 6,369,280 | | | $ | 6,465,550 | | | $ | 96,270 | | | $ | 0 | |
| | | | | | |
Short | | | | | | | | | | | | | | | | | | | | | | | | |
| | | | | | |
S&P 500 E-Mini Index | | | (41) | | | | 6-21-2019 | | | | (5,765,455 | ) | | | (5,642,830 | ) | | | 122,625 | | | | 0 | |
| | | | | | | | | | | | | | | | | | | | | | | | |
| | | | | | |
| | | | | | | | | | | | | | | | | | $ | 218,895 | | | $ | 0 | |
| | | | | | | | | | | | | | | | | | | | | | | | |
The accompanying notes are an integral part of these financial statements.
| | | | |
| 12 | | Wells Fargo Moderate Balanced Fund | | Portfolio of investments—May 31, 2019 |
Investments in Affiliates
An affiliated investment is an investment in which the Fund owns at least 5% of the outstanding voting shares of the issuer or as a result of other relationships, such as the Fund and the issuer having the same investment manager and adviser. Transactions with issuers that were either affiliated persons of the Fund at the beginning of the period or the end of the period were as follows:
| | | | | | | | | | | | | | | | | | | | | | | | | | | | | | | | | | | | |
| | | Shares,
beginning of
period | | | Shares
purchased | | | Shares
sold | | | Shares,
end of
period | | | Net
realized
gains
(losses) on
affiliated
Underlying
Funds | | | Net
change in
unrealized
gains
(losses) on
affiliated
Underlying
Funds | | | Dividends
from
affiliated
Underlying
Funds | | | Value,
end
of period | | | % of net assets | |
Investment Companies | | | | | | | | | | | | | | | | | | | | | | | | | | | | | | | | | | | | |
Affiliated Stock Funds | | | | | | | | | | | | | | | | | | | | | | | | | | | | | | | | | | | | |
Wells Fargo Conservative Income Fund Institutional Class | | | 0 | | | | 2,548,674 | | | | 648,310 | | | | 1,900,364 | | | $ | (11,988 | ) | | $ | 3,231 | | | $ | 377,440 | | | $ | 18,984,634 | | | | | |
Wells Fargo Disciplined U.S. Core Fund Class R6* | | | 884,580 | | | | 0 | | | | 884,580 | | | | 0 | | | | 59,788 | | | | 400,035 | | | | 0 | | | | 0 | | | | | |
Wells Fargo Emerging Markets Equity Fund Class R6 | | | 0 | | | | 48,919 | | | | 5,851 | | | | 43,068 | | | | 11,170 | | | | 71,948 | | | | 0 | | | | 1,019,000 | | | | | |
Wells Fargo Emerging Markets Equity Income Fund Class R6 | | | 0 | | | | 107,473 | | | | 9,780 | | | | 97,693 | | | | 5,421 | | | | 34,647 | | | | 5,557 | | | | 1,041,406 | | | | | |
| | | | | | | | | | | | | | | | | | | | | | | | | | | | | | | | | | | | |
| | | | | | | | | |
| | | | | | | | | | | | | | | | | | $ | 64,391 | | | $ | 509,861 | | | $ | 382,997 | | | $ | 21,045,040 | | | | 16.74 | % |
| | | | | | | | | | | | | | | | | | | | | | | | | | | | | | | | | | | | |
| | * | No longer held at the end of the period. |
Transactions with the affiliated Master Portfolios were as follows:
| | | | | | | | | | | | | | | | | | | | | | | | | | | | | | | | | | | | |
| | | % of
ownership,
beginning of
period | | | % of
ownership,
end of
period | | | Net realized
gains
(losses) on
securities
transactions
allocated
from
affiliated
Master
Portfolios | | | Net change in
unrealized
gains
(losses) on
securities
transactions
allocated
from
affiliated
Master
Portfolios | | | Interest
allocated
from
affiliated
Master
Portfolios | | | Dividends
allocated
from
affiliated
Master
Portfolios | | | Affiliated
income
allocated
from
affiliated
Master
Portfolios | | | Value,
end of period | | | % of
net
assets | |
Wells Fargo C&B Large Cap Value Portfolio | | | 1.21 | % | | | 1.15 | % | | $ | 482,138 | | | $ | (400,246 | ) | | $ | 0 | | | $ | 84,889 | | | $ | 2,218 | | | $ | 4,032,490 | | | | | |
Wells Fargo Core Bond Portfolio | | | 0.24 | | | | 0.20 | | | | (114,768 | ) | | | 428,669 | | | | 411,276 | | | | 0 | | | | 4,771 | | | | 11,494,859 | | | | | |
Wells Fargo Disciplined Large Cap Portfolio | | | 0.00 | | | | 3.78 | | | | (445,015 | ) | | | (52,056 | ) | | | 0 | | | | 284,186 | | | | 2,309 | | | | 11,818,312 | | | | | |
Wells Fargo Diversified Large Cap Growth Portfolio | | | 16.77 | | | | 3.35 | | | | 778,723 | | | | (823,916 | ) | | | 0 | | | | 148,126 | | | | 3,596 | | | | 8,395,498 | | | | | |
Wells Fargo Emerging Growth Portfolio | | | 0.17 | | | | 0.15 | | | | 241,474 | | | | (202,643 | ) | | | 0 | | | | 1,596 | | | | 1,739 | | | | 1,221,632 | | | | | |
Wells Fargo Factor Enhanced Emerging Markets Portfolio | | | 0.00 | | | | 0.41 | | | | 19,639 | | | | (5,692 | ) | | | 79 | | | | 10,914 | | | | 366 | | | | 1,044,370 | | | | | |
Wells Fargo International Growth Portfolio | | | 13.50 | | | | 1.79 | | | | (175,160 | ) | | | (23,746 | ) | | | 0 | | | | 96,958 | | | | 6,536 | | | | 3,752,691 | | | | | |
Wells Fargo International Value Portfolio | | | 0.66 | | | | 0.35 | | | | (24,702 | ) | | | (773,682 | ) | | | 0 | | | | 188,091 | | | | 7,090 | | | | 3,690,039 | | | | | |
Wells Fargo Large Company Value Portfolio | | | 15.34 | | | | 3.26 | | | | (28,660 | ) | | | (147,354 | ) | | | 588 | | | | 230,118 | | | | 3,093 | | | | 8,121,273 | | | | | |
Wells Fargo Managed Fixed Income Portfolio | | | 45.54 | | | | 6.90 | | | | (2,806 | ) | | | 1,303,881 | | | | 1,546,371 | | | | 0 | | | | 73,573 | | | | 40,231,988 | | | | | |
Wells Fargo Real Return Portfolio | | | 4.78 | | | | 3.14 | | | | (47,111 | ) | | | 41,641 | | | | 146,984 | | | | 26,316 | | | | 1,460 | | | | 5,731,509 | | | | | |
Wells Fargo Small Company Growth Portfolio | | | 0.07 | | | | 0.07 | | | | 278,562 | | | | (327,178 | ) | | | 0 | | | | 7,893 | | | | 1,424 | | | | 1,202,070 | | | | | |
Wells Fargo Small Company Value Portfolio | | | 1.80 | | | | 1.87 | | | | (120,043 | ) | | | (284,356 | ) | | | 0 | | | | 40,165 | | | | 1,992 | | | | 2,380,550 | | | | | |
Wells Fargo Stable Income Portfolio* | | | 100.00 | | | | 0.00 | | | | 173,323 | | | | (207,605 | ) | | | 164,693 | | | | 0 | | | | 3,616 | | | | 0 | | | | | |
| | | | | | | | | | | | | | | | | | | | | | | | | | | | | | | | | | | | |
| | | | | | | | | |
| | | | | | | | | | $ | 1,015,594 | | | $ | (1,474,283 | ) | | $ | 2,269,991 | | | $ | 1,119,252 | | | $ | 113,783 | | | $ | 103,117,281 | | | | 82.02 | % |
| | | | | | | | | | | | | | | | | | | | | | | | | | | | | | | | | | | | |
| | * | No longer held at the end of the period |
The accompanying notes are an integral part of these financial statements.
| | | | | | |
| Statement of assets and liabilities—May 31, 2019 | | Wells Fargo Moderate Balanced Fund | | | 13 | |
| | | | |
| | | | |
| |
Assets | | | | |
Investments in affiliated Master Portfolios, at value (cost 94,469,605) | | $ | 103,117,281 | |
Investments in affiliated Underlying Funds, at value (cost $20,935,214) | | | 21,045,040 | |
Investments in unaffiliated securities, at value (cost $1,277,914) | | | 1,363,769 | |
Cash | | | 18,446 | |
Receivable for investments sold | | | 6,554 | |
Receivable for Fund shares sold | | | 158,430 | |
Receivable for dividends | | | 44,776 | |
Receivable for daily variation margin on open futures contracts | | | 145,740 | |
Receivable from manager | | | 2,091 | |
Prepaid expenses and other assets | | | 31,284 | |
| | | | |
Total assets | | | 125,933,411 | |
| | | | |
| |
Liabilities | | | | |
Payable for Fund shares redeemed | | | 120,846 | |
Shareholder report expenses payable | | | 32,966 | |
Shareholder servicing fees payable | | | 26,744 | |
Administration fees payable | | | 17,784 | |
Distribution fee payable | | | 5,894 | |
Accrued expenses and other liabilities | | | 7,738 | |
| | | | |
Total liabilities | | | 211,972 | |
| | | | |
Total net assets | | $ | 125,721,439 | |
| | | | |
| |
NET ASSETS CONSIST OF | | | | |
Paid-in capital | | $ | 114,869,173 | |
Total distributable earnings | | | 10,852,266 | |
| | | | |
Total net assets | | $ | 125,721,439 | |
| | | | |
| |
COMPUTATION OF NET ASSET VALUE AND OFFERING PRICE PER SHARE | | | | |
Net assets – Class A | | $ | 30,132,202 | |
Shares outstanding – Class A1 | | | 1,480,902 | |
Net asset value per share – Class A | | | $20.35 | |
Maximum offering price per share – Class A2 | | | $21.59 | |
Net assets – Class C | | $ | 8,509,303 | |
Shares outstanding – Class C1 | | | 429,673 | |
Net asset value per share – Class C | | | $19.80 | |
Net assets – Administrator Class | | $ | 78,209,082 | |
Shares outstanding – Administrator Class1 | | | 3,803,335 | |
Net asset value per share – Administrator Class | | | $20.56 | |
Net assets – Institutional Class | | $ | 8,870,852 | |
Shares outstanding – Institutional Class1 | | | 430,613 | |
Net asset value per share – Institutional Class | | | $20.60 | |
| 1 | The Fund has an unlimited number of authorized shares. |
| 2 | Maximum offering price is computed as 100/94.25 of net asset value. On investments of $50,000 or more, the offering price is reduced. |
The accompanying notes are an integral part of these financial statements.
| | | | |
| 14 | | Wells Fargo Moderate Balanced Fund | | Statement of operations—year ended May 31, 2019 |
| | | | |
| | | | |
| |
Investment income | | | | |
Interest allocated from affiliated Master Portfolios (net of foreign withholding taxes of $175) | | $ | 2,269,991 | |
Dividends allocated from affiliated Master Portfolios (net of foreign withholding taxes of $45,704) | | | 1,119,252 | |
Dividends from affiliated Underlying Funds | | | 382,997 | |
Affiliated income allocated from affiliated Master Portfolios | | | 113,783 | |
Dividends | | | 7,637 | |
Interest | | | 7,078 | |
Expenses allocated from affiliated Master Portfolios | | | (620,653 | ) |
Waivers allocated from affiliated Master Portfolios | | | 49,348 | |
| | | | |
Total investment income | | | 3,329,433 | |
| | | | |
| |
Expenses | | | | |
Management fee | | | 424,590 | |
Administration fees | | | | |
Class A | | | 66,551 | |
Class C | | | 20,818 | |
Administrator Class | | | 124,411 | |
Institutional Class | | | 5,492 | 1 |
Shareholder servicing fees | | | | |
Class A | | | 79,228 | |
Class C | | | 24,784 | |
Administrator Class | | | 238,352 | |
Distribution fee | | | | |
Class C | | | 74,351 | |
Custody and accounting fees | | | 8,658 | |
Professional fees | | | 31,448 | |
Registration fees | | | 67,810 | |
Shareholder report expenses | | | 61,050 | |
Trustees’ fees and expenses | | | 22,321 | |
Other fees and expenses | | | 14,176 | |
| | | | |
Total expenses | | | 1,264,040 | |
Less: Fee waivers and/or expense reimbursements | | | (432,478 | ) |
| | | | |
Net expenses | | | 831,562 | |
| | | | |
Net investment income | | | 2,497,871 | |
| | | | |
| |
REALIZED AND UNREALIZED GAINS (LOSSES) ON INVESTMENTS | | | | |
| |
Net realized gains on: | | | | |
Securities transactions allocated from affiliated Master Portfolios | | | 1,015,594 | |
Affiliated Underlying Funds | | | 64,391 | |
Unaffiliated securities | | | 1,832 | |
Futures contracts | | | 176,527 | |
| | | | |
Net realized gains on investments | | | 1,258,344 | |
| | | | |
| |
Net change in unrealized gains (losses) on: | | | | |
Securities transactions allocated from affiliated Master Portfolios | | | (1,474,283 | ) |
Affiliated Underlying Funds | | | 509,861 | |
Unaffiliated securities | | | 85,852 | |
Futures contracts | | | 483,916 | |
| | | | |
Net change in unrealized gains (losses) on investments | | | (394,654 | ) |
| | | | |
Net realized and unrealized gains (losses) on investments | | | 863,690 | |
| | | | |
Net increase in net assets resulting from operations | | $ | 3,361,561 | |
| | | | |
| 1 | For the period from July 31, 2018 (commencement of class operations) to May 31, 2019 |
The accompanying notes are an integral part of these financial statements.
| | | | | | |
| Statement of changes in net assets | | Wells Fargo Moderate Balanced Fund | | | 15 | |
| | | | | | | | | | | | | | | | |
| | | Year ended
May 31, 2019 | | | Year ended
May 31, 20181 | |
| | | | |
Operations | | | | | | | | | | | | | | | | |
Net investment income | | | | | | $ | 2,497,871 | | | | | | | $ | 2,427,369 | |
Net realized gains on investments | | | | | | | 1,258,344 | | | | | | | | 9,722,121 | |
Net change in unrealized gains (losses) on investments | | | | | | | (394,654 | ) | | | | | | | (3,671,454 | ) |
| | | | |
Net increase in net assets resulting from operations | | | | | | | 3,361,561 | | | | | | | | 8,478,036 | |
| | | | |
| | | | |
Distributions to shareholders from net investment income and net realized gains | | | | | | | | | | | | | | | | |
Class A | | | | | | | (3,737,616 | ) | | | | | | | (2,929,431 | ) |
Class C | | | | | | | (1,254,911 | ) | | | | | | | (881,207 | ) |
Administrator Class | | | | | | | (10,246,697 | ) | | | | | | | (9,288,417 | ) |
Institutional Class | | | | | | | (1,267,462 | )2 | | | | | | | N/A | |
| | | | |
Total distributions to shareholders | | | | | | | (16,506,686 | ) | | | | | | | (13,099,055 | ) |
| | | | |
| | | | |
Capital share transactions | | | Shares | | | | | | | | Shares | | | | | |
Proceeds from shares sold | | | | | | | | | | | | | | | | |
Class A | | | 444,234 | | | | 9,499,182 | | | | 241,519 | | | | 5,649,474 | |
Class C | | | 144,391 | | | | 2,961,750 | | | | 45,422 | | | | 1,038,170 | |
Administrator Class | | | 387,699 | | | | 8,499,230 | | | | 612,499 | | | | 14,353,555 | |
Institutional Class | | | 503,047 | 2 | | | 11,157,702 | 2 | | | N/A | | | | N/A | |
| | | | |
| | | | |
| | | | | | | 32,117,864 | | | | | | | | 21,041,199 | |
| | | | |
Reinvestment of distributions | | | | | | | | | | | | | | | | |
Class A | | | 179,435 | | | | 3,535,133 | | | | 120,671 | | | | 2,760,491 | |
Class C | | | 63,450 | | | | 1,215,365 | | | | 36,950 | | | | 823,717 | |
Administrator Class | | | 512,778 | | | | 10,216,092 | | | | 399,782 | | | | 9,238,735 | |
Institutional Class | | | 63,414 | 2 | | | 1,264,356 | 2 | | | N/A | | | | N/A | |
| | | | |
| | | | |
| | | | | | | 16,230,946 | | | | | | | | 12,822,943 | |
| | | | |
Payment for shares redeemed | | | | | | | | | | | | | | | | |
Class A | | | (550,017 | ) | | | (11,776,841 | ) | | | (517,571 | ) | | | (12,019,030 | ) |
Class C | | | (240,319 | ) | | | (4,860,142 | ) | | | (150,464 | ) | | | (3,420,001 | ) |
Administrator Class | | | (1,991,930 | ) | | | (44,740,421 | ) | | | (882,642 | ) | | | (20,956,867 | ) |
Institutional Class | | | (135,848 | )2 | | | (2,646,480 | )2 | | | N/A | | | | N/A | |
| | | | |
| | | | |
| | | | | | | (64,023,884 | ) | | | | | | | (36,395,898 | ) |
| | | | |
Net decrease in net assets resulting from capital share transactions | | | | | | | (15,675,074 | ) | | | | | | | (2,531,756 | ) |
| | | | |
Total decrease in net assets | | | | | | | (28,820,199 | ) | | | | | | | (7,152,775 | ) |
| | | | |
| |
Net assets | | | | |
Beginning of period | | | | | | | 154,541,638 | | | | | | | | 161,694,413 | |
| | | | |
End of period | | | | | | $ | 125,721,439 | | | | | | | $ | 154,541,638 | |
| | | | |
| 1 | Effective for all fillings after November 4, 2018, the SEC prospectively eliminated the requirement to parenthetically disclose undistributed net investment income at the end of the period and permitted the aggregation of distributions, with the exception of tax basis returns of capital. Undistributed net investment income at May 31, 2018 was $1,221,521. The disaggregated distributions information for the year ended May 31, 2018 is included in Note 8,Distributions to Shareholders, in the notes to the financial statements. |
| 2 | For the period from July 31, 2018 (commencement of class operations) to May 31, 2019 |
The accompanying notes are an integral part of these financial statements.
| | | | |
| 16 | | Wells Fargo Moderate Balanced Fund | | Financial highlights |
(For a share outstanding throughout each period)
| | | | | | | | | | | | | | | | | | | | |
| | | Year ended May 31 | |
| CLASS A | | 2019 | | | 2018 | | | 2017 | | | 2016 | | | 2015 | |
Net asset value, beginning of period | | | $22.73 | | | | $23.47 | | | | $22.51 | | | | $23.57 | | | | $23.19 | |
Net investment income | | | 0.36 | 1 | | | 0.29 | | | | 0.28 | | | | 0.28 | 1 | | | 0.32 | |
Net realized and unrealized gains (losses) on investments | | | 0.11 | | | | 0.97 | | | | 1.34 | | | | (0.23 | ) | | | 1.01 | |
| | | | | | | | | | | | | | | | | | | | |
Total from investment operations | | | 0.47 | | | | 1.26 | | | | 1.62 | | | | 0.05 | | | | 1.33 | |
Distributions to shareholders from | | | | | | | | | | | | | | | | | | | | |
Net investment income | | | (0.42 | ) | | | (0.32 | ) | | | (0.29 | ) | | | (0.26 | ) | | | (0.44 | ) |
Net realized gains | | | (2.43 | ) | | | (1.68 | ) | | | (0.37 | ) | | | (0.85 | ) | | | (0.51 | ) |
| | | | | | | | | | | | | | | | | | | | |
Total distributions to shareholders | | | (2.85 | ) | | | (2.00 | ) | | | (0.66 | ) | | | (1.11 | ) | | | (0.95 | ) |
Net asset value, end of period | | | $20.35 | | | | $22.73 | | | | $23.47 | | | | $22.51 | | | | $23.57 | |
Total return2 | | | 2.68 | % | | | 5.38 | % | | | 7.33 | % | | | 0.34 | % | | | 5.87 | % |
Ratios to average net assets (annualized) | | | | | | | | | | | | | | | | | | | | |
Gross expenses3 | | | 1.31 | % | | | 1.33 | % | | | 1.32 | % | | | 1.32 | % | | | 1.36 | % |
Net expenses3 | | | 1.12 | % | | | 1.13 | % | | | 1.15 | % | | | 1.15 | % | | | 1.15 | % |
Net investment income3 | | | 1.65 | % | | | 1.42 | % | | | 1.25 | % | | | 1.26 | % | | | 1.14 | % |
Supplemental data | | | | | | | | | | | | | | | | | | | | |
Portfolio turnover rate4 | | | 191 | % | | | 113 | % | | | 114 | % | | | 87 | % | | | 84 | % |
Net assets, end of period (000s omitted) | | | $30,132 | | | | $31,980 | | | | $36,679 | | | | $35,993 | | | | $20,782 | |
| 1 | Calculated based upon average shares outstanding |
| 2 | Total return calculations do not include any sales charges. |
| 3 | Ratios include only the net expenses allocated from the affiliated Master Portfolios and do not include expenses from any other Underlying Funds. Net expenses allocated from the affiliated Master Portfolios included in the ratios were as follows: |
| | | | |
Year ended May 31, 2019 | | | 0.40 | % |
Year ended May 31, 2018 | | | 0.44 | % |
Year ended May 31, 2017 | | | 0.46 | % |
Year ended May 31, 2016 | | | 0.47 | % |
Year ended May 31, 2015 | | | 0.47 | % |
| 4 | Portfolio turnover rate is calculated by multiplying the Fund’s ownership percentage in the respective affiliated Master Portfolio by the corresponding affiliated Master Portfolio’s purchases and sales. These purchases and sales amounts are aggregated with the direct purchases and sales in the affiliated Underlying Funds and unaffiliated securities and included in the portfolio turnover calculation. |
The accompanying notes are an integral part of these financial statements.
| | | | | | |
| Financial highlights | | Wells Fargo Moderate Balanced Fund | | | 17 | |
(For a share outstanding throughout each period)
| | | | | | | | | | | | | | | | | | | | |
| | | Year ended May 31 | |
| CLASS C | | 2019 | | | 2018 | | | 2017 | | | 2016 | | | 2015 | |
Net asset value, beginning of period | | | $22.20 | | | | $22.97 | | | | $22.05 | | | | $23.18 | | | | $22.79 | |
Net investment income | | | 0.12 | | | | 0.10 | | | | 0.11 | 1 | | | 0.11 | 1 | | | 0.09 | 1 |
Net realized and unrealized gains (losses) on investments | | | 0.18 | | | | 0.95 | | | | 1.32 | | | | (0.23 | ) | | | 1.04 | |
| | | | | | | | | | | | | | | | | | | | |
Total from investment operations | | | 0.30 | | | | 1.05 | | | | 1.43 | | | | (0.12 | ) | | | 1.13 | |
Distributions to shareholders from | | | | | | | | | | | | | | | | | | | | |
Net investment income | | | (0.27 | ) | | | (0.14 | ) | | | (0.14 | ) | | | (0.16 | ) | | | (0.23 | ) |
Net realized gains | | | (2.43 | ) | | | (1.68 | ) | | | (0.37 | ) | | | (0.85 | ) | | | (0.51 | ) |
| | | | | | | | | | | | | | | | | | | | |
Total distributions to shareholders | | | (2.70 | ) | | | (1.82 | ) | | | (0.51 | ) | | | (1.01 | ) | | | (0.74 | ) |
Net asset value, end of period | | | $19.80 | | | | $22.20 | | | | $22.97 | | | | $22.05 | | | | $23.18 | |
Total return2 | | | 1.90 | % | | | 4.56 | % | | | 6.56 | % | | | (0.44 | )% | | | 5.06 | % |
Ratios to average net assets (annualized) | | | | | | | | | | | | | | | | | | | | |
Gross expenses3 | | | 2.06 | % | | | 2.08 | % | | | 2.07 | % | | | 2.07 | % | | | 2.11 | % |
Net expenses3 | | | 1.87 | % | | | 1.88 | % | | | 1.90 | % | | | 1.90 | % | | | 1.90 | % |
Net investment income3 | | | 0.89 | % | | | 0.66 | % | | | 0.50 | % | | | 0.51 | % | | | 0.40 | % |
Supplemental data | | | | | | | | | | | | | | | | | | | | |
Portfolio turnover rate4 | | | 191 | % | | | 113 | % | | | 114 | % | | | 87 | % | | | 84 | % |
Net assets, end of period (000s omitted) | | | $8,509 | | | | $10,260 | | | | $12,180 | | | | $12,501 | | | | $6,042 | |
| 1 | Calculated based upon average shares outstanding |
| 2 | Total return calculations do not include any sales charges. |
| 3 | Ratios include only the net expenses allocated from the affiliated Master Portfolios and do not include expenses from any other Underlying Funds. Net expenses allocated from the affiliated Master Portfolios included in the ratios were as follows: |
| | | | |
Year ended May 31, 2019 | | | 0.40 | % |
Year ended May 31, 2018 | | | 0.44 | % |
Year ended May 31, 2017 | | | 0.46 | % |
Year ended May 31, 2016 | | | 0.47 | % |
Year ended May 31, 2015 | | | 0.47 | % |
| 4 | Portfolio turnover rate is calculated by multiplying the Fund’s ownership percentage in the respective affiliated Master Portfolio by the corresponding affiliated Master Portfolio’s purchases and sales. These purchases and sales amounts are aggregated with the direct purchases and sales in the affiliated Underlying Funds and unaffiliated securities and included in the portfolio turnover calculation. |
The accompanying notes are an integral part of these financial statements.
| | | | |
| 18 | | Wells Fargo Moderate Balanced Fund | | Financial highlights |
(For a share outstanding throughout each period)
| | | | | | | | | | | | | | | | | | | | |
| | | Year ended May 31 | |
| ADMINISTRATOR CLASS | | 2019 | | | 2018 | | | 2017 | | | 2016 | | | 2015 | |
Net asset value, beginning of period | | | $22.94 | | | | $23.68 | | | | $22.70 | | | | $23.75 | | | | $23.38 | |
Net investment income | | | 0.41 | 1 | | | 0.38 | | | | 0.35 | 1 | | | 0.32 | | | | 0.33 | 1 |
Net realized and unrealized gains (losses) on investments | | | 0.12 | | | | 0.94 | | | | 1.35 | | | | (0.21 | ) | | | 1.07 | |
| | | | | | | | | | | | | | | | | | | | |
Total from investment operations | | | 0.53 | | | | 1.32 | | | | 1.70 | | | | 0.11 | | | | 1.40 | |
Distributions to shareholders from | | | | | | | | | | | | | | | | | | | | |
Net investment income | | | (0.48 | ) | | | (0.38 | ) | | | (0.35 | ) | | | (0.31 | ) | | | (0.52 | ) |
Net realized gains | | | (2.43 | ) | | | (1.68 | ) | | | (0.37 | ) | | | (0.85 | ) | | | (0.51 | ) |
| | | | | | | | | | | | | | | | | | | | |
Total distributions to shareholders | | | (2.91 | ) | | | (2.06 | ) | | | (0.72 | ) | | | (1.16 | ) | | | (1.03 | ) |
Net asset value, end of period | | | $20.56 | | | | $22.94 | | | | $23.68 | | | | $22.70 | | | | $23.75 | |
Total return | | | 2.95 | % | | | 5.59 | % | | | 7.62 | % | | | 0.59 | % | | | 6.13 | % |
Ratios to average net assets (annualized) | | | | | | | | | | | | | | | | | | | | |
Gross expenses2 | | | 1.23 | % | | | 1.25 | % | | | 1.24 | % | | | 1.23 | % | | | 1.20 | % |
Net expenses2 | | | 0.87 | % | | | 0.88 | % | | | 0.90 | % | | | 0.90 | % | | | 0.90 | % |
Net investment income2 | | | 1.88 | % | | | 1.67 | % | | | 1.49 | % | | | 1.48 | % | | | 1.39 | % |
Supplemental data | | | | | | | | | | | | | | | | | | | | |
Portfolio turnover rate3 | | | 191 | % | | | 113 | % | | | 114 | % | | | 87 | % | | | 84 | % |
Net assets, end of period (000s omitted) | | | $78,209 | | | | $112,302 | | | | $112,835 | | | | $156,915 | | | | $153,457 | |
| 1 | Calculated based upon average shares outstanding |
| 2 | Ratios include only the net expenses allocated from the affiliated Master Portfolios and do not include expenses from any other Underlying Funds. Net expenses allocated from the affiliated Master Portfolios included in the ratios were as follows: |
| | | | |
Year ended May 31, 2019 | | | 0.41 | % |
Year ended May 31, 2018 | | | 0.44 | % |
Year ended May 31, 2017 | | | 0.46 | % |
Year ended May 31, 2016 | | | 0.47 | % |
Year ended May 31, 2015 | | | 0.47 | % |
| 3 | Portfolio turnover rate is calculated by multiplying the Fund’s ownership percentage in the respective affiliated Master Portfolio by the corresponding affiliated Master Portfolio’s purchases and sales. These purchases and sales amounts are aggregated with the direct purchases and sales in the affiliated Underlying Funds and unaffiliated securities and included in the portfolio turnover calculation. |
The accompanying notes are an integral part of these financial statements.
| | | | | | |
| Financial highlights | | Wells Fargo Moderate Balanced Fund | | | 19 | |
(For a share outstanding throughout the period)
| | | | |
| INSTITUTIONAL CLASS | | Year ended May 31, 20191 | |
Net asset value, beginning of period | | | $23.24 | |
Net investment income | | | 0.37 | 1 |
Net realized and unrealized gains (losses) on investments | | | (0.12 | ) |
| | | | |
Total from investment operations | | | 0.25 | |
Distributions to shareholders from | | | | |
Net investment income | | | (0.46 | ) |
Net realized gains | | | (2.43 | ) |
| | | | |
Total distributions to shareholders | | | (2.89 | ) |
Net asset value, end of period | | | $20.60 | |
Total return3 | | | 1.72 | % |
Ratios to average net assets (annualized) | | | | |
Gross expenses4 | | | 0.98 | % |
Net expenses4 | | | 0.75 | % |
Net investment income4 | | | 2.15 | % |
Supplemental data | | | | |
Portfolio turnover rate5 | | | 191 | % |
Net assets, end of period (000s omitted) | | | $8,871 | |
| 1 | For the period from July 31, 2018 (commencement of class operations) to May 31, 2019 |
| 2 | Calculated based upon average shares outstanding |
| 3 | Returns for periods of less than one year are not annualized. |
| 4 | Ratios include only the net expenses allocated from the affiliated Master Portfolios and do not include expenses from any other Underlying Funds. Net expenses allocated from the affiliated Master Portfolios included in the ratios was 0.38%. |
| 5 | Portfolio turnover rate is calculated by multiplying the Fund’s ownership percentage in the respective affiliated Master Portfolio by the corresponding affiliated Master Portfolio’s purchases and sales. These purchases and sales amounts are aggregated with the direct purchases and sales in the affiliated Underlying Funds and unaffiliated securities and included in the portfolio turnover calculation. |
The accompanying notes are an integral part of these financial statements.
| | | | |
| 20 | | Wells Fargo Moderate Balanced Fund | | Notes to financial statements |
1. ORGANIZATION
Wells Fargo Funds Trust (the “Trust”), a Delaware statutory trust organized on March 10, 1999, is an open-end management investment company registered under the Investment Company Act of 1940, as amended (the “1940 Act”). As an investment company, the Trust follows the accounting and reporting guidance in Financial Accounting Standards Board (“FASB”) Accounting Standards Codification Topic 946, Financial Services – Investment Companies. These financial statements report on the Wells Fargo Moderate Balanced Fund (the “Fund”) which is a diversified series of the Trust.
The Fund is a fund-of-funds that invests in various affiliated mutual funds (“Underlying Funds”) employing a multi-asset, multi-style investment approach designed to reduce the price and return volatility of the Fund and to provide more consistent returns. The Underlying Funds incur separate expenses in seeking to achieve their investment objectives. Investments in affiliated Underlying Funds may also include investments in one or more separate diversified portfolios (collectively, the “affiliated Master Portfolios”) of Wells Fargo Master Trust, a registered open-end management investment company. Each affiliated Master Portfolio directly acquires portfolio securities, and the Fund acquires an indirect interest in those securities. The Fund accounts for its investments in the affiliated Master Portfolios as partnership investments and records on a daily basis its share of each affiliated Master Portfolio’s income, expense and realized and unrealized gains and losses. The financial statements of the affiliated Master Portfolios are presented in separate financial statements and may be obtained free of charge by contacting Investor Services or by visiting the SEC website at sec.gov. The financial statements of the affiliated Master Portfolios are filed with the SEC under Wells Fargo Master Trust. The financial statements for all other Underlying Funds are also publicly available on the SEC website at sec.gov.
2. SIGNIFICANT ACCOUNTING POLICIES
The following significant accounting policies, which are consistently followed in the preparation of the financial statements of the Fund, are in conformity with U.S. generally accepted accounting principles which require management to make estimates and assumptions that affect the reported amounts of assets and liabilities, disclosure of contingent assets and liabilities at the date of the financial statements, and the reported amounts of revenues and expenses during the reporting period. Actual results could differ from those estimates.
Securities valuation
All investments are valued each business day as of the close of regular trading on the New York Stock Exchange (generally 4 p.m. Eastern Time), although the Fund may deviate from this calculation time under unusual or unexpected circumstances.
Investments in the affiliated Master Portfolios are valued daily based on the Fund’s proportionate share of each affiliated Master Portfolio’s net assets, which are also valued daily.
Investments in underlying mutual funds are valued at net asset per share as reported by the Underlying Funds as of the close of the regular trading on the New York Stock Exchange on each day the exchange is open for trading.
Debt securities are valued at the evaluated bid price provided by an independent pricing service (e.g. taking into account various factors, including yields, maturities, or credit ratings) or, if a reliable price is not available, the quoted bid price from an independent broker-dealer.
Equity securities and futures contracts that are listed on a foreign or domestic exchange or market are valued at the official closing price or, if none, the last sales price. If no sale occurs on the principal exchange or market that day, a fair value price will be determined in accordance with the Fund’s Valuation Procedures.
Investments which are not valued using any of the methods discussed above are valued at their fair value, as determined in good faith by the Board of Trustees of the Fund. The Board of Trustees has established a Valuation Committee comprised of the Trustees and has delegated to it the authority to take any actions regarding the valuation of portfolio securities that the Valuation Committee deems necessary or appropriate, including determining the fair value of portfolio securities, unless the determination has been delegated to the Wells Fargo Asset Management Pricing Committee at Wells Fargo Funds Management, LLC (“Funds Management”). The Board of Trustees retains the authority to make or ratify any valuation decisions or approve any changes to the Valuation Procedures as it deems appropriate. On a quarterly basis, the Board of Trustees receives reports on any valuation actions taken by the Valuation Committee or the Wells Fargo Asset Management Pricing Committee which may include items for ratification.
Futures contracts
The Fund is subject to interest rate risk, equity price risk and foreign currency risk in the normal course of pursuing its investment objectives. Futures contracts are agreements between the Fund and a counterparty to buy or sell a specific amount of a commodity, financial instrument or currency at specified price and on a specified date. The Fund may buy
| | | | | | |
| Notes to financial statements | | Wells Fargo Moderate Balanced Fund | | | 21 | |
and sell futures contracts in order to gain exposure to, or protect against, changes in interest rates, security values and foreign exchange rates. The primary risks associated with the use of futures contracts are the imperfect correlation between changes in market values of securities held by the Fund and the prices of futures contracts, and the possibility of an illiquid market. Futures contracts are generally entered into on a regulated futures exchange and cleared through a clearinghouse associated with the exchange. With futures contracts, there is minimal counterparty risk to the Fund since futures contracts are exchange traded and the exchange’s clearinghouse, as counterparty to all exchange traded futures, guarantees the futures contracts against default.
Upon entering into a futures contracts, the Fund is required to deposit either cash or securities (initial margin) with the broker in an amount equal to a certain percentage of the contract value. Subsequent payments (variation margin) are paid to or from the broker each day equal to the daily changes in the contract value. Such payments are recorded as unrealized gains or losses and, if any, shown as variation margin receivable (payable) in the Statement of Assets and Liabilities. Should the Fund fail to make requested variation margin payments, the broker can gain access to the initial margin to satisfy the Fund’s payment obligations. When the contracts are closed, a realized gain or loss is recorded in the Statement of Operations.
Investment transactions, income and expenses
Investments in the affiliated Master Portfolios are recorded on a trade basis. The Fund records daily its proportionate share of each affiliated Master Portfolio’s interest and dividend income, expenses and realized and unrealized gains or losses. The Fund also accrues its own expenses.
Securities transactions are recorded on a trade date basis. Realized gains or losses are recorded on the basis of identified cost.
Interest income is accrued daily and bond discounts are accreted and premiums are amortized daily. To the extent debt obligations are placed on non-accrual status, any related interest income may be reduced by writing off interest receivables when the collection of all or a portion of interest has been determined to be doubtful based on consistently applied procedures and the fair value has decreased. If the issuer subsequently resumes interest payments or when the collectability of interest is reasonably assured, the debt obligation is removed from non-accrual status.
Income dividends and capital gain distributions from investment companies are recorded on the ex-dividend date. Capital gain distributions from investment companies are treated as realized gains.
Distributions to shareholders
Distributions to shareholders from net investment income and any net realized gains are recorded on the ex-dividend date and paid at least annually. Such distributions are determined in accordance with income tax regulations and may differ from U.S. generally accepted accounting principles. Dividend sources are estimated at the time of declaration. The tax character of distributions is determined as of the Fund’s fiscal year end. Therefore, a portion of the Fund’s distributions made prior to the Fund’s fiscal year end may be categorized as a tax return of capital at year end.
Federal and other taxes
The Fund intends to continue to qualify as a regulated investment company by distributing substantially all of its investment company taxable income and any net realized capital gains (after reduction for capital loss carryforwards) sufficient to relieve it from all, or substantially all, federal income taxes. Accordingly, no provision for federal income taxes was required.
The Fund’s income and federal excise tax returns and all financial records supporting those returns for the prior three fiscal years are subject to examination by the federal and Delaware revenue authorities. Management has analyzed the Fund’s tax positions taken on federal, state, and foreign tax returns for all open tax years and does not believe that there are any uncertain tax positions that require recognition of a tax liability.
As of May 31, 2019, the aggregate cost of all investments for federal income tax purposes was $115,951,759 and the unrealized gains (losses) consisted of:
| | | | |
| |
Gross unrealized gains | | $ | 9,793,226 | |
| |
Gross unrealized losses | | | 0 | |
| |
Net unrealized gains | | $ | 9,793,226 | |
Reclassifications are made to the Fund’s capital accounts for permanent tax differences to reflect income and gains available for distribution (or available capital loss carryforwards) under federal income tax regulations. U.S. generally accepted accounting principles require that certain components of net assets be adjusted to reflect permanent
| | | | |
| 22 | | Wells Fargo Moderate Balanced Fund | | Notes to financial statements |
differences between financial and tax reporting. These reclassifications have no effect on net assets or net asset values per share. The primary permanent difference causing such reclassification is due to redemption of partnership interest. At May 31, 2019, as a result of permanent book-to-tax differences, the following reclassification adjustments were made on the Statement of Assets and Liabilities:
| | |
| Paid-in capital | | Total distributable earnings |
| |
| $(49,046) | | $49,046 |
As of May 31, 2019, the Fund had current year deferred post-October capital losses consisting of $522,478 in short-term losses which will be recognized on the first day of the following fiscal year.
Class allocations
The separate classes of shares offered by the Fund differ principally in applicable sales charges, distribution, shareholder servicing, and administration fees. Class specific expenses are charged directly to that share class. Investment income, common expenses, and realized gains (losses) on investments are allocated daily to each class of shares based on the relative proportion of net assets of each class.
3. FAIR VALUATION MEASUREMENTS
Fair value measurements of investments are determined within a framework that has established a fair value hierarchy based upon the various data inputs utilized in determining the value of the Fund’s investments. The three-level hierarchy gives the highest priority to unadjusted quoted prices in active markets for identical assets or liabilities (Level 1) and the lowest priority to unobservable inputs (Level 3). The Fund’s investments are classified within the fair value hierarchy based on the lowest level of input that is significant to the fair value measurement. The inputs are summarized into three broad levels as follows:
| ∎ | | Level 1 – quoted prices in active markets for identical securities |
| ∎ | | Level 2 – other significant observable inputs (including quoted prices for similar securities, interest rates, prepayment speeds, credit risk, etc.) |
| ∎ | | Level 3 – significant unobservable inputs (including the Fund’s own assumptions in determining the fair value of investments) |
The inputs or methodologies used for valuing investments in securities are not necessarily an indication of the risk associated with investing in those securities.
The following is a summary of the inputs used in valuing the Fund’s assets and liabilities as of May 31, 2019:
| | | | | | | | | | | | | | | | |
| | | | |
| | | Quoted prices (Level 1) | | | Other significant
observable inputs
(Level 2) | | | Significant
unobservable inputs (Level 3) | | | Total | |
| | | | |
Assets | | | | | | | | | | | | | | | | |
| | | | |
Investments in: | | | | | | | | | | | | | | | | |
| | | | |
Exchange-traded funds | | $ | 985,298 | | | $ | 0 | | | $ | 0 | | | $ | 985,298 | |
| | | | |
Investment companies | | | 21,045,040 | | | | 0 | | | | 0 | | | | 21,045,040 | |
| | | | |
Short-term investments | | | | | | | | | | | | | | | | |
| | | | |
U.S. Treasury securities | | | 378,471 | | | | 0 | | | | 0 | | | | 378,471 | |
Investments measured at net asset value* | | | | | | | | | | | | | | | 103,117,281 | |
| | | | |
| | | 22,408,809 | | | | 0 | | | | 0 | | | | 125,526,090 | |
Futures contracts | | | 218,895 | | | | 0 | | | | 0 | | | | 218,895 | |
| | | | |
Total assets | | $ | 22,627,704 | | | $ | 0 | | | $ | 0 | | | $ | 125,744,985 | |
| * | Investments that are measured at fair value using the net asset value per share (or its equivalent) as a practical expedient have not been categorized in the fair value hierarchy. The fair value amount presented in the table is intended to permit reconciliation of the fair value hierarchy to the amounts presented in the Statement of Assets and Liabilities. The Fund’s investment in the affiliated Master Portfolios are valued at $103,117,281 does not have a redemption period notice, can be redeemed daily and does not have any unfunded commitments. |
| | | | | | |
| Notes to financial statements | | Wells Fargo Moderate Balanced Fund | | | 23 | |
Futures contracts are reported at their cumulative unrealized gains (losses) at measurement date as reported in the table following the Portfolio of Investments. For futures contracts, the current day’s variation margin is reported on the Statement of Assets and Liabilities. All other assets and liabilities are reported at their market value at measurement date.
At May 31, 2019, the Fund did not have any transfers into/out of Level 3.
The investment objective of each affiliated Master Portfolio is as follows:
| | |
| |
| Affiliated Master Portfolio | | Investment objective |
Wells Fargo C&B Large Cap Value Portfolio | | Seeks maximum long-term total return (current income and capital appreciation), consistent with minimizing risk to principal |
Wells Fargo Core Bond Portfolio | | Seeks total return, consisting of income and capital appreciation |
Wells Fargo Disciplined Large Cap Portfolio | | Seeks long-term capital appreciation |
Wells Fargo Diversified Large Cap Growth Portfolio | | Seeks long-term capital appreciation |
Wells Fargo Emerging Growth Portfolio | | Seeks long-term capital appreciation |
Wells Fargo Factor Enhanced Emerging Markets Portfolio | | Seeks to replicate the total return of the Wells Fargo Factor Enhanced Emerging Markets Index (Net), before fees and expenses |
Wells Fargo International Growth Portfolio | | Seeks long-term capital appreciation |
Wells Fargo International Value Portfolio | | Seeks long-term capital appreciation |
Wells Fargo Large Company Value Portfolio | | Seeks long-term capital appreciation |
Wells Fargo Managed Fixed Income Portfolio | | Seeks consistent fixed-income returns |
Wells Fargo Real Return Portfolio | | Seeks returns that exceed the rate of inflation over the long-term |
Wells Fargo Small Company Growth Portfolio | | Seeks long-term capital appreciation |
Wells Fargo Small Company Value Portfolio | | Seeks long-term capital appreciation |
4. TRANSACTIONS WITH AFFILIATES
Management fee
Funds Management, an indirect wholly owned subsidiary of Wells Fargo & Company (“Wells Fargo”), is the manager of the Fund and provides advisory and fund-level administrative services under an investment management agreement. Under the investment management agreement, Funds Management is responsible for, among other services, implementing the investment objectives and strategies of the Fund, supervising the subadviser and providing fund-level administrative services in connection with the Fund’s operations. As compensation for its services under the investment management agreement, Funds Management is entitled to receive a management fee at the following annual rate based on the Fund’s average daily net assets:
| | | | |
| Average daily net assets | | Management fee | |
| |
First $500 million | | | 0.30 | % |
| |
Next $500 million | | | 0.28 | |
| |
Next $2 billion | | | 0.26 | |
| |
Next $2 billion | | | 0.24 | |
| |
Next $5 billion | | | 0.23 | |
| |
Over $10 billion | | | 0.22 | |
For the year ended May 31, 2019, the management fee was equivalent to an annual rate of 0.30% of the Fund’s average daily net assets.
Funds Management also serves as the adviser to each affiliated Master Portfolio and is entitled to receive a fee from the affiliated Master Portfolio for those services.
Funds Management has retained the services of a subadviser to provide daily portfolio management to the Fund. The fee for subadvisory services is borne by Funds Management. Wells Capital Management Incorporated, an affiliate of Funds Management and an indirect wholly owned subsidiary of Wells Fargo, is the subadviser to the Fund and is entitled to receive a fee from Funds Management at an annual rate starting at 0.10% and declining to 0.05% as the average daily net assets of the Fund increase.
| | | | |
| 24 | | Wells Fargo Moderate Balanced Fund | | Notes to financial statements |
Administration fees
Under a class-level administration agreement, Funds Management provides class-level administrative services to the Fund, which includes paying fees and expenses for services provided by the transfer agent, sub-transfer agents, omnibus account servicers and record-keepers. As compensation for its services under the class-level administration agreement, Funds Management receives an annual fee which is calculated based on the average daily net assets of each class as follows:
| | | | |
| | | Class-level
administration fee | |
| |
Class A, Class C | | | 0.21 | % |
| |
Administrator Class, Institutional Class | | | 0.13 | |
Funds Management has contractually waived and/or reimbursed management and administration fees to the extent necessary to maintain certain net operating expense ratios for the Fund. When each class of the Fund has exceeded its expense cap, Funds Management has waived fees and/or reimbursed expenses from fund level expenses on a proportionate basis and then from class specific expenses. When only certain classes exceed their expense caps, waivers and/or reimbursements are applied against class specific expenses before fund level expenses. Net expenses from the affiliated Master Portfolios are included in the expense caps. Funds Management has committed through September 30, 2019 to waive fees and/or reimburse expenses to the extent necessary to cap the Fund’s expenses at 1.15% for Class A shares, 1.90% for Class C shares, 0.90% for Administrator Class shares, and 0.80% for Institutional Class shares. Funds Management voluntarily waived additional expenses of the Fund. Prior to or after the commitment expiration date, the cap may be increased or the commitment to maintain the cap may be terminated only with the approval of the Board of Trustees.
Distribution fee
The Trust has adopted a distribution plan for Class C shares of the Fund pursuant to Rule 12b-1 under the 1940 Act. A distribution fee is charged to the Class C shares and paid to Wells Fargo Funds Distributor, LLC (“Funds Distributor”), the principal underwriter of the Fund, at an annual rate of 0.75% of the average daily net assets of Class C shares.
In addition, Funds distributor is entitled to receive the front-end sales charge from the purchase of Class A shares and a contingent deferred sales charge on the redemption of certain Class A shares. Funds Distributor is also entitled to receive the contingent deferred sales charges from redemptions of Class C shares. For the year ended May 31, 2019, Funds Distributor received $6,089 from the sale of Class A shares. No contingent deferred sales charges were incurred by Class A and Class C shares for the year ended May 31, 2019.
Shareholder servicing fees
The Trust has entered into contracts with one or more shareholder servicing agents, whereby Class A, Class C, and Administrator Class of the Fund are charged a fee at an annual rate of 0.25% of the average daily net assets of each respective class. A portion of these total shareholder servicing fees were paid to affiliates of Wells Fargo.
5. INVESTMENT PORTFOLIO TRANSACTIONS
The Fund seeks to achieve its investment objective by investing substantially all of its investable assets in multiple affiliated Master Portfolios. Purchases and sales related to these investments have been calculated by aggregating the results of multiplying the Fund’s ownership percentage in the respective affiliated Master Portfolio by the corresponding affiliated Master Portfolio’s purchases and sales. Purchases and sales of unaffiliated securities in which the Fund invests are actual purchases and sale of those securities. Purchases and sales of investments, excluding short-term securities, for the year ended May 31, 2019 were as follows:
| | | | | | |
Purchases at cost | | Sales proceeds |
U.S. government | | Non-U.S. government | | U.S. government | | Non-U.S. government |
| $175,363,713 | | $128,699,671 | | $171,757,730 | | $90,724,090 |
6. DERIVATIVE TRANSACTIONS
During the year ended May 31, 2019, the Fund entered into futures contracts to gain market exposure to certain asset classes consistent with an active allocation strategy. The Fund had an average notional amount of $6,210,110 in long futures contracts and $2,671,733 in short futures contracts during the year ended May 31, 2019.
A summary of the location of derivative instruments on the financial statements by risk is outlined in the following tables.
| | | | | | |
| Notes to financial statements | | Wells Fargo Moderate Balanced Fund | | | 25 | |
The fair value of derivative instruments as of May 31, 2019 by risk type was as follows for the Fund:
| | | | | | | | | | | | |
| | | Asset derivatives | | | Liability derivatives | |
| | | Statements of Assets and
Liabilities location | | Fair value | | | Statements of Assets and
Liabilities location | | Fair value | |
| | | | |
Equity risk | | Unrealized gains on futures contracts | | $ | 122,625 | * | | Unrealized losses on futures contracts | | $ | 0 | * |
| | | | |
Foreign currency risk | | Unrealized gains on futures contracts | | | 96,270 | * | | Unrealized losses on futures contracts | | | 0 | * |
| | | | |
| | | | | $ | 218,895 | | | | | $ | 0 | |
| * | Amount represents cumulative unrealized gains (losses) on futures contracts as reported in the table following the Portfolio of Investments. Only the current day’s variation margin as of May 31, 2019 is reported separately on the Statement of Assets and Liabilities. |
The effect of derivative instruments on the Statement of Operations for the year ended May 31, 2019 was as follows for the Fund:
| | | | | | | | |
| | | Amount of realized
gains on derivatives | | | Change in unrealized
gains (losses) on derivatives | |
|
| | |
Equity risk | | $ | 118,251 | | | $ | 96,270 | |
| | |
Interest rate risk | | | 54,453 | | | | 27,214 | |
| | |
Foreign currency risk | | | 3,823 | | | | 360,432 | |
| | |
| | | $ | 176,527 | | | $ | 483,916 | |
7. BANK BORROWINGS
The Trust (excluding the money market funds), Wells Fargo Master Trust and Wells Fargo Variable Trust are parties to a $280,000,000 revolving credit agreement whereby the Fund is permitted to use bank borrowings for temporary or emergency purposes, such as to fund shareholder redemption requests. Interest under the credit agreement is charged to the Fund based on a borrowing rate equal to the higher of the Federal Funds rate in effect on that day plus 1.25% or the overnight LIBOR rate in effect on that day plus 1.25%. In addition, an annual commitment fee equal to 0.25% of the unused balance is allocated to each participating fund.
For the year ended May 31, 2019, there were no borrowings by the Fund under the agreement.
8. DISTRIBUTIONS TO SHAREHOLDERS
The tax character of distributions paid during the years ended May 31, 2019 and May 31, 2018 were as follows:
| | | | | | | | |
| | | Year ended May 31 | |
| | |
| | | 2019 | | | 2018 | |
| | |
Ordinary income | | $ | 4,099,500 | | | $ | 3,632,554 | |
| | |
Long-term capital gain | | | 12,407,186 | | | | 9,556,501 | |
As of May 31, 2019, the components of distributable earnings on a tax basis were as follows:
| | | | | | |
Undistributed ordinary income | | Undistributed long-term gain | | Unrealized gains | | Post-October capital losses deferred |
| | | |
| $989,341 | | $592,177 | | $9,793,226 | | $(522,478) |
| | | | |
| 26 | | Wells Fargo Moderate Balanced Fund | | Notes to financial statements |
Effective for all filings after November 4, 2018, the Securities and Exchange Commission eliminated the requirement to separately state the components of distributions to shareholders U.S. generally accepted accounting principles. The amounts of distributions to shareholders for the year ended May 31, 2018 were as follows:
| | | | | | | | |
| | | Net investment
income | | | Net realized
gains | |
| | |
Class A | | $ | 489,991 | | | $ | 2,439,440 | |
| | |
Class C | | | 71,963 | | | | 809,244 | |
| | |
Administrator Class | | | 1,794,197 | | | | 7,494,220 | |
9. INDEMNIFICATION
Under the Trust’s organizational documents, the officers and Trustees have been granted certain indemnification rights against certain liabilities that may arise out of performance of their duties to the Trust. Additionally, in the normal course of business, the Trust may enter into contracts with service providers that contain a variety of indemnification clauses. The Trust’s maximum exposure under these arrangements is dependent on future claims that may be made against the Fund and, therefore, cannot be estimated.
10. NEW ACCOUNTING PRONOUNCEMENT
In August 2018, FASB issued Accounting Standards Update (“ASU”) No. 2018-13, Fair Value Measurement (Topic 820)Disclosure Framework – Changes to the Disclosure Requirements for Fair Value Measurement. ASU 2018-13 updates the disclosure requirements for fair value measurements by modifying or removing certain disclosures and adding certain new disclosures. The amendments are effective for fiscal years, and interim periods within those fiscal years, beginning after December 15, 2019. Early adoption is permitted. Management has adopted the removal and modification of disclosures early, as permitted, and will adopt the additional new disclosures at the effective date.
| | | | | | |
| Report of independent registered public accounting firm | | Wells Fargo Moderate Balanced Fund | | | 27 | |
TO THE SHAREHOLDERS OF THE FUND AND BOARD OF TRUSTEES OF WELLS FARGO FUNDS TRUST:
Opinion on the Financial Statements
We have audited the accompanying statement of assets and liabilities of Wells Fargo Moderate Balanced Fund (the Fund), one of the funds constituting Wells Fargo Funds Trust, including the portfolio of investments, as of May 31, 2019, the related statement of operations for the year then ended, the statements of changes in net assets for each of the years in the two-year period then ended, and the related notes (collectively, the financial statements) and the financial highlights for each of the years or periods in the five-year period then ended. In our opinion, the financial statements and financial highlights present fairly, in all material respects, the financial position of the Fund as of May 31, 2019, the results of its operations for the year then ended, the changes in its net assets for each of the years in the two-year period then ended, and the financial highlights for each of the years or periods in the five-year period then ended, in conformity with U.S. generally accepted accounting principles.
Basis for Opinion
These financial statements and financial highlights are the responsibility of the Fund’s management. Our responsibility is to express an opinion on these financial statements and financial highlights based on our audits. We are a public accounting firm registered with the Public Company Accounting Oversight Board (United States) (PCAOB) and are required to be independent with respect to the Fund in accordance with the U.S. federal securities laws and the applicable rules and regulations of the Securities and Exchange Commission and the PCAOB.
We conducted our audits in accordance with the standards of the PCAOB. Those standards require that we plan and perform the audit to obtain reasonable assurance about whether the financial statements and financial highlights are free of material misstatement, whether due to error or fraud. Our audits included performing procedures to assess the risks of material misstatement of the financial statements and financial highlights, whether due to error or fraud, and performing procedures that respond to those risks. Such procedures included examining, on a test basis, evidence regarding the amounts and disclosures in the financial statements and financial highlights. Such procedures also included confirmation of securities owned as of May 31, 2019, by correspondence with the custodian, brokers and transfer agents, or by other appropriate auditing procedures. Our audits also included evaluating the accounting principles used and significant estimates made by management, as well as evaluating the overall presentation of the financial statements and financial highlights. We believe that our audits provide a reasonable basis for our opinion.

We have not been able to determine the specific year that we began serving as the auditor of one or more Wells Fargo Funds investment companies; however we are aware that we have served as the auditor of one or more Wells Fargo Funds investment companies since at least 1955.
Boston, Massachusetts
July 26, 2019
| | | | |
| 28 | | Wells Fargo Moderate Balanced Fund | | Other information (unaudited) |
TAX INFORMATION
For corporate shareholders, pursuant to Section 854 of the Internal Revenue Code, 18.18% of ordinary income dividends qualify for the corporate dividends-received deduction for the fiscal year ended May 31, 2019.
Pursuant to Section 852 of the Internal Revenue Code, $12,407,186 was designated as a 20% rate gain distribution for the fiscal year ended May 31, 2019.
Pursuant to Section 854 of the Internal Revenue Code, $1,107,545 of income dividends paid during the fiscal year ended May 31, 2019 has been designated as qualified dividend income (QDI).
For the fiscal year ended May 31, 2019, $1,853,552 has been designated as interest-related dividends for nonresident alien shareholders pursuant to Section 871 of the Internal Revenue Code.
For the fiscal year ended May 31, 2019, $1,295,741 has been designated as short-term capital gain dividends for nonresident alien shareholders pursuant to Section 871 of the Internal Revenue Code.
For the fiscal year ended May 31, 2019, 6.60% of the dividends distributed was derived from interest on U.S. government securities.
PROXY VOTING INFORMATION
A description of the policies and procedures used to determine how to vote proxies relating to portfolio securities is available, upon request, by calling1-800-222-8222, visiting our website atwfam.com, or visiting the SEC website at sec.gov. Information regarding how the proxies related to portfolio securities were voted during the most recent12-month period ended June 30 is available on the website atwfam.comor by visiting the SEC website at sec.gov.
QUARTERLY PORTFOLIO HOLDINGS
The Fund files its complete schedule of portfolio holdings with the SEC for the first and third quarters of each fiscal year on Form N-Q, which is available by visiting the SEC website at sec.gov. Those forms may be reviewed and copied at the SEC’s Public Reference Room in Washington, DC. Information on the operation of the Public Reference Room may be obtained by calling 1-800-SEC-0330.
| | | | | | |
| Other information (unaudited) | | Wells Fargo Moderate Balanced Fund | | | 29 | |
BOARD OF TRUSTEES AND OFFICERS
Each of the Trustees and Officers1 listed in the table below acts in identical capacities for each fund in the Wells Fargo family of funds, which consists of 151 mutual funds comprising the Wells Fargo Funds Trust, Wells Fargo Variable Trust, Wells Fargo Master Trust and four closed-end funds (collectively the “Fund Complex”). This table should be read in conjunction with the Prospectus and the Statement of Additional Information2. The mailing address of each Trustee and Officer is 525 Market Street, 12th Floor, San Francisco, CA 94105. Each Trustee and Officer serves an indefinite term, however, each Trustee serves such term until reaching the mandatory retirement age established by the Trustees.
Independent Trustees
| | | | | | |
Name and year of birth | | Position held and length of service* | | Principal occupations during past five years or longer | | Current other
public company or
investment company
directorships |
| | | |
William R. Ebsworth (Born 1957) | | Trustee, since 2015 | | Retired. From 1984 to 2013, equities analyst, portfolio manager, research director and chief investment officer at Fidelity Management and Research Company in Boston, Tokyo, and Hong Kong, and retired in 2013 as Chief Investment Officer of Fidelity Strategic Advisers, Inc. where he led a team of investment professionals managing client assets. Prior thereto, Board member of Hong Kong Securities Clearing Co., Hong Kong Options Clearing Corp., the Thailand International Fund, Ltd., Fidelity Investments Life Insurance Company, and Empire Fidelity Investments Life Insurance Company. Audit Committee Chair and Investment Committee Chair of the Vincent Memorial Hospital Endowment (non-profit organization). Mr. Ebsworth is a CFA® charterholder. | | N/A |
| | | |
Jane A. Freeman (Born 1953) | | Trustee, since 2015; Chair Liaison, since 2018 | | Retired. From 2012 to 2014 and 1999 to 2008, Chief Financial Officer of Scientific Learning Corporation. From 2008 to 2012, Ms. Freeman provided consulting services related to strategic business projects. Prior to 1999, Portfolio Manager at Rockefeller & Co. and Scudder, Stevens & Clark. Board member of the Harding Loevner Funds from 1996 to 2014, serving as both Lead Independent Director and chair of the Audit Committee. Board member of the Russell Exchange Traded Funds Trust from 2011 to 2012 and the chair of the Audit Committee. Ms. Freeman is a Board Member of The Ruth Bancroft Garden (non-profit organization). She is also an inactive Chartered Financial Analyst. | | N/A |
| | | |
Isaiah Harris, Jr. (Born 1952) | | Trustee, since 2009; Audit Committee Chairman, since 2019 | | Retired. Chairman of the Board of CIGNA Corporation since 2009, and Director since 2005. From 2003 to 2011, Director of Deluxe Corporation. Prior thereto, President and CEO of BellSouth Advertising and Publishing Corp. from 2005 to 2007, President and CEO of BellSouth Enterprises from 2004 to 2005 and President of BellSouth Consumer Services from 2000 to 2003. Emeritus member of the Iowa State University Foundation Board of Governors. Emeritus Member of the Advisory Board of Iowa State University School of Business. Advisory Board Member, Palm Harbor Academy (private school). Advisory Board Member, Child Evangelism Fellowship (non-profit). Mr. Harris is a certified public accountant (inactive status). | | CIGNA Corporation |
| | | |
Judith M. Johnson (Born 1949) | | Trustee, since 2008; Audit Committee Chairman, from 2009 to 2018 | | Retired. Prior thereto, Chief Executive Officer and Chief Investment Officer of Minneapolis Employees Retirement Fund from 1996 to 2008. Ms. Johnson is an attorney, certified public accountant and a certified managerial accountant. | | N/A |
| | | | |
| 30 | | Wells Fargo Moderate Balanced Fund | | Other information (unaudited) |
| | | | | | |
Name and year of birth | | Position held and length of service* | | Principal occupations during past five years or longer | | Current other
public company or
investment company
directorships |
| | | |
David F. Larcker (Born 1950) | | Trustee, since 2009 | | James Irvin Miller Professor of Accounting at the Graduate School of Business, Stanford University, Director of the Corporate Governance Research Initiative and Senior Faculty of The Rock Center for Corporate Governance since 2006. From 2005 to 2008, Professor of Accounting at the Graduate School of Business, Stanford University. Prior thereto, Ernst & Young Professor of Accounting at The Wharton School, University of Pennsylvania from 1985 to 2005. | | N/A |
| | | |
Olivia S. Mitchell (Born 1953) | | Trustee, since 2006; Nominating and Governance Committee Chairman, since 2018 | | International Foundation of Employee Benefit Plans Professor, Wharton School of the University of Pennsylvania since 1993. Director of Wharton’s Pension Research Council and Boettner Center on Pensions & Retirement Research, and Research Associate at the National Bureau of Economic Research. Previously, Cornell University Professor from 1978 to 1993. | | N/A |
| | | |
Timothy J. Penny (Born 1951) | | Trustee, since 1996; Chairman, since 2018 | | President and Chief Executive Officer of Southern Minnesota Initiative Foundation, a non-profit organization, since 2007. Member of the Board of Trustees of NorthStar Education Finance, Inc., a non-profit organization, since 2007. | | N/A |
| | | |
James G. Polisson (Born 1959) | | Trustee, since 2018 | | Retired. Chief Marketing Officer, Source (ETF) UK Services, Ltd, from 2015 to 2017. From 2012 to 2015, Principal of The Polisson Group, LLC, a management consulting, corporate advisory and principal investing company. Chief Executive Officer and Managing Director at Russell Investments, Global Exchange Traded Funds from 2010 to 2012. Managing Director of Barclays Global Investors from 1998 to 2010 and Global Chief Marketing Officer for iShares and Barclays Global Investors from 2000 to 2010. Trustee of the San Francisco Mechanics’ Institute, a non-profit organization, from 2013 to 2015. Board member of the Russell Exchange Traded Fund Trust from 2011 to 2012. Director of Barclays Global Investors Holdings Deutschland GmbH from 2006 to 2009. Mr. Polisson is an attorney and has a retired status with the Massachusetts and District of Columbia Bar Associations. | | N/A |
| * | Length of service dates reflect the Trustee’s commencement of service with the Trust’s predecessor entities, where applicable. |
| | | | | | |
| Other information (unaudited) | | Wells Fargo Moderate Balanced Fund | | | 31 | |
Officers
| | | | | | |
Name and year of birth | | Position held and length of service | | Principal occupations during past five years or longer | | |
| | | |
Andrew Owen (Born 1960) | | President, since 2017 | | Executive Vice President of Wells Fargo & Company and Head of Affiliated Managers, Wells Fargo Asset Management, since 2014. In addition, Mr. Owen is currently President, Chief Executive Officer and Director of Wells Fargo Funds Management, LLC since 2017. Prior thereto, Executive Vice President responsible for marketing, investments and product development for Wells Fargo Funds Management, LLC, from 2009 to 2014. | | |
| | | |
Jeremy DePalma1 (Born 1974) | | Treasurer, since 2012 | | Senior Vice President of Wells Fargo Funds Management, LLC since 2009. Senior Vice President of Evergreen Investment Management Company, LLC from 2008 to 2010 and head of the Fund Reporting and Control Team within Fund Administration from 2005 to 2010. | | |
| | | |
Alexander Kymn (Born 1973) | | Secretary and Chief Legal Officer, since 2018 | | Senior Company Counsel of Wells Fargo Bank, N.A. since 2018 (previously Senior Counsel from 2007 to 2018). Vice President of Wells Fargo Funds Management, LLC from 2008 to 2014. | | |
| | | |
Michael H. Whitaker (Born 1967) | | Chief Compliance Officer, since 2016 | | Senior Vice President and Chief Compliance Officer since 2016. Senior Vice President and Chief Compliance Officer for Fidelity Investments from 2007 to 2016. | | |
| | | |
David Berardi (Born 1975) | | Assistant Treasurer, since 2009 | | Vice President of Wells Fargo Funds Management, LLC since 2009. Vice President of Evergreen Investment Management Company, LLC from 2008 to 2010. Manager of Fund Reporting and Control for Evergreen Investment Management Company, LLC from 2004 to 2010. | | |
| 1 | Jeremy DePalma acts as Treasurer of 86 funds and Assistant Treasurer of 65 funds in the Fund Complex. |
| 2 | The Statement of Additional Information includes additional information about the Trustees and is available, without charge, upon request, by calling1-800-222-8222 or by visiting the website atwfam.com. |
| | | | |
| 32 | | Wells Fargo Moderate Balanced Fund | | Other information (unaudited) |
BOARD CONSIDERATION OF INVESTMENT MANAGEMENT AND SUB-ADVISORY AGREEMENTS:
Wells Fargo Moderate Balanced Fund
Under the Investment Company Act of 1940 (the “1940 Act”), the Board of Trustees (the “Board”) of Wells Fargo Funds Trust (the “Trust”) must determine annually whether to approve the continuation of the Trust’s investment management and sub-advisory agreements. In this regard, at an in-person meeting held on May 21-22, 2019 (the “Meeting”), the Board, all the members of which have no direct or indirect interest in the investment management and sub-advisory agreements and are not “interested persons” of the Trust, as defined in the 1940 Act (the “Independent Trustees”), reviewed and approved for Wells Fargo Moderate Balanced Fund (the “Fund”): (i) an investment management agreement (the “Management Agreement”) with Wells Fargo Funds Management, LLC (“Funds Management”); and (ii) an investment sub-advisory agreement (the “Sub-Advisory Agreement”) with Wells Capital Management Incorporated (the “Sub-Adviser”), an affiliate of Funds Management. The Management Agreement and the Sub-Advisory Agreement are collectively referred to as the “Advisory Agreements.” The Fund is a fund-of-funds that invests all of its assets in multiple portfolios of Wells Fargo Master Trust.
At the Meeting, the Board considered the factors and reached the conclusions described below relating to the selection of Funds Management and the Sub-Adviser and the approval of the Advisory Agreements. Prior to the Meeting, including at an in-person meeting in April 2019, the Trustees conferred extensively among themselves and with representatives of Funds Management about these matters. Also, the Board has adopted a team-based approach, with each team consisting of a sub-set of Trustees, to assist the full Board in the discharge of its duties in reviewing investment performance and other matters throughout the year. The Independent Trustees were assisted in their evaluation of the Advisory Agreements by independent legal counsel, from whom they received separate legal advice and with whom they met separately.
In providing information to the Board, Funds Management and the Sub-Adviser were guided by a detailed set of requests for information submitted to them by independent legal counsel on behalf of the Independent Trustees at the start of the Board’s annual contract renewal process earlier in 2019. In considering and approving the Advisory Agreements, the Trustees considered the information they believed relevant, including but not limited to the information discussed below. The Board considered not only the specific information presented in connection with the Meeting, but also the knowledge gained over time through interaction with Funds Management and the Sub-Adviser about various topics. In this regard, the Board reviewed reports of Funds Management at each of its quarterly meetings, which included, among other things, portfolio reviews and investment performance reports. In addition, the Board and the teams mentioned above confer with portfolio managers at various times throughout the year. The Board did not identify any particular information or consideration that was all-important or controlling, and each individual Trustee may have attributed different weights to various factors.
After its deliberations, the Board unanimously approved the continuation of the Advisory Agreements for a one-year term and determined that the compensation payable to Funds Management and the Sub-Adviser under each of the Advisory Agreements was reasonable. The Board considered the approval of the Advisory Agreements for the Fund as part of its consideration of agreements for funds across the complex, but its approvals were made on a fund-by-fund basis. The following summarizes a number of important, but not necessarily all, factors considered by the Board in support of its approvals.
Nature, extent and quality of services
The Board received and considered various information regarding the nature, extent and quality of services provided to the Fund by Funds Management and the Sub-Adviser under the Advisory Agreements. This information included a description of the investment advisory services and Fund-level administrative services covered by the Management Agreement, as well as, among other things, a summary of the background and experience of senior management of Wells Fargo Asset Management (“WFAM”), of which Funds Management and the Sub-Adviser are a part, a summary of investments made in the business of WFAM, a summary of certain organizational and personnel changes involving Funds Management and the Sub-Adviser, and a description of Funds Management’s and the Sub-Adviser’s business continuity planning programs and of their approaches to data privacy and cybersecurity. The Board received and reviewed information about Funds Management’s role as administrator of the Fund’s liquidity risk management program. The Board also considered the qualifications, background, tenure and responsibilities of each of the portfolio managers primarily responsible for the day-to-day portfolio management of the Fund.
The Board evaluated the ability of Funds Management and the Sub-Adviser to attract and retain qualified investment professionals, including research, advisory and supervisory personnel. The Board further considered the compliance
| | | | | | |
| Other information (unaudited) | | Wells Fargo Moderate Balanced Fund | | | 33 | |
programs and compliance records of Funds Management and the Sub-Adviser. In addition, the Board took into account the full range of services provided to the Fund by Funds Management and its affiliates.
Fund investment performance and expenses
The Board considered the investment performance results for the Fund over various time periods ended December 31, 2018. The Board considered these results in comparison to the investment performance of funds in a universe that was determined by Broadridge Inc. (“Broadridge”) to be similar to the Fund (the “Universe”), and in comparison to the Fund’s benchmark index and to other comparative data. Broadridge is an independent provider of investment company data. The Board received a description of the methodology used by Broadridge to select the mutual funds in the performance Universe. The Board noted that the investment performance of the Fund (Administrator Class) was higher than the average investment performance of the Universe for the one-, five- and ten-year periods under review, and lower than the average investment performance of the Universe for the three-year period under review. The Board also noted that the investment performance of the Fund was lower than its benchmark index, the Moderate Balanced Blended Index, for the one-, three- and five-year periods under review, but higher than its benchmark for the ten-year period under review.
The Board received information concerning, and discussed factors contributing to, the underperformance of the Fund relative to the Universe and benchmark for the periods identified above. The Board took note of the explanations for the relative underperformance during these periods, including with respect to investment decisions and market factors that affected the Fund’s investment performance. The Board also took note of the Fund’s outperformance relative to the Universe and benchmark over the longer time periods under review.
The Board also received and considered information regarding the Fund’s net operating expense ratios and their various components, including actual management fees, custodian and other non-management fees, and Rule 12b-1 and non-Rule 12b-1 shareholder service fees. The Board considered these ratios in comparison to the median ratios of funds in class-specific expense groups that were determined by Broadridge to be similar to the Fund (the “Groups”). The Board received a description of the methodology used by Broadridge to select the mutual funds in the expense Groups and an explanation of how funds comprising expense groups and their expense ratios may vary from year-to-year. Based on the Broadridge reports, the Board noted that the net operating expense ratios of the Fund were lower than the median net operating expense ratios of the expense Groups for each share class.
The Board took into account the Fund’s investment performance and expense information provided to it among the factors considered in deciding to re-approve the Advisory Agreements.
Investment management and sub-advisory fee rates
The Board reviewed and considered the contractual fee rates payable by the Fund to Funds Management under the Management Agreement, as well as the contractual fee rates payable by the Fund to Funds Management for class-level administrative services under a Class-Level Administration Agreement, which include, among other things, class-level transfer agency and sub-transfer agency costs (collectively, the “Management Rates”). The Board also reviewed and considered the contractual investment sub-advisory fee rates that are payable by Funds Management to the Sub-Adviser for investment sub-advisory services.
Among other information reviewed by the Board was a comparison of the Fund’s Management Rates, which include the advisory fees paid at the master portfolio level, with the average contractual investment management fee rates of funds in the expense Groups at a common asset level as well as transfer agency costs of the funds in the expense Groups. The Board noted that the Management Rates of the Fund were lower than the sum of these average rates for the Fund’s expense Groups for all share classes.
The Board also received and considered information about the portion of the total management fee that was retained by Funds Management after payment of the fee to the Sub-Adviser for sub-advisory services. In assessing the reasonableness of this amount, the Board received and evaluated information about the nature and extent of responsibilities retained and risks assumed by Funds Management and not delegated to or assumed by the Sub-Adviser, and about Funds Management’s on-going oversight services. Given the affiliation between Funds Management and the Sub-Adviser, the Board ascribed limited relevance to the allocation of fees between them.
The Board also received and considered information about the nature and extent of services offered and fee rates charged by Funds Management and the Sub-Adviser to other types of clients with investment strategies similar to those of the Fund. In this regard, the Board received information about the significantly greater scope of services, and compliance, reporting and other legal burdens and risks of managing proprietary mutual funds compared with those associated with managing assets of other types of clients, including third-party sub-advised fund clients and non-mutual fund clients such as institutional separate accounts.
| | | | |
| 34 | | Wells Fargo Moderate Balanced Fund | | Other information (unaudited) |
Based on its consideration of the factors and information it deemed relevant, including those described here, the Board determined that the compensation payable to Funds Management under the Management Agreement and to the Sub-Adviser under the Sub-Advisory Agreement was reasonable.
Profitability
The Board received and considered information concerning the profitability of Funds Management, as well as the profitability of both WFAM and Wells Fargo & Co. (“Wells Fargo”) from providing services to the fund family as a whole. The Board noted that the Sub-Adviser’s profitability information with respect to providing services to the Fund and other funds in the family was subsumed in the WFAM and Wells Fargo profitability analysis.
Funds Management reported on the methodologies and estimates used in calculating profitability, including a description of the methodology used to allocate certain expenses. Among other things, the Board noted that the levels of profitability reported on a fund-by-fund basis varied widely, depending on factors such as the size, type and age of fund. Based on its review, the Board did not deem the profits reported by Funds Management, WFAM or Wells Fargo from services provided to the Fund to be at a level that would prevent it from approving the continuation of the Advisory Agreements.
Economies of scale
The Board received and considered information about the potential for Funds Management to experience economies of scale in the provision of management services to the Fund, the difficulties of calculating economies of scale at an individual fund level, and the extent to which potential scale benefits are shared with shareholders. The Board noted the existence of breakpoints in the Fund’s management fee structure, which operate generally to reduce the Fund’s expense ratios as the Fund grows in size. The Board considered that in addition to management fee breakpoints, Funds Management shares potential economies of scale from its management business in a variety of ways, including through fee waiver and expense reimbursement arrangements, services that benefit shareholders, competitive management fee rates set at the outset without regard to breakpoints, and investments in the business intended to enhance services available to shareholders.
The Board concluded that Funds Management’s arrangements with respect to the Fund, including contractual breakpoints, constituted a reasonable approach to sharing potential economies of scale with the Fund and its shareholders.
Other benefits to Funds Management and the Sub-Adviser
The Board received and considered information regarding potential “fall-out” or ancillary benefits received by Funds Management and its affiliates, including the Sub-Adviser, as a result of their relationships with the Fund. Ancillary benefits could include, among others, benefits directly attributable to other relationships with the Fund and benefits potentially derived from an increase in Funds Management’s and the Sub-Adviser’s business as a result of their relationships with the Fund. The Board noted that various affiliates of Funds Management may receive distribution-related fees, shareholder servicing payments and sub-transfer agency fees in respect of shares sold or held through them and services provided.
The Board also reviewed information about soft dollar credits earned and utilized by the Sub-Adviser, fees earned by Funds Management and the Sub-Adviser from managing a private investment vehicle for the fund family’s securities lending collateral, and commissions earned by an affiliated broker from portfolio transactions.
Based on its consideration of the factors and information it deemed relevant, including those described here, the Board did not find that any ancillary benefits received by Funds Management and its affiliates, including the Sub-Adviser, were unreasonable.
Conclusion
At the Meeting, after considering the above-described factors and based on its deliberations and its evaluation of the information described above, the Board unanimously approved the continuation of the Advisory Agreements for aone-year term and determined that the compensation payable to Funds Management and the Sub-Adviser under each of the Advisory Agreements was reasonable.
This page is intentionally left blank.
This page is intentionally left blank.

For more information
More information about Wells Fargo Funds is available free upon request. To obtain literature, please write, visit the Fund’s website, or call:
Wells Fargo Funds
P.O. Box 219967
Kansas City, MO 64121-9967
Website: wfam.com
Individual investors: 1-800-222-8222
Retail investment professionals: 1-888-877-9275
Institutional investment professionals:
1-866-765-0778
This report and the financial statements contained herein are submitted for the general information of the shareholders of the Fund. If this report is used for promotional purposes, distribution of the report must be accompanied or preceded by a current prospectus. Before investing, please consider the investment objectives, risks, charges, and expenses of the investment. For a current prospectus and, if available, a summary prospectus, containing this information, call1-800-222-8222 or visit the Fund’s website atwfam.com. Read the prospectus carefully before you invest or send money.
Wells Fargo Asset Management (WFAM) is the trade name for certain investment advisory/management firms owned by Wells Fargo & Company. These firms include but are not limited to Wells Capital Management Incorporated and Wells Fargo Funds Management, LLC. Certain products managed by WFAM entities are distributed by Wells Fargo Funds Distributor, LLC (a broker-dealer and Member FINRA).
This material is for general informational and educational purposes only and is NOT intended to provide investment advice or a recommendation of any kind—including a recommendation for any specific investment, strategy, or plan.
INVESTMENT PRODUCTS: NOT FDIC INSURED ◾ NO BANK GUARANTEE ◾ MAY LOSE VALUE
© 2019 Wells Fargo Funds Management, LLC. All rights reserved.
| | |
 | | 403193 07-19 A279/AR279 05-19 |
Annual Report
May 31, 2019

Multi-Asset Funds

| ∎ | | Wells Fargo WealthBuilder Conservative Allocation Fund |
| ∎ | | Wells Fargo WealthBuilder Growth Allocation Fund |
| ∎ | | Wells Fargo WealthBuilder Growth Balanced Fund |
| ∎ | | Wells Fargo WealthBuilder Moderate Balanced Fund |
| ∎ | | Wells Fargo WealthBuilder Equity Fund |
Beginning on January 1, 2021, as permitted by new regulations adopted by the Securities and Exchange Commission, paper copies of the Wells Fargo Funds’ annual and semi-annual shareholder reports issued after this date will no longer be sent by mail, unless you specifically request paper copies of the reports. Instead, the reports will be made available on the Funds’ website, and you will be notified by mail each time a report is posted and provided with a website address to access the report.
If you already elected to receive shareholder reports electronically, you will not be affected by this change and you need not take any action. You may elect to receive shareholder reports and other communications from the Fund electronically at any time by contacting your financial intermediary (such as a broker-dealer or bank) or, if you are a direct investor, by calling 1-800-222-8222 or by enrolling at wellsfargo.com/advantagedelivery.
You may elect to receive all future reports in paper free of charge. If you invest through a financial intermediary, you can contact your financial intermediary to request that you continue to receive paper copies of your shareholder reports; if you invest directly with the Fund, you can call 1-800-222-8222. Your election to receive reports in paper will apply to all Wells Fargo Funds held in your account with your financial intermediary or, if you are a direct investor, to all Wells Fargo Funds that you hold.

Reduce clutter. Save trees.
Sign up for electronic delivery of prospectuses and shareholder reports atwellsfargo.com/advantagedelivery
Contents
The views expressed and any forward-looking statements are as of May 31, 2019, unless otherwise noted, and are those of the Fund managers and/or Wells Fargo Asset Management. Discussions of individual securities, or the markets generally, or any Wells Fargo Fund are not intended as individual recommendations. Future events or results may vary significantly from those expressed in any forward-looking statements. The views expressed are subject to change at any time in response to changing circumstances in the market. Wells Fargo Asset Management and the Fund disclaim any obligation to publicly update or revise any views expressed or forward-looking statements.
INVESTMENT PRODUCTS: NOT FDIC INSURED ◾ NO BANK GUARANTEE ◾ MAY LOSE VALUE
| | | | |
| 2 | | Multi-Asset Funds | | Letter to shareholders (unaudited) |

Andrew Owen
President
Wells Fargo Funds
Dear Shareholder:
We are pleased to offer you this annual report for the Wells Fargo WealthBuilder Funds for the12-month period that ended May 31, 2019. Higher short-term interest rates, inflation concerns, trade tensions, and geopolitical events drove investment market volatility for much of 2018, particularly for international stocks. Early 2019 saw stocks and bonds gain with renewed business and investor confidence, but volatility returned late in the period as global growth slowed and geopolitical concerns persisted.
For the period, U.S. stocks, based on the S&P 500 Index,1 gained 3.78% and international stocks, as measured by the MSCI ACWI ex USA Index (Net),2 fell 6.26%. Based on the MSCI EM Index (Net),3 emerging market stocks fell 8.70%. Bond investors saw the Bloomberg Barclays U.S. Aggregate Bond Index4 add 6.40% while the Bloomberg Barclays Global Aggregateex-USD Index5 rose 0.39%. The Bloomberg Barclays Municipal Bond Index6 added 6.40%, and the ICE BofAML U.S. High Yield Index7 was up 5.37%.
Results for investment indices reflected global concerns.
Global trade tensions escalated during the second quarter of 2018. Atit-for-tat tariff spat intensified between the U.S. and other governments. The U.S. Federal Reserve (Fed) raised the federal funds rate by 25 basis points (bps; 100 bps equal 1.00%) to a target range of between 1.75% and 2.00% in June. Market index results reflected the global concerns. The MSCI ACWI ex USA Index (Net) lost 2.61%, while the Bloomberg Barclays Global Aggregateex-USD Index dropped 4.76%.
Not all news was bad. The U.S. Bureau of Economic Analysis reported second-quarter annualized gross domestic product (GDP) growth of 4.2%. Hiring improved. Unemployment declined. Consumer confidence and spending increased. The S&P 500 Index recorded a 3.43% second-quarter gain. Stocks of companies with smaller capitalizations did even better, as measured by the Russell 2000® Index,8 adding 7.75%.
| 1 | The S&P 500 Index consists of 500 stocks chosen for market size, liquidity, and industry group representation. It is a market-value-weighted index with each stock’s weight in the index proportionate to its market value. You cannot invest directly in an index. |
| 2 | The Morgan Stanley Capital International (MSCI) All Country World Index (ACWI) ex USA Index (Net) is a free-float-adjusted market-capitalization-weighted index that is designed to measure the equity market performance of developed and emerging markets, excluding the U.S. Source: MSCI. MSCI makes no express or implied warranties or representations and shall have no liability whatsoever with respect to any MSCI data contained herein. The MSCI data may not be further redistributed or used as a basis for other indices or any securities or financial products. This report is not approved, reviewed, or produced by MSCI. You cannot invest directly in an index. |
| 3 | The Morgan Stanley Capital International (MSCI) Emerging Markets (EM) Index (Net) is a free-float-adjusted market-capitalization-weighted index that is designed to measure the equity market performance of emerging markets. You cannot invest directly in an index. |
| 4 | The Bloomberg Barclays U.S. Aggregate Bond Index is a broad-based benchmark that measures the investment-grade, U.S.-dollar-denominated, fixed-rate taxable bond market, including Treasuries, government-related and corporate securities, mortgage-backed securities (agency fixed-rate and hybrid adjustable-rate mortgage pass-throughs), asset-backed securities, and commercial mortgage-backed securities. You cannot invest directly in an index. |
| 5 | The Bloomberg Barclays Global Aggregateex-USD Index is an unmanaged index that provides a broad-based measure of the global investment-grade fixed-income markets excluding the U.S.-dollar-denominated debt market. You cannot invest directly in an index. |
| 6 | The Bloomberg Barclays Municipal Bond Index is an unmanaged index composed of long-termtax-exempt bonds with a minimum credit rating of Baa. You cannot invest directly in an index. |
| 7 | The ICE BofAML U.S. High Yield Index is a market-capitalization-weighted index of domestic and Yankee high-yield bonds. The index tracks the performance of high-yield securities traded in the U.S. bond market. You cannot invest directly in an index. Copyright 2019. ICE Data Indices, LLC. All rights reserved. |
| 8 | The Russell 2000® Index measures the performance of the 2,000 smallest companies in the Russell 3000® Index, which represents approximately 8% of the total market capitalization of the Russell 3000® Index. You cannot invest directly in an index. |
| | | | | | |
| Letter to shareholders (unaudited) | | Multi-Asset Funds | | | 3 | |
Investors appeared to shake off lingering concerns during the third quarter.
Favorable third-quarter economic indicators and corporate earnings reports encouraged domestic stock investors. U.S. trade negotiations with Mexico and Canada progressed. The Conference Board Consumer Confidence Index®9 reached its highest level in 18 years during September 2018. The Fed raised the federal funds rate by 25 bps to a target range of between 2.00% and 2.25% in September. For the quarter that ended September 30, 2018, the S&P 500 Index added 7.71%.
Investors in international markets were not as confident. Tensions between the U.S. and China increased. The U.S. imposed $200 billion in tariffs on Chinese goods. China reacted with $60 billion in tariffs on U.S. goods. Economic growth in China caused concern. The Bank of England (BoE) raised its monetary policy rate to 0.75% in August 2018. During the quarter, the MSCI ACWI ex USA Index (Net) gained 0.71%. The MSCI EM Index (Net) declined 1.09%. In fixed-income markets, U.S. bonds were flat, as measured by the Bloomberg Barclays U.S. Aggregate Bond Index. The Bloomberg Barclays Global Aggregateex-USD Index fell 1.74%.
Conflicting data unsettled markets during the fourth quarter.
November’s U.S. midterm elections shifted control of the House of Representatives from Republicans to Democrats, presaging potential partisan clashes. Third-quarter U.S. GDP was announced at an annualized 3.4% rate, lower than the second-quarter rate. Brexit efforts stalled ahead of the March 2019 deadline. The People’s Bank of China cut reserve requirement ratios, accelerated infrastructure spending, and cut taxes even as the value of the yuan declined to low levels last seen in 2008.
December’s S&P 500 Index performance was the worst since 1931. Globally, fixed-income investments fared better than stocks during the last two months of the year. The Fed increased the federal funds rate by 25 bps in December 2018 to a target range of between 2.25% and 2.50%.
The market climbs a wall of worry.
Investors entered 2019 with reasons to be concerned. A partial U.S. government shutdown driven by partisan policy disputes extended into January. Investment returns appeared to reaffirm the adage that markets climb a wall of worry. The S&P 500 Index gained 8.01% for the month of January, the best monthly performance in 30 years. Returns for the MSCI ACWI ex USA Index (Net), the Bloomberg Barclays U.S. Aggregate Bond Index, and the Bloomberg Barclays Global Aggregateex-USD Index also were positive. The Fed indicated that it would pause its program of regular rate increases during 2019 as inflation remained low.
In February 2019, concerns over slowing global growth reemerged. The Bureau of Economic Analysis announced fourth-quarter 2018 GDP grew at an annualized 2.2% rate, down from levels of the prior two quarters. In a February report, the BoE forecast the slowest growth since the financial crisis for 2019. China and the U.S. continued to wrangle over trade issues.
By the end of March 2019, the combination of dovish Fed sentiment and consistent, if not spectacular, economic and business metrics reinforced investors’ confidence. Monthly job creation data regained momentum. Corporate profits, while lower than 2018’s lofty levels, remained solid. China announced a roughly $300 billion stimulus package through tax and fee cuts intended to reinvigorate economic growth.
December’s S&P 500 Index performance was the worst since 1931.
The S&P 500 Index gained 8.01% for the month of January, the best monthly performance in 30 years.
| 9 | The Conference Board Consumer Confidence Index® measures the degree of optimism on the state of the U.S. economy that consumers are expressing through their activities of saving and spending. You cannot invest directly in an index. |
| | | | |
| 4 | | Multi-Asset Funds | | Letter to shareholders (unaudited) |
During April 2019, several broad-based U.S. equity indices reached or approached highs as investors drew confidence from favorable economic projections, sustained low inflation, and solid employment data. First-quarter GDP showed the economy grew at an annualized rate of 3.2% on improvement in business investment and exports. Favorable sentiment extended to foreign markets as the MSCI ACWI ex USA Index (Net) gained 2.64% and the MSCI EM Index (Net) added 2.11% for the month.
May 2019 presented investors with mixed signals in the economy, in the markets, and politically. In the U.S., partisan wrangling ramped up as Democrats and Republicans set their sights on 2020 presidential politics. In the U.K., the Brexit stalemate resulted in the resignation of Prime Minister Theresa May. The European Commission downgraded the 2019 growth forecast for the block of countries to 1.2%. The U.S. increased tariffs on products from China, China responded, and then talks broke down. Ending the month, equities, as measured by the MSCI ACWI (Net),10 dropped 5.93% while bonds, often considered a less risky investment, gained 1.04%, as measured by the Bloomberg Barclays Global Aggregateex-USD Index.
Don’t let short-term uncertainty derail long-term investment goals.
Periods of investment uncertainty can present challenges, but experience has taught us that maintaining long-term investment goals can be an effective way to plan for the future. To help you create a sound strategy based on your personal goals and risk tolerance, Wells Fargo Funds offers more than 100 mutual funds spanning a wide range of asset classes and investment styles. Although diversification cannot guarantee an investment profit or prevent losses, we believe it can be an effective way to manage investment risk and potentially smooth out overall portfolio performance. We encourage investors to know their investments and to understand that appropriate levels of risk-taking may unlock opportunities.
Thank you for choosing to invest with Wells Fargo Funds. We appreciate your confidence in us and remain committed to helping you meet your financial needs.
Sincerely,

Andrew Owen
President
Wells Fargo Funds
For further information about your Fund, contact your investment professional, visit our website atwfam.com, or call us directly at1-800-222-8222.
| 10 | The MSCI ACWI (Net) is a free-float-adjusted market-capitalization-weighted index that is designed to measure the equity market performance of developed and emerging markets. You cannot invest directly in an index. |
This page is intentionally left blank.
| | | | |
| 6 | | Multi-Asset Funds | | Performance highlights (unaudited) |
Wells Fargo WealthBuilder Conservative Allocation Fund
Investment objective
The Fund seeks current income with a secondary emphasis on capital appreciation.
Manager
Wells Fargo Funds Management, LLC
Subadviser
Wells Capital Management Incorporated
Portfolio managers
Kandarp R. Acharya, CFA®‡, FRM
Christian L. Chan, CFA®‡
Travis L. Keshemberg, CFA®‡*, CIPM, FRM
Average annual total returns (%) as of May 31, 2019
| | | | | | | | | | | | | | | | | | | | | | | | | | | | | | | | | | |
| | | | | Including sales charge | | | Excluding sales charge | | | Expense ratios1 (%) | |
| | | Inception date | | 1 year | | | 5 year | | | 10 year | | | 1 year | | | 5 year | | | 10 year | | | Gross | | | Net2 | |
| | | | | | | | | |
| Class A (WCAFX)3 | | 2-10-2017 | | | -2.14 | | | | 1.03 | | | | 3.58 | | | | 3.84 | | | | 2.24 | | | | 4.19 | | | | 1.18 | | | | 1.16 | |
| | | | | | | | | |
| Class C (WCCFX)4 | | 9-30-2004 | | | 1.89 | | | | 1.85 | | | | 3.99 | | | | 2.89 | | | | 1.85 | | | | 3.99 | | | | 1.93 | | | | 1.91 | |
| | | | | | | | | |
| Institutional Class (WCYFX)5 | | 7-31-2018 | | | – | | | | – | | | | – | | | | 3.97 | | | | 2.26 | | | | 4.21 | | | | 0.83 | | | | 0.83 | |
| | | | | | | | | |
| WealthBuilder Conservative Allocation Blended Index6 | | – | | | – | | | | – | | | | – | | | | 5.31 | | | | 3.65 | | | | 5.48 | | | | – | | | | – | |
| | | | | | | | | |
| Bloomberg Barclays U.S. Aggregate Bond Index7 | | – | | | – | | | | – | | | | – | | | | 6.40 | | | | 2.70 | | | | 3.83 | | | | – | | | | – | |
| | | | | | | | | |
| MSCI ACWI ex USA Index (Net)8 | | – | | | – | | | | – | | | | – | | | | -6.26 | | | | 1.31 | | | | 5.80 | | | | – | | | | – | |
| | | | | | | | | |
| Russell 3000® Index9 | | – | | | – | | | | – | | | | – | | | | 2.50 | | | | 9.25 | | | | 13.93 | | | | – | | | | – | |
Figures quoted represent past performance, which is no guarantee of future results, and do not reflect taxes that a shareholder may pay on fund distributions or the redemption of fund shares. Investment return and principal value of an investment will fluctuate so that an investor’s shares, when redeemed, may be worth more or less than their original cost. Performance shown without sales charges would be lower if sales charges were reflected. Current performance may be lower or higher than the performance data quoted, which assumes the reinvestment of dividends and capital gains. Currentmonth-end performance is available on the Fund’s website,wfam.com.
Index returns do not include transaction costs associated with buying and selling securities, any mutual fund fees or expenses, or any taxes. It is not possible to invest directly in an index.
For Class A shares, the maximumfront-end sales charge is 5.75%. For Class C shares, the maximum contingent deferred sales charge is 1.00%. Performance including a contingent deferred sales charge assumes the sales charge for the corresponding time period. Institutional Class shares are sold without afront-end sales charge or contingent deferred sales charge.
Balanced funds may invest in stocks and bonds. Stock values fluctuate in response to the activities of individual companies and general market and economic conditions. Bond values fluctuate in response to the financial condition of individual issuers, general market and economic conditions, and changes in interest rates. Changes in market conditions and government policies may lead to periods of heightened volatility in the bond market and reduced liquidity for certain bonds held by the Fund. In general, when interest rates rise, bond values fall and investors may lose principal value. Interest rate changes and their impact on the Fund and its share price can be sudden and unpredictable. The use of derivatives may reduce returns and/or increase volatility. The Fund will indirectly be exposed to all of the risks of an investment in the underlying funds and will indirectly bear expenses of the underlying funds. Certain investment strategies tend to increase the total risk of an investment (relative to the broader market). The Fund is exposed to alternative investment risk, foreign investment risk, high-yield securities risk, mortgage- and asset-backed securities risk, and smaller-company investment risk. Consult the Fund’s prospectus for additional information on these and other risks.
Please see footnotes on page 7.
| | | | | | |
| Performance highlights (unaudited) | | Multi-Asset Funds | | | 7 | |
Wells Fargo WealthBuilder Conservative Allocation Fund (continued)
|
| Growth of $10,000 investment as of May 31, 201910 |
|
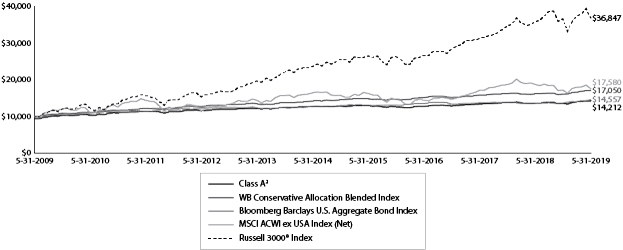 |
| ‡ | CFA® and Chartered Financial Analyst® are trademarks owned by CFA Institute. |
| * | Mr. Keshemberg became a portfolio manager of the Fund on October 26, 2018. |
| 1 | Reflects the expense ratios as stated in the most recent prospectuses, which include the impact of 0.41% of acquired fund fees and expenses. Net expenses from affiliated master portfolios are included in the acquired fund fees and expense amount. The expense ratios shown are subject to change and may differ from the annualized expense ratios shown in the financial highlights of this report, which do not include acquired fund fees and expenses. |
| 2 | The manager has contractually committed through September 30, 2019, to waive fees and/or reimburse expenses to the extent necessary to cap the expenses of each class after fee waivers at 0.75% for Class A, 1.50% for Class C, and 0.42% for Institutional Class. Brokerage commissions, stamp duty fees, interest, taxes, acquired fund fees and expenses (if any), net expenses from affiliated master portfolios, and extraordinary expenses are excluded from the expense cap. Prior to or after the commitment expiration date, the cap may be increased or the commitment to maintain the cap may be terminated only with the approval of the Board of Trustees. Without this cap, the Fund’s returns would have been lower. The expense ratio paid by an investor is the net expense ratio (the total annual fund operating expenses after fee waivers) as stated in the prospectuses. |
| 3 | Historical performance for Class A shares prior to their inception reflects the performance of Class C shares and includes the higher expenses applicable to Class C shares. If these expenses had not been included, returns for Class A shares would be higher. |
| 4 | Prior to February 13, 2017, historical performance shown for Class C shares reflects the performance of the Fund’s predecessor WealthBuilder Portfolio share class and does not reflect thefront-end sales load previously attributable to the predecessor class. The expenses for Class C shares and the predecessor share class are similar. |
| 5 | Historical performance shown for Institutional Class shares prior to their inception reflects the performance of Class A shares adjusted to reflect that Institutional Class shares do not have a sales load but not adjusted to reflect Institutional Class expenses. If these expenses had been included, returns for Institutional Class shares would be higher. |
| 6 | Source: Wells Fargo Funds Management, LLC. The WealthBuilder Conservative Allocation Blended Index is composed 80% of Bloomberg Barclays U.S. Aggregate Bond Index, 14% of the Russell 3000® Index, and 6% of the MSCI ACWI ex USA Index (Net). You cannot invest directly in an index. |
| 7 | The Bloomberg Barclays U.S. Aggregate Bond Index is a broad-based benchmark that measures the investment-grade, U.S. dollar–denominated, fixed-rate taxable bond market, including Treasuries, government-related and corporate securities, mortgage-backed securities (agency fixed-rate and hybrid adjustable rate mortgage pass-throughs), asset-backed securities, and commercial mortgage-backed securities. You cannot invest directly in an index. |
| 8 | The Morgan Stanley Capital International (MSCI) All Country World Index (ACWI) ex USA Index (Net) is a free-float-adjusted market-capitalization-weighted index that is designed to measure the equity market performance of developed and emerging markets, excluding the U.S. Source: MSCI. MSCI makes no express or implied warranties or representations and shall have no liability whatsoever with respect to any MSCI data contained herein. The MSCI data may not be further redistributed or used as a basis for other indexes or any securities or financial products. This report is not approved, reviewed, or produced by MSCI. You cannot invest directly in an index. |
| 9 | The Russell 3000® Index measures the performance of the 3,000 largest U.S. companies based on total market capitalization, which represents approximately 98% of the investable U.S. equity market. You cannot invest directly in an index. |
| 10 | The chart compares the performance of Class A shares for the most recent ten years with the WealthBuilder Conservative Allocation Blended Index, the Bloomberg Barclays U.S. Aggregate Bond Index, the MSCI ACWI ex USA Index (Net) and the Russell 3000® Index. The chart assumes a hypothetical $10,000 investment and reflects all operating expenses and assumes the maximum initial sales charge of 5.75%. |
| 11 | The ten largest holdings, excluding cash, cash equivalents and any money market funds, are calculated based on the value of the investments divided by total net assets of the Fund. Holdings are subject to change and may have changed since the date specified. |
| 12 | Effective allocation includes the effect of any tactical futures overlay that may be in place. Effective cash is comprised of the net impact of long and/or short futures contracts held as part of a dynamic risk management strategy. The amounts are subject to change and may have changed since the date specified. |
| | | | |
| 8 | | Multi-Asset Funds | | Performance highlights (unaudited) |
Wells Fargo WealthBuilder Conservative Allocation Fund (continued)
MANAGER’S DISCUSSION
Fund highlights
| ∎ | | The Fund underperformed the WealthBuilder Conservative Allocation Blended Index for the12-month period that ended May 31, 2019. The Fund is a fund-of-funds that invests in various affiliated mutual funds, unaffiliated mutual funds, and exchange-traded funds. |
| ∎ | | On a relative basis, the actively managed international investments underperformed their respective style-specific benchmarks. |
| ∎ | | The tactical asset allocation (TAA) overlay, a futures overlay, added to performance through the period. |
Positive economic data ruled most of the period.
The12-month period that ended May 31, 2019, saw the U.S. economy continue on a positive trajectory, producing moderate average gross domestic product growth of 3.1% with a core inflation rate of 2.0%, while unemployment reached a low of 3.6%, the lowest level since 1969.
Over the past 12 months, the financial markets experienced more volatility than the favorable economic environment might have suggested. Looking back at the financial markets, we saw equities experience a significant decline during the fourth quarter of 2018, as concerns over a partial U.S. government shutdown, central bank tightening, trade tensions, and slowing economic growth shook investors’ confidence. The market volatility of the fourth quarter of 2018 gave way to a first-quarter 2019 rebound where both equity and fixed-income markets rallied. The two markets seemed joined at the hip as the Federal Reserve’s (Fed’s) updated script signaled an easier policy path for the balance of 2019. Market participants were caught off balance by this evolution in the projected policy path, which has resulted in a broader opportunity set for sector rotation in equities and yield curve trades. We saw a return of volatility toward the end of the12-month period as concerns over trade (primarily with China and Mexico) caused concerns over global growth to weigh on investors’ minds.
Portfolio management addressed Fund allocations throughout the period.
Over the period, we made relatively few changes to the underlying mutual funds in which the Fund invests. The most significant change was the addition of a flexible-mandate fixed-income fund with the ability to shift assets among different fixed-income sectors such as high-yield, asset-backed, and foreign securities that the portfolio managers find attractive. In the fourth quarter of 2018, we reduced our direct high-yield exposure to fund this new investment. Also in the fourth quarter of 2018, to reduce the overall equity risk in the Fund, we introduced a dedicated equity investment in the U.S. consumer staples sector.
At the start of the period, the Fund’s targeted TAA overlay was 5.00% long in the S&P 500 futures contract. Due to volatility concerns, in early September, 2018, we reduced the position by 2.50%. In October, 2018, we added a total of 2.50%, bringing the position back to 5.00% long. During early November, 2018, we covered 1.25%. In early December, 2018, we added 2.50%, bringing the position to 6.25%. As January, 2019, drew to a close, we covered 2.50%. In early February, 2019, we covered the remaining 3.75% and exited the position. With respect to the 10-year Treasury contract activity, we started the period short 2.50% and covered the position in early October, 2018. In mid-December, 2018, we established a new 2.50% short position and exited it in early March, 2019.
Please see footnotes on page 7.
| | | | | | |
| Performance highlights (unaudited) | | Multi-Asset Funds | | | 9 | |
Wells Fargo WealthBuilder Conservative Allocation Fund (continued)
| | | | |
| Ten largest holdings (%) as of May 31, 201911 | |
| |
Wells Fargo Core Bond Portfolio | | | 24.17 | |
| |
Wells Fargo Strategic Income Fund Institutional Class | | | 13.51 | |
| |
Wells Fargo Bloomberg Barclays US Aggregateex-Corporate Portfolio | | | 11.33 | |
| |
Vanguard Intermediate-Term Corporate Bond ETF | | | 7.55 | |
| |
Vanguard Short-Term Bond ETF | | | 6.78 | |
| |
Wells Fargo Disciplined Large Cap Portfolio | | | 4.86 | |
| |
Wells Fargo Real Return Portfolio | | | 4.53 | |
| |
Wells Fargo Factor Enhanced Large Cap Portfolio | | | 4.32 | |
| |
Wells Fargo Factor Enhanced International Portfolio | | | 2.65 | |
| |
Wells Fargo High Yield Corporate Bond Portfolio | | | 2.12 | |
| | | | | | | | |
| Allocations (%) as of May 31, 2019 | |
| | | Effective
allocation12 | | | Neutral
allocation | |
| | |
Alternative Investments | | | 5 | | | | 5 | |
| | |
Bonds | | | 73 | | | | 75 | |
| | |
Stocks | | | 16 | | | | 20 | |
| | |
Effective Cash | | | 6 | | | | 0 | |
Over the entire period, TAA activity contributed about 47 basis points (bps; 100 bps equal 1.00%) to performance.
The Fund’s holdings in underlying funds that employ various factor-based strategies performed well on a relative basis over the period. The Wells Fargo Factor Enhanced Large Cap Portfolio outperformed its market benchmark by 328 bps, the Wells Fargo Factor Enhanced Small Cap Portfolio outperformed its market benchmark by 80 bps, the Wells Fargo Factor Enhanced International Portfolio outperformed its market benchmark by 172 bps, and the Wells Fargo Factor Enhanced Emerging Markets Portfolio outperformed its market benchmark by 43 bps.
While the factor-enhanced international strategies did well on a relative basis, the remainder of the actively managed international equity mutual funds held within the Fund did not, and this was the most significant detractor from performance over the period. Underperformance in the three international funds ranged from 205 bps to 966 bps.
On average, over the 12 months that ended May 31, 2019,
the equity portion of the portfolio was hedged an average of 9.4%. The maximum daily hedge was 36.1% on December 12, 2018. The hedge detracted 15 bps from performance over the entire period.
Looking ahead, we are cautiously optimistic.
Our macroeconomic view is that growth will remain positive but it will be slower over the next 12 months than it was over the preceding 12 months. However, we still hold that absent an exogenous shock—likely an implemented shift in trade policy—a U.S. recession is unlikely in 2019. As always, that view could change with new data. We are concerned about growth prospects in Europe and in the rest of the world but are most concerned about the U.S. trade negotiations with major trading partners. Until the trade negotiations move toward détente and more certainty builds to invoke more aggressive business planning resulting in further growth, we are taking a bit more of a cautious approach to the markets and have started to reduce some risks in the portfolios. Like the Fed, we remain very data dependent and acknowledge that while the U.S. economy may be softening, the levels of growth remain robust and 2019 should remain a target-rich environment for investors.
Please see footnotes on page 7.
| | | | |
| 10 | | Multi-Asset Funds | | Performance highlights (unaudited) |
Wells Fargo WealthBuilder Equity Fund
Investment objective
The Fund seeks long-term capital appreciation with no emphasis on income.
Manager
Wells Fargo Funds Management, LLC
Subadviser
Wells Capital Management Incorporated
Portfolio managers
Kandarp R. Acharya, CFA®‡, FRM
Christian L. Chan, CFA®‡
Travis L. Keshemberg, CFA®‡*, CIPM, FRM
Average annual total returns (%) as of May 31, 2019
| | | | | | | | | | | | | | | | | | | | | | | | | | | | | | | | | | |
| | | | | Including sales charge | | | Excluding sales charge | | | Expense ratios1 (%) | |
| | | Inception date | | 1 year | | | 5 year | | | 10 year | | | 1 year | | | 5 year | | | 10 year | | | Gross | | | Net2 | |
| | | | | | | | | |
| Class A (WEAFX)3 | | 2-10-2017 | | | -7.97 | | | | 4.20 | | | | 9.31 | | | | -2.35 | | | | 5.44 | | | | 9.96 | | | | 1.25 | | | | 1.25 | |
| | | | | | | | | |
| Class C (WEACX)4 | | 10-1-1997 | | | -4.16 | | | | 5.06 | | | | 9.76 | | | | -3.16 | | | | 5.06 | | | | 9.76 | | | | 2.00 | | | | 2.00 | |
| | | | | | | | | |
| Institutional Class (WEAYX)5 | | 7-31-2018 | | | – | | | | – | | | | – | | | | -2.08 | | | | 5.50 | | | | 9.99 | | | | 0.92 | | | | 0.92 | |
| | | | | | | | | |
| WealthBuilder Equity Blended Index6 | | – | | | – | | | | – | | | | – | | | | -0.14 | | | | 6.87 | | | | 11.50 | | | | – | | | | – | |
| | | | | | | | | |
| MSCI ACWI ex USA Index (Net)7 | | – | | | – | | | | – | | | | – | | | | -6.26 | | | | 1.31 | | | | 5.80 | | | | – | | | | – | |
| | | | | | | | | |
| Russell 3000® Index8 | | – | | | – | | | | – | | | | – | | | | 2.50 | | | | 9.25 | | | | 13.93 | | | | – | | | | – | |
Figures quoted represent past performance, which is no guarantee of future results, and do not reflect taxes that a shareholder may pay on fund distributions or the redemption of fund shares. Investment return and principal value of an investment will fluctuate so that an investor’s shares, when redeemed, may be worth more or less than their original cost. Performance shown without sales charges would be lower if sales charges were reflected. Current performance may be lower or higher than the performance data quoted, which assumes the reinvestment of dividends and capital gains. Currentmonth-end performance is available on the Fund’s website, wfam.com.
Index returns do not include transaction costs associated with buying and selling securities, any mutual fund fees or expenses, or any taxes. It is not possible to invest directly in an index.
For Class A shares, the maximumfront-end sales charge is 5.75%. For Class C shares, the maximum contingent deferred sales charge is 1.00%. Performance including a contingent deferred sales charge assumes the sales charge for the corresponding time period. Institutional Class shares are sold without afront-end sales charge or contingent deferred sales charge.
Stock values fluctuate in response to the activities of individual companies and general market and economic conditions. The Fund will indirectly be exposed to all of the risks of an investment in the underlying funds and will indirectly bear expenses of the underlying funds. The use of derivatives may reduce returns and/or increase volatility. Certain investment strategies tend to increase the total risk of an investment (relative to the broader market). The Fund is exposed to alternative investment risk, foreign investment risk and smaller-company investment risk. Consult the Fund’s prospectus for additional information on these and other risks.
Please see footnotes on page 11.
| | | | | | |
| Performance highlights (unaudited) | | Multi-Asset Funds | | | 11 | |
Wells Fargo WealthBuilder Equity Fund (continued)
|
| Growth of $10,000 investment as of May 31, 20199 |
|
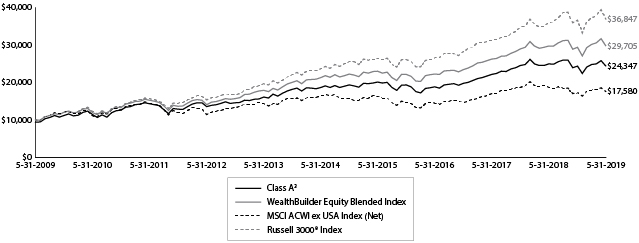 |
| ‡ | CFA® and Chartered Financial Analyst® are trademarks owned by CFA Institute. |
| * | Mr. Keshemberg became a portfolio manager of the Fund on October 26, 2018. |
| 1 | Reflects the expense ratios as stated in the most recent prospectuses, which include the impact of 0.50% of acquired fund fees and expenses. Net expenses from affiliated master portfolios are included in the acquired fund fees and expense amount. The expense ratios shown are subject to change and may differ from the annualized expense ratios shown in the financial highlights of this report, which do not include acquired fund fees and expenses. |
| 2 | The manager has contractually committed through September 30, 2019, to waive fees and/or reimburse expenses to the extent necessary to cap the expenses of each class after fee waivers at 0.75% for Class A, 1.50% for Class C, and 0.42% for Institutional Class. Brokerage commissions, stamp duty fees, interest, taxes, acquired fund fees and expenses (if any), net expenses from affiliated master portfolios, and extraordinary expenses are excluded from the expense cap. Prior to or after the commitment expiration date, the cap may be increased or the commitment to maintain the cap may be terminated only with the approval of the Board of Trustees. Without this cap, the Fund’s returns would have been lower. The expense ratio paid by an investor is the net expense ratio (the total annual fund operating expenses after fee waivers) as stated in the prospectuses. |
| 3 | Historical performance for Class A shares prior to their inception reflects the performance of Class C shares and includes the higher expenses applicable to Class C shares. If these expenses had not been included, returns for Class A shares would be higher. |
| 4 | Prior to February 13, 2017, historical performance shown for Class C shares reflects the performance of the Fund’s predecessor WealthBuilder Portfolio share class and does not reflect thefront-end sales load previously attributable to the predecessor class. The expenses for Class C shares and the predecessor share class are similar. |
| 5 | Historical performance shown for Institutional Class shares prior to their inception reflects the performance of Class A shares adjusted to reflect that Institutional Class shares do not have a sales load but not adjusted to reflect Institutional Class expenses. If these expenses had been included, returns for Institutional Class shares would be higher. |
| 6 | Source: Wells Fargo Funds Management, LLC. The WealthBuilder Equity Blended Index is composed 70% of the Russell 3000® Index and 30% of the MSCI ACWI ex USA Index (Net). You cannot invest directly in an index. |
| 7 | The Morgan Stanley Capital International (MSCI) All Country World Index (ACWI) ex USA Index (Net) is a free-float-adjusted market-capitalization- weighted index that is designed to measure the equity market performance of developed and emerging markets, excluding the U.S. Source: MSCI. MSCI makes no express or implied warranties or representations and shall have no liability whatsoever with respect to any MSCI data contained herein. The MSCI data may not be further redistributed or used as a basis for other indexes or any securities or financial products. This report is not approved, reviewed, or produced by MSCI. You cannot invest directly in an index. |
| 8 | The Russell 3000® Index measures the performance of the 3,000 largest U.S. companies based on total market capitalization, which represents approximately 98% of the investable U.S. equity market. You cannot invest directly in an index. |
| 9 | The chart compares the performance of Class A shares for the most recent ten years with the WealthBuilder Equity Blended Index, the MSCI ACWI ex USA Index (Net), and the Russell 3000® Index. The chart assumes a hypothetical $10,000 investment and reflects all operating expenses and assumes the maximum initial sales charge of 5.75%. |
| 10 | The ten largest holdings, excluding cash, cash equivalents and any money market funds, are calculated based on the value of the investments divided by total net assets of the Fund. Holdings are subject to change and may have changed since the date specified. |
| 11 | Effective allocation includes the effect of any tactical futures overlay that may be in place. Effective cash is comprised of the net impact of long and/or short futures contracts held as part of a dynamic risk management strategy. The amounts are subject to change and may have changed since the date specified. |
| | | | |
| 12 | | Multi-Asset Funds | | Performance highlights (unaudited) |
Wells Fargo WealthBuilder Equity Fund (continued)
MANAGER’S DISCUSSION
Fund highlights
| ∎ | | The Fund underperformed the WealthBuilder Equity Blended Index for the12-month period that ended May 31, 2019. The Fund is a fund-of-funds that invests in various affiliated mutual funds, unaffiliated mutual funds, and exchange-traded funds. |
| ∎ | | On a relative basis, the actively managed international investments underperformed their respective style-specific benchmarks. |
| ∎ | | The Put Replication Overlay (PRO), a futures overlay, added to performance through the period. |
Positive economic data ruled most of the period.
The12-month period that ended May 31, 2019, saw the U.S. economy continue on a positive trajectory, producing moderate average gross domestic product growth of 3.1% with a core inflation rate of 2.0%, while unemployment reached a low of 3.6%, the lowest level since 1969.
Over the last 12 months, the financial markets experienced more volatility than the favorable economic environment might have suggested. Looking back at the financial markets, we saw equities experience a significant decline during the fourth quarter of 2018, as concerns over a partial U.S. government shutdown, central bank tightening, trade tensions, and slowing economic growth shook investors’ confidence. The market volatility of the fourth quarter gave way to a first-quarter 2019 rebound where both equity and fixed-income markets rallied. The two markets seemed joined at the hip as the Federal Reserve’s (Fed’s) updated script signaled an easier policy path for the balance of 2019. Market participants were caught off balance by this evolution in the projected policy path, which has resulted in a broader opportunity set for sector rotation in equities and yield curve trades. We saw a return of volatility toward the end of the12-month period as concerns over trade (primarily with China and Mexico) caused concerns over global growth to weigh on investors’ minds.
| | | | |
| Ten largest holdings (%) as of May 31, 201910 | |
| |
Wells Fargo Disciplined Large Cap Portfolio | | | 25.26 | |
| |
Wells Fargo Factor Enhanced Large Cap Portfolio | | | 22.31 | |
| |
Wells Fargo Factor Enhanced International Portfolio | | | 13.60 | |
| |
Wells Fargo Factor Enhanced Emerging Markets Portfolio | | | 5.54 | |
| |
Dodge & Cox International Stock Fund | | | 4.92 | |
| |
Wells Fargo Endeavor Select Fund Institutional Class | | | 4.52 | |
| |
Wells Fargo Large Cap Growth Fund Class R6 | | | 4.47 | |
| |
Wells Fargo Factor Enhanced Small Cap Portfolio | | | 4.37 | |
| |
Wells Fargo Emerging Growth Portfolio | | | 3.48 | |
| |
Consumer Staples Select Sector SPDR Fund | | | 2.99 | |
Over the period, we made only one change to the Fund. In the fourth quarter of 2018, to reduce the overall equity risk in the Fund, we introduced a dedicated equity investment in the U.S. consumer staples sector.
The Fund’s holdings in underlying funds that employ various factor-based strategies performed well on a relative basis over the period. The Wells Fargo Factor Enhanced Large Cap Portfolio outperformed its market benchmark by 328 basis points (bps; 100 bps equal 1.00%), the Wells Fargo Factor Enhanced Small Cap Portfolio outperformed its market benchmark by 80 bps, the Wells Fargo Factor Enhanced International Portfolio outperformed its market benchmark by 172 bps, and the Wells Fargo Factor Enhanced Emerging Markets Portfolio outperformed its market benchmark by 43 bps.
The Fund also employs various actively managed equity strategies and a few of them also performed well over the period. The twolarge-cap U.S. growth mutual funds outperformed their market benchmarks by 146 bps and 586 bps, respectively, over the period.
Please see footnotes on page 11.
| | | | | | |
| Performance highlights (unaudited) | | Multi-Asset Funds | | | 13 | |
Wells Fargo WealthBuilder Equity Fund (continued)
| | | | | | | | |
| Allocations (%) as of May 31, 2019 | |
| | | Effective
allocation11 | | | Neutral
allocation | |
| | |
U.S. Large Cap Equities | | | 60 | | | | 60 | |
| | |
U.S. Small Cap Equities | | | 10 | | | | 10 | |
| | |
International Equities | | | 30 | | | | 30 | |
While the factor-enhanced international strategies did well on a relative basis, the remainder of the actively managed international equity mutual funds held within the Fund did not, and this was the most significant detractor from performance over the period. Underperformance in the three international funds ranged from 205 bps to 966 bps.
On average, over the 12 months that ended May 31, 2019, the equity portion of the portfolio was hedged an average of 9.6%. The maximum daily hedge was 41.2% on December 12, 2018. The hedge detracted 115 bps from performance over the entire period.
Looking ahead, we are cautiously optimistic.
Our macroeconomic view is that growth will remain positive but it will be slower over the next 12 months than it was over the preceding 12 months. However, we still hold that absent an exogenous shock—likely an implemented shift in trade policy—a U.S. recession is unlikely in 2019. As always, that view could change with new data. We are concerned about growth prospects in Europe and in the rest of the world but are most concerned about the U.S. trade negotiations with major trading partners. Until the trade negotiations move toward détente and more certainty builds to invoke more aggressive business planning resulting in further growth, we are taking a bit more of a cautious approach to the markets and have started to reduce some risks in the portfolios. Like the Fed, we remain very data dependent and acknowledge that while the U.S. economy may be softening, the levels of growth remain robust and 2019 should remain a target-rich environment for investors.
Please see footnotes on page 11.
| | | | |
| 14 | | Multi-Asset Funds | | Performance highlights (unaudited) |
Wells Fargo WealthBuilder Growth Allocation Fund
Investment objective
The Fund seeks capital appreciation with a secondary emphasis on current income.
Manager
Wells Fargo Funds Management, LLC
Subadviser
Wells Capital Management Incorporated
Portfolio managers
Kandarp R. Acharya, CFA®‡, FRM
Christian L. Chan, CFA®‡
Travis L. Keshemberg, CFA®‡*, CIPM, FRM
Average annual total returns (%) as of May 31, 2019
| | | | | | | | | | | | | | | | | | | | | | | | | | | | | | | | | | |
| | | | | Including sales charge | | | Excluding sales charge | | | Expense ratios1 (%) | |
| | | Inception date | | 1 year | | | 5 year | | | 10 year | | | 1 year | | | 5 year | | | 10 year | | | Gross | | | Net2 | |
| | | | | | | | | |
| Class A (WGAFX)3 | | 2-10-2017 | | | -6.11 | | | | 3.64 | | | | 8.58 | | | | -0.38 | | | | 4.87 | | | | 9.22 | | | | 1.27 | | | | 1.26 | |
| | | | | | | | | |
| Class C (WGCFX)4 | | 9-30-2004 | | | -2.12 | | | | 4.52 | | | | 9.04 | | | | -1.12 | | | | 4.52 | | | | 9.04 | | | | 2.02 | | | | 2.01 | |
| | | | | | | | | |
| Institutional Class (WGAYX)5 | | 7-31-2018 | | | – | | | | – | | | | – | | | | -0.23 | | | | 4.90 | | | | 9.24 | | | | 0.94 | | | | 0.93 | |
| | | | | | | | | |
| WealthBuilder Growth Allocation Blended Index6 | | – | | | – | | | | – | | | | – | | | | 1.38 | | | | 6.15 | | | | 10.09 | | | | – | | | | – | |
| | | | | | | | | |
| Bloomberg Barclays U.S. Aggregate Bond Index7 | | – | | | – | | | | – | | | | – | | | | 6.40 | | | | 2.70 | | | | 3.83 | | | | – | | | | – | |
| | | | | | | | | |
| MSCI ACWI ex USA Index (Net)8 | | – | | | – | | | | – | | | | – | | | | -6.26 | | | | 1.31 | | | | 5.80 | | | | – | | | | – | |
| | | | | | | | | |
| Russell 3000® Index9 | | – | | | – | | | | – | | | | – | | | | 2.50 | | | | 9.25 | | | | 13.93 | | | | – | | | | – | |
Figures quoted represent past performance, which is no guarantee of future results, and do not reflect taxes that a shareholder may pay on fund distributions or the redemption of fund shares. Investment return and principal value of an investment will fluctuate so that an investor’s shares, when redeemed, may be worth more or less than their original cost. Performance shown without sales charges would be lower if sales charges were reflected. Current performance may be lower or higher than the performance data quoted, which assumes the reinvestment of dividends and capital gains. Currentmonth-end performance is available on the Fund’s website,wfam.com.
Index returns do not include transaction costs associated with buying and selling securities, any mutual fund fees or expenses, or any taxes. It is not possible to invest directly in an index.
For Class A shares, the maximumfront-end sales charge is 5.75%. For Class C shares, the maximum contingent deferred sales charge is 1.00%. Performance including a contingent deferred sales charge assumes the sales charge for the corresponding time period. Institutional Class shares are sold without afront-end sales charge or contingent deferred sales charge.
Balanced funds may invest in stocks and bonds. Stock values fluctuate in response to the activities of individual companies and general market and economic conditions. Bond values fluctuate in response to the financial condition of individual issuers, general market and economic conditions, and changes in interest rates. Changes in market conditions and government policies may lead to periods of heightened volatility in the bond market and reduced liquidity for certain bonds held by the Fund. In general, when interest rates rise, bond values fall and investors may lose principal value. Interest rate changes and their impact on the Fund and its share price can be sudden and unpredictable. The use of derivatives may reduce returns and/or increase volatility. The Fund will indirectly be exposed to all of the risks of an investment in the underlying funds and will indirectly bear expenses of the underlying funds. Certain investment strategies tend to increase the total risk of an investment (relative to the broader market). The Fund is exposed to alternative investment risk, foreign investment risk, high-yield securities risk, mortgage- and asset-backed securities risk, and smaller-company investment risk. Consult the Fund’s prospectus for additional information on these and other risks.
Please see footnotes on page 15.
| | | | | | |
| Performance highlights (unaudited) | | Multi-Asset Funds | | | 15 | |
Wells Fargo WealthBuilder Growth Allocation Fund (continued)
|
| Growth of $10,000 investment as of May 31, 201910 |
|
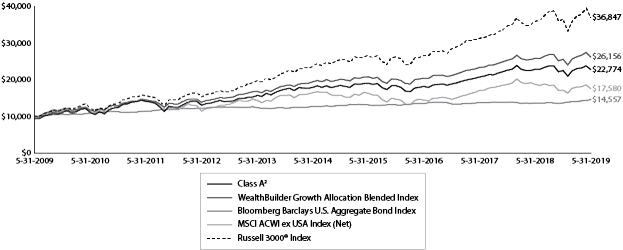 |
| ‡ | CFA® and Chartered Financial Analyst® are trademarks owned by CFA Institute. |
| * | Mr. Keshemberg became a portfolio manager of the Fund on October 26, 2018. |
| 1 | Reflects the expense ratios as stated in the most recent prospectuses, which include the impact of 0.51% of acquired fund fees and expenses. Net expenses from affiliated master portfolios are included in the acquired fund fees and expense amount. The expense ratios shown are subject to change and may differ from the annualized expense ratios shown in the financial highlights of this report, which do not include acquired fund fees and expenses. |
| 2 | The manager has contractually committed through September 30, 2019, to waive fees and/or reimburse expenses to the extent necessary to cap the expenses of each class after fee waivers at 0.75% for Class A, 1.50% for Class C, and 0.42% for Institutional Class. Brokerage commissions, stamp duty fees, interest, taxes, acquired fund fees and expenses (if any), net expenses from affiliated master portfolios, and extraordinary expenses are excluded from the expense cap. Prior to or after the commitment expiration date, the cap may be increased or the commitment to maintain the cap may be terminated only with the approval of the Board of Trustees. Without this cap, the Fund’s returns would have been lower. The expense ratio paid by an investor is the net expense ratio (the total annual fund operating expenses after fee waivers) as stated in the prospectuses. |
| 3 | Historical performance for Class A shares prior to their inception reflects the performance of Class C shares and includes the higher expenses applicable to Class C shares. If these expenses had not been included, returns for Class A shares would be higher. |
| 4 | Prior to February 13, 2017, historical performance shown for Class C shares reflects the performance of the Fund’s predecessor WealthBuilder Portfolio share class and does not reflect thefront-end sales load previously attributable to the predecessor class. The expenses for Class C shares and the predecessor share class are similar. |
| 5 | Historical performance shown for Institutional Class shares prior to their inception reflects the performance of Class A shares adjusted to reflect that Institutional Class shares do not have a sales load but not adjusted to reflect Institutional Class expenses. If these expenses had been included, returns for Institutional Class shares would be higher. |
| 6 | Source: Wells Fargo Funds Management, LLC. The WealthBuilder Growth Allocation Blended Index is composed 56% of the Russell 3000® Index, 24% of the MSCI ACWI ex USA Index (Net), and 20% of the Bloomberg Barclays U.S. Aggregate Bond Index. You cannot invest directly in an index. |
| 7 | The Bloomberg Barclays U.S. Aggregate Bond Index is a broad-based benchmark that measures the investment-grade, U.S. dollar–denominated, fixed-rate taxable bond market, including Treasuries, government-related and corporate securities, mortgage-backed securities (agency fixed-rate and hybrid adjustable rate mortgage pass-throughs), asset-backed securities, and commercial mortgage-backed securities. You cannot invest directly in an index. |
| 8 | The Morgan Stanley Capital International (MSCI) All Country World Index (ACWI) ex USA Index (Net) is a free-float-adjusted market-capitalization-weighted index that is designed to measure the equity market performance of developed and emerging markets, excluding the U.S. Source: MSCI. MSCI makes no express or implied warranties or representations and shall have no liability whatsoever with respect to any MSCI data contained herein. The MSCI data may not be further redistributed or used as a basis for other indexes or any securities or financial products. This report is not approved, reviewed, or produced by MSCI. You cannot invest directly in an index. |
| 9 | The Russell 3000® Index measures the performance of the 3,000 largest U.S. companies based on total market capitalization, which represents approximately 98% of the investable U.S. equity market. You cannot invest directly in an index. |
| 10 | The chart compares the performance of Class A shares for the most recent ten years with the WealthBuilder Growth Allocation Blended Index, the Bloomberg Barclays U.S. Aggregate Bond Index, the MSCI ACWI ex USA Index (Net), and the Russell 3000® Index. The chart assumes a hypothetical $10,000 investment and reflects all operating expenses and assumes the maximum initial sales charge of 5.75%. |
| 11 | The ten largest holdings, excluding cash, cash equivalents and any money market funds, are calculated based on the value of the investments divided by total net assets of the Fund. Holdings are subject to change and may have changed since the date specified. |
| 12 | Effective allocation includes the effect of any tactical futures overlay that may be in place. Effective cash is comprised of the net impact of long and/or short futures contracts held as part of a dynamic risk management strategy. The amounts are subject to change and may have changed since the date specified. |
| | | | |
| 16 | | Multi-Asset Funds | | Performance highlights (unaudited) |
Wells Fargo WealthBuilder Growth Allocation Fund (continued)
MANAGER’S DISCUSSION
Fund highlights
| ∎ | | The Fund underperformed the WealthBuilder Growth Allocation Blended Index for the12-month period that ended May 31, 2019. The Fund is a fund-of-funds that invests in various affiliated mutual funds, unaffiliated mutual funds, and exchange-traded funds. |
| ∎ | | On a relative basis, the actively managed international investments underperformed their respective style-specific benchmarks. |
| ∎ | | The tactical asset allocation (TAA) overlay, a futures overlay, added to performance through the period. |
Positive economic data ruled most of the period.
The12-month period that ended May 31, 2019, saw the U.S. economy continue on a positive trajectory, producing moderate average gross domestic product growth of 3.1% with a core inflation rate of 2.0%, while unemployment reached a low of 3.6%, the lowest level since 1969.
Over the last 12 months, the financial markets experienced more volatility than the favorable economic environment might have suggested. Looking back at the financial markets, we saw equities experience a significant decline during the fourth quarter of 2018, as concerns over a partial U.S. government shutdown, central bank tightening, trade tensions, and slowing economic growth shook investors’ confidence. The market volatility of the fourth quarter gave way to a first-quarter 2019 rebound where both equity and fixed-income markets rallied. The two markets seemed joined at the hip as the Federal Reserve’s (the Fed’s) updated script signaled an easier policy path for the balance of 2019. Market participants were caught off balance by this evolution in the projected policy path, which has resulted in a broader opportunity set for sector rotation in equities and yield curve trades. We saw a return of volatility toward the end of the12-month period as concerns over trade (primarily with China and Mexico) caused concerns over global growth to weigh on investors’ minds.
| | | | |
| Ten largest holdings (%) as of May 31, 201911 | |
| |
Wells Fargo Disciplined Large Cap Portfolio | | | 20.10 | |
| |
Wells Fargo Factor Enhanced Large Cap Portfolio | | | 17.79 | |
| |
Wells Fargo Factor Enhanced International Portfolio | | | 10.89 | |
| |
Wells Fargo Core Bond Portfolio | | | 4.86 | |
| |
Wells Fargo Factor Enhanced Emerging Markets Portfolio | | | 4.46 | |
| |
Dodge & Cox International Stock Fund | | | 3.95 | |
| |
Wells Fargo Endeavor Select Fund Institutional Class | | | 3.63 | |
| |
Wells Fargo Large Cap Growth Fund Class R6 | | | 3.57 | |
| |
Wells Fargo Factor Enhanced Small Cap Portfolio | | | 3.48 | |
| |
Wells Fargo Emerging Growth Portfolio | | | 2.78 | |
Over the period, we made relatively few changes to the underlying mutual funds in which the Fund invests. The most significant change was the addition of a flexible-mandate fixed-income fund with the ability to shift assets among different fixed-income sectors such as high-yield, asset-backed, and foreign securities that the portfolio managers find attractive. In the fourth quarter of 2018, we reduced our direct high-yield exposure to fund this new investment. Also in the fourth quarter of 2018, to reduce the overall equity risk in the Fund, we introduced a dedicated equity investment in the U.S. consumer staples sector.
At the start of the period, the Fund’s targeted TAA overlay was 5.00% long in the S&P 500 futures contract. Due to volatility concerns, in early September, 2018, we reduced the position by 2.50%. In October, 2018, we added a total of 2.50%, bringing the position back to 5.00% long. During early November, 2018, we covered 1.25%. In early December, 2018, we added 2.50%, bringing the position to 6.25%. As January, 2019, drew to a close, we covered 2.50%. In early February, 2019, we covered the remaining 3.75% and exited the position. With respect to the 10-year Treasury contract activity, we started the period short 2.50% and covered the position in early October, 2018. In mid-December, 2018, we established a new 2.50% short position and exited it in early March, 2019.
Please see footnotes on page 15.
| | | | | | |
| Performance highlights (unaudited) | | Multi-Asset Funds | | | 17 | |
Wells Fargo WealthBuilder Growth Allocation Fund (continued)
| | | | | | | | |
| Allocations (%) as of May 31, 2019 | |
| | | Effective
allocation12 | | | Neutral
allocation | |
| | |
Alternative Investments | | | 5 | | | | 5 | |
| | |
Bonds | | | 15 | | | | 15 | |
| | |
Stocks | | | 75 | | | | 80 | |
| | |
Effective Cash | | | 5 | | | | 0 | |
Over the entire period, TAA activity contributed about 47 basis points (bps; 100 bps equal 1.00%) to performance.
The Fund’s holdings in underlying funds that employ various factor-based strategies performed well on a relative basis over the period. Wells Fargo Factor Enhanced Large Cap Portfolio outperformed its market benchmark by 328 bps, the Wells Fargo Factor Enhanced Small Cap Portfolio outperformed its market benchmark
by 80 bps, the Wells Fargo Factor Enhanced International Portfolio outperformed its market benchmark by 172 bps, and the Wells Fargo Factor Enhanced Emerging Markets Portfolio outperformed its market benchmark by 43 bps.
While the factor-enhanced international strategies did well on a relative basis, the remainder of the actively managed international equity mutual funds held within the Fund did not, and this was the most significant detractor from performance over the period. Underperformance in the three international funds ranged from 205 bps to 966 bps.
On average, over the 12 months that ended May 31, 2019, the equity portion of the portfolio was hedged an average of 9.4%. The maximum daily hedge was 36.1% on December 12, 2018. The hedge detracted 67 bps from performance over the entire period.
Looking ahead, we are cautiously optimistic.
Our macroeconomic view is that growth will remain positive but it will be slower over the next 12 months than it was over the preceding 12 months. However, we still hold that absent an exogenous shock—likely an implemented shift in trade policy—a U.S. recession is unlikely in 2019. As always, that view could change with new data. We are concerned about growth prospects in Europe and in the rest of the world but are most concerned about the U.S. trade negotiations with major trading partners. Until the trade negotiations move toward détente and more certainty builds to invoke more aggressive business planning resulting in further growth, we are taking a bit more of a cautious approach to the markets and have started to reduce some risks in the portfolios. Like the Fed, we remain very data dependent and acknowledge that while the U.S. economy may be softening, the levels of growth remain robust and 2019 should remain a target-rich environment for investors.
Please see footnotes on page 15.
| | | | |
| 18 | | Multi-Asset Funds | | Performance highlights (unaudited) |
Wells Fargo WealthBuilder Growth Balanced Fund
Investment objective
The Fund seeks a combination of capital appreciation and current income.
Manager
Wells Fargo Funds Management, LLC
Subadviser
Wells Capital Management Incorporated
Portfolio managers
Kandarp R. Acharya, CFA®‡, FRM
Christian L. Chan, CFA®‡
Travis L. Keshemberg, CFA®‡*, CIPM, FRM
Average annual total returns (%) as of May 31, 2019
| | | | | | | | | | | | | | | | | | | | | | | | | | | | | | | | | | |
| | | | | Including sales charge | | | Excluding sales charge | | | Expense ratios1 (%) | |
| | | Inception date | | 1 year | | | 5 year | | | 10 year | | | 1 year | | | 5 year | | | 10 year | | | Gross | | | Net2 | |
| | | | | | | | | |
| Class A (WGBAX)3 | | 2-10-2017 | | | -4.79 | | | | 2.93 | | | | 7.58 | | | | 1.02 | | | | 4.16 | | | | 8.22 | | | | 1.23 | | | | 1.23 | |
| | | | | | | | | |
| Class C (WGBFX)4 | | 9-30-2004 | | | -0.69 | | | | 3.80 | | | | 8.04 | | | | 0.31 | | | | 3.80 | | | | 8.04 | | | | 1.98 | | | | 1.98 | |
| | | | | | | | | |
| Institutional Class (WGBIX)5 | | 7-31-2018 | | | – | | | | – | | | | – | | | | 1.25 | | | | 4.20 | | | | 8.25 | | | | 0.89 | | | | 0.89 | |
| | | | | | | | | |
| WealthBuilder Growth Balanced Blended Index6 | | – | | | – | | | | – | | | | – | | | | 2.80 | | | | 5.37 | | | | 8.62 | | | | – | | | | – | |
| | | | | | | | | |
| Bloomberg Barclays U.S. Aggregate Bond Index7 | | – | | | – | | | | – | | | | – | | | | 6.40 | | | | 2.70 | | | | 3.83 | | | | – | | | | – | |
| | | | | | | | | |
| MSCI ACWI ex USA Index (Net)8 | | – | | | – | | | | – | | | | – | | | | -6.26 | | | | 1.31 | | | | 5.80 | | | | – | | | | – | |
| | | | | | | | | |
| Russell 3000® Index9 | | – | | | – | | | | – | | | | – | | | | 2.50 | | | | 9.25 | | | | 13.93 | | | | – | | | | – | |
Figures quoted represent past performance, which is no guarantee of future results,and do not reflect taxes that a shareholder may pay on fund distributions or the redemption of fund shares. Investment return and principal value of an investment will fluctuate so that an investor’s shares, when redeemed, may be worth more or less than their original cost. Performance shown without sales charges would be lower if sales charges were reflected. Current performance may be lower or higher than the performance data quoted, which assumes the reinvestment of dividends and capital gains. Currentmonth-end performance is available on the Fund’s website,wfam.com.
Index returns do not include transaction costs associated with buying and selling securities, any mutual fund fees or expenses, or any taxes. It is not possible to invest directly in an index.
For Class A shares, the maximumfront-end sales charge is 5.75%. For Class C shares, the maximum contingent deferred sales charge is 1.00%. Performance including a contingent deferred sales charge assumes the sales charge for the corresponding time period. Institutional Class shares are sold without afront-end sales charge or contingent deferred sales charge.
Balanced funds may invest in stocks and bonds. Stock values fluctuate in response to the activities of individual companies and general market and economic conditions. Bond values fluctuate in response to the financial condition of individual issuers, general market and economic conditions, and changes in interest rates. Changes in market conditions and government policies may lead to periods of heightened volatility in the bond market and reduced liquidity for certain bonds held by the Fund. In general, when interest rates rise, bond values fall and investors may lose principal value. Interest rate changes and their impact on the Fund and its share price can be sudden and unpredictable. The use of derivatives may reduce returns and/or increase volatility. The Fund will indirectly be exposed to all of the risks of an investment in the underlying funds and will indirectly bear expenses of the underlying funds. Certain investment strategies tend to increase the total risk of an investment (relative to the broader market). The Fund is exposed to alternative investment risk, foreign investment risk, high-yield securities risk, mortgage- and asset-backed securities risk, and smaller-company investment risk. Consult the Fund’s prospectus for additional information on these and other risks.
Please see footnotes on page 19.
| | | | | | |
| Performance highlights (unaudited) | | Multi-Asset Funds | | | 19 | |
Wells Fargo WealthBuilder Growth Balanced Fund (continued)
|
| Growth of $10,000 investment as of May 31, 201910 |
|
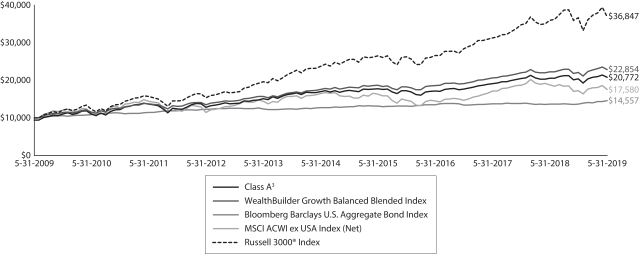 |
| ‡ | CFA® and Chartered Financial Analyst® are trademarks owned by CFA Institute. |
| * | Mr. Keshemberg became a portfolio manager of the Fund on October 26, 2018. |
| 1 | Reflects the expense ratios as stated in the most recent prospectuses, which include the impact of 0.48% of acquired fund fees and expenses. Net expenses from affiliated master portfolios are included in the acquired fund fees and expense amount. The expense ratios shown are subject to change and may differ from the annualized expense ratios shown in the financial highlights of this report, which do not include acquired fund fees and expenses. |
| 2 | The manager has contractually committed through September 30, 2019, to waive fees and/or reimburse expenses to the extent necessary to cap the expenses of each class after fee waivers at 0.75% for Class A, 1.50% for Class C, and 0.42% for Institutional Class. Brokerage commissions, stamp duty fees, interest, taxes, acquired fund fees and expenses (if any), net expenses from affiliated master portfolios, and extraordinary expenses are excluded from the expense cap. Prior to or after the commitment expiration date, the cap may be increased or the commitment to maintain the cap may be terminated only with the approval of the Board of Trustees. Without this cap, the Fund’s returns would have been lower. The expense ratio paid by an investor is the net expense ratio (the total annual fund operating expenses after fee waivers) as stated in the prospectuses. |
| 3 | Historical performance for Class A shares prior to their inception reflects the performance of Class C shares and includes the higher expenses applicable to Class C shares. If these expenses had not been included, returns for Class A shares would be higher. |
| 4 | Prior to February 13, 2017, historical performance shown for Class C shares reflects the performance of the Fund’s predecessor WealthBuilder Portfolio share class and does not reflect thefront-end sales load previously attributable to the predecessor class. The expenses for Class C shares and the predecessor share class are similar. |
| 5 | Historical performance shown for Institutional Class shares prior to their inception reflects the performance of Class A shares adjusted to reflect that Institutional Class shares do not have a sales load but not adjusted to reflect Institutional Class expenses. If these expenses had been included, returns for Institutional Class shares would be higher. |
| 6 | Source: Wells Fargo Funds Management, LLC. The WealthBuilder Growth Balanced Blended Index is composed 42% of the Russell 3000® Index, 40% of the Bloomberg Barclays U.S. Aggregate Bond Index, and 18% of the MSCI ACWI ex USA Index (Net). You cannot invest directly in an index. |
| 7 | The Bloomberg Barclays U.S. Aggregate Bond Index is a broad-based benchmark that measures the investment-grade, U.S. dollar–denominated, fixed-rate taxable bond market, including Treasuries, government-related and corporate securities, mortgage-backed securities (agency fixed-rate and hybrid adjustable rate mortgage pass-throughs), asset-backed securities, and commercial mortgage-backed securities. You cannot invest directly in an index. |
| 8 | The Morgan Stanley Capital International (MSCI) All Country World Index (ACWI) ex USA Index (Net) is a free-float-adjusted market-capitalization- weighted index that is designed to measure the equity market performance of developed and emerging markets, excluding the U.S. Source: MSCI. MSCI makes no express or implied warranties or representations and shall have no liability whatsoever with respect to any MSCI data contained herein. The MSCI data may not be further redistributed or used as a basis for other indexes or any securities or financial products. This report is not approved, reviewed, or produced by MSCI. You cannot invest directly in an index. |
| 9 | The Russell 3000® Index measures the performance of the 3,000 largest U.S. companies based on total market capitalization, which represents approximately 98% of the investable U.S. equity market. You cannot invest directly in an index. |
| 10 | The chart compares the performance of Class A shares for the most recent ten years with the WealthBuilder Growth Balanced Blended Index, the Bloomberg Barclays U.S. Aggregate Bond Index, the MSCI ACWI ex USA (Net), and the Russell 3000® Index. The chart assumes a hypothetical $10,000 investment and reflects all operating expenses and assumes the maximum initial sales charge of 5.75%. |
| 11 | The ten largest holdings, excluding cash, cash equivalents and any money market funds, are calculated based on the value of the investments divided by total net assets of the Fund. Holdings are subject to change and may have changed since the date specified. |
| 12 | Effective allocation includes the effect of any tactical futures overlay that may be in place. Effective cash is comprised of the net impact of long and/or short futures contracts held as part of a dynamic risk management strategy. The amounts are subject to change and may have changed since the date specified. |
| | | | |
| 20 | | Multi-Asset Funds | | Performance highlights (unaudited) |
Wells Fargo WealthBuilder Growth Balanced Fund (continued)
MANAGER’S DISCUSSION
Fund highlights
| ∎ | | The Fund underperformed the WealthBuilder Growth Balanced Blended Index for the12-month period that ended May 31, 2019. The Fund is a fund-of-funds that invests in various affiliated mutual funds, unaffiliated mutual funds, and exchange-traded funds. |
| ∎ | | On a relative basis, the actively managed international investments underperformed their respective style-specific benchmarks. |
| ∎ | | The tactical asset allocation (TAA) overlay, a futures overlay, added to performance through the period. |
Positive economic data ruled most of the period.
The12-month period that ended May 31, 2019, saw the U.S. economy continue on a positive trajectory, producing moderate average gross domestic product growth of 3.1% with a core inflation rate of 2.0%, while unemployment reached a low of 3.6%, the lowest level since 1969.
Over the last 12 months, the financial markets experienced more volatility than the favorable economic environment might have suggested. Looking back at the financial markets, we saw equities experience a significant decline during the fourth quarter of 2018, as concerns over a partial U.S. government shutdown, central bank tightening, trade tensions, and slowing economic growth shook investors’ confidence. The market volatility of the fourth quarter gave way to a first-quarter 2019 rebound where both equity and fixed-income markets rallied. The two markets seemed joined at the hip as the Federal Reserve’s (Fed’s) updated script signaled an easier policy path for the balance of 2019. Market participants were caught off balance by this evolution in the projected policy path, which has resulted in a broader opportunity set for sector rotation in equities and yield curve trades. We saw a return of volatility toward the end of the12-month period as concerns over trade (primarily with China and Mexico) caused concerns over global growth to weigh on investors’ minds.
| | | | |
| Ten largest holdings (%) as of May 31, 201911 | |
| |
Wells Fargo Disciplined Large Cap Portfolio | | | 14.93 | |
| |
Wells Fargo Factor Enhanced Large Cap Portfolio | | | 13.30 | |
| |
Wells Fargo Core Bond Portfolio | | | 11.39 | |
| |
Wells Fargo Factor Enhanced International Portfolio | | | 8.14 | |
| |
Wells Fargo Strategic Income Fund Institutional Class | | | 6.37 | |
| |
Wells Fargo Bloomberg Barclays US Aggregateex-Corporate Portfolio | | | 5.34 | |
| |
Vanguard Intermediate-Term Corporate Bond ETF | | | 3.56 | |
| |
Wells Fargo Factor Enhanced Emerging Markets Portfolio | | | 3.27 | |
| |
Vanguard Short-Term Bond ETF | | | 3.20 | |
| |
Dodge & Cox International Stock Fund | | | 2.91 | |
Over the period, we made relatively few changes to the underlying mutual funds in which the Fund invests. The most significant change was the addition of a flexible-mandate fixed-income fund with the ability to shift assets among different fixed-income sectors such as high-yield, asset-backed, and foreign securities that the portfolio managers find attractive. In the fourth quarter of 2018, we reduced our direct high-yield exposure to fund this new investment. Also in the fourth quarter of 2018, to reduce the overall equity risk in the Fund, we introduced a dedicated equity investment in the U.S. consumer staples sector.
At the start of the period, the Fund’s targeted TAA overlay was 5.00% long in the S&P 500 futures contract. Due to volatility concerns, in early September, 2018, we reduced
the position by 2.50%. In October, 2018, we added a total of 2.50%, bringing the position back to 5.00% long. During early November, 2018, we covered 1.25%. In early December, 2018, we added 2.50%, bringing the position to 6.25%. As January, 2019, drew to a close, we covered 2.50%. In early February, 2019, we covered the remaining 3.75% and exited the position. With respect to the 10-year Treasury contract activity, we started the period short 2.50% and covered the position in early October, 2018. In mid-December, 2018, we established a new 2.50% short position and exited it in early March, 2019.
Please see footnotes on page 19.
| | | | | | |
| Performance highlights (unaudited) | | Multi-Asset Funds | | | 21 | |
Wells Fargo WealthBuilder Growth Balanced Fund (continued)
| | | | | | | | |
| Allocations (%) as of May 31, 2019 | |
| | | Effective
allocation12 | | | Neutral
allocation | |
| | |
Alternative Investments | | | 5 | | | | 5 | |
| | |
Bonds | | | 34 | | | | 35 | |
| | |
Stocks | | | 56 | | | | 60 | |
| | |
Effective Cash | | | 5 | | | | 0 | |
Over the entire period, TAA activity contributed about 47 basis points (bps; 100 bps equal 1.00%) to performance.
The Fund’s holdings in underlying funds that employ various factor-based strategies performed well on a relative basis over the period. Wells Fargo Factor Enhanced Large Cap Portfolio outperformed its market benchmark by 328 bps, the Wells Fargo Factor Enhanced Small Cap Portfolio outperformed its market benchmark
by 80 bps, the Wells Fargo Factor Enhanced International Portfolio outperformed its market benchmark by 172 bps, and the Wells Fargo Factor Enhanced Emerging Markets Portfolio outperformed its market benchmark by 43 bps.
While the factor-enhanced international strategies did well on a relative basis, the remainder of the actively managed international equity mutual funds held within the Fund did not, and this was the most significant detractor from performance over the period. Underperformance in the three international funds ranged from 205 bps to 966 bps.
On average, over the 12 months that ended May 31, 2019, the equity portion of the portfolio was hedged an average of 9.4%. The maximum daily hedge was 36.1% on December 12, 2018. The hedge detracted 48 bps from performance over the entire period.
Looking ahead, we are cautiously optimistic.
Our macroeconomic view is that growth will remain positive but it will be slower over the next 12 months than it was over the preceding 12 months. However, we still hold that absent an exogenous shock—likely an implemented shift in trade policy—a U.S. recession is unlikely in 2019. As always, that view could change with new data. We are concerned about growth prospects in Europe and in the rest of the world but are most concerned about the U.S. trade negotiations with major trading partners. Until the trade negotiations move toward détente and more certainty builds to invoke more aggressive business planning resulting in further growth, we are taking a bit more of a cautious approach to the markets and have started to reduce some risks in the portfolios. Like the Fed, we remain very data dependent and acknowledge that while the U.S. economy may be softening, the levels of growth remain robust and 2019 should remain a target-rich environment for investors.
Please see footnotes on page 19.
| | | | |
| 22 | | Multi-Asset Funds | | Performance highlights (unaudited) |
Wells Fargo WealthBuilder Moderate Balanced Fund
Investment objective
The Fund seeks a combination of current income and capital appreciation.
Manager
Wells Fargo Funds Management, LLC
Subadviser
Wells Capital Management Incorporated
Portfolio managers
Kandarp R. Acharya, CFA®‡, FRM
Christian L. Chan, CFA®‡
Travis L. Keshemberg, CFA®‡*, CIPM, FRM
Average annual total returns (%) as of May 31, 2019
| | | | | | | | | | | | | | | | | | | | | | | | | | | | | | | | | | |
| | | | | Including sales charge | | | Excluding sales charge | | | Expense ratios1 (%) | |
| | | Inception date | | 1 year | | | 5 year | | | 10 year | | | 1 year | | | 5 year | | | 10 year | | | Gross | | | Net2 | |
| | | | | | | | | |
| Class A (WMBGX)3 | | 2-10-2017 | | | -3.49 | | | | 2.08 | | | | 5.49 | | | | 2.40 | | | | 3.29 | | | | 6.12 | | | | 1.22 | | | | 1.22 | |
| | | | | | | | | |
| Class C (WMBFX) | | 9-30-2004 | | | 0.58 | | | | 2.92 | | | | 5.93 | | | | 1.58 | | | | 2.92 | | | | 5.93 | | | | 1.97 | | | | 1.97 | |
| | | | | | | | | |
| Institutional Class (WMBZX)4 | | 7-31-2018 | | | – | | | | – | | | | – | | | | 2.76 | | | | 3.37 | | | | 6.15 | | | | 0.88 | | | | 0.88 | |
| | | | | | | | | |
| WealthBuilder Moderate Balanced Blended Index5 | | – | | | – | | | | – | | | | – | | | | 4.11 | | | | 4.54 | | | | 7.08 | | | | – | | | | – | |
| | | | | | | | | |
| Bloomberg Barclays U.S. Aggregate Bond Index6 | | – | | | – | | | | – | | | | – | | | | 6.40 | | | | 2.70 | | | | 3.83 | | | | – | | | | – | |
| | | | | | | | | |
| MSCI ACWI ex USA Index (Net)7 | | – | | | – | | | | – | | | | – | | | | -6.26 | | | | 1.31 | | | | 5.80 | | | | – | | | | – | |
| | | | | | | | | |
| Russell 3000® Index8 | | – | | | – | | | | – | | | | – | | | | 2.50 | | | | 9.25 | | | | 13.93 | | | | – | | | | – | |
Figures quoted represent past performance, which is no guarantee of future results, and do not reflect taxes that a shareholder may pay on fund distributions or the redemption of fund shares. Investment return and principal value of an investment will fluctuate so that an investor’s shares, when redeemed, may be worth more or less than their original cost. Performance shown without sales charges would be lower if sales charges were reflected. Current performance may be lower or higher than the performance data quoted, which assumes the reinvestment of dividends and capital gains. Currentmonth-end performance is available on the Fund’s website,wfam.com.
Index returns do not include transaction costs associated with buying and selling securities, any mutual fund fees or expenses, or any taxes. It is not possible to invest directly in an index.
For Class A shares, the maximumfront-end sales charge is 5.75%. For Class C shares, the maximum contingent deferred sales charge is 1.00%. Performance including a contingent deferred sales charge assumes the sales charge for the corresponding time period. Institutional Class shares are sold without afront-end sales charge or contingent deferred sales charge.
Balanced funds may invest in stocks and bonds. Stock values fluctuate in response to the activities of individual companies and general market and economic conditions. Bond values fluctuate in response to the financial condition of individual issuers, general market and economic conditions, and changes in interest rates. Changes in market conditions and government policies may lead to periods of heightened volatility in the bond market and reduced liquidity for certain bonds held by the Fund. In general, when interest rates rise, bond values fall and investors may lose principal value. Interest-rate changes and their impact on the Fund and its share price can be sudden and unpredictable. The use of derivatives may reduce returns and/or increase volatility. The Fund will indirectly be exposed to all of the risks of an investment in the underlying funds and will indirectly bear expenses of the underlying funds. Certain investment strategies tend to increase the total risk of an investment (relative to the broader market). The Fund is exposed to alternative investment risk, foreign investment risk, high-yield securities risk,mortgage-and asset-backed securities risk, and smaller-company investment risk. Consult the Fund’s prospectus for additional information on these and other risks.
Please see footnotes on page 23.
| | | | | | |
| Performance highlights (unaudited) | | Multi-Asset Funds | | | 23 | |
Wells Fargo WealthBuilder Moderate Balanced Fund (continued)
|
| Growth of $10,000 investment as of May 31, 20199 |
|
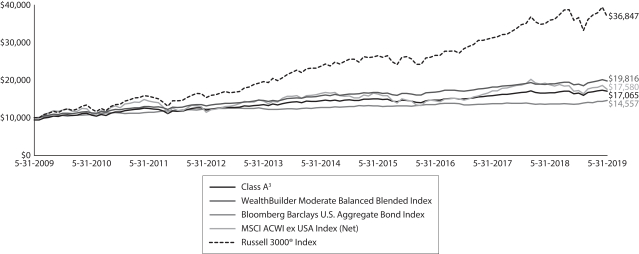 |
| ‡ | CFA® and Chartered Financial Analyst® are trademarks owned by CFA Institute. |
| * | Mr. Keshemberg became a portfolio manager of the Fund on October 26, 2018. |
| 1 | Reflects the expense ratios as stated in the most recent prospectuses, which include the impact of 0.47% of acquired fund fees and expenses. Net expenses from affiliated master portfolios are included in the acquired fund fees and expense amount. The expense ratios shown are subject to change and may differ from the annualized expense ratios shown in the financial highlights of this report, which do not include acquired fund fees and expenses. |
| 2 | The manager has contractually committed through September 30, 2019, to waive fees and/or reimburse expenses to the extent necessary to cap the expenses of each class after fee waivers at 0.75% for Class A, 1.50% for Class C, and 0.42% for Institutional Class. Brokerage commissions, stamp duty fees, interest, taxes, acquired fund fees and expenses (if any), net expenses from affiliated master portfolios, and extraordinary expenses are excluded from the expense cap. Prior to or after the commitment expiration date, the cap may be increased or the commitment to maintain the cap may be terminated only with the approval of the Board of Trustees. Without this cap, the Fund’s returns would have been lower. The expense ratio paid by an investor is the net expense ratio (the total annual fund operating expenses after fee waivers) as stated in the prospectuses. |
| 3 | Historical performance for Class A shares prior to their inception reflects the performance of Class C shares and includes the higher expenses applicable to Class C shares. If these expenses had not been included, returns for Class A shares would be higher. |
| 4 | Prior to February 13, 2017, historical performance shown for Class C shares reflects the performance of the Fund’s predecessor WealthBuilder Portfolio share class and does not reflect thefront-end sales load previously attributable to the predecessor class. The expenses for Class C shares and the predecessor share class are similar. |
| 5 | Source: Wells Fargo Funds Management, LLC. The WealthBuilder Moderate Balanced Blended Index is composed 60% of the Bloomberg Barclays U.S. Aggregate Bond Index, 28% of the Russell 3000® Index, and 12% of the MSCI ACWI ex USA Index (Net). You cannot invest directly in an index. |
| 6 | The Bloomberg Barclays U.S. Aggregate Bond Index is a broad-based benchmark that measures the investment-grade, U.S. dollar–denominated, fixed-rate taxable bond market, including Treasuries, government-related and corporate securities, mortgage-backed securities (agency fixed-rate and hybrid adjustable rate mortgage pass-throughs), asset-backed securities, and commercial mortgage-backed securities. You cannot invest directly in an index. |
| 7 | The Morgan Stanley Capital International (MSCI) All Country World Index (ACWI) ex USA Index (Net) is a free-float-adjusted market-capitalization- weighted index that is designed to measure the equity market performance of developed and emerging markets, excluding the U.S. Source: MSCI. MSCI makes no express or implied warranties or representations and shall have no liability whatsoever with respect to any MSCI data contained herein. The MSCI data may not be further redistributed or used as a basis for other indexes or any securities or financial products. This report is not approved, reviewed, or produced by MSCI. You cannot invest directly in an index. |
| 8 | The Russell 3000® Index measures the performance of the 3,000 largest U.S. companies based on total market capitalization, which represents approximately 98% of the investable U.S. equity market. You cannot invest directly in an index. |
| 9 | The chart compares the performance of Class A shares for the most recent ten years with the WealthBuilder Moderate Blended Blended Index, the Bloomberg Barclays U.S. Aggregate Bond Index, the MSCI ACWI ex USA Index (Net), and the Russell 3000® Index. The chart assumes a hypothetical $10,000 investment and reflects all operating expenses and assumes the maximum initial sales charge of 5.75%. |
| 10 | The ten largest holdings, excluding cash, cash equivalents and any money market funds, are calculated based on the value of the investments divided by total net assets of the Fund. Holdings are subject to change and may have changed since the date specified. |
| 11 | Effective allocation includes the effect of any tactical futures overlay that may be in place. Effective cash is comprised of the net impact of long and/or short futures contracts held as part of a dynamic risk management strategy. The amounts are subject to change and may have changed since the date specified. |
| | | | |
| 24 | | Multi-Asset Funds | | Performance highlights (unaudited) |
Wells Fargo WealthBuilder Moderate Balanced Fund (continued)
MANAGER’S DISCUSSION
Fund highlights
| ∎ | | The Fund underperformed the WealthBuilder Moderate Balanced Blended Index for the12-month period that ended May 31, 2019. The Fund is a fund-of-funds that invests in various affiliated mutual funds, unaffiliated mutual funds, and exchange-traded funds. |
| ∎ | | On a relative basis, the actively managed international investments underperformed their respective style-specific benchmarks. |
| ∎ | | The tactical asset allocation (TAA) overlay, a futures strategy, added to performance through the period. |
Positive economic data ruled most of the period.
The12-month period that ended May 31, 2019, saw the U.S. economy continue on a positive trajectory, producing moderate average gross domestic product growth of 3.1% with a core inflation rate of 2.0%, while unemployment reached a low of 3.6%, the lowest level since 1969.
Over the last 12 months, the financial markets experienced more volatility than the favorable economic environment might have suggested. Looking back at the financial markets, we saw equities experience a significant decline during the fourth quarter of 2018, as concerns over a partial U.S. government shutdown, central bank tightening, trade tensions, and slowing economic growth shook investors’ confidence. The market volatility of the fourth quarter of 2018 gave way to a first-quarter 2019 rebound where both equity and fixed-income markets rallied. The two markets seemed joined at the hip as the Federal Reserve’s (Fed’s) updated script signaled an easier policy path for the balance of 2019. Market participants were caught off balance by this evolution in the projected policy path, which has resulted in a broader opportunity set for sector rotation in equities and yield curve trades. We saw a return of volatility toward the end of the12-month period as concerns over trade (primarily with China and Mexico) caused concerns over global growth to weigh on investors’ minds.
Portfolio management addressed Fund allocations throughout the period.
Over the period, we made relatively few changes to the underlying mutual funds in which the Fund invests. The most significant change was the addition of a flexible mandate fixed-income fund with the ability to shift assets among different fixed-income sectors such as high-yield, asset-backed, and foreign securities that the portfolio managers find attractive. In the fourth quarter of 2018, we reduced our direct high-yield exposure to fund this new investment. Also in the fourth quarter of 2018, to reduce the overall equity risk in the Fund, we introduced a dedicated equity investment in the U.S. consumer staples sector.
At the start of the period, the Fund’s targeted TAA overlay was 5.00% long in the S&P 500 futures contract. Due to volatility concerns, in early September, 2018, we reduced the position by 2.50%. In October, 2018, we added a total of 2.50%, bringing the position back to 5.00% long. During early November, 2018, we covered 1.25%. In early December, 2018, we added 2.50%, bringing the position to 6.25%. As January, 2019, drew to a close, we covered 2.50%. In early February, 2019, we covered the remaining 3.75% and exited the position. With respect to the 10-year Treasury contract activity, we started the period short 2.50% and covered the position in early October, 2018. In mid-December, 2018, we established a new 2.50% short position and exited it in early March, 2019.
Please see footnotes on page 23.
| | | | | | |
| Performance highlights (unaudited) | | Multi-Asset Funds | | | 25 | |
Wells Fargo WealthBuilder Moderate Balanced Fund (continued)
| | | | |
| Ten largest holdings (%) as of May 31, 201910 | |
| |
Wells Fargo Core Bond Portfolio | | | 17.81 | |
| |
Wells Fargo Strategic Income Fund Institutional Class | | | 9.96 | |
| |
Wells Fargo Disciplined Large Cap Portfolio | | | 9.87 | |
| |
Wells Fargo Factor Enhanced Large Cap Portfolio | | | 8.81 | |
| |
Wells Fargo Bloomberg Barclays US Aggregateex-Corporate Portfolio | | | 8.36 | |
| |
Vanguard Intermediate-Term Corporate Bond ETF | | | 5.57 | |
| |
Wells Fargo Factor Enhanced International Portfolio | | | 5.39 | |
| |
Vanguard Short-Term Bond ETF | | | 5.00 | |
| |
Wells Fargo Real Return Portfolio | | | 3.34 | |
| |
Wells Fargo Factor Enhanced Emerging Markets Portfolio | | | 2.17 | |
| | | | | | | | |
| Allocations (%) as of May 31, 2019 | |
| | | Effective
allocation11 | | | Neutral
allocation | |
| | |
Alternative Investments | | | 5 | | | | 5 | |
| | |
Bonds | | | 54 | | | | 55 | |
| | |
Stocks | | | 35 | | | | 40 | |
| | |
Effective Cash | | | 6 | | | | 0 | |
Over the entire period, TAA activity contributed about 47 basis points (bps; 100 bps equal 1.00%) to performance.
The Fund’s holdings in underlying funds that employ various factor-based strategies performed well on a relative basis over the period. Wells Fargo Factor Enhanced Large Cap Portfolio outperformed its market benchmark by 328 bps, the Wells Fargo Factor Enhanced Small Cap Portfolio outperformed its market benchmark by 80 bps, the Wells Fargo Factor Enhanced International Portfolio outperformed its market benchmark by 172 bps, and the Wells Fargo Factor Enhanced Emerging Markets Portfolio outperformed its market benchmark by 43 bps.
While the factor-enhanced international strategies did well on a relative basis, the remainder of the actively managed international equity mutual funds held within the Fund did not, and this was the most significant detractor from performance over the period. Underperformance in the three international funds ranged from 205 bps to 966 bps.
On average, over the 12 months that ended May 31, 2019, the equity portion of the portfolio was hedged 9.4%. The maximum daily hedge was 36.1% on December 12, 2018. The hedge detracted 31 bps from performance over the entire period.
Looking ahead, we are cautiously optimistic.
Our macroeconomic view is that growth will remain positive but it will be slower over the next 12 months than it was over the preceding 12 months. However, we still hold that absent an exogenous shock—likely an implemented shift in trade policy—a U.S. recession is unlikely in 2019. As always, that view could change with new data. We are concerned about growth prospects in Europe and in the rest of the world but are most concerned about the U.S. trade negotiations with major trading partners. Until the trade negotiations move toward détente and more certainty builds to invoke more aggressive business planning resulting in further growth, we are taking a bit more of a cautious approach to the markets and have started to reduce some risks in the portfolios. Like the Fed, we remain very data dependent and acknowledge that while the U.S. economy may be softening, the levels of growth remain robust and 2019 should remain a target-rich environment for investors.
Please see footnotes on page 23.
| | | | |
| 26 | | Multi-Asset Funds | | Fund expenses (unaudited) |
As a shareholder of the Fund, you incur two types of costs: (1) transaction costs, including sales charges (loads) on purchase payments and contingent deferred sales charges (if any) on redemptions and (2) ongoing costs, including management fees, distribution(12b-1) and/or shareholder servicing fees, and other Fund expenses. This example is intended to help you understand your ongoing costs (in dollars) of investing in the Fund and to compare these costs with the ongoing costs of investing in other mutual funds.
The example is based on an investment of $1,000 invested at the beginning of thesix-month period and held for the entire period from December 1, 2018 to May 31, 2019.
Actual expenses
The “Actual” line of the table below provides information about actual account values and actual expenses. You may use the information in this line, together with the amount you invested, to estimate the expenses that you paid over the period. Simply divide your account value by $1,000 (for example, an $8,600 account value divided by $1,000 = 8.6), then multiply the result by the number in the “Actual” line under the heading entitled “Expenses paid during period” for your applicable class of shares to estimate the expenses you paid on your account during this period.
Hypothetical example for comparison purposes
The “Hypothetical” line of the table below provides information about hypothetical account values and hypothetical expenses based on the Fund’s actual expense ratio and an assumed rate of return of 5% per year before expenses, which is not the Fund’s actual return. The hypothetical account values and expenses may not be used to estimate the actual ending account balance or expenses you paid for the period. You may use this information to compare the ongoing costs of investing in the Fund and other funds. To do so, compare this 5% hypothetical example with the 5% hypothetical examples that appear in the shareholder reports of the other funds.
Please note that the expenses shown in the table are meant to highlight your ongoing costs only and do not reflect any transactional costs, such as sales charges (loads) and contingent deferred sales charges. Therefore, the “Hypothetical” line of the table is useful in comparing ongoing costs only and will not help you determine the relative total costs of owning different funds. In addition, if these transactional costs were included, your costs would have been higher.
| | | | | | | | | | | | | | | | |
| WealthBuilder Conservative Allocation Fund | | Beginning
account value
12-1-2018 | | | Ending
account value
5-31-2019 | | | Expenses
paid during
the period¹ | | | Annualized net
expense ratio | |
Class A | | | | | | | | | | | | | | | | |
| | | | |
Actual | | $ | 1,000.00 | | | $ | 1,045.37 | | | $ | 3.86 | | | | 0.75 | % |
| | | | |
Hypothetical (5% return before expenses) | | $ | 1,000.00 | | | $ | 1,021.16 | | | $ | 3.81 | | | | 0.75 | % |
Class C | | | | | | | | | | | | | | | | |
| | | | |
Actual | | $ | 1,000.00 | | | $ | 1,040.42 | | | $ | 7.63 | | | | 1.50 | % |
| | | | |
Hypothetical (5% return before expenses) | | $ | 1,000.00 | | | $ | 1,017.45 | | | $ | 7.54 | | | | 1.50 | % |
Institutional Class | | | | | | | | | | | | | | | | |
| | | | |
Actual | | $ | 1,000.00 | | | $ | 1,046.12 | | | $ | 2.15 | | | | 0.42 | % |
| | | | |
Hypothetical (5% return before expenses) | | $ | 1,000.00 | | | $ | 1,022.83 | | | $ | 2.12 | | | | 0.42 | % |
| WealthBuilder Equity Fund | |
Class A | | | | | | | | | | | | | | | | |
| | | | |
Actual | | $ | 1,000.00 | | | $ | 1,000.31 | | | $ | 3.74 | | | | 0.75 | % |
| | | | |
Hypothetical (5% return before expenses) | | $ | 1,000.00 | | | $ | 1,021.19 | | | $ | 3.78 | | | | 0.75 | % |
Class C | | | | | | | | | | | | | | | | |
| | | | |
Actual | | $ | 1,000.00 | | | $ | 995.86 | | | $ | 7.46 | | | | 1.50 | % |
| | | | |
Hypothetical (5% return before expenses) | | $ | 1,000.00 | | | $ | 1,017.45 | | | $ | 7.54 | | | | 1.50 | % |
Institutional Class | | | | | | | | | | | | | | | | |
| | | | |
Actual | | $ | 1,000.00 | | | $ | 1,001.60 | | | $ | 2.09 | | | | 0.42 | % |
| | | | |
Hypothetical (5% return before expenses) | | $ | 1,000.00 | | | $ | 1,022.84 | | | $ | 2.12 | | | | 0.42 | % |
| 1 | Expenses paid is equal to the annualized net expense ratio of each class multiplied by the average account value over the period, multiplied by the number of days in the most recent fiscal half-year divided by the number of days in the fiscal year (to reflect the one-half-year period). |
| | | | | | |
| Fund expenses (unaudited) | | Multi-Asset Funds | | | 27 | |
| | | | | | | | | | | | | | | | |
| WealthBuilder Growth Allocation Fund | | Beginning
account value
12-1-2018 | | | Ending
account value
5-31-2019 | | | Expenses
paid during
the period¹ | | | Annualized net
expense ratio | |
Class A | | | | | | | | | | | | | | | | |
| | | | |
Actual | | $ | 1,000.00 | | | $ | 1,011.47 | | | $ | 3.76 | | | | 0.75 | % |
| | | | |
Hypothetical (5% return before expenses) | | $ | 1,000.00 | | | $ | 1,021.19 | | | $ | 3.78 | | | | 0.75 | % |
Class C | | | | | | | | | | | | | | | | |
| | | | |
Actual | | $ | 1,000.00 | | | $ | 1,007.48 | | | $ | 7.51 | | | | 1.50 | % |
| | | | |
Hypothetical (5% return before expenses) | | $ | 1,000.00 | | | $ | 1,017.45 | | | $ | 7.54 | | | | 1.50 | % |
Institutional Class | | | | | | | | | | | | | | | | |
| | | | |
Actual | | $ | 1,000.00 | | | $ | 1,013.80 | | | $ | 2.11 | | | | 0.42 | % |
| | | | |
Hypothetical (5% return before expenses) | | $ | 1,000.00 | | | $ | 1,022.83 | | | $ | 2.12 | | | | 0.42 | % |
| WealthBuilder Growth Balanced Fund | |
Class A | | | | | | | | | | | | | | | | |
| | | | |
Actual | | $ | 1,000.00 | | | $ | 1,021.75 | | | $ | 3.78 | | | | 0.75 | % |
| | | | |
Hypothetical (5% return before expenses) | | $ | 1,000.00 | | | $ | 1,021.19 | | | $ | 3.78 | | | | 0.75 | % |
Class C | | | | | | | | | | | | | | | | |
| | | | |
Actual | | $ | 1,000.00 | | | $ | 1,018.33 | | | $ | 7.55 | | | | 1.50 | % |
| | | | |
Hypothetical (5% return before expenses) | | $ | 1,000.00 | | | $ | 1,017.45 | | | $ | 7.54 | | | | 1.50 | % |
Institutional Class | | | | | | | | | | | | | | | | |
| | | | |
Actual | | $ | 1,000.00 | | | $ | 1,024.08 | | | $ | 2.12 | | | | 0.42 | % |
| | | | |
Hypothetical (5% return before expenses) | | $ | 1,000.00 | | | $ | 1,022.84 | | | $ | 2.12 | | | | 0.42 | % |
| WealthBuilder Moderate Balanced Fund | |
Class A | | | | | | | | | | | | | | | | |
| | | | |
Actual | | $ | 1,000.00 | | | $ | 1,033.11 | | | $ | 3.80 | | | | 0.75 | % |
| | | | |
Hypothetical (5% return before expenses) | | $ | 1,000.00 | | | $ | 1,021.19 | | | $ | 3.78 | | | | 0.75 | % |
Class C | | | | | | | | | | | | | | | | |
| | | | |
Actual | | $ | 1,000.00 | | | $ | 1,029.40 | | | $ | 7.59 | | | | 1.50 | % |
| | | | |
Hypothetical (5% return before expenses) | | $ | 1,000.00 | | | $ | 1,017.45 | | | $ | 7.54 | | | | 1.50 | % |
Institutional Class | | | | | | | | | | | | | | | | |
| | | | |
Actual | | $ | 1,000.00 | | | $ | 1,035.74 | | | $ | 2.13 | | | | 0.42 | % |
| | | | |
Hypothetical (5% return before expenses) | | $ | 1,000.00 | | | $ | 1,022.84 | | | $ | 2.11 | | | | 0.42 | % |
| 1 | Expenses paid is equal to the annualized net expense ratio of each class multiplied by the average account value over the period, multiplied by the number of days in the most recent fiscal half-year divided by the number of days in the fiscal year (to reflect theone-half-year period). |
| | | | |
| 28 | | Multi-Asset Funds | | Portfolio of investments—May 31, 2019 |
WEALTHBUILDER CONSERVATIVE ALLOCATION FUND
| | | | | | | | | | | | | | | | |
| Security name | | | | | | | | Shares | | | Value | |
| | | | |
Exchange-Traded Funds: 14.92% | | | | | | | | | | | | | | | | |
| | | | |
Consumer Staples Select Sector SPDR Fund | | | | | | | | | | | 26,762 | | | $ | 1,488,235 | |
| | | | |
Vanguard Intermediate-Term Corporate Bond ETF | | | | | | | | | | | 217,694 | | | | 19,172,311 | |
| | | | |
Vanguard Short-Term Bond ETF | | | | | | | | | | | 214,755 | | | | 17,208,318 | |
| | | | |
Total Exchange-Traded Funds (Cost $37,389,349) | | | | | | | | | | | | | | | 37,868,864 | |
| | | | | | | | | | | | | | | | |
| | | | |
Investment Companies: 84.46% | | | | | | | | | | | | | | | | |
| | | | |
| Affiliated Master Portfolios: 57.57% | | | | | | | | | | | | | | | | |
| | | | |
Wells Fargo Bloomberg Barclays US Aggregateex-Corporate Portfolio | | | | | | | | | | | | | | | 28,756,061 | |
| | | | |
Wells Fargo Core Bond Portfolio | | | | | | | | | | | | | | | 61,343,555 | |
| | | | |
Wells Fargo Disciplined Large Cap Portfolio | | | | | | | | | | | | | | | 12,335,224 | |
| | | | |
Wells Fargo Emerging Growth Portfolio | | | | | | | | | | | | | | | 1,713,046 | |
| | | | |
Wells Fargo Factor Enhanced Emerging Markets Portfolio | | | | | | | | | | | | | | | 2,745,921 | |
| | | | |
Wells Fargo Factor Enhanced International Portfolio | | | | | | | | | | | | | | | 6,719,940 | |
| | | | |
Wells Fargo Factor Enhanced Large Cap Portfolio | | | | | | | | | | | | | | | 10,977,377 | |
| | | | |
Wells Fargo Factor Enhanced Small Cap Portfolio | | | | | | | | | | | | | | | 2,126,238 | |
| | | | |
Wells Fargo High Yield Corporate Bond Portfolio | | | | | | | | | | | | | | | 5,378,678 | |
| | | | |
Wells Fargo Real Return Portfolio | | | | | | | | | | | | | | | 11,496,458 | |
| | | | |
Wells Fargo U.S. REIT Portfolio | | | | | | | | | | | | | | | 2,530,888 | |
| | | | |
| | | | | | | | | | | | | | | 146,123,386 | |
| | | | | | | | | | | | | | | | |
| | | | |
| Alternative Investment Funds: 2.95% | | | | | | | | | | | | | | | | |
| | | | |
AQR Managed Futures Strategy Fund Class R6 † | | | | | | | | | | | 294,958 | | | | 2,521,895 | |
| | | | |
PIMCO CommodityRealReturn Strategy Fund Institutional Class | | | | | | | | | | | 419,151 | | | | 2,435,265 | |
| | | | |
The Arbitrage Fund Class I | | | | | | | | | | | 190,821 | | | | 2,539,824 | |
| | | | |
| | | | | | | | | | | | | | | 7,496,984 | |
| | | | | | | | | | | | | | | | |
| | | | |
| Bond Funds: 18.71% | | | | | | | | | | | | | | | | |
| | | | |
Federated Institutional High Yield Bond Fund Class R6 | | | | | | | | | | | 490,322 | | | | 4,726,708 | |
| | | | |
Invesco Oppenheimer International Bond Fund Class R6 | | | | | | | | | | | 870,635 | | | | 4,718,842 | |
| | | | |
Wells Fargo High Yield Bond Fund Institutional Class (l) | | | | | | | | | | | 1,172,624 | | | | 3,764,124 | |
| | | | |
Wells Fargo Strategic Income Fund Institutional Class (l) | | | | | | | | | | | 3,643,713 | | | | 34,287,336 | |
| | | | |
| | | | | | | | | | | | | | | 47,497,010 | |
| | | | | | | | | | | | | | | | |
| | | | |
| Stock Funds: 5.23% | | | | | | | | | | | | | | | | |
| | | | |
Calamos Market Neutral Income Fund Class I | | | | | | | | | | | 194,376 | | | | 2,534,665 | |
| | | | |
DFA International Small Cap Value Portfolio Institutional Class | | | | | | | | | | | 55,931 | | | | 963,691 | |
| | | | |
Dodge & Cox International Stock Fund | | | | | | | | | | | 62,156 | | | | 2,424,068 | |
| | | | |
T. Rowe Price International Discovery Fund Institutional Class | | | | | | | | | | | 16,076 | | | | 983,701 | |
| | | | |
Wells Fargo Emerging Markets Equity Fund Class R6 (l) | | | | | | | | | | | 40,832 | | | | 966,082 | |
| | | | |
Wells Fargo Endeavor Select Fund Institutional Class †(l) | | | | | | | | | | | 252,589 | | | | 2,245,515 | |
| | | | |
Wells Fargo Large Cap Growth Fund Class R6 (l) | | | | | | | | | | | 51,334 | | | | 2,200,187 | |
| | | | |
Wells Fargo Small Cap Value Fund Class R6 †(l) | | | | | | | | | | | 69,476 | | | | 946,962 | |
| | | | |
| | | | | | | | | | | | | | | 13,264,871 | |
| | | | | | | | | | | | | | | | |
| | | | |
Total Investment Companies (Cost $215,271,033) | | | | | | | | | | | | | | | 214,382,251 | |
| | | | | | | | | | | | | | | | |
The accompanying notes are an integral part of these financial statements.
| | | | | | |
| Portfolio of investments—May 31, 2019 | | Multi-Asset Funds | | | 29 | |
WEALTHBUILDER CONSERVATIVE ALLOCATION FUND
| | | | | | | | | | | | | | | | |
| Security name | | Yield | | | | | | Shares | | | Value | |
| Short-Term Investments: 0.64% | | | | | | | | | | | | | | | | |
| | | | |
| Investment Companies: 0.32% | | | | | | | | | | | | | | | | |
| | | | |
Wells Fargo Government Money Market Fund Select Class (l)(u) | | | 2.30 | % | | | | | | | 799,593 | | | $ | 799,593 | |
| | | | | | | | | | | | | | | | |
| | | | |
| | | | | | Maturity date | | | Principal | | | | |
| U.S. Treasury Securities: 0.32% | | | | | | | | | | | | | | | | |
| | | | |
U.S. Treasury Bill (z)# | | | 2.07 | | | | 6-25-2019 | | | $ | 818,000 | | | | 816,858 | |
| | | | | | | | | | | | | | | | |
| | | | |
Total Short-Term Investments (Cost $1,616,419) | | | | | | | | | | | | | | | 1,616,451 | |
| | | | | | | | | | | | | | | | |
| | | | | | | | |
| Total investments in securities (Cost $254,276,801) | | | 100.02 | % | | | 253,867,566 | |
| | |
Other assets and liabilities, net | | | (0.02 | ) | | | (38,633 | ) |
| | | | | | | | |
| Total net assets | | | 100.00 | % | | $ | 253,828,933 | |
| | | | | | | | |
| † | Non-income-earning security |
| (l) | The issuer of the security is an affiliated person of the Fund as defined in the Investment Company Act of 1940. |
| (u) | The rate represents the7-day annualized yield at period end. |
| (z) | Zero coupon security. The rate represents the current yield to maturity. |
| # | All or a portion of this security is segregated as collateral for investments in derivative instruments. |
Futures Contracts
| | | | | | | | | | | | | | | | | | | | | | | | |
| Description | | Number of
contracts | | | Expiration
date | | | Notional
cost | | | Notional
value | | | Unrealized
gains | | | Unrealized
losses | |
| | | | | | |
Long | | | | | | | | | | | | | | | | | | | | | | | | |
| | | | | | |
Japanese Yen Futures | | | 116 | | | | 6-17-2019 | | | $ | 13,193,509 | | | $ | 13,392,925 | | | $ | 199,416 | | | $ | 0 | |
| | | | | | |
Short | | | | | | | | | | | | | | | | | | | | | | | | |
| | | | | | |
E-Mini Russell 2000 Index | | | (3) | | | | 6-21-2019 | | | | (226,783 | ) | | | (219,975 | ) | | | 6,808 | | | | 0 | |
| | | | | | |
MSCI EAFE Index | | | (4) | | | | 6-21-2019 | | | | (365,280 | ) | | | (363,580 | ) | | | 1,700 | | | | 0 | |
| | | | | | |
MSCI Emerging Markets Index | | | (2) | | | | 6-21-2019 | | | | (98,411 | ) | | | (100,020 | ) | | | 0 | | | | (1,609 | ) |
| | | | | | |
S&P 500E-Mini Index | | | (87) | | | | 6-21-2019 | | | | (12,232,996 | ) | | | (11,973,810 | ) | | | 259,186 | | | | 0 | |
| | | | | | | | | | | | | | | | | | | | | | | | |
| | | | | | |
| | | | | | | | | | | | | | | | | | $ | 467,110 | | | $ | (1,609 | ) |
| | | | | | | | | | | | | | | | | | | | | | | | |
The accompanying notes are an integral part of these financial statements.
| | | | |
| 30 | | Multi-Asset Funds | | Portfolio of investments—May 31, 2019 |
WEALTHBUILDER CONSERVATIVE ALLOCATION FUND
Investments in Affiliates
An affiliated investment is an investment in which the Fund owns at least 5% of the outstanding voting shares of the issuer or as a result of other relationships, such as the Fund and the issuer having the same investment manager or adviser. Transactions with issuers that were either affiliated persons of the Fund at the beginning of the period or the end of the period were as follows:
| | | | | | | | | | | | | | | | | | | | | | | | | | | | |
| | | Shares,
end of
period | | | Net
realized
gains
(losses) on
affiliated
Underlying
Funds | | | Net realized
gain
(losses) on
capital gain
distributions
from
affiliated
Underlying
Funds | | | Net
change in
unrealized
gains
(losses) on
affiliated
Underlying
Funds | | | Dividends
from
affiliated
Underlying
Funds | | | Value,
end
of period | | | % of
net
assets | |
Investment Companies | | | | | | | | | | | | | | | | | | | | | | | | | | | | |
Bond Funds | | | | | | | | | | | | | | | | | | | | | | | | | | | | |
Wells Fargo High Yield Bond Fund Institutional Class | | | 1,172,624 | | | $ | (75,073 | ) | | $ | 0 | | | $ | 9,301 | | | $ | 203,002 | | | $ | 3,764,124 | | | | | |
Wells Fargo Strategic Income Fund Institutional Class | | | 3,643,713 | | | | (5,921 | ) | | | 0 | | | | 260,858 | | | | 684,808 | | | | 34,287,336 | | | | | |
| | | | | | | |
| | | | | | | | | | | | | | | | | | | | | | | 38,051,460 | | | | 14.99 | % |
| | | | | | | | | | | | | | | | | | | | | | | | | | | | |
Stock Funds | | | | | | | | | | | | | | | | | | | | | | | | | | | | |
Wells Fargo Emerging Markets Equity Fund Class R6 | | | 40,832 | | | | 36,970 | | | | 0 | | | | (136,099 | ) | | | 9,361 | | | | 966,082 | | | | | |
Wells Fargo Endeavor Select Fund Institutional Class † | | | 252,589 | | | | 181,440 | | | | 489,556 | | | | (378,014 | ) | | | 0 | | | | 2,245,515 | | | | | |
Wells Fargo Large Cap Growth Fund Class R6 | | | 51,334 | | | | 97,990 | | | | 528,414 | | | | (425,726 | ) | | | 1,124 | | | | 2,200,187 | | | | | |
Wells Fargo Small Cap Value Fund Class R6 † | | | 69,476 | | | | (271,069 | ) | | | 190,754 | | | | (73,908 | ) | | | 0 | | | | 946,962 | | | | | |
| | | | | | | |
| | | | | | | | | | | | | | | | | | | | | | | 6,358,746 | | | | 2.51 | |
| | | | | | | | | | | | | | | | | | | | | | | | | | | | |
| | | | | | | |
Short-Term Investments | | | | | | | | | | | | | | | | | | | | | | | | | | | | |
Investment Companies | | | | | | | | | | | | | | | | | | | | | | | | | | | | |
Wells Fargo Government Money Market Fund Select Class | | | 799,593 | | | | 0 | | �� | | 0 | | | | 0 | | | | 17,647 | | | | 799,593 | | | | 0.32 | |
| | | | | | | | | | | | | | | | | | | | | | | | | | | | |
Affiliated securities no longer held at end of period | | | | | | | 69,296 | | | | 0 | | | | 77,656 | | | | 65,297 | | | | | | | | | |
| | | | | | | | | | | | | | | | | | | | | | | | | | | | |
| | | | | | | |
| | | | | | $ | 33,633 | | | $ | 1,208,724 | | | ($ | 665,932 | ) | | $ | 981,239 | | | $ | 45,209,799 | | | | 17.82 | % |
| | | | | | | | | | | | | | | | | | | | | | | | | | | | |
For the year ended May 31, 2019, investment activity in affiliates of the Fund was as follows:
| | | | | | | | | | | | | | | | |
| | | Shares,
beginning of
period | | | Shares
purchased | | | Shares
sold | | | Shares,
end of
period | |
Investment Companies | | | | | | | | | | | | | | | | |
Bond Funds | | | | | | | | | | | | | | | | |
Wells Fargo High Yield Bond Fund Institutional Class | | | 1,500,708 | | | | 91,633 | | | | 419,717 | | | | 1,172,624 | |
Wells Fargo Short-Term High Yield Bond Fund Institutional Class * | | | 612,276 | | | | 10,952 | | | | 623,228 | | | | 0 | |
Wells Fargo Strategic Income Fund Institutional Class | | | 0 | | | | 4,037,467 | | | | 393,754 | | | | 3,643,713 | |
Stock Funds | | | | | | | | | | | | | | | | |
Wells Fargo Disciplined U.S. Core Fund Class R6 * | | | 293,037 | | | | 0 | | | | 293,037 | | | | 0 | |
Wells Fargo Emerging Markets Equity Fund Class R6 | | | 48,798 | | | | 4,014 | | | | 11,980 | | | | 40,832 | |
Wells Fargo Endeavor Select Fund Institutional Class † | | | 288,513 | | | | 80,951 | | | | 116,875 | | | | 252,589 | |
Wells Fargo Large Cap Growth Fund Class R6 | | | 56,180 | | | | 18,825 | | | | 23,671 | | | | 51,334 | |
Wells Fargo Small Cap Value Fund Class R6 † | | | 65,600 | | | | 26,636 | | | | 22,760 | | | | 69,476 | |
| | | | |
Short-Term Investments | | | | | | | | | | | | | | | | |
Investment Companies | | | | | | | | | | | | | | | | |
Wells Fargo Government Money Market Fund Select Class | | | 48,023 | | | | 25,458,904 | | | | 24,707,334 | | | | 799,593 | |
| | † | Non-income-earning security |
| | * | No longer held at the end of the period. |
The accompanying notes are an integral part of these financial statements.
| | | | | | |
| Portfolio of investments—May 31, 2019 | | Multi-Asset Funds | | | 31 | |
WEALTHBUILDER CONSERVATIVE ALLOCATION FUND
Transactions with the affiliated Master Portfolios were as follows:
| | | | | | | | | | | | | | | | | | | | | | | | | | | | | | | | | | | | |
| | | % of ownership, beginning of period | | | % of
ownership, end of period | | | Net realized gains (losses) on securities transactions allocated from affiliated Master Portfolios | | | Net change in unrealized gains (losses) on securities transactions allocated from affiliated Master Portfolios | | | Interest
allocated
from
affiliated
Master
Portfolios | | | Dividends allocated from affiliated Master Portfolios | | | Affiliated income allocated from affiliated Master Portfolios | | | Value, end of period | | | % of net assets | |
Wells Fargo Bloomberg Barclays US Aggregate ex-Corporate Portfolio | | | 3.92 | % | | | 4.65 | % | | $ | (261,540 | ) | | $ | 1,267,460 | | | $ | 784,588 | | | $ | 0 | | | $ | 13,070 | | | $ | 28,756,061 | | | | | |
Wells Fargo Core Bond Portfolio | | | 1.37 | | | | 1.05 | | | | (560,168 | ) | | | 2,482,739 | | | | 2,187,091 | | | | 0 | | | | 25,402 | | | | 61,343,555 | | | | | |
Wells Fargo Disciplined Large Cap Portfolio | | | 0.00 | | | | 3.95 | | | | (510,046 | ) | | | (108,301 | ) | | | 0 | | | | 308,846 | | | | 2,551 | | | | 12,335,224 | | | | | |
Wells Fargo Emerging Growth Portfolio | | | 0.26 | | | | 0.21 | | | | 533,661 | | | | (463,463 | ) | | | 0 | | | | 2,126 | | | | 2,445 | | | | 1,713,046 | | | | | |
Wells Fargo Factor Enhanced Emerging Markets Portfolio | | | 1.06 | | | | 1.08 | | | | (397,053 | ) | | | 59,363 | | | | 355 | | | | 84,063 | | | | 2,057 | | | | 2,745,921 | | | | | |
Wells Fargo Factor Enhanced International Portfolio | | | 0.82 | | | | 0.99 | | | | (729,559 | ) | | | 67,911 | | | | 403 | | | | 219,578 | | | | 4,794 | | | | 6,719,940 | | | | | |
Wells Fargo Factor Enhanced Large Cap Portfolio | | | 0.81 | | | | 0.98 | | | | 100,742 | | | | 515,611 | | | | 983 | | | | 268,662 | | | | 7,043 | | | | 10,977,377 | | | | | |
Wells Fargo Factor Enhanced Small Cap Portfolio | | | 0.67 | | | | 0.81 | | | | 70,036 | | | | (249,009 | ) | | | 249 | | | | 34,509 | | | | 1,766 | | | | 2,126,238 | | | | | |
Wells Fargo High Yield Corporate Bond Portfolio | | | 12.24 | | | | 8.64 | | | | (319,594 | ) | | | 339,746 | | | | 703,140 | | | | 0 | | | | 2,812 | | | | 5,378,678 | | | | | |
Wells Fargo Real Return Portfolio | | | 10.06 | | | | 6.29 | | | | (232,219 | ) | | | 279,025 | | | | 291,965 | | | | 52,694 | | | | 2,935 | | | | 11,496,458 | | | | | |
Wells Fargo U.S. REIT Portfolio | | | 5.16 | | | | 5.84 | | | | 135,816 | | | | 139,526 | | | | 0 | | | | 79,856 | | | | 211 | | | | 2,530,888 | | | | | |
| | | | | | | | | | | | | | | | | | | | | | | | | | | | | | | | | | | | |
| | | | | | | | | |
| | | | | | | | | | $ | (2,169,924 | ) | | $ | 4,330,608 | | | $ | 3,968,774 | | | $ | 1,050,334 | | | $ | 65,086 | | | $ | 146,123,386 | | | | 57.57 | % |
| | | | | | | | | | | | | | | | | | | | | | | | | | | | | | | | | | | | |
The accompanying notes are an integral part of these financial statements.
| | | | |
| 32 | | Multi-Asset Funds | | Portfolio of investments—May 31, 2019 |
WEALTHBUILDER EQUITY FUND
| | | | | | | | | | | | | | | | |
| Security name | | | | | | | | Shares | | | Value | |
| | | | |
Exchange-Traded Funds: 2.99% | | | | | | | | | | | | | | | | |
| | | | |
Consumer Staples Select Sector SPDR Fund | | | | | | | | | | | 214,518 | | | $ | 11,929,346 | |
| | | | | | | | | | | | | | | | |
| | | | |
Total Exchange-Traded Funds (Cost $10,799,489) | | | | | | | | | | | | | | | 11,929,346 | |
| | | | | | | | | | | | | | | | |
| | | | |
Investment Companies: 96.32% | | | | | | | | | | | | | | | | |
| | | | |
| Affiliated Master Portfolios: 74.56% | | | | | | | | | | | | | | | | |
| | | | |
Wells Fargo Disciplined Large Cap Portfolio | | | | | | | | | | | | | | | 100,954,269 | |
| | | | |
Wells Fargo Emerging Growth Portfolio | | | | | | | | | | | | | | | 13,908,531 | |
| | | | |
Wells Fargo Factor Enhanced Emerging Markets Portfolio | | | | | | | | | | | | | | | 22,118,283 | |
| | | | |
Wells Fargo Factor Enhanced International Portfolio | | | | | | | | | | | | | | | 54,346,141 | |
| | | | |
Wells Fargo Factor Enhanced Large Cap Portfolio | | | | | | | | | | | | | | | 89,163,428 | |
| | | | |
Wells Fargo Factor Enhanced Small Cap Portfolio | | | | | | | | | | | | | | | 17,445,728 | |
| | | | |
| | | | | | | | | | | | | | | 297,936,380 | |
| | | | | | | | | | | | | | | | |
| | | | |
| Stock Funds: 21.76% | | | | | | | | | | | | | | | | |
| | | | |
DFA International Small Cap Value Portfolio Institutional Class | | | | | | | | | | | 453,101 | | | | 7,806,925 | |
| | | | |
Dodge & Cox International Stock Fund | | | | | | | | | | | 504,439 | | | | 19,673,114 | |
| | | | |
T. Rowe Price International Discovery Fund Institutional Class | | | | | | | | | | | 131,285 | | | | 8,033,301 | |
| | | | |
Wells Fargo Emerging Markets Equity Fund Class R6 (l) | | | | | | | | | | | 328,988 | | | | 7,783,861 | |
| | | | |
Wells Fargo Endeavor Select Fund Institutional Class †(l) | | | | | | | | | | | 2,032,274 | | | | 18,066,914 | |
| | | | |
Wells Fargo Large Cap Growth Fund Class R6 (l) | | | | | | | | | | | 417,126 | | | | 17,878,033 | |
| | | | |
Wells Fargo Small Cap Value Fund Class R6 †(l) | | | | | | | | | | | 566,720 | | | | 7,724,397 | |
| | | | |
| | | | | | | | | | | | | | | 86,966,545 | |
| | | | | | | | | | | | | | | | |
| | | | |
Total Investment Companies (Cost $385,072,845) | | | | | | | | | | | | | | | 384,902,925 | |
| | | | | | | | | | | | | | | | |
| | | | |
| | | Yield | | | | | | | | | | |
| Short-Term Investments: 0.76% | | | | | | | | | | | | | | | | |
| | | | |
| Investment Companies: 0.57% | | | | | | | | | | | | | | | | |
| | | | |
Wells Fargo Government Money Market Fund Select Class (l)(u) | | | 2.30 | % | | | | | | | 2,277,831 | | | | 2,277,831 | |
| | | | | | | | | | | | | | | | |
| | | | |
| | | | | | Maturity date | | | Principal | | | | |
| U.S. Treasury Securities: 0.19% | | | | | | | | | | | | | | | | |
| | | | |
U.S. Treasury Bill (z)# | | | 2.07 | | | | 6-25-2019 | | | $ | 757,000 | | | | 755,943 | |
| | | | | | | | | | | | | | | | |
| | | | |
Total Short-Term Investments (Cost $3,033,739) | | | | | | | | | | | | | | | 3,033,774 | |
| | | | | | | | | | | | | | | | |
| | | | | | | | |
| Total investments in securities (Cost $398,906,073) | | | 100.07 | % | | | 399,866,045 | |
| | |
Other assets and liabilities, net | | | (0.07 | ) | | | (269,462 | ) |
| | | | | | | | |
| Total net assets | | | 100.00 | % | | $ | 399,596,583 | |
| | | | | | | | |
| (l) | The issuer of the security is an affiliated person of the Fund as defined in the Investment Company Act of 1940. |
| † | Non-income earning security |
| (u) | The rate represents the7-day annualized yield at period end. |
| (z) | Zero coupon security. The rate represents the current yield to maturity. |
| # | All or a portion of this security is segregated as collateral for investments in derivative instruments. |
The accompanying notes are an integral part of these financial statements.
| | | | | | |
| Portfolio of investments—May 31, 2019 | | Multi-Asset Funds | | | 33 | |
WEALTHBUILDER EQUITY FUND
Futures Contracts
| | | | | | | | | | | | | | | | | | | | | | | | |
| Description | | Number of
contracts | | | Expiration
date | | | Notional
cost | | | Notional
value | | | Unrealized
gains | | | Unrealized
losses | |
| | | | | | |
Long | | | | | | | | | | | | | | | | | | | | | | | | |
| | | | | | |
Japanese Yen Futures | | | 187 | | | | 6-17-2019 | | | $ | 21,268,847 | | | $ | 21,590,319 | | | $ | 321,472 | | | $ | 0 | |
| | | | | | |
Short | | | | | | | | | | | | | | | | | | | | | | | | |
| | | | | | |
E-Mini Russell 2000 Index | | | (22) | | | | 6-21-2019 | | | | (1,633,720 | ) | | | (1,613,150 | ) | | | 20,570 | | | | 0 | |
| | | | | | |
MSCI EAFE | | | (34) | | | | 6-21-2019 | | | | (3,097,287 | ) | | | (3,090,430 | ) | | | 6,857 | | | | 0 | |
| | | | | | |
MSCI Emerging Markets Index | | | (16) | | | | 6-21-2019 | | | | (787,283 | ) | | | (800,160 | ) | | | 0 | | | | (12,877 | ) |
| | | | | | |
S&P 500E-Mini Index | | | (37) | | | | 6-21-2019 | | | | (5,150,136 | ) | | | (5,092,310 | ) | | | 57,826 | | | | 0 | |
| | | | | | | | | | | | | | | | | | | | | | | | |
| | | | | | |
| | | | | | | | | | | | | | | | | | $ | 406,725 | | | $ | (12,877 | ) |
| | | | | | | | | | | | | | | | | | | | | | | | |
Investments in Affiliates
An affiliated investment is an investment in which the Fund owns at least 5% of the outstanding voting shares of the issuer or as a result of other relationships, such as the Fund and the issuer having the same investment manager or adviser. Transactions with issuers that were either affiliated persons of the Fund at the beginning of the period or the end of the period were as follows:
| | | | | | | | | | | | | | | | | | | | | | | | | | | | |
| | | Shares,
end of
period | | | Net
realized
gains
(losses) on
affiliated
Underlying
Funds | | | Net realized
gain
(losses) on
capital gain
distributions
from
affiliated
Underlying
Funds | | | Net
change in
unrealized
gains
(losses) on
affiliated
Underlying
Funds | | | Dividends
from
affiliated
Underlying
Funds | | | Value,
end
of period | | | % of
net
assets | |
Investment Companies | | | | | | | | | | | | | | | | | | | | | | | | | | | | |
Stock Funds | | | | | | | | | | | | | | | | | | | | | | | | | | | | |
Wells Fargo Emerging Markets Equity Fund Class R6 | | | 328,988 | | | $ | 72,597 | | | $ | 0 | | | $ | (1,717,280 | ) | | $ | 70,597 | | | $ | 7,783,861 | | | | | |
Wells Fargo Endeavor Select Fund Institutional Class † | | | 2,032,274 | | | | (12,029 | ) | | | 4,037,919 | | | | (926,934 | ) | | | 0 | | | | 18,066,914 | | | | | |
Wells Fargo Large Cap Growth Fund Class R6 | | | 417,126 | | | | (2,023,834 | ) | | | 4,372,609 | | | | (939,174 | ) | | | 8,974 | | | | 17,878,033 | | | | | |
Wells Fargo Small Cap Value Fund Class R6 † | | | 566,720 | | | | (1,202,256 | ) | | | 1,561,665 | | | | (1,860,416 | ) | | | 0 | | | | 7,724,397 | | | | | |
| | | | | | | |
| | | | | | | | | | | | | | | | | | | | | | | 51,453,205 | | | | 12.88 | % |
| | | | | | | | | | | | | | | | | | | | | | | | | | | | |
| | | | | | | |
Short-Term Investments | | | | | | | | | | | | | | | | | | | | | | | | | | | | |
Investment Companies | | | | | | | | | | | | | | | | | | | | | | | | | | | | |
Wells Fargo Government Money Market Fund Select Class | | | 2,277,831 | | | | 0 | | | | 0 | | | | 0 | | | | 48,486 | | | | 2,277,831 | | | | 0.57 | |
| | | | | | | | | | | | | | | | | | | | | | | | | | | | |
Affiliated securities no longer held at end of period | | | | | | | 937,711 | | | | 0 | | | | 236,882 | | | | 0 | | | | | | | | | |
| | | | | | | | | | | | | | | | | | | | | | | | | | | | |
| | | | | | | |
| | | | | | ($ | 2,227,811 | ) | | $ | 9,972,193 | | | ($ | 5,206,922 | ) | | $ | 128,057 | | | $ | 53,731,036 | | | | 13.45 | % |
| | | | | | | | | | | | | | | | | | | | | | | | | | | | |
The accompanying notes are an integral part of these financial statements.
| | | | |
| 34 | | Multi-Asset Funds | | Portfolio of investments—May 31, 2019 |
WEALTHBUILDER EQUITY FUND
For the year ended May 31, 2019, investment activity in affiliates of the Fund was as follows:
| | | | | | | | | | | | | | | | |
| | | Shares,
beginning of
period | | | Shares
purchased | | | Shares
sold | | | Shares,
end of
period | |
Investment Companies | | | | | | | | | | | | | | | | |
Bond Funds | | | | | | | | | | | | | | | | |
Wells Fargo Disciplined U.S. Core Fund Class R6 * | | | 2,260,514 | | | | 0 | | | | 2,260,514 | | | | 0 | |
Wells Fargo Emerging Markets Equity Fund Class R6 | | | 371,461 | | | | 39,691 | | | | 82,164 | | | | 328,988 | |
Wells Fargo Endeavor Select Fund Institutional Class † | | | 2,226,503 | | | | 616,338 | | | | 810,567 | | | | 2,032,274 | |
Wells Fargo Large Cap Growth Fund Class R6 | | | 433,975 | | | | 136,451 | | | | 153,300 | | | | 417,126 | |
Wells Fargo Small Cap Value Fund Class R6 † | | | 507,134 | | | | 178,489 | | | | 118,903 | | | | 566,720 | |
| | | | |
Short-Term Investments | | | | | | | | | | | | | | | | |
Investment Companies | | | | | | | | | | | | | | | | |
Wells Fargo Government Money Market Fund Select Class | | | 2,816,736 | | | | 46,136,552 | | | | 46,675,457 | | | | 2,277,831 | |
| | † | Non-income-earning security |
| | * | No longer held at the end of the period |
The accompanying notes are an integral part of these financial statements.
| | | | | | |
| Portfolio of investments—May 31, 2019 | | Multi-Asset Funds | | | 35 | |
WEALTHBUILDER EQUITY FUND
Transactions with the affiliated Master Portfolios were as follows:
| | | | | | | | | | | | | | | | | | | | | | | | | | | | | | | | | | | | |
| | | % of ownership, beginning of period | | | % of ownership, end of period | | | Net realized gains (losses) on securities transactions allocated from affiliated Master Portfolios | | | Net change in unrealized gains (losses) on securities transactions allocated from affiliated Master Portfolios | | | Interest allocated from affiliated Master Portfolios | | | Dividends allocated from affiliated Master Portfolios | | | Affiliated income allocated from affiliated Master Portfolios | | | Value, end of period | | | % of net assets | |
Affiliated Master Portfolios | | | | | | | | | | | | | | | | | | | | | | | | | | | | | | | | | | | | |
Wells Fargo Disciplined Large Cap Portfolio | | | 0.00 | % | | | 32.30 | % | | $ | (4,194,993 | ) | | $ | (1,515,877 | ) | | $ | 0 | | | $ | 2,495,741 | | | $ | 20,357 | | | $ | 100,954,269 | | | | | |
Wells Fargo Emerging Growth Portfolio | | | 2.00 | | | | 1.70 | | | | 2,500,930 | | | | (2,141,805 | ) | | | 0 | | | | 17,350 | | | | 19,994 | | | | 13,908,531 | | | | | |
Wells Fargo Factor Enhanced Emerging Markets Portfolio | | | 8.01 | | | | 8.69 | | | | (3,236,924 | ) | | | 369,472 | | | | 2,838 | | | | 669,890 | | | | 16,438 | | | | 22,118,283 | | | | | |
Wells Fargo Factor Enhanced International Portfolio | | | 6.32 | | | | 7.99 | | | | (6,207,400 | ) | | | 625,988 | | | | 3,241 | | | | 1,774,260 | | | | 38,525 | | | | 54,346,141 | | | | | |
Wells Fargo Factor Enhanced Large Cap Portfolio | | | 6.26 | | | | 7.92 | | | | 532,148 | | | | 3,878,508 | | | | 7,953 | | | | 2,170,215 | | | | 56,915 | | | | 89,163,428 | | | | | |
Wells Fargo Factor Enhanced Small Cap Portfolio | | | 5.18 | | | | 6.68 | | | | 349,632 | | | | (2,016,139 | ) | | | 2,011 | | | | 278,323 | | | | 14,279 | | | | 17,445,728 | | | | | |
| | | | | | | | | | | | | | | | | | | | | | | | | | | | | | | | | | | | |
| | | | | | | | | |
| | | | | | | | | | $ | (10,256,607 | ) | | $ | (799,853 | ) | | $ | 16,043 | | | $ | 7,405,779 | | | $ | 166,508 | | | $ | 297,936,380 | | | | 74.56 | % |
| | | | | | | | | | | | | | | | | | | | | | | | | | | | | | | | | | | | |
The accompanying notes are an integral part of these financial statements.
| | | | |
| 36 | | Multi-Asset Funds | | Portfolio of investments—May 31, 2019 |
WEALTHBUILDER GROWTH ALLOCATION FUND
| | | | | | | | | | | | | | | | |
| Security name | | | | | | | | Shares | | | Value | |
| | | | |
Exchange-Traded Funds: 5.26% | | | | | | | | | | | | | | | | |
| | | | |
Consumer Staples Select Sector SPDR Fund | | | | | | | | | | | 122,150 | | | $ | 6,792,762 | |
| | | | |
Vanguard Intermediate-Term Corporate Bond ETF | | | | | | | | | | | 49,218 | | | | 4,334,629 | |
| | | | |
Vanguard Short-Term Bond ETF | | | | | | | | | | | 48,652 | | | | 3,898,485 | |
| | | | |
Total Exchange-Traded Funds (Cost $14,287,136) | | | | | | | | | | | | | | | 15,025,876 | |
| | | | | | | | | | | | | | | | |
| | | | |
Investment Companies: 94.15% | | | | | | | | | | | | | | | | |
| | | | |
| Affiliated Master Portfolios: 68.95% | | | | | | | | | | | | | | | | |
| | | | |
Wells Fargo Bloomberg Barclays US Aggregateex-Corporate Portfolio | | | | | | | | | | | | | | | 6,510,542 | |
| | | | |
Wells Fargo Core Bond Portfolio | | | | | | | | | | | | | | | 13,882,275 | |
| | | | |
Wells Fargo Disciplined Large Cap Portfolio | | | | | | | | | | | | | | | 57,454,263 | |
| | | | |
Wells Fargo Emerging Growth Portfolio | | | | | | | | | | | | | | | 7,947,674 | |
| | | | |
Wells Fargo Factor Enhanced Emerging Markets Portfolio | | | | | | | | | | | | | | | 12,736,023 | |
| | | | |
Wells Fargo Factor Enhanced International Portfolio | | | | | | | | | | | | | | | 31,141,357 | |
| | | | |
Wells Fargo Factor Enhanced Large Cap Portfolio | | | | | | | | | | | | | | | 50,849,638 | |
| | | | |
Wells Fargo Factor Enhanced Small Cap Portfolio | | | | | | | | | | | | | | | 9,944,463 | |
| | | | |
Wells Fargo High Yield Corporate Bond Portfolio | | | | | | | | | | | | | | | 1,115,848 | |
| | | | |
Wells Fargo Real Return Portfolio | | | | | | | | | | | | | | | 2,603,900 | |
| | | | |
Wells Fargo U.S. REIT Portfolio | | | | | | | | | | | | | | | 2,889,904 | |
| | | | |
| | | | | | | | | | | | | | | 197,075,887 | |
| | | | | | | | | | | | | | | | |
| | | | |
| Alternative Investment Funds: 2.99% | | | | | | | | | | | | | | | | |
| | | | |
AQR Managed Futures Strategy Fund Class R6 † | | | | | | | | | | | 335,654 | | | | 2,869,840 | |
| | | | |
PIMCO CommodityRealReturn Strategy Fund Institutional Class | | | | | | | | | | | 483,704 | | | | 2,810,318 | |
| | | | |
The Arbitrage Fund Class I | | | | | | | | | | | 216,440 | | | | 2,880,817 | |
| | | | |
| | | | | | | | | | | | | | | 8,560,975 | |
| | | | | | | | | | | | | | | | |
| | | | |
| Bond Funds: 3.77% | | | | | | | | | | | | | | | | |
| | | | |
Federated Institutional High Yield Bond Fund Class R6 | | | | | | | | | | | 111,471 | | | | 1,074,580 | |
| | | | |
Invesco Oppenheimer International Bond Fund Class R6 | | | | | | | | | | | 199,065 | | | | 1,078,933 | |
| | | | |
Wells Fargo High Yield Bond Fund Institutional Class (l) | | | | | | | | | | | 267,234 | | | | 857,820 | |
| | | | |
Wells Fargo Strategic Income Fund Institutional Class (l) | | | | | | | | | | | 825,704 | | | | 7,769,878 | |
| | | | |
| | | | | | | | | | | | | | | 10,781,211 | |
| | | | | | | | | | | | | | | | |
| | | | |
| Stock Funds: 18.44% | | | | | | | | | | | | | | | | |
| | | | |
Calamos Market Neutral Income Fund Class I | | | | | | | | | | | 220,581 | | | | 2,876,374 | |
| | | | |
DFA International Small Cap Value Portfolio Institutional Class | | | | | | | | | | | 260,859 | | | | 4,494,596 | |
| | | | |
Dodge & Cox International Stock Fund | | | | | | | | | | | 289,280 | | | | 11,281,933 | |
| | | | |
T. Rowe Price International Discovery Fund Institutional Class | | | | | | | | | | | 74,944 | | | | 4,585,801 | |
| | | | |
Wells Fargo Emerging Markets Equity Fund Class R6 (l) | | | | | | | | | | | 189,463 | | | | 4,482,692 | |
| | | | |
Wells Fargo Endeavor Select Fund Institutional Class †(l) | | | | | | | | | | | 1,166,335 | | | | 10,368,722 | |
| | | | |
Wells Fargo Large Cap Growth Fund Class R6 (l) | | | | | | | | | | | 237,810 | | | | 10,192,520 | |
| | | | |
Wells Fargo Small Cap Value Fund Class R6 †(l) | | | | | | | | | | | 324,257 | | | | 4,419,623 | |
| | | | |
| | | | | | | | | | | | | | | 52,702,261 | |
| | | | | | | | | | | | | | | | |
| | | | |
Total Investment Companies (Cost $271,384,101) | | | | | | | | | | | | | | | 269,120,334 | |
| | | | | | | | | | | | | | | | |
The accompanying notes are an integral part of these financial statements.
| | | | | | |
| Portfolio of investments—May 31, 2019 | | Multi-Asset Funds | | | 37 | |
WEALTHBUILDER GROWTH ALLOCATION FUND
| | | | | | | | | | | | | | | | |
| Security name | | Yield | | | | | | Shares | | | Value | |
| | | | |
Short-Term Investments: 0.60% | | | | | | | | | | | | | | | | |
| | | | |
| Investment Companies: 0.22% | | | | | | | | | | | | | | | | |
| | | | |
Wells Fargo Government Money Market Fund Select Class (l)(u) | | | 2.30 | % | | | | | | | 615,530 | | | $ | 615,530 | |
| | | | | | | | | | | | | | | | |
| | | | |
| | | | | | Maturity date | | | Principal | | | | |
| U.S. Treasury Securities: 0.38% | | | | | | | | | | | | | | | | |
| | | | |
U.S. Treasury Bill (z)# | | | 2.07 | | | | 6-25-2019 | | | $ | 1,104,000 | | | | 1,102,458 | |
| | | | | | | | | | | | | | | | |
| | | | |
Total Short-Term Investments (Cost $1,717,946) | | | | | | | | | | | | | | | 1,717,988 | |
| | | | | | | | | | | | | | | | |
| | | | | | | | |
| Total investments in securities (Cost $287,389,183) | | | 100.01 | % | | | 285,864,198 | |
| | |
Other assets and liabilities, net | | | (0.01 | ) | | | (22,929 | ) |
| | | | | | | | |
| Total net assets | | | 100.00 | % | | $ | 285,841,269 | |
| | | | | | | | |
| † | Non-income-earning security |
| (l) | The issuer of the security is an affiliated person of the Fund as defined in the Investment Company Act of 1940. |
| (u) | The rate represents the7-day annualized yield at period end. |
| (z) | Zero coupon security. The rate represents the current yield to maturity. |
| # | All or a portion of this security is segregated as collateral for investments in derivative instruments. |
Futures Contracts
| | | | | | | | | | | | | | | | | | | | | | | | |
| Description | | Number of
contracts | | | Expiration
date | | | Notional
cost | | | Notional
value | | | Unrealized
gains | | | Unrealized
losses | |
| | | | | | |
Long | | | | | | | | | | | | | | | | | | | | | | | | |
| | | | | | |
Japanese Yen Futures | | | 133 | | | | 6-17-2019 | | | $ | 15,127,040 | | | $ | 15,355,681 | | | $ | 228,641 | | | $ | 0 | |
| | | | | | |
Short | | | | | | | | | | | | | | | | | | | | | | | | |
| | | | | | |
E-Mini Russell 2000 Index | | | (12) | | | | 6-21-2019 | | | | (899,346 | ) | | | (879,900 | ) | | | 19,446 | | | | 0 | |
| | | | | | |
MSCI EAFE Index | | | (19) | | | | 6-21-2019 | | | | (1,739,110 | ) | | | (1,727,005 | ) | | | 12,105 | | | | 0 | |
| | | | | | |
MSCI Emerging Markets Index | | | (9) | | | | 6-21-2019 | | | | (449,470 | ) | | | (450,090 | ) | | | 0 | | | | (620 | ) |
| | | | | | |
S&P 500E-Mini Index | | | (115) | | | | 6-21-2019 | | | | (16,161,769 | ) | | | (15,827,450 | ) | | | 334,319 | | | | 0 | |
| | | | | | | | | | | | | | | | | | | | | | | | |
| | | | | | |
| | | | | | | | | | | | | | | | | | $ | 594,511 | | | $ | (620 | ) |
| | | | | | | | | | | | | | | | | | | | | | | | |
The accompanying notes are an integral part of these financial statements.
| | | | |
| 38 | | Multi-Asset Funds | | Portfolio of investments—May 31, 2019 |
WEALTHBUILDER GROWTH ALLOCATION FUND
Investments in Affiliates
An affiliated investment is an investment in which the Fund owns at least 5% of the outstanding voting shares of the issuer or as a result of other relationships, such as the Fund and the issuer having the same investment manager or adviser. Transactions with issuers that were either affiliated persons of the Fund at the beginning of the period or the end of the period were as follows:
| | | | | | | | | | | | | | | | | | | | | | | | | | | | |
| | | Shares,
end of
period | | | Net
realized
gains
(losses) on
affiliated
Underlying
Funds | | | Net
realized
gains
(losses) on
capital gain
distributions
from
affiliated
Underlying
Funds | | | Net
change in
unrealized
gains
(losses) on
affiliated
Underlying
Funds | | | Dividends
from
affiliated
Underlying
Funds | | | Value,
end
of period | | | % of
net
assets | |
Investment Companies | | | | | | | | | | | | | | | | | | | | | | | | | | | | |
Bond Funds | | | | | | | | | | | | | | | | | | | | | | | | | | | | |
Wells Fargo High Yield Bond Fund Institutional Class | | | 267,234 | | | $ | (21,652 | ) | | $ | 0 | | | $ | 4,417 | | | $ | 46,148 | | | $ | 857,820 | | | | | |
Wells Fargo Strategic Income Fund Institutional Class | | | 825,704 | | | | (11,449 | ) | | | 0 | | | | 62,666 | | | | 152,616 | | | | 7,769,878 | | | | | |
| | | | | | | |
| | | | | | | | | | | | | | | | | | | | | | | 8,627,698 | | | | 3.02 | % |
| | | | | | | | | | | | | | | | | | | | | | | | | | | | |
Stock Funds | | | | | | | | | | | | | | | | | | | | | | | | | | | | |
Wells Fargo Emerging Markets Equity Fund Class R6 | | | 189,463 | | | | 94,623 | | | | 0 | | | | (560,821 | ) | | | 42,057 | | | | 4,482,692 | | | | | |
Wells Fargo Endeavor Select Fund Institutional Class † | | | 1,166,335 | | | | 38,406 | | | | 2,301,502 | | | | (1,070,342 | ) | | | 0 | | | | 10,368,722 | | | | | |
Wells Fargo Large Cap Growth Fund Class R6 | | | 237,810 | | | | (73,813 | ) | | | 2,484,233 | | | | (1,575,658 | ) | | | 5,141 | | | | 10,192,520 | | | | | |
Wells Fargo Small Cap Value Fund Class R6 † | | | 324,257 | | | | (468,064 | ) | | | 885,934 | | | | (1,180,441 | ) | | | 0 | | | | 4,419,623 | | | | | |
| | | | | | | |
| | | | | | | | | | | | | | | | | | | | | | | 29,463,557 | | | | 10.31 | |
| | | | | | | | | | | | | | | | | | | | | | | | | | | | |
| | | | | | | |
Short-Term Investments | | | | | | | | | | | | | | | | | | | | | | | | | | | | |
Investment Companies | | | | | | | | | | | | | | | | | | | | | | | | | | | | |
Wells Fargo Government Money Market Fund Select Class | | | 615,530 | | | | 0 | | | | 0 | | | | 0 | | | | 16,352 | | | | 615,530 | | | | 0.22 | |
| | | | | | | | | | | | | | | | | | | | | | | | | | | | |
Affiliated securities no longer held at end of period | | | | | | | 517,579 | | | | 0 | | | | 157,180 | | | | 14,842 | | | | | | | | | |
| | | | | | | | | | | | | | | | | | | | | | | | | | | | |
| | | | | | | |
| | | | | | $ | 75,630 | | | $ | 5,671,669 | | | $ | (4,162,999 | ) | | $ | 277,156 | | | $ | 38,706,785 | | | | 13.55 | % |
| | | | | | | | | | | | | | | | | | | | | | | | | | | | |
For the year ended May 31, 2019, investment activity in affiliates of the Fund was as follows:
| | | | | | | | | | | | | | | | |
| | | Shares,
beginning of
period | | | Shares
purchased | | | Shares
sold | | | Shares,
end of
period | |
Investment Companies | | | | | | | | | | | | | | | | |
Bond Funds | | | | | | | | | | | | | | | | |
Wells Fargo High Yield Bond Fund Institutional Class | | | 326,928 | | | | 38,423 | | | | 98,117 | | | | 267,234 | |
Wells Fargo Strategic Income Fund Institutional Class | | | 0 | | | | 961,413 | | | | 135,709 | | | | 825,704 | |
Wells Fargo Short-Term High Yield Bond Fund Institutional Class * | | | 133,613 | | | | 4,268 | | | | 137,881 | | | | 0 | |
Stock Funds | | | | | | | | | | | | | | | | |
Wells Fargo Disciplined U.S. Core Fund Class R6 * | | | 1,301,297 | | | | 0 | | | | 1,301,297 | | | | 0 | |
Wells Fargo Emerging Markets Equity Fund Class R6 | | | 215,735 | | | | 13,457 | | | | 39,729 | | | | 189,463 | |
Wells Fargo Endeavor Select Fund Institutional Class † | | | 1,281,318 | | | | 329,389 | | | | 444,372 | | | | 1,166,335 | |
Wells Fargo Large Cap Growth Fund Class R6 | | | 249,632 | | | | 74,246 | | | | 86,068 | | | | 237,810 | |
Wells Fargo Small Cap Value Fund Class R6 † | | | 291,878 | | | | 91,503 | | | | 59,124 | | | | 324,257 | |
| | | | |
Short-Term Investments | | | | | | | | | | | | | | | | |
Investment Companies | | | | | | | | | | | | | | | | |
Wells Fargo Government Money Market Fund Select Class | | | 163,691 | | | | 26,548,757 | | | | 26,096,918 | | | | 615,530 | |
| | † | Non-income-earning security |
| | * | No longer held at the end of the period. |
The accompanying notes are an integral part of these financial statements.
| | | | | | |
| Portfolio of investments—May 31, 2019 | | Multi-Asset Funds | | | 39 | |
WEALTHBUILDER GROWTH ALLOCATION FUND
Transactions with the affiliated Master Portfolios were as follows:
| | | | | | | | | | | | | | | | | | | | | | | | | | | | | | | | | | | | |
| | | % of ownership, beginning of period | | | % of
ownership, end of period | | | Net realized gains (losses) on securities transactions allocated from affiliated Master Portfolios | | | Net change in unrealized gains (losses) on securities transactions allocated from affiliated Master Portfolios | | | Interest
allocated
from
affiliated
Master
Portfolios | | | Dividends allocated from affiliated Master Portfolios | | | Affiliated income allocated from affiliated Master Portfolios | | | Value, end of period | | | % of net assets | |
Wells Fargo Bloomberg Barclays US Aggregate ex-Corporate Portfolio | | | 0.86 | % | | | 1.05 | % | | $ | (39,629 | ) | | $ | 281,768 | | | $ | 176,544 | | | $ | 0 | | | $ | 2,940 | | | $ | 6,510,542 | | | | | |
Wells Fargo Core Bond Portfolio | | | 0.30 | | | | 0.24 | | | | (82,995 | ) | | | 545,074 | | | | 492,077 | | | | 0 | | | | 5,724 | | | | 13,882,275 | | | | | |
Wells Fargo Disciplined Large Cap Portfolio | | | 0.00 | | | | 18.38 | | | | (2,384,728 | ) | | | (804,039 | ) | | | 0 | | | | 1,425,831 | | | | 11,654 | | | | 57,454,263 | | | | | |
Wells Fargo Emerging Growth Portfolio | | | 1.15 | | | | 0.97 | | | | 1,617,095 | | | | (1,400,782 | ) | | | 0 | | | | 9,751 | | | | 11,405 | | | | 7,947,674 | | | | | |
Wells Fargo Factor Enhanced Emerging Markets Portfolio | | | 4.65 | | | | 5.01 | | | | (1,812,833 | ) | | | 244,644 | | | | 1,611 | | | | 378,022 | | | | 9,311 | | | | 12,736,023 | | | | | |
Wells Fargo Factor Enhanced International Portfolio | | | 3.64 | | | | 4.58 | | | | (3,515,416 | ) | | | 369,610 | | | | 1,854 | | | | 1,013,603 | | | | 22,044 | | | | 31,141,357 | | | | | |
Wells Fargo Factor Enhanced Large Cap Portfolio | | | 3.61 | | | | 4.52 | | | | 324,071 | | | | 2,288,729 | | | | 4,547 | | | | 1,239,705 | | | | 32,540 | | | | 50,849,638 | | | | | |
Wells Fargo Factor Enhanced Small Cap Portfolio | | | 2.98 | | | | 3.81 | | | | 223,885 | | | | (1,144,976 | ) | | | 1,150 | | | | 158,903 | | | | 8,159 | | | | 9,944,463 | | | | | |
Wells Fargo High Yield Corporate Bond Portfolio | | | 2.68 | | | | 1.79 | | | | (68,974 | ) | | | 75,248 | | | | 159,068 | | | | 0 | | | | 631 | | | | 1,115,848 | | | | | |
Wells Fargo Real Return Portfolio | | | 2.21 | | | | 1.42 | | | | (48,932 | ) | | | 61,039 | | | | 66,379 | | | | 11,846 | | | | 662 | | | | 2,603,900 | | | | | |
Wells Fargo U.S. REIT Portfolio | | | 5.71 | | | | 6.67 | | | | 154,370 | | | | 159,095 | | | | 0 | | | | 91,137 | | | | 242 | | | | 2,889,904 | | | | | |
| | | | | | | | | | | | | | | | | | | | | | | | | | | | | | | | | | | | |
| | | | | | | | | |
| | | | | | | | | | $ | (5,634,086 | ) | | $ | 675,410 | | | $ | 903,230 | | | $ | 4,328,798 | | | $ | 105,312 | | | $ | 197,075,887 | | | | 68.95 | % |
| | | | | | | | | | | | | | | | | | | | | | | | | | | | | | | | | | | | |
The accompanying notes are an integral part of these financial statements.
| | | | |
| 40 | | Multi-Asset Funds | | Portfolio of investments—May 31, 2019 |
WEALTHBUILDER GROWTH BALANCED FUND
| | | | | | | | | | | | | | | | |
| Security name | | | | | | | | Shares | | | Value | |
| | | | |
Exchange-Traded Funds: 8.44% | | | | | | | | | | | | | | | | |
| | | | |
Consumer Staples Select Sector SPDR Fund | | | | | | | | | | | 177,396 | | | $ | 9,864,992 | |
| | | | |
Vanguard Intermediate-Term Corporate Bond ETF | | | | | | | | | | | 237,269 | | | | 20,896,281 | |
| | | | |
Vanguard Short-Term Bond ETF | | | | | | | | | | | 234,329 | | | | 18,776,783 | |
| | | | |
Total Exchange-Traded Funds (Cost $48,415,328) | | | | | | | | | | | | | | | 49,538,056 | |
| | | | | | | | | | | | | | | | |
| | | | |
Investment Companies: 90.88% | | | | | | | | | | | | | | | | |
| | | | |
| Affiliated Master Portfolios: 65.12% | | | | | | | | | | | | | | | | |
| | | | |
Wells Fargo Bloomberg Barclays US Aggregateex-Corporate Portfolio | | | | | | | | | | | | | | | 31,353,040 | |
| | | | |
Wells Fargo Core Bond Portfolio | | | | | | | | | | | | | | | 66,875,316 | |
| | | | |
Wells Fargo Disciplined Large Cap Portfolio | | | | | | | | | | | | | | | 87,630,295 | |
| | | | |
Wells Fargo Emerging Growth Portfolio | | | | | | | | | | | | | | | 12,069,672 | |
| | | | |
Wells Fargo Factor Enhanced Emerging Markets Portfolio | | | | | | | | | | | | | | | 19,212,830 | |
| | | | |
Wells Fargo Factor Enhanced International Portfolio | | | | | | | | | | | | | | | 47,772,707 | |
| | | | |
Wells Fargo Factor Enhanced Large Cap Portfolio | | | | | | | | | | | | | | | 78,041,798 | |
| | | | |
Wells Fargo Factor Enhanced Small Cap Portfolio | | | | | | | | | | | | | | | 15,109,617 | |
| | | | |
Wells Fargo High Yield Corporate Bond Portfolio | | | | | | | | | | | | | | | 5,544,515 | |
| | | | |
Wells Fargo Real Return Portfolio | | | | | | | | | | | | | | | 12,530,964 | |
| | | | |
Wells Fargo U.S. REIT Portfolio | | | | | | | | | | | | | | | 5,982,035 | |
| | | | |
| | | | | | | | | | | | | | | 382,122,789 | |
| | | | | | | | | | | | | | | | |
| | | | |
| Alternative Investment Funds: 3.00% | | | | | | | | | | | | | | | | |
| | | | |
AQR Managed Futures Strategy Fund Class R6 † | | | | | | | | | | | 688,217 | | | | 5,884,256 | |
| | | | |
PIMCO CommodityRealReturn Strategy Fund Institutional Class | | | | | | | | | | | 994,841 | | | | 5,780,025 | |
| | | | |
The Arbitrage Fund Class I | | | | | | | | | | | 446,123 | | | | 5,937,892 | |
| | | | |
| | | | | | | | | | | | | | | 17,602,173 | |
| | | | | | | | | | | | | | | | |
| | | | |
| Bond Funds: 8.83% | | | | | | | | | | | | | | | | |
| | | | |
Federated Institutional High Yield Bond Fund Class R6 | | | | | | | | | | | 535,014 | | | | 5,157,534 | |
| | | | |
Invesco Oppenheimer International Bond Fund Class R6 | | | | | | | | | | | 954,770 | | | | 5,174,852 | |
| | | | |
Wells Fargo High Yield Bond Fund Institutional Class (l) | | | | | | | | | | | 1,280,953 | | | | 4,111,858 | |
| | | | |
Wells Fargo Strategic Income Fund Institutional Class (l) | | | | | | | | | | | 3,972,769 | | | | 37,383,754 | |
| | | | |
| | | | | | | | | | | | | | | 51,827,998 | |
| | | | | | | | | | | | | | | | |
| | | | |
| Stock Funds: 13.93% | | | | | | | | | | | | | | | | |
| | | | |
Calamos Market Neutral Income Fund Class I | | | | | | | | | | | 454,105 | | | | 5,921,531 | |
| | | | |
DFA International Small Cap Value Portfolio Institutional Class | | | | | | | | | | | 393,225 | | | | 6,775,261 | |
| | | | |
Dodge & Cox International Stock Fund | | | | | | | | | | | 437,429 | | | | 17,059,714 | |
| | | | |
T. Rowe Price International Discovery Fund Institutional Class | | | | | | | | | | | 114,086 | | | | 6,980,896 | |
| | | | |
Wells Fargo Emerging Markets Equity Fund Class R6 (l) | | | | | | | | | | | 285,791 | | | | 6,761,811 | |
| | | | |
Wells Fargo Endeavor Select Fund Institutional Class †(l) | | | | | | | | | | | 1,795,342 | | | | 15,960,593 | |
| | | | |
Wells Fargo Large Cap Growth Fund Class R6 (l) | | | | | | | | | | | 363,032 | | | | 15,559,535 | |
| | | | |
Wells Fargo Small Cap Value Fund Class R6 †(l) | | | | | | | | | | | 492,391 | | | | 6,711,294 | |
| | | | |
| | | | | | | | | | | | | | | 81,730,635 | |
| | | | | | | | | | | | | | | | |
| | | | |
Total Investment Companies (Cost 538,876,455) | | | | | | | | | | | | | | | 533,283,595 | |
| | | | | | | | | | | | | | | | |
The accompanying notes are an integral part of these financial statements.
| | | | | | |
| Portfolio of investments—May 31, 2019 | | Multi-Asset Funds | | | 41 | |
WEALTHBUILDER GROWTH BALANCED FUND
| | | | | | | | | | | | | | | | |
| Security name | | Yield | | | | | | Shares | | | Value | |
| | | | |
Short-Term Investments: 0.74% | | | | | | | | | | | | | | | | |
| | | | |
| Investment Companies: 0.38% | | | | | | | | | | | | | | | | |
| | | | |
Wells Fargo Government Money Market Fund Select Class (l)(u) | | | 2.30 | % | | | | | | | 2,225,222 | | | $ | 2,225,222 | |
| | | | | | | | | | | | | | | | |
| | | | |
| | | | | | Maturity date | | | Principal | | | | |
| U.S. Treasury Securities: 0.36% | | | | | | | | | | | | | | | | |
| | | | |
U.S. Treasury Bill (z)# | | | 2.07 | | | | 6-25-2019 | | | $ | 2,132,000 | | | | 2,129,023 | |
| | | | | | | | | | | | | | | | |
| | | | |
Total Short-Term Investments (Cost $4,354,162) | | | | | | | | | | | | | | | 4,354,245 | |
| | | | | | | | | | | | | | | | |
| | | | | | | | |
| Total investments in securities (Cost $591,645,945) | | | 100.06 | % | | | 587,175,896 | |
| | |
Other assets and liabilities, net | | | (0.06 | ) | | | (377,090 | ) |
| | | | | | | | |
| Total net assets | | | 100.00 | % | | $ | 586,798,806 | |
| | | | | | | | |
| † | Non-income-earning security |
| (l) | The issuer of the security is an affiliated person of the Fund as defined in the Investment Company Act of 1940. |
| (u) | The rate represents the7-day annualized yield at period end. |
| (z) | Zero coupon security. The rate represents the current yield to maturity. |
| # | All or a portion of this security is segregated as collateral for investments in derivative instruments. |
Futures Contracts
| | | | | | | | | | | | | | | | | | | | | | | | |
| Description | | Number of
contracts | | | Expiration
date | | | Notional
cost | | | Notional
value | | | Unrealized
gains | | | Unrealized
losses | |
| | | | | | |
Long | | | | | | | | | | | | | | | | | | | | | | | | |
| | | | | | |
Japanese Yen Futures | | | 271 | | | | 6-17-2019 | | | $ | 30,822,766 | | | $ | 31,288,643 | | | $ | 465,877 | | | $ | 0 | |
| | | | | | |
Short | | | | | | | | | | | | | | | | | | | | | | | | |
| | | | | | |
E-Mini Russell 2000 Index | | | (19) | | | | 6-21-2019 | | | | (1,410,573 | ) | | | (1,393,175 | ) | | | 17,398 | | | | 0 | |
| | | | | | |
MSCI EAFE Index | | | (29) | | | | 6-21-2019 | | | | (2,641,389 | ) | | | (2,635,955 | ) | | | 5,434 | | | | 0 | |
| | | | | | |
MSCI Emerging Markets Index | | | (14) | | | | 6-21-2019 | | | | (688,883 | ) | | | (700,140 | ) | | | 0 | | | | (11,257 | ) |
| | | | | | |
S&P 500E-Mini Index | | | (224) | | | | 6-21-2019 | | | | (31,547,743 | ) | | | (30,829,120 | ) | | | 718,623 | | | | 0 | |
| | | | | | | | | | | | | | | | | | | | | | | | |
| | | | | | |
| | | | | | | | | | | | | | | | | | $ | 1,207,332 | | | $ | (11,257 | ) |
| | | | | | | | | | | | | | | | | | | | | | | | |
The accompanying notes are an integral part of these financial statements.
| | | | |
| 42 | | Multi-Asset Funds | | Portfolio of investments—May 31, 2019 |
WEALTHBUILDER GROWTH BALANCED FUND
Investments in Affiliates
An affiliated investment is an investment in which the Fund owns at least 5% of the outstanding voting shares of the issuer or as a result of other relationships, such as the Fund and the issuer having the same investment manager or adviser. Transactions with issuers that were either affiliated persons of the Fund at the beginning of the period or the end of the period were as follows:
| | | | | | | | | | | | | | | | | | | | | | | | | | | | |
| | | Shares,
end of
period | | | Net
realized
gains
(losses) on
affiliated
Underlying
Funds | | | Net
realized
gain
(losses) on
capital gain
distributions
from
affiliated
Underlying
Funds | | | Net
change in
unrealized
gains
(losses) on
affiliated
Underlying
Funds | | | Dividends
from
affiliated
Underlying
Funds | | | Value,
end
of period | | | % of
net
assets | |
Investment Companies | | | | | | | | | | | | | | | | | | | | | | | | | | | | |
Bond Funds | | | | | | | | | | | | | | | | | | | | | | | | | | | | |
Wells Fargo High Yield Bond Fund Institutional Class | | | 1,280,953 | | | $ | (86,654 | ) | | $ | 0 | | | $ | 6,125 | | | $ | 222,560 | | | $ | 4,111,858 | | | | | |
Wells Fargo Strategic Income Fund Institutional Class | | | 3,972,769 | | | | (34,146 | ) | | | 0 | | | | 291,143 | | | | 736,866 | | | | 37,383,754 | | | | | |
| | | | | | | |
| | | | | | | | | | | | | | | | | | | | | | | 41,495,612 | | | | 7.07 | % |
| | | | | | | | | | | | | | | | | | | | | | | | | | | | |
Stock Funds | | | | | | | | | | | | | | | | | | | | | | | | | | | | |
Wells Fargo Emerging Markets Equity Fund Class R6 | | | 285,791 | | | | 183,923 | | | | 0 | | | | (878,601 | ) | | | 65,396 | | | | 6,761,811 | | | | | |
Wells Fargo Endeavor Select Fund Institutional Class † | | | 1,795,342 | | | | 262,783 | | | | 3,520,971 | | | | (1,789,321 | ) | | | 0 | | | | 15,960,593 | | | | | |
Wells Fargo Large Cap Growth Fund Class R6 | | | 363,032 | | | | 620,782 | | | | 3,802,349 | | | | (3,102,506 | ) | | | 7,952 | | | | 15,559,535 | | | | | |
Wells Fargo Small Cap Value Fund Class R6 † | | | 492,391 | | | | (1,274,737 | ) | | | 1,372,741 | | | | (1,264,477 | ) | | | 0 | | | | 6,711,294 | | | | | |
| | | | | | | |
| | | | | | | | | | | | | | | | | | | | | | | 44,993,233 | | | | 7.67 | |
| | | | | | | | | | | | | | | | | | | | | | | | | | | | |
| | | | | | | |
Short-Term Investments | | | | | | | | | | | | | | | | | | | | | | | | | | | | |
Investment Companies | | | | | | | | | | | | | | | | | | | | | | | | | | | | |
Wells Fargo Government Money Market Fund Select Class | | | 2,225,222 | | | | 0 | | | | 0 | | | | 0 | | | | 44,256 | | | | 2,225,222 | | | | 0.38 | |
| | | | | | | | | | | | | | | | | | | | | | | | | | | | |
Affiliated securities no longer held at end of period | | | | | | | 780,361 | | | | 0 | | | | 257,663 | | | | 71,530 | | | | | | | | | |
| | | | | | | | | | | | | | | | | | | | | | | | | | | | |
| | | | | | | |
| | | | | | $ | 452,312 | | | $ | 8,696,061 | | | ($ | 6,479,974 | ) | | $ | 1,148,560 | | | $ | 88,714,067 | | | | 15.12 | % |
| | | | | | | | | | | | | | | | | | | | | | | | | | | | |
For the year ended May 31, 2019, investment activity in affiliates of the Fund was as follows:
| | | | | | | | | | | | | | | | |
| | | Shares,
beginning of
period | | | Shares
purchased | | | Shares
sold | | | Shares,
end of
period | |
Investment Companies | | | | | | | | | | | | | | | | |
Bond Funds | | | | | | | | | | | | | | | | |
Wells Fargo High Yield Bond Fund Institutional Class | | | 1,584,935 | | | | 108,601 | | | | 412,583 | | | | 1,280,953 | |
Wells Fargo Short-Term High Yield Bond Fund Institutional Class * | | | 645,811 | | | | 13,919 | | | | 659,730 | | | | 0 | |
Wells Fargo Strategic Income Fund Institutional Class | | | 0 | | | | 4,423,285 | | | | 450,516 | | | | 3,972,769 | |
Stock Funds | | | | | | | | | | | | | | | | |
Wells Fargo Disciplined U.S. Core Fund Class R6 * | | | 2,010,249 | | | | 0 | | | | 2,010,249 | | | | 0 | |
Wells Fargo Emerging Markets Equity Fund Class R6 | | | 333,632 | | | | 22,120 | | | | 69,961 | | | | 285,791 | |
Wells Fargo Endeavor Select Fund Institutional Class † | | | 1,978,166 | | | | 535,419 | | | | 718,243 | | | | 1,795,342 | |
Wells Fargo Large Cap Growth Fund Class R6 | | | 385,409 | | | | 113,156 | | | | 135,533 | | | | 363,032 | |
Wells Fargo Small Cap Value Fund Class R6 † | | | 450,814 | | | | 138,517 | | | | 96,940 | | | | 492,391 | |
| | | | |
Short-Term Investments | | | | | | | | | | | | | | | | |
Investment Companies | | | | | | | | | | | | | | | | |
Wells Fargo Government Money Market Fund Select Class | | | 790,414 | | | | 49,869,219 | | | | 48,434,411 | | | | 2,225,222 | |
| | † | Non-income-earning security |
| | * | No longer held at the end of the period. |
The accompanying notes are an integral part of these financial statements.
| | | | | | |
| Portfolio of investments—May 31, 2019 | | Multi-Asset Funds | | | 43 | |
WEALTHBUILDER GROWTH BALANCED FUND
Transactions with the affiliated Master Portfolios were as follows:
| | | | | | | | | | | | | | | | | | | | | | | | | | | | | | | | | | | | |
| | | % of ownership, beginning of period | | | % of
ownership, end of period | | | Net realized gains (losses) on securities transactions allocated from affiliated Master Portfolios | | | Net change in unrealized gains (losses) on securities transactions allocated from affiliated Master Portfolios | | | Interest
allocated
from
affiliated
Master
Portfolios | | | Dividends allocated from affiliated Master Portfolios | | | Affiliated income allocated from affiliated Master Portfolios | | | Value, end of period | | | % of net assets | |
Wells Fargo Bloomberg Barclays US Aggregate ex-Corporate Portfolio | | | 4.16 | % | | | 5.07 | % | | $ | (216,788 | ) | | $ | 1,377,469 | | | $ | 852,109 | | | $ | 0 | | | $ | 14,184 | | | $ | 31,353,040 | | | | | |
Wells Fargo Core Bond Portfolio | | | 1.45 | | | | 1.15 | | | | (484,439 | ) | | | 2,700,634 | | | | 2,377,029 | | | | 0 | | | | 27,607 | | | | 66,875,316 | | | | | |
Wells Fargo Disciplined Large Cap Portfolio | | | 0.00 | | | | 28.04 | | | | (3,709,924 | ) | | | (1,357,947 | ) | | | 0 | | | | 2,203,411 | | | | 17,963 | | | | 87,630,295 | | | | | |
Wells Fargo Emerging Growth Portfolio | | | 1.78 | | | | 1.47 | | | | 2,757,752 | | | | (2,393,803 | ) | | | 0 | | | | 15,154 | | | | 17,548 | | | | 12,069,672 | | | | | |
Wells Fargo Factor Enhanced Emerging Markets Portfolio | | | 7.20 | | | | 7.55 | | | | (2,745,155 | ) | | | 392,699 | | | | 2,488 | | | | 582,155 | | | | 14,350 | | | | 19,212,830 | | | | | |
Wells Fargo Factor Enhanced International Portfolio | | | 5.64 | | | | 7.02 | | | | (5,339,226 | ) | | | 581,924 | | | | 2,860 | | | | 1,559,578 | | | | 34,003 | | | | 47,772,707 | | | | | |
Wells Fargo Factor Enhanced Large Cap Portfolio | | | 5.57 | | | | 6.93 | | | | 539,342 | | | | 3,608,666 | | | | 6,997 | | | | 1,912,613 | | | | 50,150 | | | | 78,041,798 | | | | | |
Wells Fargo Factor Enhanced Small Cap Portfolio | | | 4.60 | | | | 5.78 | | | | 338,962 | | | | (1,731,888 | ) | | | 1,770 | | | | 244,998 | | | | 12,579 | | | | 15,109,617 | | | | | |
Wells Fargo High Yield Corporate Bond Portfolio | | | 12.94 | | | | 8.90 | | | | (337,943 | ) | | | 396,128 | | | | 769,265 | | | | 0 | | | | 3,060 | | | | 5,544,515 | | | | | |
Wells Fargo Real Return Portfolio | | | 10.68 | | | | 6.86 | | | | (242,795 | ) | | | 304,934 | | | | 319,115 | | | | 57,284 | | | | 3,184 | | | | 12,530,964 | | | | | |
Wells Fargo U.S. REIT Portfolio | | | 11.74 | | | | 13.80 | | | | 308,975 | | | | 339,698 | | | | 0 | | | | 187,877 | | | | 498 | | | | 5,982,035 | | | | | |
| | | | | | | | | | | | | | | | | | | | | | | | | | | | | | | | | | | | |
| | | | | | | | | |
| | | | | | | | | | $ | (9,131,239 | ) | | $ | 4,218,514 | | | $ | 4,331,633 | | | $ | 6,763,070 | | | $ | 195,126 | | | $ | 382,122,789 | | | | 65.12 | % |
| | | | | | | | | | | | | | | | | | | | | | | | | | | | | | | | | | | | |
The accompanying notes are an integral part of these financial statements.
| | | | |
| 44 | | Multi-Asset Funds | | Portfolio of investments—May 31, 2019 |
WEALTHBUILDER MODERATE BALANCED FUND
| | | | | | | | | | | | | | | | |
| Security name | | | | | | | | Shares | | | Value | |
| | | | |
Exchange-Traded Funds: 11.72% | | | | | | | | | | | | | | | | |
| | | | |
Consumer Staples Select Sector SPDR Fund | | | | | | | | | | | 88,195 | | | $ | 4,904,524 | |
| | | | |
Vanguard Intermediate-Term Corporate Bond ETF | | | | | | | | | | | 271,388 | | | | 23,901,141 | |
| | | | |
Vanguard Short-Term Bond ETF | | | | | | | | | | | 268,017 | | | | 21,476,202 | |
| | | | |
Total Exchange-Traded Funds (Cost $49,454,355) | | | | | | | | | | | | | | | 50,281,867 | |
| | | | | | | | | | | | | | | | |
| | | | |
Investment Companies: 87.70% | | | | | | | | | | | | | | | | |
| | | | |
| Affiliated Master Portfolios: 61.38% | | | | | | | | | | | | | | | | |
| | | | |
Wells Fargo Bloomberg Barclays US Aggregateex-Corporate Portfolio | | | | | | | | | | | | | | | 35,856,012 | |
| | | | |
Wells Fargo Core Bond Portfolio | | | | | | | | | | | | | | | 76,414,275 | |
| | | | |
Wells Fargo Disciplined Large Cap Portfolio | | | | | | | | | | | | | | | 42,349,970 | |
| | | | |
Wells Fargo Emerging Growth Portfolio | | | | | | | | | | | | | | | 5,833,267 | |
| | | | |
Wells Fargo Factor Enhanced Emerging Markets Portfolio | | | | | | | | | | | | | | | 9,299,925 | |
| | | | |
Wells Fargo Factor Enhanced International Portfolio | | | | | | | | | | | | | | | 23,111,128 | |
| | | | |
Wells Fargo Factor Enhanced Large Cap Portfolio | | | | | | | | | | | | | | | 37,806,519 | |
| | | | |
Wells Fargo Factor Enhanced Small Cap Portfolio | | | | | | | | | | | | | | | 7,293,388 | |
| | | | |
Wells Fargo High Yield Corporate Bond Portfolio | | | | | | | | | | | | | | | 6,723,026 | |
| | | | |
Wells Fargo Real Return Portfolio | | | | | | | | | | | | | | | 14,334,555 | |
| | | | |
Wells Fargo U.S. REIT Portfolio | | | | | | | | | | | | | | | 4,370,976 | |
| | | | |
| | | | | | | | | | | | | | | 263,393,041 | |
| | | | | | | | | | | | | | | | |
| | | | |
| Alternative Investment Funds: 2.98% | | | | | | | | | | | | | | | | |
| | | | |
AQR Managed Futures Strategy Fund Class R6 † | | | | | | | | | | | 500,321 | | | | 4,277,748 | |
| | | | |
PIMCO CommodityRealReturn Strategy Fund Institutional Class | | | | | | | | | | | 718,761 | | | | 4,176,002 | |
| | | | |
The Arbitrage Fund Class I | | | | | | | | | | | 324,464 | | | | 4,318,620 | |
| | | | |
| | | | | | | | | | | | | | | 12,772,370 | |
| | | | | | | | | | | | | | | | |
| | | | |
| Bond Funds: 13.80% | | | | | | | | | | | | | | | | |
| | | | |
Federated Institutional High Yield Bond Fund Class R6 | | | | | | | | | | | 612,908 | | | | 5,908,432 | |
| | | | |
Invesco Oppenheimer International Bond Fund Class R6 | | | | | | | | | | | 1,088,898 | | | | 5,901,827 | |
| | | | |
Wells Fargo High Yield Bond Fund Institutional Class (l) | | | | | | | | | | | 1,463,296 | | | | 4,697,181 | |
| | | | |
Wells Fargo Strategic Income Fund Institutional Class (l) | | | | | | | | | | | 4,541,647 | | | | 42,736,903 | |
| | | | |
| | | | | | | | | | | | | | | 59,244,343 | |
| | | | | | | | | | | | | | | | |
| | | | |
| Stock Funds: 9.54% | | | | | | | | | | | | | | | | |
| | | | |
Calamos Market Neutral Income Fund Class I | | | | | | | | | | | 330,031 | | | | 4,303,598 | |
| | | | |
DFA International Small Cap Value Portfolio Institutional Class | | | | | | | | | | | 190,098 | | | | 3,275,396 | |
| | | | |
Dodge & Cox International Stock Fund | | | | | | | | | | | 211,201 | | | | 8,236,824 | |
| | | | |
T. Rowe Price International Discovery Fund Institutional Class | | | | | | | | | | | 54,774 | | | | 3,351,626 | |
| | | | |
Wells Fargo Emerging Markets Equity Fund Class R6 (l) | | | | | | | | | | | 137,771 | | | | 3,259,654 | |
| | | | |
Wells Fargo Endeavor Select Fund Institutional Class †(l) | | | | | | | | | | | 871,727 | | | | 7,749,655 | |
| | | | |
Wells Fargo Large Cap Growth Fund Class R6 (l) | | | | | | | | | | | 175,467 | | | | 7,520,532 | |
| | | | |
Wells Fargo Small Cap Value Fund Class R6 †(l) | | | | | | | | | | | 237,364 | | | | 3,235,272 | |
| | | | |
| | | | | | | | | | | | | | | 40,932,557 | |
| | | | | | | | | | | | | | | | |
| | | | |
Total Investment Companies (Cost $379,220,092) | | | | | | | | | | | | | | | 376,342,311 | |
| | | | | | | | | | | | | | | | |
The accompanying notes are an integral part of these financial statements.
| | | | | | |
| Portfolio of investments—May 31, 2019 | | Multi-Asset Funds | | | 45 | |
WEALTHBUILDER MODERATE BALANCED FUND
| | | | | | | | | | | | | | | | |
| Security name | | Yield | | | | | | Shares | | | Value | |
| | | | |
Short-Term Investments: 0.56% | | | | | | | | | | | | | | | | |
| | | | |
| Investment Companies: 0.20% | | | | | | | | | | | | | | | | |
| | | | |
Wells Fargo Government Money Market Fund Select Class (l)(u) | | | 2.30 | % | | | | | | | 884,814 | | | $ | 884,814 | |
| | | | | | | | | | | | | | | | |
| | | | |
| | | | | | Maturity date | | | Principal | | | | |
| U.S. Treasury Securities: 0.36% | | | | | | | | | | | | | | | | |
| | | | |
U.S. Treasury Bill (z)# | | | 2.07 | | | | 6-25-2019 | | | $ | 1,536,000 | | | | 1,533,855 | |
| | | | | | | | | | | | | | | | |
| | | | |
Total Short-Term Investments (Cost $2,418,610) | | | | | | | | | | | | | | | 2,418,669 | |
| | | | | | | | | | | | | | | | |
| | | | | | | | |
| Total investments in securities (Cost $431,093,057) | | | 99.98 | % | | | 429,042,847 | |
| | |
Other assets and liabilities, net | | | 0.02 | | | | 85,801 | |
| | | | | | | | |
| Total net assets | | | 100.00 | % | | $ | 429,128,648 | |
| | | | | | | | |
| † | Non-income-earning security |
| (l) | The issuer of the security is an affiliated person of the Fund as defined in the Investment Company Act of 1940. |
| (u) | The rate represents the7-day annualized yield at period end. |
| (z) | Zero coupon security. The rate represents the current yield to maturity. |
| # | All or a portion of this security is segregated as collateral for investments in derivative instruments. |
Futures Contracts
| | | | | | | | | | | | | | | | | | | | | | | | |
| Description | | Number of
contracts | | | Expiration
date | | | Notional
cost | | | Notional
value | | | Unrealized
gains | | | Unrealized
losses | |
| | | | | | |
Long | | | | | | | | | | | | | | | | | | | | | | | | |
| | | | | | |
Japanese Yen Futures | | | 198 | | | | 6-17-2019 | | | $ | 22,519,955 | | | $ | 22,860,338 | | | $ | 340,383 | | | $ | 0 | |
| | | | | | |
Short | | | | | | | | | | | | | | | | | | | | | | | | |
| | | | | | |
E-Mini Russell 2000 Index | | | (9) | | | | 6-21-2019 | | | | (676,199 | ) | | | (659,925 | ) | | | 16,274 | | | | 0 | |
| | | | | | |
MSCI EAFE Index | | | (14) | | | | 6-21-2019 | | | | (1,282,212 | ) | | | (1,272,530 | ) | | | 9,682 | | | | 0 | |
| | | | | | |
MSCI Emerging Markets Index | | | (7) | | | | 6-21-2019 | | | | (348,345 | ) | | | (350,070 | ) | | | 0 | | | | (1,725 | ) |
| | | | | | |
S&P 500E-Mini Index | | | (155) | | | | 6-21-2019 | | | | (21,786,374 | ) | | | (21,332,650 | ) | | | 453,724 | | | | 0 | |
| | | | | | | | | | | | | | | | | | | | | | | | |
| | | | | | |
| | | | | | | | | | | | | | | | | | $ | 820,063 | | | $ | (1,725 | ) |
| | | | | | | | | | | | | | | | | | | | | | | | |
The accompanying notes are an integral part of these financial statements.
| | | | |
| 46 | | Multi-Asset Funds | | Portfolio of investments—May 31, 2019 |
WEALTHBUILDER MODERATE BALANCED FUND
Investments in Affiliates
An affiliated investment is an investment in which the Fund owns at least 5% of the outstanding voting shares of the issuer or as a result of other relationships, such as the Fund and the issuer having the same investment manager or adviser. Transactions with issuers that were either affiliated persons of the Fund at the beginning of the period or the end of the period were as follows:
| | | | | | | | | | | | | | | | | | | | | | | | | | | | |
| | | Shares,
end of
period | | | Net
realized
gains
(losses) on
affiliated
Underlying
Funds | | | Net
realized
gains
(losses) on
capital gain
distributions
from
affiliated
Underlying
Funds | | | Net
change in
unrealized
gains
(losses) on
affiliated
Underlying
Funds | | | Dividends
from
affiliated
Underlying
Funds | | | Value,
end
of period | | | % of
net
assets | |
Investment Companies | | | | | | | | | | | | | | | | | | | | | | | | | | | | |
Bond Funds | | | | | | | | | | | | | | | | | | | | | | | | | | | | |
Wells Fargo High Yield Bond Fund Institutional Class | | | 1,463,296 | | | $ | (99,497 | ) | | $ | 0 | | | $ | 9,135 | | | $ | 259,747 | | | $ | 4,697,181 | | | | | |
Wells Fargo Strategic Income Fund Institutional Class | | | 4,541,647 | | | | (19,495 | ) | | | 0 | | | | 329,264 | | | | 860,566 | | | | 42,736,903 | | | | | |
| | | | | | | |
| | | | | | | | | | | | | | | | | | | | | | | 47,434,084 | | | | 11.05 | % |
| | | | | | | | | | | | | | | | | | | | | | | | | | | | |
Stock Funds | | | | | | | | | | | | | | | | | | | | | | | | | | | | |
Wells Fargo Emerging Markets Equity Fund Class R6 | | | 137,771 | | | | 119,414 | | | | 0 | | | | (472,516 | ) | | | 32,176 | | | | 3,259,654 | | | | | |
Wells Fargo Endeavor Select Fund Institutional Class † | | | 871,727 | | | | 427,067 | | | | 1,718,320 | | | | (1,152,544 | ) | | | 0 | | | | 7,749,655 | | | | | |
Wells Fargo Large Cap Growth Fund Class R6 | | | 175,467 | | | | 353,874 | | | | 1,854,853 | | | | (1,539,642 | ) | | | 3,917 | | | | 7,520,532 | | | | | |
Wells Fargo Small Cap Value Fund Class R6 † | | | 237,364 | | | | (765,351 | ) | | | 672,818 | | | | (475,185 | ) | | | 0 | | | | 3,235,272 | | | | | |
| | | | | | | |
| | | | | | | | | | | | | | | | | | | | | | | 21,765,113 | | | | 5.07 | |
| | | | | | | | | | | | | | | | | | | | | | | | | | | | |
| | | | | | | |
Short-Term Investments | | | | | | | | | | | | | | | | | | | | | | | | | | | | |
Investment Companies | | | | | | | | | | | | | | | | | | | | | | | | | | | | |
Wells Fargo Government Money Market Fund Select Class | | | 884,814 | | | | 0 | | | | 0 | | | | 0 | | | | 18,215 | | | | 884,814 | | | | 0.20 | |
| | | | | | | | | | | | | | | | | | | | | | | | | | | | |
Affiliated securities no longer held at end of period | | | | | | | 358,962 | | | | 0 | | | | 165,221 | | | | 84,694 | | | | | | | | | |
| | | | | | | | | | | | | | | | | | | | | | | | | | | | |
| | | | | | | |
| | | | | | $ | 374,974 | | | $ | 4,245,991 | | | $ | (3,136,267 | ) | | $ | 1,259,315 | | | $ | 70,084,011 | | | | 16.32 | % |
| | | | | | | | | | | | | | | | | | | | | | | | | | | | |
For the year ended May 31, 2019, investment activity in affiliates of the Fund was as follows:
| | | | | | | | | | | | | | | | |
| | | Shares,
beginning of
period | | | Shares
purchased | | | Shares
sold | | | Shares,
end of
period | |
Investment Companies | | | | | | | | | | | | | | | | |
Bond Funds | | | | | | | | | | | | | | | | |
Wells Fargo High Yield Bond Fund Institutional Class | | | 1,911,953 | | | | 81,229 | | | | 529,886 | | | | 1,463,296 | |
Wells Fargo Strategic Income Fund Institutional Class | | | 0 | | | | 5,205,982 | | | | 664,335 | | | | 4,541,647 | |
Wells Fargo Short-Term High Yield Bond Fund Insitutional Class * | | | 780,008 | | | | 9,566 | | | | 789,574 | | | | 0 | |
Stock Funds | | | | | | | | | | | | | | | | |
Wells Fargo Disciplined U.S. Core Fund Class R6 * | | | 1,021,404 | | | | 0 | | | | 1,021,404 | | | | 0 | |
Wells Fargo Emerging Markets Equity Fund Class R6 | | | 170,189 | | | | 6,872 | | | | 39,290 | | | | 137,771 | |
Wells Fargo Endeavor Select Fund Institutional Class † | | | 1,008,976 | | | | 248,575 | | | | 385,824 | | | | 871,727 | |
Wells Fargo Large Cap Growth Fund Class R6 | | | 196,506 | | | | 54,602 | | | | 75,641 | | | | 175,467 | |
Wells Fargo Small Cap Value Fund Class R6 † | | | 228,776 | | | | 69,877 | | | | 61,289 | | | | 237,364 | |
| | | | |
Short-Term Investments | | | | | | | | | | | | | | | | |
Investment Companies | | | | | | | | | | | | | | | | |
Wells Fargo Government Money Market Fund Select Class | | | 0 | | | | 35,431,659 | | | | 34,546,845 | | | | 884,814 | |
| | † | Non-income-earning security |
| | * | No longer held at the end of the period |
The accompanying notes are an integral part of these financial statements.
| | | | | | |
| Portfolio of investments—May 31, 2019 | | Multi-Asset Funds | | | 47 | |
WEALTHBUILDER MODERATE BALANCED FUND
Transactions with the affiliated Master Portfolios were as follows:
| | | | | | | | | | | | | | | | | | | | | | | | | | | | | | | | | | | | |
| | | % of ownership, beginning of period | | | % of
ownership, end of period | | | Net realized gains (losses) on securities transactions allocated from affiliated Master Portfolios | | | Net change in unrealized gains (losses) on securities transactions allocated from affiliated Master Portfolios | | | Interest
allocated
from
affiliated
Master
Portfolios | | | Dividends allocated from affiliated Master Portfolios | | | Affiliated income allocated from affiliated Master Portfolios | | | Value, end of period | | | % of net assets | |
Wells Fargo Bloomberg Barclays US Aggregate ex-Corporate Portfolio | | | 5.00 | % | | | 5.80 | % | | $ | (305,821 | ) | | $ | 1,595,161 | | | $ | 999,281 | | | $ | 0 | | | $ | 16,696 | | | $ | 35,856,012 | | | | | |
Wells Fargo Core Bond Portfolio | | | 1.75 | | | | 1.31 | | | | (721,554 | ) | | | 3,174,570 | | | | 2,785,641 | | | | 0 | | | | 32,289 | | | | 76,414,275 | | | | | |
Wells Fargo Disciplined Large Cap Portfolio | | | 0.00 | | | | 13.55 | | | | (1,820,288 | ) | | | (520,484 | ) | | | 0 | | | | 1,088,660 | | | | 8,987 | | | | 42,349,970 | | | | | |
Wells Fargo Emerging Growth Portfolio | | | 0.90 | | | | 0.71 | | | | 1,581,993 | | | | (1,398,959 | ) | | | 0 | | | | 7,466 | | | | 8,610 | | | | 5,833,267 | | | | | |
Wells Fargo Factor Enhanced Emerging Markets Portfolio | | | 3.67 | | | | 3.66 | | | | (1,385,836 | ) | | | 198,005 | | | | 1,230 | | | | 291,226 | | | | 7,127 | | | | 9,299,925 | | | | | |
Wells Fargo Factor Enhanced International Portfolio | | | 2.85 | | | | 3.40 | | | | (2,578,999 | ) | | | 238,035 | | | | 1,409 | | | | 766,013 | | | | 16,768 | | | | 23,111,128 | | | | | |
Wells Fargo Factor Enhanced Large Cap Portfolio | | | 2.83 | | | | 3.36 | | | | 340,398 | | | | 1,769,015 | | | | 3,433 | | | | 943,749 | | | | 24,660 | | | | 37,806,519 | | | | | |
Wells Fargo Factor Enhanced Small Cap Portfolio | | | 2.34 | | | | 2.79 | | | | 207,696 | | | | (874,562 | ) | | | 870 | | | | 121,467 | | | | 6,194 | | | | 7,293,388 | | | | | |
Wells Fargo High Yield Corporate Bond Portfolio | | | 15.60 | | | | 10.80 | | | | (408,573 | ) | | | 444,006 | | | | 900,616 | | | | 0 | | | | 3,583 | | | | 6,723,026 | | | | | |
Wells Fargo Real Return Portfolio | | | 12.84 | | | | 7.84 | | | | (297,405 | ) | | | 352,101 | | | | 373,324 | | | | 67,113 | | | | 3,754 | | | | 14,334,555 | | | | | |
Wells Fargo U.S. REIT Portfolio | | | 9.01 | | | | 10.09 | | | | 233,325 | | | | 252,362 | | | | 0 | | | | 140,971 | | | | 369 | | | | 4,370,976 | | | | | |
| | | | | | | | | | | | | | | | | | | | | | | | | | | | | | | | | | | | |
| | | | | | | | | |
| | | | | | | | | | $ | (5,155,064 | ) | | $ | 5,229,250 | | | $ | 5,065,804 | | | $ | 3,426,665 | | | $ | 129,037 | | | $ | 263,393,041 | | | | 61.38 | % |
| | | | | | | | | | | | | | | | | | | | | | | | | | | | | | | | | | | | |
The accompanying notes are an integral part of these financial statements.
| | | | |
| 48 | | Multi-Asset Funds | | Statements of assets and liabilities—May 31, 2019 |
| | | | | | | | |
| | | WealthBuilder
Conservative
Allocation Fund | | | WealthBuilder
Equity Fund | |
| | |
Assets | | | | | | | | |
Investments in affiliated Master Portfolios, at value (see cost below) | | $ | 146,123,386 | | | $ | 297,936,380 | |
Investments in unaffiliated Underlying Funds and securities, at value (see cost below) | | | 62,534,381 | | | | 48,198,629 | |
Investments in affiliated Underlying Funds, at value (see cost below) | | | 45,209,799 | | | | 53,731,036 | |
Cash | | | 30,560 | | | | 0 | |
Receivable for investments sold | | | 269,791 | | | | 122,120 | |
Receivable for Fund shares sold | | | 98,772 | | | | 19,802 | |
Receivable for dividends | | | 65,660 | | | | 0 | |
Receivable for daily variation margin on open futures contracts | | | 305,739 | | | | 299,227 | |
Prepaid expenses and other assets | | | 71,857 | | | | 42,994 | |
| | | | |
Total assets | | | 254,709,945 | | | | 400,350,188 | |
| | | | |
| | |
Liabilities | | | | | | | | |
Payable for Fund shares redeemed | | | 513,979 | | | | 184,835 | |
Distribution fee payable | | | 162,392 | | | | 249,856 | |
Shareholder servicing fees payable | | | 57,853 | | | | 93,492 | |
Administration fees payable | | | 48,654 | | | | 78,672 | |
Management fee payable | | | 48,032 | | | | 88,537 | |
Custodian and accounting fees payable | | | 43,245 | | | | 43,491 | |
Payable for daily variation margin on open futures contracts | | | 1,858 | | | | 13,549 | |
Accrued expenses and other liabilities | | | 4,999 | | | | 1,173 | |
| | | | |
Total liabilities | | | 881,012 | | | | 753,605 | |
| | | | |
Total net assets | | $ | 253,828,933 | | | $ | 399,596,583 | |
| | | | |
| | |
NET ASSETS CONSIST OF | | | | | | | | |
Paid-in capital | | $ | 253,267,386 | | | $ | 388,993,854 | |
Total distributable earnings | | | 561,547 | | | | 10,602,729 | |
| | | | |
Total net assets | | $ | 253,828,933 | | | $ | 399,596,583 | |
| | | | |
| | |
COMPUTATION OF NET ASSET VALUE AND OFFERING PRICE PER SHARE | | | | | | | | |
Net assets – Class A | | $ | 16,242,186 | | | $ | 42,588,051 | |
Shares outstanding – Class A1 | | | 1,653,877 | | | | 2,578,202 | |
Net asset value per share – Class A | | | $9.82 | | | | $16.52 | |
Maximum offering price per share – Class A2 | | | $10.42 | | | | $17.53 | |
Net assets – Class C | | $ | 237,153,020 | | | $ | 355,837,023 | |
Shares outstanding – Class C1 | | | 24,179,563 | | | | 21,709,185 | |
Net asset value per share – Class C | | | $9.81 | | | | $16.39 | |
Net assets – Institutional Class | | $ | 433,727 | | | $ | 1,171,509 | |
Shares outstanding – Institutional Class1 | | | 44,280 | | | | 70,798 | |
Net asset value per share – Institutional Class | | | $9.80 | | | | $16.55 | |
| | |
Investments in affiliated Master Portfolios, at cost | | $ | 146,729,414 | | | $ | 300,132,013 | |
| | | | |
Investments in unaffiliated Underlying Funds and securities, at cost | | $ | 62,355,477 | | | $ | 43,868,789 | |
| | | | |
Investments in affiliated Underlying Funds, at cost | | $ | 45,191,910 | | | $ | 54,905,271 | |
| | | | |
| 1 | Each Fund has an unlimited number of authorized shares. |
| 2 | Maximum offering price is computed as 100/94.25 of net asset value. On investments of $50,000 or more, the offering price is reduced. |
The accompanying notes are an integral part of these financial statements.
| | | | | | |
| Statements of assets and liabilities—May 31, 2019 | | Multi-Asset Funds | | | 49 | |
| | | | | | | | | | |
WealthBuilder
Growth
Allocation Fund | | | WealthBuilder
Growth
Balanced Fund | | | WealthBuilder
Moderate
Balanced Fund | |
| | |
| | | | | | | | | | |
| $ | 197,075,887 | | | $ | 382,122,789 | | | $ | 263,393,041 | |
| | 50,081,526 | | | | 116,339,040 | | | | 95,565,795 | |
| | 38,706,785 | | | | 88,714,067 | | | | 70,084,011 | |
| | 37,564 | | | | 72,241 | | | | 50,517 | |
| | 313,861 | | | | 354,672 | | | | 345,367 | |
| | 31,874 | | | | 147,606 | | | | 21,641 | |
| | 15,096 | | | | 71,992 | | | | 82,295 | |
| | 378,158 | | | | 754,323 | | | | 534,569 | |
| | 93,797 | | | | 5,510 | | | | 106,062 | |
| | |
| | 286,734,548 | | | | 588,582,240 | | | | 430,183,298 | |
| | |
| | |
| | | | | | | | | | |
| | 495,060 | | | | 933,320 | | | | 468,118 | |
| | 182,648 | | | | 373,849 | | | | 270,902 | |
| | 66,452 | | | | 135,461 | | | | 98,147 | |
| | 55,908 | | | | 113,910 | | | | 82,672 | |
| | 59,142 | | | | 131,615 | | | | 93,510 | |
| | 23,243 | | | | 56,263 | | | | 24,257 | |
| | 7,343 | | | | 11,929 | | | | 5,965 | |
| | 3,483 | | | | 27,087 | | | | 11,079 | |
| | |
| | 893,279 | | | | 1,783,434 | | | | 1,054,650 | |
| | |
| $ | 285,841,269 | | | $ | 586,798,806 | | | $ | 429,128,648 | |
| | |
| | |
| | | | | | | | | | |
| $ | 279,869,245 | | | $ | 577,794,654 | | | $ | 421,774,059 | |
| | 5,972,024 | | | | 9,004,152 | | | | 7,354,589 | |
| | |
| $ | 285,841,269 | | | $ | 586,798,806 | | | $ | 429,128,648 | |
| | |
| | |
| | | | | | | | | | |
| $ | 23,420,216 | | | $ | 46,380,316 | | | $ | 34,104,012 | |
| | 2,024,541 | | | | 3,983,301 | | | | 3,311,819 | |
| | $11.57 | | | | $11.64 | | | | $10.30 | |
| | $12.28 | | | | $12.35 | | | | $10.93 | |
| $ | 261,722,049 | | | $ | 539,351,772 | | | $ | 393,207,242 | |
| | 22,221,879 | | | | 45,507,624 | | | | 37,454,728 | |
| | $11.78 | | | | $11.85 | | | | $10.50 | |
| $ | 699,004 | | | $ | 1,066,718 | | | $ | 1,817,394 | |
| | 60,398 | | | | 91,551 | | | | 176,173 | |
| | $11.57 | | | | $11.65 | | | | $10.32 | |
| | |
| $ | 198,428,834 | | | $ | 386,161,994 | | | $ | 265,630,502 | |
| | |
| $ | 48,118,626 | | | $ | 113,464,642 | | | $ | 94,131,512 | |
| | |
| $ | 40,841,723 | | | $ | 92,019,309 | | | $ | 71,331,043 | |
| | |
The accompanying notes are an integral part of these financial statements.
| | | | |
| 50 | | Multi-Asset Funds | | Statements of operations—year ended May 31, 2019 |
| | | | | | | | |
| | | WealthBuilder
Conservative
Allocation Fund | | | WealthBuilder
Equity Fund | |
| | |
Investment income | | | | | | | | |
Interest allocated from affiliated Master Portfolios | | $ | 3,968,774 | | | $ | 16,043 | |
Dividends from unaffiliated Underlying Funds | | | 2,603,614 | | | | 1,317,610 | |
Dividends allocated from affiliated Master Portfolios* | | | 1,050,334 | | | | 7,405,779 | |
Dividends from affiliated Underlying Funds | | | 981,239 | | | | 128,057 | |
Interest | | | 18,978 | | | | 26,952 | |
Affiliated income allocated from affiliated Master Portfolios | | | 65,086 | | | | 166,508 | |
Expenses allocated from affiliated Master Portfolios | | | (483,602 | ) | | | (922,094 | ) |
Waivers allocated from affiliated Master Portfolios | | | 27,399 | | | | 85,017 | |
| | | | |
Total investment income | | | 8,231,822 | | | | 8,223,872 | |
| | | | |
| | |
Expenses | | | | | | | | |
Management fee | | | 706,992 | | | | 1,134,255 | |
Administration fees | |
Class A | | | 24,524 | | | | 63,548 | |
Class C | | | 568,715 | | | | 887,815 | |
Institutional Class | | | 392 | 1 | | | 874 | 1 |
Shareholder servicing fees | |
Class A | | | 29,195 | | | | 75,653 | |
Class C | | | 677,042 | | | | 1,056,922 | |
Distribution fee | |
Class C | | | 2,030,975 | | | | 3,170,245 | |
Custody and accounting fees | | | 65,060 | | | | 69,579 | |
Professional fees | | | 29,155 | | | | 33,778 | |
Registration fees | | | 55,545 | | | | 52,841 | |
Shareholder report expenses | | | 30,714 | | | | 39,850 | |
Trustees’ fees and expenses | | | 20,979 | | | | 21,063 | |
Other fees and expenses | | | 12,133 | | | | 13,612 | |
| | | | |
Total expenses | | | 4,251,421 | | | | 6,620,035 | |
Less: Fee waivers and/or expense reimbursements | | | (100,468 | ) | | | (48,720 | ) |
| | | | |
Net expenses | | | 4,150,953 | | | | 6,571,315 | |
| | | | |
Net investment income | | | 4,080,869 | | | | 1,652,557 | |
| | | | |
| | |
REALIZED AND UNREALIZED GAINS (LOSSES) ON INVESTMENTS | | | | | | | | |
|
Net realized gains (losses) on: | |
Securities transactions allocated from affiliated Master Portfolios | | | (2,169,924 | ) | | | (10,256,607 | ) |
Unaffiliated Underlying Funds | | | (746,366 | ) | | | 6,502,994 | |
Affiliated Underlying Funds | | | 33,633 | | | | (2,227,811 | ) |
Futures contracts | | | (9,893 | ) | | | (4,989,772 | ) |
Capital gain distributions from unaffiliated Underlying Funds | | | 116,831 | | | | 286,107 | |
Capital gain distributions from affiliated Underlying Funds | | | 1,208,724 | | | | 9,972,193 | |
| | | | |
Net realized gain (losses) on investments | | | (1,566,995 | ) | | | (712,896 | ) |
| | | | |
|
Net change in unrealized gains (losses) on: | |
Securities transactions allocated from affiliated Master Portfolios | | | 4,330,608 | | | | (799,853 | ) |
Unaffiliated Underlying Funds | | | 422,478 | | | | (9,268,371 | ) |
Affiliated Underlying Funds | | | (665,932 | ) | | | (5,206,922 | ) |
Futures contracts | | | 1,024,624 | | | | 288,181 | |
| | | | |
Net change in unrealized gains (losses) on investments | | | 5,111,778 | | | | (14,986,965 | ) |
| | | | |
Net realized and unrealized gains (losses) on investments | | | 3,544,783 | | | | (15,699,861 | ) |
| | | | |
Net increase (decrease) in net assets resulting from operations | | $ | 7,625,652 | | | $ | (14,047,304 | ) |
| | | | |
| | |
* Net of foreign dividend withholding taxes allocated from affiliated Master Portfolios in the amount of | | | $40,754 | | | | $315,336 | |
| 1 | For the period from July 31, 2018 (commencement of class operations) to May 31, 2019 |
The accompanying notes are an integral part of these financial statements.
| | | | | | |
| Statements of operations—year ended May 31, 2019 | | Multi-Asset Funds | | | 51 | |
| | | | | | | | | | |
WealthBuilder
Growth
Allocation Fund | | | WealthBuilder
Growth
Balanced Fund | | | WealthBuilder
Moderate
Balanced Fund | |
| | |
| | | | | | | | | | |
| $ | 903,230 | | | $ | 4,331,633 | | | $ | 5,065,804 | |
| | 1,532,853 | | | | 4,140,055 | | | | 3,815,447 | |
| | 4,328,798 | | | | 6,763,070 | | | | 3,426,665 | |
| | 277,156 | | | | 1,148,560 | | | | 1,259,315 | |
| | 25,777 | | | | 53,685 | | | | 29,388 | |
| | 105,312 | | | | 195,126 | | | | 129,037 | |
| | (616,952 | ) | | | (1,223,441 | ) | | | (875,480 | ) |
| | 54,076 | | | | 95,610 | | | | 59,113 | |
| | |
| | 6,610,250 | | | | 15,504,298 | | | | 12,909,289 | |
| | |
| | |
| | | | | | | | | | |
| | 806,296 | | | | 1,656,627 | | | | 1,229,599 | |
| | | | | | | | | | |
| | 33,001 | | | | 67,090 | | | | 47,664 | |
| | 643,607 | | | | 1,323,442 | | | | 983,167 | |
| | 421 | 1 | | | 641 | 1 | | | 1,258 | 1 |
| | | | | | | | | | |
| | 39,287 | | | | 79,868 | | | | 56,742 | |
| | 766,199 | | | | 1,575,526 | | | | 1,170,437 | |
| | | | | | | | | | |
| | 2,298,269 | | | | 4,726,342 | | | | 3,511,192 | |
| | 54,709 | | | | 78,230 | | | | 61,759 | |
| | 28,648 | | | | 28,652 | | | | 29,155 | |
| | 48,635 | | | | 68,515 | | | | 51,538 | |
| | 42,862 | | | | 76,890 | | | | 51,138 | |
| | 20,981 | | | | 20,981 | | | | 20,797 | |
| | 9,530 | | | | 16,196 | | | | 17,480 | |
| | |
| | 4,792,445 | | | | 9,719,000 | | | | 7,231,926 | |
| | (76,032 | ) | | | (25,159 | ) | | | (35,136 | ) |
| | |
| | 4,716,413 | | | | 9,693,841 | | | | 7,196,790 | |
| | |
| | 1,893,837 | | | | 5,810,457 | | | | 5,712,499 | |
| | |
| | |
| | | | | | | | | | |
| | |
| | | | | | | | | | |
| | (5,634,086 | ) | | | (9,131,239 | ) | | | (5,155,064 | ) |
| | 3,217,340 | | | | 4,010,567 | | | | 791,367 | |
| | 75,630 | | | | 452,312 | | | | 374,974 | |
| | (1,501,664 | ) | | | (1,832,978 | ) | | | (792,306 | ) |
| | 252,647 | | | | 439,200 | | | | 263,820 | |
| | 5,671,669 | | | | 8,696,061 | | | | 4,245,991 | |
| | |
| | 2,081,536 | | | | 2,633,923 | | | | (271,218 | ) |
| | |
| | |
| | | | | | | | | | |
| | 675,410 | | | | 4,218,514 | | | | 5,229,250 | |
| | (5,201,947 | ) | | | (7,131,078 | ) | | | (2,312,681 | ) |
| | (4,162,999 | ) | | | (6,479,974 | ) | | | (3,136,267 | ) |
| | 1,178,937 | | | | 2,410,018 | | | | 1,764,889 | |
| | |
| | (7,510,599 | ) | | | (6,982,520 | ) | | | 1,545,191 | |
| | |
| | (5,429,063 | ) | | | (4,348,597 | ) | | | 1,273,973 | |
| | |
| $ | (3,535,226 | ) | | $ | 1,461,860 | | | $ | 6,986,472 | |
| | |
| | |
| | $179,841 | | | | $277,929 | | | | $138,343 | |
The accompanying notes are an integral part of these financial statements.
| | | | |
| 52 | | Multi-Asset Funds | | Statements of changes in net assets |
| | | | | | | | | | | | | | | | |
| | | WealthBuilder Conservative Allocation Fund | |
| | | Year ended
May 31, 2019 | | | Year ended
May 31, 20181 | |
| | | | |
Operations | | | | | | | | | | | | | | | | |
Net investment income | | | | | | $ | 4,080,869 | | | | | | | $ | 3,989,573 | |
Net realized gains (losses) on investments | | | | | | | (1,566,995 | ) | | | | | | | 29,758,281 | |
Net change in unrealized gains (losses) on investments | | | | | | | 5,111,778 | | | | | | | | (27,795,953 | ) |
| | | | |
Net increase in net assets resulting from operations | | | | | | | 7,625,652 | | | | | | | | 5,951,901 | |
| | | | |
| | | | |
Distributions to shareholders from net investment income and net realized gains | | | | | | | | | | | | | | | | |
Class A | | | | | | | (740,750 | ) | | | | | | | (229,050 | ) |
Class C | | | | | | | (13,613,959 | ) | | | | | | | (20,206,237 | ) |
Institutional Class | | | | | | | (19,276 | )2 | | | | | | | N/A | |
| | | | |
Total distributions to shareholders | | | | | | | (14,373,985 | ) | | | | | | | (20,435,287 | ) |
| | | | |
| | | | |
Capital share transactions | | | Shares | | | | | | | | Shares | | | | | |
Proceeds from shares sold | | | | | | | | | | | | | | | | |
Class A | | | 1,700,659 | | | | 16,886,758 | | | | 441,853 | | | | 4,609,365 | |
Class C | | | 1,017,500 | | | | 9,885,420 | | | | 1,397,260 | | | | 14,441,414 | |
Institutional Class | | | 164,577 | 2 | | | 1,588,897 | 2 | | | N/A | | | | N/A | |
| | | | |
| | | | |
| | | | | | | 28,361,075 | | | | | | | | 19,050,779 | |
| | | | |
Reinvestment of distributions | | | | | | | | | | | | | | | | |
Class A | | | 77,627 | | | | 739,314 | | | | 21,609 | | | | 222,354 | |
Class C | | | 1,428,610 | | | | 13,593,433 | | | | 1,968,929 | | | | 20,172,596 | |
Institutional Class | | | 1,871 | 2 | | | 17,747 | 2 | | | N/A | | | | N/A | |
| | | | |
| | | | |
| | | | | | | 14,350,494 | | | | | | | | 20,394,950 | |
| | | | |
Payment for shares redeemed | | | | | | | | | | | | | | | | |
Class A | | | (575,232 | ) | | | (5,636,147 | ) | | | (437,464 | ) | | | (4,671,561 | ) |
Class C | | | (10,033,613 | ) | | | (99,336,835 | ) | | | (12,071,518 | ) | | | (126,129,049 | ) |
Institutional Class | | | (122,168 | )2 | | | (1,191,536 | )2 | | | N/A | | | | N/A | |
| | | | |
| | | | |
| | | | | | | (106,164,518 | ) | | | | | | | (130,800,610 | ) |
| | | | |
Net decrease in net assets resulting from capital share transactions | | | | | | | (63,452,949 | ) | | | | | | | (91,354,881 | ) |
| | | | |
Total decrease in net assets | | | | | | | (70,201,282 | ) | | | | | | | (105,838,267 | ) |
| | | | |
| | | | |
Net assets | | | | | | | | | | | | | | | | |
Beginning of period | | | | | | | 324,030,215 | | | | | | | | 429,868,482 | |
| | | | |
End of period | | | | | | $ | 253,828,933 | | | | | | | $ | 324,030,215 | |
| | | | |
| 1 | Effective for all filings after November 4, 2018, the SEC prospectively eliminated the requirement to parenthetically disclose undistributed net investment income at the end of the period and permitted the aggregation of distributions, with the exception of tax basis returns of capital. Undistributed net investment income at May 31, 2018 was $722,443. The disaggregated distributions information for the year ended May 31, 2018 is included in Note 8,Distributions to Shareholders, in the notes to the financial statements. |
| 2 | For the period from July 31, 2018 (commencement of class operations) to May 31, 2019 |
The accompanying notes are an integral part of these financial statements.
| | | | | | |
| Statements of changes in net assets | | Multi-Asset Funds | | | 53 | |
| | | | | | | | | | | | | | | | |
| | | WealthBuilder Equity Fund | |
| | | Year ended
May 31, 2019 | | | Year ended
May 31, 20181 | |
| | | | |
Operations | | | | | | | | | | | | | | | | |
Net investment income (loss) | | | | | | $ | 1,652,557 | | | | | | | $ | (544,542 | ) |
Net realized gains (losses) on investments | | | | | | | (712,896 | ) | | | | | | | 158,196,375 | |
Net change in unrealized gains (losses) on investments | | | | | | | (14,986,965 | ) | | | | | | | (97,817,126 | ) |
| | | | |
Net increase (decrease) in net assets resulting from operations | | | | | | | (14,047,304 | ) | | | | | | | 59,834,707 | |
| | | | |
| | | | |
Distributions to shareholders from net investment income and net realized gains | | | | | | | | | | | | | | | | |
Class A | | | | | | | (6,781,481 | ) | | | | | | | (502,275 | ) |
Class C | | | | | | | (65,563,410 | ) | | | | | | | (79,982,709 | ) |
Institutional Class | | | | | | | (167,781 | )2 | | | | | | | N/A | |
| | | | |
Total distributions to shareholders | | | | | | | (72,512,672 | ) | | | | | | | (80,484,984 | ) |
| | | | |
| | | | |
Capital share transactions | | | Shares | | | | | | | | Shares | | | | | |
Proceeds from shares sold | | | | | | | | | | | | | | | | |
Class A | | | 2,426,481 | | | | 48,555,252 | | | | 131,029 | | | | 2,846,777 | |
Class C | | | 945,150 | | | | 17,736,143 | | | | 637,060 | | | | 13,677,332 | |
Institutional Class | | | 178,964 | 2 | | | 3,217,616 | 2 | | | N/A | | | | N/A | |
| | | | |
| | | | |
| | | | | | | 69,509,011 | | | | | | | | 16,524,109 | |
| | | | |
Reinvestment of distributions | | | | | | | | | | | | | | | | |
Class A | | | 422,258 | | | | 6,777,270 | | | | 24,274 | | | | 497,866 | |
Class C | | | 4,131,618 | | | | 65,508,147 | | | | 3,925,023 | | | | 79,874,225 | |
Institutional Class | | | 10,174 | 2 | | | 163,731 | 2 | | | N/A | | | | N/A | |
| | | | |
| | | | |
| | | | | | | 72,449,148 | | | | | | | | 80,372,091 | |
| | | | |
Payment for shares redeemed | | | | | | | | | | | | | | | | |
Class A | | | (464,860 | ) | | | (8,044,037 | ) | | | (38,943 | ) | | | (846,144 | ) |
Class C | | | (7,536,636 | ) | | | (141,072,542 | ) | | | (5,316,752 | ) | | | (114,225,285 | ) |
Institutional Class | | | (118,340 | )2 | | | (1,982,012 | )2 | | | N/A | | | | N/A | |
| | | | |
| | | | |
| | | | | | | (151,098,591 | ) | | | | | | | (115,071,429 | ) |
| | | | |
Net decrease in net assets resulting from capital share transactions | | | | | | | (9,140,432 | ) | | | | | | | (18,175,229 | ) |
| | | | |
Total decrease in net assets | | | | | | | (95,700,408 | ) | | | | | | | (38,825,506 | ) |
| | | | |
| | | | |
Net assets | | | | | | | | | | | | | | | | |
Beginning of period | | | | | | | 495,296,991 | | | | | | | | 534,122,497 | |
| | | | |
End of period | | | | | | $ | 399,596,583 | | | | | | | $ | 495,296,991 | |
| | | | |
| 1 | Effective for all filings after November 4, 2018, the SEC prospectively eliminated the requirement to parenthetically disclose undistributed net investment income at the end of the period and permitted the aggregation of distributions, with the exception of tax basis returns of capital. Accumulated net investment loss at May 31, 2018 was $(247,963). The disaggregated distributions information for the year ended May 31, 2018 is included in Note 8,Distributions to Shareholders, in the notes to the financial statements. |
| 2 | For the period from July 31, 2018 (commencement of class operations) to May 31, 2019 |
The accompanying notes are an integral part of these financial statements.
| | | | |
| 54 | | Multi-Asset Funds | | Statements of changes in net assets |
| | | | | | | | | | | | | | | | |
| | | WealthBuilder Growth Allocation Fund | |
| | | Year ended
May 31, 2019 | | | Year ended
May 31, 20181 | |
| | | | |
Operations | | | | | | | | | | | | | | | | |
Net investment income | | | | | | $ | 1,893,837 | | | | | | | $ | 1,049,334 | |
Net realized gains on investments | | | | | | | 2,081,536 | | | | | | | | 87,783,129 | |
Net change in unrealized gains (losses) on investments | | | | | | | (7,510,599 | ) | | | | | | | (52,289,593 | ) |
| | | | |
Net increase (decrease) in net assets resulting from operations | | | | | | | (3,535,226 | ) | | | | | | | 36,542,870 | |
| | | | |
| | | | |
Distributions to shareholders from net investment income and net realized gains | | | | | | | | | | | | | | | | |
Class A | | | | | | | (3,138,679 | ) | | | | | | | (206,167 | ) |
Class C | | | | | | | (42,918,189 | ) | | | | | | | (48,737,139 | ) |
Institutional Class | | | | | | | (61,181 | )2 | | | | | | | N/A | |
| | | | |
Total distributions to shareholders | | | | | | | (46,118,049 | ) | | | | | | | (48,943,306 | ) |
| | | | |
| | | | |
Capital share transactions | | | Shares | | | | | | | | Shares | | | | | |
Proceeds from shares sold | | | | | | | | | | | | | | | | |
Class A | | | 2,036,222 | | | | 27,117,968 | | | | 131,674 | | | | 1,942,532 | |
Class C | | | 847,864 | | | | 10,888,924 | | | | 1,149,221 | | | | 16,940,690 | |
Institutional Class | | | 265,048 | 2 | | | 3,276,689 | 2 | | | N/A | | | | N/A | |
| | | | |
| | | | |
| | | | | | | 41,283,581 | | | | | | | | 18,883,222 | |
| | | | |
Reinvestment of distributions | | | | | | | | | | | | | | | | |
Class A | | | 279,666 | | | | 3,134,820 | | | | 14,554 | | | | 202,164 | |
Class C | | | 3,772,440 | | | | 42,874,982 | | | | 3,459,661 | | | | 48,677,424 | |
Institutional Class | | | 5,132 | 2 | | | 57,371 | 2 | | | N/A | | | | N/A | |
| | | | |
| | | | |
| | | | | | | 46,067,173 | | | | | | | | 48,879,588 | |
| | | | |
Payment for shares redeemed | | | | | | | | | | | | | | | | |
Class A | | | (436,105 | ) | | | (5,180,494 | ) | | | (25,928 | ) | | | (381,384 | ) |
Class C | | | (7,662,224 | ) | | | (100,301,573 | ) | | | (6,993,305 | ) | | | (102,141,480 | ) |
Institutional Class | | | (209,782 | )2 | | | (2,567,803 | )2 | | | N/A | | | | N/A | |
| | | | |
| | | | |
| | | | | | | (108,049,870 | ) | | | | | | | (102,522,864 | ) |
| | | | |
Net decrease in net assets resulting from capital share transactions | | | | | | | (20,699,116 | ) | | | | | | | (34,760,054 | ) |
| | | | |
Total decrease in net assets | | | | | | | (70,352,391 | ) | | | | | | | (47,160,490 | ) |
| | | | |
| | | | |
Net assets | | | | | | | | | | | | | | | | |
Beginning of period | | | | | | | 356,193,660 | | | | | | | | 403,354,150 | |
| | | | |
End of period | | | | | | $ | 285,841,269 | | | | | | | $ | 356,193,660 | |
| | | | |
| 1 | Effective for all filings after November 4, 2018, the SEC prospectively eliminated the requirement to parenthetically disclose undistributed net investment income at the end of the period and permitted the aggregation of distributions, with the exception of tax basis returns of capital. Undistributed net investment income at May 31, 2018 was $1,065,126. The disaggregated distributions information for the year ended May 31, 2018 is included in Note 8,Distributions to Shareholders, in the notes to the financial statements. |
| 2 | For the period from July 31, 2018 (commencement of class operations) to May 31, 2019 |
The accompanying notes are an integral part of these financial statements.
| | | | | | |
| Statements of changes in net assets | | Multi-Asset Funds | | | 55 | |
| | | | | | | | | | | | | | | | |
| | | WealthBuilder Growth Balanced Fund | |
| | | Year ended
May 31, 2019 | | | Year ended
May 31, 20181 | |
| | | | |
Operations | | | | | | | | | | | | | | | | |
Net investment income | | | | | | $ | 5,810,457 | | | | | | | $ | 4,643,783 | |
Net realized gains on investments | | | | | | | 2,633,923 | | | | | | | | 155,068,922 | |
Net change in unrealized gains (losses) on investments | | | | | | | (6,982,520 | ) | | | | | | | (104,030,093 | ) |
| | | | |
Net increase in net assets resulting from operations | | | | | | | 1,461,860 | | | | | | | | 55,682,612 | |
| | | | |
| | | | |
Distributions to shareholders from net investment income and net realized gains | | | | | | | | | | | | | | | | |
Class A | | | | | | | (5,344,460 | ) | | | | | | | (357,125 | ) |
Class C | | | | | | | (69,709,208 | ) | | | | | | | (95,884,883 | ) |
Institutional Class | | | | | | | (77,211 | )2 | | | | | | | N/A | |
| | | | |
Total distributions to shareholders | | | | | | | (75,130,879 | ) | | | | | | | (96,242,008 | ) |
| | | | |
| | | | |
Capital share transactions | | | Shares | | | | | | | | Shares | | | | | |
Proceeds from shares sold | | | | | | | | | | | | | | | | |
Class A | | | 4,148,800 | | | | 54,057,256 | | | | 169,082 | | | | 2,407,771 | |
Class C | | | 1,419,289 | | | | 17,942,360 | | | | 1,968,361 | | | | 27,821,771 | |
Institutional Class | | | 336,006 | 2 | | | 4,026,264 | 2 | | | N/A | | | | N/A | |
| | | | |
| | | | |
| | | | | | | 76,025,880 | | | | | | | | 30,229,542 | |
| | | | |
Reinvestment of distributions | | | | | | | | | | | | | | | | |
Class A | | | 474,395 | | | | 5,341,393 | | | | 26,490 | | | | 353,378 | |
Class C | | | 6,102,231 | | | | 69,643,294 | | | | 7,084,829 | | | | 95,786,890 | |
Institutional Class | | | 6,601 | 2 | | | 74,079 | 2 | | | N/A | | | | N/A | |
| | | | |
| | | | |
| | | | | | | 75,058,766 | | | | | | | | 96,140,268 | |
| | | | |
Payment for shares redeemed | | | | | | | | | | | | | | | | |
Class A | | | (868,338 | ) | | | (10,442,394 | ) | | | (69,946 | ) | | | (999,776 | ) |
Class C | | | (16,626,587 | ) | | | (212,253,060 | ) | | | (15,518,833 | ) | | | (218,962,882 | ) |
Institutional Class | | | (251,056 | )2 | | | (2,984,069 | )2 | | | N/A | | | | N/A | |
| | | | |
| | | | |
| | | | | | | (225,679,523 | ) | | | | | | | (219,962,658 | ) |
| | | | |
Net decrease in net assets resulting from capital share transactions | | | | | | | (74,594,877 | ) | | | | | | | (93,592,848 | ) |
| | | | |
Total decrease in net assets | | | | | | | (148,263,896 | ) | | | | | | | (134,152,244 | ) |
| | | | |
| | | | |
Net assets | | | | | | | | | | | | | | | | |
Beginning of period | | | | | | | 735,062,702 | | | | | | | | 869,214,946 | |
| | | | |
End of period | | | | | | $ | 586,798,806 | | | | | | | $ | 735,062,702 | |
| | | | |
| 1 | Effective for all filings after November 4, 2018, the SEC prospectively eliminated the requirement to parenthetically disclose undistributed net investment income at the end of the period and permitted the aggregation of distributions, with the exception of tax basis returns of capital. Undistributed net investment income at May 31, 2018 was $1,130,399. The disaggregated distributions information for the year ended May 31, 2018 is included in Note 8,Distributions to Shareholders, in the notes to the financial statements. |
| 2 | For the period from July 31, 2018 (commencement of class operations) to May 31, 2019 |
The accompanying notes are an integral part of these financial statements.
| | | | |
| 56 | | Multi-Asset Funds | | Statements of changes in net assets |
| | | | | | | | | | | | | | | | |
| | | WealthBuilder Moderate Balanced Fund | |
| | | Year ended
May 31, 2019 | | | Year ended
May 31, 20181 | |
| | | | |
Operations | | | | | | | | | | | | | | | | |
Net investment income | | | | | | $ | 5,712,499 | | | | | | | $ | 5,243,262 | |
Net realized gains (losses) on investments | | | | | | | (271,218 | ) | | | | | | | 83,896,886 | |
Net change in unrealized gains (losses) on investments | | | | | | | 1,545,191 | | | | | | | | (61,583,718 | ) |
| | | | |
Net increase in net assets resulting from operations | | | | | | | 6,986,472 | | | | | | | | 27,556,430 | |
| | | | |
| | | | |
Distributions to shareholders from net investment income and net realized gains | | | | | | | | | | | | | | | | |
Class A | | | | | | | (2,146,382 | ) | | | | | | | (321,280 | ) |
Class C | | | | | | | (30,232,848 | ) | | | | | | | (62,978,713 | ) |
Institutional Class | | | | | | | (74,178 | )2 | | | | | | | N/A | |
| | | | |
Total distributions to shareholders | | | | | | | (32,453,408 | ) | | | | | | | (63,300,993 | ) |
| | | | |
| | | | |
Capital share transactions | | | Shares | | | | | | | | Shares | | | | | |
Proceeds from shares sold | | | | | | | | | | | | | | | | |
Class A | | | 3,677,957 | | | | 39,561,183 | | | | 265,285 | | | | 3,112,449 | |
Class C | | | 1,228,264 | | | | 13,112,373 | | | | 1,532,312 | | | | 17,999,411 | |
Institutional Class | | | 569,268 | 2 | | | 5,892,542 | 2 | | | N/A | | | | N/A | |
| | | | |
| | | | |
| | | | | | | 58,566,098 | | | | | | | | 21,111,860 | |
| | | | |
Reinvestment of distributions | | | | | | | | | | | | | | | | |
Class A | | | 214,360 | | | | 2,144,579 | | | | 28,649 | | | | 319,076 | |
Class C | | �� | 2,974,197 | | | | 30,204,676 | | | | 5,537,712 | | | | 62,820,690 | |
Institutional Class | | | 7,289 | 2 | | | 72,276 | 2 | | | N/A | | | | N/A | |
| | | | |
| | | | |
| | | | | | | 32,421,531 | | | | | | | | 63,139,766 | |
| | | | |
Payment for shares redeemed | | | | | | | | | | | | | | | | |
Class A | | | (829,255 | ) | | | (8,576,195 | ) | | | (112,799 | ) | | | (1,291,924 | ) |
Class C | | | (17,126,410 | ) | | | (185,476,591 | ) | | | (16,475,285 | ) | | | (193,483,340 | ) |
Institutional Class | | | (400,384 | )2 | | | (4,155,113 | )2 | | | N/A | | | | N/A | |
| | | | |
| | | | |
| | | | | | | (198,207,899 | ) | | | | | | | (194,775,264 | ) |
| | | | |
Net decrease in net assets resulting from capital share transactions | | | | | | | (107,220,270 | ) | | | | | | | (110,523,638 | ) |
| | | | |
Total decrease in net assets | | | | | | | (132,687,206 | ) | | | | | | | (146,268,201 | ) |
| | | | |
| | | | |
Net assets | | | | | | | | | | | | | | | | |
Beginning of period | | | | | | | 561,815,854 | | | | | | | | 708,084,055 | |
| | | | |
End of period | | | | | | $ | 429,128,648 | | | | | | | $ | 561,815,854 | |
| | | | |
| 1 | Effective for all filings after November 4, 2018, the SEC prospectively eliminated the requirement to parenthetically disclose undistributed net investment income at the end of the period and permitted the aggregation of distributions, with the exception of tax basis returns of capital. Undistributed net investment income at May 31, 2018 was $1,433,310. The disaggregated distributions information for the year ended May 31, 2018 is included in Note 8,Distributions to Shareholders, in the notes to the financial statements. |
| 2 | For the period from July 31, 2018 (commencement of class operations) to May 31, 2019 |
The accompanying notes are an integral part of these financial statements.
This page is intentionally left blank.
| | | | |
| 58 | | Multi-Asset Funds | | Financial highlights |
| | | | | | | | | | | | | | | | | | | | | | | | |
| WealthBuilder Conservative Allocation Fund | | Beginning
net asset
value per
share | | | Net
investment
income | | | Net realized
and unrealized
gains (losses)
on investments | | | Distributions
from net
investment
income | | | Distributions
from net
realized gains | | | Ending
net asset
value per
share | |
| | | | | | |
Class A | | | | | | | | | | | | | | | | | | | | | | | | |
Year ended May 31, 2019 | | $ | 10.05 | | | | 0.18 | | | | 0.18 | | | | (0.19 | ) | | | (0.40 | ) | | $ | 9.82 | |
Year ended May 31, 2018 | | $ | 10.52 | | | | 0.20 | | | | 0.02 | | | | (0.19 | ) | | | (0.50 | ) | | $ | 10.05 | |
Year ended May 31, 20174 | | $ | 10.34 | | | | 0.04 | | | | 0.18 | | | | (0.04 | ) | | | 0.00 | | | $ | 10.52 | |
| | | | | | |
Class C5 | | | | | | | | | | | | | | | | | | | | | | | | |
Year ended May 31, 2019 | | $ | 10.06 | | | | 0.14 | 6 | | | 0.13 | | | | (0.12 | ) | | | (0.40 | ) | | $ | 9.81 | |
Year ended May 31, 2018 | | $ | 10.51 | | | | 0.11 | | | | 0.04 | | | | (0.10 | ) | | | (0.50 | ) | | $ | 10.06 | |
Year ended May 31, 2017 | | $ | 10.33 | | | | 0.07 | | | | 0.38 | | | | (0.10 | ) | | | (0.17 | ) | | $ | 10.51 | |
Year ended May 31, 2016 | | $ | 10.82 | | | | 0.07 | | | | (0.20 | ) | | | (0.08 | ) | | | (0.28 | ) | | $ | 10.33 | |
Year ended May 31, 2015 | | $ | 10.92 | | | | 0.04 | | | | 0.15 | | | | (0.05 | ) | | | (0.24 | ) | | $ | 10.82 | |
| | | | | | |
Institutional Class | | | | | | | | | | | | | | | | | | | | | | | | |
Year ended May 31, 20197 | | $ | 10.15 | | | | 0.15 | | | | 0.12 | | | | (0.22 | ) | | | (0.40 | ) | | $ | 9.80 | |
| 1 | Ratios do not include expenses of the Underlying Funds. Including net expenses allocated from the affiliated Master Portfolios, the expense ratios would be increased by the following amounts: |
| | | | | | | | | | | | | | | | | | | | |
| | | Year ended May 31 | |
| | | 2019 | | | 2018 | | | 2017 | | | 2016 | | | 2015 | |
Class A | | | 0.16 | % | | | 0.13 | % | | | 0.11 | %4 | | | N/A | | | | N/A | |
Class C5 | | | 0.16 | % | | | 0.13 | % | | | 0.11 | % | | | 0.11 | % | | | 0.11 | % |
Institutional Class | | | 0.16 | %7 | | | N/A | | | | N/A | | | | N/A | | | | N/A | |
| 2 | Total return calculations do not include any sales charges. Returns for periods of less than one year are not annualized. |
| 3 | Portfolio turnover rate is calculated by multiplying the Fund’s ownership percentage in the respective affiliated Master Portfolio by the corresponding affiliated Master Portfolio’s purchases and sales. These purchase and sale amounts are aggregated with the direct purchases and sales in Underlying Funds and included in the portfolio turnover calculation. |
| 4 | For the period from February 10, 2017 (commencement of class operations) to May 31, 2017 |
| 5 | Effective at the close of business on February 10, 2017, the Fund’s existing share class, WealthBuilder Portfolio shares, was renamed Class C. |
| 6 | Calculated based upon average shares outstanding |
| 7 | For the period from July 31, 2018 (commencement of class operations) to May 31, 2019 |
The accompanying notes are an integral part of these financial statements.
| | | | | | |
| Financial highlights | | Multi-Asset Funds | | | 59 | |
| | | | | | | | | | | | | | | | | | | | | | |
| Ratio to average net assets (annualized) | | | Total
return2 | | | Portfolio
turnover
rate3 | | | Net assets at
end of period
(000s omitted) | |
Net investment
income | | | Gross
expenses1 | | | Net
expenses1 | |
| | | | | |
| | | | | | | | | | | | | | | | | | | | | | |
| | 2.15 | % | | | 0.79 | % | | | 0.75 | % | | | 3.84 | % | | | 183 | % | | $ | 16,242 | |
| | 1.81 | % | | | 0.77 | % | | | 0.75 | % | | | 2.05 | % | | | 192 | % | | $ | 4,532 | |
| | 1.34 | % | | | 0.76 | % | | | 0.75 | % | | | 2.14 | % | | | 175 | % | | $ | 4,468 | |
| | | | | |
| | | | | | | | | | | | | | | | | | | | | | |
| | 1.41 | % | | | 1.54 | % | | | 1.50 | % | | | 2.89 | % | | | 183 | % | | $ | 237,153 | |
| | 1.05 | % | | | 1.52 | % | | | 1.50 | % | | | 1.37 | % | | | 192 | % | | $ | 319,498 | |
| | 0.72 | % | | | 1.50 | % | | | 1.50 | % | | | 4.42 | % | | | 175 | % | | $ | 425,400 | |
| | 0.68 | % | | | 1.51 | % | | | 1.50 | % | | | (1.11 | )% | | | 198 | % | | $ | 523,832 | |
| | 0.34 | % | | | 1.55 | % | | | 1.50 | % | | | 1.75 | % | | | 169 | % | | $ | 545,059 | |
| | | | | |
| | | | | | | | | | | | | | | | | | | | | | |
| | 1.61 | % | | | 0.46 | % | | | 0.42 | % | | | 2.95 | % | | | 183 | % | | $ | 434 | |
The accompanying notes are an integral part of these financial statements.
| | | | |
| 60 | | Multi-Asset Funds | | Financial highlights |
| | | | | | | | | | | | | | | | | | | | | | | | |
| WealthBuilder Equity Fund | | Beginning
net asset
value per
share | | | Net
investment
income (loss) | | | Net realized
and unrealized
gains (losses)
on investments | | | Distributions
from net
investment
income | | | Distributions
from net
realized gains | | | Ending
net asset
value per
share | |
| | | | | | |
Class A | | | | | | | | | | | | | | | | | | | | | | | | |
Year ended May 31, 2019 | | $ | 20.55 | | | | 0.17 | 4 | | | (0.81 | ) | | | (0.26 | ) | | | (3.13 | ) | | $ | 16.52 | |
Year ended May 31, 2018 | | $ | 21.41 | | | | 0.10 | | | | 2.59 | | | | 0.00 | | | | (3.55 | ) | | $ | 20.55 | |
Year ended May 31, 20175 | | $ | 20.15 | | | | (0.02 | )4 | | | 1.28 | | | | 0.00 | | | | 0.00 | | | $ | 21.41 | |
| | | | | | |
Class C6 | | | | | | | | | | | | | | | | | | | | | | | | |
Year ended May 31, 2019 | | $ | 20.33 | | | | 0.06 | | | | (0.82 | ) | | | (0.05 | ) | | | (3.13 | ) | | $ | 16.39 | |
Year ended May 31, 2018 | | $ | 21.36 | | | | (0.02 | )4 | | | 2.54 | | | | 0.00 | | | | (3.55 | ) | | $ | 20.33 | |
Year ended May 31, 2017 | | $ | 18.25 | | | | (0.07 | ) | | | 3.19 | | | | 0.00 | | | | (0.01 | ) | | $ | 21.36 | |
Year ended May 31, 2016 | | $ | 19.44 | | | | (0.08 | ) | | | (1.11 | ) | | | 0.00 | | | | 0.00 | | | $ | 18.25 | |
Year ended May 31, 2015 | | $ | 18.07 | | | | (0.08 | ) | | | 1.45 | | | | 0.00 | | | | 0.00 | | | $ | 19.44 | |
| | | | | | |
Institutional Class | | | | | | | | | | | | | | | | | | | | | | | | |
Year ended May 31, 20197 | | $ | 21.08 | | | | 0.14 | | | | (1.26 | ) | | | (0.28 | ) | | | (3.13 | ) | | $ | 16.55 | |
| 1 | Ratios do not include expenses of the Underlying Funds. Including net expenses allocated from the affiliated Master Portfolios, the expense ratios would be increased by the following amounts: |
| | | | | | | | | | | | | | | | | | | | |
| | | Year ended May 31 | |
| | | 2019 | | | 2018 | | | 2017 | | | 2016 | | | 2015 | |
Class A | | | 0.18 | % | | | 0.12 | % | | | 0.12 | %4 | | | N/A | | | | N/A | |
Class C6 | | | 0.18 | % | | | 0.12 | % | | | 0.12 | % | | | 0.12 | % | | | 0.12 | % |
Institutional Class | | | 0.18 | %7 | | | N/A | | | | N/A | | | | N/A | | | | N/A | |
| 2 | Total return calculations do not include any sales charges. Returns for periods of less than one year are not annualized. |
| 3 | Portfolio turnover rate is calculated by multiplying the Fund’s ownership percentage in the respective affiliated Master Portfolio by the corresponding affiliated Master Portfolio’s purchases and sales. These purchase and sale amounts are aggregated with the direct purchases and sales in Underlying Funds and included in the portfolio turnover calculation. |
| 4 | Calculated based upon average shares outstanding |
| 5 | For the period from February 10, 2017 (commencement of class operations) to May 31, 2017 |
| 6 | Effective at the close of business on February 10, 2017, the Fund’s existing share class, WealthBuilder Portfolio shares, was renamed Class C. |
| 7 | For the period from July 31, 2018 (commencement of class operations) to May 31, 2019 |
The accompanying notes are an integral part of these financial statements.
| | | | | | |
| Financial highlights | | Multi-Asset Funds | | | 61 | |
| | | | | | | | | | | | | | | | | | | | | | |
| Ratio to average net assets (annualized) | | | Total
return2 | | |
Portfolio
turnover
rate3 | | | Net assets at
end of period
(000s omitted) | |
Net investment
income (loss) | | | Gross
expenses1 | | | Net
expenses1 | |
| | | | | |
| | | | | | | | | | | | | | | | | | | | | | |
| | 0.97 | % | | | 0.76 | % | | | 0.75 | % | | | (2.35 | )% | | | 78 | % | | $ | 42,588 | |
| | 0.75 | % | | | 0.75 | % | | | 0.75 | % | | | 12.61 | % | | | 63 | % | | $ | 3,993 | |
| | (0.30 | )% | | | 0.75 | % | | | 0.75 | % | | | 6.25 | % | | | 30 | % | | $ | 1,669 | |
| | | | | |
| | | | | | | | | | | | | | | | | | | | | | |
| | 0.32 | % | | | 1.51 | % | | | 1.50 | % | | | (3.16 | )% | | | 78 | % | | $ | 355,837 | |
| | (0.10 | )% | | | 1.50 | % | | | 1.50 | % | | | 11.80 | % | | | 63 | % | | $ | 491,304 | |
| | (0.37 | )% | | | 1.50 | % | | | 1.50 | % | | | 17.07 | % | | | 30 | % | | $ | 532,454 | |
| | (0.46 | )% | | | 1.51 | % | | | 1.50 | % | | | (6.12 | )% | | | 27 | % | | $ | 423,109 | |
| | (0.44 | )% | | | 1.55 | % | | | 1.50 | % | | | 7.58 | % | | | 27 | % | | $ | 452,296 | |
| | | | | |
| | | | | | | | | | | | | | | | | | | | | | |
| | 0.49 | % | | | 0.43 | % | | | 0.42 | % | | | (4.54 | )% | | | 78 | % | | $ | 1,172 | |
The accompanying notes are an integral part of these financial statements.
| | | | |
| 62 | | Multi-Asset Funds | | Financial highlights |
| | | | | | | | | | | | | | | | | | | | | | | | |
| WealthBuilder Growth Allocation Fund | | Beginning
net asset
value per
share | | | Net
investment
income (loss) | | | Net realized
and unrealized
gains (losses)
on investments | | | Distributions
from net
investment
income | | | Distributions
from net
realized gains | | | Ending
net asset
value per
share | |
| | | | | | |
Class A | | | | | | | | | | | | | | | | | | | | | | | | |
Year ended May 31, 2019 | | $ | 13.88 | | | | 0.14 | 4 | | | (0.30 | ) | | | (0.23 | ) | | | (1.92 | ) | | $ | 11.57 | |
Year ended May 31, 2018 | | $ | 14.60 | | | | 0.12 | | | | 1.39 | | | | (0.30 | ) | | | (1.93 | ) | | $ | 13.88 | |
Year ended May 31, 20175 | | $ | 13.92 | | | | 0.01 | 4 | | | 0.67 | | | | 0.00 | | | | 0.00 | | | $ | 14.60 | |
| | | | | | |
Class C6 | | | | | | | | | | | | | | | | | | | | | | | | |
Year ended May 31, 2019 | | $ | 14.02 | | | | 0.08 | | | | (0.33 | ) | | | (0.07 | ) | | | (1.92 | ) | | $ | 11.78 | |
Year ended May 31, 2018 | | $ | 14.58 | | | | 0.04 | | | | 1.34 | | | | (0.01 | ) | | | (1.93 | ) | | $ | 14.02 | |
Year ended May 31, 2017 | | $ | 13.39 | | | | (0.01 | )4 | | | 1.84 | | | | 0.00 | | | | (0.64 | ) | | $ | 14.58 | |
Year ended May 31, 2016 | | $ | 14.92 | | | | (0.01 | ) | | | (0.71 | ) | | | (0.04 | ) | | | (0.77 | ) | | $ | 13.39 | |
Year ended May 31, 2015 | | $ | 14.78 | | | | (0.02 | ) | | | 0.89 | | | | (0.12 | ) | | | (0.61 | ) | | $ | 14.92 | |
| | | | | | |
Institutional Class | | | | | | | | | | | | | | | | | | | | | | | | |
Year ended May 31, 20197 | | $ | 14.20 | | | | 0.18 | | | | (0.65 | ) | | | (0.24 | ) | | | (1.92 | ) | | $ | 11.57 | |
| 1 | Ratios do not include expenses of the Underlying Funds. Including net expenses allocated from the affiliated Master Portfolios, the expense ratios would be increased by the following amounts: |
| | | | | | | | | | | | | | | | | | | | |
| | | Year ended May 31 | |
| | | 2019 | | | 2018 | | | 2017 | | | 2016 | | | 2015 | |
Class A | | | 0.17 | % | | | 0.12 | % | | | 0.11 | %5 | | | N/A | | | | N/A | |
Class C6 | | | 0.17 | % | | | 0.12 | % | | | 0.11 | % | | | 0.11 | % | | | 0.11 | % |
Institutional Class | | | 0.17 | %7 | | | N/A | | | | N/A | | | | N/A | | | | N/A | |
| 2 | Total return calculations do not include any sales charges. Returns for periods of less than one year are not annualized. |
| 3 | Portfolio turnover rate is calculated by multiplying the Fund’s ownership percentage in the respective affiliated Master Portfolio by the corresponding affiliated Master Portfolio’s purchases and sales. These purchase and sale amounts are aggregated with the direct purchases and sales in Underlying Funds and included in the portfolio turnover calculation. |
| 4 | Calculated based upon average shares outstanding |
| 5 | For the period from February 10, 2017 (commencement of class operations) to May 31, 2017 |
| 6 | Effective at the close of business on February 10, 2017, the Fund’s existing share class, WealthBuilder Portfolio shares, was renamed Class C. |
| 7 | For the period from July 31, 2018 (commencement of class operations) to May 31, 2019 |
The accompanying notes are an integral part of these financial statements.
| | | | | | |
| Financial highlights | | Multi-Asset Funds | | | 63 | |
| | | | | | | | | | | | | | | | | | | | | | |
| Ratio to average net assets (annualized) | | | Total
return2 | | | Portfolio
turnover
rate3 | | | Net assets at
end of period
(000s omitted) | |
Net investment
income (loss) | | | Gross
expenses1 | | | Net
expenses1 | |
| | | | | |
| | | | | | | | | | | | | | | | | | | | | | |
| | 1.20 | % | | | 0.78 | % | | | 0.75 | % | | | (0.38 | )% | | | 97 | % | | $ | 23,420 | |
| | 1.07 | % | | | 0.76 | % | | | 0.75 | % | | | 10.33 | % | | | 93 | % | | $ | 2,009 | |
| | 0.16 | % | | | 0.76 | % | | | 0.75 | % | | | 4.89 | % | | | 58 | % | | $ | 357 | |
| | | | | |
| | | | | | | | | | | | | | | | | | | | | | |
| | 0.56 | % | | | 1.52 | % | | | 1.50 | % | | | (1.12 | )% | | | 97 | % | | $ | 261,722 | |
| | 0.26 | % | | | 1.51 | % | | | 1.50 | % | | | 9.45 | % | | | 93 | % | | $ | 354,185 | |
| | (0.06 | )% | | | 1.51 | % | | | 1.50 | % | | | 14.05 | % | | | 58 | % | | $ | 402,997 | |
| | (0.06 | )% | | | 1.51 | % | | | 1.50 | % | | | (4.79 | )% | | | 59 | % | | $ | 429,628 | |
| | (0.20 | )% | | | 1.55 | % | | | 1.50 | % | | | 6.14 | % | | | 53 | % | | $ | 451,139 | |
| | | | | |
| | | | | | | | | | | | | | | | | | | | | | |
| | 1.84 | % | | | 0.45 | % | | | 0.42 | % | | | (2.47 | )% | | | 97 | % | | $ | 699 | |
The accompanying notes are an integral part of these financial statements.
| | | | |
| 64 | | Multi-Asset Funds | | Financial highlights |
| | | | | | | | | | | | | | | | | | | | | | | | |
| WealthBuilder Growth Balanced Fund | | Beginning
net asset
value per
share | | | Net
investment
income | | | Net realized
and unrealized
gains (losses)
on investments | | | Distributions
from net
investment
income | | | Distributions
from net
realized gains | | | Ending
net asset
value per
share | |
| | | | | | |
Class A | | | | | | | | | | | | | | | | | | | | | | | | |
Year ended May 31, 2019 | | $ | 13.27 | | | | 0.18 | 4 | | | (0.14 | ) | | | (0.23 | ) | | | (1.44 | ) | | $ | 11.64 | |
Year ended May 31, 2018 | | $ | 14.24 | | | | 0.19 | 4 | | | 0.89 | | | | (0.42 | ) | | | (1.63 | ) | | $ | 13.27 | |
Year ended May 31, 20175 | | $ | 13.68 | | | | 0.01 | | | | 0.55 | | | | 0.00 | | | | 0.00 | | | $ | 14.24 | |
| | | | | | |
Class C6 | | | | | | | | | | | | | | | | | | | | | | | | |
Year ended May 31, 2019 | | $ | 13.40 | | | | 0.11 | | | | (0.14 | ) | | | (0.08 | ) | | | (1.44 | ) | | $ | 11.85 | |
Year ended May 31, 2018 | | $ | 14.21 | | | | 0.09 | | | | 0.87 | | | | (0.14 | ) | | | (1.63 | ) | | $ | 13.40 | |
Year ended May 31, 2017 | | $ | 13.29 | | | | 0.05 | | | | 1.40 | | | | 0.00 | | | | (0.53 | ) | | $ | 14.21 | |
Year ended May 31, 2016 | | $ | 14.52 | | | | 0.03 | | | | (0.53 | ) | | | (0.06 | ) | | | (0.67 | ) | | $ | 13.29 | |
Year ended May 31, 2015 | | $ | 14.42 | | | | 0.01 | | | | 0.67 | | | | (0.10 | ) | | | (0.48 | ) | | $ | 14.52 | |
| | | | | | |
Institutional Class | | | | | | | | | | | | | | | | | | | | | | | | |
Year ended May 31, 20197 | | $ | 13.52 | | | | 0.15 | | | | (0.33 | ) | | | (0.25 | ) | | | (1.44 | ) | | $ | 11.65 | |
| 1 | Ratios do not include expenses of the Underlying Funds. Including net expenses allocated from the affiliated Master Portfolios, the expense ratios would be increased by the following amounts: |
| | | | | | | | | | | | | | | | | | | | |
| | | Year ended May 31 | |
| | | 2019 | | | 2018 | | | 2017 | | | 2016 | | | 2015 | |
Class A | | | 0.17 | % | | | 0.12 | % | | | 0.11 | %5 | | | N/A | | | | N/A | |
Class C6 | | | 0.17 | % | | | 0.12 | % | | | 0.11 | % | | | 0.11 | % | | | 0.11 | % |
Institutional Class | | | 0.16 | %7 | | | N/A | | | | N/A | | | | N/A | | | | N/A | |
| 2 | Total return calculations do not include any sales charges. Returns for periods of less than one year are not annualized. |
| 3 | Portfolio turnover rate is calculated by multiplying the Fund’s ownership percentage in the respective affiliated Master Portfolio by the corresponding affiliated Master Portfolio’s purchases and sales. These purchase and sale amounts are aggregated with the direct purchases and sales in Underlying Funds and included in the portfolio turnover calculation. |
| 4 | Calculated based upon average shares outstanding |
| 5 | For the period from February 10, 2017 (commencement of class operations) to May 31, 2017 |
| 6 | Effective at the close of business on February 10, 2017, the Fund’s existing share class, WealthBuilder Portfolio shares, was renamed Class C. |
| 7 | For the period from July 31, 2018 (commencement of class operations) to May 31, 2019 |
The accompanying notes are an integral part of these financial statements.
| | | | | | |
| Financial highlights | | Multi-Asset Funds | | | 65 | |
| | | | | | | | | | | | | | | | | | | | | | |
| Ratio to average net assets (annualized) | | | Total
return2 | | | Portfolio
turnover
rate3 | | | Net assets at
end of period
(000s omitted) | |
Net investment
income | | | Gross
expenses1 | | | Net
expenses1 | |
| | | | | |
| | | | | | | | | | | | | | | | | | | | | | |
| | 1.51 | % | | | 0.76 | % | | | 0.75 | % | | | 1.02 | % | | | 126 | % | | $ | 46,380 | |
| | 1.33 | % | | | 0.75 | % | | | 0.75 | % | | | 7.51 | % | | | 129 | % | | $ | 3,031 | |
| | 0.54 | % | | | 0.74 | % | | | 0.74 | % | | | 4.09 | % | | | 102 | % | | $ | 1,464 | |
| | | | | |
| | | | | | | | | | | | | | | | | | | | | | |
| | 0.84 | % | | | 1.50 | % | | | 1.50 | % | | | 0.31 | % | | | 126 | % | | $ | 539,352 | |
| | 0.56 | % | | | 1.50 | % | | | 1.50 | % | | | 6.65 | % | | | 129 | % | | $ | 732,031 | |
| | 0.30 | % | | | 1.49 | % | | | 1.49 | % | | | 11.14 | % | | | 102 | % | | $ | 867,751 | |
| | 0.26 | % | | | 1.49 | % | | | 1.49 | % | | | (3.39 | )% | | | 100 | % | | $ | 966,932 | |
| | 0.06 | % | | | 1.54 | % | | | 1.50 | % | | | 4.89 | % | | | 89 | % | | $ | 1,018,411 | |
| | | | | |
| | | | | | | | | | | | | | | | | | | | | | |
| | 1.38 | % | | | 0.43 | % | | | 0.42 | % | | | (0.62 | )% | | | 126 | % | | $ | 1,067 | |
The accompanying notes are an integral part of these financial statements.
| | | | |
| 66 | | Multi-Asset Funds | | Financial highlights |
| | | | | | | | | | | | | | | | | | | | | | | | |
| WealthBuilder Moderate Balanced Fund | | Beginning
net asset
value per
share | | | Net
investment
income | | | Net realized
and unrealized
gains (losses)
on investments | | | Distributions
from net
investment
income | | | Distributions
from net
realized gains | | | Ending
net asset
value per
share | |
| | | | | | |
Class A | | | | | | | | | | | | | | | | | | | | | | | | |
Year ended May 31, 2019 | | $ | 10.90 | | | | 0.19 | 4 | | | 0.03 | | | | (0.18 | ) | | | (0.64 | ) | | $ | 10.30 | |
Year ended May 31, 2018 | | $ | 11.83 | | | | 0.18 | 4 | | | 0.40 | | | | (0.50 | ) | | | (1.01 | ) | | $ | 10.90 | |
Year ended May 31, 20175 | | $ | 11.56 | | | | 0.07 | | | | 0.28 | | | | (0.08 | ) | | | 0.00 | | | $ | 11.83 | |
| | | | | | |
Class C6 | | | | | | | | | | | | | | | | | | | | | | | | |
Year ended May 31, 2019 | | $ | 11.10 | | | | 0.12 | 4 | | | 0.02 | | | | (0.10 | ) | | | (0.64 | ) | | $ | 10.50 | |
Year ended May 31, 2018 | | $ | 11.83 | | | | 0.09 | | | | 0.41 | | | | (0.22 | ) | | | (1.01 | ) | | $ | 11.10 | |
Year ended May 31, 2017 | | $ | 11.40 | | | | 0.06 | | | | 0.80 | | | | (0.08 | ) | | | (0.35 | ) | | $ | 11.83 | |
Year ended May 31, 2016 | | $ | 12.19 | | | | 0.05 | | | | (0.30 | ) | | | (0.07 | ) | | | (0.47 | ) | | $ | 11.40 | |
Year ended May 31, 2015 | | $ | 12.21 | | | | 0.03 | | | | 0.39 | | | | (0.07 | ) | | | (0.37 | ) | | $ | 12.19 | |
| | | | | | |
Institutional Class | | | | | | | | | | | | | | | | | | | | | | | | |
Year ended May 31, 20197 | | $ | 11.06 | | | | 0.14 | | | | (0.04 | ) | | | (0.20 | ) | | | (0.64 | ) | | $ | 10.32 | |
| 1 | Ratios do not include expenses of the Underlying Funds. Including net expenses allocated from the affiliated Master Portfolios, the expense ratios would be increased by the following amounts: |
| | | | | | | | | | | | | | | | | | | | |
| | | Year ended May 31 | |
| | | 2019 | | | 2018 | | | 2017 | | | 2016 | | | 2015 | |
Class A | | | 0.16 | % | | | 0.13 | % | | | 0.11 | %5 | | | N/A | | | | N/A | |
Class C6 | | | 0.17 | % | | | 0.13 | % | | | 0.11 | % | | | 0.11 | % | | | 0.11 | % |
Institutional Class | | | 0.16 | %7 | | | N/A | | | | N/A | | | | N/A | | | | N/A | |
| 2 | Total return calculations do not include any sales charges. Returns for periods of less than one year are not annualized. |
| 3 | Portfolio turnover rate is calculated by multiplying the Fund’s ownership percentage in the respective affiliated Master Portfolio by the corresponding affiliated Master Portfolio’s purchases and sales. These purchase and sale amounts are aggregated with the direct purchases and sales in Underlying Funds and included in the portfolio turnover calculation. |
| 4 | Calculated based upon average shares outstanding |
| 5 | For the period from February 10, 2017 (commencement of class operations) to May 31, 2017 |
| 6 | Effective at the close of business on February 10, 2017, the Fund’s existing share class, WealthBuilder Portfolio shares, was renamed Class C. |
| 7 | For the period from July 31, 2018 (commencement of class operations) to May 31, 2019 |
The accompanying notes are an integral part of these financial statements.
| | | | | | |
| Financial highlights | | Multi-Asset Funds | | | 67 | |
| | | | | | | | | | | | | | | | | | | | | | |
| Ratio to average net assets (annualized) | | | Total
return2 | | | Portfolio
turnover
rate3 | | | Net assets at
end of period
(000s omitted) | |
Net investment
income | | | Gross
expenses1 | | | Net
expenses1 | |
| | | | | |
| | | | | | | | | | | | | | | | | | | | | | |
| | 1.81 | % | | | 0.76 | % | | | 0.75 | % | | | 2.40 | % | | | 155 | % | | $ | 34,104 | |
| | 1.58 | % | | | 0.75 | % | | | 0.75 | % | | | 4.87 | % | | | 161 | % | | $ | 2,712 | |
| | 1.03 | % | | | 0.74 | % | | | 0.74 | % | | | 3.06 | % | | | 136 | % | | $ | 800 | |
| | | | | |
| | | | | | | | | | | | | | | | | | | | | | |
| | 1.13 | % | | | 1.51 | % | | | 1.50 | % | | | 1.58 | % | | | 155 | % | | $ | 393,207 | |
| | 0.81 | % | | | 1.50 | % | | | 1.50 | % | | | 4.11 | % | | | 161 | % | | $ | 559,104 | |
| | 0.52 | % | | | 1.49 | % | | | 1.49 | % | | | 7.75 | % | | | 136 | % | | $ | 707,284 | |
| | 0.48 | % | | | 1.49 | % | | | 1.49 | % | | | (2.02 | )% | | | 150 | % | | $ | 833,218 | |
| | 0.21 | % | | | 1.55 | % | | | 1.50 | % | | | 3.44 | % | | | 129 | % | | $ | 893,175 | |
| | | | | |
| | | | | | | | | | | | | | | | | | | | | | |
| | 1.37 | % | | | 0.43 | % | | | 0.42 | % | | | 1.28 | % | | | 155 | % | | $ | 1,817 | |
The accompanying notes are an integral part of these financial statements.
| | | | |
| 68 | | Multi-Asset Funds | | Notes to financial statements |
1. ORGANIZATION
Wells Fargo Funds Trust (the “Trust”), a Delaware statutory trust organized on March 10, 1999, is anopen-end management investment company registered under the Investment Company Act of 1940, as amended (the “1940 Act”). As an investment company, the Trust follows the accounting and reporting guidance in Financial Accounting Standards BoardAccounting Standards Codification Topic 946, Financial Services – Investment Companies. These financial statements report on the following funds: Wells Fargo WealthBuilder Conservative Allocation Fund (“WealthBuilder Conservative Allocation Fund”), Wells Fargo WealthBuilder Equity Fund (“WealthBuilder Equity Fund”), Wells Fargo WealthBuilder Growth Allocation Fund (“WealthBuilder Growth Allocation Fund”), Wells Fargo WealthBuilder Growth Balanced Fund (“WealthBuilder Growth Balanced Fund”) and Wells Fargo WealthBuilder Moderate Balanced Fund (“WealthBuilder Moderate Balanced Fund”) (each, a “Fund”, collectively, the “Funds”). Each Fund is a diversified series of the Trust.
Each Fund is afund-of-funds that may invest in various affiliated mutual funds, unaffiliated mutual funds and exchange-traded funds (collectively, the “Underlying Funds”) to pursue its investment objective. The Underlying Funds incur separate expenses in seeking to achieve their investment objectives. Investments in affiliated mutual funds may also include investments in one or more separate diversified portfolios (each, an “affiliated Master Portfolio”, collectively, the “affiliated Master Portfolios”) of Wells Fargo Master Trust, a registeredopen-end management investment company. Each affiliated Master Portfolio directly acquires portfolio securities, and each Fund investing in an affiliated Master Portfolio acquires an indirect interest in those securities. Each Fund accounts for its investment in the affiliated Master Portfolios as partnership investments and records on a daily basis its share of the affiliated Master Portfolio’s income, expense and realized and unrealized gains and losses. The financial statements for the Underlying Funds are presented in separate financial statements and may be obtained by contacting Investor Services for the affiliated mutual funds or by contacting the servicing agent of the unaffiliated mutual funds. The financial statements of the affiliated Master Portfolios are available by visiting the SEC website at sec.gov and are filed with the SEC under Wells Fargo Master Trust. The financial statements for all other Underlying Funds are also publicly available on the SEC website at sec.gov.
2. SIGNIFICANT ACCOUNTING POLICIES
The following significant accounting policies, which are consistently followed in the preparation of the financial statements of each Fund, are in conformity with U.S. generally accepted accounting principles which require management to make estimates and assumptions that affect the reported amounts of assets and liabilities, disclosure of contingent assets and liabilities at the date of the financial statements, and the reported amounts of revenues and expenses during the reporting period. Actual results could differ from those estimates.
Securities valuation
All investments are valued each business day as of the close of regular trading on the New York Stock Exchange (generally 4 p.m. Eastern Time), although the Funds may deviate from this calculation time under unusual or unexpected circumstances.
Investments in underlying mutual funds are valued at net asset per share as reported by the Underlying Funds as of the close of the regular trading on the New York Stock Exchange on each day the exchange is open for trading. Investments in affiliated Master Portfolios are valued daily based on each Fund’s proportionate share of each affiliated Master Portfolio’s net assets, which are also valued daily.
Equity securities and futures contracts that are listed on a foreign or domestic exchange or market are valued at the official closing price or, if none, the last sales price. If no sale occurs on the principal exchange or market that day, a fair value price will be determined in accordance with the Funds’ Valuation Procedures.
Debt securities are valued at the evaluated bid price provided by an independent pricing service (e.g. taking into account various factors, including yields, maturities, or credit ratings) or, if a reliable price is not available, the quoted bid price from an independent broker-dealer.
Investments which are not valued using the methods discussed above are valued at their fair value, as determined in good faith by the Board of Trustees of the Funds. The Board of Trustees has established a Valuation Committee comprised of the Trustees and has delegated to it the authority to take any actions regarding the valuation of portfolio securities that the Valuation Committee deems necessary or appropriate, including determining the fair value of portfolio securities, unless the determination has been delegated to the Wells Fargo Asset Management Pricing Committee at Wells Fargo Funds Management, LLC (“Funds Management”). The Board of Trustees retains the authority to make or ratify any valuation decisions or approve any changes to the Valuation Procedures as it deems appropriate. On a quarterly basis, the Board of Trustees receives reports on any valuation actions taken by the Valuation Committee or the Wells Fargo Asset Management Pricing Committee which may include items for ratification.
| | | | | | |
| Notes to financial statements | | Multi-Asset Funds | | | 69 | |
Futures contracts
Each Fund is subject to interest rate risk, equity price risk and foreign currency risk in the normal course of pursuing its investment objectives. Futures contracts are agreements between the Fund and a counterparty to buy or sell a specific amount of a commodity, financial instrument or currency at specified price and on a specified date. The Fund may buy and sell futures contracts in order to gain exposure to, or protect against, changes in interest rates, security values and foreign exchange rates. The primary risks associated with the use of futures contracts are the imperfect correlation between changes in market values of securities held by the Fund and the prices of futures contracts, and the possibility of an illiquid market. Futures contracts are generally entered into on a regulated futures exchange and cleared through a clearinghouse associated with the exchange. With futures contracts, there is minimal counterparty risk to the Fund since futures contracts are exchange traded and the exchange’s clearinghouse, as counterparty to all exchange traded futures, guarantees the futures contracts against default.
Upon entering into a futures contracts, the Fund is required to deposit either cash or securities (initial margin) with the broker in an amount equal to a certain percentage of the contract value. Subsequent payments (variation margin) are paid to or from the broker each day equal to the daily changes in the contract value. Such payments are recorded as unrealized gains or losses and, if any, shown as variation margin receivable (payable) in the Statements of Assets and Liabilities. Should the Fund fail to make requested variation margin payments, the broker can gain access to the initial margin to satisfy the Fund’s payment obligations. When the contracts are closed, a realized gain or loss is recorded in the Statements of Operations.
Security transactions and income recognition
Securities transactions are recorded on a trade date basis. Realized gains or losses are recorded on the basis of identified cost.
Income dividends and capital gain distributions from Underlying Funds are recorded on theex-dividend date. Capital gain distributions from Underlying Funds are treated as realized gains.
Interest income is accrued daily and bond discounts are accreted and premiums are amortized daily. To the extent debt obligations are placed onnon-accrual status, any related interest income may be reduced by writing off interest receivables when the collection of all or a portion of interest has been determined to be doubtful based on consistently applied procedures and the fair value has decreased. If the issuer subsequently resumes interest payments or when the collectability of interest is reasonably assured, the debt obligation is removed fromnon-accrual status.
Each Fund records on a daily basis its proportionate share of each affiliated Master Portfolio’s interest and dividend income, in addition to expenses and realized and unrealized gains and losses. Income from foreign securities in each affiliated Master Portfolio is recorded net of foreign taxes withheld where recovery of such taxes is not assured.
Distributions to shareholders
Distributions to shareholders from net investment income and any net realized gains are recorded on theex-dividend date for each Fund as follows:
| | | | | | | | |
| | | Net investment income | | | Net realized gains | |
| | |
WealthBuilder Conservative Allocation Fund | | | Monthly | | | | Annually | |
| | |
WealthBuilder Equity Fund | | | Annually | | | | Annually | |
| | |
WealthBuilder Growth Allocation Fund | | | Annually | | | | Annually | |
| | |
WealthBuilder Growth Balanced Fund | | | Annually | | | | Annually | |
| | |
WealthBuilder Moderate Balanced Fund | | | Quarterly | | | | Annually | |
Federal and other taxes
Each Fund is treated as a separate entity for federal income tax purposes. Each Fund intends to continue to qualify as a regulated investment company by distributing substantially all of its investment company taxable income and any net realized capital gains (after reduction for capital loss carryforwards) sufficient to relieve it from all, or substantially all, federal income taxes. Accordingly, no provision for federal income taxes was required.
Each Fund’s income and federal excise tax returns and all financial records supporting those returns for the prior three fiscal years are subject to examination by the federal and Delaware revenue authorities. Management has analyzed each Fund’s tax positions taken on federal, state, and foreign tax returns for all open tax years and does not believe that there are any uncertain tax positions that require recognition of a tax liability.
| | | | |
| 70 | | Multi-Asset Funds | | Notes to financial statements |
As of May 31, 2019, the aggregate cost of all investments for federal income tax purposes and the unrealized gains (losses) were as follows:
| | | | | | | | | | | | | | | | |
| | | Tax cost | | | Gross
unrealized gains | | | Gross unrealized
losses | | | Net unrealized gains | |
WealthBuilder Conservative Allocation Fund | | $ | 253,640,768 | | | $ | 3,569,864 | | | $ | (2,877,565 | ) | | $ | 692,299 | |
WealthBuilder Equity Fund | | | 386,989,034 | | | | 19,977,388 | | | | (6,706,529 | ) | | | 13,270,859 | |
WealthBuilder Growth Allocation Fund | | | 280,001,311 | | | | 10,368,460 | | | | (3,911,682 | ) | | | 6,456,778 | |
WealthBuilder Growth Balanced Fund | | | 579,801,003 | | | | 17,009,658 | | | | (8,438,690 | ) | | | 8,570,968 | |
WealthBuilder Moderate Balanced Fund | | | 424,783,036 | | | | 9,923,050 | | | | (4,844,901 | ) | | | 5,078,149 | |
Reclassifications are made to each Fund’s capital accounts for permanent tax differences to reflect income and gains available for distribution (or available capital loss carryforwards) under federal income tax regulations. U.S. generally accepted accounting principles require that certain components of net assets be adjusted to reflect permanent differences between financial and tax reporting. These reclassifications have no effect on net assets or net asset values per share. At May 31, 2019, as a result of permanentbook-to-tax differences, the following reclassification adjustments were made on the Statements of Assets and Liabilities:
| | | | | | | | |
| | | Paid-in capital | | | Total
distributable
earnings | |
WealthBuilder Conservative Allocation Fund | | $ | (8,381 | ) | | $ | 8,381 | |
WealthBuilder Equity Fund | | | (345 | ) | | | 345 | |
WealthBuilder Growth Allocation Fund | | | 150 | | | | (150 | ) |
WealthBuilder Growth Balanced Fund | | | (14,290 | ) | | | 14,290 | |
WealthBuilder Moderate Balanced Fund | | | (10,994 | ) | | | 10,994 | |
As of May 31, 2019, WealthBuilder Conservative Allocation Fund had capital loss carryforwards which consist of $756,938 in short-term capital losses.
At May 31, 2019, current year deferred post-October capital losses and late-year ordinary losses, which will be recognized on the first day of the following fiscal year were as follows:
| | | | | | | | | | | | |
| | | Deferred post-October
capital losses | | | Late-year ordinary
losses deferred | |
| | | Short-term | | | Long-term | |
WealthBuilder Equity Fund | | $ | (7,816,764 | ) | | $ | 5,585,661 | | | $ | (1,351,065 | ) |
WealthBuilder Growth Allocation Fund | | | (3,958,981 | ) | | | 3,407,391 | | | | (94,718 | ) |
WealthBuilder Growth Balanced Fund | | | (5,236,106 | ) | | | 4,982,014 | | | | 0 | |
WealthBuilder Moderate Balanced Fund | | | (1,776,270 | ) | | | 0 | | | | 0 | |
Class allocations
The separate classes of shares offered by each Fund differ principally in applicable sales charges, distribution, shareholder servicing, and administration fees. Class specific expenses are charged directly to that share class. Investment income, common expenses, and realized and unrealized gains (losses) on investments are allocated daily to each class of shares based on the relative proportion of net assets of each class.
3. FAIR VALUATION MEASUREMENTS
Fair value measurements of investments are determined within a framework that has established a fair value hierarchy based upon the various data inputs utilized in determining the value of each Fund’s investments. The three-level hierarchy gives the highest priority to unadjusted quoted prices in active markets for identical assets or liabilities (Level 1) and the lowest priority to unobservable inputs (Level 3). Each Fund’s investments are classified within the fair value hierarchy based on the lowest level of input that is significant to the fair value measurement. The inputs are summarized into three broad levels as follows:
| | | | | | |
| Notes to financial statements | | Multi-Asset Funds | | | 71 | |
| ∎ | | Level 1 – quoted prices in active markets for identical securities |
| ∎ | | Level 2 – other significant observable inputs (including quoted prices for similar securities, interest rates, prepayment speeds, credit risk, etc.) |
| ∎ | | Level 3 – significant unobservable inputs (including the Fund’s own assumptions in determining the fair value of investments) |
The inputs or methodologies used for valuing investments in securities are not necessarily an indication of the risk associated with investing in those securities.
The following is a summary of the inputs used in valuing each Fund’s assets and liabilities as of May 31, 2019:
| | | | | | | | | | | | | | | | |
| | | | |
| WealthBuilder Conservative Allocation Fund | | Quoted prices
(Level 1) | | | Other significant
observable inputs
(Level 2) | | | Significant
unobservable inputs (Level 3) | | | Total | |
| | | | |
Assets | | | | | | | | | | | | | | | | |
Investments in: | | | | | | | | | | | | | | | | |
| | | | |
Exchange-traded funds | | $ | 37,868,864 | | | $ | 0 | | | $ | 0 | | | $ | 37,868,864 | |
| | | | |
Investment companies | | | 68,258,865 | | | | 0 | | | | 0 | | | | 68,258,865 | |
| | | | |
Short-term investments | | | | | | | | | | | | | | | | |
| | | | |
Investment companies | | | 799,593 | | | | 0 | | | | 0 | | | | 799,593 | |
| | | | |
U.S. Treasury securities | | | 816,858 | | | | 0 | | | | 0 | | | | 816,858 | |
| | | | |
Investments measured at net asset value* | | | | | | | | | | | | | | | 146,123,386 | |
| | | | |
| | | 107,744,180 | | | | 0 | | | | 0 | | | | 253,867,566 | |
| | | | |
Futures contracts | | | 467,110 | | | | 0 | | | | 0 | | | | 467,110 | |
| | | | |
Total assets | | $ | 108,211,290 | | | $ | 0 | | | $ | 0 | | | $ | 254,334,676 | |
| | | | |
Liabilities | | | | | | | | | | | | | | | | |
| | | | |
Futures contracts | | $ | 1,609 | | | $ | 0 | | | $ | 0 | | | $ | 1,609 | |
| | | | |
Total liabilities | | $ | 1,609 | | | $ | 0 | | | $ | 0 | | | $ | 1,609 | |
| * | Investments that are measured at fair value using the net asset value per share (or its equivalent) as a practical expedient have not been categorized in the fair value hierarchy. The fair value amount presented in the table is intended to permit reconciliation of the fair value hierarchy to the amounts presented in the Statements of Assets and Liabilities. The Fund’s investments in the affiliated Master Portfolios are valued at $146,123,386. Each affiliated Master Portfolio does not have a redemption period notice, can be redeemed daily and does not have any unfunded commitments. |
| | | | | | | | | | | | | | | | |
| | | | |
| WealthBuilder Equity Fund | | Quoted prices
(Level 1) | | | Other significant
observable inputs
(Level 2) | | | Significant
unobservable inputs (Level 3) | | | Total | |
| | | | |
Assets | | | | | | | | | | | | | | | | |
Investments in: | | | | | | | | | | | | | | | | |
| | | | |
Exchange-traded funds | | $ | 11,929,346 | | | $ | 0 | | | $ | 0 | | | $ | 11,929,346 | |
| | | | |
Investment companies | | | 86,966,545 | | | | 0 | | | | 0 | | | | 86,966,545 | |
| | | | |
Short-term investments | | | | | | | | | | | | | | | | |
| | | | |
Investment companies | | | 2,277,831 | | | | 0 | | | | 0 | | | | 2,277,831 | |
| | | | |
U.S. Treasury securities | | | 755,943 | | | | 0 | | | | 0 | | | | 755,943 | |
| | | | |
Investments measured at net asset value* | | | | | | | | | | | | | | | 297,936,380 | |
| | | | |
| | | 101,929,665 | | | | 0 | | | | 0 | | | | 399,866,045 | |
| | | | |
Futures contracts | | | 406,725 | | | | 0 | | | | 0 | | | | 406,725 | |
| | | | |
Total assets | | $ | 102,336,390 | | | $ | 0 | | | $ | 0 | | | $ | 400,272,770 | |
| | | | |
Liabilities | | | | | | | | | | | | | | | | |
| | | | |
Futures contracts | | $ | 12,877 | | | $ | 0 | | | $ | 0 | | | $ | 12,877 | |
| | | | |
Total liabilities | | $ | 12,877 | | | $ | 0 | | | $ | 0 | | | $ | 12,877 | |
| * | Investments that are measured at fair value using the net asset value per share (or its equivalent) as a practical expedient have not been categorized in the fair value hierarchy. The fair value amount presented in the table is intended to permit reconciliation of the fair value hierarchy to the amounts presented in the Statements of Assets and Liabilities. The Fund’s investments in the affiliated Master Portfolios are valued at $297,936,380. Each affiliated Master Portfolio does not have a redemption period notice, can be redeemed daily and does not have any unfunded commitments. |
| | | | |
| 72 | | Multi-Asset Funds | | Notes to financial statements |
| | | | | | | | | | | | | | | | |
| | | | |
| WealthBuilder Growth Allocation Fund | | Quoted prices
(Level 1) | | | Other significant
observable inputs
(Level 2) | | | Significant
unobservable inputs (Level 3) | | | Total | |
| | | | |
Assets | | | | | | | | | | | | | | | | |
Investments in: | | | | | | | | | | | | | | | | |
| | | | |
Exchange-traded funds | | $ | 15,025,876 | | | $ | 0 | | | $ | 0 | | | $ | 15,025,876 | |
| | | | |
Investment companies | | | 72,044,447 | | | | 0 | | | | 0 | | | | 72,044,447 | |
| | | | |
Short-term investments | | | | | | | | | | | | | | | | |
| | | | |
Investment companies | | | 615,530 | | | | 0 | | | | 0 | | | | 615,530 | |
| | | | |
U.S. Treasury securities | | | 1,102,458 | | | | 0 | | | | 0 | | | | 1,102,458 | |
| | | | |
Investments measured at net asset value* | | | | | | | | | | | | | | | 197,075,887 | |
| | | | |
| | | 88,788,311 | | | | 0 | | | | 0 | | | | 285,864,198 | |
| | | | |
Futures contracts | | | 594,511 | | | | 0 | | | | 0 | | | | 594,511 | |
| | | | |
Total assets | | $ | 89,382,822 | | | $ | 0 | | | $ | 0 | | | $ | 286,458,709 | |
| | | | |
Liabilities | | | | | | | | | | | | | | | | |
| | | | |
Futures contracts | | $ | 620 | | | $ | 0 | | | $ | 0 | | | $ | 620 | |
| | | | |
Total liabilities | | $ | 620 | | | $ | 0 | | | $ | 0 | | | $ | 620 | |
| * | Investments that are measured at fair value using the net asset value per share (or its equivalent) as a practical expedient have not been categorized in the fair value hierarchy. The fair value amount presented in the table is intended to permit reconciliation of the fair value hierarchy to the amounts presented in the Statements of Assets and Liabilities. The Fund’s investments in the affiliated Master Portfolios are valued at $197,075,887. Each affiliated Master Portfolio does not have a redemption period notice, can be redeemed daily and does not have any unfunded commitments. |
| | | | | | | | | | | | | | | | |
| | | | |
| WealthBuilder Growth Balanced Fund | | Quoted prices
(Level 1) | | | Other significant
observable inputs
(Level 2) | | | Significant
unobservable inputs (Level 3) | | | Total | |
| | | | |
Assets | | | | | | | | | | | | | | | | |
Investments in: | | | | | | | | | | | | | | | | |
| | | | |
Exchange-traded funds | | $ | 49,538,056 | | | $ | 0 | | | $ | 0 | | | $ | 49,538,056 | |
| | | | |
Investment companies | | | 151,160,806 | | | | 0 | | | | 0 | | | | 151,160,806 | |
| | | | |
Short-term investments | | | | | | | | | | | | | | | | |
| | | | |
Investment companies | | | 2,225,222 | | | | 0 | | | | 0 | | | | 2,225,222 | |
| | | | |
U.S. Treasury securities | | | 2,129,023 | | | | 0 | | | | 0 | | | | 2,129,023 | |
| | | | |
Investments measured at net asset value* | | | | | | | | | | | | | | | 382,122,789 | |
| | | | |
| | | 205,053,107 | | | | 0 | | | | 0 | | | | 587,175,896 | |
| | | | |
Futures contracts | | | 1,207,332 | | | | 0 | | | | 0 | | | | 1,207,332 | |
| | | | |
Total assets | | $ | 206,260,439 | | | $ | 0 | | | $ | 0 | | | $ | 588,383,228 | |
| | | | |
Liabilities | | | | | | | | | | | | | | | | |
| | | | |
Futures contracts | | $ | 11,257 | | | $ | 0 | | | $ | 0 | | | $ | 11,257 | |
| | | | |
Total liabilities | | $ | 11,257 | | | $ | 0 | | | $ | 0 | | | $ | 11,257 | |
| * | Investments that are measured at fair value using the net asset value per share (or its equivalent) as a practical expedient have not been categorized in the fair value hierarchy. The fair value amount presented in the table is intended to permit reconciliation of the fair value hierarchy to the amounts presented in the Statements of Assets and Liabilities. The Fund’s investments in the affiliated Master Portfolios are valued at $382,122,789. Each affiliated Master Portfolio does not have a redemption period notice, can be redeemed daily and does not have any unfunded commitments. |
| | | | | | |
| Notes to financial statements | | Multi-Asset Funds | | | 73 | |
| | | | | | | | | | | | | | | | |
| | | | |
| WealthBuilder Moderate Balanced Fund | | Quoted prices
(Level 1) | | | Other significant
observable inputs
(Level 2) | | | Significant
unobservable inputs (Level 3) | | | Total | |
| | | | |
Assets | | | | | | | | | | | | | | | | |
Investments in: | | | | | | | | | | | | | | | | |
| | | | |
Exchange-traded funds | | $ | 50,281,867 | | | $ | 0 | | | $ | 0 | | | $ | 50,281,867 | |
| | | | |
Investment companies | | | 112,949,270 | | | | 0 | | | | 0 | | | | 112,949,270 | |
| | | | |
Short-term investments | | | | | | | | | | | | | | | | |
| | | | |
Investment companies | | | 884,814 | | | | 0 | | | | 0 | | | | 884,814 | |
| | | | |
U.S. Treasury securities | | | 1,533,855 | | | | 0 | | | | 0 | | | | 1,533,855 | |
| | | | |
Investments measured at net asset value* | | | | | | | | | | | | | | | 263,393,041 | |
| | | | |
| | | 165,649,806 | | | | 0 | | | | 0 | | | | 429,042,847 | |
| | | | |
Futures contracts | | | 820,063 | | | | 0 | | | | 0 | | | | 820,063 | |
| | | | |
Total assets | | $ | 166,469,869 | | | $ | 0 | | | $ | 0 | | | $ | 429,862,910 | |
| | | | |
Liabilities | | | | | | | | | | | | | | | | |
| | | | |
Futures contracts | | $ | 1,725 | | | $ | 0 | | | $ | 0 | | | $ | 1,725 | |
| | | | |
Total liabilities | | $ | 1,725 | | | $ | 0 | | | $ | 0 | | | $ | 1,725 | |
| * | Investments that are measured at fair value using the net asset value per share (or its equivalent) as a practical expedient have not been categorized in the fair value hierarchy. The fair value amount presented in the table is intended to permit reconciliation of the fair value hierarchy to the amounts presented in the Statements of Assets and Liabilities. The Fund’s investments in the affiliated Master Portfolios are valued at $263,393,041. Each affiliated Master Portfolio does not have a redemption period notice, can be redeemed daily and does not have any unfunded commitments. |
Futures contracts are reported at their cumulative unrealized gains (losses) at measurement date as reported in the table following each Portfolio of Investments. For futures contracts, the current day’s variation margin is reported on the Statements of Assets and Liabilities. All other assets and liabilities are reported at their market value at measurement date.
At May 31, 2019, the Funds did not have any transfers into/out of Level 3.
The investment objective of each affiliated Master Portfolio is as follows:
| | |
| |
| Affiliated Master Portfolio | | Investment objective |
| |
Wells Fargo Bloomberg Barclays US Aggregateex-Corporate Portfolio | | Seeks to replicate the total return of the Bloomberg Barclays USex-Corporate Index, before fees and expenses |
| |
Wells Fargo Core Bond Portfolio | | Seeks total return, consisting of income and capital appreciation |
| |
Wells Fargo Disciplined Large Cap Portfolio | | Seeks long-term capital appreciation |
| |
Wells Fargo Emerging Growth Portfolio | | Seeks long-term capital appreciation |
| |
Wells Fargo Factor Enhanced Emerging Markets Portfolio | | Seeks to replicate the total return of the Wells Fargo Factor Enhanced Emerging Markets Index, before fees and expenses |
| |
Wells Fargo Factor Enhanced International Portfolio | | Seeks to replicate the total return of the Wells Fargo Factor Enhanced International Index, before fees and expenses |
| |
Wells Fargo Factor Enhanced Large Cap Portfolio | | Seeks to replicate the total return of the Wells Fargo Factor Enhanced Large Cap Index, before fees and expenses |
| |
Wells Fargo Factor Enhanced Small Cap Portfolio | | Seeks to replicate the total return of the Wells Fargo Factor Enhanced Small Cap Index, before fees and expenses |
| |
Wells Fargo High Yield Corporate Bond Portfolio | | Seeks to replicate the total return of the Wells Fargo U.S. High Yield Bond Index, before fees and expenses |
| |
Wells Fargo Real Return Portfolio | | Seeks returns that exceed the rate of inflation over the long-term |
| |
Wells Fargo U.S. REIT Portfolio | | Seeks to replicate the total return of the Wells Fargo U.S. REIT Index, before fees and expenses |
| | | | |
| 74 | | Multi-Asset Funds | | Notes to financial statements |
4. TRANSACTIONS WITH AFFILIATES
Management fee
Funds Management, an indirect wholly owned subsidiary of Wells Fargo & Company (“Wells Fargo”), is the manager of each Fund and provides advisory and fund-level administrative services under an investment management agreement. Under the investment management agreement, Funds Management is responsible for, among other services, implementing the investment objectives and strategies of each Fund, supervising the subadviser and providing fund-level administrative services in connection with each Fund’s operations. As compensation for its services under the investment management agreement, Funds Management is entitled to receive a management fee at the following annual rate based on each Fund’s average daily net assets:
| | |
| |
| Average daily net assets | | Management fee |
| |
First $1 billion | | 0.250% |
| |
Next $4 billion | | 0.225 |
| |
Next $5 billion | | 0.190 |
| |
Over $10 billion | | 0.180 |
For the year ended May 31, 2019, the management fee was equivalent to an annual rate of 0.25% of each Fund’s average daily net assets.
Funds Management has retained the services of a subadviser to provide daily portfolio management to the Funds. The fee for subadvisory services is borne by Funds Management. Wells Capital Management Incorporated, an affiliate of Funds Management and an indirect wholly owned subsidiary of Wells Fargo, is the subadviser to each Fund and is an annual subadvisory fee of 0.15% of each Fund’s average daily net assets.
Funds Management also serves as the adviser to each affiliated Master Portfolio and is entitled to receive a fee from each affiliated Master Portfolio for those services.
Administration fees
Under a class-level administration agreement, Funds Management provides class-level administrative services to each Fund, which includes paying fees and expenses for services provided by the transfer agent,sub-transfer agents, omnibus account servicers and record-keepers. As compensation for its services under the class-level administration agreement, Funds Management receives an annual fee which is calculated based on the average daily net assets of each class as follows:
| | | | |
| | | Class-level
administration fee | |
| |
Class A, Class C | | | 0.21 | % |
| |
Institutional Class | | | 0.13 | |
Funds Management has contractually waived and/or reimbursed management and administration fees to the extent necessary to maintain certain net operating expense ratios for each Fund. When each class of a Fund has exceeded its expense cap, Funds Management has waived fees and/or reimbursed expenses from fund level expenses on a proportionate basis and then from class specific expenses. When only certain classes exceed their expense caps, waivers and/or reimbursements are applied against class specific expenses before fund level expenses. Funds Management has committed through September 30, 2019 to waive fees and/or reimburse expenses to the extent necessary to cap each Fund’s expenses at 0.75% for Class A shares, 1.50% for Class C shares and 0.42% for Institutional Class shares. Acquired fund fees and expenses (including net expenses from affiliated Master Portfolios) are excluded from the expense caps. Prior to or after the commitment expiration date, the cap may be increased or the commitment to maintain the cap may be terminated only with the approval of the Board of Trustees.
Distribution fee
The Trust has adopted a Distribution Plan for Class C shares of the Funds pursuant to Rule12b-1 under the 1940 Act. A distribution fee is charged to Class C shares and paid to Wells Fargo Funds Distributor, LLC (“Funds Distributor”), the principal underwriter of each Fund, at an annual rate of 0.75% of the average daily net assets of Class C.
In addition, Funds Distributor is entitled to receive thefront-end sales charge from the purchase of Class A shares and a contingent deferred sales charge on the redemption of certain Class A shares. Funds Distributor is also entitled to receive the contingent deferred sales charges from redemptions of Class C shares. For the year ended May 31, 2019, Funds Distributor received the following amounts infront-end sales charges and contingent deferred sales charges.
| | | | | | |
| Notes to financial statements | | Multi-Asset Funds | | | 75 | |
| | | | | | | | |
| | | Front-end
sales charges | | | Contingent deferred
sales charges | |
| | | Class A | | | Class C | |
WealthBuilder Conservative Allocation Fund | | $ | 1,293 | | | $ | 1,497 | |
WealthBuilder Equity Fund | | | 6,834 | | | | 3,046 | |
WealthBuilder Growth Allocation Fund | | | 4,978 | | | | 1,382 | |
WealthBuilder Growth Balanced Fund | | | 5,934 | | | | 1,428 | |
WealthBuilder Moderate Balanced Fund | | | 2,382 | | | | 4,775 | |
No contingent deferred sales charges were incurred by Class A shares of each Fund for the year ended May 31, 2019.
Shareholder servicing fees
The Trust has entered into contracts with one or more shareholder servicing agents, whereby Class A and Class C of each Fund are charged a fee at an annual rate of 0.25% of the average daily net assets of each respective class. A portion of these total shareholder servicing fees were paid to affiliates of Wells Fargo.
5. INVESTMENT PORTFOLIO TRANSACTIONS
Purchases and sales of investments, excluding short-term securities, for the year ended May 31, 2019 were as follows:
| | | | | | | | | | | | | | | | |
| | | Purchases at cost* | | | Sales proceeds* | |
| | | U.S.
government | | | Non-U.S.
government | | | U.S.
government | | | Non-U.S.
government | |
| | | | |
WealthBuilder Conservative Allocation Fund | | $ | 340,860,517 | | | $ | 175,571,087 | | | $ | 350,507,236 | | | $ | 215,647,065 | |
| | | | |
WealthBuilder Equity Fund | | | 0 | | | | 342,185,513 | | | | 0 | | | | 457,099,556 | |
| | | | |
WealthBuilder Growth Allocation Fund | | | 77,145,329 | | | | 227,590,399 | | | | 79,329,528 | | | | 302,487,462 | |
| | | | |
WealthBuilder Growth Balanced Fund | | | 371,507,795 | | | | 443,416,211 | | | | 382,027,259 | | | | 576,686,420 | |
| | | | |
WealthBuilder Moderate Balanced Fund | | | 424,654,880 | | | | 327,406,489 | | | | 436,686,546 | | | | 417,941,754 | |
| * | The Funds seek to achieve their investment objectives by investing some of their investable assets in affiliated Master Portfolios. Purchases and sales related to these investments have been calculated by aggregating the results of multiplying each Fund’s ownership percentage in the respective affiliated Master Portfolio by the corresponding affiliated Master Portfolio’s purchases and sales. Purchases and sales in Underlying Funds in which the Funds invest are actual aggregate purchases and sales of those investments. |
6. DERIVATIVE TRANSACTIONS
During the year ended May 31, 2019, the Funds entered into futures contracts to gain market exposure to certain asset classes consistent with an active asset allocation strategy.
| | | | | | | | |
| | | Average notional balance | |
| | | Long futures | | | Short futures | |
| | |
WealthBuilder Conservative Allocation Fund | | $ | 13,236,938 | | | $ | 7,886,361 | |
| | |
WealthBuilder Equity Fund | | | 6,189,368 | | | | 17,830,745 | |
| | |
WealthBuilder Growth Allocation Fund | | | 15,498,295 | | | | 15,241,211 | |
| | |
WealthBuilder Growth Balanced Fund | | | 31,497,011 | | | | 26,840,265 | |
| | |
WealthBuilder Moderate Balanced Fund | | | 23,260,497 | | | | 16,678,374 | |
A summary of the location of derivative instruments on the financial statements by primary risk exposure is outlined following tables.
| | | | |
| 76 | | Multi-Asset Funds | | Notes to financial statements |
The fair value of derivative instruments as of May 31, 2019 was as follows for WealthBuilder Conservative Allocation Fund:
| | | | | | | | | | | | |
| | | Asset derivatives | | | Liability derivatives | |
| | | Statements of Assets and
Liabilities location | | Fair value | | | Statements of Assets and
Liabilities location | | Fair value | |
| | | | |
Equity risk | | Unrealized gains on futures contracts | | $ | 267,694 | * | | Unrealized losses on futures contracts | | $ | 1,609 | * |
| | | | |
Foreign currency risk | | Unrealized gains on futures contracts | | | 199,416 | * | | Unrealized losses on futures contracts | | | 0 | * |
| | | | |
| | | | | $ | 467,110 | | | | | $ | 1,609 | |
| * | Amount represents cumulative unrealized gains (losses) on futures contracts as reported in the table following the Portfolio of Investments. Only the current day’s variation margin as of May 31, 2019 is reported separately on the Statements of Assets and Liabilities. |
The effect of derivative instruments on the Statements of Operations for the year ended May 31, 2019 was as follows:
| | | | | | | | |
| | |
| | | Amount of realized
gains (losses) on
derivatives | | | Change in unrealized
gains (losses) on
derivatives | |
| | |
Equity risk | | $ | (100,196 | ) | | $ | 787,591 | |
| | |
Interest rate risk | | | 90,303 | | | | 60,474 | |
| | |
Foreign currency risk | | | 0 | | | | 176,559 | |
| | |
| | | $ | (9,893 | ) | | $ | 1,024,624 | |
The fair value of derivative instruments as of May 31, 2019 was as follows for WealthBuilder Equity Fund:
| | | | | | | | | | | | |
| | | Asset derivatives | | | Liability derivatives | |
| | | Statements of Assets and
Liabilities location | | Fair value | | | Statements of Assets and
Liabilities location | | Fair value | |
| | | | |
Equity risk | | Unrealized gains on futures contracts | | $ | 85,253 | * | | Unrealized losses on futures contracts | | $ | 12,877 | * |
| | | | |
Foreign currency risk | | Unrealized gains on futures contracts | | | 321,472 | * | | Unrealized losses on futures contracts | | | 0 | * |
| | | | |
| | | | | $ | 406,725 | | | | | $ | 12,877 | |
| * | Amount represents cumulative unrealized gains (losses) on futures contracts as reported in the table following the Portfolio of Investments. Only the current day’s variation margin as of May 31, 2019 is reported separately on the Statements of Assets and Liabilities. |
The effect of derivative instruments on the Statements of Operations for the year ended May 31, 2019 was as follows:
| | | | | | | | |
| | |
| | | Amount of realized
gains (losses) on
derivatives | | | Change in unrealized
gains (losses) on
derivatives | |
|
| | |
Equity risk | | $ | (5,256,916 | ) | | $ | 72,376 | |
| | |
Foreign currency risk | | | 267,144 | | | | 215,805 | |
| | |
| | | $ | (4,989,772 | ) | | $ | 288,181 | |
The fair value of derivative instruments as of May 31, 2019 was as follows for WealthBuilder Growth Allocation Fund:
| | | | | | | | | | | | |
| | | Asset derivatives | | | Liability derivatives | |
| | | Statements of Assets and
Liabilities location | | Fair value | | | Statements of Assets and
Liabilities location | | Fair value | |
| | | | |
Equity risk | | Unrealized gains on futures contracts | | $ | 365,870 | * | | Unrealized losses on futures contracts | | $ | 620 | * |
| | | | |
Foreign currency risk | | Unrealized gains on futures contracts | | | 228,641 | * | | Unrealized losses on futures contracts | | | 0 | * |
| | | | |
| | | | | $ | 594,511 | | | | | $ | 620 | |
| * | Amount represents cumulative unrealized gains (losses) on futures contracts as reported in the table following the Portfolio of Investments. Only the current day’s variation margin as of May 31, 2019 is reported separately on the Statements of Assets and Liabilities. |
| | | | | | |
| Notes to financial statements | | Multi-Asset Funds | | | 77 | |
The effect of derivative instruments on the Statements of Operations for the year ended May 31, 2019 was as follows:
| | | | | | | | |
| | |
| | | Amount of realized
losses on
derivatives | | | Change in unrealized
gains (losses) on
derivatives | |
| | |
Equity risk | | $ | (1,180,224 | ) | | $ | 953,509 | |
| | |
Interest rate risk | | | (22,049 | ) | | | 65,733 | |
| | |
Foreign currency risk | | | (299,391 | ) | | | 159,695 | |
| | |
| | | $ | (1,501,664 | ) | | $ | 1,178,937 | |
The fair value of derivative instruments as of May 31, 2019 was as follows for WealthBuilder Growth Balanced Fund:
| | | | | | | | | | | | |
| | | Asset derivatives | | | Liability derivatives | |
| | | Statements of Assets and
Liabilities location | | Fair value | | | Statements of Assets and
Liabilities location | | Fair value | |
| | | | |
Equity risk | | Unrealized gains on futures contracts | | $ | 741,455 | * | | Unrealized losses on futures contracts | | $ | 11,257 | * |
| | | | |
Foreign currency risk | | Unrealized gains on futures contracts | | | 465,877 | * | | Unrealized losses on futures contracts | | | 0 | * |
| | | | |
| | | | | $ | 1,207,332 | | | | | $ | 11,257 | |
| * | Amount represents cumulative unrealized gains (losses) on futures contracts as reported in the table following the Portfolio of Investments. Only the current day’s variation margin as of May 31, 2019 is reported separately on the Statements of Assets and Liabilities. |
The effect of derivative instruments on the Statements of Operations for the year ended May 31, 2019 was as follows:
| | | | | | | | |
| | |
| | | Amount of realized
gains (losses) on
derivatives | | | Change in unrealized
gains (losses) on
derivatives | |
| | |
Equity risk | | $ | (2,357,366 | ) | | $ | 1,927,577 | |
| | |
Interest rate risk | | | 225,035 | | | | 134,971 | |
| | |
Foreign currency risk | | | 299,353 | | | | 347,470 | |
| | |
| | | $ | (1,832,978 | ) | | $ | 2,410,018 | |
The fair value of derivative instruments as of May 31, 2019 was as follows for WealthBuilder Moderate Balanced Fund:
| | | | | | | | | | | | |
| | | Asset derivatives | | | Liability derivatives | |
| | | Statements of Assets and
Liabilities location | | Fair value | | | Statements of Assets and
Liabilities location | | Fair value | |
| | | | |
Equity risk | | Unrealized gains on futures contracts | | $ | 479,680 | * | | Unrealized losses on futures contracts | | $ | 1,725 | * |
| | | | |
Foreign currency risk | | Unrealized gains on futures contracts | | | 340,383 | * | | Unrealized losses on futures contracts | | | 0 | * |
| | | | |
| | | | | $ | 820,063 | | | | | $ | 1,725 | |
| * | Amount represents cumulative unrealized gains (losses) on futures contracts as reported in the table following the Portfolio of Investments. Only the current day’s variation margin as of May 31, 2019 is reported separately on the Statements of Assets and Liabilities. |
The effect of derivative instruments on the Statements of Operations for the year ended May 31, 2019 was as follows:
| | | | | | | | |
| | |
| | | Amount of realized
gains (losses) on
derivatives | | | Change in unrealized
gains (losses) on
derivatives | |
| | |
Equity risk | | $ | (652,062 | ) | | $ | 1,387,861 | |
| | |
Interest rate risk | | | 162,714 | | | | 104,467 | |
| | |
Foreign currency risk | | | (297,278 | ) | | | 272,561 | |
| | |
| | | $ | (792,306 | ) | | $ | 1,764,889 | |
| | | | |
| 78 | | Multi-Asset Funds | | Notes to financial statements |
7. BANK BORROWINGS
The Trust (excluding the money market funds), Wells Fargo Master Trust and Wells Fargo Variable Trust are parties to a $280,000,000 revolving credit agreement whereby the Fund is permitted to use bank borrowings for temporary or emergency purposes, such as to fund shareholder redemption requests. Interest under the credit agreement is charged to the Funds based on a borrowing rate equal to the higher of the Federal Funds rate in effect on that day plus 1.25% or the overnight LIBOR rate in effect on that day plus 1.25%. In addition, an annual commitment fee equal to 0.25% of the unused balance is allocated to each participating fund.
For the year ended May 31, 2019, there were no borrowings by the Funds under the agreement.
8. DISTRIBUTIONS TO SHAREHOLDERS
The tax character of distributions paid during the years ended May 31, 2019 and May 31, 2018, were as follows:
| | | | | | | | | | | | | | | | |
| | | Ordinary income | | | Long-term capital gain | |
| | | 2019 | | | 2018 | | | 2019 | | | 2018 | |
| | | | |
WealthBuilder Conservative Allocation Fund | | $ | 3,531,157 | | | $ | 4,750,610 | | | $ | 10,842,828 | | | $ | 15,684,677 | |
| | | | |
WealthBuilder Equity Fund | | | 6,940,355 | | | | 0 | | | | 65,572,317 | | | | 80,484,984 | |
| | | | |
WealthBuilder Growth Allocation Fund | | | 5,766,814 | | | | 2,466,393 | | | | 40,351,235 | | | | 46,676,913 | |
| | | | |
WealthBuilder Growth Balanced Fund | | | 9,607,448 | | | | 12,231,217 | | | | 65,523,431 | | | | 84,010,791 | |
| | | | |
WealthBuilder Moderate Balanced Fund | | | 5,300,505 | | | | 7,332,686 | | | | 27,152,903 | | | | 55,968,307 | |
As of May 31, 2019, the components of distributable earnings on a tax basis were as follows:
| | | | | | | | | | | | | | | | | | | | | | | | |
| | | Undistributed
ordinary
income | | | Undistributed
long-term
gain | | | Unrealized
gains | | | Late-year
ordinary losses
deferred | | | Post-October
capital losses
deferred | | | Capital loss
carryforward | |
| | | | | | |
WealthBuilder Conservative Allocation Fund | | $ | 626,186 | | | $ | 0 | | | $ | 692,299 | | | $ | 0 | | | $ | 0 | | | $ | (756,938 | ) |
| | | | | | |
WealthBuilder Equity Fund | | | 0 | | | | 914,038 | | | | 13,270,859 | | | | (1,351,065 | ) | | | (2,231,103 | ) | | | 0 | |
| | | | | | |
WealthBuilder Growth Allocation Fund | | | 0 | | | | 161,554 | | | | 6,456,778 | | | | (94,718 | ) | | | (551,590 | ) | | | 0 | |
| | | | | | |
WealthBuilder Growth Balanced Fund | | | 379,868 | | | | 307,408 | | | | 8,570,968 | | | | 0 | | | | (254,092 | ) | | | 0 | |
| | | | | | |
WealthBuilder Moderate Balanced Fund | | | 1,114,284 | | | | 2,938,426 | | | | 5,078,149 | | | | 0 | | | | (1,776,270 | ) | | | 0 | |
Effective for all filings after November 4, 2018, the Securities and Exchange Commission eliminated the requirement to separately state the components of distributions to shareholders under U.S. generally accepted accounting principles. The amounts of distributions to shareholders for the year ended May 31, 2018 were as follows:
| | | | | | | | | | | | | | |
| | | WealthBuilder Conservative
Allocation Fund | | | WealthBuilder
Equity Fund | |
| | | Net investment
income | | | Net realized
gains | | | Net investment
income | | Net realized
gains | |
| | | | |
Class A | | $ | 84,981 | | | $ | 114,069 | | | $0 | | $ | 502,275 | |
| | | | |
Class C | | | 3,383,508 | | | | 16,822,729 | | | 0 | | | 79,982,709 | |
| | | | | | | | | | | | | | | | | | | | | | | | |
| | | WealthBuilder Moderate
Balanced Fund | | | WealthBuilder Growth
Balanced Fund | | | WealthBuilder Growth
Allocation Fund | |
| | | Net investment
income | | | Net realized
gains | | | Net investment
income | | | Net realized
gains | | | Net investment
income | | | Net realized
gains | |
| | | | | | |
Class A | | $ | 27,480 | | | $ | 178,687 | | | $ | 73,232 | | | $ | 283,893 | | | $ | 104,006 | | | $ | 218,274 | |
| | | | | | |
Class C | | | 311,968 | | | | 48,425,171 | | | | 7,654,876 | | | | 88,230,007 | | | | 11,319,272 | | | | 51,659,441 | |
| | | | | | |
| Notes to financial statements | | Multi-Asset Funds | | | 79 | |
9. INDEMNIFICATION
Under the Trust’s organizational documents, the officers and Trustees have been granted certain indemnification rights against certain liabilities that may arise out of performance of their duties to the Trust. Additionally, in the normal course of business, the Trust may enter into contracts with service providers that contain a variety of indemnification clauses. The Trust’s maximum exposure under these arrangements is dependent on future claims that may be made against the Funds and, therefore, cannot be estimated.
10. NEW ACCOUNTING PRONOUNCEMENT
In August 2018, FASB issued Accounting Standards Update (“ASU”)No. 2018-13, Fair Value Measurement (Topic 820)Disclosure Framework—Changes to the Disclosure Requirements for Fair Value Measurement. ASU2018-13 updates the disclosure requirements for fair value measurements by modifying or removing certain disclosures and adding certain new disclosures. The amendments are effective for fiscal years, and interim periods within those fiscal years, beginning after December 15, 2019. Early adoption is permitted. Management has adopted the removal and modification of disclosures early, as permitted, and will adopt the additional new disclosures at the effective date.
| | | | |
| 80 | | Multi-Asset Funds | | Report of independent registered public accounting firm |
TO THE SHAREHOLDERS OF THE FUNDS AND BOARD OF TRUSTEES OF WELLS FARGO FUNDS TRUST:
Opinion on the Financial Statements
We have audited the accompanying statements of assets and liabilities of Wells Fargo WealthBuilder Conservative Allocation Fund, Wells Fargo WealthBuilder Equity Fund, Wells Fargo WealthBuilder Growth Allocation Fund, Wells Fargo WealthBuilder Growth Balanced Fund, and Wells Fargo WealthBuilder Moderate Balanced Fund (the Funds), five of the funds constituting Wells Fargo Funds Trust, including the portfolios of investments, as of May 31, 2019, the related statements of operations for the year then ended, the statements of changes in net assets for each of the years in the two-year period then ended, and the related notes (collectively, the financial statements) and the financial highlights for each of the years or periods in the five-year period then ended. In our opinion, the financial statements and financial highlights present fairly, in all material respects, the financial position of the Funds as of May 31, 2019, the results of their operations for the year then ended, the changes in their net assets for each of the years in the two-year period then ended, and the financial highlights for each of the years or periods in the five-year period then ended, in conformity with U.S. generally accepted accounting principles.
Basis for Opinion
These financial statements and financial highlights are the responsibility of the Funds’ management. Our responsibility is to express an opinion on these financial statements and financial highlights based on our audits. We are a public accounting firm registered with the Public Company Accounting Oversight Board (United States) (PCAOB) and are required to be independent with respect to the Funds in accordance with the U.S. federal securities laws and the applicable rules and regulations of the Securities and Exchange Commission and the PCAOB.
We conducted our audits in accordance with the standards of the PCAOB. Those standards require that we plan and perform the audit to obtain reasonable assurance about whether the financial statements and financial highlights are free of material misstatement, whether due to error or fraud. Our audits included performing procedures to assess the risks of material misstatement of the financial statements and financial highlights, whether due to error or fraud, and performing procedures that respond to those risks. Such procedures included examining, on a test basis, evidence regarding the amounts and disclosures in the financial statements and financial highlights. Such procedures also included confirmation of securities owned as of May 31, 2019, by correspondence with the transfer agents, custodian and brokers, or by other appropriate auditing procedures. Our audits also included evaluating the accounting principles used and significant estimates made by management, as well as evaluating the overall presentation of the financial statements and financial highlights. We believe that our audits provide a reasonable basis for our opinion.

We have not been able to determine the specific year that we began serving as the auditor of one or more Wells Fargo Funds investment companies; however we are aware that we have served as the auditor of one or more Wells Fargo Funds investment companies since at least 1955.
Boston, Massachusetts
July 26, 2019
| | | | | | |
| Other information (unaudited) | | Multi-Asset Funds | | | 81 | |
TAX INFORMATION
For corporate shareholders, pursuant to Section 854 of the Internal Revenue Code, the percentage of ordinary income dividends qualifying for the corporate dividends-received deduction was as follows for the fiscal year ended May 31, 2019:
| | | | |
| | | Dividends-received deduction | |
| |
WealthBuilder Conservative Allocation Fund | | | 13.96 | % |
| |
WealthBuilder Equity Fund | | | 64.05 | |
| |
WealthBuilder Growth Allocation Fund | | | 44.37 | |
| |
WealthBuilder Growth Balanced Fund | | | 39.79 | |
| |
WealthBuilder Moderate Balanced Fund | | | 31.06 | |
Pursuant to Section 852 of the Internal Revenue Code, the following amounts were designated as a 20% rate gain distribution for the fiscal year ended May 31, 2019:
| | | | |
| | | 20% rate gain distribution | |
| |
WealthBuilder Conservative Allocation Fund | | $ | 10,842,828 | |
| |
WealthBuilder Equity Fund | | | 65,572,317 | |
| |
WealthBuilder Growth Allocation Fund | | | 40,351,235 | |
| |
WealthBuilder Growth Balanced Fund | | | 65,523,431 | |
| |
WealthBuilder Moderate Balanced Fund | | | 27,152,903 | |
Pursuant to Section 854 of the Internal Revenue Code, the following amounts of income dividends paid during the fiscal year ended May 31, 2019 have been designated as qualified dividend income (QDI):
| | | | |
| | | QDI | |
| |
WealthBuilder Conservative Allocation Fund | | $ | 785,695 | |
| |
WealthBuilder Equity Fund | | | 6,940,355 | |
| |
WealthBuilder Growth Allocation Fund | | | 4,051,741 | |
| |
WealthBuilder Growth Balanced Fund | | | 6,047,624 | |
| |
WealthBuilder Moderate Balanced Fund | | | 2,615,951 | |
For the fiscal year ended May 31, 2019, the following amounts have been designated as interest-related dividends for nonresident alien shareholders pursuant to Section 871 of the Internal Revenue Code:
| | | | |
| | | Interest-related dividends | |
| |
WealthBuilder Conservative Allocation Fund | | $ | 1,361,967 | |
| |
WealthBuilder Equity Fund | | | 98,063 | |
| |
WealthBuilder Growth Allocation Fund | | | 451,635 | |
| |
WealthBuilder Growth Balanced Fund | | | 1,702,000 | |
| |
WealthBuilder Moderate Balanced Fund | | | 1,575,556 | |
| | | | |
| 82 | | Multi-Asset Funds | | Other information (unaudited) |
For the fiscal year ended May 31, 2019, the following amounts have been designated as short-term capital gain dividends for nonresident alien shareholders pursuant to Section 871 of the Internal Revenue Code:
| | | | |
| | | Short-term capital
gain dividends | |
| |
WealthBuilder Equity Fund | | $ | 5,570,758 | |
| |
WealthBuilder Growth Allocation Fund | | | 3,570,148 | |
| |
WealthBuilder Growth Balanced Fund | | | 4,777,710 | |
| |
WealthBuilder Moderate Balanced Fund | | | 442,176 | |
For the fiscal year ended May 31, 2019, the percentage of ordinary income distributed which was derived from interest on U.S. government securities was as follows:
| | | | |
| | | % of U.S. government
income | |
| |
WealthBuilder Conservative Allocation Fund | | | 12.08 | % |
| |
WealthBuilder Growth Allocation Fund | | | 1.21 | |
| |
WealthBuilder Growth Balanced Fund | | | 3.60 | |
| |
WealthBuilder Moderate Balanced Fund | | | 8.85 | |
PROXY VOTING INFORMATION
A description of the policies and procedures used to determine how to vote proxies relating to portfolio securities is available without charge, upon request, by calling1-800-222-8222, visiting our website atwfam.com, or visiting the SEC website at sec.gov. Information regarding how the proxies related to portfolio securities were voted during the most recent12-month period ended June 30 is available on the website atwfam.comor by visiting the SEC website at sec.gov.
QUARTERLY PORTFOLIO HOLDINGS
Each Fund files its complete schedule of portfolio holdings with the SEC for the first and third quarters of each fiscal year on Form N-Q, which is available by visiting the SEC website at sec.gov. Those forms may be reviewed and copied at the SEC’s Public Reference Room in Washington, DC. Information on the operation of the Public Reference Room may be obtained by calling 1-800-SEC-0330.
| | | | | | |
| Other information (unaudited) | | Multi-Asset Funds | | | 83 | |
BOARD OF TRUSTEES AND OFFICERS
Each of the Trustees and Officers1 listed in the table below acts in identical capacities for each fund in the Wells Fargo family of funds, which consists of 151 mutual funds comprising the Wells Fargo Funds Trust, Wells Fargo Variable Trust, Wells Fargo Master Trust and fourclosed-end funds (collectively the “Fund Complex”). This table should be read in conjunction with the Prospectus and the Statement of Additional Information2. The mailing address of each Trustee and Officer is 525 Market Street, 12th Floor, San Francisco, CA 94105. Each Trustee and Officer serves an indefinite term, however, each Trustee serves such term until reaching the mandatory retirement age established by the Trustees.
Independent Trustees
| | | | | | |
Name and
year of birth | | Position held and
length of service* | | Principal occupations during past five years or longer | | Current other
public company or
investment company
directorships |
| | | |
| William R. Ebsworth (Born 1957) | | Trustee, since 2015 | | Retired. From 1984 to 2013, equities analyst, portfolio manager, research director and chief investment officer at Fidelity Management and Research Company in Boston, Tokyo, and Hong Kong, and retired in 2013 as Chief Investment Officer of Fidelity Strategic Advisers, Inc. where he led a team of investment professionals managing client assets. Prior thereto, Board member of Hong Kong Securities Clearing Co., Hong Kong Options Clearing Corp., the Thailand International Fund, Ltd., Fidelity Investments Life Insurance Company, and Empire Fidelity Investments Life Insurance Company. Audit Committee Chair and Investment Committee Chair of the Vincent Memorial Hospital Endowment (non-profit organization). Mr. Ebsworth is a CFA® charterholder. | | N/A |
| | | |
| Jane A. Freeman (Born 1953) | | Trustee, since 2015; Chair Liaison, since 2018 | | Retired. From 2012 to 2014 and 1999 to 2008, Chief Financial Officer of Scientific Learning Corporation. From 2008 to 2012, Ms. Freeman provided consulting services related to strategic business projects. Prior to 1999, Portfolio Manager at Rockefeller & Co. and Scudder, Stevens & Clark. Board member of the Harding Loevner Funds from 1996 to 2014, serving as both Lead Independent Director and chair of the Audit Committee. Board member of the Russell Exchange Traded Funds Trust from 2011 to 2012 and the chair of the Audit Committee. Ms. Freeman is a Board Member of The Ruth Bancroft Garden(non-profit organization). She is also an inactive Chartered Financial Analyst. | | N/A |
| | | |
| Isaiah Harris, Jr. (Born 1952) | | Trustee, since 2009; Audit Committee Chairman, since 2019 | | Retired. Chairman of the Board of CIGNA Corporation since 2009, and Director since 2005. From 2003 to 2011, Director of Deluxe Corporation. Prior thereto, President and CEO of BellSouth Advertising and Publishing Corp. from 2005 to 2007, President and CEO of BellSouth Enterprises from 2004 to 2005 and President of BellSouth Consumer Services from 2000 to 2003. Emeritus member of the Iowa State University Foundation Board of Governors. Emeritus Member of the Advisory Board of Iowa State University School of Business. Advisory Board Member, Palm Harbor Academy (private school). Advisory Board Member, Child Evangelism Fellowship(non-profit). Mr. Harris is a certified public accountant (inactive status). | | CIGNA Corporation |
| | | |
| Judith M. Johnson (Born 1949) | | Trustee, since 2008; Audit Committee Chairman, from 2009 to 2018 | | Retired. Prior thereto, Chief Executive Officer and Chief Investment Officer of Minneapolis Employees Retirement Fund from 1996 to 2008. Ms. Johnson is an attorney, certified public accountant and a certified managerial accountant. | | N/A |
| | | | |
| 84 | | Multi-Asset Funds | | Other information (unaudited) |
| | | | | | |
Name and
year of birth | | Position held and
length of service* | | Principal occupations during past five years or longer | | Current other
public company or
investment company
directorships |
| | | |
| David F. Larcker (Born 1950) | | Trustee, since 2009 | | James Irvin Miller Professor of Accounting at the Graduate School of Business, Stanford University, Director of the Corporate Governance Research Initiative and Senior Faculty of The Rock Center for Corporate Governance since 2006. From 2005 to 2008, Professor of Accounting at the Graduate School of Business, Stanford University. Prior thereto, Ernst & Young Professor of Accounting at The Wharton School, University of Pennsylvania from 1985 to 2005. | | N/A |
| | | |
| Olivia S. Mitchell (Born 1953) | | Trustee, since 2006; Nominating and Governance Committee Chairman, since 2018 | | International Foundation of Employee Benefit Plans Professor, Wharton School of the University of Pennsylvania since 1993. Director of Wharton’s Pension Research Council and Boettner Center on Pensions & Retirement Research, and Research Associate at the National Bureau of Economic Research. Previously, Cornell University Professor from 1978 to 1993. | | N/A |
| | | |
| Timothy J. Penny (Born 1951) | | Trustee, since 1996; Chairman, since 2018 | | President and Chief Executive Officer of Southern Minnesota Initiative Foundation, anon-profit organization, since 2007. Member of the Board of Trustees of NorthStar Education Finance, Inc., anon-profit organization, since 2007. | | N/A |
| | | |
| James G. Polisson (Born 1959) | | Trustee, since 2018 | | Retired. Chief Marketing Officer, Source (ETF) UK Services, Ltd, from 2015 to 2017. From 2012 to 2015, Principal of The Polisson Group, LLC, a management consulting, corporate advisory and principal investing company. Chief Executive Officer and Managing Director at Russell Investments, Global Exchange Traded Funds from 2010 to 2012. Managing Director of Barclays Global Investors from 1998 to 2010 and Global Chief Marketing Officer for iShares and Barclays Global Investors from 2000 to 2010. Trustee of the San Francisco Mechanics’ Institute, anon-profit organization, from 2013 to 2015. Board member of the Russell Exchange Traded Fund Trust from 2011 to 2012. Director of Barclays Global Investors Holdings Deutschland GmbH from 2006 to 2009. Mr. Polisson is an attorney and has a retired status with the Massachusetts and District of Columbia Bar Associations. | | N/A |
| * | Length of service dates reflect the Trustee’s commencement of service with the Trust’s predecessor entities, where applicable. |
| | | | | | |
| Other information (unaudited) | | Multi-Asset Funds | | | 85 | |
Officers
| | | | | | |
Name and
year of birth | | Position held and
length of service | | Principal occupations during past five years or longer | | |
| | | |
| Andrew Owen (Born 1960) | | President, since 2017 | | Executive Vice President of Wells Fargo & Company and Head of Affiliated Managers, Wells Fargo Asset Management, since 2014. In addition, Mr. Owen is currently President, Chief Executive Officer and Director of Wells Fargo Funds Management, LLC since 2017. Prior thereto, Executive Vice President responsible for marketing, investments and product development for Wells Fargo Funds Management, LLC, from 2009 to 2014. | | |
| | | |
| Jeremy DePalma1 (Born 1974) | | Treasurer, since 2012 | | Senior Vice President of Wells Fargo Funds Management, LLC since 2009. Senior Vice President of Evergreen Investment Management Company, LLC from 2008 to 2010 and head of the Fund Reporting and Control Team within Fund Administration from 2005 to 2010. | | |
| | | |
| Alexander Kymn (Born 1973) | | Secretary and Chief Legal Officer, since 2018 | | Senior Company Counsel of Wells Fargo Bank, N.A. since 2018 (previously Senior Counsel from 2007 to 2018). Vice President of Wells Fargo Funds Management, LLC from 2008 to 2014. | | |
| | | |
| Michael H. Whitaker(Born 1967) | | Chief Compliance Officer, since 2016 | | Senior Vice President and Chief Compliance Officer since 2016. Senior Vice President and Chief Compliance Officer for Fidelity Investments from 2007 to 2016. | | |
| | | |
| David Berardi (Born 1975) | | Assistant Treasurer, since 2009 | | Vice President of Wells Fargo Funds Management, LLC since 2009. Vice President of Evergreen Investment Management Company, LLC from 2008 to 2010. Manager of Fund Reporting and Control for Evergreen Investment Management Company, LLC from 2004 to 2010. | | |
| 1 | Jeremy DePalma acts as Treasurer of 86 funds and Assistant Treasurer of 65 funds in the Fund Complex. |
| 2 | The Statement of Additional Information includes additional information about the Trustees and is available, without charge, upon request, by calling1-800-222-8222 or by visiting the website atwfam.com. |
| | | | |
| 86 | | Multi-Asset Funds | | Other information (unaudited) |
BOARD CONSIDERATION OF INVESTMENT MANAGEMENT ANDSUB-ADVISORY AGREEMENTS:
Wells Fargo WealthBuilder Conservative Allocation Fund, Wells Fargo WealthBuilder Equity Fund, Wells Fargo WealthBuilder Growth Allocation Fund, Wells Fargo WealthBuilder Growth Balanced Fund and Wells Fargo WealthBuilder Moderate Balanced Fund
Under the Investment Company Act of 1940 (the “1940 Act”), the Board of Trustees (the “Board”) of Wells Fargo Funds Trust (the “Trust”) must determine annually whether to approve the continuation of the Trust’s investment management andsub-advisory agreements. In this regard, at anin-person meeting held on May21-22, 2019 (the “Meeting”), the Board, all the members of which have no direct or indirect interest in the investment management andsub-advisory agreements and are not “interested persons” of the Trust, as defined in the 1940 Act (the “Independent Trustees”), reviewed and approved for each of the funds of the Trust identified above (each, a “Fund” and collectively, the “Funds”): (i) an investment management agreement (the “Management Agreement”) with Wells Fargo Funds Management, LLC (“Funds Management”); and (ii) an investmentsub-advisory agreement (the“Sub-Advisory Agreement”) with Wells Capital Management Incorporated (the“Sub-Adviser”), an affiliate of Funds Management. The Management Agreement and theSub-Advisory Agreement are collectively referred to as the “Advisory Agreements.”
At the Meeting, the Board considered the factors and reached the conclusions described below relating to the selection of Funds Management and theSub-Adviser and the approval of the Advisory Agreements. Prior to the Meeting, including at anin-person meeting in April 2019, the Trustees conferred extensively among themselves and with representatives of Funds Management about these matters. Also, the Board has adopted a team-based approach, with each team consisting of asub-set of Trustees, to assist the full Board in the discharge of its duties in reviewing investment performance and other matters throughout the year. The Independent Trustees were assisted in their evaluation of the Advisory Agreements by independent legal counsel, from whom they received separate legal advice and with whom they met separately.
In providing information to the Board, Funds Management and theSub-Adviser were guided by a detailed set of requests for information submitted to them by independent legal counsel on behalf of the Independent Trustees at the start of the Board’s annual contract renewal process earlier in 2019. In considering and approving the Advisory Agreements, the Trustees considered the information they believed relevant, including but not limited to the information discussed below. The Board considered not only the specific information presented in connection with the Meeting, but also the knowledge gained over time through interaction with Funds Management and theSub-Adviser about various topics. In this regard, the Board reviewed reports of Funds Management at each of its quarterly meetings, which included, among other things, portfolio reviews and investment performance reports. In addition, the Board and the teams mentioned above confer with portfolio managers at various times throughout the year. The Board did not identify any particular information or consideration that wasall-important or controlling, and each individual Trustee may have attributed different weights to various factors.
After its deliberations, the Board unanimously approved the continuation of the Advisory Agreements for aone-year term and determined that the compensation payable to Funds Management and theSub-Adviser under each of the Advisory Agreements was reasonable. The Board considered the approval of the Advisory Agreements for the Funds as part of its consideration of agreements for funds across the complex, but its approvals were made on afund-by-fund basis. The following summarizes a number of important, but not necessarily all, factors considered by the Board in support of its approvals.
Nature, extent and quality of services
The Board received and considered various information regarding the nature, extent and quality of services provided to the Funds by Funds Management and theSub-Adviser under the Advisory Agreements. This information included a description of the investment advisory services and Fund-level administrative services covered by the Management Agreement, as well as, among other things, a summary of the background and experience of senior management of Wells Fargo Asset Management (“WFAM”), of which Funds Management and theSub-Adviser are a part, a summary of investments made in the business of WFAM, a summary of certain organizational and personnel changes involving Funds Management and theSub-Adviser, and a description of Funds Management’s and theSub-Adviser’s business continuity planning programs and of their approaches to data privacy and cybersecurity. The Board received and reviewed information about Funds Management’s role as administrator of the Funds’ liquidity risk management program.The Board also considered the qualifications, background, tenure and responsibilities of each of the portfolio managers primarily responsible for theday-to-day portfolio management of the Funds.
At the Meeting, the Board also received and considered a presentation that the Trustees had requested from Funds Management, which reviewed, among other things, the Funds and their investment strategies, the Funds’ tactical asset allocation process, a volatility analysis, an assessment of performance and the process of evaluating and selecting unaffiliated underlying mutual funds.
| | | | | | |
| Other information (unaudited) | | Multi-Asset Funds | | | 87 | |
The Board evaluated the ability of Funds Management and theSub-Adviser to attract and retain qualified investment professionals, including research, advisory and supervisory personnel. The Board further considered the compliance programs and compliance records of Funds Management and theSub-Adviser. In addition, the Board took into account the full range of services provided to the Funds by Funds Management and its affiliates.
Fund investment performance and expenses
The Board considered the investment performance results for each of the Funds over various time periods ended December 31, 2018. The Board considered these results in comparison to the investment performance of funds in a universe that was determined by Broadridge Inc. (“Broadridge”) to be similar to the respective Funds (each, a “Universe”), and in comparison to each Fund’s benchmark index and to other comparative data. Broadridge is an independent provider of investment company data. The Board received a description of the methodology used by Broadridge to select the mutual funds in each performance Universe.
The Board noted that the investment performance of each Fund (Class A) relative to its respective Universe was as follows: (i) the investment performance of the WealthBuilder Conservative Allocation Fund was higher than the average investment performance of its Universe for theone-year period under review, but lower than the average investment performance of its Universe for the three-, five- andten-year periods under review; (ii) the investment performance of the WealthBuilder Equity Fund was higher than or in range of the average investment performance of its Universe for all periods under review; (iii) the investment performance of the WealthBuilder Growth Allocation Fund was higher than or in range of the average investment performance of its Universe for the three-, five- andten-year periods under review, but lower than the average investment performance of its Universe for theone-year period under review; (iv) the investment performance of the WealthBuilder Growth Balanced Fund was higher than or in range of the average investment performance of its Universe for theone-, three- andten-year periods under review, but lower than the average investment performance of its Universe for the five-year period under review; and (v) the investment performance of the WealthBuilder Moderate Balanced Fund was higher than the average investment performance of its Universe for theone-year period under review, but lower than the average investment performance of its Universe for the three-, five- andten-year periods under review.
The Board also noted that the investment performance of each Fund relative to its respective benchmark index was as follows: (i) the investment performance of the WealthBuilder Conservative Allocation Fund was lower than its benchmark index, the WealthBuilder Conservative Allocation Blended Index, which is a proprietary index used by the Board to help it assess the Fund’s relative performance, for all periods under review; (ii) the investment performance of the WealthBuilder Equity Fund was lower than its benchmark index, the WealthBuilder Equity Blended Index, which is a proprietary index used by the Board to help it assess the Fund’s relative performance, for all periods under review; (iii) the investment performance of the WealthBuilder Growth Allocation Fund was in range of its benchmark index, the WealthBuilder Growth Allocation Blended Index, which is a proprietary index used by the Board to help it assess the Fund’s relative performance, for theten-year period under review, but lower than its benchmark index for theone-, three- and five-year periods under review; (iv) the investment performance of the WealthBuilder Growth Balanced Fund was higher than its benchmark index, the WealthBuilder Growth Balanced Blended Index, which is a proprietary index used by the Board to help it assess the Fund’s relative performance, for theten-year period under review, but lower than its benchmark index for theone-, three- and five-year periods under review; and (v) the investment performance of the WealthBuilder Moderate Balanced Fund was lower than its benchmark index, the WealthBuilder Moderate Balanced Blended Index, which is a proprietary index used by the Board to help it assess the Fund’s relative performance, for all periods under review.
The Board received information concerning, and discussed factors contributing to, the underperformance of the Wells Fargo WealthBuilder Conservative Allocation Fund, Wells Fargo WealthBuilder Growth Balanced Fund and Wells Fargo WealthBuilder Moderate Balanced Fund for the periods identified above. The Board took note of the explanations for the relative underperformance during these periods, including with respect to investment decisions and market factors that affected such Funds’ investment performance. The Board also took note of the changes to such Funds’ investment process that were implemented in 2018.
The Board also received and considered information regarding each Fund’s net operating expense ratios and their various components, including actual management fees, custodian and othernon-management fees, and Rule12b-1 andnon-Rule12b-1 shareholder service fees. The Board considered these ratios for each Fund in comparison to the median ratios of funds in expense groups that were determined by Broadridge to be similar to the Fund (the “Groups”). The Board received a description of the methodology used by Broadridge to select the mutual funds in the expense Groups and an explanation of how funds comprising expense groups and their expense ratios may vary fromyear-to-year.
Based on the Broadridge reports, the Board noted that: (i) the net operating expense ratio of the WealthBuilder Conservative Allocation Fund, including underlying mutual fund expenses, was in range of the median net operating
| | | | |
| 88 | | Multi-Asset Funds | | Other information (unaudited) |
expense ratio of its expense Group for all share classes; and (ii) the net operating expense ratio of each of the WealthBuilder Equity Fund, WealthBuilder Growth Allocation Fund, WealthBuilder Growth Balanced Fund, and WealthBuilder Moderate Balanced Fund, including underlying mutual fund expenses, was lower than the median net operating expense ratio of such Fund’s respective expense Group for all share classes. The Board noted that the Funds invest in both affiliated and unaffiliated underlying mutual funds, while most of the funds included in each expense Group, and all of the funds identified by Funds Management as being in a competitorsub-group, invest only in affiliated funds. The Board also considered that the Funds are designed to offer exposure to a wide range of investment styles, including alternatives, while maintaining a low investment minimum.
The Board took into account the Funds’ investment performance and expense information provided to it among the factors considered in deciding tore-approve the Advisory Agreements.
Investment management andsub-advisory fee rates
The Board reviewed and considered the contractual fee rates payable by each Fund to Funds Management under the Management Agreement, as well as the contractual fee rates payable by each Fund to Funds Management for class-level administrative services under a Class-Level Administration Agreement, which include, among other things, class-level transfer agency andsub-transfer agency costs (collectively, the “Management Rates”). The Board also reviewed and considered the contractual investmentsub-advisory fee rates that are payable by Funds Management to theSub-Adviser for investmentsub-advisory services.
Among other information reviewed by the Board was a comparison of each Fund’s Management Rates with the average contractual investment management fee rates of funds in the expense Groups at a common asset level, as well as transfer agency costs of the funds in the expense Groups. The Board noted that the Management Rates of each Fund were higher than the average rates for the Fund’s expense Groups for all share classes, except Institutional Class of the Wells Fargo WealthBuilder Moderate Balanced Fund, which was in range of the average rate for the Fund’s expense Group. The Board noted that the net operating expense ratio of the each Fund, including underlying mutual fund expenses, was lower than or in range of the median net operating expense ratio of the Fund’s expense Group for all share classes. The Board also noted that the Funds are among the fewfunds-of-funds utilizing both affiliated and unaffiliated underlying funds, and received information from Funds Management about the process and resources required to evaluate and select unaffiliated underlying mutual funds.
The Board also received and considered information about the portion of the total management fee that was retained by Funds Management after payment of the fee to theSub-Adviser forsub-advisory services. In assessing the reasonableness of this amount, the Board received and evaluated information about the nature and extent of responsibilities retained and risks assumed by Funds Management and not delegated to or assumed by theSub-Adviser, and about Funds Management’son-going oversight services. Given the affiliation between Funds Management and theSub-Adviser, the Board ascribed limited relevance to the allocation of the fees between them.
Based on its consideration of the factors and information it deemed relevant, including those described here, the Board determined that the compensation payable to Funds Management under the Management Agreement and to theSub-Adviser under theSub-Advisory Agreement was reasonable.
Profitability
The Board received and considered information concerning the profitability of Funds Management, as well as the profitability of both WFAM and Wells Fargo & Co. (“Wells Fargo”) from providing services to the fund family as a whole. The Board noted that theSub-Adviser’s profitability information with respect to providing services to the Funds and other funds in the family was subsumed in the WFAM and Wells Fargo profitability analysis.
Funds Management reported on the methodologies and estimates used in calculating profitability, including a description of the methodology used to allocate certain expenses. Among other things, the Board noted that the levels of profitability reported on afund-by-fund basis varied widely, depending on factors such as the size, type and age of fund. Based on its review, the Board did not deem the profits reported by Funds Management, WFAM or Wells Fargo from services provided to the Funds to be at a level that would prevent it from approving the continuation of the Advisory Agreements.
Economies of scale
The Board received and considered information about the potential for Funds Management to experience economies of scale in the provision of management services to the Funds, the difficulties of calculating economies of scale at an individual fund level, and the extent to which potential scale benefits are shared with shareholders. The Board noted the
| | | | | | |
| Other information (unaudited) | | Multi-Asset Funds | | | 89 | |
existence of breakpoints in each Fund’s management fee structure, which operate generally to reduce the Fund’s expense ratios as the Fund grows in size. The Board considered that in addition to management fee breakpoints, Funds Management shares potential economies of scale from its management business in a variety of ways, including through fee waiver and expense reimbursement arrangements, services that benefit shareholders, competitive management fee rates set at the outset without regard to breakpoints, and investments in the business intended to enhance services available to shareholders.
The Board concluded that Funds Management’s arrangements with respect to the Funds, including contractual breakpoints, constituted a reasonable approach to sharing potential economies of scale with the Funds and their shareholders.
Other benefits to Funds Management and theSub-Adviser
The Board received and considered information regarding potential“fall-out” or ancillary benefits received by Funds Management and its affiliates, including theSub-Adviser, as a result of their relationships with the Funds. Ancillary benefits could include, among others, fees received from affiliated underlying mutual funds and benefits directly attributable to other relationships with the Funds and benefits potentially derived from an increase in Funds Management’s and theSub-Adviser’s business as a result of their relationships with the Funds. The Board noted that various affiliates of Funds Management may receive distribution-related fees, shareholder servicing payments andsub-transfer agency fees in respect of shares sold or held through them and services provided.
The Board also reviewed information about soft dollar credits earned and utilized by theSub-Adviser, fees earned by Funds Management and theSub-Adviser from managing a private investment vehicle for the fund family’s securities lending collateral, and commissions earned by an affiliated broker from portfolio transactions.
Based on its consideration of the factors and information it deemed relevant, including those described here, the Board did not find that any ancillary benefits received by Funds Management and its affiliates, including theSub-Adviser, were unreasonable.
Conclusion
At the Meeting, after considering the above-described factors and based on its deliberations and its evaluation of the information described above, the Board unanimously approved the continuation of the Advisory Agreements for aone-year term and determined that the compensation payable to Funds Management and theSub-Adviser under each of the Advisory Agreements was reasonable.
This page is intentionally left blank.
This page is intentionally left blank.
This page is intentionally left blank.

For more information
More information about Wells Fargo Funds is available free upon request. To obtain literature, please write, visit the Funds’ website, or call:
Wells Fargo Funds
P.O. Box 219967
Kansas City, MO 64121-9967
Website: wfam.com
Individual investors: 1-800-222-8222
Retail investment professionals: 1-888-877-9275
Institutional investment professionals: 1-866-765-0778
This report and the financial statements contained herein are submitted for the general information of the shareholders of Wells Fargo Funds. If this report is used for promotional purposes, distribution of the report must be accompanied or preceded by a current prospectus. Before investing, please consider the investment objectives, risks, charges, and expenses of the investment. For a current prospectus and, if available, a summary prospectus, containing this information, call1-800-222-8222 or visit the Funds’ website atwfam.com. Read the prospectus carefully before you invest or send money.
Wells Fargo Asset Management (WFAM) is the trade name for certain investment advisory/management firms owned by Wells Fargo & Company. These firms include but are not limited to Wells Capital Management Incorporated and Wells Fargo Funds Management, LLC. Certain products managed by WFAM entities are distributed by Wells Fargo Funds Distributor, LLC (a broker-dealer and Member FINRA).
This material is for general informational and educational purposes only and is NOT intended to provide investment advice or a recommendation of any kind—including a recommendation for any specific investment, strategy, or plan.
INVESTMENT PRODUCTS: NOT FDIC INSURED ◾ NO BANK GUARANTEE ◾ MAY LOSE VALUE
© 2019 Wells Fargo Funds Management, LLC. All rights reserved.
| | |
 | | 403203 07-19 AWBP/AR102 05-19 |
Annual Report
May 31, 2019

Wells Fargo C&B Large Cap Value Fund

Beginning on January 1, 2021, as permitted by new regulations adopted by the Securities and Exchange Commission, paper copies of the Wells Fargo Funds’ annual and semi-annual shareholder reports issued after this date will no longer be sent by mail, unless you specifically request paper copies of the reports. Instead, the reports will be made available on the Funds’ website, and you will be notified by mail each time a report is posted and provided with a website address to access the report.
If you already elected to receive shareholder reports electronically, you will not be affected by this change and you need not take any action. You may elect to receive shareholder reports and other communications from the Fund electronically at any time by contacting your financial intermediary (such as a broker-dealer or bank) or, if you are a direct investor, by calling 1-800-222-8222 or by enrolling at wellsfargo.com/advantagedelivery.
You may elect to receive all future reports in paper free of charge. If you invest through a financial intermediary, you can contact your financial intermediary to request that you continue to receive paper copies of your shareholder reports; if you invest directly with the Fund, you can call 1-800-222-8222. Your election to receive reports in paper will apply to all Wells Fargo Funds held in your account with your financial intermediary or, if you are a direct investor, to all Wells Fargo Funds that you hold.

Reduce clutter. Save trees.
Sign up for electronic delivery of prospectuses and shareholder reports atwellsfargo.com/advantagedelivery
Contents
The views expressed and any forward-looking statements are as of May 31, 2019, unless otherwise noted, and are those of the Fund managers and/or Wells Fargo Asset Management. Discussions of individual securities, or the markets generally, or any Wells Fargo Fund are not intended as individual recommendations. Future events or results may vary significantly from those expressed in any forward-looking statements. The views expressed are subject to change at any time in response to changing circumstances in the market. Wells Fargo Asset Management and the Fund disclaim any obligation to publicly update or revise any views expressed or forward-looking statements.
INVESTMENT PRODUCTS: NOT FDIC INSURED ◾ NO BANK GUARANTEE ◾ MAY LOSE VALUE
| | | | |
| 2 | | Wells Fargo C&B Large Cap Value Fund | | Letter to shareholders (unaudited) |

Andrew Owen
President
Wells Fargo Funds
Dear Shareholder:
We are pleased to offer you this annual report for the Wells Fargo C&B Large Cap Value Fund for the 12-month period that ended May 31, 2019. Higher short-term interest rates, inflation concerns, trade tensions, and geopolitical events drove investment market volatility for much of 2018, particularly for international stocks. Early 2019 saw stocks and bonds gain with renewed business and investor confidence, but volatility returned late in the period as global growth slowed and geopolitical concerns persisted.
For the period, U.S. stocks, based on the S&P 500 Index,1 gained 3.78% and international stocks, as measured by the MSCI ACWI ex USA Index (Net),2 fell 6.26%. Based on the MSCI EM Index (Net),3 emerging market stocks fell 8.70%. Bond investors saw the Bloomberg Barclays U.S. Aggregate Bond Index4 add 6.40% while the Bloomberg Barclays Global Aggregate ex-USD Index5 rose 0.39%. The Bloomberg Barclays Municipal Bond Index6 added 6.40%, and the ICE BofAML U.S. High Yield Index7 was up 5.37%.
Results for investment indices reflected global concerns.
Global trade tensions escalated during the second quarter of 2018. A tit-for-tat tariff spat intensified between the U.S. and other governments. The U.S. Federal Reserve (Fed) raised the federal funds rate by 25 basis points (bps; 100 bps equal 1.00%) to a target range of between 1.75% and 2.00% in June. Market index results reflected the global concerns. The MSCI ACWI ex USA Index (Net) lost 2.61%, while the Bloomberg Barclays Global Aggregate ex-USD Index dropped 4.76%.
Not all news was bad. The U.S. Bureau of Economic Analysis reported second-quarter annualized gross domestic product (GDP) growth of 4.2%. Hiring improved. Unemployment declined. Consumer confidence and spending increased. The S&P 500 Index recorded a 3.43% second-quarter gain. Stocks of companies with smaller capitalizations did even better, as measured by the Russell 2000® Index,8 adding 7.75%.
| 1 | The S&P 500 Index consists of 500 stocks chosen for market size, liquidity, and industry group representation. It is a market-value-weighted index with each stock’s weight in the index proportionate to its market value. You cannot invest directly in an index. |
| 2 | The Morgan Stanley Capital International (MSCI) All Country World Index (ACWI) ex USA Index (Net) is a free-float-adjusted market-capitalization-weighted index that is designed to measure the equity market performance of developed and emerging markets, excluding the U.S. Source: MSCI. MSCI makes no express or implied warranties or representations and shall have no liability whatsoever with respect to any MSCI data contained herein. The MSCI data may not be further redistributed or used as a basis for other indices or any securities or financial products. This report is not approved, reviewed, or produced by MSCI. You cannot invest directly in an index. |
| 3 | The MSCI Emerging Markets (EM) Index (Net) is a free-float-adjusted market-capitalization-weighted index that is designed to measure the equity market performance of emerging markets. You cannot invest directly in an index. |
| 4 | The Bloomberg Barclays U.S. Aggregate Bond Index is a broad-based benchmark that measures the investment-grade, U.S.-dollar-denominated, fixed-rate taxable bond market, including Treasuries, government-related and corporate securities, mortgage-backed securities (agency fixed-rate and hybrid adjustable-rate mortgage pass-throughs), asset-backed securities, and commercial mortgage-backed securities. You cannot invest directly in an index. |
| 5 | The Bloomberg Barclays Global Aggregate ex-USD Index is an unmanaged index that provides a broad-based measure of the global investment-grade fixed-income markets excluding the U.S.-dollar-denominated debt market. You cannot invest directly in an index. |
| 6 | The Bloomberg Barclays Municipal Bond Index is an unmanaged index composed of long-term tax-exempt bonds with a minimum credit rating of Baa. You cannot invest directly in an index. |
| 7 | The ICE BofAML U.S. High Yield Index is a market-capitalization-weighted index of domestic and Yankee high-yield bonds. The index tracks the performance of high-yield securities traded in the U.S. bond market. You cannot invest directly in an index. Copyright 2019. ICE Data Indices, LLC. All rights reserved. |
| 8 | The Russell 2000® Index measures the performance of the 2,000 smallest companies in the Russell 3000® Index, which represents approximately 8% of the total market capitalization of the Russell 3000® Index. You cannot invest directly in an index. |
| | | | | | |
| Letter to shareholders (unaudited) | | Wells Fargo C&B Large Cap Value Fund | | | 3 | |
Investors appeared to shake off lingering concerns during the third quarter.
Favorable third-quarter economic indicators and corporate earnings reports encouraged domestic stock investors. U.S. trade negotiations with Mexico and Canada progressed. The Conference Board Consumer Confidence Index®9 reached its highest level in 18 years during September 2018. The Fed raised the federal funds rate by 25 bps to a target range of between 2.00% and 2.25% in September. For the quarter that ended September 30, 2018, the S&P 500 Index added 7.71%.
Investors in international markets were not as confident. Tensions between the U.S. and China increased. The U.S. imposed $200 billion in tariffs on Chinese goods. China reacted with $60 billion in tariffs on U.S. goods. Economic growth in China caused concern. The Bank of England (BoE) raised its monetary policy rate to 0.75% in August 2018. During the quarter, the MSCI ACWI ex USA Index (Net) gained 0.71%. The MSCI EM Index (Net) declined 1.09%. In fixed-income markets, U.S. bonds were flat, as measured by the Bloomberg Barclays U.S. Aggregate Bond Index. The Bloomberg Barclays Global Aggregate ex-USD Index fell 1.74%.
Conflicting data unsettled markets during the fourth quarter.
November’s U.S. midterm elections shifted control of the House of Representatives from Republicans to Democrats, presaging potential partisan clashes. Third-quarter U.S. GDP was announced at an annualized 3.4% rate, lower than the second-quarter rate. Brexit efforts stalled ahead of the March 2019 deadline. The People’s Bank of China cut reserve requirement ratios, accelerated infrastructure spending, and cut taxes even as the value of the yuan declined to low levels last seen in 2008.
December’s S&P 500 Index performance was the worst since 1931. Globally,fixed-income investments fared better than stocks during the last two months of the year. The Fed increased the federal funds rate by 25 bps in December 2018 to a target range of between 2.25% and 2.50%.
The market climbs a wall of worry.
Investors entered 2019 with reasons to be concerned. A partial U.S. government shutdown driven by partisan policy disputes extended into January. Investment returns appeared to reaffirm the adage that markets climb a wall of worry. The S&P 500 Index gained 8.01% for the month of January, the best monthly performance in 30 years. Returns for the MSCI ACWI ex USA Index (Net), the Bloomberg Barclays U.S. Aggregate Bond Index, and the Bloomberg Barclays Global Aggregate ex-USD Index also were positive. The Fed indicated that it would pause its program of regular rate increases during 2019 as inflation remained low.
In February 2019, concerns over slowing global growth reemerged. The Bureau of Economic Analysis announced fourth-quarter 2018 GDP grew at an annualized 2.2% rate, down from levels of the prior two quarters. In a February report, the BoE forecast the slowest growth since the financial crisis for 2019. China and the U.S. continued to wrangle over trade issues.
By the end of March 2019, the combination of dovish Fed sentiment and consistent, if not spectacular, economic and business metrics reinforced investors’ confidence. Monthly job creation data regained momentum. Corporate profits, while lower than 2018’s lofty levels, remained solid. China announced a roughly $300 billion stimulus package through tax and fee cuts intended to reinvigorate economic growth.
December’s S&P 500 Index performance was the worst since 1931.
The S&P 500 Index gained 8.01% for the month of January, the best monthly performance in 30 years.
| 9 | The Conference Board Consumer Confidence Index® measures the degree of optimism on the state of the U.S. economy that consumers are expressing through their activities of saving and spending. You cannot invest directly in an index. |
| | | | |
| 4 | | Wells Fargo C&B Large Cap Value Fund | | Letter to shareholders (unaudited) |
During April 2019, several broad-based U.S. equity indices reached or approached highs as investors drew confidence from favorable economic projections, sustained low inflation, and solid employment data. First-quarter GDP showed the economy grew at an annualized rate of 3.2% on improvement in business investment and exports. Favorable sentiment extended to foreign markets as the MSCI ACWI ex USA Index (Net) gained 2.64% and the MSCI EM Index (Net) added 2.11% for the month.
May 2019 presented investors with mixed signals in the economy, in the markets, and politically. In the U.S., partisan wrangling ramped up as Democrats and Republicans set their sights on 2020 presidential politics. In the U.K., the Brexit stalemate resulted in the resignation of Prime Minister Theresa May. The European Commission downgraded the 2019 growth forecast for the block of countries to 1.2%. The U.S. increased tariffs on products from China, China responded, and then talks broke down. Ending the month, equities, as measured by the MSCI ACWI (Net),10 dropped 5.93% while bonds, often considered a less risky investment, gained 1.04%, as measured by the Bloomberg Barclays Global Aggregate ex-USD Index.
Don’t let short-term uncertainty derail long-term investment goals.
Periods of investment uncertainty can present challenges, but experience has taught us that maintaining long-term investment goals can be an effective way to plan for the future. To help you create a sound strategy based on your personal goals and risk tolerance, Wells Fargo Funds offers more than 100 mutual funds spanning a wide range of asset classes and investment styles. Although diversification cannot guarantee an investment profit or prevent losses, we believe it can be an effective way to manage investment risk and potentially smooth out overall portfolio performance. We encourage investors to know their investments and to understand that appropriate levels of risk-taking may unlock opportunities.
Thank you for choosing to invest with Wells Fargo Funds. We appreciate your confidence in us and remain committed to helping you meet your financial needs.
Sincerely,

Andrew Owen
President
Wells Fargo Funds
For further information about your Fund, contact your investment professional, visit our website atwfam.com, or call us directly at1-800-222-8222.
| 10 | The MSCI ACWI (Net) is a free-float-adjusted market-capitalization-weighted index that is designed to measure the equity market performance of developed and emerging markets. You cannot invest directly in an index. |
This page is intentionally left blank.
| | | | |
| 6 | | Wells Fargo C&B Large Cap Value Fund1 | | Performance highlights (unaudited) |
Investment objective
The Fund seeks maximum long-term total return (current income and capital appreciation), consistent with minimizing risk to principal.
Manager
Wells Fargo Funds Management, LLC
Subadviser for the affiliated master portfolio
Cooke & Bieler, L.P.
Portfolio managers
Andrew Armstrong, CFA®‡
Steve Lyons, CFA®‡
Michael M. Meyer, CFA®‡
Edward W. O’Connor, CFA®‡
R. James O’Neil, CFA®‡
Mehul Trivedi, CFA®‡
William Weber, CFA®‡
Average annual total returns (%) as of May 31, 2019
| | | | | | | | | | | | | | | | | | | | | | | | | | | | | | | | | | |
| | | | | Including sales charge | | | Excluding sales charge | | | Expense ratios2 (%) | |
| | | Inception date | | 1 year | | | 5 year | | | 10 year | | | 1 year | | | 5 year | | | 10 year | | | Gross | | | Net3 | |
| | | | | | | | | |
| Class A (CBEAX) | | 7-26-2004 | | | -4.50 | | | | 5.72 | | | | 11.11 | | | | 1.33 | | | | 6.98 | | | | 11.77 | | | | 1.21 | | | | 1.08 | |
| | | | | | | | | |
| Class C (CBECX) | | 7-26-2004 | | | -0.39 | | | | 6.18 | | | | 10.94 | | | | 0.61 | | | | 6.18 | | | | 10.94 | | | | 1.96 | | | | 1.83 | |
| | | | | | | | | |
| Class R6 (CBEJX)4 | | 10-31-2016 | | | – | | | | – | | | | – | | | | 1.74 | | | | 7.36 | | | | 12.17 | | | | 0.78 | | | | 0.65 | |
| | | | | | | | | |
| Administrator Class (CBLLX) | | 7-26-2004 | | | – | | | | – | | | | – | | | | 1.44 | | | | 7.13 | | | | 11.95 | | | | 1.13 | | | | 1.00 | |
| | | | | | | | | |
| Institutional Class (CBLSX) | | 7-26-2004 | | | – | | | | – | | | | – | | | | 1.64 | | | | 7.36 | | | | 12.24 | | | | 0.88 | | | | 0.75 | |
| | | | | | | | | |
| Russell 1000® Value Index5 | | – | | | – | | | | – | | | | – | | | | 1.45 | | | | 6.53 | | | | 12.33 | | | | – | | | | – | |
Figures quoted represent past performance, which is no guarantee of future results, and do not reflect taxes that a shareholder may pay on fund distributions or the redemption of fund shares. Investment return and principal value of an investment will fluctuate so that an investor’s shares, when redeemed, may be worth more or less than their original cost. Performance shown without sales charges would be lower if sales charges were reflected. Current performance may be lower or higher than the performance data quoted, which assumes the reinvestment of dividends and capital gains. Current month-end performance is available on the Fund’s website,wfam.com.
Index returns do not include transaction costs associated with buying and selling securities, any mutual fund fees or expenses, or any taxes. It is not possible to invest directly in an index.
For Class A shares, the maximum front-end sales charge is 5.75%. For Class C shares, the maximum contingent deferred sales charge is 1.00%. Performance including a contingent deferred sales charge assumes the sales charge for the corresponding time period. Class R6, Administrator Class, and Institutional Class shares are sold without a front-end sales charge or contingent deferred sales charge.
Stock values fluctuate in response to the activities of individual companies and general market and economic conditions. Consult the Fund’s prospectus for additional information on these and other risks.
Please see footnotes on page 7.
| | | | | | |
| Performance highlights (unaudited) | | Wells Fargo C&B Large Cap Value Fund | | | 7 | |
|
| Growth of $10,000 investment as of May 31, 20196 |
|
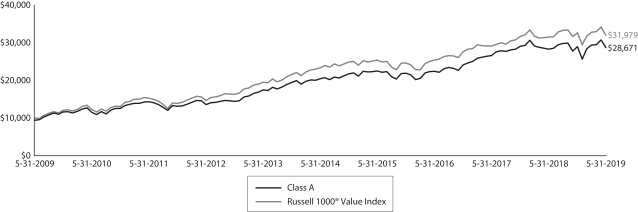 |
| ‡ | CFA® and Chartered Financial Analyst® are trademarks owned by CFA Institute. |
| 1 | The Fund is a gateway feeder fund that invests substantially all of its assets in a single affiliated master portfolio of the Wells Fargo Master Trust with a substantially identical investment objective and substantially similar investment strategies. References to the investment activities of the Fund are intended to refer to the investment activities of the affiliated master portfolio in which it invests. |
| 2 | Reflects the expense ratios as stated in the most recent prospectuses. The expense ratios shown are subject to change and may differ from the annualized expense ratios shown in the financial highlights of this report. |
| 3 | The manager has contractually committed through September 30, 2019, to waive fees and/or reimburse expenses to the extent necessary to cap the expenses of each class after fee waivers at the amounts shown. Brokerage commissions, stamp duty fees, interest, taxes, acquired fund fees and expenses (if any) from funds in which the affiliated master portfolio invests, and extraordinary expenses are excluded from the expense cap. Net expenses from the affiliated master portfolio are included in the expense cap. Prior to or after the commitment expiration date, the cap may be increased or the commitment to maintain the cap may be terminated only with the approval of the Board of Trustees. Without this cap, the Fund’s returns would have been lower. The expense ratio paid by an investor is the net expense ratio (the total annual fund operating expenses after fee waivers) as stated in the prospectuses. |
| 4 | Historical performance shown for Class R6 shares prior to their inception reflects the performance of the Institutional Class shares adjusted to reflect the higher expenses applicable to Class R6 shares. If these expenses had been included, returns for Class R6 shares would be higher. |
| 5 | The Russell 1000® Value Index measures the performance of those Russell 1000 companies with lower price/book ratios and lower forecasted growth values. You cannot invest directly in an index. |
| 6 | The chart compares the performance of Class A shares for the most recent ten years with the Russell 1000® Value Index. The chart assumes a hypothetical $10,000 investment in Class A shares and reflects all operating expenses and assumes the maximum initial sales charge of 5.75%. |
| 7 | The ten largest holdings, excluding cash, cash equivalents and any money market funds, are calculated based on the value of the securities of the affiliated master portfolio allocable to the Fund divided by the total net assets of the Fund. Holdings are subject to change and may have changed since the date specified. |
| 8 | Amounts represent the sector distribution of the affiliated master portfolio which are calculated based on the total long-term investments of the affiliated master portfolio. These amounts are subject to change and may have changed since the date specified. |
| * | The security was no longer held at the end of the period. |
| | | | |
| 8 | | Wells Fargo C&B Large Cap Value Fund | | Performance highlights (unaudited) |
MANAGER’S DISCUSSION
Fund highlights
| ∎ | | The Fund (Class A, excluding sales charges) posted a positive return but underperformed its benchmark, the Russell 1000® Value Index, for the 12-month period that ended May 31, 2019. |
| ∎ | | Sector positioning detracted from performance, particularly from underweights in utilities, consumer staples, and real estate, as well as an overweight in materials. |
| ∎ | | Stock selection contributed to performance, mainly due to the Fund’s holdings in the financials and materials sectors. |
Over the past year, investors were beset by increasing uncertainty, concerns about the direction of the economy, and rising oil prices. Stocks were being driven more by sentiment than underlying fundamentals. Although our commitment to investing in quality companies and bottom-up fundamental stock selection process were additive, the Fund underperformed its benchmark as investors sought the perceived safety of utilities, consumer staples, and real estate.
| | | | |
| Ten largest holdings (%) as of May 31, 20197 | |
| |
Fidelity National Financial Incorporated | | | 3.53 | |
| |
Synchrony Financial | | | 3.24 | |
| |
Chubb Limited | | | 3.04 | |
| |
Arrow Electronics Incorporated | | | 3.00 | |
| |
State Street Corporation | | | 2.78 | |
| |
Intercontinental Exchange Incorporated | | | 2.76 | |
| |
Brookfield Asset Management Incorporated Class A | | | 2.71 | |
| |
JPMorgan Chase & Company | | | 2.68 | |
| |
AerCap Holdings NV | | | 2.57 | |
| |
Amdocs Limited | | | 2.53 | |
Sector positioning was the primary reason for the underperformance mainly due to the underweights in three of the best-performing sectors for the Russell 1000® Value Index—utilities, consumer staples, and real estate, as well as the overweight in materials. Offsetting that was the contribution from our underweight in energy, the worst-performing sector for the index.
The largest stock detractors from the Fund’s performance were State Street Corporation, Schlumberger Limited, and AerCap Holdings N.V. State Street experienced lower fee income, a rise in expenses, and a decline in assets under custody and administration. Schlumberger, an oil-services provider, suffered due to a decline in oil prices. AerCap Holdings, a commercial airplane leasing
company, was punished for its perceived economic sensitivity despite its solid fundamentals as weakening global macroeconomic conditions could affect demand growth and airline credit quality. In each case, our ongoing research tells us that they have durable and competitively advantaged franchises that historically have sustained above-average returns on invested capital, growth, and free cash flow generation over time.
Stock selection contributed to performance particularly as a result of holdings in the financials and materials sectors. The top contributors to the Fund’s performance were: Crown Holdings, Incorporated; Gildan Activewear Incorporated; and Verizon Communications Incorporated. Crown Holdings, a leading manufacturer of beverage, food, and aerosol cans, reported solid results with strong free cash flow generation, creating confidence in its outlook and longer-term earnings power after weak performance in early 2018. Gildan Activewear, a Canadian manufacturer of branded clothing, experienced strong performance in activewear. Verizon Communications, the largest U.S. wireless telecommunication company, continued to benefit from good underlying wireless growth and solid profitability.
We took advantage of opportunities during the volatile 12-month period.
During the year, we took advantage of opportunities created by the volatile market environment. In addition to adding to existing holdings, we initiated positions in Bermuda-based specialty property and casualty and mortgage insurer Arch Capital Group Limited; semiconductor capital equipment manufacturer Applied Materials, Incorporated; the largest metals service center in North America, Reliance Steel & Aluminum Company; and American food company The Kraft Heinz Company*.
To make room for these positions, we trimmed some existing holdings and eliminated Accenture plc; Analog Devices, Incorporated; Markel Corporation; Twenty-First Century Fox, Incorporated; Ball Corporation; and Unilever N.V., all of which reached our price targets or offered significantly less appreciation potential than recently purchased stocks.
Please see footnotes on page 7.
| | | | | | |
| Performance highlights (unaudited) | | Wells Fargo C&B Large Cap Value Fund | | | 9 | |
|
| Sector distribution as of May 31, 20198 |
|
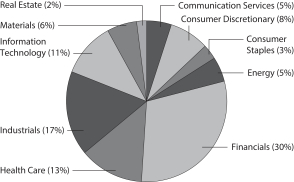
|
Understanding of fundamentals and a disciplined approach continues to be imperative.
Our market outlook for the remainder of this year is somewhat guarded. Amid growing uncertainty, we see a mixed environment, likely including increasing volatility. In view of the trade war and the ongoing uncertainty of its effect, along with other economic fears, an understanding of fundamentals and a disciplined approached is imperative. We continue to assess and reassess the investment thesis of every portfolio holding, subjecting each of them to the objective scrutiny embedded in our rigorous research effort and accountability system. Given our active, disciplined, long-term, bottom-up, fundamental approach, we remain confident in our time-tested investment process and in our team’s ability to practice it successfully.
Please see footnotes on page 7.
| | | | |
| 10 | | Wells Fargo C&B Large Cap Value Fund | | Fund expenses (unaudited) |
As a shareholder of the Fund, you incur two types of costs: (1) transaction costs, including sales charges (loads) on purchase payments and contingent deferred sales charges (if any) on redemptions and (2) ongoing costs, including management fees, distribution (12b-1) and/or shareholder servicing fees, and other Fund expenses. This example is intended to help you understand your ongoing costs (in dollars) of investing in the Fund and to compare these costs with the ongoing costs of investing in other mutual funds.
The example is based on an investment of $1,000 invested at the beginning of the six-month period and held for the entire period from December 1, 2018 to May 31, 2019.
Actual expenses
The “Actual” line of the table below provides information about actual account values and actual expenses. You may use the information in this line, together with the amount you invested, to estimate the expenses that you paid over the period. Simply divide your account value by $1,000 (for example, an $8,600 account value divided by $1,000 = 8.6), then multiply the result by the number in the “Actual” line under the heading entitled “Expenses paid during period” for your applicable class of shares to estimate the expenses you paid on your account during this period.
Hypothetical example for comparison purposes
The “Hypothetical” line of the table below provides information about hypothetical account values and hypothetical expenses based on the Fund’s actual expense ratio and an assumed rate of return of 5% per year before expenses, which is not the Fund’s actual return. The hypothetical account values and expenses may not be used to estimate the actual ending account balance or expenses you paid for the period. You may use this information to compare the ongoing costs of investing in the Fund and other funds. To do so, compare this 5% hypothetical example with the 5% hypothetical examples that appear in the shareholder reports of the other funds.
Please note that the expenses shown in the table are meant to highlight your ongoing costs only and do not reflect any transactional costs, such as sales charges (loads) and contingent deferred sales charges. Therefore, the “Hypothetical” line of the table is useful in comparing ongoing costs only and will not help you determine the relative total costs of owning different funds. In addition, if these transactional costs were included, your costs would have been higher.
| | | | | | | | | | | | | | | | |
| | | Beginning account value 12-1-2018 | | | Ending account value 5-31-2019 | | | Expenses paid during the period1,2 | | | Annualized net expense ratio1 | |
Class A | | | | | | | | | | | | | | | | |
| | | | |
Actual | | $ | 1,000.00 | | | $ | 990.55 | | | $ | 5.35 | | | | 1.08 | % |
| | | | |
Hypothetical (5% return before expenses) | | $ | 1,000.00 | | | $ | 1,019.56 | | | $ | 5.43 | | | | 1.08 | % |
Class C | | | | | | | | | | | | | | | | |
| | | | |
Actual | | $ | 1,000.00 | | | $ | 986.77 | | | $ | 9.05 | | | | 1.83 | % |
| | | | |
Hypothetical (5% return before expenses) | | $ | 1,000.00 | | | $ | 1,015.82 | | | $ | 9.18 | | | | 1.83 | % |
Class R6 | | | | | | | | | | | | | | | | |
| | | | |
Actual | | $ | 1,000.00 | | | $ | 992.53 | | | $ | 3.22 | | | | 0.65 | % |
| | | | |
Hypothetical (5% return before expenses) | | $ | 1,000.00 | | | $ | 1,021.70 | | | $ | 3.26 | | | | 0.65 | % |
Administrator Class | | | | | | | | | | | | | | | | |
| | | | |
Actual | | $ | 1,000.00 | | | $ | 990.93 | | | $ | 4.95 | | | | 1.00 | % |
| | | | |
Hypothetical (5% return before expenses) | | $ | 1,000.00 | | | $ | 1,019.96 | | | $ | 5.02 | | | | 1.00 | % |
Institutional Class | | | | | | | | | | | | | | | | |
| | | | |
Actual | | $ | 1,000.00 | | | $ | 992.21 | | | $ | 3.71 | | | | 0.75 | % |
| | | | |
Hypothetical (5% return before expenses) | | $ | 1,000.00 | | | $ | 1,021.20 | | | $ | 3.77 | | | | 0.75 | % |
| 1 | Amounts reflect net expenses allocated from the affiliated Master Portfolio in which the Fund invests. |
| 2 | Expenses paid is equal to the annualized net expense ratio of each class multiplied by the average account value over the period, multiplied by the number of days in the most recent fiscal half-year divided by the number of days in the fiscal year (to reflect the one-half-year period). |
| | | | | | |
| Portfolio of investments—May 31, 2019 | | Wells Fargo C&B Large Cap Value Fund | | | 11 | |
| | | | | | | | | | | | | | | | |
| Security name | | | | | | | | | | | Value | |
| | | | |
Investment Companies: 99.92% | | | | | | | | | | | | | | | | |
| | | | |
| Affiliated Master Portfolio: 99.92% | | | | | | | | | | | | | | | | |
| | | | |
Wells Fargo C&B Large Cap Value Portfolio | | | | | | | | | | | | | | $ | 270,294,844 | |
| | | | | | | | | | | | | | | | |
| | | | |
Total Investment Companies (Cost $223,590,685) | | | | | | | | | | | | | | | 270,294,844 | |
| | | | | | | | | | | | | | | | |
| | | | | | | | |
| Total investments in securities (Cost $223,590,685) | | | 99.92 | % | | | 270,294,844 | |
| | |
Other assets and liabilities, net | | | 0.08 | | | | 226,924 | |
| | | | | | | | |
| Total net assets | | | 100.00 | % | | $ | 270,521,768 | |
| | | | | | | | |
Transactions with the affiliated Master Portfolio were as follows:
| | | | | | | | | | | | | | | | | | | | | | | | | | | | | | | | |
| | | % of ownership, beginning of period | | | % of ownership, end of period | | | Net realized gains (losses) on securities transactions allocated from affiliated Master Portfolio | | | Net change in unrealized gains (losses) on securities transactions allocated from affiliated Master Portfolio | | | Dividends allocated from affiliated Master Portfolio | | | Affiliated income allocated from affiliated Master Portfolio | | | Value, end of period | | | % of net assets | |
Wells Fargo C&B Large Cap Value Portfolio | | | 93 | % | | | 77 | % | | $ | 22,450,835 | | | $ | (20,286,156 | ) | | $ | 6,073,585 | | | $ | 150,882 | | | $ | 270,294,844 | | | | 99.92 | % |
The accompanying notes are an integral part of these financial statements.
| | | | |
| 12 | | Wells Fargo C&B Large Cap Value Fund | | Statement of assets and liabilities—May 31, 2019 |
| | | | |
| | | | |
| |
Assets | | | | |
Investments in affiliated Master Portfolio, at value (cost $223,590,685) | | $ | 270,294,844 | |
Receivable for Fund shares sold | | | 454,438 | |
Receivable from manager | | | 34,791 | |
Prepaid expenses and other assets | | | 110,802 | |
| | | | |
Total assets | | | 270,894,875 | |
| | | | |
| |
Liabilities | | | | |
Payable for Fund shares redeemed | | | 313,701 | |
Administration fees payable | | | 33,038 | |
Distribution fee payable | | | 4,055 | |
Shareholder servicing fees payable | | | 22,313 | |
| | | | |
Total liabilities | | | 373,107 | |
| | | | |
Total net assets | | $ | 270,521,768 | |
| | | | |
| |
NET ASSETS CONSIST OF | | | | |
Paid-in capital | | $ | 212,055,796 | |
Total distributable earnings | | | 58,465,972 | |
| | | | |
Total net assets | | $ | 270,521,768 | |
| | | | |
| |
COMPUTATION OF NET ASSET VALUE AND OFFERING PRICE PER SHARE | | | | |
Net assets – Class A | | $ | 79,171,520 | |
Shares outstanding – Class A1 | | | 6,084,169 | |
Net asset value per share – Class A | | | $13.01 | |
Maximum offering price per share – Class A2 | | | $13.80 | |
Net assets – Class C | | $ | 5,097,967 | |
Shares outstanding – Class C1 | | | 396,138 | |
Net asset value per share – Class C | | | $12.87 | |
Net assets – Class R6 | | $ | 68,365,579 | |
Shares outstanding – Class R61 | | | 5,233,484 | |
Net asset value per share – Class R6 | | | $13.06 | |
Net assets – Administrator Class | | $ | 9,273,799 | |
Shares outstanding – Administrator Class1 | | | 711,749 | |
Net asset value per share – Administrator Class | | | $13.03 | |
Net assets – Institutional Class | | $ | 108,612,903 | |
Shares outstanding – Institutional Class1 | | | 8,320,628 | |
Net asset value per share – Institutional Class | | | $13.05 | |
| 1 | The Fund has an unlimited number of authorized shares. |
| 2 | Maximum offering price is computed as 100/94.25 of net asset value. On investments of $50,000 or more, the offering price is reduced. |
The accompanying notes are an integral part of these financial statements.
| | | | | | |
| Statement of operations—year ended May 31, 2019 | | Wells Fargo C&B Large Cap Value Fund | | | 13 | |
| | | | |
| | | | |
| |
Investment income | | | | |
Dividends allocated from affiliated Master Portfolio (net of foreign withholding taxes of $232,604) | | $ | 6,073,585 | |
Affiliated income allocated from affiliated Master Portfolio | | | 150,882 | |
Expenses allocated from affiliated Master Portfolio | | | (2,184,347 | ) |
Waivers allocated from affiliated Master Portfolio | | | 87,249 | |
| | | | |
Total investment income | | | 4,127,369 | |
| | | | |
| |
Expenses | | | | |
Management fee | | | 162,402 | |
Administration fees | | | | |
Class A | | | 172,972 | |
Class C | | | 19,347 | |
Class R6 | | | 30,111 | |
Administrator Class | | | 13,942 | |
Institutional Class | | | 158,769 | |
Shareholder servicing fees | | | | |
Class A | | | 205,919 | |
Class C | | | 23,031 | |
Administrator Class | | | 26,812 | |
Distribution fee | | | | |
Class C | | | 69,095 | |
Custody and accounting fees | | | 13,737 | |
Professional fees | | | 28,862 | |
Registration fees | | | 105,746 | |
Shareholder report expenses | | | 45,883 | |
Trustees’ fees and expenses | | | 21,120 | |
Other fees and expenses | | | 14,899 | |
| | | | |
Total expenses | | | 1,112,647 | |
Less: Fee waivers and/or expense reimbursements | | | (479,703 | ) |
| | | | |
Net expenses | | | 632,944 | |
| | | | |
Net investment income | | | 3,494,425 | |
| | | | |
| |
REALIZED AND UNREALIZED GAINS (LOSSES) ON INVESTMENTS | | | | |
Net realized gains on securities transactions allocated from affiliated Master Portfolio | | | 22,450,835 | |
Net change in unrealized gains (losses) on securities transactions allocated from affiliated Master Portfolio | | | (20,286,156 | ) |
| | | | |
Net realized and unrealized gains (losses) on investments | | | 2,164,679 | |
| | | | |
Net increase in net assets resulting from operations | | $ | 5,659,104 | |
| | | | |
The accompanying notes are an integral part of these financial statements.
| | | | |
| 14 | | Wells Fargo C&B Large Cap Value Fund | | Statement of changes in net assets |
| | | | | | | | | | | | | | | | |
| | | Year ended May 31, 2019 | | | Year ended May 31, 2018¹ | |
| | | | |
Operations | | | | | | | | | | | | | | | | |
Net investment income | | | | | | $ | 3,494,425 | | | | | | | $ | 3,023,151 | |
Net realized gains on investments | | | | | | | 22,450,835 | | | | | | | | 30,034,249 | |
Net change in unrealized gains (losses) on investments | | | | | | | (20,286,156 | ) | | | | | | | (11,845,354 | ) |
| | | | |
Net increase in net assets resulting from operations | | | | | | | 5,659,104 | | | | | | | | 21,212,046 | |
| | | | |
| | | | |
Distributions to shareholders from net investment income and net realized gains | | | | | | | | | | | | | | | | |
Class A | | | | | | | (5,854,644 | ) | | | | | | | (9,243,548 | ) |
Class C | | | | | | | (663,292 | ) | | | | | | | (1,063,860 | ) |
Class R6 | | | | | | | (8,273,383 | ) | | | | | | | (453,208 | ) |
Administrator Class | | | | | | | (729,387 | ) | | | | | | | (1,533,377 | ) |
Institutional Class | | | | | | | (9,537,075 | ) | | | | | | | (27,982,031 | ) |
| | | | |
Total distributions to shareholders | | | | | | | (25,057,781 | ) | | | | | | | (40,276,024 | ) |
| | | | |
| | | | |
Capital share transactions | | | Shares | | | | | | | | Shares | | | | | |
Proceeds from shares sold | | | | | | | | | | | | | | | | |
Class A | | | 598,330 | | | | 7,944,833 | | | | 919,384 | | | | 13,795,201 | |
Class C | | | 153,872 | | | | 1,981,780 | | | | 281,614 | | | | 4,187,818 | |
Class R6 | | | 709,584 | | | | 9,759,366 | | | | 7,863,006 | | | | 110,525,989 | |
Administrator Class | | | 63,073 | | | | 881,388 | | | | 297,700 | | | | 4,486,264 | |
Institutional Class | | | 2,556,786 | | | | 34,874,000 | | | | 6,201,334 | | | | 92,921,657 | |
| | | | |
| | | | |
| | | | | | | 55,441,367 | | | | | | | | 225,916,929 | |
| | | | |
Reinvestment of distributions | | | | | | | | | | | | | | | | |
Class A | | | 463,313 | | | | 5,752,084 | | | | 629,729 | | | | 9,080,968 | |
Class C | | | 53,533 | | | | 657,661 | | | | 73,825 | | | | 1,051,272 | |
Class R6 | | | 40,613 | | | | 506,108 | | | | 31,033 | | | | 449,875 | |
Administrator Class | | | 45,134 | | | | 561,040 | | | | 87,651 | | | | 1,265,630 | |
Institutional Class | | | 755,134 | | | | 9,401,667 | | | | 1,065,954 | | | | 15,442,909 | |
| | | | |
| | | | |
| | | | | | | 16,878,560 | | | | | | | | 27,290,654 | |
| | | | |
Payment for shares redeemed | | | | | | | | | | | | | | | | |
Class A | | | (1,139,570 | ) | | | (15,660,154 | ) | | | (1,094,969 | ) | | | (16,239,579 | ) |
Class C | | | (613,403 | ) | | | (8,120,776 | ) | | | (110,207 | ) | | | (1,620,229 | ) |
Class R6 | | | (3,440,746 | ) | | | (46,779,401 | ) | | | (212,138 | ) | | | (3,029,866 | ) |
Administrator Class | | | (311,921 | ) | | | (4,389,568 | ) | | | (257,513 | ) | | | (3,725,510 | ) |
Institutional Class | | | (4,670,529 | ) | | | (62,677,183 | ) | | | (12,692,000 | ) | | | (180,616,185 | ) |
| | | | |
| | | | |
| | | | | | | (137,627,082 | ) | | | | | | | (205,231,369 | ) |
| | | | |
Net increase (decrease) in net assets resulting from capital share transactions | | | | | | | (65,307,155 | ) | | | | | | | 47,976,214 | |
| | | | |
Total increase (decrease) in net assets | | | | | | | (84,705,832 | ) | | | | | | | 28,912,236 | |
| | | | |
| | | | |
Net assets | | | | | | | | | | | | | | | | |
Beginning of period | | | | | | | 355,227,600 | | | | | | | | 326,315,364 | |
| | | | |
End of period | | | | | | $ | 270,521,768 | | | | | | | $ | 355,227,600 | |
| | | | |
| 1 | Effective for all filings after November 4, 2018, the SEC prospectively eliminated the requirement to parenthetically disclose undistributed net investment income at the end of the period and permitted the aggregation of distributions, with the exception of tax basis returns of capital. Undistributed net investment income at May 31, 2018 was $1,304,663. The disaggregated distributions information for the year ended May 31, 2018 is included in Note 7,Distributions to Shareholders,in the notes to the financial statements. |
The accompanying notes are an integral part of these financial statements.
| | | | | | |
| Financial highlights | | Wells Fargo C&B Large Cap Value Fund | | | 15 | |
(For a share outstanding throughout each period)
| | | | | | | | | | | | | | | | | | | | |
| | | Year ended May 31 | |
| CLASS A | | 2019 | | | 2018 | | | 2017 | | | 2016 | | | 2015 | |
Net asset value, beginning of period | | | $13.91 | | | | $14.54 | | | | $12.55 | | | | $13.07 | | | | $11.99 | |
Net investment income | | | 0.11 | | | | 0.09 | 1 | | | 0.08 | | | | 0.11 | 1 | | | 0.10 | |
Net realized and unrealized gains (losses) on investments | | | 0.02 | | | | 0.87 | | | | 2.23 | | | | (0.14 | ) | | | 1.07 | |
| | | | | | | | | | | | | | | | | | | | |
Total from investment operations | | | 0.13 | | | | 0.96 | | | | 2.31 | | | | (0.03 | ) | | | 1.17 | |
Distributions to shareholders from | | | | | | | | | | | | | | | | | | | | |
Net investment income | | | (0.12 | ) | | | (0.06 | ) | | | (0.08 | ) | | | (0.10 | ) | | | (0.09 | ) |
Net realized gains | | | (0.91 | ) | | | (1.53 | ) | | | (0.24 | ) | | | (0.39 | ) | | | 0.00 | |
| | | | | | | | | | | | | | | | | | | | |
Total distributions to shareholders | | | (1.03 | ) | | | (1.59 | ) | | | (0.32 | ) | | | (0.49 | ) | | | (0.09 | ) |
Net asset value, end of period | | | $13.01 | | | | $13.91 | | | | $14.54 | | | | $12.55 | | | | $13.07 | |
Total return2 | | | 1.33 | % | | | 6.29 | % | | | 18.62 | % | | | (0.08 | )% | | | 9.78 | % |
Ratios to average net assets (annualized) | | | | | | | | | | | | | | | | | | | | |
Gross expenses3 | | | 1.23 | % | | | 1.21 | % | | | 1.24 | % | | | 1.25 | % | | | 1.29 | % |
Net expenses3 | | | 1.08 | % | | | 1.10 | % | | | 1.15 | % | | | 1.15 | % | | | 1.15 | % |
Net investment income3 | | | 0.83 | % | | | 0.58 | % | | | 0.62 | % | | | 0.89 | % | | | 0.73 | % |
Supplemental data | | | | | | | | | | | | | | | | | | | | |
Portfolio turnover rate4 | | | 47 | % | | | 42 | % | | | 89 | % | | | 29 | % | | | 35 | % |
Net assets, end of period (000s omitted) | | | $79,172 | | | | $85,707 | | | | $83,016 | | | | $88,387 | | | | $27,085 | |
| 1 | Calculated based upon average shares outstanding |
| 2 | Total return calculations do not include any sales charges. |
| 3 | Ratios include net expenses allocated from the affiliated Master Portfolio which were as follows: |
| | | | |
Year ended May 31, 2019 | | | 0.65 | % |
Year ended May 31, 2018 | | | 0.66 | % |
Year ended May 31, 2017 | | | 0.68 | % |
Year ended May 31, 2016 | | | 0.68 | % |
Year ended May 31, 2015 | | | 0.68 | % |
| 4 | Portfolio turnover rate is calculated by multiplying the affiliated Master Portfolio’s percentage of the Fund’s total investments in securities at the end of the period by the affiliated Master Portfolio’s portfolio turnover rate. |
The accompanying notes are an integral part of these financial statements.
| | | | |
| 16 | | Wells Fargo C&B Large Cap Value Fund | | Financial highlights |
(For a share outstanding throughout each period)
| | | | | | | | | | | | | | | | | | | | |
| | | Year ended May 31 | |
| CLASS C | | 2019 | | | 2018 | | | 2017 | | | 2016 | | | 2015 | |
Net asset value, beginning of period | | | $13.75 | | | | $14.44 | | | | $12.48 | | | | $13.01 | | | | $11.95 | |
Net investment income (loss) | | | 0.01 | 1 | | | (0.02 | )1 | | | (0.02 | ) | | | 0.01 | | | | (0.00 | )2 |
Net realized and unrealized gains (losses) on investments | | | 0.03 | | | | 0.86 | | | | 2.22 | | | | (0.14 | ) | | | 1.07 | |
| | | | | | | | | | | | | | | | | | | | |
Total from investment operations | | | 0.04 | | | | 0.84 | | | | 2.20 | | | | (0.13 | ) | | | 1.07 | |
Distributions to shareholders from | | | | | | | | | | | | | | | | | | | | |
Net investment income | | | (0.01 | ) | | | 0.00 | | | | 0.00 | | | | (0.01 | ) | | | (0.01 | ) |
Net realized gains | | | (0.91 | ) | | | (1.53 | ) | | | (0.24 | ) | | | (0.39 | ) | | | 0.00 | |
| | | | | | | | | | | | | | | | | | | | |
Total distributions to shareholders | | | (0.92 | ) | | | (1.53 | ) | | | (0.24 | ) | | | (0.40 | ) | | | (0.01 | ) |
Net asset value, end of period | | | $12.87 | | | | $13.75 | | | | $14.44 | | | | $12.48 | | | | $13.01 | |
Total return3 | | | 0.61 | % | | | 5.46 | % | | | 17.73 | % | | | (0.82 | )% | | | 8.93 | % |
Ratios to average net assets (annualized) | | | | | | | | | | | | | | | | | | | | |
Gross expenses4 | | | 1.97 | % | | | 1.96 | % | | | 1.99 | % | | | 2.00 | % | | | 2.04 | % |
Net expenses4 | | | 1.83 | % | | | 1.85 | % | | | 1.90 | % | | | 1.90 | % | | | 1.90 | % |
Net investment income (loss) 4 | | | 0.07 | % | | | (0.16 | )% | | | (0.13 | )% | | | 0.11 | % | | | (0.02 | )% |
Supplemental data | | | | | | | | | | | | | | | | | | | | |
Portfolio turnover rate5 | | | 47 | % | | | 42 | % | | | 89 | % | | | 29 | % | | | 35 | % |
Net assets, end of period (000s omitted) | | | $5,098 | | | | $11,031 | | | | $8,043 | | | | $7,282 | | | | $7,654 | |
| 1 | Calculated based upon average shares outstanding |
| 2 | Amount is more than $(0.005). |
| 3 | Total return calculations do not include any sales charges. |
| 4 | Ratios include net expenses allocated from the affiliated Master Portfolio which were as follows: |
| | | | |
Year ended May 31, 2019 | | | 0.65 | % |
Year ended May 31, 2018 | | | 0.66 | % |
Year ended May 31, 2017 | | | 0.68 | % |
Year ended May 31, 2016 | | | 0.68 | % |
Year ended May 31, 2015 | | | 0.68 | % |
| 5 | Portfolio turnover rate is calculated by multiplying the affiliated Master Portfolio’s percentage of the Fund’s total investments in securities at the end of the period by the affiliated Master Portfolio’s portfolio turnover rate. |
The accompanying notes are an integral part of these financial statements.
| | | | | | |
| Financial highlights | | Wells Fargo C&B Large Cap Value Fund | | | 17 | |
(For a share outstanding throughout each period)
| | | | | | | | | | | | |
| | | Year ended May 31 | |
| CLASS R6 | | 2019 | | | 2018 | | | 20171 | |
Net asset value, beginning of period | | | $13.97 | | | | $14.59 | | | | $12.73 | |
Net investment income | | | 0.18 | 2 | | | 0.18 | 2 | | | 0.16 | |
Net realized and unrealized gains (losses) on investments | | | 0.00 | 3 | | | 0.85 | | | | 2.06 | |
| | | | | | | | | | | | |
Total from investment operations | | | 0.18 | | | | 1.03 | | | | 2.22 | |
Distributions to shareholders from | | | | | | | | | | | | |
Net investment income | | | (0.18 | ) | | | (0.12 | ) | | | (0.12 | ) |
Net realized gains | | | (0.91 | ) | | | (1.53 | ) | | | (0.24 | ) |
| | | | | | | | | | | | |
Total distributions to shareholders | | | (1.09 | ) | | | (1.65 | ) | | | (0.36 | ) |
Net asset value, end of period | | | $13.06 | | | | $13.97 | | | | $14.59 | |
Total return4 | | | 1.74 | % | | | 6.76 | % | | | 17.65 | % |
Ratios to average net assets (annualized) | | | | | | | | | | | | |
Gross expenses5 | | | 0.79 | % | | | 0.77 | % | | | 0.81 | % |
Net expenses5 | | | 0.65 | % | | | 0.65 | % | | | 0.70 | % |
Net investment income5 | | | 1.27 | % | | | 1.28 | % | | | 1.04 | % |
Supplemental data | | | | | | | | | | | | |
Portfolio turnover rate6 | | | 47 | % | | | 42 | % | | | 89 | % |
Net assets, end of period (000s omitted) | | | $68,366 | | | | $110,665 | | | | $3,532 | |
| 1 | For the period from October 31, 2016 (commencement of class operations) to March 31, 2017 |
| 2 | Calculated based upon average shares outstanding |
| 3 | Amount is less than $0.005. |
| 4 | Returns for periods of less than one year are not annualized. |
| 5 | Ratios include net expenses allocated from the affiliated Master Portfolio which were as follows: |
| | | | |
Year ended May 31, 2019 | | | 0.65 | % |
Year ended May 31, 2018 | | | 0.65 | % |
Year ended May 31, 20171 | | | 0.68 | % |
| 6 | Portfolio turnover rate is calculated by multiplying the affiliated Master Portfolio’s percentage of the Fund’s total investments in securities at the end of the period by the affiliated Master Portfolio’s portfolio turnover rate. |
The accompanying notes are an integral part of these financial statements.
| | | | |
| 18 | | Wells Fargo C&B Large Cap Value Fund | | Financial highlights |
(For a share outstanding throughout each period)
| | | | | | | | | | | | | | | | | | | | |
| | | Year ended May 31 | |
| ADMINISTRATOR CLASS | | 2019 | | | 2018 | | | 2017 | | | 2016 | | | 2015 | |
Net asset value, beginning of period | | | $13.92 | | | | $14.56 | | | | $12.54 | | | | $13.07 | | | | $12.00 | |
Net investment income | | | 0.12 | 1 | | | 0.10 | 1 | | | 0.10 | 1 | | | 0.13 | 1 | | | 0.13 | |
Net realized and unrealized gains (losses) on investments | | | 0.02 | | | | 0.87 | | | | 2.24 | | | | (0.15 | ) | | | 1.06 | |
| | | | | | | | | | | | | | | | | | | | |
Total from investment operations | | | 0.14 | | | | 0.97 | | | | 2.34 | | | | (0.02 | ) | | | 1.19 | |
Distributions to shareholders from | | | | | | | | | | | | | | | | | | | | |
Net investment income | | | (0.12 | ) | | | (0.08 | ) | | | (0.08 | ) | | | (0.12 | ) | | | (0.12 | ) |
Net realized gains | | | (0.91 | ) | | | (1.53 | ) | | | (0.24 | ) | | | (0.39 | ) | | | 0.00 | |
| | | | | | | | | | | | | | | | | | | | |
Total distributions to shareholders | | | (1.03 | ) | | | (1.61 | ) | | | (0.32 | ) | | | (0.51 | ) | | | (0.12 | ) |
Net asset value, end of period | | | $13.03 | | | | $13.92 | | | | $14.56 | | | | $12.54 | | | | $13.07 | |
Total return | | | 1.44 | % | | | 6.36 | % | | | 18.82 | % | | | 0.11 | % | | | 9.93 | % |
Ratios to average net assets (annualized) | | | | | | | | | | | | | | | | | | | | |
Gross expenses2 | | | 1.15 | % | | | 1.13 | % | | | 1.16 | % | | | 1.16 | % | | | 1.13 | % |
Net expenses2 | | | 1.00 | % | | | 1.00 | % | | | 1.00 | % | | | 0.98 | % | | | 0.95 | % |
Net investment income2 | | | 0.90 | % | | | 0.69 | % | | | 0.77 | % | | | 1.03 | % | | | 0.92 | % |
Supplemental data | | | | | | | | | | | | | | | | | | | | |
Portfolio turnover rate3 | | | 47 | % | | | 42 | % | | | 89 | % | | | 29 | % | | | 35 | % |
Net assets, end of period (000s omitted) | | | $9,274 | | | | $12,742 | | | | $11,467 | | | | $23,210 | | | | $55,705 | |
| 1 | Calculated based upon average shares outstanding |
| 2 | Ratios include net expenses allocated from the affiliated Master Portfolio which were as follows: |
| | | | |
Year ended May 31, 2019 | | | 0.65 | % |
Year ended May 31, 2018 | | | 0.66 | % |
Year ended May 31, 2017 | | | 0.68 | % |
Year ended May 31, 2016 | | | 0.68 | % |
Year ended May 31, 2015 | | | 0.68 | % |
| 3 | Portfolio turnover rate is calculated by multiplying the affiliated Master Portfolio’s percentage of the Fund’s total investments in securities at the end of the period by the affiliated Master Portfolio’s portfolio turnover rate. |
The accompanying notes are an integral part of these financial statements.
| | | | | | |
| Financial highlights | | Wells Fargo C&B Large Cap Value Fund | | | 19 | |
(For a share outstanding throughout each period)
| | | | | | | | | | | | | | | | | | | | |
| | | Year ended May 31 | |
| INSTITUTIONAL CLASS | | 2019 | | | 2018 | | | 2017 | | | 2016 | | | 2015 | |
Net asset value, beginning of period | | | $13.96 | | | | $14.58 | | | | $12.58 | | | | $13.11 | | | | $12.03 | |
Net investment income | | | 0.14 | | | | 0.13 | 1 | | | 0.14 | | | | 0.16 | | | | 0.15 | |
Net realized and unrealized gains (losses) on investments | | | 0.02 | | | | 0.89 | | | | 2.22 | | | | (0.14 | ) | | | 1.08 | |
| | | | | | | | | | | | | | | | | | | | |
Total from investment operations | | | 0.16 | | | | 1.02 | | | | 2.36 | | | | 0.02 | | | | 1.23 | |
Distributions to shareholders from | | | | | | | | | | | | | | | | | | | | |
Net investment income | | | (0.16 | ) | | | (0.11 | ) | | | (0.12 | ) | | | (0.16 | ) | | | (0.15 | ) |
Net realized gains | | | (0.91 | ) | | | (1.53 | ) | | | (0.24 | ) | | | (0.39 | ) | | | 0.00 | |
| | | | | | | | | | | | | | | | | | | | |
Total distributions to shareholders | | | (1.07 | ) | | | (1.64 | ) | | | (0.36 | ) | | | (0.55 | ) | | | (0.15 | ) |
Net asset value, end of period | | | $13.05 | | | | $13.96 | | | | $14.58 | | | | $12.58 | | | | $13.11 | |
Total return | | | 1.64 | % | | | 6.68 | % | | | 19.05 | % | | | 0.33 | % | | | 10.15 | % |
Ratios to average net assets (annualized) | | | | | | | | | | | | | | | | | | | | |
Gross expenses2 | | | 0.90 | % | | | 0.88 | % | | | 0.91 | % | | | 0.92 | % | | | 0.86 | % |
Net expenses2 | | | 0.75 | % | | | 0.77 | % | | | 0.80 | % | | | 0.77 | % | | | 0.70 | % |
Net investment income2 | | | 1.17 | % | | | 0.87 | % | | | 0.96 | % | | | 1.25 | % | | | 1.18 | % |
Supplemental data | | | | | | | | | | | | | | | | | | | | |
Portfolio turnover rate3 | | | 47 | % | | | 42 | % | | | 89 | % | | | 29 | % | | | 35 | % |
Net assets, end of period (000s omitted) | | | $108,613 | | | | $135,082 | | | | $220,257 | | | | $133,632 | | | | $132,768 | |
| 1 | Calculated based upon average shares outstanding |
| 2 | Ratios include net expenses allocated from the affiliated Master Portfolio which were as follows: |
| | | | |
Year ended May 31, 2019 | | | 0.65 | % |
Year ended May 31, 2018 | | | 0.66 | % |
Year ended May 31, 2017 | | | 0.68 | % |
Year ended May 31, 2016 | | | 0.68 | % |
Year ended May 31, 2015 | | | 0.68 | % |
| 3 | Portfolio turnover rate is calculated by multiplying the affiliated Master Portfolio’s percentage of the Fund’s total investments in securities at the end of the period by the affiliated Master Portfolio’s portfolio turnover rate. |
The accompanying notes are an integral part of these financial statements.
| | | | |
| 20 | | Wells Fargo C&B Large Cap Value Fund | | Notes to financial statements |
1. ORGANIZATION
Wells Fargo Funds Trust (the “Trust”), a Delaware statutory trust organized on March 10, 1999, is an open-end management investment company registered under the Investment Company Act of 1940, as amended (the “1940 Act”). As an investment company, the Trust follows the accounting and reporting guidance in Financial Accounting Standards Board (“FASB”) Accounting Standards Codification Topic 946, Financial Services – Investment Companies. These financial statements report on the Wells Fargo C&B Large Cap Value Fund (the “Fund”) which is a diversified series of the Trust.
The Fund is a feeder fund in a master-feeder structure that invests substantially all of its assets in a single master portfolio with a substantially identical investment objective and substantially similar investment strategies. The Fund seeks to achieve its investment objective by investing all investable assets in a separate diversified portfolio (the “affiliated Master Portfolio”) of Wells Fargo Master Trust, a registered open-end management investment company. The affiliated Master Portfolio directly acquires portfolio securities and the Fund acquires an indirect interest in those securities. The Fund accounts for its investment in the affiliated Master Portfolio as a partnership investment and records on a daily basis its share of the affiliated Master Portfolio’s income, expense and realized and unrealized gains and losses. The financial statements of the affiliated Master Portfolio for the year ended May 31, 2019 are included in this report and should be read in conjunction with the Fund’s financial statements. As of May 31, 2019, the Fund owned 77% of Wells Fargo C&B Large Cap Value Portfolio.
2. SIGNIFICANT ACCOUNTING POLICIES
The following significant accounting policies, which are consistently followed in the preparation of the financial statements of the Fund, are in conformity with U.S. generally accepted accounting principles which require management to make estimates and assumptions that affect the reported amounts of assets and liabilities, disclosure of contingent assets and liabilities at the date of the financial statements, and the reported amounts of revenues and expenses during the reporting period. Actual results could differ from those estimates.
Securities valuation
All investments are valued each business day as of the close of regular trading on the New York Stock Exchange (generally 4 p.m. Eastern Time), although the Fund may deviate from this calculation time under unusual or unexpected circumstances.
Investments in the affiliated Master Portfolio are valued daily based on the Fund’s proportionate share of the affiliated Master Portfolio’s net assets, which are also valued daily. Securities held in the affiliated Master Portfolio are valued as discussed in the Notes to Financial Statements of the affiliated Master Portfolio, which are included elsewhere in this report.
Investment transactions, income and expenses
Investments in the affiliated Master Portfolio are recorded on a trade basis. The Fund records daily its proportionate share of the affiliated Master Portfolio’s dividend income, expenses and realized and unrealized gains or losses. The Fund also accrues its own expenses.
Distributions to shareholders
Distributions to shareholders from net investment income and any net realized gains are recorded on the ex-dividend date and paid at least annually. Such distributions are determined in accordance with income tax regulations and may differ from U.S. generally accepted accounting principles. Dividend sources are estimated at the time of declaration. The tax character of distributions is determined as of the Fund’s fiscal year end. Therefore, a portion of the Fund’s distributions made prior to the Fund’s fiscal year end may be categorized as a tax return of capital at year end.
Federal and other taxes
The Fund intends to continue to qualify as a regulated investment company by distributing substantially all of its investment company taxable income and any net realized capital gains (after reduction for capital loss carryforwards) sufficient to relieve it from all, or substantially all, federal income taxes. Accordingly, no provision for federal income taxes was required.
The Fund’s income and federal excise tax returns and all financial records supporting those returns for the prior three fiscal years are subject to examination by the federal and Delaware revenue authorities. Management has analyzed the Fund’s tax positions taken on federal, state, and foreign tax returns for all open tax years and does not believe that there are any uncertain tax positions that require recognition of a tax liability.
| | | | | | |
| Notes to financial statements | | Wells Fargo C&B Large Cap Value Fund | | | 21 | |
As of May 31, 2019, the aggregate cost of all investments for federal income tax purposes was $225,754,002 and the unrealized gains (losses) consisted of:
| | | | |
| |
Gross unrealized gains | | $ | 44,540,842 | |
| |
Gross unrealized losses | | | 0 | |
| |
Net unrealized gains | | $ | 44,540,842 | |
Class allocations
The separate classes of shares offered by the Fund differ principally in applicable sales charges, distribution, shareholder servicing, and administration fees. Class specific expenses are charged directly to that share class. Investment income, common expenses, and realized and unrealized gains (losses) on investments are allocated daily to each class of shares based on the relative proportion of net assets of each class.
3. FAIR VALUATION MEASUREMENTS
At May 31, 2019, the affiliated Master Portfolio was measured at fair value using the net asset value per share (or its equivalent) as a practical expedient. The investment objective and the value of the affiliate Master Portfolio was as follows:
| | | | | | |
| | |
| Affiliated Master Portfolio | | Investment objective | | Value of
affiliated Master
Portfolio | |
Wells Fargo C&B Large Cap Value Portfolio | | Seeks maximum long-term total return (current income and capital appreciation), consistent with minimizing risk to principal | | | $270,294,844 | |
The affiliated Master Portfolio does not have a redemption period notice, can be redeemed daily and does not have any unfunded commitments.
4. TRANSACTIONS WITH AFFILIATES
Management fee
Wells Fargo Funds Management, LLC (“Funds Management”), an indirect wholly owned subsidiary of Wells Fargo & Company (“Wells Fargo”), is the manager of the Fund and provides advisory and fund-level administrative services under an investment management agreement. Under the investment management agreement, Funds Management is responsible for, among other services, implementing the investment objectives and strategies of the Fund and providing fund-level administrative services in connection with the Fund’s operations. As long as the Fund continues to invest substantially all of its assets in a single affiliated Master Portfolio, the Fund pays Funds Management an investment management fee only for fund-level administrative services at the following annual rate based on the Fund’s average daily net assets:
| | | | |
| |
| Average daily net assets | | Management fee | |
| |
First $5 billion | | | 0.05 | % |
| |
Next $5 billion | | | 0.04 | |
| |
Over $10 billion | | | 0.03 | |
For the year ended May 31, 2019, the management fee was equivalent to an annual rate of 0.05% of the Fund’s average daily net assets.
Funds Management also serves as the adviser to the affiliated Master Portfolio and is entitled to receive a fee from the affiliated Master Portfolio for those services.
Administration fees
Under a class-level administration agreement, Funds Management provides class-level administrative services to the Fund, which includes paying fees and expenses for services provided by the transfer agent, sub-transfer agents, omnibus account servicers and record-keepers. As compensation for its services under the class-level administration agreement, Funds Management receives an annual fee which is calculated based on the average daily net assets of each class as follows:
| | | | |
| | | Class-level
administration fee | |
| |
Class A, Class C | | | 0.21 | % |
| |
Class R6 | | | 0.03 | |
| |
Administrator Class, Institutional Class | | | 0.13 | |
| | | | |
| 22 | | Wells Fargo C&B Large Cap Value Fund | | Notes to financial statements |
Funds Management has contractually waived and/or reimbursed management and administration fees to the extent necessary to maintain certain net operating expense ratios for the Fund. When each class of the Fund has exceeded its expense cap, Funds Management has waived fees and/or reimbursed expenses from fund level expenses on a proportionate basis and then from class specific expenses. When only certain classes exceed their expense caps, waivers and/or reimbursements are applied against class specific expenses before fund level expenses. Net expenses from the affiliated Master Portfolio are included in the expense caps. Funds Management has committed through September 30, 2019 to waive fees and/or reimburse expenses to the extent necessary to cap the Fund’s expenses at 1.08% for Class A shares, 1.83% for Class C shares, 0.65% for Class R6 shares, 1.00% for Administrator Class shares, and 0.75% for Institutional Class shares. Prior to or after the commitment expiration date, the cap may be increased or the commitment to maintain the cap may be terminated only with the approval of the Board of Trustees.
Distribution fee
The Trust has adopted a distribution plan for Class C shares of the Fund pursuant to Rule 12b-1 under the 1940 Act. A distribution fee is charged to Class C shares and paid to Wells Fargo Funds Distributor, LLC (“Funds Distributor”), the principal underwriter, at an annual rate of 0.75% of the average daily net assets of Class C shares.
In addition, Funds Distributor is entitled to receive the front-end sales charge from the purchase of Class A shares and a contingent deferred sales charge on the redemption of certain Class A shares. Funds Distributor is also entitled to receive the contingent deferred sales charges from redemptions of Class C shares. For the year ended May 31, 2019, Funds Distributor received $1,621 from the sale of Class A shares, and $29 in contingent deferred sales charges from redemptions of Class C shares. No contingent deferred sales charges were incurred by Class A shares for the year ended May 31, 2019.
Shareholder servicing fees
The Trust has entered into contracts with one or more shareholder servicing agents, whereby Class A, Class C, and Administrator Class of the Fund are charged a fee at an annual rate of 0.25% of the average daily net assets of each respective class. A portion of these total shareholder servicing fees were paid to affiliates of Wells Fargo.
5. INVESTMENT PORTFOLIO TRANSACTIONS
The Fund seeks to achieve its investment objective by investing substantially all of its assets in a single affiliated Master Portfolio. Purchases and sales have been calculated by multiplying the Fund’s ownership percentage of the affiliated Master Portfolio by the affiliated Master Portfolio’s purchases and sales. Purchases and sales of investments, excluding U.S. government obligations (if any) and short-term securities, for the year ended May 31, 2019 were $143,545,693 and $172,356,302, respectively.
6. BANK BORROWINGS
The Trust (excluding the money market funds), Wells Fargo Master Trust and Wells Fargo Variable Trust are parties to a $280,000,000 revolving credit agreement whereby the Fund is permitted to use bank borrowings for temporary or emergency purposes, such as to fund shareholder redemption requests. Interest under the credit agreement is charged to the Fund based on a borrowing rate equal to the higher of the Federal Funds rate in effect on that day plus 1.25% or the overnight LIBOR rate in effect on that day plus 1.25%. In addition, an annual commitment fee equal to 0.25% of the unused balance is allocated to each participating fund.
For the year ended May 31, 2019, there were no borrowings by the Fund under the agreement.
7. DISTRIBUTIONS TO SHAREHOLDERS
The tax character of distributions paid during the years ended May 31, 2019 and May 31, 2018 were as follows:
| | | | | | | | |
| | | Year ended May 31 | |
| | |
| | | 2019 | | | 2018 | |
| | |
Ordinary income | | $ | 8,378,114 | | | $ | 9,020,097 | |
| | |
Long-term capital gain | | | 16,679,667 | | | | 31,255,927 | |
As of May 31, 2019, the components of distributable earnings on a tax basis were as follows:
| | | | |
Undistributed ordinary income | | Undistributed long-term gain | | Unrealized gains |
| | |
| $1,772,703 | | $12,152,427 | | $44,540,842 |
| | | | | | |
| Notes to financial statements | | Wells Fargo C&B Large Cap Value Fund | | | 23 | |
Effective for all filings after November 4, 2018, the Securities and Exchange Commission eliminated the requirement to separately state the components of distributions to shareholders under U.S. generally accepted accounting principles. The amounts of distributions to shareholders for the year ended May 31, 2018 were as follows:
| | | | | | | | |
| | | Net
investment
income | | | Net realized
gains | |
| | |
Class A | | $ | 403,349 | | | $ | 8,840,199 | |
| | |
Class C | | | 0 | | | | 1,063,860 | |
| | |
Class R6 | | | 36,739 | | | | 416,469 | |
| | |
Administrator Class | | | 86,666 | | | | 1,446,711 | |
| | |
Institutional Class | | | 2,028,817 | | | | 25,953,214 | |
8. CONCENTRATION RISK
Concentration risk result from exposure to a limited number of sectors. Through its investment in the affiliated Master Portfolio which may invest a substantial portion of its assets in any sector, the Fund may in turn be more affected by changes in that sector than a fund whose investments are not heavily weighted in any sector.
9. INDEMNIFICATION
Under the Trust’s organizational documents, the officers and Trustees have been granted certain indemnification rights against certain liabilities that may arise out of performance of their duties to the Trust. Additionally, in the normal course of business, the Trust may enter into contracts with service providers that contain a variety of indemnification clauses. The Trust’s maximum exposure under these arrangements is dependent on future claims that may be made against the Fund and, therefore, cannot be estimated.
10. NEW ACCOUNTING PRONOUNCEMENT
In August 2018, FASB issued Accounting Standards Update (“ASU”) No. 2018-13, Fair Value Measurement (Topic 820)Disclosure Framework—Changes to the Disclosure Requirements for Fair Value Measurement.ASU 2018-13 updates the disclosure requirements for fair value measurements by modifying or removing certain disclosures and adding certain new disclosures. The amendments are effective for fiscal years, and interim periods within those fiscal years, beginning after December 15, 2019. Early adoption is permitted. Management has adopted the removal and modification of disclosures early, as permitted, and will adopt the additional new disclosures at the effective date.
| | | | |
| 24 | | Wells Fargo C&B Large Cap Value Fund | | Report of independent registered public accounting firm |
TO THE SHAREHOLDERS OF THE FUND AND BOARD OF TRUSTEES OF WELLS FARGO FUNDS TRUST:
Opinion on the Financial Statements
We have audited the accompanying statement of assets and liabilities of Wells Fargo C&B Large Cap Value Fund (the Fund), one of the funds constituting Wells Fargo Funds Trust, including the portfolio of investments, as of May 31, 2019, the related statement of operations for the year then ended, the statements of changes in net assets for each of the years in the two-year period then ended, and the related notes (collectively, the financial statements) and the financial highlights for each of the years or periods in the five-year period then ended. In our opinion, the financial statements and financial highlights present fairly, in all material respects, the financial position of the Fund as of May 31, 2019, the results of its operations for the year then ended, the changes in its net assets for each of the years in the two-year period then ended, and the financial highlights for each of the years or periods in the five-year period then ended, in conformity with U.S. generally accepted accounting principles.
Basis for Opinion
These financial statements and financial highlights are the responsibility of the Fund’s management. Our responsibility is to express an opinion on these financial statements and financial highlights based on our audits. We are a public accounting firm registered with the Public Company Accounting Oversight Board (United States) (PCAOB) and are required to be independent with respect to the Fund in accordance with the U.S. federal securities laws and the applicable rules and regulations of the Securities and Exchange Commission and the PCAOB.
We conducted our audits in accordance with the standards of the PCAOB. Those standards require that we plan and perform the audit to obtain reasonable assurance about whether the financial statements and financial highlights are free of material misstatement, whether due to error or fraud. Our audits included performing procedures to assess the risks of material misstatement of the financial statements and financial highlights, whether due to error or fraud, and performing procedures that respond to those risks. Such procedures included examining, on a test basis, evidence regarding the amounts and disclosures in the financial statements and financial highlights. Such procedures also included confirmation of securities owned as of May 31, 2019, by correspondence with the transfer agent. Our audits also included evaluating the accounting principles used and significant estimates made by management, as well as evaluating the overall presentation of the financial statements and financial highlights. We believe that our audits provide a reasonable basis for our opinion.

We have not been able to determine the specific year that we began serving as the auditor of one or more Wells Fargo Funds investment companies; however we are aware that we have served as the auditor of one or more Wells Fargo Funds investment companies since at least 1955.
Boston, Massachusetts
July 26, 2019
| | | | | | |
| Portfolio of investments—May 31, 2019 | | Wells Fargo C&B Large Cap Value Portfolio | | | 25 | |
| | | | | | | | | | | | | | | | |
| Security name | | | | | | | | Shares | | | Value | |
| | | | |
Common Stocks: 95.94% | | | | | | | | | | | | | | | | |
| | | | |
Communication Services: 4.55% | | | | | | | | | | | | | | | | |
| | | | |
| Diversified Telecommunication Services: 2.51% | | | | | | | | | | | | | | | | |
| | | | |
Verizon Communications Incorporated | | | | | | | | | | | 161,700 | | | $ | 8,788,395 | |
| | | | | | | | | | | | | | | | |
| | | | |
| Media: 2.04% | | | | | | | | | | | | | | | | |
| | | | |
Omnicom Group Incorporated | | | | | | | | | | | 92,600 | | | | 7,163,536 | |
| | | | | | | | | | | | | | | | |
| | | | |
Consumer Discretionary: 7.75% | | | | | | | | | | | | | | | | |
| | | | |
| Hotels, Restaurants & Leisure: 2.36% | | | | | | | | | | | | | | | | |
| | | | |
Carnival Corporation | | | | | | | | | | | 161,600 | | | | 8,272,304 | |
| | | | | | | | | | | | | | | | |
| | | | |
| Household Durables: 1.48% | | | | | | | | | | | | | | | | |
| | | | |
Whirlpool Corporation | | | | | | | | | | | 45,200 | | | | 5,192,576 | |
| | | | | | | | | | | | | | | | |
| | | | |
| Textiles, Apparel & Luxury Goods: 3.91% | | | | | | | | | | | | | | | | |
| | | | |
Gildan Activewear Incorporated | | | | | | | | | | | 220,086 | | | | 7,936,301 | |
| | | | |
HanesBrands Incorporated | | | | | | | | | | | 389,900 | | | | 5,790,015 | |
| | | | |
| | | | | | | | | | | | | | | 13,726,316 | |
| | | | | | | | | | | | | | | | |
| | | | |
Consumer Staples: 2.49% | | | | | | | | | | | | | | | | |
| | | | |
| Beverages: 0.41% | | | | | | | | | | | | | | | | |
| | | | |
Diageo plc ADR | | | | | | | | | | | 8,580 | | | | 1,441,955 | |
| | | | | | | | | | | | | | | | |
| | | | |
| Tobacco: 2.08% | | | | | | | | | | | | | | | | |
| | | | |
Philip Morris International Incorporated | | | | | | | | | | | 94,500 | | | | 7,288,785 | |
| | | | | | | | | | | | | | | | |
| | | | |
Energy: 4.71% | | | | | | | | | | | | | | | | |
| | | | |
| Energy Equipment & Services: 1.16% | | | | | | | | | | | | | | | | |
| | | | |
Schlumberger Limited | | | | | | | | | | | 117,700 | | | | 4,083,013 | |
| | | | | | | | | | | | | | | | |
| | | | |
| Oil, Gas & Consumable Fuels: 3.55% | | | | | | | | | | | | | | | | |
| | | | |
Exxon Mobil Corporation | | | | | | | | | | | 117,200 | | | | 8,294,244 | |
| | | | |
World Fuel Services Corporation | | | | | | | | | | | 142,600 | | | | 4,155,364 | |
| | | | |
| | | | | | | | | | | | | | | 12,449,608 | |
| | | | | | | | | | | | | | | | |
| | | | |
Financials: 28.81% | | | | | | | | | | | | | | | | |
| | | | |
| Banks: 5.20% | | | | | | | | | | | | | | | | |
| | | | |
JPMorgan Chase & Company | | | | | | | | | | | 88,900 | | | | 9,419,844 | |
| | | | |
PNC Financial Services Group Incorporated | | | | | | | | | | | 69,200 | | | | 8,806,392 | |
| | | | |
| | | | | | | | | | | | | | | 18,226,236 | |
| | | | | | | | | | | | | | | | |
| | | | |
| Capital Markets: 8.25% | | | | | | | | | | | | | | | | |
| | | | |
Brookfield Asset Management Incorporated Class A | | | | | | | | | | | 207,500 | | | | 9,513,875 | |
| | | | |
Intercontinental Exchange Incorporated | | | | | | | | | | | 117,900 | | | | 9,692,559 | |
| | | | |
State Street Corporation | | | | | | | | | | | 176,300 | | | | 9,740,575 | |
| | | | |
| | | | | | | | | | | | | | | 28,947,009 | |
| | | | | | | | | | | | | | | | |
The accompanying notes are an integral part of these financial statements.
| | | | |
| 26 | | Wells Fargo C&B Large Cap Value Portfolio | | Portfolio of investments—May 31, 2019 |
| | | | | | | | | | | | | | | | |
| Security name | | | | | | | | Shares | | | Value | |
| | | | |
| Consumer Finance: 3.24% | | | | | | | | | | | | | | | | |
| | | | |
Synchrony Financial | | | | | | | | | | | 338,000 | | | $ | 11,366,940 | |
| | | | | | | | | | | | | | | | |
| | | | |
| Diversified Financial Services: 1.97% | | | | | | | | | | | | | | | | |
| | | | |
Berkshire Hathaway Incorporated Class B † | | | | | | | | | | | 35,000 | | | | 6,909,700 | |
| | | | | | | | | | | | | | | | |
| | | | |
| Insurance: 10.15% | | | | | | | | | | | | | | | | |
| | | | |
Arch Capital Group Limited † | | | | | | | | | | | 252,900 | | | | 8,707,347 | |
| | | | |
Chubb Limited | | | | | | | | | | | 73,000 | | | | 10,663,110 | |
| | | | |
Fidelity National Financial Incorporated | | | | | | | | | | | 321,400 | | | | 12,389,970 | |
| | | | |
The Progressive Corporation | | | | | | | | | | | 48,800 | | | | 3,868,864 | |
| | | | |
| | | | | | | | | | | | | | | 35,629,291 | |
| | | | | | | | | | | | | | | | |
| | | | |
Health Care: 13.02% | | | | | | | | | | | | | | | | |
| | | | |
| Health Care Equipment & Supplies: 4.02% | | | | | | | | | | | | | | | | |
| | | | |
Becton Dickinson & Company | | | | | | | | | | | 24,800 | | | | 5,789,312 | |
| | | | |
Medtronic plc | | | | | | | | | | | 90,000 | | | | 8,332,200 | |
| | | | |
| | | | | | | | | | | | | | | 14,121,512 | |
| | | | | | | | | | | | | | | | |
| | | | |
| Health Care Providers & Services: 4.39% | | | | | | | | | | | | | | | | |
| | | | |
Laboratory Corporation of America Holdings † | | | | | | | | | | | 42,300 | | | | 6,878,403 | |
| | | | |
UnitedHealth Group Incorporated | | | | | | | | | | | 35,200 | | | | 8,511,360 | |
| | | | |
| | | | | | | | | | | | | | | 15,389,763 | |
| | | | | | | | | | | | | | | | |
| | | | |
| Pharmaceuticals: 4.61% | | | | | | | | | | | | | | | | |
| | | | |
Allergan plc | | | | | | | | | | | 65,400 | | | | 7,972,914 | |
| | | | |
Johnson & Johnson | | | | | | | | | | | 62,700 | | | | 8,223,105 | |
| | | | |
| | | | | | | | | | | | | | | 16,196,019 | |
| | | | | | | | | | | | | | | | |
| | | | |
Industrials: 16.48% | | | | | | | | | | | | | | | | |
| | | | |
| Air Freight & Logistics: 2.03% | | | | | | | | | | | | | | | | |
| | | | |
United Parcel Service Incorporated Class B | | | | | | | | | | | 76,600 | | | | 7,117,672 | |
| | | | | | | | | | | | | | | | |
| | | | |
| Building Products: 2.05% | | | | | | | | | | | | | | | | |
| | | | |
Johnson Controls International plc | | | | | | | | | | | 186,500 | | | | 7,183,980 | |
| | | | | | | | | | | | | | | | |
| | | | |
| Electrical Equipment: 4.14% | | | | | | | | | | | | | | | | |
| | | | |
AMETEK Incorporated | | | | | | | | | | | 75,600 | | | | 6,190,884 | |
| | | | |
Eaton Corporation plc | | | | | | | | | | | 112,100 | | | | 8,350,329 | |
| | | | |
| | | | | | | | | | | | | | | 14,541,213 | |
| | | | | | | | | | | | | | | | |
| | | | |
| Industrial Conglomerates: 1.47% | | | | | | | | | | | | | | | | |
| | | | |
3M Company | | | | | | | | | | | 32,300 | | | | 5,159,925 | |
| | | | | | | | | | | | | | | | |
| | | | |
| Machinery: 4.22% | | | | | | | | | | | | | | | | |
| | | | |
Colfax Corporation † | | | | | | | | | | | 297,477 | | | | 7,466,673 | |
| | | | |
Snap-on Incorporated | | | | | | | | | | | 47,000 | | | | 7,328,240 | |
| | | | |
| | | | | | | | | | | | | | | 14,794,913 | |
| | | | | | | | | | | | | | | | |
| | | | |
| Trading Companies & Distributors: 2.57% | | | | | | | | | | | | | | | | |
| | | | |
AerCap Holdings NV † | | | | | | | | | | | 201,500 | | | | 9,031,230 | |
| | | | | | | | | | | | | | | | |
The accompanying notes are an integral part of these financial statements.
| | | | | | |
| Portfolio of investments—May 31, 2019 | | Wells Fargo C&B Large Cap Value Portfolio | | | 27 | |
| | | | | | | | | | | | | | | | |
| Security name | | | | | | | | Shares | | | Value | |
| | | | |
Information Technology: 10.83% | | | | | | | | | | | | | | | | |
| | | | |
| Electronic Equipment, Instruments & Components: 4.82% | | | | | | | | | | | | | | | | |
| | | | |
Arrow Electronics Incorporated † | | | | | | | | | | | 167,800 | | | $ | 10,514,348 | |
| | | | |
TE Connectivity Limited | | | | | | | | | | | 75,900 | | | | 6,393,057 | |
| | | | |
| | | | | | | | | | | | | | | 16,907,405 | |
| | | | | | | | | | | | | | | | |
| | | | |
| IT Services: 4.79% | | | | | | | | | | | | | | | | |
| | | | |
Alliance Data Systems Corporation | | | | | | | | | | | 26,700 | | | | 3,671,250 | |
| | | | |
Amdocs Limited | | | | | | | | | | | 149,300 | | | | 8,871,406 | |
| | | | |
Leidos Holdings Incorporated | | | | | | | | | | | 56,840 | | | | 4,281,757 | |
| | | | |
| | | | | | | | | | | | | | | 16,824,413 | |
| | | | | | | | | | | | | | | | |
| | | | |
| Semiconductors & Semiconductor Equipment: 1.22% | | | | | | | | | | | | | | | | |
| | | | |
Applied Materials Incorporated | | | | | | | | | | | 110,700 | | | | 4,282,983 | |
| | | | | | | | | | | | | | | | |
| | | | |
Materials: 5.46% | | | | | | | | | | | | | | | | |
| | | | |
| Chemicals: 1.67% | | | | | | | | | | | | | | | | |
| | | | |
Axalta Coating Systems Limited † | | | | | | | | | | | 249,000 | | | | 5,853,990 | |
| | | | | | | | | | | | | | | | |
| | | | |
| Containers & Packaging: 2.15% | | | | | | | | | | | | | | | | |
| | | | |
Crown Holdings Incorporated † | | | | | | | | | | | 136,110 | | | | 7,544,577 | |
| | | | | | | | | | | | | | | | |
| | | | |
| Metals & Mining: 1.64% | | | | | | | | | | | | | | | | |
| | | | |
Reliance Steel & Aluminum Company | | | | | | | | | | | 69,100 | | | | 5,753,957 | |
| | | | | | | | | | | | | | | | |
| | | | |
Real Estate: 1.84% | | | | | | | | | | | | | | | | |
| | | | |
| Real Estate Management & Development: 1.84% | | | | | | | | | | | | | | | | |
| | | | |
CBRE Group Incorporated Class A † | | | | | | | | | | | 141,600 | | | | 6,471,120 | |
| | | | | | | | | | | | | | | | |
| | | | |
Total Common Stocks (Cost $280,431,435) | | | | | | | | | | | | | | | 336,660,336 | |
| | | | | | | | | | | | | | | | |
| | | | |
| | | Yield | | | | | | | | | | |
| Short-Term Investments: 3.38% | | | | | | | | | | | | | | | | |
| | | | |
| Investment Companies: 3.38% | | | | | | | | | | | | | | | | |
| | | | |
Wells Fargo Government Money Market Fund Select Class (l)(u) | | | 2.30 | % | | | | | | | 11,857,445 | | | | 11,857,445 | |
| | | | | | | | | | | | | | | | |
| | | | |
Total Short-Term Investments (Cost $11,857,445) | | | | | | | | | | | | | | | 11,857,445 | |
| | | | | | | | | | | | | | | | |
| | | | | | | | |
| Total investments in securities (Cost $292,288,880) | | | 99.32 | % | | | 348,517,781 | |
| | |
Other assets and liabilities, net | | | 0.68 | | | | 2,377,295 | |
| | | | | | | | |
| Total net assets | | | 100.00 | % | | $ | 350,895,076 | |
| | | | | | | | |
| † | Non-income-earning security |
| (l) | The issuer of the security is an affiliated person of the Portfolio as defined in the Investment Company Act of 1940 |
| (u) | The rate represents the 7-day annualized yield at period end. |
Abbreviations:
| ADR | American depositary receipt |
The accompanying notes are an integral part of these financial statements.
| | | | |
| 28 | | Wells Fargo C&B Large Cap Value Portfolio | | Portfolio of investments—May 31, 2019 |
Investments in Affiliates
An affiliated investment is an investment in which the Portfolio owns at least 5% of the outstanding voting shares of the issuer or as a result of other relationships, such as the Portfolio and the issuer having the same adviser or investment manager. Transactions with issuers that were either affiliated persons of the Portfolio at the beginning of the period or the end of the period were as follows:
| | | | | | | | | | | | | | | | | | | | | | | | | | | | | | | | | | | | |
| | | Shares,
beginning of
period | | | Shares
purchased | | | Shares
sold | | | Shares,
end of
period | | | Net
realized
gains
(losses) | | | Net
change in
unrealized
gains
(losses) | | | Income
from
affiliated
securities | | | Value,
end
of period | | | % of
net
assets | |
Short-Term Investments | | | | | | | | | | | | | | | | | | | | | | | | | | | | | | | | | | | | |
Investment Companies | | | | | | | | | | | | | | | | | | | | | | | | | | | | | | | | | | | | |
Securities Lending Cash Investments LLC * | | | 10,765,440 | | | | 41,129,061 | | | | 51,894,501 | | | | 0 | | | $ | 2,788 | | | $ | (49 | ) | | $ | 61,028 | | | $ | 0 | | | | | |
Wells Fargo Government Money Market Fund Select Class | | | 11,494,258 | | | | 159,702,909 | | | | 159,339,722 | | | | 11,857,445 | | | | 0 | | | | 0 | | | | 190,959 | | | | 11,857,445 | | | | | |
| | | | | | | | | | | | | | | | | | | | | | | | | | | | | | | | | | | | |
| | | | | | | | | |
| | | | | | | | | | | | | | | | | | $ | 2,788 | | | $ | (49 | ) | | $ | 251,987 | | | $ | 11,857,445 | | | | 3.38 | % |
| | | | | | | | | | | | | | | | | | | | | | | | | | | | | | | | | | | | |
| | * | No longer held at the end of the period |
The accompanying notes are an integral part of these financial statements.
| | | | | | |
| Statement of assets and liabilities—May 31, 2019 | | Wells Fargo C&B Large Cap Value Portfolio | | | 29 | |
| | | | |
| | | | |
| |
Assets | | | | |
Investments in unaffiliated securities, at value (cost $280,431,435) | | $ | 336,660,336 | |
Investments in affiliated securities, at value (cost $11,857,445) | | | 11,857,445 | |
Receivable for investments sold | | | 1,606,725 | |
Receivable for dividends | | | 724,058 | |
Receivable for dividends tax reclaim | | | 245,897 | |
Prepaid expenses and other assets | | | 28,795 | |
| | | | |
Total assets | | | 351,123,256 | |
| | | | |
| |
Liabilities | | | | |
Advisory fee payable | | | 203,220 | |
Custodian and accounting fees payable | | | 24,960 | |
| | | | |
Total liabilities | | | 228,180 | |
| | | | |
Total net assets | | $ | 350,895,076 | |
| | | | |
The accompanying notes are an integral part of these financial statements.
| | | | |
| 30 | | Wells Fargo C&B Large Cap Value Portfolio | | Statement of operations—year ended May 31, 2019 |
| | | | |
| | | | |
| |
Investment income | | | | |
Dividends (net of foreign withholding taxes of $300,486) | | $ | 7,665,759 | |
Income from affiliated securities | | | 200,411 | |
| | | | |
Total investment income | | | 7,866,170 | |
| | | | |
| |
Expenses | | | | |
Advisory fee | | | 2,670,020 | |
Custody and accounting fees | | | 22,752 | |
Professional fees | | | 39,017 | |
Shareholder report expenses | | | 1,064 | |
Trustees’ fees and expenses | | | 21,000 | |
Other fees and expenses | | | 9,129 | |
| | | | |
Total expenses | | | 2,762,982 | |
Less: Fee waivers and/or expense reimbursements | | | (110,776 | ) |
| | | | |
Net expenses | | | 2,652,206 | |
| | | | |
Net investment income | | | 5,213,964 | |
| | | | |
| |
REALIZED AND UNREALIZED GAINS (LOSSES) ON INVESTMENTS | | | | |
| |
Net realized gains on: | | | | |
Unaffiliated securities | | | 23,336,840 | |
Affiliated securities | | | 2,788 | |
| | | | |
Net realized gains on investments | | | 23,339,628 | |
| | | | |
| |
Net change in unrealized gains (losses) on: | | | | |
Unaffiliated securities | | | (19,831,968 | ) |
Affiliated securities | | | (49 | ) |
| | | | |
Net change in unrealized gains (losses) on investments | | | (19,832,017 | ) |
| | | | |
Net realized and unrealized gains (losses) on investments | | | 3,507,611 | |
| | | | |
Net increase in net assets resulting from operations | | $ | 8,721,575 | |
| | | | |
The accompanying notes are an integral part of these financial statements.
| | | | | | |
| Statement of changes in net assets | | Wells Fargo C&B Large Cap Value Portfolio | | | 31 | |
| | | | | | | | |
| | | Year ended May 31, 2019 | | | Year ended May 31, 2018 | |
| | |
Operations | | | | | | | | |
Net investment income | | $ | 5,213,964 | | | $ | 4,162,366 | |
Net realized gains on investments | | | 23,339,628 | | | | 34,247,156 | |
Net change in unrealized gains (losses) on investments | | | (19,832,017 | ) | | | (13,968,164 | ) |
| | | | |
Net increase in net assets resulting from operations | | | 8,721,575 | | | | 24,441,358 | |
| | | | |
| | |
Capital transactions | | | | | | | | |
Transactions in investors’ beneficial interests | | | | | | | | |
Contributions | | | 105,704,905 | | | | 67,670,834 | |
Withdrawals | | | (145,734,521 | ) | | | (73,762,455 | ) |
| | | | |
Net decrease in net assets resulting from capital transactions | | | (40,029,616 | ) | | | (6,091,621 | ) |
| | | | |
Total increase (decrease) in net assets | | | (31,308,041 | ) | | | 18,349,737 | |
| | | | |
| | |
Net assets | | | | | | | | |
Beginning of period | | | 382,203,117 | | | | 363,853,380 | |
| | | | |
End of period | | $ | 350,895,076 | | | $ | 382,203,117 | |
| | | | |
The accompanying notes are an integral part of these financial statements.
| | | | |
| 32 | | Wells Fargo C&B Large Cap Value Portfolio | | Financial highlights |
| | | | | | | | | | | | | | | | | | | | |
| | | Year ended May 31 | |
| | | 2019 | | | 2018 | | | 2017 | | | 2016 | | | 2015 | |
Total return | | | 1.80 | % | | | 6.65 | % | | | 19.17 | % | | | 0.35 | % | | | 10.29 | % |
Ratios to average net assets (annualized) | | | | | | | | | | | | | | | | | | | | |
Gross expenses | | | 0.67 | % | | | 0.67 | % | | | 0.68 | % | | | 0.68 | % | | | 0.68 | % |
Net expenses | | | 0.65 | % | | | 0.66 | % | | | 0.68 | % | | | 0.68 | % | | | 0.68 | % |
Net investment income | | | 1.27 | % | | | 1.02 | % | | | 1.09 | % | | | 1.33 | % | | | 1.20 | % |
Supplemental data | | | | | | | | | | | | | | | | | | | | |
Portfolio turnover rate | | | 47 | % | | | 42 | % | | | 89 | % | | | 29 | % | | | 35 | % |
The accompanying notes are an integral part of these financial statements.
| | | | | | |
| Notes to financial statements | | Wells Fargo C&B Large Cap Value Portfolio | | | 33 | |
1. ORGANIZATION
Wells Fargo Master Trust (the “Trust”), a Delaware statutory trust organized on March 10, 1999, is an open-end management investment company registered under the Investment Company Act of 1940, as amended (the “1940 Act”). As an investment company, the Trust follows the accounting and reporting guidance in Financial Accounting Standards Board (“FASB”) Accounting Standards Codification Topic 946, Financial Services – Investment Companies. These financial statements report on the Wells Fargo C&B Large Cap Value Portfolio (the “Portfolio”) which is a diversified series of the Trust.
2. SIGNIFICANT ACCOUNTING POLICIES
The following significant accounting policies, which are consistently followed in the preparation of the financial statements of the Portfolio, are in conformity with U.S. generally accepted accounting principles which require management to make estimates and assumptions that affect the reported amounts of assets and liabilities, disclosure of contingent assets and liabilities at the date of the financial statements, and the reported amounts of revenues and expenses during the reporting period. Actual results could differ from those estimates.
Securities valuation
All investments are valued each business day as of the close of regular trading on the New York Stock Exchange (generally 4 p.m. Eastern Time), although the Portfolio may deviate from this calculation time under unusual or unexpected circumstances.
Equity securities that are listed on a foreign or domestic exchange or market are valued at the official closing price or, if none, the last sales price. If no sale occurs on the principal exchange or market that day, a fair value price will be determined in accordance with the Portfolio’s Valuation Procedures.
Investments in registered open-end investment companies are valued at net asset value. Interests in non-registered investment companies that are redeemable at net asset value are fair valued normally at net asset value.
Investments which are not valued using any of the methods discussed above are valued at their fair value, as determined in good faith by the Board of Trustees of the Portfolio. The Board of Trustees has established a Valuation Committee comprised of the Trustees and has delegated to it the authority to take any actions regarding the valuation of portfolio securities that the Valuation Committee deems necessary or appropriate, including determining the fair value of portfolio securities, unless the determination has been delegated to the Wells Fargo Asset Management Pricing Committee at Wells Fargo Funds Management, LLC (“Funds Management”). The Board of Trustees retains the authority to make or ratify any valuation decisions or approve any changes to the Valuation Procedures as it deems appropriate. On a quarterly basis, the Board of Trustees receives reports on any valuation actions taken by the Valuation Committee or the Wells Fargo Asset Management Pricing Committee which may include items for ratification.
Securities lending
The Portfolio may lend its securities from time to time in order to earn additional income in the form of fees or interest on securities received as collateral or the investment of any cash received as collateral. When securities are on loan, the Portfolio receives interest or dividends on the securities loaned. The Portfolio receives collateral in the form of cash or securities with a value at least equal to the value of the securities on loan. The value of the loaned securities is determined at the close of each business day and any additional required collateral is delivered to the Portfolio on the next business day. In a securities lending transaction, the net asset value of the Portfolio will be affected by an increase or decrease in the value of the securities loaned and by an increase or decrease in the value of the instrument in which collateral is invested. The amount of securities lending activity undertaken by the Portfolio fluctuates from time to time. In the event of default or bankruptcy by the borrower, the Portfolio may be prevented from recovering the loaned securities or gaining access to the collateral or may experience delays or costs in doing so. In addition, the investment of any cash collateral received may lose all or part of its value. The Portfolio has the right under the lending agreement to recover the securities from the borrower on demand.
The Portfolio lends its securities through an unaffiliated securities lending agent. Cash collateral received in connection with its securities lending transactions is invested in Securities Lending Cash Investments, LLC (the “Securities Lending Fund”). The Securities Lending Fund is exempt from registration under Section 3(c)(7) of the 1940 Act and is managed by Funds Management and is subadvised by Wells Capital Management Incorporated (“WellsCap”), an affiliate of Funds Management and an indirect wholly owned subsidiary of Wells Fargo & Company (“Wells Fargo”). Funds Management receives an advisory fee starting at 0.05% and declining to 0.01% as the average daily net assets of the Securities Lending Fund increase. All of the fees received by Funds Management are paid to WellsCap for its services as subadviser. The Securities Lending Fund seeks to provide a positive return compared to the daily Fed Funds Open Rate by investing in
| | | | |
| 34 | | Wells Fargo C&B Large Cap Value Portfolio | | Notes to financial statements |
high-quality, U.S. dollar-denominated short-term money market instruments. Securities Lending Fund investments are valued at the evaluated bid price provided by an independent pricing service. Income earned from investment in the Securities Lending Fund (net of fees and rebates), if any, is included in income from affiliated securities on the Statement of Operations.
Security transactions and income recognition
Securities transactions are recorded on a trade date basis. Realized gains or losses are recorded on the basis of identified cost.
Dividend income is recognized on the ex-dividend date. Dividend income is recorded net of foreign taxes withheld where recovery of such taxes is not assured.
Federal and other taxes
The Portfolio is treated as a separate entity for federal income tax purposes. The Portfolio is not required to pay federal income taxes on its net investment income and net capital gains as it is treated as a partnership for federal income tax purposes. All dividends, gains and losses of the Portfolio are deemed to have been “passed through” to the interest holders in proportion to their holdings of the Portfolio regardless of whether such dividends and gains have been distributed by the Portfolio.
The Portfolio’s income tax returns and all financial records supporting those returns for the prior three fiscal years are subject to examination by the federal revenue authority. Management has analyzed the Portfolio’s tax positions taken on federal, state, and foreign tax returns for all open tax years and does not believe that there are any uncertain tax positions that require recognition of a tax liability.
As of May 31, 2019, the aggregate cost of all investments for federal income tax purposes was $296,233,310 and the unrealized gains (losses) consisted of:
| | | | |
| |
Gross unrealized gains | | $ | 70,332,959 | |
| |
Gross unrealized losses | | | (18,048,488 | ) |
| |
Net unrealized gains | | $ | 52,284,471 | |
3. FAIR VALUATION MEASUREMENTS
Fair value measurements of investments are determined within a framework that has established a fair value hierarchy based upon the various data inputs utilized in determining the value of the Portfolio’s investments. The three-level hierarchy gives the highest priority to unadjusted quoted prices in active markets for identical assets or liabilities (Level 1) and the lowest priority to unobservable inputs (Level 3). The Portfolio’s investments are classified within the fair value hierarchy based on the lowest level of input that is significant to the fair value measurement. The inputs are summarized into three broad levels as follows:
| ∎ | | Level 1 – quoted prices in active markets for identical securities |
| ∎ | | Level 2 – other significant observable inputs (including quoted prices for similar securities, interest rates, prepayment speeds, credit risk, etc.) |
| ∎ | | Level 3 – significant unobservable inputs (including the Portfolio’s own assumptions in determining the fair value of investments) |
The inputs or methodologies used for valuing investments in securities are not necessarily an indication of the risk associated with investing in those securities.
| | | | | | |
| Notes to financial statements | | Wells Fargo C&B Large Cap Value Portfolio | | | 35 | |
The following is a summary of the inputs used in valuing the Portfolio’s assets and liabilities as of May 31, 2019:
| | | | | | | | | | | | | | | | |
| | | | |
| | | Quoted prices
(Level 1) | | | Other significant
observable inputs
(Level 2) | | | Significant
unobservable inputs (Level 3) | | | Total | |
| | | | |
Assets | | | | | | | | | | | | | | | | |
Investments in: | | | | | | | | | | | | | | | | |
| | | | |
Common stocks | | | | | | | | | | | | | | | | |
| | | | |
Communication services | | $ | 15,951,931 | | | $ | 0 | | | $ | 0 | | | $ | 15,951,931 | |
| | | | |
Consumer discretionary | | | 27,191,196 | | | | 0 | | | | 0 | | | | 27,191,196 | |
| | | | |
Consumer staples | | | 8,730,740 | | | | 0 | | | | 0 | | | | 8,730,740 | |
| | | | |
Energy | | | 16,532,621 | | | | 0 | | | | 0 | | | | 16,532,621 | |
| | | | |
Financials | | | 101,079,176 | | | | 0 | | | | 0 | | | | 101,079,176 | |
| | | | |
Health care | | | 45,707,294 | | | | 0 | | | | 0 | | | | 45,707,294 | |
| | | | |
Industrials | | | 57,828,933 | | | | 0 | | | | 0 | | | | 57,828,933 | |
| | | | |
Information technology | | | 38,014,801 | | | | 0 | | | | 0 | | | | 38,014,801 | |
| | | | |
Materials | | | 19,152,524 | | | | 0 | | | | 0 | | | | 19,152,524 | |
| | | | |
Real estate | | | 6,471,120 | | | | 0 | | | | 0 | | | | 6,471,120 | |
| | | | |
Short-term investments | | | | | | | | | | | | | | | | |
| | | | |
Investment companies | | | 11,857,445 | | | | 0 | | | | 0 | | | | 11,857,445 | |
| | | | |
Total assets | | $ | 348,517,781 | | | $ | 0 | | | $ | 0 | | | $ | 348,517,781 | |
Additional sector, industry or geographic detail is included in the Portfolio of Investments.
At May 31, 2019, the Portfolio did not have any transfers into/out of Level 3.
4. TRANSACTIONS WITH AFFILIATES AND OTHER EXPENSES
Advisory fee
The Trust has entered into an advisory contract with Funds Management, an indirect wholly owned subsidiary of Wells Fargo. The adviser is responsible for implementing investment policies and guidelines and for supervising the subadviser, who is responsible for day-to-day portfolio management of the Portfolio. Pursuant to the contract, Funds Management is entitled to receive an annual advisory fee at the following annual rate based on the Portfolio’s average daily net assets:
| | | | |
| |
| Average daily net assets | | Advisory fee | |
| |
First $500 million | | | 0.650 | % |
| |
Next $500 million | | | 0.625 | |
| |
Next $1 billion | | | 0.600 | |
| |
Next $2 billion | | | 0.575 | |
| |
Next $4 billion | | | 0.550 | |
| |
Next $4 billion | | | 0.525 | |
| |
Next $4 billion | | | 0.500 | |
| |
Over $16 billion | | | 0.475 | |
For the year ended May 31, 2019, the advisory fee was equivalent to an annual rate of 0.65% of the Portfolio’s average daily net assets.
Funds Management has retained the services of a subadviser to provide daily portfolio management to the Portfolio. The fee for subadvisory services is borne by Funds Management. Cooke & Bieler, L.P., which is not an affiliate of Funds Management, is also a subadviser to the Portfolio and is entitled to receive a fee from Funds Management at an annual rate starting at 0.38% and declining to 0.30% as the average daily net assets of the Portfolio increase.
Funds Management has voluntarily waived and/or reimbursed advisory fees to reduce the net operating expense ratio of the Portfolio.
| | | | |
| 36 | | Wells Fargo C&B Large Cap Value Portfolio | | Notes to financial statements |
Interfund transactions
The Portfolio may purchase or sell portfolio investment securities to certain other Wells Fargo affiliates pursuant toRule 17a-7 under the 1940 Act and under procedures adopted by the Board of Trustees. The procedures have been designed to ensure that these interfund transactions, which do not incur broker commissions, are effected at current market prices. Pursuant to these procedures, the Portfolio had $62,835,601 and $0 in interfund purchases and sales, respectively, during the year ended May 31, 2019.
5. INVESTMENT PORTFOLIO TRANSACTIONS
Purchases and sales of investments, excluding U.S. government obligations (if any) and short-term securities, for the year ended May 31, 2019 were $186,350,121 and $223,751,874, respectively.
6. BANK BORROWINGS
Effective August 28, 2018, the Trust, along with Wells Fargo Variable Trust and Wells Fargo Funds Trust (excluding the money market funds), are parties to a $280,000,000 revolving credit agreement whereby the Portfolio is permitted to use bank borrowings for temporary or emergency purposes, such as to fund shareholder redemption requests. Interest under the credit agreement is charged to the Portfolio based on a borrowing rate equal to the higher of the Federal Funds rate in effect on that day plus 1.25% or the overnight LIBOR rate in effect on that day plus 1.25%. In addition, an annual commitment fee equal to 0.25% of the unused balance is allocated to each participating fund.
For the year ended May 31, 2019, there were no borrowings by the Portfolio under the agreement.
7. CONCENTRATION RISK
Concentration risk result from exposure to a limited number of sectors. A portfolio that invests a substantial portion of its assets in any sector may be more affected by changes in that sector than would be a portfolio whose investments are not heavily weighted in any sector.
8. INDEMNIFICATION
Under the Trust’s organizational documents, the officers and Trustees have been granted certain indemnification rights against certain liabilities that may arise out of performance of their duties to the Trust. Additionally, in the normal course of business, the Trust may enter into contracts with service providers that contain a variety of indemnification clauses. The Trust’s maximum exposure under these arrangements is dependent on future claims that may be made against the Portfolio and, therefore, cannot be estimated.
9. NEW ACCOUNTING PRONOUNCEMENT
In August 2018, FASB issued Accounting Standards Update (“ASU”) No. 2018-13, Fair Value Measurement (Topic 820)Disclosure Framework—Changes to the Disclosure Requirements for Fair Value Measurement.ASU 2018-13 updates the disclosure requirements for fair value measurements by modifying or removing certain disclosures and adding certain new disclosures. The amendments are effective for fiscal years, and interim periods within those fiscal years, beginning after December 15, 2019. Early adoption is permitted. Management has adopted the removal and modification of disclosures early, as permitted, and will adopt the additional new disclosures at the effective date.
| | | | | | |
| Report of independent registered public accounting firm | | Wells Fargo C&B Large Cap Value Portfolio | | | 37 | |
TO THE SHAREHOLDERS OF THE PORTFOLIO AND BOARD OF TRUSTEES OF WELLS FARGO MASTER TRUST:
Opinion on the Financial Statements
We have audited the accompanying statement of assets and liabilities of Wells Fargo C&B Large Cap Value Portfolio (the Portfolio), one of the portfolios constituting Wells Fargo Master Trust, including the portfolio of investments, as of May 31, 2019, the related statement of operations for the year then ended, the statements of changes in net assets for each of the years in the two-year period then ended, and the related notes (collectively, the financial statements) and the financial highlights for each of the years in the five-year period then ended. In our opinion, the financial statements and financial highlights present fairly, in all material respects, the financial position of the Portfolio as of May 31, 2019, the results of its operations for the year then ended, the changes in its net assets for each of the years in the two-year period then ended, and the financial highlights for each of the years in the five-year period then ended, in conformity with U.S. generally accepted accounting principles.
Basis for Opinion
These financial statements and financial highlights are the responsibility of the Portfolio’s management. Our responsibility is to express an opinion on these financial statements and financial highlights based on our audits. We are a public accounting firm registered with the Public Company Accounting Oversight Board (United States) (PCAOB) and are required to be independent with respect to the Portfolio in accordance with the U.S. federal securities laws and the applicable rules and regulations of the Securities and Exchange Commission and the PCAOB.
We conducted our audits in accordance with the standards of the PCAOB. Those standards require that we plan and perform the audit to obtain reasonable assurance about whether the financial statements and financial highlights are free of material misstatement, whether due to error or fraud. Our audits included performing procedures to assess the risks of material misstatement of the financial statements and financial highlights, whether due to error or fraud, and performing procedures that respond to those risks. Such procedures included examining, on a test basis, evidence regarding the amounts and disclosures in the financial statements and financial highlights. Such procedures also included confirmation of securities owned as of May 31, 2019, by correspondence with the custodian or by other appropriate auditing procedures. Our audits also included evaluating the accounting principles used and significant estimates made by management, as well as evaluating the overall presentation of the financial statements and financial highlights. We believe that our audits provide a reasonable basis for our opinion.
We have not been able to determine the specific year that we began serving as the auditor of one or more Wells Fargo Funds investment companies; however we are aware that we have served as the auditor of one or more Wells Fargo Funds investment companies since at least 1955.
Boston, Massachusetts
July 26, 2019
| | | | |
| 38 | | Wells Fargo C&B Large Cap Value Fund | | Other information (unaudited) |
TAX INFORMATION
For corporate shareholders, pursuant to Section 854 of the Internal Revenue Code, 65.17% of ordinary income dividends qualify for the corporate dividends-received deduction for the fiscal year ended May 31, 2019.
Pursuant to Section 852 of the Internal Revenue Code, $16,679,667 was designated as a 20% rate gain distribution for the fiscal year ended May 31, 2019.
Pursuant to Section 854 of the Internal Revenue Code, $7,415,167 of income dividends paid during the fiscal year ended May 31, 2019 has been designated as qualified dividend income (QDI).
For the fiscal year ended May 31, 2019, $140,112 has been designated as interest-related dividends for nonresident alien shareholders pursuant to Section 871 of the Internal Revenue Code.
For the fiscal year ended May 31, 2019, $4,736,778 has been designated as short-term capital gain dividends for nonresident alien shareholders pursuant to Section 871 of the Internal Revenue Code.
PROXY VOTING INFORMATION
A description of the policies and procedures used to determine how to vote proxies relating to portfolio securities is available, upon request, by calling1-800-222-8222, visiting our website at wfam.com, or visiting the SEC website at sec.gov. Information regarding how the voted proxies relating to portfolio securities during the most recent 12-month period ended June 30 is available on the website atwfam.comor by visiting the SEC website at sec.gov.
QUARTERLY PORTFOLIO HOLDINGS
The Fund and Portfolio file their complete schedule of portfolio holdings with the SEC for the first and third quarters of each fiscal year on Form N-Q, which is available by visiting the SEC website at sec.gov. Those forms may be reviewed and copied at the SEC’s Public Reference Room in Washington, DC. Information on the operation of the Public Reference Room may be obtained by calling 1-800-SEC-0330.
| | | | | | |
| Other information (unaudited) | | Wells Fargo C&B Large Cap Value Fund | | | 39 | |
BOARD OF TRUSTEES AND OFFICERS
Each of the Trustees and Officers1 listed in the table below acts in identical capacities for each fund in the Wells Fargo family of funds, which consists of 151 mutual funds comprising the Wells Fargo Funds Trust, Wells Fargo Variable Trust, Wells Fargo Master Trust and four closed-end funds (collectively the “Fund Complex”). This table should be read in conjunction with the Prospectus and the Statement of Additional Information2. The mailing address of each Trustee and Officer is 525 Market Street, 12th Floor, San Francisco, CA 94105. Each Trustee and Officer serves an indefinite term, however, each Trustee serves such term until reaching the mandatory retirement age established by the Trustees.
Independent Trustees
| | | | | | |
Name and year of birth | | Position held and length of service* | | Principal occupations during past five years or longer | | Current other
public company or
investment company
directorships |
| | | |
William R. Ebsworth (Born 1957) | | Trustee, since 2015 | | Retired. From 1984 to 2013, equities analyst, portfolio manager, research director and chief investment officer at Fidelity Management and Research Company in Boston, Tokyo, and Hong Kong, and retired in 2013 as Chief Investment Officer of Fidelity Strategic Advisers, Inc. where he led a team of investment professionals managing client assets. Prior thereto, Board member of Hong Kong Securities Clearing Co., Hong Kong Options Clearing Corp., the Thailand International Fund, Ltd., Fidelity Investments Life Insurance Company, and Empire Fidelity Investments Life Insurance Company. Audit Committee Chair and Investment Committee Chair of the Vincent Memorial Hospital Endowment (non-profit organization). Mr. Ebsworth is a CFA® charterholder. | | N/A |
| | | |
Jane A. Freeman (Born 1953) | | Trustee, since 2015; Chair Liaison, since 2018 | | Retired. From 2012 to 2014 and 1999 to 2008, Chief Financial Officer of Scientific Learning Corporation. From 2008 to 2012, Ms. Freeman provided consulting services related to strategic business projects. Prior to 1999, Portfolio Manager at Rockefeller & Co. and Scudder, Stevens & Clark. Board member of the Harding Loevner Funds from 1996 to 2014, serving as both Lead Independent Director and chair of the Audit Committee. Board member of the Russell Exchange Traded Funds Trust from 2011 to 2012 and the chair of the Audit Committee. Ms. Freeman is a Board Member of The Ruth Bancroft Garden (non-profit organization). She is also an inactive Chartered Financial Analyst. | | N/A |
| | | |
Isaiah Harris, Jr. (Born 1952) | | Trustee, since 2009; Audit Committee Chairman, since 2019 | | Retired. Chairman of the Board of CIGNA Corporation since 2009, and Director since 2005. From 2003 to 2011, Director of Deluxe Corporation. Prior thereto, President and CEO of BellSouth Advertising and Publishing Corp. from 2005 to 2007, President and CEO of BellSouth Enterprises from 2004 to 2005 and President of BellSouth Consumer Services from 2000 to 2003. Emeritus member of the Iowa State University Foundation Board of Governors. Emeritus Member of the Advisory Board of Iowa State University School of Business. Advisory Board Member, Palm Harbor Academy (private school). Advisory Board Member, Child Evangelism Fellowship (non-profit). Mr. Harris is a certified public accountant (inactive status). | | CIGNA Corporation |
| | | |
Judith M. Johnson (Born 1949) | | Trustee, since 2008; Audit Committee Chairman, from 2009 to 2018 | | Retired. Prior thereto, Chief Executive Officer and Chief Investment Officer of Minneapolis Employees Retirement Fund from 1996 to 2008. Ms. Johnson is an attorney, certified public accountant and a certified managerial accountant. | | N/A |
| | | | |
| 40 | | Wells Fargo C&B Large Cap Value Fund | | Other information (unaudited) |
| | | | | | |
Name and year of birth | | Position held and length of service* | | Principal occupations during past five years or longer | | Current other
public company or
investment company
directorships |
| | | |
David F. Larcker (Born 1950) | | Trustee, since 2009 | | James Irvin Miller Professor of Accounting at the Graduate School of Business, Stanford University, Director of the Corporate Governance Research Initiative and Senior Faculty of The Rock Center for Corporate Governance since 2006. From 2005 to 2008, Professor of Accounting at the Graduate School of Business, Stanford University. Prior thereto, Ernst & Young Professor of Accounting at The Wharton School, University of Pennsylvania from 1985 to 2005. | | N/A |
| | | |
Olivia S. Mitchell (Born 1953) | | Trustee, since 2006; Nominating and Governance Committee Chairman, since 2018 | | International Foundation of Employee Benefit Plans Professor, Wharton School of the University of Pennsylvania since 1993. Director of Wharton’s Pension Research Council and Boettner Center on Pensions & Retirement Research, and Research Associate at the National Bureau of Economic Research. Previously, Cornell University Professor from 1978 to 1993. | | N/A |
| | | |
Timothy J. Penny (Born 1951) | | Trustee, since 1996; Chairman, since 2018 | | President and Chief Executive Officer of Southern Minnesota Initiative Foundation, a non-profit organization, since 2007. Member of the Board of Trustees of NorthStar Education Finance, Inc., a non-profit organization, since 2007. | | N/A |
| | | |
James G. Polisson (Born 1959) | | Trustee, since 2018 | | Retired. Chief Marketing Officer, Source (ETF) UK Services, Ltd, from 2015 to 2017. From 2012 to 2015, Principal of The Polisson Group, LLC, a management consulting, corporate advisory and principal investing company. Chief Executive Officer and Managing Director at Russell Investments, Global Exchange Traded Funds from 2010 to 2012. Managing Director of Barclays Global Investors from 1998 to 2010 and Global Chief Marketing Officer for iShares and Barclays Global Investors from 2000 to 2010. Trustee of the San Francisco Mechanics’ Institute, a non-profit organization, from 2013 to 2015. Board member of the Russell Exchange Traded Fund Trust from 2011 to 2012. Director of Barclays Global Investors Holdings Deutschland GmbH from 2006 to 2009. Mr. Polisson is an attorney and has a retired status with the Massachusetts and District of Columbia Bar Associations. | | N/A |
| * | Length of service dates reflect the Trustee’s commencement of service with the Trust’s predecessor entities, where applicable. |
| | | | | | |
| Other information (unaudited) | | Wells Fargo C&B Large Cap Value Fund | | | 41 | |
Officers
| | | | | | |
Name and year of birth | | Position held and
length of service | | Principal occupations during past five years or longer | | |
| | | |
Andrew Owen (Born 1960) | | President, since 2017 | | Executive Vice President of Wells Fargo & Company and Head of Affiliated Managers, Wells Fargo Asset Management, since 2014. In addition, Mr. Owen is currently President, Chief Executive Officer and Director of Wells Fargo Funds Management, LLC since 2017. Prior thereto, Executive Vice President responsible for marketing, investments and product development for Wells Fargo Funds Management, LLC, from 2009 to 2014. | | |
| | | |
Nancy Wiser1 (Born 1967) | | Treasurer, since 2012 | | Executive Vice President of Wells Fargo Funds Management, LLC since 2011. Chief Operating Officer and Chief Compliance Officer at LightBox Capital Management LLC, from 2008 to 2011. | | |
| | | |
Alexander Kymn (Born 1973) | | Secretary and Chief Legal Officer, since 2018 | | Senior Company Counsel of Wells Fargo Bank, N.A. since 2018 (previously Senior Counsel from 2007 to 2018). Vice President of Wells Fargo Funds Management, LLC from 2008 to 2014. | | |
| | | |
Michael H. Whitaker (Born 1967) | | Chief Compliance Officer, since 2016 | | Senior Vice President and Chief Compliance Officer since 2016. Senior Vice President and Chief Compliance Officer for Fidelity Investments from 2007 to 2016. | | |
| | | |
David Berardi (Born 1975) | | Assistant Treasurer, since 2009 | | Vice President of Wells Fargo Funds Management, LLC since 2009. Vice President of Evergreen Investment Management Company, LLC from 2008 to 2010. Manager of Fund Reporting and Control for Evergreen Investment Management Company, LLC from 2004 to 2010. | | |
| | | |
Jeremy DePalma1 (Born 1974) | | Assistant Treasurer, since 2009 | | Senior Vice President of Wells Fargo Funds Management, LLC since 2009. Senior Vice President of Evergreen Investment Management Company, LLC from 2008 to 2010 and head of the Fund Reporting and Control Team within Fund Administration from 2005 to 2010. | | |
| 1 | Nancy Wiser acts as Treasurer of 65 funds in the Fund Complex. Jeremy DePalma acts as Treasurer of 86 funds and Assistant Treasurer of 65 funds in the Fund Complex. |
| 2 | The Statement of Additional Information includes additional information about the Trustees and is available, without charge, upon request, by calling 1-800-222-8222 or by visiting the website atwfam.com. |
| | | | |
| 42 | | Wells Fargo C&B Large Cap Value Fund | | Other information (unaudited) |
BOARD CONSIDERATION OF INVESTMENT MANAGEMENT, ADVISORY AND SUB-ADVISORY AGREEMENTS:
Wells Fargo C&B Large Cap Value Fund and Wells Fargo C&B Large Cap Value Portfolio
Under the Investment Company Act of 1940 (the “1940 Act”), the Board of Trustees (each, a “Board” and collectively, the “Boards”) of each of Wells Fargo Funds Trust (“Funds Trust”) and Wells Fargo Master Trust (“Master Trust”, and collectively, the “Trusts”) must determine annually whether to approve the continuation of the Trusts’ investment management, advisory and sub-advisory agreements, as applicable. In this regard, at an in-person meeting held on May 21-22, 2019 (the “Meeting”), the Funds Trust Board, all the members of which have no direct or indirect interest in the investment management agreement and are not “interested persons” of the Trusts, as defined in the 1940 Act (the “Independent Trustees”), reviewed and approved for Wells Fargo C&B Large Cap Value Fund (the “Gateway Fund”) an investment management agreement (the “Gateway Fund Management Agreement”) with Wells Fargo Funds Management, LLC (“Funds Management”).
At the Meeting, the Master Trust Board, all the members of which have no direct or indirect interest in the investment advisory and sub-advisory agreements and are Independent Trustees, reviewed and approved: (i) an investment advisory agreement (the “Master Portfolio Advisory Agreement”) with Funds Management for Wells Fargo C&B Large Cap Value Portfolio, a portfolio of Master Trust (the “Master Portfolio”); and (ii) an investment sub-advisory agreement (the “Sub-Advisory Agreement”) with Cooke & Bieler L.P. (the “Sub-Adviser”).
The Gateway Fund and the Master Portfolio are collectively referred to as the “Funds.” The Gateway Fund Management Agreement, the Master Portfolio Advisory Agreement and the Sub-Advisory Agreement are collectively referred to as the “Advisory Agreements.”
The Gateway Fund is a gateway feeder fund that invest substantially all of its assets in the Master Portfolio. The Master Portfolio has a substantially similar investment objective and substantially similar investment strategies to the Gateway Fund. Information provided to the Boards regarding the Gateway Fund is also applicable to the Master Portfolio, as relevant.
At the Meeting, the Boards considered the factors and reached the conclusions described below relating to the selection of Funds Management and the Sub-Adviser and the approval of the Advisory Agreements. Prior to the Meeting, including at an in-person meeting in April 2019, the Trustees conferred extensively among themselves and with representatives of Funds Management about these matters. Also, the Boards have adopted a team-based approach, with each team consisting of a sub-set of Trustees, to assist the full Boards in the discharge of their duties in reviewing investment performance and other matters throughout the year. The Independent Trustees were assisted in their evaluation of the Advisory Agreements by independent legal counsel, from whom they received separate legal advice and with whom they met separately.
In providing information to the Boards, Funds Management and the Sub-Adviser were guided by a detailed set of requests for information submitted to them by independent legal counsel on behalf of the Independent Trustees at the start of the Boards’ annual contract renewal process earlier in 2019. In considering and approving the Advisory Agreements, the Trustees considered the information they believed relevant, including but not limited to the information discussed below. The Boards considered not only the specific information presented in connection with the Meeting, but also the knowledge gained over time through interaction with Funds Management and the Sub-Adviser about various topics. In this regard, the Boards reviewed reports of Funds Management at each of their quarterly meetings, which included, among other things, portfolio reviews and investment performance reports. In addition, the Boards and the teams mentioned above confer with portfolio managers at various times throughout the year. The Boards did not identify any particular information or consideration that was all-important or controlling, and each individual Trustee may have attributed different weights to various factors.
After its deliberations, the Funds Trust Board unanimously approved the continuation of the Gateway Fund Management Agreement for a one-year period. Additionally, after its deliberations, the Master Trust Board unanimously approved the continuation of the Master Portfolio Advisory Agreement and the Sub-Advisory Agreement, each for a one-year term. The Boards also determined that the compensation payable to Funds Management and the Sub-Adviser was reasonable. The Boards considered the approval of the Advisory Agreements for the Funds as part of their consideration of agreements for funds across the complex, but their approvals were made on a fund-by-fund basis. The following summarizes a number of important, but not necessarily all, factors considered by the Boards in support of their approvals.
| | | | | | |
| Other information (unaudited) | | Wells Fargo C&B Large Cap Value Fund | | | 43 | |
Nature, extent and quality of services
The Boards received and considered various information regarding the nature, extent and quality of services provided to the Funds by Funds Management and the Sub-Adviser under the Advisory Agreements. This information included a description of the investment advisory services and Fund-level administrative services, as well as, among other things, a summary of the background and experience of senior management of Wells Fargo Asset Management (“WFAM”), of which Funds Management is a part, a summary of investments made in the business of WFAM, a summary of certain organizational and personnel changes involving Funds Management, and a description of Funds Management’s and the Sub-Adviser’s business continuity planning programs and of their approaches to data privacy and cybersecurity. The Boards received and reviewed information about Funds Management’s role as administrator of the Funds’ liquidity risk management program. The Boards also considered the qualifications, background, tenure and responsibilities of each of the portfolio managers primarily responsible for the day-to-day portfolio management of the Funds.
The Boards evaluated the ability of Funds Management and the Sub-Adviser to attract and retain qualified investment professionals, including research, advisory and supervisory personnel. The Boards further considered the compliance programs and compliance records of Funds Management and the Sub-Adviser. In addition, the Boards took into account the full range of services provided to the Funds by Funds Management and its affiliates.
Fund investment performance and expenses
The Boards considered the investment performance results for each of the Funds over various time periods ended December 31, 2018. The Boards considered these results in comparison to the investment performance of funds in a universe that was determined by Broadridge Inc. (“Broadridge”) to be similar to the Gateway Fund (the “Universe”), and in comparison to the Gateway Fund’s benchmark index and to other comparative data. Broadridge is an independent provider of investment company data. The Boards received a description of the methodology used by Broadridge to select the mutual funds in the performance Universe. The Funds Trust Board noted that the investment performance of the Gateway Fund (Administrator Class) was higher than the average investment performance of its Universe for the three-, five- and ten-year periods under review, but lower than the average investment performance of its Universe for the one-year period under review. The Funds Trust Board also noted that the investment performance of the Gateway Fund was in range of its benchmark index, the Russell 1000® Value Index, for the ten-year period under review, but lower than its benchmark index for the one-, three- and five-year periods under review.
The Master Trust Board took note of the investment performance of the Master Portfolio in the context of reviewing the investment performance of the Gateway Fund.
The Funds Trust Board received information concerning, and discussed factors contributing to, the underperformance of the Gateway Fund relative to the Universe and benchmark for the periods identified above. The Funds Trust Board took note of the explanations for the relative underperformance during these periods, including with respect to investment decisions and market factors that affected the Gateway Fund’s investment performance. The Board also took note of the Gateway Fund’s outperformance relative to the Universe over the long-term.
The Funds Trust Board also received and considered information regarding the Gateway Fund’s net operating expense ratios, which include fees and expenses of the Master Portfolio, and their various components, including actual management fees assessed at the Gateway Fund and Master Portfolio levels, custodian and other non-management fees, and Rule 12b-1 and non-Rule 12b-1 shareholder service fees. The Funds Trust Board considered these ratios in comparison to the median ratios of funds in class-specific expense groups that were determined by Broadridge to be similar to the Gateway Fund (the “Groups”). The Funds Trust Board received a description of the methodology used by Broadridge to select the mutual funds in the expense Groups and an explanation of how funds comprising expense groups and their expense ratios may vary from year-to-year. Based on the Broadridge reports, the Funds Trust Board noted that the net operating expense ratios of the Gateway Fund were lower than or equal to the median net operating expense ratios of its expense Groups for each share class.
With respect to the Master Portfolio, the Master Trust Board reviewed the fee rates that are payable to Funds Management for investment advisory services (as discussed below), which are the only fees charged at the Master Portfolio level, relative to a corresponding expense Group.
The Boards took into account the Funds’ investment performance and expense information provided to them among the factors considered in deciding to re-approve the Advisory Agreements.
| | | | |
| 44 | | Wells Fargo C&B Large Cap Value Fund | | Other information (unaudited) |
Investment management, advisory and sub-advisory fee rates
The Funds Trust Board noted that Funds Management receives no advisory fees from the Gateway Fund as long as the Gateway Fund continues to invest all (or substantially all) of its assets in a single master portfolio. If the Gateway Fund were to change its investment structure so that it began investing in two or more master portfolios (a fund-of-funds), Funds Management would be entitled to receive an annual fee of 0.25% of the Gateway Fund’s average daily net assets for providing investment advisory services to the Gateway Fund, including allocating the Gateway Fund’s assets to the Master Portfolio.
The Funds Trust Board reviewed and considered the contractual fee rates that are payable by the Gateway Fund to Funds Management under the Gateway Fund Management Agreement, as well as the contractual fee rates payable by the Gateway Fund to Funds Management for class-level administrative services under a Class-Level Administration Agreement, which include, among other things, class-level transfer agency and sub-transfer agency costs (collectively, the “Management Rates”).
The Master Trust Board reviewed and considered the contractual investment advisory fee rate that is payable by the Master Portfolio to Funds Management for investment advisory services under the Master Portfolio Advisory Agreement (the “Advisory Agreement Rate”). The Master Trust Board also reviewed and considered the contractual investment sub-advisory fee rate that is payable by Funds Management to the Sub-Adviser for investment sub-advisory services (the “Sub-Advisory Agreement Rate”).
Among other information reviewed by the Funds Trust Board was a comparison of the Gateway Fund’s Management Rate, which include the advisory fees paid at the Master Portfolio level, with the average contractual investment management fee rates of funds in the expense Groups at a common asset level as well as transfer agency costs of the funds in the expense Groups. The Funds Trust Board noted that the Management Rates of the Gateway Fund were in range of the sum of these average rates for the Gateway Fund’s expense Groups for each share class except the Administrator Class. However, the Board noted that the net operating expense ratios of the Gateway Fund were lower than or equal to the median net operating expense ratios of the expense Groups for each share class, including for the Administrator Class.
The Master Trust Board reviewed a comparison of the Advisory Agreement Rate of the Master Portfolio with those of other funds in the Master Portfolio’s expense Group at a common asset level. The Master Trust Board noted that the Advisory Agreement Rate of the Master Portfolio was in range of the median rate for the Master Portfolio’s expense Group.
The Master Trust Board also received and considered information about the portions of the total management fees that were retained by Funds Management after payment of the fees to the Sub-Adviser for sub-advisory services. The Master Trust Board considered these amounts in comparison to the median amount retained by advisers to funds in a sub-advised expense universe that was determined by Broadridge to be similar to the Master Portfolio. In assessing the reasonableness of these amounts, the Master Trust Board received and evaluated information about the nature and extent of responsibilities retained and risks assumed by Funds Management and not delegated to or assumed by the Sub-Adviser, and about Funds Management’s on-going oversight services. The Master Trust Board also considered that the sub-advisory fees paid to the Sub-Adviser had been negotiated by Funds Management on an arm’s length basis.
The Boards also received and considered information about the nature and extent of services offered and fee rates charged by Funds Management and the Sub-Adviser to other types of clients with investment strategies similar to those of the Funds. In this regard, the Boards received information about the significantly greater scope of services, and compliance, reporting and other legal burdens and risks of managing proprietary mutual funds compared with those associated with managing assets of other types of clients, including third-party sub-advised fund clients and non-mutual fund clients such as institutional separate accounts.
Based on its consideration of the factors and information it deemed relevant, including those described here, the Funds Trust Board determined that the compensation payable to Funds Management under the Gateway Fund Management Agreement was reasonable, and the Master Trust Board determined that the compensation payable to Funds Management under the Master Portfolio Advisory Agreement and to the Sub-Adviser under the Sub-Advisory Agreement was reasonable.
Profitability
The Boards received and considered information concerning the profitability of Funds Management, as well as the profitability of both WFAM and Wells Fargo & Co. (“Wells Fargo”) from providing services to the fund family as a whole.
| | | | | | |
| Other information (unaudited) | | Wells Fargo C&B Large Cap Value Fund | | | 45 | |
Funds Management reported on the methodologies and estimates used in calculating profitability, including a description of the methodology used to allocate certain expenses. Among other things, the Boards noted that the levels of profitability reported on a fund-by-fund basis varied widely, depending on factors such as the size, type and age of fund. The Boards did not consider profitability with respect to the Sub-Adviser, as the sub-advisory fees paid to the Sub-Adviser had been negotiated by Funds Management on an arm’s-length basis.
Based on its review, the Boards did not deem the profits reported by Funds Management, WFAM or Wells Fargo from services provided to the Funds to be at a level that would prevent the Boards from approving the continuation of the Advisory Agreements.
Economies of scale
The Boards received and considered information about the potential for Funds Management to experience economies of scale in the provision of management services to the Funds, the difficulties of calculating economies of scale at an individual fund level, and the extent to which potential scale benefits are shared with shareholders. The Boards noted the existence of breakpoints in the Master Portfolio’s advisory fee structure and the Gateway Fund’s management fee structure, which operate generally to reduce the Funds’ expense ratios as the Funds grow in size. The Boards considered that, in addition to management fee breakpoints, Funds Management shares potential economies of scale from its management business in a variety of ways, including through fee waiver and expense reimbursement arrangements, services that benefit shareholders, competitive management fee rates set at the outset without regard to breakpoints, and investments in the business intended to enhance services available to shareholders.
The Boards concluded that Funds Management’s arrangements with respect to each Fund, including contractual breakpoints, constituted a reasonable approach to sharing potential economies of scale with the Funds and their shareholders.
Other benefits to Funds Management and the Sub-Adviser
The Boards received and considered information regarding potential “fall-out” or ancillary benefits received by Funds Management, the Sub-Adviser, and their affiliates as a result of their relationships with the Funds. Ancillary benefits could include, among others, benefits directly attributable to other relationships with the Funds and benefits potentially derived from an increase in Funds Management’s and the Sub-Adviser’s business as a result of their relationships with the Funds. The Boards noted that various affiliates of Funds Management may receive distribution-related fees, shareholder servicing payments and sub-transfer agency fees in respect of shares sold or held through them and services provided.
The Boards also reviewed information about soft dollar credits earned and utilized by the Sub-Adviser, fees earned by Funds Management and its affiliate from managing a private investment vehicle for the fund family’s securities lending collateral, and commissions earned by an affiliated broker from portfolio transactions.
Based on their consideration of the factors and information they deemed relevant, including those described here, the Boards did not find that any ancillary benefits received by Funds Management, the Sub-Adviser, and their affiliates were unreasonable.
Conclusion
At the Meeting, after considering the above-described factors and based on its deliberations and its evaluation of the information described above, the Funds Trust Board unanimously approved the continuation of the Gateway Fund Management Agreement for a one-year period. Additionally, after considering the above-described factors and based on its deliberations and its evaluation of the information described above, the Master Trust Board unanimously approved the continuation of the Master Portfolio Advisory Agreement and the Sub-Advisory Agreement, each for a one-year term. The Boards also determined that the compensation payable to Funds Management and the Sub-Adviser was reasonable.
This page is intentionally left blank.
This page is intentionally left blank.
This page is intentionally left blank.

For more information
More information about Wells Fargo Funds is available free upon request. To obtain literature, please write, visit the Fund’s website, or call:
Wells Fargo Funds
P.O. Box 219967
Kansas City, MO 64121-9967
Website: wfam.com
Individual investors: 1-800-222-8222
Retail investment professionals: 1-888-877-9275
Institutional investment professionals:
1-866-765-0778
This report and the financial statements contained herein are submitted for the general information of the shareholders of the Fund. If this report is used for promotional purposes, distribution of the report must be accompanied or preceded by a current prospectus. Before investing, please consider the investment objectives, risks, charges, and expenses of the investment. For a current prospectus and, if available, a summary prospectus, containing this information, call1-800-222-8222 or visit the Fund’s website atwfam.com. Read the prospectus carefully before you invest or send money.
Wells Fargo Asset Management (WFAM) is the trade name for certain investment advisory/management firms owned by Wells Fargo & Company. These firms include but are not limited to Wells Capital Management Incorporated and Wells Fargo Funds Management, LLC. Certain products managed by WFAM entities are distributed by Wells Fargo Funds Distributor, LLC (a broker-dealer and Member FINRA).
This material is for general informational and educational purposes only and is NOT intended to provide investment advice or a recommendation of any kind—including a recommendation for any specific investment, strategy, or plan.
INVESTMENT PRODUCTS: NOT FDIC INSURED ◾ NO BANK GUARANTEE ◾ MAY LOSE VALUE
© 2019 Wells Fargo Funds Management, LLC. All rights reserved.
| | |
 | | 403194 07-19 A280/AR280 05-19 |
Annual Report
May 31, 2019

Wells Fargo Diversified Equity Fund

Beginning on January 1, 2021, as permitted by new regulations adopted by the Securities and Exchange Commission, paper copies of the Wells Fargo Funds’ annual and semi-annual shareholder reports issued after this date will no longer be sent by mail, unless you specifically request paper copies of the reports. Instead, the reports will be made available on the Funds’ website, and you will be notified by mail each time a report is posted and provided with a website address to access the report.
If you already elected to receive shareholder reports electronically, you will not be affected by this change and you need not take any action. You may elect to receive shareholder reports and other communications from the Fund electronically at any time by contacting your financial intermediary (such as a broker-dealer or bank) or, if you are a direct investor, by calling 1-800-222-8222 or by enrolling at wellsfargo.com/advantagedelivery.
You may elect to receive all future reports in paper free of charge. If you invest through a financial intermediary, you can contact your financial intermediary to request that you continue to receive paper copies of your shareholder reports; if you invest directly with the Fund, you can call 1-800-222-8222. Your election to receive reports in paper will apply to all Wells Fargo Funds held in your account with your financial intermediary or, if you are a direct investor, to all Wells Fargo Funds that you hold.

Reduce clutter. Save trees.
Sign up for electronic delivery of prospectuses and shareholder reports atwellsfargo.com/advantagedelivery
Contents
The views expressed and any forward-looking statements are as of May 31, 2019, unless otherwise noted, and are those of the Fund managers and/or Wells Fargo Asset Management. Discussions of individual securities, or the markets generally, or any Wells Fargo Fund are not intended as individual recommendations. Future events or results may vary significantly from those expressed in any forward-looking statements. The views expressed are subject to change at any time in response to changing circumstances in the market. Wells Fargo Asset Management and the Fund disclaim any obligation to publicly update or revise any views expressed or forward-looking statements.
INVESTMENT PRODUCTS: NOT FDIC INSURED ◾ NO BANK GUARANTEE ◾ MAY LOSE VALUE
| | | | |
| 2 | | Wells Fargo Diversified Equity Fund | | Letter to shareholders (unaudited) |

Andrew Owen
President
Wells Fargo Funds
Dear Shareholder:
We are pleased to offer you this annual report for the Wells Fargo Diversified Equity Fund for the 12-month period that ended May 31, 2019. Higher short-term interest rates, inflation concerns, trade tensions, and geopolitical events drove investment market volatility for much of 2018, particularly for international stocks. Early 2019 saw stocks and bonds gain with renewed business and investor confidence, but volatility returned late in the period as global growth slowed and geopolitical concerns persisted.
For the period, U.S. stocks, based on the S&P 500 Index,1 gained 3.78% and international stocks, as measured by the MSCI ACWI ex USA Index (Net),2 fell 6.26%. Based on the MSCI EM Index (Net),3 emerging market stocks fell 8.70%. Bond investors saw the Bloomberg Barclays U.S. Aggregate Bond Index4 add 6.40% while the Bloomberg Barclays Global Aggregate ex-USD Index5 rose 0.39%. The Bloomberg Barclays Municipal Bond Index6 added 6.40%, and the ICE BofAML U.S. High Yield Index7 was up 5.37%.
Results for investment indices reflected global concerns.
Global trade tensions escalated during the second quarter of 2018. A tit-for-tat tariff spat intensified between the U.S. and other governments. The U.S. Federal Reserve (Fed) raised the federal funds rate by 25 basis points (bps; 100 bps equal 1.00%) to a target range of between 1.75% and 2.00% in June. Market index results reflected the global concerns. The MSCI ACWI ex USA Index (Net) lost 2.61%, while the Bloomberg Barclays Global Aggregate ex-USD Index dropped 4.76%.
Not all news was bad. The U.S. Bureau of Economic Analysis reported second-quarter annualized gross domestic product (GDP) growth of 4.2%. Hiring improved. Unemployment declined. Consumer confidence and spending increased. The S&P 500 Index recorded a 3.43% second-quarter gain. Stocks of companies with smaller capitalizations did even better, as measured by the Russell 2000® Index,8 adding 7.75%.
| 1 | The S&P 500 Index consists of 500 stocks chosen for market size, liquidity, and industry group representation. It is a market-value-weighted index with each stock’s weight in the index proportionate to its market value. You cannot invest directly in an index. |
| 2 | The Morgan Stanley Capital International (MSCI) All Country World Index (ACWI) ex USA Index (Net) is a free-float-adjusted market-capitalization-weighted index that is designed to measure the equity market performance of developed and emerging markets, excluding the U.S. Source: MSCI. MSCI makes no express or implied warranties or representations and shall have no liability whatsoever with respect to any MSCI data contained herein. The MSCI data may not be further redistributed or used as a basis for other indices or any securities or financial products. This report is not approved, reviewed, or produced by MSCI. You cannot invest directly in an index. |
| 3 | The MSCI Emerging Markets (EM) Index (Net) is a free-float-adjusted market-capitalization-weighted index that is designed to measure the equity market performance of emerging markets. You cannot invest directly in an index. |
| 4 | The Bloomberg Barclays U.S. Aggregate Bond Index is a broad-based benchmark that measures the investment-grade, U.S.-dollar-denominated, fixed-rate taxable bond market, including Treasuries, government-related and corporate securities, mortgage-backed securities (agency fixed-rate and hybrid adjustable-rate mortgage pass-throughs), asset-backed securities, and commercial mortgage-backed securities. You cannot invest directly in an index. |
| 5 | The Bloomberg Barclays Global Aggregate ex-USD Index is an unmanaged index that provides a broad-based measure of the global investment-grade fixed-income markets excluding the U.S.-dollar-denominated debt market. You cannot invest directly in an index. |
| 6 | The Bloomberg Barclays Municipal Bond Index is an unmanaged index composed of long-term tax-exempt bonds with a minimum credit rating of Baa. You cannot invest directly in an index. |
| 7 | The ICE BofAML U.S. High Yield Index is a market-capitalization-weighted index of domestic and Yankee high-yield bonds. The index tracks the performance of high-yield securities traded in the U.S. bond market. You cannot invest directly in an index. Copyright 2019. ICE Data Indices, LLC. All rights reserved. |
| 8 | The Russell 2000® Index measures the performance of the 2,000 smallest companies in the Russell 3000® Index, which represents approximately 8% of the total market capitalization of the Russell 3000® Index. You cannot invest directly in an index. |
| | | | | | |
| Letter to shareholders (unaudited) | | Wells Fargo Diversified Equity Fund | | | 3 | |
Investors appeared to shake off lingering concerns during the third quarter.
Favorable third-quarter economic indicators and corporate earnings reports encouraged domestic stock investors. U.S. trade negotiations with Mexico and Canada progressed. The Conference Board Consumer Confidence Index®9 reached its highest level in 18 years during September 2018. The Fed raised the federal funds rate by 25 bps to a target range of between 2.00% and 2.25% in September. For the quarter that ended September 30, 2018, the S&P 500 Index added 7.71%.
Investors in international markets were not as confident. Tensions between the U.S. and China increased. The U.S. imposed $200 billion in tariffs on Chinese goods. China reacted with $60 billion in tariffs on U.S. goods. Economic growth in China caused concern. The Bank of England (BoE) raised its monetary policy rate to 0.75% in August 2018. During the quarter, the MSCI ACWI ex USA Index (Net) gained 0.71%. The MSCI EM Index (Net) declined 1.09%. In fixed-income markets, U.S. bonds were flat, as measured by the Bloomberg Barclays U.S. Aggregate Bond Index. The Bloomberg Barclays Global Aggregate ex-USD Index fell 1.74%.
Conflicting data unsettled markets during the fourth quarter.
November’s U.S. midterm elections shifted control of the House of Representatives from Republicans to Democrats, presaging potential partisan clashes. Third-quarter U.S. GDP was announced at an annualized 3.4% rate, lower than the second-quarter rate. Brexit efforts stalled ahead of the March 2019 deadline. The People’s Bank of China cut reserve requirement ratios, accelerated infrastructure spending, and cut taxes even as the value of the yuan declined to low levels last seen in 2008.
December’s S&P 500 Index performance was the worst since 1931. Globally,fixed-income investments fared better than stocks during the last two months of the year. The Fed increased the federal funds rate by 25 bps in December 2018 to a target range of between 2.25% and 2.50%.
The market climbs a wall of worry.
Investors entered 2019 with reasons to be concerned. A partial U.S. government shutdown driven by partisan policy disputes extended into January. Investment returns appeared to reaffirm the adage that markets climb a wall of worry. The S&P 500 Index gained 8.01% for the month of January, the best monthly performance in 30 years. Returns for the MSCI ACWI ex USA Index (Net), the Bloomberg Barclays U.S. Aggregate Bond Index, and the Bloomberg Barclays Global Aggregate ex-USD Index also were positive. The Fed indicated that it would pause its program of regular rate increases during 2019 as inflation remained low.
In February 2019, concerns over slowing global growth reemerged. The Bureau of Economic Analysis announced fourth-quarter 2018 GDP grew at an annualized 2.2% rate, down from levels of the prior two quarters. In a February report, the BoE forecast the slowest growth since the financial crisis for 2019. China and the U.S. continued to wrangle over trade issues.
By the end of March 2019, the combination of dovish Fed sentiment and consistent, if not spectacular, economic and business metrics reinforced investors’ confidence. Monthly job creation data regained momentum. Corporate profits, while lower than 2018’s lofty levels, remained solid. China announced a roughly $300 billion stimulus package through tax and fee cuts intended to reinvigorate economic growth.
December’s S&P 500 Index performance was the worst since 1931.
The S&P 500 Index gained 8.01% for the month of January, the best monthly performance in 30 years.
| 9 | The Conference Board Consumer Confidence Index® measures the degree of optimism on the state of the U.S. economy that consumers are expressing through their activities of saving and spending. You cannot invest directly in an index. |
| | | | |
| 4 | | Wells Fargo Diversified Equity Fund | | Letter to shareholders (unaudited) |
During April 2019, several broad-based U.S. equity indices reached or approached highs as investors drew confidence from favorable economic projections, sustained low inflation, and solid employment data. First-quarter GDP showed the economy grew at an annualized rate of 3.2% on improvement in business investment and exports. Favorable sentiment extended to foreign markets as the MSCI ACWI ex USA Index (Net) gained 2.64% and the MSCI EM Index (Net) added 2.11% for the month.
May 2019 presented investors with mixed signals in the economy, in the markets, and politically. In the U.S., partisan wrangling ramped up as Democrats and Republicans set their sights on 2020 presidential politics. In the U.K., the Brexit stalemate resulted in the resignation of Prime Minister Theresa May. The European Commission downgraded the 2019 growth forecast for the block of countries to 1.2%. The U.S. increased tariffs on products from China, China responded, and then talks broke down. Ending the month, equities, as measured by the MSCI ACWI (Net),10 dropped 5.93% while bonds, often considered a less risky investment, gained 1.04%, as measured by the Bloomberg Barclays Global Aggregate ex-USD Index.
Don’t let short-term uncertainty derail long-term investment goals.
Periods of investment uncertainty can present challenges, but experience has taught us that maintaining long-term investment goals can be an effective way to plan for the future. To help you create a sound strategy based on your personal goals and risk tolerance, Wells Fargo Funds offers more than 100 mutual funds spanning a wide range of asset classes and investment styles. Although diversification cannot guarantee an investment profit or prevent losses, we believe it can be an effective way to manage investment risk and potentially smooth out overall portfolio performance. We encourage investors to know their investments and to understand that appropriate levels of risk-taking may unlock opportunities.
Thank you for choosing to invest with Wells Fargo Funds. We appreciate your confidence in us and remain committed to helping you meet your financial needs.
Sincerely,

Andrew Owen
President
Wells Fargo Funds
For further information about your Fund, contact your investment professional, visit our website atwfam.com, or call us directly at1-800-222-8222.
| 10 | The MSCI ACWI (Net) is a free-float-adjusted market-capitalization-weighted index that is designed to measure the equity market performance of developed and emerging markets. You cannot invest directly in an index. |
This page is intentionally left blank.
| | | | |
| 6 | | Wells Fargo Diversified Equity Fund | | Performance highlights (unaudited) |
Investment objective
The Fund seeks long-term total capital appreciation.
Manager
Wells Fargo Funds Management, LLC
Portfolio managers
Thomas C. Biwer, CFA®‡
Aldo Ceccarelli, CFA®‡
Average annual total returns (%) as of May 31, 2019
| | | | | | | | | | | | | | | | | | | | | | | | | | | | | | | | | | |
| | | | | Including sales charge | | | Excluding sales charge | | | Expense ratios1 (%) | |
| | | Inception date | | 1 year | | | 5 year | | | 10 year | | | 1 year | | | 5 year | | | 10 year | | | Gross | | | Net2 | |
| | | | | | | | | |
| Class A (NVDAX) | | 5-2-1996 | | | -6.29 | | | | 5.41 | | | | 10.73 | | | | -0.57 | | | | 6.66 | | | | 11.38 | | | | 1.38 | | | | 1.25 | |
| | | | | | | | | |
| Class C (WFDEX) | | 10-1-1998 | | | -2.34 | | | | 5.87 | | | | 10.55 | | | | -1.34 | | | | 5.87 | | | | 10.55 | | | | 2.13 | | | | 2.00 | |
| | | | | | | | | |
| Administrator Class (NVDEX) | | 11-11-1994 | | | – | | | | – | | | | – | | | | -0.35 | | | | 6.93 | | | | 11.66 | | | | 1.30 | | | | 1.00 | |
| | | | | | | | | |
| Diversified Equity Blended Index3 | | – | | | – | | | | – | | | | – | | | | 0.87 | | | | 8.04 | | | | 12.76 | | | | – | | | | – | |
| | | | | | | | | |
| MSCI EAFE Index (Net)4 | | – | | | – | | | | – | | | | – | | | | -5.75 | | | | 1.27 | | | | 6.23 | | | | – | | | | – | |
| | | | | | | | | |
| Russell 1000® Growth Index5 | | – | | | – | | | | – | | | | – | | | | 5.39 | | | | 12.33 | | | | 15.64 | | | | – | | | | – | |
| | | | | | | | | |
| Russell 1000® Value Index6 | | – | | | – | | | | – | | | | – | | | | 1.45 | | | | 6.53 | | | | 12.33 | | | | – | | | | – | |
| | | | | | | | | |
| Russell 2000® Index7 | | – | | | – | | | | – | | | | – | | | | -9.04 | | | | 6.71 | | | | 12.84 | | | | – | | | | – | |
| | | | | | | | | |
| S&P 500 Index8 | | – | | | – | | | | – | | | | – | | | | 3.78 | | | | 9.66 | | | | 13.95 | | | | – | | | | – | |
Figures quoted represent past performance, which is no guarantee of future results, and do not reflect taxes that a shareholder may pay on fund distributions or the redemption of fund shares. Investment return and principal value of an investment will fluctuate so that an investor’s shares, when redeemed, may be worth more or less than their original cost. Performance shown without sales charges would be lower if sales charges were reflected. Current performance may be lower or higher than the performance data quoted, which assumes the reinvestment of dividends and capital gains. Current month-end performance is available on the Fund’s website, wfam.com.
Index returns do not include transaction costs associated with buying and selling securities, any mutual fund fees or expenses, or any taxes. It is not possible to invest directly in an index.
For Class A shares, the maximum front-end sales charge is 5.75%. For Class C shares, the maximum contingent deferred sales charge is 1.00%. Performance including a contingent deferred sales charge assumes the sales charge for the corresponding time period. Administrator Class shares are sold without a front-end sales charge or contingent deferred sales charge.
Stock values fluctuate in response to the activities of individual companies and general market and economic conditions. The use of derivatives may reduce returns and/or increase volatility. Certain investment strategies tend to increase the total risk of an investment (relative to the broader market). The Fund is exposed to foreign investment risk and smaller-company securities risk. Consult the Fund’s prospectus for additional information on these and other risks.
Please see footnotes on page 7.
| | | | | | |
| Performance highlights (unaudited) | | Wells Fargo Diversified Equity Fund | | | 7 | |
|
| Growth of $10,000 investment as of May 31, 20199 |
|
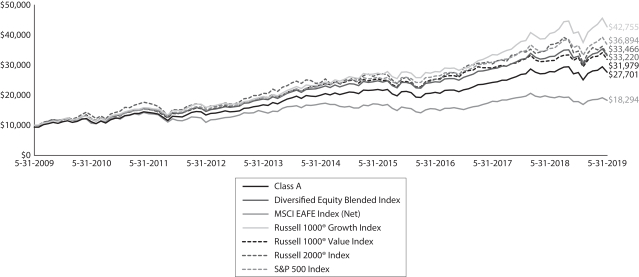 |
| ‡ | CFA® and Chartered Financial Analyst® are trademarks owned by CFA Institute. |
| 1 | Reflects the expense ratios as stated in the most recent prospectuses, which include the impact of 0.53% in acquired fund fees and expenses. The expense ratios shown are subject to change and may differ from the annualized expense ratios shown in the financial highlights of this report. |
| 2 | The manager has contractually committed through September 30, 2019, to waive fees and/or reimburse expenses to the extent necessary to cap the expenses of each class after fee waivers at the amounts shown. Brokerage commissions, stamp duty fees, interest, taxes, acquired fund fees and expenses (if any) from funds in which the affiliated master portfolios and funds invest and from any money market funds, and extraordinary expenses are excluded from the expense cap. All other acquired fund fees and expenses from the affiliated master portfolios and funds are included in the expense caps. Prior to or after the commitment expiration date, the cap may be increased or the commitment to maintain the cap may be terminated only with the approval of the Board of Trustees. Without this cap, the Fund’s returns would have been lower. The expense ratio paid by an investor is the net expense ratio (the total annual fund operating expenses after fee waivers) as stated in the prospectuses. |
| 3 | Source: Wells Fargo Funds Management, LLC. The Diversified Equity Blended Index is composed 25% of the S&P 500 Index, 25% of the Russell 1000® Growth Index, 25% of the Russell 1000® Value Index, 15% of the MSCI EAFE Index (Net), and 10% of the Russell 2000® Index. You cannot invest directly in an index. |
| 4 | The Morgan Stanley Capital International (MSCI) Europe, Australasia, Far East (EAFE) Index (Net) is a free-float-adjusted market-capitalization-weighted index that is designed to measure the equity market performance of developed markets, excluding the U.S. and Canada. Source: MSCI. MSCI makes no express or implied representations and shall have no liability whatsoever with respect to any MSCI data contained herein. The MSCI data may not be further redistributed or used as a basis for other indexes or any securities or financial products. This report is not approved, reviewed, or produced by MSCI. You cannot invest directly in an index. |
| 5 | The Russell 1000® Growth Index measures the performance of those Russell 1000 companies with higher price/book ratios and higher forecasted growth values. You cannot invest directly in an index. |
| 6 | The Russell 1000® Value Index measures the performance of those Russell 1000 companies with lower price/book ratios and lower forecasted growth values. You cannot invest directly in an index. |
| 7 | The Russell 2000® Index measures the performance of the 2,000 smallest companies in the Russell 3000® Index, which represents approximately 8% of the total market capitalization of the Russell 3000® Index. You cannot invest directly in an index. |
| 8 | The S&P 500 Index consists of 500 stocks chosen for market size, liquidity, and industry group representation. It is a market-value-weighted index with each stock’s weight in the index proportionate to its market value. You cannot invest directly in an index. |
| 9 | The chart compares the performance of Class A shares for the most recent ten years with the Diversified Equity Blended Index, the MSCI EAFE Index (Net), the Russell 1000® Growth Index, the Russell 1000® Value Index, the Russell 2000® Index, and the S&P 500 Index. The chart assumes a hypothetical $10,000 investment in Class A shares and reflects all operating expenses and assumes the maximum initial sales charge of 5.75%. |
| 10 | The ten largest holdings, excluding cash, cash equivalents and any money market funds, are calculated based on the value of the investments divided by total net assets of the Fund. Holdings are subject to change and may have changed since the date specified. |
| 11 | Current target allocation is subject to change and may have changed since the date specified. |
| | | | |
| 8 | | Wells Fargo Diversified Equity Fund | | Performance highlights (unaudited) |
MANAGER’S DISCUSSION
Fund highlights
| ∎ | | The Fund underperformed its benchmark, the Diversified Equity Blended Index, for the 12-month period that ended May 31, 2019. |
| ∎ | | Relative underperformance by two of the domestic underlying equity investments and one of the underlying international equity managers were the most significant detractors from performance over the period. |
| ∎ | | Of the nine underlying investments, four outperformed their respective benchmarks while five lagged. |
Positive economic data and increased market volatility ruled most of the period.
The 12-month period that ended May 31, 2019, saw the U.S. economy continue on a positive trajectory, producing moderate average gross domestic product growth of 3.1% with a core inflation rate of 2.0%, while unemployment reached a low of 3.6%, the lowest level since 1969.
Over the past 12 months, the financial markets experienced more volatility than the favorable economic environment might have suggested. We saw equities experience a significant decline during the fourth quarter of 2018, as concerns over a partial U.S. government shutdown, central bank tightening, trade tensions, and slowing economic growth shook investors’ confidence. The market volatility of the fourth quarter gave way to a first-quarter 2019 rebound where both equity and fixed-income markets rallied. The two markets seemed joined at the hip as the Federal Reserve’s (Fed’s) updated script signaled an easier policy path for the balance of 2019. Market participants were caught off guard by this evolution in the projected policy path, resulting in a broader opportunity set for sector rotation in equities and yield curve trades. We saw a return of volatility toward the end of the 12-month period as concerns over trade—primarily with China and Mexico—caused concerns over global growth to weigh on investors’ minds.
For the 12-month period, the broad U.S. equity market delivered a modest positive return while foreign markets declined. Among the Fund’s underlying holdings, U.S. equity funds as a group produced positive absolute returns despite declines in the small-cap segment, but they lagged their respective benchmarks on balance. International equity funds suffered negative absolute returns but narrowly outperformed their respective benchmarks on balance.
There were no changes to the Fund’s strategic composition.
The Fund’s overall asset allocation among the underlying funds remains aligned with the composition of its blended benchmark: 25% in U.S. large-cap value portfolios, 25% in U.S. large-cap blend portfolios, 25% in U.S. large-cap growth portfolios, 10% in U.S. small-cap portfolios, and 15% in international portfolios.
| | | | |
| Fund holdings (%) as of May 31, 201910 | |
| |
Wells Fargo Diversified Large Cap Growth Portfolio | | | 25.13% | |
| |
Wells Fargo Index Portfolio | | | 25.07% | |
| |
Wells Fargo Large Company Value Portfolio | | | 16.71% | |
| |
Wells Fargo C&B Large Cap Value Portfolio | | | 8.31% | |
| |
Wells Fargo International Growth Portfolio | | | 7.57% | |
| |
Wells Fargo International Value Portfolio | | | 7.37% | |
| |
Wells Fargo Small Company Value Portfolio | | | 4.88% | |
| |
Wells Fargo Emerging Growth Portfolio | | | 2.52% | |
| |
Wells Fargo Small Company Growth Portfolio | | | 2.48% | |
Looking ahead, we are cautiously optimistic.
Our macroeconomic view is that growth will remain positive but it will be slower over the next 12 months than it was over the preceding 12 months. However, we still hold that absent an exogenous shock—like an implemented shift in trade policy—a U.S. recession is unlikely in 2019. As always, that view could change with new data. We are concerned about growth prospects in Europe and the rest of the world but are most concerned about the U.S. trade negotiations with major trading partners. Until trade negotiations move toward détente and more certainty fosters more aggressive business planning resulting in further growth, we believe markets will remain volatile. We acknowledge that while the U.S. economy may be softening, the level of growth remains robust and 2019 should remain a target-rich environment for investors.
Please see footnotes on page 7.
| | | | | | |
| Performance highlights (unaudited) | | Wells Fargo Diversified Equity Fund | | | 9 | |
|
| Neutral target allocation |
|
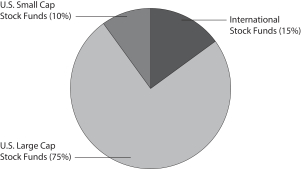
|
|
| Current target allocation as of May 31, 201911 |
|

|
Please see footnotes on page 7.
| | | | |
| 10 | | Wells Fargo Diversified Equity Fund | | Fund expenses (unaudited) |
As a shareholder of the Fund, you incur two types of costs: (1) transaction costs, including sales charges (loads) on purchase payments and contingent deferred sales charges (if any) on redemptions and (2) ongoing costs, including management fees, distribution (12b-1) and/or shareholder servicing fees, and other Fund expenses. This example is intended to help you understand your ongoing costs (in dollars) of investing in the Fund and to compare these costs with the ongoing costs of investing in other mutual funds.
The example is based on an investment of $1,000 invested at the beginning of the six-month period and held for the entire period from December 1, 2018 to May 31, 2019.
Actual expenses
The “Actual” line of the table below provides information about actual account values and actual expenses. You may use the information in this line, together with the amount you invested, to estimate the expenses that you paid over the period. Simply divide your account value by $1,000 (for example, an $8,600 account value divided by $1,000 = 8.6), then multiply the result by the number in the “Actual” line under the heading entitled “Expenses paid during period” for your applicable class of shares to estimate the expenses you paid on your account during this period.
Hypothetical example for comparison purposes
The “Hypothetical” line of the table below provides information about hypothetical account values and hypothetical expenses based on the Fund’s actual expense ratio and an assumed rate of return of 5% per year before expenses, which is not the Fund’s actual return. The hypothetical account values and expenses may not be used to estimate the actual ending account balance or expenses you paid for the period. You may use this information to compare the ongoing costs of investing in the Fund and other funds. To do so, compare this 5% hypothetical example with the 5% hypothetical examples that appear in the shareholder reports of the other funds.
Please note that the expenses shown in the table are meant to highlight your ongoing costs only and do not reflect any transactional costs, such as sales charges (loads) and contingent deferred sales charges. Therefore, the “Hypothetical” line of the table is useful in comparing ongoing costs only and will not help you determine the relative total costs of owning different funds. In addition, if these transactional costs were included, your costs would have been higher.
| | | | | | | | | | | | | | | | |
| | | Beginning account value 12-1-2018 | | | Ending account value 5-31-2019 | | | Expenses
paid during the period1,2 | | | Annualized net expense ratio1 | |
Class A | | | | | | | | | | | | | | | | |
| | | | |
Actual | | $ | 1,000.00 | | | $ | 1,002.58 | | | $ | 6.24 | | | | 1.25 | % |
| | | | |
Hypothetical (5% return before expenses) | | $ | 1,000.00 | | | $ | 1,018.70 | | | $ | 6.29 | | | | 1.25 | % |
Class C | | | | | | | | | | | | | | | | |
| | | | |
Actual | | $ | 1,000.00 | | | $ | 998.87 | | | $ | 9.96 | | | | 2.00 | % |
| | | | |
Hypothetical (5% return before expenses) | | $ | 1,000.00 | | | $ | 1,014.97 | | | $ | 10.04 | | | | 2.00 | % |
Administrator Class | | | | | | | | | | | | | | | | |
| | | | |
Actual | | $ | 1,000.00 | | | $ | 1,003.66 | | | $ | 4.99 | | | | 1.00 | % |
| | | | |
Hypothetical (5% return before expenses) | | $ | 1,000.00 | | | $ | 1,019.95 | | | $ | 5.03 | | | | 1.00 | % |
| 1 | Amounts reflect net expenses allocated from the affiliated Master Portfolios in which the Fund invests. |
| 2 | Expenses paid is equal to the annualized net expense ratio of each class multiplied by the average account value over the period, multiplied by the number of days in the most recent fiscal half-year divided by the number of days in the fiscal year (to reflect the one-half-year period). |
| | | | | | |
| Portfolio of investments—May 31, 2019 | | Wells Fargo Diversified Equity Fund | | | 11 | |
| | | | | | | | | | | | | | | | |
| Security name | | | | | | | | | | | Value | |
| | | | |
Investment Companies: 100.06% | | | | | | | | | | | | | | | | |
| | | | |
| Affiliated Master Portfolios: 100.06% | | | | | | | | | | | | | | | | |
| | | | |
Wells Fargo C&B Large Cap Value Portfolio | | | | | | | | | | | | | | $ | 12,534,851 | |
| | | | |
Wells Fargo Diversified Large Cap Growth Portfolio | | | | | | | | | | | | | | | 37,898,451 | |
| | | | |
Wells Fargo Emerging Growth Portfolio | | | | | | | | | | | | | | | 3,806,629 | |
| | | | |
Wells Fargo Index Portfolio | | | | | | | | | | | | | | | 37,799,057 | |
| | | | |
Wells Fargo International Growth Portfolio | | | | | | | | | | | | | | | 11,420,978 | |
| | | | |
Wells Fargo International Value Portfolio | | | | | | | | | | | | | | | 11,118,224 | |
| | | | |
Wells Fargo Large Company Value Portfolio | | | | | | | | | | | | | | | 25,200,984 | |
| | | | |
Wells Fargo Small Company Growth Portfolio | | | | | | | | | | | | | | | 3,736,437 | |
| | | | |
Wells Fargo Small Company Value Portfolio | | | | | | | | | | | | | | | 7,359,729 | |
| | | | |
Total Investment Companies (Cost $139,101,893) | | | | | | | | | | | | | | | 150,875,340 | |
| | | | | | | | | | | | | | | | |
| | | | | | | | |
| Total investments in securities (Cost $139,101,893) | | | 100.06 | % | | | 150,875,340 | |
| | |
Other assets and liabilities, net | | | (0.06 | ) | | | (93,135 | ) |
| | | | | | | | |
| Total net assets | | | 100.00 | % | | $ | 150,782,205 | |
| | | | | | | | |
Transactions with the affiliated Master Portfolios were as follows:
| | | | | | | | | | | | | | | | | | | | | | | | | | | | | | | | | | | | |
| | | % of
ownership, beginning
of period | | | % of
ownership, end of
period | | | Net realized
gains
(losses) on
securities
transactions
allocated
from
affiliated
Master
Portfolios | | | Net change in
unrealized
gains (losses) on
securities
transactions
allocated
from
affiliated
Master
Portfolios | | | Dividends
allocated
from
affiliated
Master
Portfolios | | | Affiliated
income
allocated
from
affiliated
Master
Portfolios | | | Interest
allocated
from
affiliated
Master
Portfolios | | | Value, end of period | | | % of
net
assets | |
Wells Fargo C&B Large Cap Value Portfolio | | | 3.64 | % | | | 3.57 | % | | $ | 1,660,939 | | | $ | (1,582,965 | ) | | $ | 255,346 | | | $ | 6,725 | | | $ | 0 | | | $ | 12,534,851 | | | | | |
Wells Fargo Diversified Large Cap Growth Portfolio | | | 50.34 | | | | 15.12 | | | | 2,649,403 | | | | (1,397,741 | ) | | | 522,855 | | | | 12,778 | | | | 0 | | | | 37,898,451 | | | | | |
Wells Fargo Emerging Growth Portfolio | | | 0.50 | | | | 0.46 | | | | 758,020 | | | | (689,740 | ) | | | 4,355 | | | | 5,263 | | | | 0 | | | | 3,806,629 | | | | | |
Wells Fargo Index Portfolio | | | 2.60 | | | | 3.16 | | | | 9,621,582 | | | | (8,855,189 | ) | | | 797,020 | | | | 18,637 | | | | 1,408 | | | | 37,799,057 | | | | | |
Wells Fargo International Growth Portfolio | | | 27.82 | | | | 5.46 | | | | (43,596 | ) | | | (179,178 | ) | | | 262,971 | | | | 17,298 | | | | 0 | | | | 11,420,978 | | | | | |
Wells Fargo International Value Portfolio | | | 1.37 | | | | 1.04 | | | | 304,005 | | | | (2,098,741 | ) | | | 492,337 | | | | 18,169 | | | | 0 | | | | 11,118,224 | | | | | |
Wells Fargo Large Company Value Portfolio | | | 46.00 | | | | 10.11 | | | | (418,278 | ) | | | (420,315 | ) | | | 698,278 | | | | 9,272 | | | | 1,796 | | | | 25,200,984 | | | | | |
Wells Fargo Small Company Growth Portfolio | | | 0.22 | | | | 0.21 | | | | 833,763 | | | | (1,028,283 | ) | | | 23,740 | | | | 4,285 | | | | 0 | | | | 3,736,437 | | | | | |
Wells Fargo Small Company Value Portfolio | | | 5.44 | | | | 5.77 | | | | (409,312 | ) | | | (858,468 | ) | | | 121,413 | | | | 5,986 | | | | 0 | | | | 7,359,729 | | | | | |
| | | | | | | | | | | | | | | | | | | | | | | | | | | | | | | | | | | | |
| | | | | | | | | |
| | | | | | | | | | $ | 14,956,526 | | | $ | (17,110,620 | ) | | $ | 3,178,315 | | | $ | 98,413 | | | $ | 3,204 | | | $ | 150,875,340 | | | | 100.06 | % |
| | | | | | | | | | | | | | | | | | | | | | | | | | | | | | | | | | | | |
The accompanying notes are an integral part of these financial statements.
| | | | |
| 12 | | Wells Fargo Diversified Equity Fund | | Statement of assets and liabilities—May 31, 2019 |
| | | | |
| | | | |
| |
Assets | | | | |
Investments in affiliated Master Portfolios, at value (cost $139,101,893) | | $ | 150,875,340 | |
Receivable for Fund shares sold | | | 72,776 | |
Prepaid expenses and other assets | | | 24,468 | |
| | | | |
Total assets | | | 150,972,584 | |
| | | | |
| |
Liabilities | | | | |
Payable for Fund shares redeemed | | | 99,952 | |
Shareholder servicing fees payable | | | 40,652 | |
Administration fees payable | | | 23,266 | |
Custodian and accounting fees payable | | | 15,762 | |
Management fee payable | | | 9,384 | |
Distribution fee payable | | | 999 | |
Professional fees payable | | | 364 | |
| | | | |
Total liabilities | | | 190,379 | |
| | | | |
Total net assets | | $ | 150,782,205 | |
| | | | |
| |
NET ASSETS CONSIST OF | | | | |
Paid-in capital | | $ | 136,349,904 | |
Total distributable earnings | | | 14,432,301 | |
| | | | |
Total net assets | | $ | 150,782,205 | |
| | | | |
| |
COMPUTATION OF NET ASSET VALUE AND OFFERING PRICE PER SHARE | | | | |
Net assets – Class A | | $ | 61,691,580 | |
Shares outstanding – Class A1 | | | 2,888,311 | |
Net asset value per share – Class A | | | $21.36 | |
Maximum offering price per share – Class A2 | | | $22.66 | |
Net assets – Class C | | $ | 1,425,479 | |
Shares outstanding – Class C1 | | | 77,252 | |
Net asset value per share – Class C | | | $18.45 | |
Net assets – Administrator Class | | $ | 87,665,146 | |
Shares outstanding – Administrator Class1 | | | 4,082,800 | |
Net asset value per share – Administrator Class | | | $21.47 | |
| 1 | The Fund has an unlimited number of authorized shares. |
| 2 | Maximum offering price is computed as 100/94.25 of net asset value. On investments of $50,000 or more, the offering price is reduced. |
The accompanying notes are an integral part of these financial statements.
| | | | | | |
| Statement of operations—year ended May 31, 2019 | | Wells Fargo Diversified Equity Fund | | | 13 | |
| | | | |
| | | | |
| |
Investment income | | | | |
Dividends allocated from affiliated Master Portfolios (net of foreign withholding taxes of $119,989) | | $ | 3,178,315 | |
Affiliated income allocated from affiliated Master Portfolios | | | 98,413 | |
Interest allocated from affiliated Master Portfolios | | | 3,204 | |
Expenses allocated from affiliated Master Portfolios | | | (876,143 | ) |
Waivers allocated from affiliated Master Portfolios | | | 49,071 | |
| | | | |
Total investment income | | | 2,452,860 | |
| | | | |
| |
Expenses | | | | |
Management fee | | | 492,329 | |
Administration fees | | | | |
Class A | | | 140,025 | |
Class C | | | 4,242 | |
Administrator Class | | | 124,035 | |
Shareholder servicing fees | | | | |
Class A | | | 166,696 | |
Class C | | | 5,050 | |
Administrator Class | | | 237,831 | |
Distribution fee | | | | |
Class C | | | 15,145 | |
Custody and accounting fees | | | 8,874 | |
Professional fees | | | 27,397 | |
Registration fees | | | 67,308 | |
Shareholder report expenses | | | 31,100 | |
Trustees’ fees and expenses | | | 21,586 | |
Other fees and expenses | | | 12,983 | |
| | | | |
Total expenses | | | 1,354,601 | |
Less: Fee waivers and/or expense reimbursements | | | (354,079 | ) |
| | | | |
Net expenses | | | 1,000,522 | |
| | | | |
Net investment income | | | 1,452,338 | |
| | | | |
| |
REALIZED AND UNREALIZED GAINS (LOSSES) ON INVESTMENTS | | | | |
Net realized gains on securities transactions allocated from affiliated Master Portfolios | | | 14,956,526 | |
Net change in unrealized gains (losses) on securities transactions allocated from affiliated Master Portfolios | | | (17,110,620 | ) |
| | | | |
Net realized and unrealized gains (losses) on investments | | | (2,154,094 | ) |
| | | | |
Net decrease in net assets resulting from operations | | $ | (701,756 | ) |
| | | | |
The accompanying notes are an integral part of these financial statements.
| | | | |
| 14 | | Wells Fargo Diversified Equity Fund | | Statement of changes in net assets |
| | | | | | | | | | | | | | | | |
| | | Year ended
May 31, 2019 | | | Year ended
May 31, 20181 | |
| | | | |
Operations | | | | | | | | | | | | | | | | |
Net investment income | | | | | | $ | 1,452,338 | | | | | | | $ | 1,206,178 | |
Net realized gains on investments | | | | | | | 14,956,526 | | | | | | | | 35,307,459 | |
Net change in unrealized gains (losses) on investments | | | | | | | (17,110,620 | ) | | | | | | | (11,548,765 | ) |
| | | | |
Net increase (decrease) in net assets resulting from operations | | | | | | | (701,756 | ) | | | | | | | 24,964,872 | |
| | | | |
| | | | |
Distributions to shareholders from net investment income and net realized gains | | | | | | | | | | | | | | | | |
Class A | | | | | | | (11,767,492 | ) | | | | | | | (15,394,697 | ) |
Class C | | | | | | | (402,680 | ) | | | | | | | (556,741 | ) |
Administrator Class | | | | | | | (17,449,901 | ) | | | | | | | (22,994,201 | ) |
| | | | |
Total distributions to shareholders | | | | | | | (29,620,073 | ) | | | | | | | (38,945,639 | ) |
| | | | |
| | | | |
Capital share transactions | | | Shares | | | | | | | | Shares | | | | | |
Proceeds from shares sold | | | | | | | | | | | | | | | | |
Class A | | | 139,473 | | | | 3,178,936 | | | | 55,115 | | | | 1,529,167 | |
Class C | | | 53,240 | | | | 885,112 | | | | 5,348 | | | | 134,858 | |
Administrator Class | | | 235,991 | | | | 5,636,176 | | | | 235,053 | | | | 6,684,802 | |
| | | | |
| | | | |
| | | | | | | 9,700,224 | | | | | | | | 8,348,827 | |
| | | | |
Reinvestment of distributions | | | | | | | | | | | | | | | | |
Class A | | | 570,354 | | | | 11,702,541 | | | | 592,560 | | | | 15,300,796 | |
Class C | | | 22,549 | | | �� | 399,109 | | | | 23,873 | | | | 547,166 | |
Administrator Class | | | 839,325 | | | | 17,324,595 | | | | 878,963 | | | | 22,817,521 | |
| | | | |
| | | | |
| | | | | | | 29,426,245 | | | | | | | | 38,665,483 | |
| | | | |
Payment for shares redeemed | | | | | | | | | | | | | | | | |
Class A | | | (456,015 | ) | | | (10,838,098 | ) | | | (351,795 | ) | | | (9,977,926 | ) |
Class C | | | (93,775 | ) | | | (1,785,908 | ) | | | (21,669 | ) | | | (542,415 | ) |
Administrator Class | | | (702,090 | ) | | | (16,078,144 | ) | | | (1,474,444 | ) | | | (42,759,421 | ) |
| | | | |
| | | | |
| | | | | | | (28,702,150 | ) | | | | | | | (53,279,762 | ) |
| | | | |
Net increase (decrease) in net assets resulting from capital share transactions | | | | | | | 10,424,319 | | | | | | | | (6,265,452 | ) |
| | | | |
Total decrease in net assets | | | | | | | (19,897,510 | ) | | | | | | | (20,246,219 | ) |
| | | | |
| | | | |
Net assets | | | | | | | | | | | | | | | | |
Beginning of period | | | | | | | 170,679,715 | | | | | | | | 190,925,934 | |
| | | | |
End of period | | | | | | $ | 150,782,205 | | | | | | | $ | 170,679,715 | |
| | | | |
| 1 | Effective for all filings after November 4, 2018, the SEC prospectively eliminated the requirement to parenthetically disclose undistributed net investment income at the end of the period and permitted the aggregation of distributions, with the exception of tax basis returns of capital. Overdistributed net investment income at May 31, 2018 was $230,980. The disaggregated distributions information for the year ended May 31, 2018 is included in Note 7,Distributions to Shareholders, in the notes to the financial statements. |
The accompanying notes are an integral part of these financial statements.
| | | | | | |
| Financial highlights | | Wells Fargo Diversified Equity Fund | | | 15 | |
(For a share outstanding throughout each period)
| | | | | | | | | | | | | | | | | | | | |
| | | Year ended May 31 | |
| CLASS A | | 2019 | | | 2018 | | | 2017 | | | 2016 | | | 2015 | |
Net asset value, beginning of period | | | $26.48 | | | | $29.37 | | | | $27.30 | | | | $32.37 | | | | $32.78 | |
Net investment income | | | 0.18 | 1 | | | 0.16 | 1 | | | 0.13 | | | | 0.16 | | | | 0.14 | |
Net realized and unrealized gains (losses) on investments | | | (0.55 | ) | | | 3.93 | | | | 3.94 | | | | (1.55 | ) | | | 2.79 | |
| | | | | | | | | | | | | | | | | | | | |
Total from investment operations | | | (0.37 | ) | | | 4.09 | | | | 4.07 | | | | (1.39 | ) | | | 2.93 | |
Distributions to shareholders from | | | | | | | | | | | | |
Net investment income | | | (0.13 | ) | | | (0.17 | ) | | | (0.22 | ) | | | (0.08 | ) | | | (0.15 | ) |
Net realized gains | | | (4.62 | ) | | | (6.81 | ) | | | (1.78 | ) | | | (3.60 | ) | | | (3.19 | ) |
| | | | | | | | | | | | | | | | | | | | |
Total distributions to shareholders | | | (4.75 | ) | | | (6.98 | ) | | | (2.00 | ) | | | (3.68 | ) | | | (3.34 | ) |
Net asset value, end of period | | | $21.36 | | | | $26.48 | | | | $29.37 | | | | $27.30 | | | | $32.37 | |
Total return2 | | | (0.57 | )% | | | 14.68 | % | | | 15.59 | % | | | (4.24 | )% | | | 9.39 | % |
Ratios to average net assets (annualized) | | | | | | | | | | | | |
Gross expenses3 | | | 1.37 | % | | | 1.38 | % | | | 1.40 | % | | | 1.41 | % | | | 1.44 | % |
Net expenses3 | | | 1.25 | % | | | 1.25 | % | | | 1.25 | % | | | 1.25 | % | | | 1.25 | % |
Net investment income3 | | | 0.75 | % | | | 0.55 | % | | | 0.63 | % | | | 0.60 | % | | | 0.44 | % |
Supplemental data | | | | | | | | | | | | |
Portfolio turnover rate4 | | | 91 | % | | | 70 | % | | | 90 | % | | | 39 | % | | | 38 | % |
Net assets, end of period (000s omitted) | | | $61,692 | | | | $69,766 | | | | $68,678 | | | | $67,597 | | | | $81,502 | |
| 1 | Calculated based upon average shares outstanding |
| 2 | Total return calculations do not include any sales charges. |
| 3 | Ratios include net expenses allocated from the affiliated Master Portfolios which were as follows: |
| | | | |
Year ended May 31, 2019 | | | 0.50 | % |
Year ended May 31, 2018 | | | 0.53 | % |
Year ended May 31, 2017 | | | 0.57 | % |
Year ended May 31, 2016 | | | 0.59 | % |
Year ended May 31, 2015 | | | 0.59 | % |
| 4 | Portfolio turnover rate is calculated by multiplying each affiliated Master Portfolio’s percentage of the Fund’s total investments in securities at the end of the period by the respective affiliated Master Portfolio’s portfolio turnover rate. |
The accompanying notes are an integral part of these financial statements.
| | | | |
| 16 | | Wells Fargo Diversified Equity Fund | | Financial highlights |
(For a share outstanding throughout each period)
| | | | | | | | | | | | | | | | | | | | |
| | | Year ended May 31 | |
| CLASS C | | 2019 | | | 2018 | | | 2017 | | | 2016 | | | 2015 | |
Net asset value, beginning of period | | | $23.58 | | | | $26.86 | | | | $25.12 | | | | $30.22 | | | | $30.88 | |
Net investment loss | | | (0.01 | )1 | | | (0.05 | )1 | | | (0.03 | )1 | | | (0.05 | )1 | | | (0.12 | ) |
Net realized and unrealized gains (losses) on investments | | | (0.50 | ) | | | 3.58 | | | | 3.57 | | | | (1.45 | ) | | | 2.65 | |
| | | | | | | | | | | | | | | | | | | | |
Total from investment operations | | | (0.51 | ) | | | 3.53 | | | | 3.54 | | | | (1.50 | ) | | | 2.53 | |
Distributions to shareholders from | | | | | | | | | | | | |
Net investment income | | | 0.00 | | | | (0.00 | )2 | | | (0.02 | ) | | | 0.00 | | | | 0.00 | |
Net realized gains | | | (4.62 | ) | | | (6.81 | ) | | | (1.78 | ) | | | (3.60 | ) | | | (3.19 | ) |
| | | | | | | | | | | | | | | | | | | | |
Total distributions to shareholders | | | (4.62 | ) | | | (6.81 | ) | | | (1.80 | ) | | | (3.60 | ) | | | (3.19 | ) |
Net asset value, end of period | | | $18.45 | | | | $23.58 | | | | $26.86 | | | | $25.12 | | | | $30.22 | |
Total return3 | | | (1.34 | )% | | | 13.89 | % | | | 14.71 | % | | | (4.96 | )% | | | 8.58 | % |
Ratios to average net assets (annualized) | | | | | | | | | | | | |
Gross expenses4 | | | 2.11 | % | | | 2.13 | % | | | 2.15 | % | | | 2.16 | % | | | 2.19 | % |
Net expenses4 | | | 2.00 | % | | | 2.00 | % | | | 2.00 | % | | | 2.00 | % | | | 2.00 | % |
Net investment loss4 | | | (0.04 | )% | | | (0.21 | )% | | | (0.13 | )% | | | (0.17 | )% | | | (0.31 | )% |
Supplemental data | | | | | | | | | | | | |
Portfolio turnover rate5 | | | 91 | % | | | 70 | % | | | 90 | % | | | 39 | % | | | 38 | % |
Net assets, end of period (000s omitted) | | | $1,425 | | | | $2,245 | | | | $2,355 | | | | $2,846 | | | | $4,165 | |
| 1 | Calculated based upon average shares outstanding |
| 2 | Amount is less than $0.005. |
| 3 | Total return calculations do not include any sales charges. |
| 4 | Ratios include net expenses allocated from the affiliated Master Portfolios which were as follows: |
| | | | |
Year ended May 31, 2019 | | | 0.50 | % |
Year ended May 31, 2018 | | | 0.53 | % |
Year ended May 31, 2017 | | | 0.57 | % |
Year ended May 31, 2016 | | | 0.59 | % |
Year ended May 31, 2015 | | | 0.59 | % |
| 5 | Portfolio turnover rate is calculated by multiplying each affiliated Master Portfolio’s percentage of the Fund’s total investments in securities at the end of the period by the respective affiliated Master Portfolio’s portfolio turnover rate. |
The accompanying notes are an integral part of these financial statements.
| | | | | | |
| Financial highlights | | Wells Fargo Diversified Equity Fund | | | 17 | |
(For a share outstanding throughout each period)
| | | | | | | | | | | | | | | | | | | | |
| | | Year ended May 31 | |
| ADMINISTRATOR CLASS | | 2019 | | | 2018 | | | 2017 | | | 2016 | | | 2015 | |
Net asset value, beginning of period | | | $26.60 | | | | $29.46 | | | | $27.38 | | | | $32.45 | | | | $32.84 | |
Net investment income | | | 0.24 | 1 | | | 0.23 | 1 | | | 0.24 | 1 | | | 0.24 | | | | 0.22 | 1 |
Net realized and unrealized gains (losses) on investments | | | (0.57 | ) | | | 3.95 | | | | 3.91 | | | | (1.55 | ) | | | 2.81 | |
| | | | | | | | | | | | | | | | | | | | |
Total from investment operations | | | (0.33 | ) | | | 4.18 | | | | 4.15 | | | | (1.31 | ) | | | 3.03 | |
Distributions to shareholders from | | | | | | | | | | | | |
Net investment income | | | (0.18 | ) | | | (0.23 | ) | | | (0.29 | ) | | | (0.16 | ) | | | (0.23 | ) |
Net realized gains | | | (4.62 | ) | | | (6.81 | ) | | | (1.78 | ) | | | (3.60 | ) | | | (3.19 | ) |
| | | | | | | | | | | | | | | | | | | | |
Total distributions to shareholders | | | (4.80 | ) | | | (7.04 | ) | | | (2.07 | ) | | | (3.76 | ) | | | (3.42 | ) |
Net asset value, end of period2 | | | $21.47 | | | | $26.60 | | | | $29.46 | | | | $27.38 | | | | $32.45 | |
Total return | | | (0.35 | )% | | | 14.99 | % | | | 15.86 | % | | | (3.98 | )% | | | 9.65 | % |
Ratios to average net assets (annualized) | | | | | | | | | | | | |
Gross expenses2 | | | 1.29 | % | | | 1.30 | % | | | 1.32 | % | | | 1.33 | % | | | 1.28 | % |
Net expenses2 | | | 1.00 | % | | | 1.00 | % | | | 1.00 | % | | | 1.00 | % | | | 1.00 | % |
Net investment income2 | | | 1.00 | % | | | 0.79 | % | | | 0.87 | % | | | 0.85 | % | | | 0.67 | % |
Supplemental data | | | | | | | | | | | | |
Portfolio turnover rate3 | | | 91 | % | | | 70 | % | | | 90 | % | | | 39 | % | | | 38 | % |
Net assets, end of period (000s omitted) | | | $87,665 | | | | $98,668 | | | | $119,893 | | | | $140,963 | | | | $167,371 | |
| 1 | Calculated based upon average shares outstanding |
| 2 | Ratios include net expenses allocated from the affiliated Master Portfolios which were as follows: |
| | | | |
Year ended May 31, 2019 | | | 0.50 | % |
Year ended May 31, 2018 | | | 0.53 | % |
Year ended May 31, 2017 | | | 0.57 | % |
Year ended May 31, 2016 | | | 0.59 | % |
Year ended May 31, 2015 | | | 0.59 | % |
| 3 | Portfolio turnover rate is calculated by multiplying each affiliated Master Portfolio’s percentage of the Fund’s total investments in securities at the end of the period by the respective affiliated Master Portfolio’s portfolio turnover rate. |
The accompanying notes are an integral part of these financial statements.
| | | | |
| 18 | | Wells Fargo Diversified Equity Fund | | Notes to financial statements |
1. ORGANIZATION
Wells Fargo Funds Trust (the “Trust”), a Delaware statutory trust organized on March 10, 1999, is an open-end management investment company registered under the Investment Company Act of 1940, as amended (the “1940 Act”). As an investment company, the Trust follows the accounting and reporting guidance in Financial Accounting Standards Board (“FASB”) Accounting Standards Codification Topic 946, Financial Services – Investment Companies. These financial statements report on the Wells Fargo Diversified Equity Fund (the “Fund”) which is a diversified series of the Trust.
The Fund is a fund-of-funds that invests in various affiliated mutual funds employing a multi-style equity investment approach designed to reduce the price and return volatility of the Fund and to provide more consistent returns. The Fund invests in multiple diversified portfolios (collectively, the “affiliated Master Portfolios”) of Wells Fargo Master Trust, a registered open-end management investment company. Each affiliated Master Portfolio directly acquires portfolio securities, and the Fund acquires an indirect interest in those securities. The Fund accounts for its investment in the affiliated Master Portfolios as partnership investments and records on a daily basis its share of each affiliated Master Portfolio’s income, expense and realized and unrealized gains and losses. The financial statements of the affiliated Master Portfolios are presented in separate financial statements and may be obtained free of charge by contacting Investor Services or by visiting the SEC website at sec.gov. The financial statements of the affiliated Master Portfolios are filed with the SEC under Wells Fargo Master Trust.
2. SIGNIFICANT ACCOUNTING POLICIES
The following significant accounting policies, which are consistently followed in the preparation of the financial statements of the Fund, are in conformity with U.S. generally accepted accounting principles which require management to make estimates and assumptions that affect the reported amounts of assets and liabilities, disclosure of contingent assets and liabilities at the date of the financial statements, and the reported amounts of revenues and expenses during the reporting period. Actual results could differ from those estimates.
Securities valuation
All investments are valued each business day as of the close of regular trading on the New York Stock Exchange (generally 4 p.m. Eastern Time), although the Fund may deviate from this calculation time under unusual or unexpected circumstances.
Investments in the affiliated Master Portfolios are valued daily based on the Fund’s proportionate share of each affiliated Master Portfolio’s net assets, which are also valued daily.
Investment transactions, income and expenses
Investments in the affiliated Master Portfolios are recorded on a trade basis. The Fund records daily its proportionate share of each affiliated Master Portfolio’s interest and dividend income, expenses, and realized and unrealized gains or losses. The Fund also accrues its own expenses.
Distributions to shareholders
Distributions to shareholders from net investment income and any net realized gains are recorded on the ex-dividend date and paid at least annually. Such distributions are determined in accordance with income tax regulations and may differ from U.S. generally accepted accounting principles. Dividend sources are estimated at the time of declaration. The tax character of distributions is determined as of the Fund’s fiscal year end. Therefore, a portion of the Fund’s distributions made prior to the Fund’s fiscal year end may be categorized as a tax return of capital at year end.
Federal and other taxes
The Fund intends to continue to qualify as a regulated investment company by distributing substantially all of its investment company taxable income and any net realized capital gains (after reduction for capital loss carryforwards) sufficient to relieve it from all, or substantially all, federal income taxes. Accordingly, no provision for federal income taxes was required.
The Fund’s income and federal excise tax returns and all financial records supporting those returns for the prior three fiscal years are subject to examination by the federal and Delaware revenue authorities. Management has analyzed the Fund’s tax positions taken on federal, state, and foreign tax returns for all open tax years and does not believe that there are any uncertain tax positions that require recognition of a tax liability.
| | | | | | |
| Notes to financial statements | | Wells Fargo Diversified Equity Fund | | | 19 | |
As of May 31, 2019, the aggregate cost of all investments for federal income tax purposes was $14,560,855 and the unrealized gains (losses) consisted of:
| | | | |
| |
Gross unrealized gains | | $ | 5,314,485 | |
| |
Gross unrealized losses | | | 0 | |
| |
Net unrealized gains | | $ | 5,314,485 | |
As of May 31, 2019, the Fund had current year deferred post-October capital losses consisting of $719,989 in short-term losses which will be recognized on the first day of the following fiscal year.
Class allocations
The separate classes of shares offered by the Fund differ principally in applicable sales charges, distribution, shareholder servicing, and administration fees. Class specific expenses are charged directly to that share class. Investment income, common expenses, and realized and unrealized gains (losses) on investments are allocated daily to each class of shares based on the relative proportion of net assets of each class.
3. FAIR VALUATION MEASUREMENTS
At May 31, 2019, the affiliated Master Portfolios were measured at fair value using the net asset value per share (or its equivalent) as a practical expedient. The aggregate value of the affiliated Master Portfolios was $150,875,340. The investment objective of each affiliated Master Portfolio is as follows:
| | |
| |
| Affiliated Master Portfolio | | Investment objective |
| |
Wells Fargo C&B Large Cap Value Portfolio | | Seeks maximum long-term total return (current income and capital appreciation), consistent with minimizing risk to principal |
| |
Wells Fargo Diversified Large Cap Growth Portfolio | | Seeks long-term capital appreciation |
| |
Wells Fargo Emerging Growth Portfolio | | Seeks long-term capital appreciation |
| |
Wells Fargo Index Portfolio | | Seeks to replicate the total return of the S&P 500 Index, before fees and expenses |
| |
Wells Fargo International Growth Portfolio | | Seeks long-term capital appreciation |
| |
Wells Fargo International Value Portfolio | | Seeks long-term capital appreciation |
| |
Wells Fargo Large Company Value Portfolio | | Seeks long-term capital appreciation |
| |
Wells Fargo Small Company Growth Portfolio | | Seeks long-term capital appreciation |
| |
Wells Fargo Small Company Value Portfolio | | Seeks long-term capital appreciation |
The affiliated Master Portfolios do not have a redemption period notice, can be redeemed daily and do not have any unfunded commitments.
4. TRANSACTIONS WITH AFFILIATES
Management fee
Wells Fargo Funds Management, LLC (“Funds Management”), an indirect wholly owned subsidiary of Wells Fargo & Company (“Wells Fargo”), is the manager of the Fund and provides advisory and fund-level administrative services under an investment management agreement. Under the investment management agreement, Funds Management is responsible for, among other services, implementing the investment objectives and strategies of the Fund and providing fund-level administrative services in connection with the Fund’s operations. As compensation for its services under the investment management agreement, Funds Management is entitled to receive a management fee at the following annual rate based on the Fund’s average daily net assets:
| | | | |
| Average daily net assets | | Management fee | |
| |
First $500 million | | | 0.30 | % |
| |
Next $500 million | | | 0.28 | |
| |
Next $2 billion | | | 0.26 | |
| |
Next $2 billion | | | 0.24 | |
| |
Next $5 billion | | | 0.23 | |
| |
Over $10 billion | | | 0.22 | |
| | | | |
| 20 | | Wells Fargo Diversified Equity Fund | | Notes to financial statements |
For the year ended May 31, 2019, the management fee was equivalent to an annual rate of 0.30% of the Fund’s average daily net assets.
Funds Management also serves as the adviser to each affiliated Master Portfolio and is entitled to receive a fee from each affiliated Master Portfolio for those services.
Administration fees
Under a class-level administration agreement, Funds Management provides class-level administrative services to the Fund, which includes paying fees and expenses for services provided by the transfer agent, sub-transfer agents, omnibus account servicers and record-keepers. As compensation for its services under the class-level administration agreement, Funds Management receives an annual fee which is calculated based on the average daily net assets of each class as follows:
| | | | |
| | | Class-level
administration fee | |
| |
Class A, Class C | | | 0.21 | % |
| |
Administrator Class | | | 0.13 | |
Funds Management has contractually waived and/or reimbursed management and administration fees to the extent necessary to maintain certain net operating expense ratios for the Fund. When each class of the Fund has exceeded its expense cap, Funds Management has waived fees and/or reimbursed expenses from fund level expenses on a proportionate basis and then from class specific expenses. When only certain classes exceed their expense caps, waivers and/or reimbursements are applied against class specific expenses before fund level expenses. Net expenses from the affiliated Master Portfolios are included in the expense caps. Funds Management has committed through September 30, 2019 to waive fees and/or reimburse expenses to the extent necessary to cap the Fund’s expenses at 1.25% for Class A shares, 2.00% for Class C shares, and 1.00% for Administrator Class shares. Prior to or after the commitment expiration date, the cap may be increased or the commitment to maintain the cap may be terminated only with the approval of the Board of Trustees.
Distribution fee
The Trust has adopted a distribution plan for Class C shares of the Fund pursuant to Rule 12b-1 under the 1940 Act. A distribution fee is charged to Class C shares and paid to Wells Fargo Funds Distributor, LLC (“Funds Distributor”), the principal underwriter, at an annual rate of 0.75% of the average daily net assets of Class C shares.
In addition, Funds Distributor is entitled to receive the front-end sales charge from the purchase of Class A shares and a contingent deferred sales charge on the redemption of certain Class A shares. Funds Distributor is also entitled to receive the contingent deferred sales charges from redemptions of Class C shares. For the year ended May 31, 2019, Funds Distributor received $2,456 from the sale of Class A shares. No contingent deferred sales charges were incurred by Class A and Class C shares for the year ended May 31, 2019.
Shareholder servicing fees
The Trust has entered into contracts with one or more shareholder servicing agents, whereby Class A, Class C, and Administrator Class of the Fund are charged a fee at an annual rate of 0.25% of the average daily net assets of each respective class. A portion of these total shareholder servicing fees were paid to affiliates of Wells Fargo.
5. INVESTMENT PORTFOLIO TRANSACTIONS
The Fund seeks to achieve its investment objective by investing substantially all of its investable assets in multiple affiliated Master Portfolios. Purchases and sales related to these investments have been calculated by aggregating the results of multiplying the Fund’s ownership percentage in the respective affiliated Master Portfolio by the corresponding affiliated Master Portfolio’s purchases and sales. Purchases and sales of investments, excluding U.S. government obligations (if any) and short-term securities, for the year ended May 31, 2019 were $208,257,256 and $169,276,746, respectively.
6. BANK BORROWINGS
The Trust (excluding the money market funds), Wells Fargo Master Trust and Wells Fargo Variable Trust are parties to a $280,000,000 revolving credit agreement whereby the Fund is permitted to use bank borrowings for temporary or emergency purposes, such as to fund shareholder redemption requests. Interest under the credit agreement is charged to the Fund based on a borrowing rate equal to the higher of the Federal Funds rate in effect on that day plus 1.25% or the overnight LIBOR rate in effect on that day plus 1.25%. In addition, an annual commitment fee equal to 0.25% of the unused balance is allocated to each participating fund.
| | | | | | |
| Notes to financial statements | | Wells Fargo Diversified Equity Fund | | | 21 | |
For the year ended May 31, 2019, there were no borrowings by the Fund under the agreement.
7. DISTRIBUTIONS TO SHAREHOLDERS
The tax character of distributions paid during the years ended May 31, 2019 and May 31, 2018 were as follows:
| | | | | | | | |
| | | Year ended May 31 | |
| | |
| | | 2019 | | | 2018 | |
| | |
Ordinary income | | $ | 5,593,514 | | | $ | 5,645,545 | |
| | |
Long-term capital gain | | | 24,026,559 | | | | 33,300,094 | |
As of May 31, 2019, the components of distributable earnings on a tax basis were as follows:
| | | | | | |
Undistributed ordinary income | | Undistributed long-term gain | | Unrealized gains | | Post-October capital losses deferred |
| | | |
| $794,132 | | $9,043,673 | | $5,314,485 | | $(719,989) |
Effective for all filings after November 4, 2018, the Securities and Exchange Commission eliminated the requirement to separately state the components of distributions to shareholders under U.S. generally accepted accounting principles. The amounts of distributions to shareholders for the year ended May 31, 2018 were as follows:
| | | | | | | | |
| | | Net investment income | | | Net realized gains | |
| | |
Class A | | | $460,860 | | | | $14,933,837 | |
| | |
Class C | | | 406 | | | | 556,335 | |
| | |
Administrator Class | | | 931,700 | | | | 22,062,501 | |
8. INDEMNIFICATION
Under the Trust’s organizational documents, the officers and Trustees have been granted certain indemnification rights against certain liabilities that may arise out of performance of their duties to the Trust. Additionally, in the normal course of business, the Trust may enter into contracts with service providers that contain a variety of indemnification clauses. The Trust’s maximum exposure under these arrangements is dependent on future claims that may be made against the Fund and, therefore, cannot be estimated.
9. NEW ACCOUNTING PRONOUNCEMENT
In August 2018, FASB issued Accounting Standards Update (“ASU”) No. 2018-13, Fair Value Measurement (Topic 820)Disclosure Framework—Changes to the Disclosure Requirements for Fair Value Measurement. ASU 2018-13 updates the disclosure requirements for fair value measurements by modifying or removing certain disclosures and adding certain new disclosures. The amendments are effective for fiscal years, and interim periods within those fiscal years, beginning after December 15, 2019. Early adoption is permitted. Management has adopted the removal and modification of disclosures early, as permitted, and will adopt the additional new disclosures at the effective date.
| | | | |
| 22 | | Wells Fargo Diversified Equity Fund | | Report of independent registered public accounting firm |
TO THE SHAREHOLDERS OF THE FUND AND BOARD OF TRUSTEES OF WELLS FARGO FUNDS TRUST:
Opinion on the Financial Statements
We have audited the accompanying statement of assets and liabilities of Wells Fargo Diversified Equity Fund (the Fund), one of the funds constituting Wells Fargo Funds Trust, including the portfolio of investments, as of May 31, 2019, the related statement of operations for the year then ended, the statements of changes in net assets for each of the years in the two-year period then ended, and the related notes (collectively, the financial statements) and the financial highlights for each of the years in the five-year period then ended. In our opinion, the financial statements and financial highlights present fairly, in all material respects, the financial position of the Fund as of May 31, 2019, the results of its operations for the year then ended, the changes in its net assets for each of the years in the two-year period then ended, and the financial highlights for each of the years in the five-year period then ended, in conformity with U.S. generally accepted accounting principles.
Basis for Opinion
These financial statements and financial highlights are the responsibility of the Fund’s management. Our responsibility is to express an opinion on these financial statements and financial highlights based on our audits. We are a public accounting firm registered with the Public Company Accounting Oversight Board (United States) (PCAOB) and are required to be independent with respect to the Fund in accordance with the U.S. federal securities laws and the applicable rules and regulations of the Securities and Exchange Commission and the PCAOB.
We conducted our audits in accordance with the standards of the PCAOB. Those standards require that we plan and perform the audit to obtain reasonable assurance about whether the financial statements and financial highlights are free of material misstatement, whether due to error or fraud. Our audits included performing procedures to assess the risks of material misstatement of the financial statements and financial highlights, whether due to error or fraud, and performing procedures that respond to those risks. Such procedures included examining, on a test basis, evidence regarding the amounts and disclosures in the financial statements and financial highlights. Such procedures also included confirmation of securities owned as of May 31, 2019, by correspondence with the transfer agent. Our audits also included evaluating the accounting principles used and significant estimates made by management, as well as evaluating the overall presentation of the financial statements and financial highlights. We believe that our audits provide a reasonable basis for our opinion.

We have not been able to determine the specific year that we began serving as the auditor of one or more Wells Fargo Funds investment companies; however we are aware that we have served as the auditor of one or more Wells Fargo Funds investment companies since at least 1955.
Boston, Massachusetts
July 26, 2019
| | | | | | |
| Other information (unaudited) | | Wells Fargo Diversified Equity Fund | | | 23 | |
TAX INFORMATION
For corporate shareholders, pursuant to Section 854 of the Internal Revenue Code, 48.54% of ordinary income dividends qualify for the corporate dividends-received deduction for the fiscal year ended May 31, 2019.
Pursuant to Section 852 of the Internal Revenue Code, $24,026,559 was designated as a 20% rate gain distribution for the fiscal year ended May 31, 2019.
Pursuant to Section 854 of the Internal Revenue Code, $3,759,582 of income dividends paid during the fiscal year ended May 31, 2019 has been designated as qualified dividend income (QDI).
For the fiscal year ended May 31, 2019, $28,576 has been designated as interest-related dividends for nonresident alien shareholders pursuant to Section 871 of the Internal Revenue Code.
For the fiscal year ended May 31, 2019, $4,410,221 has been designated as short-term capital gain dividends for nonresident alien shareholders pursuant to Section 871 of the Internal Revenue Code.
PROXY VOTING INFORMATION
A description of the policies and procedures used to determine how to vote proxies relating to portfolio securities is available, upon request, by calling1-800-222-8222, visiting our website atwfam.com, or visiting the SEC website at sec.gov. Information regarding how the proxies related to portfolio securities were voted during the most recent12-month period ended June 30 is available on the website atwfam.com or by visiting the SEC website at sec.gov.
QUARTERLY PORTFOLIO HOLDINGS
The Fund files its complete schedule of portfolio holdings with the SEC for the first and third quarters of each fiscal year on Form N-Q, which is available by visiting the SEC website at sec.gov. Those forms may be reviewed and copied at the SEC’s Public Reference Room in Washington, DC. Information on the operation of the Public Reference Room may be obtained by calling 1-800-SEC-0330.
| | | | |
| 24 | | Wells Fargo Diversified Equity Fund | | Other information (unaudited) |
BOARD OF TRUSTEES AND OFFICERS
Each of the Trustees and Officers1 listed in the table below acts in identical capacities for each fund in the Wells Fargo family of funds, which consists of 151 mutual funds comprising the Wells Fargo Funds Trust, Wells Fargo Variable Trust, Wells Fargo Master Trust and four closed-end funds (collectively the “Fund Complex”). This table should be read in conjunction with the Prospectus and the Statement of Additional Information2. The mailing address of each Trustee and Officer is 525 Market Street, 12th Floor, San Francisco, CA 94105. Each Trustee and Officer serves an indefinite term, however, each Trustee serves such term until reaching the mandatory retirement age established by the Trustees.
Independent Trustees
| | | | | | |
Name and year of birth | | Position held and length of service* | | Principal occupations during past five years or longer | | Current other public company or
investment company
directorships |
| | | |
William R. Ebsworth (Born 1957) | | Trustee, since 2015 | | Retired. From 1984 to 2013, equities analyst, portfolio manager, research director and chief investment officer at Fidelity Management and Research Company in Boston, Tokyo, and Hong Kong, and retired in 2013 as Chief Investment Officer of Fidelity Strategic Advisers, Inc. where he led a team of investment professionals managing client assets. Prior thereto, Board member of Hong Kong Securities Clearing Co., Hong Kong Options Clearing Corp., the Thailand International Fund, Ltd., Fidelity Investments Life Insurance Company, and Empire Fidelity Investments Life Insurance Company. Audit Committee Chair and Investment Committee Chair of the Vincent Memorial Hospital Endowment (non-profit organization). Mr. Ebsworth is a CFA® charterholder. | | N/A |
| | | |
Jane A. Freeman (Born 1953) | | Trustee, since 2015; Chair Liaison, since 2018 | | Retired. From 2012 to 2014 and 1999 to 2008, Chief Financial Officer of Scientific Learning Corporation. From 2008 to 2012, Ms. Freeman provided consulting services related to strategic business projects. Prior to 1999, Portfolio Manager at Rockefeller & Co. and Scudder, Stevens & Clark. Board member of the Harding Loevner Funds from 1996 to 2014, serving as both Lead Independent Director and chair of the Audit Committee. Board member of the Russell Exchange Traded Funds Trust from 2011 to 2012 and the chair of the Audit Committee. Ms. Freeman is a Board Member of The Ruth Bancroft Garden (non-profit organization). She is also an inactive Chartered Financial Analyst. | | N/A |
| | | |
Isaiah Harris, Jr. (Born 1952) | | Trustee, since 2009; Audit Committee Chairman, since 2019 | | Retired. Chairman of the Board of CIGNA Corporation since 2009, and Director since 2005. From 2003 to 2011, Director of Deluxe Corporation. Prior thereto, President and CEO of BellSouth Advertising and Publishing Corp. from 2005 to 2007, President and CEO of BellSouth Enterprises from 2004 to 2005 and President of BellSouth Consumer Services from 2000 to 2003. Emeritus member of the Iowa State University Foundation Board of Governors. Emeritus Member of the Advisory Board of Iowa State University School of Business. Advisory Board Member, Palm Harbor Academy (private school). Advisory Board Member, Child Evangelism Fellowship (non-profit). Mr. Harris is a certified public accountant (inactive status). | | CIGNA Corporation |
| | | |
Judith M. Johnson (Born 1949) | | Trustee, since 2008; Audit Committee Chairman, from 2009 to 2018 | | Retired. Prior thereto, Chief Executive Officer and Chief Investment Officer of Minneapolis Employees Retirement Fund from 1996 to 2008. Ms. Johnson is an attorney, certified public accountant and a certified managerial accountant. | | N/A |
| | | | | | |
| Other information (unaudited) | | Wells Fargo Diversified Equity Fund | | | 25 | |
| | | | | | |
Name and year of birth | | Position held and length of service* | | Principal occupations during past five years or longer | | Current other public company or
investment company
directorships |
| | | |
David F. Larcker (Born 1950) | | Trustee, since 2009 | | James Irvin Miller Professor of Accounting at the Graduate School of Business, Stanford University, Director of the Corporate Governance Research Initiative and Senior Faculty of The Rock Center for Corporate Governance since 2006. From 2005 to 2008, Professor of Accounting at the Graduate School of Business, Stanford University. Prior thereto, Ernst & Young Professor of Accounting at The Wharton School, University of Pennsylvania from 1985 to 2005. | | N/A |
| | | |
Olivia S. Mitchell (Born 1953) | | Trustee, since 2006; Nominating and Governance Committee Chairman, since 2018 | | International Foundation of Employee Benefit Plans Professor, Wharton School of the University of Pennsylvania since 1993. Director of Wharton’s Pension Research Council and Boettner Center on Pensions & Retirement Research, and Research Associate at the National Bureau of Economic Research. Previously, Cornell University Professor from 1978 to 1993. | | N/A |
| | | |
Timothy J. Penny (Born 1951) | | Trustee, since 1996; Chairman, since 2018 | | President and Chief Executive Officer of Southern Minnesota Initiative Foundation, a non-profit organization, since 2007. Member of the Board of Trustees of NorthStar Education Finance, Inc., a non-profit organization, since 2007. | | N/A |
| | | |
James G. Polisson (Born 1959) | | Trustee, since 2018 | | Retired. Chief Marketing Officer, Source (ETF) UK Services, Ltd, from 2015 to 2017. From 2012 to 2015, Principal of The Polisson Group, LLC, a management consulting, corporate advisory and principal investing company. Chief Executive Officer and Managing Director at Russell Investments, Global Exchange Traded Funds from 2010 to 2012. Managing Director of Barclays Global Investors from 1998 to 2010 and Global Chief Marketing Officer for iShares and Barclays Global Investors from 2000 to 2010. Trustee of the San Francisco Mechanics’ Institute, a non-profit organization, from 2013 to 2015. Board member of the Russell Exchange Traded Fund Trust from 2011 to 2012. Director of Barclays Global Investors Holdings Deutschland GmbH from 2006 to 2009. Mr. Polisson is an attorney and has a retired status with the Massachusetts and District of Columbia Bar Associations. | | N/A |
| * | Length of service dates reflect the Trustee’s commencement of service with the Trust’s predecessor entities, where applicable. |
| | | | |
| 26 | | Wells Fargo Diversified Equity Fund | | Other information (unaudited) |
Officers
| | | | | | |
Name and year of birth | | Position held and length of service | | Principal occupations during past five years or longer | | |
| | | |
Andrew Owen (Born 1960) | | President, since 2017 | | Executive Vice President of Wells Fargo & Company and Head of Affiliated Managers, Wells Fargo Asset Management, since 2014. In addition, Mr. Owen is currently President, Chief Executive Officer and Director of Wells Fargo Funds Management, LLC since 2017. Prior thereto, Executive Vice President responsible for marketing, investments and product development for Wells Fargo Funds Management, LLC, from 2009 to 2014. | | |
| | | |
Nancy Wiser1 (Born 1967) | | Treasurer, since 2012 | | Executive Vice President of Wells Fargo Funds Management, LLC since 2011. Chief Operating Officer and Chief Compliance Officer at LightBox Capital Management LLC, from 2008 to 2011. | | |
| | | |
Alexander Kymn (Born 1973) | | Secretary and Chief Legal Officer, since 2018 | | Senior Company Counsel of Wells Fargo Bank, N.A. since 2018 (previously Senior Counsel from 2007 to 2018). Vice President of Wells Fargo Funds Management, LLC from 2008 to 2014. | | |
| | | |
Michael H. Whitaker (Born 1967) | | Chief Compliance Officer, since 2016 | | Senior Vice President and Chief Compliance Officer since 2016. Senior Vice President and Chief Compliance Officer for Fidelity Investments from 2007 to 2016. | | |
| | | |
David Berardi (Born 1975) | | Assistant Treasurer, since 2009 | | Vice President of Wells Fargo Funds Management, LLC since 2009. Vice President of Evergreen Investment Management Company, LLC from 2008 to 2010. Manager of Fund Reporting and Control for Evergreen Investment Management Company, LLC from 2004 to 2010. | | |
| | | |
Jeremy DePalma1 (Born 1974) | | Assistant Treasurer, since 2009 | | Senior Vice President of Wells Fargo Funds Management, LLC since 2009. Senior Vice President of Evergreen Investment Management Company, LLC from 2008 to 2010 and head of the Fund Reporting and Control Team within Fund Administration from 2005 to 2010. | | |
| 1 | Nancy Wiser acts as Treasurer of 65 funds in the Fund Complex. Jeremy DePalma acts as Treasurer of 86 funds and Assistant Treasurer of 65 funds in the Fund Complex. |
| 2 | The Statement of Additional Information includes additional information about the Trustees and is available, without charge, upon request, by calling1-800-222-8222 or by visiting the website atwfam.com. |
| | | | | | |
| Other information (unaudited) | | Wells Fargo Diversified Equity Fund | | | 27 | |
BOARD CONSIDERATION OF INVESTMENT MANAGEMENT AGREEMENT:
Wells Fargo Diversified Equity Fund
Under the Investment Company Act of 1940 (the “1940 Act”), the Board of Trustees (the “Board”) of Wells Fargo Funds Trust (the “Trust”) must determine annually whether to approve the continuation of the Trust’s investment management agreement. In this regard, at anin-person meeting held on May21-22, 2019 (the “Meeting”), the Board, all the members of which have no direct or indirect interest in the investment management agreement and are not “interested persons” of the Trust, as defined in the 1940 Act (the “Independent Trustees”), reviewed and approved for Wells Fargo Diversified Equity Fund (the “Fund”) an investment management agreement (the “Management Agreement”) with Wells Fargo Funds Management, LLC (“Funds Management”). The Fund is afund-of-funds that invests all of its assets in multiple portfolios of Wells Fargo Master Trust (the “Master Portfolios”).
At the Meeting, the Board considered the factors and reached the conclusions described below relating to the selection of Funds Management and the approval of the Management Agreement. Prior to the Meeting, including at anin-person meeting in April 2019, the Trustees conferred extensively among themselves and with representatives of Funds Management about these matters. Also, the Board has adopted a team-based approach, with each team consisting of asub-set of Trustees, to assist the full Board in the discharge of its duties in reviewing investment performance and other matters throughout the year. The Independent Trustees were assisted in their evaluation of the Management Agreement by independent legal counsel, from whom they received separate legal advice and with whom they met separately.
In providing information to the Board, Funds Management was guided by a detailed set of requests for information submitted to it by independent legal counsel on behalf of the Independent Trustees at the start of the Board’s annual contract renewal process earlier in 2019. In considering and approving the Management Agreement, the Trustees considered the information they believed relevant, including but not limited to the information discussed below. The Board considered not only the specific information presented in connection with the Meeting, but also the knowledge gained over time through interaction with Funds Management about various topics. In this regard, the Board reviewed reports of Funds Management at each of its quarterly meetings, which included, among other things, portfolio reviews and investment performance reports. In addition, the Board and the teams mentioned above confer with portfolio managers at various times throughout the year. The Board did not identify any particular information or consideration that wasall-important or controlling, and each individual Trustee may have attributed different weights to various factors.
After its deliberations, the Board unanimously approved the continuation of the Management Agreement for aone-year term and determined that the compensation payable to Funds Management was reasonable. The Board considered the approval of the Management Agreement for the Fund as part of its consideration of agreements for funds across the complex, but its approval was made on afund-by-fund basis. The following summarizes a number of important, but not necessarily all, factors considered by the Board in support of its approvals.
Nature, extent and quality of services
The Board received and considered various information regarding the nature, extent and quality of services provided to the Fund by Funds Management under the Management Agreement. This information included a description of the investment advisory services and Fund-level administrative services covered by the Management Agreement, as well as, among other things, a summary of the background and experience of senior management of Wells Fargo Asset Management (“WFAM”), of which Funds Management is a part, a summary of investments made in the business of WFAM, a summary of certain organizational and personnel changes involving Funds Management, and a description of Funds Management’s business continuity planning programs and of their approaches to data privacy and cybersecurity. The Board received and reviewed information about Funds Management’s role as administrator of the Fund’s liquidity risk management program. The Board also considered the qualifications, background, tenure and responsibilities of each of the portfolio managers primarily responsible for theday-to-day portfolio management of the Fund.
The Board evaluated the ability of Funds Management to attract and retain qualified investment professionals, including research, advisory and supervisory personnel. The Board further considered the compliance programs and compliance records of Funds Management. In addition, the Board took into account the full range of services provided to the Fund by Funds Management and its affiliates.
Fund investment performance and expenses
The Board considered the investment performance results for the Fund over various time periods ended December 31, 2018. The Board considered these results in comparison to the investment performance of funds in a universe that was determined by Broadridge Inc. (“Broadridge”) to be similar to the Fund (the “Universe”), and in comparison to the Fund’s
| | | | |
| 28 | | Wells Fargo Diversified Equity Fund | | Other information (unaudited) |
benchmark index and to other comparative data. Broadridge is an independent provider of investment company data. The Board received a description of the methodology used by Broadridge to select the mutual funds in the performance Universe. The Board noted that the investment performance of the Fund (Administrator Class) was higher than or in range of the average investment performance of its Universe for theone-, three- and five-year periods under review, but lower than the average investment performance of its Universe for theten-year period under review. The Board also noted that the investment performance of the Fund was lower than its benchmark index, the Diversified Equity Blended Index, which is a proprietary index used by the Board to help it assess the Fund’s relative performance, for all periods under review.
The Board also received and considered information regarding the Fund’s net operating expense ratios, which include fees and expenses of the Master Portfolios, and their various components, including actual management fees assessed at the Fund and Master Portfolio levels, custodian and othernon-management fees, and Rule12b-1 andnon-Rule12b-1 shareholder service fees. The Board considered these ratios in comparison to the median ratios of funds in class-specific expense groups that were determined by Broadridge to be similar to the Fund (the “Groups”). The Board received a description of the methodology used by Broadridge to select the mutual funds in the expense Groups and an explanation of how funds comprising expense groups and their expense ratios may vary fromyear-to-year. Based on the Broadridge reports, the Board noted that the net operating expense ratios of the Fund were lower than the median net operating expense ratios of the expense Groups for all share classes.
The Board took into account the Fund’s investment performance and expense information provided to it among the factors considered in deciding tore-approve the Management Agreement.
Investment management fee rates
The Board noted that the Fund is afund-of-funds that invests in multiple Master Portfolios and therefore Funds Management is entitled to receive an annual fee of 0.25% of the Fund’s average daily net assets for providing investment advisory services to the Fund, including allocating the Fund’s assets among the various Master Portfolios. The Board reviewed and considered the contractual fee rates that are payable by the Fund to Funds Management under the Management Agreement, as well as the contractual fee rates payable by the Fund to Funds Management for class-level administrative services under a Class-Level Administration Agreement, which include, among other things, class-level transfer agency andsub-transfer agency costs (collectively, the “Management Rates”).
Among other information reviewed by the Board was a comparison of the Fund’s Management Rates with the average contractual investment management fee rates of funds in the expense Groups at a common asset level as well as transfer agency costs of the funds in the expense Groups. The Board noted that the Management Rates of the Fund were lower than the sum of these average rates for the Fund’s expense Groups for all share classes.
The Board also received and considered information about the nature and extent of services offered and fee rates charged by Funds Management to other types of clients with investment strategies similar to those of the Fund. In this regard, the Board received information about the significantly greater scope of services, and compliance, reporting and other legal burdens and risks of managing proprietary mutual funds compared with those associated with managing assets of other types of clients, including third-partysub-advised fund clients andnon-mutual fund clients such as institutional separate accounts.
Based on its consideration of the factors and information it deemed relevant, including those described here, the Board determined that the compensation payable to Funds Management under the Management Agreement was reasonable.
Profitability
The Board received and considered information concerning the profitability of Funds Management, as well as the profitability of both WFAM and Wells Fargo & Co. (“Wells Fargo”) from providing services to the fund family as a whole.
Funds Management reported on the methodologies and estimates used in calculating profitability, including a description of the methodology used to allocate certain expenses. Among other things, the Board noted that the levels of profitability reported on afund-by-fund basis varied widely, depending on factors such as the size, type and age of fund.
Based on its review, the Board did not deem the profits reported by Funds Management, WFAM or Wells Fargo from services provided to the Fund to be at a level that would prevent it from approving the continuation of the Management Agreement.
| | | | | | |
| Other information (unaudited) | | Wells Fargo Diversified Equity Fund | | | 29 | |
Economies of scale
The Board received and considered information about the potential for Funds Management to experience economies of scale in the provision of management services to the Fund, the difficulties of calculating economies of scale at an individual fund level, and the extent to which potential scale benefits are shared with shareholders. The Board noted the existence of breakpoints in the Fund’s management fee structure, which operate generally to reduce the Fund’s expense ratios as the Fund grows in size. The Board considered that in addition to management fee breakpoints, Funds Management shares potential economies of scale from its management business in a variety of ways, including through fee waiver and expense reimbursement arrangements, services that benefit shareholders, competitive management fee rates set at the outset without regard to breakpoints, and investments in the business intended to enhance services available to shareholders.
The Board concluded that Funds Management’s arrangements with respect to the Fund, including contractual breakpoints, constituted a reasonable approach to sharing potential economies of scale with the Fund and its shareholders.
Other benefits to Funds Management
The Board received and considered information regarding potential“fall-out” or ancillary benefits received by Funds Management and its affiliates as a result of their relationships with the Fund. Ancillary benefits could include, among others, benefits directly attributable to other relationships with the Fund and benefits potentially derived from an increase in Funds Management’s business as a result of their relationships with the Fund. The Board noted that various affiliates of Funds Management may receive distribution-related fees, shareholder servicing payments andsub-transfer agency fees in respect of shares sold or held through them and services provided.
The Board also reviewed information about fees earned by Funds Management and its affiliate from managing a private investment vehicle for the fund family’s securities lending collateral, and commissions earned by an affiliated broker from portfolio transactions.
Based on its consideration of the factors and information it deemed relevant, including those described here, the Board did not find that any ancillary benefits received by Funds Management and its affiliates were unreasonable.
Conclusion
At the Meeting, after considering the above-described factors and based on its deliberations and its evaluation of the information described above, the Board unanimously approved the continuation of the Management Agreement for aone-year term and determined that the compensation payable to Funds Management was reasonable.
This page is intentionally left blank.
This page is intentionally left blank.
This page is intentionally left blank.

For more information
More information about Wells Fargo Funds is available free upon request. To obtain literature, please write, visit the Fund’s website, or call:
Wells Fargo Funds
P.O. Box 219967
Kansas City, MO 64121-9967
Website: wfam.com
Individual investors: 1-800-222-8222
Retail investment professionals: 1-888-877-9275
Institutional investment professionals:1-866-765-0778
This report and the financial statements contained herein are submitted for the general information of the shareholders of the Fund. If this report is used for promotional purposes, distribution of the report must be accompanied or preceded by a current prospectus. Before investing, please consider the investment objectives, risks, charges, and expenses of the investment. For a current prospectus and, if available, a summary prospectus, containing this information, call1-800-222-8222 or visit the Fund’s website atwfam.com. Read the prospectus carefully before you invest or send money.
Wells Fargo Asset Management (WFAM) is the trade name for certain investment advisory/management firms owned by Wells Fargo & Company. These firms include but are not limited to Wells Capital Management Incorporated and Wells Fargo Funds Management, LLC. Certain products managed by WFAM entities are distributed by Wells Fargo Funds Distributor, LLC (a broker-dealer and Member FINRA).
This material is for general informational and educational purposes only and is NOT intended to provide investment advice or a recommendation of any kind—including a recommendation for any specific investment, strategy, or plan.
INVESTMENT PRODUCTS: NOT FDIC INSURED ◾ NO BANK GUARANTEE ◾ MAY LOSE VALUE
© 2019 Wells Fargo Funds Management, LLC. All rights reserved.
| | |
 | | 403195 07-19 A281/AR281 05-19 |
Annual Report
May 31, 2019

Wells Fargo Emerging Growth Fund

Beginning on January 1, 2021, as permitted by new regulations adopted by the Securities and Exchange Commission, paper copies of the Wells Fargo Funds’ annual and semi-annual shareholder reports issued after this date will no longer be sent by mail, unless you specifically request paper copies of the reports. Instead, the reports will be made available on the Funds’ website, and you will be notified by mail each time a report is posted and provided with a website address to access the report.
If you already elected to receive shareholder reports electronically, you will not be affected by this change and you need not take any action. You may elect to receive shareholder reports and other communications from the Fund electronically at any time by contacting your financial intermediary (such as a broker-dealer or bank) or, if you are a direct investor, by calling 1-800-222-8222 or by enrolling at wellsfargo.com/advantagedelivery.
You may elect to receive all future reports in paper free of charge. If you invest through a financial intermediary, you can contact your financial intermediary to request that you continue to receive paper copies of your shareholder reports; if you invest directly with the Fund, you can call 1-800-222-8222. Your election to receive reports in paper will apply to all Wells Fargo Funds held in your account with your financial intermediary or, if you are a direct investor, to all Wells Fargo Funds that you hold.

Reduce clutter. Save trees.
Sign up for electronic delivery of prospectuses and shareholder reports atwellsfargo.com/advantagedelivery
Contents
The views expressed and any forward-looking statements are as of May 31, 2019, unless otherwise noted, and are those of the Fund managers and/or Wells Fargo Asset Management. Discussions of individual securities, or the markets generally, or any Wells Fargo Fund are not intended as individual recommendations. Future events or results may vary significantly from those expressed in any forward-looking statements. The views expressed are subject to change at any time in response to changing circumstances in the market. Wells Fargo Asset Management and the Fund disclaim any obligation to publicly update or revise any views expressed or forward-looking statements.
INVESTMENT PRODUCTS: NOT FDIC INSURED ◾ NO BANK GUARANTEE ◾ MAY LOSE VALUE
| | | | |
| 2 | | Wells Fargo Emerging Growth Fund | | Letter to shareholders (unaudited) |

Andrew Owen
President
Wells Fargo Funds
Dear Shareholder:
We are pleased to offer you this annual report for the Wells Fargo Emerging Growth Fund for the 12-month period that ended May 31, 2019. Higher short-term interest rates, inflation concerns, trade tensions, and geopolitical events drove investment market volatility for much of 2018, particularly for international stocks. Early 2019 saw stocks and bonds gain with renewed business and investor confidence, but volatility returned late in the period as global growth slowed and geopolitical concerns persisted.
For the period, U.S. stocks, based on the S&P 500 Index,1 gained 3.78% and international stocks, as measured by the MSCI ACWI ex USA Index (Net),2 fell 6.26%. Based on the MSCI EM Index (Net),3 emerging market stocks fell 8.70%. Bond investors saw the Bloomberg Barclays U.S. Aggregate Bond Index4 add 6.40% while the Bloomberg Barclays Global Aggregate ex-USD Index5 rose 0.39%. The Bloomberg Barclays Municipal Bond Index6 added 6.40%, and the ICE BofAML U.S. High Yield Index7 was up 5.37%.
Results for investment indices reflected global concerns.
Global trade tensions escalated during the second quarter of 2018. A tit-for-tat tariff spat intensified between the U.S. and other governments. The U.S. Federal Reserve (Fed) raised the federal funds rate by 25 basis points (bps; 100 bps equal 1.00%) to a target range of between 1.75% and 2.00% in June. Market index results reflected the global concerns. The MSCI ACWI ex USA Index (Net) lost 2.61%, while the Bloomberg Barclays Global Aggregate ex-USD Index dropped 4.76%.
Not all news was bad. The U.S. Bureau of Economic Analysis reported second-quarter annualized gross domestic product (GDP) growth of 4.2%. Hiring improved. Unemployment declined. Consumer confidence and spending increased. The S&P 500 Index recorded a 3.43% second-quarter gain. Stocks of companies with smaller capitalizations did even better, as measured by the Russell 2000® Index,8 adding 7.75%.
| 1 | The S&P 500 Index consists of 500 stocks chosen for market size, liquidity, and industry group representation. It is a market-value-weighted index with each stock’s weight in the index proportionate to its market value. You cannot invest directly in an index. |
| 2 | The Morgan Stanley Capital International (MSCI) All Country World Index (ACWI) ex USA Index (Net) is a free-float-adjusted market-capitalization-weighted index that is designed to measure the equity market performance of developed and emerging markets, excluding the U.S. Source: MSCI. MSCI makes no express or implied warranties or representations and shall have no liability whatsoever with respect to any MSCI data contained herein. The MSCI data may not be further redistributed or used as a basis for other indices or any securities or financial products. This report is not approved, reviewed, or produced by MSCI. You cannot invest directly in an index. |
| 3 | The MSCI Emerging Markets (EM) Index (Net) is a free-float-adjusted market-capitalization-weighted index that is designed to measure the equity market performance of emerging markets. You cannot invest directly in an index. |
| 4 | The Bloomberg Barclays U.S. Aggregate Bond Index is a broad-based benchmark that measures the investment-grade, U.S.-dollar-denominated, fixed-rate taxable bond market, including Treasuries, government-related and corporate securities, mortgage-backed securities (agency fixed-rate and hybrid adjustable-rate mortgage pass-throughs), asset-backed securities, and commercial mortgage-backed securities. You cannot invest directly in an index. |
| 5 | The Bloomberg Barclays Global Aggregate ex-USD Index is an unmanaged index that provides a broad-based measure of the global investment-grade fixed-income markets excluding the U.S.-dollar-denominated debt market. You cannot invest directly in an index. |
| 6 | The Bloomberg Barclays Municipal Bond Index is an unmanaged index composed of long-term tax-exempt bonds with a minimum credit rating of Baa. You cannot invest directly in an index. |
| 7 | The ICE BofAML U.S. High Yield Index is a market-capitalization-weighted index of domestic and Yankee high-yield bonds. The index tracks the performance of high-yield securities traded in the U.S. bond market. You cannot invest directly in an index. Copyright 2019. ICE Data Indices, LLC. All rights reserved. |
| 8 | The Russell 2000® Index measures the performance of the 2,000 smallest companies in the Russell 3000® Index, which represents approximately 8% of the total market capitalization of the Russell 3000® Index. You cannot invest directly in an index. |
| | | | | | |
| Letter to shareholders (unaudited) | | Wells Fargo Emerging Growth Fund | | | 3 | |
Investors appeared to shake off lingering concerns during the third quarter.
Favorable third-quarter economic indicators and corporate earnings reports encouraged domestic stock investors. U.S. trade negotiations with Mexico and Canada progressed. The Conference Board Consumer Confidence Index®9 reached its highest level in 18 years during September 2018. The Fed raised the federal funds rate by 25 bps to a target range of between 2.00% and 2.25% in September. For the quarter that ended September 30, 2018, the S&P 500 Index added 7.71%.
Investors in international markets were not as confident. Tensions between the U.S. and China increased. The U.S. imposed $200 billion in tariffs on Chinese goods. China reacted with $60 billion in tariffs on U.S. goods. Economic growth in China caused concern. The Bank of England (BoE) raised its monetary policy rate to 0.75% in August 2018. During the quarter, the MSCI ACWI ex USA Index (Net) gained 0.71%. The MSCI EM Index (Net) declined 1.09%. In fixed-income markets, U.S. bonds were flat, as measured by the Bloomberg Barclays U.S. Aggregate Bond Index. The Bloomberg Barclays Global Aggregate ex-USD Index fell 1.74%.
Conflicting data unsettled markets during the fourth quarter.
November’s U.S. midterm elections shifted control of the House of Representatives from Republicans to Democrats, presaging potential partisan clashes. Third-quarter U.S. GDP was announced at an annualized 3.4% rate, lower than the second-quarter rate. Brexit efforts stalled ahead of the March 2019 deadline. The People’s Bank of China cut reserve requirement ratios, accelerated infrastructure spending, and cut taxes even as the value of the yuan declined to low levels last seen in 2008.
December’s S&P 500 Index performance was the worst since 1931. Globally,fixed-income investments fared better than stocks during the last two months of the year. The Fed increased the federal funds rate by 25 bps in December 2018 to a target range of between 2.25% and 2.50%.
The market climbs a wall of worry.
Investors entered 2019 with reasons to be concerned. A partial U.S. government shutdown driven by partisan policy disputes extended into January. Investment returns appeared to reaffirm the adage that markets climb a wall of worry. The S&P 500 Index gained 8.01% for the month of January, the best monthly performance in 30 years. Returns for the MSCI ACWI ex USA Index (Net), the Bloomberg Barclays U.S. Aggregate Bond Index, and the Bloomberg Barclays Global Aggregate ex-USD Index also were positive. The Fed indicated that it would pause its program of regular rate increases during 2019 as inflation remained low.
In February 2019, concerns over slowing global growth reemerged. The Bureau of Economic Analysis announced fourth-quarter 2018 GDP grew at an annualized 2.2% rate, down from levels of the prior two quarters. In a February report, the BoE forecast the slowest growth since the financial crisis for 2019. China and the U.S. continued to wrangle over trade issues.
By the end of March 2019, the combination of dovish Fed sentiment and consistent, if not spectacular, economic and business metrics reinforced investors’ confidence. Monthly job creation data regained momentum. Corporate profits, while lower than 2018’s lofty levels, remained solid. China announced a roughly $300 billion stimulus package through tax and fee cuts intended to reinvigorate economic growth.
December’s S&P 500 Index performance was the worst since 1931.
The S&P 500 Index gained 8.01% for the month of January, the best monthly performance in 30 years.
| 9 | The Conference Board Consumer Confidence Index® measures the degree of optimism on the state of the U.S. economy that consumers are expressing through their activities of saving and spending. You cannot invest directly in an index. |
| | | | |
| 4 | | Wells Fargo Emerging Growth Fund | | Letter to shareholders (unaudited) |
During April 2019, several broad-based U.S. equity indices reached or approached highs as investors drew confidence from favorable economic projections, sustained low inflation, and solid employment data. First-quarter GDP showed the economy grew at an annualized rate of 3.2% on improvement in business investment and exports. Favorable sentiment extended to foreign markets as the MSCI ACWI ex USA Index (Net) gained 2.64% and the MSCI EM Index (Net) added 2.11% for the month.
May 2019 presented investors with mixed signals in the economy, in the markets, and politically. In the U.S., partisan wrangling ramped up as Democrats and Republicans set their sights on 2020 presidential politics. In the U.K., the Brexit stalemate resulted in the resignation of Prime Minister Theresa May. The European Commission downgraded the 2019 growth forecast for the block of countries to 1.2%. The U.S. increased tariffs on products from China, China responded, and then talks broke down. Ending the month, equities, as measured by the MSCI ACWI (Net),10 dropped 5.93% while bonds, often considered a less risky investment, gained 1.04%, as measured by the Bloomberg Barclays Global Aggregate ex-USD Index.
Don’t let short-term uncertainty derail long-term investment goals.
Periods of investment uncertainty can present challenges, but experience has taught us that maintaining long-term investment goals can be an effective way to plan for the future. To help you create a sound strategy based on your personal goals and risk tolerance, Wells Fargo Funds offers more than 100 mutual funds spanning a wide range of asset classes and investment styles. Although diversification cannot guarantee an investment profit or prevent losses, we believe it can be an effective way to manage investment risk and potentially smooth out overall portfolio performance. We encourage investors to know their investments and to understand that appropriate levels of risk-taking may unlock opportunities.
Thank you for choosing to invest with Wells Fargo Funds. We appreciate your confidence in us and remain committed to helping you meet your financial needs.
Sincerely,

Andrew Owen
President
Wells Fargo Funds
For further information about your Fund, contact your investment professional, visit our website atwfam.com, or call us directly at1-800-222-8222.
| 10 | The MSCI ACWI (Net) is a free-float-adjusted market-capitalization-weighted index that is designed to measure the equity market performance of developed and emerging markets. You cannot invest directly in an index. |
This page is intentionally left blank.
| | | | |
| 6 | | Wells Fargo Emerging Growth Fund1 | | Performance highlights (unaudited) |
Investment objective
The Fund seeks long-term capital appreciation.
Manager
Wells Fargo Funds Management, LLC
Subadviser for the affiliated master portfolio
Wells Capital Management Incorporated
Portfolio managers
Joseph M. Eberhardy, CFA®‡, CPA
Thomas C. Ognar, CFA®‡
Average annual total returns (%) as of May 31, 2019
| | | | | | | | | | | | | | | | | | | | | | | | | | | | | | | | | | |
| | | | | Including sales charge | | | Excluding sales charge | | | Expense ratios2 (%) | |
| | | Inception date | | 1 year | | | 5 year | | | 10 year | | | 1 year | | | 5 year | | | 10 year | | | Gross | | | Net3 | |
| | | | | | | | | |
| Class A (WEMAX) | | 3-31-2008 | | | -6.54 | | | | 9.96 | | | | 14.74 | | | | -0.84 | | | | 11.27 | | | | 15.42 | | | | 1.36 | | | | 1.28 | |
| | | | | | | | | |
| Class C (WEMCX) | | 3-31-2008 | | | -2.55 | | | | 10.43 | | | | 14.56 | | | | -1.55 | | | | 10.43 | | | | 14.56 | | | | 2.11 | | | | 2.03 | |
| | | | | | | | | |
| Class R6 (WEGRX)4 | | 7-31-2018 | | | – | | | | – | | | | – | | | | -0.22 | | | | 11.81 | | | | 15.98 | | | | 0.93 | | | | 0.85 | |
| | | | | | | | | |
| Administrator Class (WFGDX) | | 1-31-2007 | | | – | | | | – | | | | – | | | | -0.75 | | | | 11.42 | | | | 15.60 | | | | 1.28 | | | | 1.20 | |
| | | | | | | | | |
| Institutional Class (WEMIX) | | 3-31-2008 | | | – | | | | – | | | | – | | | | -0.42 | | | | 11.76 | | | | 15.95 | | | | 1.03 | | | | 0.90 | |
| | | | | | | | | |
| Russell 2000® Growth Index5 | | – | | | – | | | | – | | | | – | | | | -6.88 | | | | 8.32 | | | | 13.93 | | | | – | | | | – | |
Figures quoted represent past performance, which is no guarantee of future results, and do not reflect taxes that a shareholder may pay on fund distributions or the redemption of fund shares. Investment return and principal value of an investment will fluctuate so that an investor’s shares, when redeemed, may be worth more or less than their original cost. Performance shown without sales charges would be lower if sales charges were reflected. Current performance may be lower or higher than the performance data quoted, which assumes the reinvestment of dividends and capital gains. Current month-end performance is available on the Fund’s website,wfam.com.
Index returns do not include transaction costs associated with buying and selling securities, any mutual fund fees or expenses, or any taxes. It is not possible to invest directly in an index.
For Class A shares, the maximum front-end sales charge is 5.75%. For Class C shares, the maximum contingent deferred sales charge is 1.00%. Performance including a contingent deferred sales charge assumes the sales charge for the corresponding time period. Class R6, Administrator, and Institutional Class shares are sold without a front-end sales charge or contingent deferred sales charge.
Stock values fluctuate in response to the activities of individual companies and general market and economic conditions. Smaller-company stocks tend to be more volatile and less liquid than those of larger companies. Certain investment strategies tend to increase the total risk of an investment (relative to the broader market). The Fund is exposed to foreign investment risk. Consult the Fund’s prospectus for additional information on these and other risks.
Please see footnotes on page 7.
| | | | | | |
| Performance highlights (unaudited) | | Wells Fargo Emerging Growth Fund | | | 7 | |
|
| Growth of $10,000 investment as of May 31, 20196 |
|
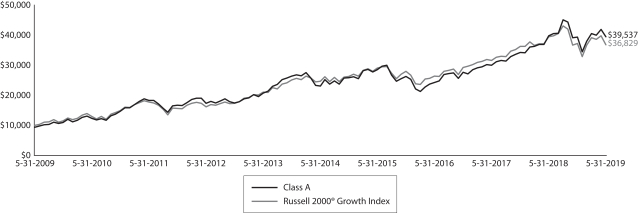 |
| ‡ | CFA® and Chartered Financial Analyst® are trademarks owned by CFA Institute. |
| 1 | The Fund is a gateway feeder fund that invests substantially all of its assets in a single affiliated master portfolio of the Wells Fargo Master Trust with a substantially identical investment objective and substantially similar investment strategies. References to the investment activities of the Fund are intended to refer to the investment activities of the affiliated master portfolio in which it invests. |
| 2 | Reflects the expense ratios as stated in the most recent prospectuses. The expense ratios shown are subject to change and may differ from the annualized expense ratios shown in the financial highlights of this report. |
| 3 | The manager has contractually committed through September 30, 2019, to waive fees and/or reimburse expenses to the extent necessary to cap the expenses of each class after fee waivers at the amounts shown. Brokerage commissions, stamp duty fees, interest, taxes, acquired fund fees and expenses (if any) from funds in which the affiliated master portfolio invests, and extraordinary expenses are excluded from the expense cap. Net expenses from the affiliated master portfolio are included in the expense caps. Prior to or after the commitment expiration date, the cap may be increased or the commitment to maintain the cap may be terminated only with the approval of the Board of Trustees. Without this cap, the Fund’s returns would have been lower. The expense ratio paid by an investor is the net expense ratio (the total annual fund operating expenses after fee waivers) as stated in the prospectuses. |
| 4 | Historical performance shown for Class R6 shares prior to their inception reflects the performance of Institutional Class shares, and includes the higher expenses applicable to Institutional Class shares. If these expenses had not been included, returns for Class R6 shares would be higher. |
| 5 | The Russell 2000® Growth Index measures the performance of those Russell 2000 companies with higher price/book ratios and higher forecasted growth values. You cannot invest directly in an index. |
| 6 | The chart compares the performance of Class A shares for the most recent ten years with the Russell 2000® Growth Index. The chart assumes a hypothetical $10,000 investment in Class A shares and reflects all operating expenses and assumes the maximum initial sales charge of 5.75%. |
| 7 | The ten largest holdings, excluding cash, cash equivalents and any money market funds, are calculated based on the value of the securities of the affiliated master portfolio allocable to the Fund divided by the total net assets of the Fund. Holdings are subject to change and may have changed since the date specified. |
| 8 | Amounts represent the sector distribution of the affiliated master portfolio which are calculated based on the total long-term investments of the affiliated master portfolio. These amounts are subject to change and may have changed since the date specified. |
| * | The security was no longer held at the end of the period. |
| | | | |
| 8 | | Wells Fargo Emerging Growth Fund | | Performance highlights (unaudited) |
MANAGER’S DISCUSSION
Fund highlights
| ∎ | | The Fund outperformed the Russell 2000® Growth Index for the 12-month period that ended May 31, 2019. |
| ∎ | | Relative performance contributions came from the information technology (IT), consumer discretionary, and financials sectors. |
| ∎ | | The health care and industrials sectors served as detractors during the period. |
Equity markets demonstrated strong consistency and low volatility during the period.
U.S. stocks rallied earlier in the 12-month period on the backdrop of solid economic conditions but have been plagued by a series of negative events, which include tariff and trade tensions with China, fears of weaker economic growth, and a flattening yield curve, which has stifled investor sentiment in recent months. As the ongoing trade dispute between the U.S. and China lingers and with the durability of economic conditions in question, a more dovish Federal Reserve could mollify investor trepidation regarding future interest rate hikes. While a cautious lens is warranted, most economic indicators are not signaling a recession. Rather, the economy stands on solid footing with unemployment still meandering on a 50-year low. This backdrop, along with accommodative fiscal and monetary policy, steady wage inflation, and lower energy prices is fostering a healthy landscape for the consumer.
Notable strength from the IT sector, particularly within the software-as-a-service area, aided relative performance as companies such as Q2 Holdings, Incorporated, and Five9, Incorporated, have delivered accelerating billings growth and other strong growth metrics while generating market share penetration and margin expansion within their respective markets. Strength within the consumer discretionary sector also boosted the portfolio’s relative returns as companies like Planet Fitness, Incorporated, and Ollie’s Bargain Outlet Holdings, Incorporated, captured strong sales trends and benefited from their well-executed store-expansion strategies. We believe Ollie’s represents a unique growth opportunity as a retailer of closeout inventory offering a wide array of merchandise at prices well below department stores and mass-market retailers. Elsewhere within consumer discretionary, Chegg, Incorporated, rallied sharply after its student-learning platform generated strong subscriber growth. Going forward, we believe the company has the propensity to expand its presence outside the U.S. college student market into areas overseas.
| | | | |
| Ten largest holdings (%) as of May 31, 20197 | |
| |
InterXion Holding NV | | | 3.08 | |
| |
Q2 Holdings Incorporated | | | 2.89 | |
| |
ASGN Incorporated | | | 2.75 | |
| |
MasTec Incorporated | | | 2.68 | |
| |
Kinsale Capital Group Incorporated | | | 2.61 | |
| |
Rapid7 Incorporated | | | 2.59 | |
| |
Envestnet Incorporated | | | 2.55 | |
| |
Novanta Incorporated | | | 2.35 | |
| |
Codexis Incorporated | | | 2.21 | |
| |
Mercury Computer Systems Incorporated | | | 2.19 | |
Holdings within the industrials sector hindered relative performance. Consumer-directed benefits market provider WageWorks, Incorporated, delayed a regulatory filing after concluding material weakness in its internal financial reporting controls. We believe the issue is tied to a previous acquisition from 2016. Due to the remaining uncertainty, we exited our position based on the potential risk that remains given that there are a number of unknowns at this point with limited visibility to the nature and scope of the underlying issues. Other weakness in the portfolio came mainly from stocks within the health care sector. Biotech holding Ligand Pharmaceuticals Incorporated* was pressured by negative third-party reports calling its pipeline into question. Additionally, the company announced the sale
of its largest royalty-generating asset, exacerbating negative sentiment. Other weakness came from medical technology holding AxoGen, Incorporated, which offers nerve-repair solutions. During the period, the company issued disappointing guidance citing higher costs associated with an increase in sales representatives. The company also delayed a key study, which was expected to conclude in 2018, until 2020 or later.
IT remains the largest sector weight in the portfolio. We remain diversified within the sector with exposure to electronic equipment instruments, software, semiconductors, and data centers. We continue to witness strong revenue, cash flow, and earnings growth from our technology companies, particularly within the software industry. Next-generation cloud platforms continue to garner a disproportionate share of new business at the expense of legacy solutions. Software holdings such as Five9; Q2 Holdings; and Envestnet, Incorporated, have delivered strong growth metrics while generating market share
Please see footnotes on page 7.
| | | | | | |
| Performance highlights (unaudited) | | Wells Fargo Emerging Growth Fund | | | 9 | |
penetration and margin expansion within their respective industry verticals. The economy has witnessed favorable unemployment trends and, with strength from the consumer over the past few years, we remain underweight the consumer discretionary sector mainly due to changing spending patterns and the e-commerce effect on many brick and mortar retailers. However, we do find opportunities in companies whose business models are resistant to internet and e-commerce competition in industries like discount fitness centers, off-price retailers, as well as select companies with unique concepts in the fast-casual restaurant space.
|
| Sector distribution as of May 31, 20198 |
|
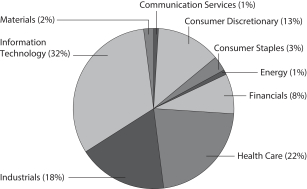 |
Growth stocks are the core of our investment focus.
The market volatility in late 2018 enabled us to opportunistically add to positions in stocks with strong secular drivers whose absolute and relative valuations were trading at attractive levels. We continue to take advantage of the widening and narrowing of the valuation gap of our stocks and seek out additional opportunities to upgrade the portfolio. We believe the economic outlook for equites remains attractive given the strong labor market, low interest rate environment, and reasonable valuations. We remain comfortable with our positioning and are positive on market segments that have been productive for the portfolio: software as a service (SaaS), cloud services, online retail, digital
payments, and the internet of things, as well as our most recent addition to the acronym, innovation (SCODIi). We continue to witness a scarcity of growth stock opportunities within the investing universe, which could favor the companies that we currently own and those that we are seeking to add. Going forward, given the favorable economic backdrop currently in the market, the faster-growing stocks emphasized in our investment process should augur well for the future of the portfolio.
Please see footnotes on page 7.
| | | | |
| 10 | | Wells Fargo Emerging Growth Fund | | Fund expenses (unaudited) |
As a shareholder of the Fund, you incur two types of costs: (1) transaction costs, including sales charges (loads) on purchase payments and contingent deferred sales charges (if any) on redemptions and (2) ongoing costs, including management fees, distribution (12b-1) and/or shareholder servicing fees, and other Fund expenses. This example is intended to help you understand your ongoing costs (in dollars) of investing in the Fund and to compare these costs with the ongoing costs of investing in other mutual funds.
The example is based on an investment of $1,000 invested at the beginning of the six-month period and held for the entire period from December 1, 2018 to May 31, 2019.
Actual expenses
The “Actual” line of the table below provides information about actual account values and actual expenses. You may use the information in this line, together with the amount you invested, to estimate the expenses that you paid over the period. Simply divide your account value by $1,000 (for example, an $8,600 account value divided by $1,000 = 8.6), then multiply the result by the number in the “Actual” line under the heading entitled “Expenses paid during period” for your applicable class of shares to estimate the expenses you paid on your account during this period.
Hypothetical example for comparison purposes
The “Hypothetical” line of the table below provides information about hypothetical account values and hypothetical expenses based on the Fund’s actual expense ratio and an assumed rate of return of 5% per year before expenses, which is not the Fund’s actual return. The hypothetical account values and expenses may not be used to estimate the actual ending account balance or expenses you paid for the period. You may use this information to compare the ongoing costs of investing in the Fund and other funds. To do so, compare this 5% hypothetical example with the 5% hypothetical examples that appear in the shareholder reports of the other funds.
Please note that the expenses shown in the table are meant to highlight your ongoing costs only and do not reflect any transactional costs, such as sales charges (loads) and contingent deferred sales charges. Therefore, the “Hypothetical” line of the table is useful in comparing ongoing costs only and will not help you determine the relative total costs of owning different funds. In addition, if these transactional costs were included, your costs would have been higher.
| | | | | | | | | | | | | | | | |
| | | Beginning
account value
12-1-2018 | | | Ending
account value
5-31-2019 | | | Expenses
paid during
the period1,2 | | | Annualized net
expense ratio1 | |
Class A | | | | | | | | | | | | | | | | |
| | | | |
Actual | | $ | 1,000.00 | | | $ | 1,003.94 | | | $ | 6.39 | | | | 1.28 | % |
| | | | |
Hypothetical (5% return before expenses) | | $ | 1,000.00 | | | $ | 1,018.55 | | | $ | 6.44 | | | | 1.28 | % |
Class C | | | | | | | | | | | | | | | | |
| | | | |
Actual | | $ | 1,000.00 | | | $ | 1,000.26 | | | $ | 10.11 | | | | 2.03 | % |
| | | | |
Hypothetical (5% return before expenses) | | $ | 1,000.00 | | | $ | 1,014.82 | | | $ | 10.18 | | | | 2.03 | % |
Class R6 | | | | | | | | | | | | | | | | |
| | | | |
Actual | | $ | 1,000.00 | | | $ | 1,007.73 | | | $ | 4.26 | | | | 0.85 | % |
| | | | |
Hypothetical (5% return before expenses) | | $ | 1,000.00 | | | $ | 1,020.69 | | | $ | 4.28 | | | | 0.85 | % |
Administrator Class | | | | | | | | | | | | | | | | |
| | | | |
Actual | | $ | 1,000.00 | | | $ | 1,003.95 | | | $ | 5.99 | | | | 1.20 | % |
| | | | |
Hypothetical (5% return before expenses) | | $ | 1,000.00 | | | $ | 1,018.95 | | | $ | 6.04 | | | | 1.20 | % |
Institutional Class | | | | | | | | | | | | | | | | |
| | | | |
Actual | | $ | 1,000.00 | | | $ | 1,005.69 | | | $ | 4.50 | | | | 0.90 | % |
| | | | |
Hypothetical (5% return before expenses) | | $ | 1,000.00 | | | $ | 1,020.44 | | | $ | 4.53 | | | | 0.90 | % |
| 1 | Amounts reflect net expenses allocated from the affiliated Master Portfolio in which the Fund invests. |
| 2 | Expenses paid is equal to the annualized net expense ratio of each class multiplied by the average account value over the period, multiplied by the number of days in the most recent fiscal half-year divided by the number of days in the fiscal year (to reflect the one-half-year period). |
| | | | | | |
| Portfolio of investments—May 31, 2019 | | Wells Fargo Emerging Growth Fund | | | 11 | |
| | | | | | | | | | | | | | | | |
| Security name | | | | | | | | | | | Value | |
| | | | |
Investment Companies: 99.95% | | | | | | | | | | | | | | | | |
| | | | |
| Affiliated Master Portfolio: 99.95% | | | | | | | | | | | | | | | | |
| | | | |
Wells Fargo Emerging Growth Portfolio | | | | | | | | | | | | | | $ | 748,894,497 | |
| | | | | | | | | | | | | | | | |
| | | | |
Total Investment Companies (Cost $531,396,231) | | | | | | | | | | | | | | | 748,894,497 | |
| | | | | | | | | | | | | | | | |
| | | | | | | | |
| Total investments in securities (Cost $531,396,231) | | | 99.95 | % | | | 748,894,497 | |
| | |
Other assets and liabilities, net | | | 0.05 | | | | 409,363 | |
| | | | | | | | |
| Total net assets | | | 100.00 | % | | $ | 749,303,860 | |
| | | | | | | | |
Transactions with the affiliated Master Portfolio were as follows:
| | | | | | | | | | | | | | | | | | | | | | | | | | | | | | | | | | | | |
| | | % of
ownership,
beginning of
period | | | % of
ownership,
end of
period | | | Net
realized
gains
(losses) on
securities
transactions
allocated
from
affiliated
Master
Portfolio | | | Net
change in
unrealized
gains
(losses) on
securities
transactions
allocated
from
affiliated
Master
Portfolio | | | Dividends
allocated
from
affiliated
Master
Portfolio | | | Securities
lending
income
allocated
from
affiliated
Master
Portfolio | | | Affiliated
income
allocated
from
affiliated
Master
Portfolio | | | Value,
end
of period | | | % of
net
assets | |
Wells Fargo Emerging Growth Portfolio | | | 93 | % | | | 91 | % | | $ | 97,676,529 | | | $ | (97,747,120 | ) | | $ | 863,685 | | | $ | 708,730 | | | $ | 318,659 | | | $ | 748,894,497 | | | | 99.95 | % |
The accompanying notes are an integral part of these financial statements.
| | | | |
| 12 | | Wells Fargo Emerging Growth Fund | | Statement of assets and liabilities—May 31, 2019 |
| | | | |
| | | | |
| |
Assets | | | | |
Investments in affiliated Master Portfolio, at value (cost $531,396,231) | | $ | 748,894,497 | |
Receivable for Fund shares sold | | | 948,682 | |
Receivable from manager | | | 41,299 | |
Prepaid expenses and other assets | | | 55,399 | |
| | | | |
Total assets | | | 749,939,877 | |
| | | | |
| |
Liabilities | | | | |
Payable for Fund shares redeemed | | | 369,605 | |
Administration fees payable | | | 101,707 | |
Custodian and accounting fees payable | | | 52,967 | |
Shareholder report expenses payable | | | 52,952 | |
Shareholder servicing fees payable | | | 39,956 | |
Distribution fee payable | | | 1,214 | |
Accrued expenses and other liabilities | | | 17,616 | |
| | | | |
Total liabilities | | | 636,017 | |
| | | | |
Total net assets | | $ | 749,303,860 | |
| | | | |
| |
NET ASSETS CONSIST OF | | | | |
Paid-in capital | | $ | 519,498,936 | |
Total distributable earnings | | | 229,804,924 | |
| | | | |
Total net assets | | $ | 749,303,860 | |
| | | | |
| |
COMPUTATION OF NET ASSET VALUE AND OFFERING PRICE PER SHARE | | | | |
Net assets – Class A | | $ | 145,898,070 | |
Shares outstanding – Class A1 | | | 10,798,968 | |
Net asset value per share – Class A | | | $13.51 | |
Maximum offering price per share – Class A2 | | | $14.33 | |
Net assets – Class C | | $ | 1,760,837 | |
Shares outstanding – Class C1 | | | 152,030 | |
Net asset value per share – Class C | | | $11.58 | |
Net assets – Class R6 | | $ | 22,408 | |
Shares outstanding – Class R61 | | | 1,508 | |
Net asset value per share – Class R6 | | | $14.86 | |
Net assets – Administrator Class | | $ | 23,549,445 | |
Shares outstanding – Administrator Class1 | | | 1,679,646 | |
Net asset value per share – Administrator Class | | | $14.02 | |
Net assets – Institutional Class | | $ | 578,073,100 | |
Shares outstanding – Institutional Class1 | | | 38,985,343 | |
Net asset value per share – Institutional Class | | | $14.83 | |
| 1 | The Fund has an unlimited number of authorized shares. |
| 2 | Maximum offering price is computed as 100/94.25 of net asset value. On investments of $50,000 or more, the offering price is reduced. |
The accompanying notes are an integral part of these financial statements.
| | | | | | |
| Statement of operations—year ended May 31, 2019 | | Wells Fargo Emerging Growth Fund | | | 13 | |
| | | | |
| | | | |
| |
Investment income | | | | |
Dividends allocated from affiliated Master Portfolio | | $ | 863,685 | |
Securities lending income allocated from affiliated Master Portfolio | | | 708,730 | |
Affiliated income allocated from affiliated Master Portfolio | | | 318,659 | |
Expenses allocated from affiliated Master Portfolio | | | (6,472,704 | ) |
| | | | |
Total investment income | | | (4,581,630 | ) |
| | | | |
| |
Expenses | | | | |
Management fee | | | 401,662 | |
Administration fees | | | | |
Class A | | | 320,362 | |
Class C | | | 7,467 | |
Class R6 | | | 31 | 1 |
Administrator Class | | | 55,179 | |
Institutional Class | | | 786,066 | |
Shareholder servicing fees | | | | |
Class A | | | 381,384 | |
Class C | | | 8,889 | |
Administrator Class | | | 105,490 | |
Distribution fee | | | | |
Class C | | | 26,667 | |
Custody and accounting fees | | | 28,182 | |
Professional fees | | | 27,524 | |
Registration fees | | | 72,522 | |
Shareholder report expenses | | | 103,015 | |
Trustees’ fees and expenses | | | 20,930 | |
Other fees and expenses | | | 20,439 | |
| | | | |
Total expenses | | | 2,365,809 | |
Less: Fee waivers and/or expense reimbursements | | | (844,005 | ) |
| | | | |
Net expenses | | | 1,521,804 | |
| | | | |
Net investment loss | | | (6,103,434 | ) |
| | | | |
| |
REALIZED AND UNREALIZED GAINS (LOSSES) ON INVESTMENTS | | | | |
Net realized gains on securities transactions allocated from affiliated Master Portfolio | | | 97,676,529 | |
Net change in unrealized gains (losses) on securities transactions allocated from affiliated Master Portfolio | | | (97,747,120 | ) |
| | | | |
Net realized and unrealized gains (losses) on investments | | | (70,591 | ) |
| | | | |
Net decrease in net assets resulting from operations | | $ | (6,174,025 | ) |
| | | | |
| 1 | For the period from July 31, 2018 (commencement of class operations) to May 31, 2019 |
The accompanying notes are an integral part of these financial statements.
| | | | |
| 14 | | Wells Fargo Emerging Growth Fund | | Statement of changes in net assets |
| | | | | | | | | | | | | | | | |
| | | Year ended
May 31, 2019 | | | Year ended
May 31, 20181 | |
| | | |
Operations | | | | | | | | | | | | |
Net investment loss | | | | | | $ | (6,103,434 | ) | | | | | | $ | (5,006,023 | ) |
Net realized gains on investments | | | | | | | 97,676,529 | | | | | | | | 111,281,986 | |
Net change in unrealized gains (losses) on investments | | | | | | | (97,747,120 | ) | | | | | | | 111,090,852 | |
| | | | |
Net increase (decrease) in net assets resulting from operations | | | | | | | (6,174,025 | ) | | | | | | | 217,366,815 | |
| | | | |
| | | | |
Distributions to shareholders from net investment income and net realized gains | | | | | | | | | | | | | | | | |
Class A | | | | | | | (28,101,143 | ) | | | | | | | (16,172,743 | ) |
Class C | | | | | | | (901,234 | ) | | | | | | | (446,164 | ) |
Class R6 | | | | | | | (42,849 | )2 | | | | | | | N/A | |
Administrator Class | | | | | | | (8,840,125 | ) | | | | | | | (5,883,416 | ) |
Institutional Class | | | | | | | (102,793,991 | ) | | | | | | | (62,422,402 | ) |
| | | | |
Total distributions to shareholders | | | | | | | (140,679,342 | ) | | | | | | | (84,924,725 | ) |
| | | | |
| | | | |
Capital share transactions | | | Shares | | | | | | | | Shares | | | | | |
Proceeds from shares sold | | | | |
Class A | | | 862,093 | | | | 13,135,712 | | | | 304,935 | | | | 4,820,337 | |
Class C | | | 77,032 | | | | 1,001,064 | | | | 26,206 | | | | 364,560 | |
Class R6 | | | 14,756 | 2 | | | 297,716 | 2 | | | N/A | | | | N/A | |
Administrator Class | | | 429,821 | | | | 7,044,106 | | | | 418,055 | | | | 6,747,014 | |
Institutional Class | | | 9,474,160 | | | | 157,333,266 | | | | 5,505,435 | | | | 91,822,139 | |
| | | | |
| | | | |
| | | | | | | 178,811,864 | | | | | | | | 103,754,050 | |
| | | | |
Reinvestment of distributions | | | | |
Class A | | | 2,156,211 | | | | 27,319,193 | | | | 1,097,179 | | | | 15,689,654 | |
Class C | | | 82,682 | | | | 901,234 | | | | 34,857 | | | | 446,164 | |
Class R6 | | | 2,781 | 2 | | | 38,603 | 2 | | | N/A | | | | N/A | |
Administrator Class | | | 670,663 | | | | 8,812,510 | | | | 398,600 | | | | 5,863,399 | |
Institutional Class | | | 7,302,150 | | | | 101,353,848 | | | | 3,940,125 | | | | 60,402,110 | |
| | | | |
| | | | |
| | | | | | | 138,425,388 | | | | | | | | 82,401,327 | |
| | | | |
Payment for shares redeemed | | | | |
Class A | | | (1,230,646 | ) | | | (18,738,814 | ) | | | (1,293,442 | ) | | | (20,049,449 | ) |
Class C | | | (283,432 | ) | | | (3,327,781 | ) | | | (35,973 | ) | | | (509,745 | ) |
Class R6 | | | (16,029 | )2 | | | (224,477 | )2 | | | N/A | | | | N/A | |
Administrator Class | | | (2,404,440 | ) | | | (34,455,016 | ) | | | (1,240,005 | ) | | | (19,665,862 | ) |
Institutional Class | | | (10,946,323 | ) | | | (181,113,056 | ) | | | (10,895,635 | ) | | | (180,356,163 | ) |
| | | | |
| | | | |
| | | | | | | (237,859,144 | ) | | | | | | | (220,581,219 | ) |
| | | | |
Net increase (decrease) in net assets resulting from capital share transactions | | | | | | | 79,378,108 | | | | | | | | (34,425,842 | ) |
| | | | |
Total increase (decrease) in net assets | | | | | | | (67,475,259 | ) | | | | | | | 98,016,248 | |
| | | | |
| | |
Net assets | | | | | | | | |
Beginning of period | | | | | | | 816,779,119 | | | | | | | | 718,762,871 | |
| | | | |
End of period | | | | | | $ | 749,303,860 | | | | | | | $ | 816,779,119 | |
| | | | |
| 1 | Effective for all filings after November 4, 2018, the SEC prospectively eliminated the requirement to parenthetically disclose undistributed net investment income at the end of the period and permitted the aggregation of distributions, with the exception of tax basis returns of capital. Accumulated net investment loss at May 31, 2018 was $1,472,576. The disaggregated distributions information for the year ended May 31, 2018 is included in Note 7,Distributions to Shareholders, in the notes to the financial statements. |
| 2 | For the period from July 31, 2018 (commencement of class operations) to May 31, 2019 |
The accompanying notes are an integral part of these financial statements.
| | | | | | |
| Financial highlights | | Wells Fargo Emerging Growth Fund | | | 15 | |
(For a share outstanding throughout each period)
| | | | | | | | | | | | | | | | | | | | |
| | | Year ended May 31 | |
| CLASS A | | 2019 | | | 2018 | | | 2017 | | | 2016 | | | 2015 | |
Net asset value, beginning of period | | | $17.04 | | | | $14.57 | | | | $12.55 | | | | $16.70 | | | | $14.61 | |
Net investment loss | | | (0.16 | )1 | | | (0.15 | ) | | | (0.10 | )1 | | | (0.13 | )1 | | | (0.22 | ) |
Net realized and unrealized gains (losses) on investments | | | (0.19 | ) | | | 4.57 | | | | 2.96 | | | | (2.28 | ) | | | 3.51 | |
| | | | | | | | | | | | | | | | | | | | |
Total from investment operations | | | (0.35 | ) | | | 4.42 | | | | 2.86 | | | | (2.41 | ) | | | 3.29 | |
Distributions to shareholders from | | | | | | | | | | | | |
Net realized gains | | | (3.18 | ) | | | (1.95 | ) | | | (0.84 | ) | | | (1.74 | ) | | | (1.20 | ) |
Net asset value, end of period | | | $13.51 | | | | $17.04 | | | | $14.57 | | | | $12.55 | | | | $16.70 | |
Total return2 | | | (0.84 | )% | | | 32.91 | % | | | 23.39 | % | | | (14.94 | )% | | | 23.32 | % |
Ratios to average net assets (annualized) | | | | | | | | | | | | |
Gross expenses3 | | | 1.35 | % | | | 1.36 | % | | | 1.36 | % | | | 1.35 | % | | | 1.39 | % |
Net expenses3 | | | 1.29 | % | | | 1.35 | % | | | 1.35 | % | | | 1.35 | % | | | 1.37 | % |
Net investment loss3 | | | (1.06 | )% | | | (1.01 | )% | | | (0.72 | )% | | | (0.92 | )% | | | (1.20 | )% |
Supplemental data | | | | | | | | | | | | |
Portfolio turnover rate4 | | | 71 | % | | | 47 | % | | | 115 | % | | | 68 | % | | | 56 | % |
Net assets, end of period (000s omitted) | | | $145,898 | | | | $153,526 | | | | $129,724 | | | | $127,154 | | | | $131,638 | |
| 1 | Calculated based upon average shares outstanding |
| 2 | Total return calculations do not include any sales charges. |
| 3 | Ratios include net expenses allocated from the affiliated Master Portfolio which were as follows: |
| | | | |
Year ended May 31, 2019 | | | 0.81 | % |
Year ended May 31, 2018 | | | 0.81 | % |
Year ended May 31, 2017 | | | 0.81 | % |
Year ended May 31, 2016 | | | 0.80 | % |
Year ended May 31, 2015 | | | 0.80 | % |
| 4 | Portfolio turnover rate is calculated by multiplying the affiliated Master Portfolio’s percentage of the Fund’s total investments in securities at the end of the period by the affiliated Master Portfolio’s portfolio turnover rate. |
The accompanying notes are an integral part of these financial statements.
| | | | |
| 16 | | Wells Fargo Emerging Growth Fund | | Financial highlights |
(For a share outstanding throughout each period)
| | | | | | | | | | | | | | | | | | | | |
| | | Year ended May 31 | |
| CLASS C | | 2019 | | | 2018 | | | 2017 | | | 2016 | | | 2015 | |
Net asset value, beginning of period | | | $15.19 | | | | $13.28 | | | | $11.58 | | | | $15.67 | | | | $13.88 | |
Net investment loss | | | (0.25 | )1 | | | (0.25 | )1 | | | (0.19 | )1 | | | (0.21 | ) | | | (0.33 | ) |
Net realized and unrealized gains (losses) on investments | | | (0.18 | ) | | | 4.11 | | | | 2.73 | | | | (2.14 | ) | | | 3.32 | |
| | | | | | | | | | | | | | | | | | | | |
Total from investment operations | | | (0.43 | ) | | | 3.86 | | | | 2.54 | | | | (2.35 | ) | | | 2.99 | |
Distributions to shareholders from | | | | | | | | | | | | | | | | |
Net realized gains | | | (3.18 | ) | | | (1.95 | ) | | | (0.84 | ) | | | (1.74 | ) | | | (1.20 | ) |
Net asset value, end of period | | | $11.58 | | | | $15.19 | | | | $13.28 | | | | $11.58 | | | | $15.67 | |
Total return2 | | | (1.55 | )% | | | 31.82 | % | | | 22.56 | % | | | (15.59 | )% | | | 22.35 | % |
Ratios to average net assets (annualized) | | | | | | | | | | | | | | | | |
Gross expenses3 | | | 2.10 | % | | | 2.11 | % | | | 2.11 | % | | | 2.10 | % | | | 2.14 | % |
Net expenses3 | | | 2.04 | % | | | 2.10 | % | | | 2.10 | % | | | 2.10 | % | | | 2.12 | % |
Net investment loss3 | | | (1.78 | )% | | | (1.76 | )% | | | (1.46 | )% | | | (1.70 | )% | | | (1.95 | )% |
Supplemental data | | | | | | | | | | | | | | | | |
Portfolio turnover rate4 | | | 71 | % | | | 47 | % | | | 115 | % | | | 68 | % | | | 56 | % |
Net assets, end of period (000s omitted) | | | $1,761 | | | | $4,190 | | | | $3,328 | | | | $3,815 | | | | $5,101 | |
| 1 | Calculated based upon average shares outstanding |
| 2 | Total return calculations do not include any sales charges. |
| 3 | Ratios include net expenses allocated from the affiliated Master Portfolio which were as follows: |
| | | | |
Year ended May 31, 2019 | | | 0.81 | % |
Year ended May 31, 2018 | | | 0.81 | % |
Year ended May 31, 2017 | | | 0.81 | % |
Year ended May 31, 2016 | | | 0.80 | % |
Year ended May 31, 2015 | | | 0.80 | % |
| 4 | Portfolio turnover rate is calculated by multiplying the affiliated Master Portfolio’s percentage of the Fund’s total investments in securities at the end of the period by the affiliated Master Portfolio’s portfolio turnover rate. |
The accompanying notes are an integral part of these financial statements.
| | | | | | |
| Financial highlights | | Wells Fargo Emerging Growth Fund | | | 17 | |
(For a share outstanding throughout the period)
| | | | |
| CLASS R6 | | Year ended
May 31, 20191 | |
Net asset value, beginning of period | | | $18.70 | |
Net investment loss | | | (0.07 | )2 |
Net realized and unrealized gains (losses) on investments | | | (0.59 | ) |
| | | | |
Total from investment operations | | | (0.66 | ) |
Distributions to shareholders from | | | | |
Net realized gains | | | (3.18 | ) |
Net asset value, end of period | | | $14.86 | |
Total return3 | | | (2.35 | )% |
Ratios to average net assets (annualized) | | | | |
Gross expenses4 | | | 0.92 | % |
Net expenses4 | | | 0.85 | % |
Net investment loss4 | | | (0.51 | )% |
Supplemental data | | | | |
Portfolio turnover rate5 | | | 71 | % |
Net assets, end of period (000s omitted) | | | $22 | |
| 1 | For the period from July, 31, 2018 (commencement of class operations) to May 31, 2019 |
| 2 | Calculated based upon average shares outstanding |
| 3 | Returns for periods of less than one year are not annualized. |
| 4 | Ratio includes net expenses allocated from the affiliated Master Portfolio in the amount of 0.81%. |
| 5 | Portfolio turnover rate is calculated by multiplying the affiliated Master Portfolio’s percentage of the Fund’s total investments in securities at the end of the period by the affiliated Master Portfolio’s portfolio turnover rate. |
The accompanying notes are an integral part of these financial statements.
| | | | |
| 18 | | Wells Fargo Emerging Growth Fund | | Financial highlights |
(For a share outstanding throughout each period)
| | | | | | | | | | | | | | | | | | | | |
| | | Year ended May 31 | |
| ADMINISTRATOR CLASS | | 2019 | | | 2018 | | | 2017 | | | 2016 | | | 2015 | |
Net asset value, beginning of period | | | $17.54 | | | | $14.93 | | | | $12.82 | | | | $17.00 | | | | $14.83 | |
Net investment loss | | | (0.15 | )1 | | | (0.14 | )1 | | | (0.07 | )1 | | | (0.12 | )1 | | | (0.16 | )1 |
Net realized and unrealized gains (losses) on investments | | | (0.19 | ) | | | 4.70 | | | | 3.02 | | | | (2.32 | ) | | | 3.53 | |
| | | | | | | | | | | | | | | | | | | | |
Total from investment operations | | | (0.34 | ) | | | 4.56 | | | | 2.95 | | | | (2.44 | ) | | | 3.37 | |
Distributions to shareholders from | | | | | | | | | | | | | | | | | | | | |
Net realized gains | | | (3.18 | ) | | | (1.95 | ) | | | (0.84 | ) | | | (1.74 | ) | | | (1.20 | ) |
Net asset value, end of period | | | $14.02 | | | | $17.54 | | | | $14.93 | | | | $12.82 | | | | $17.00 | |
Total return | | | (0.75 | )% | | | 33.06 | % | | | 23.60 | % | | | (14.80 | )% | | | 23.45 | % |
Ratios to average net assets (annualized) | | | | | | | | | | | | | | | | | | | | |
Gross expenses2 | | | 1.27 | % | | | 1.28 | % | | | 1.26 | % | | | 1.23 | % | | | 1.21 | % |
Net expenses2 | | | 1.20 | % | | | 1.20 | % | | | 1.20 | % | | | 1.20 | % | | | 1.20 | % |
Net investment loss2 | | | (0.94 | )% | | | (0.86 | )% | | | (0.48 | )% | | | (0.80 | )% | | | (1.03 | )% |
Supplemental data | | | | | | | | | | | | | | | | | | | | |
Portfolio turnover rate3 | | | 71 | % | | | 47 | % | | | 115 | % | | | 68 | % | | | 56 | % |
Net assets, end of period (000s omitted) | | | $23,549 | | | | $52,335 | | | | $50,865 | | | | $99,792 | | | | $159,813 | |
| 1 | Calculated based upon average shares outstanding |
| 2 | Ratios include net expenses allocated from the affiliated Master Portfolio which were as follows: |
| | | | |
Year ended May 31, 2019 | | | 0.81 | % |
Year ended May 31, 2018 | | | 0.81 | % |
Year ended May 31, 2017 | | | 0.81 | % |
Year ended May 31, 2016 | | | 0.80 | % |
Year ended May 31, 2015 | | | 0.80 | % |
| 3 | Portfolio turnover rate is calculated by multiplying the affiliated Master Portfolio’s percentage of the Fund’s total investments in securities at the end of the period by the affiliated Master Portfolio’s portfolio turnover rate. |
The accompanying notes are an integral part of these financial statements.
| | | | | | |
| Financial highlights | | Wells Fargo Emerging Growth Fund | | | 19 | |
(For a share outstanding throughout each period)
| | | | | | | | | | | | | | | | | | | | |
| | | Year ended May 31 | |
| INSTITUTIONAL CLASS | | 2019 | | | 2018 | | | 2017 | | | 2016 | | | 2015 | |
Net asset value, beginning of period | | | $18.30 | | | | $15.46 | | | | $13.20 | | | | $17.40 | | | | $15.11 | |
Net investment loss | | | (0.13 | ) | | | (0.09 | ) | | | (0.04 | )1 | | | (0.07 | ) | | | (0.12 | ) |
Net realized and unrealized gains (losses) on investments | | | (0.16 | ) | | | 4.88 | | | | 3.14 | | | | (2.39 | ) | | | 3.61 | |
| | | | | | | | | | | | | | | | | | | | |
Total from investment operations | | | (0.29 | ) | | | 4.79 | | | | 3.10 | | | | (2.46 | ) | | | 3.49 | |
Distributions to shareholders from | | | | | | | | | | | | | | | | |
Net realized gains | | | (3.18 | ) | | | (1.95 | ) | | | (0.84 | ) | | | (1.74 | ) | | | (1.20 | ) |
Net asset value, end of period | | | $14.83 | | | | $18.30 | | | | $15.46 | | | | $13.20 | | | | $17.40 | |
Total return | | | (0.42 | )% | | | 33.44 | % | | | 24.08 | % | | | (14.62 | )% | | | 23.89 | % |
Ratios to average net assets (annualized) | | | | | | | | | | | | | | | | |
Gross expenses2 | | | 1.02 | % | | | 1.03 | % | | | 1.03 | % | | | 1.01 | % | | | 0.96 | % |
Net expenses2 | | | 0.90 | % | | | 0.90 | % | | | 0.90 | % | | | 0.90 | % | | | 0.90 | % |
Net investment loss2 | | | (0.67 | )% | | | (0.56 | )% | | | (0.24 | )% | | | (0.50 | )% | | | (0.73 | )% |
Supplemental data | | | | | | | | | | | | | | | | |
Portfolio turnover rate3 | | | 71 | % | | | 47 | % | | | 115 | % | | | 68 | % | | | 56 | % |
Net assets, end of period (000s omitted) | | | $578,073 | | | | $606,729 | | | | $534,846 | | | | $583,843 | | | | $723,946 | |
| 1 | Calculated based upon average shares outstanding |
| 2 | Ratios include net expenses allocated from the affiliated Master Portfolio which were as follows: |
| | | | |
Year ended May 31, 2019 | | | 0.81 | % |
Year ended May 31, 2018 | | | 0.81 | % |
Year ended May 31, 2017 | | | 0.81 | % |
Year ended May 31, 2016 | | | 0.80 | % |
Year ended May 31, 2015 | | | 0.80 | % |
| 3 | Portfolio turnover rate is calculated by multiplying the affiliated Master Portfolio’s percentage of the Fund’s total investments in securities at the end of the period by the affiliated Master Portfolio’s portfolio turnover rate. |
The accompanying notes are an integral part of these financial statements.
| | | | |
| 20 | | Wells Fargo Emerging Growth Fund | | Notes to financial statements |
1. ORGANIZATION
Wells Fargo Funds Trust (the “Trust”), a Delaware statutory trust organized on March 10, 1999, is an open-end management investment company registered under the Investment Company Act of 1940, as amended (the “1940 Act”). As an investment company, the Trust follows the accounting and reporting guidance in Financial Accounting Standards Board (“FASB”) Accounting Standards Codification Topic 946, Financial Services – Investment Companies. These financial statements report on the Wells Fargo Emerging Growth Fund (the “Fund”) which is a diversified series of the Trust.
The Fund is a feeder fund in a master-feeder structure that invests substantially all of its assets in a single master portfolio with a substantially identical investment objective and substantially similar investment strategies. The Fund seeks to achieve its investment objective by investing substantially all of its assets in a separate diversified portfolio (the “affiliated Master Portfolio”) of Wells Fargo Master Trust, a registered open-end management investment company. The affiliated Master Portfolio directly acquires portfolio securities and the Fund acquires an indirect interest in those securities. The Fund accounts for its investment in the affiliated Master Portfolio as a partnership investment and records on a daily basis its share of the affiliated Master Portfolio’s income, expense and realized and unrealized gains and losses. The financial statements of the affiliated Master Portfolio for the year ended May 31, 2019 are included in this report and should be read in conjunction with the Fund’s financial statements. As of May 31, 2019, the Fund owned 91% of Wells Fargo Emerging Growth Portfolio.
2. SIGNIFICANT ACCOUNTING POLICIES
The following significant accounting policies, which are consistently followed in the preparation of the financial statements of the Fund, are in conformity with U.S. generally accepted accounting principles which require management to make estimates and assumptions that affect the reported amounts of assets and liabilities, disclosure of contingent assets and liabilities at the date of the financial statements, and the reported amounts of revenues and expenses during the reporting period. Actual results could differ from those estimates.
Securities valuation
All investments are valued each business day as of the close of regular trading on the New York Stock Exchange (generally 4 p.m. Eastern Time), although the Fund may deviate from this calculation time under unusual or unexpected circumstances.
Investments in the affiliated Master Portfolio are valued daily based on the Fund’s proportionate share of the affiliated Master Portfolio’s net assets, which are also valued daily. Securities held in the affiliated Master Portfolio are valued as discussed in the Notes to Financial Statements of the affiliated Master Portfolio, which are included elsewhere in this report.
Investment transactions, income and expenses
Investments in the affiliated Master Portfolio are recorded on a trade basis. The Fund records daily its proportionate share of the affiliated Master Portfolio’s dividend income, expenses and realized and unrealized gains or losses. The Fund also accrues its own expenses.
Distributions to shareholders
Distributions to shareholders from net investment income and any net realized gains are recorded on the ex-dividend date and paid at least annually. Such distributions are determined in accordance with income tax regulations and may differ from U.S. generally accepted accounting principles. Dividend sources are estimated at the time of declaration. The tax character of distributions is determined as of the Fund’s fiscal year end. Therefore, a portion of the Fund’s distributions made prior to the Fund’s fiscal year end may be categorized as a tax return of capital at year end.
Federal and other taxes
The Fund intends to continue to qualify as a regulated investment company by distributing substantially all of its investment company taxable income and any net realized capital gains (after reduction for capital loss carryforwards) sufficient to relieve it from all, or substantially all, federal income taxes. Accordingly, no provision for federal income taxes was required.
The Fund’s income and federal excise tax returns and all financial records supporting those returns for the prior three fiscal years are subject to examination by the federal and Delaware revenue authorities. Management has analyzed the Fund’s tax positions taken on federal, state, and foreign tax returns for all open tax years and does not believe that there are any uncertain tax positions that require recognition of a tax liability.
As of May 31, 2019, the aggregate cost of all investments for federal income tax purposes was $530,124,897 and the unrealized gains (losses) consisted of:
| | | | |
| |
Gross unrealized gains | | $ | 218,769,600 | |
| |
Gross unrealized losses | | | 0 | |
| |
Net unrealized gains | | $ | 218,769,600 | |
| | | | | | |
| Notes to financial statements | | Wells Fargo Emerging Growth Fund | | | 21 | |
As of May 31, 2019, the Fund had current year deferred post-October capital losses and a qualified late-year ordinary loss which will both be recognized on the first day of the following fiscal year in the following amounts:
| | |
Deferred post-October capital losses | | Late-year ordinary losses deferred |
| Short-term |
| |
| $(24,372,603) | | $(2,341,222) |
Class allocations
The separate classes of shares offered by the Fund differ principally in applicable sales charges, distribution, shareholder servicing, and administration fees. Class specific expenses are charged directly to that share class. Investment income, common expenses, and realized and unrealized gains (losses) on investments are allocated daily to each class of shares based on the relative proportion of net assets of each class.
3. FAIR VALUATION MEASUREMENTS
At May 31, 2019, the affiliated Master Portfolio was measured at fair value using the net asset value per share (or its equivalent) as a practical expedient. The investment objective and the value of the affiliate Master Portfolio was as follows:
| | | | |
| Affiliated Master Portfolio | | Investment objective | | Value of
affiliated Master
Portfolio |
| | |
| Wells Fargo Emerging Growth Portfolio | | Seeks long-term capital appreciation | | $748,894,497 |
The affiliated Master Portfolio does not have a redemption period notice, can be redeemed daily and does not have any unfunded commitments.
4. TRANSACTIONS WITH AFFILIATES
Management fee
Wells Fargo Funds Management, LLC (“Funds Management”), an indirect wholly owned subsidiary of Wells Fargo & Company (“Wells Fargo”), is the manager of the Fund and provides advisory and fund-level administrative services under an investment management agreement. Under the investment management agreement, Funds Management is responsible for, among other services, implementing the investment objectives and strategies of the Fund and providing fund-level administrative services in connection with the Fund’s operations. As long as the Fund continues to invest substantially all of its assets in a single affiliated Master Portfolio, the Fund pays Funds Management an investment management fee only for fund-level administrative services at the following annual rate based on the Fund’s average daily net assets:
| | |
| |
| Average daily net assets | | Management fee |
| |
First $5 billion | | 0.05% |
| |
Next $5 billion | | 0.04 |
| |
Over $10 billion | | 0.03 |
For the year ended May 31, 2019, the management fee was equivalent to an annual rate of 0.05% of the Fund’s average daily net assets.
Funds Management also serves as the adviser to the affiliated Master Portfolio and is entitled to receive a fee from the affiliated Master Portfolio for those services.
| | | | |
| 22 | | Wells Fargo Emerging Growth Fund | | Notes to financial statements |
Administration fees
Under a class-level administration agreement, Funds Management provides class-level administrative services to the Fund, which includes paying fees and expenses for services provided by the transfer agent, sub-transfer agents, omnibus account servicers and record-keepers. As compensation for its services under the class-level administration agreement, Funds Management receives an annual fee which is calculated based on the average daily net assets of each class as follows:
| | | | |
| | | Class-level
administration fee | |
| |
Class A, Class C | | | 0.21 | % |
| |
Class R6 | | | 0.03 | |
| |
Administrator Class, Institutional Class | | | 0.13 | |
Funds Management has contractually waived and/or reimbursed management and administration fees to the extent necessary to maintain certain net operating expense ratios for the Fund. When each class of the Fund has exceeded its expense cap, Funds Management has waived fees and/or reimbursed expenses from fund level expenses on a proportionate basis and then from class specific expenses. When only certain classes exceed their expense caps, waivers and/or reimbursements are applied against class specific expenses before fund level expenses. Net expenses from the affiliated Master Portfolio are included in the expense caps. Funds Management has committed through September 30, 2019 to waive fees and/or reimburse expenses to the extent necessary to cap the Fund’s expenses at 1.28% for Class A shares, 2.03% for Class C shares, 0.85% for Class R6 shares, 1.20% for Administrator Class shares, and 0.90% for Institutional Class shares. Prior to or after the commitment expiration date, the cap may be increased or the commitment to maintain the cap may be terminated only with the approval of the Board of Trustees. Prior to August 1, 2018, the Fund’s expenses were capped at 1.35% for Class A shares and 2.10% for Class C shares.
Distribution fee
The Trust has adopted a distribution plan for Class C shares of the Fund pursuant to Rule 12b-1 under the 1940 Act. A distribution fee is charged to Class C shares and paid to Wells Fargo Funds Distributor, LLC (“Funds Distributor”), the principal underwriter, at an annual rate of 0.75% of the average daily net assets of Class C shares.
In addition, Funds Distributor is entitled to receive the front-end sales charge from the purchase of Class A shares and a contingent deferred sales charge on the redemption of certain Class A shares. Funds Distributor is also entitled to receive the contingent deferred sales charges from redemptions of Class C shares. For the year ended May 31, 2019, Funds Distributor received $3,144 from the sale of Class A shares. No contingent deferred sales charges were incurred by Class A and Class C shares for the year ended May 31, 2019.
Shareholder servicing fees
The Trust has entered into contracts with one or more shareholder servicing agents, whereby Class A, Class C, and Administrator Class of the Fund are charged a fee at an annual rate of 0.25% of the average daily net assets of each respective class. A portion of these total shareholder servicing fees were paid to affiliates of Wells Fargo.
5. INVESTMENT PORTFOLIO TRANSACTIONS
The Fund seeks to achieve its investment objective by investing substantially all of its assets in a single affiliated Master Portfolio. Purchases and sales have been calculated by multiplying the Fund’s ownership percentage of the affiliated Master Portfolio by the affiliated Master Portfolio’s purchases and sales. Purchases and sales of investments, excluding short-term securities, for the year ended May 31, 2019 were $563,678,269 and $615,266,379, respectively.
6. BANK BORROWINGS
The Trust (excluding the money market funds), Wells Fargo Master Trust and Wells Fargo Variable Trust are parties to a $280,000,000 revolving credit agreement whereby the Fund is permitted to use bank borrowings for temporary or emergency purposes, such as to fund shareholder redemption requests. Interest under the credit agreement is charged to the Fund based on a borrowing rate equal to the higher of the Federal Funds rate in effect on that day plus 1.25% or the overnight LIBOR rate in effect on that day plus 1.25%. In addition, an annual commitment fee equal to 0.25% of the unused balance is allocated to each participating fund.
For the year ended May 31, 2019, there were no borrowings by the Fund under the agreement.
| | | | | | |
| Notes to financial statements | | Wells Fargo Emerging Growth Fund | | | 23 | |
7. DISTRIBUTIONS TO SHAREHOLDERS
The tax character of distributions paid during the years ended May 31, 2019 and May 31, 2018 were as follows:
| | | | | | | | |
| | | Year ended May 31 | |
| | |
| | | 2019 | | | 2018 | |
| | |
Ordinary income | | $ | 14,567,564 | | | $ | 114,038 | |
| | |
Long-term capital gain | | | 126,111,778 | | | | 84,810,687 | |
As of May 31, 2019, the components of distributable earnings on a tax basis were as follows:
| | | | | | |
Undistributed
long-term
gain | | Unrealized
gains | | Late-year
ordinary losses
deferred | | Post-October
capital losses
deferred |
| | | |
| $37,749,149 | | $218,769,600 | | $(2,341,222) | | $(24,372,603) |
Effective for all filings after November 4, 2018, the Securities and Exchange Commission eliminated the requirement to separately state the components of distributions to shareholders under U.S. generally accepted accounting principles. The amounts of distributions to shareholders for the year ended May 31, 2018 were as follows:
| | | | |
| | | Net
realized
gains | |
| |
Class A | | | $16,172,743 | |
| |
Class C | | | 446,164 | |
| |
Administrator Class | | | 5,883,416 | |
| |
Institutional Class | | | 62,422,402 | |
8. CONCENTRATION RISK
Concentration risk results from exposure to a limited number of sectors. Through its investment in the affiliated Master Portfolio which may invest a substantial portion of its assets in any sector, the Fund may in turn be more affected by changes in that sector than a fund whose investments are not heavily weighted in any sector.
9. INDEMNIFICATION
Under the Trust’s organizational documents, the officers and Trustees have been granted certain indemnification rights against certain liabilities that may arise out of performance of their duties to the Trust. Additionally, in the normal course of business, the Trust may enter into contracts with service providers that contain a variety of indemnification clauses. The Trust’s maximum exposure under these arrangements is dependent on future claims that may be made against the Fund and, therefore, cannot be estimated.
10. NEW ACCOUNTING PRONOUNCEMENT
In August 2018, FASB issued Accounting Standards Update (“ASU”) No. 2018-13, Fair Value Measurement (Topic 820)Disclosure Framework—Changes to the Disclosure Requirements for Fair Value Measurement. ASU 2018-13 updates the disclosure requirements for fair value measurements by modifying or removing certain disclosures and adding certain new disclosures. The amendments are effective for fiscal years, and interim periods within those fiscal years, beginning after December 15, 2019. Early adoption is permitted. Management has adopted the removal and modification of disclosures early, as permitted, and will adopt the additional new disclosures at the effective date.
| | | | |
| 24 | | Wells Fargo Emerging Growth Fund | | Report of independent registered public accounting firm |
TO THE SHAREHOLDERS OF THE FUND AND BOARD OF TRUSTEES OF WELLS FARGO FUNDS TRUST:
Opinion on the Financial Statements
We have audited the accompanying statement of assets and liabilities of Wells Fargo Emerging Growth Fund (the Fund), one of the funds constituting Wells Fargo Funds Trust, including the portfolio of investments, as of May 31, 2019, the related statement of operations for the year then ended, the statements of changes in net assets for each of the years in the two-year period then ended, and the related notes (collectively, the financial statements) and the financial highlights for each of the years or periods in the five-year period then ended. In our opinion, the financial statements and financial highlights present fairly, in all material respects, the financial position of the Fund as of May 31, 2019, the results of its operations for the year then ended, the changes in its net assets for each of the years in the two-year period then ended, and the financial highlights for each of the years or periods in the five-year period then ended, in conformity with U.S. generally accepted accounting principles.
Basis for Opinion
These financial statements and financial highlights are the responsibility of the Fund’s management. Our responsibility is to express an opinion on these financial statements and financial highlights based on our audits. We are a public accounting firm registered with the Public Company Accounting Oversight Board (United States) (PCAOB) and are required to be independent with respect to the Fund in accordance with the U.S. federal securities laws and the applicable rules and regulations of the Securities and Exchange Commission and the PCAOB.
We conducted our audits in accordance with the standards of the PCAOB. Those standards require that we plan and perform the audit to obtain reasonable assurance about whether the financial statements and financial highlights are free of material misstatement, whether due to error or fraud. Our audits included performing procedures to assess the risks of material misstatement of the financial statements and financial highlights, whether due to error or fraud, and performing procedures that respond to those risks. Such procedures included examining, on a test basis, evidence regarding the amounts and disclosures in the financial statements and financial highlights. Such procedures also included confirmation of securities owned as of May 31, 2019, by correspondence with the transfer agent. Our audits also included evaluating the accounting principles used and significant estimates made by management, as well as evaluating the overall presentation of the financial statements and financial highlights. We believe that our audits provide a reasonable basis for our opinion.

We have not been able to determine the specific year that we began serving as the auditor of one or more Wells Fargo Funds investment companies; however we are aware that we have served as the auditor of one or more Wells Fargo Funds investment companies since at least 1955.
Boston, Massachusetts
July 26, 2019
| | | | | | |
| Portfolio of investments—May 31, 2019 | | Wells Fargo Emerging Growth Portfolio | | | 25 | |
| | | | | | | | | | | | | | | | |
| Security name | | | | | | | | Shares | | | Value | |
| | | | |
Common Stocks: 99.51% | | | | | | | | | | | | | | | | |
| | | | |
Communication Services: 0.70% | | | | | | | | | | | | | | | | |
| | | | |
| Entertainment: 0.19% | | | | | | | | | | | | | | | | |
| | | | |
SciPlay Corporation Class A † | | | | | | | | | | | 95,634 | | | $ | 1,530,144 | |
| | | | | | | | | | | | | | | | |
| | | | |
| Media: 0.51% | | | | | | | | | | | | | | | | |
| | | | |
Nexstar Media Group Incorporated Class A | | | | | | | | | | | 42,200 | | | | 4,226,330 | |
| | | | | | | | | | | | | | | | |
| | | | |
Consumer Discretionary: 13.30% | | | | | | | | | | | | | | | | |
| | | | |
| Auto Components: 0.81% | | | | | | | | | | | | | | | | |
| | | | |
Fox Factory Holding Corporation † | | | | | | | | | | | 98,500 | | | | 6,601,470 | |
| | | | | | | | | | | | | | | | |
| | | | |
| Diversified Consumer Services: 2.06% | | | | | | | | | | | | | | | | |
| | | | |
Chegg Incorporated † | | | | | | | | | | | 299,114 | | | | 11,204,810 | |
| | | | |
Grand Canyon Education Incorporated † | | | | | | | | | | | 47,360 | | | | 5,676,570 | |
| |
| | | | 16,881,380 | |
| | | | | | | | | | | | | | | | |
| | | | |
| Hotels, Restaurants & Leisure: 4.56% | | | | | | | | | | | | | | | | |
| | | | |
Dine Brands Global Incorporated | | | | | | | | | | | 38,500 | | | | 3,635,170 | |
| | | | |
Eldorado Resorts Incorporated † | | | | | | | | | | | 126,300 | | | | 6,210,171 | |
| | | | |
Planet Fitness Incorporated Class A † | | | | | | | | | | | 197,660 | | | | 15,115,060 | |
| | | | |
Wingstop Incorporated | | | | | | | | | | | 155,918 | | | | 12,423,546 | |
| |
| | | | 37,383,947 | |
| | | | | | | | | | | | | | | | |
| | | | |
| Internet & Direct Marketing Retail: 0.24% | | | | | | | | | | | | | | | | |
| | | | |
Farfetch Limited Class A Ǡ | | | | | | | | | | | 97,822 | | | | 1,961,331 | |
| | | | | | | | | | | | | | | | |
| | | | |
| Leisure Products: 0.87% | | | | | | | | | | | | | | | | |
| | | | |
Mastercraft Boat Holdings Incorporated † | | | | | | | | | | | 134,816 | | | | 2,677,446 | |
| | | | |
Yeti Holdings Incorporated Ǡ | | | | | | | | | | | 187,148 | | | | 4,476,580 | |
| |
| | | | 7,154,026 | |
| | | | | | | | | | | | | | | | |
| | | | |
| Multiline Retail: 2.15% | | | | | | | | | | | | | | | | |
| | | | |
Ollie’s Bargain Outlet Holdings Incorporated † | | | | | | | | | | | 178,660 | | | | 17,637,315 | |
| | | | | | | | | | | | | | | | |
| | | | |
| Specialty Retail: 2.19% | | | | | | | | | | | | | | | | |
| | | | |
Five Below Incorporated † | | | | | | | | | | | 55,697 | | | | 7,169,875 | |
| | | | |
Lithia Motors Incorporated Class A | | | | | | | | | | | 94,780 | | | | 10,819,137 | |
| |
| | | | 17,989,012 | |
| | | | | | | | | | | | | | | | |
| | | | |
| Textiles, Apparel & Luxury Goods: 0.42% | | | | | | | | | | | | | | | | |
| | | | |
Deckers Outdoor Corporation † | | | | | | | | | | | 22,500 | | | | 3,422,250 | |
| | | | | | | | | | | | | | | | |
| | | | |
Consumer Staples: 3.42% | | | | | | | | | | | | | | | | |
| | | | |
| Beverages: 0.69% | | | | | | | | | | | | | | | | |
| | | | |
Boston Beer Company Incorporated † | | | | | | | | | | | 18,000 | | | | 5,657,400 | |
| | | | | | | | | | | | | | | | |
| | | | |
| Food & Staples Retailing: 0.84% | | | | | | | | | | | | | | | | |
| | | | |
The Chef’s Warehouse Incorporated † | | | | | | | | | | | 218,000 | | | | 6,904,060 | |
| | | | | | | | | | | | | | | | |
The accompanying notes are an integral part of these financial statements.
| | | | |
| 26 | | Wells Fargo Emerging Growth Portfolio | | Portfolio of investments—May 31, 2019 |
| | | | | | | | | | | | | | | | |
| Security name | | | | | | | | Shares | | | Value | |
| | | | |
| Food Products: 1.14% | | | | | | | | | | | | | | | | |
| | | | |
Freshpet Incorporated † | | | | | | | | | | | 200,812 | | | $ | 9,331,734 | |
| | | | | | | | | | | | | | | | |
| | | | |
| Personal Products: 0.75% | | | | | | | | | | | | | | | | |
| | | | |
Inter Parfums Incorporated | | | | | | | | | | | 94,300 | | | | 6,108,754 | |
| | | | | | | | | | | | | | | | |
| | | | |
Energy: 1.01% | | | | | | | | | | | | | | | | |
| | | | |
| Energy Equipment & Services: 0.47% | | | | | | | | | | | | | | | | |
| | | | |
Cactus Incorporated Class A † | | | | | | | | | | | 119,199 | | | | 3,879,927 | |
| | | | | | | | | | | | | | | | |
| | | | |
| Oil, Gas & Consumable Fuels: 0.54% | | | | | | | | | | | | | | | | |
| | | | |
Matador Resources Company † | | | | | | | | | | | 141,236 | | | | 2,321,920 | |
| | | | |
PDC Energy Incorporated † | | | | | | | | | | | 67,290 | | | | 2,053,691 | |
| | | | |
| | | | | | | | | | | | | | | 4,375,611 | |
| | | | | | | | | | | | | | | | |
| | | | |
Financials: 7.73% | | | | | | | | | | | | | | | | |
| | | | |
| Capital Markets: 1.96% | | | | | | | | | | | | | | | | |
| | | | |
Stifel Financial Corporation | | | | | | | | | | | 300,000 | | | | 16,089,000 | |
| | | | | | | | | | | | | | | | |
| | | | |
| Insurance: 3.73% | | | | | | | | | | | | | | | | |
| | | | |
Goosehead Insurance Incorporated Class A | | | | | | | | | | | 101,163 | | | | 3,705,601 | |
| | | | |
Kinsale Capital Group Incorporated | | | | | | | | | | | 255,179 | | | | 21,381,448 | |
| | | | |
Trupanion Incorporated Ǡ | | | | | | | | | | | 185,300 | | | | 5,434,849 | |
| | | | |
| | | | | | | | | | | | | | | 30,521,898 | |
| | | | | | | | | | | | | | | | |
| | | | |
| Thrifts & Mortgage Finance: 2.04% | | | | | | | | | | | | | | | | |
| | | | |
LendingTree Incorporated † | | | | | | | | | | | 44,532 | | | | 16,732,454 | |
| | | | | | | | | | | | | | | | |
| | | | |
Health Care: 21.93% | | | | | | | | | | | | | | | | |
| | | | |
| Biotechnology: 3.84% | | | | | | | | | | | | | | | | |
| | | | |
Audentes Therapeutics Incorporated † | | | | | | | | | | | 34,342 | | | | 1,206,091 | |
| | | | |
CareDx Incorporated † | | | | | | | | | | | 337,926 | | | | 10,685,220 | |
| | | | |
Natera Incorporated † | | | | | | | | | | | 150,427 | | | | 3,444,778 | |
| | | | |
Repligen Corporation † | | | | | | | | | | | 231,840 | | | | 16,105,925 | |
| | | | |
| | | | | | | | | | | | | | | 31,442,014 | |
| | | | | | | | | | | | | | | | |
| | | | |
| Health Care Equipment & Supplies: 8.49% | | | | | | | | | | | | | | | | |
| | | | |
Axogen Incorporated † | | | | | | | | | | | 159,377 | | | | 3,335,761 | |
| | | | |
Glaukos Corporation † | | | | | | | | | | | 88,739 | | | | 5,721,891 | |
| | | | |
Inogen Incorporated † | | | | | | | | | | | 52,750 | | | | 3,400,793 | |
| | | | |
iRhythm Technologies Incorporated † | | | | | | | | | | | 134,262 | | | | 9,191,577 | |
| | | | |
Merit Medical Systems Incorporated † | | | | | | | | | | | 290,900 | | | | 15,019,167 | |
| | | | |
Neuronetics Incorporated † | | | | | | | | | | | 186,718 | | | | 2,150,991 | |
| | | | |
Orthopediatrics Corporation † | | | | | | | | | | | 85,101 | | | | 3,306,174 | |
| | | | |
Shockwave Medical Incorporated Ǡ | | | | | | | | | | | 61,908 | | | | 3,701,479 | |
| | | | |
SI-BONE Incorporated † | | | | | | | | | | | 257,997 | | | | 4,331,770 | |
| | | | |
Silk Road Medical Incorporated † | | | | | | | | | | | 38,433 | | | | 1,639,552 | |
| | | | |
STAAR Surgical Company † | | | | | | | | | | | 122,300 | | | | 2,833,691 | |
| | | | |
Tactile Systems Technology Class I † | | | | | | | | | | | 110,773 | | | | 5,320,427 | |
| | | | |
Tandem Diabetes Care Incorporated † | | | | | | | | | | | 77,900 | | | | 5,340,824 | |
| | | | |
Vapotherm Incorporated † | | | | | | | | | | | 254,808 | | | | 4,285,871 | |
| | | | |
| | | | | | | | | | | | | | | 69,579,968 | |
| | | | | | | | | | | | | | | | |
The accompanying notes are an integral part of these financial statements.
| | | | | | |
| Portfolio of investments—May 31, 2019 | | Wells Fargo Emerging Growth Portfolio | | | 27 | |
| | | | | | | | | | | | | | | | |
| Security name | | | | | | | | Shares | | | Value | |
| | | | |
| Health Care Providers & Services: 3.22% | | | | | | | | | | | | | | | | |
| | | | |
Amedisys Incorporated † | | | | | | | | | | | 128,800 | | | $ | 14,465,528 | |
| | | | |
BioTelemetry Incorporated † | | | | | | | | | | | 48,200 | | | | 2,306,852 | |
| | | | |
HealthEquity Incorporated † | | | | | | | | | | | 146,912 | | | | 9,602,168 | |
| | | | |
| | | | | | | | | | | | | | | 26,374,548 | |
| | | | | | | | | | | | | | | | |
| | | | |
| Health Care Technology: 3.32% | | | | | | | | | | | | | | | | |
| | | | |
Tabula Rasa Healthcare Incorporated Ǡ | | | | | | | | | | | 152,900 | | | | 6,906,493 | |
| | | | |
Teladoc Incorporated Ǡ | | | | | | | | | | | 204,679 | | | | 11,895,943 | |
| | | | |
Vocera Communications Incorporated † | | | | | | | | | | | 259,000 | | | | 8,381,240 | |
| | | | |
| | | | | | | | | | | | | | | 27,183,676 | |
| | | | | | | | | | | | | | | | |
| | | | |
| Life Sciences Tools & Services: 2.64% | | | | | | | | | | | | | | | | |
| | | | |
Codexis Incorporated † | | | | | | | | | | | 999,938 | | | | 18,098,878 | |
| | | | |
Neogenomics Incorporated † | | | | | | | | | | | 165,354 | | | | 3,589,835 | |
| | | | |
| | | | | | | | | | | | | | | 21,688,713 | |
| | | | | | | | | | | | | | | | |
| | | | |
| Pharmaceuticals: 0.42% | | | | | | | | | | | | | | | | |
| | | | |
MyoKardia Incorporated † | | | | | | | | | | | 74,400 | | | | 3,465,552 | |
| | | | | | | | | | | | | | | | |
| | | | |
Industrials: 17.82% | | | | | | | | | | | | | | | | |
| | | | |
| Aerospace & Defense: 2.40% | | | | | | | | | | | | | | | | |
| | | | |
Kratos Defense & Security Solutions Incorporated † | | | | | | | | | | | 79,100 | | | | 1,744,155 | |
| | | | |
Mercury Computer Systems Incorporated † | | | | | | | | | | | 260,745 | | | | 17,928,826 | |
| | | | |
| | | | | | | | | | | | | | | 19,672,981 | |
| | | | | | | | | | | | | | | | |
| | | | |
| Airlines: 1.94% | | | | | | | | | | | | | | | | |
| | | | |
SkyWest Incorporated | | | | | | | | | | | 271,030 | | | | 15,914,882 | |
| | | | | | | | | | | | | | | | |
| | | | |
| Commercial Services & Supplies: 3.10% | | | | | | | | | | | | | | | | |
| | | | |
Advanced Disposal Services Incorporated † | | | | | | | | | | | 344,402 | | | | 11,069,080 | |
| | | | |
Casella Waste Systems Incorporated Class A † | | | | | | | | | | | 369,600 | | | | 14,310,912 | |
| | | | |
| | | | | | | | | | | | | | | 25,379,992 | |
| | | | | | | | | | | | | | | | |
| | | | |
| Construction & Engineering: 2.82% | | | | | | | | | | | | | | | | |
| | | | |
Granite Construction Incorporated | | | | | | | | | | | 28,450 | | | | 1,143,406 | |
| | | | |
MasTec Incorporated † | | | | | | | | | | | 472,500 | | | | 21,966,525 | |
| | | | |
| | | | | | | | | | | | | | | 23,109,931 | |
| | | | | | | | | | | | | | | | |
| | | | |
| Electrical Equipment: 0.28% | | | | | | | | | | | | | | | | |
| | | | |
Bloom Energy Corporation Class A Ǡ | | | | | | | | | | | 215,501 | | | | 2,327,411 | |
| | | | | | | | | | | | | | | | |
| | | | |
| Machinery: 3.13% | | | | | | | | | | | | | | | | |
| | | | |
Milacron Holdings Corporation † | | | | | | | | | | | 502,858 | | | | 5,772,810 | |
| | | | |
RBC Bearings Incorporated † | | | | | | | | | | | 17,500 | | | | 2,490,250 | |
| | | | |
Rexnord Corporation † | | | | | | | | | | | 661,910 | | | | 17,414,852 | |
| | | | |
| | | | | | | | | | | | | | | 25,677,912 | |
| | | | | | | | | | | | | | | | |
The accompanying notes are an integral part of these financial statements.
| | | | |
| 28 | | Wells Fargo Emerging Growth Portfolio | | Portfolio of investments—May 31, 2019 |
| | | | | | | | | | | | | | | | |
| Security name | | | | | | | | Shares | | | Value | |
| | | | |
| Professional Services: 3.52% | | | | | | | | | | | | | | | | |
| | | | |
ASGN Incorporated † | | | | | | | | | | | 445,043 | | | $ | 22,577,031 | |
| | | | |
Korn/Ferry International | | | | | | | | | | | 145,600 | | | | 6,272,448 | |
| | | | |
| | | | | | | | | | | | | | | 28,849,479 | |
| | | | | | | | | | | | | | | | |
| | | | |
| Trading Companies & Distributors: 0.63% | | | | | | | | | | | | | | | | |
| | | | |
SiteOne Landscape Supply Incorporated Ǡ | | | | | | | | | | | 79,100 | | | | 5,131,217 | |
| | | | | | | | | | | | | | | | |
| | | | |
Information Technology: 31.74% | | | | | | | | | | | | | | | | |
| | | | |
| Electronic Equipment, Instruments & Components: 2.77% | | | | | | | | | | | | | | | | |
| | | | |
nLight Incorporated Ǡ | | | | | | | | | | | 184,261 | | | | 3,443,838 | |
| | | | |
Novanta Incorporated † | | | | | | | | | | | 240,920 | | | | 19,278,418 | |
| | | | |
| | | | | | | | | | | | | | | 22,722,256 | |
| | | | | | | | | | | | | | | | |
| | | | |
| IT Services: 5.21% | | | | | | | | | | | | | | | | |
| | | | |
Endava plc Sponsored ADR † | | | | | | | | | | | 146,882 | | | | 5,499,262 | |
| | | | |
EVO Payments Incorporated Class A † | | | | | | | | | | | 272,277 | | | | 8,015,835 | |
| | | | |
InterXion Holding NV † | | | | | | | | | | | 342,920 | | | | 25,276,633 | |
| | | | |
Wix.com Limited † | | | | | | | | | | | 28,310 | | | | 3,888,095 | |
| | | | |
| | | | | | | | | | | | | | | 42,679,825 | |
| | | | | | | | | | | | | | | | |
| | | | |
| Semiconductors & Semiconductor Equipment: 2.88% | | | | | | | | | | | | | | | | |
| | | | |
Diodes Incorporated † | | | | | | | | | | | 217,031 | | | | 6,712,769 | |
| | | | |
Monolithic Power Systems Incorporated | | | | | | | | | | | 32,180 | | | | 3,747,361 | |
| | | | |
Semtech Corporation † | | | | | | | | | | | 182,100 | | | | 7,253,043 | |
| | | | |
Silicon Laboratories Incorporated † | | | | | | | | | | | 62,500 | | | | 5,848,125 | |
| | | | |
| | | | | | | | | | | | | | | 23,561,298 | |
| | | | | | | | | | | | | | | | |
| | | | |
| Software: 20.88% | | | | | | | | | | | | | | | | |
| | | | |
Altair Engineering Incorporated Class A † | | | | | | | | | | | 272,253 | | | | 10,375,562 | |
| | | | |
Anaplan Incorporated † | | | | | | | | | | | 188,556 | | | | 8,204,072 | |
| | | | |
BlackLine Incorporated † | | | | | | | | | | | 133,623 | | | | 6,869,558 | |
| | | | |
Cision Limited † | | | | | | | | | | | 601,050 | | | | 6,599,529 | |
| | | | |
Envestnet Incorporated † | | | | | | | | | | | 312,992 | | | | 20,942,295 | |
| | | | |
Everbridge Incorporated † | | | | | | | | | | | 39,100 | | | | 3,074,824 | |
| | | | |
Five9 Incorporated † | | | | | | | | | | | 307,760 | | | | 15,803,476 | |
| | | | |
ForeScout Technologies Incorporated † | | | | | | | | | | | 65,700 | | | | 2,110,284 | |
| | | | |
Globant SA † | | | | | | | | | | | 73,100 | | | | 6,786,604 | |
| | | | |
Proofpoint Incorporated † | | | | | | | | | | | 35,230 | | | | 3,958,443 | |
| | | | |
Q2 Holdings Incorporated † | | | | | | | | | | | 323,543 | | | | 23,696,289 | |
| | | | |
Rapid7 Incorporated † | | | | | | | | | | | 406,136 | | | | 21,220,606 | |
| | | | |
RealPage Incorporated † | | | | | | | | | | | 148,500 | | | | 8,660,520 | |
| | | | |
SailPoint Technologies Holdings Incorporated † | | | | | | | | | | | 265,847 | | | | 4,670,932 | |
| | | | |
Shotspotter Incorporated † | | | | | | | | | | | 233,743 | | | | 10,752,178 | |
| | | | |
SPS Commerce Incorporated † | | | | | | | | | | | 60,448 | | | | 6,161,465 | |
| | | | |
Talend SA ADR † | | | | | | | | | | | 240,818 | | | | 11,231,752 | |
| | | | |
| | | | | | | | | | | | | | | 171,118,389 | |
| | | | | | | | | | | | | | | | |
The accompanying notes are an integral part of these financial statements.
| | | | | | |
| Portfolio of investments—May 31, 2019 | | Wells Fargo Emerging Growth Portfolio | | | 29 | |
| | | | | | | | | | | | | | | | |
| Security name | | | | | | | | Shares | | | Value | |
| | | | |
Materials: 1.86% | | | | | | | | | | | | | | | | |
| | | | |
| Chemicals: 1.37% | | | | | | | | | | | | | | | | |
| | | | |
Ingevity Corporation † | | | | | | | | | | | 56,400 | | | $ | 4,946,280 | |
| | | | |
PQ Group Holdings Incorporated † | | | | | | | | | | | 413,820 | | | | 6,269,373 | |
| | | | |
| | | | | | | | | | | | | | | 11,215,653 | |
| | | | | | | | | | | | | | | | |
| | | | |
| Metals & Mining: 0.49% | | | | | | | | | | | | | | | | |
| | | | |
Mayville Engineering Company Incorporated † | | | | | | | | | | | 247,645 | | | | 4,036,612 | |
| | | | | | | | | | | | | | | | |
| | | | |
Total Common Stocks (Cost $564,606,267) | | | | | | | | | | | | | | | 815,520,352 | |
| | | | | | | | | | | | | | | | |
| | | | |
| | | Yield | | | | | | | | | | |
| Short-Term Investments: 6.28% | | | | | | | | | | | | | | | | |
| | | | |
| Investment Companies: 6.28% | | | | | | | | | | | | | | | | |
| | | | |
Securities Lending Cash Investments LLC (l)(r)(u) | | | 2.51 | % | | | | | | | 41,141,098 | | | | 41,145,212 | |
| | | | |
Wells Fargo Government Money Market Fund Select Class (l)(u) | | | 2.30 | | | | | | | | 10,281,602 | | | | 10,281,602 | |
| | | | |
Total Short-Term Investments (Cost $51,425,748) | | | | | | | | | | | | | | | 51,426,814 | |
| | | | | | | | | | | | | | | | |
| | | | | | | | |
| Total investments in securities (Cost $616,032,015) | | | 105.79 | % | | | 866,947,166 | |
| | |
Other assets and liabilities, net | | | (5.79 | ) | | | (47,456,752 | ) |
| | | | | | | | |
| Total net assets | | | 100.00 | % | | $ | 819,490,414 | |
| | | | | | | | |
| † | Non-income-earning security |
| « | All or a portion of this security is on loan. |
| (l) | The issuer of the security is an affiliated person of the Portfolio as defined in the Investment Company Act of 1940. |
| (r) | The investment is a non-registered investment company purchased with cash collateral received from securities on loan. |
| (u) | The rate represents the 7-day annualized yield at period end. |
Abbreviations:
| ADR | American depositary receipt |
Investments in Affiliates
An affiliated investment is an investment in which the Portfolio owns at least 5% of the outstanding voting shares of the issuer or as a result of other relationships, such as the Portfolio and the issuer having the same adviser or investment manager. Transactions with issuers that were either affiliated persons of the Portfolio at the beginning of the period or the end of the period were as follows:
| | | | | | | | | | | | | | | | | | | | | | | | | | | | | | | | | | | | |
| | | Shares,
beginning of
period | | | Shares
purchased | | | Shares
sold | | | Shares,
end of
period | | | Net
realized
gains
(losses) | | | Net
change in
unrealized
gains
(losses) | | | Income
from
affiliated
securities | | | Value,
end
of period | | | % of
net
assets | |
Short-Term Investments | | | | | | | | | | | | | | | | | | | | | | | | | | | | | | | | | | | | |
Investment Companies | | | | | | | | | | | | | | | | | | | | | | | | | | | | | | | | | | | | |
Securities Lending Cash Investments LLC | | | 46,370,791 | | | | 419,624,074 | | | | 424,853,767 | | | | 41,141,098 | | | $ | 12,866 | | | $ | (1,227 | ) | | $ | 988,961 | | | $ | 41,145,212 | | | | | |
Wells Fargo Government Money Market Fund Select Class | | | 2,952,741 | | | | 413,296,407 | | | | 405,967,546 | | | | 10,281,602 | | | | 0 | | | | 0 | | | | 352,764 | | | | 10,281,602 | | | | | |
| | | | | | | | | | | | | | | | | | | | | | | | | | | | | | | | | | | | |
| | | | | | | | | |
| | | | | | | | | | | | | | | | | | $ | 12,866 | | | $ | (1,227 | ) | | $ | 1,341,725 | | | $ | 51,426,814 | | | | 6.28 | % |
| | | | | | | | | | | | | | | | | | | | | | | | | | | | | | | | | | | | |
The accompanying notes are an integral part of these financial statements.
| | | | |
| 30 | | Wells Fargo Emerging Growth Portfolio | | Statement of assets and liabilities—May 31, 2019 |
| | | | |
| | | | |
| |
Assets | | | | |
Investments in unaffiliated securities (including $39,310,167 of securities loaned), at value (cost $564,606,267) | | $ | 815,520,352 | |
Investments in affiliated securities, at value (cost $51,425,748) | | | 51,426,814 | |
Receivable for investments sold | | | 888,099 | |
Receivable for dividends | | | 100,819 | |
Receivable for securities lending income, net | | | 98,935 | |
| | | | |
Total assets | | | 868,035,019 | |
| | | | |
| |
Liabilities | | | | |
Payable upon receipt of securities loaned | | | 41,123,073 | |
Payable for investments purchased | | | 6,715,452 | |
Advisory fee payable | | | 602,803 | |
Accrued expenses and other liabilities | | | 103,277 | |
| | | | |
Total liabilities | | | 48,544,605 | |
| | | | |
Total net assets | | $ | 819,490,414 | |
| | | | |
The accompanying notes are an integral part of these financial statements.
| | | | | | |
| Statement of operations—year ended May 31, 2019 | | Wells Fargo Emerging Growth Portfolio | | | 31 | |
| | | | |
| | | | |
| |
Investment income | | | | |
Dividends | | $ | 963,041 | |
Securities lending income from affiliates, net | | | 782,643 | |
Income from affiliated securities | | | 352,764 | |
| | | | |
Total investment income | | | 2,098,448 | |
| | | | |
| |
Expenses | | | | |
Advisory fee | | | 7,007,473 | |
Custody and accounting fees | | | 52,011 | |
Professional fees | | | 43,115 | |
Shareholder report expenses | | | 4,536 | |
Trustees’ fees and expenses | | | 20,983 | |
Other fees and expenses | | | 29,429 | |
| | | | |
Net expenses | | | 7,157,547 | |
| | | | |
Net investment loss | | | (5,059,099 | ) |
| | | | |
| |
REALIZED AND UNREALIZED GAINS (LOSSES) ON INVESTMENTS | | | | |
| |
Net realized gains on: | | | | |
Unaffiliated securities | | | 101,579,794 | |
Affiliated securities | | | 12,866 | |
| | | | |
Net realized gains on investments | | | 101,592,660 | |
| | | | |
| |
Net change in unrealized gains (losses) on: | | | | |
Unaffiliated securities | | | (103,570,324 | ) |
Affiliated securities | | | (1,227 | ) |
| | | | |
Net change in unrealized gains (losses) on investments | | | (103,571,551 | ) |
| | | | |
Net realized and unrealized gains (losses) on investments | | | (1,978,891 | ) |
| | | | |
Net decrease in net assets resulting from operations | | $ | (7,037,990 | ) |
| | | | |
The accompanying notes are an integral part of these financial statements.
| | | | |
| 32 | | Wells Fargo Emerging Growth Portfolio | | Statement of changes in net assets |
| | | | | | | | |
| | | Year ended
May 31, 2019 | | | Year ended
May 31, 2018 | |
| | |
Operations | | | | | | | | |
Net investment loss | | $ | (5,059,099 | ) | | $ | (3,833,027 | ) |
Net realized gains on investments | | | 101,592,660 | | | | 122,582,157 | |
Net change in unrealized gains (losses) on investments | | | (103,571,551 | ) | | | 120,331,062 | |
| | | | |
Net increase (decrease) in net assets resulting from operations | | | (7,037,990 | ) | | | 239,080,192 | |
| | | | |
| |
Capital transactions | | | | |
Transactions in investors’ beneficial interests | | | | | | | | |
Contributions | | | 113,603,214 | | | | 20,933,192 | |
Withdrawals | | | (166,578,053 | ) | | | (175,150,153 | ) |
| | | | |
Net decrease in net assets resulting from capital transactions | | | (52,974,839 | ) | | | (154,216,961 | ) |
| | | | |
Total increase (decrease) in net assets | | | (60,012,829 | ) | | | 84,863,231 | |
| | | | |
| |
Net assets | | | | |
Beginning of period | | | 879,503,243 | | | | 794,640,012 | |
| | | | |
End of period | | $ | 819,490,414 | | | $ | 879,503,243 | |
| | | | |
The accompanying notes are an integral part of these financial statements.
| | | | | | |
| Financial highlights | | Wells Fargo Emerging Growth Portfolio | | | 33 | |
| | | | | | | | | | | | | | | | | | | | |
| | | Year ended May 31 | |
| | | 2019 | | | 2018 | | | 2017 | | | 2016 | | | 2015 | |
Total return | | | (0.28 | )% | | | 33.60 | % | | | 23.97 | % | | | (14.47 | )% | | | 24.02 | % |
Ratios to average net assets (annualized) | | | | | | | | | | | | | | | | | | | | |
Gross expenses | | | 0.81 | % | | | 0.81 | % | | | 0.81 | % | | | 0.80 | % | | | 0.80 | % |
Net expenses | | | 0.81 | % | | | 0.81 | % | | | 0.81 | % | | | 0.80 | % | | | 0.80 | % |
Net investment loss | | | (0.57 | )% | | | (0.47 | )% | | | (0.15 | )% | | | (0.40 | )% | | | (0.63 | )% |
Supplemental data | | | | | | | | | | | | | | | | | | | | |
Portfolio turnover rate | | | 71 | % | | | 47 | % | | | 115 | % | | | 66 | % | | | 56 | % |
The accompanying notes are an integral part of these financial statements.
| | | | |
| 34 | | Wells Fargo Emerging Growth Portfolio | | Notes to financial statements |
1. ORGANIZATION
Wells Fargo Master Trust (the “Trust”), a Delaware statutory trust organized on March 10, 1999, is an open-end management investment company registered under the Investment Company Act of 1940, as amended (the “1940 Act”). As an investment company, the Trust follows the accounting and reporting guidance in Financial Accounting Standards Board (“FASB”) Accounting Standards Codification Topic 946, Financial Services – Investment Companies. These financial statements report on the Wells Fargo Emerging Growth Portfolio (the “Portfolio”) which is a diversified series of the Trust.
2. SIGNIFICANT ACCOUNTING POLICIES
The following significant accounting policies, which are consistently followed in the preparation of the financial statements of the Portfolio, are in conformity with U.S. generally accepted accounting principles which require management to make estimates and assumptions that affect the reported amounts of assets and liabilities, disclosure of contingent assets and liabilities at the date of the financial statements, and the reported amounts of revenues and expenses during the reporting period. Actual results could differ from those estimates.
Securities valuation
All investments are valued each business day as of the close of regular trading on the New York Stock Exchange (generally 4 p.m. Eastern Time), although the Portfolio may deviate from this calculation time under unusual or unexpected circumstances.
Equity securities that are listed on a foreign or domestic exchange or market are valued at the official closing price or, if none, the last sales price. If no sale occurs on the principal exchange or market that day, a fair value price will be determined in accordance with the Fund’s Valuation Procedures.
Investments in registered open-end investment companies are valued at net asset value. Interests in non-registered investment companies that are redeemable at net asset value are fair valued normally at net asset value.
Investments which are not valued using any of the methods discussed above are valued at their fair value, as determined in good faith by the Board of Trustees of the Portfolio. The Board of Trustees has established a Valuation Committee comprised of the Trustees and has delegated to it the authority to take any actions regarding the valuation of portfolio securities that the Valuation Committee deems necessary or appropriate, including determining the fair value of portfolio securities, unless the determination has been delegated to the Wells Fargo Asset Management Pricing Committee at Wells Fargo Funds Management, LLC (“Funds Management”). The Board of Trustees retains the authority to make or ratify any valuation decisions or approve any changes to the Valuation Procedures as it deems appropriate. On a quarterly basis, the Board of Trustees receives reports on any valuation actions taken by the Valuation Committee or the Wells Fargo Asset Management Pricing Committee which may include items for ratification.
Securities lending
The Portfolio may lend its securities from time to time in order to earn additional income in the form of fees or interest on securities received as collateral or the investment of any cash received as collateral. When securities are on loan, the Portfolio receives interest or dividends on the securities loaned. The Portfolio receives collateral in the form of cash or securities with a value at least equal to the value of the securities on loan. The value of the loaned securities is determined at the close of each business day and any additional required collateral is delivered to the Portfolio on the next business day. In a securities lending transaction, the net asset value of the Portfolio will be affected by an increase or decrease in the value of the securities loaned and by an increase or decrease in the value of the instrument in which collateral is invested. The amount of securities lending activity undertaken by the Portfolio fluctuates from time to time. In the event of default or bankruptcy by the borrower, the Portfolio may be prevented from recovering the loaned securities or gaining access to the collateral or may experience delays or costs in doing so. In addition, the investment of any cash collateral received may lose all or part of its value. The Portfolio has the right under the lending agreement to recover the securities from the borrower on demand.
The Portfolio lends its securities through an unaffiliated securities lending agent. Cash collateral received in connection with its securities lending transactions is invested in Securities Lending Cash Investments, LLC (the “Securities Lending Fund”). The Securities Lending Fund is exempt from registration under Section 3(c)(7) of the 1940 Act and is managed by Funds Management and is subadvised by Wells Capital Management Incorporated (“WellsCap”), an affiliate of Funds Management and an indirect wholly owned subsidiary of Wells Fargo & Company (“Wells Fargo”). Funds Management receives an advisory fee starting at 0.05% and declining to 0.01% as the average daily net assets of the Securities Lending Fund increase. All of the fees received by Funds Management are paid to WellsCap for its services as subadviser. The Securities Lending Fund seeks to provide a positive return compared to the daily Fed Funds Open Rate by investing in
| | | | | | |
| Notes to financial statements | | Wells Fargo Emerging Growth Portfolio | | | 35 | |
high-quality, U.S. dollar-denominated short-term money market instruments. Securities Lending Fund investments are valued at the evaluated bid price provided by an independent pricing service. Income earned from investment in the Securities Lending Fund (net of fees and rebates), if any, is included in income from affiliated securities on the Statement of Operations.
Security transactions and income recognition
Securities transactions are recorded on a trade date basis. Realized gains or losses are recorded on the basis of identified cost.
Dividend income is recognized on the ex-dividend date.
Federal and other taxes
The Portfolio is treated as a separate entity for federal income tax purposes. The Portfolio is not required to pay federal income taxes on its net investment income and net capital gains as it is treated as a partnership for federal income tax purposes. All dividends, gains and losses of the Portfolio are deemed to have been “passed through” to the interest holders in proportion to their holdings of the Portfolio regardless of whether such dividends and gains have been distributed by the Portfolio.
The Portfolio’s income tax returns and all financial records supporting those returns for the prior three fiscal years are subject to examination by the federal revenue authority. Management has analyzed the Portfolio’s tax positions taken on federal, state, and foreign tax returns for all open tax years and does not believe that there are any uncertain tax positions that require recognition of a tax liability.
As of May 31, 2019, the aggregate cost of all investments for federal income tax purposes was $617,386,850 and the unrealized gains (losses) consisted of:
| | | | |
| |
Gross unrealized gains | | $ | 280,994,400 | |
| |
Gross unrealized losses | | | (31,434,084 | ) |
| |
Net unrealized gains | | $ | 249,560,316 | |
3. FAIR VALUATION MEASUREMENTS
Fair value measurements of investments are determined within a framework that has established a fair value hierarchy based upon the various data inputs utilized in determining the value of the Portfolio’s investments. The three-level hierarchy gives the highest priority to unadjusted quoted prices in active markets for identical assets or liabilities (Level 1) and the lowest priority to unobservable inputs (Level 3). The Portfolio’s investments are classified within the fair value hierarchy based on the lowest level of input that is significant to the fair value measurement. The inputs are summarized into three broad levels as follows:
| ∎ | | Level 1 – quoted prices in active markets for identical securities |
| ∎ | | Level 2 – other significant observable inputs (including quoted prices for similar securities, interest rates, prepayment speeds, credit risk, etc.) |
| ∎ | | Level 3 – significant unobservable inputs (including the Portfolio’s own assumptions in determining the fair value of investments) |
The inputs or methodologies used for valuing investments in securities are not necessarily an indication of the risk associated with investing in those securities.
| | | | |
| 36 | | Wells Fargo Emerging Growth Portfolio | | Notes to financial statements |
The following is a summary of the inputs used in valuing the Portfolio’s assets and liabilities as of May 31, 2019:
| | | | | | | | | | | | | | | | |
| | | | |
| | | Quoted prices
(Level 1) | | | Other significant
observable inputs
(Level 2) | | | Significant
unobservable inputs (Level 3) | | | Total | |
| | | | |
Assets | | | | | | | | | | | | | | | | |
Investments in: | | | | | | | | | | | | | | | | |
| | | | |
Common stocks | | | | | | | | | | | | | | | | |
| | | | |
Communication services | | $ | 5,756,474 | | | $ | 0 | | | $ | 0 | | | $ | 5,756,474 | |
| | | | |
Consumer discretionary | | | 109,030,731 | | | | 0 | | | | 0 | | | | 109,030,731 | |
| | | | |
Consumer staples | | | 28,001,948 | | | | 0 | | | | 0 | | | | 28,001,948 | |
| | | | |
Energy | | | 8,255,538 | | | | 0 | | | | 0 | | | | 8,255,538 | |
| | | | |
Financials | | | 63,343,352 | | | | 0 | | | | 0 | | | | 63,343,352 | |
| | | | |
Health care | | | 179,734,471 | | | | 0 | | | | 0 | | | | 179,734,471 | |
| | | | |
Industrials | | | 146,063,805 | | | | 0 | | | | 0 | | | | 146,063,805 | |
| | | | |
Information technology | | | 260,081,768 | | | | 0 | | | | 0 | | | | 260,081,768 | |
| | | | |
Materials | | | 15,252,265 | | | | 0 | | | | 0 | | | | 15,252,265 | |
| | | | |
Short-term investments | | | | | | | | | | | | | | | | |
| | | | |
Investment companies | | | 10,281,602 | | | | 41,145,212 | | | | 0 | | | | 51,426,814 | |
| | | | |
Total assets | | $ | 825,801,954 | | | $ | 41,145,212 | | | $ | 0 | | | $ | 866,947,166 | |
Additional sector, industry or geographic detail is included in the Portfolio of Investments.
At May 31, 2019, the Portfolio did not have any transfers into/out of Level 3.
4. TRANSACTIONS WITH AFFILIATES
Advisory fee
The Trust has entered into an advisory contract with Funds Management, an indirect wholly owned subsidiary of Wells Fargo. The adviser is responsible for implementing investment policies and guidelines and for supervising the subadviser, who is responsible for day-to-day portfolio management of the Portfolio. Pursuant to the contract, Funds Management is entitled to receive an annual advisory fee at the following annual rate based on the Portfolio’s average daily net assets:
| | |
| |
| Average daily net assets | | Advisory fee |
| |
First $500 million | | 0.800% |
| |
Next $500 million | | 0.775 |
| |
Next $1 billion | | 0.750 |
| |
Next $1 billion | | 0.725 |
| |
Next $1 billion | | 0.700 |
| |
Over $4 billion | | 0.680 |
For the year ended May 31, 2019, the advisory fee was equivalent to an annual rate of 0.79% of the Portfolio’s average daily net assets.
Funds Management has retained the services of a subadviser to provide daily portfolio management to the Portfolio. The fee for subadvisory services is borne by Funds Management. WellsCap is the subadviser to the Portfolio and is entitled to receive a fee from Funds Management at an annual rate starting at 0.55% and declining to 0.40% as the average daily net assets of the Portfolio increase.
Interfund transactions
The Portfolio may purchase or sell portfolio investment securities to certain other Wells Fargo affiliates pursuant to Rule 17a-7 under the 1940 Act and under procedures adopted by the Board of Trustees. The procedures have been designed to ensure that these interfund transactions, which do not incur broker commissions, are effected at current market prices.
| | | | | | |
| Notes to financial statements | | Wells Fargo Emerging Growth Portfolio | | | 37 | |
5. INVESTMENT PORTFOLIO TRANSACTIONS
Purchases and sales of investments, excluding U.S. government obligations (if any) and short-term securities, for the year ended May 31, 2019 were $616,814,437 and $673,265,596, respectively.
6. BANK BORROWINGS
Effective August 28, 2018, the Trust, along with Wells Fargo Variable Trust and Wells Fargo Funds Trust (excluding the money market funds), are parties to a $280,000,000 revolving credit agreement whereby the Portfolio is permitted to use bank borrowings for temporary or emergency purposes, such as to fund shareholder redemption requests. Interest under the credit agreement is charged to the Portfolio based on a borrowing rate equal to the higher of the Federal Funds rate in effect on that day plus 1.25% or the overnight LIBOR rate in effect on that day plus 1.25%. In addition, an annual commitment fee equal to 0.25% of the unused balance is allocated to each participating fund.
For the year ended May 31, 2019, there were no borrowings by the Portfolio under the agreement.
7. CONCENTRATION RISK
Concentration risk results from exposure to a limited number of sectors. A fund that invests a substantial portion of its assets in any sector may be more affected by changes in that sector than would be a fund whose investments are not heavily weighted in any sector.
8. INDEMNIFICATION
Under the Trust’s organizational documents, the officers and Trustees have been granted certain indemnification rights against certain liabilities that may arise out of performance of their duties to the Trust. Additionally, in the normal course of business, the Trust may enter into contracts with service providers that contain a variety of indemnification clauses. The Trust’s maximum exposure under these arrangements is dependent on future claims that may be made against the Portfolio and, therefore, cannot be estimated.
9. NEW ACCOUNTING PRONOUNCEMENT
In August 2018, FASB issued Accounting Standards Update (“ASU”) No. 2018-13, Fair Value Measurement (Topic 820)Disclosure Framework—Changes to the Disclosure Requirements for Fair Value Measurement. ASU 2018-13 updates the disclosure requirements for fair value measurements by modifying or removing certain disclosures and adding certain new disclosures. The amendments are effective for fiscal years, and interim periods within those fiscal years, beginning after December 15, 2019. Early adoption is permitted. Management has adopted the removal and modification of disclosures early, as permitted, and will adopt the additional new disclosures at the effective date.
| | | | |
| 38 | | Wells Fargo Emerging Growth Portfolio | | Report of independent registered public accounting firm |
TO THE SHAREHOLDERS OF THE PORTFOLIO AND BOARD OF TRUSTEES OF WELLS FARGO MASTER TRUST:
Opinion on the Financial Statements
We have audited the accompanying statement of assets and liabilities of Wells Fargo Emerging Growth Portfolio (the Portfolio), one of the portfolios constituting Wells Fargo Master Trust, including the portfolio of investments, as of May 31, 2019, the related statement of operations for the year then ended, the statements of changes in net assets for each of the years in the two-year period then ended, and the related notes (collectively, the financial statements) and the financial highlights for each of the years in the five-year period then ended. In our opinion, the financial statements and financial highlights present fairly, in all material respects, the financial position of the Portfolio as of May 31, 2019, the results of its operations for the year then ended, the changes in its net assets for each of the years in the two-year period then ended, and the financial highlights for each of the years in the five-year period then ended, in conformity with U.S. generally accepted accounting principles.
Basis for Opinion
These financial statements and financial highlights are the responsibility of the Portfolio’s management. Our responsibility is to express an opinion on these financial statements and financial highlights based on our audits. We are a public accounting firm registered with the Public Company Accounting Oversight Board (United States) (PCAOB) and are required to be independent with respect to the Portfolio in accordance with the U.S. federal securities laws and the applicable rules and regulations of the Securities and Exchange Commission and the PCAOB.
We conducted our audits in accordance with the standards of the PCAOB. Those standards require that we plan and perform the audit to obtain reasonable assurance about whether the financial statements and financial highlights are free of material misstatement, whether due to error or fraud. Our audits included performing procedures to assess the risks of material misstatement of the financial statements and financial highlights, whether due to error or fraud, and performing procedures that respond to those risks. Such procedures included examining, on a test basis, evidence regarding the amounts and disclosures in the financial statements and financial highlights. Such procedures also included confirmation of securities owned as of May 31, 2019, by correspondence with the custodian and brokers, or by other appropriate auditing procedures. Our audits also included evaluating the accounting principles used and significant estimates made by management, as well as evaluating the overall presentation of the financial statements and financial highlights. We believe that our audits provide a reasonable basis for our opinion.
We have not been able to determine the specific year that we began serving as the auditor of one or more Wells Fargo Funds investment companies; however we are aware that we have served as the auditor of one or more Wells Fargo Funds investment companies since at least 1955.
Boston, Massachusetts
July 26, 2019
| | | | | | |
| Other information (unaudited) | | Wells Fargo Emerging Growth Fund | | | 39 | |
TAX INFORMATION
For corporate shareholders, pursuant to Section 854 of the Internal Revenue Code, 5.64% of ordinary income dividends qualify for the corporate dividends-received deduction for the fiscal year ended May 31, 2019.
Pursuant to Section 852 of the Internal Revenue Code, $126,111,778 was designated as a 20% rate gain distribution for the fiscal year ended May 31, 2019.
Pursuant to Section 854 of the Internal Revenue Code, $821,264 of income dividends paid during the fiscal year ended May 31, 2019 has been designated as qualified dividend income (QDI).
For the fiscal year ended May 31, 2019, $14,567,564 has been designated as short-term capital gain dividends for nonresident alien shareholders pursuant to Section 871 of the Internal Revenue Code.
PROXY VOTING INFORMATION
A description of the policies and procedures used to determine how to vote proxies relating to portfolio securities is available, upon request, by calling1-800-222-8222, visiting our website atwfam.com, or visiting the SEC website at sec.gov. Information regarding how the proxies related to portfolio securities were voted during the most recent12-month period ended June 30 is available on the website atwfam.com or by visiting the SEC website at sec.gov.
QUARTERLY PORTFOLIO HOLDINGS
The Fund and Portfolio file their complete schedule of portfolio holdings with the SEC for the first and third quarters of each fiscal year on Form N-Q, which is available by visiting the SEC website at sec.gov. Those forms may be reviewed and copied at the SEC’s Public Reference Room in Washington, DC. Information on the operation of the Public Reference Room may be obtained by calling 1-800-SEC-0330.
| | | | |
| 40 | | Wells Fargo Emerging Growth Fund | | Other information (unaudited) |
BOARD OF TRUSTEES AND OFFICERS
Each of the Trustees and Officers1 listed in the table below acts in identical capacities for each fund in the Wells Fargo family of funds, which consists of 151 mutual funds comprising the Wells Fargo Funds Trust, Wells Fargo Variable Trust, Wells Fargo Master Trust and four closed-end funds (collectively the “Fund Complex”). This table should be read in conjunction with the Prospectus and the Statement of Additional Information2. The mailing address of each Trustee and Officer is 525 Market Street, 12th Floor, San Francisco, CA 94105. Each Trustee and Officer serves an indefinite term, however, each Trustee serves such term until reaching the mandatory retirement age established by the Trustees.
Independent Trustees
| | | | | | |
Name and
year of birth | | Position held and
length of service* | | Principal occupations during past five years or longer | | Current other
public company or
investment company
directorships |
| | | |
William R. Ebsworth
(Born 1957) | | Trustee, since 2015 | | Retired. From 1984 to 2013, equities analyst, portfolio manager, research director and chief investment officer at Fidelity Management and Research Company in Boston, Tokyo, and Hong Kong, and retired in 2013 as Chief Investment Officer of Fidelity Strategic Advisers, Inc. where he led a team of investment professionals managing client assets. Prior thereto, Board member of Hong Kong Securities Clearing Co., Hong Kong Options Clearing Corp., the Thailand International Fund, Ltd., Fidelity Investments Life Insurance Company, and Empire Fidelity Investments Life Insurance Company. Audit Committee Chair and Investment Committee Chair of the Vincent Memorial Hospital Endowment (non-profit organization). Mr. Ebsworth is a CFA® charterholder. | | N/A |
| | | |
Jane A. Freeman
(Born 1953) | | Trustee, since 2015; Chair Liaison, since 2018 | | Retired. From 2012 to 2014 and 1999 to 2008, Chief Financial Officer of Scientific Learning Corporation. From 2008 to 2012, Ms. Freeman provided consulting services related to strategic business projects. Prior to 1999, Portfolio Manager at Rockefeller & Co. and Scudder, Stevens & Clark. Board member of the Harding Loevner Funds from 1996 to 2014, serving as both Lead Independent Director and chair of the Audit Committee. Board member of the Russell Exchange Traded Funds Trust from 2011 to 2012 and the chair of the Audit Committee. Ms. Freeman is a Board Member of The Ruth Bancroft Garden (non-profit organization). She is also an inactive Chartered Financial Analyst. | | N/A |
| | | |
Isaiah Harris, Jr.
(Born 1952) | | Trustee, since 2009; Audit Committee Chairman, since 2019 | | Retired. Chairman of the Board of CIGNA Corporation since 2009, and Director since 2005. From 2003 to 2011, Director of Deluxe Corporation. Prior thereto, President and CEO of BellSouth Advertising and Publishing Corp. from 2005 to 2007, President and CEO of BellSouth Enterprises from 2004 to 2005 and President of BellSouth Consumer Services from 2000 to 2003. Emeritus member of the Iowa State University Foundation Board of Governors. Emeritus Member of the Advisory Board of Iowa State University School of Business. Advisory Board Member, Palm Harbor Academy (private school). Advisory Board Member, Child Evangelism Fellowship (non-profit). Mr. Harris is a certified public accountant (inactive status). | | CIGNA Corporation |
| | | |
Judith M. Johnson
(Born 1949) | | Trustee, since 2008; Audit Committee Chairman, from 2009 to 2018 | | Retired. Prior thereto, Chief Executive Officer and Chief Investment Officer of Minneapolis Employees Retirement Fund from 1996 to 2008. Ms. Johnson is an attorney, certified public accountant and a certified managerial accountant. | | N/A |
| | | | | | |
| Other information (unaudited) | | Wells Fargo Emerging Growth Fund | | | 41 | |
| | | | | | |
Name and
year of birth | | Position held and
length of service* | | Principal occupations during past five years or longer | | Current other
public company or
investment company
directorships |
| | | |
David F. Larcker
(Born 1950) | | Trustee, since 2009 | | James Irvin Miller Professor of Accounting at the Graduate School of Business, Stanford University, Director of the Corporate Governance Research Initiative and Senior Faculty of The Rock Center for Corporate Governance since 2006. From 2005 to 2008, Professor of Accounting at the Graduate School of Business, Stanford University. Prior thereto, Ernst & Young Professor of Accounting at The Wharton School, University of Pennsylvania from 1985 to 2005. | | N/A |
| | | |
Olivia S. Mitchell
(Born 1953) | | Trustee, since 2006; Nominating and Governance Committee Chairman, since 2018 | | International Foundation of Employee Benefit Plans Professor, Wharton School of the University of Pennsylvania since 1993. Director of Wharton’s Pension Research Council and Boettner Center on Pensions & Retirement Research, and Research Associate at the National Bureau of Economic Research. Previously, Cornell University Professor from 1978 to 1993. | | N/A |
| | | |
Timothy J. Penny
(Born 1951) | | Trustee, since 1996; Chairman, since 2018 | | President and Chief Executive Officer of Southern Minnesota Initiative Foundation, a non-profit organization, since 2007. Member of the Board of Trustees of NorthStar Education Finance, Inc., a non-profit organization, since 2007. | | N/A |
| | | |
James G. Polisson
(Born 1959) | | Trustee, since 2018 | | Retired. Chief Marketing Officer, Source (ETF) UK Services, Ltd, from 2015 to 2017. From 2012 to 2015, Principal of The Polisson Group, LLC, a management consulting, corporate advisory and principal investing company. Chief Executive Officer and Managing Director at Russell Investments, Global Exchange Traded Funds from 2010 to 2012. Managing Director of Barclays Global Investors from 1998 to 2010 and Global Chief Marketing Officer for iShares and Barclays Global Investors from 2000 to 2010. Trustee of the San Francisco Mechanics’ Institute, a non-profit organization, from 2013 to 2015. Board member of the Russell Exchange Traded Fund Trust from 2011 to 2012. Director of Barclays Global Investors Holdings Deutschland GmbH from 2006 to 2009. Mr. Polisson is an attorney and has a retired status with the Massachusetts and District of Columbia Bar Associations. | | N/A |
| * | Length of service dates reflect the Trustee’s commencement of service with the Trust’s predecessor entities, where applicable. |
| | | | |
| 42 | | Wells Fargo Emerging Growth Fund | | Other information (unaudited) |
Officers
| | | | | | |
Name and
year of birth | | Position held and
length of service | | Principal occupations during past five years or longer | | |
| | | |
Andrew Owen
(Born 1960) | | President, since 2017 | | Executive Vice President of Wells Fargo & Company and Head of Affiliated Managers, Wells Fargo Asset Management, since 2014. In addition, Mr. Owen is currently President, Chief Executive Officer and Director of Wells Fargo Funds Management, LLC since 2017. Prior thereto, Executive Vice President responsible for marketing, investments and product development for Wells Fargo Funds Management, LLC, from 2009 to 2014. | | |
| | | |
Nancy Wiser1 (Born 1967) | | Treasurer, since 2012 | | Executive Vice President of Wells Fargo Funds Management, LLC since 2011. Chief Operating Officer and Chief Compliance Officer at LightBox Capital Management LLC, from 2008 to 2011. | | |
| | | |
Alexander Kymn
(Born 1973) | | Secretary and Chief Legal Officer, since 2018 | | Senior Company Counsel of Wells Fargo Bank, N.A. since 2018 (previously Senior Counsel from 2007 to 2018). Vice President of Wells Fargo Funds Management, LLC from 2008 to 2014. | | |
| | | |
Michael H. Whitaker
(Born 1967) | | Chief Compliance Officer, since 2016 | | Senior Vice President and Chief Compliance Officer since 2016. Senior Vice President and Chief Compliance Officer for Fidelity Investments from 2007 to 2016. | | |
| | | |
David Berardi
(Born 1975) | | Assistant Treasurer, since 2009 | | Vice President of Wells Fargo Funds Management, LLC since 2009. Vice President of Evergreen Investment Management Company, LLC from 2008 to 2010. Manager of Fund Reporting and Control for Evergreen Investment Management Company, LLC from 2004 to 2010. | | |
| | | |
Jeremy DePalma1
(Born 1974) | | Assistant Treasurer, since 2009 | | Senior Vice President of Wells Fargo Funds Management, LLC since 2009. Senior Vice President of Evergreen Investment Management Company, LLC from 2008 to 2010 and head of the Fund Reporting and Control Team within Fund Administration from 2005 to 2010. | | |
| 1 | Nancy Wiser acts as Treasurer of 65 funds in the Fund Complex. Jeremy DePalma acts as Treasurer of 86 funds and Assistant Treasurer of 65 funds in the Fund Complex. |
| 2 | The Statement of Additional Information includes additional information about the Trustees and is available, without charge, upon request, by calling1-800-222-8222 or by visiting the website atwfam.com. |
| | | | | | |
| Other information (unaudited) | | Wells Fargo Emerging Growth Fund | | | 43 | |
BOARD CONSIDERATION OF INVESTMENT MANAGEMENT, ADVISORY AND SUB-ADVISORY AGREEMENTS:
Wells Fargo Emerging Growth Fund and Wells Fargo Emerging Growth Portfolio
Under the Investment Company Act of 1940 (the “1940 Act”), the Board of Trustees (each, a “Board” and collectively, the “Boards”) of each of Wells Fargo Funds Trust (“Funds Trust”) and Wells Fargo Master Trust (“Master Trust”, and collectively, the “Trusts”) must determine annually whether to approve the continuation of the Trusts’ investment management, advisory and sub-advisory agreements, as applicable. In this regard, at an in-person meeting held on May 21-22, 2019 (the “Meeting”), the Funds Trust Board, all the members of which have no direct or indirect interest in the investment management agreement and are not “interested persons” of the Trusts, as defined in the 1940 Act (the “Independent Trustees”), reviewed and approved for Wells Fargo Emerging Growth Fund (the “Gateway Fund”) an investment management agreement (the “Gateway Fund Management Agreement”) with Wells Fargo Funds Management, LLC (“Funds Management”).
At the Meeting, the Master Trust Board, all the members of which have no direct or indirect interest in the investment advisory and sub-advisory agreements and are Independent Trustees, reviewed and approved: (i) an investment advisory agreement (the “Master Portfolio Advisory Agreement”) with Funds Management for Wells Fargo Emerging Growth Portfolio, a portfolio of Master Trust (the “Master Portfolio”); and (ii) an investment sub-advisory agreement (the “Sub-Advisory Agreement”) with Wells Capital Management Incorporated (the “Sub-Adviser”), an affiliate of Funds Management.
The Gateway Fund and the Master Portfolio are collectively referred to as the “Funds.” The Gateway Fund Management Agreement, the Master Portfolio Advisory Agreement and the Sub-Advisory Agreement are collectively referred to as the “Advisory Agreements.”
The Gateway Fund is a gateway feeder fund that invest substantially all of its assets in the Master Portfolio. The Master Portfolio has a substantially similar investment objective and substantially similar investment strategies to the Gateway Fund. Information provided to the Boards regarding the Gateway Fund is also applicable to the Master Portfolio, as relevant.
At the Meeting, the Boards considered the factors and reached the conclusions described below relating to the selection of Funds Management and the Sub-Adviser and the approval of the Advisory Agreements. Prior to the Meeting, including at an in-person meeting in April 2019, the Trustees conferred extensively among themselves and with representatives of Funds Management about these matters. Also, the Boards have adopted a team-based approach, with each team consisting of a sub-set of Trustees, to assist the full Boards in the discharge of their duties in reviewing investment performance and other matters throughout the year. The Independent Trustees were assisted in their evaluation of the Advisory Agreements by independent legal counsel, from whom they received separate legal advice and with whom they met separately.
In providing information to the Boards, Funds Management and the Sub-Adviser were guided by a detailed set of requests for information submitted to them by independent legal counsel on behalf of the Independent Trustees at the start of the Boards’ annual contract renewal process earlier in 2019. In considering and approving the Advisory Agreements, the Trustees considered the information they believed relevant, including but not limited to the information discussed below. The Boards considered not only the specific information presented in connection with the Meeting, but also the knowledge gained over time through interaction with Funds Management and the Sub-Adviser about various topics. In this regard, the Boards reviewed reports of Funds Management at each of their quarterly meetings, which included, among other things, portfolio reviews and investment performance reports. In addition, the Boards and the teams mentioned above confer with portfolio managers at various times throughout the year. The Boards did not identify any particular information or consideration that was all-important or controlling, and each individual Trustee may have attributed different weights to various factors.
After its deliberations, the Funds Trust Board unanimously approved the continuation of the Gateway Fund Management Agreement for a one-year period. Additionally, after its deliberations, the Master Trust Board unanimously approved the continuation of the Master Portfolio Advisory Agreement and the Sub-Advisory Agreement, each for a one-year term. The Boards also determined that the compensation payable to Funds Management and the Sub-Adviser was reasonable. The Boards considered the approval of the Advisory Agreements for the Funds as part of their consideration of agreements for funds across the complex, but their approvals were made on a fund-by-fund basis. The following summarizes a number of important, but not necessarily all, factors considered by the Boards in support of their approvals.
Nature, extent and quality of services
The Boards received and considered various information regarding the nature, extent and quality of services provided to the Funds by Funds Management and the Sub-Adviser under the Advisory Agreements. This information included a
| | | | |
| 44 | | Wells Fargo Emerging Growth Fund | | Other information (unaudited) |
description of the investment advisory services and Fund-level administrative services, as well as, among other things, a summary of the background and experience of senior management of Wells Fargo Asset Management (“WFAM”), of which Funds Management and the Sub-Adviser are a part, a summary of investments made in the business of WFAM, a summary of certain organizational and personnel changes involving Funds Management and the Sub-Adviser, and a description of Funds Management’s and the Sub-Adviser’s business continuity planning programs and of their approaches to data privacy and cybersecurity. The Boards received and reviewed information about Funds Management’s role as administrator of the Funds’ liquidity risk management program. The Boards also considered the qualifications, background, tenure and responsibilities of each of the portfolio managers primarily responsible for the day-to-day portfolio management of the Funds.
The Boards evaluated the ability of Funds Management and the Sub-Adviser to attract and retain qualified investment professionals, including research, advisory and supervisory personnel. The Boards further considered the compliance programs and compliance records of Funds Management and the Sub-Adviser. In addition, the Boards took into account the full range of services provided to the Funds by Funds Management and its affiliates.
Fund investment performance and expenses
The Boards considered the investment performance results for each of the Funds over various time periods ended December 31, 2018. The Boards considered these results in comparison to the investment performance of funds in a universe that was determined by Broadridge Inc. (“Broadridge”) to be similar to the Gateway Fund (the “Universe”), and in comparison to the Gateway Fund’s benchmark index and to other comparative data. Broadridge is an independent provider of investment company data. The Boards received a description of the methodology used by Broadridge to select the mutual funds in the performance Universe. The Funds Trust Board noted that the investment performance of the Gateway Fund (Administrator Class) was higher than the average investment performance of its Universe for all periods under review. The Funds Trust Board also noted that the investment performance of the Gateway Fund was higher than its benchmark, the Russell 2000® Growth Index, for all periods under review.
The Master Trust Board took note of the investment performance of the Master Portfolio in the context of reviewing the investment performance of the Gateway Fund.
The Funds Trust Board also received and considered information regarding the Gateway Fund’s net operating expense ratios, which include fees and expenses of the Master Portfolio, and their various components, including actual management fees assessed at the Gateway Fund and Master Portfolio levels, custodian and other non-management fees, and Rule 12b-1 and non-Rule 12b-1 shareholder service fees. The Funds Trust Board considered these ratios in comparison to the median ratios of funds in class-specific expense groups that were determined by Broadridge to be similar to the Gateway Fund (the “Groups”). The Funds Trust Board received a description of the methodology used by Broadridge to select the mutual funds in the expense Groups and an explanation of how funds comprising expense groups and their expense ratios may vary from year-to-year. Based on the Broadridge reports, the Funds Trust Board noted that the net operating expense ratios of the Gateway Fund were lower than, equal to or in range of the median net operating expense ratios of its expense Groups for all share classes.
With respect to the Master Portfolio, the Master Trust Board reviewed the fee rates that are payable to Funds Management for investment advisory services (as discussed below), which are the only fees charged at the Master Portfolio level, relative to a corresponding expense Group.
The Boards took into account the Funds’ investment performance and expense information provided to them among the factors considered in deciding to re-approve the Advisory Agreements.
Investment management, advisory and sub-advisory fee rates
The Funds Trust Board noted that Funds Management receives no advisory fees from the Gateway Fund as long as the Gateway Fund continues to invest all (or substantially all) of its assets in a single master portfolio. If the Gateway Fund were to change its investment structure so that it began investing in two or more master portfolios (a fund-of-funds), Funds Management would be entitled to receive an annual fee of 0.25% of the Gateway Fund’s average daily net assets for providing investment advisory services to the Gateway Fund, including allocating the Gateway Fund’s assets to the Master Portfolio.
The Funds Trust Board reviewed and considered the contractual fee rates that are payable by the Gateway Fund to Funds Management under the Gateway Fund Management Agreement, as well as the contractual fee rates payable by the Gateway Fund to Funds Management for class-level administrative services under a Class-Level Administration Agreement, which include, among other things, class-level transfer agency and sub-transfer agency costs (collectively, the “Management Rates”).
| | | | | | |
| Other information (unaudited) | | Wells Fargo Emerging Growth Fund | | | 45 | |
The Master Trust Board reviewed and considered the contractual investment advisory fee rate that is payable by the Master Portfolio to Funds Management for investment advisory services under the Master Portfolio Advisory Agreement (the “Advisory Agreement Rate”). The Master Trust Board also reviewed and considered the contractual investment sub-advisory fee rate that is payable by Funds Management to the Sub-Adviser for investment sub-advisory services (the “Sub-Advisory Agreement Rate”).
Among other information reviewed by the Funds Trust Board was a comparison of the Gateway Fund’s Management Rate, which include the advisory fees paid at the Master Portfolio level, with the average contractual investment management fee rates of funds in the expense Groups at a common asset level as well as transfer agency costs of the funds in the expense Groups. The Funds Trust Board noted that the Management Rates of the Gateway Fund were equal to or in range of the sum of these average rates for the Gateway Fund’s expense Groups for all share classes.
The Master Trust Board reviewed a comparison of the Advisory Agreement Rate of the Master Portfolio with those of other funds in the Master Portfolio’s expense Group at a common asset level. The Master Trust Board noted that the Advisory Agreement Rate of the Master Portfolio was lower than the median rate for the Master Portfolio’s expense Group.
The Master Trust Board also received and considered information about the portions of the total management fees that were retained by Funds Management after payment of the fees to the Sub-Adviser for sub-advisory services. In assessing the reasonableness of these amounts, the Master Trust Board received and evaluated information about the nature and extent of responsibilities retained and risks assumed by Funds Management and not delegated to or assumed by the Sub-Adviser, and about Funds Management’s on-going oversight services. Given the affiliation between Funds Management and the Sub-Adviser, the Master Trust Board ascribed limited relevance to the allocation of fees between them.
The Boards also received and considered information about the nature and extent of services offered and fee rates charged by Funds Management and the Sub-Adviser to other types of clients with investment strategies similar to those of the Funds. In this regard, the Boards received information about the significantly greater scope of services, and compliance, reporting and other legal burdens and risks of managing proprietary mutual funds compared with those associated with managing assets of other types of clients, including third-party sub-advised fund clients and non-mutual fund clients such as institutional separate accounts.
Based on its consideration of the factors and information it deemed relevant, including those described here, the Funds Trust Board determined that the compensation payable to Funds Management under the Gateway Fund Management Agreement was reasonable, and the Master Trust Board determined that the compensation payable to Funds Management under the Master Portfolio Advisory Agreement and to the Sub-Adviser under the Sub-Advisory Agreement was reasonable.
Profitability
The Boards received and considered information concerning the profitability of Funds Management, as well as the profitability of both WFAM and Wells Fargo & Co. (“Wells Fargo”) from providing services to the fund family as a whole. The Boards noted that the Sub-Adviser’s profitability with respect to providing services to the Master Portfolio and other funds in the family was subsumed in the WFAM and Wells Fargo profitability analysis.
Funds Management reported on the methodologies and estimates used in calculating profitability, including a description of the methodology used to allocate certain expenses. Among other things, the Boards noted that the levels of profitability reported on a fund-by-fund basis varied widely, depending on factors such as the size, type and age of fund. Based on its review, the Boards did not deem the profits reported by Funds Management, WFAM or Wells Fargo from services provided to the Funds to be at a level that would prevent the Boards from approving the continuation of the Advisory Agreements.
Economies of scale
The Boards received and considered information about the potential for Funds Management to experience economies of scale in the provision of management services to the Funds, the difficulties of calculating economies of scale at an individual fund level, and the extent to which potential scale benefits are shared with shareholders. The Boards noted the existence of breakpoints in the Master Portfolio’s advisory fee structure and the Gateway Fund’s management fee structure, which operate generally to reduce the Funds’ expense ratios as the Funds grow in size. The Boards considered that, in addition to management fee breakpoints, Funds Management shares potential economies of scale from its management business in a variety of ways, including through fee waiver and expense reimbursement arrangements, services that benefit shareholders, competitive management fee rates set at the outset without regard to breakpoints, and investments in the business intended to enhance services available to shareholders.
| | | | |
| 46 | | Wells Fargo Emerging Growth Fund | | Other information (unaudited) |
The Boards concluded that Funds Management’s arrangements with respect to each Fund, including contractual breakpoints, constituted a reasonable approach to sharing potential economies of scale with the Funds and their shareholders.
Other benefits to Funds Management and the Sub-Adviser
The Boards received and considered information regarding potential “fall-out” or ancillary benefits received by Funds Management and its affiliates, including the Sub-Adviser, as a result of their relationships with the Funds. Ancillary benefits could include, among others, benefits directly attributable to other relationships with the Funds and benefits potentially derived from an increase in Funds Management’s and the Sub-Adviser’s business as a result of their relationships with the Funds. The Boards noted that various affiliates of Funds Management may receive distribution-related fees, shareholder servicing payments and sub-transfer agency fees in respect of shares sold or held through them and services provided.
The Boards also reviewed information about soft dollar credits earned and utilized by the Sub-Adviser, fees earned by Funds Management and the Sub-Adviser from managing a private investment vehicle for the fund family’s securities lending collateral, and commissions earned by an affiliated broker from portfolio transactions.
Based on their consideration of the factors and information they deemed relevant, including those described here, the Boards did not find that any ancillary benefits received by Funds Management and its affiliates, including the Sub-Adviser, were unreasonable.
Conclusion
At the Meeting, after considering the above-described factors and based on its deliberations and its evaluation of the information described above, the Funds Trust Board unanimously approved the continuation of the Gateway Fund Management Agreement for a one-year period. Additionally, after considering the above-described factors and based on its deliberations and its evaluation of the information described above, the Master Trust Board unanimously approved the continuation of the Master Portfolio Advisory Agreement and the Sub-Advisory Agreement, each for a one-year term. The Boards also determined that the compensation payable to Funds Management and the Sub-Adviser was reasonable.
This page is intentionally left blank.
This page is intentionally left blank.

For more information
More information about Wells Fargo Funds is available free upon request. To obtain literature, please write, visit the Fund’s website, or call:
Wells Fargo Funds
P.O. Box 219967
Kansas City, MO 64121-9967
Website: wfam.com
Individual investors: 1-800-222-8222
Retail investment professionals: 1-888-877-9275
Institutional investment professionals:1-866-765-0778
This report and the financial statements contained herein are submitted for the general information of the shareholders of the Fund. If this report is used for promotional purposes, distribution of the report must be accompanied or preceded by a current prospectus. Before investing, please consider the investment objectives, risks, charges, and expenses of the investment. For a current prospectus and, if available, a summary prospectus, containing this information, call1-800-222-8222 or visit the Fund’s website atwfam.com. Read the prospectus carefully before you invest or send money.
Wells Fargo Asset Management (WFAM) is the trade name for certain investment advisory/management firms owned by Wells Fargo & Company. These firms include but are not limited to Wells Capital Management Incorporated and Wells Fargo Funds Management, LLC. Certain products managed by WFAM entities are distributed by Wells Fargo Funds Distributor, LLC (a broker-dealer and Member FINRA).
This material is for general informational and educational purposes only and is NOT intended to provide investment advice or a recommendation of any kind—including a recommendation for any specific investment, strategy, or plan.
INVESTMENT PRODUCTS: NOT FDIC INSURED ◾ NO BANK GUARANTEE ◾ MAY LOSE VALUE
© 2019 Wells Fargo Funds Management, LLC. All rights reserved.
| | |
 | | 403196 07-19 A282/AR282 05-19 |
Annual Report
May 31, 2019

Wells Fargo Index Fund

Beginning on January 1, 2021, as permitted by new regulations adopted by the Securities and Exchange Commission, paper copies of the Wells Fargo Funds’ annual and semi-annual shareholder reports issued after this date will no longer be sent by mail, unless you specifically request paper copies of the reports. Instead, the reports will be made available on the Funds’ website, and you will be notified by mail each time a report is posted and provided with a website address to access the report.
If you already elected to receive shareholder reports electronically, you will not be affected by this change and you need not take any action. You may elect to receive shareholder reports and other communications from the Fund electronically at any time by contacting your financial intermediary (such as a broker-dealer or bank) or, if you are a direct investor, by calling 1-800-222-8222 or by enrolling at wellsfargo.com/advantagedelivery.
You may elect to receive all future reports in paper free of charge. If you invest through a financial intermediary, you can contact your financial intermediary to request that you continue to receive paper copies of your shareholder reports; if you invest directly with the Fund, you can call 1-800-222-8222. Your election to receive reports in paper will apply to all Wells Fargo Funds held in your account with your financial intermediary or, if you are a direct investor, to all Wells Fargo Funds that you hold.

Reduce clutter. Save trees.
Sign up for electronic delivery of prospectuses and shareholder reports atwellsfargo.com/advantagedelivery
Contents
The views expressed and any forward-looking statements are as of May 31, 2019, unless otherwise noted, and are those of the Fund managers and/or Wells Fargo Asset Management. Discussions of individual securities, or the markets generally, or any Wells Fargo Fund are not intended as individual recommendations. Future events or results may vary significantly from those expressed in any forward-looking statements. The views expressed are subject to change at any time in response to changing circumstances in the market. Wells Fargo Asset Management and the Fund disclaim any obligation to publicly update or revise any views expressed or forward-looking statements.
INVESTMENT PRODUCTS: NOT FDIC INSURED ◾ NO BANK GUARANTEE ◾ MAY LOSE VALUE
| | | | |
| 2 | | Wells Fargo Index Fund | | Letter to shareholders (unaudited) |

Andrew Owen
President
Wells Fargo Funds
Dear Shareholder:
We are pleased to offer you this annual report for the Wells Fargo Index Fund for the 12-month period that ended May 31, 2019. Higher short-term interest rates, inflation concerns, trade tensions, and geopolitical events drove investment market volatility for much of 2018, particularly for international stocks. Early 2019 saw stocks and bonds gain with renewed business and investor confidence, but volatility returned late in the period as global growth slowed and geopolitical concerns persisted.
For the period, U.S. stocks, based on the S&P 500 Index,1 gained 3.78% and international stocks, as measured by the MSCI ACWI ex USA Index (Net),2 fell 6.26%. Based on the MSCI EM Index (Net),3 emerging market stocks fell 8.70%. Bond investors saw the Bloomberg Barclays U.S. Aggregate Bond Index4 add 6.40% while the Bloomberg Barclays Global Aggregate ex-USD Index5 rose 0.39%. The Bloomberg Barclays Municipal Bond Index6 added 6.40%, and the ICE BofAML U.S. High Yield Index7 was up 5.37%.
Results for investment indices reflected global concerns.
Global trade tensions escalated during the second quarter of 2018. A tit-for-tat tariff spat intensified between the U.S. and other governments. The U.S. Federal Reserve (Fed) raised the federal funds rate by 25 basis points (bps; 100 bps equal 1.00%) to a target range of between 1.75% and 2.00% in June. Market index results reflected the global concerns. The MSCI ACWI ex USA Index (Net) lost 2.61%, while the Bloomberg Barclays Global Aggregate ex-USD Index dropped 4.76%.
Not all news was bad. The U.S. Bureau of Economic Analysis reported second-quarter annualized gross domestic product (GDP) growth of 4.2%. Hiring improved. Unemployment declined. Consumer confidence and spending increased. The S&P 500 Index recorded a 3.43% second-quarter gain. Stocks of companies with smaller capitalizations did even better, as measured by the Russell 2000® Index,8 adding 7.75%.
| 1 | The S&P 500 Index consists of 500 stocks chosen for market size, liquidity, and industry group representation. It is a market-value-weighted index with each stock’s weight in the index proportionate to its market value. You cannot invest directly in an index. |
| 2 | The Morgan Stanley Capital International (MSCI) All Country World Index (ACWI) ex USA Index (Net) is a free-float-adjusted market-capitalization-weighted index that is designed to measure the equity market performance of developed and emerging markets, excluding the U.S. Source: MSCI. MSCI makes no express or implied warranties or representations and shall have no liability whatsoever with respect to any MSCI data contained herein. The MSCI data may not be further redistributed or used as a basis for other indices or any securities or financial products. This report is not approved, reviewed, or produced by MSCI. You cannot invest directly in an index. |
| 3 | The MSCI Emerging Markets (EM) Index (Net) is a free-float-adjusted market-capitalization-weighted index that is designed to measure the equity market performance of emerging markets. You cannot invest directly in an index. |
| 4 | The Bloomberg Barclays U.S. Aggregate Bond Index is a broad-based benchmark that measures the investment-grade, U.S.-dollar-denominated, fixed-rate taxable bond market, including Treasuries, government-related and corporate securities, mortgage-backed securities (agency fixed-rate and hybrid adjustable-rate mortgage pass-throughs), asset-backed securities, and commercial mortgage-backed securities. You cannot invest directly in an index. |
| 5 | The Bloomberg Barclays Global Aggregate ex-USD Index is an unmanaged index that provides a broad-based measure of the global investment-grade fixed-income markets excluding the U.S.-dollar-denominated debt market. You cannot invest directly in an index. |
| 6 | The Bloomberg Barclays Municipal Bond Index is an unmanaged index composed of long-term tax-exempt bonds with a minimum credit rating of Baa. You cannot invest directly in an index. |
| 7 | The ICE BofAML U.S. High Yield Index is a market-capitalization-weighted index of domestic and Yankee high-yield bonds. The index tracks the performance of high-yield securities traded in the U.S. bond market. You cannot invest directly in an index. Copyright 2019. ICE Data Indices, LLC. All rights reserved. |
| 8 | The Russell 2000® Index measures the performance of the 2,000 smallest companies in the Russell 3000® Index, which represents approximately 8% of the total market capitalization of the Russell 3000® Index. You cannot invest directly in an index. |
| | | | | | |
| Letter to shareholders (unaudited) | | Wells Fargo Index Fund | | | 3 | |
Investors appeared to shake off lingering concerns during the third quarter.
Favorable third-quarter economic indicators and corporate earnings reports encouraged domestic stock investors. U.S. trade negotiations with Mexico and Canada progressed. The Conference Board Consumer Confidence Index®9 reached its highest level in 18 years during September 2018. The Fed raised the federal funds rate by 25 bps to a target range of between 2.00% and 2.25% in September. For the quarter that ended September 30, 2018, the S&P 500 Index added 7.71%.
Investors in international markets were not as confident. Tensions between the U.S. and China increased. The U.S. imposed $200 billion in tariffs on Chinese goods. China reacted with $60 billion in tariffs on U.S. goods. Economic growth in China caused concern. The Bank of England (BoE) raised its monetary policy rate to 0.75% in August 2018. During the quarter, the MSCI ACWI ex USA Index (Net) gained 0.71%. The MSCI EM Index (Net) declined 1.09%. In fixed-income markets, U.S. bonds were flat, as measured by the Bloomberg Barclays U.S. Aggregate Bond Index. The Bloomberg Barclays Global Aggregate ex-USD Index fell 1.74%.
Conflicting data unsettled markets during the fourth quarter.
November’s U.S. midterm elections shifted control of the House of Representatives from Republicans to Democrats, presaging potential partisan clashes. Third-quarter U.S. GDP was announced at an annualized 3.4% rate, lower than the second-quarter rate. Brexit efforts stalled ahead of the March 2019 deadline. The People’s Bank of China cut reserve requirement ratios, accelerated infrastructure spending, and cut taxes even as the value of the yuan declined to low levels last seen in 2008.
December’s S&P 500 Index performance was the worst since 1931. Globally,fixed-income investments fared better than stocks during the last two months of the year. The Fed increased the federal funds rate by 25 bps in December 2018 to a target range of between 2.25% and 2.50%.
The market climbs a wall of worry.
Investors entered 2019 with reasons to be concerned. A partial U.S. government shutdown driven by partisan policy disputes extended into January. Investment returns appeared to reaffirm the adage that markets climb a wall of worry. The S&P 500 Index gained 8.01% for the month of January, the best monthly performance in 30 years. Returns for the MSCI ACWI ex USA Index (Net), the Bloomberg Barclays U.S. Aggregate Bond Index, and the Bloomberg Barclays Global Aggregate ex-USD Index also were positive. The Fed indicated that it would pause its program of regular rate increases during 2019 as inflation remained low.
In February 2019, concerns over slowing global growth reemerged. The Bureau of Economic Analysis announced fourth-quarter 2018 GDP grew at an annualized 2.2% rate, down from levels of the prior two quarters. In a February report, the BoE forecast the slowest growth since the financial crisis for 2019. China and the U.S. continued to wrangle over trade issues.
By the end of March 2019, the combination of dovish Fed sentiment and consistent, if not spectacular, economic and business metrics reinforced investors’ confidence. Monthly job creation data regained momentum. Corporate profits, while lower than 2018’s lofty levels, remained solid. China announced a roughly $300 billion stimulus package through tax and fee cuts intended to reinvigorate economic growth.
December’s S&P 500 Index performance was the worst since 1931.
The S&P 500 Index gained 8.01% for the month of January, the best monthly performance in 30 years.
| 9 | The Conference Board Consumer Confidence Index® measures the degree of optimism on the state of the U.S. economy that consumers are expressing through their activities of saving and spending. You cannot invest directly in an index. |
| | | | |
| 4 | | Wells Fargo Index Fund | | Letter to shareholders (unaudited) |
During April, several broad-based U.S. equity indices reached or approached highs as investors drew confidence from favorable economic projections, sustained low inflation, and solid employment data. First-quarter GDP showed the economy grew at an annualized rate of 3.2% on improvement in business investment and exports. Favorable sentiment extended to foreign markets as the MSCI ACWI ex USA Index (Net) gained 2.64% and the MSCI EM Index (Net) added 2.11% for the month.
May 2019 presented investors with mixed signals in the economy, in the markets, and politically. In the U.S., partisan wrangling ramped up as Democrats and Republicans set their sights on 2020 presidential politics. In the U.K., the Brexit stalemate resulted in the resignation of Prime Minister Theresa May. The European Commission downgraded the 2019 growth forecast for the block of countries to 1.2%. The U.S. increased tariffs on products from China, China responded, and then talks broke down. Ending the month, equities, as measured by the MSCI ACWI (Net),10 dropped 5.93% while bonds, often considered a less risky investment, gained 1.04%, as measured by the Bloomberg Barclays Global Aggregate ex-USD Index.
Don’t let short-term uncertainty derail long-term investment goals.
Periods of investment uncertainty can present challenges, but experience has taught us that maintaining long-term investment goals can be an effective way to plan for the future. To help you create a sound strategy based on your personal goals and risk tolerance, Wells Fargo Funds offers more than 100 mutual funds spanning a wide range of asset classes and investment styles. Although diversification cannot guarantee an investment profit or prevent losses, we believe it can be an effective way to manage investment risk and potentially smooth out overall portfolio performance. We encourage investors to know their investments and to understand that appropriate levels of risk-taking may unlock opportunities.
Thank you for choosing to invest with Wells Fargo Funds. We appreciate your confidence in us and remain committed to helping you meet your financial needs.
Sincerely,

Andrew Owen
President
Wells Fargo Funds
For further information about your Fund, contact your investment professional, visit our website atwfam.com, or call us directly at1-800-222-8222.
| 10 | The MSCI ACWI (Net) is a free-float-adjusted market-capitalization-weighted index that is designed to measure the equity market performance of developed and emerging markets. You cannot invest directly in an index. |
This page is intentionally left blank.
| | | | |
| 6 | | Wells Fargo Index Fund1 | | Performance highlights (unaudited) |
Investment objective
The Fund seeks to replicate the total return of the S&P 500 Index, before fees and expenses.
Manager
Wells Fargo Funds Management, LLC
Subadviser for the affiliated master portfolio
Wells Capital Management Incorporated
Portfolio managers
John R. Campbell, CFA®‡
David Neal, CFA®‡
Robert M. Wicentowski, CFA®‡
Average annual total returns (%) as of May 31, 2019
| | | | | | | | | | | | | | | | | | | | | | | | | | | | | | | | | | |
| | | | | Including sales charge | | | Excluding sales charge | | | Expense ratios2 (%) | |
| | | Inception date | | 1 year | | | 5 year | | | 10 year | | | 1 year | | | 5 year | | | 10 year | | | Gross | | | Net3 | |
| | | | | | | | | |
| Class A (WFILX)4 | | 11-4-1998 | | | -2.61 | | | | 7.86 | | | | 12.71 | | | | 3.32 | | | | 9.15 | | | | 13.38 | | | | 0.63 | | | | 0.45 | |
| | | | | | | | | |
| Class C (WFINX)4 | | 4-30-1999 | | | 1.54 | | | | 8.33 | | | | 12.53 | | | | 2.54 | | | | 8.33 | | | | 12.53 | | | | 1.38 | | | | 1.20 | |
| | | | | | | | | |
| Administrator Class (WFIOX)4 | | 2-14-1985 | | | – | | | | – | | | | – | | | | 3.52 | | | | 9.40 | | | | 13.68 | | | | 0.40 | | | | 0.25 | |
| | | | | | | | | |
| S&P 500 Index5 | | – | | | – | | | | – | | | | – | | | | 3.78 | | | | 9.66 | | | | 13.95 | | | | – | | | | – | |
Figures quoted represent past performance, which is no guarantee of future results, and do not reflect taxes that a shareholder may pay on fund distributions or the redemption of fund shares. Investment return and principal value of an investment will fluctuate so that an investor’s shares, when redeemed, may be worth more or less than their original cost. Performance shown without sales charges would be lower if sales charges were reflected. Current performance may be lower or higher than the performance data quoted, which assumes the reinvestment of dividends and capital gains. Current month-end performance is available on the Fund’s website,wfam.com.
Index returns do not include transaction costs associated with buying and selling securities, any mutual fund fees or expenses, or any taxes. It is not possible to invest directly in an index.
For Class A shares, the maximum front-end sales charge is 5.75%. For Class C shares, the maximum contingent deferred sales charge is 1.00%. Performance including a contingent deferred sales charge assumes the sales charge for the corresponding time period. Administrator Class shares are sold without a front-end sales charge or contingent deferred sales charge.
Stock values fluctuate in response to the activities of individual companies and general market and economic conditions. The use of derivatives may reduce returns and/or increase volatility. Consult the Fund’s prospectus for additional information on these and other risks.
Please see footnotes on page 7.
| | | | | | |
| Performance highlights (unaudited) | | Wells Fargo Index Fund | | | 7 | |
|
| Growth of $10,000 investment as of May 31, 20196 |
|
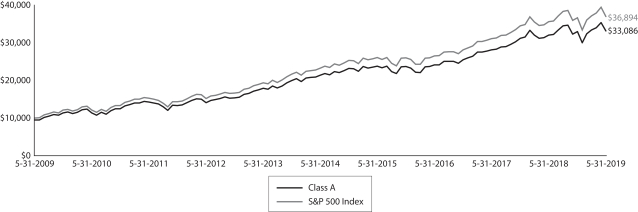 |
| ‡ | CFA® and Chartered Financial Analyst® are trademarks owned by CFA Institute. |
| 1 | The Fund is a gateway feeder fund that invests substantially all of its assets in a single affiliated master portfolio of the Wells Fargo Master Trust with a substantially identical investment objective and substantially similar investment strategies. References to the investment activities of the Fund are intended to refer to the investment activities of the affiliated master portfolio in which it invests. |
| 2 | Reflects the expense ratios as stated in the most recent prospectuses. The expense ratios shown are subject to change and may differ from the annualized expense ratios shown in the financial highlights of this report. |
| 3 | The manager has contractually committed through September 30, 2019, to waive fees and/or reimburse expenses to the extent necessary to cap the expenses of each class after fee waivers at the amounts shown. Brokerage commissions, stamp duty fees, interest, taxes, acquired fund fees and expenses (if any) from funds in which the affiliated master portfolio invests, and extraordinary expenses are excluded from the expense caps. Net expenses from the affiliated master portfolio are included in the expense cap. Prior to or after the commitment expiration date, the cap may be increased or the commitment to maintain the cap may be terminated only with the approval of the Board of Trustees. Without this cap, the Fund’s returns would have been lower. The expense ratio paid by an investor is the net expense ratio (the total annual fund operating expenses after fee waivers) as stated in the prospectuses. |
| 4 | Historical performance shown prior to July 19, 2010, is based on the performance of the Fund’s predecessor, Evergreen Equity Index Fund. |
| 5 | The S&P 500 Index consists of 500 stocks chosen for market size, liquidity, and industry group representation. It is a market-value-weighted index with each stock’s weight in the index proportionate to its market value. You cannot invest directly in an index. |
| 6 | The chart compares the performance of Class A shares for the most recent ten years with the S&P 500 Index. The chart assumes a hypothetical $10,000 investment in Class A shares and reflects all operating expenses and assumes the maximum initial sales charge of 5.75%. |
| 7 | The ten largest holdings, excluding cash, cash equivalents and any money market funds, are calculated based on the value of the securities of the affiliated master portfolio allocable to the Fund divided by the total net assets of the Fund. Holdings are subject to change and may have changed since the date specified. |
| 8 | Amounts represent the sector distribution of the affiliated master portfolio which are calculated based on the total long-term investments of the affiliated master portfolio. These amounts are subject to change and may have changed since the date specified. |
| | | | |
| 8 | | Wells Fargo Index Fund | | Performance highlights (unaudited) |
MANAGER’S DISCUSSION
Fund highlights
| ∎ | | For the 12-month period that ended May 31, 2019, the Fund underperformed its S&P 500 Index benchmark. |
| ∎ | | The energy, materials, financials, and industrials sectors declined. |
| ∎ | | The real estate, utilities, and consumer staples sectors posted the highest returns in the S&P 500 Index. |
The Fund’s management team rebalances the portfolio to reflect the ongoing changes in the constituents and their weightings within the index. One cannot invest directly in the benchmark, and timing of cash flows and other practical issues affect the Fund’s tracking error, which is a measure of how closely a portfolio tracks the index to which it is benchmarked. The team uses an investment process designed to control trading and implementation costs and reduce tracking error to the benchmark as much as possible.
| | | | |
| Ten largest holdings (%) as of May 31, 20197 | |
| |
Microsoft Corporation | | | 4.04 | |
| |
Apple Incorporated | | | 3.34 | |
| |
Amazon.com Incorporated | | | 3.12 | |
| |
Facebook Incorporated Class A | | | 1.80 | |
| |
Berkshire Hathaway Incorporated Class B | | | 1.63 | |
| |
Johnson & Johnson | | | 1.49 | |
| |
JPMorgan Chase & Company | | | 1.48 | |
| |
Alphabet Incorporated Class C | | | 1.44 | |
| |
Alphabet Incorporated Class A | | | 1.41 | |
| |
Exxon Mobil Corporation | | | 1.28 | |
Despite weakness in the fourth quarter of 2018 and a weak May 2019, the S&P 500 Index delivered a positive return over the period.
The period began with reports of solid economic growth and strong corporate profit growth. Later reports signaled that growth was slowing. As the Federal Open Market Committee (FOMC) raised the federal funds target rate throughout the first half of 2018, concerns began to surface that the rate was rising too quickly. The FOMC took a dovish pivot later during the reporting period, holding rates steady since December. Tensions with China rose throughout the period, and what market participants seemed to largely ignore initially was taken more seriously as tensions escalated with each passing month.
|
| Sector distribution as of May 31, 20198 |
|
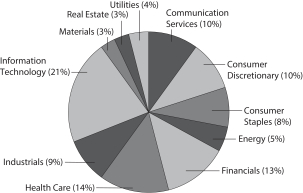 |
The real estate, utilities, and consumer staples sectors were the top performers within the S&P 500 Index.
Real estate, utilities, and consumer staples are relatively interest rate dependent or are viewed as proxies for fixed-income securities. The pause in hikes to the U.S. federal funds rate since December and the fact that many market participants now expect rates to move in the opposite direction are favorable conditions for these sectors. Strength was broad among real estate investment trusts in the real estate sector and among utilities. Within consumer staples, household products companies, soft drink companies, and discount retailers were particularly strong.
Energy, materials, financials, and industrials declined for the period.
Energy companies were under pressure over much of the period as the price for a barrel of West Texas Intermediate crude oil fell from a high of around $75.00 in October 2018 to a low of around $42.50 in January 2019 before finishing the period around $53.50. Nearly every company in the sector finished the period lower than it began. Materials weakness was broad and led by metals and mining companies. Financials weakness was most concentrated among capital markets companies and banks. Industrials weakness was driven by the airfreight and logistics industry, including notable detractors FedEx Corporation and United Parcel Service, Incorporated.
Please see footnotes on page 7.
| | | | | | |
| Performance highlights (unaudited) | | Wells Fargo Index Fund | | | 9 | |
The economy is likely to present continued opportunities for growth, but with elevated risks.
We expect the U.S. economy to maintain the trend established over the past several years with steady growth, low unemployment, high consumer confidence, and growth in personal incomes. Corporate fundamentals have deteriorated somewhat as the earnings outlook has weakened. However, investment spending and corporate balance sheets remain healthy. We believe the largest source of risk to earnings is linked to uncertainty regarding trade disputes, which have the potential to result in higher input costs, higher labor costs, and profit-margin compression. The risk of slow economic growth for several quarters or an economic downturn has increased. However, the combination of weak core inflation and slower economic growth will likely keep the FOMC on hold in 2019 with a bias toward loosening monetary policy.
| | | | |
| 10 | | Wells Fargo Index Fund | | Fund expenses (unaudited) |
As a shareholder of the Fund, you incur two types of costs: (1) transaction costs, including sales charges (loads) on purchase payments and contingent deferred sales charges (if any) on redemptions and (2) ongoing costs, including management fees, distribution (12b-1) and/or shareholder servicing fees, and other Fund expenses. This example is intended to help you understand your ongoing costs (in dollars) of investing in the Fund and to compare these costs with the ongoing costs of investing in other mutual funds.
The example is based on an investment of $1,000 invested at the beginning of the six-month period and held for the entire period from December 1, 2018 to May 31, 2019.
Actual expenses
The “Actual” line of the table below provides information about actual account values and actual expenses. You may use the information in this line, together with the amount you invested, to estimate the expenses that you paid over the period. Simply divide your account value by $1,000 (for example, an $8,600 account value divided by $1,000 = 8.6), then multiply the result by the number in the “Actual” line under the heading entitled “Expenses paid during period” for your applicable class of shares to estimate the expenses you paid on your account during this period.
Hypothetical example for comparison purposes
The “Hypothetical” line of the table below provides information about hypothetical account values and hypothetical expenses based on the Fund’s actual expense ratio and an assumed rate of return of 5% per year before expenses, which is not the Fund’s actual return. The hypothetical account values and expenses may not be used to estimate the actual ending account balance or expenses you paid for the period. You may use this information to compare the ongoing costs of investing in the Fund and other funds. To do so, compare this 5% hypothetical example with the 5% hypothetical examples that appear in the shareholder reports of the other funds.
Please note that the expenses shown in the table are meant to highlight your ongoing costs only and do not reflect any transactional costs, such as sales charges (loads) and contingent deferred sales charges. Therefore, the “Hypothetical” line of the table is useful in comparing ongoing costs only and will not help you determine the relative total costs of owning different funds. In addition, if these transactional costs were included, your costs would have been higher.
| | | | | | | | | | | | | | | | |
| | | Beginning
account value
12-1-2018 | | | Ending
account value
5-31-2019 | | | Expenses
paid during
the period1,2 | | | Annualized net
expense ratio1 | |
Class A | | | | | | | | | | | | | | | | |
| | | | |
Actual | | $ | 1,000.00 | | | $ | 1,005.30 | | | $ | 2.25 | | | | 0.45 | % |
| | | | |
Hypothetical (5% return before expenses) | | $ | 1,000.00 | | | $ | 1,022.68 | | | $ | 2.27 | | | | 0.45 | % |
Class C | | | | | | | | | | | | | | | | |
| | | | |
Actual | | $ | 1,000.00 | | | $ | 1,001.47 | | | $ | 5.98 | | | | 1.20 | % |
| | | | |
Hypothetical (5% return before expenses) | | $ | 1,000.00 | | | $ | 1,018.96 | | | $ | 6.03 | | | | 1.20 | % |
Administrator Class | | | | | | | | | | | | | | | | |
| | | | |
Actual | | $ | 1,000.00 | | | $ | 1,006.17 | | | $ | 1.25 | | | | 0.25 | % |
| | | | |
Hypothetical (5% return before expenses) | | $ | 1,000.00 | | | $ | 1,023.68 | | | $ | 1.26 | | | | 0.25 | % |
| 1 | Amounts reflect net expenses allocated from the affiliated Master Portfolio in which the Fund invests. |
| 2 | Expenses paid is equal to the annualized net expense ratio of each class multiplied by the average account value over the period, multiplied by the number of days in the most recent fiscal half-year divided by the number of days in the fiscal year (to reflect the one-half-year period). |
| | | | | | |
| Portfolio of investments—May 31, 2019 | | Wells Fargo Index Fund | | | 11 | |
| | | | | | | | | | | | | | | | |
| Security name | | | | | | | | | | | Value | |
| | | | |
Investment Companies: 100.09% | | | | | | | | | | | | | | | | |
| | | | |
| Affiliated Master Portfolio: 100.09% | | | | | | | | | | | | | | | | |
| | | | |
Wells Fargo Index Portfolio | | | | | | | | | | | | | | $ | 1,157,587,475 | |
| | | | | | | | | | | | | | | | |
| | | | |
Total Investment Companies (Cost $210,203,507) | | | | | | | | | | | | | | | 1,157,587,475 | |
| | | | | | | | | | | | | | | | |
| | | | | | | | |
| Total investments in securities (Cost $210,203,507) | | | 100.09 | % | | | 1,157,587,475 | |
| | |
Other assets and liabilities, net | | | (0.09 | ) | | | (996,708 | ) |
| | | | | | | | |
| Total net assets | | | 100.00 | % | | $ | 1,156,590,767 | |
| | | | | | | | |
Transactions with the affiliated Master Portfolio were as follows:
| | | | | | | | | | | | | | | | | | | | | | | | | | | | | | | | | | | | |
| | | % of
ownership,
beginning of
period | | | % of
ownership,
end of
period | | | Net
realized
gains
(losses) on
securities
transactions
allocated
from
affiliated
Master
Portfolio | | | Net
change in
unrealized
gains
(losses) on
securities
transactions
allocated
from
affiliated
Master
Portfolio | | | Dividends
allocated
from
affiliated
Master
Portfolio | | | Affiliated
income
allocated
from
affiliated
Master
Portfolio | | | Interest
allocated
from
affiliated
Master
Portfolio | | | Value,
end of
period | | | % of
net
assets | |
Wells Fargo Index Portfolio | | | 97 | % | | | 97 | % | | $ | 306,741,725 | | | $ | (284,064,839 | ) | | $ | 26,960,730 | | | $ | 1,079,067 | | | $ | 49,485 | | | $ | 1,157,587,475 | | | | 100.09 | % |
The accompanying notes are an integral part of these financial statements.
| | | | |
| 12 | | Wells Fargo Index Fund | | Statement of assets and liabilities—May 31, 2019 |
| | | | |
| | | | |
| |
Assets | | | | |
Investments in affiliated Master Portfolio, at value (cost $210,203,507) | | $ | 1,157,587,475 | |
Receivable for Fund shares sold | | | 481,931 | |
Receivable from manager | | | 165,862 | |
Prepaid expenses and other assets | | | 185,112 | |
| | | | |
Total assets | | | 1,158,420,380 | |
| | | | |
| |
Liabilities | | | | |
Payable for Fund shares redeemed | | | 1,275,885 | |
Shareholder servicing fees payable | | | 207,153 | |
Administration fees payable | | | 194,588 | |
Distribution fee payable | | | 13,628 | |
Accrued expenses and other liabilities | | | 138,359 | |
| | | | |
Total liabilities | | | 1,829,613 | |
| | | | |
Total net assets | | $ | 1,156,590,767 | |
| | | | |
| |
NET ASSETS CONSIST OF | | | | |
Paid-in capital | | $ | (5,230,480 | ) |
Total distributable earnings | | | 1,161,821,247 | |
| | | | |
Total net assets | | $ | 1,156,590,767 | |
| | | | |
| |
COMPUTATION OF NET ASSET VALUE AND OFFERING PRICE PER SHARE | | | | |
Net assets – Class A | | $ | 676,511,407 | |
Shares outstanding – Class A1 | | | 13,673,192 | |
Net asset value per share – Class A | | | $49.48 | |
Maximum offering price per share – Class A2 | | | $52.50 | |
Net assets – Class C | | $ | 19,145,683 | |
Shares outstanding – Class C1 | | | 382,727 | |
Net asset value per share – Class C | | | $50.02 | |
Net assets – Administrator Class | | $ | 460,933,677 | |
Shares outstanding – Administrator Class1 | | | 9,174,186 | |
Net asset value per share – Administrator Class | | | $50.24 | |
| 1 | The Fund has an unlimited number of authorized shares. |
| 2 | Maximum offering price is computed as 100/94.25 of net asset value. On investments of $50,000 or more, the offering price is reduced. |
The accompanying notes are an integral part of these financial statements.
| | | | | | |
| Statement of operations—year ended May 31, 2019 | | Wells Fargo Index Fund | | | 13 | |
| | | | |
| | | | |
| |
Investment income | | | | |
Dividends allocated from affiliated Master Portfolio (net of foreign withholding taxes of $15,537) | | $ | 26,960,730 | |
Affiliated income allocated from affiliated Master Portfolio | | | 1,079,067 | |
Interest allocated from affiliated Master Portfolio | | | 49,485 | |
Expenses allocated from affiliated Master Portfolio | | | (1,551,650 | ) |
| | | | |
Total investment income | | | 26,537,632 | |
| | | | |
| |
Expenses | | | | |
Management fee | | | 714,769 | |
Administration fees | | | | |
Class A | | | 1,475,634 | |
Class C | | | 105,083 | |
Administrator Class | | | 879,861 | |
Shareholder servicing fees | | | | |
Class A | | | 1,756,707 | |
Class C | | | 125,100 | |
Administrator Class | | | 658,783 | |
Distribution fee | | | | |
Class C | | | 375,281 | |
Custody and accounting fees | | | 75,029 | |
Professional fees | | | 32,467 | |
Registration fees | | | 86,724 | |
Shareholder report expenses | | | 97,432 | |
Trustees’ fees and expenses | | | 20,505 | |
Other fees and expenses | | | 82,259 | |
| | | | |
Total expenses | | | 6,485,634 | |
Less: Fee waivers and/or expense reimbursements | | | (2,579,567 | ) |
| | | | |
Net expenses | | | 3,906,067 | |
| | | | |
Net investment income | | | 22,631,565 | |
| | | | |
| |
REALIZED AND UNREALIZED GAINS (LOSSES) ON INVESTMENTS | | | | |
Net realized gains on securities transactions allocated from affiliated Master Portfolio | | | 306,741,725 | |
Net change in unrealized gains (losses) on securities transactions allocated from affiliated Master Portfolio | | | (284,064,839 | ) |
| | | | |
Net realized and unrealized gains (losses) on investments | | | 22,676,886 | |
| | | | |
Net increase in net assets resulting from operations | | $ | 45,308,451 | |
| | | | |
The accompanying notes are an integral part of these financial statements.
| | | | |
| 14 | | Wells Fargo Index Fund | | Statement of changes in net assets |
| | | | | | | | | | | | | | | | |
| | | Year ended
May 31, 2019 | | | Year ended
May 31, 20181 | |
| | | | |
Operations | | | | | | | | | | | | | | | | |
Net investment income | | | | | | $ | 22,631,565 | | | | | | | $ | 28,480,595 | |
Net realized gains on investments | | | | | | | 306,741,725 | | | | | | | | 342,171,321 | |
Net change in unrealized gains (losses) on investments | | | | | | | (284,064,839 | ) | | | | | | | (126,133,995 | ) |
| | | | |
Net increase in net assets resulting from operations | | | | | | | 45,308,451 | | | | | | | | 244,517,921 | |
| | | | |
| | | | |
Distributions to shareholders from net investment income and net realized gains | | | | | | | | | | | | | | | | |
Class A | | | | | | | (163,505,563 | ) | | | | | | | (123,045,671 | ) |
Class C | | | | | | | (13,933,913 | ) | | | | | | | (11,221,352 | ) |
Administrator Class | | | | | | | (171,863,037 | ) | | | | | | | (188,746,345 | ) |
| | | | |
Total distributions to shareholders | | | | | | | (349,302,513 | ) | | | | | | | (323,013,368 | ) |
| | | | |
| | | | |
Capital share transactions | | | Shares | | | | | | | | Shares | | | | | |
Proceeds from shares sold | | | | | | | | | | | | | | | | |
Class A | | | 1,215,528 | | | | 63,105,358 | | | | 473,086 | | | | 31,179,127 | |
Class C | | | 101,602 | | | | 5,479,223 | | | | 87,293 | | | | 5,748,674 | |
Administrator Class | | | 1,223,311 | | | | 69,577,734 | | | | 1,710,651 | | | | 115,109,719 | |
| | | | |
| | | | |
| | | | | | | 138,162,315 | | | | | | | | 152,037,520 | |
| | | | |
Reinvestment of distributions | | | | | | | | | | | | | | | | |
Class A | | | 3,265,381 | | | | 156,770,222 | | | | 1,867,730 | | | | 117,353,642 | |
Class C | | | 255,848 | | | | 12,342,496 | | | | 157,810 | | | | 9,921,751 | |
Administrator Class | | | 2,487,498 | | | | 121,257,092 | | | | 1,928,218 | | | | 122,530,422 | |
| | | | |
| | | | |
| | | | | | | 290,369,810 | | | | | | | | 249,805,815 | |
| | | | |
Payment for shares redeemed | | | | | | | | | | | | | | | | |
Class A | | | (1,902,710 | ) | | | (106,045,189 | ) | | | (1,478,098 | ) | | | (97,820,940 | ) |
Class C | | | (1,013,120 | ) | | | (51,601,044 | ) | | | (215,384 | ) | | | (14,322,037 | ) |
Administrator Class | | | (7,480,787 | ) | | | (408,288,013 | ) | | | (7,771,521 | ) | | | (516,434,208 | ) |
| | | | |
| | | | |
| | | | | | | (565,934,246 | ) | | | | | | | (628,577,185 | ) |
| | | | |
Net decrease in net assets resulting from capital share transactions | | | | | | | (137,402,121 | ) | | | | | | | (226,733,850 | ) |
| | | | |
Total decrease in net assets | | | | | | | (441,396,183 | ) | | | | | | | (305,229,297 | ) |
| | | | |
| | |
Net assets | | | | | | | | |
Beginning of period | | | | | | | 1,597,986,950 | | | | | | | | 1,903,216,247 | |
| | | | |
End of period | | | | | | $ | 1,156,590,767 | | | | | | | $ | 1,597,986,950 | |
| | | | |
| 1 | Effective for all filings after November 4, 2018, the SEC prospectively eliminated the requirement to parenthetically disclose undistributed net investment income at the end of the period and permitted the aggregation of distributions, with the exception of tax basis returns of capital. Undistributed net investment income at May 31, 2018 was $10,188,054. The disaggregated distributions information for the year ended May 31, 2018 is included in Note 7,Distributions to Shareholders,in the notes to the financial statements. |
The accompanying notes are an integral part of these financial statements.
| | | | | | |
| Financial highlights | | Wells Fargo Index Fund | | | 15 | |
(For a share outstanding throughout each period)
| | | | | | | | | | | | | | | | | | | | |
| | | Year ended May 31 | |
| CLASS A | | 2019 | | | 2018 | | | 2017 | | | 2016 | | | 2015 | |
Net asset value, beginning of period | | | $63.35 | | | | $66.85 | | | | $62.85 | | | | $67.32 | | | | $62.14 | |
Net investment income | | | 0.82 | | | | 0.99 | 1 | | | 1.05 | | | | 0.81 | | | | 1.00 | |
Net realized and unrealized gains (losses) on investments | | | 0.54 | | | | 7.99 | | | | 9.09 | | | | (0.17 | ) | | | 5.91 | |
| | | | | | | | | | | | | | | | | | | | |
Total from investment operations | | | 1.36 | | | | 8.98 | | | | 10.14 | | | | 0.64 | | | | 6.91 | |
Distributions to shareholders from | | | | | | | | | | | | | | | | | | | | |
Net investment income | | | (0.90 | ) | | | (1.02 | ) | | | (1.16 | ) | | | (1.08 | ) | | | (0.96 | ) |
Net realized gains | | | (14.33 | ) | | | (11.46 | ) | | | (4.98 | ) | | | (4.03 | ) | | | (0.77 | ) |
| | | | | | | | | | | | | | | | | | | | |
Total distributions to shareholders | | | (15.23 | ) | | | (12.48 | ) | | | (6.14 | ) | | | (5.11 | ) | | | (1.73 | ) |
Net asset value, end of period | | | $49.48 | | | | $63.35 | | | | $66.85 | | | | $62.85 | | | | $67.32 | |
Total return2 | | | 3.32 | % | | | 13.87 | % | | | 16.94 | % | | | 1.24 | % | | | 11.21 | % |
Ratios to average net assets (annualized) | | | | | | | | | | | | | | | | | | | | |
Gross expenses3 | | | 0.65 | % | | | 0.63 | % | | | 0.62 | % | | | 0.63 | % | | | 0.68 | % |
Net expenses3 | | | 0.45 | % | | | 0.45 | % | | | 0.45 | % | | | 0.48 | % | | | 0.56 | % |
Net investment income3 | | | 1.51 | % | | | 1.49 | % | | | 1.68 | % | | | 1.78 | % | | | 1.50 | % |
Supplemental data | | | | | | | | | | | | | | | | | | | | |
Portfolio turnover rate4 | | | 4 | % | | | 3 | % | | | 9 | % | | | 4 | % | | | 4 | % |
Net assets, end of period (000s omitted) | | | $676,511 | | | | $702,866 | | | | $684,004 | | | | $639,496 | | | | $445,088 | |
| 1 | Calculated based upon average shares outstanding |
| 2 | Total return calculations do not include any sales charges. |
| 3 | Ratios include net expenses allocated from the affiliated Master Portfolio which were as follows: |
| | | | |
Year ended May 31, 2019 | | | 0.11 | % |
Year ended May 31, 2018 | | | 0.10 | % |
Year ended May 31, 2017 | | | 0.10 | % |
Year ended May 31, 2016 | | | 0.10 | % |
Year ended May 31, 2015 | | | 0.11 | % |
| 4 | Portfolio turnover rate is calculated by multiplying the affiliated Master Portfolio’s percentage of the Fund’s total investment in securities at the end of the period by the affiliated Master Portfolio’s portfolio turnover rate. |
The accompanying notes are an integral part of these financial statements.
| | | | |
| 16 | | Wells Fargo Index Fund | | Financial highlights |
(For a share outstanding throughout each period)
| | | | | | | | | | | | | | | | | | | | |
| | | Year ended May 31 | |
| CLASS C | | 2019 | | | 2018 | | | 2017 | | | 2016 | | | 2015 | |
Net asset value, beginning of period | | | $63.67 | | | | $67.11 | | | | $63.12 | | | | $67.55 | | | | $62.37 | |
Net investment income | | | 0.46 | 1 | | | 0.50 | 1 | | | 0.66 | | | | 0.62 | 1 | | | 0.50 | |
Net realized and unrealized gains (losses) on investments | | | 0.52 | | | | 8.00 | | | | 9.02 | | | | (0.45 | ) | | | 5.94 | |
| | | | | | | | | | | | | | | | | | | | |
Total from investment operations | | | 0.98 | | | | 8.50 | | | | 9.68 | | | | 0.17 | | | | 6.44 | |
Distributions to shareholders from | | | | | | | | | | | | | | | | | | | | |
Net investment income | | | (0.30 | ) | | | (0.48 | ) | | | (0.71 | ) | | | (0.57 | ) | | | (0.49 | ) |
Net realized gains | | | (14.33 | ) | | | (11.46 | ) | | | (4.98 | ) | | | (4.03 | ) | | | (0.77 | ) |
| | | | | | | | | | | | | | | | | | | | |
Total distributions to shareholders | | | (14.63 | ) | | | (11.94 | ) | | | (5.69 | ) | | | (4.60 | ) | | | (1.26 | ) |
Net asset value, end of period | | | $50.02 | | | | $63.67 | | | | $67.11 | | | | $63.12 | | | | $67.55 | |
Total return2 | | | 2.54 | % | | | 13.02 | % | | | 16.07 | % | | | 0.48 | % | | | 10.38 | % |
Ratios to average net assets (annualized) | | | | | | | | | | | | | | | | | | | | |
Gross expenses3 | | | 1.39 | % | | | 1.38 | % | | | 1.37 | % | | | 1.38 | % | | | 1.43 | % |
Net expenses3 | | | 1.20 | % | | | 1.20 | % | | | 1.20 | % | | | 1.24 | % | | | 1.31 | % |
Net investment income3 | | | 0.77 | % | | | 0.72 | % | | | 0.93 | % | | | 0.99 | % | | | 0.75 | % |
Supplemental data | | | | | | | | | | | | | | | | | | | | |
Portfolio turnover rate4 | | | 4 | % | | | 3 | % | | | 9 | % | | | 4 | % | | | 4 | % |
Net assets, end of period (000s omitted) | | | $19,146 | | | | $66,117 | | | | $67,691 | | | | $79,858 | | | | $83,718 | |
| 1 | Calculated based upon average shares outstanding |
| 2 | Total return calculations do not include any sales charges. |
| 3 | Ratios include net expenses allocated from the affiliated Master Portfolio which were as follows: |
| | | | |
Year ended May 31, 2019 | | | 0.11 | % |
Year ended May 31, 2018 | | | 0.10 | % |
Year ended May 31, 2017 | | | 0.10 | % |
Year ended May 31, 2016 | | | 0.10 | % |
Year ended May 31, 2015 | | | 0.11 | % |
| 4 | Portfolio turnover rate is calculated by multiplying the affiliated Master Portfolio’s percentage of the Fund’s total investment in securities at the end of the period by the affiliated Master Portfolio’s portfolio turnover rate. |
The accompanying notes are an integral part of these financial statements.
| | | | | | |
| Financial highlights | | Wells Fargo Index Fund | | | 17 | |
(For a share outstanding throughout each period)
| | | | | | | | | | | | | | | | | | | | |
| | | Year ended May 31 | |
| ADMINISTRATOR CLASS | | 2019 | | | 2018 | | | 2017 | | | 2016 | | | 2015 | |
Net asset value, beginning of period | | | $64.04 | | | | $67.43 | | | | $63.33 | | | | $67.80 | | | | $62.56 | |
Net investment income | | | 1.02 | 1 | | | 1.26 | | | | 1.41 | | | | 1.31 | | | | 1.27 | |
Net realized and unrealized gains (losses) on investments | | | 0.48 | | | | 7.94 | | | | 8.94 | | | | (0.51 | ) | | | 5.90 | |
| | | | | | | | | | | | | | | | | | | | |
Total from investment operations | | | 1.50 | | | | 9.20 | | | | 10.35 | | | | 0.80 | | | | 7.17 | |
Distributions to shareholders from | | | | | | | | | | | | | | | | | | | | |
Net investment income | | | (0.97 | ) | | | (1.13 | ) | | | (1.27 | ) | | | (1.24 | ) | | | (1.16 | ) |
Net realized gains | | | (14.33 | ) | | | (11.46 | ) | | | (4.98 | ) | | | (4.03 | ) | | | (0.77 | ) |
| | | | | | | | | | | | | | | | | | | | |
Total distributions to shareholders | | | (15.30 | ) | | | (12.59 | ) | | | (6.25 | ) | | | (5.27 | ) | | | (1.93 | ) |
Net asset value, end of period | | | $50.24 | | | | $64.04 | | | | $67.43 | | | | $63.33 | | | | $67.80 | |
Total return | | | 3.52 | % | | | 14.10 | % | | | 17.18 | % | | | 1.49 | % | | | 11.56 | % |
Ratios to average net assets (annualized) | | | | | | | | | | | | | | | | | | | | |
Gross expenses2 | | | 0.41 | % | | | 0.40 | % | | | 0.39 | % | | | 0.40 | % | | | 0.37 | % |
Net expenses2 | | | 0.25 | % | | | 0.25 | % | | | 0.25 | % | | | 0.25 | % | | | 0.25 | % |
Net investment income2 | | | 1.72 | % | | | 1.70 | % | | | 1.88 | % | | | 1.97 | % | | | 1.81 | % |
Supplemental data | | | | | | | | | | | | | | | | | | | | |
Portfolio turnover rate3 | | | 4 | % | | | 3 | % | | | 9 | % | | | 4 | % | | | 4 | % |
Net assets, end of period (000s omitted) | | | $460,934 | | | | $829,004 | | | | $1,151,522 | | | | $1,502,276 | | | | $1,832,814 | |
| 1 | Calculated based upon average shares outstanding |
| 2 | Ratios include net expenses allocated from the affiliated Master Portfolio which were as follows: |
| | | | |
Year ended May 31, 2019 | | | 0.11 | % |
Year ended May 31, 2018 | | | 0.10 | % |
Year ended May 31, 2017 | | | 0.10 | % |
Year ended May 31, 2016 | | | 0.10 | % |
Year ended May 31, 2015 | | | 0.11 | % |
| 3 | Portfolio turnover rate is calculated by multiplying the affiliated Master Portfolio’s percentage of the Fund’s total investment in securities at the end of the period by the affiliated Master Portfolio’s portfolio turnover rate. |
The accompanying notes are an integral part of these financial statements.
| | | | |
| 18 | | Wells Fargo Index Fund | | Notes to financial statements |
1. ORGANIZATION
Wells Fargo Funds Trust (the “Trust”), a Delaware statutory trust organized on March 10, 1999, is an open-end management investment company registered under the Investment Company Act of 1940, as amended (the “1940 Act”). As an investment company, the Trust follows the accounting and reporting guidance in Financial Accounting Standards Board (“FASB”) Accounting Standards Codification Topic 946, Financial Services – Investment Companies. These financial statements report on the Wells Fargo Index Fund (the “Fund”) which is a diversified series of the Trust.
The Fund is a feeder fund in a master-feeder structure that invests substantially all of its assets in a single master portfolio with a substantially identical investment objective and substantially similar investment strategies. The Fund seeks to achieve its investment objective by investing substantially all of its assets in a separate diversified portfolio (the “affiliated Master Portfolio”) of Wells Fargo Master Trust, a registered open-end management investment company. The affiliated Master Portfolio directly acquires portfolio securities and the Fund acquires an indirect interest in those securities. The Fund accounts for its investment in the affiliated Master Portfolio as a partnership investment and records on a daily basis its share of the affiliated Master Portfolio’s income, expense and realized and unrealized gains and losses. The financial statements of the affiliated Master Portfolio for the year ended May 31, 2019 are included in this report and should be read in conjunction with the Fund’s financial statements. As of May 31, 2019, the Fund owned 97% of Wells Fargo Index Portfolio.
2. SIGNIFICANT ACCOUNTING POLICIES
The following significant accounting policies, which are consistently followed in the preparation of the financial statements of the Fund, are in conformity with U.S. generally accepted accounting principles which require management to make estimates and assumptions that affect the reported amounts of assets and liabilities, disclosure of contingent assets and liabilities at the date of the financial statements, and the reported amounts of revenues and expenses during the reporting period. Actual results could differ from those estimates.
Securities valuation
All investments are valued each business day as of the close of regular trading on the New York Stock Exchange (generally 4 p.m. Eastern Time), although the Fund may deviate from this calculation time under unusual or unexpected circumstances.
Investments in the affiliated Master Portfolio are valued daily based on the Fund’s proportionate share of the affiliated Master Portfolio’s net assets, which are also valued daily. Securities held in the affiliated Master Portfolio are valued as discussed in the Notes to Financial Statements of the affiliated Master Portfolio, which are included elsewhere in this report.
Investment transactions, income and expenses
Investments in the affiliated Master Portfolio are recorded on a trade basis. The Fund records daily its proportionate share of the affiliated Master Portfolio’s interest and dividend income, expenses and realized and unrealized gains or losses. The Fund also accrues its own expenses.
Distributions to shareholders
Distributions to shareholders from net investment income and any net realized gains are recorded on the ex-dividend date and paid at least annually. Such distributions are determined in accordance with income tax regulations and may differ from U.S. generally accepted accounting principles. Dividend sources are estimated at the time of declaration. The tax character of distributions is determined as of the Fund’s fiscal year end. Therefore, a portion of the Fund’s distributions made prior to the Fund’s fiscal year end may be categorized as a tax return of capital at year end.
Federal and other taxes
The Fund intends to continue to qualify as a regulated investment company by distributing substantially all of its investment company taxable income and any net realized capital gains (after reduction for capital loss carryforwards) sufficient to relieve it from all, or substantially all, federal income taxes. Accordingly, no provision for federal income taxes was required.
The Fund’s income and federal excise tax returns and all financial records supporting those returns for the prior three fiscal years are subject to examination by the federal and Delaware revenue authorities. Management has analyzed the Fund’s tax positions taken on federal, state, and foreign tax returns for all open tax years and does not believe that there are any uncertain tax positions that require recognition of a tax liability.
| | | | | | |
| Notes to financial statements | | Wells Fargo Index Fund | | | 19 | |
As of May 31, 2019, the aggregate cost of all investments for federal income tax purposes was $215,793,647 and the unrealized gains (losses) consisted of:
| | | | |
| |
Gross unrealized gains | | $ | 941,793,828 | |
| |
Gross unrealized losses | | | 0 | |
| |
Net unrealized gains | | $ | 941,793,828 | |
Class allocations
The separate classes of shares offered by the Fund differ principally in applicable sales charges, distribution, shareholder servicing, and administration fees. Class specific expenses are charged directly to that share class. Investment income, common expenses, and realized and unrealized gains (losses) on investments are allocated daily to each class of shares based on the relative proportion of net assets of each class.
3. FAIR VALUATION MEASUREMENTS
At May 31, 2019, the affiliated Master Portfolio was measured at fair value using the net asset value per share (or its equivalent) as a practical expedient. The investment objective and the value of the affiliate Master Portfolio was as follows:
| | | | | | |
| | |
| Affiliated Master Portfolio | | Investment objective | | Value of
affiliated Master
Portfolio | |
Wells Fargo Index Portfolio | | Seeks to replicate the total return of the S&P 500 Index, before fees and expenses | | | $1,157,587,475 | |
The affiliated Master Portfolio does not have a redemption period notice, can be redeemed daily and does not have any unfunded commitments.
4. TRANSACTIONS WITH AFFILIATES
Management fee
Wells Fargo Funds Management, LLC (“Funds Management”), an indirect wholly owned subsidiary of Wells Fargo & Company (“Wells Fargo”), is the manager of the Fund and provides advisory and fund-level administrative services under an investment management agreement. Under the investment management agreement, Funds Management is responsible for, among other services, implementing the investment objectives and strategies of the Fund and providing fund-level administrative services in connection with the Fund’s operations. As long as the Fund continues to invest substantially all of its assets in a single affiliated Master Portfolio, the Fund pays Funds Management an investment management fee only for fund-level administrative services at the following annual rate based on the Fund’s average daily net assets:
| | |
| |
| Average daily net assets | | Management fee |
| |
First $5 billion | | 0.05% |
| |
Next $5 billion | | 0.04 |
| |
Over $10 billion | | 0.03 |
For the year ended May 31, 2019, the management fee was equivalent to an annual rate of 0.05% of the Fund’s average daily net assets.
Funds Management also serves as the adviser to the affiliated Master Portfolio and is entitled to receive a fee from the affiliated Master Portfolio for those services.
Administration fees
Under a class-level administration agreement, Funds Management provides class-level administrative services to the Fund, which includes paying fees and expenses for services provided by the transfer agent, sub-transfer agents, omnibus account servicers and record-keepers. As compensation for its services under the class-level administration agreement, Funds Management receives an annual fee which is calculated based on the average daily net assets of each class as follows:
| | | | |
| | | Class-level
administration fee | |
| |
Class A, Class C | | | 0.21 | % |
| |
Administrator Class | | | 0.13 | |
| | | | |
| 20 | | Wells Fargo Index Fund | | Notes to financial statements |
Funds Management has contractually waived and/or reimbursed management and administration fees to the extent necessary to maintain certain net operating expense ratios for the Fund. When each class of the Fund has exceeded its expense cap, Funds Management has waived fees and/or reimbursed expenses from fund level expenses on a proportionate basis and then from class specific expenses. When only certain classes exceed their expense caps, waivers and/or reimbursements are applied against class specific expenses before fund level expenses. Net expenses from the affiliated Master Portfolio are included in the expense caps. Funds Management has committed through September 30, 2019 to waive fees and/or reimburse expenses to the extent necessary to cap the Fund’s expenses at 0.45% for Class A shares, 1.20% for Class C shares, and 0.25% for Administrator Class shares. Prior to or after the commitment expiration date, the cap may be increased or the commitment to maintain the cap may be terminated only with the approval of the Board of Trustees.
Distribution fee
The Trust has adopted a distribution plan for Class C shares of the Fund pursuant to Rule 12b-1 under the 1940 Act. A distribution fee is charged to Class C shares and paid to Wells Fargo Funds Distributor, LLC (“Funds Distributor”), the principal underwriter, at an annual rate of 0.75% of the average daily net assets of Class C shares.
In addition, Funds Distributor is entitled to receive the front-end sales charge from the purchase of Class A shares and a contingent deferred sales charge on the redemption of certain Class A shares. Funds Distributor is also entitled to receive the contingent deferred sales charges from redemptions of Class C shares. For the year ended May 31, 2019, Funds Distributor received $10,524 from the sale of Class A shares and $92 in contingent deferred sales charges from redemptions of Class C shares. No contingent deferred sales charges were incurred by Class A shares for the year ended May 31, 2019.
Shareholder servicing fees
The Trust has entered into contracts with one or more shareholder servicing agents, whereby Class A and Class C of the Fund are charged a fee at an annual rate of 0.25% of the average daily net assets of each respective class. Administrator Class is charged a fee at an annual rate of 0.10% of its average daily net assets. A portion of these total shareholder servicing fees were paid to affiliates of Wells Fargo.
5. INVESTMENT PORTFOLIO TRANSACTIONS
The Fund seeks to achieve its investment objective by investing substantially all of its assets in a single affiliated Master Portfolio. Purchases and sales have been calculated by multiplying the Fund’s ownership percentage of the affiliated Master Portfolio by the affiliated Master Portfolio’s purchases and sales. Purchases and sales of investments, excluding short-term securities, for the year ended May 31, 2019 were $48,714,178 and $495,402,094 respectively.
6. BANK BORROWINGS
The Trust (excluding the money market funds), Wells Fargo Master Trust and Wells Fargo Variable Trust are parties to a $280,000,000 revolving credit agreement whereby the Fund is permitted to use bank borrowings for temporary or emergency purposes, such as to fund shareholder redemption requests. Interest under the credit agreement is charged to the Fund based on a borrowing rate equal to the higher of the Federal Funds rate in effect on that day plus 1.25% or the overnight LIBOR rate in effect on that day plus 1.25%. In addition, an annual commitment fee equal to 0.25% of the unused balance is allocated to each participating fund.
For the year ended May 31, 2019, there were no borrowings by the Fund under the agreement.
7. DISTRIBUTIONS TO SHAREHOLDERS
The tax character of distributions paid during the years ended May 31, 2019 and May 31, 2018 were as follows:
| | | | | | | | |
| | | Year ended May 31 | |
| | |
| | | 2019 | | | 2018 | |
| | |
Ordinary income | | $ | 26,860,120 | | | $ | 34,215,926 | |
| | |
Long-term capital gain | | | 322,442,393 | | | | 288,797,442 | |
As of May 31, 2019, the components of distributable earnings on a tax basis were as follows:
| | | | |
Undistributed ordinary income | | Undistributed
long-term
gain | | Unrealized
gains |
| | |
| $7,451,967 | | $212,591,329 | | $941,793,828 |
| | | | | | |
| Notes to financial statements | | Wells Fargo Index Fund | | | 21 | |
Effective for all filings after November 4, 2018, the Securities and Exchange Commission eliminated the requirement to separately state the components of distributions to shareholders under U.S. generally accepted accounting principles. The amounts of distributions to shareholders for the year ended May 31, 2018 were as follows:
| | | | | | | | |
| | | Net
investment
income | | | Net
realized
gains | |
| | |
Class A | | | $11,646,335 | | | | $111,399,336 | |
| | |
Class C | | | 516,619 | | | | 10,704,733 | |
| | |
Administrator Class | | | 18,709,889 | | | | 170,036,456 | |
8. INDEMNIFICATION
Under the Trust’s organizational documents, the officers and Trustees have been granted certain indemnification rights against certain liabilities that may arise out of performance of their duties to the Trust. Additionally, in the normal course of business, the Trust may enter into contracts with service providers that contain a variety of indemnification clauses. The Trust’s maximum exposure under these arrangements is dependent on future claims that may be made against the Fund and, therefore, cannot be estimated.
9. NEW ACCOUNTING PRONOUNCEMENT
In August 2018, FASB issued Accounting Standards Update (“ASU”) No. 2018-13, Fair Value Measurement (Topic 820)Disclosure Framework—Changes to the Disclosure Requirements for Fair Value Measurement. ASU 2018-13 updates the disclosure requirements for fair value measurements by modifying or removing certain disclosures and adding certain new disclosures. The amendments are effective for fiscal years, and interim periods within those fiscal years, beginning after December 15, 2019. Early adoption is permitted. Management has adopted the removal and modification of disclosures early, as permitted, and will adopt the additional new disclosures at the effective date.
| | | | |
| 22 | | Wells Fargo Index Fund | | Report of independent registered public accounting firm |
TO THE SHAREHOLDERS OF THE FUND AND BOARD OF TRUSTEES OF WELLS FARGO FUNDS TRUST:
Opinion on the Financial Statements
We have audited the accompanying statement of assets and liabilities of Wells Fargo Index Fund (the Fund), one of the funds constituting Wells Fargo Funds Trust, including the portfolio of investments, as of May 31, 2019, the related statement of operations for the year then ended, the statements of changes in net assets for each of the years in the two-year period then ended, and the related notes (collectively, the financial statements) and the financial highlights for each of the years in the five-year period then ended. In our opinion, the financial statements and financial highlights present fairly, in all material respects, the financial position of the Fund as of May 31, 2019, the results of its operations for the year then ended, the changes in its net assets for each of the years in the two-year period then ended, and the financial highlights for each of the years in the five-year period then ended, in conformity with U.S. generally accepted accounting principles.
Basis for Opinion
These financial statements and financial highlights are the responsibility of the Fund’s management. Our responsibility is to express an opinion on these financial statements and financial highlights based on our audits. We are a public accounting firm registered with the Public Company Accounting Oversight Board (United States) (PCAOB) and are required to be independent with respect to the Fund in accordance with the U.S. federal securities laws and the applicable rules and regulations of the Securities and Exchange Commission and the PCAOB.
We conducted our audits in accordance with the standards of the PCAOB. Those standards require that we plan and perform the audit to obtain reasonable assurance about whether the financial statements and financial highlights are free of material misstatement, whether due to error or fraud. Our audits included performing procedures to assess the risks of material misstatement of the financial statements and financial highlights, whether due to error or fraud, and performing procedures that respond to those risks. Such procedures included examining, on a test basis, evidence regarding the amounts and disclosures in the financial statements and financial highlights. Such procedures also included confirmation of securities owned as of May 31, 2019, by correspondence with the transfer agent. Our audits also included evaluating the accounting principles used and significant estimates made by management, as well as evaluating the overall presentation of the financial statements and financial highlights. We believe that our audits provide a reasonable basis for our opinion.

We have not been able to determine the specific year that we began serving as the auditor of one or more Wells Fargo Funds investment companies; however we are aware that we have served as the auditor of one or more Wells Fargo Funds investment companies since at least 1955.
Boston, Massachusetts
July 26, 2019
| | | | | | |
| Portfolio of investments—May 31, 2019 | | Wells Fargo Index Portfolio | | | 23 | |
| | | | | | | | | | | | | | | | |
| Security name | | | | | | | | Shares | | | Value | |
| | | | |
Common Stocks: 97.56% | | | | | | | | | | | | | | | | |
| | | | |
Communication Services: 10.14% | | | | | | | | | | | | | | | | |
| | | | |
| Diversified Telecommunication Services: 1.95% | | | | | | | | | | | | | | | | |
| | | | |
AT&T Incorporated | | | | | | | | | | | 370,412 | | | $ | 11,327,188 | |
| | | | |
CenturyLink Incorporated | | | | | | | | | | | 48,356 | | | | 505,320 | |
| | | | |
Verizon Communications Incorporated | | | | | | | | | | | 210,108 | | | | 11,419,370 | |
| | | | |
| | | | | | | | | | | | | | | 23,251,878 | |
| | | | | | | | | | | | | | | | |
| | | | |
| Entertainment: 1.97% | | | | | | | | | | | | | | | | |
| | | | |
Activision Blizzard Incorporated | | | | | | | | | | | 38,840 | | | | 1,684,491 | |
| | | | |
Electronic Arts Incorporated † | | | | | | | | | | | 15,234 | | | | 1,417,981 | |
| | | | |
Netflix Incorporated † | | | | | | | | | | | 22,201 | | | | 7,621,159 | |
| | | | |
Take-Two Interactive Software Incorporated † | | | | | | | | | | | 5,754 | | | | 622,295 | |
| | | | |
The Walt Disney Company | | | | | | | | | | | 88,795 | | | | 11,724,492 | |
| | | | |
Viacom Incorporated Class B | | | | | | | | | | | 17,982 | | | | 522,017 | |
| | | | |
| | | | | | | | | | | | | | | 23,592,435 | |
| | | | | | | | | | | | | | | | |
| | | | |
| Interactive Media & Services: 4.78% | | | | | | | | | | | | | | | | |
| | | | |
Alphabet Incorporated Class A † | | | | | | | | | | | 15,222 | | | | 16,843,143 | |
| | | | |
Alphabet Incorporated Class C † | | | | | | | | | | | 15,630 | | | | 17,249,737 | |
| | | | |
Facebook Incorporated Class A † | | | | | | | | | | | 121,301 | | | | 21,527,288 | |
| | | | |
TripAdvisor Incorporated † | | | | | | | | | | | 5,226 | | | | 220,903 | |
| | | | |
Twitter Incorporated † | | | | | | | | | | | 37,042 | | | | 1,349,810 | |
| | | | |
| | | | | | | | | | | | | | | 57,190,881 | |
| | | | | | | | | | | | | | | | |
| | | | |
| Media: 1.44% | | | | | | | | | | | | | | | | |
| | | | |
CBS Corporation Class B | | | | | | | | | | | 17,679 | | | | 853,542 | |
| | | | |
Charter Communications Incorporated Class A † | | | | | | | | | | | 8,823 | | | | 3,324,506 | |
| | | | |
Comcast Corporation Class A | | | | | | | | | | | 229,659 | | | | 9,416,019 | |
| | | | |
Discovery Communications Incorporated Class A † | | | | | | | | | | | 7,984 | | | | 217,644 | |
| | | | |
Discovery Communications Incorporated Class C † | | | | | | | | | | | 18,328 | | | | 469,930 | |
| | | | |
DISH Network Corporation Class A † | | | | | | | | | | | 11,667 | | | | 421,295 | |
| | | | |
Fox Corporation Class A | | | | | | | | | | | 17,940 | | | | 632,026 | |
| | | | |
Fox Corporation Class B | | | | | | | | | | | 8,256 | | | | 286,566 | |
| | | | |
Interpublic Group of Companies Incorporated | | | | | | | | | | | 19,572 | | | | 415,318 | |
| | | | |
News Corporation Class A | | | | | | | | | | | 19,593 | | | | 223,164 | |
| | | | |
News Corporation Class B | | | | | | | | | | | 6,294 | | | | 73,325 | |
| | | | |
Omnicom Group Incorporated | | | | | | | | | | | 11,374 | | | | 879,893 | |
| | | | |
| | | | | | | | | | | | | | | 17,213,228 | |
| | | | | | | | | | | | | | | | |
| | | | |
Consumer Discretionary: 9.93% | | | | | | | | | | | | | | | | |
| | | | |
| Auto Components: 0.10% | | | | | | | | | | | | | | | | |
| | | | |
Aptiv plc | | | | | | | | | | | 13,222 | | | | 846,737 | |
| | | | |
BorgWarner Incorporated | | | | | | | | | | | 10,561 | | | | 374,704 | |
| | | | |
| | | | | | | | | | | | | | | 1,221,441 | |
| | | | | | | | | | | | | | | | |
The accompanying notes are an integral part of these financial statements.
| | | | |
| 24 | | Wells Fargo Index Portfolio | | Portfolio of investments—May 31, 2019 |
| | | | | | | | | | | | | | | | |
| Security name | | | | | | | | Shares | | | Value | |
| | | | |
| Automobiles: 0.37% | | | | | | | | | | | | | | | | |
| | | | |
Ford Motor Company | | | | | | | | | | | 198,702 | | | $ | 1,891,643 | |
| | | | |
General Motors Company | | | | | | | | | | | 66,653 | | | | 2,222,211 | |
| | | | |
Harley-Davidson Incorporated | | | | | | | | | | | 8,113 | | | | 265,457 | |
| | | | |
| | | | | | | | | | | | | | | 4,379,311 | |
| | | | | | | | | | | | | | | | |
| | | | |
| Distributors: 0.10% | | | | | | | | | | | | | | | | |
| | | | |
Genuine Parts Company | | | | | | | | | | | 7,421 | | | | 733,937 | |
| | | | |
LKQ Corporation † | | | | | | | | | | | 16,006 | | | | 410,554 | |
| | | | |
| | | | | | | | | | | | | | | 1,144,491 | |
| | | | | | | | | | | | | | | | |
| | | | |
| Diversified Consumer Services: 0.02% | | | | | | | | | | | | | | | | |
| | | | |
H&R Block Incorporated | | | | | | | | | | | 10,451 | | | | 274,339 | |
| | | | | | | | | | | | | | | | |
| | | | |
| Hotels, Restaurants & Leisure: 1.90% | | | | | | | | | | | | | | | | |
| | | | |
Carnival Corporation | | | | | | | | | | | 20,360 | | | | 1,042,228 | |
| | | | |
Chipotle Mexican Grill Incorporated † | | | | | | | | | | | 1,238 | | | | 817,043 | |
| | | | |
Darden Restaurants Incorporated | | | | | | | | | | | 6,280 | | | | 730,490 | |
| | | | |
Hilton Worldwide Holdings Incorporated | | | | | | | | | | | 14,891 | | | | 1,331,851 | |
| | | | |
Marriott International Incorporated Class A | | | | | | | | | | | 14,336 | | | | 1,789,706 | |
| | | | |
McDonald’s Corporation | | | | | | | | | | | 38,915 | | | | 7,715,677 | |
| | | | |
MGM Resorts International | | | | | | | | | | | 25,936 | | | | 643,732 | |
| | | | |
Norwegian Cruise Line Holdings Limited † | | | | | | | | | | | 11,067 | | | | 605,476 | |
| | | | |
Royal Caribbean Cruises Limited | | | | | | | | | | | 8,722 | | | | 1,061,991 | |
| | | | |
Starbucks Corporation | | | | | | | | | | | 63,236 | | | | 4,809,730 | |
| | | | |
Wynn Resorts Limited | | | | | | | | | | | 4,926 | | | | 528,708 | |
| | | | |
Yum! Brands Incorporated | | | | | | | | | | | 15,581 | | | | 1,594,715 | |
| | | | |
| | | | | | | | | | | | | | | 22,671,347 | |
| | | | | | | | | | | | | | | | |
| | | | |
| Household Durables: 0.30% | | | | | | | | | | | | | | | | |
| | | | |
D.R. Horton Incorporated | | | | | | | | | | | 17,279 | | | | 738,850 | |
| | | | |
Garmin Limited | | | | | | | | | | | 6,166 | | | | 471,576 | |
| | | | |
Leggett & Platt Incorporated | | | | | | | | | | | 6,665 | | | | 236,674 | |
| | | | |
Lennar Corporation Class A | | | | | | | | | | | 14,540 | | | | 722,056 | |
| | | | |
Mohawk Industries Incorporated † | | | | | | | | | | | 3,125 | | | | 423,594 | |
| | | | |
Newell Rubbermaid Incorporated | | | | | | | | | | | 19,779 | | | | 265,434 | |
| | | | |
Pulte Group Incorporated | | | | | | | | | | | 12,965 | | | | 401,915 | |
| | | | |
Whirlpool Corporation | | | | | | | | | | | 3,235 | | | | 371,637 | |
| | | | |
| | | | | | | | | | | | | | | 3,631,736 | |
| | | | | | | | | | | | | | | | |
| | | | |
| Internet & Direct Marketing Retail: 3.62% | | | | | | | | | | | | | | | | |
| | | | |
Amazon.com Incorporated † | | | | | | | | | | | 20,981 | | | | 37,242,744 | |
| | | | |
Booking Holdings Incorporated † | | | | | | | | | | | 2,289 | | | | 3,791,088 | |
| | | | |
eBay Incorporated | | | | | | | | | | | 43,729 | | | | 1,571,183 | |
| | | | |
Expedia Group Incorporated | | | | | | | | | | | 5,945 | | | | 683,675 | |
| | | | |
| | | | | | | | | | | | | | | 43,288,690 | |
| | | | | | | | | | | | | | | | |
The accompanying notes are an integral part of these financial statements.
| | | | | | |
| Portfolio of investments—May 31, 2019 | | Wells Fargo Index Portfolio | | | 25 | |
| | | | | | | | | | | | | | | | |
| Security name | | | | | | | | Shares | | | Value | |
| | | | |
| Leisure Products: 0.06% | | | | | | | | | | | | | | | | |
| | | | |
Hasbro Incorporated | | | | | | | | | | | 5,887 | | | $ | 560,089 | |
| | | | |
Mattel Incorporated †« | | | | | | | | | | | 17,563 | | | | 172,996 | |
| | | | |
| | | | | | | | | | | | | | | 733,085 | |
| | | | | | | | | | | | | | | | |
| | | | |
| Multiline Retail: 0.50% | | | | | | | | | | | | | | | | |
| | | | |
Dollar General Corporation | | | | | | | | | | | 13,367 | | | | 1,701,352 | |
| | | | |
Dollar Tree Incorporated † | | | | | | | | | | | 12,100 | | | | 1,229,239 | |
| | | | |
Kohl’s Corporation | | | | | | | | | | | 8,397 | | | | 414,140 | |
| | | | |
Macy’s Incorporated | | | | | | | | | | | 15,636 | | | | 321,633 | |
| | | | |
Nordstrom Incorporated | | | | | | | | | | | 5,449 | | | | 170,554 | |
| | | | |
Target Corporation | | | | | | | | | | | 26,535 | | | | 2,134,741 | |
| | | | |
| | | | | | | | | | | | | | | 5,971,659 | |
| | | | | | | | | | | | | | | | |
| | | | |
| Specialty Retail: 2.27% | | | | | | | | | | | | | | | | |
| | | | |
Advance Auto Parts Incorporated | | | | | | | | | | | 3,644 | | | | 564,820 | |
| | | | |
AutoZone Incorporated † | | | | | | | | | | | 1,269 | | | | 1,303,403 | |
| | | | |
Best Buy Company Incorporated | | | | | | | | | | | 11,905 | | | | 746,086 | |
| | | | |
CarMax Incorporated † | | | | | | | | | | | 8,649 | | | | 677,044 | |
| | | | |
Foot Locker Incorporated | | | | | | | | | | | 5,740 | | | | 225,869 | |
| | | | |
L Brands Incorporated | | | | | | | | | | | 11,612 | | | | 260,806 | |
| | | | |
Lowe’s Companies Incorporated | | | | | | | | | | | 40,730 | | | | 3,799,294 | |
| | | | |
O’Reilly Automotive Incorporated † | | | | | | | | | | | 3,985 | | | | 1,479,909 | |
| | | | |
Ross Stores Incorporated | | | | | | | | | | | 18,844 | | | | 1,752,304 | |
| | | | |
The Gap Incorporated | | | | | | | | | | | 10,861 | | | | 202,883 | |
| | | | |
The Home Depot Incorporated | | | | | | | | | | | 57,435 | | | | 10,904,035 | |
| | | | |
The TJX Companies Incorporated | | | | | | | | | | | 62,927 | | | | 3,164,599 | |
| | | | |
Tiffany & Company | | | | | | | | | | | 5,516 | | | | 491,531 | |
| | | | |
Tractor Supply Company | | | | | | | | | | | 6,167 | | | | 621,510 | |
| | | | |
ULTA Beauty Incorporated † | | | | | | | | | | | 2,865 | | | | 955,134 | |
| | | | |
| | | | | | | | | | | | | | | 27,149,227 | |
| | | | | | | | | | | | | | | | |
| | | | |
| Textiles, Apparel & Luxury Goods: 0.69% | | | | | | | | | | | | | | | | |
| | | | |
Capri Holdings Limited † | | | | | | | | | | | 7,761 | | | | 252,077 | |
| | | | |
HanesBrands Incorporated | | | | | | | | | | | 18,378 | | | | 272,913 | |
| | | | |
Nike Incorporated Class B | | | | | | | | | | | 64,007 | | | | 4,937,500 | |
| | | | |
PVH Corporation | | | | | | | | | | | 3,851 | | | | 328,067 | |
| | | | |
Ralph Lauren Corporation | | | | | | | | | | | 2,682 | | | | 281,959 | |
| | | | |
Tapestry Incorporated | | | | | | | | | | | 14,745 | | | | 421,117 | |
| | | | |
Under Armour Incorporated Class A † | | | | | | | | | | | 9,549 | | | | 217,717 | |
| | | | |
Under Armour Incorporated Class C † | | | | | | | | | | | 9,790 | | | | 198,052 | |
| | | | |
VF Corporation | | | | | | | | | | | 16,495 | | | | 1,350,611 | |
| | | | |
| | | | | | | | | | | | | | | 8,260,013 | |
| | | | | | | | | | | | | | | | |
| | | | |
Consumer Staples: 7.23% | | | | | | | | | | | | | | | | |
| | | | |
| Beverages: 1.88% | | | | | | | | | | | | | | | | |
| | | | |
Brown-Forman Corporation Class B | | | | | | | | | | | 8,456 | | | | 422,631 | |
| | | | |
Constellation Brands Incorporated Class A | | | | | | | | | | | 8,469 | | | | 1,494,355 | |
| | | | |
Molson Coors Brewing Company Class B | | | | | | | | | | | 9,542 | | | | 524,619 | |
The accompanying notes are an integral part of these financial statements.
| | | | |
| 26 | | Wells Fargo Index Portfolio | | Portfolio of investments—May 31, 2019 |
| | | | | | | | | | | | | | | | |
| Security name | | | | | | | | Shares | | | Value | |
| | | | |
| Beverages(continued) | | | | | | | | | | | | | | | | |
| | | | |
Monster Beverage Corporation † | | | | | | | | | | | 19,885 | | | $ | 1,230,086 | |
| | | | |
PepsiCo Incorporated | | | | | | | | | | | 71,427 | | | | 9,142,656 | |
| | | | |
The Coca-Cola Company | | | | | | | | | | | 195,656 | | | | 9,612,579 | |
| | | | |
| | | | | | | | | | | | | | | 22,426,926 | |
| | | | | | | | | | | | | | | | |
| | | | |
| Food & Staples Retailing: 1.45% | | | | | | | | | | | | | | | | |
| | | | |
Costco Wholesale Corporation | | | | | | | | | | | 22,398 | | | | 5,366,113 | |
| | | | |
Sysco Corporation | | | | | | | | | | | 24,020 | | | | 1,653,056 | |
| | | | |
The Kroger Company | | | | | | | | | | | 40,564 | | | | 925,265 | |
| | | | |
Wal-Mart Stores Incorporated | | | | | | | | | | | 72,387 | | | | 7,342,937 | |
| | | | |
Walgreens Boots Alliance Incorporated | | | | | | | | | | | 40,777 | | | | 2,011,937 | |
| | | | |
| | | | | | | | | | | | | | | 17,299,308 | |
| | | | | | | | | | | | | | | | |
| | | | |
| Food Products: 1.14% | | | | | | | | | | | | | | | | |
| | | | |
Archer Daniels Midland Company | | | | | | | | | | | 28,480 | | | | 1,091,354 | |
| | | | |
Campbell Soup Company « | | | | | | | | | | | 9,796 | | | | 355,693 | |
| | | | |
ConAgra Foods Incorporated | | | | | | | | | | | 24,693 | | | | 661,032 | |
| | | | |
General Mills Incorporated | | | | | | | | | | | 30,344 | | | | 1,500,207 | |
| | | | |
Hormel Foods Corporation « | | | | | | | | | | | 13,864 | | | | 547,489 | |
| | | | |
Kellogg Company | | | | | | | | | | | 12,765 | | | | 670,928 | |
| | | | |
Lamb Weston Holdings Incorporated | | | | | | | | | | | 7,449 | | | | 441,353 | |
| | | | |
McCormick & Company Incorporated | | | | | | | | | | | 6,234 | | | | 972,753 | |
| | | | |
Mondelez International Incorporated Class A | | | | | | | | | | | 73,434 | | | | 3,734,119 | |
| | | | |
The Hershey Company | | | | | | | | | | | 7,070 | | | | 932,957 | |
| | | | |
The J.M. Smucker Company | | | | | | | | | | | 5,784 | | | | 703,103 | |
| | | | |
The Kraft Heinz Company | | | | | | | | | | | 31,623 | | | | 874,376 | |
| | | | |
Tyson Foods Incorporated Class A | | | | | | | | | | | 15,013 | | | | 1,139,337 | |
| | | | |
| | | | | | | | | | | | | | | 13,624,701 | |
| | | | | | | | | | | | | | | | |
| | | | |
| Household Products: 1.70% | | | | | | | | | | | | | | | | |
| | | | |
Church & Dwight Company Incorporated | | | | | | | | | | | 12,504 | | | | 930,423 | |
| | | | |
Colgate-Palmolive Company | | | | | | | | | | | 43,815 | | | | 3,050,400 | |
| | | | |
Kimberly-Clark Corporation | | | | | | | | | | | 17,514 | | | | 2,239,865 | |
| | | | |
The Clorox Company | | | | | | | | | | | 6,517 | | | | 969,795 | |
| | | | |
The Procter & Gamble Company | | | | | | | | | | | 127,202 | | | | 13,090,358 | |
| | | | |
| | | | | | | | | | | | | | | 20,280,841 | |
| | | | | | | | | | | | | | | | |
| | | | |
| Personal Products: 0.16% | | | | | | | | | | | | | | | | |
| | | | |
Coty Incorporated Class A | | | | | | | | | | | 15,280 | | | | 188,555 | |
| | | | |
The Estee Lauder Companies Incorporated Class A | | | | | | | | | | | 11,098 | | | | 1,787,111 | |
| | | | |
| | | | | | | | | | | | | | | 1,975,666 | |
| | | | | | | | | | | | | | | | |
| | | | |
| Tobacco: 0.90% | | | | | | | | | | | | | | | | |
| | | | |
Altria Group Incorporated | | | | | | | | | | | 95,312 | | | | 4,676,007 | |
| | | | |
Philip Morris International Incorporated | | | | | | | | | | | 79,046 | | | | 6,096,818 | |
| | | | |
| | | | | | | | | | | | | | | 10,772,825 | |
| | | | | | | | | | | | | | | | |
The accompanying notes are an integral part of these financial statements.
| | | | | | |
| Portfolio of investments—May 31, 2019 | | Wells Fargo Index Portfolio | | | 27 | |
| | | | | | | | | | | | | | | | |
| Security name | | | | | | | | Shares | | | Value | |
| | | | |
Energy: 4.81% | | | | | | | | | | | | | | | | |
| | | | |
| Energy Equipment & Services: 0.42% | | | | | | | | | | | | | | | | |
| | | | |
Baker Hughes Incorporated | | | | | | | | | | | 26,105 | | | $ | 558,908 | |
| | | | |
Halliburton Company | | | | | | | | | | | 44,368 | | | | 944,595 | |
| | | | |
Helmerich & Payne Incorporated | | | | | | | | | | | 5,563 | | | | 272,086 | |
| | | | |
National Oilwell Varco Incorporated | | | | | | | | | | | 19,497 | | | | 406,512 | |
| | | | |
Schlumberger Limited | | | | | | | | | | | 70,475 | | | | 2,444,778 | |
| | | | |
TechnipFMC plc | | | | | | | | | | | 21,635 | | | | 450,008 | |
| | | | |
| | | | | | | | | | | | | | | 5,076,887 | |
| | | | | | | | | | | | | | | | |
| | | | |
| Oil, Gas & Consumable Fuels: 4.39% | | | | | | | | | | | | | | | | |
| | | | |
Anadarko Petroleum Corporation | | | | | | | | | | | 25,403 | | | | 1,787,609 | |
| | | | |
Apache Corporation | | | | | | | | | | | 19,089 | | | | 497,650 | |
| | | | |
Cabot Oil & Gas Corporation | | | | | | | | | | | 21,528 | | | | 538,631 | |
| | | | |
Chevron Corporation | | | | | | | | | | | 96,616 | | | | 10,999,732 | |
| | | | |
Cimarex Energy Company | | | | | | | | | | | 5,159 | | | | 295,043 | |
| | | | |
Concho Resources Incorporated | | | | | | | | | | | 10,200 | | | | 999,702 | |
| | | | |
ConocoPhillips | | | | | | | | | | | 57,683 | | | | 3,400,990 | |
| | | | |
Devon Energy Corporation | | | | | | | | | | | 21,115 | | | | 531,253 | |
| | | | |
Diamondback Energy Incorporated | | | | | | | | | | | 7,857 | | | | 770,457 | |
| | | | |
EOG Resources Incorporated | | | | | | | | | | | 29,495 | | | | 2,415,051 | |
| | | | |
Exxon Mobil Corporation | | | | | | | | | | | 215,446 | | | | 15,247,113 | |
| | | | |
Hess Corporation | | | | | | | | | | | 12,943 | | | | 722,996 | |
| | | | |
HollyFrontier Corporation | | | | | | | | | | | 7,989 | | | | 303,422 | |
| | | | |
Kinder Morgan Incorporated | | | | | | | | | | | 98,990 | | | | 1,974,851 | |
| | | | |
Marathon Oil Corporation | | | | | | | | | | | 41,620 | | | | 547,303 | |
| | | | |
Marathon Petroleum Corporation | | | | | | | | | | | 34,253 | | | | 1,575,295 | |
| | | | |
Noble Energy Incorporated | | | | | | | | | | | 24,590 | | | | 526,226 | |
| | | | |
Occidental Petroleum Corporation | | | | | | | | | | | 38,113 | | | | 1,896,884 | |
| | | | |
ONEOK Incorporated | | | | | | | | | | | 20,930 | | | | 1,331,567 | |
| | | | |
Phillips 66 | | | | | | | | | | | 21,332 | | | | 1,723,626 | |
| | | | |
Pioneer Natural Resources Company | | | | | | | | | | | 8,561 | | | | 1,215,320 | |
| | | | |
The Williams Companies Incorporated | | | | | | | | | | | 61,577 | | | | 1,624,401 | |
| | | | |
Valero Energy Corporation | | | | | | | | | | | 21,235 | | | | 1,494,944 | |
| | | | |
| | | | | | | | | | | | | | | 52,420,066 | |
| | | | | | | | | | | | | | | | |
| | | | |
Financials: 12.84% | | | | | | | | | | | | | | | | |
| | | | |
| Banks: 5.37% | | | | | | | | | | | | | | | | |
| | | | |
Bank of America Corporation | | | | | | | | | | | 456,756 | | | | 12,149,710 | |
| | | | |
BB&T Corporation | | | | | | | | | | | 38,831 | | | | 1,815,349 | |
| | | | |
Citigroup Incorporated | | | | | | | | | | | 119,572 | | | | 7,431,400 | |
| | | | |
Citizens Financial Group Incorporated | | | | | | | | | | | 23,410 | | | | 762,698 | |
| | | | |
Comerica Incorporated | | | | | | | | | | | 8,085 | | | | 556,410 | |
| | | | |
Fifth Third Bancorp | | | | | | | | | | | 39,141 | | | | 1,037,237 | |
| | | | |
First Republic Bank | | | | | | | | | | | 8,379 | | | | 812,931 | |
| | | | |
Huntington Bancshares Incorporated | | | | | | | | | | | 53,229 | | | | 673,347 | |
| | | | |
JPMorgan Chase & Company | | | | | | | | | | | 166,491 | | | | 17,641,386 | |
| | | | |
KeyCorp | | | | | | | | | | | 51,296 | | | | 819,197 | |
| | | | |
M&T Bank Corporation | | | | | | | | | | | 7,044 | | | | 1,124,222 | |
The accompanying notes are an integral part of these financial statements.
| | | | |
| 28 | | Wells Fargo Index Portfolio | | Portfolio of investments—May 31, 2019 |
| | | | | | | | | | | | | | | | |
| Security name | | | | | | | | Shares | | | Value | |
| | | | |
| Banks(continued) | | | | | | | | | | | | | | | | |
| | | | |
People’s United Financial Incorporated | | | | | | | | | | | 19,994 | | | $ | 307,308 | |
| | | | |
PNC Financial Services Group Incorporated | | | | | | | | | | | 23,066 | | | | 2,935,379 | |
| | | | |
Regions Financial Corporation | | | | | | | | | | | 51,750 | | | | 715,703 | |
| | | | |
SunTrust Banks Incorporated | | | | | | | | | | | 22,539 | | | | 1,352,565 | |
| | | | |
SVB Financial Group † | | | | | | | | | | | 2,676 | | | | 538,946 | |
| | | | |
US Bancorp | | | | | | | | | | | 76,506 | | | | 3,840,601 | |
| | | | |
Wells Fargo & Company (l) | | | | | | | | | | | 208,199 | | | | 9,237,790 | |
| | | | |
Zions Bancorporation | | | | | | | | | | | 9,466 | | | | 407,701 | |
| | | | |
| | | | | | | | | | | | | | | 64,159,880 | |
| | | | | | | | | | | | | | | | |
| | | | |
| Capital Markets: 2.63% | | | | | | | | | | | | | | | | |
| | | | |
Affiliated Managers Group Incorporated | | | | | | | | | | | 2,647 | | | | 221,872 | |
| | | | |
Ameriprise Financial Incorporated | | | | | | | | | | | 6,890 | | | | 952,405 | |
| | | | |
Bank of New York Mellon Corporation | | | | | | | | | | | 44,668 | | | | 1,906,877 | |
| | | | |
BlackRock Incorporated | | | | | | | | | | | 6,188 | | | | 2,571,485 | |
| | | | |
CBOE Holdings Incorporated | | | | | | | | | | | 5,705 | | | | 619,221 | |
| | | | |
CME Group Incorporated | | | | | | | | | | | 18,192 | | | | 3,495,047 | |
| | | | |
E*TRADE Financial Corporation | | | | | | | | | | | 12,525 | | | | 561,120 | |
| | | | |
Franklin Resources Incorporated | | | | | | | | | | | 15,027 | | | | 478,159 | |
| | | | |
Intercontinental Exchange Incorporated | | | | | | | | | | | 28,907 | | | | 2,376,444 | |
| | | | |
Invesco Limited | | | | | | | | | | | 20,191 | | | | 394,532 | |
| | | | |
Moody’s Corporation | | | | | | | | | | | 8,450 | | | | 1,545,336 | |
| | | | |
Morgan Stanley | | | | | | | | | | | 66,036 | | | | 2,687,005 | |
| | | | |
MSCI Incorporated | | | | | | | | | | | 4,288 | | | | 943,403 | |
| | | | |
Northern Trust Corporation | | | | | | | | | | | 11,106 | | | | 949,785 | |
| | | | |
Raymond James Financial Incorporated | | | | | | | | | | | 6,454 | | | | 532,971 | |
| | | | |
S&P Global Incorporated | | | | | | | | | | | 12,641 | | | | 2,703,657 | |
| | | | |
State Street Corporation | | | | | | | | | | | 19,254 | | | | 1,063,784 | |
| | | | |
T. Rowe Price Group Incorporated | | | | | | | | | | | 12,014 | | | | 1,215,096 | |
| | | | |
The Charles Schwab Corporation | | | | | | | | | | | 60,321 | | | | 2,509,957 | |
| | | | |
The Goldman Sachs Group Incorporated | | | | | | | | | | | 17,415 | | | | 3,178,063 | |
| | | | |
The NASDAQ OMX Group Incorporated | | | | | | | | | | | 5,888 | | | | 533,688 | |
| | | | |
| | | | | | | | | | | | | | | 31,439,907 | |
| | | | | | | | | | | | | | | | |
| | | | |
| Consumer Finance: 0.71% | | | | | | | | | | | | | | | | |
| | | | |
American Express Company | | | | | | | | | | | 35,165 | | | | 4,033,777 | |
| | | | |
Capital One Financial Corporation | | | | | | | | | | | 23,791 | | | | 2,042,933 | |
| | | | |
Discover Financial Services | | | | | | | | | | | 16,698 | | | | 1,244,836 | |
| | | | |
Synchrony Financial | | | | | | | | | | | 33,208 | | | | 1,116,785 | |
| | | | |
| | | | | | | | | | | | | | | 8,438,331 | |
| | | | | | | | | | | | | | | | |
| | | | |
| Diversified Financial Services: 1.65% | | | | | | | | | | | | | | | | |
| | | | |
Berkshire Hathaway Incorporated Class B † | | | | | | | | | | | 98,878 | | | | 19,520,495 | |
| | | | |
Jefferies Financial Group Incorporated | | | | | | | | | | | 13,373 | | | | 236,301 | |
| | | | |
| | | | | | | | | | | | | | | 19,756,796 | |
| | | | | | | | | | | | | | | | |
| | | | |
| Insurance: 2.48% | | | | | | | | | | | | | | | | |
| | | | |
AFLAC Incorporated | | | | | | | | | | | 38,153 | | | | 1,957,249 | |
| | | | |
American International Group Incorporated | | | | | | | | | | | 44,212 | | | | 2,257,907 | |
The accompanying notes are an integral part of these financial statements.
| | | | | | |
| Portfolio of investments—May 31, 2019 | | Wells Fargo Index Portfolio | | | 29 | |
| | | | | | | | | | | | | | | | |
| Security name | | | | | | | | Shares | | | Value | |
| | | | |
| Insurance(continued) | | | | | | | | | | | | | | | | |
| | | | |
Aon plc | | | | | | | | | | | 12,204 | | | $ | 2,197,574 | |
| | | | |
Arthur J. Gallagher & Company | | | | | | | | | | | 9,359 | | | | 788,028 | |
| | | | |
Assurant Incorporated | | | | | | | | | | | 3,137 | | | | 313,575 | |
| | | | |
Chubb Limited | | | | | | | | | | | 23,308 | | | | 3,404,600 | |
| | | | |
Cincinnati Financial Corporation | | | | | | | | | | | 7,705 | | | | 756,939 | |
| | | | |
Everest Reinsurance Group Limited | | | | | | | | | | | 2,068 | | | | 512,161 | |
| | | | |
Lincoln National Corporation | | | | | | | | | | | 10,388 | | | | 617,567 | |
| | | | |
Loews Corporation | | | | | | | | | | | 13,930 | | | | 715,445 | |
| | | | |
Marsh & McLennan Companies Incorporated | | | | | | | | | | | 25,684 | | | | 2,455,390 | |
| | | | |
MetLife Incorporated | | | | | | | | | | | 48,676 | | | | 2,249,318 | |
| | | | |
Principal Financial Group Incorporated | | | | | | | | | | | 13,161 | | | | 678,713 | |
| | | | |
Prudential Financial Incorporated | | | | | | | | | | | 20,797 | | | | 1,921,227 | |
| | | | |
The Allstate Corporation | | | | | | | | | | | 16,880 | | | | 1,612,209 | |
| | | | |
The Hartford Financial Services Group Incorporated | | | | | | | | | | | 18,279 | | | | 962,572 | |
| | | | |
The Progressive Corporation | | | | | | | | | | | 29,690 | | | | 2,353,823 | |
| | | | |
The Travelers Companies Incorporated | | | | | | | | | | | 13,393 | | | | 1,949,619 | |
| | | | |
Torchmark Corporation | | | | | | | | | | | 5,157 | | | | 440,975 | |
| | | | |
Unum Group | | | | | | | | | | | 10,913 | | | | 343,650 | |
| | | | |
Willis Towers Watson plc | | | | | | | | | | | 6,565 | | | | 1,152,158 | |
| | | | |
| | | | | | | | | | | | | | | 29,640,699 | |
| | | | | | | | | | | | | | | | |
| | | | |
Health Care: 13.88% | | | | | | | | | | | | | | | | |
| | | | |
| Biotechnology: 2.17% | | | | | | | | | | | | | | | | |
| | | | |
AbbVie Incorporated | | | | | | | | | | | 75,006 | | | | 5,753,710 | |
| | | | |
Alexion Pharmaceuticals Incorporated † | | | | | | | | | | | 11,363 | | | | 1,291,746 | |
| | | | |
Amgen Incorporated | | | | | | | | | | | 31,642 | | | | 5,274,721 | |
| | | | |
Biogen Idec Incorporated † | | | | | | | | | | | 10,002 | | | | 2,193,339 | |
| | | | |
Celgene Corporation † | | | | | | | | | | | 35,714 | | | | 3,349,616 | |
| | | | |
Gilead Sciences Incorporated | | | | | | | | | | | 64,858 | | | | 4,037,411 | |
| | | | |
Incyte Corporation † | | | | | | | | | | | 9,034 | | | | 710,343 | |
| | | | |
Regeneron Pharmaceuticals Incorporated † | | | | | | | | | | | 3,985 | | | | 1,202,354 | |
| | | | |
Vertex Pharmaceuticals Incorporated † | | | | | | | | | | | 13,000 | | | | 2,160,340 | |
| | | | |
| | | | | | | | | | | | | | | 25,973,580 | |
| | | | | | | | | | | | | | | | |
| | | | |
| Health Care Equipment & Supplies: 3.38% | | | | | | | | | | | | | | | | |
| | | | |
Abbott Laboratories | | | | | | | | | | | 89,307 | | | | 6,798,942 | |
| | | | |
ABIOMED Incorporated † | | | | | | | | | | | 2,293 | | | | 600,583 | |
| | | | |
Align Technology Incorporated † | | | | | | | | | | | 3,701 | | | | 1,052,379 | |
| | | | |
Baxter International Incorporated | | | | | | | | | | | 24,238 | | | | 1,780,039 | |
| | | | |
Becton Dickinson & Company | | | | | | | | | | | 13,682 | | | | 3,193,926 | |
| | | | |
Boston Scientific Corporation † | | | | | | | | | | | 70,474 | | | | 2,706,906 | |
| | | | |
Danaher Corporation | | | | | | | | | | | 31,948 | | | | 4,217,455 | |
| | | | |
Dentsply Sirona Incorporated | | | | | | | | | | | 11,897 | | | | 640,891 | |
| | | | |
Edwards Lifesciences Corporation † | | | | | | | | | | | 10,565 | | | | 1,803,446 | |
| | | | |
Hologic Incorporated † | | | | | | | | | | | 13,617 | | | | 599,284 | |
| | | | |
IDEXX Laboratories Incorporated † | | | | | | | | | | | 4,373 | | | | 1,092,244 | |
| | | | |
Intuitive Surgical Incorporated † | | | | | | | | | | | 5,822 | | | | 2,706,357 | |
| | | | |
Medtronic plc | | | | | | | | | | | 68,196 | | | | 6,313,586 | |
| | | | |
ResMed Incorporated | | | | | | | | | | | 7,287 | | | | 831,592 | |
The accompanying notes are an integral part of these financial statements.
| | | | |
| 30 | | Wells Fargo Index Portfolio | | Portfolio of investments—May 31, 2019 |
| | | | | | | | | | | | | | | | |
| Security name | | | | | | | | Shares | | | Value | |
| | | | |
| Health Care Equipment & Supplies(continued) | | | | | | | | | | | | | | | | |
| | | | |
Stryker Corporation | | | | | | | | | | | 15,728 | | | $ | 2,881,999 | |
| | | | |
Teleflex Incorporated | | | | | | | | | | | 2,340 | | | | 674,622 | |
| | | | |
The Cooper Companies Incorporated | | | | | | | | | | | 2,509 | | | | 747,155 | |
| | | | |
Varian Medical Systems Incorporated † | | | | | | | | | | | 4,616 | | | | 582,816 | |
| | | | |
Zimmer Biomet Holdings Incorporated | | | | | | | | | | | 10,395 | | | | 1,184,302 | |
| | | | |
| | | | | | | | | | | | | | | 40,408,524 | |
| | | | | | | | | | | | | | | | |
| | | | |
| Health Care Providers & Services: 2.69% | | | | | | | | | | | | | | | | |
| | | | |
AmerisourceBergen Corporation | | | | | | | | | | | 7,943 | | | | 618,442 | |
| | | | |
Anthem Incorporated | | | | | | | | | | | 13,069 | | | | 3,632,921 | |
| | | | |
Cardinal Health Incorporated | | | | | | | | | | | 15,154 | | | | 637,529 | |
| | | | |
Centene Corporation † | | | | | | | | | | | 21,009 | | | | 1,213,270 | |
| | | | |
Cigna Corporation | | | | | | | | | | | 19,326 | | | | 2,860,635 | |
| | | | |
CVS Health Corporation | | | | | | | | | | | 65,955 | | | | 3,454,063 | |
| | | | |
DaVita HealthCare Partners Incorporated † | | | | | | | | | | | 6,431 | | | | 279,234 | |
| | | | |
HCA Holdings Incorporated | | | | | | | | | | | 13,579 | | | | 1,642,516 | |
| | | | |
Henry Schein Incorporated | | | | | | | | | | | 7,699 | | | | 496,278 | |
| | | | |
Humana Incorporated | | | | | | | | | | | 6,893 | | | | 1,687,820 | |
| | | | |
Laboratory Corporation of America Holdings † | | | | | | | | | | | 5,014 | | | | 815,327 | |
| | | | |
McKesson Corporation | | | | | | | | | | | 9,754 | | | | 1,191,354 | |
| | | | |
Quest Diagnostics Incorporated | | | | | | | | | | | 6,827 | | | | 654,778 | |
| | | | |
UnitedHealth Group Incorporated | | | | | | | | | | | 48,791 | | | | 11,797,664 | |
| | | | |
Universal Health Services Incorporated Class B | | | | | | | | | | | 4,247 | | | | 507,729 | |
| | | | |
WellCare Health Plans Incorporated † | | | | | | | | | | | 2,542 | | | | 702,075 | |
| | | | |
| | | | | | | | | | | | | | | 32,191,635 | |
| | | | | | | | | | | | | | | | |
| | | | |
| Health Care Technology: 0.10% | | | | | | | | | | | | | | | | |
| | | | |
Cerner Corporation † | | | | | | | | | | | 16,493 | | | | 1,154,015 | |
| | | | | | | | | | | | | | | | |
| | | | |
| Life Sciences Tools & Services: 1.01% | | | | | | | | | | | | | | | | |
| | | | |
Agilent Technologies Incorporated | | | | | | | | | | | 16,150 | | | | 1,082,858 | |
| | | | |
Illumina Incorporated † | | | | | | | | | | | 7,475 | | | | 2,294,152 | |
| | | | |
IQVIA Holdings Incorporated † | | | | | | | | | | | 8,046 | | | | 1,093,049 | |
| | | | |
Mettler-Toledo International Incorporated † | | | | | | | | | | | 1,261 | | | | 911,816 | |
| | | | |
PerkinElmer Incorporated | | | | | | | | | | | 5,634 | | | | 486,440 | |
| | | | |
Thermo Fisher Scientific Incorporated | | | | | | | | | | | 20,470 | | | | 5,465,081 | |
| | | | |
Waters Corporation † | | | | | | | | | | | 3,636 | | | | 729,782 | |
| | | | |
| | | | | | | | | | | | | | | 12,063,178 | |
| | | | | | | | | | | | | | | | |
| | | | |
| Pharmaceuticals: 4.53% | | | | | | | | | | | | | | | | |
| | | | |
Allergan plc | | | | | | | | | | | 15,898 | | | | 1,938,125 | |
| | | | |
Bristol-Myers Squibb Company | | | | | | | | | | | 83,020 | | | | 3,766,617 | |
| | | | |
Eli Lilly & Company | | | | | | | | | | | 43,917 | | | | 5,091,737 | |
| | | | |
Johnson & Johnson | | | | | | | | | | | 135,417 | | | | 17,759,940 | |
| | | | |
Merck & Company Incorporated | | | | | | | | | | | 131,252 | | | | 10,396,471 | |
| | | | |
Mylan NV † | | | | | | | | | | | 26,219 | | | | 440,479 | |
| | | | |
Nektar Therapeutics † | | | | | | | | | | | 8,853 | | | | 277,276 | |
| | | | |
Perrigo Company plc | | | | | | | | | | | 6,356 | | | | 267,079 | |
| | | | |
Pfizer Incorporated | | | | | | | | | | | 282,302 | | | | 11,721,179 | |
| | | | |
Zoetis Incorporated | | | | | | | | | | | 24,345 | | | | 2,460,062 | |
| | | | |
| | | | | | | | | | | | | | | 54,118,965 | |
| | | | | | | | | | | | | | | | |
The accompanying notes are an integral part of these financial statements.
| | | | | | |
| Portfolio of investments—May 31, 2019 | | Wells Fargo Index Portfolio | | | 31 | |
| | | | | | | | | | | | | | | | |
| Security name | | | | | | | | Shares | | | Value | |
| | | | |
Industrials: 9.11% | | | | | | | | | | | | | | | | |
| | | | |
| Aerospace & Defense: 2.55% | | | | | | | | | | | | | | | | |
| | | | |
Arconic Incorporated | | | | | | | | | | | 20,504 | | | $ | 449,038 | |
| | | | |
General Dynamics Corporation | | | | | | | | | | | 13,777 | | | | 2,215,617 | |
| | | | |
Harris Corporation | | | | | | | | | | | 5,998 | | | | 1,122,766 | |
| | | | |
Huntington Ingalls Industries Incorporated | | | | | | | | | | | 2,112 | | | | 433,213 | |
| | | | |
L-3 Technologies Incorporated | | | | | | | | | | | 4,033 | | | | 976,228 | |
| | | | |
Lockheed Martin Corporation | | | | | | | | | | | 12,500 | | | | 4,231,750 | |
| | | | |
Northrop Grumman Corporation | | | | | | | | | | | 8,631 | | | | 2,617,351 | |
| | | | |
Raytheon Company | | | | | | | | | | | 14,352 | | | | 2,504,424 | |
| | | | |
Textron Incorporated | | | | | | | | | | | 11,933 | | | | 540,565 | |
| | | | |
The Boeing Company | | | | | | | | | | | 26,718 | | | | 9,127,136 | |
| | | | |
TransDigm Group Incorporated † | | | | | | | | | | | 2,475 | | | | 1,091,351 | |
| | | | |
United Technologies Corporation | | | | | | | | | | | 41,218 | | | | 5,205,833 | |
| | | | |
| | | | | | | | | | | | | | | 30,515,272 | |
| | | | | | | | | | | | | | | | |
| | | | |
| Air Freight & Logistics: 0.53% | | | | | | | | | | | | | | | | |
| | | | |
C.H. Robinson Worldwide Incorporated | | | | | | | | | | | 6,959 | | | | 554,145 | |
| | | | |
Expeditors International of Washington Incorporated | | | | | | | | | | | 8,729 | | | | 607,451 | |
| | | | |
FedEx Corporation | | | | | | | | | | | 12,212 | | | | 1,884,067 | |
| | | | |
United Parcel Service Incorporated Class B | | | | | | | | | | | 35,390 | | | | 3,288,439 | |
| | | | |
| | | | | | | | | | | | | | | 6,334,102 | |
| | | | | | | | | | | | | | | | |
| | | | |
| Airlines: 0.39% | | | | | | | | | | | | | | | | |
| | | | |
Alaska Air Group Incorporated | | | | | | | | | | | 6,260 | | | | 364,332 | |
| | | | |
American Airlines Group Incorporated | | | | | | | | | | | 20,322 | | | | 553,368 | |
| | | | |
Delta Air Lines Incorporated | | | | | | | | | | | 31,417 | | | | 1,617,976 | |
| | | | |
Southwest Airlines Company | | | | | | | | | | | 25,293 | | | | 1,203,947 | |
| | | | |
United Continental Holdings Incorporated † | | | | | | | | | | | 11,393 | | | | 884,666 | |
| | | | |
| | | | | | | | | | | | | | | 4,624,289 | |
| | | | | | | | | | | | | | | | |
| | | | |
| Building Products: 0.29% | | | | | | | | | | | | | | | | |
| | | | |
A.O. Smith Corporation | | | | | | | | | | | 7,211 | | | | 292,046 | |
| | | | |
Allegion plc | | | | | | | | | | | 4,803 | | | | 466,131 | |
| | | | |
Fortune Brands Home & Security Incorporated | | | | | | | | | | | 7,147 | | | | 343,485 | |
| | | | |
Johnson Controls International plc | | | | | | | | | | | 46,410 | | | | 1,787,713 | |
| | | | |
Masco Corporation | | | | | | | | | | | 14,975 | | | | 522,927 | |
| | | | |
| | | | | | | | | | | | | | | 3,412,302 | |
| | | | | | | | | | | | | | | | |
| | | | |
| Commercial Services & Supplies: 0.42% | | | | | | | | | | | | | | | | |
| | | | |
Cintas Corporation | | | | | | | | | | | 4,306 | | | | 955,200 | |
| | | | |
Copart Incorporated † | | | | | | | | | | | 10,212 | | | | 729,954 | |
| | | | |
Republic Services Incorporated | | | | | | | | | | | 10,957 | | | | 926,853 | |
| | | | |
Rollins Incorporated | | | | | | | | | | | 7,495 | | | | 281,587 | |
| | | | |
Waste Management Incorporated | | | | | | | | | | | 19,825 | | | | 2,167,864 | |
| | | | |
| | | | | | | | | | | | | | | 5,061,458 | |
| | | | | | | | | | | | | | | | |
The accompanying notes are an integral part of these financial statements.
| | | | |
| 32 | | Wells Fargo Index Portfolio | | Portfolio of investments—May 31, 2019 |
| | | | | | | | | | | | | | | | |
| Security name | | | | | | | | Shares | | | Value | |
| | | | |
| Construction & Engineering: 0.07% | | | | | | | | | | | | | | | | |
| | | | |
Fluor Corporation | | | | | | | | | | | 7,097 | | | $ | 196,729 | |
| | | | |
Jacobs Engineering Group Incorporated | | | | | | | | | | | 5,959 | | | | 448,653 | |
| | | | |
Quanta Services Incorporated | | | | | | | | | | | 7,188 | | | | 249,855 | |
| | | | |
| | | | | | | | | | | | | | | 895,237 | |
| | | | | | | | | | | | | | | | |
| | | | |
| Electrical Equipment: 0.45% | | | | | | | | | | | | | | | | |
| | | | |
AMETEK Incorporated | | | | | | | | | | | 11,549 | | | | 945,748 | |
| | | | |
Eaton Corporation plc | | | | | | | | | | | 21,540 | | | | 1,604,515 | |
| | | | |
Emerson Electric Company | | | | | | | | | | | 31,253 | | | | 1,882,681 | |
| | | | |
Rockwell Automation Incorporated | | | | | | | | | | | 6,079 | | | | 904,859 | |
| | | | |
| | | | | | | | | | | | | | | 5,337,803 | |
| | | | | | | | | | | | | | | | |
| | | | |
| Industrial Conglomerates: 1.40% | | | | | | | | | | | | | | | | |
| | | | |
3M Company | | | | | | | | | | | 29,279 | | | | 4,677,320 | |
| | | | |
General Electric Company | | | | | | | | | | | 442,643 | | | | 4,178,550 | |
| | | | |
Honeywell International Incorporated | | | | | | | | | | | 37,073 | | | | 6,091,465 | |
| | | | |
Roper Industries Incorporated | | | | | | | | | | | 5,268 | | | | 1,811,771 | |
| | | | |
| | | | | | | | | | | | | | | 16,759,106 | |
| | | | | | | | | | | | | | | | |
| | | | |
| Machinery: 1.48% | | | | | | | | | | | | | | | | |
| | | | |
Caterpillar Incorporated | | | | | | | | | | | 29,266 | | | | 3,506,359 | |
| | | | |
Cummins Incorporated | | | | | | | | | | | 7,360 | | | | 1,109,594 | |
| | | | |
Deere & Company | | | | | | | | | | | 16,195 | | | | 2,270,053 | |
| | | | |
Dover Corporation | | | | | | | | | | | 7,370 | | | | 658,952 | |
| | | | |
Flowserve Corporation | | | | | | | | | | | 6,660 | | | | 309,357 | |
| | | | |
Fortive Corporation | | | | | | | | | | | 14,974 | | | | 1,140,270 | |
| | | | |
Illinois Tool Works Incorporated | | | | | | | | | | | 15,349 | | | | 2,143,334 | |
| | | | |
Ingersoll-Rand plc | | | | | | | | | | | 12,314 | | | | 1,457,239 | |
| | | | |
Paccar Incorporated | | | | | | | | | | | 17,630 | | | | 1,160,407 | |
| | | | |
Parker-Hannifin Corporation | | | | | | | | | | | 6,578 | | | | 1,001,961 | |
| | | | |
Pentair plc | | | | | | | | | | | 8,017 | | | | 279,152 | |
| | | | |
Snap-on Incorporated | | | | | | | | | | | 2,828 | | | | 440,942 | |
| | | | |
Stanley Black & Decker Incorporated | | | | | | | | | | | 7,696 | | | | 979,085 | |
| | | | |
Wabtec Corporation « | | | | | | | | | | | 8,064 | | | | 503,032 | |
| | | | |
Xylem Incorporated | | | | | | | | | | | 9,130 | | | | 677,629 | |
| | | | |
| | | | | | | | | | | | | | | 17,637,366 | |
| | | | | | | | | | | | | | | | |
| | | | |
| Professional Services: 0.31% | | | | | | | | | | | | | | | | |
| | | | |
Equifax Incorporated | | | | | | | | | | | 6,137 | | | | 741,963 | |
| | | | |
IHS Markit Limited † | | | | | | | | | | | 18,481 | | | | 1,060,625 | |
| | | | |
Nielsen Holdings plc | | | | | | | | | | | 18,074 | | | | 410,822 | |
| | | | |
Robert Half International Incorporated | | | | | | | | | | | 6,055 | | | | 324,911 | |
| | | | |
Verisk Analytics Incorporated | | | | | | | | | | | 8,314 | | | | 1,163,960 | |
| | | | |
| | | | | | | | | | | | | | | 3,702,281 | |
| | | | | | | | | | | | | | | | |
| | | | |
| Road & Rail: 1.06% | | | | | | | | | | | | | | | | |
| | | | |
CSX Corporation | | | | | | | | | | | 39,400 | | | | 2,934,118 | |
| | | | |
J.B. Hunt Transport Services Incorporated | | | | | | | | | | | 4,423 | | | | 376,574 | |
| | | | |
Kansas City Southern | | | | | | | | | | | 5,133 | | | | 581,466 | |
The accompanying notes are an integral part of these financial statements.
| | | | | | |
| Portfolio of investments—May 31, 2019 | | Wells Fargo Index Portfolio | | | 33 | |
| | | | | | | | | | | | | | | | |
| Security name | | | | | | | | Shares | | | Value | |
| | | | |
| Road & Rail(continued) | | | | | | | | | | | | | | | | |
| | | | |
Norfolk Southern Corporation | | | | | | | | | | | 13,600 | | | $ | 2,653,904 | |
| | | | |
Union Pacific Corporation | | | | | | | | | | | 36,757 | | | | 6,130,332 | |
| | | | |
| | | | | | | | | | | | | | | 12,676,394 | |
| | | | | | | | | | | | | | | | |
| | | | |
| Trading Companies & Distributors: 0.16% | | | | | | | | | | | | | | | | |
| | | | |
Fastenal Company | | | | | | | | | | | 29,102 | | | | 890,230 | |
| | | | |
United Rentals Incorporated † | | | | | | | | | | | 4,047 | | | | 445,575 | |
| | | | |
W.W. Grainger Incorporated | | | | | | | | | | | 2,293 | | | | 600,055 | |
| | | | |
| | | | | | | | | | | | | | | 1,935,860 | |
| | | | | | | | | | | | | | | | |
| | | | |
Information Technology: 20.63% | | | | | | | | | | | | | | | | |
| | | | |
| Communications Equipment: 1.20% | | | | | | | | | | | | | | | | |
| | | | |
Arista Networks Incorporated † | | | | | | | | | | | 2,657 | | | | 649,876 | |
| | | | |
Cisco Systems Incorporated | | | | | | | | | | | 223,838 | | | | 11,646,291 | |
| | | | |
F5 Networks Incorporated † | | | | | | | | | | | 3,023 | | | | 399,278 | |
| | | | |
Juniper Networks Incorporated | | | | | | | | | | | 17,691 | | | | 435,376 | |
| | | | |
Motorola Solutions Incorporated | | | | | | | | | | | 8,333 | | | | 1,249,533 | |
| | | | |
| | | | | | | | | | | | | | | 14,380,354 | |
| | | | | | | | | | | | | | | | |
| | | | |
| Electronic Equipment, Instruments & Components: 0.44% | | | | | | | | | | | | | | | | |
| | | | |
Amphenol Corporation Class A | | | | | | | | | | | 15,157 | | | | 1,318,659 | |
| | | | |
Corning Incorporated | | | | | | | | | | | 40,006 | | | | 1,153,773 | |
| | | | |
FLIR Systems Incorporated | | | | | | | | | | | 6,888 | | | | 332,897 | |
| | | | |
IPG Photonics Corporation † | | | | | | | | | | | 1,804 | | | | 225,807 | |
| | | | |
Keysight Technologies Incorporated † | | | | | | | | | | | 9,547 | | | | 717,266 | |
| | | | |
TE Connectivity Limited | | | | | | | | | | | 17,230 | | | | 1,451,283 | |
| | | | |
| | | | | | | | | | | | | | | 5,199,685 | |
| | | | | | | | | | | | | | | | |
| | | | |
| IT Services: 5.25% | | | | | | | | | | | | | | | | |
| | | | |
Accenture plc Class A | | | | | | | | | | | 32,413 | | | | 5,771,783 | |
| | | | |
Akamai Technologies Incorporated † | | | | | | | | | | | 8,299 | | | | 625,413 | |
| | | | |
Alliance Data Systems Corporation | | | | | | | | | | | 2,318 | | | | 318,725 | |
| | | | |
Automatic Data Processing Incorporated | | | | | | | | | | | 22,151 | | | | 3,546,818 | |
| | | | |
Broadridge Financial Solutions Incorporated | | | | | | | | | | | 5,882 | | | | 734,485 | |
| | | | |
Cognizant Technology Solutions Corporation Class A | | | | | | | | | | | 29,243 | | | | 1,811,019 | |
| | | | |
DXC Technology Company | | | | | | | | | | | 13,641 | | | | 648,493 | |
| | | | |
Fidelity National Information Services Incorporated | | | | | | | | | | | 16,420 | | | | 1,975,326 | |
| | | | |
Fiserv Incorporated † | | | | | | | | | | | 19,912 | | | | 1,709,644 | |
| | | | |
FleetCor Technologies Incorporated † | | | | | | | | | | | 4,366 | | | | 1,127,345 | |
| | | | |
Gartner Incorporated † | | | | | | | | | | | 4,562 | | | | 690,231 | |
| | | | |
Global Payments Incorporated | | | | | | | | | | | 8,014 | | | | 1,234,477 | |
| | | | |
International Business Machines Corporation | | | | | | | | | | | 45,249 | | | | 5,746,171 | |
| | | | |
Jack Henry & Associates Incorporated | | | | | | | | | | | 3,924 | | | | 514,907 | |
| | | | |
MasterCard Incorporated Class A | | | | | | | | | | | 45,900 | | | | 11,543,391 | |
| | | | |
Paychex Incorporated | | | | | | | | | | | 16,250 | | | | 1,394,088 | |
| | | | |
PayPal Holdings Incorporated † | | | | | | | | | | | 59,656 | | | | 6,547,246 | |
| | | | |
Total System Services Incorporated | | | | | | | | | | | 8,276 | | | | 1,022,334 | |
| | | | |
VeriSign Incorporated † | | | | | | | | | | | 5,357 | | | | 1,044,508 | |
The accompanying notes are an integral part of these financial statements.
| | | | |
| 34 | | Wells Fargo Index Portfolio | | Portfolio of investments—May 31, 2019 |
| | | | | | | | | | | | | | | | |
| Security name | | | | | | | | Shares | | | Value | |
| | | | |
| IT Services(continued) | | | | | | | | | | | | | | | | |
| | | | |
Visa Incorporated Class A | | | | | | | | | | | 88,994 | | | $ | 14,357,402 | |
| | | | |
Western Union Company | | | | | | | | | | | 22,165 | | | | 430,001 | |
| | | | |
| | | | | | | | | | | | | | | 62,793,807 | |
| | | | | | | | | | | | | | | | |
| | | | |
| Semiconductors & Semiconductor Equipment: 3.46% | | | | | | | | | | | | | | | | |
| | | | |
Advanced Micro Devices Incorporated † | | | | | | | | | | | 44,798 | | | | 1,227,913 | |
| | | | |
Analog Devices Incorporated | | | | | | | | | | | 18,728 | | | | 1,809,499 | |
| | | | |
Applied Materials Incorporated | | | | | | | | | | | 48,275 | | | | 1,867,760 | |
| | | | |
Broadcom Incorporated | | | | | | | | | | | 20,141 | | | | 5,068,281 | |
| | | | |
Intel Corporation | | | | | | | | | | | 228,667 | | | | 10,070,495 | |
| | | | |
KLA-Tencor Corporation | | | | | | | | | | | 8,400 | | | | 865,788 | |
| | | | |
Lam Research Corporation | | | | | | | | | | | 7,759 | | | | 1,354,799 | |
| | | | |
Maxim Integrated Products Incorporated | | | | | | | | | | | 13,902 | | | | 731,106 | |
| | | | |
Microchip Technology Incorporated « | | | | | | | | | | | 12,050 | | | | 964,362 | |
| | | | |
Micron Technology Incorporated † | | | | | | | | | | | 57,004 | | | | 1,858,900 | |
| | | | |
NVIDIA Corporation | | | | | | | | | | | 30,814 | | | | 4,174,064 | |
| | | | |
Qorvo Incorporated † | | | | | | | | | | | 6,244 | | | | 382,008 | |
| | | | |
QUALCOMM Incorporated | | | | | | | | | | | 61,543 | | | | 4,112,303 | |
| | | | |
Skyworks Solutions Incorporated | | | | | | | | | | | 8,851 | | | | 589,742 | |
| | | | |
Texas Instruments Incorporated | | | | | | | | | | | 47,721 | | | | 4,977,778 | |
| | | | |
Xilinx Incorporated | | | | | | | | | | | 12,873 | | | | 1,317,037 | |
| | | | |
| | | | | | | | | | | | | | | 41,371,835 | |
| | | | | | | | | | | | | | | | |
| | | | |
| Software: 6.56% | | | | | | | | | | | | | | | | |
| | | | |
Adobe Systems Incorporated † | | | | | | | | | | | 24,800 | | | | 6,718,320 | |
| | | | |
Ansys Incorporated † | | | | | | | | | | | 4,260 | | | | 764,670 | |
| | | | |
Autodesk Incorporated † | | | | | | | | | | | 11,136 | | | | 1,791,894 | |
| | | | |
Cadence Design Systems Incorporated † | | | | | | | | | | | 14,257 | | | | 906,317 | |
| | | | |
Citrix Systems Incorporated | | | | | | | | | | | 6,363 | | | | 598,886 | |
| | | | |
Fortinet Incorporated † | | | | | | | | | | | 7,375 | | | | 534,540 | |
| | | | |
Intuit Incorporated | | | | | | | | | | | 13,174 | | | | 3,225,654 | |
| | | | |
Microsoft Corporation | | | | | | | | | | | 390,123 | | | | 48,250,413 | |
| | | | |
Oracle Corporation | | | | | | | | | | | 129,569 | | | | 6,556,191 | |
| | | | |
Red Hat Incorporated † | | | | | | | | | | | 8,988 | | | | 1,656,488 | |
| | | | |
Salesforce.com Incorporated † | | | | | | | | | | | 38,899 | | | | 5,889,698 | |
| | | | |
Symantec Corporation | | | | | | | | | | | 32,503 | | | | 608,781 | |
| | | | |
Synopsys Incorporated † | | | | | | | | | | | 7,611 | | | | 886,225 | |
| | | | |
| | | | | | | | | | | | | | | 78,388,077 | |
| | | | | | | | | | | | | | | | |
| | | | |
| Technology Hardware, Storage & Peripherals: 3.72% | | | | | | | | | | | | | | | | |
| | | | |
Apple Incorporated | | | | | | | | | | | 227,778 | | | | 39,877,094 | |
| | | | |
Hewlett Packard Enterprise Company | | | | | | | | | | | 70,017 | | | | 960,633 | |
| | | | |
HP Incorporated | | | | | | | | | | | 77,977 | | | | 1,456,610 | |
| | | | |
NetApp Incorporated | | | | | | | | | | | 12,558 | | | | 743,434 | |
| | | | |
Seagate Technology plc | | | | | | | | | | | 13,037 | | | | 545,598 | |
| | | | |
Western Digital Corporation | | | | | | | | | | | 14,789 | | | | 550,447 | |
| | | | |
Xerox Corporation | | | | | | | | | | | 10,163 | | | | 311,089 | |
| | | | |
| | | | | | | | | | | | | | | 44,444,905 | |
| | | | | | | | | | | | | | | | |
The accompanying notes are an integral part of these financial statements.
| | | | | | |
| Portfolio of investments—May 31, 2019 | | Wells Fargo Index Portfolio | | | 35 | |
| | | | | | | | | | | | | | | | |
| Security name | | | | | | | | Shares | | | Value | |
| | | | |
Materials: 2.55% | | | | | | | | | | | | | | | | |
| | | | |
| Chemicals: 1.89% | | | | | | | | | | | | | | | | |
| | | | |
Air Products & Chemicals Incorporated | | | | | | | | | | | 11,168 | | | $ | 2,273,693 | |
| | | | |
Albemarle Corporation | | | | | | | | | | | 5,377 | | | | 340,364 | |
| | | | |
Celanese Corporation Series A | | | | | | | | | | | 6,514 | | | | 618,374 | |
| | | | |
CF Industries Holdings Incorporated | | | | | | | | | | | 11,334 | | | | 456,080 | |
| | | | |
Dow Incorporated | | | | | | | | | | | 38,217 | | | | 1,787,027 | |
| | | | |
DowDuPont Incorporated | | | | | | | | | | | 114,652 | | | | 3,499,179 | |
| | | | |
Eastman Chemical Company | | | | | | | | | | | 7,107 | | | | 461,386 | |
| | | | |
Ecolab Incorporated | | | | | | | | | | | 12,881 | | | | 2,371,263 | |
| | | | |
FMC Corporation | | | | | | | | | | | 6,847 | | | | 502,912 | |
| | | | |
International Flavors & Fragrances Incorporated « | | | | | | | | | | | 5,151 | | | | 697,548 | |
| | | | |
Linde plc | | | | | | | | | | | 28,020 | | | | 5,059,011 | |
| | | | |
LyondellBasell Industries NV Class A | | | | | | | | | | | 15,476 | | | | 1,149,093 | |
| | | | |
PPG Industries Incorporated | | | | | | | | | | | 11,995 | | | | 1,255,277 | |
| | | | |
The Mosaic Company | | | | | | | | | | | 18,033 | | | | 387,169 | |
| | | | |
The Sherwin-Williams Company | | | | | | | | | | | 4,149 | | | | 1,740,298 | |
| | | | |
| | | | | | | | | | | | | | | 22,598,674 | |
| | | | | | | | | | | | | | | | |
| | | | |
| Construction Materials: 0.13% | | | | | | | | | | | | | | | | |
| | | | |
Martin Marietta Materials Incorporated | | | | | | | | | | | 3,175 | | | | 668,338 | |
| | | | |
Vulcan Materials Company | | | | | | | | | | | 6,703 | | | | 837,272 | |
| | | | |
| | | | | | | | | | | | | | | 1,505,610 | |
| | | | | | | | | | | | | | | | |
| | | | |
| Containers & Packaging: 0.29% | | | | | | | | | | | | | | | | |
| | | | |
Avery Dennison Corporation | | | | | | | | | | | 4,270 | | | | 444,336 | |
| | | | |
Ball Corporation | | | | | | | | | | | 17,001 | | | | 1,043,691 | |
| | | | |
International Paper Company | | | | | | | | | | | 20,352 | | | | 843,997 | |
| | | | |
Packaging Corporation of America | | | | | | | | | | | 4,805 | | | | 428,029 | |
| | | | |
Sealed Air Corporation | | | | | | | | | | | 7,914 | | | | 331,597 | |
| | | | |
WestRock Company | | | | | | | | | | | 12,985 | | | | 423,311 | |
| | | | |
| | | | | | | | | | | | | | | 3,514,961 | |
| | | | | | | | | | | | | | | | |
| | | | |
| Metals & Mining: 0.24% | | | | | | | | | | | | | | | | |
| | | | |
Freeport-McMoRan Incorporated | | | | | | | | | | | 73,682 | | | | 715,452 | |
| | | | |
Newmont Mining Corporation | | | | | | | | | | | 41,554 | | | | 1,375,022 | |
| | | | |
Nucor Corporation | | | | | | | | | | | 15,528 | | | | 745,344 | |
| | | | |
| | | | | | | | | | | | | | | 2,835,818 | |
| | | | | | | | | | | | | | | | |
| | | | |
Real Estate: 3.11% | | | | | | | | | | | | | | | | |
| | | | |
| Equity REITs: 3.05% | | | | | | | | | | | | | | | | |
| | | | |
Alexandria Real Estate Equities Incorporated | | | | | | | | | | | 5,732 | | | | 839,222 | |
| | | | |
American Tower Corporation | | | | | | | | | | | 22,431 | | | | 4,682,920 | |
| | | | |
Apartment Investment & Management Company Class A | | | | | | | | | | | 7,904 | | | | 394,805 | |
| | | | |
AvalonBay Communities Incorporated | | | | | | | | | | | 7,043 | | | | 1,429,799 | |
| | | | |
Boston Properties Incorporated | | | | | | | | | | | 7,857 | | | | 1,027,931 | |
| | | | |
Crown Castle International Corporation | | | | | | | | | | | 21,131 | | | | 2,747,241 | |
| | | | |
Digital Realty Trust Incorporated | | | | | | | | | | | 10,568 | | | | 1,244,065 | |
| | | | |
Duke Realty Corporation | | | | | | | | | | | 18,267 | | | | 549,654 | |
The accompanying notes are an integral part of these financial statements.
| | | | |
| 36 | | Wells Fargo Index Portfolio | | Portfolio of investments—May 31, 2019 |
| | | | | | | | | | | | | | | | |
| Security name | | | | | | | | Shares | | | Value | |
| | | | |
| Equity REITs(continued) | | | | | | | | | | | | | | | | |
| | | | |
Equinix Incorporated | | | | | | | | | | | 4,237 | | | $ | 2,058,292 | |
| | | | |
Equity Residential Company Limited | | | | | | | | | | | 18,811 | | | | 1,440,358 | |
| | | | |
Essex Property Trust Incorporated | | | | | | | | | | | 3,340 | | | | 974,412 | |
| | | | |
Extra Space Storage Incorporated | | | | | | | | | | | 6,473 | | | | 693,647 | |
| | | | |
Federal Realty Investment Trust | | | | | | | | | | | 3,781 | | | | 494,290 | |
| | | | |
HCP Incorporated | | | | | | | | | | | 24,294 | | | | 770,363 | |
| | | | |
Host Hotels & Resorts Incorporated | | | | | | | | | | | 37,652 | | | | 681,878 | |
| | | | |
Iron Mountain Incorporated | | | | | | | | | | | 14,561 | | | | 446,295 | |
| | | | |
Kimco Realty Corporation | | | | | | | | | | | 21,427 | | | | 372,830 | |
| | | | |
Mid-America Apartment Communities Incorporated | | | | | | | | | | | 5,791 | | | | 661,216 | |
| | | | |
Prologis Incorporated | | | | | | | | | | | 32,053 | | | | 2,361,345 | |
| | | | |
Public Storage Incorporated | | | | | | | | | | | 7,631 | | | | 1,815,262 | |
| | | | |
Realty Income Corporation | | | | | | | | | | | 15,447 | | | | 1,082,526 | |
| | | | |
Regency Centers Corporation | | | | | | | | | | | 8,517 | | | | 561,781 | |
| | | | |
SBA Communications Corporation † | | | | | | | | | | | 5,725 | | | | 1,238,947 | |
| | | | |
Simon Property Group Incorporated | | | | | | | | | | | 15,710 | | | | 2,546,434 | |
| | | | |
SL Green Realty Corporation | | | | | | | | | | | 4,255 | | | | 365,930 | |
| | | | |
The Macerich Company | | | | | | | | | | | 5,383 | | | | 195,564 | |
| | | | |
UDR Incorporated | | | | | | | | | | | 14,014 | | | | 627,547 | |
| | | | |
Ventas Incorporated | | | | | | | | | | | 18,112 | | | | 1,164,602 | |
| | | | |
Vornado Realty Trust | | | | | | | | | | | 8,817 | | | | 583,950 | |
| | | | |
Welltower Incorporated | | | | | | | | | | | 19,646 | | | | 1,595,648 | |
| | | | |
Weyerhaeuser Company | | | | | | | | | | | 37,960 | | | | 865,488 | |
| | | | |
| | | | | | | | | | | | | | | 36,514,242 | |
| | | | | | | | | | | | | | | | |
| | | | |
| Real Estate Management & Development: 0.06% | | | | | | | | | | | | | | | | |
| | | | |
CBRE Group Incorporated Class A † | | | | | | | | | | | 15,881 | | | | 725,762 | |
| | | | | | | | | | | | | | | | |
| | | | |
Utilities: 3.33% | | | | | | | | | | | | | | | | |
| | | | |
| Electric Utilities: 2.00% | | | | | | | | | | | | | | | | |
| | | | |
Alliant Energy Corporation | | | | | | | | | | | 12,004 | | | | 569,710 | |
| | | | |
American Electric Power Company Incorporated | | | | | | | | | | | 25,083 | | | | 2,160,148 | |
| | | | |
Duke Energy Corporation | | | | | | | | | | | 36,968 | | | | 3,164,830 | |
| | | | |
Edison International | | | | | | | | | | | 16,567 | | | | 983,583 | |
| | | | |
Entergy Corporation | | | | | | | | | | | 9,640 | | | | 935,755 | |
| | | | |
Evergy Incorporated | | | | | | | | | | | 12,948 | | | | 752,797 | |
| | | | |
Eversource Energy | | | | | | | | | | | 16,118 | | | | 1,190,153 | |
| | | | |
Exelon Corporation | | | | | | | | | | | 49,310 | | | | 2,370,825 | |
| | | | |
FirstEnergy Corporation | | | | | | | | | | | 25,610 | | | | 1,056,156 | |
| | | | |
NextEra Energy Incorporated | | | | | | | | | | | 24,314 | | | | 4,819,278 | |
| | | | |
Pinnacle West Capital Corporation | | | | | | | | | | | 5,703 | | | | 535,569 | |
| | | | |
PPL Corporation | | | | | | | | | | | 36,659 | | | | 1,090,972 | |
| | | | |
The Southern Company | | | | | | | | | | | 52,606 | | | | 2,814,421 | |
| | | | |
Xcel Energy Incorporated | | | | | | | | | | | 26,147 | | | | 1,499,269 | |
| | | | |
| | | | | | | | | | | | | | | 23,943,466 | |
| | | | | | | | | | | | | | | | |
| | | | |
| Gas Utilities: 0.05% | | | | | | | | | | | | | | | | |
| | | | |
Atmos Energy Corporation | | | | | | | | | | | 5,944 | | | | 605,099 | |
| | | | | | | | | | | | | | | | |
The accompanying notes are an integral part of these financial statements.
| | | | | | |
| Portfolio of investments—May 31, 2019 | | Wells Fargo Index Portfolio | | | 37 | |
| | | | | | | | | | | | | | | | |
| Security name | | | | | | | | Shares | | | Value | |
| | | | |
| Independent Power & Renewable Electricity Producers: 0.08% | | | | | | | | | | | | | | | | |
| | | | |
AES Corporation | | | | | | | | | | | 33,677 | | | $ | 532,097 | |
| | | | |
NRG Energy Incorporated | | | | | | | | | | | 14,288 | | | | 486,364 | |
| | | | |
| | | | | | | | | | | | | | | 1,018,461 | |
| | | | | | | | | | | | | | | | |
| | | | |
| Multi-Utilities: 1.11% | | | | | | | | | | | | | | | | |
| | | | |
Ameren Corporation | | | | | | | | | | | 12,440 | | | | 912,350 | |
| | | | |
CenterPoint Energy Incorporated | | | | | | | | | | | 25,485 | | | | 724,793 | |
| | | | |
CMS Energy Corporation | | | | | | | | | | | 14,411 | | | | 808,601 | |
| | | | |
Consolidated Edison Incorporated | | | | | | | | | | | 16,326 | | | | 1,408,934 | |
| | | | |
Dominion Energy Incorporated | | | | | | | | | | | 40,644 | | | | 3,055,616 | |
| | | | |
DTE Energy Company | | | | | | | | | | | 9,251 | | | | 1,160,723 | |
| | | | |
NiSource Incorporated | | | | | | | | | | | 18,941 | | | | 527,507 | |
| | | | |
Public Service Enterprise Group Incorporated | | | | | | | | | | | 25,702 | | | | 1,510,250 | |
| | | | |
Sempra Energy | | | | | | | | | | | 13,935 | | | | 1,831,756 | |
| | | | |
WEC Energy Group Incorporated | | | | | | | | | | | 16,040 | | | | 1,292,022 | |
| | | | |
| | | | | | | | | | | | | | | 13,232,552 | |
| | | | | | | | | | | | | | | | |
| | | | |
| Water Utilities: 0.09% | | | | | | | | | | | | | | | | |
| | | | |
American Water Works Company Incorporated | | | | | | | | | | | 9,191 | | | | 1,038,767 | |
| | | | | | | | | | | | | | | | |
| | | | |
Total Common Stocks (Cost $383,304,766) | | | | | | | | | | | | | | | 1,166,200,036 | |
| | | | | | | | | | | | | | | | |
| | | | |
| | | Yield | | | | | | | | | | |
| Short-Term Investments: 2.48% | | | | | | | | | | | | | | | | |
| | | | |
| Investment Companies: 2.29% | | | | | | | | | | | | | | | | |
| | | | |
Securities Lending Cash Investments LLC (l)(r)(u) | | | 2.51 | % | | | | | | | 3,129,501 | | | | 3,129,814 | |
| | | | |
Wells Fargo Government Money Market Fund Select Class (l)(u) | | | 2.30 | | | | | | | | 24,217,403 | | | | 24,217,403 | |
| | | | |
| | | | | | | | | | | | | | | 27,347,217 | |
| | | | | | | | | | | | | | | | |
| | | | |
| | | | | | Maturity date | | | Principal | | | | |
| U.S. Treasury Securities: 0.19% | | | | | | | | | | | | | | | | |
| | | | |
U.S. Treasury Bill (z)# | | | 1.83 | | | | 6-13-2019 | | | $ | 2,268,000 | | | | 2,266,500 | |
| | | | | | | | | | | | | | | | |
| | | | |
Total Short-Term Investments (Cost $29,613,568) | | | | | | | | | | | | | | | 29,613,717 | |
| | | | | | | | | | | | | | | | |
| | | | | | | | |
| Total investments in securities (Cost $412,918,334) | | | 100.04 | % | | | 1,195,813,753 | |
| | |
Other assets and liabilities, net | | | (0.04 | ) | | | (427,221 | ) |
| | | | | | | | |
| Total net assets | | | 100.00 | % | | $ | 1,195,386,532 | |
| | | | | | | | |
| † | Non-income-earning security |
| « | All or a portion of this security is on loan. |
| (l) | The issuer of the security is an affiliated person of the Portfolio as defined in the Investment Company Act of 1940. |
| (r) | The investment is a non-registered investment company purchased with cash collateral received from securities on loan. |
| (u) | The rate represents the 7-day annualized yield at period end. |
| (z) | Zero coupon security. The rate represents the current yield to maturity. |
| # | All or a portion of this security is segregated as collateral for investments in derivative instruments. |
Abbreviations:
| REIT | Real estate investment trust |
The accompanying notes are an integral part of these financial statements.
| | | | |
| 38 | | Wells Fargo Index Portfolio | | Portfolio of investments—May 31, 2019 |
Futures Contracts
| | | | | | | | | | | | | | | | | | | | | | | | |
| Description | | Number of
contracts | | | Expiration
date | | | Notional
cost | | | Notional
value | | | Unrealized
gains | | | Unrealized
losses | |
| | | | | | |
Long | | | | | | | | | | | | | | | | | | | | | | | | |
| | | | | | |
S&P 500 Index | | | 41 | | | | 6-20-2019 | | | $ | 29,747,405 | | | $ | 28,214,150 | | | $ | 0 | | | $ | (1,533,255 | ) |
Investments in Affiliates
An affiliated investment is an investment in which the Portfolio owns at least 5% of the outstanding voting shares of the issuer or as a result of other relationships, such as the Portfolio and the issuer having the same adviser or investment manager. Transactions with issuers that were either affiliated persons of the Portfolio at the beginning of the period or the end of the period were as follows:
| | | | | | | | | | | | | | | | | | | | | | | | | | | | | | | | | | | | |
| | | Shares,
beginning of
period | | | Shares
purchased | | | Shares
sold | | | Shares,
end of
period | | | Net
realized
gains
(losses) | | | Net
change in
unrealized
gains
(losses) | | | Income
from
affiliated
securities | | | Value,
end
of period | | | % of
net
assets | |
Common Stocks | | | | | | | | | | | | | | | | | | | | | | | | | | | | | | | | | | | | |
Financials | | | | | | | | | | | | | | | | | | | | | | | | | | | | | | | | | | | | |
Banks | | | | | | | | | | | | | | | | | | | | | | | | | | | | | | | | | | | | |
Wells Fargo & Company | | | 308,208 | | | | 890 | | | | 100,899 | | | | 208,199 | | | $ | 2,349,943 | | | $ | (4,708,807 | ) | | $ | 449,938 | | | $ | 9,237,790 | | | | 0.77 | % |
| | | | | | | | | |
Short-Term Investments | | | | | | | | | | | | | | | | | | | | | | | | | | | | | | | | | | | | |
Investment Companies | | | | | | | | | | | | | | | | | | | | | | | | | | | | | | | | | | | | |
Securities Lending Cash Investments LLC | | | 6,535,529 | | | | 51,479,964 | | | | 54,885,992 | | | | 3,129,501 | | | | 141 | | | | (207 | ) | | | 77,452 | | | | 3,129,814 | | | | | |
Wells Fargo Government Money Market Fund Select Class | | | 17,497,109 | | | | 318,604,274 | | | | 311,883,980 | | | | 24,217,403 | | | | 0 | | | | 0 | | | | 604,782 | | | | 24,217,403 | | | | | |
| | | | | | | | | |
| | | | | | | | | | | | | | | | | | | | | | | | | | | | | | | 27,347,217 | | | | 2.29 | % |
| | | | | | | | | | | | | | | | | | | | | | | | | | | | | | | | | | | | |
| | | | | | | | | |
| | | | | | | | | | | | | | | | | | $ | 2,350,084 | | | $ | (4,709,014 | ) | | $ | 1,132,172 | | | $ | 36,585,007 | | | | 3.06 | % |
| | | | | | | | | | | | | | | | | | | | | | | | | | | | | | | | | | | | |
The accompanying notes are an integral part of these financial statements.
| | | | | | |
| Statement of assets and liabilities—May 31, 2019 | | Wells Fargo Index Portfolio | | | 39 | |
| | | | |
| | | | |
| |
Assets | | | | |
Investments in unaffiliated securities (including $3,025,927 of securities loaned), at value (cost $380,664,056) | | $ | 1,159,228,746 | |
Investments in affiliated securities, at value (cost $32,254,278) | | | 36,585,007 | |
Receivable for dividends | | | 2,448,106 | |
Receivable for tax reclaims | | | 624,323 | |
Receivable for securities lending income, net | | | 636 | |
Prepaid expenses and other assets | | | 186,800 | |
| | | | |
Total assets | | | 1,199,073,618 | |
| | | | |
| |
Liabilities | | | | |
Payable upon receipt of securities loaned | | | 3,127,781 | |
Payable for daily variation margin on open futures contracts | | | 387,450 | |
Advisory fee payable | | | 107,208 | |
Accrued expenses and other liabilities | | | 64,647 | |
| | | | |
Total liabilities | | | 3,687,086 | |
| | | | |
Total net assets | | $ | 1,195,386,532 | |
| | | | |
The accompanying notes are an integral part of these financial statements.
| | | | |
| 40 | | Wells Fargo Index Portfolio | | Statement of operations—year ended May 31, 2019 |
| | | | |
| | | | |
| |
Investment income | | | | |
Dividends (net of foreign dividend withholding taxes of $16,043) | | $ | 27,744,211 | |
Income from affiliated securities | | | 1,112,974 | |
Interest | | | 50,937 | |
| | | | |
Total investment income | | | 28,908,122 | |
| | | | |
| |
Expenses | | | | |
Advisory fee | | | 1,354,919 | |
Custody and accounting fees | | | 133,001 | |
Professional fees | | | 60,889 | |
Shareholder report expenses | | | 7,142 | |
Trustees’ fees and expenses | | | 20,971 | |
Other fees and expenses | | | 19,813 | |
| | | | |
Net expenses | | | 1,596,735 | |
| | | | |
Net investment income | | | 27,311,387 | |
| | | | |
| |
REALIZED AND UNREALIZED GAINS (LOSSES) ON INVESTMENTS | | | | |
| |
Net realized gains on: | | | | |
Unaffiliated securities | | | 313,083,728 | |
Affiliated securities | | | 2,350,084 | |
Futures contracts | | | 903,750 | |
| | | | |
Net realized gains on investments | | | 316,337,562 | |
| | | | |
| |
Net change in unrealized gains (losses) on: | | | | |
Unaffiliated securities | | | (286,211,751 | ) |
Affiliated securities | | | (4,709,014 | ) |
Futures contracts | | | (2,000,615 | ) |
| | | | |
Net change in unrealized gains (losses) on investments | | | (292,921,380 | ) |
| | | | |
Net realized and unrealized gains (losses) on investments | | | 23,416,182 | |
| | | | |
Net increase in net assets resulting from operations | | $ | 50,727,569 | |
| | | | |
The accompanying notes are an integral part of these financial statements.
| | | | | | |
| Statement of changes in net assets | | Wells Fargo Index Portfolio | | | 41 | |
| | | | | | | | |
| | | Year ended
May 31, 2019 | | | Year ended
May 31, 2018 | |
| | |
Operations | | | | | | | | |
Net investment income | | $ | 27,311,387 | | | $ | 34,477,983 | |
Net realized gains on investments | | | 316,337,562 | | | | 356,446,608 | |
Net change in unrealized gains (losses) on investments | | | (292,921,380 | ) | | | (130,957,468 | ) |
| | | | |
Net increase in net assets resulting from operations | | | 50,727,569 | | | | 259,967,123 | |
| | | | |
| |
Capital transactions | | | | |
Transactions in investors’ beneficial interests | | | | | | | | |
Contributions | | | 3,884,910 | | | | 15,647,891 | |
Withdrawals | | | (513,193,862 | ) | | | (637,181,697 | ) |
| | | | |
Net decrease in net assets resulting from capital transactions | | | (509,308,952 | ) | | | (621,533,806 | ) |
| | | | |
Total decrease in net assets | | | (458,581,383 | ) | | | (361,566,683 | ) |
| | | | |
| |
Net assets | | | | |
Beginning of period | | | 1,653,967,915 | | | | 2,015,534,598 | |
| | | | |
End of period | | $ | 1,195,386,532 | | | $ | 1,653,967,915 | |
| | | | |
The accompanying notes are an integral part of these financial statements.
| | | | |
| 42 | | Wells Fargo Index Portfolio | | Financial highlights |
| | | | | | | | | | | | | | | | | | | | |
| | | Year ended May 31 | |
| | | 2019 | | | 2018 | | | 2017 | | | 2016 | | | 2015 | |
Total return | | | 3.67 | % | | | 14.27 | % | | | 17.36 | % | | | 1.62 | % | | | 11.69 | % |
Ratios to average net assets (annualized) | | | | | | | | | | | | | | | | | | | | |
Gross expenses | | | 0.11 | % | | | 0.10 | % | | | 0.10 | % | | | 0.11 | % | | | 0.11 | % |
Net expenses | | | 0.11 | % | | | 0.10 | % | | | 0.10 | % | | | 0.10 | % | | | 0.11 | % |
Net investment income | | | 1.86 | % | | | 1.84 | % | | | 2.03 | % | | | 2.12 | % | | | 1.96 | % |
Supplemental data | | | | | | | | | | | | | | | | | | | | |
Portfolio turnover rate | | | 4 | % | | | 3 | % | | | 9 | % | | | 4 | % | | | 4 | % |
The accompanying notes are an integral part of these financial statements.
| | | | | | |
| Notes to financial statements | | Wells Fargo Index Portfolio | | | 43 | |
1. ORGANIZATION
Wells Fargo Master Trust (the “Trust”), a Delaware statutory trust organized on March 10, 1999, is an open-end management investment company registered under the Investment Company Act of 1940, as amended (the “1940 Act”). As an investment company, the Trust follows the accounting and reporting guidance in Financial Accounting Standards Board (“FASB”) Accounting Standards Codification Topic 946, Financial Services – Investment Companies. These financial statements report on the Wells Fargo Index Portfolio (the “Portfolio”) which is a diversified series of the Trust.
2. SIGNIFICANT ACCOUNTING POLICIES
The following significant accounting policies, which are consistently followed in the preparation of the financial statements of the Portfolio, are in conformity with U.S. generally accepted accounting principles which require management to make estimates and assumptions that affect the reported amounts of assets and liabilities, disclosure of contingent assets and liabilities at the date of the financial statements, and the reported amounts of revenues and expenses during the reporting period. Actual results could differ from those estimates.
Securities valuation
All investments are valued each business day as of the close of regular trading on the New York Stock Exchange (generally 4 p.m. Eastern Time), although the Portfolio may deviate from this calculation time under unusual or unexpected circumstances.
Equity securities and futures contracts that are listed on a foreign or domestic exchange or market are valued at the official closing price or, if none, the last sales price. If no sale occurs on the principal exchange or market that day, a fair value price will be determined in accordance with the Portfolio’s Valuation Procedures.
Debt securities are valued at the evaluated bid price provided by an independent pricing service service (e.g. taking into account various factors, including yields, maturities, or credit ratings) or, if a reliable price is not available, the quoted bid price from an independent broker-dealer.
Investments in registered open-end investment companies are valued at net asset value. Interests in non-registered investment companies that are redeemable at net asset value are fair valued normally at net asset value.
Investments which are not valued using any of the methods discussed above are valued at their fair value, as determined in good faith by the Board of Trustees of the Portfolio. The Board of Trustees has established a Valuation Committee comprised of the Trustees and has delegated to it the authority to take any actions regarding the valuation of portfolio securities that the Valuation Committee deems necessary or appropriate, including determining the fair value of portfolio securities, unless the determination has been delegated to the Wells Fargo Asset Management Pricing Committee at Wells Fargo Funds Management, LLC (“Funds Management”). The Board of Trustees retains the authority to make or ratify any valuation decisions or approve any changes to the Valuation Procedures as it deems appropriate. On a quarterly basis, the Board of Trustees receives reports on any valuation actions taken by the Valuation Committee or the Wells Fargo Asset Management Pricing Committee which may include items for ratification.
Securities lending
The Portfolio may lend its securities from time to time in order to earn additional income in the form of fees or interest on securities received as collateral or the investment of any cash received as collateral. When securities are on loan, the Portfolio receives interest or dividends on the securities loaned. The Portfolio receives collateral in the form of cash or securities with a value at least equal to the value of the securities on loan. The value of the loaned securities is determined at the close of each business day and any additional required collateral is delivered to the Portfolio on the next business day. In a securities lending transaction, the net asset value of the Portfolio will be affected by an increase or decrease in the value of the securities loaned and by an increase or decrease in the value of the instrument in which collateral is invested. The amount of securities lending activity undertaken by the Portfolio fluctuates from time to time. In the event of default or bankruptcy by the borrower, the Portfolio may be prevented from recovering the loaned securities or gaining access to the collateral or may experience delays or costs in doing so. In addition, the investment of any cash collateral received may lose all or part of its value. The Portfolio has the right under the lending agreement to recover the securities from the borrower on demand.
The Portfolio lends its securities through an unaffiliated securities lending agent. Cash collateral received in connection with its securities lending transactions is invested in Securities Lending Cash Investments, LLC (the “Securities Lending Fund”). The Securities Lending Fund is exempt from registration under Section 3(c)(7) of the 1940 Act and is managed by Funds Management and is subadvised by Wells Capital Management Incorporated (“WellsCap”), an affiliate of Funds Management and an indirect wholly owned subsidiary of Wells Fargo & Company (“Wells Fargo”). Funds Management
| | | | |
| 44 | | Wells Fargo Index Portfolio | | Notes to financial statements |
receives an advisory fee starting at 0.05% and declining to 0.01% as the average daily net assets of the Securities Lending Fund increase. All of the fees received by Funds Management are paid to WellsCap for its services as subadviser. The Securities Lending Fund seeks to provide a positive return compared to the daily Fed Funds Open Rate by investing in high-quality, U.S. dollar-denominated short-term money market instruments. Securities Lending Fund investments are valued at the evaluated bid price provided by an independent pricing service. Income earned from investment in the Securities Lending Fund (net of fees and rebates), if any, is included in income from affiliated securities on the Statement of Operations.
Futures contracts
The Portfolio is subject to equity price risk in the normal course of pursuing its investment objectives. Futures contracts are agreements between the Portfolio and a counterparty to buy or sell a specific amount of a commodity, financial instrument or currency at specified price and on a specified date. The Portfolio may buy and sell futures contracts in order to gain exposure to, or protect against, changes in security values. The primary risks associated with the use of futures contracts are the imperfect correlation between changes in market values of securities held by the Portfolio and the prices of futures contracts, and the possibility of an illiquid market. Futures contracts are generally entered into on a regulated futures exchange and cleared through a clearinghouse associated with the exchange. With futures contracts, there is minimal counterparty risk to the Portfolio since futures contracts are exchange traded and the exchange’s clearinghouse, as counterparty to all exchange traded futures, guarantees the futures contracts against default.
Upon entering into a futures contracts, the Portfolio is required to deposit either cash or securities (initial margin) with the broker in an amount equal to a certain percentage of the contract value. Subsequent payments (variation margin) are paid to or from the broker each day equal to the daily changes in the contract value. Such payments are recorded as unrealized gains or losses and, if any, shown as variation margin receivable (payable) in the Statement of Assets and Liabilities. Should the Portfolio fail to make requested variation margin payments, the broker can gain access to the initial margin to satisfy the Portfolio’s payment obligations. When the contracts are closed, a realized gain or loss is recorded in the Statement of Operations.
Security transactions and income recognition
Securities transactions are recorded on a trade date basis. Realized gains or losses are recorded on the basis of identified cost.
Dividend income is recognized on the ex-dividend date. Dividend income is recorded net of foreign taxes withheld where recovery of such taxes is not assured.
Interest income is accrued daily and bond discounts are accreted and premiums are amortized daily. To the extent debt obligations are placed on non-accrual status, any related interest income may be reduced by writing off interest receivables when the collection of all or a portion of interest has been determined to be doubtful based on consistently applied procedures and the fair value has decreased. If the issuer subsequently resumes interest payments or when the collectability of interest is reasonably assured, the debt obligation is removed from non-accrual status.
Federal and other taxes
The Portfolio is treated as a separate entity for federal income tax purposes. The Portfolio is not required to pay federal income taxes on its net investment income and net capital gains as it is treated as a partnership for federal income tax purposes. All interest, dividends, gains and losses of the Portfolio are deemed to have been “passed through” to the interest holders in proportion to their holdings of the Portfolio regardless of whether such interest, dividends and gains have been distributed by the Portfolio.
The Portfolio’s income tax returns and all financial records supporting those returns for the prior three fiscal years are subject to examination by the federal revenue authority. Management has analyzed the Portfolio’s tax positions taken on federal, state, and foreign tax returns for all open tax years and does not believe that there are any uncertain tax positions that require recognition of a tax liability.
As of May 31, 2019, the aggregate cost of all investments for federal income tax purposes was $433,782,316 and the unrealized gains (losses) consisted of:
| | | | |
| |
Gross unrealized gains | | $ | 797,914,415 | |
| |
Gross unrealized losses | | | (37,416,233 | ) |
| |
Net unrealized gains | | $ | 760,498,182 | |
| | | | | | |
| Notes to financial statements | | Wells Fargo Index Portfolio | | | 45 | |
3. FAIR VALUATION MEASUREMENTS
Fair value measurements of investments are determined within a framework that has established a fair value hierarchy based upon the various data inputs utilized in determining the value of the Portfolio’s investments. The three-level hierarchy gives the highest priority to unadjusted quoted prices in active markets for identical assets or liabilities (Level 1) and the lowest priority to unobservable inputs (Level 3). The Portfolio’s investments are classified within the fair value hierarchy based on the lowest level of input that is significant to the fair value measurement. The inputs are summarized into three broad levels as follows:
| ∎ | | Level 1 – quoted prices in active markets for identical securities |
| ∎ | | Level 2 – other significant observable inputs (including quoted prices for similar securities, interest rates, prepayment speeds, credit risk, etc.) |
| ∎ | | Level 3 – significant unobservable inputs (including the Portfolio’s own assumptions in determining the fair value of investments) |
The inputs or methodologies used for valuing investments in securities are not necessarily an indication of the risk associated with investing in those securities.
The following is a summary of the inputs used in valuing the Portfolio’s assets and liabilities as of May 31, 2019:
| | | | | | | | | | | | | | | | |
| | | | |
| | | Quoted prices
(Level 1) | | | Other significant
observable inputs
(Level 2) | | | Significant
unobservable inputs
(Level 3) | | | Total | |
| | | | |
Assets | | | | | | | | | | | | | | | | |
Investments in: | | | | | | | | | | | | | | | | |
| | | | |
Common stocks | | | | | | | | | | | | | | | | |
| | | | |
Communication services | | $ | 121,248,422 | | | $ | 0 | | | $ | 0 | | | $ | 121,248,422 | |
| | | | |
Consumer discretionary | | | 118,725,339 | | | | 0 | | | | 0 | | | | 118,725,339 | |
| | | | |
Consumer staples | | | 86,380,267 | | | | 0 | | | | 0 | | | | 86,380,267 | |
| | | | |
Energy | | | 57,496,953 | | | | 0 | | | | 0 | | | | 57,496,953 | |
| | | | |
Financials | | | 153,435,613 | | | | 0 | | | | 0 | | | | 153,435,613 | |
| | | | |
Health care | | | 165,909,897 | | | | 0 | | | | 0 | | | | 165,909,897 | |
| | | | |
Industrials | | | 108,891,470 | | | | 0 | | | | 0 | | | | 108,891,470 | |
| | | | |
Information technology | | | 246,578,663 | | | | 0 | | | | 0 | | | | 246,578,663 | |
| | | | |
Materials | | | 30,455,063 | | | | 0 | | | | 0 | | | | 30,455,063 | |
| | | | |
Real estate | | | 37,240,004 | | | | 0 | | | | 0 | | | | 37,240,004 | |
| | | | |
Utilities | | | 39,838,345 | | | | 0 | | | | 0 | | | | 39,838,345 | |
| | | | |
Short-term investments | | | | | | | | | | | | | | | | |
| | | | |
Investment companies | | | 24,217,403 | | | | 3,129,814 | | | | 0 | | | | 27,347,217 | |
| | | | |
U.S. Treasury securities | | | 2,266,500 | | | | 0 | | | | 0 | | | | 2,266,500 | |
| | | | |
Total assets | | $ | 1,192,683,939 | | | $ | 3,129,814 | | | $ | 0 | | | $ | 1,195,813,753 | |
| | | | |
Liabilities | | | | | | | | | | | | | | | | |
| | | | |
Futures contracts | | $ | 1,533,255 | | | $ | 0 | | | $ | 0 | | | $ | 1,533,255 | |
| | | | |
Total liabilities | | $ | 1,533,255 | | | $ | 0 | | | $ | 0 | | | $ | 1,533,255 | |
Additional sector, industry or geographic detail is included in the Portfolio of Investments.
Futures contracts are reported at their cumulative unrealized gains (losses) at measurement date as reported in the table following the Portfolio of Investments. For futures contracts, the current day’s variation margin is reported on the Statement of Assets and Liabilities. All other assets and liabilities are reported at their market value at measurement date.
At May 31, 2019, the Portfolio did not have any transfers into/out of Level 3.
| | | | |
| 46 | | Wells Fargo Index Portfolio | | Notes to financial statements |
4. TRANSACTIONS WITH AFFILIATES
Advisory fee
The Trust has entered into an advisory contract with Funds Management, an indirect wholly owned subsidiary of Wells Fargo. The adviser is responsible for implementing investment policies and guidelines and for supervising the subadviser, who is responsible for day-to-day portfolio management of the Portfolio. Pursuant to the contract, Funds Management is entitled to receive an annual advisory fee at the following annual rate based on the Portfolio’s average daily net assets:
| | |
| |
| Average daily net assets | | Advisory fee |
| |
First $500 million | | 0.100% |
| |
Next $500 million | | 0.100 |
| |
Next $2 billion | | 0.075 |
| |
Next $2 billion | | 0.075 |
| |
Over $5 billion | | 0.050 |
For the year ended May 31, 2019, the advisory fee was equivalent to an annual rate of 0.09% of the Portfolio’s average daily net assets.
Funds Management has retained the services of a subadviser to provide daily portfolio management to the Portfolio. The fee for subadvisory services is borne by Funds Management. WellsCap is the subadviser to the Portfolio and is entitled to receive a fee from Funds Management at an annual rate starting at 0.05% and declining to 0.02% as the average daily net assets of the Portfolio increase.
Interfund transactions
The Portfolios may purchase or sell portfolio investment securities to certain other Wells Fargo affiliates pursuant to Rule 17a-7 of the 1940 Act and under procedures adopted by the Board of Trustees. The procedures have been designed to ensure that these interfund transactions, which do not incur broker commissions, are effected at current market prices.
5. INVESTMENT PORTFOLIO TRANSACTIONS
Purchases and sales of investments, excluding U.S. government obligations (if any) and short-term securities, for the year ended May 31, 2019 were $50,304,857 and $511,578,610, respectively.
6. DERIVATIVE TRANSACTIONS
During the year ended May 31, 2019, the Portfolio entered into futures contracts for to gain market exposure. The Portfolio had an average notional amount of $35,004,303 in long futures contracts during the year ended May 31, 2019.
The fair value, realized gains or losses and change in unrealized gains or losses, if any, on derivative instruments are reflected in the corresponding financial statement captions.
7. BANK BORROWINGS
Effective August 28, 2018, the Trust, along with Wells Fargo Variable Trust and Wells Fargo Funds Trust (excluding the money market funds), are parties to a $280,000,000 revolving credit agreement whereby the Portfolio is permitted to use bank borrowings for temporary or emergency purposes, such as to fund shareholder redemption requests. Interest under the credit agreement is charged to the Portfolio based on a borrowing rate equal to the higher of the Federal Funds rate in effect on that day plus 1.25% or the overnight LIBOR rate in effect on that day plus 1.25%. In addition, an annual commitment fee equal to 0.25% of the unused balance is allocated to each participating fund.
For the year ended May 31, 2019, there were no borrowings by the Portfolio under the agreement.
8. INDEMNIFICATION
Under the Trust’s organizational documents, the officers and Trustees have been granted certain indemnification rights against certain liabilities that may arise out of performance of their duties to the Trust. Additionally, in the normal course of business, the Trust may enter into contracts with service providers that contain a variety of indemnification clauses. The Trust’s maximum exposure under these arrangements is dependent on future claims that may be made against the Portfolio and, therefore, cannot be estimated.
| | | | | | |
| Notes to financial statements | | Wells Fargo Index Portfolio | | | 47 | |
9. NEW ACCOUNTING PRONOUNCEMENT
In August 2018, FASB issued Accounting Standards Update (“ASU”) No. 2018-13, Fair Value Measurement (Topic 820)Disclosure Framework—Changes to the Disclosure Requirements for Fair Value Measurement. ASU 2018-13 updates the disclosure requirements for fair value measurements by modifying or removing certain disclosures and adding certain new disclosures. The amendments are effective for fiscal years, and interim periods within those fiscal years, beginning after December 15, 2019. Early adoption is permitted. Management has adopted the removal and modification of disclosures early, as permitted, and will adopt the additional new disclosures at the effective date.
| | | | |
| 48 | | Wells Fargo Index Portfolio | | Report of independent registered public accounting firm |
TO THE SHAREHOLDERS OF THE PORTFOLIO AND BOARD OF TRUSTEES OF WELLS FARGO MASTER TRUST:
Opinion on the Financial Statements
We have audited the accompanying statement of assets and liabilities of Wells Fargo Index Portfolio (the Portfolio), one of the portfolios constituting Wells Fargo Master Trust, including the portfolio of investments, as of May 31, 2019, the related statement of operations for the year then ended, the statements of changes in net assets for each of the years in the two-year period then ended, and the related notes (collectively, the financial statements) and the financial highlights for each of the years in the five-year period then ended. In our opinion, the financial statements and financial highlights present fairly, in all material respects, the financial position of the Portfolio as of May 31, 2019, the results of its operations for the year then ended, the changes in its net assets for each of the years in the two-year period then ended, and the financial highlights for each of the years in the five-year period then ended, in conformity with U.S. generally accepted accounting principles.
Basis for Opinion
These financial statements and financial highlights are the responsibility of the Portfolio’s management. Our responsibility is to express an opinion on these financial statements and financial highlights based on our audits. We are a public accounting firm registered with the Public Company Accounting Oversight Board (United States) (PCAOB) and are required to be independent with respect to the Portfolio in accordance with the U.S. federal securities laws and the applicable rules and regulations of the Securities and Exchange Commission and the PCAOB.
We conducted our audits in accordance with the standards of the PCAOB. Those standards require that we plan and perform the audit to obtain reasonable assurance about whether the financial statements and financial highlights are free of material misstatement, whether due to error or fraud. Our audits included performing procedures to assess the risks of material misstatement of the financial statements and financial highlights, whether due to error or fraud, and performing procedures that respond to those risks. Such procedures included examining, on a test basis, evidence regarding the amounts and disclosures in the financial statements and financial highlights. Such procedures also included confirmation of securities owned as of May 31, 2019, by correspondence with the custodian and brokers, or by other appropriate auditing procedures. Our audits also included evaluating the accounting principles used and significant estimates made by management, as well as evaluating the overall presentation of the financial statements and financial highlights. We believe that our audits provide a reasonable basis for our opinion.
We have not been able to determine the specific year that we began serving as the auditor of one or more Wells Fargo Funds investment companies; however we are aware that we have served as the auditor of one or more Wells Fargo Funds investment companies since at least 1955.
Boston, Massachusetts
July 26, 2019
| | | | | | |
| Other information (unaudited) | | Wells Fargo Index Fund | | | 49 | |
TAX INFORMATION
For corporate shareholders, pursuant to Section 854 of the Internal Revenue Code, 100% of ordinary income dividends qualify for the corporate dividends-received deduction for the fiscal year ended May 31, 2019.
Pursuant to Section 852 of the Internal Revenue Code, $322,442,393 was designated as a 20% rate gain distribution for the fiscal year ended May 31, 2019.
Pursuant to Section 854 of the Internal Revenue Code, $26,860,120 of income dividends paid during the fiscal year ended May 31, 2019 has been designated as qualified dividend income (QDI).
For the fiscal year ended May 31, 2019, $439,456 has been designated as interest-related dividends for nonresident alien shareholders pursuant to Section 871 of the Internal Revenue Code.
For the fiscal year ended May 31, 2019, $1,476,587 has been designated as short-term capital gain dividends for nonresident alien shareholders pursuant to Section 871 of the Internal Revenue Code.
PROXY VOTING INFORMATION
A description of the policies and procedures used to determine how to vote proxies relating to portfolio securities is available, upon request, by calling1-800-222-8222, visiting our website atwfam.com, or visiting the SEC website at sec.gov. Information regarding how the proxies related to portfolio securities were voted during the most recent 12-month period ended June 30 is available on the website atwfam.com or by visiting the SEC website at sec.gov.
QUARTERLY PORTFOLIO HOLDINGS
The Fund and Portfolio file their complete schedule of portfolio holdings with the SEC for the first and third quarters of each fiscal year on Form N-Q, which is available by visiting the SEC website at sec.gov. Those forms may be reviewed and copied at the SEC’s Public Reference Room in Washington, DC. Information on the operation of the Public Reference Room may be obtained by calling 1-800-SEC-0330.
| | | | |
| 50 | | Wells Fargo Index Fund | | Other information (unaudited) |
BOARD OF TRUSTEES AND OFFICERS
Each of the Trustees and Officers1 listed in the table below acts in identical capacities for each fund in the Wells Fargo family of funds, which consists of 151 mutual funds comprising the Wells Fargo Funds Trust, Wells Fargo Variable Trust, Wells Fargo Master Trust and four closed-end funds (collectively the “Fund Complex”). This table should be read in conjunction with the Prospectus and the Statement of Additional Information2. The mailing address of each Trustee and Officer is 525 Market Street, 12th Floor, San Francisco, CA 94105. Each Trustee and Officer serves an indefinite term, however, each Trustee serves such term until reaching the mandatory retirement age established by the Trustees.
Independent Trustees
| | | | | | |
Name and
year of birth | | Position held and
length of service* | | Principal occupations during past five years or longer | | Current other
public company or
investment company
directorships |
| | | |
William R. Ebsworth (Born 1957) | | Trustee, since 2015 | | Retired. From 1984 to 2013, equities analyst, portfolio manager, research director and chief investment officer at Fidelity Management and Research Company in Boston, Tokyo, and Hong Kong, and retired in 2013 as Chief Investment Officer of Fidelity Strategic Advisers, Inc. where he led a team of investment professionals managing client assets. Prior thereto, Board member of Hong Kong Securities Clearing Co., Hong Kong Options Clearing Corp., the Thailand International Fund, Ltd., Fidelity Investments Life Insurance Company, and Empire Fidelity Investments Life Insurance Company. Audit Committee Chair and Investment Committee Chair of the Vincent Memorial Hospital Endowment (non-profit organization). Mr. Ebsworth is a CFA® charterholder. | | N/A |
| | | |
Jane A. Freeman (Born 1953) | | Trustee, since 2015; Chair Liaison, since 2018 | | Retired. From 2012 to 2014 and 1999 to 2008, Chief Financial Officer of Scientific Learning Corporation. From 2008 to 2012, Ms. Freeman provided consulting services related to strategic business projects. Prior to 1999, Portfolio Manager at Rockefeller & Co. and Scudder, Stevens & Clark. Board member of the Harding Loevner Funds from 1996 to 2014, serving as both Lead Independent Director and chair of the Audit Committee. Board member of the Russell Exchange Traded Funds Trust from 2011 to 2012 and the chair of the Audit Committee. Ms. Freeman is a Board Member of The Ruth Bancroft Garden (non-profit organization). She is also an inactive Chartered Financial Analyst. | | N/A |
| | | |
Isaiah Harris, Jr. (Born 1952) | | Trustee, since 2009; Audit Committee Chairman, since 2019 | | Retired. Chairman of the Board of CIGNA Corporation since 2009, and Director since 2005. From 2003 to 2011, Director of Deluxe Corporation. Prior thereto, President and CEO of BellSouth Advertising and Publishing Corp. from 2005 to 2007, President and CEO of BellSouth Enterprises from 2004 to 2005 and President of BellSouth Consumer Services from 2000 to 2003. Emeritus member of the Iowa State University Foundation Board of Governors. Emeritus Member of the Advisory Board of Iowa State University School of Business. Advisory Board Member, Palm Harbor Academy (private school). Advisory Board Member, Child Evangelism Fellowship (non-profit). Mr. Harris is a certified public accountant (inactive status). | | CIGNA Corporation |
| | | |
Judith M. Johnson (Born 1949) | | Trustee, since 2008; Audit Committee Chairman, from 2009 to 2018 | | Retired. Prior thereto, Chief Executive Officer and Chief Investment Officer of Minneapolis Employees Retirement Fund from 1996 to 2008. Ms. Johnson is an attorney, certified public accountant and a certified managerial accountant. | | N/A |
| | | | | | |
| Other information (unaudited) | | Wells Fargo Index Fund | | | 51 | |
| | | | | | |
Name and
year of birth | | Position held and
length of service* | | Principal occupations during past five years or longer | | Current other
public company or
investment company
directorships |
| | | |
David F. Larcker (Born 1950) | | Trustee, since 2009 | | James Irvin Miller Professor of Accounting at the Graduate School of Business, Stanford University, Director of the Corporate Governance Research Initiative and Senior Faculty of The Rock Center for Corporate Governance since 2006. From 2005 to 2008, Professor of Accounting at the Graduate School of Business, Stanford University. Prior thereto, Ernst & Young Professor of Accounting at The Wharton School, University of Pennsylvania from 1985 to 2005. | | N/A |
| | | |
Olivia S. Mitchell (Born 1953) | | Trustee, since 2006; Nominating and Governance Committee Chairman, since 2018 | | International Foundation of Employee Benefit Plans Professor, Wharton School of the University of Pennsylvania since 1993. Director of Wharton’s Pension Research Council and Boettner Center on Pensions & Retirement Research, and Research Associate at the National Bureau of Economic Research. Previously, Cornell University Professor from 1978 to 1993. | | N/A |
| | | |
Timothy J. Penny (Born 1951) | | Trustee, since 1996; Chairman, since 2018 | | President and Chief Executive Officer of Southern Minnesota Initiative Foundation, a non-profit organization, since 2007. Member of the Board of Trustees of NorthStar Education Finance, Inc., a non-profit organization, since 2007. | | N/A |
| | | |
James G. Polisson (Born 1959) | | Trustee, since 2018 | | Retired. Chief Marketing Officer, Source (ETF) UK Services, Ltd, from 2015 to 2017. From 2012 to 2015, Principal of The Polisson Group, LLC, a management consulting, corporate advisory and principal investing company. Chief Executive Officer and Managing Director at Russell Investments, Global Exchange Traded Funds from 2010 to 2012. Managing Director of Barclays Global Investors from 1998 to 2010 and Global Chief Marketing Officer for iShares and Barclays Global Investors from 2000 to 2010. Trustee of the San Francisco Mechanics’ Institute, a non-profit organization, from 2013 to 2015. Board member of the Russell Exchange Traded Fund Trust from 2011 to 2012. Director of Barclays Global Investors Holdings Deutschland GmbH from 2006 to 2009. Mr. Polisson is an attorney and has a retired status with the Massachusetts and District of Columbia Bar Associations. | | N/A |
| * | Length of service dates reflect the Trustee’s commencement of service with the Trust’s predecessor entities, where applicable. |
| | | | |
| 52 | | Wells Fargo Index Fund | | Other information (unaudited) |
Officers
| | | | | | |
Name and
year of birth | | Position held and
length of service | | Principal occupations during past five years or longer | | |
| | | |
Andrew Owen (Born 1960) | | President, since 2017 | | Executive Vice President of Wells Fargo & Company and Head of Affiliated Managers, Wells Fargo Asset Management, since 2014. In addition, Mr. Owen is currently President, Chief Executive Officer and Director of Wells Fargo Funds Management, LLC since 2017. Prior thereto, Executive Vice President responsible for marketing, investments and product development for Wells Fargo Funds Management, LLC, from 2009 to 2014. | | |
| | | |
Nancy Wiser1 (Born 1967) | | Treasurer, since 2012 | | Executive Vice President of Wells Fargo Funds Management, LLC since 2011. Chief Operating Officer and Chief Compliance Officer at LightBox Capital Management LLC, from 2008 to 2011. | | |
| | | |
Alexander Kymn (Born 1973) | | Secretary and Chief Legal Officer, since 2018 | | Senior Company Counsel of Wells Fargo Bank, N.A. since 2018 (previously Senior Counsel from 2007 to 2018). Vice President of Wells Fargo Funds Management, LLC from 2008 to 2014. | | |
| | | |
Michael H. Whitaker (Born 1967) | | Chief Compliance Officer, since 2016 | | Senior Vice President and Chief Compliance Officer since 2016. Senior Vice President and Chief Compliance Officer for Fidelity Investments from 2007 to 2016. | | |
| | | |
David Berardi (Born 1975) | | Assistant Treasurer, since 2009 | | Vice President of Wells Fargo Funds Management, LLC since 2009. Vice President of Evergreen Investment Management Company, LLC from 2008 to 2010. Manager of Fund Reporting and Control for Evergreen Investment Management Company, LLC from 2004 to 2010. | | |
| | | |
Jeremy DePalma1 (Born 1974) | | Assistant Treasurer, since 2009 | | Senior Vice President of Wells Fargo Funds Management, LLC since 2009. Senior Vice President of Evergreen Investment Management Company, LLC from 2008 to 2010 and head of the Fund Reporting and Control Team within Fund Administration from 2005 to 2010. | | |
| 1 | Nancy Wiser acts as Treasurer of 65 funds in the Fund Complex. Jeremy DePalma acts as Treasurer of 86 funds and Assistant Treasurer of 65 funds in the Fund Complex. |
| 2 | The Statement of Additional Information includes additional information about the Trustees and is available, without charge, upon request, by calling1-800-222-8222 or by visiting the website atwfam.com. |
| | | | | | |
| Other information (unaudited) | | Wells Fargo Index Fund | | | 53 | |
BOARD CONSIDERATION OF INVESTMENT MANAGEMENT, ADVISORY AND SUB-ADVISORY AGREEMENTS:
Wells Fargo Index Fund and Wells Fargo Index Portfolio
Under the Investment Company Act of 1940 (the “1940 Act”), the Board of Trustees (each, a “Board” and collectively, the “Boards”) of each of Wells Fargo Funds Trust (“Funds Trust”) and Wells Fargo Master Trust (“Master Trust”, and collectively, the “Trusts”) must determine annually whether to approve the continuation of the Trusts’ investment management, advisory and sub-advisory agreements, as applicable. In this regard, at an in-person meeting held on May 21-22, 2019 (the “Meeting”), the Funds Trust Board, all the members of which have no direct or indirect interest in the investment management agreement and are not “interested persons” of the Trusts, as defined in the 1940 Act (the “Independent Trustees”), reviewed and approved for Wells Fargo Index Fund (the “Gateway Fund”) an investment management agreement (the “Gateway Fund Management Agreement”) with Wells Fargo Funds Management, LLC (“Funds Management”).
At the Meeting, the Master Trust Board, all the members of which have no direct or indirect interest in the investment advisory and sub-advisory agreements and are Independent Trustees, reviewed and approved: (i) an investment advisory agreement (the “Master Portfolio Advisory Agreement”) with Funds Management for Wells Fargo Index Portfolio, a portfolio of Master Trust (the “Master Portfolio”); and (ii) an investment sub-advisory agreement (the “Sub-Advisory Agreement”) with Wells Capital Management Incorporated (the “Sub-Adviser”), an affiliate of Funds Management.
The Gateway Fund and the Master Portfolio are collectively referred to as the “Funds.” The Gateway Fund Management Agreement, the Master Portfolio Advisory Agreement and the Sub-Advisory Agreement are collectively referred to as the “Advisory Agreements.”
The Gateway Fund is a gateway feeder fund that invest substantially all of its assets in the Master Portfolio. The Master Portfolio has a substantially similar investment objective and substantially similar investment strategies to the Gateway Fund. Information provided to the Boards regarding the Gateway Fund is also applicable to the Master Portfolio, as relevant.
At the Meeting, the Boards considered the factors and reached the conclusions described below relating to the selection of Funds Management and the Sub-Adviser and the approval of the Advisory Agreements. Prior to the Meeting, including at an in-person meeting in April 2019, the Trustees conferred extensively among themselves and with representatives of Funds Management about these matters. Also, the Boards have adopted a team-based approach, with each team consisting of a sub-set of Trustees, to assist the full Boards in the discharge of their duties in reviewing investment performance and other matters throughout the year. The Independent Trustees were assisted in their evaluation of the Advisory Agreements by independent legal counsel, from whom they received separate legal advice and with whom they met separately.
In providing information to the Boards, Funds Management and the Sub-Adviser were guided by a detailed set of requests for information submitted to them by independent legal counsel on behalf of the Independent Trustees at the start of the Boards’ annual contract renewal process earlier in 2019. In considering and approving the Advisory Agreements, the Trustees considered the information they believed relevant, including but not limited to the information discussed below. The Boards considered not only the specific information presented in connection with the Meeting, but also the knowledge gained over time through interaction with Funds Management and the Sub-Adviser about various topics. In this regard, the Boards reviewed reports of Funds Management at each of their quarterly meetings, which included, among other things, portfolio reviews and investment performance reports. In addition, the Boards and the teams mentioned above confer with portfolio managers at various times throughout the year. The Boards did not identify any particular information or consideration that was all-important or controlling, and each individual Trustee may have attributed different weights to various factors.
After its deliberations, the Funds Trust Board unanimously approved the continuation of the Gateway Fund Management Agreement for a one-year period. Additionally, after its deliberations, the Master Trust Board unanimously approved the continuation of the Master Portfolio Advisory Agreement and the Sub-Advisory Agreement, each for a one-year term. The Boards also determined that the compensation payable to Funds Management and the Sub-Adviser was reasonable. The Boards considered the approval of the Advisory Agreements for the Funds as part of their consideration of agreements for funds across the complex, but their approvals were made on a fund-by-fund basis. The following summarizes a number of important, but not necessarily all, factors considered by the Boards in support of their approvals.
Nature, extent and quality of services
The Boards received and considered various information regarding the nature, extent and quality of services provided to the Funds by Funds Management and the Sub-Adviser under the Advisory Agreements. This information included a
| | | | |
| 54 | | Wells Fargo Index Fund | | Other information (unaudited) |
description of the investment advisory services and Fund-level administrative services, as well as, among other things, a summary of the background and experience of senior management of Wells Fargo Asset Management (“WFAM”), of which Funds Management and the Sub-Adviser are a part, a summary of investments made in the business of WFAM, a summary of certain organizational and personnel changes involving Funds Management and the Sub-Adviser, and a description of Funds Management’s and the Sub-Adviser’s business continuity planning programs and of their approaches to data privacy and cybersecurity. The Boards received and reviewed information about Funds Management’s role as administrator of the Funds’ liquidity risk management program. The Boards also considered the qualifications, background, tenure and responsibilities of each of the portfolio managers primarily responsible for the day-to-day portfolio management of the Funds.
The Boards evaluated the ability of Funds Management and the Sub-Adviser to attract and retain qualified investment professionals, including research, advisory and supervisory personnel. The Boards further considered the compliance programs and compliance records of Funds Management and the Sub-Adviser. In addition, the Boards took into account the full range of services provided to the Funds by Funds Management and its affiliates.
Fund investment performance and expenses
The Boards considered the investment performance results for each of the Funds over various time periods ended December 31, 2018. The Boards considered these results in comparison to the investment performance of funds in a universe that was determined by Broadridge Inc. (“Broadridge”) to be similar to the Gateway Fund (the “Universe”), and in comparison to the Gateway Fund’s benchmark index and to other comparative data. Broadridge is an independent provider of investment company data. The Boards received a description of the methodology used by Broadridge to select the mutual funds in the performance Universe. The Funds Trust Board noted that the investment performance of the Gateway Fund (Administrator Class) was higher than the average investment performance of its Universe for all periods under review. The Funds Trust Board also noted that the investment performance of the Gateway Fund was in range of its benchmark, the S&P 500 Index, for all periods under review.
The Master Trust Board took note of the investment performance of the Master Portfolio in the context of reviewing the investment performance of the Gateway Fund.
The Funds Trust Board also received and considered information regarding the Gateway Fund’s net operating expense ratios, which include fees and expenses of the Master Portfolio, and their various components, including actual management fees assessed at the Gateway Fund and Master Portfolio levels, custodian and other non-management fees, and Rule 12b-1 and non-Rule 12b-1 shareholder service fees. The Funds Trust Board considered these ratios in comparison to the median ratios of funds in class-specific expense groups that were determined by Broadridge to be similar to the Gateway Fund (the “Groups”). The Funds Trust Board received a description of the methodology used by Broadridge to select the mutual funds in the expense Groups and an explanation of how funds comprising expense groups and their expense ratios may vary from year-to-year. Based on the Broadridge reports, the Funds Trust Board noted that the net operating expense ratios of the Gateway Fund were lower than the median net operating expense ratios of its expense Groups for each share class.
With respect to the Master Portfolio, the Master Trust Board reviewed the fee rates that are payable to Funds Management for investment advisory services (as discussed below), which are the only fees charged at the Master Portfolio level, relative to a corresponding expense Group.
The Boards took into account the Funds’ investment performance and expense information provided to them among the factors considered in deciding to re-approve the Advisory Agreements.
Investment management, advisory and sub-advisory fee rates
The Funds Trust Board noted that Funds Management receives no advisory fees from the Gateway Fund as long as the Gateway Fund continues to invest all (or substantially all) of its assets in a single master portfolio. If the Gateway Fund were to change its investment structure so that it began investing in two or more master portfolios (a fund-of-funds), Funds Management would be entitled to receive an annual fee of 0.25% of the Gateway Fund’s average daily net assets for providing investment advisory services to the Gateway Fund, including allocating the Gateway Fund’s assets to the Master Portfolio.
The Funds Trust Board reviewed and considered the contractual fee rates that are payable by the Gateway Fund to Funds Management under the Gateway Fund Management Agreement, as well as the contractual fee rates payable by the Gateway Fund to Funds Management for class-level administrative services under a Class-Level Administration Agreement, which include, among other things, class-level transfer agency and sub-transfer agency costs (collectively, the “Management Rates”).
| | | | | | |
| Other information (unaudited) | | Wells Fargo Index Fund | | | 55 | |
The Master Trust Board reviewed and considered the contractual investment advisory fee rate that is payable by the Master Portfolio to Funds Management for investment advisory services under the Master Portfolio Advisory Agreement (the “Advisory Agreement Rate”). The Master Trust Board also reviewed and considered the contractual investment sub-advisory fee rate that is payable by Funds Management to the Sub-Adviser for investment sub-advisory services (the “Sub-Advisory Agreement Rate”).
Among other information reviewed by the Funds Trust Board was a comparison of the Gateway Fund’s Management Rate, which include the advisory fees paid at the Master Portfolio level, with the average contractual investment management fee rates of funds in the expense Groups at a common asset level as well as transfer agency costs of the funds in the expense Groups. The Funds Trust Board noted that the Management Rates of the Gateway Fund were in range of the sum of these average rates for the Gateway Fund’s expense Groups for all share classes.
The Master Trust Board reviewed a comparison of the Advisory Agreement Rate of the Master Portfolio with those of other funds in the Master Portfolio’s expense Group at a common asset level. The Master Trust Board noted that the Advisory Agreement Rate of the Master Portfolio was lower than the median rate for the Master Portfolio’s expense Group.
The Master Trust Board also received and considered information about the portions of the total management fees that were retained by Funds Management after payment of the fees to the Sub-Adviser for sub-advisory services. In assessing the reasonableness of these amounts, the Master Trust Board received and evaluated information about the nature and extent of responsibilities retained and risks assumed by Funds Management and not delegated to or assumed by the Sub-Adviser, and about Funds Management’s on-going oversight services. Given the affiliation between Funds Management and the Sub-Adviser, the Master Trust Board ascribed limited relevance to the allocation of fees between them.
The Boards also received and considered information about the nature and extent of services offered and fee rates charged by Funds Management and the Sub-Adviser to other types of clients with investment strategies similar to those of the Funds. In this regard, the Boards received information about the significantly greater scope of services, and compliance, reporting and other legal burdens and risks of managing proprietary mutual funds compared with those associated with managing assets of other types of clients, including third-party sub-advised fund clients and non-mutual fund clients such as institutional separate accounts.
Based on its consideration of the factors and information it deemed relevant, including those described here, the Funds Trust Board determined that the compensation payable to Funds Management under the Gateway Fund Management Agreement was reasonable, and the Master Trust Board determined that the compensation payable to Funds Management under the Master Portfolio Advisory Agreement and to the Sub-Adviser under the Sub-Advisory Agreement was reasonable.
Profitability
The Boards received and considered information concerning the profitability of Funds Management, as well as the profitability of both WFAM and Wells Fargo & Co. (“Wells Fargo”) from providing services to the fund family as a whole. The Boards noted that the Sub-Adviser’s profitability with respect to providing services to the Master Portfolio and other funds in the family was subsumed in the WFAM and Wells Fargo profitability analysis.
Funds Management reported on the methodologies and estimates used in calculating profitability, including a description of the methodology used to allocate certain expenses. Among other things, the Boards noted that the levels of profitability reported on a fund-by-fund basis varied widely, depending on factors such as the size, type and age of fund. Based on its review, the Boards did not deem the profits reported by Funds Management, WFAM or Wells Fargo from services provided to the Funds to be at a level that would prevent the Boards from approving the continuation of the Advisory Agreements.
Economies of scale
The Boards received and considered information about the potential for Funds Management to experience economies of scale in the provision of management services to the Funds, the difficulties of calculating economies of scale at an individual fund level, and the extent to which potential scale benefits are shared with shareholders. The Boards noted the existence of breakpoints in the Master Portfolio’s advisory fee structure and the Gateway Fund’s management fee structure, which operate generally to reduce the Funds’ expense ratios as the Funds grow in size. The Boards considered that, in addition to management fee breakpoints, Funds Management shares potential economies of scale from its management business in a variety of ways, including through fee waiver and expense reimbursement arrangements, services that benefit shareholders, competitive management fee rates set at the outset without regard to breakpoints, and investments in the business intended to enhance services available to shareholders.
| | | | |
| 56 | | Wells Fargo Index Fund | | Other information (unaudited) |
The Boards concluded that Funds Management’s arrangements with respect to each Fund, including contractual breakpoints, constituted a reasonable approach to sharing potential economies of scale with the Funds and their shareholders.
Other benefits to Funds Management and the Sub-Adviser
The Boards received and considered information regarding potential “fall-out” or ancillary benefits received by Funds Management and its affiliates, including the Sub-Adviser, as a result of their relationships with the Funds. Ancillary benefits could include, among others, benefits directly attributable to other relationships with the Funds and benefits potentially derived from an increase in Funds Management’s and the Sub-Adviser’s business as a result of their relationships with the Funds. The Boards noted that various affiliates of Funds Management may receive distribution-related fees, shareholder servicing payments and sub-transfer agency fees in respect of shares sold or held through them and services provided.
The Boards also reviewed information about soft dollar credits earned and utilized by the Sub-Adviser, fees earned by Funds Management and the Sub-Adviser from managing a private investment vehicle for the fund family’s securities lending collateral, and commissions earned by an affiliated broker from portfolio transactions.
Based on their consideration of the factors and information they deemed relevant, including those described here, the Boards did not find that any ancillary benefits received by Funds Management and its affiliates, including the Sub-Adviser, were unreasonable.
Conclusion
At the Meeting, after considering the above-described factors and based on its deliberations and its evaluation of the information described above, the Funds Trust Board unanimously approved the continuation of the Gateway Fund Management Agreement for a one-year period. Additionally, after considering the above-described factors and based on its deliberations and its evaluation of the information described above, the Master Trust Board unanimously approved the continuation of the Master Portfolio Advisory Agreement and the Sub-Advisory Agreement, each for a one-year term. The Boards also determined that the compensation payable to Funds Management and the Sub-Adviser was reasonable.

For more information
More information about Wells Fargo Funds is available free upon request. To obtain literature, please write, visit the Fund’s website, or call:
Wells Fargo Funds
P.O. Box 219967
Kansas City, MO 64121-9967
Website: wfam.com
Individual investors: 1-800-222-8222
Retail investment professionals: 1-888-877-9275
Institutional investment professionals:1-866-765-0778
This report and the financial statements contained herein are submitted for the general information of the shareholders of the Fund. If this report is used for promotional purposes, distribution of the report must be accompanied or preceded by a current prospectus. Before investing, please consider the investment objectives, risks, charges, and expenses of the investment. For a current prospectus and, if available, a summary prospectus, containing this information, call1-800-222-8222 or visit the Fund’s website atwfam.com. Read the prospectus carefully before you invest or send money.
Wells Fargo Asset Management (WFAM) is the trade name for certain investment advisory/management firms owned by Wells Fargo & Company. These firms include but are not limited to Wells Capital Management Incorporated and Wells Fargo Funds Management, LLC. Certain products managed by WFAM entities are distributed by Wells Fargo Funds Distributor, LLC (a broker-dealer and Member FINRA).
This material is for general informational and educational purposes only and is NOT intended to provide investment advice or a recommendation of any kind—including a recommendation for any specific investment, strategy, or plan.
INVESTMENT PRODUCTS: NOT FDIC INSURED ◾ NO BANK GUARANTEE ◾ MAY LOSE VALUE
© 2019 Wells Fargo Funds Management, LLC. All rights reserved.
| | |
 | | 403197 07-19 A283/AR283 05-19 |
Annual Report
May 31, 2019

Wells Fargo International Value Fund

Beginning on January 1, 2021, as permitted by new regulations adopted by the Securities and Exchange Commission, paper copies of the Wells Fargo Funds’ annual and semi-annual shareholder reports issued after this date will no longer be sent by mail, unless you specifically request paper copies of the reports. Instead, the reports will be made available on the Funds’ website, and you will be notified by mail each time a report is posted and provided with a website address to access the report.
If you already elected to receive shareholder reports electronically, you will not be affected by this change and you need not take any action. You may elect to receive shareholder reports and other communications from the Fund electronically at any time by contacting your financial intermediary (such as a broker-dealer or bank) or, if you are a direct investor, by calling 1-800-222-8222 or by enrolling at wellsfargo.com/advantagedelivery.
You may elect to receive all future reports in paper free of charge. If you invest through a financial intermediary, you can contact your financial intermediary to request that you continue to receive paper copies of your shareholder reports; if you invest directly with the Fund, you can call 1-800-222-8222. Your election to receive reports in paper will apply to all Wells Fargo Funds held in your account with your financial intermediary or, if you are a direct investor, to all Wells Fargo Funds that you hold.

Reduce clutter. Save trees.
Sign up for electronic delivery of prospectuses and shareholder reports atwellsfargo.com/advantagedelivery
Contents
The views expressed and any forward-looking statements are as of May 31, 2019, unless otherwise noted, and are those of the Fund managers and/or Wells Fargo Asset Management. Discussions of individual securities, or the markets generally, or any Wells Fargo Fund are not intended as individual recommendations. Future events or results may vary significantly from those expressed in any forward-looking statements. The views expressed are subject to change at any time in response to changing circumstances in the market. Wells Fargo Asset Management and the Fund disclaim any obligation to publicly update or revise any views expressed or forward-looking statements.
INVESTMENT PRODUCTS: NOT FDIC INSURED ◾ NO BANK GUARANTEE ◾ MAY LOSE VALUE
| | | | |
| 2 | | Wells Fargo International Value Fund | | Letter to shareholders (unaudited) |

Andrew Owen
President
Wells Fargo Funds
Dear Shareholder:
We are pleased to offer you this annual report for the Wells Fargo International Value Fund for the 12-month period that ended May 31, 2019. Higher short-term interest rates, inflation concerns, trade tensions, and geopolitical events drove investment market volatility for much of 2018, particularly for international stocks. Early 2019 saw stocks and bonds gain with renewed business and investor confidence, but volatility returned late in the period as global growth slowed and geopolitical concerns persisted.
For the period, U.S. stocks, based on the S&P 500 Index,1 gained 3.78% and international stocks, as measured by the MSCI ACWI ex USA Index (Net),2 fell 6.26%. Based on the MSCI EM Index (Net),3 emerging market stocks fell 8.70%. Bond investors saw the Bloomberg Barclays U.S. Aggregate Bond Index4 add 6.40% while the Bloomberg Barclays Global Aggregate ex-USD Index5 rose 0.39%. The Bloomberg Barclays Municipal Bond Index6 added 6.40%, and the ICE BofAML U.S. High Yield Index7 was up 5.37%.
Results for investment indices reflected global concerns.
Global trade tensions escalated during the second quarter of 2018. A tit-for-tat tariff spat intensified between the U.S. and other governments. The U.S. Federal Reserve (Fed) raised the federal funds rate by 25 basis points (bps; 100 bps equal 1.00%) to a target range of between 1.75% and 2.00% in June. Market index results reflected the global concerns. The MSCI ACWI ex USA Index (Net) lost 2.61%, while the Bloomberg Barclays Global Aggregate ex-USD Index dropped 4.76%.
Not all news was bad. The U.S. Bureau of Economic Analysis reported second-quarter annualized gross domestic product (GDP) growth of 4.2%. Hiring improved. Unemployment declined. Consumer confidence and spending increased. The S&P 500 Index recorded a 3.43% second-quarter gain. Stocks of companies with smaller capitalizations did even better, as measured by the Russell 2000® Index,8 adding 7.75%.
| 1 | The S&P 500 Index consists of 500 stocks chosen for market size, liquidity, and industry group representation. It is a market-value-weighted index with each stock’s weight in the index proportionate to its market value. You cannot invest directly in an index. |
| 2 | The Morgan Stanley Capital International (MSCI) All Country World Index (ACWI) ex USA Index (Net) is a free-float-adjusted market-capitalization-weighted index that is designed to measure the equity market performance of developed and emerging markets, excluding the U.S. Source: MSCI. MSCI makes no express or implied warranties or representations and shall have no liability whatsoever with respect to any MSCI data contained herein. The MSCI data may not be further redistributed or used as a basis for other indices or any securities or financial products. This report is not approved, reviewed, or produced by MSCI. You cannot invest directly in an index. |
| 3 | The MSCI Emerging Markets (EM) Index (Net) is a free-float-adjusted market-capitalization-weighted index that is designed to measure the equity market performance of emerging markets. You cannot invest directly in an index. |
| 4 | The Bloomberg Barclays U.S. Aggregate Bond Index is a broad-based benchmark that measures the investment-grade, U.S.-dollar-denominated, fixed-rate taxable bond market, including Treasuries, government-related and corporate securities, mortgage-backed securities (agency fixed-rate and hybrid adjustable-rate mortgage pass-throughs), asset-backed securities, and commercial mortgage-backed securities. You cannot invest directly in an index. |
| 5 | The Bloomberg Barclays Global Aggregate ex-USD Index is an unmanaged index that provides a broad-based measure of the global investment-grade fixed-income markets excluding the U.S.-dollar-denominated debt market. You cannot invest directly in an index. |
| 6 | The Bloomberg Barclays Municipal Bond Index is an unmanaged index composed of long-term tax-exempt bonds with a minimum credit rating of Baa. You cannot invest directly in an index. |
| 7 | The ICE BofAML U.S. High Yield Index is a market-capitalization-weighted index of domestic and Yankee high-yield bonds. The index tracks the performance of high-yield securities traded in the U.S. bond market. You cannot invest directly in an index. Copyright 2019. ICE Data Indices, LLC. All rights reserved. |
| 8 | The Russell 2000® Index measures the performance of the 2,000 smallest companies in the Russell 3000® Index, which represents approximately 8% of the total market capitalization of the Russell 3000® Index. You cannot invest directly in an index. |
| | | | | | |
| Letter to shareholders (unaudited) | | Wells Fargo International Value Fund | | | 3 | |
Investors appeared to shake off lingering concerns during the third quarter.
Favorable third-quarter economic indicators and corporate earnings reports encouraged domestic stock investors. U.S. trade negotiations with Mexico and Canada progressed. The Conference Board Consumer Confidence Index®9 reached its highest level in 18 years during September 2018. The Fed raised the federal funds rate by 25 bps to a target range of between 2.00% and 2.25% in September. For the quarter that ended September 30, 2018, the S&P 500 Index added 7.71%.
Investors in international markets were not as confident. Tensions between the U.S. and China increased. The U.S. imposed $200 billion in tariffs on Chinese goods. China reacted with $60 billion in tariffs on U.S. goods. Economic growth in China caused concern. The Bank of England (BoE) raised its monetary policy rate to 0.75% in August 2018. During the quarter, the MSCI ACWI ex USA Index (Net) gained 0.71%. The MSCI EM Index (Net) declined 1.09%. In fixed-income markets, U.S. bonds were flat, as measured by the Bloomberg Barclays U.S. Aggregate Bond Index. The Bloomberg Barclays Global Aggregate ex-USD Index fell 1.74%.
Conflicting data unsettled markets during the fourth quarter.
November’s U.S. midterm elections shifted control of the House of Representatives from Republicans to Democrats, presaging potential partisan clashes. Third-quarter U.S. GDP was announced at an annualized 3.4% rate, lower than the second-quarter rate. Brexit efforts stalled ahead of the March 2019 deadline. The People’s Bank of China cut reserve requirement ratios, accelerated infrastructure spending, and cut taxes even as the value of the yuan declined to low levels last seen in 2008.
December’s S&P 500 Index performance was the worst since 1931. Globally,fixed-income investments fared better than stocks during the last two months of the year. The Fed increased the federal funds rate by 25 bps in December 2018 to a target range of between 2.25% and 2.50%.
The market climbs a wall of worry.
Investors entered 2019 with reasons to be concerned. A partial U.S. government shutdown driven by partisan policy disputes extended into January. Investment returns appeared to reaffirm the adage that markets climb a wall of worry. The S&P 500 Index gained 8.01% for the month of January, the best monthly performance in 30 years. Returns for the MSCI ACWI ex USA Index (Net), the Bloomberg Barclays U.S. Aggregate Bond Index, and the Bloomberg Barclays Global Aggregate ex-USD Index also were positive. The Fed indicated that it would pause its program of regular rate increases during 2019 as inflation remained low.
In February 2019, concerns over slowing global growth reemerged. The Bureau of Economic Analysis announced fourth-quarter 2018 GDP grew at an annualized 2.2% rate, down from levels of the prior two quarters. In a February report, the BoE forecast the slowest growth since the financial crisis for 2019. China and the U.S. continued to wrangle over trade issues.
By the end of March 2019, the combination of dovish Fed sentiment and consistent, if not spectacular, economic and business metrics reinforced investors’ confidence. Monthly job creation data regained momentum. Corporate profits, while lower than 2018’s lofty levels, remained solid. China announced a roughly $300 billion stimulus package through tax and fee cuts intended to reinvigorate economic growth.
December’s S&P 500 Index performance was the worst since 1931.
The S&P 500 Index gained 8.01% for the month of January, the best monthly performance in 30 years.
| 9 | The Conference Board Consumer Confidence Index® measures the degree of optimism on the state of the U.S. economy that consumers are expressing through their activities of saving and spending. You cannot invest directly in an index. |
| | | | |
| 4 | | Wells Fargo International Value Fund | | Letter to shareholders (unaudited) |
During April 2019, several broad-based U.S. equity indices reached or approached highs as investors drew confidence from favorable economic projections, sustained low inflation, and solid employment data. First-quarter GDP showed the economy grew at an annualized rate of 3.2% on improvement in business investment and exports. Favorable sentiment extended to foreign markets as the MSCI ACWI ex USA Index (Net) gained 2.64% and the MSCI EM Index (Net) added 2.11% for the month.
May 2019 presented investors with mixed signals in the economy, in the markets, and politically. In the U.S., partisan wrangling ramped up as Democrats and Republicans set their sights on 2020 presidential politics. In the U.K., the Brexit stalemate resulted in the resignation of Prime Minister Theresa May. The European Commission downgraded the 2019 growth forecast for the block of countries to 1.2%. The U.S. increased tariffs on products from China, China responded, and then talks broke down. Ending the month, equities, as measured by the MSCI ACWI (Net),10 dropped 5.93% while bonds, often considered a less risky investment, gained 1.04%, as measured by the Bloomberg Barclays Global Aggregate ex-USD Index.
Don’t let short-term uncertainty derail long-term investment goals.
Periods of investment uncertainty can present challenges, but experience has taught us that maintaining long-term investment goals can be an effective way to plan for the future. To help you create a sound strategy based on your personal goals and risk tolerance, Wells Fargo Funds offers more than 100 mutual funds spanning a wide range of asset classes and investment styles. Although diversification cannot guarantee an investment profit or prevent losses, we believe it can be an effective way to manage investment risk and potentially smooth out overall portfolio performance. We encourage investors to know their investments and to understand that appropriate levels of risk-taking may unlock opportunities.
Thank you for choosing to invest with Wells Fargo Funds. We appreciate your confidence in us and remain committed to helping you meet your financial needs.
Sincerely,

Andrew Owen
President
Wells Fargo Funds
For further information about your Fund, contact your investment professional, visit our website atwfam.com, or call us directly at1-800-222-8222.
| 10 | The MSCI ACWI (Net) is a free-float-adjusted market-capitalization-weighted index that is designed to measure the equity market performance of developed and emerging markets. You cannot invest directly in an index. |
This page is intentionally left blank.
| | | | |
| 6 | | Wells Fargo International Value Fund1 | | Performance highlights (unaudited) |
Investment objective
The Fund seeks long-term capital appreciation.
Manager
Wells Fargo Funds Management, LLC
Subadviser for the affiliated master portfolio
LSV Asset Management
Portfolio managers
Josef Lakonishok
Puneet Mansharamani, CFA®‡
Menno Vermeulen, CFA®‡
Average annual total returns (%) as of May 31, 2019
| | | | | | | | | | | | | | | | | | | | | | | | | | | | | | | | | | |
| | | | | Including sales charge | | | Excluding sales charge | | | Expense ratios2 (%) | |
| | | Inception date | | 1 year | | | 5 year | | | 10 year | | | 1 year | | | 5 year | | | 10 year | | | Gross | | | Net3 | |
| | | | | | | | | |
| Class A (WFFAX) | | 10-31-2003 | | | -16.51 | | | | -1.74 | | | | 4.02 | | | | -11.42 | | | | -0.57 | | | | 4.64 | | | | 1.35 | | | | 1.35 | |
| | | | | | | | | |
| Class C (WFVCX) | | 4-8-2005 | | | -13.10 | | | | -1.33 | | | | 3.84 | | | | -12.10 | | | | -1.33 | | | | 3.84 | | | | 2.10 | | | | 2.10 | |
| | | | | | | | | |
| Class R6 (WFRVX)4 | | 7-31-2018 | | | – | | | | – | | | | – | | | | -11.08 | | | | -0.21 | | | | 5.05 | | | | 0.92 | | | | 0.90 | |
| | | | | | | | | |
| Administrator Class (WFVDX) | | 4-8-2005 | | | – | | | | – | | | | – | | | | -11.33 | | | | -0.49 | | | | 4.80 | | | | 1.27 | | | | 1.25 | |
| | | | | | | | | |
| Institutional Class (WFVIX) | | 8-31-2006 | | | – | | | | – | | | | – | | | | -11.13 | | | | -0.22 | | | | 5.05 | | | | 1.02 | | | | 1.00 | |
| | | | | | | | | |
| MSCI EAFE Value Index (Net)5 | | – | | | – | | | | – | | | | – | | | | -8.23 | | | | -0.75 | | | | 4.85 | | | | – | | | | – | |
Figures quoted represent past performance, which is no guarantee of future results, and do not reflect taxes that a shareholder may pay on fund distributions or the redemption of fund shares. Investment return and principal value of an investment will fluctuate so that an investor’s shares, when redeemed, may be worth more or less than their original cost. Performance shown without sales charges would be lower if sales charges were reflected. Current performance may be lower or higher than the performance data quoted, which assumes the reinvestment of dividends and capital gains. Currentmonth-end performance is available on the Fund’s website, wfam.com.
Index returns do not include transaction costs associated with buying and selling securities, any mutual fund fees or expenses, or any taxes. It is not possible to invest directly in an index.
For Class A shares, the maximumfront-end sales charge is 5.75%. For Class C shares, the maximum contingent deferred sales charge is 1.00%. Performance including a contingent deferred sales charge assumes the sales charge for the corresponding time period. Class R6, Administrator Class, and Institutional Class shares are sold without afront-end sales charge or contingent deferred sales charge.
Stock values fluctuate in response to the activities of individual companies and general market and economic conditions. Foreign investments are especially volatile and can rise or fall dramatically due to differences in the political and economic conditions of the host country. These risks are generally intensified in emerging markets. The use of derivatives may reduce returns and/or increase volatility. Certain investment strategies tend to increase the total risk of an investment (relative to the broader market). The Fund is exposed to smaller-company securities risk. Consult the Fund’s prospectus for additional information on these and other risks.
Please see footnotes on page 7.
| | | | | | |
| Performance highlights (unaudited) | | Wells Fargo International Value Fund | | | 7 | |
|
| Growth of $10,000 investment as of May 31, 20196 |
|
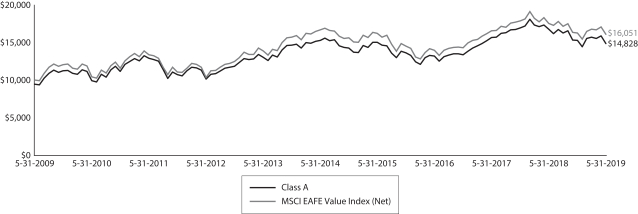 |
| ‡ | CFA® and Chartered Financial Analyst®are trademarks owned by CFA Institute. |
| 1 | The Fund is a gateway feeder fund that invests substantially all of its assets in a single affiliated master portfolio of the Wells Fargo Master Trust with a substantially identical investment objective and substantially similar investment strategies. References to the investment activities of the Fund are intended to refer to the investment activities of the affiliated master portfolio in which it invests. |
| 2 | Reflects the expense ratios as stated in the most recent prospectuses. The expense ratios shown are subject to change and may differ from the annualized expense ratios shown in the financial highlights of this report. |
| 3 | The manager has contractually committed through September 30, 2019, to waive fees and/or reimburse expenses to the extent necessary to cap the expenses of each class after fee waivers at the amounts shown. Brokerage commissions, stamp duty fees, interest, taxes, acquired fund fees and expenses (if any) from funds in which the affiliated master portfolio invests, and extraordinary expenses are excluded from the expense cap. Net expenses from the affiliated master portfolio are included in the expense cap. Prior to or after the commitment expiration date, the cap may be increased or the commitment to maintain the cap may be terminated only with the approval of the Board of Trustees. Without this cap, the Fund’s returns would have been lower. The expense ratio paid by an investor is the net expense ratio (the total annual fund operating expenses after fee waivers) as stated in the prospectuses. |
| 4 | Historical performance shown for the Class R6 shares prior to their inception reflects the performance of the Institutional Class shares, and is not adjusted to reflect Class R6 expenses. If these expenses had been included, returns for Class R6 shares would be higher. |
| 5 | The Morgan Stanley Capital International (MSCI) Europe, Australasia, Far East (EAFE) Value Index (Net) is a free-float-adjusted market capitalization-weighted index that is designed to measure the equity market performance of value securities within developed equity markets, excluding the U.S. and Canada. Source: MSCI. MSCI makes no express or implied warranties or representations and shall have no liability whatsoever with respect to any MSCI data contained herein. The MSCI data may not be further redistributed or used as a basis for other indices or any securities or financial products. This report is not approved, reviewed, or produced by MSCI. You cannot invest directly in an index. |
| 6 | The chart compares the performance of Class A shares for the most recent ten years with the MSCI EAFE Value Index (Net). The chart assumes a hypothetical $10,000 investment in Class A shares and reflects all operating expenses and assumes the maximum initial sales charge of 5.75%. |
| 7 | The MSCI EAFE Index (Net) is a free-float-adjusted market-capitalization-weighted index that is designed to measure the equity market performance of developed markets, excluding the U.S. and Canada. You cannot invest directly in an index. |
| 8 | The MSCI Emerging Markets (EM) Index (Net) is a free-float-adjusted market-capitalization-weighted index that is designed to measure large- andmid-cap equity market performance of emerging markets. You cannot invest directly in an index. |
| 9 | The ten largest holdings, excluding cash, cash equivalents and any money market funds, are calculated based on the value of the securities of the affiliated master portfolio allocable to the Fund divided by the total net assets of the Fund. Holdings are subject to change and may have changed since the date specified. |
| 10 | Amounts represent the sector distribution of the affiliated master portfolio which are calculated based on the total long-term investments of the affiliated master portfolio. These amounts are subject to change and may have changed since the date specified. |
| * | The security was no longer held at the end of the period. |
| | | | |
| 8 | | Wells Fargo International Value Fund | | Performance highlights (unaudited) |
MANAGER’S DISCUSSION
Fund highlights
| ∎ | | The Fund underperformed its benchmark, the MSCI EAFE Value Index (Net), for the12-month period that ended May 31, 2019. |
| ∎ | | The difficult environment for value stocks contributed to the underperformance given the Fund’s emphasis on deeper value stocks. The Fund’s underweight to utilities and overweight to consumer discretionary stocks relative to the benchmark also had a negative impact on results. While stock selection was strong in the consumer staples and financials sectors, this was offset by poor selection in the materials, industrials, and information technology (IT) sectors. |
| ∎ | | From a portfolio composition perspective, changes to sector exposures during the period included an increase in consumer staples and health care stocks and a decrease in materials and consumer discretionary stocks. The Fund is overweight the industrials, consumer staples, and health care sectors relative to the value benchmark and underweight the financials, utilities, and real estate sectors. |
International developed stock markets declined over the past 12 months.
International developed stock markets declined over the past 12 months, with the MSCI EAFE Index (Net)7 falling 5.75%. Value stocks trailed growth stocks in the period, as the MSCI EAFE Value Index (Net) declined 8.23%. Economically sensitive sectors including consumer discretionary, materials, and energy struggled over the past 12 months, while defensive sectors including utilities, consumer staples, and health care held up well in the down market. Emerging markets lagged developed markets over the reporting period, with the MSCI EM Index (Net)8 falling 8.70%, although value stocks held up better in emerging markets than in developed markets.
| | | | |
| Ten largest holdings (%) as of May 31, 20199 | |
| |
Roche Holding AG | | | 2.55 | |
| |
Royal Dutch Shell plc Class B | | | 2.16 | |
| |
Sanofi SA | | | 1.79 | |
| |
GlaxoSmithKline plc | | | 1.74 | |
| |
Total SA | | | 1.60 | |
| |
Nippon Telegraph & Telephone Corporation | | | 1.36 | |
| |
KDDI Corporation | | | 1.30 | |
| |
BP plc | | | 1.28 | |
| |
Swiss Life Holding AG | | | 1.03 | |
| |
Enel SpA | | | 0.99 | |
The difficult environment for value stocks contributed to the underperformance given the Fund’s emphasis on deeper value stocks. The Fund’s exposure to emerging markets also had a negative impact on results, as emerging markets lagged developed markets. However, stock selection within the emerging market portion of the portfolio added value. The Fund’s underweight to utilities and overweight to consumer discretionary stocks relative to the value benchmark also had a negative impact on results. While stock selection was strong in the consumer staples and financials sectors, this was offset by poor selection in the materials, industrials, and IT sectors.
Top-contributing positions included Swiss pharmaceutical company Roche Holding Limited AG, which advanced
nearly 30%, and financial holding Swiss Life Holding Limited, which was up nearly 40%. Emerging market holdings in Brazil and Russia added value, including Brazilian stocks JBS S.A., the largest meat processing company in the world; electric power company Companhia Energética de Minas Gerais SA (CEMIG)*; and Banco do Estado do Rio Grande do Sul, S.A. Russian oil and gas holdings LUKOIL PJSC and Gazprom Neft also added value. Underweights to Bayer AG and British American Tobacco plc* contributed positively in the period, as both stocks lagged. Detractors included German holdings Covestro AG in the materials sector and Leoni AG, a German manufacturing company in the consumer discretionary sector. Japanese holding Mitsubishi Gas Chemical Company, Incorporated, also detracted, while underweights to defensive stocks Novartis AG* and Nestle S.A.* in Switzerland, Commonwealth Bank of Australia*, and materials companies Rio Tinto Limited and BHP Billiton Limited* also had negative effects on results.
Please see footnotes on page 7.
| | | | | | |
| Performance highlights (unaudited) | | Wells Fargo International Value Fund | | | 9 | |
|
| Sector distribution as of May 31, 201910 |
|
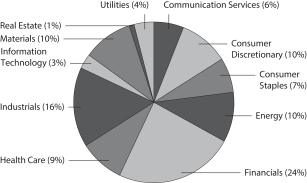 |
|
| Country allocation as of May 31, 201910 |
|
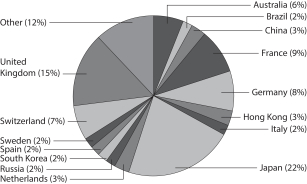 |
The most significant changes to sector exposures during the period included an increase in consumer staples and health care stocks and a decrease in materials and consumer discretionary stocks. The Fund initiated a position in Imperial Brands PLC*, a U.K.-based tobacco company and added to Korean tobacco holding KT&G Corporation. The Fund also increased its exposure to several food companies and supermarkets, including Loblaw Companies Limited, METRO AG, Tate & Lyle PLC, and Carrefour S.A. The Fund added to holdings Astellas Pharma Incorporated, Roche, Sanofi S.A., and Sawai Pharmaceutical Company Limited in the pharmaceuticals industry and is now overweight health care stocks.
The Fund reduced its overweight to the consumer discretionary sector and is now equal to the value benchmark. The Fund sold Aoyama Trading Company Limited and DCM Holdings Company Limited in Japan, Automotive Holdings Group Limited and Retail Food Group Limited in Australia, and Ceconomy AG in Germany. The Fund also reduced its exposure to the materials sector by selling Petra Diamonds Limited in the U.K., Sumitomo Osaka Cement Company Limited in Japan, and Norwegian chemical company Yara International ASA and trimming its exposure to German chemical holding BASF SE, which had done well.
The Fund is overweight the industrials, consumer staples, and health care sectors relative to the value benchmark and underweight the financials, utilities, and real estate sectors.
We believe that the Fund remains attractive based on valuation.
While the Fund has struggled given the difficult environment for deep value stocks recently, we believe it remains attractively positioned from a valuation standpoint. The Fund holds a diversified portfolio of high-quality companies that are generating strong cash flow and earnings, with many paying attractive dividends yet trading at extremely attractive prices.
Please see footnotes on page 7.
| | | | |
| 10 | | Wells Fargo International Value Fund | | Fund expenses (unaudited) |
As a shareholder of the Fund, you incur two types of costs: (1) transaction costs, including sales charges (loads) on purchase payments and contingent deferred sales charges (if any) on redemptions and (2) ongoing costs, including management fees, distribution(12b-1) and/or shareholder servicing fees, and other Fund expenses. This example is intended to help you understand your ongoing costs (in dollars) of investing in the Fund and to compare these costs with the ongoing costs of investing in other mutual funds.
The example is based on an investment of $1,000 invested at the beginning of thesix-month period and held for the entire period from December 1, 2018 to May 31, 2019.
Actual expenses
The “Actual” line of the table below provides information about actual account values and actual expenses. You may use the information in this line, together with the amount you invested, to estimate the expenses that you paid over the period. Simply divide your account value by $1,000 (for example, an $8,600 account value divided by $1,000 = 8.6), then multiply the result by the number in the “Actual” line under the heading entitled “Expenses paid during period” for your applicable class of shares to estimate the expenses you paid on your account during this period.
Hypothetical example for comparison purposes
The “Hypothetical” line of the table below provides information about hypothetical account values and hypothetical expenses based on the Fund’s actual expense ratio and an assumed rate of return of 5% per year before expenses, which is not the Fund’s actual return. The hypothetical account values and expenses may not be used to estimate the actual ending account balance or expenses you paid for the period. You may use this information to compare the ongoing costs of investing in the Fund and other funds. To do so, compare this 5% hypothetical example with the 5% hypothetical examples that appear in the shareholder reports of the other funds.
Please note that the expenses shown in the table are meant to highlight your ongoing costs only and do not reflect any transactional costs, such as sales charges (loads) and contingent deferred sales charges. Therefore, the “Hypothetical” line of the table is useful in comparing ongoing costs only and will not help you determine the relative total costs of owning different funds. In addition, if these transactional costs were included, your costs would have been higher.
| | | | | | | | | | | | | | | | |
| | | Beginning account value 12-1-2018 | | | Ending account value 5-31-2019 | | | Expenses paid during the period1,2 | | | Annualized net expense ratio1 | |
Class A | | | | | | | | | | | | | | | | |
| | | | |
Actual | | $ | 1,000.00 | | | $ | 973.31 | | | $ | 6.62 | | | | 1.34 | % |
| | | | |
Hypothetical (5% return before expenses) | | $ | 1,000.00 | | | $ | 1,018.23 | | | $ | 6.77 | | | | 1.34 | % |
Class C | | | | | | | | | | | | | | | | |
| | | | |
Actual | | $ | 1,000.00 | | | $ | 969.28 | | | $ | 10.27 | | | | 2.09 | % |
| | | | |
Hypothetical (5% return before expenses) | | $ | 1,000.00 | | | $ | 1,014.50 | | | $ | 10.51 | | | | 2.09 | % |
Class R6 | | | | | | | | | | | | | | | | |
| | | | |
Actual | | $ | 1,000.00 | | | $ | 974.80 | | | $ | 4.43 | | | | 0.90 | % |
| | | | |
Hypothetical (5% return before expenses) | | $ | 1,000.00 | | | $ | 1,020.45 | | | $ | 4.53 | | | | 0.90 | % |
Administrator Class | | | | | | | | | | | | | | | | |
| | | | |
Actual | | $ | 1,000.00 | | | $ | 973.82 | | | $ | 6.15 | | | | 1.25 | % |
| | | | |
Hypothetical (5% return before expenses) | | $ | 1,000.00 | | | $ | 1,018.70 | | | $ | 6.29 | | | | 1.25 | % |
Institutional Class | | | | | | | | | | | | | | | | |
| | | | |
Actual | | $ | 1,000.00 | | | $ | 975.03 | | | $ | 4.92 | | | | 1.00 | % |
| | | | |
Hypothetical (5% return before expenses) | | $ | 1,000.00 | | | $ | 1,019.95 | | | $ | 5.03 | | | | 1.00 | % |
| 1 | Amounts reflect net expenses allocated from the affiliated Master Portfolio in which the Fund invests. |
| 2 | Expenses paid is equal to the annualized net expense ratio of each class multiplied by the average account value over the period, multiplied by the number of days in the most recent fiscal half-year divided by the number of days in the fiscal year (to reflect theone-half-year period). |
| | | | | | |
| Portfolio of investments—May 31, 2019 | | Wells Fargo International Value Fund | | | 11 | |
| | | | | | | | | | | | | | | | |
| Security name | | | | | | | | | | | Value | |
| | | | | | | | | | | | | | | | |
| | | |
Investment Companies: 99.75% | | | | | | | | | | | | | |
| | | |
| Affiliated Master Portfolio: 99.75% | | | | | | | | | | | | | |
| | | | |
Wells Fargo International Value Portfolio | | | | | | | | | | | | | | $ | 846,306,646 | |
| | | | | | | | | | | | | | | | |
| | | |
Total Investment Companies (Cost $911,697,342) | | | | | | | | | | | | 846,306,646 | |
| | | | | | | | | | | | | | | | |
| | | | | | | | |
| Total investments in securities (Cost $911,697,342) | | | 99.75 | % | | | 846,306,646 | |
| | |
Other assets and liabilities, net | | | 0.25 | | | | 2,083,567 | |
| | | | | | | | |
| Total net assets | | | 100.00 | % | | $ | 848,390,213 | |
| | | | | | | | |
Transactions with the affiliated Master Portfolio were as follows:
| | | | | | | | | | | | | | | | | | | | | | | | | | | | | | | | |
| | | % of
ownership,
beginning of
period | | | % of
ownership,
end of
period | | | Net realized
gains
(losses) on
securities
transactions
allocated
from
affiliated
Master
Portfolio | | | Net
change in
unrealized
gains
(losses) on
securities
transactions
allocated
from
affiliated
Master
Portfolio | | | Dividends
allocated
from
affiliated
Master
Portfolio | | | Affiliated
income
allocated
from
affiliated
Master
Portfolio | | | Value,
end
of period | | | % of
net
assets | |
Wells Fargo International Value Portfolio | | | 95 | % | | | 79 | % | | $ | (1,507,425 | ) | | $ | (128,322,670 | ) | | $ | 37,136,085 | | | $ | 1,334,691 | | | $ | 846,306,646 | | | | 99.75 | % |
The accompanying notes are an integral part of these financial statements.
| | | | |
| 12 | | Wells Fargo International Value Fund | | Statement of assets and liabilities—May 31, 2019 |
| | | | |
| | | | |
| |
Assets | | | | |
Investments in affiliated Master Portfolio, at value (cost $911,697,342) | | $ | 846,306,646 | |
Receivable for Fund shares sold | | | 10,063,771 | |
Prepaid expenses and other assets | | | 386,596 | |
| | | | |
Total assets | | | 856,757,013 | |
| | | | |
| |
Liabilities | | | | |
Payable for Fund shares redeemed | | | 8,200,978 | |
Administration fees payable | | | 106,325 | |
Custody and accounting fee | | | 30,560 | |
Shareholder serving fee | | | 15,527 | |
Management fee payable | | | 12,922 | |
Distribution fee payable | | | 488 | |
| | | | |
Total liabilities | | | 8,366,800 | |
| | | | |
Total net assets | | $ | 848,390,213 | |
| | | | |
| |
NET ASSETS CONSIST OF | | | | |
Paid-in capital | | $ | 900,986,185 | |
Total distributable loss | | | (52,595,972 | ) |
| | | | |
Total net assets | | $ | 848,390,213 | |
| | | | |
| |
COMPUTATION OF NET ASSET VALUE AND OFFERING PRICE PER SHARE | | | | |
Net assets – Class A | | $ | 57,427,156 | |
Shares outstanding – Class A1 | | | 4,238,135 | |
Net asset value per share – Class A | | | $13.55 | |
Maximum offering price per share – Class A2 | | | $14.38 | |
Net assets – Class C | | $ | 675,283 | |
Shares outstanding – Class C1 | | | 51,152 | |
Net asset value per share – Class C | | | $13.20 | |
Net assets – Class R6 | | $ | 328,788 | |
Shares outstanding – Class R61 | | | 24,557 | |
Net asset value per share – Class R6 | | | $13.39 | |
Net assets – Administrator Class | | $ | 3,375,132 | |
Shares outstanding – Administrator Class1 | | | 247,083 | |
Net asset value per share – Administrator Class | | | $13.66 | |
Net assets – Institutional Class | | $ | 786,583,854 | |
Shares outstanding – Institutional Class1 | | | 58,735,894 | |
Net asset value per share – Institutional Class | | | $13.39 | |
| 1 | The Fund has an unlimited number of authorized shares. |
| 2 | Maximum offering price is computed as 100/94.25 of net asset value. On investments of $50,000 or more, the offering price is reduced. |
The accompanying notes are an integral part of these financial statements.
| | | | | | |
| Statement of operations—year ended May 31, 2019 | | Wells Fargo International Value Fund | | | 13 | |
| | | | |
| | | | |
| |
Investment income | | | | |
Dividends allocated from affiliated Master Portfolio (net of foreign withholding taxes of $5,178,150) | | $ | 37,136,085 | |
Affiliated income allocated from affiliated Master Portfolio | | | 1,334,691 | |
Expenses allocated from affiliated Master Portfolio | | | (7,016,491 | ) |
| | | | |
Total investment income | | | 31,454,285 | |
| | | | |
| |
Expenses | | | | |
Management fee | | | 441,541 | |
Administration fees | |
Class A | | | 117,503 | |
Class C | | | 2,121 | |
Class R6 | | | 17 | 1 |
Administrator Class | | | 5,273 | |
Institutional Class | | | 1,068,609 | |
Shareholder servicing fees | |
Class A | | | 139,885 | |
Class C | | | 2,525 | |
Administrator Class | | | 10,139 | |
Distribution fee | |
Class C | | | 7,573 | |
Custody and accounting fees | | | 26,072 | |
Professional fees | | | 31,123 | |
Registration fees | | | 104,723 | |
Shareholder report expenses | | | 99,819 | |
Trustees’ fees and expenses | | | 20,993 | |
Other fees and expenses | | | 16,232 | |
| | | | |
Total expenses | | | 2,094,148 | |
Less: Fee waivers and/or expense reimbursements | | | (113,975 | ) |
| | | | |
Net expenses | | | 1,980,173 | |
| | | | |
Net investment income | | | 29,474,112 | |
| | | | |
| |
REALIZED AND UNREALIZED GAINS (LOSSES) ON INVESTMENTS | | | | |
Net realized losses on securities transactions allocated from affiliated Master Portfolio | | | (1,507,425 | ) |
Net change in unrealized gains (losses) on securities transactions allocated from affiliated Master Portfolio | | | (128,322,670 | ) |
| | | | |
Net realized and unrealized gains (losses) on investments | | | (129,830,095 | ) |
| | | | |
Net decrease in net assets resulting from operations | | $ | (100,355,983 | ) |
| | | | |
| 1 | For the period from July 31, 2018 (commencement of class operations) to May 31, 2019 |
The accompanying notes are an integral part of these financial statements.
| | | | |
| 14 | | Wells Fargo International Value Fund | | Statement of changes in net assets |
| | | | | | | | | | | | | | | | |
| | | Year ended
May 31, 2019 | | | Year ended
May 31, 20181 | |
| | | | |
Operations | | | | | | | | | | | | | | | | |
Net investment income | | | | | | $ | 29,474,112 | | | | | | | $ | 19,745,024 | |
Net realized gains (losses) on investments | | | | | | | (1,507,425 | ) | | | | | | | 14,310,484 | |
Net change in unrealized gains (losses) on investments | | | | | | | (128,322,670 | ) | | | | | | | 21,273,653 | |
| | | | |
Net increase (decrease) in net assets resulting from operations | | | | | | | (100,355,983 | ) | | | | | | | 55,329,161 | |
| | | | |
| | | | |
Distributions to shareholders from net investment income and net realized gains | | | | | | | | | | | | | | | | |
Class A | | | | | | | (1,313,945 | ) | | | | | | | (53,028 | ) |
Class C | | | | | | | (14,168 | ) | | | | | | | (19,938 | ) |
Class R6 | | | | | | | (596 | )2 | | | | | | | N/A | |
Administrator Class | | | | | | | (77,201 | ) | | | | | | | (104,265 | ) |
Institutional Class | | | | | | | (20,194,351 | ) | | | | | | | (22,325,915 | ) |
| | | | |
Total distributions to shareholders | | | | | | | (21,600,261 | ) | | | | | | | (22,503,146 | ) |
| | | | |
| | | | |
Capital share transactions | | | Shares | | | | | | | | Shares | | | | | |
Proceeds from shares sold | | | | | | | | | | | | | | | | |
Class A | | | 3,672,486 | | | | 53,518,580 | | | | 2,633,442 | | | | 42,441,930 | |
Class C | | | 16,692 | | | | 242,225 | | | | 31,890 | | | | 496,381 | |
Class R6 | | | 24,567 | 2 | | | 344,146 | 2 | | | N/A | | | | N/A | |
Administrator Class | | | 32,361 | | | | 477,105 | | | | 150,614 | | | | 2,424,464 | |
Institutional Class | | | 18,526,386 | | | | 265,263,060 | | | | 18,051,179 | | | | 284,422,225 | |
| | | | |
| | | | |
| | | | | | | 319,845,116 | | | | | | | | 329,785,000 | |
| | | | |
Reinvestment of distributions | | | | | | | | | | | | | | | | |
Class A | | | 100,957 | | | | 1,313,445 | | | | 3,299 | | | | 52,993 | |
Class C | | | 1,114 | | | | 14,168 | | | | 1,271 | | | | 19,890 | |
Administrator Class | | | 5,827 | | | | 76,387 | | | | 6,369 | | | | 102,738 | |
Institutional Class | | | 1,565,162 | | | | 20,081,032 | | | | 1,408,571 | | | | 22,297,672 | |
| | | | |
| | | | |
| | | | | | | 21,485,032 | | | | | | | | 22,473,293 | |
| | | | |
Payment for shares redeemed | | | | | | | | | | | | | | | | |
Class A | | | (2,002,351 | ) | | | (28,345,901 | ) | | | (342,547 | ) | | | (5,580,817 | ) |
Class C | | | (41,168 | ) | | | (575,161 | ) | | | (15,622 | ) | | | (244,651 | ) |
Class R6 | | | (10 | )2 | | | (134 | )2 | | | N/A | | | | N/A | |
Administrator Class | | | (169,343 | ) | | | (2,557,464 | ) | | | (138,280 | ) | | | (2,200,897 | ) |
Institutional Class | | | (14,671,752 | ) | | | (210,525,992 | ) | | | (14,341,542 | ) | | | (228,026,971 | ) |
| | | | |
| | | | |
| | | | | | | (242,004,652 | ) | | | | | | | (236,053,336 | ) |
| | | | |
Net increase in net assets resulting from capital share transactions | | | | | | | 99,325,496 | | | | | | | | 116,204,957 | |
| | | | |
Total increase (decrease) in net assets | | | | | | | (22,630,748 | ) | | | | | | | 149,030,972 | |
| | | | |
| | | | |
Net assets | | | | | | | | | | | | | | | | |
Beginning of period | | | | | | | 871,020,961 | | | | | | | | 721,989,989 | |
| | | | |
End of period | | | | | | $ | 848,390,213 | | | | | | | $ | 871,020,961 | |
| | | | |
| 1 | Effective for all filings after November 4, 2018, the SEC prospectively eliminated the requirement to parenthetically disclose undistributed net investment income at the end of the period and permitted the aggregation of distributions, with the exception of tax basis returns of capital. Undistributed net investment income at May 31, 2018 was $9,444,288. The disaggregated distributions information for the year ended May 31, 2018 is included in Note 7,Distributions to Shareholders, in the notes to the financial statements. |
| 2 | For the period from July 31, 2018 (commencement of class operations) to May 31, 2019 |
The accompanying notes are an integral part of these financial statements.
| | | | | | |
| Financial highlights | | Wells Fargo International Value Fund | | | 15 | |
(For a share outstanding throughout each period)
| | | | | | | | | | | | | | | | | | | | |
| | | Year ended May 31 | |
| CLASS A | | 2019 | | | 2018 | | | 2017 | | | 2016 | | | 2015 | |
Net asset value, beginning of period | | | $15.68 | | | | $14.88 | | | | $12.83 | | | | $14.85 | | | | $15.45 | |
Net investment income | | | 0.47 | 1 | | | 0.72 | 1 | | | 0.09 | 1 | | | 0.26 | | | | 0.26 | 1 |
Net realized and unrealized gains (losses) on investments | | | (2.27 | ) | | | 0.35 | | | | 2.26 | | | | (2.08 | ) | | | (0.53 | ) |
| | | | | | | | | | | | | | | | | | | | |
Total from investment operations | | | (1.80 | ) | | | 1.07 | | | | 2.35 | | | | (1.82 | ) | | | (0.27 | ) |
Distributions to shareholders from | | | | | | | | | | | | | | | | | | | | |
Net investment income | | | (0.33 | ) | | | (0.27 | ) | | | (0.30 | ) | | | (0.20 | ) | | | (0.33 | ) |
Net asset value, end of period | | | $13.55 | | | | $15.68 | | | | $14.88 | | | | $12.83 | | | | $14.85 | |
Total return2 | | | (11.42 | )% | | | 7.12 | % | | | 18.65 | % | | | (12.31 | )% | | | (1.55 | )% |
Ratios to average net assets (annualized) | | | | | | | | | | | | | | | | | | | | |
Gross expenses3 | | | 1.34 | % | | | 1.34 | % | | | 1.39 | % | | | 1.46 | % | | | 1.50 | % |
Net expenses3 | | | 1.33 | % | | | 1.34 | % | | | 1.35 | % | | | 1.39 | % | | | 1.49 | % |
Net investment income3 | | | 3.22 | % | | | 4.48 | % | | | 0.69 | % | | | 1.98 | % | | | 1.80 | % |
Supplemental data | | | | | | | | | | | | | | | | | | | | |
Portfolio turnover rate4 | | | 13 | % | | | 15 | % | | | 41 | % | | | 14 | % | | | 18 | % |
Net assets, end of period (000s omitted) | | | $57,427 | | | | $38,677 | | | | $2,571 | | | | $4,981 | | | | $5,768 | |
| 1 | Calculated based upon average shares outstanding |
| 2 | Total return calculations do not include any sales charges. |
| 3 | Ratios include net expenses allocated from the affiliated Master Portfolio which were as follows: |
| | | | |
Year ended May 31, 2019 | | | 0.80 | % |
Year ended May 31, 2018 | | | 0.81 | % |
Year ended May 31, 2017 | | | 0.85 | % |
Year ended May 31, 2016 | | | 0.91 | % |
Year ended May 31, 2015 | | | 0.91 | % |
| 4 | Portfolio turnover rate is calculated by multiplying the affiliated Master Portfolio’s percentage of the Fund’s total investments in securities at the end of the period by the affiliated Master Portfolio’s portfolio turnover rate. |
The accompanying notes are an integral part of these financial statements.
| | | | |
| 16 | | Wells Fargo International Value Fund | | Financial highlights |
(For a share outstanding throughout each period)
| | | | | | | | | | | | | | | | | | | | |
| | | Year ended May 31 | |
| CLASS C | | 2019 | | | 2018 | | | 2017 | | | 2016 | | | 2015 | |
Net asset value, beginning of period | | | $15.24 | | | | $14.60 | | | | $12.56 | | | | $14.54 | | | | $15.16 | |
Net investment income | | | 0.36 | | | | 0.21 | | | | 0.23 | | | | 0.17 | | | | 0.13 | |
Net realized and unrealized gains (losses) on investments | | | (2.21 | ) | | | 0.73 | | | | 1.97 | | | | (2.05 | ) | | | (0.51 | ) |
| | | | | | | | | | | | | | | | | | | | |
Total from investment operations | | | (1.85 | ) | | | 0.94 | | | | 2.20 | | | | (1.88 | ) | | | (0.38 | ) |
Distributions to shareholders from | | | | | | | | | | | | | | | | | | | | |
Net investment income | | | (0.19 | ) | | | (0.30 | ) | | | (0.16 | ) | | | (0.10 | ) | | | (0.24 | ) |
Net asset value, end of period | | | $13.20 | | | | $15.24 | | | | $14.60 | | | | $12.56 | | | | $14.54 | |
Total return1 | | | (12.10 | )% | | | 6.36 | % | | | 17.69 | % | | | (12.95 | )% | | | (2.37 | )% |
Ratios to average net assets (annualized) | | | | | | | | | | | | | | | | | | | | |
Gross expenses2 | | | 2.08 | % | | | 2.10 | % | | | 2.16 | % | | | 2.21 | % | | | 2.25 | % |
Net expenses2 | | | 2.08 | % | | | 2.10 | % | | | 2.10 | % | | | 2.14 | % | | | 2.24 | % |
Net investment income2 | | | 1.92 | % | | | 1.40 | % | | | 1.57 | % | | | 1.25 | % | | | 1.07 | % |
Supplemental data | | | | | | | | | | | | | | | | | | | | |
Portfolio turnover rate3 | | | 13 | % | | | 15 | % | | | 41 | % | | | 14 | % | | | 18 | % |
Net assets, end of period (000s omitted) | | | $675 | | | | $1,135 | | | | $832 | | | | $783 | | | | $920 | |
| 1 | Total return calculations do not include any sales charges. |
| 2 | Ratios include net expenses allocated from the affiliated Master Portfolio which were as follows: |
| | | | |
Year ended May 31, 2019 | | | 0.79 | % |
Year ended May 31, 2018 | | | 0.82 | % |
Year ended May 31, 2017 | | | 0.87 | % |
Year ended May 31, 2016 | | | 0.91 | % |
Year ended May 31, 2015 | | | 0.91 | % |
| 3 | Portfolio turnover rate is calculated by multiplying the affiliated Master Portfolio’s percentage of the Fund’s total investments in securities at the end of the period by the affiliated Master Portfolio’s portfolio turnover rate. |
The accompanying notes are an integral part of these financial statements.
| | | | | | |
| Financial highlights | | Wells Fargo International Value Fund | | | 17 | |
(For a share outstanding throughout the period)
| | | | |
| CLASS R6 | | Year ended
May 31, 20191 | |
Net asset value, beginning of period | | | $15.44 | |
Net investment income | | | 0.51 | |
Net realized and unrealized gains (losses) on investments | | | (2.19 | ) |
| | | | |
Total from investment operations | | | (1.68 | ) |
Distributions to shareholders from | | | | |
Net investment income | | | (0.37 | ) |
Net asset value, end of period | | | $13.39 | |
Total return2 | | | (10.85 | )% |
Ratios to average net assets (annualized) | | | | |
Gross expenses3 | | | 0.92 | % |
Net expenses3 | | | 0.89 | % |
Net investment income3 | | | 7.19 | % |
Supplemental data | | | | |
Portfolio turnover rate4 | | | 13 | % |
Net assets, end of period (000s omitted) | | | $329 | |
| 1 | For the period from July 31, 2018 (commencement of class operations) to May 31, 2019 |
| 2 | Returns for periods of less than one year are not annualized. |
| 3 | Ratios include net expenses allocated from the affiliated Master Portfolio in the amount of 0.79%. |
| 4 | Portfolio turnover rate is calculated by multiplying the affiliated Master Portfolio’s percentage of the Fund’s total investments in securities at the end of the period by the affiliated Master Portfolio’s portfolio turnover rate. |
The accompanying notes are an integral part of these financial statements.
| | | | |
| 18 | | Wells Fargo International Value Fund | | Financial highlights |
(For a share outstanding throughout each period)
| | | | | | | | | | | | | | | | | | | | |
| | | Year ended May 31 | |
| ADMINISTRATOR CLASS | | 2019 | | | 2018 | | | 2017 | | | 2016 | | | 2015 | |
Net asset value, beginning of period | | | $15.76 | | | | $15.04 | | | | $12.91 | | | | $14.73 | | | | $15.35 | |
Net investment income | | | 0.43 | 1 | | | 0.37 | 1 | | | 0.33 | 1 | | | 0.14 | 1 | | | 0.28 | |
Net realized and unrealized gains (losses) on investments | | | (2.23 | ) | | | 0.73 | | | | 2.05 | | | | (1.96 | ) | | | (0.52 | ) |
| | | | | | | | | | | | | | | | | | | | |
Total from investment operations | | | (1.80 | ) | | | 1.10 | | | | 2.38 | | | | (1.82 | ) | | | (0.24 | ) |
Distributions to shareholders from | | | | | | | | | | | | | | | | | | | | |
Net investment income | | | (0.30 | ) | | | (0.38 | ) | | | (0.25 | ) | | | 0.00 | | | | (0.38 | ) |
Net asset value, end of period | | | $13.66 | | | | $15.76 | | | | $15.04 | | | | $12.91 | | | | $14.73 | |
Total return | | | (11.33 | )% | | | 7.25 | % | | | 18.66 | % | | | (12.36 | )% | | | (1.35 | )% |
Ratios to average net assets (annualized) | | | | | | | | | | | | | | | | | | | | |
Gross expenses2 | | | 1.25 | % | | | 1.27 | % | | | 1.33 | % | | | 1.36 | % | | | 1.34 | % |
Net expenses2 | | | 1.24 | % | | | 1.25 | % | | | 1.25 | % | | | 1.25 | % | | | 1.25 | % |
Net investment income2 | | | 2.92 | % | | | 2.30 | % | | | 2.46 | % | | | 0.99 | % | | | 2.12 | % |
Supplemental data | | | | | | | | | | | | | | | | | | | | |
Portfolio turnover rate3 | | | 13 | % | | | 15 | % | | | 41 | % | | | 14 | % | | | 18 | % |
Net assets, end of period (000s omitted) | | | $3,375 | | | | $5,961 | | | | $5,407 | | | | $11,873 | | | | $487,582 | |
| 1 | Calculated based upon average shares outstanding |
| 2 | Ratios include net expenses allocated from the affiliated Master Portfolio which were as follows: |
| | | | |
Year ended May 31, 2019 | | | 0.79 | % |
Year ended May 31, 2018 | | | 0.82 | % |
Year ended May 31, 2017 | | | 0.87 | % |
Year ended May 31, 2016 | | | 0.91 | % |
Year ended May 31, 2015 | | | 0.91 | % |
| 3 | Portfolio turnover rate is calculated by multiplying the affiliated Master Portfolio’s percentage of the Fund’s total investments in securities at the end of the period by the affiliated Master Portfolio’s portfolio turnover rate. |
The accompanying notes are an integral part of these financial statements.
| | | | | | |
| Financial highlights | | Wells Fargo International Value Fund | | | 19 | |
(For a share outstanding throughout each period)
| | | | | | | | | | | | | | | | | | | | |
| | | Year ended May 31 | |
| INSTITUTIONAL CLASS | | 2019 | | | 2018 | | | 2017 | | | 2016 | | | 2015 | |
Net asset value, beginning of period | | | $15.48 | | | | $14.80 | | | | $12.73 | | | | $14.75 | | | | $15.38 | |
Net investment income | | | 0.48 | 1 | | | 0.41 | | | | 0.39 | | | | 0.36 | | | | 0.29 | |
Net realized and unrealized gains (losses) on investments | | | (2.22 | ) | | | 0.71 | | | | 1.99 | | | | (2.12 | ) | | | (0.51 | ) |
| | | | | | | | | | | | | | | | | | | | |
Total from investment operations | | | (1.74 | ) | | | 1.12 | | | | 2.38 | | | | (1.76 | ) | | | (0.22 | ) |
Distributions to shareholders from | | | | | | | | | | | | | | | | | | | | |
Net investment income | | | (0.35 | ) | | | (0.44 | ) | | | (0.31 | ) | | | (0.26 | ) | | | (0.41 | ) |
Net asset value, end of period | | | $13.39 | | | | $15.48 | | | | $14.80 | | | | $12.73 | | | | $14.75 | |
Total return | | | (11.13 | )% | | | 7.51 | % | | | 19.04 | % | | | (11.98 | )% | | | (1.19 | )% |
Ratios to average net assets (annualized) | | | | | | | | | | | | | | | | | | | | |
Gross expenses2 | | | 1.01 | % | | | 1.02 | % | | | 1.07 | % | | | 1.13 | % | | | 1.07 | % |
Net expenses2 | | | 0.99 | % | | | 1.00 | % | | | 1.00 | % | | | 1.00 | % | | | 1.05 | % |
Net investment income2 | | | 3.35 | % | | | 2.43 | % | | | 2.95 | % | | | 2.81 | % | | | 2.42 | % |
Supplemental data | | | | | | | | | | | | | | | | | | | | |
Portfolio turnover rate3 | | | 13 | % | | | 15 | % | | | 41 | % | | | 14 | % | | | 18 | % |
Net assets, end of period (000s omitted) | | | $786,584 | | | | $825,247 | | | | $713,180 | | | | $456,239 | | | | $3,793 | |
| 1 | Calculated based upon average shares outstanding |
| 2 | Ratios include net expenses allocated from the affiliated Master Portfolio which were as follows: |
| | | | |
Year ended May 31, 2019 | | | 0.79 | % |
Year ended May 31, 2018 | | | 0.82 | % |
Year ended May 31, 2017 | | | 0.86 | % |
Year ended May 31, 2016 | | | 0.91 | % |
Year ended May 31, 2015 | | | 0.91 | % |
| 3 | Portfolio turnover rate is calculated by multiplying the affiliated Master Portfolio’s percentage of the Fund’s total investments in securities at the end of the period by the affiliated Master Portfolio’s portfolio turnover rate. |
The accompanying notes are an integral part of these financial statements.
| | | | |
| 20 | | Wells Fargo International Value Fund | | Notes to financial statements |
1. ORGANIZATION
Wells Fargo Funds Trust (the “Trust”), a Delaware statutory trust organized on March 10, 1999, is anopen-end management investment company registered under the Investment Company Act of 1940, as amended (the “1940 Act”). As an investment company, the Trust follows the accounting and reporting guidance in Financial Accounting Standards Board (“FASB”)Accounting Standards Codification Topic 946, Financial Services – Investment Companies. These financial statements report on the Wells Fargo International Value Fund (the “Fund”) which is a diversified series of the Trust.
The Fund is a feeder fund in a master-feeder structure that invests substantially all of its assets in a single master portfolio with a substantially identical investment objective and substantially similar investment strategies. The Fund seeks to achieve its investment objective by investing substantially all of its assets in a separate diversified portfolio (the “affiliated Master Portfolio”) of Wells Fargo Master Trust, a registeredopen-end management investment company. The affiliated Master Portfolio directly acquires portfolio securities and the Fund acquires an indirect interest in those securities. The Fund accounts for its investment in the affiliated Master Portfolio as a partnership investment and records on a daily basis its share of the affiliated Master Portfolio’s income, expense and realized and unrealized gains and losses. The financial statements of the affiliated Master Portfolio for the year ended May 31, 2019 are included in this report and should be read in conjunction with the Fund’s financial statements. As of May 31, 2019, the Fund owned 79% of Wells Fargo International Value Portfolio.
2. SIGNIFICANT ACCOUNTING POLICIES
The following significant accounting policies, which are consistently followed in the preparation of the financial statements of the Fund, are in conformity with U.S. generally accepted accounting principles which require management to make estimates and assumptions that affect the reported amounts of assets and liabilities, disclosure of contingent assets and liabilities at the date of the financial statements, and the reported amounts of revenues and expenses during the reporting period. Actual results could differ from those estimates.
Securities valuation
All investments are valued each business day as of the close of regular trading on the New York Stock Exchange (generally 4 p.m. Eastern Time), although the Fund may deviate from this calculation time under unusual or unexpected circumstances.
Investments in the affiliated Master Portfolio are valued daily based on the Fund’s proportionate share of the affiliated Master Portfolio’s net assets, which are also valued daily. Securities held in the affiliated Master Portfolio are valued as discussed in the Notes to Financial Statements of the affiliated Master Portfolio, which are included elsewhere in this report.
Investment transactions, income and expenses
Investments in the affiliated Master Portfolio are recorded on a trade basis. The Fund records daily its proportionate share of the affiliated Master Portfolio’s dividend income, expenses and realized and unrealized gains or losses. The Fund also accrues its own expenses.
Distributions to shareholders
Distributions to shareholders are recorded on the ex-dividend date and paid from net investment income quarterly and any net realized gains are paid at least annually. Such distributions are determined in accordance with income tax regulations and may differ from U.S. generally accepted accounting principles. Dividend sources are estimated at the time of declaration. The tax character of distributions is determined as of the Fund’s fiscal year end. Therefore, a portion of the Fund’s distributions made prior to the Fund’s fiscal year end may be categorized as a tax return of capital at year end.
Federal and other taxes
The Fund intends to continue to qualify as a regulated investment company by distributing substantially all of its investment company taxable income and any net realized capital gains (after reduction for capital loss carryforwards) sufficient to relieve it from all, or substantially all, federal income taxes. Accordingly, no provision for federal income taxes was required.
The Fund’s income and federal excise tax returns and all financial records supporting those returns for the prior three fiscal years are subject to examination by the federal and Delaware revenue authorities. Management has analyzed the Fund’s tax positions taken on federal, state, and foreign tax returns for all open tax years and does not believe that there are any uncertain tax positions that require recognition of a tax liability.
As of May 31, 2019, the aggregate cost of all investments for federal income tax purposes was $915,995,508 and the unrealized gains (losses) consisted of:
| | | | |
| |
Gross unrealized gains | | $ | 0 | |
| |
Gross unrealized losses | | | (69,688,862 | ) |
| |
Net unrealized losses | | $ | (69,688,862 | ) |
| | | | | | |
| Notes to financial statements | | Wells Fargo International Value Fund | | | 21 | |
Reclassifications are made to the Fund’s capital accounts for permanent tax differences to reflect income and gains available for distribution (or available capital loss carryforwards) under federal income tax regulations. U.S. generally accepted accounting principles require that certain components of net assets be adjusted to reflect permanent differences between financial and tax reporting. These reclassifications have no effect on net assets or net asset values per share. The primary permanent difference causing such reclassification is due to expiration of capital loss carryforwards. At May 31, 2019, as a result of permanentbook-to-tax differences, the following reclassification adjustments were made on the Statement of Assets and Liabilities:
| | |
| Paid-in capital | | Total distributable
loss |
| |
| $(4,561,591) | | $4,561,591 |
As of May 31, 2019, the Fund had capital loss carryforwards which consist of $873,586 in short-term capital losses and $2,121,084 in long-term capital losses.
Class allocations
The separate classes of shares offered by the Fund differ principally in applicable sales charges, distribution, shareholder servicing, and administration fees. Class specific expenses are charged directly to that share class. Investment income, common expenses, and realized and unrealized gains (losses) on investments are allocated daily to each class of shares based on the relative proportion of net assets of each class.
3. FAIR VALUATION MEASUREMENTS
At May 31, 2019, the affiliated Master Portfolio was measured at fair value using the net asset value per share (or its equivalent) as a practical expedient. The investment objective and the value of the affiliate Master Portfolio was as follows:
| | | | | | |
| | |
| Affiliated Master Portfolio | | Investment objective | | Value of
affiliated Master
Portfolio | |
Wells Fargo International Value Portfolio | | Seek long-term capital appreciation | | | $846,306,646 | |
The affiliated Master Portfolio does not have a redemption period notice, can be redeemed daily and does not have any unfunded commitments.
4. TRANSACTIONS WITH AFFILIATES
Management fee
Wells Fargo Funds Management, LLC (“Funds Management”), an indirect wholly owned subsidiary of Wells Fargo & Company (“Wells Fargo”), is the manager of the Fund and provides advisory and fund-level administrative services under an investment management agreement. Under the investment management agreement, Funds Management is responsible for, among other services, implementing the investment objectives and strategies of the Fund and providing fund-level administrative services in connection with the Fund’s operations. As long as the Fund continues to invest substantially all of its assets in a single affiliated Master Portfolio, the Fund pays Funds Management an investment management fee only for fund-level administrative services at the following annual rate based on the Fund’s average daily net assets:
| | | | |
| |
| Average daily net assets | | Management fee | |
| |
First $5 billion | | | 0.05 | % |
| |
Next $5 billion | | | 0.04 | |
| |
Over $10 billion | | | 0.03 | |
| | | | |
| 22 | | Wells Fargo International Value Fund | | Notes to financial statements |
For the year ended May 31, 2019, the management fee was equivalent to an annual rate of 0.05% of the Fund’s average daily net assets.
Funds Management also serves as the adviser to the affiliated Master Portfolio and is entitled to receive a fee from the affiliated Master Portfolio for those services.
Administration fees
Under a class-level administration agreement, Funds Management provides class-level administrative services to the Fund, which includes paying fees and expenses for services provided by the transfer agent,sub-transfer agents, omnibus account servicers and record-keepers. As compensation for its services under the class-level administration agreement, Funds Management receives an annual fee which is calculated based on the average daily net assets of each class as follows:
| | | | |
| | | Class-level
administration fee | |
| |
Class A, Class C | | | 0.21 | % |
| |
Class R6 | | | 0.03 | |
| |
Administrator Class, Institutional Class | | | 0.13 | |
Funds Management has contractually waived and/or reimbursed management and administration fees to the extent necessary to maintain certain net operating expense ratios for the Fund. When each class of the Fund has exceeded its expense cap, Funds Management has waived fees and/or reimbursed expenses from fund level expenses on a proportionate basis and then from class specific expenses. When only certain classes exceed their expense caps, waivers and/or reimbursements are applied against class specific expenses before fund level expenses. Net expenses from the affiliated Master Portfolio are included in the expense caps. Funds Management has committed through September 30, 2019 to waive fees and/or reimburse expenses to the extent necessary to cap the Fund’s expenses at 1.35% for Class A shares, 2.10% for Class C shares, 0.90% for Class R6 shares, 1.25% for Administrator Class shares, and 1.00% for Institutional Class shares. Prior to or after the commitment expiration date, the cap may be increased or the commitment to maintain the cap may be terminated only with the approval of the Board of Trustees.
Distribution fee
The Trust has adopted a distribution plan for Class C shares of the Fund pursuant to Rule12b-1 under the 1940 Act. A distribution fee is charged to Class C shares and paid to Wells Fargo Funds Distributor, LLC (“Funds Distributor”), the principal underwriter, at an annual rate of 0.75% of the average daily net assets of Class C shares.
In addition, Funds Distributor is entitled to receive thefront-end sales charge from the purchase of Class A shares and a contingent deferred sales charge on the redemption of certain Class A shares. Funds Distributor is also entitled to receive the contingent deferred sales charges from redemptions of Class C shares. For the year ended May 31, 2019, Funds Distributor received $986 from the sale of Class A shares. No contingent deferred sales charges were incurred by Class A and Class C shares for the year ended May 31, 2019.
Shareholder servicing fees
The Trust has entered into contracts with one or more shareholder servicing agents, whereby Class A, Class C, and Administrator Class of the Fund are charged a fee at an annual rate of 0.25% of the average daily net assets of each respective class. A portion of these total shareholder servicing fees were paid to affiliates of Wells Fargo.
5. INVESTMENT PORTFOLIO TRANSACTIONS
The Fund seeks to achieve its investment objective by investing substantially all of its assets in a single affiliated Master Portfolio. Purchases and sales have been calculated by multiplying the Fund’s ownership percentage of the affiliated Master Portfolio by the affiliated Master Portfolio’s purchases and sales. Purchases and sales of investments, excluding U.S. government obligations (if any) and short-term securities, for the year ended May 31, 2019 were $367,772,058 and $111,522,356, respectively.
6. BANK BORROWINGS
The Trust (excluding the money market funds), Wells Fargo Master Trust and Wells Fargo Variable Trust are parties to a $280,000,000 revolving credit agreement whereby the Fund is permitted to use bank borrowings for temporary or emergency purposes, such as to fund shareholder redemption requests. Interest under the credit agreement is charged
| | | | | | |
| Notes to financial statements | | Wells Fargo International Value Fund | | | 23 | |
to the Fund based on a borrowing rate equal to the higher of the Federal Funds rate in effect on that day plus 1.25% or the overnight LIBOR rate in effect on that day plus 1.25%. In addition, an annual commitment fee equal to 0.25% of the unused balance is allocated to each participating fund.
For the year ended May 31, 2019, there were no borrowings by the Fund under the agreement.
7. DISTRIBUTIONS TO SHAREHOLDERS
The tax character of distributions paid was $21,600,261 and $22,503,146 of ordinary income for the years ended May 31, 2019 And May 31, 2018, respectively.
As of May 31, 2019, the components of distributable earnings on a tax basis were as follows:
| | | | |
Undistributed ordinary income | | Unrealized losses | | Capital loss carryforward |
| | |
| $20,087,560 | | $(69,688,862) | | $(2,994,670) |
Effective for all filings after November 4, 2018, the Securities and Exchange Commission eliminated the requirement to separately state the components of distributions to shareholders under U.S. generally accepted accounting principles. The amounts of distributions to shareholders for the year ended May 31, 2018 were as follows:
| | | | |
| | | Net
investment
income | |
| |
Class A | | $ | 53,028 | |
| |
Class C | | | 19,938 | |
| |
Administrator Class | | | 104,265 | |
| |
Institutional Class | | | 22,325,915 | |
8. INDEMNIFICATION
Under the Trust’s organizational documents, the officers and Trustees have been granted certain indemnification rights against certain liabilities that may arise out of performance of their duties to the Trust. Additionally, in the normal course of business, the Trust may enter into contracts with service providers that contain a variety of indemnification clauses. The Trust’s maximum exposure under these arrangements is dependent on future claims that may be made against the Fund and, therefore, cannot be estimated.
9. NEW ACCOUNTING PRONOUNCEMENT
In August 2018, FASB issued Accounting Standards Update (“ASU”)No. 2018-13, Fair Value Measurement (Topic 820)Disclosure Framework—Changes to the Disclosure Requirements for Fair Value Measurement. ASU2018-13 updates the disclosure requirements for fair value measurements by modifying or removing certain disclosures and adding certain new disclosures. The amendments are effective for fiscal years, and interim periods within those fiscal years, beginning after December 15, 2019. Early adoption is permitted. Management has adopted the removal and modification of disclosures early, as permitted, and will adopt the additional new disclosures at the effective date.
| | | | |
| 24 | | Wells Fargo International Value Fund | | Report of independent registered public accounting firm |
TO THE SHAREHOLDERS OF THE FUND AND BOARD OF TRUSTEES OF WELLS FARGO FUNDS TRUST:
Opinion on the Financial Statements
We have audited the accompanying statement of assets and liabilities of Wells Fargo International Value Fund (the Fund), one of the funds constituting Wells Fargo Funds Trust, including the portfolio of investments, as of May 31, 2019, the related statement of operations for the year then ended, the statements of changes in net assets for each of the years in the two-year period then ended, and the related notes (collectively, the financial statements) and the financial highlights for each of the years or periods in the five-year period then ended. In our opinion, the financial statements and financial highlights present fairly, in all material respects, the financial position of the Fund as of May 31, 2019, the results of its operations for the year then ended, the changes in its net assets for each of the years in the two-year period then ended, and the financial highlights for each of the years or periods in the five-year period then ended, in conformity with U.S. generally accepted accounting principles.
Basis for Opinion
These financial statements and financial highlights are the responsibility of the Fund’s management. Our responsibility is to express an opinion on these financial statements and financial highlights based on our audits. We are a public accounting firm registered with the Public Company Accounting Oversight Board (United States) (PCAOB) and are required to be independent with respect to the Fund in accordance with the U.S. federal securities laws and the applicable rules and regulations of the Securities and Exchange Commission and the PCAOB.
We conducted our audits in accordance with the standards of the PCAOB. Those standards require that we plan and perform the audit to obtain reasonable assurance about whether the financial statements and financial highlights are free of material misstatement, whether due to error or fraud. Our audits included performing procedures to assess the risks of material misstatement of the financial statements and financial highlights, whether due to error or fraud, and performing procedures that respond to those risks. Such procedures included examining, on a test basis, evidence regarding the amounts and disclosures in the financial statements and financial highlights. Such procedures also included confirmation of securities owned as of May 31, 2019, by correspondence with the transfer agent. Our audits also included evaluating the accounting principles used and significant estimates made by management, as well as evaluating the overall presentation of the financial statements and financial highlights. We believe that our audits provide a reasonable basis for our opinion.

We have not been able to determine the specific year that we began serving as the auditor of one or more Wells Fargo Funds investment companies; however we are aware that we have served as the auditor of one or more Wells Fargo Funds investment companies since at least 1955.
Boston, Massachusetts
July 26, 2019
| | | | | | |
| Portfolio of investments—May 31, 2019 | | Wells Fargo International Value Portfolio | | | 25 | |
| | | | | | | | | | | | | | | | |
| Security name | | | | | | | | Shares | | | Value | |
|
Common Stocks: 96.06% | |
|
| Australia: 5.59% | |
| | | | |
AGL Energy Limited (Utilities, Multi-Utilities) | | | | | | | | | | | 263,700 | | | $ | 3,759,185 | |
| | | | |
Asaleo Care Limited (Consumer Staples, Personal Products) † | | | | | | | | | | | 713,500 | | | | 433,086 | |
| | | | |
BlueScope Steel Limited (Materials, Metals & Mining) | | | | | | | | | | | 266,242 | | | | 1,946,655 | |
| | | | |
Coca-Cola Amatil Limited (Consumer Staples, Beverages) | | | | | | | | | | | 960,600 | | | | 6,350,491 | |
| | | | |
CSR Limited (Materials, Construction Materials) | | | | | | | | | | | 897,866 | | | | 2,485,171 | |
| | | | |
Fortescue Metals Group Limited (Materials, Metals & Mining) | | | | | | | | | | | 927,200 | | | | 5,177,750 | |
| | | | |
Harvey Norman Holdings Limited (Consumer Discretionary, Multiline Retail) « | | | | | | | | | | | 1,226,186 | | | | 3,538,519 | |
| | | | |
Lendlease Corporation Limited (Real Estate, Real Estate Management & Development) | | | | | | | | | | | 407,700 | | | | 4,030,207 | |
| | | | |
Macquarie Group Limited (Financials, Capital Markets) | | | | | | | | | | | 47,800 | | | | 3,989,343 | |
| | | | |
Metcash Limited (Consumer Staples, Food & Staples Retailing) | | | | | | | | | | | 1,164,200 | | | | 2,382,437 | |
| | | | |
Mineral Resources Limited (Materials, Metals & Mining) | | | | | | | | | | | 300,500 | | | | 3,131,023 | |
| | | | |
Mirvac Group (Real Estate, Equity REITs) | | | | | | | | | | | 2,065,070 | | | | 4,340,594 | |
| | | | |
Myer Holdings Limited (Consumer Discretionary, Multiline Retail) † | | | | | | | | | | | 1,702,400 | | | | 791,240 | |
| | | | |
Qantas Airways Limited (Industrials, Airlines) | | | | | | | | | | | 1,142,785 | | | | 4,399,763 | |
| | | | |
Rio Tinto Limited (Materials, Metals & Mining) | | | | | | | | | | | 134,687 | | | | 9,371,269 | |
| | | | |
South32 Limited (Materials, Metals & Mining) | | | | | | | | | | | 1,583,900 | | | | 3,647,856 | |
| |
| | | | 59,774,589 | |
| | | | | | | | | | | | | | | | |
|
| Austria: 0.81% | |
| | | | |
OMV AG (Energy, Oil, Gas & Consumable Fuels) | | | | | | | | | | | 89,986 | | | | 4,231,217 | |
| | | | |
Raiffeisen Bank International AG (Financials, Banks) | | | | | | | | | | | 111,330 | | | | 2,589,431 | |
| | | | |
Voestalpine AG (Materials, Metals & Mining) | | | | | | | | | | | 69,168 | | | | 1,805,824 | |
| |
| | | | 8,626,472 | |
| | | | | | | | | | | | | | | | |
|
| Belgium: 0.62% | |
| | | | |
Bpost SA (Industrials, Air Freight & Logistics) | | | | | | | | | | | 68,200 | | | | 670,316 | |
| | | | |
UCB SA (Health Care, Pharmaceuticals) | | | | | | | | | | | 77,200 | | | | 5,905,987 | |
| |
| | | | 6,576,303 | |
| | | | | | | | | | | | | | | | |
|
| Brazil: 1.17% | |
| | | | |
Banco de Brasil SA (Financials, Banks) | | | | | | | | | | | 268,900 | | | | 3,553,171 | |
| | | | |
Companhia de Saneamento de Minas Gerais SA (Utilities, Water Utilities) | | | | | | | | | | | 282,500 | | | | 4,473,694 | |
| | | | |
JBS SA (Consumer Staples, Food Products) | | | | | | | | | | | 805,600 | | | | 4,487,931 | |
| |
| | | | 12,514,796 | |
| | | | | | | | | | | | | | | | |
|
| Canada: 1.00% | |
| | | | |
Loblaw Companies Limited (Consumer Staples, Food & Staples Retailing) | | | | | | | | | | | 80,100 | | | | 4,110,488 | |
| | | | |
Magna International Incorporated (Consumer Discretionary, Auto Components) | | | | | | | | | | | 90,400 | | | | 3,871,897 | |
| | | | |
WestJet Airlines Limited (Industrials, Airlines) | | | | | | | | | | | 120,000 | | | | 2,680,379 | |
| |
| | | | 10,662,764 | |
| | | | | | | | | | | | | | | | |
|
| China: 3.42% | |
| | | | |
Agile Property Holdings Limited (Real Estate, Real Estate Management & Development) | | | | | | | | | | | 1,900,000 | | | | 2,406,643 | |
| | | | |
China Communications Services Corporation Limited H Shares (Industrials, Construction & Engineering) | | | | | | | | | | | 2,836,000 | | | | 2,123,505 | |
| | | | |
China Petroleum & Chemical Corporation H Shares (Energy, Oil, Gas & Consumable Fuels) | | | | | | | | | | | 6,634,000 | | | | 4,417,279 | |
| | | | |
China Railway Construction Corporation Limited H Shares (Industrials, Construction & Engineering) | | | | | | | | | | | 3,201,500 | | | | 3,744,827 | |
| | | | |
China Resources Cement Holdings Limited (Materials, Construction Materials) | | | | | | | | | | | 4,106,000 | | | | 3,561,531 | |
The accompanying notes are an integral part of these financial statements.
| | | | |
| 26 | | Wells Fargo International Value Portfolio | | Portfolio of investments—May 31, 2019 |
| | | | | | | | | | | | | | | | |
| Security name | | | | | | | | Shares | | | Value | |
|
| China(continued) | |
| | | | |
China Telecom Corporation Limited H Shares (Communication Services, Diversified Telecommunication Services) | | | | | | | | | | | 10,590,000 | | | $ | 5,322,321 | |
| | | | |
Dongfeng Motor Group Company Limited H Shares (Consumer Discretionary, Automobiles) | | | | | | | | | | | 3,154,000 | | | | 2,598,981 | |
| | | | |
Nine Dragons Paper Holdings Limited (Materials, Paper & Forest Products) | | | | | | | | | | | 3,216,000 | | | | 2,563,923 | |
| | | | |
PICC Property & Casualty Company Limited H Shares (Financials, Insurance) | | | | | | | | | | | 4,298,000 | | | | 4,643,642 | |
| | | | |
Shanghai Pharmaceuticals Holding Company Limited H Shares (Health Care, Health Care Providers & Services) | | | | | | | | | | | 1,061,600 | | | | 2,096,239 | |
| | | | |
Shenzhen International Holdings Limited H Shares (Industrials, Transportation Infrastructure) | | | | | | | | | | | 1,777,300 | | | | 3,124,056 | |
| |
| | | | 36,602,947 | |
| | | | | | | | | | | | | | | | |
|
| Denmark: 0.62% | |
| | | | |
Danske Bank AS (Financials, Banks) | | | | | | | | | | | 150,300 | | | | 2,463,251 | |
| | | | |
DFDS AS (Industrials, Marine) | | | | | | | | | | | 59,227 | | | | 2,253,127 | |
| | | | |
Sydbank AS (Financials, Banks) | | | | | | | | | | | 102,782 | | | | 1,927,005 | |
| |
| | | | 6,643,383 | |
| | | | | | | | | | | | | | | | |
|
| Finland: 0.60% | |
| | | | |
Nordea Bank AB (Financials, Banks) | | | | | | | | | | | 203,700 | | | | 1,438,466 | |
| | | | |
Outokumpu Oyj (Materials, Metals & Mining) « | | | | | | | | | | | 695,100 | | | | 2,043,829 | |
| | | | |
UPM-Kymmene Oyj (Materials, Paper & Forest Products) | | | | | | | | | | | 118,000 | | | | 2,955,487 | |
| |
| | | | 6,437,782 | |
| | | | | | | | | | | | | | | | |
|
| France: 8.99% | |
| | | | |
AirFrance-KLM (Industrials, Airlines) † | | | | | | | | | | | 288,100 | | | | 2,489,839 | |
| | | | |
Arkema SA (Materials, Chemicals) | | | | | | | | | | | 42,992 | | | | 3,607,902 | |
| | | | |
AXA SA (Financials, Insurance) | | | | | | | | | | | 282,700 | | | | 6,973,268 | |
| | | | |
BNP Paribas SA (Financials, Banks) « | | | | | | | | | | | 123,579 | | | | 5,643,050 | |
| | | | |
Carrefour SA (Consumer Staples, Food & Staples Retailing) | | | | | | | | | | | 149,000 | | | | 2,803,108 | |
| | | | |
Compagnie de Saint-Gobain SA (Industrials, Building Products) « | | | | | | | | | | | 152,637 | | | | 5,527,354 | |
| | | | |
Compagnie Generale des Etablissements Michelin SCA (Consumer Discretionary, Auto Components) « | | | | | | | | | | | 32,700 | | | | 3,760,846 | |
| | | | |
Credit Agricole SA (Financials, Banks) | | | | | | | | | | | 219,328 | | | | 2,506,578 | |
| | | | |
Engie SA (Utilities, Multi-Utilities) « | | | | | | | | | | | 328,900 | | | | 4,574,511 | |
| | | | |
Natixis SA (Financials, Capital Markets) « | | | | | | | | | | | 1,250,400 | | | | 5,739,797 | |
| | | | |
Neopost SA (Information Technology, Technology Hardware, Storage & Peripherals) | | | | | | | | | | | 66,600 | | | | 1,459,027 | |
| | | | |
Orange SA (Communication Services, Diversified Telecommunication Services) « | | | | | | | | | | | 586,700 | | | | 9,202,263 | |
| | | | |
Renault SA (Consumer Discretionary, Automobiles) | | | | | | | | | | | 55,900 | | | | 3,367,233 | |
| | | | |
Sanofi SA (Health Care, Pharmaceuticals) | | | | | | | | | | | 238,389 | | | | 19,238,686 | |
| | | | |
SCOR SE (Financials, Insurance) | | | | | | | | | | | 9,900 | | | | 407,332 | |
| | | | |
Societe Generale SA (Financials, Banks) « | | | | | | | | | | | 63,400 | | | | 1,590,781 | |
| | | | |
Total SA (Energy, Oil, Gas & Consumable Fuels) | | | | | | | | | | | 329,000 | | | | 17,142,174 | |
| |
| | | | 96,033,749 | |
| | | | | | | | | | | | | | | | |
|
| Germany: 7.48% | |
| | | | |
Allianz AG (Financials, Insurance) | | | | | | | | | | | 44,428 | | | | 9,869,966 | |
| | | | |
Aurubis AG (Materials, Metals & Mining) | | | | | | | | | | | 43,296 | | | | 1,896,514 | |
| | | | |
BASF SE (Materials, Chemicals) | | | | | | | | | | | 108,900 | | | | 7,185,099 | |
| | | | |
Bayer AG (Health Care, Pharmaceuticals) | | | | | | | | | | | 90,600 | | | | 5,346,112 | |
| | | | |
Bayerische Motoren Werke AG (Consumer Discretionary, Automobiles) | | | | | | | | | | | 91,500 | | | | 6,339,636 | |
| | | | |
Covestro AG (Materials, Chemicals) 144A | | | | | | | | | | | 132,837 | | | | 5,821,687 | |
| | | | |
Daimler AG (Consumer Discretionary, Automobiles) | | | | | | | | | | | 106,990 | | | | 5,550,091 | |
| | | | |
Deutsche Lufthansa AG (Industrials, Airlines) | | | | | | | | | | | 223,600 | | | | 4,259,000 | |
The accompanying notes are an integral part of these financial statements.
| | | | | | |
| Portfolio of investments—May 31, 2019 | | Wells Fargo International Value Portfolio | | | 27 | |
| | | | | | | | | | | | | | | | |
| Security name | | | | | | | | Shares | | | Value | |
| | | | |
| Germany(continued) | | | | | | | | | | | | | | | | |
| | | | |
Deutsche Post AG (Industrials, Air Freight & Logistics) | | | | | | | | | | | 85,100 | | | $ | 2,507,932 | |
| | | | |
Kloeckner & Company SE (Industrials, Trading Companies & Distributors) « | | | | | | | | | | | 344,100 | | | | 1,841,330 | |
| | | | |
Leoni AG (Consumer Discretionary, Auto Components) Ǡ | | | | | | | | | | | 72,900 | | | | 1,140,978 | |
| | | | |
Metro AG (Consumer Staples, Food & Staples Retailing) | | | | | | | | | | | 368,900 | | | | 5,814,965 | |
| | | | |
Muenchener Rueckversicherungs Gesellschaft AG (Financials, Insurance) | | | | | | | | | | | 28,119 | | | | 6,788,379 | |
| | | | |
Rheinmetall AG (Industrials, Industrial Conglomerates) | | | | | | | | | | | 30,300 | | | | 3,225,871 | |
| | | | |
Siemens AG (Industrials, Industrial Conglomerates) | | | | | | | | | | | 34,200 | | | | 3,875,670 | |
| | | | |
Siltronic AG (Information Technology, Semiconductors & Semiconductor Equipment) | | | | | | | | | | | 27,422 | | | | 1,875,443 | |
| | | | |
Volkswagen AG (Consumer Discretionary, Automobiles) | | | | | | | | | | | 41,837 | | | | 6,641,498 | |
| |
| | | | 79,980,171 | |
| | | | | | | | | | | | | | | | |
|
| Hong Kong: 2.66% | |
| | | | |
China Water Affairs Group Limited (Utilities, Water Utilities) | | | | | | | | | | | 1,965,000 | | | | 1,904,956 | |
| | | | |
Kingboard Laminates Holdings Limited (Information Technology, Electronic Equipment, Instruments & Components) | | | | | | | | | | | 3,948,000 | | | | 3,369,086 | |
| | | | |
Lee & Man Paper Manufacturing Limited (Materials, Paper & Forest Products) | | | | | | | | | | | 3,155,000 | | | | 2,052,478 | |
| | | | |
Sinotruk Hong Kong Limited (Industrials, Machinery) « | | | | | | | | | | | 3,095,000 | | | | 5,866,625 | |
| | | | |
Skyworth Digital Holdings Limited (Consumer Discretionary, Household Durables) | | | | | | | | | | | 8,404,000 | | | | 2,208,321 | |
| | | | |
WH Group Limited (Consumer Staples, Food Products) 144A | | | | | | | | | | | 4,355,500 | | | | 3,922,397 | |
| | | | |
Wheelock & Company Limited (Real Estate, Real Estate Management & Development) | | | | | | | | | | | 379,000 | | | | 2,509,085 | |
| | | | |
Xinyi Glass Holdings Limited (Consumer Discretionary, Auto Components) | | | | | | | | | | | 2,816,000 | | | | 2,819,754 | |
| | | | |
Yue Yuen Industrial Holdings Limited (Consumer Discretionary, Textiles, Apparel & Luxury Goods) | | | | | | | | | | | 1,364,000 | | | | 3,819,071 | |
| |
| | | | 28,471,773 | |
| | | | | | | | | | | | | | | | |
|
| India: 0.52% | |
| | | | |
REC Limited (Financials, Diversified Financial Services) | | | | | | | | | | | 1,086,900 | | | | 2,254,392 | |
| | | | |
Tech Mahindra Limited (Information Technology, IT Services) | | | | | | | | | | | 307,494 | | | | 3,354,841 | |
| |
| | | | 5,609,233 | |
| | | | | | | | | | | | | | | | |
|
| Ireland: 0.68% | |
| | | | |
C&C Group plc (Consumer Staples, Beverages) | | | | | | | | | | | 240,000 | | | | 977,283 | |
| | | | |
Grafton Group plc (Industrials, Trading Companies & Distributors) | | | | | | | | | | | 248,800 | | | | 2,675,208 | |
| | | | |
Smurfit Kappa Group plc (Materials, Containers & Packaging) | | | | | | | | | | | 130,200 | | | | 3,607,232 | |
| |
| | | | 7,259,723 | |
| | | | | | | | | | | | | | | | |
|
| Israel: 0.33% | |
| | | | |
Bank Hapoalim Limited (Financials, Banks) | | | | | | | | | | | 320,800 | | | | 2,310,203 | |
| | | | |
Teva Pharmaceutical Industries Limited (Health Care, Pharmaceuticals) † | | | | | | | | | | | 136,844 | | | | 1,179,068 | |
| |
| | | | 3,489,271 | |
| | | | | | | | | | | | | | | | |
|
| Italy: 2.49% | |
| | | | |
A2A SpA (Utilities, Multi-Utilities) | | | | | | | | | | | 2,121,107 | | | | 3,458,423 | |
| | | | |
Enel SpA (Utilities, Electric Utilities) | | | | | | | | | | | 1,706,600 | | | | 10,619,361 | |
| | | | |
Leonardo-Finmeccanica SpA (Industrials, Aerospace & Defense) | | | | | | | | | | | 342,737 | | | | 3,806,679 | |
| | | | |
Mediobanca SpA (Financials, Banks) | | | | | | | | | | | 371,363 | | | | 3,431,789 | |
| | | | |
UnipolSai Assicurazioni SpA (Financials, Insurance) « | | | | | | | | | | | 2,160,500 | | | | 5,266,480 | |
| |
| | | | 26,582,732 | |
| | | | | | | | | | | | | | | | |
The accompanying notes are an integral part of these financial statements.
| | | | |
| 28 | | Wells Fargo International Value Portfolio | | Portfolio of investments—May 31, 2019 |
| | | | | | | | | | | | | | | | |
| Security name | | | | | | | | Shares | | | Value | |
|
| Japan: 21.66% | |
| | | | |
Adeka Corporation (Materials, Chemicals) | | | | | | | | | | | 203,500 | | | $ | 2,852,549 | |
| | | | |
Aisin Seiki Company Limited (Consumer Discretionary, Auto Components) | | | | | | | | | | | 119,800 | | | | 3,985,410 | |
| | | | |
Aozora Bank Limited (Financials, Banks) | | | | | | | | | | | 64,900 | | | | 1,580,502 | |
| | | | |
Asahi Glass Company Limited (Industrials, Building Products) | | | | | | | | | | | 121,800 | | | | 3,928,307 | |
| | | | |
Astellas Pharma Incorporated (Health Care, Pharmaceuticals) | | | | | | | | | | | 278,500 | | | | 3,758,651 | |
| | | | |
Brother Industries Limited (Information Technology, Technology Hardware, Storage & Peripherals) | | | | | | | | | | | 200,800 | | | | 3,452,133 | |
| | | | |
Central Glass Company Limited (Industrials, Building Products) | | | | | | | | | | | 68,000 | | | | 1,500,374 | |
| | | | |
Credit Saison Company Limited (Financials, Consumer Finance) | | | | | | | | | | | 329,900 | | | | 3,561,879 | |
| | | | |
Denka Company Limited (Materials, Chemicals) | | | | | | | | | | | 99,700 | | | | 2,861,321 | |
| | | | |
DIC Incorporated (Materials, Chemicals) | | | | | | | | | | | 124,900 | | | | 3,048,590 | |
| | | | |
Dowa Mining Company Limited (Materials, Metals & Mining) | | | | | | | | | | | 56,900 | | | | 1,780,012 | |
| | | | |
Fujikura Limited (Industrials, Electrical Equipment) | | | | | | | | | | | 435,200 | | | | 1,437,748 | |
| | | | |
Geo Holdings Corporation (Consumer Discretionary, Specialty Retail) | | | | | | | | | | | 133,700 | | | | 1,686,595 | |
| | | | |
Hitachi Capital Corporation (Financials, Consumer Finance) | | | | | | | | | | | 93,300 | | | | 1,979,391 | |
| | | | |
Hitachi Limited (Information Technology, Electronic Equipment, Instruments & Components) | | | | | | | | | | | 165,800 | | | | 5,639,633 | |
| | | | |
Idemitsu Kosan Company Limited (Energy, Oil, Gas & Consumable Fuels) | | | | | | | | | | | 59,614 | | | | 1,691,626 | |
| | | | |
Isuzu Motors Limited (Consumer Discretionary, Automobiles) | | | | | | | | | | | 434,600 | | | | 4,812,625 | |
| | | | |
Itochu Corporation (Industrials, Trading Companies & Distributors) | | | | | | | | | | | 530,100 | | | | 9,778,711 | |
| | | | |
Japan Airlines Company Limited (Industrials, Airlines) | | | | | | | | | | | 108,600 | | | | 3,420,401 | |
| | | | |
JFE Holdings Incorporated (Materials, Metals & Mining) | | | | | | | | | | | 263,600 | | | | 3,668,240 | |
| | | | |
JTEKT Corporation (Industrials, Machinery) | | | | | | | | | | | 322,100 | | | | 3,424,161 | |
| | | | |
JXTG Holdings Incorporated (Energy, Oil, Gas & Consumable Fuels) | | | | | | | | | | | 754,900 | | | | 3,612,012 | |
| | | | |
Kaken Pharmaceutical Company Limited (Health Care, Pharmaceuticals) | | | | | | | | | | | 44,700 | | | | 2,120,223 | |
| | | | |
KDDI Corporation (Communication Services, Wireless Telecommunication Services) | | | | | | | | | | | 544,200 | | | | 14,003,618 | |
| | | | |
Keihin Corporation (Consumer Discretionary, Auto Components) | | | | | | | | | | | 180,400 | | | | 2,348,954 | |
| | | | |
Komatsu Limited (Industrials, Machinery) | | | | | | | | | | | 236,900 | | | | 5,282,786 | |
| | | | |
Maeda Road Construction Company Limited (Industrials, Construction & Engineering) | | | | | | | | | | | 148,000 | | | | 2,984,174 | |
| | | | |
Makino Milling Machine Company Limited (Industrials, Machinery) | | | | | | | | | | | 79,400 | | | | 2,754,985 | |
| | | | |
Marubeni Corporation (Industrials, Trading Companies & Distributors) | | | | | | | | | | | 1,051,700 | | | | 6,632,509 | |
| | | | |
Mazda Motor Corporation (Consumer Discretionary, Automobiles) | | | | | | | | | | | 283,200 | | | | 2,774,113 | |
| | | | |
Mitsubishi Electric Corporation (Industrials, Electrical Equipment) | | | | | | | | | | | 292,500 | | | | 3,672,277 | |
| | | | |
Mitsubishi Gas Chemical Company Incorporated (Materials, Chemicals) | | | | | | | | | | | 195,500 | | | | 2,444,540 | |
| | | | |
Mitsubishi UFJ Financial Group Incorporated (Financials, Banks) | | | | | | | | | | | 921,500 | | | | 4,261,188 | |
| | | | |
Mitsubishi UFJ Lease & Finance Company Limited (Financials, Diversified Financial Services) | | | | | | | | | | | 699,300 | | | | 3,497,629 | |
| | | | |
Mitsui Chemicals Incorporated (Materials, Chemicals) | | | | | | | | | | | 177,100 | | | | 3,901,054 | |
| | | | |
Mixi Incorporated (Communication Services, Interactive Media & Services) | | | | | | | | | | | 54,400 | | | | 1,150,600 | |
| | | | |
Mizuho Financial Group Incorporated (Financials, Banks) | | | | | | | | | | | 3,425,200 | | | | 4,858,148 | |
| | | | |
Morinaga Milk Industry Company Limited (Consumer Staples, Food Products) | | | | | | | | | | | 134,500 | | | | 4,896,438 | |
| | | | |
Nippon Telegraph & Telephone Corporation (Communication Services, Diversified Telecommunication Services) | | | | | | | | | | | 324,200 | | | | 14,557,811 | |
| | | | |
Nissan Motor Company Limited (Consumer Discretionary, Automobiles) | | | | | | | | | | | 587,500 | | | | 3,982,628 | |
| | | | |
Nisshinbo Holdings Incorporated (Industrials, Industrial Conglomerates) | | | | | | | | | | | 82,500 | | | | 574,032 | |
| | | | |
NTN Corporation (Industrials, Machinery) | | | | | | | | | | | 1,133,600 | | | | 2,991,829 | |
| | | | |
NTT DOCOMO Incorporated (Communication Services, Wireless Telecommunication Services) | | | | | | | | | | | 98,600 | | | | 2,270,625 | |
| | | | |
ORIX Corporation (Financials, Diversified Financial Services) | | | | | | | | | | | 469,600 | | | | 6,651,926 | |
| | | | |
Resona Holdings Incorporated (Financials, Banks) | | | | | | | | | | | 1,348,600 | | | | 5,723,445 | |
| | | | |
Ryobi Limited (Industrials, Machinery) | | | | | | | | | | | 117,400 | | | | 2,149,417 | |
| | | | |
Sawai Pharmaceutical Company Limited (Health Care, Pharmaceuticals) | | | | | | | | | | | 81,600 | | | | 4,209,330 | |
| | | | |
Sojitz Corporation (Industrials, Trading Companies & Distributors) | | | | | | | | | | | 1,855,500 | | | | 5,975,818 | |
| | | | |
Sompo Holdings Incorporated NKSJ Holdings Inc(Financials, Insurance) | | | | | | | | | | | 85,400 | | | | 3,240,574 | |
| | | | |
Sumitomo Heavy Industries Limited (Industrials, Machinery) | | | | | | | | | | | 140,900 | | | | 4,479,311 | |
The accompanying notes are an integral part of these financial statements.
| | | | | | |
| Portfolio of investments—May 31, 2019 | | Wells Fargo International Value Portfolio | | | 29 | |
| | | | | | | | | | | | | | | | |
| Security name | | | | | | | | Shares | | | Value | |
| | | | |
| Japan(continued) | | | | | | | | | | | | | | | | |
| | | | |
Sumitomo Mitsui Financial Group Incorporated (Financials, Banks) | | | | | | | | | | | 173,200 | | | $ | 6,046,377 | |
| | | | |
Teijin Limited (Materials, Chemicals) | | | | | | | | | | | 279,600 | | | | 4,574,639 | |
| | | | |
The Keiyo Bank Limited (Financials, Banks) | | | | | | | | | | | 224,300 | | | | 1,293,660 | |
| | | | |
The Yokohama Rubber Company Limited (Consumer Discretionary, Auto Components) | | | | | | | | | | | 172,900 | | | | 2,894,298 | |
| | | | |
Toho Holdings Company Limited (Health Care, Health Care Providers & Services) | | | | | | | | | | | 63,000 | | | | 1,412,144 | |
| | | | |
Tokyo Electron Limited (Information Technology, Semiconductors & Semiconductor Equipment) | | | | | | | | | | | 2,700 | | | | 368,505 | |
| | | | |
Toyo Ink SC Holding Company Limited (Materials, Chemicals) | | | | | | | | | | | 75,000 | | | | 1,565,542 | |
| | | | |
Toyo Tire & Rubber Company Limited (Consumer Discretionary, Auto Components) | | | | | | | | | | | 165,400 | | | | 2,068,168 | |
| | | | |
Toyota Boshoku Corporation (Consumer Discretionary, Auto Components) | | | | | | | | | | | 180,900 | | | | 2,223,585 | |
| | | | |
UBE Industries Limited (Materials, Chemicals) | | | | | | | | | | | 149,300 | | | | 2,867,100 | |
| | | | |
ULVAC Incorporated (Information Technology, Semiconductors & Semiconductor Equipment) | | | | | | | | | | | 107,300 | | | | 3,084,386 | |
| | | | |
West Japan Railway Company (Industrials, Road & Rail) | | | | | | | | | | | 67,100 | | | | 5,263,231 | |
| |
| | | | 231,512,488 | |
| | | | | | | | | | | | | | | | |
|
| Liechtenstein: 0.02% | |
| | | | |
VP Bank AG (Financials, Capital Markets) | | | | | | | | | | | 1,379 | | | | 216,508 | |
| | | | | | | | | | | | | | | | |
|
| Malaysia: 0.30% | |
| | | | |
Tenaga Nasional Bhd (Utilities, Electric Utilities) | | | | | | | | | | | 1,062,400 | | | | 3,219,778 | |
| | | | | | | | | | | | | | | | |
|
| Netherlands: 2.88% | |
| | | | |
ABN AMRO Group NV (Financials, Banks) 144A | | | | | | | | | | | 161,500 | | | | 3,417,149 | |
| | | | |
Aegon NV (Financials, Insurance) « | | | | | | | | | | | 566,623 | | | | 2,592,780 | |
| | | | |
ASR Nederland NV (Financials, Insurance) | | | | | | | | | | | 83,831 | | | | 3,180,415 | |
| | | | |
ING Groep NV (Financials, Banks) | | | | | | | | | | | 282,500 | | | | 3,059,692 | |
| | | | |
Koninklijke Ahold Delhaize NV (Consumer Staples, Food & Staples Retailing) | | | | | | | | | | | 437,386 | | | | 9,838,479 | |
| | | | |
Philips Lighting NV (Industrials, Electrical Equipment) 144A | | | | | | | | | | | 161,000 | | | | 4,309,473 | |
| | | | |
RHI Magnesita NV (Materials, Construction Materials) | | | | | | | | | | | 64,721 | | | | 3,940,517 | |
| | | | |
X5 Retail Group NV GDR (Consumer Staples, Food & Staples Retailing) | | | | | | | | | | | 14,352 | | | | 422,236 | |
| |
| | | | 30,760,741 | |
| | | | | | | | | | | | | | | | |
|
| Norway: 1.41% | |
| | | | |
Den Norske Bank ASA (Financials, Banks) | | | | | | | | | | | 221,600 | | | | 3,757,606 | |
| | | | |
Grieg Seafood ASA (Consumer Staples, Food Products) | | | | | | | | | | | 336,787 | | | | 4,779,522 | |
| | | | |
Leroy Seafood Group ASA (Consumer Staples, Food Products) « | | | | | | | | | | | 558,599 | | | | 3,829,649 | |
| | | | |
Mowi ASA (Consumer Staples, Food Products) | | | | | | | | | | | 117,900 | | | | 2,734,749 | |
| |
| | | | 15,101,526 | |
| | | | | | | | | | | | | | | | |
|
| Poland: 0.12% | |
| | | | |
Asseco Poland SA (Information Technology, Software) | | | | | | | | | | | 93,400 | | | | 1,245,268 | |
| | | | | | | | | | | | | | | | |
|
| Russia: 1.57% | |
| | | | |
Gazprom Neft ADR (Energy, Oil, Gas & Consumable Fuels) | | | | | | | | | | | 136,114 | | | | 3,852,026 | |
| | | | |
Gazprom Neft ADR (Energy, Oil, Gas & Consumable Fuels) | | | | | | | | | | | 886 | | | | 25,286 | |
| | | | |
Gazprom PAO ADR (Energy, Oil, Gas & Consumable Fuels) | | | | | | | | | | | 781,547 | | | | 5,134,764 | |
| | | | |
Lukoil OAO ADR (Energy, Oil, Gas & Consumable Fuels) « | | | | | | | | | | | 46,800 | | | | 3,731,364 | |
| | | | |
Lukoil PJSC ADR (Energy, Oil, Gas & Consumable Fuels) | | | | | | | | | | | 50,101 | | | | 4,036,137 | |
| |
| | | | 16,779,577 | |
| | | | | | | | | | | | | | | | |
The accompanying notes are an integral part of these financial statements.
| | | | |
| 30 | | Wells Fargo International Value Portfolio | | Portfolio of investments—May 31, 2019 |
| | | | | | | | | | | | | | | | |
| Security name | | | | | | | | Shares | | | Value | |
|
| Singapore: 0.60% | |
| | | | |
DBS Group Holdings Limited (Financials, Banks) | | | | | | | | | | | 185,700 | | | $ | 3,283,579 | |
| | | | |
United Overseas Bank Limited (Financials, Banks) | | | | | | | | | | | 184,100 | | | | 3,149,414 | |
| |
| | | | 6,432,993 | |
| | | | | | | | | | | | | | | | |
|
| South Africa: 0.30% | |
| | | | |
Absa Group Limited (Financials, Banks) | | | | | | | | | | | 274,900 | | | | 3,189,434 | |
| | | | | | | | | | | | | | | | |
|
| South Korea: 2.22% | |
| | | | |
BNK Financial Group Incorporated (Financials, Banks) | | | | | | | | | | | 440,300 | | | | 2,551,071 | |
| | | | |
E-MART Incorporated (Consumer Staples, Food & Staples Retailing) | | | | | | | | | | | 8,500 | | | | 1,027,794 | |
| | | | |
Industrial Bank of Korea (Financials, Banks) | | | | | | | | | | | 264,500 | | | | 3,076,098 | |
| | | | |
JB Financial Group Company Limited (Financials, Banks) | | | | | | | | | | | 25,418 | | | | 119,097 | |
| | | | |
KB Financial Group Incorporated (Financials, Banks) | | | | | | | | | | | 79,300 | | | | 2,916,567 | |
| | | | |
KT&G Corporation (Consumer Staples, Tobacco) | | | | | | | | | | | 38,400 | | | | 3,256,697 | |
| | | | |
LG Uplus Corporation (Communication Services, Diversified Telecommunication Services) | | | | | | | | | | | 351,800 | | | | 4,120,925 | |
| | | | |
SK Telecom Company Limited (Communication Services, Wireless Telecommunication Services) | | | | | | | | | | | 17,400 | | | | 3,660,005 | |
| | | | |
Woori Financial Group Incorporated (Financials, Banks) | | | | | | | | | | | 254,400 | | | | 2,969,317 | |
| |
| | | | 23,697,571 | |
| | | | | | | | | | | | | | | | |
|
| Spain: 1.78% | |
| | | | |
Banco Santander Central Hispano SA (Financials, Banks) | | | | | | | | | | | 731,000 | | | | 3,227,348 | |
| | | | |
Distribuidora Internacional SA (Consumer Staples, Food & Staples Retailing) | | | | | | | | | | | 391,000 | | | | 257,715 | |
| | | | |
Iberdrola SA (Utilities, Electric Utilities) | | | | | | | | | | | 389,400 | | | | 3,616,741 | |
| | | | |
International Consolidated Airlines Group SA (Industrials, Airlines) | | | | | | | | | | | 548,044 | | | | 3,125,512 | |
| | | | |
Repsol YPF SA (Energy, Oil, Gas & Consumable Fuels) | | | | | | | | | | | 542,137 | | | | 8,757,675 | |
| |
| | | | 18,984,991 | |
| | | | | | | | | | | | | | | | |
|
| Sweden: 2.03% | |
| | | | |
Boliden AB (Materials, Metals & Mining) | | | | | | | | | | | 102,400 | | | | 2,334,829 | |
| | | | |
Boliden AB (Materials, Metals & Mining) †(a) | | | | | | | | | | | 102,400 | | | | 45,876 | |
| | | | |
Electrolux AB Class B (Consumer Discretionary, Household Durables) | | | | | | | | | | | 162,100 | | | | 3,525,176 | |
| | | | |
Sandvik AB (Industrials, Machinery) | | | | | | | | | | | 240,700 | | | | 3,718,437 | |
| | | | |
Skandinaviska Enskilda Banken AB Class A (Financials, Banks) | | | | | | | | | | | 272,700 | | | | 2,422,173 | |
| | | | |
Volvo AB Class B (Industrials, Machinery) | | | | | | | | | | | 689,107 | | | | 9,643,169 | |
| |
| | | | 21,689,660 | |
| | | | | | | | | | | | | | | | |
|
| Switzerland: 7.06% | |
| | | | |
Baloise Holding AG (Financials, Insurance) | | | | | | | | | | | 39,946 | | | | 6,646,695 | |
| | | | |
Credit Suisse Group AG (Financials, Capital Markets) | | | | | | | | | | | 168,600 | | | | 1,917,957 | |
| | | | |
Helvetia Holding AG (Financials, Insurance) | | | | | | | | | | | 31,465 | | | | 3,871,648 | |
| | | | |
Roche Holding AG (Health Care, Pharmaceuticals) | | | | | | | | | | | 104,400 | | | | 27,433,348 | |
| | | | |
Swiss Life Holding AG (Financials, Insurance) | | | | | | | | | | | 24,300 | | | | 11,059,685 | |
| | | | |
Swiss Reinsurance AG (Financials, Insurance) | | | | | | | | | | | 91,400 | | | | 8,672,160 | |
| | | | |
UBS Group AG (Financials, Capital Markets) | | | | | | | | | | | 424,002 | | | | 4,891,109 | |
| | | | |
Valiant Holding AG (Financials, Banks) | | | | | | | | | | | 17,400 | | | | 1,859,476 | |
| | | | |
Zurich Insurance Group AG (Financials, Insurance) | | | | | | | | | | | 27,970 | | | | 9,073,314 | |
| |
| | | | 75,425,392 | |
| | | | | | | | | | | | | | | | |
The accompanying notes are an integral part of these financial statements.
| | | | | | |
| Portfolio of investments—May 31, 2019 | | Wells Fargo International Value Portfolio | | | 31 | |
| | | | | | | | | | | | | | | | |
| Security name | | | | | | | | Shares | | | Value | |
|
| Taiwan: 0.56% | |
| | | | |
Catcher Technology Company Limited (Information Technology, Technology Hardware, Storage & Peripherals) | | | | | | | | | | | 328,000 | | | $ | 1,992,123 | |
| | | | |
Pegatron Corporation (Information Technology, Technology Hardware, Storage & Peripherals) | | | | | | | | | | | 600,000 | | | | 977,461 | |
| | | | |
Powertech Technology Incorporated (Information Technology, Semiconductors & Semiconductor Equipment) | | | | | | | | | | | 1,283,000 | | | | 3,015,481 | |
| |
| | | | 5,985,065 | |
| | | | | | | | | | | | | | | | |
|
| Thailand: 1.00% | |
| | | | |
Bangchak Corporation PCL (Energy, Oil, Gas & Consumable Fuels) | | | | | | | | | | | 2,321,100 | | | | 2,163,597 | |
| | | | |
Krung Thai Bank PCL ADR (Financials, Banks) | | | | | | | | | | | 5,181,900 | | | | 3,127,397 | |
| | | | |
Quality Houses PCL (Real Estate, Real Estate Management & Development) | | | | | | | | | | | 15,516,900 | | | | 1,480,718 | |
| | | | |
Thai Oil PCL (Energy, Oil, Gas & Consumable Fuels) | | | | | | | | | | | 744,000 | | | | 1,392,906 | |
| | | | |
Thanachart Capital PCL | | | | | | | | | | | 1,481,500 | | | | 2,481,065 | |
| |
| | | | 10,645,683 | |
| | | | | | | | | | | | | | | | |
|
| Turkey: 0.49% | |
| | | | |
Koç Holding AS (Industrials, Industrial Conglomerates) | | | | | | | | | | | 1,184,300 | | | | 3,299,492 | |
| | | | |
TAV Havalimanlari Holding AS (Industrials, Transportation Infrastructure) | | | | | | | | | | | 439,000 | | | | 1,917,116 | |
| |
| | | | 5,216,608 | |
| | | | | | | | | | | | | | | | |
|
| United Kingdom: 15.08% | |
| | | | |
3i Group plc (Financials, Capital Markets) | | | | | | | | | | | 364,800 | | | | 4,847,194 | |
| | | | |
Anglo American plc (Materials, Metals & Mining) | | | | | | | | | | | 267,586 | | | | 6,410,700 | |
| | | | |
Aviva plc (Financials, Insurance) | | | | | | | | | | | 704,391 | | | | 3,603,069 | |
| | | | |
Babcock International Group plc (Industrials, Commercial Services & Supplies) | | | | | | | | | | | 331,300 | | | | 1,875,592 | |
| | | | |
BAE Systems plc (Industrials, Aerospace & Defense) | | | | | | | | | | | 1,687,100 | | | | 9,649,310 | |
| | | | |
Barclays plc (Financials, Banks) | | | | | | | | | | | 715,000 | | | | 1,349,942 | |
| | | | |
Barratt Developments plc (Consumer Discretionary, Household Durables) | | | | | | | | | | | 480,975 | | | | 3,393,044 | |
| | | | |
Bellway plc (Consumer Discretionary, Household Durables) | | | | | | | | | | | 80,100 | | | | 2,775,712 | |
| | | | |
Bovis Homes Group plc (Consumer Discretionary, Household Durables) | | | | | | | | | | | 244,800 | | | | 3,028,343 | |
| | | | |
BP plc (Energy, Oil, Gas & Consumable Fuels) | | | | | | | | | | | 2,015,036 | | | | 13,759,094 | |
| | | | |
BT Group plc (Communication Services, Diversified Telecommunication Services) | | | | | | | | | | | 1,099,700 | | | | 2,693,836 | |
| | | | |
Centrica plc (Utilities, Multi-Utilities) | | | | | | | | | | | 2,517,300 | | | | 2,976,270 | |
| | | | |
Crest Nicholson Holdings plc (Consumer Discretionary, Household Durables) | | | | | | | | | | | 345,400 | | | | 1,600,839 | |
| | | | |
Debenhams plc (Consumer Discretionary, Multiline Retail) «(a)† | | | | | | | | | | | 395,800 | | | | 0 | |
| | | | |
Firstgroup plc (Industrials, Road & Rail) † | | | | | | | | | | | 952,400 | | | | 1,388,294 | |
| | | | |
GlaxoSmithKline plc (Health Care, Pharmaceuticals) | | | | | | | | | | | 965,207 | | | | 18,633,410 | |
| | | | |
Highland Gold Mining Limited (Materials, Metals & Mining) « | | | | | | | | | | | 1,280,734 | | | | 2,691,056 | |
| | | | |
Imperial Tobacco Group plc (Consumer Staples, Tobacco) | | | | | | | | | | | 283,391 | | | | 6,861,004 | |
| | | | |
Inchcape plc (Consumer Discretionary, Distributors) | | | | | | | | | | | 423,425 | | | | 3,136,945 | |
| | | | |
J Sainsbury plc (Consumer Staples, Food & Staples Retailing) | | | | | | | | | | | 1,270,500 | | | | 3,214,065 | |
| | | | |
Kingfisher plc (Consumer Discretionary, Specialty Retail) | | | | | | | | | | | 1,323,253 | | | | 3,578,381 | |
| | | | |
Legal & General Group plc (Financials, Insurance) | | | | | | | | | | | 2,314,194 | | | | 7,507,395 | |
| | | | |
Lloyds Banking Group plc (Financials, Banks) | | | | | | | | | | | 8,916,700 | | | | 6,454,883 | |
| | | | |
Marks & Spencer Group plc (Consumer Discretionary, Multiline Retail) | | | | | | | | | | | 705,000 | | | | 2,007,199 | |
| | | | |
Marston’s plc (Consumer Discretionary, Hotels, Restaurants & Leisure) | | | | | | | | | | | 893,000 | | | | 1,209,132 | |
| | | | |
Mitchells & Butlers plc (Consumer Discretionary, Hotels, Restaurants & Leisure) † | | | | | | | | | | | 367,200 | | | | 1,285,924 | |
| | | | |
Paragon Group of Companies plc (Financials, Thrifts & Mortgage Finance) | | | | | | | | | | | 501,100 | | | | 2,754,525 | |
| | | | |
Petrofac Limited (Energy, Energy Equipment & Services) | | | | | | | | | | | 522,047 | | | | 2,733,051 | |
| | | | |
Premier Foods plc (Consumer Staples, Food Products) † | | | | | | | | | | | 73,926 | | | | 33,179 | |
| | | | |
QinetiQ Group plc (Industrials, Aerospace & Defense) | | | | | | | | | | | 773,800 | | | | 2,850,697 | |
The accompanying notes are an integral part of these financial statements.
| | | | |
| 32 | | Wells Fargo International Value Portfolio | | Portfolio of investments—May 31, 2019 |
| | | | | | | | | | | | | | | | |
| Security name | | | | | | | | Shares | | | Value | |
|
| United Kingdom(continued) | |
| | | | |
Quilter plc (Financials, Capital Markets) | | | | | | | | | | | 615,246 | | | $ | 1,028,751 | |
| | | | |
Redrow plc (Consumer Discretionary, Household Durables) | | | | | | | | | | | 420,064 | | | | 2,894,308 | |
| | | | |
Royal Dutch Shell plc Class B (Energy, Oil, Gas & Consumable Fuels) | | | | | | | | | | | 740,200 | | | | 23,146,954 | |
| | | | |
Royal Mail plc (Industrials, Air Freight & Logistics) | | | | | | | | | | | 539,626 | | | | 1,399,920 | |
| | | | |
Tate & Lyle plc (Consumer Staples, Food Products) | | | | | | | | | | | 497,300 | | | | 4,540,553 | |
| | | | |
The Berkeley Group Holdings plc (Consumer Discretionary, Household Durables) | | | | | | | | | | | 75,800 | | | | 3,350,221 | |
| | | | |
The Restaurant Group plc (Consumer Discretionary, Hotels, Restaurants & Leisure) | | | | | | | | | | | 338,594 | | | | 558,628 | |
| |
| | | | 161,221,420 | |
| | | | | | | | | | | | | | | | |
| |
Total Common Stocks (Cost $1,117,875,331) | | | | 1,026,590,391 | |
| | | | | | | | | | | | | | | | |
| | | | |
| | | Dividend yield | | | | | | | | | | |
| Preferred Stocks: 0.99% | |
|
| Brazil: 0.99% | |
| | | | |
Banco do Estado do Rio Grande do Sul SA Class B (Financials, Banks) | | | 0.37 | % | | | | | | | 957,800 | | | | 5,797,156 | |
| | | | |
Itaúsa Investimentos Itaú SA (Financials, Banks) | | | 6.02 | | | | | | | | 1,524,600 | | | | 4,813,974 | |
| |
Total Preferred Stocks (Cost $8,754,221) | | | | 10,611,130 | |
| | | | | | | | | | | | | | | | |
| | | | |
| | | | | | Expiration date | | | | | | | |
| Rights: 0.01% | |
|
| United Kingdom: 0.01% | |
| | | | |
Marks & Spencer Group plc (Consumer Discretionary, Multiline Retail) † | | | | | | | 11-6-2019 | | | | 141,000 | | | | 69,521 | |
| | | | | | | | | | | | | | | | |
| |
Total Rights (Cost $0) | | | | 69,521 | |
| | | | | | | | | | | | | | | | |
| | | | |
| | | Yield | | | | | | | | | | |
| Short-Term Investments: 6.64% | |
|
| Investment Companies: 6.64% | |
| | | | |
Securities Lending Cash Investments LLC (l)(r)(u) | | | 2.51 | | | | | | | | 64,602,214 | | | | 64,608,675 | |
| | | | |
Wells Fargo Government Money Market Fund Select Class (l)(u) | | | 2.30 | | | | | | | | 6,351,554 | | | | 6,351,554 | |
| |
Total Short-Term Investments (Cost $70,959,934) | | | | 70,960,229 | |
| | | | | | | | | | | | | | | | |
| | | | | | | | |
| Total investments in securities (Cost $1,197,589,486) | | | 103.70 | % | | | 1,108,231,271 | |
| | |
Other assets and liabilities, net | | | (3.70 | ) | | | (39,490,518 | ) |
| | | | | | | | |
| Total net assets | | | 100.00 | % | | $ | 1,068,740,753 | |
| | | | | | | | |
| † | Non-income-earning security |
| « | All or a portion of this security is on loan. |
| (l) | The issuer of the security is an affiliated person of the Portfolio as defined in the Investment Company Act of 1940. |
| (r) | The investment is anon-registered investment company purchased with cash collateral received from securities on loan. |
| (u) | The rate represents the7-day annualized yield at period end. |
| 144A | The security may be resold in transactions exempt from registration, normally to qualified institutional buyers, pursuant to Rule 144A under the Securities Act of 1933. |
| (a) | The security is fair valued in accordance with procedures approved by the Board of Trustees. |
The accompanying notes are an integral part of these financial statements.
| | | | | | |
| Portfolio of investments—May 31, 2019 | | Wells Fargo International Value Portfolio | | | 33 | |
Abbreviations:
| ADR | American depositary receipt |
| GDR | Global depositary receipt |
| REIT | Real estate investment trust |
The following table shows the percent of total long-term investments by sector as of May 31, 2019:
| | | | |
Financials | | | 24.19 | % |
Industrials | | | 15.86 | |
Materials | | | 10.40 | |
Consumer Discretionary | | | 10.18 | |
Energy | | | 9.62 | |
Health Care | | | 8.81 | |
Consumer Staples | | | 7.42 | |
Communication Services | | | 5.50 | |
Utilities | | | 3.72 | |
Information Technology | | | 2.88 | |
Real Estate | | | 1.42 | |
| | | | |
| | | 100.00 | % |
| | | | |
Investments in Affiliates
An affiliated investment is an investment in which the Portfolio owns at least 5% of the outstanding voting shares of the issuer or as a result of other relationships, such as the Portfolio and the issuer having the same investment manager. Transactions with issuers that were either affiliated persons of the Portfolio at the beginning of the period or the end of the period were as follows:
| | | | | | | | | | | | | | | | | | | | | | | | | | | | | | | | | | | | |
| | | Shares,
beginning of
period | | | Shares
purchased | | | Shares
sold | | | Shares,
end of
period | | | Net
realized
gains
(losses) | | | Net
change in
unrealized
gains
(losses) | | | Income
from
affiliated
securities | | | Value,
end
of period | | | % of
net
assets | |
Short-Term Investments | | | | | | | | | | | | | | | | | | | | | | | | | | | | | | | | | | | | |
Investment Companies | | | | | | | | | | | | | | | | | | | | | | | | | | | | | | | | | | | | |
Securities Lending Cash Investments LLC | | | 25,301,762 | | | | 423,232,972 | | | | 383,932,520 | | | | 64,602,214 | | | $ | 1,929 | | | $ | 0 | | | $ | 681,812 | | | $ | 64,608,675 | | | | | |
Wells Fargo Government Money Market Fund Select Class | | | 22,685,533 | | | | 145,511,964 | | | | 161,845,943 | | | | 6,351,554 | | | | 0 | | | | 0 | | | | 211,473 | | | | 6,351,554 | | | | | |
| | | | | | | | | | | | | | | | | | | | | | | | | | | | | | | | | | | | |
| | | | | | | | | |
| | | | | | | | | | | | | | | | | | $ | 1,929 | | | $ | 0 | | | $ | 893,285 | | | $ | 70,960,229 | | | | 6.64 | % |
| | | | | | | | | | | | | | | | | | | | | | | | | | | | | | | | | | | | |
The accompanying notes are an integral part of these financial statements.
| | | | |
| 34 | | Wells Fargo International Value Portfolio | | Statement of assets and liabilities—May 31, 2019 |
| | | | |
| | | | |
| |
Assets | | | | |
Investments in unaffiliated securities (including $60,224,944 of securities loaned), at value (cost $1,126,629,552) | | $ | 1,037,271,042 | |
Investments in affiliated securities, at value ($70,959,934) | | | 70,960,229 | |
Foreign currency, at value (cost $14,555,542) | | | 14,255,493 | |
Receivable for investments sold | | | 929,976 | |
Receivable for dividends | | | 11,744,738 | |
Receivable for securities lending income, net | | | 565,987 | |
Prepaid expenses and other assets | | | 15,141 | |
| | | | |
Total assets | | | 1,135,742,606 | |
| | | | |
| |
Liabilities | | | | |
Payable upon receipt of securities loaned | | | 64,604,389 | |
Payable for investments purchased | | | 1,463,921 | |
Advisory fee payable | | | 758,280 | |
Accrued expenses and other liabilities | | | 175,263 | |
| | | | |
Total liabilities | | | 67,001,853 | |
| | | | |
Total net assets | | $ | 1,068,740,753 | |
| | | | |
The accompanying notes are an integral part of these financial statements.
| | | | | | |
| Statement of operations—year ended May 31, 2019 | | Wells Fargo International Value Portfolio | | | 35 | |
| | | | |
| | | | |
| |
Investment income | | | | |
Dividends (net of foreign withholding taxes of $6,569,923) | | $ | 47,548,301 | |
Income from affiliated securities | | | 1,719,287 | |
| | | | |
Total investment income | | | 49,267,588 | |
| | | | |
| |
Expenses | | | | |
Advisory fee | | | 8,720,811 | |
Custody and accounting fees | | | 196,418 | |
Professional fees | | | 60,999 | |
Shareholder report expenses | | | 2,653 | |
Trustees’ fees and expenses | | | 20,997 | |
Interest expense | | | 6,773 | |
Other fees and expenses | | | 48,085 | |
| | | | |
Total expenses | | | 9,056,736 | |
| | | | |
Net investment income | | | 40,210,852 | |
| | | | |
| |
REALIZED AND UNREALIZED GAINS (LOSSES) ON INVESTMENTS | | | | |
| |
Net realized gains (losses) on: | | | | |
Unaffiliated securities | | | (6,399,421 | ) |
Affiliated securities | | | 1,929 | |
| | | | |
Net realized losses on investments | | | (6,397,492 | ) |
Net change in unrealized gains (losses) on investments | | | (155,017,981 | ) |
| | | | |
Net realized and unrealized gains (losses) on investments | | | (161,415,473 | ) |
| | | | |
Net decrease in net assets resulting from operations | | $ | (121,204,621 | ) |
| | | | |
The accompanying notes are an integral part of these financial statements.
| | | | |
| 36 | | Wells Fargo International Value Portfolio | | Statement of changes in net assets |
| | | | | | | | |
| | | Year ended
May 31, 2019 | | | Year ended
May 31, 2018 | |
|
Operations | |
Net investment income | | $ | 40,210,852 | | | $ | 22,286,555 | |
Net realized gains (losses) on investments | | | (6,397,492 | ) | | | 15,107,292 | |
Net change in unrealized gains (losses) on investments | | | (155,017,981 | ) | | | 21,851,248 | |
| | | | |
Net increase (decrease) in net assets resulting from operations | | | (121,204,621 | ) | | | 59,245,095 | |
| | | | | | | | |
| |
Capital transactions | | | | |
Transactions in investors’ beneficial interests | |
Contributions | | | 527,916,476 | | | | 197,415,479 | |
Withdrawals | | | (237,901,170 | ) | | | (109,368,233 | ) |
| | | | |
Net increase in net assets resulting from capital transactions | | | 290,015,306 | | | | 88,047,246 | |
| | | | | | | | |
Total increase in net assets | | | 168,810,685 | | | | 147,292,341 | |
| | | | |
| |
Net assets | | | | |
Beginning of period | | | 899,930,068 | | | | 752,637,727 | |
| | | | |
End of period | | $ | 1,068,740,753 | | | $ | 899,930,068 | |
| | | | |
The accompanying notes are an integral part of these financial statements.
| | | | | | |
| Financial highlights | | Wells Fargo International Value Portfolio | | | 37 | |
| | | | | | | | | | | | | | | | | | | | |
| | | Year ended May 31 | |
| | | 2019 | | | 2018 | | | 2017 | | | 2016 | | | 2015 | |
Total return | | | (10.98 | )% | | | 7.74 | % | | | 19.16 | % | | | (11.85 | )% | | | (1.04 | )% |
Ratios to average net assets (annualized) | | | | | | | | | | | | | | | | | | | | |
Gross expenses | | | 0.80 | % | | | 0.82 | % | | | 0.87 | % | | | 0.91 | % | | | 0.91 | % |
Net expenses | | | 0.80 | % | | | 0.82 | % | | | 0.87 | % | | | 0.91 | % | | | 0.91 | % |
Net investment income | | | 3.53 | % | | | 2.65 | % | | | 3.03 | % | | | 2.50 | % | | | 2.45 | % |
Supplemental data | | | | | | | | | | | | | | | | | | | | |
Portfolio turnover rate | | | 13 | % | | | 15 | % | | | 41 | % | | | 14 | % | | | 18 | % |
The accompanying notes are an integral part of these financial statements.
| | | | |
| 38 | | Wells Fargo International Value Portfolio | | Notes to financial statements |
1. ORGANIZATION
Wells Fargo Master Trust (the “Trust”), a Delaware statutory trust organized on March 10, 1999, is anopen-end management investment company registered under the Investment Company Act of 1940, as amended (the “1940 Act”). As an investment company, the Trust follows the accounting and reporting guidance in Financial Accounting Standards Board (“FASB”)Accounting Standards Codification Topic 946, Financial Services – Investment Companies. These financial statements report on the Wells Fargo International Value Portfolio (the “Portfolio”) which is a diversified series of the Trust.
2. SIGNIFICANT ACCOUNTING POLICIES
The following significant accounting policies, which are consistently followed in the preparation of the financial statements of the Portfolio, are in conformity with U.S. generally accepted accounting principles which require management to make estimates and assumptions that affect the reported amounts of assets and liabilities, disclosure of contingent assets and liabilities at the date of the financial statements, and the reported amounts of revenues and expenses during the reporting period. Actual results could differ from those estimates.
Securities valuation
All investments are valued each business day as of the close of regular trading on the New York Stock Exchange (generally 4 p.m. Eastern Time), although the Portfolio may deviate from this calculation time under unusual or unexpected circumstances.
Equity securities that are listed on a foreign or domestic exchange or market are valued at the official closing price or, if none, the last sales price. If no sale occurs on the principal exchange or market that day, a fair value price will be determined in accordance with the Portfolio’s Valuation Procedures.
The values of securities denominated in foreign currencies are translated into U.S. dollars at rates provided by an independent foreign currency pricing source at a time each business day specified by the Wells Fargo Asset Management Pricing Committee at Wells Fargo Funds Management, LLC (“Funds Management”).
Many securities markets and exchanges outside the U.S. close prior to the close of the New York Stock Exchange and therefore may not fully reflect trading or events that occur after the close of the principal exchange in which the foreign securities are traded, but before the close of the New York Stock Exchange. If such trading or events are expected to materially affect the value of such securities, then fair value pricing procedures approved by the Board of Trustees of the Portfolio are applied. These procedures take into account multiple factors including movements in U.S. securities markets after foreign exchanges close. Foreign securities that are fair valued under these procedures are categorized as Level 2 and the application of these procedures may result in transfers between Level 1 and Level 2. Depending on market activity, such fair valuations may be frequent. Such fair value pricing may result in net asset values that are higher or lower than net asset values based on the last reported sales price or latest quoted bid price. On May 31, 2019, such fair value pricing was used in pricing certain foreign securities.
Investments in registeredopen-end investment companies are valued at net asset value. Interests innon-registered investment companies that are redeemable at net asset value are fair valued normally at net asset value.
Investments which are not valued using any of the methods discussed above are valued at their fair value, as determined in good faith by the Board of Trustees. The Board of Trustees has established a Valuation Committee comprised of the Trustees and has delegated to it the authority to take any actions regarding the valuation of portfolio securities that the Valuation Committee deems necessary or appropriate, including determining the fair value of portfolio securities, unless the determination has been delegated to the Wells Fargo Asset Management Pricing Committee. The Board of Trustees retains the authority to make or ratify any valuation decisions or approve any changes to the Valuation Procedures as it deems appropriate. On a quarterly basis, the Board of Trustees receives reports on any valuation actions taken by the Valuation Committee or the Wells Fargo Asset Management Pricing Committee which may include items for ratification.
Foreign currency translation
The accounting records of the Portfolio are maintained in U.S. dollars. The values of other assets and liabilities denominated in foreign currencies are translated into U.S. dollars at rates provided by an independent foreign currency pricing source at a time each business day specified by the Wells Fargo Asset Management Pricing Committee. Purchases and sales of securities, and income and expenses are converted at the rate of exchange on the respective dates of such transactions. Net realized foreign exchange gains or losses arise from sales of foreign currencies, currency gains or losses realized between the trade and settlement dates on securities transactions, and the difference between the amounts of dividends, interest and foreign withholding taxes recorded and the U.S. dollar equivalent of the amounts actually paid or received. Net unrealized foreign exchange gains and losses arise from changes in the fair value of assets and liabilities other than investments in securities resulting from changes in exchange rates. The changes in net assets arising from changes in exchange rates of securities and the changes in net assets resulting from changes in market prices of securities are not separately presented. Such changes are included in net realized and unrealized gains or losses from investments.
| | | | | | |
| Notes to financial statements | | Wells Fargo International Value Portfolio | | | 39 | |
Securities lending
The Portfolio may lend its securities from time to time in order to earn additional income in the form of fees or interest on securities received as collateral or the investment of any cash received as collateral. When securities are on loan, the Portfolio receives interest or dividends on the securities loaned. The Portfolio receives collateral in the form of cash or securities with a value at least equal to the value of the securities on loan. The value of the loaned securities is determined at the close of each business day and any additional required collateral is delivered to the Portfolio on the next business day. In a securities lending transaction, the net asset value of the Portfolio will be affected by an increase or decrease in the value of the securities loaned and by an increase or decrease in the value of the instrument in which collateral is invested. The amount of securities lending activity undertaken by the Portfolio fluctuates from time to time. In the event of default or bankruptcy by the borrower, the Portfolio may be prevented from recovering the loaned securities or gaining access to the collateral or may experience delays or costs in doing so. In addition, the investment of any cash collateral received may lose all or part of its value. The Portfolio has the right under the lending agreement to recover the securities from the borrower on demand.
The Portfolio lends its securities through an unaffiliated securities lending agent. Cash collateral received in connection with its securities lending transactions is invested in Securities Lending Cash Investments, LLC (the “Securities Lending Fund”). The Securities Lending Fund is exempt from registration under Section 3(c)(7) of the 1940 Act and is managed by Funds Management and is subadvised by Wells Capital Management Incorporated (“WellsCap”), an affiliate of Funds Management and an indirect wholly owned subsidiary of Wells Fargo & Company (“Wells Fargo”). Funds Management receives an advisory fee starting at 0.05% and declining to 0.01% as the average daily net assets of the Securities Lending Fund increase. All of the fees received by Funds Management are paid to WellsCap for its services as subadviser. The Securities Lending Fund seeks to provide a positive return compared to the daily Fed Funds Open Rate by investing in high-quality, U.S. dollar-denominated short-term money market instruments. Securities Lending Fund investments are valued at the evaluated bid price provided by an independent pricing service. Income earned from investment in the Securities Lending Fund (net of fees and rebates), if any, is included in income from affiliated securities on the Statement of Operations.
Security transactions and income recognition
Securities transactions are recorded on a trade date basis. Realized gains or losses are recorded on the basis of identified cost.
Dividend income is recognized on theex-dividend date, except for certain dividends from foreign securities, which are recorded as soon as the custodian verifies theex-dividend date. Dividend income from foreign securities is recorded net of foreign taxes withheld where recovery of such taxes is not assured.
Federal and other taxes
The Portfolio is treated as a separate entity for federal income tax purposes. The Portfolio is not required to pay federal income taxes on its net investment income and net capital gains as it is treated as a partnership for federal income tax purposes. All dividends, gains and losses of the Portfolio are deemed to have been “passed through” to the interest holders in proportion to their holdings of the Portfolio regardless of whether such dividends and gains have been distributed by the Portfolio.
The Portfolio’s income tax returns and all financial records supporting those returns for the prior three fiscal years are subject to examination by the federal revenue authority. Management has analyzed the Portfolio’s tax positions taken on federal, state, and foreign tax returns for all open tax years and does not believe that there are any uncertain tax positions that require recognition of a tax liability.
As of May 31, 2019, the aggregate cost of all investments for federal income tax purposes was $1,201,886,158 and the unrealized gains (losses) consisted of:
| | | | |
| |
Gross unrealized gains | | $ | 81,744,116 | |
| |
Gross unrealized losses | | | (175,399,003 | ) |
| |
Net unrealized losses | | $ | (93,654,887 | ) |
3. FAIR VALUATION MEASUREMENTS
Fair value measurements of investments are determined within a framework that has established a fair value hierarchy based upon the various data inputs utilized in determining the value of the Portfolio’s investments. The three-level hierarchy gives the highest priority to unadjusted quoted prices in active markets for identical assets or liabilities (Level 1) and the lowest priority to unobservable inputs (Level 3). The Portfolio’s investments are classified within the fair value hierarchy based on the lowest level of input that is significant to the fair value measurement. The inputs are summarized into three broad levels as follows:
| | | | |
| 40 | | Wells Fargo International Value Portfolio | | Notes to financial statements |
| ∎ | | Level 1 – quoted prices in active markets for identical securities |
| ∎ | | Level 2 – other significant observable inputs (including quoted prices for similar securities, interest rates, prepayment speeds, credit risk, etc.) |
| ∎ | | Level 3 – significant unobservable inputs (including the Portfolio’s own assumptions in determining the fair value of investments) |
The inputs or methodologies used for valuing investments in securities are not necessarily an indication of the risk associated with investing in those securities.
The following is a summary of the inputs used in valuing the Portfolio’s assets and liabilities as of May 31, 2019:
| | | | | | | | | | | | | | | | |
| | | | |
| | | Quoted prices (Level 1) | | | Other significant observable Inputs (Level 2) | | | Significant
unobservable inputs (Level 3) | | | Total | |
| | | | |
Assets | | | | | | | | | | | | | | | | |
Investments in: | | | | | | | | | | | | | | | | |
| | | | |
Common stocks | | | | | | | | | | | | | | | | |
| | | | |
Australia | | $ | 59,774,589 | | | $ | 0 | | | $ | 0 | | | $ | 59,774,589 | |
| | | | |
Austria | | | 8,626,472 | | | | 0 | | | | 0 | | | | 8,626,472 | |
| | | | |
Belgium | | | 6,576,303 | | | | 0 | | | | 0 | | | | 6,576,303 | |
| | | | |
Brazil | | | 12,514,796 | | | | 0 | | | | 0 | | | | 12,514,796 | |
| | | | |
Canada | | | 10,662,764 | | | | 0 | | | | 0 | | | | 10,662,764 | |
| | | | |
China | | | 36,602,947 | | | | 0 | | | | 0 | | | | 36,602,947 | |
| | | | |
Denmark | | | 0 | | | | 6,643,383 | | | | 0 | | | | 6,643,383 | |
| | | | |
Finland | | | 6,437,782 | | | | 0 | | | | 0 | | | | 6,437,782 | |
| | | | |
France | | | 96,033,749 | | | | 0 | | | | 0 | | | | 96,033,749 | |
| | | | |
Germany | | | 79,980,171 | | | | 0 | | | | 0 | | | | 79,980,171 | |
| | | | |
Hong Kong | | | 28,471,773 | | | | 0 | | | | 0 | | | | 28,471,773 | |
| | | | |
India | | | 5,609,233 | | | | 0 | | | | 0 | | | | 5,609,233 | |
| | | | |
Ireland | | | 7,259,723 | | | | 0 | | | | 0 | | | | 7,259,723 | |
| | | | |
Israel | | | 0 | | | | 3,489,271 | | | | 0 | | | | 3,489,271 | |
| | | | |
Italy | | | 26,582,732 | | | | 0 | | | | 0 | | | | 26,582,732 | |
| | | | |
Japan | | | 231,512,488 | | | | 0 | | | | 0 | | | | 231,512,488 | |
| | | | |
Liechtenstein | | | 216,508 | | | | 0 | | | | 0 | | | | 216,508 | |
| | | | |
Malaysia | | | 3,219,778 | | | | 0 | | | | 0 | | | | 3,219,778 | |
| | | | |
Netherlands | | | 30,760,741 | | | | 0 | | | | 0 | | | | 30,760,741 | |
| | | | |
Norway | | | 15,101,526 | | | | 0 | | | | 0 | | | | 15,101,526 | |
| | | | |
Poland | | | 1,245,268 | | | | 0 | | | | 0 | | | | 1,245,268 | |
| | | | |
Russia | | | 16,779,577 | | | | 0 | | | | 0 | | | | 16,779,577 | |
| | | | |
Singapore | | | 6,432,993 | | | | 0 | | | | 0 | | | | 6,432,993 | |
| | | | |
South Africa | | | 3,189,434 | | | | 0 | | | | 0 | | | | 3,189,434 | |
| | | | |
South Korea | | | 23,697,571 | | | | 0 | | | | 0 | | | | 23,697,571 | |
| | | | |
Spain | | | 18,984,991 | | | | 0 | | | | 0 | | | | 18,984,991 | |
| | | | |
Sweden | | | 21,643,784 | | | | 45,876 | | | | 0 | | | | 21,689,660 | |
| | | | |
Switzerland | | | 75,425,392 | | | | 0 | | | | 0 | | | | 75,425,392 | |
| | | | |
Taiwan | | | 5,985,065 | | | | 0 | | | | 0 | | | | 5,985,065 | |
| | | | |
Thailand | | | 10,645,683 | | | | 0 | | | | 0 | | | | 10,645,683 | |
| | | | |
Turkey | | | 5,216,608 | | | | 0 | | | | 0 | | | | 5,216,608 | |
| | | | |
United Kingdom | | | 161,221,420 | | | | 0 | | | | 0 | | | | 61,221,420 | |
| | | | |
Preferred stocks | | | | | | | | | | | | | | | | |
| | | | |
Brazil | | | 10,611,130 | | | | 0 | | | | 0 | | | | 10,611,130 | |
| | | | |
Rights | | | | | | | | | | | | | | | | |
| | | | |
United Kingdom | | | 0 | | | | 69,521 | | | | 0 | | | | 69,521 | |
| | | | |
Short-term investments | | | | | | | | | | | | | | | | |
| | | | |
Investment companies | | | 6,351,554 | | | | 64,608,675 | | | | 0 | | | | 70,960,229 | |
| | | | |
Total assets | | $ | 1,033,374,545 | | | $ | 74,856,726 | | | $ | 0 | | | $ | 1,108,231,271 | |
| | | | | | |
| Notes to financial statements | | Wells Fargo International Value Portfolio | | | 41 | |
Additional sector, industry or geographic detail is included in the Portfolio of Investments.
At May 31, 2019, the Portfolio did not have any transfers into/out of Level 3.
4. TRANSACTIONS WITH AFFILIATES AND OTHER EXPENSES
Advisory fee
The Trust has entered into an advisory contract with Funds Management, an indirect wholly owned subsidiary of Wells Fargo. The adviser is responsible for implementing investment policies and guidelines and for supervising the subadviser, who is responsible forday-to-day portfolio management of the Portfolio. Pursuant to the contract, Funds Management is entitled to receive an annual advisory fee at the following annual rate based on the Portfolio’s average daily net assets:
| | |
| Average daily net assets | | Advisory fee |
| |
First $500 million | | 0.800% |
| |
Next $500 million | | 0.750 |
| |
Next $1 billion | | 0.700 |
| |
Next $2 billion | | 0.675 |
| |
Over $4 billion | | 0.650 |
For the year ended May 31, 2019, the advisory fee was equivalent to an annual rate of 0.77% of the Portfolio’s average daily net assets.
Funds Management has retained the services of a subadviser to provide daily portfolio management to the Portfolio. The fee for subadvisory services is borne by Funds Management. LSV Asset Management, which is not an affiliate of the Funds Management, is the subadviser to the Portfolio and is entitled to receive a fee from Funds Management at an annual rate starting at 0.35% and declining to 0.30% as the average daily net assets of the Portfolio increase.
Interfund transactions
The Portfolio may purchase or sell portfolio investment securities to certain other Wells Fargo affiliates pursuant toRule 17a-7 under the 1940 Act and under procedures adopted by the Board of Trustees. The procedures have been designed to ensure that these interfund transactions, which do not incur broker commissions, are effected at current market prices. Pursuant to these procedures, the Portfolio had $268,840,363 and $0 in interfund purchases and sales, respectively, during the year ended May 31, 2019.
5. INVESTMENT PORTFOLIO TRANSACTIONS
Purchases and sales of investments, excluding U.S. government obligations (if any) and short-term securities, for the year ended May 31, 2019 were $464,433,298 and $140,833,689, respectively.
6. BANK BORROWINGS
Effective August 28, 2018, the Trust, along with Wells Fargo Variable Trust and Wells Fargo Funds Trust (excluding the money market funds), are parties to a $280,000,000 revolving credit agreement whereby the Portfolio is permitted to use bank borrowings for temporary or emergency purposes, such as to fund shareholder redemption requests. Interest under the credit agreement is charged to the Portfolio based on a borrowing rate equal to the higher of the Federal Funds rate in effect on that day plus 1.25% or the overnight LIBOR rate in effect on that day plus 1.25%. In addition, an annual commitment fee equal to 0.25% of the unused balance is allocated to each participating fund.
During the year ended May 31, 2019, the Portfolio had average borrowings outstanding of $180,613 at an average rate of 3.75% and paid interest in the amount of $6,773.
7. INDEMNIFICATION
Under the Trust’s organizational documents, the officers and Trustees have been granted certain indemnification rights against certain liabilities that may arise out of performance of their duties to the Trust. Additionally, in the normal course of business, the Trust may enter into contracts with service providers that contain a variety of indemnification clauses. The Trust’s maximum exposure under these arrangements is dependent on future claims that may be made against the Portfolio and, therefore, cannot be estimated.
| | | | |
| 42 | | Wells Fargo International Value Portfolio | | Notes to financial statements |
8. NEW ACCOUNTING PRONOUNCEMENT
In August 2018, FASB issued Accounting Standards Update (“ASU”)No. 2018-13, Fair Value Measurement (Topic 820)Disclosure Framework—Changes to the Disclosure Requirements for Fair Value Measurement. ASU2018-13 updates the disclosure requirements for fair value measurements by modifying or removing certain disclosures and adding certain new disclosures. The amendments are effective for fiscal years, and interim periods within those fiscal years, beginning after December 15, 2019. Early adoption is permitted. Management has adopted the removal and modification of disclosures early, as permitted, and will adopt the additional new disclosures at the effective date.
| | | | | | |
| Report of independent registered public accounting firm | | Wells Fargo International Value Portfolio | | | 43 | |
TO THE SHAREHOLDERS OF THE PORTFOLIO AND BOARD OF TRUSTEES OF WELLS FARGO MASTER TRUST:
Opinion on the Financial Statements
We have audited the accompanying statement of assets and liabilities of Wells Fargo International Value Portfolio (the Portfolio), one of the portfolios constituting Wells Fargo Master Trust, including the portfolio of investments, as of May 31, 2019, the related statement of operations for the year then ended, the statements of changes in net assets for each of the years in the two-year period then ended, and the related notes (collectively, the financial statements) and the financial highlights for each of the years in the five-year period then ended. In our opinion, the financial statements and financial highlights present fairly, in all material respects, the financial position of the Portfolio as of May 31, 2019, the results of its operations for the year then ended, the changes in its net assets for each of the years in the two-year period then ended, and the financial highlights for each of the years in the five-year period then ended, in conformity with U.S. generally accepted accounting principles.
Basis for Opinion
These financial statements and financial highlights are the responsibility of the Portfolio’s management. Our responsibility is to express an opinion on these financial statements and financial highlights based on our audits. We are a public accounting firm registered with the Public Company Accounting Oversight Board (United States) (PCAOB) and are required to be independent with respect to the Portfolio in accordance with the U.S. federal securities laws and the applicable rules and regulations of the Securities and Exchange Commission and the PCAOB.
We conducted our audits in accordance with the standards of the PCAOB. Those standards require that we plan and perform the audit to obtain reasonable assurance about whether the financial statements and financial highlights are free of material misstatement, whether due to error or fraud. Our audits included performing procedures to assess the risks of material misstatement of the financial statements and financial highlights, whether due to error or fraud, and performing procedures that respond to those risks. Such procedures included examining, on a test basis, evidence regarding the amounts and disclosures in the financial statements and financial highlights. Such procedures also included confirmation of securities owned as of May 31, 2019, by correspondence with the custodian and brokers, or by other appropriate auditing procedures. Our audits also included evaluating the accounting principles used and significant estimates made by management, as well as evaluating the overall presentation of the financial statements and financial highlights. We believe that our audits provide a reasonable basis for our opinion.
We have not been able to determine the specific year that we began serving as the auditor of one or more Wells Fargo Funds investment companies; however we are aware that we have served as the auditor of one or more Wells Fargo Funds investment companies since at least 1955.
Boston, Massachusetts
July 26, 2019
| | | | |
| 44 | | Wells Fargo International Value Fund | | Other information (unaudited) |
TAX INFORMATION
Pursuant to Section 854 of the Internal Revenue Code, $21,427,508 of income dividends paid during the fiscal year ended May 31, 2019 has been designated as qualified dividend income (QDI).
Pursuant to Section 853 of the Internal Revenue Code, the Fund expects to designate amounts as foreign taxes paid for the fiscal year ended May 31, 2019. Additional details will be available in the semiannual report.
PROXY VOTING INFORMATION
A description of the policies and procedures used to determine how to vote proxies relating to portfolio securities is available, upon request, by calling1-800-222-8222, visiting our website atwfam.com, or visiting the SEC website at sec.gov. Information regarding how the proxies related to portfolio securities were voted during the most recent12-month period ended June 30 is available on the website atwfam.comor by visiting the SEC website at sec.gov.
QUARTERLY PORTFOLIO HOLDINGS
The Fund and Portfolio file their complete schedule of portfolio holdings with the SEC for the first and third quarters of each fiscal year on Form N-Q, which is available by visiting the SEC website at sec.gov. Those forms may be reviewed and copied at the SEC’s Public Reference Room in Washington, DC. Information on the operation of the Public Reference Room may be obtained by calling 1-800-SEC-0330.
| | | | | | |
| Other information (unaudited) | | Wells Fargo International Value Fund | | | 45 | |
BOARD OF TRUSTEES AND OFFICERS
Each of the Trustees and Officers1 listed in the table below acts in identical capacities for each fund in the Wells Fargo family of funds, which consists of 151 mutual funds comprising the Wells Fargo Funds Trust, Wells Fargo Variable Trust, Wells Fargo Master Trust and fourclosed-end funds (collectively the “Fund Complex”). This table should be read in conjunction with the Prospectus and the Statement of Additional Information2. The mailing address of each Trustee and Officer is 525 Market Street, 12th Floor, San Francisco, CA 94105. Each Trustee and Officer serves an indefinite term, however, each Trustee serves such term until reaching the mandatory retirement age established by the Trustees.
Independent Trustees
| | | | | | |
Name and year of birth | | Position held and length of service* | | Principal occupations during past five years or longer | | Current other public company or
investment company
directorships |
| | | |
William R. Ebsworth (Born 1957) | | Trustee, since 2015 | | Retired. From 1984 to 2013, equities analyst, portfolio manager, research director and chief investment officer at Fidelity Management and Research Company in Boston, Tokyo, and Hong Kong, and retired in 2013 as Chief Investment Officer of Fidelity Strategic Advisers, Inc. where he led a team of investment professionals managing client assets. Prior thereto, Board member of Hong Kong Securities Clearing Co., Hong Kong Options Clearing Corp., the Thailand International Fund, Ltd., Fidelity Investments Life Insurance Company, and Empire Fidelity Investments Life Insurance Company. Audit Committee Chair and Investment Committee Chair of the Vincent Memorial Hospital Endowment(non-profit organization). Mr. Ebsworth is a CFA® charterholder. | | N/A |
| | | |
Jane A. Freeman (Born 1953) | | Trustee, since 2015; Chair Liaison, since 2018 | | Retired. From 2012 to 2014 and 1999 to 2008, Chief Financial Officer of Scientific Learning Corporation. From 2008 to 2012, Ms. Freeman provided consulting services related to strategic business projects. Prior to 1999, Portfolio Manager at Rockefeller & Co. and Scudder, Stevens & Clark. Board member of the Harding Loevner Funds from 1996 to 2014, serving as both Lead Independent Director and chair of the Audit Committee. Board member of the Russell Exchange Traded Funds Trust from 2011 to 2012 and the chair of the Audit Committee. Ms. Freeman is a Board Member of The Ruth Bancroft Garden(non-profit organization). She is also an inactive Chartered Financial Analyst. | | N/A |
| | | |
Isaiah Harris, Jr. (Born 1952) | | Trustee, since 2009; Audit Committee Chairman, since 2019 | | Retired. Chairman of the Board of CIGNA Corporation since 2009, and Director since 2005. From 2003 to 2011, Director of Deluxe Corporation. Prior thereto, President and CEO of BellSouth Advertising and Publishing Corp. from 2005 to 2007, President and CEO of BellSouth Enterprises from 2004 to 2005 and President of BellSouth Consumer Services from 2000 to 2003. Emeritus member of the Iowa State University Foundation Board of Governors. Emeritus Member of the Advisory Board of Iowa State University School of Business. Advisory Board Member, Palm Harbor Academy (private school). Advisory Board Member, Child Evangelism Fellowship(non-profit). Mr. Harris is a certified public accountant (inactive status). | | CIGNA Corporation |
| | | |
Judith M. Johnson (Born 1949) | | Trustee, since 2008; Audit Committee Chairman, from 2009 to 2018 | | Retired. Prior thereto, Chief Executive Officer and Chief Investment Officer of Minneapolis Employees Retirement Fund from 1996 to 2008. Ms. Johnson is an attorney, certified public accountant and a certified managerial accountant. | | N/A |
| | | | |
| 46 | | Wells Fargo International Value Fund | | Other information (unaudited) |
| | | | | | |
Name and year of birth | | Position held and length of service* | | Principal occupations during past five years or longer | | Current other public company or
investment company
directorships |
| | | |
David F. Larcker (Born 1950) | | Trustee, since 2009 | | James Irvin Miller Professor of Accounting at the Graduate School of Business, Stanford University, Director of the Corporate Governance Research Initiative and Senior Faculty of The Rock Center for Corporate Governance since 2006. From 2005 to 2008, Professor of Accounting at the Graduate School of Business, Stanford University. Prior thereto, Ernst & Young Professor of Accounting at The Wharton School, University of Pennsylvania from 1985 to 2005. | | N/A |
| | | |
Olivia S. Mitchell (Born 1953) | | Trustee, since 2006; Nominating and Governance Committee Chairman, since 2018 | | International Foundation of Employee Benefit Plans Professor, Wharton School of the University of Pennsylvania since 1993. Director of Wharton’s Pension Research Council and Boettner Center on Pensions & Retirement Research, and Research Associate at the National Bureau of Economic Research. Previously, Cornell University Professor from 1978 to 1993. | | N/A |
| | | |
Timothy J. Penny (Born 1951) | | Trustee, since 1996; Chairman, since 2018 | | President and Chief Executive Officer of Southern Minnesota Initiative Foundation, anon-profit organization, since 2007. Member of the Board of Trustees of NorthStar Education Finance, Inc., anon-profit organization, since 2007. | | N/A |
| | | |
James G. Polisson (Born 1959) | | Trustee, since 2018 | | Retired. Chief Marketing Officer, Source (ETF) UK Services, Ltd, from 2015 to 2017. From 2012 to 2015, Principal of The Polisson Group, LLC, a management consulting, corporate advisory and principal investing company. Chief Executive Officer and Managing Director at Russell Investments, Global Exchange Traded Funds from 2010 to 2012. Managing Director of Barclays Global Investors from 1998 to 2010 and Global Chief Marketing Officer for iShares and Barclays Global Investors from 2000 to 2010. Trustee of the San Francisco Mechanics’ Institute, anon-profit organization, from 2013 to 2015. Board member of the Russell Exchange Traded Fund Trust from 2011 to 2012. Director of Barclays Global Investors Holdings Deutschland GmbH from 2006 to 2009. Mr. Polisson is an attorney and has a retired status with the Massachusetts and District of Columbia Bar Associations. | | N/A |
| * | Length of service dates reflect the Trustee’s commencement of service with the Trust’s predecessor entities, where applicable. |
| | | | | | |
| Other information (unaudited) | | Wells Fargo International Value Fund | | | 47 | |
Officers
| | | | | | |
Name and year of birth | | Position held and
length of service | | Principal occupations during past five years or longer | | |
| | | |
Andrew Owen (Born 1960) | | President, since 2017 | | Executive Vice President of Wells Fargo & Company and Head of Affiliated Managers, Wells Fargo Asset Management, since 2014. In addition, Mr. Owen is currently President, Chief Executive Officer and Director of Wells Fargo Funds Management, LLC since 2017. Prior thereto, Executive Vice President responsible for marketing, investments and product development for Wells Fargo Funds Management, LLC, from 2009 to 2014. | | |
| | | |
Jeremy DePalma1 (Born 1974) | | Treasurer, since 2012 | | Senior Vice President of Wells Fargo Funds Management, LLC since 2009. Senior Vice President of Evergreen Investment Management Company, LLC from 2008 to 2010 and head of the Fund Reporting and Control Team within Fund Administration from 2005 to 2010. | | |
| | | |
Alexander Kymn (Born 1973) | | Secretary and Chief Legal Officer, since 2018 | | Senior Company Counsel of Wells Fargo Bank, N.A. since 2018 (previously Senior Counsel from 2007 to 2018). Vice President of Wells Fargo Funds Management, LLC from 2008 to 2014. | | |
| | | |
Michael H. Whitaker (Born 1967) | | Chief Compliance Officer, since 2016 | | Senior Vice President and Chief Compliance Officer since 2016. Senior Vice President and Chief Compliance Officer for Fidelity Investments from 2007 to 2016. | | |
| | | |
David Berardi (Born 1975) | | Assistant Treasurer, since 2009 | | Vice President of Wells Fargo Funds Management, LLC since 2009. Vice President of Evergreen Investment Management Company, LLC from 2008 to 2010. Manager of Fund Reporting and Control for Evergreen Investment Management Company, LLC from 2004 to 2010. | | |
| 1 | Jeremy DePalma acts as Treasurer of 86 funds and Assistant Treasurer of 65 funds in the Fund Complex. |
| 2 | The Statement of Additional Information includes additional information about the Trustees and is available, without charge, upon request, by calling1-800-222-8222 or by visiting the website atwfam.com. |
| | | | |
| 48 | | Wells Fargo International Value Fund | | Other information (unaudited) |
BOARD CONSIDERATION OF INVESTMENT MANAGEMENT, ADVISORY AND SUB-ADVISORY AGREEMENTS:
Wells Fargo International Value Fund and Wells Fargo International Value Portfolio
Under the Investment Company Act of 1940 (the “1940 Act”), the Board of Trustees (each, a “Board” and collectively, the “Boards”) of each of Wells Fargo Funds Trust (“Funds Trust”) and Wells Fargo Master Trust (“Master Trust”, and collectively, the “Trusts”) must determine annually whether to approve the continuation of the Trusts’ investment management, advisory and sub-advisory agreements, as applicable. In this regard, at an in-person meeting held on May 21-22, 2019 (the “Meeting”), the Funds Trust Board, all the members of which have no direct or indirect interest in the investment management agreement and are not “interested persons” of the Trusts, as defined in the 1940 Act (the “Independent Trustees”), reviewed and approved for Wells Fargo International Value Fund (the “Gateway Fund”) an investment management agreement (the “Gateway Fund Management Agreement”) with Wells Fargo Funds Management, LLC (“Funds Management”).
At the Meeting, the Master Trust Board, all the members of which have no direct or indirect interest in the investment advisory and sub-advisory agreements and are Independent Trustees, reviewed and approved: (i) an investment advisory agreement (the “Master Portfolio Advisory Agreement”) with Funds Management for Wells Fargo International Value Portfolio, a portfolio of Master Trust (the “Master Portfolio”); and (ii) an investment sub-advisory agreement (the “Sub-Advisory Agreement”) with LSV Asset Management (the “Sub-Adviser”).
The Gateway Fund and the Master Portfolio are collectively referred to as the “Funds.” The Gateway Fund Management Agreement, the Master Portfolio Advisory Agreement and the Sub-Advisory Agreement are collectively referred to as the “Advisory Agreements.”
The Gateway Fund is a gateway feeder fund that invest substantially all of its assets in the Master Portfolio. The Master Portfolio has a substantially similar investment objective and substantially similar investment strategies to the Gateway Fund. Information provided to the Boards regarding the Gateway Fund is also applicable to the Master Portfolio, as relevant.
At the Meeting, the Boards considered the factors and reached the conclusions described below relating to the selection of Funds Management and the Sub-Adviser and the approval of the Advisory Agreements. Prior to the Meeting, including at an in-person meeting in April 2019, the Trustees conferred extensively among themselves and with representatives of Funds Management about these matters. Also, the Boards have adopted a team-based approach, with each team consisting of a sub-set of Trustees, to assist the full Boards in the discharge of their duties in reviewing investment performance and other matters throughout the year. The Independent Trustees were assisted in their evaluation of the Advisory Agreements by independent legal counsel, from whom they received separate legal advice and with whom they met separately.
In providing information to the Boards, Funds Management and the Sub-Adviser were guided by a detailed set of requests for information submitted to them by independent legal counsel on behalf of the Independent Trustees at the start of the Boards’ annual contract renewal process earlier in 2019. In considering and approving the Advisory Agreements, the Trustees considered the information they believed relevant, including but not limited to the information discussed below. The Boards considered not only the specific information presented in connection with the Meeting, but also the knowledge gained over time through interaction with Funds Management and the Sub-Adviser about various topics. In this regard, the Boards reviewed reports of Funds Management at each of their quarterly meetings, which included, among other things, portfolio reviews and investment performance reports. In addition, the Boards and the teams mentioned above confer with portfolio managers at various times throughout the year. The Boards did not identify any particular information or consideration that was all-important or controlling, and each individual Trustee may have attributed different weights to various factors.
After its deliberations, the Funds Trust Board unanimously approved the continuation of the Gateway Fund Management Agreement for a one-year period. Additionally, after its deliberations, the Master Trust Board unanimously approved the continuation of the Master Portfolio Advisory Agreement and the Sub-Advisory Agreement, each for a one-year term. The Boards also determined that the compensation payable to Funds Management and the Sub-Adviser was reasonable. The Boards considered the approval of the Advisory Agreements for the Funds as part of their consideration of agreements for funds across the complex, but their approvals were made on a fund-by-fund basis. The following summarizes a number of important, but not necessarily all, factors considered by the Boards in support of their approvals.
| | | | | | |
| Other information (unaudited) | | Wells Fargo International Value Fund | | | 49 | |
Nature, extent and quality of services
The Boards received and considered various information regarding the nature, extent and quality of services provided to the Funds by Funds Management and the Sub-Adviser under the Advisory Agreements. This information included a description of the investment advisory services and Fund-level administrative services, as well as, among other things, a summary of the background and experience of senior management of Wells Fargo Asset Management (“WFAM”), of which Funds Management is a part, a summary of investments made in the business of WFAM, a summary of certain organizational and personnel changes involving Funds Management, and a description of Funds Management’s and the Sub-Adviser’s business continuity planning programs and of their approaches to data privacy and cybersecurity. The Boards received and reviewed information about Funds Management’s role as administrator of the Funds’ liquidity risk management program. The Boards also considered the qualifications, background, tenure and responsibilities of each of the portfolio managers primarily responsible for the day-to-day portfolio management of the Funds.
The Boards evaluated the ability of Funds Management and the Sub-Adviser to attract and retain qualified investment professionals, including research, advisory and supervisory personnel. The Boards further considered the compliance programs and compliance records of Funds Management and the Sub-Adviser. In addition, the Boards took into account the full range of services provided to the Funds by Funds Management and its affiliates.
Fund investment performance and expenses
The Boards considered the investment performance results for each of the Funds over various time periods ended December 31, 2018. The Boards considered these results in comparison to the investment performance of funds in a universe that was determined by Broadridge Inc. (“Broadridge”) to be similar to the Gateway Fund (the “Universe”), and in comparison to the Gateway Fund’s benchmark index and to other comparative data. Broadridge is an independent provider of investment company data. The Boards received a description of the methodology used by Broadridge to select the mutual funds in the performance Universe. The Funds Trust Board noted that the investment performance of the Gateway Fund (Administrator Class) was higher than the average investment performance of its Universe for all periods under review. The Funds Trust Board also noted that the investment performance of the Gateway Fund was higher than or in range of its benchmark, the MSCI EAFE Value Index (Net), for the three-, five- and ten-year periods under review, but lower than its benchmark for the one-year period under review.
The Master Trust Board took note of the investment performance of the Master Portfolio in the context of reviewing the investment performance of the Gateway Fund.
The Funds Trust Board also received and considered information regarding the Gateway Fund’s net operating expense ratios, which include fees and expenses of the Master Portfolio, and their various components, including actual management fees assessed at the Gateway Fund and Master Portfolio levels, custodian and other non-management fees, and Rule 12b-1 and non-Rule 12b-1 shareholder service fees. The Funds Trust Board considered these ratios in comparison to the median ratios of funds in class-specific expense groups that were determined by Broadridge to be similar to the Gateway Fund (the “Groups”). The Funds Trust Board received a description of the methodology used by Broadridge to select the mutual funds in the expense Groups and an explanation of how funds comprising expense groups and their expense ratios may vary from year-to-year. Based on the Broadridge reports, the Funds Trust Board noted that the net operating expense ratios of the Gateway Fund were equal to or in range of the median net operating expense ratios of its expense Groups for each share class.
With respect to the Master Portfolio, the Master Trust Board reviewed the fee rates that are payable to Funds Management for investment advisory services (as discussed below), which are the only fees charged at the Master Portfolio level, relative to a corresponding expense Group.
The Boards took into account the Funds’ investment performance and expense information provided to them among the factors considered in deciding to re-approve the Advisory Agreements.
Investment management, advisory and sub-advisory fee rates
The Funds Trust Board noted that Funds Management receives no advisory fees from the Gateway Fund as long as the Gateway Fund continues to invest all (or substantially all) of its assets in a single master portfolio. If the Gateway Fund were to change its investment structure so that it began investing in two or more master portfolios (a fund-of-funds), Funds Management would be entitled to receive an annual fee of 0.25% of the Gateway Fund’s average daily net assets for providing investment advisory services to the Gateway Fund, including allocating the Gateway Fund’s assets to the Master Portfolio.
| | | | |
| 50 | | Wells Fargo International Value Fund | | Other information (unaudited) |
The Funds Trust Board reviewed and considered the contractual fee rates that are payable by the Gateway Fund to Funds Management under the Gateway Fund Management Agreement, as well as the contractual fee rates payable by the Gateway Fund to Funds Management for class-level administrative services under a Class-Level Administration Agreement, which include, among other things, class-level transfer agency and sub-transfer agency costs (collectively, the “Management Rates”).
The Master Trust Board reviewed and considered the contractual investment advisory fee rate that is payable by the Master Portfolio to Funds Management for investment advisory services under the Master Portfolio Advisory Agreement (the “Advisory Agreement Rate”). The Master Trust Board also reviewed and considered the contractual investment sub-advisory fee rate that is payable by Funds Management to the Sub-Adviser for investment sub-advisory services (the “Sub-Advisory Agreement Rate”).
Among other information reviewed by the Funds Trust Board was a comparison of the Gateway Fund’s Management Rate, which include the advisory fees paid at the Master Portfolio level, with the average contractual investment management fee rates of funds in the expense Groups at a common asset level as well as transfer agency costs of the funds in the expense Groups. The Funds Trust Board noted that the Management Rates of the Gateway Fund were lower than, equal to or in range of the sum of these average rates for the Gateway Fund’s expense Groups for all share classes. The Funds Trust Board also noted that the net operating expense ratio caps for all classes of the Gateway Fund would be reduced.
The Master Trust Board reviewed a comparison of the Advisory Agreement Rate of the Master Portfolio with those of other funds in the Master Portfolio’s expense Group at a common asset level. The Master Trust Board noted that the Advisory Agreement Rate of the Master Portfolio was in range of the median rate for the Master Portfolio’s expense Group.
The Master Trust Board also received and considered information about the portions of the total management fees that were retained by Funds Management after payment of the fees to the Sub-Adviser for sub-advisory services. The Master Trust Board considered these amounts in comparison to the median amount retained by advisers to funds in a sub-advised expense universe that was determined by Broadridge to be similar to the Master Portfolio. In assessing the reasonableness of these amounts, the Master Trust Board received and evaluated information about the nature and extent of responsibilities retained and risks assumed by Funds Management and not delegated to or assumed by the Sub-Adviser, and about Funds Management’s on-going oversight services. The Master Trust Board also considered that the sub-advisory fees paid to the Sub-Adviser had been negotiated by Funds Management on an arm’s length basis.
The Boards also received and considered information about the nature and extent of services offered and fee rates charged by Funds Management and the Sub-Adviser to other types of clients with investment strategies similar to those of the Funds. In this regard, the Boards received information about the significantly greater scope of services, and compliance, reporting and other legal burdens and risks of managing proprietary mutual funds compared with those associated with managing assets of other types of clients, including third-party sub-advised fund clients and non-mutual fund clients such as institutional separate accounts.
Based on its consideration of the factors and information it deemed relevant, including those described here, the Funds Trust Board determined that the compensation payable to Funds Management under the Gateway Fund Management Agreement was reasonable, and the Master Trust Board determined that the compensation payable to Funds Management under the Master Portfolio Advisory Agreement and to the Sub-Adviser under the Sub-Advisory Agreement was reasonable.
Profitability
The Boards received and considered information concerning the profitability of Funds Management, as well as the profitability of both WFAM and Wells Fargo & Co. (“Wells Fargo”) from providing services to the fund family as a whole.
Funds Management reported on the methodologies and estimates used in calculating profitability, including a description of the methodology used to allocate certain expenses. Among other things, the Boards noted that the levels of profitability reported on a fund-by-fund basis varied widely, depending on factors such as the size, type and age of fund. The Boards did not consider profitability with respect to the Sub-Adviser, as the sub-advisory fees paid to the Sub-Adviser had been negotiated by Funds Management on an arm’s-length basis.
Based on its review, the Boards did not deem the profits reported by Funds Management, WFAM or Wells Fargo from services provided to the Funds to be at a level that would prevent the Boards from approving the continuation of the Advisory Agreements.
| | | | | | |
| Other information (unaudited) | | Wells Fargo International Value Fund | | | 51 | |
Economies of scale
The Boards received and considered information about the potential for Funds Management to experience economies of scale in the provision of management services to the Funds, the difficulties of calculating economies of scale at an individual fund level, and the extent to which potential scale benefits are shared with shareholders. The Boards noted the existence of breakpoints in the Master Portfolio’s advisory fee structure and the Gateway Fund’s management fee structure, which operate generally to reduce the Funds’ expense ratios as the Funds grow in size. The Boards considered that, in addition to management fee breakpoints, Funds Management shares potential economies of scale from its management business in a variety of ways, including through fee waiver and expense reimbursement arrangements, services that benefit shareholders, competitive management fee rates set at the outset without regard to breakpoints, and investments in the business intended to enhance services available to shareholders.
The Boards concluded that Funds Management’s arrangements with respect to each Fund, including contractual breakpoints, constituted a reasonable approach to sharing potential economies of scale with the Funds and their shareholders.
Other benefits to Funds Management and the Sub-Adviser
The Boards received and considered information regarding potential “fall-out” or ancillary benefits received by Funds Management, the Sub-Adviser, and their affiliates as a result of their relationships with the Funds. Ancillary benefits could include, among others, benefits directly attributable to other relationships with the Funds and benefits potentially derived from an increase in Funds Management’s and the Sub-Adviser’s business as a result of their relationships with the Funds. The Boards noted that various affiliates of Funds Management may receive distribution-related fees, shareholder servicing payments and sub-transfer agency fees in respect of shares sold or held through them and services provided.
The Boards also reviewed information about soft dollar credits earned and utilized by the Sub-Adviser, fees earned by Funds Management and its affiliate from managing a private investment vehicle for the fund family’s securities lending collateral, and commissions earned by an affiliated broker from portfolio transactions.
Based on their consideration of the factors and information they deemed relevant, including those described here, the Boards did not find that any ancillary benefits received by Funds Management, the Sub-Adviser, and their affiliates were unreasonable.
Conclusion
At the Meeting, after considering the above-described factors and based on its deliberations and its evaluation of the information described above, the Funds Trust Board unanimously approved the continuation of the Gateway Fund Management Agreement for a one-year period. Additionally, after considering the above-described factors and based on its deliberations and its evaluation of the information described above, the Master Trust Board unanimously approved the continuation of the Master Portfolio Advisory Agreement and the Sub-Advisory Agreement, each for a one-year term. The Boards also determined that the compensation payable to Funds Management and the Sub-Adviser was reasonable.
This page is intentionally left blank.

For more information
More information about Wells Fargo Funds is available free upon request. To obtain literature, please write, visit the Fund’s website, or call:
Wells Fargo Funds
P.O. Box 219967
Kansas City, MO 64121-9967
Website: wfam.com
Individual investors: 1-800-222-8222
Retail investment professionals: 1-888-877-9275
Institutional investment professionals: 1-866-765-0778
This report and the financial statements contained herein are submitted for the general information of the shareholders of the Fund. If this report is used for promotional purposes, distribution of the report must be accompanied or preceded by a current prospectus. Before investing, please consider the investment objectives, risks, charges, and expenses of the investment. For a current prospectus and, if available, a summary prospectus, containing this information, call1-800-222-8222 or visit the Fund’s website atwfam.com. Read the prospectus carefully before you invest or send money.
Wells Fargo Asset Management (WFAM) is the trade name for certain investment advisory/management firms owned by Wells Fargo & Company. These firms include but are not limited to Wells Capital Management Incorporated and Wells Fargo Funds Management, LLC. Certain products managed by WFAM entities are distributed by Wells Fargo Funds Distributor, LLC (a broker-dealer and Member FINRA).
This material is for general informational and educational purposes only and is NOT intended to provide investment advice or a recommendation of any kind—including a recommendation for any specific investment, strategy, or plan.
INVESTMENT PRODUCTS: NOT FDIC INSURED ◾ NO BANK GUARANTEE ◾ MAY LOSE VALUE
© 2019 Wells Fargo Funds Management, LLC. All rights reserved.
| | |
 | | 403198 07-19 A284/AR284 05-19 |
Annual Report
May 31, 2019

Wells Fargo Small Company Growth Fund

Beginning on January 1, 2021, as permitted by new regulations adopted by the Securities and Exchange Commission, paper copies of the Wells Fargo Funds’ annual and semi-annual shareholder reports issued after this date will no longer be sent by mail, unless you specifically request paper copies of the reports. Instead, the reports will be made available on the Funds’ website, and you will be notified by mail each time a report is posted and provided with a website address to access the report.
If you already elected to receive shareholder reports electronically, you will not be affected by this change and you need not take any action. You may elect to receive shareholder reports and other communications from the Fund electronically at any time by contacting your financial intermediary (such as a broker-dealer or bank) or, if you are a direct investor, by calling 1-800-222-8222 or by enrolling at wellsfargo.com/advantagedelivery.
You may elect to receive all future reports in paper free of charge. If you invest through a financial intermediary, you can contact your financial intermediary to request that you continue to receive paper copies of your shareholder reports; if you invest directly with the Fund, you can call 1-800-222-8222. Your election to receive reports in paper will apply to all Wells Fargo Funds held in your account with your financial intermediary or, if you are a direct investor, to all Wells Fargo Funds that you hold.

Reduce clutter. Save trees.
Sign up for electronic delivery of prospectuses and shareholder reports atwellsfargo.com/advantagedelivery
Contents
The views expressed and any forward-looking statements are as of May 31, 2019, unless otherwise noted, and are those of the Fund managers and/or Wells Fargo Asset Management. Discussions of individual securities, or the markets generally, or any Wells Fargo Fund are not intended as individual recommendations. Future events or results may vary significantly from those expressed in any forward-looking statements. The views expressed are subject to change at any time in response to changing circumstances in the market. Wells Fargo Asset Management and the Fund disclaim any obligation to publicly update or revise any views expressed or forward-looking statements.
INVESTMENT PRODUCTS: NOT FDIC INSURED ◾ NO BANK GUARANTEE ◾ MAY LOSE VALUE
| | | | |
| 2 | | Wells Fargo Small Company Growth Fund | | Letter to shareholders (unaudited) |

Andrew Owen
President
Wells Fargo Funds
Dear Shareholder:
We are pleased to offer you this annual report for the Wells Fargo Small Company Growth Fund for the 12-month period that ended May 31, 2019. Higher short-term interest rates, inflation concerns, trade tensions, and geopolitical events drove investment market volatility for much of 2018, particularly for international stocks. Early 2019 saw stocks and bonds gain with renewed business and investor confidence, but volatility returned late in the period as global growth slowed and geopolitical concerns persisted.
For the period, U.S. stocks, based on the S&P 500 Index,1 gained 3.78% and international stocks, as measured by the MSCI ACWI ex USA Index (Net),2 fell 6.26%. Based on the MSCI EM Index (Net),3 emerging market stocks fell 8.70%. Bond investors saw the Bloomberg Barclays U.S. Aggregate Bond Index4 add 6.40% while the Bloomberg Barclays Global Aggregate ex-USD Index5 rose 0.39%. The Bloomberg Barclays Municipal Bond Index6 added 6.40%, and the ICE BofAML U.S. High Yield Index7 was up 5.37%.
Results for investment indices reflected global concerns.
Global trade tensions escalated during the second quarter of 2018. A tit-for-tat tariff spat intensified between the U.S. and other governments. The U.S. Federal Reserve (Fed) raised the federal funds rate by 25 basis points (bps; 100 bps equal 1.00%) to a target range of between 1.75% and 2.00% in June. Market index results reflected the global concerns. The MSCI ACWI ex USA Index (Net) lost 2.61%, while the Bloomberg Barclays Global Aggregate ex-USD Index dropped 4.76%.
Not all news was bad. The U.S. Bureau of Economic Analysis reported second-quarter annualized gross domestic product (GDP) growth of 4.2%. Hiring improved. Unemployment declined. Consumer confidence and spending increased. The S&P 500 Index recorded a 3.43% second-quarter gain. Stocks of companies with smaller capitalizations did even better, as measured by the Russell 2000® Index,8 adding 7.75%.
| 1 | The S&P 500 Index consists of 500 stocks chosen for market size, liquidity, and industry group representation. It is a market-value-weighted index with each stock’s weight in the index proportionate to its market value. You cannot invest directly in an index. |
| 2 | The Morgan Stanley Capital International (MSCI) All Country World Index (ACWI) ex USA Index (Net) is a free-float-adjusted market-capitalization-weighted index that is designed to measure the equity market performance of developed and emerging markets, excluding the U.S. Source: MSCI. MSCI makes no express or implied warranties or representations and shall have no liability whatsoever with respect to any MSCI data contained herein. The MSCI data may not be further redistributed or used as a basis for other indices or any securities or financial products. This report is not approved, reviewed, or produced by MSCI. You cannot invest directly in an index. |
| 3 | The MSCI Emerging Markets (EM) Index (Net) is a free-float-adjusted market-capitalization-weighted index that is designed to measure the equity market performance of emerging markets. You cannot invest directly in an index. |
| 4 | The Bloomberg Barclays U.S. Aggregate Bond Index is a broad-based benchmark that measures the investment-grade, U.S.-dollar-denominated, fixed-rate taxable bond market, including Treasuries, government-related and corporate securities, mortgage-backed securities (agency fixed-rate and hybrid adjustable-rate mortgage pass-throughs), asset-backed securities, and commercial mortgage-backed securities. You cannot invest directly in an index. |
| 5 | The Bloomberg Barclays Global Aggregate ex-USD Index is an unmanaged index that provides a broad-based measure of the global investment-grade fixed-income markets excluding the U.S.-dollar-denominated debt market. You cannot invest directly in an index. |
| 6 | The Bloomberg Barclays Municipal Bond Index is an unmanaged index composed of long-term tax-exempt bonds with a minimum credit rating of Baa. You cannot invest directly in an index. |
| 7 | The ICE BofAML U.S. High Yield Index is a market-capitalization-weighted index of domestic and Yankee high-yield bonds. The index tracks the performance of high-yield securities traded in the U.S. bond market. You cannot invest directly in an index. Copyright 2019. ICE Data Indices, LLC. All rights reserved. |
| 8 | The Russell 2000® Index measures the performance of the 2,000 smallest companies in the Russell 3000® Index, which represents approximately 8% of the total market capitalization of the Russell 3000® Index. You cannot invest directly in an index. |
| | | | | | |
| Letter to shareholders (unaudited) | | Wells Fargo Small Company Growth Fund | | | 3 | |
Investors appeared to shake off lingering concerns during the third quarter.
Favorable third-quarter economic indicators and corporate earnings reports encouraged domestic stock investors. U.S. trade negotiations with Mexico and Canada progressed. The Conference Board Consumer Confidence Index®9 reached its highest level in 18 years during September 2018. The Fed raised the federal funds rate by 25 bps to a target range of between 2.00% and 2.25% in September. For the quarter that ended September 30, 2018, the S&P 500 Index added 7.71%.
Investors in international markets were not as confident. Tensions between the U.S. and China increased. The U.S. imposed $200 billion in tariffs on Chinese goods. China reacted with $60 billion in tariffs on U.S. goods. Economic growth in China caused concern. The Bank of England (BoE) raised its monetary policy rate to 0.75% in August 2018. During the quarter, the MSCI ACWI ex USA Index (Net) gained 0.71%. The MSCI EM Index (Net) declined 1.09%. In fixed-income markets, U.S. bonds were flat, as measured by the Bloomberg Barclays U.S. Aggregate Bond Index. The Bloomberg Barclays Global Aggregate ex-USD Index fell 1.74%.
Conflicting data unsettled markets during the fourth quarter.
November’s U.S. midterm elections shifted control of the House of Representatives from Republicans to Democrats, presaging potential partisan clashes. Third-quarter U.S. GDP was announced at an annualized 3.4% rate, lower than the second-quarter rate. Brexit efforts stalled ahead of the March 2019 deadline. The People’s Bank of China cut reserve requirement ratios, accelerated infrastructure spending, and cut taxes even as the value of the yuan declined to low levels last seen in 2008.
December’s S&P 500 Index performance was the worst since 1931. Globally,fixed-income investments fared better than stocks during the last two months of the year. The Fed increased the federal funds rate by 25 bps in December 2018 to a target range of between 2.25% and 2.50%.
The market climbs a wall of worry.
Investors entered 2019 with reasons to be concerned. A partial U.S. government shutdown driven by partisan policy disputes extended into January. Investment returns appeared to reaffirm the adage that markets climb a wall of worry. The S&P 500 Index gained 8.01% for the month of January, the best monthly performance in 30 years. Returns for the MSCI ACWI ex USA Index (Net), the Bloomberg Barclays U.S. Aggregate Bond Index, and the Bloomberg Barclays Global Aggregate ex-USD Index also were positive. The Fed indicated that it would pause its program of regular rate increases during 2019 as inflation remained low.
In February 2019, concerns over slowing global growth reemerged. The Bureau of Economic Analysis announced fourth-quarter 2018 GDP grew at an annualized 2.2% rate, down from levels of the prior two quarters. In a February report, the BoE forecast the slowest growth since the financial crisis for 2019. China and the U.S. continued to wrangle over trade issues.
By the end of March 2019, the combination of dovish Fed sentiment and consistent, if not spectacular, economic and business metrics reinforced investors’ confidence. Monthly job creation data regained momentum. Corporate profits, while lower than 2018’s lofty levels, remained solid. China announced a roughly $300 billion stimulus package through tax and fee cuts intended to reinvigorate economic growth.
December’s S&P 500 Index performance was the worst since 1931.
The S&P 500 Index gained 8.01% for the month of January, the best monthly performance in 30 years.
| 9 | The Conference Board Consumer Confidence Index® measures the degree of optimism on the state of the U.S. economy that consumers are expressing through their activities of saving and spending. You cannot invest directly in an index. |
| | | | |
| 4 | | Wells Fargo Small Company Growth Fund | | Letter to shareholders (unaudited) |
During April, several broad-based U.S. equity indices reached or approached highs as investors drew confidence from favorable economic projections, sustained low inflation, and solid employment data. First-quarter GDP showed the economy grew at an annualized rate of 3.2% on improvement in business investment and exports. Favorable sentiment extended to foreign markets as the MSCI ACWI ex USA Index (Net) gained 2.64% and the MSCI EM Index (Net) added 2.11% for the month.
May 2019 presented investors with mixed signals in the economy, in the markets, and politically. In the U.S., partisan wrangling ramped up as Democrats and Republicans set their sights on 2020 presidential politics. In the U.K., the Brexit stalemate resulted in the resignation of Prime Minister Theresa May. The European Commission downgraded the 2019 growth forecast for the block of countries to 1.2%. The U.S. increased tariffs on products from China, China responded, and then talks broke down. Ending the month, equities, as measured by the MSCI ACWI (Net),10 dropped 5.93% while bonds, often considered a less risky investment, gained 1.04%, as measured by the Bloomberg Barclays Global Aggregate ex-USD Index.
Don’t let short-term uncertainty derail long-term investment goals.
Periods of investment uncertainty can present challenges, but experience has taught us that maintaining long-term investment goals can be an effective way to plan for the future. To help you create a sound strategy based on your personal goals and risk tolerance, Wells Fargo Funds offers more than 100 mutual funds spanning a wide range of asset classes and investment styles. Although diversification cannot guarantee an investment profit or prevent losses, we believe it can be an effective way to manage investment risk and potentially smooth out overall portfolio performance. We encourage investors to know their investments and to understand that appropriate levels of risk-taking may unlock opportunities.
Thank you for choosing to invest with Wells Fargo Funds. We appreciate your confidence in us and remain committed to helping you meet your financial needs.
Sincerely,

Andrew Owen
President
Wells Fargo Funds
For further information about your Fund, contact your investment professional, visit our website atwfam.com, or call us directly at1-800-222-8222.
| 10 | The MSCI ACWI (Net) is a free-float-adjusted market-capitalization-weighted index that is designed to measure the equity market performance of developed and emerging markets. You cannot invest directly in an index. |
This page is intentionally left blank.
| | | | |
| 6 | | Wells Fargo Small Company Growth Fund1 | | Performance highlights (unaudited) |
The Fund is currently closed to most new investors.2
Investment objective
The Fund seeks long-term capital appreciation.
Manager
Wells Fargo Funds Management, LLC
Subadviser for the affiliated master portfolio
Peregrine Capital Management, LLC
Portfolio managers
William A. Grierson, CFA®‡
Daniel J. Hagen, CFA®‡
Paul E. von Kuster, CFA®‡
Average annual total returns (%) as of May 31, 2019
| | | | | | | | | | | | | | | | | | | | | | | | | | | | | | | | | | |
| | | | | Including sales charge | | | Excluding sales charge | | | Expense ratios3 (%) | |
| | | Inception date | | 1 year | | | 5 year | | | 10 year | | | 1 year | | | 5 year | | | 10 year | | | Gross | | | Net4 | |
| | | | | | | | | |
| Class A (WFSAX) | | 1-30-2004 | | | -11.53 | | | | 6.04 | | | | 14.09 | | | | -6.13 | | | | 7.30 | | | | 14.77 | | | | 1.33 | | | | 1.33 | |
| | | | | | | | | |
| Class C (WSMCX) | | 1-30-2004 | | | -7.82 | | | | 6.50 | | | | 13.93 | | | | -6.82 | | | | 6.50 | | | | 13.93 | | | | 2.08 | | | | 2.08 | |
| | | | | | | | | |
| Class R6 (WSCRX)5 | | 10-31-2014 | | | – | | | | – | | | | – | | | | -5.73 | | | | 7.78 | | | | 15.31 | | | | 0.90 | | | | 0.90 | |
| | | | | | | | | |
| Administrator Class (NVSCX) | | 11-11-1994 | | | – | | | | – | | | | – | | | | -6.02 | | | | 7.47 | | | | 15.01 | | | | 1.25 | | | | 1.20 | |
| | | | | | | | | |
| Institutional Class (WSCGX) | | 3-31-2008 | | | – | | | | – | | | | – | | | | -5.77 | | | | 7.73 | | | | 15.28 | | | | 1.00 | | | | 0.95 | |
| | | | | | | | | |
| Russell 2000® Growth Index6 | | – | | | – | | | | – | | | | – | | | | -6.88 | | | | 8.32 | | | | 13.93 | | | | – | | | | – | |
Figures quoted represent past performance, which is no guarantee of future results, and do not reflect taxes that a shareholder may pay on fund distributions or the redemption of fund shares. Investment return and principal value of an investment will fluctuate so that an investor’s shares, when redeemed, may be worth more or less than their original cost. Performance shown without sales charges would be lower if sales charges were reflected. Current performance may be lower or higher than the performance data quoted, which assumes the reinvestment of dividends and capital gains. Current month-end performance is available on the Fund’s website, wfam.com.
Index returns do not include transaction costs associated with buying and selling securities, any mutual fund fees or expenses, or any taxes. It is not possible to invest directly in an index.
For Class A shares, the maximum front-end sales charge is 5.75%. For Class C shares, the maximum contingent deferred sales charge is 1.00%. Performance including a contingent deferred sales charge assumes the sales charge for the corresponding time period. Class R6, Administrator Class, and Institutional Class shares are sold without a front-end sales charge or contingent deferred sales charge.
Stock values fluctuate in response to the activities of individual companies and general market and economic conditions. Smaller-company stocks tend to be more volatile and less liquid than those of larger companies. Certain investment strategies tend to increase the total risk of an investment (relative to the broader market). The Fund is exposed to foreign investment risk. Consult the Fund’s prospectus for additional information on these and other risks.
Please see footnotes on page 7.
| | | | | | |
| Performance highlights (unaudited) | | Wells Fargo Small Company Growth Fund | | | 7 | |
|
| Growth of $10,000 investment as of May 31, 20197 |
|
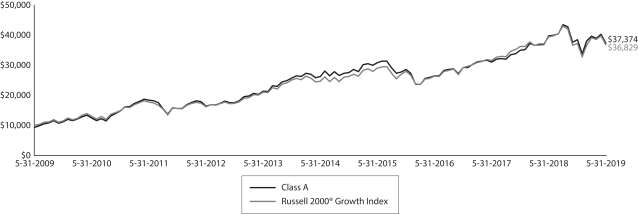 |
| ‡ | CFA® and Chartered Financial Analyst® are trademarks owned by CFA Institute. |
| 1 | The Fund is a gateway feeder fund that invests substantially all of its assets in a single affiliated master portfolio of the Wells Fargo Master Trust with a substantially identical investment objective and substantially similar investment strategies. References to the investment activities of the Fund are intended to refer to the investment activities of the affiliated master portfolio in which it invests. |
| 2 | Please see the Fund’s current Statement of Additional Information for further details. |
| 3 | Reflects the expense ratios as stated in the most recent prospectuses, which include the impact of 0.01% in acquired fund fees and expenses. The expense ratios shown are subject to change and may differ from the annualized expense ratios shown in the financial highlights of this report. |
| 4 | The manager has contractually committed through September 30, 2019, to waive fees and/or reimburse expenses to the extent necessary to cap the expense of each class after fee waivers at 1.35% for Class A, 2.10% for Class C, 0.90% for Class R6, 1.20% for Administrator Class, and 0.95% for Institutional Class shares. Brokerage commissions, stamp duty fees, interest, taxes, acquired fund fees and expenses (if any) from funds in which the affiliated master portfolio invests, and extraordinary expenses are excluded from the expense caps. Prior to or after the commitment expiration date, the cap may be increased or the commitment to maintain the cap may be terminated only with the approval of the Board of Trustees. Without this cap, the Fund’s returns would have been lower. The expense ratio paid by an investor is the net expense ratio (the total annual fund operating expenses after fee waivers) as stated in the prospectuses. |
| 5 | Historical performance shown for Class R6 shares prior to their inception reflects the performance of Institutional Class shares, and includes the higher expenses applicable to Institutional Class shares. If these expenses had not been included, returns for Class R6 shares would be higher. |
| 6 | The Russell 2000® Growth Index measures the performance shown of those Russell 2000 companies with higher price/book ratios and higher forecasted growth values. You cannot invest directly in an index. |
| 7 | The chart compares the performance of Class A shares for the most recent ten years with the Russell 2000® Growth Index. The chart assumes a hypothetical $10,000 investment in Class A shares and reflects all operating expenses and assumes the maximum initial sales charge of 5.75%. |
| 8 | The ten largest holdings, excluding cash, cash equivalents and any money market funds, are calculated based on the value of the securities of the affiliated master portfolio allocable to the Fund divided by the total net assets of the Fund. Holdings are subject to change and may have changed since the date specified. |
| 9 | Amounts represent the sector distribution of the affiliated master portfolio which are calculated based on the total long-term investments of the affiliated master portfolio. These amounts are subject to change and may have changed since the date specified. |
| * | The security was no longer held at the end of the period. |
| | | | |
| 8 | | Wells Fargo Small Company Growth Fund | | Performance highlights (unaudited) |
MANAGER’S DISCUSSION
Fund highlights
| ∎ | | The Fund outperformed the Russell 2000® Growth Index for the 12-month period that ended May 31, 2019. |
| ∎ | | Strong stock selection in core growth sectors of health care and information technology (IT) drove relative outperformance. |
| ∎ | | Stock selection within industrials detracted from overall performance. |
Small-cap growth stocks delivered two very different environments over the past year, which resulted a small net decline in overall returns in the contrasting market dynamics. Strong company fundamentals continued to manifest throughout 2018 as a growing number of companies exceeded both sales and earnings expectations. This, when combined with a supportive macroeconomic backdrop, resulted in a robust environment for overall returns in small-cap growth. Beginning later in the third quarter of 2018, signs of slowing economic activity began to negatively affect investor sentiments. Company fundamentals slowed in this more tepid backdrop, leading to a deceleration in earnings growth rates, which was incorporated into forward expectations to drive negative small-cap returns. Capping off 2018, the U.S. Federal Reserve (Fed) acknowledged some downside risks to the economic backdrop while continuing to signal additional interest rate increases in a seemingly contradictory policy position. Trade tensions between the U.S. and China, locked in a stalemate through much of 2018, reemerged in the fourth quarter of 2018 and continued into 2019 with growing prominence. The impact of this escalating tit-for-tat trade approach, which has begun to affect overall growth and company fundamentals, has mattered little in 2019. Renewed market optimism has been driven instead by the abrupt reversal in policy positions by the Fed, driving real expectations of interest rate cuts following the most recent tightening cycle and propelling markets higher.
Last year offered many opportunities for the Fund to demonstrate the core tenets of its investment philosophy. For example, our well-diversified portfolio provided significant upside through the positive return environment of the first three quarters of 2018. Of equal importance, during the sharply negative fourth-quarter environment, principal was somewhat protected on the downside and again the Fund outperformed. While 2019 returns have experienced a higher degree of macro-driven variability, construction and strong stock selection drove outperformance above the Russell 2000® Growth Index for the totality of the trailing 12-month period.
| | | | |
| Ten largest holdings (%) as of May 31, 20198 | |
| |
Copart Incorporated | | | 1.55 | |
| |
ICON plc ADR | | | 1.54 | |
| |
SS&C Technologies Holdings Incorporated | | | 1.47 | |
| |
Essent Group Limited | | | 1.46 | |
| |
RealPage Incorporated | | | 1.43 | |
| |
PTC Incorporated | | | 1.42 | |
| |
Cypress Semiconductor Corporation | | | 1.40 | |
| |
Eldorado Resorts Incorporated | | | 1.34 | |
| |
Argo Group International Holdings Limited | | | 1.34 | |
| |
Evercore Partners Incorporated Class A | | | 1.31 | |
Health care and IT were the top-contributing sectors for the year. Positive outperformance in health care was driven primarily by stock selection within biotechnology. The top contributor to returns was Array BioPharma Incorporated, a leader in developing targeted therapeutics used in oncology, which has begun to successfully commercialize corporate-owned assets that have seen broad initial uptake and expanding uses, leading the stock to outperform. Within IT, software was the top-contributing industry. Leaders in this space include LiveRamp Holdings, Incorporated, which enables more targeted digital advertising that has benefited from strong demand for its offerings and improved profitably following a divestiture.
The industrials sector was the largest detractor from performance for the year. Headline concerns surrounding the potential for slowing economic growth led to moderating demand trends across the sector. This led to underperformance in the more economically sensitive building products and construction industry groups, which was the key source of adverse stock selection. Rising tariffs and increased raw material costs negatively affected margins at companies such as Cornerstone Building Brands, Incorporated*, and JELD-WEN Holding, Incorporated*, while project delays led to reduced earnings visibility at Granite Construction Incorporated and Dycom Industries Incorporated. Encouragingly, more recent results have benefited from heightened merger and acquisition activity in the machinery industry as both CIRCOR International, Incorporated, and Gardner Denver Holdings, Incorporated, have received offers from strategic acquirers.
Please see footnotes on page 7.
| | | | | | |
| Performance highlights (unaudited) | | Wells Fargo Small Company Growth Fund | | | 9 | |
We remain focused on consistent application of our disciplined process.
Our team has employed the same bottom-up style for more than 30 years. We believe the combination of our disciplined investment process and experienced team has been the key to the performance of this investment style over time. Looking ahead, we remain focused on identifying what we believe are attractive growth companies with underappreciated opportunities relative to their valuations. In our opinion, these stocks ultimately may be rewarded by the marketplace, which could lead to outperformance and may add value to the Fund.
|
| Sector distribution as of May 31, 20199 |
|
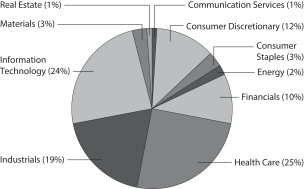 |
Please see footnotes on page 7.
| | | | |
| 10 | | Wells Fargo Small Company Growth Fund | | Fund expenses (unaudited) |
As a shareholder of the Fund, you incur two types of costs: (1) transaction costs, including sales charges (loads) on purchase payments and contingent deferred sales charges (if any) on redemptions and (2) ongoing costs, including management fees, distribution (12b-1) and/or shareholder servicing fees, and other Fund expenses. This example is intended to help you understand your ongoing costs (in dollars) of investing in the Fund and to compare these costs with the ongoing costs of investing in other mutual funds.
The example is based on an investment of $1,000 invested at the beginning of the six-month period and held for the entire period from December 1, 2018 to May 31, 2019.
Actual expenses
The “Actual” line of the table below provides information about actual account values and actual expenses. You may use the information in this line, together with the amount you invested, to estimate the expenses that you paid over the period. Simply divide your account value by $1,000 (for example, an $8,600 account value divided by $1,000 = 8.6), then multiply the result by the number in the “Actual” line under the heading entitled “Expenses paid during period” for your applicable class of shares to estimate the expenses you paid on your account during this period.
Hypothetical example for comparison purposes
The “Hypothetical” line of the table below provides information about hypothetical account values and hypothetical expenses based on the Fund’s actual expense ratio and an assumed rate of return of 5% per year before expenses, which is not the Fund’s actual return. The hypothetical account values and expenses may not be used to estimate the actual ending account balance or expenses you paid for the period. You may use this information to compare the ongoing costs of investing in the Fund and other funds. To do so, compare this 5% hypothetical example with the 5% hypothetical examples that appear in the shareholder reports of the other funds.
Please note that the expenses shown in the table are meant to highlight your ongoing costs only and do not reflect any transactional costs, such as sales charges (loads) and contingent deferred sales charges. Therefore, the “Hypothetical” line of the table is useful in comparing ongoing costs only and will not help you determine the relative total costs of owning different funds. In addition, if these transactional costs were included, your costs would have been higher.
| | | | | | | | | | | | | | | | |
| | | Beginning
account value
12-1-2018 | | | Ending
account value
5-31-2019 | | | Expenses
paid during
the period1,2 | | | Net annual
expense ratio1 | |
Class A | | | | | | | | | | | | | | | | |
| | | | |
Actual | | $ | 1,000.00 | | | $ | 969.49 | | | $ | 6.47 | | | | 1.32 | % |
| | | | |
Hypothetical (5% return before expenses) | | $ | 1,000.00 | | | $ | 1,018.36 | | | $ | 6.63 | | | | 1.32 | % |
Class C | | | | | | | | | | | | | | | | |
| | | | |
Actual | | $ | 1,000.00 | | | $ | 965.88 | | | $ | 10.13 | | | | 2.07 | % |
| | | | |
Hypothetical (5% return before expenses) | | $ | 1,000.00 | | | $ | 1,014.63 | | | $ | 10.38 | | | | 2.07 | % |
Class R6 | | | | | | | | | | | | | | | | |
| | | | |
Actual | | $ | 1,000.00 | | | $ | 971.54 | | | $ | 4.36 | | | | 0.89 | % |
| | | | |
Hypothetical (5% return before expenses) | | $ | 1,000.00 | | | $ | 1,020.51 | | | $ | 4.47 | | | | 0.89 | % |
Administrator Class | | | | | | | | | | | | | | | | |
| | | | |
Actual | | $ | 1,000.00 | | | $ | 970.15 | | | $ | 5.89 | | | | 1.20 | % |
| | | | |
Hypothetical (5% return before expenses) | | $ | 1,000.00 | | | $ | 1,018.95 | | | $ | 6.04 | | | | 1.20 | % |
Institutional Class | | | | | | | | | | | | | | | | |
| | | | |
Actual | | $ | 1,000.00 | | | $ | 971.30 | | | $ | 4.67 | | | | 0.95 | % |
| | | | |
Hypothetical (5% return before expenses) | | $ | 1,000.00 | | | $ | 1,020.20 | | | $ | 4.78 | | | | 0.95 | % |
| 1 | Amounts reflect net expenses allocated from the affiliated Master Portfolio in which the Fund invests. |
| 2 | Expenses paid is equal to the annualized net expense ratio of each class multiplied by the average account value over the period, multiplied by the number of days in the most recent fiscal half-year divided by the number of days in the fiscal year (to reflect the one-half-year period). |
| | | | | | |
| Portfolio of investments—May 31, 2019 | | Wells Fargo Small Company Growth Fund | | | 11 | |
| | | | | | | | | | | | | | | | |
| Security name | | | | | | | | | | | Value | |
| | | | |
Investment Companies: 100.00% | | | | | | | | | | | | | | | | |
| | | | |
| Affiliated Master Portfolio: 100.00% | | | | | | | | | | | | | | | | |
| | | | |
Wells Fargo Small Company Growth Portfolio | | | | | | | | | | | | | | $ | 1,778,405,869 | |
| | | | | | | | | | | | | | | | |
| | | | |
Total Investment Companies (Cost $1,462,501,226) | | | | | | | | | | | | | | | 1,778,405,869 | |
| | | | | | | | | | | | | | | | |
| | | | | | | | |
| Total investments in securities (Cost $1,462,501,226) | | | 100.00 | % | | | 1,778,405,869 | |
| | |
Other assets and liabilities, net | | | 0.00 | | | | (6,883 | ) |
| | | | | | | | |
| Total net assets | | | 100.00 | % | | $ | 1,778,398,986 | |
| | | | | | | | |
Transactions with the affiliated Master Portfolio were as follows:
| | | | | | | | | | | | | | | | | | | | | | | | | | | | | | | | |
| | | % of
ownership,
beginning of
period | | | % of
ownership,
end of
period | | | Net
realized
gains
(losses) on
securities
transactions
allocated
from
affiliated
Master
Portfolio | | | Net
change in
unrealized
gains
(losses) on
securities
transactions
allocated
from
affiliated
Master
Portfolio | | | Dividends
allocated
from
affiliated
Master
Portfolio | | | Affiliated
income
allocated
from
affiliated
Master
Portfolio | | | Value,
end
of period | | | % of
net
assets | |
Wells Fargo Small Company Growth Portfolio | | | 99 | % | | | 98 | % | | $ | 211,071,257 | | | $ | (317,347,617 | ) | | $ | 11,492,739 | | | $ | 2,054,875 | | | $ | 1,778,405,869 | | | | 100.00 | % |
The accompanying notes are an integral part of these financial statements.
| | | | |
| 12 | | Wells Fargo Small Company Growth Fund | | Statement of assets and liabilities—May 31, 2019 |
| | | | |
| | | | |
| |
Assets | | | | |
Investment in affiliated Master Portfolio, at value (cost $1,462,501,226) | | $ | 1,778,405,869 | |
Receivable for Fund shares sold | | | 2,000,051 | |
Prepaid expenses and other assets | | | 19,595 | |
| | | | |
Total assets | | | 1,780,425,515 | |
| | | | |
| |
Liabilities | | | | |
Payable for Fund shares redeemed | | | 1,583,077 | |
Administration fees payable | | | 171,717 | |
Shareholder report expenses payable | | | 114,773 | |
Management fee payable | | | 45,147 | |
Distribution fee payable | | | 9,972 | |
Accrued expenses and other liabilities | | | 101,843 | |
| | | | |
Total liabilities | | | 2,026,529 | |
| | | | |
Total net assets | | $ | 1,778,398,986 | |
| | | | |
| |
NET ASSETS CONSIST OF | | | | |
Paid-in capital | | $ | 1,402,143,319 | |
Total distributable earnings | | | 376,255,667 | |
| | | | |
Total net assets | | $ | 1,778,398,986 | |
| | | | |
| |
COMPUTATION OF NET ASSET VALUE AND OFFERING PRICE PER SHARE | | | | |
Net assets – Class A | | $ | 64,182,450 | |
Shares outstanding – Class A1 | | | 1,310,285 | |
Net asset value per share – Class A | | | $48.98 | |
Maximum offering price per share – Class A2 | | | $51.97 | |
Net assets – Class C | | $ | 13,968,201 | |
Shares outstanding – Class C1 | | | 326,762 | |
Net asset value per share – Class C | | | $42.75 | |
Net assets – Class R6 | | $ | 564,516,228 | |
Shares outstanding – Class R61 | | | 10,722,187 | |
Net asset value per share – Class R6 | | | $52.65 | |
Net assets – Administrator Class | | $ | 87,849,502 | |
Shares outstanding – Administrator Class1 | | | 1,719,251 | |
Net asset value per share – Administrator Class | | | $51.10 | |
Net assets – Institutional Class | | $ | 1,047,882,605 | |
Shares outstanding – Institutional Class1 | | | 19,956,482 | |
Net asset value per share – Institutional Class | | | $52.51 | |
| 1 | The Fund has an unlimited number of authorized shares. |
| 2 | Maximum offering price is computed as 100/94.25 of net asset value. On investments of $50,000 or more, the offering price is reduced. |
The accompanying notes are an integral part of these financial statements.
| | | | | | |
| Statement of operations—year ended May 31, 2019 | | Wells Fargo Small Company Growth Fund | | | 13 | |
| | | | |
| | | | |
| |
Investment income | | | | |
Dividends allocated from affiliated Master Portfolio (net of foreign withholding taxes of $87,921) | | $ | 11,492,739 | |
Affiliated income allocated from affiliated Master Portfolio | | | 2,054,875 | |
Expenses allocated from affiliated Master Portfolio | | | (15,326,425 | ) |
| | | | |
Total investment income | | | (1,778,811 | ) |
| | | | |
| |
Expenses | | | | |
Management fee | | | 986,734 | |
Administration fees | | | | |
Class A | | | 146,993 | |
Class C | | | 36,845 | |
Class R6 | | | 190,290 | |
Administrator Class | | | 143,175 | |
Institutional Class | | | 1,483,937 | |
Shareholder servicing fees | | | | |
Class A | | | 174,992 | |
Class C | | | 43,863 | |
Administrator Class | | | 275,337 | |
Distribution fee | | | | |
Class C | | | 131,572 | |
Custody and accounting fees | | | 66,563 | |
Professional fees | | | 29,302 | |
Registration fees | | | 166,815 | |
Shareholder report expenses | | | 217,433 | |
Trustees’ fees and expenses | | | 22,392 | |
Other fees and expenses | | | 39,092 | |
| | | | |
Total expenses | | | 4,155,335 | |
Less: Fee waivers and/or expense reimbursements | | | (429,092 | ) |
| | | | |
Net expenses | | | 3,726,243 | |
| | | | |
Net investment loss | | | (5,505,054 | ) |
| | | | |
| |
REALIZED AND UNREALIZED GAINS (LOSSES) ON INVESTMENTS | | | | |
Net realized gains on securities transactions allocated from affiliated Master Portfolio | | | 211,071,257 | |
Net change in unrealized gains (losses) on securities transactions allocated from affiliated Master Portfolio | | | (317,347,617 | ) |
| | | | |
Net realized and unrealized gains (losses) on investments | | | (106,276,360 | ) |
| | | | |
Net decrease in net assets resulting from operations | | $ | (111,781,414 | ) |
| | | | |
The accompanying notes are an integral part of these financial statements.
| | | | |
| 14 | | Wells Fargo Small Company Growth Fund | | Statement of changes in net assets |
| | | | | | | | | | | | | | | | |
| | | Year ended
May 31, 2019 | | | Year ended
May 31, 2018¹ | |
| | | | |
Operations | | | | | | | | | | | | | | | | |
Net investment loss | | | | | | $ | (5,505,054 | ) | | | | | | $ | (6,731,559 | ) |
Net realized gains on investments | | | | | | | 211,071,257 | | | | | | | | 118,893,213 | |
Net change in unrealized gains (losses) on investments | | | | | | | (317,347,617 | ) | | | | | | | 342,601,168 | |
| | | | |
Net increase (decrease) in net assets resulting from operations | | | | | | | (111,781,414 | ) | | | | | | | 454,762,822 | |
| | | | |
| | | | |
Distributions to shareholders from net realized income and net realized gains | | | | | | | | | | | | | | | | |
Class A | | | | | | | (4,812,269 | ) | | | | | | | 0 | |
Class C | | | | | | | (1,472,490 | ) | | | | | | | 0 | |
Class R6 | | | | | | | (43,353,220 | ) | | | | | | | 0 | |
Administrator Class | | | | | | | (7,628,191 | ) | | | | | | | 0 | |
Institutional Class | | | | | | | (79,166,580 | ) | | | | | | | 0 | |
| | | | |
Total distributions to shareholders | | | | | | | (136,432,750 | ) | | | | | | | 0 | |
| | | | |
| | | | |
Capital share transactions | | | Shares | | | | | | | | | | | | Shares | |
Proceeds from shares sold | | | | | | | | | | | | | | | | |
Class A | | | 438,493 | | | | 23,606,902 | | | | 418,324 | | | | 20,519,628 | |
Class C | | | 11,566 | | | | 528,806 | | | | 16,011 | | | | 676,399 | |
Class R6 | | | 3,125,212 | | | | 184,297,448 | | | | 3,523,131 | | | | 188,048,494 | |
Administrator Class | | | 504,790 | | | | 28,496,503 | | | | 359,239 | | | | 18,697,115 | |
Institutional Class | | | 5,840,084 | | | | 335,266,742 | | | | 5,366,558 | | | | 285,015,561 | |
| | | | |
| | | | |
| | | | | | | 572,196,401 | | | | | | | | 512,957,197 | |
| | | | |
Reinvestment of distributions | | | | | | | | | | | | | | | | |
Class A | | | 92,633 | | | | 4,427,868 | | | | 0 | | | | 0 | |
Class C | | | 31,746 | | | | 1,328,867 | | | | 0 | | | | 0 | |
Class R6 | | | 735,766 | | | | 37,730,057 | | | | 0 | | | | 0 | |
Administrator Class | | | 152,980 | | | | 7,624,565 | | | | 0 | | | | 0 | |
Institutional Class | | | 1,201,482 | | | | 61,455,772 | | | | 0 | | | | 0 | |
| | | | |
| | | | |
| | | | | | | 112,567,129 | | | | | | | | 0 | |
| | | | |
Payment for shares redeemed | | | | | | | | | | | | | | | | |
Class A | | | (563,233 | ) | | | (31,063,522 | ) | | | (795,177 | ) | | | (39,090,958 | ) |
Class C | | | (113,094 | ) | | | (5,236,576 | ) | | | (184,692 | ) | | | (8,044,725 | ) |
Class R6 | | | (3,393,805 | ) | | | (197,814,217 | ) | | | (2,181,955 | ) | | | (117,000,267 | ) |
Administrator Class | | | (882,997 | ) | | | (49,514,482 | ) | | | (1,253,278 | ) | | | (62,203,048 | ) |
Institutional Class | | | (6,511,614 | ) | | | (373,073,185 | ) | | | (7,602,523 | ) | | | (404,594,261 | ) |
| | | | |
| | | | |
| | | | | | | (656,701,982 | ) | | | | | | | (630,933,259 | ) |
| | | | |
Net increase (decrease) in net assets resulting from capital share transactions | | | | | | | 28,061,548 | | | | | | | | (117,976,062 | ) |
| | | | |
Total increase (decrease) in net assets | | | | | | | (220,152,616 | ) | | | | | | | 336,786,760 | |
| | | | |
| | | | |
Net assets | | | | | | | | | | | | | | | | |
Beginning of period | | | | | | | 1,998,551,602 | | | | | | | | 1,661,764,842 | |
| | | | |
End of period | | | | | | $ | 1,778,398,986 | | | | | | | $ | 1,998,551,602 | |
| | | | |
| ¹ | Effective for all filings after November 4, 2018, the SEC prospectively eliminated the requirement to parenthetically disclose undistributed net investment income at the end of the period and permitted the aggregation of distributions, with the exception of tax basis returns of capital. Accumulated net investment loss at May 31, 2018 was $3,054,501. |
The accompanying notes are an integral part of these financial statements.
| | | | | | |
| Financial highlights | | Wells Fargo Small Company Growth Fund | | | 15 | |
(For a share outstanding throughout each period)
| | | | | | | | | | | | | | | | | | | | |
| | | Year ended May 31 | |
| CLASS A | | 2019 | | | 2018 | | | 2017 | | | 2016 | | | 2015 | |
Net asset value, beginning of period | | | $56.66 | | | | $44.26 | | | | $37.69 | | | | $44.23 | | | | $39.44 | |
Net investment loss | | | (0.36 | ) | | | (0.35 | )1 | | | (0.28 | )1 | | | (0.22 | )1 | | | (0.37 | )1 |
Net realized and unrealized gains (losses) on investments | | | (3.22 | ) | | | 12.75 | | | | 6.85 | | | | (6.05 | ) | | | 7.08 | |
| | | | | | | | | | | | | | | | | | | | |
Total from investment operations | | | (3.58 | ) | | | 12.40 | | | | 6.57 | | | | (6.27 | ) | | | 6.71 | |
Distributions to shareholders from | | | | | | | | | | | | | | | | | | | | |
Net realized gains | | | (4.10 | ) | | | 0.00 | | | | 0.00 | | | | (0.27 | ) | | | (1.92 | ) |
Net asset value, end of period | | | $48.98 | | | | $56.66 | | | | $44.26 | | | | $37.69 | | | | $44.23 | |
Total return2 | | | (6.13 | )% | | | 28.02 | % | | | 17.43 | % | | | (14.20 | )% | | | 17.51 | % |
Ratios to average net assets (annualized) | | | | | | | | | | | | | | | | | | | | |
Gross expenses3 | | | 1.31 | % | | | 1.32 | % | | | 1.33 | % | | | 1.34 | % | | | 1.41 | % |
Net expenses3 | | | 1.31 | % | | | 1.32 | % | | | 1.33 | % | | | 1.34 | % | | | 1.40 | % |
Net investment loss3 | | | (0.63 | )% | | | (0.71 | )% | | | (0.68 | )% | | | (0.57 | )% | | | (0.90 | )% |
Supplemental data | | | | | | | | | | | | | | | | | | | | |
Portfolio turnover rate4 | | | 54 | % | | | 37 | % | | | 82 | % | | | 49 | % | | | 58 | % |
Net assets, end of period (000s omitted) | | | $64,182 | | | | $76,065 | | | | $76,087 | | | | $128,675 | | | | $85,588 | |
| 1 | Calculated based upon average shares outstanding |
| 2 | Total return calculations do not include any sales charges. |
| 3 | Ratios include net expenses allocated from the affiliated Master Portfolio which were as follows: |
| | | | |
Year ended May 31, 2019 | | | 0.78 | % |
Year ended May 31, 2018 | | | 0.78 | % |
Year ended May 31, 2017 | | | 0.78 | % |
Year ended May 31, 2016 | | | 0.80 | % |
Year ended May 31, 2015 | | | 0.81 | % |
| 4 | Portfolio turnover rate is calculated by multiplying the affiliated Master Portfolio’s percentage of the Fund’s total investments in securities at the end of the period by the affiliated Master Portfolio’s portfolio turnover rate. |
The accompanying notes are an integral part of these financial statements.
| | | | |
| 16 | | Wells Fargo Small Company Growth Fund | | Financial highlights |
(For a share outstanding throughout each period)
| | | | | | | | | | | | | | | | | | | | |
| | | Year ended May 31 | |
| CLASS C | | 2019 | | | 2018 | | | 2017 | | | 2016 | | | 2015 | |
Net asset value, beginning of period | | | $50.38 | | | | $39.65 | | | | $34.02 | | | | $40.25 | | | | $36.32 | |
Net investment loss | | | (0.66 | )1 | | | (0.64 | )1 | | | (0.54 | )1 | | | (0.46 | )1 | | | (0.63 | )1 |
Net realized and unrealized gains (losses) on investments | | | (2.87 | ) | | | 11.37 | | | | 6.17 | | | | (5.50 | ) | | | 6.48 | |
| | | | | | | | | | | | | | | | | | | | |
Total from investment operations | | | (3.53 | ) | | | 10.73 | | | | 5.63 | | | | (5.96 | ) | | | 5.85 | |
Distributions to shareholders from | | | | | | | | | | | | | | | | | | | | |
Net realized gains | | | (4.10 | ) | | | 0.00 | | | | 0.00 | | | | (0.27 | ) | | | (1.92 | ) |
Net asset value, end of period | | | $42.75 | | | | $50.38 | | | | $39.65 | | | | $34.02 | | | | $40.25 | |
Total return2 | | | (6.82 | )% | | | 27.06 | % | | | 16.55 | % | | | (14.84 | )% | | | 16.62 | % |
Ratios to average net assets (annualized) | | | | | | | | | | | | | | | | | | | | |
Gross expenses3 | | | 2.06 | % | | | 2.07 | % | | | 2.08 | % | | | 2.09 | % | | | 2.16 | % |
Net expenses3 | | | 2.06 | % | | | 2.07 | % | | | 2.08 | % | | | 2.09 | % | | | 2.15 | % |
Net investment loss3 | | | (1.38 | )% | | | (1.47 | )% | | | (1.43 | )% | | | (1.32 | )% | | | (1.64 | )% |
Supplemental data | | | | | | | | | | | | | | | | | | | | |
Portfolio turnover rate4 | | | 54 | % | | | 37 | % | | | 82 | % | | | 49 | % | | | 58 | % |
Net assets, end of period (000s omitted) | | | $13,968 | | | | $19,979 | | | | $22,410 | | | | $26,946 | | | | $17,334 | |
| 1 | Calculated based upon average shares outstanding |
| 2 | Total return calculations do not include any sales charges. |
| 3 | Ratios include net expenses allocated from the affiliated Master Portfolio which were as follows: |
| | | | |
Year ended May 31, 2019 | | | 0.78 | % |
Year ended May 31, 2018 | | | 0.78 | % |
Year ended May 31, 2017 | | | 0.78 | % |
Year ended May 31, 2016 | | | 0.80 | % |
Year ended May 31, 2015 | | | 0.81 | % |
| 4 | Portfolio turnover rate is calculated by multiplying the affiliated Master Portfolio’s percentage of the Fund’s total investments in securities at the end of the period by the affiliated Master Portfolio’s portfolio turnover rate. |
The accompanying notes are an integral part of these financial statements.
| | | | | | |
| Financial highlights | | Wells Fargo Small Company Growth Fund | | | 17 | |
(For a share outstanding throughout each period)
| | | | | | | | | | | | | | | | | | | | |
| | | Year ended May 31 | |
| CLASS R6 | | 2019 | | | 2018 | | | 2017 | | | 2016 | | | 20151 | |
Net asset value, beginning of period | | | $60.31 | | | | $46.91 | | | | $39.77 | | | | $46.45 | | | | $42.98 | |
Net investment loss | | | (0.12 | ) | | | (0.14 | ) | | | (0.11 | ) | | | (0.03 | ) | | | (0.09 | )2 |
Net realized and unrealized gains (losses) on investments | | | (3.44 | ) | | | 13.54 | | | | 7.25 | | | | (6.38 | ) | | | 5.48 | |
| | | | | | | | | | | | | | | | | | | | |
Total from investment operations | | | (3.56 | ) | | | 13.40 | | | | 7.14 | | | | (6.41 | ) | | | 5.39 | |
Distributions to shareholders from | | | | | | | | | | | | | | | | | | | | |
Net realized gains | | | (4.10 | ) | | | 0.00 | | | | 0.00 | | | | (0.27 | ) | | | (1.92 | ) |
Net asset value, end of period | | | $52.65 | | | | $60.31 | | | | $46.91 | | | | $39.77 | | | | $46.45 | |
Total return3 | | | (5.73 | )% | | | 28.59 | % | | | 17.95 | % | | | (13.83 | )% | | | 13.00 | % |
Ratios to average net assets (annualized) | | | | | | | | | | | | | | | | | | | | |
Gross expenses4 | | | 0.88 | % | | | 0.89 | % | | | 0.90 | % | | | 0.91 | % | | | 0.91 | % |
Net expenses4 | | | 0.88 | % | | | 0.89 | % | | | 0.90 | % | | | 0.90 | % | | | 0.90 | % |
Net investment loss4 | | | (0.20 | )% | | | (0.29 | )% | | | (0.25 | )% | | | (0.09 | )% | | | (0.34 | )% |
Supplemental data | | | | | | | | | | | | | | | | | | | | |
Portfolio turnover rate5 | | | 54 | % | | | 37 | % | | | 82 | % | | | 49 | % | | | 58 | % |
Net assets, end of period (000s omitted) | | | $564,516 | | | | $618,523 | | | | $418,111 | | | | $229,391 | | | | $644 | |
| 1 | For the period from October 31, 2014 (commencement of class operations) to May 31, 2015 |
| 2 | Calculated based upon average shares outstanding |
| 3 | Returns for periods of less than one year are not annualized. |
| 4 | Ratios include net expenses allocated from the affiliated Master Portfolio which were as follows: |
| | | | |
Year ended May 31, 2019 | | | 0.78 | % |
Year ended May 31, 2018 | | | 0.78 | % |
Year ended May 31, 2017 | | | 0.78 | % |
Year ended May 31, 2016 | | | 0.80 | % |
Year ended May 31, 20151 | | | 0.81 | % |
| 5 | Portfolio turnover rate is calculated by multiplying the affiliated Master Portfolio’s percentage of the Fund’s total investments in securities at the end of the period by the affiliated Master Portfolio’s portfolio turnover rate. |
The accompanying notes are an integral part of these financial statements.
| | | | |
| 18 | | Wells Fargo Small Company Growth Fund | | Financial highlights |
(For a share outstanding throughout each period)
| | | | | | | | | | | | | | | | | | | | |
| | | Year ended May 31 | |
| ADMINISTRATOR CLASS | | 2019 | | | 2018 | | | 2017 | | | 2016 | | | 2015 | |
Net asset value, beginning of period | | | $58.85 | | | | $45.91 | | | | $39.05 | | | | $45.73 | | | | $40.64 | |
Net investment loss | | | (0.29 | )1 | | | (0.30 | )1 | | | (0.24 | )1 | | | (0.19 | )1 | | | (0.30 | )1 |
Net realized and unrealized gains (losses) on investments | | | (3.36 | ) | | | 13.24 | | | | 7.10 | | | | (6.22 | ) | | | 7.31 | |
| | | | | | | | | | | | | | | | | | | | |
Total from investment operations | | | (3.65 | ) | | | 12.94 | | | | 6.86 | | | | (6.41 | ) | | | 7.01 | |
Distributions to shareholders from | | | | | | | | | | | | | | | | | | | | |
Net realized gains | | | (4.10 | ) | | | 0.00 | | | | 0.00 | | | | (0.27 | ) | | | (1.92 | ) |
Net asset value, end of period | | | $51.10 | | | | $58.85 | | | | $45.91 | | | | $39.05 | | | | $45.73 | |
Total return | | | (6.02 | )% | | | 28.19 | % | | | 17.57 | % | | | (14.04 | )% | | | 17.73 | % |
Ratios to average net assets (annualized) | | | | | | | | | | | | | | | | | | | | |
Gross expenses2 | | | 1.23 | % | | | 1.24 | % | | | 1.25 | % | | | 1.25 | % | | | 1.24 | % |
Net expenses2 | | | 1.20 | % | | | 1.20 | % | | | 1.20 | % | | | 1.20 | % | | | 1.20 | % |
Net investment loss2 | | | (0.51 | )% | | | (0.60 | )% | | | (0.55 | )% | | | (0.46 | )% | | | (0.70 | )% |
Supplemental data | | | | | | | | | | | | | | | | | | | | |
Portfolio turnover rate3 | | | 54 | % | | | 37 | % | | | 82 | % | | | 49 | % | | | 58 | % |
Net assets, end of period (000s omitted) | | | $87,850 | | | | $114,429 | | | | $130,311 | | | | $130,104 | | | | $185,267 | |
| 1 | Calculated based upon average shares outstanding |
| 2 | Ratios include net expenses allocated from the affiliated Master Portfolio which were as follows: |
| | | | |
Year ended May 31, 2019 | | | 0.78 | % |
Year ended May 31, 2018 | | | 0.78 | % |
Year ended May 31, 2017 | | | 0.78 | % |
Year ended May 31, 2016 | | | 0.80 | % |
Year ended May 31, 2015 | | | 0.81 | % |
| 3 | Portfolio turnover rate is calculated by multiplying the affiliated Master Portfolio’s percentage of the Fund’s total investments in securities at the end of the period by the affiliated Master Portfolio’s portfolio turnover rate. |
The accompanying notes are an integral part of these financial statements.
| | | | | | |
| Financial highlights | | Wells Fargo Small Company Growth Fund | | | 19 | |
(For a share outstanding throughout each period)
| | | | | | | | | | | | | | | | | | | | |
| | | Year ended May 31 | |
| INSTITUTIONAL CLASS | | 2019 | | | 2018 | | | 2017 | | | 2016 | | | 2015 | |
Net asset value, beginning of period | | | $60.20 | | | | $46.85 | | | | $39.75 | | | | $46.44 | | | | $41.14 | |
Net investment loss | | | (0.15 | ) | | | (0.19 | ) | | | (0.15 | ) | | | (0.09 | ) | | | (0.20 | )1 |
Net realized and unrealized gains (losses) on investments | | | (3.44 | ) | | | 13.54 | | | | 7.25 | | | | (6.33 | ) | | | 7.42 | |
| | | | | | | | | | | | | | | | | | | | |
Total from investment operations | | | (3.59 | ) | | | 13.35 | | | | 7.10 | | | | (6.42 | ) | | | 7.22 | |
Distributions to shareholders from | | | | | | | | | | | | | | | | | | | | |
Net realized gains | | | (4.10 | ) | | | 0.00 | | | | 0.00 | | | | (0.27 | ) | | | (1.92 | ) |
Net asset value, end of period | | | $52.51 | | | | $60.20 | | | | $46.85 | | | | $39.75 | | | | $46.44 | |
Total return | | | (5.77 | )% | | | 28.50 | % | | | 17.86 | % | | | (13.85 | )% | | | 18.03 | % |
Ratios to average net assets (annualized) | | | | | | | | | | | | | | | | | | | | |
Gross expenses2 | | | 0.98 | % | | | 0.99 | % | | | 1.00 | % | | | 1.01 | % | | | 0.98 | % |
Net expenses2 | | | 0.95 | % | | | 0.95 | % | | | 0.95 | % | | | 0.95 | % | | | 0.95 | % |
Net investment loss2 | | | (0.26 | )% | | | (0.35 | )% | | | (0.31 | )% | | | (0.18 | )% | | | (0.45 | )% |
Supplemental data | | | | | | | | | | | | | | | | | | | | |
Portfolio turnover rate3 | | | 54 | % | | | 37 | % | | | 82 | % | | | 49 | % | | | 58 | % |
Net assets, end of period (000s omitted) | | | $1,047,883 | | | | $1,169,555 | | | | $1,014,847 | | | | $678,699 | | | | $457,542 | |
| 1 | Calculated based upon average shares outstanding |
| 2 | Ratios include net expenses allocated from the affiliated Master Portfolio which were as follows: |
| | | | |
Year ended May 31, 2019 | | | 0.78 | % |
Year ended May 31, 2018 | | | 0.78 | % |
Year ended May 31, 2017 | | | 0.78 | % |
Year ended May 31, 2016 | | | 0.80 | % |
Year ended May 31, 2015 | | | 0.81 | % |
| 3 | Portfolio turnover rate is calculated by multiplying the affiliated Master Portfolio’s percentage of the Fund’s total investments in securities at the end of the period by the affiliated Master Portfolio’s portfolio turnover rate. |
The accompanying notes are an integral part of these financial statements.
| | | | |
| 20 | | Wells Fargo Small Company Growth Fund | | Notes to financial statements |
1. ORGANIZATION
Wells Fargo Funds Trust (the “Trust”), a Delaware statutory trust organized on March 10, 1999, is an open-end management investment company registered under the Investment Company Act of 1940, as amended (the “1940 Act”). As an investment company, the Trust follows the accounting and reporting guidance in Financial Accounting Standards Board (“FASB”) Accounting Standards Codification Topic 946, Financial Services – Investment Companies. These financial statements report on the Wells Fargo Small Company Growth Fund (the “Fund”) which is a diversified series of the Trust.
The Fund is a feeder fund in a master-feeder structure that invests substantially all of its assets in a single master portfolio with a substantially identical investment objective and substantially similar investment strategies. The Fund seeks to achieve its investment objective by investing substantially all of its assets in a separate diversified portfolio (the “affiliated Master Portfolio”) of Wells Fargo Master Trust, a registered open-end management investment company. The affiliated Master Portfolio directly acquires portfolio securities and the Fund acquires an indirect interest in those securities. The Fund accounts for its investment in the affiliated Master Portfolio as a partnership investment and records on a daily basis its share of the affiliated Master Portfolio’s income, expense and realized and unrealized gains and losses. The financial statements of the affiliated Master Portfolio for the year ended May 31, 2019 are included in this report and should be read in conjunction with the Fund’s financial statements. As of May 31, 2019, the Fund owned 98% of Wells Fargo Small Company Growth Portfolio.
2. SIGNIFICANT ACCOUNTING POLICIES
The following significant accounting policies, which are consistently followed in the preparation of the financial statements of the Fund, are in conformity with U.S. generally accepted accounting principles which require management to make estimates and assumptions that affect the reported amounts of assets and liabilities, disclosure of contingent assets and liabilities at the date of the financial statements, and the reported amounts of revenues and expenses during the reporting period. Actual results could differ from those estimates.
Securities valuation
All investments are valued each business day as of the close of regular trading on the New York Stock Exchange (generally 4 p.m. Eastern Time), although the Fund may deviate from this calculation time under unusual or unexpected circumstances.
Investments in the affiliated Master Portfolio are valued daily based on the Fund’s proportionate share of the affiliated Master Portfolio’s net assets, which are also valued daily. Securities held in the affiliated Master Portfolio are valued as discussed in the Notes to Financial Statements of the affiliated Master Portfolio, which are included elsewhere in this report.
Investment transactions, income and expenses
Investments in the affiliated Master Portfolio are recorded on a trade basis. The Fund records daily its proportionate share of the affiliated Master Portfolio’s dividend income, expenses and realized and unrealized gains or losses. The Fund also accrues its own expenses.
Distributions to shareholders
Distributions to shareholders from net investment income and any net realized gains are recorded on the ex-dividend date and paid at least annually. Such distributions are determined in accordance with income tax regulations and may differ from U.S. generally accepted accounting principles. Dividend sources are estimated at the time of declaration. The tax character of distributions is determined as of the Fund’s fiscal year end. Therefore, a portion of the Fund’s distributions made prior to the Fund’s fiscal year end may be categorized as a tax return of capital at year end.
Federal and other taxes
The Fund intends to continue to qualify as a regulated investment company by distributing substantially all of its investment company taxable income and any net realized capital gains (after reduction for capital loss carryforwards) sufficient to relieve it from all, or substantially all, federal income taxes. Accordingly, no provision for federal income taxes was required.
The Fund’s income and federal excise tax returns and all financial records supporting those returns for the prior three fiscal years are subject to examination by the federal and Delaware revenue authorities. Management has analyzed the Fund’s tax positions taken on federal, state, and foreign tax returns for all open tax years and does not believe that there are any uncertain tax positions that require recognition of a tax liability.
| | | | | | |
| Notes to financial statements | | Wells Fargo Small Company Growth Fund | | | 21 | |
As of May 31, 2019, the aggregate cost of all investments for federal income tax purposes was $1,480,431,828 and the unrealized gains (losses) consisted of:
| | | | |
| |
Gross unrealized gains | | $ | 297,974,041 | |
| |
Gross unrealized losses | | | 0 | |
| |
Net unrealized gains | | $ | 297,974,041 | |
As of May 31, 2019, the Fund had current year deferred post-October capital losses consisting of $6,988,693 in short-term losses which will be recognized on the first day of the following fiscal year.
As of May 31, 2019, the Fund had a qualified late-year ordinary loss of $1,877,655 which will be recognized on the first day of the following fiscal year.
Class allocations
The separate classes of shares offered by the Fund differ principally in applicable sales charges, distribution, shareholder servicing, and administration fees. Class specific expenses are charged directly to that share class. Investment income, common expenses, and realized and unrealized gains (losses) on investments are allocated daily to each class of shares based on the relative proportion of net assets of each class.
3. FAIR VALUATION MEASUREMENTS
At May 31, 2019, the affiliated Master Portfolio was measured at fair value using the net asset value per share (or its equivalent) as a practical expedient. The investment objective and the value of the affiliate Master Portfolio was as follows:
| | | | | | | | |
| Affiliated Master Portfolio | | Investment objective | | | Value of affiliated Master Portfolio | |
Wells Fargo Small Company Growth Portfolio | | | Seeks long-term capital appreciation | | | $ | 1,778,405,869 | |
The affiliated Master Portfolio does not have a redemption period notice, can be redeemed daily and does not have any unfunded commitments.
4. TRANSACTIONS WITH AFFILIATES
Management fee
Wells Fargo Funds Management, LLC (“Funds Management”), an indirect wholly owned subsidiary of Wells Fargo & Company (“Wells Fargo”), is the manager of the Fund and provides advisory and fund-level administrative services under an investment management agreement. Under the investment management agreement, Funds Management is responsible for, among other services, implementing the investment objectives and strategies of the Fund and providing fund-level administrative services in connection with the Fund’s operations. As long as the Fund continues to invest substantially all of its assets in a single affiliated Master Portfolio, the Fund pays Funds Management an investment management fee only for fund-level administrative services at the following annual rate based on the Fund’s average daily net assets:
| | | | |
| Average daily net assets | | Management fee | |
| |
First $5 billion | | | 0.05 | % |
| |
Next $5 billion | | | 0.04 | |
| |
Over $10 billion | | | 0.03 | |
For the year ended May 31, 2019, the management fee was equivalent to an annual rate of 0.05% of the Fund’s average daily net assets.
Funds Management also serves as the adviser to the affiliated Master Portfolio and is entitled to receive a fee from the affiliated Master Portfolio for those services.
Administration fees
Under a class-level administration agreement, Funds Management provides class-level administrative services to the Fund, which includes paying fees and expenses for services provided by the transfer agent, sub-transfer agents, omnibus
| | | | |
| 22 | | Wells Fargo Small Company Growth Fund | | Notes to financial statements |
account servicers and record-keepers. As compensation for its services under the class-level administration agreement, Funds Management receives an annual fee which is calculated based on the average daily net assets of each class as follows:
| | | | |
| | | Class-level
administration fee | |
| |
Class A, Class C | | | 0.21 | % |
| |
Class R6 | | | 0.03 | |
| |
Administrator Class, Institutional Class | | | 0.13 | |
Funds Management has contractually waived and/or reimbursed management and administration fees to the extent necessary to maintain certain net operating expense ratios for the Fund. When each class of the Fund has exceeded its expense cap, Funds Management has waived fees and/or reimbursed expenses from fund level expenses on a proportionate basis and then from class specific expenses. When only certain classes exceed their expense caps, waivers and/or reimbursements are applied against class specific expenses before fund level expenses. Net expenses from the affiliated Master Portfolio are included in the expense caps. Funds Management has committed through September 30, 2019 to waive fees and/or reimburse expenses to the extent necessary to cap the Fund’s expenses at 1.35% for Class A shares, 2.10% for Class C shares, 0.90% for Class R6 shares, 1.20% for Administrator Class shares, and 0.95% for Institutional Class shares. Prior to or after the commitment expiration date, the cap may be increased or the commitment to maintain the cap may be terminated only with the approval of the Board of Trustees.
Distribution fee
The Trust has adopted a distribution plan for Class C shares of the Fund pursuant to Rule 12b-1 under the 1940 Act. A distribution fee is charged to Class C and paid to Wells Fargo Funds Distributor, LLC (“Funds Distributor”), the principal underwriter, at an annual rate of 0.75% of the average daily net assets of Class C shares.
In addition, Funds Distributor is entitled to receive the front-end sales charge from the purchase of Class A shares and a contingent deferred sales charge on the redemption of certain Class A shares. Funds Distributor is also entitled to receive the contingent deferred sales charges from redemptions of Class C shares. For the year ended May 31, 2019, Funds Distributor received $1,321 from the sale of Class A shares and $11 in contingent deferred sales charges from redemptions of Class C shares. No contingent deferred sales charges were incurred by Class A shares for the year ended May 31, 2019.
Shareholder servicing fees
The Trust has entered into contracts with one or more shareholder servicing agents, whereby Class A, Class C, and Administrator Class of the Fund are charged a fee at an annual rate of 0.25% of the average daily net assets of each respective class. A portion of these total shareholder servicing fees were paid to affiliates of Wells Fargo.
5. INVESTMENT PORTFOLIO TRANSACTIONS
The Fund seeks to achieve its investment objective by investing substantially all of its assets in a single affiliated Master Portfolio. Purchases and sales have been calculated by multiplying the Fund’s ownership percentage of the affiliated Master Portfolio by the affiliated Master Portfolio’s purchases and sales. Purchases and sales of investments, excluding short-term securities, for year ended May 31, 2019 were $1,021,292,647 and $1,077,854,047, respectively.
6. BANK BORROWINGS
The Trust (excluding the money market funds), Wells Fargo Master Trust and Wells Fargo Variable Trust are parties to a $280,000,000 revolving credit agreement whereby the Fund is permitted to use bank borrowings for temporary or emergency purposes, such as to fund shareholder redemption requests. Interest under the credit agreement is charged to the Fund based on a borrowing rate equal to the higher of the Federal Funds rate in effect on that day plus 1.25% or the overnight LIBOR rate in effect on that day plus 1.25%. In addition, an annual commitment fee equal to 0.25% of the unused balance is allocated to each participating fund.
For the year ended May 31, 2019, there were no borrowings by the Fund under the agreement.
| | | | | | |
| Notes to financial statements | | Wells Fargo Small Company Growth Fund | | | 23 | |
7. DISTRIBUTIONS TO SHAREHOLDERS
The tax character of distributions paid during the years ended May 31, 2019 and May 31, 2018 were as follows:
| | | | | | | | |
| | | Year ended May 31 | |
| | |
| | | 2019 | | | 2018 | |
| | |
Ordinary income | | $ | 30,719,230 | | | $ | 0 | |
| | |
Long-term capital gain | | | 105,713,520 | | | | 0 | |
As of May 31, 2019, the components of distributable earnings on a tax basis were as follows:
| | | | | | |
Undistributed long-term gain | | Unrealized gains | | Late-year ordinary losses deferred | | Post-October capital losses deferred |
| | | |
| $87,147,974 | | $297,974,041 | | $(1,877,655) | | $(6,988,693) |
8. CONCENTRATION RISK
Concentration risk result from exposure to a limited number of sectors. Through its investment in the affiliated Master Portfolio which may invest a substantial portion of its assets in any sector, the Fund may in turn be more affected by changes in that sector than a fund whose investments are not heavily weighted in any sector.
9. INDEMNIFICATION
Under the Trust’s organizational documents, the officers and Trustees have been granted certain indemnification rights against certain liabilities that may arise out of performance of their duties to the Trust. Additionally, in the normal course of business, the Trust may enter into contracts with service providers that contain a variety of indemnification clauses. The Trust’s maximum exposure under these arrangements is dependent on future claims that may be made against the Fund and, therefore, cannot be estimated.
10. NEW ACCOUNTING PRONOUNCEMENT
In August 2018, FASB issued Accounting Standards Update (“ASU”) No. 2018-13, Fair Value Measurement (Topic 820)Disclosure Framework—Changes to the Disclosure Requirements for Fair Value Measurement. ASU 2018-13 updates the disclosure requirements for fair value measurements by modifying or removing certain disclosures and adding certain new disclosures. The amendments are effective for fiscal years, and interim periods within those fiscal years, beginning after December 15, 2019. Early adoption is permitted. Management has adopted the removal and modification of disclosures early, as permitted, and will adopt the additional new disclosures at the effective date.
| | | | |
| 24 | | Wells Fargo Small Company Growth Fund | | Report of independent registered public accounting firm |
TO THE SHAREHOLDERS OF THE FUND AND BOARD OF TRUSTEES OF WELLS FARGO FUNDS TRUST:
Opinion on the Financial Statements
We have audited the accompanying statement of assets and liabilities of Wells Fargo Small Company Growth Fund (the Fund), one of the funds constituting Wells Fargo Funds Trust, including the portfolio of investments, as of May 31, 2019, the related statement of operations for the year then ended, the statements of changes in net assets for each of the years in the two-year period then ended, and the related notes (collectively, the financial statements) and the financial highlights for each of the years or periods in the five-year period then ended. In our opinion, the financial statements and financial highlights present fairly, in all material respects, the financial position of the Fund as of May 31, 2019, the results of its operations for the year then ended, the changes in its net assets for each of the years in the two-year period then ended, and the financial highlights for each of the years or periods in the five-year period then ended, in conformity with U.S. generally accepted accounting principles.
Basis for Opinion
These financial statements and financial highlights are the responsibility of the Fund’s management. Our responsibility is to express an opinion on these financial statements and financial highlights based on our audits. We are a public accounting firm registered with the Public Company Accounting Oversight Board (United States) (PCAOB) and are required to be independent with respect to the Fund in accordance with the U.S. federal securities laws and the applicable rules and regulations of the Securities and Exchange Commission and the PCAOB.
We conducted our audits in accordance with the standards of the PCAOB. Those standards require that we plan and perform the audit to obtain reasonable assurance about whether the financial statements and financial highlights are free of material misstatement, whether due to error or fraud. Our audits included performing procedures to assess the risks of material misstatement of the financial statements and financial highlights, whether due to error or fraud, and performing procedures that respond to those risks. Such procedures included examining, on a test basis, evidence regarding the amounts and disclosures in the financial statements and financial highlights. Such procedures also included confirmation of securities owned as of May 31, 2019, by correspondence with the transfer agent. Our audits also included evaluating the accounting principles used and significant estimates made by management, as well as evaluating the overall presentation of the financial statements and financial highlights. We believe that our audits provide a reasonable basis for our opinion.

We have not been able to determine the specific year that we began serving as the auditor of one or more Wells Fargo Funds investment companies; however we are aware that we have served as the auditor of one or more Wells Fargo Funds investment companies since at least 1955.
Boston, Massachusetts
July 26, 2019
| | | | | | |
| Portfolio of investments—May 31, 2019 | | Wells Fargo Small Company Growth Portfolio | | | 25 | |
| | | | | | | | | | | | | | | | |
| Security name | | | | | | | | Shares | | | Value | |
| | | | |
Common Stocks: 95.60% | | | | | | | | | | | | | | | | |
| | | | |
Communication Services: 0.57% | | | | | | | | | | | | | | | | |
| | | | |
| Entertainment: 0.57% | | | | | | | | | | | | | | | | |
| | | | |
Lions Gate Entertainment Class B | | | | | | | | | | | 754,343 | | | $ | 10,379,760 | |
| | | | | | | | | | | | | | | | |
| | | | |
Consumer Discretionary: 11.73% | | | | | | | | | | | | | | | | |
| | | | |
| Auto Components: 0.98% | | | | | | | | | | | | | | | | |
| | | | |
Fox Factory Holding Corporation † | | | | | | | | | | | 263,576 | | | | 17,664,864 | |
| | | | | | | | | | | | | | | | |
| | | | |
| Diversified Consumer Services: 1.32% | | | | | | | | | | | | | | | | |
| | | | |
Houghton Mifflin Harcourt Company † | | | | | | | | | | | 1,161,448 | | | | 6,550,567 | |
| | | | |
Strategic Education Incorporated | | | | | | | | | | | 98,221 | | | | 17,285,914 | |
| | | | |
| | | | | | | | | | | | | | | 23,836,481 | |
| | | | | | | | | | | | | | | | |
| | | | |
| Hotels, Restaurants & Leisure: 4.35% | | | | | | | | | | | | | | | | |
| | | | |
Dave & Buster’s Entertainment Incorporated | | | | | | | | | | | 282,809 | | | | 14,066,920 | |
| | | | |
Eldorado Resorts Incorporated † | | | | | | | | | | | 494,043 | | | | 24,292,094 | |
| | | | |
Extended Stay America Incorporated | | | | | | | | | | | 1,361,460 | | | | 23,335,424 | |
| | | | |
International Game Technology « | | | | | | | | | | | 1,297,722 | | | | 16,870,387 | |
| | | | |
| | | | | | | | | | | | | | | 78,564,825 | |
| | | | | | | | | | | | | | | | |
| | | | |
| Household Durables: 0.86% | | | | | | | | | | | | | | | | |
| | | | |
Skyline Champion Corporation | | | | | | | | | | | 667,838 | | | | 15,620,731 | |
| | | | | | | | | | | | | | | | |
| | | | |
| Leisure Products: 0.45% | | | | | | | | | | | | | | | | |
| | | | |
Callaway Golf Company | | | | | | | | | | | 549,731 | | | | 8,081,046 | |
| | | | | | | | | | | | | | | | |
| | | | |
| Specialty Retail: 3.23% | | | | | | | | | | | | | | | | |
| | | | |
At Home Group Incorporated Ǡ | | | | | | | | | | | 589,330 | | | | 11,226,737 | |
| | | | |
Burlington Stores Incorporated † | | | | | | | | | | | 106,962 | | | | 16,748,110 | |
| | | | |
Children’s Place Retail Stores Incorporated « | | | | | | | | | | | 175,610 | | | | 16,272,023 | |
| | | | |
Monro Muffler Brake Incorporated | | | | | | | | | | | 177,971 | | | | 14,186,068 | |
| | | | |
| | | | | | | | | | | | | | | 58,432,938 | |
| | | | | | | | | | | | | | | | |
| | | | |
| Textiles, Apparel & Luxury Goods: 0.54% | | | | | | | | | | | | | | | | |
| | | | |
G-III Apparel Group Limited † | | | | | | | | | | | 378,281 | | | | 9,733,170 | |
| | | | | | | | | | | | | | | | |
| | | | |
Consumer Staples: 2.61% | | | | | | | | | | | | | | | | |
| | | | |
| Food & Staples Retailing: 1.27% | | | | | | | | | | | | | | | | |
| | | | |
Performance Food Group Company † | | | | | | | | | | | 581,653 | | | | 22,888,046 | |
| | | | | | | | | | | | | | | | |
| | | | |
| Household Products: 1.34% | | | | | | | | | | | | | | | | |
| | | | |
Central Garden & Pet Company Class A † | | | | | | | | | | | 536,717 | | | | 13,723,854 | |
| | | | |
Energizer Holdings Incorporated | | | | | | | | | | | 257,662 | | | | 10,543,529 | |
| | | | |
| | | | | | | | | | | | | | | 24,267,383 | |
| | | | | | | | | | | | | | | | |
The accompanying notes are an integral part of these financial statements.
| | | | |
| 26 | | Wells Fargo Small Company Growth Portfolio | | Portfolio of investments—May 31, 2019 |
| | | | | | | | | | | | | | | | |
| Security name | | | | | | | | Shares | | | Value | |
| | | | |
Energy: 1.59% | | | | | | | | | | | | | | | | |
| | | | |
| Oil, Gas & Consumable Fuels: 1.59% | | | | | | | | | | | | | | | | |
| | | | |
Berry Petroleum Corporation | | | | | | | | | | | 517,373 | | | $ | 5,561,760 | |
| | | | |
GasLog Limited | | | | | | | | | | | 728,637 | | | | 10,492,373 | |
| | | | |
Parsley Energy Incorporated Class A † | | | | | | | | | | | 715,336 | | | | 12,754,441 | |
| | | | |
| | | | | | | | | | | | | | | 28,808,574 | |
| | | | | | | | | | | | | | | | |
| | | | |
Financials: 9.51% | | | | | | | | | | | | | | | | |
| | | | |
| Banks: 1.17% | | | | | | | | | | | | | | | | |
| | | | |
SVB Financial Group † | | | | | | | | | | | 59,865 | | | | 12,056,811 | |
| | | | |
Triumph Bancorp Incorporated † | | | | | | | | | | | 323,826 | | | | 9,089,796 | |
| | | | |
| | | | | | | | | | | | | | | 21,146,607 | |
| | | | | | | | | | | | | | | | |
| | | | |
| Capital Markets: 4.12% | | | | | | | | | | | | | | | | |
| | | | |
Evercore Partners Incorporated Class A | | | | | | | | | | | 306,283 | | | | 23,654,236 | |
| | | | |
Focus Financial Partners Class A † | | | | | | | | | | | 219,468 | | | | 6,156,077 | |
| | | | |
Stifel Financial Corporation | | | | | | | | | | | 382,778 | | | | 20,528,384 | |
| | | | |
Virtu Financial Incorporated Class A « | | | | | | | | | | | 498,768 | | | | 11,481,639 | |
| | | | |
Virtus Investment Partners Incorporated | | | | | | | | | | | 124,412 | | | | 12,639,015 | |
| | | | |
| | | | | | | | | | | | | | | 74,459,351 | |
| | | | | | | | | | | | | | | | |
| | | | |
| Consumer Finance: 0.85% | | | | | | | | | | | | | | | | |
| | | | |
FirstCash Financial Services Incorporated | | | | | | | | | | | 162,453 | | | | 15,387,548 | |
| | | | | | | | | | | | | | | | |
| | | | |
| Insurance: 1.91% | | | | | | | | | | | | | | | | |
| | | | |
Argo Group International Holdings Limited | | | | | | | | | | | 342,903 | | | | 24,171,232 | |
| | | | |
Goosehead Insurance Incorporated Class A « | | | | | | | | | | | 282,181 | | | | 10,336,290 | |
| | | | |
| | | | | | | | | | | | | | | 34,507,522 | |
| | | | | | | | | | | | | | | | |
| | | | |
| Thrifts & Mortgage Finance: 1.46% | | | | | | | | | | | | | | | | |
| | | | |
Essent Group Limited † | | | | | | | | | | | 561,838 | | | | 26,378,294 | |
| | | | | | | | | | | | | | | | |
| | | | |
Health Care: 23.46% | | | | | | | | | | | | | | | | |
| | | | |
| Biotechnology: 6.94% | | | | | | | | | | | | | | | | |
| | | | |
ACADIA Pharmaceuticals Incorporated Ǡ | | | | | | | | | | | 404,531 | | | | 9,704,699 | |
| | | | |
Alnylam Pharmaceuticals Incorporated † | | | | | | | | | | | 175,207 | | | | 11,829,977 | |
| | | | |
Array BioPharma Incorporated † | | | | | | | | | | | 589,135 | | | | 15,564,947 | |
| | | | |
CareDx Incorporated † | | | | | | | | | | | 370,108 | | | | 11,702,815 | |
| | | | |
Emergent BioSolutions Incorporated † | | | | | | | | | | | 243,089 | | | | 9,704,113 | |
| | | | |
Flexion Therapeutics Incorporated Ǡ | | | | | | | | | | | 568,225 | | | | 6,267,522 | |
| | | | |
Galapagos NV † | | | | | | | | | | | 58,277 | | | | 6,622,598 | |
| | | | |
Intercept Pharmaceuticals Incorporated Ǡ | | | | | | | | | | | 97,123 | | | | 8,043,727 | |
| | | | |
Invitae Corporation † | | | | | | | | | | | 528,662 | | | | 9,225,152 | |
| | | | |
Ionis Pharmaceuticals Incorporated † | | | | | | | | | | | 140,534 | | | | 9,219,030 | |
| | | | |
Iovance Biotherapeutics Incorporated † | | | | | | | | | | | 522,539 | | | | 8,543,513 | |
| | | | |
Ironwood Pharmaceuticals Incorporated | | | | | | | | | | | 926,983 | | | | 10,131,924 | |
| | | | |
Portola Pharmaceuticals Incorporated Ǡ | | | | | | | | | | | 316,083 | | | | 8,815,555 | |
| | | | |
| | | | | | | | | | | | | | | 125,375,572 | |
| | | | | | | | | | | | | | | | |
The accompanying notes are an integral part of these financial statements.
| | | | | | |
| Portfolio of investments—May 31, 2019 | | Wells Fargo Small Company Growth Portfolio | | | 27 | |
| | | | | | | | | | | | | | | | |
| Security name | | | | | | | | Shares | | | Value | |
| | | | |
| Health Care Equipment & Supplies: 7.40% | | | | | | | | | | | | | | | | |
| | | | |
Atricure Incorporated † | | | | | | | | | | | 590,435 | | | $ | 17,299,746 | |
| | | | |
Axogen Incorporated † | | | | | | | | | | | 396,736 | | | | 8,303,684 | |
| | | | |
Cerus Corporation † | | | | | | | | | | | 1,446,112 | | | | 6,782,265 | |
| | | | |
DexCom Incorporated † | | | | | | | | | | | 170,984 | | | | 20,740,359 | |
| | | | |
Glaukos Corporation † | | | | | | | | | | | 184,991 | | | | 11,928,220 | |
| | | | |
Inogen Incorporated † | | | | | | | | | | | 122,056 | | | | 7,868,950 | |
| | | | |
Merit Medical Systems Incorporated † | | | | | | | | | | | 299,178 | | | | 15,446,560 | |
| | | | |
Novocure Limited † | | | | | | | | | | | 170,122 | | | | 9,036,881 | |
| | | | |
Tactile Systems Technology Class I † | | | | | | | | | | | 349,683 | | | | 16,795,274 | |
| | | | |
Wright Medical Group NV † | | | | | | | | | | | 633,490 | | | | 19,460,813 | |
| | | | |
| | | | | | | | | | | | | | | 133,662,752 | |
| | | | | | | | | | | | | | | | |
| | | | |
| Health Care Providers & Services: 2.15% | | | | | | | | | | | | | | | | |
| | | | |
AMN Healthcare Services Incorporated † | | | | | | | | | | | 291,288 | | | | 14,109,991 | |
| | | | |
HealthEquity Incorporated † | | | | | | | | | | | 184,500 | | | | 12,058,920 | |
| | | | |
PetIQ Incorporated Ǡ | | | | | | | | | | | 485,597 | | | | 12,737,209 | |
| | | | |
| | | | | | | | | | | | | | | 38,906,120 | |
| | | | | | | | | | | | | | | | |
| | | | |
| Health Care Technology: 3.89% | | | | | | | | | | | | | | | | |
| | | | |
Allscripts Healthcare Solutions Incorporated † | | | | | | | | | | | 1,004,514 | | | | 9,773,921 | |
| | | | |
Evolent Health Incorporated Class A † | | | | | | | | | | | 836,282 | | | | 8,898,040 | |
| | | | |
Medidata Solutions Incorporated † | | | | | | | | | | | 202,077 | | | | 18,419,319 | |
| | | | |
Tabula Rasa Healthcare Incorporated Ǡ | | | | | | | | | | | 253,397 | | | | 11,445,942 | |
| | | | |
Teladoc Incorporated Ǡ | | | | | | | | | | | 236,459 | | | | 13,742,997 | |
| | | | |
Vocera Communications Incorporated † | | | | | | | | | | | 247,715 | | | | 8,016,057 | |
| | | | |
| | | | | | | | | | | | | | | 70,296,276 | |
| | | | | | | | | | | | | | | | |
| | | | |
| Life Sciences Tools & Services: 2.64% | | | | | | | | | | | | | | | | |
| | | | |
ICON plc ADR † | | | | | | | | | | | 196,373 | | | | 27,798,562 | |
| | | | |
Syneos Health Incorporated † | | | | | | | | | | | 482,541 | | | | 19,895,165 | |
| | | | |
| | | | | | | | | | | | | | | 47,693,727 | |
| | | | | | | | | | | | | | | | |
| | | | |
| Pharmaceuticals: 0.44% | | | | | | | | | | | | | | | | |
| | | | |
Pacira Pharmaceuticals Incorporated † | | | | | | | | | | | 182,444 | | | | 7,938,138 | |
| | | | | | | | | | | | | | | | |
| | | | |
Industrials: 18.51% | | | | | | | | | | | | | | | | |
| | | | |
| Aerospace & Defense: 1.51% | | | | | | | | | | | | | | | | |
| | | | |
AAR Corporation | | | | | | | | | | | 295,335 | | | | 8,886,630 | |
| | | | |
Kratos Defense & Security Solutions Incorporated † | | | | | | | | | | | 834,997 | | | | 18,411,684 | |
| | | | |
| | | | | | | | | | | | | | | 27,298,314 | |
| | | | | | | | | | | | | | | | |
| | | | |
| Air Freight & Logistics: 0.59% | | | | | | | | | | | | | | | | |
| | | | |
Hub Group Incorporated Class A † | | | | | | | | | | | 276,521 | | | | 10,773,258 | |
| | | | | | | | | | | | | | | | |
| | | | |
| Building Products: 1.84% | | | | | | | | | | | | | | | | |
| | | | |
A.O. Smith Corporation | | | | | | | | | | | 341,731 | | | | 13,840,106 | |
| | | | |
Masonite International Corporation † | | | | | | | | | | | 192,982 | | | | 9,176,294 | |
| | | | |
PGT Incorporated † | | | | | | | | | | | 682,681 | | | | 10,212,908 | |
| | | | |
| | | | | | | | | | | | | | | 33,229,308 | |
| | | | | | | | | | | | | | | | |
The accompanying notes are an integral part of these financial statements.
| | | | |
| 28 | | Wells Fargo Small Company Growth Portfolio | | Portfolio of investments—May 31, 2019 |
| | | | | | | | | | | | | | | | |
| Security name | | | | | | | | Shares | | | Value | |
| | | | |
| Commercial Services & Supplies: 2.63% | | | | | | | | | | | | | | | | |
| | | | |
Copart Incorporated † | | | | | | | | | | | 392,875 | | | $ | 28,082,705 | |
| | | | |
KAR Auction Services Incorporated | | | | | | | | | | | 345,674 | | | | 19,433,792 | |
| | | | |
| | | | | | | | | | | | | | | 47,516,497 | |
| | | | | | | | | | | | | | | | |
| | | | |
| Construction & Engineering: 1.33% | | | | | | | | | | | | | | | | |
| | | | |
Dycom Industries Incorporated † | | | | | | | | | | | 130,089 | | | | 6,786,743 | |
| | | | |
Granite Construction Incorporated | | | | | | | | | | | 429,268 | | | | 17,252,281 | |
| | | | |
| | | | | | | | | | | | | | | 24,039,024 | |
| | | | | | | | | | | | | | | | |
| | | | |
| Electrical Equipment: 0.58% | | | | | | | | | | | | | | | | |
| | | | |
GrafTech International Limited « | | | | | | | | | | | 1,057,544 | | | | 10,480,261 | |
| | | | | | | | | | | | | | | | |
| | | | |
| Machinery: 5.73% | | | | | | | | | | | | | | | | |
| | | | |
AGCO Corporation | | | | | | | | | | | 202,550 | | | | 13,481,728 | |
| | | | |
Circor International Incorporated † | | | | | | | | | | | 300,924 | | | | 12,717,048 | |
| | | | |
Gardner Denver Holdings Incorporated † | | | | | | | | | | | 686,909 | | | | 23,334,299 | |
| | | | |
Gates Industrial Corporation plc † | | | | | | | | | | | 890,461 | | | | 10,044,400 | |
| | | | |
SPX Corporation † | | | | | | | | | | | 620,901 | | | | 18,465,596 | |
| | | | |
Wabash National Corporation | | | | | | | | | | | 721,279 | | | | 9,744,479 | |
| | | | |
Woodward Governor Company | | | | | | | | | | | 144,367 | | | | 15,724,454 | |
| | | | |
| | | | | | | | | | | | | | | 103,512,004 | |
| | | | | | | | | | | | | | | | |
| | | | |
| Professional Services: 1.78% | | | | | | | | | | | | | | | | |
| | | | |
ASGN Incorporated † | | | | | | | | | | | 367,425 | | | | 18,639,470 | |
| | | | |
ICF International Incorporated | | | | | | | | | | | 185,213 | | | | 13,500,176 | |
| | | | |
| | | | | | | | | | | | | | | 32,139,646 | |
| | | | | | | | | | | | | | | | |
| | | | |
| Road & Rail: 2.52% | | | | | | | | | | | | | | | | |
| | | | |
Genesee & Wyoming Incorporated Class A † | | | | | | | | | | | 234,404 | | | | 22,319,949 | |
| | | | |
Knight-Swift Transportation Holdings Incorporated « | | | | | | | | | | | 378,597 | | | | 10,464,421 | |
| | | | |
Schneider National Incorporated Class B | | | | | | | | | | | 760,653 | | | | 12,778,970 | |
| | | | |
| | | | | | | | | | | | | | | 45,563,340 | |
| | | | | | | | | | | | | | | | |
| | | | |
Information Technology: 23.40% | | | | | | | | | | | | | | | | |
| | | | |
| Communications Equipment: 2.02% | | | | | | | | | | | | | | | | |
| | | | |
Ciena Corporation † | | | | | | | | | | | 577,078 | | | | 20,163,105 | |
| | | | |
Lumentum Holdings Incorporated † | | | | | | | | | | | 403,348 | | | | 16,323,494 | |
| | | | |
| | | | | | | | | | | | | | | 36,486,599 | |
| | | | | | | | | | | | | | | | |
| | | | |
| Electronic Equipment, Instruments & Components: 0.69% | | | | | | | | | | | | | | | | |
| | | | |
Tech Data Corporation † | | | | | | | | | | | 136,789 | | | | 12,399,923 | |
| | | | | | | | | | | | | | | | |
| | | | |
| IT Services: 2.40% | | | | | | | | | | | | | | | | |
| | | | |
LiveRamp Holdings incorporated † | | | | | | | | | | | 453,040 | | | | 23,277,195 | |
| | | | |
WEX Incorporated † | | | | | | | | | | | 106,294 | | | | 20,083,188 | |
| | | | |
| | | | | | | | | | | | | | | 43,360,383 | |
| | | | | | | | | | | | | | | | |
The accompanying notes are an integral part of these financial statements.
| | | | | | |
| Portfolio of investments—May 31, 2019 | | Wells Fargo Small Company Growth Portfolio | | | 29 | |
| | | | | | | | | | | | | | | | |
| Security name | | | | | | | | Shares | | | Value | |
| | | | |
| Semiconductors & Semiconductor Equipment: 4.30% | | | | | | | | | | | | | | | | |
| | | | |
Cabot Microelectronics Corporation | | | | | | | | | | | 116,319 | | | $ | 11,337,613 | |
| | | | |
Cypress Semiconductor Corporation | | | | | | | | | | | 1,414,669 | | | | 25,209,402 | |
| | | | |
FormFactor Incorporated † | | | | | | | | | | | 606,213 | | | | 8,705,219 | |
| | | | |
Nanometrics Incorporated † | | | | | | | | | | | 225,981 | | | | 6,429,159 | |
| | | | |
Silicon Motion Technology Corporation ADR | | | | | | | | | | | 281,394 | | | | 10,723,925 | |
| | | | |
Teradyne Incorporated | | | | | | | | | | | 362,327 | | | | 15,268,460 | |
| | | | |
| | | | | | | | | | | | | | | 77,673,778 | |
| | | | | | | | | | | | | | | | |
| | | | |
| Software: 13.99% | | | | | | | | | | | | | | | | |
| | | | |
Benefitfocus Incorporated † | | | | | | | | | | | 300,165 | | | | 8,512,679 | |
| | | | |
Box Incorporated Class A † | | | | | | | | | | | 930,369 | | | | 17,202,523 | |
| | | | |
Carbon Black Incorporated † | | | | | | | | | | | 875,815 | | | | 13,181,016 | |
| | | | |
Cloudera Incorporated † | | | | | | | | | | | 1,189,802 | | | | 10,910,484 | |
| | | | |
Cornerstone OnDemand Incorporated † | | | | | | | | | | | 393,650 | | | | 20,953,990 | |
| | | | |
CyberArk Software Limited † | | | | | | | | | | | 148,616 | | | | 19,624,743 | |
| | | | |
Mimecast Limited † | | | | | | | | | | | 262,971 | | | | 11,938,883 | |
| | | | |
New Relic Incorporated † | | | | | | | | | | | 162,647 | | | | 16,316,747 | |
| | | | |
Nuance Communications Incorporated † | | | | | | | | | | | 1,028,901 | | | | 17,666,230 | |
| | | | |
PTC Incorporated † | | | | | | | | | | | 305,152 | | | | 25,651,077 | |
| | | | |
RealPage Incorporated † | | | | | | | | | | | 444,551 | | | | 25,926,214 | |
| | | | |
SS&C Technologies Holdings Incorporated | | | | | | | | | | | 476,968 | | | | 26,543,269 | |
| | | | |
Talend SA ADR † | | | | | | | | | | | 163,154 | | | | 7,609,503 | |
| | | | |
Tufin Software Technologies Limited † | | | | | | | | | | | 172,273 | | | | 3,876,143 | |
| | | | |
Zendesk Incorporated † | | | | | | | | | | | 203,373 | | | | 17,134,175 | |
| | | | |
Zuora Incorporated † | | | | | | | | | | | 701,403 | | | | 9,812,628 | |
| | | | |
| | | | | | | | | | | | | | | 252,860,304 | |
| | | | | | | | | | | | | | | | |
| | | | |
Materials: 3.32% | | | | | | | | | | | | | | | | |
| | | | |
| Chemicals: 1.47% | | | | | | | | | | | | | | | | |
| | | | |
Element Solutions Incorporated † | | | | | | | | | | | 1,427,500 | | | | 13,504,150 | |
| | | | |
Orion Engineered Carbons SA | | | | | | | | | | | 746,090 | | | | 13,116,262 | |
| | | | |
| | | | | | | | | | | | | | | 26,620,412 | |
| | | | | | | | | | | | | | | | |
| | | | |
| Construction Materials: 0.73% | | | | | | | | | | | | | | | | |
| | | | |
US Concrete Incorporated Ǡ | | | | | | | | | | | 283,190 | | | | 13,188,158 | |
| | | | | | | | | | | | | | | | |
| | | | |
| Metals & Mining: 0.52% | | | | | | | | | | | | | | | | |
| | | | |
Steel Dynamics Incorporated | | | | | | | | | | | 374,695 | | | | 9,423,579 | |
| | | | | | | | | | | | | | | | |
| | | | |
| Paper & Forest Products: 0.60% | | | | | | | | | | | | | | | | |
| | | | |
Boise Cascade Company | | | | | | | | | | | 483,636 | | | | 10,736,719 | |
| | | | | | | | | | | | | | | | |
| | | | |
Real Estate: 0.90% | | | | | | | | | | | | | | | | |
| | | | |
| Equity REITs: 0.90% | | | | | | | | | | | | | | | | |
| | | | |
QTS Realty Trust Incorporated Class A | | | | | | | | | | | 351,021 | | | | 16,206,640 | |
| | | | | | | | | | | | | | | | |
| | | | |
Total Common Stocks (Cost $1,358,851,046) | | | | | | | | | | | | | | | 1,727,537,872 | |
| | | | | | | | | | | | | | | | |
The accompanying notes are an integral part of these financial statements.
| | | | |
| 30 | | Wells Fargo Small Company Growth Portfolio | | Portfolio of investments—May 31, 2019 |
| | | | | | | | | | | | | | | | |
| Security name | | | | | Expiration date | | | Shares | | | Value | |
| | | | |
Rights: 0.00% | | | | | | | | | | | | | | | | |
| | | | |
Consumer Discretionary: 0.00% | | | | | | | | | | | | | | | | |
| | | | |
| Media: 0.00% | | | | | | | | | | | | | | | | |
| | | | |
Media General Incorporated †(a) | | | | | | | 12-31-2020 | | | | 347,897 | | | $ | 0 | |
| | | | | | | | | | | | | | | | |
| | | | |
Total Rights (Cost $0) | | | | | | | | | | | | | | | 0 | |
| | | | | | | | | | | | | | | | |
| | | | |
| | | Yield | | | | | | | | | | |
| Short-Term Investments: 10.80% | | | | | | | | | | | | | | | | |
| | | | |
| Investment Companies: 10.80% | | | | | | | | | | | | | | | | |
| | | | |
Securities Lending Cash Investments LLC (l)(r)(u) | | | 2.51 | % | | | | | | | 117,789,132 | | | | 117,800,911 | |
| | | | |
Wells Fargo Government Money Market Fund Select Class (l)(u) | | | 2.30 | | | | | | | | 77,449,512 | | | | 77,449,512 | |
| | | | | | | | | | | | | | | | |
| | | | |
Total Short-Term Investments (Cost $195,244,459) | | | | | | | | | | | | | | | 195,250,423 | |
| | | | | | | | | | | | | | | | |
| | | | | | | | |
| Total investments in securities (Cost $1,554,095,505) | | | 106.40 | % | | | 1,922,788,295 | |
| | |
Other assets and liabilities, net | | | (6.40 | ) | | | (115,703,677 | ) |
| | | | | | | | |
| Total net assets | | | 100.00 | % | | $ | 1,807,084,618 | |
| | | | | | | | |
| † | Non-income-earning security |
| « | All or a portion of this security is on loan. |
| (a) | The security is fair valued in accordance with procedures approved by the Board of Trustees. |
| (l) | The issuer of the security is an affiliated person of the Portfolio as defined in the Investment Company Act of 1940. |
| (r) | The investment is a non-registered investment company purchased with cash collateral received from securities on loan. |
| (u) | The rate represents the 7-day annualized yield at period end. |
Abbreviations:
| ADR | American depositary receipt |
| REIT | Real estate investment trust |
Investments in Affiliates
An affiliated investment is an investment in which the Portfolio owns at least 5% of the outstanding voting shares of the issuer or as a result of other relationships, such as the Portfolio and the issuer having the same adviser or investment manager. Transactions with issuers that were either affiliated persons of the Portfolio at the beginning of the period or the end of the period were as follows:
| | | | | | | | | | | | | | | | | | | | | | | | | | | | | | | | | | | | |
| | | Shares, beginning of period | | | Shares purchased | | | Shares sold | | | Shares, end of period | | | Net realized gains (losses) | | | Net change in unrealized gains (losses) | | | Income
from
affiliated
securities | | | Value,
end
of period | | | % of
net
assets | |
Short-Term Investments | | | | | | | | | | | | | | | | | | | | | | | | | | | | | | | | | | | | |
Investment Companies | | | | | | | | | | | | | | | | | | | | | | | | | | | | | | | | | | | | |
Securities Lending Cash Investments LLC | | | 217,573,353 | | | | 749,511,278 | | | | 849,295,499 | | | | 117,789,132 | | | $ | 6,228 | | | $ | (6,902 | ) | | $ | 3,182,700 | | �� | $ | 117,800,911 | | | | | |
Wells Fargo Government Money Market Fund Select Class | | | 48,273,067 | | | | 753,595,762 | | | | 724,419,317 | | | | 77,449,512 | | | | 0 | | | | 0 | | | | 1,558,272 | | | | 77,449,512 | | | | | |
| | | | | | | | | | | | | | | | | | | | | | | | | | | | | | | | | | | | |
| | | | | | | | | |
| | | | | | | | | | | | | | | | | | $ | 6,228 | | | $ | (6,902 | ) | | $ | 4,740,972 | | | $ | 195,250,423 | | | | 10.80 | % |
| | | | | | | | | | | | | | | | | | | | | | | | | | | | | | | | | | | | |
The accompanying notes are an integral part of these financial statements.
| | | | | | |
| Statement of assets and liabilities—May 31, 2019 | | Wells Fargo Small Company Growth Portfolio | | | 31 | |
| | | | |
| | | | |
| |
Assets | | | | |
Investments in unaffiliated securities (including $113,683,501 of securities loaned), at value (cost $1,358,851,046) | | $ | 1,727,537,872 | |
Investments in affiliated securities, at value (cost $195,244,459) | | | 195,250,423 | |
Receivable for investments sold | | | 2,050,713 | |
Receivable for dividends | | | 1,362,716 | |
Receivable for securities lending income, net | | | 26,923 | |
Prepaid expenses and other assets | | | 21,988 | |
| | | | |
Total assets | | | 1,926,250,635 | |
| | | | |
| |
Liabilities | | | | |
Payable upon receipt of securities loaned | | | 117,783,752 | |
Advisory fee payable | | | 1,320,016 | |
Accrued expenses and other liabilities | | | 62,249 | |
| | | | |
Total liabilities | | | 119,166,017 | |
| | | | |
Total net assets | | $ | 1,807,084,618 | |
| | | | |
The accompanying notes are an integral part of these financial statements.
| | | | |
| 32 | | Wells Fargo Small Company Growth Portfolio | | Statement of operations—year ended May 31, 2019 |
| | | | |
| | | | |
| |
Investment income | | | | |
Dividends (net of foreign withholding taxes of $89,815) | | $ | 11,721,275 | |
Income from affiliated securities | | | 2,094,920 | |
| | | | |
Total investment income | | | 13,816,195 | |
| | | | |
| |
Expenses | | | | |
Advisory fee | | | 15,439,896 | |
Custody and accounting fees | | | 91,405 | |
Professional fees | | | 43,727 | |
Shareholder report expenses | | | 1,989 | |
Trustees’ fees and expenses | | | 20,975 | |
Other fees and expenses | | | 25,100 | |
| | | | |
Total expenses | | | 15,623,092 | |
| | | | |
Net investment loss | | | (1,806,897 | ) |
| | | | |
| |
REALIZED AND UNREALIZED GAINS (LOSSES) ON INVESTMENTS | | | | |
| |
Net realized gains on: | | | | |
Unaffiliated securities | | | 201,425,264 | |
Affiliated securities | | | 6,228 | |
| | | | |
Net realized gains on investments | | | 201,431,492 | |
| | | | |
| |
Net change in unrealized gains (losses) on: | | | | |
Unaffiliated securities | | | (312,373,288 | ) |
Affiiliated securities | | | (6,902 | ) |
| | | | |
Net change in unrealized gains (losses) on investments | | | (312,380,190 | ) |
| | | | |
Net realized and unrealized gains (losses) on investments | | | (110,948,698 | ) |
| | | | |
Net decrease in net assets resulting from operations | | $ | (112,755,595 | ) |
| | | | |
The accompanying notes are an integral part of these financial statements.
| | | | | | |
| Statements of changes in net assets | | Wells Fargo Small Company Growth Portfolio | | | 33 | |
| | | | | | | | |
| | | Year ended
May 31, 2019 | | | Year ended
May 31, 2018 | |
| | |
Operations | | | | | | | | |
Net investment loss | | $ | (1,806,897 | ) | | $ | (3,185,500 | ) |
Net realized gains on investments | | | 201,431,492 | | | | 120,175,795 | |
Net change in unrealized gains (losses) on investments | | | (312,380,190 | ) | | | 344,244,383 | |
| | | | |
Net increase (decrease) in net assets resulting from operations | | | (112,755,595 | ) | | | 461,234,678 | |
| | | | |
| |
Capital transactions | | | | |
Transactions in investors’ beneficial interests | | | | | | | | |
Contributions | | | 200,173,324 | | | | 105,533,154 | |
Withdrawals | | | (288,826,821 | ) | | | (231,798,568 | ) |
| | | | |
Net decrease in net assets resulting from capital transactions | | | (88,653,497 | ) | | | (126,265,414 | ) |
| | | | |
Total increase (decrease) in net assets | | | (201,409,092 | ) | | | 334,969,264 | |
| | | | |
| |
Net assets | | | | |
Beginning of period | | | 2,008,493,710 | | | | 1,673,524,446 | |
| | | | |
End of period | | $ | 1,807,084,618 | | | $ | 2,008,493,710 | |
| | | | |
The accompanying notes are an integral part of these financial statements.
| | | | |
| 34 | | Wells Fargo Small Company Growth Portfolio | | Financial highlights |
| | | | | | | | | | | | | | | | | | | | |
| | | Year ended May 31 | |
| | | 2019 | | | 2018 | | | 2017 | | | 2016 | | | 2015 | |
Total return | | | (5.64 | )% | | | 28.74 | % | | | 18.15 | % | | | (13.86 | )% | | | 18.07 | % |
Ratios to average net assets (annualized) | | | | | | | | | | | | | | | | | | | | |
Gross expenses | | | 0.78 | % | | | 0.78 | % | | | 0.79 | % | | | 0.80 | % | | | 0.82 | % |
Net expenses | | | 0.78 | % | | | 0.78 | % | | | 0.79 | % | | | 0.80 | % | | | 0.82 | % |
Net investment loss | | | (0.09 | )% | | | (0.18 | )% | | | (0.14 | )% | | | (0.03 | )% | | | (0.32 | )% |
Supplemental data | | | | | | | | | | | | | | | | | | | | |
Portfolio turnover rate | | | 54 | % | | | 37 | % | | | 82 | % | | | 49 | % | | | 58 | % |
The accompanying notes are an integral part of these financial statements.
| | | | | | |
| Notes to financial statements | | Wells Fargo Small Company Growth Portfolio | | | 35 | |
1. ORGANIZATION
Wells Fargo Master Trust (the “Trust”), a Delaware statutory trust organized on March 10, 1999, is an open-end management investment company registered under the Investment Company Act of 1940, as amended (the “1940 Act”). As an investment company, the Trust follows the accounting and reporting guidance in Financial Accounting Standards Board (“FASB”) Accounting Standards Codification Topic 946, Financial Services – Investment Companies. These financial statements report on the Wells Fargo Small Company Growth Portfolio (the “Portfolio”) which is a diversified series of the Trust.
2. SIGNIFICANT ACCOUNTING POLICIES
The following significant accounting policies, which are consistently followed in the preparation of the financial statements of the Portfolio, are in conformity with U.S. generally accepted accounting principles which require management to make estimates and assumptions that affect the reported amounts of assets and liabilities, disclosure of contingent assets and liabilities at the date of the financial statements, and the reported amounts of revenues and expenses during the reporting period. Actual results could differ from those estimates.
Securities valuation
All investments are valued each business day as of the close of regular trading on the New York Stock Exchange (generally 4 p.m. Eastern Time), although the Portfolio may deviate from this calculation time under unusual or unexpected circumstances.
Equity securities that are listed on a foreign or domestic exchange or market are valued at the official closing price or, if none, the last sales price. If no sale occurs on the principal exchange or market that day, a fair value price will be determined in accordance with the Portfolio’s Valuation Procedures.
Investments in registered open-end investment companies are valued at net asset value. Interests in non-registered investment companies that are redeemable at net asset value are fair valued normally at net asset value.
Investments which are not valued using any of the methods discussed above are valued at their fair value, as determined in good faith by the Board of Trustees of the Portfolio. The Board of Trustees has established a Valuation Committee comprised of the Trustees and has delegated to it the authority to take any actions regarding the valuation of portfolio securities that the Valuation Committee deems necessary or appropriate, including determining the fair value of portfolio securities, unless the determination has been delegated to the Wells Fargo Asset Management Pricing Committee at Wells Fargo Funds Management, LLC (“Funds Management”). The Board of Trustees retains the authority to make or ratify any valuation decisions or approve any changes to the Valuation Procedures as it deems appropriate. On a quarterly basis, the Board of Trustees receives reports on any valuation actions taken by the Valuation Committee or the Wells Fargo Asset Management Pricing Committee which may include items for ratification.
Securities lending
The Portfolio may lend its securities from time to time in order to earn additional income in the form of fees or interest on securities received as collateral or the investment of any cash received as collateral. When securities are on loan, the Portfolio receives interest or dividends on the securities loaned. The Portfolio receives collateral in the form of cash or securities with a value at least equal to the value of the securities on loan. The value of the loaned securities is determined at the close of each business day and any additional required collateral is delivered to the Portfolio on the next business day. In a securities lending transaction, the net asset value of the Portfolio will be affected by an increase or decrease in the value of the securities loaned and by an increase or decrease in the value of the instrument in which collateral is invested. The amount of securities lending activity undertaken by the Portfolio fluctuates from time to time. In the event of default or bankruptcy by the borrower, the Portfolio may be prevented from recovering the loaned securities or gaining access to the collateral or may experience delays or costs in doing so. In addition, the investment of any cash collateral received may lose all or part of its value. The Portfolio has the right under the lending agreement to recover the securities from the borrower on demand.
The Portfolio lends its securities through an unaffiliated securities lending agent. Cash collateral received in connection with its securities lending transactions is invested in Securities Lending Cash Investments, LLC (the “Securities Lending Fund”). The Securities Lending Fund is exempt from registration under Section 3(c)(7) of the 1940 Act and is managed by Funds Management and is subadvised by Wells Capital Management Incorporated (“WellsCap”), an affiliate of Funds Management and an indirect wholly owned subsidiary of Wells Fargo & Company (“Wells Fargo”). Funds Management receives an advisory fee starting at 0.05% and declining to 0.01% as the average daily net assets of the Securities Lending Fund increase. All of the fees received by Funds Management are paid to WellsCap for its services as subadviser. The Securities Lending Fund seeks to provide a positive return compared to the daily Fed Funds Open Rate by investing in
| | | | |
| 36 | | Wells Fargo Small Company Growth Portfolio | | Notes to financial statements |
high-quality, U.S. dollar-denominated short-term money market instruments. Securities Lending Fund investments are valued at the evaluated bid price provided by an independent pricing service. Income earned from investment in the Securities Lending Fund (net of fees and rebates), if any, is included in income from affiliated securities on the Statement of Operations.
Security transactions and income recognition
Securities transactions are recorded on a trade date basis. Realized gains or losses are recorded on the basis of identified cost.
Dividend income is recognized on the ex-dividend date. Dividend income is recorded net of foreign taxes withheld where recovery of such taxes is not assured.
Federal and other taxes
The Portfolio is treated as a separate entity for federal income tax purposes. The Portfolio is not required to pay federal income taxes on its net investment income and net capital gains as it is treated as a partnership for federal income tax purposes. All dividends, gains and losses of the Portfolio are deemed to have been “passed through” to the interest holders in proportion to their holdings of the Portfolio regardless of whether such dividends and gains have been distributed by the Portfolio.
The Portfolio’s income tax returns and all financial records supporting those returns for the prior three fiscal years are subject to examination by the federal revenue authority. Management has analyzed the Portfolio’s tax positions taken on federal, state, and foreign tax returns for all open tax years and does not believe that there are any uncertain tax positions that require recognition of a tax liability.
As of May 31, 2019, the aggregate cost of all investments for federal income tax purposes was $1,579,784,531 and the unrealized gains (losses) consisted of:
| | | | |
| |
Gross unrealized gains | | $ | 490,303,387 | |
| |
Gross unrealized losses | | | (147,299,623 | ) |
| |
Net unrealized gains | | $ | 343,003,764 | |
3. FAIR VALUATION MEASUREMENTS
Fair value measurements of investments are determined within a framework that has established a fair value hierarchy based upon the various data inputs utilized in determining the value of the Portfolio’s investments. The three-level hierarchy gives the highest priority to unadjusted quoted prices in active markets for identical assets or liabilities (Level 1) and the lowest priority to unobservable inputs (Level 3). The Portfolio’s investments are classified within the fair value hierarchy based on the lowest level of input that is significant to the fair value measurement. The inputs are summarized into three broad levels as follows:
| ∎ | | Level 1 – quoted prices in active markets for identical securities |
| ∎ | | Level 2 – other significant observable inputs (including quoted prices for similar securities, interest rates, prepayment speeds, credit risk, etc.) |
| ∎ | | Level 3 – significant unobservable inputs (including the Portfolio’s own assumptions in determining the fair value of investments) |
The inputs or methodologies used for valuing investments in securities are not necessarily an indication of the risk associated with investing in those securities.
| | | | | | |
| Notes to financial statements | | Wells Fargo Small Company Growth Portfolio | | | 37 | |
The following is a summary of the inputs used in valuing the Portfolio’s assets and liabilities as of May 31, 2019:
| | | | | | | | | | | | | | | | |
| | | | |
| | | Quoted prices (Level 1) | | | Other significant
observable inputs
(Level 2) | | | Significant
unobservable inputs (Level 3) | | | Total | |
| | | | |
Assets | | | | | | | | | | | | | | | | |
Investments in: | | | | | | | | | | | | | | | | |
| | | | |
Common stocks | | | | | | | | | | | | | | | | |
| | | | |
Communication services | | $ | 10,379,760 | | | $ | 0 | | | $ | 0 | | | $ | 10,379,760 | |
| | | | |
Consumer discretionary | | | 211,934,055 | | | | 0 | | | | 0 | | | | 211,934,055 | |
| | | | |
Consumer staples | | | 47,155,429 | | | | 0 | | | | 0 | | | | 47,155,429 | |
| | | | |
Energy | | | 28,808,574 | | | | 0 | | | | 0 | | | | 28,808,574 | |
| | | | |
Financials | | | 171,879,322 | | | | 0 | | | | 0 | | | | 171,879,322 | |
| | | | |
Health care | | | 423,872,585 | | | | 0 | | | | 0 | | | | 423,872,585 | |
| | | | |
Industrials | | | 334,551,652 | | | | 0 | | | | 0 | | | | 334,551,652 | |
| | | | |
Information technology | | | 422,780,987 | | | | 0 | | | | 0 | | | | 422,780,987 | |
| | | | |
Materials | | | 59,968,868 | | | | 0 | | | | 0 | | | | 59,968,868 | |
| | | | |
Real estate | | | 16,206,640 | | | | 0 | | | | 0 | | | | 16,206,640 | |
| | | | |
Rights | | | | | | | | | | | | | | | | |
| | | | |
Consumer discretionary | | | 0 | | | | 0 | | | | 0 | | | | 0 | |
| | | | |
Short-term investments | | | | | | | | | | | | | | | | |
| | | | |
Investment companies | | | 77,449,512 | | | | 117,800,911 | | | | 0 | | | | 195,250,423 | |
| | | | |
Total assets | | $ | 1,804,987,384 | | | $ | 117,800,911 | | | $ | 0 | | | $ | 1,922,788,295 | |
Additional sector, industry or geographic detail is included in the Portfolio of Investments.
At May 31, 2019, the Portfolio did not have any transfers into/out of Level 3.
4. TRANSACTIONS WITH AFFILIATES AND OTHER EXPENSES
Advisory fee
The Trust has entered into an advisory contract with Funds Management, an indirect wholly owned subsidiary of Wells Fargo. The adviser is responsible for implementing investment policies and guidelines and for supervising the subadviser, who is responsible for day-to-day portfolio management of the Portfolio. Pursuant to the contract, Funds Management is entitled to receive an annual advisory fee at the following annual rate based on the Portfolio’s average daily net assets:
| | | | |
| Average daily net assets | | Advisory fee | |
| |
First $500 million | | | 0.800 | % |
| |
Next $500 million | | | 0.775 | |
| |
Next $1 billion | | | 0.750 | |
| |
Next $1 billion | | | 0.725 | |
| |
Next $1 billion | | | 0.700 | |
| |
Over $4 billion | | | 0.680 | |
For the year ended May 31, 2019, the advisory fee was equivalent to an annual rate of 0.77% of the Portfolio’s average daily net assets.
Funds Management has retained the services of a subadviser to provide daily portfolio management to the Portfolio. The fee for subadvisory services is borne by Funds Management. Peregrine Capital Management, LLC, which is not an affiliate of Funds Management, is the subadviser to the Portfolio and is entitled to receive a fee from Funds Management at an annual rate starting at 0.50% and declining to 0.45% as the average daily net assets of the Portfolio increase.
Interfund transactions
The Portfolio may purchase or sell portfolio investment securities to certain other Wells Fargo affiliates pursuant to Rule 17a-7 under the 1940 Act and under procedures adopted by the Board of Trustees. The procedures have been designed to ensure that these interfund transactions, which do not incur broker commissions, are effected at current market prices.
| | | | |
| 38 | | Wells Fargo Small Company Growth Portfolio | | Notes to financial statements |
5. INVESTMENT PORTFOLIO TRANSACTIONS
Purchases and sales of investments, excluding U.S. government obligations (if any) and short-term securities, for the year ended May 31, 2019 were $1,037,762,113 and $1,095,235,628, respectively.
6. BANK BORROWINGS
Effective August 28, 2018, the Trust, along with Wells Fargo Variable Trust and Wells Fargo Funds Trust (excluding the money market funds), are parties to a $280,000,000 revolving credit agreement whereby the Portfolio is permitted to use bank borrowings for temporary or emergency purposes, such as to fund shareholder redemption requests. Interest under the credit agreement is charged to the Portfolio based on a borrowing rate equal to the higher of the Federal Funds rate in effect on that day plus 1.25% or the overnight LIBOR rate in effect on that day plus 1.25%. In addition, an annual commitment fee equal to 0.25% of the unused balance is allocated to each participating fund.
For the year ended May 31, 2019, there were no borrowings by the Portfolio under the agreement.
7. CONCENTRATION RISK
Concentration risk results from exposure to a limited number of sectors. A fund that invests a substantial portion of its assets in any sector may be more affected by changes in that sector than would be a fund whose investments are not heavily weighted in any sector.
8. INDEMNIFICATION
Under the Trust’s organizational documents, the officers and Trustees have been granted certain indemnification rights against certain liabilities that may arise out of performance of their duties to the Trust. Additionally, in the normal course of business, the Trust may enter into contracts with service providers that contain a variety of indemnification clauses. The Trust’s maximum exposure under these arrangements is dependent on future claims that may be made against the Portfolio and, therefore, cannot be estimated.
9. NEW ACCOUNTING PRONOUNCEMENT
In August 2018, FASB issued Accounting Standards Update (“ASU”) No. 2018-13, Fair Value Measurement (Topic 820)Disclosure Framework—Changes to the Disclosure Requirements for Fair Value Measurement. ASU 2018-13 updates the disclosure requirements for fair value measurements by modifying or removing certain disclosures and adding certain new disclosures. The amendments are effective for fiscal years, and interim periods within those fiscal years, beginning after December 15, 2019. Early adoption is permitted. Management has adopted the removal and modification of disclosures early, as permitted, and will adopt the additional new disclosures at the effective date.
| | | | | | |
| Report of independent registered public accounting firm | | Wells Fargo Small Company Growth Portfolio | | | 39 | |
TO THE SHAREHOLDERS OF THE PORTFOLIO AND BOARD OF TRUSTEES OF WELLS FARGO MASTER TRUST:
Opinion on the Financial Statements
We have audited the accompanying statement of assets and liabilities of Wells Fargo Small Company Growth Portfolio (the Portfolio), one of the portfolios constituting Wells Fargo Master Trust, including the portfolio of investments, as of May 31, 2019, the related statement of operations for the year then ended, the statements of changes in net assets for each of the years in the two-year period then ended, and the related notes (collectively, the financial statements) and the financial highlights for each of the years in the five-year period then ended. In our opinion, the financial statements and financial highlights present fairly, in all material respects, the financial position of the Portfolio as of May 31, 2019, the results of its operations for the year then ended, the changes in its net assets for each of the years in the two-year period then ended, and the financial highlights for each of the years in the five-year period then ended, in conformity with U.S. generally accepted accounting principles.
Basis for Opinion
These financial statements and financial highlights are the responsibility of the Portfolio’s management. Our responsibility is to express an opinion on these financial statements and financial highlights based on our audits. We are a public accounting firm registered with the Public Company Accounting Oversight Board (United States) (PCAOB) and are required to be independent with respect to the Portfolio in accordance with the U.S. federal securities laws and the applicable rules and regulations of the Securities and Exchange Commission and the PCAOB.
We conducted our audits in accordance with the standards of the PCAOB. Those standards require that we plan and perform the audit to obtain reasonable assurance about whether the financial statements and financial highlights are free of material misstatement, whether due to error or fraud. Our audits included performing procedures to assess the risks of material misstatement of the financial statements and financial highlights, whether due to error or fraud, and performing procedures that respond to those risks. Such procedures included examining, on a test basis, evidence regarding the amounts and disclosures in the financial statements and financial highlights. Such procedures also included confirmation of securities owned as of May 31, 2019, by correspondence with the custodian or by other appropriate auditing procedures. Our audits also included evaluating the accounting principles used and significant estimates made by management, as well as evaluating the overall presentation of the financial statements and financial highlights. We believe that our audits provide a reasonable basis for our opinion.
We have not been able to determine the specific year that we began serving as the auditor of one or more Wells Fargo Funds investment companies; however we are aware that we have served as the auditor of one or more Wells Fargo Funds investment companies since at least 1955.
Boston, Massachusetts
July 26, 2019
| | | | |
| 40 | | Wells Fargo Small Company Growth Fund | | Other information (unaudited) |
TAX INFORMATION
For corporate shareholders, pursuant to Section 854 of the Internal Revenue Code, 22.43% of ordinary income dividends qualify for the corporate dividends-received deduction for the fiscal year ended May 31, 2019.
Pursuant to Section 852 of the Internal Revenue Code, $105,713,520 was designated as a 20% rate gain distribution for the fiscal year ended May 31, 2019.
Pursuant to Section 854 of the Internal Revenue Code, $8,526,216 of income dividends paid during the fiscal year ended May 31, 2019 has been designated as qualified dividend income (QDI).
For the fiscal year ended May 31, 2019, $30,719,230 has been designated as short-term capital gain dividends for nonresident alien shareholders pursuant to Section 871 of the Internal Revenue Code.
PROXY VOTING INFORMATION
A description of the policies and procedures used to determine how to vote proxies relating to portfolio securities is available, upon request, by calling1-800-222-8222, visiting our website atwfam.com, or visiting the SEC website at sec.gov. Information regarding how the proxies related to portfolio securities were voted during the most recent 12-month period ended June 30 is available on the website atwfam.com or by visiting the SEC website at sec.gov.
QUARTERLY PORTFOLIO HOLDINGS
The Fund and Portfolio file their complete schedule of portfolio holdings with the SEC for the first and third quarters of each fiscal year on Form N-Q, which is available by visiting the SEC website at sec.gov. Those forms may be reviewed and copied at the SEC’s Public Reference Room in Washington, DC. Information on the operation of the Public Reference Room may be obtained by calling 1-800-SEC-0330.
| | | | | | |
| Other information (unaudited) | | Wells Fargo Small Company Growth Fund | | | 41 | |
BOARD OF TRUSTEES AND OFFICERS
Each of the Trustees and Officers1 listed in the table below acts in identical capacities for each fund in the Wells Fargo family of funds, which consists of 151 mutual funds comprising the Wells Fargo Funds Trust, Wells Fargo Variable Trust, Wells Fargo Master Trust and four closed-end funds (collectively the “Fund Complex”). This table should be read in conjunction with the Prospectus and the Statement of Additional Information2. The mailing address of each Trustee and Officer is 525 Market Street, 12th Floor, San Francisco, CA 94105. Each Trustee and Officer serves an indefinite term, however, each Trustee serves such term until reaching the mandatory retirement age established by the Trustees.
Independent Trustees
| | | | | | |
Name and year of birth | | Position held and length of service* | | Principal occupations during past five years or longer | | Current other public company or
investment company
directorships |
| | | |
William R. Ebsworth (Born 1957) | | Trustee, since 2015 | | Retired. From 1984 to 2013, equities analyst, portfolio manager, research director and chief investment officer at Fidelity Management and Research Company in Boston, Tokyo, and Hong Kong, and retired in 2013 as Chief Investment Officer of Fidelity Strategic Advisers, Inc. where he led a team of investment professionals managing client assets. Prior thereto, Board member of Hong Kong Securities Clearing Co., Hong Kong Options Clearing Corp., the Thailand International Fund, Ltd., Fidelity Investments Life Insurance Company, and Empire Fidelity Investments Life Insurance Company. Audit Committee Chair and Investment Committee Chair of the Vincent Memorial Hospital Endowment (non-profit organization). Mr. Ebsworth is a CFA® charterholder. | | N/A |
| | | |
Jane A. Freeman (Born 1953) | | Trustee, since 2015; Chair Liaison, since 2018 | | Retired. From 2012 to 2014 and 1999 to 2008, Chief Financial Officer of Scientific Learning Corporation. From 2008 to 2012, Ms. Freeman provided consulting services related to strategic business projects. Prior to 1999, Portfolio Manager at Rockefeller & Co. and Scudder, Stevens & Clark. Board member of the Harding Loevner Funds from 1996 to 2014, serving as both Lead Independent Director and chair of the Audit Committee. Board member of the Russell Exchange Traded Funds Trust from 2011 to 2012 and the chair of the Audit Committee. Ms. Freeman is a Board Member of The Ruth Bancroft Garden (non-profit organization). She is also an inactive Chartered Financial Analyst. | | N/A |
| | | |
Isaiah Harris, Jr. (Born 1952) | | Trustee, since 2009; Audit Committee Chairman, since 2019 | | Retired. Chairman of the Board of CIGNA Corporation since 2009, and Director since 2005. From 2003 to 2011, Director of Deluxe Corporation. Prior thereto, President and CEO of BellSouth Advertising and Publishing Corp. from 2005 to 2007, President and CEO of BellSouth Enterprises from 2004 to 2005 and President of BellSouth Consumer Services from 2000 to 2003. Emeritus member of the Iowa State University Foundation Board of Governors. Emeritus Member of the Advisory Board of Iowa State University School of Business. Advisory Board Member, Palm Harbor Academy (private school). Advisory Board Member, Child Evangelism Fellowship (non-profit). Mr. Harris is a certified public accountant (inactive status). | | CIGNA Corporation |
| | | |
Judith M. Johnson (Born 1949) | | Trustee, since 2008; Audit Committee Chairman, from 2009 to 2018 | | Retired. Prior thereto, Chief Executive Officer and Chief Investment Officer of Minneapolis Employees Retirement Fund from 1996 to 2008. Ms. Johnson is an attorney, certified public accountant and a certified managerial accountant. | | N/A |
| | | | |
| 42 | | Wells Fargo Small Company Growth Fund | | Other information (unaudited) |
| | | | | | |
Name and year of birth | | Position held and length of service* | | Principal occupations during past five years or longer | | Current other public company or
investment company
directorships |
| | | |
David F. Larcker (Born 1950) | | Trustee, since 2009 | | James Irvin Miller Professor of Accounting at the Graduate School of Business, Stanford University, Director of the Corporate Governance Research Initiative and Senior Faculty of The Rock Center for Corporate Governance since 2006. From 2005 to 2008, Professor of Accounting at the Graduate School of Business, Stanford University. Prior thereto, Ernst & Young Professor of Accounting at The Wharton School, University of Pennsylvania from 1985 to 2005. | | N/A |
| | | |
Olivia S. Mitchell (Born 1953) | | Trustee, since 2006; Nominating and Governance Committee Chairman, since 2018 | | International Foundation of Employee Benefit Plans Professor, Wharton School of the University of Pennsylvania since 1993. Director of Wharton’s Pension Research Council and Boettner Center on Pensions & Retirement Research, and Research Associate at the National Bureau of Economic Research. Previously, Cornell University Professor from 1978 to 1993. | | N/A |
| | | |
Timothy J. Penny (Born 1951) | | Trustee, since 1996; Chairman, since 2018 | | President and Chief Executive Officer of Southern Minnesota Initiative Foundation, a non-profit organization, since 2007. Member of the Board of Trustees of NorthStar Education Finance, Inc., a non-profit organization, since 2007. | | N/A |
| | | |
James G. Polisson (Born 1959) | | Trustee, since 2018 | | Retired. Chief Marketing Officer, Source (ETF) UK Services, Ltd, from 2015 to 2017. From 2012 to 2015, Principal of The Polisson Group, LLC, a management consulting, corporate advisory and principal investing company. Chief Executive Officer and Managing Director at Russell Investments, Global Exchange Traded Funds from 2010 to 2012. Managing Director of Barclays Global Investors from 1998 to 2010 and Global Chief Marketing Officer for iShares and Barclays Global Investors from 2000 to 2010. Trustee of the San Francisco Mechanics’ Institute, a non-profit organization, from 2013 to 2015. Board member of the Russell Exchange Traded Fund Trust from 2011 to 2012. Director of Barclays Global Investors Holdings Deutschland GmbH from 2006 to 2009. Mr. Polisson is an attorney and has a retired status with the Massachusetts and District of Columbia Bar Associations. | | N/A |
| * | Length of service dates reflect the Trustee’s commencement of service with the Trust’s predecessor entities, where applicable. |
| | | | | | |
| Other information (unaudited) | | Wells Fargo Small Company Growth Fund | | | 43 | |
Officers
| | | | | | |
Name and year of birth | | Position held and length of service | | Principal occupations during past five years or longer | | |
| | | |
Andrew Owen (Born 1960) | | President, since 2017 | | Executive Vice President of Wells Fargo & Company and Head of Affiliated Managers, Wells Fargo Asset Management, since 2014. In addition, Mr. Owen is currently President, Chief Executive Officer and Director of Wells Fargo Funds Management, LLC since 2017. Prior thereto, Executive Vice President responsible for marketing, investments and product development for Wells Fargo Funds Management, LLC, from 2009 to 2014. | | |
| | | |
Nancy Wiser1 (Born 1967) | | Treasurer, since 2012 | | Executive Vice President of Wells Fargo Funds Management, LLC since 2011. Chief Operating Officer and Chief Compliance Officer at LightBox Capital Management LLC, from 2008 to 2011. | | |
| | | |
Alexander Kymn (Born 1973) | | Secretary and Chief Legal Officer, since 2018 | | Senior Company Counsel of Wells Fargo Bank, N.A. since 2018 (previously Senior Counsel from 2007 to 2018). Vice President of Wells Fargo Funds Management, LLC from 2008 to 2014. | | |
| | | |
Michael H. Whitaker (Born 1967) | | Chief Compliance Officer, since 2016 | | Senior Vice President and Chief Compliance Officer since 2016. Senior Vice President and Chief Compliance Officer for Fidelity Investments from 2007 to 2016. | | |
| | | |
David Berardi (Born 1975) | | Assistant Treasurer, since 2009 | | Vice President of Wells Fargo Funds Management, LLC since 2009. Vice President of Evergreen Investment Management Company, LLC from 2008 to 2010. Manager of Fund Reporting and Control for Evergreen Investment Management Company, LLC from 2004 to 2010. | | |
| | | |
Jeremy DePalma1 (Born 1974) | | Assistant Treasurer, since 2009 | | Senior Vice President of Wells Fargo Funds Management, LLC since 2009. Senior Vice President of Evergreen Investment Management Company, LLC from 2008 to 2010 and head of the Fund Reporting and Control Team within Fund Administration from 2005 to 2010. | | |
| 1 | Nancy Wiser acts as Treasurer of 65 funds in the Fund Complex. Jeremy DePalma acts as Treasurer of 86 funds and Assistant Treasurer of 65 funds in the Fund Complex. |
| 2 | The Statement of Additional Information includes additional information about the Trustees and is available, without charge, upon request, by calling1-800-222-8222 or by visiting the website atwfam.com. |
| | | | |
| 44 | | Wells Fargo Small Company Growth Fund | | Other information (unaudited) |
BOARD CONSIDERATION OF INVESTMENT MANAGEMENT, ADVISORY AND SUB-ADVISORY AGREEMENTS:
Wells Fargo Small Company Growth Fund and Wells Fargo Small Company Growth Portfolio
Under the Investment Company Act of 1940 (the “1940 Act”), the Board of Trustees (each, a “Board” and collectively, the “Boards”) of each of Wells Fargo Funds Trust (“Funds Trust”) and Wells Fargo Master Trust (“Master Trust”, and collectively, the “Trusts”) must determine annually whether to approve the continuation of the Trusts’ investment management, advisory and sub-advisory agreements, as applicable. In this regard, at an in-person meeting held on May 21-22, 2019 (the “Meeting”), the Funds Trust Board, all the members of which have no direct or indirect interest in the investment management agreement and are not “interested persons” of the Trusts, as defined in the 1940 Act (the “Independent Trustees”), reviewed and approved for Wells Fargo Small Company Growth Fund (the “Gateway Fund”) an investment management agreement (the “Gateway Fund Management Agreement”) with Wells Fargo Funds Management, LLC (“Funds Management”).
At the Meeting, the Master Trust Board, all the members of which have no direct or indirect interest in the investment advisory and sub-advisory agreements and are Independent Trustees, reviewed and approved: (i) an investment advisory agreement (the “Master Portfolio Advisory Agreement”) with Funds Management for Wells Fargo Small Company Growth Portfolio, a portfolio of Master Trust (the “Master Portfolio”); and (ii) an investment sub-advisory agreement (the “Sub-Advisory Agreement”) with Peregrine Capital Management, LLC (the “Sub-Adviser”).
The Gateway Fund and the Master Portfolio are collectively referred to as the “Funds.” The Gateway Fund Management Agreement, the Master Portfolio Advisory Agreement and the Sub-Advisory Agreement are collectively referred to as the “Advisory Agreements.”
The Gateway Fund is a gateway feeder fund that invest substantially all of its assets in the Master Portfolio. The Master Portfolio has a substantially similar investment objective and substantially similar investment strategies to the Gateway Fund. Information provided to the Boards regarding the Gateway Fund is also applicable to the Master Portfolio, as relevant.
At the Meeting, the Boards considered the factors and reached the conclusions described below relating to the selection of Funds Management and the Sub-Adviser and the approval of the Advisory Agreements. Prior to the Meeting, including at an in-person meeting in April 2019, the Trustees conferred extensively among themselves and with representatives of Funds Management about these matters. Also, the Boards have adopted a team-based approach, with each team consisting of a sub-set of Trustees, to assist the full Boards in the discharge of their duties in reviewing investment performance and other matters throughout the year. The Independent Trustees were assisted in their evaluation of the Advisory Agreements by independent legal counsel, from whom they received separate legal advice and with whom they met separately.
In providing information to the Boards, Funds Management and the Sub-Adviser were guided by a detailed set of requests for information submitted to them by independent legal counsel on behalf of the Independent Trustees at the start of the Boards’ annual contract renewal process earlier in 2019. In considering and approving the Advisory Agreements, the Trustees considered the information they believed relevant, including but not limited to the information discussed below. The Boards considered not only the specific information presented in connection with the Meeting, but also the knowledge gained over time through interaction with Funds Management and the Sub-Adviser about various topics. In this regard, the Boards reviewed reports of Funds Management at each of their quarterly meetings, which included, among other things, portfolio reviews and investment performance reports. In addition, the Boards and the teams mentioned above confer with portfolio managers at various times throughout the year. The Boards did not identify any particular information or consideration that was all-important or controlling, and each individual Trustee may have attributed different weights to various factors.
After its deliberations, the Funds Trust Board unanimously approved the continuation of the Gateway Fund Management Agreement for a one-year period. Additionally, after its deliberations, the Master Trust Board unanimously approved the continuation of the Master Portfolio Advisory Agreement and the Sub-Advisory Agreement, each for a one-year term. The Boards also determined that the compensation payable to Funds Management and the Sub-Adviser was reasonable. The Boards considered the approval of the Advisory Agreements for the Funds as part of their consideration of agreements for funds across the complex, but their approvals were made on a fund-by-fund basis. The following summarizes a number of important, but not necessarily all, factors considered by the Boards in support of their approvals.
Nature, extent and quality of services
The Boards received and considered various information regarding the nature, extent and quality of services provided to the Funds by Funds Management and the Sub-Adviser under the Advisory Agreements. This information included a description of the investment advisory services and Fund-level administrative services, as well as, among other things, a
| | | | | | |
| Other information (unaudited) | | Wells Fargo Small Company Growth Fund | | | 45 | |
summary of the background and experience of senior management of Wells Fargo Asset Management (“WFAM”), of which Funds Management is a part, a summary of investments made in the business of WFAM, a summary of certain organizational and personnel changes involving Funds Management, and a description of Funds Management’s and the Sub-Adviser’s business continuity planning programs and of their approaches to data privacy and cybersecurity. The Boards received and reviewed information about Funds Management’s role as administrator of the Funds’ liquidity risk management program. The Boards also considered the qualifications, background, tenure and responsibilities of each of the portfolio managers primarily responsible for the day-to-day portfolio management of the Funds.
The Boards evaluated the ability of Funds Management and the Sub-Adviser to attract and retain qualified investment professionals, including research, advisory and supervisory personnel. The Boards further considered the compliance programs and compliance records of Funds Management and the Sub-Adviser. In addition, the Boards took into account the full range of services provided to the Funds by Funds Management and its affiliates.
Fund investment performance and expenses
The Boards considered the investment performance results for each of the Funds over various time periods ended December 31, 2018. The Boards considered these results in comparison to the investment performance of funds in a universe that was determined by Broadridge Inc. (“Broadridge”) to be similar to the Gateway Fund (the “Universe”), and in comparison to the Gateway Fund’s benchmark index and to other comparative data. Broadridge is an independent provider of investment company data. The Boards received a description of the methodology used by Broadridge to select the mutual funds in the performance Universe. The Funds Trust Board noted that the investment performance of the Gateway Fund (Administrator Class) was higher than or in range of the average investment performance of its Universe for the one-, five- and ten-year periods under review, but lower than the average investment performance of its Universe for the three-year period under review. The Funds Trust Board also noted that the investment performance of the Gateway Fund was higher than or equal to its benchmark, the Russell 2000® Growth Index, for all periods under review.
The Master Trust Board took note of the investment performance of the Master Portfolio in the context of reviewing the investment performance of the Gateway Fund.
The Funds Trust Board received information concerning, and discussed factors contributing to, the underperformance of the Gateway Fund relative to the Universe and benchmark for the periods identified above. The Funds Trust Board took note of the explanations for the relative underperformance during these periods, including with respect to investment decisions and market factors that affected the Gateway Fund’s investment performance.
The Funds Trust Board also received and considered information regarding the Gateway Fund’s net operating expense ratios, which include fees and expenses of the Master Portfolio, and their various components, including actual management fees assessed at the Gateway Fund and Master Portfolio levels, custodian and other non-management fees, and Rule 12b-1 and non-Rule 12b-1 shareholder service fees. The Funds Trust Board considered these ratios in comparison to the median ratios of funds in class-specific expense groups that were determined by Broadridge to be similar to the Gateway Fund (the “Groups”). The Funds Trust Board received a description of the methodology used by Broadridge to select the mutual funds in the expense Groups and an explanation of how funds comprising expense groups and their expense ratios may vary from year-to-year. Based on the Broadridge reports, the Funds Trust Board noted that the net operating expense ratios of the Gateway Fund were lower than, equal to, or in range of the median net operating expense ratios of its expense Groups for each share class.
With respect to the Master Portfolio, the Master Trust Board reviewed the fee rates that are payable to Funds Management for investment advisory services (as discussed below), which are the only fees charged at the Master Portfolio level, relative to a corresponding expense Group.
The Boards took into account the Funds’ investment performance and expense information provided to them among the factors considered in deciding to re-approve the Advisory Agreements.
Investment management, advisory and sub-advisory fee rates
The Funds Trust Board noted that Funds Management receives no advisory fees from the Gateway Fund as long as the Gateway Fund continues to invest all (or substantially all) of its assets in a single master portfolio. If the Gateway Fund were to change its investment structure so that it began investing in two or more master portfolios (a fund-of-funds), Funds Management would be entitled to receive an annual fee of 0.25% of the Gateway Fund’s average daily net assets for providing investment advisory services to the Gateway Fund, including allocating the Gateway Fund’s assets to the Master Portfolio.
| | | | |
| 46 | | Wells Fargo Small Company Growth Fund | | Other information (unaudited) |
The Funds Trust Board reviewed and considered the contractual fee rates that are payable by the Gateway Fund to Funds Management under the Gateway Fund Management Agreement, as well as the contractual fee rates payable by the Gateway Fund to Funds Management for class-level administrative services under a Class-Level Administration Agreement, which include, among other things, class-level transfer agency and sub-transfer agency costs (collectively, the “Management Rates”).
The Master Trust Board reviewed and considered the contractual investment advisory fee rate that is payable by the Master Portfolio to Funds Management for investment advisory services under the Master Portfolio Advisory Agreement (the “Advisory Agreement Rate”). The Master Trust Board also reviewed and considered the contractual investment sub-advisory fee rate that is payable by Funds Management to the Sub-Adviser for investment sub-advisory services (the “Sub-Advisory Agreement Rate”).
Among other information reviewed by the Funds Trust Board was a comparison of the Gateway Fund’s Management Rate, which include the advisory fees paid at the Master Portfolio level, with the average contractual investment management fee rates of funds in the expense Groups at a common asset level as well as transfer agency costs of the funds in the expense Groups. The Funds Trust Board noted that the Management Rates of the Gateway Fund were in range of the sum of these average rates for the Gateway Fund’s expense Groups for the Institutional Class and Class R6, but higher than the sum of these average rates for the Gateway Fund’s expense Groups for Class A and the Administrator Class. The Funds Trust Board noted that the net operating expense ratio cap for Class A of the Gateway Fund would be reduced. The Funds Trust Board also noted that the net operating expense ratios of the Gateway Fund were lower than, equal to, or in range of the median net operating expense ratios of its expense Groups for each share class.
The Master Trust Board reviewed a comparison of the Advisory Agreement Rate of the Master Portfolio with those of other funds in the Master Portfolio’s expense Group at a common asset level. The Master Trust Board noted that the Advisory Agreement Rate of the Master Portfolio was lower than the median rate for the Master Portfolio’s expense Group.
The Master Trust Board also received and considered information about the portions of the total management fees that were retained by Funds Management after payment of the fees to the Sub-Adviser for sub-advisory services. The Master Trust Board considered these amounts in comparison to the median amount retained by advisers to funds in a sub-advised expense universe that was determined by Broadridge to be similar to the Master Portfolio. In assessing the reasonableness of these amounts, the Master Trust Board received and evaluated information about the nature and extent of responsibilities retained and risks assumed by Funds Management and not delegated to or assumed by the Sub-Adviser, and about Funds Management’s on-going oversight services. The Master Trust Board also considered that the sub-advisory fees paid to the Sub-Adviser had been negotiated by Funds Management on an arm’s length basis.
The Boards also received and considered information about the nature and extent of services offered and fee rates charged by Funds Management and the Sub-Adviser to other types of clients with investment strategies similar to those of the Funds. In this regard, the Boards received information about the significantly greater scope of services, and compliance, reporting and other legal burdens and risks of managing proprietary mutual funds compared with those associated with managing assets of other types of clients, including third-party sub-advised fund clients and non-mutual fund clients such as institutional separate accounts.
Based on its consideration of the factors and information it deemed relevant, including those described here, the Funds Trust Board determined that the compensation payable to Funds Management under the Gateway Fund Management Agreement was reasonable, and the Master Trust Board determined that the compensation payable to Funds Management under the Master Portfolio Advisory Agreement and to the Sub-Adviser under the Sub-Advisory Agreement was reasonable.
Profitability
The Boards received and considered information concerning the profitability of Funds Management, as well as the profitability of both WFAM and Wells Fargo & Co. (“Wells Fargo”) from providing services to the fund family as a whole.
Funds Management reported on the methodologies and estimates used in calculating profitability, including a description of the methodology used to allocate certain expenses. Among other things, the Boards noted that the levels of profitability reported on a fund-by-fund basis varied widely, depending on factors such as the size, type and age of fund. The Boards did not consider profitability with respect to the Sub-Adviser, as the sub-advisory fees paid to the Sub-Adviser had been negotiated by Funds Management on an arm’s-length basis.
Based on its review, the Boards did not deem the profits reported by Funds Management, WFAM or Wells Fargo from services provided to the Funds to be at a level that would prevent the Boards from approving the continuation of the Advisory Agreements.
| | | | | | |
| Other information (unaudited) | | Wells Fargo Small Company Growth Fund | | | 47 | |
Economies of scale
The Boards received and considered information about the potential for Funds Management to experience economies of scale in the provision of management services to the Funds, the difficulties of calculating economies of scale at an individual fund level, and the extent to which potential scale benefits are shared with shareholders. The Boards noted the existence of breakpoints in the Master Portfolio’s advisory fee structure and the Gateway Fund’s management fee structure, which operate generally to reduce the Funds’ expense ratios as the Funds grow in size. The Boards considered that, in addition to management fee breakpoints, Funds Management shares potential economies of scale from its management business in a variety of ways, including through fee waiver and expense reimbursement arrangements, services that benefit shareholders, competitive management fee rates set at the outset without regard to breakpoints, and investments in the business intended to enhance services available to shareholders.
The Boards concluded that Funds Management’s arrangements with respect to each Fund, including contractual breakpoints, constituted a reasonable approach to sharing potential economies of scale with the Funds and their shareholders.
Other benefits to Funds Management and the Sub-Adviser
The Boards received and considered information regarding potential “fall-out” or ancillary benefits received by Funds Management, the Sub-Adviser, and their affiliates as a result of their relationships with the Funds. Ancillary benefits could include, among others, benefits directly attributable to other relationships with the Funds and benefits potentially derived from an increase in Funds Management’s and the Sub-Adviser’s business as a result of their relationships with the Funds. The Boards noted that various affiliates of Funds Management may receive distribution-related fees, shareholder servicing payments and sub-transfer agency fees in respect of shares sold or held through them and services provided.
The Boards also reviewed information about soft dollar credits earned and utilized by the Sub-Adviser, fees earned by Funds Management and its affiliate from managing a private investment vehicle for the fund family’s securities lending collateral, and commissions earned by an affiliated broker from portfolio transactions.
Based on their consideration of the factors and information they deemed relevant, including those described here, the Boards did not find that any ancillary benefits received by Funds Management, the Sub-Adviser, and their affiliates were unreasonable.
Conclusion
At the Meeting, after considering the above-described factors and based on its deliberations and its evaluation of the information described above, the Funds Trust Board unanimously approved the continuation of the Gateway Fund Management Agreement for a one-year period. Additionally, after considering the above-described factors and based on its deliberations and its evaluation of the information described above, the Master Trust Board unanimously approved the continuation of the Master Portfolio Advisory Agreement and the Sub-Advisory Agreement, each for a one-year term. The Boards also determined that the compensation payable to Funds Management and the Sub-Adviser was reasonable.
This page is intentionally left blank.

For more information
More information about Wells Fargo Funds is available free upon request. To obtain literature, please write, visit the Fund’s website, or call:
Wells Fargo Funds
P.O. Box 219967
Kansas City, MO 64121-9967
Website: wfam.com
Individual investors: 1-800-222-8222
Retail investment professionals: 1-888-877-9275
Institutional investment professionals:1-866-765-0778
This report and the financial statements contained herein are submitted for the general information of the shareholders of the Fund. If this report is used for promotional purposes, distribution of the report must be accompanied or preceded by a current prospectus. Before investing, please consider the investment objectives, risks, charges, and expenses of the investment. For a current prospectus and, if available, a summary prospectus, containing this information, call1-800-222-8222 or visit the Fund’s website atwfam.com. Read the prospectus carefully before you invest or send money.
Wells Fargo Asset Management (WFAM) is the trade name for certain investment advisory/management firms owned by Wells Fargo & Company. These firms include but are not limited to Wells Capital Management Incorporated and Wells Fargo Funds Management, LLC. Certain products managed by WFAM entities are distributed by Wells Fargo Funds Distributor, LLC (a broker-dealer and Member FINRA).
This material is for general informational and educational purposes only and is NOT intended to provide investment advice or a recommendation of any kind—including a recommendation for any specific investment, strategy, or plan.
INVESTMENT PRODUCTS: NOT FDIC INSURED ◾ NO BANK GUARANTEE ◾ MAY LOSE VALUE
© 2019 Wells Fargo Funds Management, LLC. All rights reserved.
| | |
 | | 403199 07-19 A285/AR285 05-19 |
Annual Report
May 31, 2019

Wells Fargo Small Company Value Fund

Beginning on January 1, 2021, as permitted by new regulations adopted by the Securities and Exchange Commission, paper copies of the Wells Fargo Funds’ annual and semi-annual shareholder reports issued after this date will no longer be sent by mail, unless you specifically request paper copies of the reports. Instead, the reports will be made available on the Funds’ website, and you will be notified by mail each time a report is posted and provided with a website address to access the report.
If you already elected to receive shareholder reports electronically, you will not be affected by this change and you need not take any action. You may elect to receive shareholder reports and other communications from the Fund electronically at any time by contacting your financial intermediary (such as a broker-dealer or bank) or, if you are a direct investor, by calling 1-800-222-8222 or by enrolling at wellsfargo.com/advantagedelivery.
You may elect to receive all future reports in paper free of charge. If you invest through a financial intermediary, you can contact your financial intermediary to request that you continue to receive paper copies of your shareholder reports; if you invest directly with the Fund, you can call 1-800-222-8222. Your election to receive reports in paper will apply to all Wells Fargo Funds held in your account with your financial intermediary or, if you are a direct investor, to all Wells Fargo Funds that you hold.

Reduce clutter. Save trees.
Sign up for electronic delivery of prospectuses and shareholder reports atwellsfargo.com/advantagedelivery
Contents
The views expressed and any forward-looking statements are as of May 31, 2019, unless otherwise noted, and are those of the Fund managers and/or Wells Fargo Asset Management. Discussions of individual securities, or the markets generally, or any Wells Fargo Fund are not intended as individual recommendations. Future events or results may vary significantly from those expressed in any forward-looking statements. The views expressed are subject to change at any time in response to changing circumstances in the market. Wells Fargo Asset Management and the Fund disclaim any obligation to publicly update or revise any views expressed or forward-looking statements.
INVESTMENT PRODUCTS: NOT FDIC INSURED ◾ NO BANK GUARANTEE ◾ MAY LOSE VALUE
| | | | |
| 2 | | Wells Fargo Small Company Value Fund | | Letter to shareholders (unaudited) |

Andrew Owen
President
Wells Fargo Funds
Dear Shareholder:
We are pleased to offer you this annual report for the Wells Fargo Small Company Value Fund for the12-month period that ended May 31, 2019. Higher short-term interest rates, inflation concerns, trade tensions, and geopolitical events drove investment market volatility for much of 2018, particularly for international stocks. Early 2019 saw stocks and bonds gain with renewed business and investor confidence, but volatility returned late in the period as global growth slowed and geopolitical concerns persisted.
For the period, U.S. stocks, based on the S&P 500 Index,1 gained 3.78% and international stocks, as measured by the MSCI ACWI ex USA Index (Net),2 fell 6.26%. Based on the MSCI EM Index (Net),3 emerging market stocks fell 8.70%. Bond investors saw the Bloomberg Barclays U.S. Aggregate Bond Index4 add 6.40% while the Bloomberg Barclays Global Aggregateex-USD Index5 rose 0.39%. The Bloomberg Barclays Municipal Bond Index6 added 6.40%, and the ICE BofAML U.S. High Yield Index7 was up 5.37%.
Results for investment indices reflected global concerns.
Global trade tensions escalated during the second quarter of 2018. Atit-for-tat tariff spat intensified between the U.S. and other governments. The U.S. Federal Reserve (Fed) raised the federal funds rate by 25 basis points (bps; 100 bps equal 1.00%) to a target range of between 1.75% and 2.00% in June. Market index results reflected the global concerns. The MSCI ACWI ex USA Index (Net) lost 2.61%, while the Bloomberg Barclays Global Aggregateex-USD Index dropped 4.76%.
Not all news was bad. The U.S. Bureau of Economic Analysis reported second-quarter annualized gross domestic product (GDP) growth of 4.2%. Hiring improved. Unemployment declined. Consumer confidence and spending increased. The S&P 500 Index recorded a 3.43% second-quarter gain. Stocks of companies with smaller capitalizations did even better, as measured by the Russell 2000® Index,8 adding 7.75%.
| 1 | The S&P 500 Index consists of 500 stocks chosen for market size, liquidity, and industry group representation. It is a market-value-weighted index with each stock’s weight in the index proportionate to its market value. You cannot invest directly in an index. |
| 2 | The Morgan Stanley Capital International (MSCI) All Country World Index (ACWI) ex USA Index (Net) is a free-float-adjusted market-capitalization-weighted index that is designed to measure the equity market performance of developed and emerging markets, excluding the U.S. Source: MSCI. MSCI makes no express or implied warranties or representations and shall have no liability whatsoever with respect to any MSCI data contained herein. The MSCI data may not be further redistributed or used as a basis for other indices or any securities or financial products. This report is not approved, reviewed, or produced by MSCI. You cannot invest directly in an index. |
| 3 | The MSCI Emerging Markets (EM) Index (Net) is a free-float-adjusted market-capitalization-weighted index that is designed to measure the equity market performance of emerging markets. You cannot invest directly in an index. |
| 4 | The Bloomberg Barclays U.S. Aggregate Bond Index is a broad-based benchmark that measures the investment-grade, U.S.-dollar-denominated, fixed-rate taxable bond market, including Treasuries, government-related and corporate securities, mortgage-backed securities (agency fixed-rate and hybrid adjustable-rate mortgage pass-throughs), asset-backed securities, and commercial mortgage-backed securities. You cannot invest directly in an index. |
| 5 | The Bloomberg Barclays Global Aggregateex-USD Index is an unmanaged index that provides a broad-based measure of the global investment-grade fixed-income markets excluding the U.S.-dollar-denominated debt market. You cannot invest directly in an index. |
| 6 | The Bloomberg Barclays Municipal Bond Index is an unmanaged index composed of long-termtax-exempt bonds with a minimum credit rating of Baa. You cannot invest directly in an index. |
| 7 | The ICE BofAML U.S. High Yield Index is a market-capitalization-weighted index of domestic and Yankee high-yield bonds. The index tracks the performance of high-yield securities traded in the U.S. bond market. You cannot invest directly in an index. Copyright 2019. ICE Data Indices, LLC. All rights reserved. |
| 8 | The Russell 2000® Index measures the performance of the 2,000 smallest companies in the Russell 3000® Index, which represents approximately 8% of the total market capitalization of the Russell 3000® Index. You cannot invest directly in an index. |
| | | | | | |
| Letter to shareholders (unaudited) | | Wells Fargo Small Company Value Fund | | | 3 | |
Investors appeared to shake off lingering concerns during the third quarter.
Favorable third-quarter economic indicators and corporate earnings reports encouraged domestic stock investors. U.S. trade negotiations with Mexico and Canada progressed. The Conference Board Consumer Confidence Index®9 reached its highest level in 18 years during September 2018. The Fed raised the federal funds rate by 25 bps to a target range of between 2.00% and 2.25% in September. For the quarter that ended September 30, 2018, the S&P 500 Index added 7.71%.
Investors in international markets were not as confident. Tensions between the U.S. and China increased. The U.S. imposed $200 billion in tariffs on Chinese goods. China reacted with $60 billion in tariffs on U.S. goods. Economic growth in China caused concern. The Bank of England (BoE) raised its monetary policy rate to 0.75% in August 2018. During the quarter, the MSCI ACWI ex USA Index (Net) gained 0.71%. The MSCI EM Index (Net) declined 1.09%. In fixed-income markets, U.S. bonds were flat, as measured by the Bloomberg Barclays U.S. Aggregate Bond Index. The Bloomberg Barclays Global Aggregateex-USD Index fell 1.74%.
Conflicting data unsettled markets during the fourth quarter.
November’s U.S. midterm elections shifted control of the House of Representatives from Republicans to Democrats, presaging potential partisan clashes. Third-quarter U.S. GDP was announced at an annualized 3.4% rate, lower than the second-quarter rate. Brexit efforts stalled ahead of the March 2019 deadline. The People’s Bank of China cut reserve requirement ratios, accelerated infrastructure spending, and cut taxes even as the value of the yuan declined to low levels last seen in 2008.
December’s S&P 500 Index performance was the worst since 1931. Globally, fixed-income investments fared better than stocks during the last two months of the year. The Fed increased the federal funds rate by 25 bps in December 2018 to a target range of between 2.25% and 2.50%.
The market climbs a wall of worry.
Investors entered 2019 with reasons to be concerned. A partial U.S. government shutdown driven by partisan policy disputes extended into January. Investment returns appeared to reaffirm the adage that markets climb a wall of worry. The S&P 500 Index gained 8.01% for the month of January, the best monthly performance in 30 years. Returns for the MSCI ACWI ex USA Index (Net), the Bloomberg Barclays U.S. Aggregate Bond Index, and the Bloomberg Barclays Global Aggregateex-USD Index also were positive. The Fed indicated that it would pause its program of regular rate increases during 2019 as inflation remained low.
In February 2019, concerns over slowing global growth reemerged. The Bureau of Economic Analysis announced fourth-quarter 2018 GDP grew at an annualized 2.2% rate, down from levels of the prior two quarters. In a February report, the BoE forecast the slowest growth since the financial crisis for 2019. China and the U.S. continued to wrangle over trade issues.
By the end of March 2019, the combination of dovish Fed sentiment and consistent, if not spectacular, economic and business metrics reinforced investors’ confidence. Monthly job creation data regained momentum. Corporate profits, while lower than 2018’s lofty levels, remained solid. China announced a roughly $300 billion stimulus package through tax and fee cuts intended to reinvigorate economic growth.
December’s S&P 500 Index performance was the worst since 1931.
The S&P 500 Index gained 8.01% for the month of January, the best monthly performance in 30 years.
| 9 | The Conference Board Consumer Confidence Index® measures the degree of optimism on the state of the U.S. economy that consumers are expressing through their activities of saving and spending. You cannot invest directly in an index. |
| | | | |
| 4 | | Wells Fargo Small Company Value Fund | | Letter to shareholders (unaudited) |
During April, several broad-based U.S. equity indices reached or approached highs as investors drew confidence from favorable economic projections, sustained low inflation, and solid employment data. First-quarter GDP showed the economy grew at an annualized rate of 3.2% on improvement in business investment and exports. Favorable sentiment extended to foreign markets as the MSCI ACWI ex USA Index (Net) gained 2.64% and the MSCI EM Index (Net) added 2.11% for the month.
May 2019 presented investors with mixed signals in the economy, in the markets, and politically. In the U.S., partisan wrangling ramped up as Democrats and Republicans set their sights on 2020 presidential politics. In the U.K., the Brexit stalemate resulted in the resignation of Prime Minister Theresa May. The European Commission downgraded the 2019 growth forecast for the block of countries to 1.2%. The U.S. increased tariffs on products from China, China responded, and then talks broke down. Ending the month, equities, as measured by the MSCI ACWI (Net),10 dropped 5.93% while bonds, often considered a less risky investment, gained 1.04%, as measured by the Bloomberg Barclays Global Aggregateex-USD Index.
Don’t let short-term uncertainty derail long-term investment goals.
Periods of investment uncertainty can present challenges, but experience has taught us that maintaining long-term investment goals can be an effective way to plan for the future. To help you create a sound strategy based on your personal goals and risk tolerance, Wells Fargo Funds offers more than 100 mutual funds spanning a wide range of asset classes and investment styles. Although diversification cannot guarantee an investment profit or prevent losses, we believe it can be an effective way to manage investment risk and potentially smooth out overall portfolio performance. We encourage investors to know their investments and to understand that appropriate levels of risk-taking may unlock opportunities.
Thank you for choosing to invest with Wells Fargo Funds. We appreciate your confidence in us and remain committed to helping you meet your financial needs.
Sincerely,

Andrew Owen
President
Wells Fargo Funds
For further information about your Fund, contact your investment professional, visit our website atwfam.com, or call us directly at1-800-222-8222.
| 10 | The MSCI ACWI (Net) is a free-float-adjusted market-capitalization-weighted index that is designed to measure the equity market performance of developed and emerging markets. You cannot invest directly in an index. |
This page is intentionally left blank.
| | | | |
| 6 | | Wells Fargo Small Company Value Fund1 | | Performance highlights (unaudited) |
Investment objective
The Fund seeks long-term capital appreciation.
Manager
Wells Fargo Funds Management, LLC
Subadviser for the affiliated master portfolio
Wells Capital Management Incorporated
Portfolio managers
Jeff Goverman
Garth R. Nisbet, CFA®‡
Craig Pieringer, CFA®‡
Average annual total returns (%) as of May 31, 2019
| | | | | | | | | | | | | | | | | | | | | | | | | | | | | | | | | | |
| | | | | Including sales charge | | | Excluding sales charge | | | Expense ratios2 (%) | |
| | | Inception date | | 1 year | | | 5 year | | | 10 year | | | 1 year | | | 5 year | | | 10 year | | | Gross | | | Net3 | |
| | | | | | | | | |
| Class A (SCVAX) | | 1-31-2002 | | | -19.63 | | | | 2.84 | | | | 11.19 | | | | -14.72 | | | | 4.07 | | | | 11.85 | | | | 1.46 | | | | 1.15 | |
| | | | | | | | | |
| Class C (SCVFX) | | 8-30-2002 | | | -16.73 | | | | 3.29 | | | | 11.05 | | | | -15.37 | | | | 3.29 | | | | 11.05 | | | | 2.21 | | | | 1.90 | |
| | | | | | | | | |
| Class R6 (SCVJX)4 | | 10-31-2016 | | | – | | | | – | | | | – | | | | -14.38 | | | | 4.48 | | | | 12.22 | | | | 1.03 | | | | 0.75 | |
| | | | | | | | | |
| Administrator Class (SCVIX) | | 1-31-2002 | | | – | | | | – | | | | – | | | | -14.65 | | | | 4.23 | | | | 12.10 | | | | 1.38 | | | | 1.05 | |
| | | | | | | | | |
| Institutional Class (SCVNX)5 | | 7-30-2010 | | | – | | | | – | | | | – | | | | -14.46 | | | | 4.43 | | | | 12.30 | | | | 1.13 | | | | 0.85 | |
| | | | | | | | | |
| Russell 2000® Value Index6 | | – | | | – | | | | – | | | | – | | | | -11.32 | | | | 5.00 | | | | 11.67 | | | | – | | | | – | |
Figures quoted represent past performance, which is no guarantee of future results,and do not reflect taxes that a shareholder may pay on fund distributions or the redemption of fund shares. Investment return and principal value of an investment will fluctuate so that an investor’s shares, when redeemed, may be worth more or less than their original cost. Performance shown without sales charges would be lower if sales charges were reflected. Current performance may be lower or higher than the performance data quoted, which assumes the reinvestment of dividends and capital gains. Currentmonth-end performance is available on the Fund’s website,wfam.com.
Index returns do not include transaction costs associated with buying and selling securities, any mutual fund fees or expenses, or any taxes. It is not possible to invest directly in an index.
For Class A shares, the maximumfront-end sales charge is 5.75%. For Class C shares, the maximum contingent deferred sales charge is 1.00%. Performance including a contingent deferred sales charge assumes the sales charge for the corresponding time period. Class R6, Administrator Class, and Institutional Class shares are sold without afront-end sales charge or contingent deferred sales charge.
Stock values fluctuate in response to the activities of individual companies and general market and economic conditions. Smaller-company stocks tend to be more volatile and less liquid than those of larger companies. Certain investment strategies tend to increase the total risk of an investment (relative to the broader market). Consult the Fund’s prospectus for additional information on these and other risks.
Please see footnotes on page 7.
| | | | | | |
| Performance highlights (unaudited) | | Wells Fargo Small Company Value Fund | | | 7 | |
|
| Growth of $10,000 investment as of May 31, 20197 |
|
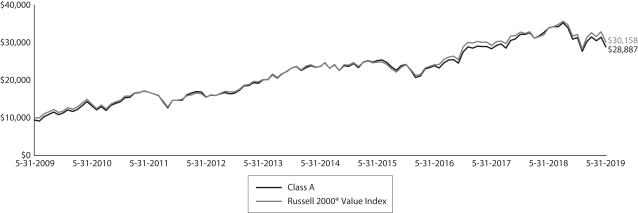 |
| ‡ | CFA® and Chartered Financial Analyst® are trademarks owned by CFA Institute. |
| 1 | The Fund is a gateway feeder fund that invests substantially all of its assets in a single affiliated master portfolio of the Wells Fargo Master Trust with a substantially identical investment objective and substantially similar investment strategies. References to the investment activities of the Fund are intended to refer to the investment activities of the affiliated master portfolio in which it invests. |
| 2 | Reflects the expense ratios as stated in the most recent prospectuses. The expense ratios shown are subject to change and may differ from the annualized expense ratios shown in the financial highlights of this report. |
| 3 | The manager has contractually committed through September 30, 2019, to waive fees and/or reimburse expenses to the extent necessary to cap the expenses of each class after fee waivers at the amounts shown. Brokerage commissions, stamp duty fees, interest, taxes, acquired fund fees and expenses (if any) from funds in which the affiliated master portfolio invests and extraordinary expenses are excluded from the expense caps. Prior to or after the commitment expiration date, the cap may be increased or the commitment to maintain the cap may be terminated only with the approval of the Board of Trustees. Net expenses from the affiliated master portfolio are included in the expense cap. Without this cap, the Fund’s returns would have been lower. The expense ratio paid by an investor is the net expense ratio (the total annual fund operating expenses after fee waivers) as stated in the prospectuses. |
| 4 | Historical performance shown for the Class R6 shares prior to their inception reflects the performance of the Institutional Class shares and includes the higher expenses applicable to Institutional Class shares. If these expenses had been included, returns for Class R6 shares would be higher. |
| 5 | Historical performance shown for Institutional Class shares prior to their inception reflects the performance of Administrator Class shares and includes the higher expenses applicable to Administrator Class shares. If these expenses had not been included, returns for Institutional Class shares would be higher. |
| 6 | The Russell 2000® Value Index measures the performance of those Russell 2000 companies with lower price/book ratios and lower forecasted growth values. You cannot invest directly in an index. |
| 7 | The chart compares the performance of Class A shares for the most recent ten years with the Russell 2000® Value Index. The chart assumes a hypothetical $10,000 investment in Class A shares and reflects all operating expenses and assumes the maximum initial sales charge of 5.75%. |
| 8 | The Russell 1000® Value Index measures the performance of the 1,000 largest companies in the Russell 3000® Index, which represents approximately 92% of the total market capitalization of the Russell 3000® Index. You cannot invest directly in an index. |
| 9 | The Russell Midcap® Value Index measures the performance of those Russell Midcap companies with lower price/book ratios and lower forecasted growth values. The stocks are also members of the Russell 1000® Value Index. You cannot invest directly in an index. |
| 10 | The Russell 1000® Index measures the performance of the 1,000 largest companies in the Russell 3000® Index, which represents approximately 92% of the total market capitalization of the Russell 3000® Index. You cannot invest directly in an index. |
| 11 | The Russell 2000® Index measures the performance of the 2,000 smallest companies in the Russell 3000® Index, which represents approximately 8% of the total market capitalization of the Russell 3000® Index. You cannot invest directly in an index. |
| 12 | The Russell 2000® Growth Index measures the performance of those Russell 2000 companies with higher price/book ratios and higher forecasted growth values. You cannot invest directly in an index. |
| 13 | The ten largest holdings, excluding cash, cash equivalents and any money market funds, are calculated based on the value of the securities of the affiliated master portfolio allocable to the Fund divided by the total net assets of the Fund. Holdings are subject to change and may have changed since the date specified. |
| 14 | Amounts represent the sector distribution of the affiliated master portfolio which are calculated based on the total long-term investments of the affiliated master portfolio. These amounts are subject to change and may have changed since the date specified. |
| * | The security was no longer held at the end of the period. |
| | | | |
| 8 | | Wells Fargo Small Company Value Fund | | Performance highlights (unaudited) |
MANAGER’S DISCUSSION
Fund highlights
| ∎ | | The Fund underperformed the Russell 2000® Value Index for the12-month period that ended May 31, 2019. |
| ∎ | | Stock selection within the consumer discretionary and financials sectors detracted from relative results. Within consumer discretionary, investments in an auto supplier and a specialty retailer were the main detractors, while investments in a regional bank and an online financial services provider were the main detractors in the financials sector. |
| ∎ | | Stock selection in the health care and consumer staples sectors contributed to relative return. Within health care, the Fund’s health care service provider holdings were contributors, while relative strength in the consumer staples sector was led by the Fund’s investment in one of the largest chicken producers in the U.S. |
During the period, investors were confronted with higher volatility.
After a period of relative calm, investors were confronted with new challenges that brought increased volatility. Talk of trade wars, an unknown Brexit outcome, a government shutdown, and a hawkish U.S. Federal Reserve (Fed) all affected the market with varying intensities.Large-cap stocks fared the best, rallying to twoall-time highs, with a deep December correction in between. Performance dispersion by market capitalization was significant, withlarge-cap value stocks, as measured by the Russell 1000® Value Index8, outperforming microcap value stocks, as measured by the Russell Midcap® Value Index9, by 16.25%.
Over the reporting period,large-cap stocks, as measured by the Russell 1000® Index10, were up whilesmall-cap stocks, as measured by the Russell 2000® Index11, declined, for a relative outperformance by large caps of 12.52%. Within small caps, growth stocks, as measured by the Russell 2000® Growth Index12, outperformed value stocks, as measured by the Russell 2000® Value Index, by 4.44%. It was a difficult period forsmall-cap value, as many of the metrics associated with value, including low price/earnings, low price/book, and long-term reversal ratios, were not rewarded.
We favored more defensive sectors of the economy and smaller-capitalization stocks.
Due to increased volatility, we lowered exposure to risk-sensitive sectors of the economy, including consumer discretionary and energy, and increased exposure to more defensive sectors, including consumer staples and utilities. In light of the period’s underperformance by the smallest market cap stocks, we increased the portfolio weighting of stocks under $1 billion in market capitalization.
| | | | |
| Ten largest holdings(%) as of May 31, 201913 | |
| |
Northwest Natural Holding Company | | | 1.22 | |
| |
Otter Tail Corporation | | | 1.19 | |
| |
Hawaiian Electric Industries Incorporated | | | 1.16 | |
| |
Armada Hoffler Properties Incorporated | | | 1.15 | |
| |
Independence Realty Trust Incorporated | | | 1.13 | |
| |
Dine Brands Global Incorporated | | | 1.12 | |
| |
One Liberty Properties Incorporated | | | 1.12 | |
| |
Great Southern Bancorp Incorporated | | | 1.09 | |
| |
MDU Resources Group Incorporated | | | 1.08 | |
| |
Hostess Brands Incorporated | | | 1.06 | |
|
| Sector distribution as of May 31, 201914 |
|
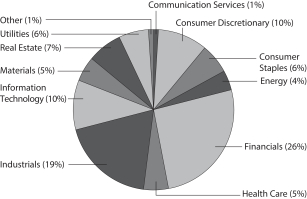 |
Stock selection led to the Fund’s underperformance.
The Fund underperformed its benchmark for the12-month period. Stock selection in health care and consumer staples aided relative performance, while consumer discretionary and financials investments detracted.
Please see footnotes on page 7.
| | | | | | |
| Performance highlights (unaudited) | | Wells Fargo Small Company Value Fund | | | 9 | |
In health care, investments in two health care service providers, The Ensign Group, Incorporated, and Molina Healthcare*, Incorporated, were key contributors to performance. Shares of Ensign Group, a skilled nursing operator, outperformed after posting solid occupancy gains, stable reimbursement rates, and improvements in underperforming facilities. Molina Healthcare, which provides managed care services for government-sponsored programs, rose as the company executed on key initiatives to simplify and turn around the business. Operating margins and market share gains improved quicker than expected. Stock selection in the consumer staples sector—notably, Pilgrim’s Pride Corporation—contributed to performance. Pilgrim’s Pride, the second-largest chicken processor in the U.S., outperformed as supply and demand imbalances shifted in the company’s favor, leading to market expectations of improved product pricing.
Within consumer discretionary, Cooper-Standard Holdings Incorporated* and Tailored Brands, Incorporated*, were the main detractors from performance. Cooper-Standard, a global supplier to the automotive industry, underperformed as the company faced weaker demand from Europe and China and expects higher costs associated with international trade uncertainty and tariffs. Tailored Brands, a men’s clothing retailer, continues to struggle with negative traffic trends as consumers shift to competitors with more establishede-commerce capabilities. Customers Bancorp, Incorporated, and Enova International, Incorporated, led to the relative underperformance in financials. Customers Bancorp, a full-service bank located in Pennsylvania, underperformed over the past year as the company faced net interest margin pressure and was unable to divest its BankMobile business. Enova, a provider of online financial services, including short-term consumer loans, continues to underperform as ongoing regulatory challenges weigh on the stock.
The stock market appears to be on a sound footing.
The U.S. economy has proven resilient. Interest rates are low, inflation remains tame, unemployment is near cycle lows, U.S. gross domestic product growth is expected to be in the 2.0% to 2.5% range, and earnings should likely grow in themid-single digits. While the current international trade conflict may drive near-term stock market sentiment, we believe the long-term outlook for the market remains sound.
Small-cap stocks are attractive due to their low valuations relative tolarge-cap stocks and should benefit if the Fed cuts rates or the U.S. dollar weakens. History also reinforces the case for value relative to growth stocks. As of May 31, 2019, the valuation gap between the Russell 2000® Growth Index and the Russell 2000® Value Index, usingnext-12-month price/earnings as a measure, has never been wider, at 35 times and 14 times, respectively. Similarly, the trailing10-year annualized returns for the Russell 2000® Value Index minus the Russell 2000® Growth Index approximate negative 2 standard deviations from the30-year historical mean, a statistical extreme that has marked past value style troughs.
| | | | |
| 10 | | Wells Fargo Small Company Value Fund | | Fund expenses (unaudited) |
As a shareholder of the Fund, you incur two types of costs: (1) transaction costs, including sales charges (loads) on purchase payments and contingent deferred sales charges (if any) on redemptions and (2) ongoing costs, including management fees, distribution(12b-1) and/or shareholder servicing fees, and other Fund expenses. This example is intended to help you understand your ongoing costs (in dollars) of investing in the Fund and to compare these costs with the ongoing costs of investing in other mutual funds.
The example is based on an investment of $1,000 invested at the beginning of thesix-month period and held for the entire period from December 1, 2018 to May 31, 2019.
Actual expenses
The “Actual” line of the table below provides information about actual account values and actual expenses. You may use the information in this line, together with the amount you invested, to estimate the expenses that you paid over the period. Simply divide your account value by $1,000 (for example, an $8,600 account value divided by $1,000 = 8.6), then multiply the result by the number in the “Actual” line under the heading entitled “Expenses paid during period” for your applicable class of shares to estimate the expenses you paid on your account during this period.
Hypothetical example for comparison purposes
The “Hypothetical” line of the table below provides information about hypothetical account values and hypothetical expenses based on the Fund’s actual expense ratio and an assumed rate of return of 5% per year before expenses, which is not the Fund’s actual return. The hypothetical account values and expenses may not be used to estimate the actual ending account balance or expenses you paid for the period. You may use this information to compare the ongoing costs of investing in the Fund and other funds. To do so, compare this 5% hypothetical example with the 5% hypothetical examples that appear in the shareholder reports of the other funds.
Please note that the expenses shown in the table are meant to highlight your ongoing costs only and do not reflect any transactional costs, such as sales charges (loads) and contingent deferred sales charges. Therefore, the “Hypothetical” line of the table is useful in comparing ongoing costs only and will not help you determine the relative total costs of owning different funds. In addition, if these transactional costs were included, your costs would have been higher.
| | | | | | | | | | | | | | | | |
| | | Beginning account value 12-1-2018 | | | Ending account value 5-31-2019 | | | Expenses paid during the period¹,2 | | | Annualized net
expense ratio1 | |
Class A | | | | | | | | | | | | | | | | |
| | | | |
Actual | | $ | 1,000.00 | | | $ | 921.73 | | | $ | 5.48 | | | | 1.14 | % |
| | | | |
Hypothetical (5% return before expenses) | | $ | 1,000.00 | | | $ | 1,019.23 | | | $ | 5.76 | | | | 1.14 | % |
Class C | | | | | | | | | | | | | | | | |
| | | | |
Actual | | $ | 1,000.00 | | | $ | 918.73 | | | $ | 9.05 | | | | 1.89 | % |
| | | | |
Hypothetical (5% return before expenses) | | $ | 1,000.00 | | | $ | 1,015.50 | | | $ | 9.51 | | | | 1.89 | % |
Class R6 | | | | | | | | | | | | | | | | |
| | | | |
Actual | | $ | 1,000.00 | | | $ | 924.03 | | | $ | 3.57 | | | | 0.74 | % |
| | | | |
Hypothetical (5% return before expenses) | | $ | 1,000.00 | | | $ | 1,021.22 | | | $ | 3.75 | | | | 0.74 | % |
Administrator Class | | | | | | | | | | | | | | | | |
| | | | |
Actual | | $ | 1,000.00 | | | $ | 922.32 | | | $ | 5.00 | | | | 1.04 | % |
| | | | |
Hypothetical (5% return before expenses) | | $ | 1,000.00 | | | $ | 1,019.73 | | | $ | 5.26 | | | | 1.04 | % |
Institutional Class | | | | | | | | | | | | | | | | |
| | | | |
Actual | | $ | 1,000.00 | | | $ | 923.21 | | | $ | 4.02 | | | | 0.84 | % |
| | | | |
Hypothetical (5% return before expenses) | | $ | 1,000.00 | | | $ | 1,020.75 | | | $ | 4.23 | | | | 0.84 | % |
| 1 | Amounts reflect net expenses allocated from the affiliated Master Portfolio in which the Fund invests. |
| 2 | Expenses paid is equal to the annualized net expense ratio of each class multiplied by the average account value over the period, multiplied by the number of days in the most recent fiscal half-year divided by the number of days in the fiscal year (to reflect theone-half-year period). |
| | | | | | |
| Portfolio of investments—May 31, 2019 | | Wells Fargo Small Company Value Fund | | | 11 | |
| | | | | | | | | | | | | | | | |
| Security name | | | | | | | | | | | Value | |
| | | | |
Investment Companies: 99.64% | | | | | | | | | | | | | | | | |
| | | | |
| Affiliated Master Portfolio: 99.64% | | | | | | | | | | | | | | | | |
| | | | |
Wells Fargo Small Company Value Portfolio | | | | | | | | | | | | | | $ | 60,533,578 | |
| | | | | | | | | | | | | | | | |
| | | | |
Total Investment Companies (Cost $73,159,441) | | | | | | | | | | | | | | | 60,533,578 | |
| | | | | | | | | | | | | | | | |
| | | | | | | | |
| Total investments in securities (Cost $73,159,441) | | | 99.64 | % | | | 60,533,578 | |
| | |
Other assets and liabilities, net | | | 0.36 | | | | 218,085 | |
| | | | | | | | |
| Total net assets | | | 100.00 | % | | $ | 60,751,663 | |
| | | | | | | | |
Transactions with the affiliated Master Portfolio were as follows:
| | | | | | | | | | | | | | | | | | | | | | | | | | | | | | | | | | | | |
| | | % of ownership, beginning of period | | | % of ownership, end of period | | | Net realized gains on securities transactions allocated from affiliated Master Portfolio | | | Net change in unrealized gains (losses) on securities transactions allocated from affiliated Master Portfolio | | | Dividends allocated from affiliated Master Portfolio | | | Affiliated
income allocated from affiliated Master Portfolio | | | Securities lending income allocated from affiliated Master
Portfolio | | | Value, end of period | | | % of net assets | |
Wells Fargo Small Company Value Portfolio | | | 87 | % | | | 47 | % | | $ | (4,999,289 | ) | | $ | (10,331,943 | ) | | $ | 1,374,321 | | | $ | 15,017 | | | $ | 62,160 | | | $ | 60,533,578 | | | | 99.64 | % |
The accompanying notes are an integral part of these financial statements.
| | | | |
| 12 | | Wells Fargo Small Company Value Fund | | Statement of assets and liabilities—May 31, 2019 |
| | | | |
| | | | |
| |
Assets | | | | |
Investments in affiliated Master Portfolio, at value (cost $73,159,441) | | $ | 60,533,578 | |
Receivable for Fund shares sold | | | 98,109 | |
Receivable from manager | | | 24,947 | |
Prepaid expenses and other assets | | | 125,599 | |
| | | | |
Total assets | | | 60,782,233 | |
| | | | |
| |
Liabilities | | | | |
Administration fees payable | | | 8,479 | |
Custodian and accounting fees payable | | | 7,066 | |
Shareholder servicing fees payable | | | 6,426 | |
Payable for Fund shares redeemed | | | 6,271 | |
Distribution fee payable | | | 787 | |
Accrued expenses and other liabilities | | | 1,541 | |
| | | | |
Total liabilities | | | 30,570 | |
| | | | |
Total net assets | | $ | 60,751,663 | |
| | | | |
| |
NET ASSETS CONSIST OF | | | | |
Paid-in capital | | $ | 82,657,477 | |
Total distributable loss | | | (21,905,814 | ) |
| | | | |
Total net assets | | $ | 60,751,663 | |
| | | | |
| |
COMPUTATION OF NET ASSET VALUE AND OFFERING PRICE PER SHARE | | | | |
Net assets – Class A | | $ | 11,901,502 | |
Shares outstanding – Class A1 | | | 491,329 | |
Net asset value per share – Class A | | | $24.22 | |
Maximum offering price per share – Class A2 | | | $25.70 | |
Net assets – Class C | | $ | 1,099,379 | |
Shares outstanding – Class C1 | | | 51,183 | |
Net asset value per share – Class C | | | $21.48 | |
Net assets – Class R6 | | $ | 730,525 | |
Shares outstanding – Class R61 | | | 29,320 | |
Net asset value per share – Class R6 | | | $24.92 | |
Net assets – Administrator Class | | $ | 13,904,607 | |
Shares outstanding – Administrator Class1 | | | 560,678 | |
Net asset value per share – Administrator Class | | | $24.80 | |
Net assets – Institutional Class | | $ | 33,115,650 | |
Shares outstanding – Institutional Class1 | | | 1,332,008 | |
Net asset value per share – Institutional Class | | | $24.86 | |
| 1 | The Fund has an unlimited number of authorized shares. |
| 2 | Maximum offering price is computed as 100/94.25 of net asset value. On investments of $50,000 or more, the offering price is reduced. |
The accompanying notes are an integral part of these financial statements.
| | | | | | |
| Statement of operations—year ended May 31, 2019 | | Wells Fargo Small Company Value Fund | | | 13 | |
| | | | |
| | | | |
| |
Investment income | | | | |
Dividends allocated from affiliated Master Portfolio (net of foreign withholding taxes of $1,834) | | $ | 1,374,321 | |
Securities lending income allocated from affiliated Master Portfolio | | | 62,160 | |
Affiliated income allocated from affiliated Master Portfolio | | | 15,017 | |
Expenses allocated from affiliated Master Portfolio | | | (807,282 | ) |
Waivers allocated from affiliated Master Portfolio | | | 100,286 | |
| | | | |
Total investment income | | | 744,502 | |
| | | | |
| |
Expenses | | | | |
Management fee | | | 47,326 | |
Administration fees | | | | |
Class A | | | 28,840 | |
Class C | | | 3,542 | |
Class R6 | | | 149 | |
Administrator Class | | | 39,761 | |
Institutional Class | | | 62,594 | |
Shareholder servicing fees | | | | |
Class A | | | 34,333 | |
Class C | | | 4,216 | |
Administrator Class | | | 76,260 | |
Distribution fee | | | | |
Class C | | | 12,648 | |
Custody and accounting fees | | | 9,158 | |
Professional fees | | | 30,570 | |
Registration fees | | | 95,011 | |
Shareholder report expenses | | | 25,328 | |
Trustees’ fees and expenses | | | 21,813 | |
Other fees and expenses | | | 10,773 | |
| | | | |
Total expenses | | | 502,322 | |
Less: Fee waivers and/or expense reimbursements | | | (285,980 | ) |
| | | | |
Net expenses | | | 216,342 | |
| | | | |
Net investment income | | | 528,160 | |
| | | | |
| |
REALIZED AND UNREALIZED GAINS (LOSSES) ON INVESTMENTS | | | | |
Net realized losses on securities transactions allocated from affiliated Master Portfolio | | | (4,999,289 | ) |
Net change in unrealized gains (losses) on securities transactions allocated from affiliated Master Portfolio | | | (10,331,943 | ) |
| | | | |
Net realized and unrealized gains (losses) on investments | | | (15,331,232 | ) |
| | | | |
Net decrease in net assets resulting from operations | | $ | (14,803,072 | ) |
| | | | |
The accompanying notes are an integral part of these financial statements.
| | | | |
| 14 | | Wells Fargo Small Company Value Fund | | Statement of changes in net assets |
| | | | | | | | | | | | | | | | |
| | | Year ended
May 31, 2019 | | | Year ended
May 31, 20181 | |
| | | | |
Operations | | | | | | | | | | | | | | | | |
Net investment income | | | | | | $ | 528,160 | | | | | | | $ | 872,024 | |
Net realized gains (losses) on investments | | | | | | | (4,999,289 | ) | | | | | | | 41,508,619 | |
Net change in unrealized gains (losses) on investments | | | | | | | (10,331,943 | ) | | | | | | | (18,058,560 | ) |
| | | | |
Net increase (decrease) in net assets resulting from operations | | | | | | | (14,803,072 | ) | | | | | | | 24,322,083 | |
| | | | |
| | | | |
Distributions to shareholders from net investment income and net realized gains | | | | | | | | | | | | | | | | |
Class A | | | | | | | (82,268 | ) | | | | | | | (52,718 | ) |
Class R6 | | | | | | | (4,758 | ) | | | | | | | (2,568 | ) |
Administrator Class | | | | | | | (80,883 | ) | | | | | | | (283,478 | ) |
Institutional Class | | | | | | | (367,043 | ) | | | | | | | (383,137 | ) |
| | | | |
Total distributions to shareholders | | | | | | | (534,952 | ) | | | | | | | (721,901 | ) |
| | | | |
| | | | |
Capital share transactions | | | Shares | | | | | | | | Shares | | | | | |
Proceeds from shares sold | | | | | | | | | | | | | | | | |
Class A | | | 100,769 | | | | 2,699,778 | | | | 60,419 | | | | 1,605,930 | |
Class C | | | 15,848 | | | | 366,047 | | | | 14,660 | | | | 329,415 | |
Class R6 | | | 25,104 | | | | 690,295 | | | | 15,174 | | | | 412,649 | |
Administrator Class | | | 156,576 | | | | 4,440,193 | | | | 100,581 | | | | 2,701,458 | |
Institutional Class | | | 927,734 | | | | 26,194,616 | | | | 431,742 | | | | 11,786,334 | |
| | | | |
| | | | | | | 34,390,929 | | | | | | | | 16,835,786 | |
| | | | |
Reinvestment of distributions | | | | | | | | | | | | | | | | |
Class A | | | 3,218 | | | | 75,882 | | | | 1,785 | | | | 48,755 | |
Class R6 | | | 183 | | | | 4,430 | | | | 84 | | | | 2,350 | |
Administrator Class | | | 3,347 | | | | 80,761 | | | | 10,156 | | | | 283,362 | |
Institutional Class | | | 15,183 | | | | 366,819 | | | | 13,529 | | | | 379,367 | |
| | | | |
| | | | | | | 527,892 | | | | | | | | 713,834 | |
| | | | |
Payment for shares redeemed | | | | | | | | | | | | | | | | |
Class A | | | (160,314 | ) | | | (4,366,685 | ) | | | (192,694 | ) | | | (5,099,087 | ) |
Class C | | | (42,700 | ) | | | (986,195 | ) | | | (28,318 | ) | | | (663,810 | ) |
Class R6 | | | (6,898 | ) | | | (189,905 | ) | | | (5,501 | ) | | | (154,810 | ) |
Administrator Class | | | (1,664,950 | ) | | | (46,927,131 | ) | | | (392,453 | ) | | | (10,624,027 | ) |
Institutional Class | | | (1,684,689 | ) | | | (45,679,163 | ) | | | (481,774 | ) | | | (13,221,590 | ) |
| | | | |
| | | | | | | (98,149,079 | ) | | | | | | | (29,763,324 | ) |
| | | | |
Net decrease in net assets resulting from capital share transactions | | | | | | | (63,230,258 | ) | | | | | | | (12,213,704 | ) |
| | | | |
Total increase (decrease) in net assets | | | | | | | (78,568,282 | ) | | | | | | | 11,386,478 | |
| | | | |
| | | | |
Net assets | | | | | | | | | | | | | | | | |
Beginning of period | | | | | | | 139,319,945 | | | | | | | | 127,933,467 | |
| | | | |
End of period | | | | | | $ | 60,751,663 | | | | | | | $ | 139,319,945 | |
| | | | |
| 1 | Effective for all filings after November 4, 2018, the SEC prospectively eliminated the requirement to parenthetically disclose undistributed net investment income at the end of the period and permitted the aggregation of distributions, with the exception of tax basis returns of capital. Undistributed net investment income at May 31, 2018 was $358,050. The disaggregated distributions information for the year ended May 31, 2018 is included in Note 7,Distributions to Shareholders, in the notes to the financial statements |
The accompanying notes are an integral part of these financial statements.
| | | | | | |
| Financial highlights | | Wells Fargo Small Company Value Fund | | | 15 | |
(For a share outstanding throughout each period)
| | | | | | | | | | | | | | | | | | | | |
| | | Year ended May 31 | |
| CLASS A | | 2019 | | | 2018 | | | 2017 | | | 2016 | | | 2015 | |
Net asset value, beginning of period | | | $28.60 | | | | $24.01 | | | | $20.22 | | | | $21.42 | | | | $20.08 | |
Net investment income | | | 0.09 | | | | 0.09 | | | | 0.05 | | | | 0.08 | | | | 0.07 | |
Net realized and unrealized gains (losses) on investments | | | (4.31 | ) | | | 4.58 | | | | 3.75 | | | | (1.25 | ) | | | 1.27 | |
| | | | | | | | | | | | | | | | | | | | |
Total from investment operations | | | (4.22 | ) | | | 4.67 | | | | 3.80 | | | | (1.17 | ) | | | 1.34 | |
Distributions to shareholders from | | | | | | | | | | | | | | | | | | | | |
Net investment income | | | (0.16 | ) | | | (0.08 | ) | | | (0.01 | ) | | | (0.03 | ) | | | 0.00 | |
Net asset value, end of period | | | $24.22 | | | | $28.60 | | | | $24.01 | | | | $20.22 | | | | $21.42 | |
Total return1 | | | (14.72 | )% | | | 19.48 | % | | | 18.86 | % | | | (5.48 | )% | | | 6.62 | % |
Ratios to average net assets (annualized) | | | | | | | | | | | | | | | | | | | | |
Gross expenses2 | | | 1.49 | % | | | 1.47 | % | | | 1.47 | % | | | 1.48 | % | | | 1.50 | % |
Net expenses2 | | | 1.15 | % | | | 1.33 | % | | | 1.35 | % | | | 1.37 | % | | | 1.40 | % |
Net investment income2 | | | 0.38 | % | | | 0.46 | % | | | 0.20 | % | | | 0.11 | % | | | 0.33 | % |
Supplemental data | | | | | | | | | | | | | | | | | | | | |
Portfolio turnover rate3 | | | 168 | % | | | 144 | % | | | 110 | % | | | 72 | % | | | 54 | % |
Net assets, end of period (000s omitted) | | | $11,902 | | | | $15,665 | | | | $16,280 | | | | $23,151 | | | | $26,339 | |
| 1 | Total return calculations do not include any sales charges. |
| 2 | Ratios include net expenses allocated from the affiliated Master Portfolio which were as follows: |
| | | | |
Year ended May 31, 2019 | | | 0.75 | % |
Year ended May 31, 2018 | | | 0.84 | % |
Year ended May 31, 2017 | | | 0.84 | % |
Year ended May 31, 2016 | | | 0.84 | % |
Year ended May 31, 2015 | | | 0.84 | % |
| 3 | Portfolio turnover rate is calculated by multiplying the affiliated Master Portfolio’s percentage of the Fund’s total investments in securities at the end of the period by the affiliated Master Portfolio’s portfolio turnover rate. |
The accompanying notes are an integral part of these financial statements.
| | | | |
| 16 | | Wells Fargo Small Company Value Fund | | Financial highlights |
(For a share outstanding throughout each period)
| | | | | | | | | | | | | | | | | | | | |
| | | Year ended May 31 | |
| CLASS C | | 2019 | | | 2018 | | | 2017 | | | 2016 | | | 2015 | |
Net asset value, beginning of period | | | $25.38 | | | | $21.40 | | | | $18.15 | | | | $19.34 | | | | $18.27 | |
Net investment loss | | | (0.08 | )1 | | | (0.07 | )1 | | | (0.11 | )1 | | | (0.11 | )1 | | | (0.08 | )1 |
Net realized and unrealized gains (losses) on investments | | | (3.82 | ) | | | 4.05 | | | | 3.36 | | | | (1.08 | ) | | | 1.15 | |
| | | | | | | | | | | | | | | | | | | | |
Total from investment operations | | | (3.90 | ) | | | 3.98 | | | | 3.25 | | | | (1.19 | ) | | | 1.07 | |
Net asset value, end of period | | | $21.48 | | | | $25.38 | | | | $21.40 | | | | $18.15 | | | | $19.34 | |
Total return2 | | | (15.37 | )% | | | 18.60 | % | | | 17.97 | % | | | (6.20 | )% | | | 5.86 | % |
Ratios to average net assets (annualized) | | | | | | | | | | | | | | | | | | | | |
Gross expenses3 | | | 2.22 | % | | | 2.21 | % | | | 2.22 | % | | | 2.23 | % | | | 2.26 | % |
Net expenses3 | | | 1.90 | % | | | 2.08 | % | | | 2.10 | % | | | 2.12 | % | | | 2.15 | % |
Net investment loss3 | | | (0.35 | )% | | | (0.29 | )% | | | (0.54 | )% | | | (0.62 | )% | | | (0.42 | )% |
Supplemental data | | | | | | | | | | | | | | | | | | | | |
Portfolio turnover rate4 | | | 168 | % | | | 144 | % | | | 110 | % | | | 72 | % | | | 54 | % |
Net assets, end of period (000s omitted) | | | $1,099 | | | | $1,980 | | | | $1,962 | | | | $2,004 | | | | $2,602 | |
| 1 | Calculated based upon average shares outstanding |
| 2 | Total return calculations do not include any sales charges. |
| 3 | Ratios include net expenses allocated from the affiliated Master Portfolio which were as follows: |
| | | | |
Year ended May 31, 2019 | | | 0.75 | % |
Year ended May 31, 2018 | | | 0.84 | % |
Year ended May 31, 2017 | | | 0.84 | % |
Year ended May 31, 2016 | | | 0.84 | % |
Year ended May 31, 2015 | | | 0.84 | % |
| 4 | Portfolio turnover rate is calculated by multiplying the affiliated Master Portfolio’s percentage of the Fund’s total investments in securities at the end of the period by the affiliated Master Portfolio’s portfolio turnover rate. |
The accompanying notes are an integral part of these financial statements.
| | | | | | |
| Financial highlights | | Wells Fargo Small Company Value Fund | | | 17 | |
(For a share outstanding throughout each period)
| | | | | | | | | | | | |
| | | Year ended May 31 | |
| CLASS R6 | | 2019 | | | 2018 | | | 20171 | |
Net asset value, beginning of period | | | $29.44 | | | | $24.69 | | | | $21.37 | |
Net investment income | | | 0.21 | 2 | | | 0.29 | 2 | | | 0.08 | |
Net realized and unrealized gains (losses) on investments | | | (4.45 | ) | | | 4.65 | | | | 3.33 | |
| | | | | | | | | | | | |
Total from investment operations | | | (4.24 | ) | | | 4.94 | | | | 3.41 | |
Distributions to shareholders from | | | | | | | | | | | | |
Net investment income | | | (0.28 | ) | | | (0.19 | ) | | | (0.09 | ) |
Net asset value, end of period | | | $24.92 | | | | $29.44 | | | | $24.69 | |
Total return3 | | | (14.38 | )% | | | 20.03 | % | | | 15.95 | % |
Ratios to average net assets (annualized) | | | | | | | | | | | | |
Gross expenses4 | | | 1.09 | % | | | 1.03 | % | | | 1.02 | % |
Net expenses4 | | | 0.75 | % | | | 0.88 | % | | | 0.90 | % |
Net investment income4 | | | 0.77 | % | | | 1.04 | % | | | 0.58 | % |
Supplemental data | | | | | | | | | | | | |
Portfolio turnover rate5 | | | 168 | % | | | 144 | % | | | 110 | % |
Net assets, end of period (000s omitted) | | | $731 | | | | $322 | | | | $29 | |
| 1 | For the period from October 31, 2016 (commencement of class operations) to May 31, 2017. |
| 2 | Calculated based upon average shares outstanding |
| 3 | Returns for periods of less than one year are not annualized. |
| 4 | Ratios include net expenses allocated from the affiliated Master Portfolio which were as follows: |
| | | | |
Year ended May 31, 2019 | | | 0.75 | % |
Year ended May 31, 2018 | | | 0.84 | % |
Year ended May 31, 20171 | | | 0.83 | % |
| 5 | Portfolio turnover rate is calculated by multiplying the affiliated Master Portfolio’s percentage of the Fund’s total investments in securities at the end of the period by the affiliated Master Portfolio’s portfolio turnover rate. |
The accompanying notes are an integral part of these financial statements.
| | | | |
| 18 | | Wells Fargo Small Company Value Fund | | Financial highlights |
(For a share outstanding throughout each period)
| | | | | | | | | | | | | | | | | | | | |
| | | Year ended May 31 | |
| ADMINISTRATOR CLASS | | 2019 | | | 2018 | | | 2017 | | | 2016 | | | 2015 | |
Net asset value, beginning of period | | | $29.23 | | | | $24.53 | | | | $20.66 | | | | $21.90 | | | | $20.49 | |
Net investment income | | | 0.14 | 1 | | | 0.20 | | | | 0.08 | 1 | | | 0.13 | | | | 0.11 | |
Net realized and unrealized gains (losses) on investments | | | (4.43 | ) | | | 4.63 | | | | 3.83 | | | | (1.30 | ) | | | 1.30 | |
| | | | | | | | | | | | | | | | | | | | |
Total from investment operations | | | (4.29 | ) | | | 4.83 | | | | 3.91 | | | | (1.17 | ) | | | 1.41 | |
Distributions to shareholders from | | | | | | | | | | | | | | | | | | | | |
Net investment income | | | (0.14 | ) | | | (0.13 | ) | | | (0.04 | ) | | | (0.07 | ) | | | 0.00 | |
Net asset value, end of period | | | $24.80 | | | | $29.23 | | | | $24.53 | | | | $20.66 | | | | $21.90 | |
Total return | | | (14.65 | )% | | | 19.71 | % | | | 19.00 | % | | | (5.36 | )% | | | 6.88 | % |
Ratios to average net assets (annualized) | | | | | | | | | | | | | | | | | | | | |
Gross expenses2 | | | 1.35 | % | | | 1.38 | % | | | 1.39 | % | | | 1.39 | % | | | 1.34 | % |
Net expenses2 | | | 1.05 | % | | | 1.19 | % | | | 1.20 | % | | | 1.20 | % | | | 1.20 | % |
Net investment income2 | | | 0.49 | % | | | 0.59 | % | | | 0.36 | % | | | 0.28 | % | | | 0.52 | % |
Supplemental data | | | | | | | | | | | | | | | | | | | | |
Portfolio turnover rate3 | | | 168 | % | | | 144 | % | | | 110 | % | | | 72 | % | | | 0 | % |
Net assets, end of period (000s omitted) | | | $13,905 | | | | $60,379 | | | | $57,591 | | | | $64,023 | | | | $71,034 | |
| 1 | Calculated based upon average shares outstanding |
| 2 | Ratios include net expenses allocated from the affiliated Master Portfolio which were as follows: |
| | | | |
Year ended May 31, 2019 | | | 0.75 | % |
Year ended May 31, 2018 | | | 0.84 | % |
Year ended May 31, 2017 | | | 0.84 | % |
Year ended May 31, 2016 | | | 0.84 | % |
Year ended May 31, 2015 | | | 0.84 | % |
| 3 | Portfolio turnover rate is calculated by multiplying the affiliated Master Portfolio’s percentage of the Fund’s total investments in securities at the end of the period by the affiliated Master Portfolio’s portfolio turnover rate. |
The accompanying notes are an integral part of these financial statements.
| | | | | | |
| Financial highlights | | Wells Fargo Small Company Value Fund | | | 19 | |
(For a share outstanding throughout each period)
| | | | | | | | | | | | | | | | | | | | |
| | | Year ended May 31 | |
| INSTITUTIONAL CLASS | | 2019 | | | 2018 | | | 2017 | | | 2016 | | | 2015 | |
Net asset value, beginning of period | | | $29.40 | | | | $24.68 | | | | $20.77 | | | | $22.02 | | | | $20.57 | |
Net investment income | | | 0.19 | 1 | | | 0.21 | | | | 0.11 | | | | 0.08 | 1 | | | 0.14 | |
Net realized and unrealized gains (losses) on investments | | | (4.45 | ) | | | 4.69 | | | | 3.89 | | | | (1.22 | ) | | | 1.31 | |
| | | | | | | | | | | | | | | | | | | | |
Total from investment operations | | | (4.26 | ) | | | 4.90 | | | | 4.00 | | | | (1.14 | ) | | | 1.45 | |
Distributions to shareholders from | | | | | | | | | | | | | | | | | | | | |
Net investment income | | | (0.28 | ) | | | (0.18 | ) | | | (0.09 | ) | | | (0.11 | ) | | | 0.00 | |
Net asset value, end of period | | | $24.86 | | | | $29.40 | | | | $24.68 | | | | $20.77 | | | | $22.02 | |
Total return | | | (14.46 | )% | | | 19.90 | % | | | 13.70 | % | | | (5.13 | )% | | | 7.05 | % |
Ratios to average net assets (annualized) | | | | | | | | | | | | | | | | | | | | |
Gross expenses2 | | | 1.14 | % | | | 1.14 | % | | | 1.14 | % | | | 1.14 | % | | | 1.07 | % |
Net expenses2 | | | 0.85 | % | | | 0.99 | % | | | 1.00 | % | | | 1.00 | % | | | 1.00 | % |
Net investment income2 | | | 0.68 | % | | | 0.78 | % | | | 0.55 | % | | | 0.40 | % | | | 0.75 | % |
Supplemental data | | | | | | | | | | | | | | | | | | | | |
Portfolio turnover rate3 | | | 168 | % | | | 144 | % | | | 110 | % | | | 72 | % | | | 54 | % |
Net assets, end of period (000s omitted) | | | $33,116 | | | | $60,973 | | | | $52,072 | | | | $31,768 | | | | $16,850 | |
| 1 | Calculated based upon average shares outstanding |
| 2 | Ratios include net expenses allocated from the affiliated Master Portfolio which were as follows: |
| | | | |
Year ended May 31, 2019 | | | 0.75 | % |
Year ended May 31, 2018 | | | 0.84 | % |
Year ended May 31, 2017 | | | 0.84 | % |
Year ended May 31, 2016 | | | 0.84 | % |
Year ended May 31, 2015 | | | 0.84 | % |
| 3 | Portfolio turnover rate is calculated by multiplying the affiliated Master Portfolio’s percentage of the Fund’s total investments in securities at the end of the period by the affiliated Master Portfolio’s portfolio turnover rate. |
The accompanying notes are an integral part of these financial statements.
| | | | |
| 20 | | Wells Fargo Small Company Value Fund | | Notes to financial statements |
1. ORGANIZATION
Wells Fargo Funds Trust (the “Trust”), a Delaware statutory trust organized on March 10, 1999, is anopen-end management investment company registered under the Investment Company Act of 1940, as amended (the “1940 Act”). As an investment company, the Trust follows the accounting and reporting guidance in Financial Accounting Standards BoardAccounting Standards Codification Topic 946, Financial Services – Investment Companies. These financial statements report on the Wells Fargo Small Company Value Fund (the “Fund”) which is a diversified series of the Trust.
The Fund is a feeder fund in a master-feeder structure that invests substantially all of its assets in a single master portfolio with a substantially identical investment objective and substantially similar investment strategies. The Fund seeks to achieve its investment objective by investing substantially all of its assets in a separate diversified portfolio (the “affiliated Master Portfolio”) of Wells Fargo Master Trust, a registeredopen-end management investment company. The affiliated Master Portfolio directly acquires portfolio securities and the Fund acquires an indirect interest in those securities. The Fund accounts for its investment in the affiliated Master Portfolio as a partnership investment and records on a daily basis its share of the affiliated Master Portfolio’s income, expense and realized and unrealized gains and losses. The financial statements of the affiliated Master Portfolio for the year ended May 31, 2019 are included in this report and should be read in conjunction with the Fund’s financial statements. As of May 31, 2019, the Fund owned 47% of Wells Fargo Small Company Value Portfolio.
2. SIGNIFICANT ACCOUNTING POLICIES
The following significant accounting policies, which are consistently followed in the preparation of the financial statements of the Fund, are in conformity with U.S. generally accepted accounting principles which require management to make estimates and assumptions that affect the reported amounts of assets and liabilities, disclosure of contingent assets and liabilities at the date of the financial statements, and the reported amounts of revenues and expenses during the reporting period. Actual results could differ from those estimates.
Securities valuation
All investments are valued each business day as of the close of regular trading on the New York Stock Exchange (generally 4 p.m. Eastern Time), although the Fund may deviate from this calculation time under unusual or unexpected circumstances.
Investments in the affiliated Master Portfolio are valued daily based on the Fund’s proportionate share of the affiliated Master Portfolio’s net assets, which are also valued daily. Securities held in the affiliated Master Portfolio are valued as discussed in the Notes to Financial Statements of the affiliated Master Portfolio, which are included elsewhere in this report.
Investment transactions, income and expenses
Investments in the affiliated Master Portfolio are recorded on a trade basis. The Fund records daily its proportionate share of the affiliated Master Portfolio’s dividend income, expenses and realized and unrealized gains or losses. The Fund also accrues its own expenses.
Distributions to shareholders
Distributions to shareholders from net investment income and any net realized gains are recorded on theex-dividend date and paid at least annually. Such distributions are determined in accordance with income tax regulations and may differ from U.S. generally accepted accounting principles. Dividend sources are estimated at the time of declaration. The tax character of distributions is determined as of the Fund’s fiscal year end. Therefore, a portion of the Fund’s distributions made prior to the Fund’s fiscal year end may be categorized as a tax return of capital at year end.
Federal and other taxes
The Fund intends to continue to qualify as a regulated investment company by distributing substantially all of its investment company taxable income and any net realized capital gains (after reduction for capital loss carryforwards) sufficient to relieve it from all, or substantially all, federal income taxes. Accordingly, no provision for federal income taxes was required.
The Fund’s income and federal excise tax returns and all financial records supporting those returns for the prior three fiscal years are subject to examination by the federal and Delaware revenue authorities. Management has analyzed the Fund’s tax positions taken on federal, state, and foreign tax returns for all open tax years and does not believe that there are any uncertain tax positions that require recognition of a tax liability.
| | | | | | |
| Notes to financial statements | | Wells Fargo Small Company Value Fund | | | 21 | |
As of May 31, 2019, the aggregate cost of all investments for federal income tax purposes was $79,104,190 and the unrealized gains (losses) consisted of:
| | | | |
| |
Gross unrealized gains | | $ | 0 | |
| |
Gross unrealized losses | | | (18,570,612 | ) |
| |
Net unrealized losses | | $ | (18,570,612 | ) |
As of May 31, 2019, the Fund had current year deferred post-October capital losses consisting of $3,470,691 in short-term losses and $260,535 in long-term losses which will be recognized on the first day of the following fiscal year.
Class allocations
The separate classes of shares offered by the Fund differ principally in applicable sales charges, distribution, shareholder servicing, and administration fees. Class specific expenses are charged directly to that share class. Investment income, common expenses, and realized and unrealized gains (losses) on investments are allocated daily to each class of shares based on the relative proportion of net assets of each class.
3. FAIR VALUATION MEASUREMENTS
At May 31, 2019, the affiliated Master Portfolio was measured at fair value using the net asset value per share (or its equivalent) as a practical expedient. The investment objective and the value of the affiliated Master Portfolio was as follows:
| | | | | | |
| Affiliated Master Portfolio | | Investment objective | | Value of affiliated Master
Portfolio | |
| | |
Wells Fargo Small Company Value Portfolio | | Seeks long-term capital appreciation | | $ | 60,533,578 | |
The affiliated Master Portfolio does not have a redemption period notice, can be redeemed daily and does not have any unfunded commitments.
4. TRANSACTIONS WITH AFFILIATES
Management fee
Wells Fargo Funds Management, LLC (“Funds Management”), an indirect wholly owned subsidiary of Wells Fargo & Company (“Wells Fargo”), is the manager of the Fund and provides advisory and fund-level administrative services under an investment management agreement. Under the investment management agreement, Funds Management is responsible for, among other services, implementing the investment objectives and strategies of the Fund, and providing fund-level administrative services in connection with the Fund’s operations. As long as the Fund continues to invest substantially all of its assets in a single affiliated Master Portfolio, the Fund pays Funds Management an investment management fee only for fund-level administrative services at the following annual rate based on the Fund’s average daily net assets:
| | | | |
| |
| Average daily net assets | | Management fee | |
| |
First $5 billion | | | 0.05 | % |
| |
Next $5 billion | | | 0.04 | |
| |
Over $10 billion | | | 0.03 | |
For the year ended May, 31 2019, the management fee was equivalent to an annual rate of 0.05% of the Fund’s average daily net assets.
Funds Management also serves as the adviser to the affiliated Master Portfolio and is entitled to receive a fee from the affiliated Master Portfolio for those services.
| | | | |
| 22 | | Wells Fargo Small Company Value Fund | | Notes to financial statements |
Administration fees
Under a class-level administration agreement, Funds Management provides class-level administrative services to the Fund, which includes paying fees and expenses for services provided by the transfer agent,sub-transfer agents, omnibus account servicers and record-keepers. As compensation for its services under the class-level administration agreement, Funds Management receives an annual fee which is calculated based on the average daily net assets of each class as follows:
| | | | |
| | | Class-level administration fee | |
| |
Class A, Class C | | | 0.21 | % |
| |
Class R6 | | | 0.03 | |
| |
Administrator Class, Institutional Class | | | 0.13 | |
Funds Management has contractually waived and/or reimbursed management and administration fees to the extent necessary to maintain certain net operating expense ratios for the Fund. When each class of the Fund has exceeded its expense cap, Funds Management has waived fees and/or reimbursed expenses from fund level expenses on a proportionate basis and then from class specific expenses. When only certain classes exceed their expense caps, waivers and/or reimbursements are applied against class specific expenses before fund level expenses. Net expenses from the affiliated Master Portfolio are included in the expense caps. Funds Management has committed through September 30, 2019 to waive fees and/or reimburse expenses to the extent necessary to cap the Fund’s expenses at 1.15% for Class A shares and 1.90% for Class C shares, 0.75% for Class R6 shares, 1.05% for Administrator Class shares, and 0.85% for Institutional Class shares. Prior to or after the commitment expiration date, the cap may be increased or the commitment to maintain the cap may be terminated only with the approval of the Board of Trustees.
Distribution fee
The Trust has adopted a distribution plan for Class C shares of the Fund pursuant to Rule12b-1 under the 1940 Act. A distribution fee is charged to Class C shares and paid to Wells Fargo Funds Distributor, LLC (“Funds Distributor”), the principal underwriter, at an annual rate of 0.75% of the average daily net assets of Class C shares.
In addition, Funds Distributor is entitled to receive thefront-end sales charge from the purchase of Class A shares and a contingent deferred sales charge on the redemption of certain Class A shares. Funds Distributor is also entitled to receive the contingent deferred sales charges from redemptions of Class C shares. For the year ended May 31, 2019, Funds Distributor received $1,375 from the sale of Class A shares and $13 in contingent deferred sales charges from redemptions of Class C shares. No contingent deferred sales charges were incurred by Class A shares for the year ended May 31, 2019.
Shareholder servicing fees
The Trust has entered into contracts with one or more shareholder servicing agents, whereby Class A, Class C, and Administrator Class of the Fund are charged a fee at an annual rate of 0.25% of the average daily net assets of each respective class. A portion of these total shareholder servicing fees were paid to affiliates of Wells Fargo.
5. INVESTMENT PORTFOLIO TRANSACTIONS
The Fund seeks to achieve its investment objective by investing substantially all of its assets in a single affiliated Master Portfolio. Purchases and sales have been calculated by multiplying the Fund’s ownership percentage of the affiliated Master Portfolio by the affiliated Master Portfolio’s purchases and sales. Purchases and sales of investments, excluding short-term securities, for the year ended May 31, 2019 were $136,180,034 and $136,307,131, respectively.
6. BANK BORROWINGS
The Trust (excluding the money market funds), Wells Fargo Master Trust and Wells Fargo Variable Trust are parties to a $280,000,000 revolving credit agreement whereby the Fund is permitted to use bank borrowings for temporary or emergency purposes, such as to fund shareholder redemption requests. Interest under the credit agreement is charged to the Fund based on a borrowing rate equal to the higher of the Federal Funds rate in effect on that day plus 1.25% or the overnight LIBOR rate in effect on that day plus 1.25%. In addition, an annual commitment fee equal to 0.25% of the unused balance is allocated to each participating fund.
For the year ended May 31, 2019, there were no borrowings by the Fund under the agreement.
| | | | | | |
| Notes to financial statements | | Wells Fargo Small Company Value Fund | | | 23 | |
7. DISTRIBUTIONS TO SHAREHOLDERS
The tax character of distributions paid was $534,952 and $721,901 of ordinary income for the years ended May 31, 2019 and May 31, 2018, respectively.
As of May 31, 2019, the components of distributable earnings on a tax basis were as follows:
| | | | |
Undistributed ordinary income | | Unrealized losses | | Post-October capital losses deferred |
| | |
| $396,024 | | $(18,570,612) | | $(3,731,226) |
Effective for all filings after November 4, 2018, the Securities and Exchange Commission eliminated the requirement to separately state the components of distributions to shareholders under U.S. generally accepted accounting principles. The amounts of distributions to shareholders for the year ended May 31, 2018 were as follows:
| | | | |
| | | Net investment income | |
| |
Class A | | $ | 52,718 | |
| |
Class R6 | | | 2,568 | |
| |
Administrator Class | | | 283,478 | |
| |
Institutional Class | | | 383,137 | |
8. CONCENTRATION RISK
Concentration risks result from exposure to a limited number of sectors. Through its investment in the affiliated Master Portfolio which may invest a substantial portion of its assets in any sector, the Fund may in turn be more affected by changes in that sector than a fund whose investments are not heavily weighted in any sector.
9. INDEMNIFICATION
Under the Trust’s organizational documents, the officers and Trustees have been granted certain indemnification rights against certain liabilities that may arise out of performance of their duties to the Trust. Additionally, in the normal course of business, the Trust may enter into contracts with service providers that contain a variety of indemnification clauses. The Trust’s maximum exposure under these arrangements is dependent on future claims that may be made against the Fund and, therefore, cannot be estimated.
10. NEW ACCOUNTING PRONOUNCEMENT
In August 2018, FASB issued Accounting Standards Update (“ASU”)No. 2018-13, Fair Value Measurement (Topic 820)Disclosure Framework—Changes to the Disclosure Requirements for Fair Value Measurement. ASU2018-13 updates the disclosure requirements for fair value measurements by modifying or removing certain disclosures and adding certain new disclosures. The amendments are effective for fiscal years, and interim periods within those fiscal years, beginning after December 15, 2019. Early adoption is permitted. Management has adopted the removal and modification of disclosures early, as permitted, and will adopt the additional new disclosures at the effective date.
| | | | |
| 24 | | Wells Fargo Small Company Value Fund | | Report of independent registered public accounting firm |
TO THE SHAREHOLDERS OF THE FUND AND BOARD OF TRUSTEES OF WELLS FARGO FUNDS TRUST:
Opinion on the Financial Statements
We have audited the accompanying statement of assets and liabilities of Wells Fargo Small Company Value Fund (the Fund), one of the funds constituting Wells Fargo Funds Trust, including the portfolio of investments, as of May 31, 2019, the related statement of operations for the year then ended, the statements of changes in net assets for each of the years in the two-year period then ended, and the related notes (collectively, the financial statements) and the financial highlights for each of the years or periods in the five-year period then ended. In our opinion, the financial statements and financial highlights present fairly, in all material respects, the financial position of the Fund as of May 31, 2019, the results of its operations for the year then ended, the changes in its net assets for each of the years in the two-year period then ended, and the financial highlights for each of the years or periods in the five-year period then ended, in conformity with U.S. generally accepted accounting principles.
Basis for Opinion
These financial statements and financial highlights are the responsibility of the Fund’s management. Our responsibility is to express an opinion on these financial statements and financial highlights based on our audits. We are a public accounting firm registered with the Public Company Accounting Oversight Board (United States) (PCAOB) and are required to be independent with respect to the Fund in accordance with the U.S. federal securities laws and the applicable rules and regulations of the Securities and Exchange Commission and the PCAOB.
We conducted our audits in accordance with the standards of the PCAOB. Those standards require that we plan and perform the audit to obtain reasonable assurance about whether the financial statements and financial highlights are free of material misstatement, whether due to error or fraud. Our audits included performing procedures to assess the risks of material misstatement of the financial statements and financial highlights, whether due to error or fraud, and performing procedures that respond to those risks. Such procedures included examining, on a test basis, evidence regarding the amounts and disclosures in the financial statements and financial highlights. Such procedures also included confirmation of securities owned as of May 31, 2019, by correspondence with the transfer agent. Our audits also included evaluating the accounting principles used and significant estimates made by management, as well as evaluating the overall presentation of the financial statements and financial highlights. We believe that our audits provide a reasonable basis for our opinion.

We have not been able to determine the specific year that we began serving as the auditor of one or more Wells Fargo Funds investment companies; however we are aware that we have served as the auditor of one or more Wells Fargo Funds investment companies since at least 1955.
Boston, Massachusetts
July 26, 2019
| | | | | | |
| Portfolio of investments—May 31, 2019 | | Wells Fargo Small Company Value Portfolio | | | 25 | |
| | | | | | | | | | | | | | | | |
| Security name | | | | | | | | Shares | | | Value | |
| | | | |
Common Stocks: 98.81% | | | | | | | | | | | | | | | | |
| | | | |
Communication Services: 0.44% | | | | | | | | | | | | | | | | |
| | | | |
| Media: 0.44% | | | | | | | | | | | | | | | | |
| | | | |
Entercom Communications Corporation | | | | | | | | | | | 32,952 | | | $ | 190,792 | |
| | | | |
WideOpenWest Incorporated † | | | | | | | | | | | 50,165 | | | | 374,231 | |
| | | | |
| | | | | | | | | | | | | | | 565,023 | |
| | | | | | | | | | | | | | | | |
| | | | |
Consumer Discretionary: 9.77% | | | | | | | | | | | | | | | | |
| | | | |
| Auto Components: 0.03% | | | | | | | | | | | | | | | | |
| | | | |
Horizon Global Corporation † | | | | | | | | | | | 8,976 | | | | 36,443 | |
| | | | | | | | | | | | | | | | |
| | | | |
| Diversified Consumer Services: 0.69% | | | | | | | | | | | | | | | | |
| | | | |
Collectors Universe Incorporated | | | | | | | | | | | 41,800 | | | | 879,472 | |
| | | | | | | | | | | | | | | | |
| | | | |
| Hotels, Restaurants & Leisure: 1.50% | | | | | | | | | | | | | | | | |
| | | | |
Dine Brands Global Incorporated | | | | | | | | | | | 15,229 | | | | 1,437,922 | |
| | | | |
El Pollo Loco Holdings Incorporated † | | | | | | | | | | | 6,999 | | | | 73,350 | |
| | | | |
Noodles & Company † | | | | | | | | | | | 35,415 | | | | 256,050 | |
| | | | |
Red Lion Hotels Corporation † | | | | | | | | | | | 18,601 | | | | 140,996 | |
| | | | |
| | | | | | | | | | | | | | | 1,908,318 | |
| | | | | | | | | | | | | | | | |
| | | | |
| Household Durables: 2.46% | | | | | | | | | | | | | | | | |
| | | | |
Cavco Industries Incorporated † | | | | | | | | | | | 5,371 | | | | 771,276 | |
| | | | |
Helen of Troy Limited † | | | | | | | | | | | 9,752 | | | | 1,302,965 | |
| | | | |
Hooker Furniture Corporation | | | | | | | | | | | 39,797 | | | | 1,067,754 | |
| | | | |
| | | | | | | | | | | | | | | 3,141,995 | |
| | | | | | | | | | | | | | | | |
| | | | |
| Leisure Products: 1.44% | | | | | | | | | | | | | | | | |
| | | | |
Johnson Outdoors Incorporated Class A | | | | | | | | | | | 16,367 | | | | 1,208,048 | |
| | | | |
Malibu Boats Incorporated Class A † | | | | | | | | | | | 17,536 | | | | 629,542 | |
| | | | |
| | | | | | | | | | | | | | | 1,837,590 | |
| | | | | | | | | | | | | | | | |
| | | | |
| Specialty Retail: 1.64% | | | | | | | | | | | | | | | | |
| | | | |
Dick’s Sporting Goods Incorporated | | | | | | | | | | | 33,001 | | | | 1,138,865 | |
| | | | |
Shoe Carnival Incorporated « | | | | | | | | | | | 37,087 | | | | 952,765 | |
| | | | |
| | | | | | | | | | | | | | | 2,091,630 | |
| | | | | | | | | | | | | | | | |
| | | | |
| Textiles, Apparel & Luxury Goods: 2.01% | | | | | | | | | | | | | | | | |
| | | | |
Carter’s Incorporated | | | | | | | | | | | 10,801 | | | | 908,472 | |
| | | | |
Charles & Colvard Limited † | | | | | | | | | | | 142,017 | | | | 346,522 | |
| | | | |
Lakeland Industries Incorporated † | | | | | | | | | | | 24,175 | | | | 294,935 | |
| | | | |
Rocky Brands Incorporated | | | | | | | | | | | 41,781 | | | | 1,021,963 | |
| | | | |
| | | | | | | | | | | | | | | 2,571,892 | |
| | | | | | | | | | | | | | | | |
| | | | |
Consumer Staples: 6.07% | | | | | | | | | | | | | | | | |
| | | | |
| Food & Staples Retailing: 0.71% | | | | | | | | | | | | | | | | |
| | | | |
Ingles Markets Incorporated Class A | | | | | | | | | | | 30,476 | | | | 908,490 | |
| | | | | | | | | | | | | | | | |
The accompanying notes are an integral part of these financial statements.
| | | | |
| 26 | | Wells Fargo Small Company Value Portfolio | | Portfolio of investments—May 31, 2019 |
| | | | | | | | | | | | | | | | |
| Security name | | | | | | | | Shares | | | Value | |
| | | | |
| Food Products: 3.69% | | | | | | | | | | | | | | | | |
| | | | |
Cal-Maine Foods Incorporated | | | | | | | | | | | 31,328 | | | $ | 1,159,763 | |
| | | | |
Hostess Brands Incorporated † | | | | | | | | | | | 101,661 | | | | 1,361,241 | |
| | | | |
Pilgrim’s Pride Corporation † | | | | | | | | | | | 38,060 | | | | 973,194 | |
| | | | |
Sanderson Farms Incorporated | | | | | | | | | | | 8,866 | | | | 1,212,071 | |
| | | | |
| | | | | | | | | | | | | | | 4,706,269 | |
| | | | | | | | | | | | | | | | |
| | | | |
| Household Products: 1.67% | | | | | | | | | | | | | | | | |
| | | | |
Central Garden & Pet Company Ǡ | | | | | | | | | | | 44,322 | | | | 1,247,664 | |
| | | | |
Spectrum Brands Holdings Incorporated | | | | | | | | | | | 16,787 | | | | 884,171 | |
| | | | |
| | | | | | | | | | | | | | | 2,131,835 | |
| | | | | | | | | | | | | | | | |
| | | | |
Energy: 4.13% | | | | | | | | | | | | | | | | |
| | | | |
| Energy Equipment & Services: 1.77% | | | | | | | | | | | | | | | | |
| | | | |
McDermott International Incorporated Ǡ | | | | | | | | | | | 46,861 | | | | 283,040 | |
| | | | |
Newpark Resources Incorporated † | | | | | | | | | | | 160,714 | | | | 1,123,391 | |
| | | | |
Patterson-UTI Energy Incorporated | | | | | | | | | | | 80,380 | | | | 854,439 | |
| | | | |
| | | | | | | | | | | | | | | 2,260,870 | |
| | | | | | | | | | | | | | | | |
| | | | |
| Oil, Gas & Consumable Fuels: 2.36% | | | | | | | | | | | | | | | | |
| | | | |
Callon Petroleum Company † | | | | | | | | | | | 130,456 | | | | 815,350 | |
| | | | |
Southwestern Energy Company † | | | | | | | | | | | 269,016 | | | | 965,767 | |
| | | | |
Teekay Tankers Limited Class A † | | | | | | | | | | | 466,550 | | | | 522,536 | |
| | | | |
W&T Offshore Incorporated † | | | | | | | | | | | 167,621 | | | | 704,008 | |
| | | | |
| | | | | | | | | | | | | | | 3,007,661 | |
| | | | | | | | | | | | | | | | |
| | | | |
Financials: 26.19% | | | | | | | | | | | | | | | | |
| | | | |
| Banks: 15.27% | | | | | | | | | | | | | | | | |
| | | | |
Banc of California Incorporated | | | | | | | | | | | 46,034 | | | | 609,030 | |
| | | | |
Banner Corporation | | | | | | | | | | | 24,050 | | | | 1,213,563 | |
| | | | |
Customers Bancorp Incorporated † | | | | | | | | | | | 62,469 | | | | 1,231,889 | |
| | | | |
FB Financial Corporation | | | | | | | | | | | 37,544 | | | | 1,306,156 | |
| | | | |
Fidelity Southern Corporation | | | | | | | | | | | 43,415 | | | | 1,223,001 | |
| | | | |
First Foundation Incorporated | | | | | | | | | | | 70,446 | | | | 923,547 | |
| | | | |
First Interstate BancSystem Class A | | | | | | | | | | | 33,364 | | | | 1,231,465 | |
| | | | |
Great Southern Bancorp Incorporated | | | | | | | | | | | 25,183 | | | | 1,390,605 | |
| | | | |
Heritage Financial Corporation | | | | | | | | | | | 42,931 | | | | 1,206,361 | |
| | | | |
Independent Bank Corporation | | | | | | | | | | | 58,262 | | | | 1,232,241 | |
| | | | |
Midland States Bancorp Incorporated | | | | | | | | | | | 51,127 | | | | 1,252,612 | |
| | | | |
OFG Bancorp | | | | | | | | | | | 56,211 | | | | 1,055,643 | |
| | | | |
Orrstown Financial Services Incorporated | | | | | | | | | | | 21,624 | | | | 459,294 | |
| | | | |
Popular Incorporated | | | | | | | | | | | 14,240 | | | | 743,470 | |
| | | | |
Triumph Bancorp Incorporated † | | | | | | | | | | | 34,493 | | | | 968,219 | |
| | | | |
Umpqua Holdings Corporation | | | | | | | | | | | 75,569 | | | | 1,206,837 | |
| | | | |
Univest Corporation of Pennsylvania | | | | | | | | | | | 56,878 | | | | 1,358,247 | |
| | | | |
Western Alliance Bancorp † | | | | | | | | | | | 21,206 | | | | 872,627 | |
| | | | |
| | | | | | | | | | | | | | | 19,484,807 | |
| | | | | | | | | | | | | | | | |
The accompanying notes are an integral part of these financial statements.
| | | | | | |
| Portfolio of investments—May 31, 2019 | | Wells Fargo Small Company Value Portfolio | | | 27 | |
| | | | | | | | | | | | | | | | |
| Security name | | | | | | | | Shares | | | Value | |
| | | | |
| Capital Markets: 1.93% | | | | | | | | | | | | | | | | |
| | | | |
Blucora Incorporated † | | | | | | | | | | | 20,331 | | | $ | 629,651 | |
| | | | |
Och Ziff Capital Managemen Group Incorporated | | | | | | | | | | | 34,673 | | | | 628,968 | |
| | | | |
Piper Jaffray Companies Incorporated | | | | | | | | | | | 17,035 | | | | 1,206,419 | |
| | | | |
| | | | | | | | | | | | | | | 2,465,038 | |
| | | | | | | | | | | | | | | | |
| | | | |
| Consumer Finance: 0.19% | | | | | | | | | | | | | | | | |
| | | | |
Enova International Incorporated † | | | | | | | | | | | 11,633 | | | | 248,365 | |
| | | | | | | | | | | | | | | | |
| | | | |
| Insurance: 3.75% | | | | | | | | | | | | | | | | |
| | | | |
American Equity Investment Life Holding Company | | | | | | | | | | | 45,224 | | | | 1,280,291 | |
| | | | |
FBL Financial Group Incorporated | | | | | | | | | | | 18,612 | | | | 1,145,755 | |
| | | | |
National General Holdings Corporation | | | | | | | | | | | 44,458 | | | | 1,010,086 | |
| | | | |
State Auto Financial Corporation | | | | | | | | | | | 39,481 | | | | 1,349,855 | |
| | | | |
| | | | | | | | | | | | | | | 4,785,987 | |
| | | | | | | | | | | | | | | | |
|
| Mortgage REITs: 1.96% | |
| | | | |
Invesco Mortgage Capital Incorporated | | | | | | | | | | | 52,915 | | | | 814,362 | |
| | | | |
MFA Financial Incorporated | | | | | | | | | | | 118,009 | | | | 830,783 | |
| | | | |
New York Mortgage Trust Incorporated | | | | | | | | | | | 142,608 | | | | 861,352 | |
| | | | |
| | | | | | | | | | | | | | | 2,506,497 | |
| | | | | | | | | | | | | | | | |
|
| Thrifts & Mortgage Finance: 3.09% | |
| | | | |
Homestreet Incorporated † | | | | | | | | | | | 46,324 | | | | 1,317,918 | |
| | | | |
OceanFirst Financial Corporation | | | | | | | | | | | 55,378 | | | | 1,319,104 | |
| | | | |
Walker & Dunlop Incorporated | | | | | | | | | | | 25,896 | | | | 1,301,792 | |
| | | | |
| | | | | | | | | | | | | | | 3,938,814 | |
| | | | | | | | | | | | | | | | |
|
Health Care: 5.45% | |
|
| Health Care Equipment & Supplies: 0.38% | |
| | | | |
Fonar Corporation † | | | | | | | | | | | 15,437 | | | | 296,390 | |
| | | | |
LeMaitre Vascular Incorporated | | | | | | | | | | | 7,338 | | | | 189,394 | |
| | | | |
| | | | | | | | | | | | | | | 485,784 | |
| | | | | | | | | | | | | | | | |
|
| Health Care Providers & Services: 3.74% | |
| | | | |
AMN Healthcare Services Incorporated † | | | | | | | | | | | 18,435 | | | | 892,991 | |
| | | | |
BioScrip Incorporated † | | | | | | | | | | | 68,863 | | | | 142,546 | |
| | | | |
Brookdale Senior Living Incorporated † | | | | | | | | | | | 72,690 | | | | 449,224 | |
| | | | |
Ensign Group Incorporated | | | | | | | | | | | 20,106 | | | | 1,070,846 | |
| | | | |
Hanger Incorporated † | | | | | | | | | | | 54,121 | | | | 1,009,898 | |
| | | | |
LHC Group Incorporated † | | | | | | | | | | | 7,915 | | | | 896,611 | |
| | | | |
Tenet Healthcare Corporation † | | | | | | | | | | | 15,809 | | | | 315,548 | |
| | | | |
| | | | | | | | | | | | | | | 4,777,664 | |
| | | | | | | | | | | | | | | | |
|
| Pharmaceuticals: 1.33% | |
| | | | |
Akorn Incorporated † | | | | | | | | | | | 46,924 | | | | 193,327 | |
| | | | |
Phibro Animal Health Corporation Class A | | | | | | | | | | | 11,493 | | | | 339,963 | |
| | | | |
Prestige Consumer Healthcare Incorporated † | | | | | | | | | | | 40,040 | | | | 1,162,361 | |
| | | | |
| | | | | | | | | | | | | | | 1,695,651 | |
| | | | | | | | | | | | | | | | |
The accompanying notes are an integral part of these financial statements.
| | | | |
| 28 | | Wells Fargo Small Company Value Portfolio | | Portfolio of investments—May 31, 2019 |
| | | | | | | | | | | | | | | | |
| Security name | | | | | | | | Shares | | | Value | |
|
Industrials: 18.44% | |
|
| Aerospace & Defense: 0.24% | |
| | | | |
Ducommun Incorporated † | | | | | | | | | | | 6,704 | | | $ | 302,552 | |
| | | | | | | | | | | | | | | | |
|
| Airlines: 0.27% | |
| | | | |
Mesa Air Group Incorporated † | | | | | | | | | | | 37,687 | | | | 343,705 | |
| | | | | | | | | | | | | | | | |
|
| Building Products: 0.52% | |
| | | | |
Patrick Industries Incorporated † | | | | | | | | | | | 16,439 | | | | 670,547 | |
| | | | | | | | | | | | | | | | |
|
| Commercial Services & Supplies: 1.90% | |
| | | | |
ACCO Brands Corporation | | | | | | | | | | | 16,937 | | | | 124,487 | |
| | | | |
Casella Waste Systems Incorporated Class A † | | | | | | | | | | | 10,027 | | | | 388,245 | |
| | | | |
Ceco Environmental Corporation † | | | | | | | | | | | 32,582 | | | | 288,351 | |
| | | | |
Ennis Incorporated | | | | | | | | | | | 67,455 | | | | 1,249,267 | |
| | | | |
Hudson Technologies Incorporated † | | | | | | | | | | | 230,921 | | | | 369,474 | |
| | | | |
| | | | | | | | | | | | | | | 2,419,824 | |
| | | | | | | | | | | | | | | | |
|
| Construction & Engineering: 2.37% | |
| | | | |
Comfort Systems Incorporated | | | | | | | | | | | 8,821 | | | | 416,175 | |
| | | | |
Limbach Holdings Incorporated † | | | | | | | | | | | 23,756 | | | | 214,992 | |
| | | | |
MYR Group Incorporated † | | | | | | | | | | | 39,343 | | | | 1,270,385 | |
| | | | |
Sterling Construction Company Incorporated † | | | | | | | | | | | 94,080 | | | | 1,123,315 | |
| | | | |
| | | | | | | | | | | | | | | 3,024,867 | |
| | | | | | | | | | | | | | | | |
|
| Electrical Equipment: 1.56% | |
| | | | |
Encore Wire Corporation | | | | | | | | | | | 21,878 | | | | 1,091,931 | |
| | | | |
Generac Holdings Incorporated † | | | | | | | | | | | 16,431 | | | | 906,170 | |
| | | | |
| | | | | | | | | | | | | | | 1,998,101 | |
| | | | | | | | | | | | | | | | |
|
| Machinery: 4.09% | |
| | | | |
Columbus McKinnon Corporation | | | | | | | | | | | 32,130 | | | | 1,165,034 | |
| | | | |
Federal Signal Corporation | | | | | | | | | | | 18,472 | | | | 441,296 | |
| | | | |
Kadant Incorporated | | | | | | | | | | | 10,659 | | | | 865,298 | |
| | | | |
Miller Industries Incorporated | | | | | | | | | | | 32,593 | | | | 865,344 | |
| | | | |
NN Incorporated | | | | | | | | | | | 30,227 | | | | 234,259 | |
| | | | |
Spartan Motors Incorporated | | | | | | | | | | | 115,855 | | | | 999,829 | |
| | | | |
Standex International Corporation | | | | | | | | | | | 7,995 | | | | 519,995 | |
| | | | |
The Greenbrier Companies Incorporated | | | | | | | | | | | 4,559 | | | | 124,050 | |
| | | | |
| | | | | | | | | | | | | | | 5,215,105 | |
| | | | | | | | | | | | | | | | |
|
| Marine: 0.38% | |
| | | | |
Seaspan Corporation « | | | | | | | | | | | 51,703 | | | | 481,355 | |
| | | | | | | | | | | | | | | | |
|
| Professional Services: 3.85% | |
| | | | |
Barrett Business Services Incorporated | | | | | | | | | | | 7,469 | | | | 537,917 | |
| | | | |
BG Staffing Incorporated | | | | | | | | | | | 13,929 | | | | 237,072 | |
| | | | |
CBIZ Incorporated † | | | | | | | | | | | 66,405 | | | | 1,314,819 | |
| | | | |
Kelly Services Incorporated Class A | | | | | | | | | | | 48,630 | | | | 1,142,805 | |
| | | | |
Korn/Ferry International | | | | | | | | | | | 24,418 | | | | 1,051,927 | |
| | | | |
WageWorks Incorporated † | | | | | | | | | | | 12,553 | | | | 627,273 | |
| | | | |
| | | | | | | | | | | | | | | 4,911,813 | |
| | | | | | | | | | | | | | | | |
The accompanying notes are an integral part of these financial statements.
| | | | | | |
| Portfolio of investments—May 31, 2019 | | Wells Fargo Small Company Value Portfolio | | | 29 | |
| | | | | | | | | | | | | | | | |
| Security name | | | | | | | | Shares | | | Value | |
|
| Road & Rail: 1.04% | |
| | | | |
Genesee & Wyoming Incorporated Class A † | | | | | | | | | | | 13,970 | | | $ | 1,330,223 | |
| | | | | | | | | | | | | | | | |
|
| Trading Companies & Distributors: 2.22% | |
| | | | |
CAI International Incorporated † | | | | | | | | | | | 52,696 | | | | 1,186,714 | |
| | | | |
DXP Enterprises Incorporated † | | | | | | | | | | | 33,165 | | | | 1,068,576 | |
| | | | |
Fly Leasing Limited ADR † | | | | | | | | | | | 35,582 | | | | 577,852 | |
| | | | |
| | | | | | | | | | | | | | | 2,833,142 | |
| | | | | | | | | | | | | | | | |
|
Information Technology: 10.28% | |
|
| Communications Equipment: 0.67% | |
| | | | |
Lumentum Holdings Incorporated † | | | | | | | | | | | 15,098 | | | | 611,016 | |
| | | | |
Plantronics Incorporated | | | | | | | | | | | 5,913 | | | | 242,847 | |
| | | | |
| | | | | | | | | | | | | | | 853,863 | |
| | | | | | | | | | | | | | | | |
|
| Electronic Equipment, Instruments & Components: 3.55% | |
| | | | |
Eplus Incorporated † | | | | | | | | | | | 14,032 | | | | 991,501 | |
| | | | |
Insight Enterprises Incorporated † | | | | | | | | | | | 23,928 | | | | 1,231,813 | |
| | | | |
Methode Electronics Incorporated | | | | | | | | | | | 25,881 | | | | 637,449 | |
| | | | |
Napco Security Technologies Incorporated † | | | | | | | | | | | 21,326 | | | | 569,831 | |
| | | | |
PC Connection Incorporated | | | | | | | | | | | 34,765 | | | | 1,103,441 | |
| | | | |
| | | | | | | | | | | | | | | 4,534,035 | |
| | | | | | | | | | | | | | | | |
|
| IT Services: 2.09% | |
| | | | |
Conduent Incorporated † | | | | | | | | | | | 103,045 | | | | 917,101 | |
| | | | |
Hackett Group Incorporated | | | | | | | | | | | 36,185 | | | | 582,217 | |
| | | | |
TTEC Holdings Incorporated | | | | | | | | | | | 29,513 | | | | 1,171,076 | |
| | | | |
| | | | | | | | | | | | | | | 2,670,394 | |
| | | | | | | | | | | | | | | | |
|
| Semiconductors & Semiconductor Equipment: 2.69% | |
| | | | |
Cohu Incorporated | | | | | | | | | | | 25,695 | | | | 373,862 | |
| | | | |
Entegris Incorporated | | | | | | | | | | | 20,707 | | | | 711,078 | |
| | | | |
FormFactor Incorporated † | | | | | | | | | | | 74,337 | | | | 1,067,479 | |
| | | | |
Rudolph Technologies Incorporated † | | | | | | | | | | | 55,535 | | | | 1,281,192 | |
| | | | |
| | | | | | | | | | | | | | | 3,433,611 | |
| | | | | | | | | | | | | | | | |
|
| Software: 1.28% | |
| | | | |
American Software Incorporated Class A | | | | | | | | | | | 39,398 | | | | 499,173 | |
| | | | |
GlobalSCAPE Incorporated | | | | | | | | | | | 22,751 | | | | 207,944 | |
| | | | |
Nuance Communications Incorporated † | | | | | | | | | | | 53,955 | | | | 926,407 | |
| | | | |
| | | | | | | | | | | | | | | 1,633,524 | |
| | | | | | | | | | | | | | | | |
|
Materials: 4.92% | |
|
| Chemicals: 1.46% | |
| | | | |
Advansix Incorporated † | | | | | | | | | | | 22,842 | | | | 556,888 | |
| | | | |
Stepan Company | | | | | | | | | | | 15,440 | | | | 1,310,238 | |
| | | | |
| | | | | | | | | | | | | | | 1,867,126 | |
| | | | | | | | | | | | | | | | |
The accompanying notes are an integral part of these financial statements.
| | | | |
| 30 | | Wells Fargo Small Company Value Portfolio | | Portfolio of investments—May 31, 2019 |
| | | | | | | | | | | | | | | | |
| Security name | | | | | | | | Shares | | | Value | |
|
| Construction Materials: 0.85% | |
| | | | |
Eagle Materials Incorporated | | | | | | | | | | | 12,599 | | | $ | 1,084,270 | |
| | | | | | | | | | | | | | | | |
|
| Metals & Mining: 1.65% | |
| | | | |
Kaiser Aluminum Corporation | | | | | | | | | | | 12,247 | | | | 1,091,453 | |
| | | | |
Schnitzer Steel Industries Incorporated Class A | | | | | | | | | | | 47,924 | | | | 1,011,676 | |
| | | | |
| | | | | | | | | | | | | | | 2,103,129 | |
| | | | | | | | | | | | | | | | |
|
| Paper & Forest Products: 0.96% | |
| | | | |
PH Glatfelter Company | | | | | | | | | | | 18,387 | | | | 268,082 | |
| | | | |
Verso Corporation Class A † | | | | | | | | | | | 55,747 | | | | 959,963 | |
| | | | |
| | | | | | | | | | | | | | | 1,228,045 | |
| | | | | | | | | | | | | | | | |
|
Real Estate: 6.77% | |
|
| Equity REITs: 6.38% | |
| | | | |
Armada Hoffler Properties Incorporated | | | | | | | | | | | 88,940 | | | | 1,467,510 | |
| | | | |
CareTrust REIT Incorporated | | | | | | | | | | | 43,138 | | | | 1,048,685 | |
| | | | |
Global Medical REIT Incorporated | | | | | | | | | | | 53,964 | | | | 575,256 | |
| | | | |
Independence Realty Trust Incorporated | | | | | | | | | | | 131,564 | | | | 1,444,573 | |
| | | | |
Monmouth Real Estate Investment Corporation | | | | | | | | | | | 88,138 | | | | 1,228,644 | |
| | | | |
One Liberty Properties Incorporated | | | | | | | | | | | 50,335 | | | | 1,436,561 | |
| | | | |
PotlatchDeltic Corporation | | | | | | | | | | | 27,881 | | | | 938,196 | |
| | | | |
| | | | | | | | | | | | | | | 8,139,425 | |
| | | | | | | | | | | | | | | | |
| | | | |
| Real Estate Management & Development: 0.39% | | | | | | | | | | | | | | | | |
| | | | |
Marcus & Millichap Incorporated † | | | | | | | | | | | 16,408 | | | | 501,100 | |
| | | | | | | | | | | | | | | | |
| | | | |
Utilities: 6.35% | | | | | | | | | | | | | | | | |
| | | | |
| Electric Utilities: 2.36% | | | | | | | | | | | | | | | | |
| | | | |
Hawaiian Electric Industries Incorporated | | | | | | | | | | | 35,697 | | | | 1,482,853 | |
| | | | |
Otter Tail Corporation | | | | | | | | | | | 30,741 | | | | 1,526,905 | |
| | | | |
| | | | | | | | | | | | | | | 3,009,758 | |
| | | | | | | | | | | | | | | | |
| | | | |
| Gas Utilities: 2.23% | | | | | | | | | | | | | | | | |
| | | | |
National Fuel Gas Company | | | | | | | | | | | 24,001 | | | | 1,279,493 | |
| | | | |
Northwest Natural Holding Company | | | | | | | | | | | 22,721 | | | | 1,563,659 | |
| | | | |
| | | | | | | | | | | | | | | 2,843,152 | |
| | | | | | | | | | | | | | | | |
| | | | |
| Multi-Utilities: 1.08% | | | | | | | | | | | | | | | | |
| | | | |
MDU Resources Group Incorporated | | | | | | | | | | | 55,806 | | | | 1,377,292 | |
| | | | | | | | | | | | | | | | |
| | | | |
| Water Utilities: 0.68% | | | | | | | | | | | | | | | | |
| | | | |
Artesian Resources Corporation Class A | | | | | | | | | | | 24,394 | | | | 868,670 | |
| | | | | | | | | | | | | | | | |
| | | | |
Total Common Stocks (Cost $129,787,868) | | | | | | | | | | | | | | | 126,114,723 | |
| | | | | | | | | | | | | | | | |
| | | | |
Exchange-Traded Funds: 0.53% | | | | | | | | | | | | | | | | |
| | | | |
iShares Russell 2000 Index ETF | | | | | | | | | | | 4,600 | | | | 670,956 | |
| | | | | | | | | | | | | | | | |
| | | | |
Total Exchange-Traded Funds (Cost $723,470) | | | | | | | | | | | | | | | 670,956 | |
| | | | | | | | | | | | | | | | |
The accompanying notes are an integral part of these financial statements.
| | | | | | |
| Portfolio of investments—May 31, 2019 | | Wells Fargo Small Company Value Portfolio | | | 31 | |
| | | | | | | | | | | | | | | | |
| Security name | | Yield | | | | | | Shares | | | Value | |
| | | | |
Short-Term Investments: 2.13% | | | | | | | | | | | | | | | | |
| | | | |
| Investment Companies: 2.13% | | | | | | | | | | | | | | | | |
| | | | |
Securities Lending Cash Investments LLC (l)(r)(u) | | | 2.51 | % | | | | | | | 2,006,789 | | | $ | 2,006,990 | |
| | | | |
Wells Fargo Government Money Market Fund Select Class (I)(u) | | | 2.30 | | | | | | | | 718,186 | | | | 718,186 | |
| | | | |
Total Short-Term Investments (Cost $2,724,996) | | | | | | | | | | | | | | | 2,725,176 | |
| | | | | | | | | | | | | | | | |
| | | | | | | | |
| Total investments in securities (Cost $133,236,334) | | | 101.47 | % | | | 129,510,855 | |
| | |
Other assets and liabilities, net | | | (1.47 | ) | | | (1,880,436 | ) |
| | | | | | | | |
| Total net assets | | | 100.00 | % | | $ | 127,630,419 | |
| | | | | | | | |
| † | Non-income-earning security |
| « | All or a portion of this security is on loan. |
| (l) | The issuer of the security is an affiliated person of the Portfolio as defined in the Investment Company Act of 1940. |
| (r) | The investment is anon-registered investment company purchased with cash collateral received from securities on loan. |
| (u) | The rate represents the7-day annualized yield at period end. |
Abbreviations:
| ADR | American depositary receipt |
| REIT | Real estate investment trust |
Investments in Affiliates
An affiliated investment is an investment in which the Portfolio owns at least 5% of the outstanding voting shares of the issuer or as a result of other relationships, such as the Portfolio and the issuer having the same adviser or investment manager. Transactions with issuers that were either affiliated persons of the Portfolio at the beginning of the period or the end of the period were as follows:
| | | | | | | | | | | | | | | | | | | | | | | | | | | | | | | | | | | | |
| | | Shares,
beginning of
period | | | Shares
purchased | | | Shares
sold | | | Shares,
end of
period | | | Net
realized
gains
(losses) | | | Net
change in unrealized gains (losses) | | | Income from affiliated securities | | | Value, end of period | | | % of
net
assets | |
Short-Term Investments | | | | | | | | | | | | | | | | | | | | | | | | | | | | | | | | | | | | |
Investment Companies | | | | | | | | | | | | | | | | | | | | | | | | | | | | | | | | | | | | |
Securities Lending Cash Investments LLC | | | 5,546,867 | | | | 76,423,623 | | | | 79,963,701 | | | | 2,006,789 | | | $ | (328 | ) | | $ | (172 | ) | | $ | 134,621 | | | $ | 2,006,990 | | | | | |
Wells Fargo Government Money Market Fund Select Class | | | 851,216 | | | | 133,591,983 | | | | 133,725,013 | | | | 718,186 | | | | 0 | | | | 0 | | | | 26,900 | | | | 718,186 | | | | | |
| | | | | | | | | | | | | | | | | | | | | | | | | | | | | | | | | | | | |
| | | | | | | | | |
| | | | | | | | | | | | | | | | | | $ | (328 | ) | | $ | (172 | ) | | $ | 161,521 | | | $ | 2,725,176 | | | | 2.13 | % |
| | | | | | | | | | | | | | | | | | | | | | | | | | | | | | | | | | | | |
The accompanying notes are an integral part of these financial statements.
| | | | |
| 32 | | Wells Fargo Small Company Value Portfolio | | Statement of assets and liabilities—May 31, 2019 |
| | | | |
| | | | |
| |
Assets | | | | |
Investments in unaffiliated securities (including $1,924,347 of security loaned), at value (cost $130,511,338) | | $ | 126,785,679 | |
Investments in affiliated securities, at value (cost $2,724,996) | | | 2,725,176 | |
Receivable for investments sold | | | 846,926 | |
Receivable for dividends | | | 101,213 | |
Receivable for securities lending income, net | | | 3,271 | |
Prepaid expenses and other assets | | | 16,551 | |
| | | | |
Total assets | | | 130,478,816 | |
| | | | |
| |
Liabilities | | | | |
Payable upon receipt of securities loaned | | | 2,006,773 | |
Payable for investments purchased | | | 588,674 | |
Overdraft due to custodian bank | | | 156,444 | |
Advisory fee payable | | | 81,775 | |
Accrued expenses and other liabilities | | | 14,731 | |
| | | | |
Total liabilities | | | 2,848,397 | |
| | | | |
Total net assets | | $ | 127,630,419 | |
| | | | |
The accompanying notes are an integral part of these financial statements.
| | | | | | |
| Statement of operations—year ended May 31, 2019 | | Wells Fargo Small Company Value Portfolio | | | 33 | |
| | | | |
| | | | |
| |
Investment income | | | | |
Dividends (net of foreign withholding taxes of $3,550) | | $ | 2,578,744 | |
Income from affiliated securities | | | 137,210 | |
| | | | |
Total investment income | | | 2,715,954 | |
| | | | |
| |
Expenses | | | | |
Advisory fee | | | 1,401,687 | |
Custody and accounting fees | | | 23,282 | |
Professional fees | | | 43,785 | |
Shareholder report expenses | | | 2,797 | |
Trustees’ fees and expenses | | | 20,578 | |
Other fees and expenses | | | 6,995 | |
| | | | |
Total expenses | | | 1,499,124 | |
Less: Fee waivers and/or expense reimbursements | | | (188,541 | ) |
| | | | |
Net expenses | | | 1,310,583 | |
| | | | |
Net investment income | | | 1,405,371 | |
| | | | |
| |
REALIZED AND UNREALIZED GAINS (LOSSES) ON INVESTMENTS | | | | |
| |
Net realized losses on: | | | | |
Unaffiliated securities | | | (20,261,005 | ) |
Affiliated securities | | | (328 | ) |
| | | | |
Net realized losses on investments | | | (20,261,333 | ) |
| | | | |
| |
Net change in unrealized gains (losses) on: | | | | |
Unaffiliated securities | | | (10,952,580 | ) |
Affiliated securities | | | (172 | ) |
| | | | |
Net change in unrealized gains (losses) on investments | | | (10,952,752 | ) |
| | | | |
Net realized and unrealized gains (losses) on investments | | | (31,214,085 | ) |
| | | | |
Net decrease in net assets resulting from operations | | $ | (29,808,714 | ) |
| | | | |
The accompanying notes are an integral part of these financial statements.
| | | | |
| 34 | | Wells Fargo Small Company Value Portfolio | | Statement of changes in net assets |
| | | | | | | | |
| | | Year ended
May 31, 2019 | | | Year ended
May 31, 2018 | |
| | |
Operations | | | | | | | | |
Net investment income | | $ | 1,405,371 | | | $ | 1,619,419 | |
Net realized gains (losses) on investments | | | (20,261,333 | ) | | | 56,399,955 | |
Net change in unrealized gains (losses) on investments | | | (10,952,752 | ) | | | (24,205,675 | ) |
| | | | |
Net increase (decrease) in net assets resulting from operations | | | (29,808,714 | ) | | | 33,813,699 | |
| | | | |
| | |
Capital transactions | | | | | | | | |
Transactions in investors’ beneficial interests | | | | | | | | |
Contributions | | | 110,246,678 | | | | 10,857,996 | |
Withdrawals | | | (112,205,990 | ) | | | (99,498,049 | ) |
| | | | |
Net decrease in net assets resulting from capital transactions | | | (1,959,312 | ) | | | (88,640,053 | ) |
| | | | |
Total decrease in net assets | | | (31,768,026 | ) | | | (54,826,354 | ) |
| | | | |
| | |
Net assets | | | | | | | | |
Beginning of period | | | 159,398,445 | | | | 214,224,799 | |
| | | | |
End of period | | $ | 127,630,419 | | | $ | 159,398,445 | |
| | | | |
The accompanying notes are an integral part of these financial statements.
| | | | | | |
| Financial highlights | | Wells Fargo Small Company Value Portfolio | | | 35 | |
| | | | | | | | | | | | | | | | | | | | |
| | | Year ended May 31 | |
| | | 2019 | | | 2018 | | | 2017 | | | 2016 | | | 2015 | |
Total return | | | (14.51 | )% | | | 20.10 | % | | | 19.44 | % | | | (4.96 | )% | | | 7.29 | % |
Ratios to average net assets (annualized) | | | | | | | | | | | | | | | | | | | | |
Gross expenses | | | 0.86 | % | | | 0.85 | % | | | 0.84 | % | | | 0.85 | % | | | 0.84 | % |
Net expenses | | | 0.75 | % | | | 0.84 | % | | | 0.84 | % | | | 0.85 | % | | | 0.84 | % |
Net investment income | | | 0.80 | % | | | 0.87 | % | | | 0.72 | % | | | 0.62 | % | | | 0.89 | % |
Supplemental data | | | | | | | | | | | | | | | | | | | | |
Portfolio turnover rate | | | 168 | % | | | 144 | % | | | 110 | % | | | 72 | % | | | 54 | % |
The accompanying notes are an integral part of these financial statements.
| | | | |
| 36 | | Wells Fargo Small Company Value Portfolio | | Notes to financial statements |
1. ORGANIZATION
Wells Fargo Master Trust (the “Trust”), a Delaware statutory trust organized on March 10, 1999, is anopen-end management investment company registered under the Investment Company Act of 1940, as amended (the “1940 Act”). As an investment company, the Trust follows the accounting and reporting guidance in Financial Accounting Standards BoardAccounting Standards Codification Topic 946, Financial Services – Investment Companies. These financial statements report on the Wells Fargo Small Company Value Portfolio (the “Portfolio”) which is a diversified series of the Trust.
2. SIGNIFICANT ACCOUNTING POLICIES
The following significant accounting policies, which are consistently followed in the preparation of the financial statements of the Portfolio, are in conformity with U.S. generally accepted accounting principles which require management to make estimates and assumptions that affect the reported amounts of assets and liabilities, disclosure of contingent assets and liabilities at the date of the financial statements, and the reported amounts of revenues and expenses during the reporting period. Actual results could differ from those estimates.
Securities valuation
All investments are valued each business day as of the close of regular trading on the New York Stock Exchange (generally 4 p.m. Eastern Time), although the Portfolio may deviate from this calculation time under unusual or unexpected circumstances.
Equity securities that are listed on a foreign or domestic exchange or market are valued at the official closing price or, if none, the last sales price. If no sale occurs on the principal exchange or market that day, a fair value price will be determined in accordance with the Portfolio’s Valuation Procedures.
Investments in registeredopen-end investment companies are valued at net asset value. Interests innon-registered investment companies that are redeemable at net asset value are fair valued normally at net asset value.
Investments which are not valued using any of the methods discussed above are valued at their fair value, as determined in good faith by the Board of Trustees of the Portfolio. The Board of Trustees has established a Valuation Committee comprised of the Trustees and has delegated to it the authority to take any actions regarding the valuation of portfolio securities that the Valuation Committee deems necessary or appropriate, including determining the fair value of portfolio securities, unless the determination has been delegated to the Wells Fargo Asset Management Pricing Committee at Wells Fargo Funds Management, LLC (“Funds Management”). The Board of Trustees retains the authority to make or ratify any valuation decisions or approve any changes to the Valuation Procedures as it deems appropriate. On a quarterly basis, the Board of Trustees receives reports on any valuation actions taken by the Valuation Committee or the Wells Fargo Asset Management Pricing Committee which may include items for ratification.
Securities lending
The Portfolio may lend its securities from time to time in order to earn additional income in the form of fees or interest on securities received as collateral or the investment of any cash received as collateral. When securities are on loan, the Portfolio receives interest or dividends on the securities loaned. The Portfolio receives collateral in the form of cash or securities with a value at least equal to the value of the securities on loan. The value of the loaned securities is determined at the close of each business day and any additional required collateral is delivered to the Portfolio on the next business day. In a securities lending transaction, the net asset value of the Portfolio will be affected by an increase or decrease in the value of the securities loaned and by an increase or decrease in the value of the instrument in which collateral is invested. The amount of securities lending activity undertaken by the Portfolio fluctuates from time to time. In the event of default or bankruptcy by the borrower, the Portfolio may be prevented from recovering the loaned securities or gaining access to the collateral or may experience delays or costs in doing so. In addition, the investment of any cash collateral received may lose all or part of its value. The Portfolio has the right under the lending agreement to recover the securities from the borrower on demand.
The Portfolio lends its securities through an unaffiliated securities lending agent. Cash collateral received in connection with its securities lending transactions is invested in Securities Lending Cash Investments, LLC (the “Securities Lending Fund”). The Securities Lending Fund is exempt from registration under Section 3(c)(7) of the 1940 Act and is managed by Funds Management and is subadvised by Wells Capital Management Incorporated (“WellsCap”), an affiliate of Funds Management and an indirect wholly owned subsidiary of Wells Fargo & Company (“Wells Fargo”). Funds Management receives an advisory fee starting at 0.05% and declining to 0.01% as the average daily net assets of the Securities Lending Fund increase. All of the fees received by Funds Management are paid to WellsCap for its services as subadviser. The Securities Lending Fund seeks to provide a positive return compared to the daily Fed Funds Open Rate by investing in
| | | | | | |
| Notes to financial statements | | Wells Fargo Small Company Value Portfolio | | | 37 | |
high-quality, U.S. dollar-denominated short-term money market instruments. Securities Lending Fund investments are valued at the evaluated bid price provided by an independent pricing service. Income earned from investment in the Securities Lending Fund (net of fees and rebates), if any, is included in income from affiliated securities on the Statement of Operations.
Security transactions and income recognition
Securities transactions are recorded on a trade date basis. Realized gains or losses are recorded on the basis of identified cost.
Dividend income is recognized on theex-dividend date. Dividend income is recorded net of foreign taxes withheld where recovery of such taxes is not assured.
Federal and other taxes
The Portfolio is treated as a separate entity for federal income tax purposes. The Portfolio is not required to pay federal income taxes on its net investment income and net capital gains as it is treated as a partnership for federal income tax purposes. All dividends, gains and losses of the Portfolio are deemed to have been “passed through” to the interest holders in proportion to their holdings of the Portfolio regardless of whether such dividends and gains have been distributed by the Portfolio.
The Portfolio’s income tax returns and all financial records supporting those returns for the prior three fiscal years are subject to examination by the federal revenue authority. Management has analyzed the Portfolio’s tax positions taken on federal, state, and foreign tax returns for all open tax years and does not believe that there are any uncertain tax positions that require recognition of a tax liability.
As of May 31, 2019, the aggregate cost of all investments for federal income tax purposes was $137,451,953 and the unrealized gains (losses) consisted of:
| | | | |
| |
Gross unrealized gains | | $ | 6,468,519 | |
| |
Gross unrealized losses | | | (14,409,617 | ) |
| |
Net unrealized losses | | $ | (7,941,098 | ) |
3. FAIR VALUATION MEASUREMENTS
Fair value measurements of investments are determined within a framework that has established a fair value hierarchy based upon the various data inputs utilized in determining the value of the Portfolio’s investments. The three-level hierarchy gives the highest priority to unadjusted quoted prices in active markets for identical assets or liabilities (Level 1) and the lowest priority to unobservable inputs (Level 3). The Portfolio’s investments are classified within the fair value hierarchy based on the lowest level of input that is significant to the fair value measurement. The inputs are summarized into three broad levels as follows:
| ∎ | | Level 1 – quoted prices in active markets for identical securities |
| ∎ | | Level 2 – other significant observable inputs (including quoted prices for similar securities, interest rates, prepayment speeds, credit risk, etc.) |
| ∎ | | Level 3 – significant unobservable inputs (including the Portfolio’s own assumptions in determining the fair value of investments) |
The inputs or methodologies used for valuing investments in securities are not necessarily an indication of the risk associated with investing in those securities.
| | | | |
| 38 | | Wells Fargo Small Company Value Portfolio | | Notes to financial statements |
The following is a summary of the inputs used in valuing the Portfolio’s assets and liabilities as of May 31, 2019:
| | | | | | | | | | | | | | | | |
| | | | |
| | | Quoted prices (Level 1) | | | Other significant observable inputs (Level 2) | | | Significant unobservable inputs (Level 3) | | | Total | |
| | | | |
Assets | | | | | | | | | | | | | | | | |
Investments in: | | | | | | | | | | | | | | | | |
| | | | |
Common stocks | | | | | | | | | | | | | | | | |
| | | | |
Communication services | | $ | 565,023 | | | $ | 0 | | | $ | 0 | | | $ | 565,023 | |
| | | | |
Consumer discretionary | | | 12,467,340 | | | | 0 | | | | 0 | | | | 12,467,340 | |
| | | | |
Consumer staples | | | 7,746,594 | | | | 0 | | | | 0 | | | | 7,746,594 | |
| | | | |
Energy | | | 5,268,531 | | | | 0 | | | | 0 | | | | 5,268,531 | |
| | | | |
Financials | | | 33,429,508 | | | | 0 | | | | 0 | | | | 33,429,508 | |
| | | | |
Health care | | | 6,959,099 | | | | 0 | | | | 0 | | | | 6,959,099 | |
| | | | |
Industrials | | | 23,531,234 | | | | 0 | | | | 0 | | | | 23,531,234 | |
| | | | |
Information technology | | | 13,125,427 | | | | 0 | | | | 0 | | | | 13,125,427 | |
| | | | |
Materials | | | 6,282,570 | | | | 0 | | | | 0 | | | | 6,282,570 | |
| | | | |
Real estate | | | 8,640,525 | | | | 0 | | | | 0 | | | | 8,640,525 | |
| | | | |
Utilities | | | 8,098,872 | | | | 0 | | | | 0 | | | | 8,098,872 | |
| | | | |
Exchange-traded funds | | | 670,956 | | | | 0 | | | | 0 | | | | 670,956 | |
| | | | |
Short-term investments | | | | | | | | | | | | | | | | |
| | | | |
Investment companies | | | 718,186 | | | | 2,006,990 | | | | 0 | | | | 2,725,176 | |
| | | | |
Total assets | | $ | 127,503,865 | | | $ | 2,006,990 | | | $ | 0 | | | $ | 129,510,855 | |
Additional sector, industry or geographic detail for the Portfolio is included in the Portfolio of investments.
At May 31, 2019, the Portfolio did not have any transfers into/out of Level 3.
4. TRANSACTIONS WITH AFFILIATES
Advisory fee
The Trust has entered into an advisory contract with Funds Management , an indirect wholly owned subsidiary of Wells Fargo. The adviser is responsible for implementing investment policies and guidelines and for supervising the subadviser, who is responsible forday-to-day portfolio management of the Portfolio. Pursuant to the contract, Funds Management is entitled to receive an advisory fee at the following annual rate based on the Portfolio’s average daily net assets:
| | |
| |
| Average daily net assets | | Advisory fee |
| |
First $500 million | | 0.800% |
| |
Next $500 million | | 0.775 |
| |
Next $1 billion | | 0.750 |
| |
Next $1 billion | | 0.725 |
| |
Next $1 billion | | 0.700 |
| |
Over $4 billion | | 0.680 |
For the year ended May 31, 2019, the advisory fee was equivalent to an annual rate of 0.80% of the Portfolio’s average daily net assets.
| | | | | | |
| Notes to financial statements | | Wells Fargo Small Company Value Portfolio | | | 39 | |
Funds Management has retained the services of a subadviser to provide daily portfolio management to the Portfolio. The fee for subadvisory services is borne by Funds Management. WellsCap is the subadviser to the Portfolio and is entitled to receive a fee from Funds Management at an annual rate starting at 0.55% and declining to 0.40% as the average daily net assets of the Portfolio increase.
Funds Management has voluntarily waived and/or reimbursed advisory fees to reduce the net operating expense ratio of the Portfolio.
Interfund transactions
The Portfolio may purchase or sell portfolio investment securities to certain other Wells Fargo affiliates pursuant toRule 17a-7 under the 1940 Act and under procedures adopted by the Board of Trustees. The procedures have been designed to ensure that these interfund transactions, which do not incur broker commissions, are effected at current market prices.
5. INVESTMENT PORTFOLIO TRANSACTIONS
Purchases and sales of investments, excluding U.S. government obligations (if any) and short-term securities, for the year ended May 31, 2019 were $287,125,187 and $287,393,161, respectively.
6. BANK BORROWINGS
Effective August 28, 2018, the Trust, along with Wells Fargo Variable Trust and Wells Fargo Funds Trust (excluding the money market funds), are parties to a $280,000,000 revolving credit agreement whereby the Portfolio is permitted to use bank borrowings for temporary or emergency purposes, such as to fund shareholder redemption requests. Interest under the credit agreement is charged to the Portfolio based on a borrowing rate equal to the higher of the Federal Funds rate in effect on that day plus 1.25% or the overnight LIBOR rate in effect on that day plus 1.25%. In addition, an annual commitment fee equal to 0.25% of the unused balance is allocated to each participating fund.
For the year ended May 31, 2019, there were no borrowings by the Portfolio under the agreement.
7. CONCENTRATION RISK
Concentration risk results from exposure to a limited number of sectors. A fund that invests a substantial portion of its assets in any sector may be more affected by changes in that sector than would be a fund whose investments are not heavily weighted in any sector.
8. INDEMNIFICATION
Under the Trust’s organizational documents, the officers and Trustees have been granted certain indemnification rights against certain liabilities that may arise out of performance of their duties to the Trust. Additionally, in the normal course of business, the Trust may enter into contracts with service providers that contain a variety of indemnification clauses. The Trust’s maximum exposure under these arrangements is dependent on future claims that may be made against the Portfolio and, therefore, cannot be estimated.
9. NEW ACCOUNTING PRONOUNCEMENT
In August 2018, FASB issued Accounting Standards Update (“ASU”)No. 2018-13, Fair Value Measurement (Topic 820)Disclosure Framework—Changes to the Disclosure Requirements for Fair Value Measurement. ASU2018-13 updates the disclosure requirements for fair value measurements by modifying or removing certain disclosures and adding certain new disclosures. The amendments are effective for fiscal years, and interim periods within those fiscal years, beginning after December 15, 2019. Early adoption is permitted. Management has adopted the removal and modification of disclosures early, as permitted, and will adopt the additional new disclosures at the effective date.
| | | | |
| 40 | | Wells Fargo Small Company Value Portfolio | | Report of independent registered public accounting firm |
TO THE SHAREHOLDERS OF THE PORTFOLIO AND BOARD OF TRUSTEES OF WELLS FARGO MASTER TRUST:
Opinion on the Financial Statements
We have audited the accompanying statement of assets and liabilities of Wells Fargo Small Company Value Portfolio (the Portfolio), one of the portfolios constituting Wells Fargo Master Trust, including the portfolio of investments, as of May 31, 2019, the related statement of operations for the year then ended, the statements of changes in net assets for each of the years in the two-year period then ended, and the related notes (collectively, the financial statements) and the financial highlights for each of the years in the five-year period then ended. In our opinion, the financial statements and financial highlights present fairly, in all material respects, the financial position of the Portfolio as of May 31, 2019, the results of its operations for the year then ended, the changes in its net assets for each of the years in the two-year period then ended, and the financial highlights for each of the years in the five-year period then ended, in conformity with U.S. generally accepted accounting principles.
Basis for Opinion
These financial statements and financial highlights are the responsibility of the Portfolio’s management. Our responsibility is to express an opinion on these financial statements and financial highlights based on our audits. We are a public accounting firm registered with the Public Company Accounting Oversight Board (United States) (PCAOB) and are required to be independent with respect to the Portfolio in accordance with the U.S. federal securities laws and the applicable rules and regulations of the Securities and Exchange Commission and the PCAOB.
We conducted our audits in accordance with the standards of the PCAOB. Those standards require that we plan and perform the audit to obtain reasonable assurance about whether the financial statements and financial highlights are free of material misstatement, whether due to error or fraud. Our audits included performing procedures to assess the risks of material misstatement of the financial statements and financial highlights, whether due to error or fraud, and performing procedures that respond to those risks. Such procedures included examining, on a test basis, evidence regarding the amounts and disclosures in the financial statements and financial highlights. Such procedures also included confirmation of securities owned as of May 31, 2019, by correspondence with the custodian and brokers, or by other appropriate auditing procedures. Our audits also included evaluating the accounting principles used and significant estimates made by management, as well as evaluating the overall presentation of the financial statements and financial highlights. We believe that our audits provide a reasonable basis for our opinion.
We have not been able to determine the specific year that we began serving as the auditor of one or more Wells Fargo Funds investment companies; however we are aware that we have served as the auditor of one or more Wells Fargo Funds investment companies since at least 1955.
Boston, Massachusetts
July 26, 2019
| | | | | | |
| Other information (unaudited) | | Wells Fargo Small Company Value Fund | | | 41 | |
TAX INFORMATION
For corporate shareholders, pursuant to Section 854 of the Internal Revenue Code, 100% of ordinary income dividends qualifying for the corporate dividends-received deduction was as follows for the fiscal year ended May 31, 2019.
Pursuant to Section 854 of the Internal Revenue Code, $534,952 of income dividends paid during the fiscal year ended May 31, 2019 have been designated as qualified dividend income (QDI).
For the fiscal year ended May 31, 2019, $8,255 has been designated as interest-related dividends for nonresident alien shareholders pursuant to Section 871 of the Internal Revenue Code.
PROXY VOTING INFORMATION
A description of the policies and procedures used to determine how to vote proxies relating to portfolio securities is available without charge, upon request, by calling1-800-222-8222, visiting our website atwfam.com, or visiting the SEC website at sec.gov. Information regarding how the proxies related to portfolio securities were voted during the most recent12-month period ended June 30 is available on the website atwfam.comor by visiting the SEC website at sec.gov.
QUARTERLY PORTFOLIO HOLDINGS
The Fund and Portfolio file their complete schedule of portfolio holdings with the SEC for the first and third quarters of each fiscal year on Form N-Q, which is available by visiting the SEC website at sec.gov. Those forms may be reviewed and copied at the SEC’s Public Reference Room in Washington, DC. Information on the operation of the Public Reference Room may be obtained by calling 1-800-SEC-0330.
| | | | |
| 42 | | Wells Fargo Small Company Value Fund | | Other information (unaudited) |
BOARD OF TRUSTEES AND OFFICERS
Each of the Trustees and Officers1 listed in the table below acts in identical capacities for each fund in the Wells Fargo family of funds, which consists of 151 mutual funds comprising the Wells Fargo Funds Trust, Wells Fargo Variable Trust, Wells Fargo Master Trust and fourclosed-end funds (collectively the “Fund Complex”). This table should be read in conjunction with the Prospectus and the Statement of Additional Information2. The mailing address of each Trustee and Officer is 525 Market Street, 12th Floor, San Francisco, CA 94105. Each Trustee and Officer serves an indefinite term, however, each Trustee serves such term until reaching the mandatory retirement age established by the Trustees.
Independent Trustees
| | | | | | |
Name and year of birth | | Position held and length of service* | | Principal occupations during past five years or longer | | Current other public company or investment company directorships |
| | | |
William R. Ebsworth (Born 1957) | | Trustee, since 2015 | | Retired. From 1984 to 2013, equities analyst, portfolio manager, research director and chief investment officer at Fidelity Management and Research Company in Boston, Tokyo, and Hong Kong, and retired in 2013 as Chief Investment Officer of Fidelity Strategic Advisers, Inc. where he led a team of investment professionals managing client assets. Prior thereto, Board member of Hong Kong Securities Clearing Co., Hong Kong Options Clearing Corp., the Thailand International Fund, Ltd., Fidelity Investments Life Insurance Company, and Empire Fidelity Investments Life Insurance Company. Audit Committee Chair and Investment Committee Chair of the Vincent Memorial Hospital Endowment(non-profit organization). Mr. Ebsworth is a CFA® charterholder. | | N/A |
| | | |
| Jane A. Freeman (Born 1953) | | Trustee, since 2015; Chair Liaison, since 2018 | | Retired. From 2012 to 2014 and 1999 to 2008, Chief Financial Officer of Scientific Learning Corporation. From 2008 to 2012, Ms. Freeman provided consulting services related to strategic business projects. Prior to 1999, Portfolio Manager at Rockefeller & Co. and Scudder, Stevens & Clark. Board member of the Harding Loevner Funds from 1996 to 2014, serving as both Lead Independent Director and chair of the Audit Committee. Board member of the Russell Exchange Traded Funds Trust from 2011 to 2012 and the chair of the Audit Committee. Ms. Freeman is a Board Member of The Ruth Bancroft Garden(non-profit organization). She is also an inactive Chartered Financial Analyst. | | N/A |
| | | |
| Isaiah Harris, Jr. (Born 1952) | | Trustee, since 2009; Audit Committee Chairman, since 2019 | | Retired. Chairman of the Board of CIGNA Corporation since 2009, and Director since 2005. From 2003 to 2011, Director of Deluxe Corporation. Prior thereto, President and CEO of BellSouth Advertising and Publishing Corp. from 2005 to 2007, President and CEO of BellSouth Enterprises from 2004 to 2005 and President of BellSouth Consumer Services from 2000 to 2003. Emeritus member of the Iowa State University Foundation Board of Governors. Emeritus Member of the Advisory Board of Iowa State University School of Business. Advisory Board Member, Palm Harbor Academy (private school). Advisory Board Member, Child Evangelism Fellowship(non-profit). Mr. Harris is a certified public accountant (inactive status). | | CIGNA Corporation |
| | | |
| Judith M. Johnson (Born 1949) | | Trustee, since 2008; Audit Committee Chairman, from 2009 to 2018 | | Retired. Prior thereto, Chief Executive Officer and Chief Investment Officer of Minneapolis Employees Retirement Fund from 1996 to 2008. Ms. Johnson is an attorney, certified public accountant and a certified managerial accountant. | | N/A |
| | | | | | |
| Other information (unaudited) | | Wells Fargo Small Company Value Fund | | | 43 | |
| | | | | | |
Name and year of birth | | Position held and length of service* | | Principal occupations during past five years or longer | | Current other public company or investment company directorships |
| | | |
| David F. Larcker (Born 1950) | | Trustee, since 2009 | | James Irvin Miller Professor of Accounting at the Graduate School of Business, Stanford University, Director of the Corporate Governance Research Initiative and Senior Faculty of The Rock Center for Corporate Governance since 2006. From 2005 to 2008, Professor of Accounting at the Graduate School of Business, Stanford University. Prior thereto, Ernst & Young Professor of Accounting at The Wharton School, University of Pennsylvania from 1985 to 2005. | | N/A |
| | | |
| Olivia S. Mitchell (Born 1953) | | Trustee, since 2006; Nominating and Governance Committee Chairman, since 2018 | | International Foundation of Employee Benefit Plans Professor, Wharton School of the University of Pennsylvania since 1993. Director of Wharton’s Pension Research Council and Boettner Center on Pensions & Retirement Research, and Research Associate at the National Bureau of Economic Research. Previously, Cornell University Professor from 1978 to 1993. | | N/A |
| | | |
| Timothy J. Penny (Born 1951) | | Trustee, since 1996; Chairman, since 2018 | | President and Chief Executive Officer of Southern Minnesota Initiative Foundation, anon-profit organization, since 2007. Member of the Board of Trustees of NorthStar Education Finance, Inc., anon-profit organization, since 2007. | | N/A |
| | | |
| James G. Polisson (Born 1959) | | Trustee, since 2018 | | Retired. Chief Marketing Officer, Source (ETF) UK Services, Ltd, from 2015 to 2017. From 2012 to 2015, Principal of The Polisson Group, LLC, a management consulting, corporate advisory and principal investing company. Chief Executive Officer and Managing Director at Russell Investments, Global Exchange Traded Funds from 2010 to 2012. Managing Director of Barclays Global Investors from 1998 to 2010 and Global Chief Marketing Officer for iShares and Barclays Global Investors from 2000 to 2010. Trustee of the San Francisco Mechanics’ Institute, anon-profit organization, from 2013 to 2015. Board member of the Russell Exchange Traded Fund Trust from 2011 to 2012. Director of Barclays Global Investors Holdings Deutschland GmbH from 2006 to 2009. Mr. Polisson is an attorney and has a retired status with the Massachusetts and District of Columbia Bar Associations. | | N/A |
| * | Length of service dates reflect the Trustee’s commencement of service with the Trust’s predecessor entities, where applicable. |
| | | | |
| 44 | | Wells Fargo Small Company Value Fund | | Other information (unaudited) |
Officers
| | | | | | |
Name and year of birth | | Position held and
length of service | | Principal occupations during past five years or longer | | |
| | | |
Andrew Owen (Born 1960) | | President, since 2017 | | Executive Vice President of Wells Fargo & Company and Head of Affiliated Managers, Wells Fargo Asset Management, since 2014. In addition, Mr. Owen is currently President, Chief Executive Officer and Director of Wells Fargo Funds Management, LLC since 2017. Prior thereto, Executive Vice President responsible for marketing, investments and product development for Wells Fargo Funds Management, LLC, from 2009 to 2014. | | |
| | | |
| Nancy Wiser1(Born 1967) | | Treasurer, since 2012 | | Executive Vice President of Wells Fargo Funds Management, LLC since 2011. Chief Operating Officer and Chief Compliance Officer at LightBox Capital Management LLC, from 2008 to 2011. | | |
| | | |
Alexander Kymn (Born 1973) | | Secretary and Chief Legal Officer, since 2018 | | Senior Company Counsel of Wells Fargo Bank, N.A. since 2018 (previously Senior Counsel from 2007 to 2018). Vice President of Wells Fargo Funds Management, LLC from 2008 to 2014. | | |
| | | |
Michael H. Whitaker (Born 1967) | | Chief Compliance Officer, since 2016 | | Senior Vice President and Chief Compliance Officer since 2016. Senior Vice President and Chief Compliance Officer for Fidelity Investments from 2007 to 2016. | | |
| | | |
| David Berardi (Born 1975) | | Assistant Treasurer, since 2009 | | Vice President of Wells Fargo Funds Management, LLC since 2009. Vice President of Evergreen Investment Management Company, LLC from 2008 to 2010. Manager of Fund Reporting and Control for Evergreen Investment Management Company, LLC from 2004 to 2010. | | |
| | | |
Jeremy DePalma1 (Born 1974) | | Assistant Treasurer, since 2009 | | Senior Vice President of Wells Fargo Funds Management, LLC since 2009. Senior Vice President of Evergreen Investment Management Company, LLC from 2008 to 2010 and head of the Fund Reporting and Control Team within Fund Administration from 2005 to 2010. | | |
| 1 | Nancy Wiser acts as Treasurer of 65 funds in the Fund Complex. Jeremy DePalma acts as Treasurer of 86 funds and Assistant Treasurer of 65 funds in the Fund Complex. |
| 2 | The Statement of Additional Information includes additional information about the Trustees and is available, without charge, upon request, by calling1-800-222-8222 or by visiting the website atwfam.com. |
| | | | | | |
| Other information (unaudited) | | Wells Fargo Small Company Value Fund | | | 45 | |
BOARD CONSIDERATION OF INVESTMENT MANAGEMENT, ADVISORY AND SUB-ADVISORY AGREEMENTS:
Wells Fargo Small Company Value Fund and Wells Fargo Small Company Value Portfolio
Under the Investment Company Act of 1940 (the “1940 Act”), the Board of Trustees (each, a “Board” and collectively, the “Boards”) of each of Wells Fargo Funds Trust (“Funds Trust”) and Wells Fargo Master Trust (“Master Trust”, and collectively, the “Trusts”) must determine annually whether to approve the continuation of the Trusts’ investment management, advisory and sub-advisory agreements, as applicable. In this regard, at an in-person meeting held on May 21-22, 2019 (the “Meeting”), the Funds Trust Board, all the members of which have no direct or indirect interest in the investment management agreement and are not “interested persons” of the Trusts, as defined in the 1940 Act (the “Independent Trustees”), reviewed and approved for Wells Fargo Small Company Value Fund (the “Gateway Fund”) an investment management agreement (the “Gateway Fund Management Agreement”) with Wells Fargo Funds Management, LLC (“Funds Management”).
At the Meeting, the Master Trust Board, all the members of which have no direct or indirect interest in the investment advisory and sub-advisory agreements and are Independent Trustees, reviewed and approved: (i) an investment advisory agreement (the “Master Portfolio Advisory Agreement”) with Funds Management for Wells Fargo Small Company Value Portfolio, a portfolio of Master Trust (the “Master Portfolio”); and (ii) an investment sub-advisory agreement (the “Sub-Advisory Agreement”) with Wells Capital Management Incorporated (the “Sub-Adviser”), an affiliate of Funds Management.
The Gateway Fund and the Master Portfolio are collectively referred to as the “Funds.” The Gateway Fund Management Agreement, the Master Portfolio Advisory Agreement and the Sub-Advisory Agreement are collectively referred to as the “Advisory Agreements.”
The Gateway Fund is a gateway feeder fund that invest substantially all of its assets in the Master Portfolio. The Master Portfolio has a substantially similar investment objective and substantially similar investment strategies to the Gateway Fund. Information provided to the Boards regarding the Gateway Fund is also applicable to the Master Portfolio, as relevant.
At the Meeting, the Boards considered the factors and reached the conclusions described below relating to the selection of Funds Management and the Sub-Adviser and the approval of the Advisory Agreements. Prior to the Meeting, including at an in-person meeting in April 2019, the Trustees conferred extensively among themselves and with representatives of Funds Management about these matters. Also, the Boards have adopted a team-based approach, with each team consisting of a sub-set of Trustees, to assist the full Boards in the discharge of their duties in reviewing investment performance and other matters throughout the year. The Independent Trustees were assisted in their evaluation of the Advisory Agreements by independent legal counsel, from whom they received separate legal advice and with whom they met separately.
In providing information to the Boards, Funds Management and the Sub-Adviser were guided by a detailed set of requests for information submitted to them by independent legal counsel on behalf of the Independent Trustees at the start of the Boards’ annual contract renewal process earlier in 2019. In considering and approving the Advisory Agreements, the Trustees considered the information they believed relevant, including but not limited to the information discussed below. The Boards considered not only the specific information presented in connection with the Meeting, but also the knowledge gained over time through interaction with Funds Management and the Sub-Adviser about various topics. In this regard, the Boards reviewed reports of Funds Management at each of their quarterly meetings, which included, among other things, portfolio reviews and investment performance reports. In addition, the Boards and the teams mentioned above confer with portfolio managers at various times throughout the year. The Boards did not identify any particular information or consideration that was all-important or controlling, and each individual Trustee may have attributed different weights to various factors.
After its deliberations, the Funds Trust Board unanimously approved the continuation of the Gateway Fund Management Agreement for a one-year period. Additionally, after its deliberations, the Master Trust Board unanimously approved the continuation of the Master Portfolio Advisory Agreement and the Sub-Advisory Agreement, each for a one-year term. The Boards also determined that the compensation payable to Funds Management and the Sub-Adviser was reasonable. The Boards considered the approval of the Advisory Agreements for the Funds as part of their consideration of agreements for funds across the complex, but their approvals were made on a fund-by-fund basis. The following summarizes a number of important, but not necessarily all, factors considered by the Boards in support of their approvals.
Nature, extent and quality of services
The Boards received and considered various information regarding the nature, extent and quality of services provided to the Funds by Funds Management and the Sub-Adviser under the Advisory Agreements. This information included a
| | | | |
| 46 | | Wells Fargo Small Company Value Fund | | Other information (unaudited) |
description of the investment advisory services and Fund-level administrative services, as well as, among other things, a summary of the background and experience of senior management of Wells Fargo Asset Management (“WFAM”), of which Funds Management and the Sub-Adviser are a part, a summary of investments made in the business of WFAM, a summary of certain organizational and personnel changes involving Funds Management and the Sub-Adviser, and a description of Funds Management’s and the Sub-Adviser’s business continuity planning programs and of their approaches to data privacy and cybersecurity. The Boards received and reviewed information about Funds Management’s role as administrator of the Funds’ liquidity risk management program. The Boards also considered the qualifications, background, tenure and responsibilities of each of the portfolio managers primarily responsible for the day-to-day portfolio management of the Funds.
The Boards evaluated the ability of Funds Management and the Sub-Adviser to attract and retain qualified investment professionals, including research, advisory and supervisory personnel. The Boards further considered the compliance programs and compliance records of Funds Management and the Sub-Adviser. In addition, the Boards took into account the full range of services provided to the Funds by Funds Management and its affiliates.
Fund investment performance and expenses
The Boards considered the investment performance results for each of the Funds over various time periods ended December 31, 2018. The Boards considered these results in comparison to the investment performance of funds in a universe that was determined by Broadridge Inc. (“Broadridge”) to be similar to the Gateway Fund (the “Universe”), and in comparison to the Gateway Fund’s benchmark index and to other comparative data. Broadridge is an independent provider of investment company data. The Boards received a description of the methodology used by Broadridge to select the mutual funds in the performance Universe. The Funds Trust Board noted that the investment performance of the Gateway Fund (Administrator Class) was higher than or in range of the average investment performance of its Universe for the three-, five- and ten-year periods under review, but lower than the average investment performance of its Universe for the one-year period under review. The Funds Trust Board also noted that the investment performance of the Gateway Fund was higher than or in range of its benchmark, the Russell 2000® Value Index, for the three-, five- and ten-year periods under review, but lower than its benchmark for the one-year period under review.
The Master Trust Board took note of the investment performance of the Master Portfolio in the context of reviewing the investment performance of the Gateway Fund.
The Funds Trust Board received information concerning, and discussed factors contributing to, the underperformance of the Gateway Fund relative to the Universe and benchmark for the periods identified above. The Funds Trust Board took note of the explanations for the relative underperformance during these periods, including with respect to investment decisions and market factors that affected the Gateway Fund’s investment performance.
The Funds Trust Board also received and considered information regarding the Gateway Fund’s net operating expense ratios, which include fees and expenses of the Master Portfolio, and their various components, including actual management fees assessed at the Gateway Fund and Master Portfolio levels, custodian and other non-management fees, and Rule 12b-1 and non-Rule 12b-1 shareholder service fees. The Funds Trust Board considered these ratios in comparison to the median ratios of funds in class-specific expense groups that were determined by Broadridge to be similar to the Gateway Fund (the “Groups”). The Funds Trust Board received a description of the methodology used by Broadridge to select the mutual funds in the expense Groups and an explanation of how funds comprising expense groups and their expense ratios may vary from year-to-year. Based on the Broadridge reports, the Funds Trust Board noted that the net operating expense ratios of the Gateway Fund were lower than the median net operating expense ratios of its expense Groups for each share class.
With respect to the Master Portfolio, the Master Trust Board reviewed the fee rates that are payable to Funds Management for investment advisory services (as discussed below), which are the only fees charged at the Master Portfolio level, relative to a corresponding expense Group.
The Boards took into account the Funds’ investment performance and expense information provided to them among the factors considered in deciding to re-approve the Advisory Agreements.
Investment management, advisory and sub-advisory fee rates
The Funds Trust Board noted that Funds Management receives no advisory fees from the Gateway Fund as long as the Gateway Fund continues to invest all (or substantially all) of its assets in a single master portfolio. If the Gateway Fund were to change its investment structure so that it began investing in two or more master portfolios (a fund-of-funds), Funds Management would be entitled to receive an annual fee of 0.25% of the Gateway Fund’s average daily net assets for providing investment advisory services to the Gateway Fund, including allocating the Gateway Fund’s assets to the Master Portfolio.
| | | | | | |
| Other information (unaudited) | | Wells Fargo Small Company Value Fund | | | 47 | |
The Funds Trust Board reviewed and considered the contractual fee rates that are payable by the Gateway Fund to Funds Management under the Gateway Fund Management Agreement, as well as the contractual fee rates payable by the Gateway Fund to Funds Management for class-level administrative services under a Class-Level Administration Agreement, which include, among other things, class-level transfer agency and sub-transfer agency costs (collectively, the “Management Rates”).
The Master Trust Board reviewed and considered the contractual investment advisory fee rate that is payable by the Master Portfolio to Funds Management for investment advisory services under the Master Portfolio Advisory Agreement (the “Advisory Agreement Rate”). The Master Trust Board also reviewed and considered the contractual investment sub-advisory fee rate that is payable by Funds Management to the Sub-Adviser for investment sub-advisory services (the “Sub-Advisory Agreement Rate”).
Among other information reviewed by the Funds Trust Board was a comparison of the Gateway Fund’s Management Rate, which include the advisory fees paid at the Master Portfolio level, with the average contractual investment management fee rates of funds in the expense Groups at a common asset level as well as transfer agency costs of the funds in the expense Groups. The Funds Trust Board noted that the Management Rates of the Gateway Fund were lower than or in range of the sum of these average rates for the Gateway Fund’s expense Groups for all share classes.
The Master Trust Board reviewed a comparison of the Advisory Agreement Rate of the Master Portfolio with those of other funds in the Master Portfolio’s expense Group at a common asset level. The Master Trust Board noted that the Advisory Agreement Rate of the Master Portfolio was lower than the median rate for the Master Portfolio’s expense Group.
The Master Trust Board also received and considered information about the portions of the total management fees that were retained by Funds Management after payment of the fees to the Sub-Adviser for sub-advisory services. In assessing the reasonableness of these amounts, the Master Trust Board received and evaluated information about the nature and extent of responsibilities retained and risks assumed by Funds Management and not delegated to or assumed by the Sub-Adviser, and about Funds Management’s on-going oversight services. Given the affiliation between Funds Management and the Sub-Adviser, the Master Trust Board ascribed limited relevance to the allocation of fees between them.
The Boards also received and considered information about the nature and extent of services offered and fee rates charged by Funds Management and the Sub-Adviser to other types of clients with investment strategies similar to those of the Funds. In this regard, the Boards received information about the significantly greater scope of services, and compliance, reporting and other legal burdens and risks of managing proprietary mutual funds compared with those associated with managing assets of other types of clients, including third-party sub-advised fund clients and non-mutual fund clients such as institutional separate accounts.
Based on its consideration of the factors and information it deemed relevant, including those described here, the Funds Trust Board determined that the compensation payable to Funds Management under the Gateway Fund Management Agreement was reasonable, and the Master Trust Board determined that the compensation payable to Funds Management under the Master Portfolio Advisory Agreement and to the Sub-Adviser under the Sub-Advisory Agreement was reasonable.
Profitability
The Boards received and considered information concerning the profitability of Funds Management, as well as the profitability of both WFAM and Wells Fargo & Co. (“Wells Fargo”) from providing services to the fund family as a whole. The Boards noted that the Sub-Adviser’s profitability information with respect to providing services to the Master Portfolio and other funds in the family was subsumed in the WFAM and Wells Fargo profitability analysis.
Funds Management reported on the methodologies and estimates used in calculating profitability, including a description of the methodology used to allocate certain expenses. Among other things, the Boards noted that the levels of profitability reported on a fund-by-fund basis varied widely, depending on factors such as the size, type and age of fund.
Based on its review, the Boards did not deem the profits reported by Funds Management, WFAM or Wells Fargo from services provided to the Funds to be at a level that would prevent the Boards from approving the continuation of the Advisory Agreements.
Economies of scale
The Boards received and considered information about the potential for Funds Management to experience economies of scale in the provision of management services to the Funds, the difficulties of calculating economies of scale at an
| | | | |
| 48 | | Wells Fargo Small Company Value Fund | | Other information (unaudited) |
individual fund level, and the extent to which potential scale benefits are shared with shareholders. The Boards noted the existence of breakpoints in the Master Portfolio’s advisory fee structure and the Gateway Fund’s management fee structure, which operate generally to reduce the Funds’ expense ratios as the Funds grow in size. The Boards considered that, in addition to management fee breakpoints, Funds Management shares potential economies of scale from its management business in a variety of ways, including through fee waiver and expense reimbursement arrangements, services that benefit shareholders, competitive management fee rates set at the outset without regard to breakpoints, and investments in the business intended to enhance services available to shareholders.
The Boards concluded that Funds Management’s arrangements with respect to each Fund, including contractual breakpoints, constituted a reasonable approach to sharing potential economies of scale with the Funds and their shareholders.
Other benefits to Funds Management and the Sub-Adviser
The Boards received and considered information regarding potential “fall-out” or ancillary benefits received by Funds Management and its affiliates, including the Sub-Adviser, as a result of their relationships with the Funds. Ancillary benefits could include, among others, benefits directly attributable to other relationships with the Funds and benefits potentially derived from an increase in Funds Management’s and the Sub-Adviser’s business as a result of their relationships with the Funds. The Boards noted that various affiliates of Funds Management may receive distribution-related fees, shareholder servicing payments and sub-transfer agency fees in respect of shares sold or held through them and services provided.
The Boards also reviewed information about soft dollar credits earned and utilized by the Sub-Adviser, fees earned by Funds Management and the Sub-Adviser from managing a private investment vehicle for the fund family’s securities lending collateral, and commissions earned by an affiliated broker from portfolio transactions.
Based on their consideration of the factors and information they deemed relevant, including those described here, the Boards did not find that any ancillary benefits received by Funds Management and its affiliates, including the Sub-Adviser, were unreasonable.
Conclusion
At the Meeting, after considering the above-described factors and based on its deliberations and its evaluation of the information described above, the Funds Trust Board unanimously approved the continuation of the Gateway Fund Management Agreement for a one-year period. Additionally, after its deliberations, the Master Trust Board unanimously approved the continuation of the Master Portfolio Advisory Agreement and the Sub-Advisory Agreement for a one-year term. The Boards also determined that the compensation payable to Funds Management and the Sub-Adviser was reasonable.

For more information
More information about Wells Fargo Funds is available free upon request. To obtain literature, please write, visit the Fund’s website, or call:
Wells Fargo Funds
P.O. Box 219967
Kansas City, MO 64121-9967
Website: wfam.com
Individual investors: 1-800-222-8222
Retail investment professionals: 1-888-877-9275
Institutional investment professionals:
1-866-765-0778
This report and the financial statements contained herein are submitted for the general information of the shareholders of the Fund. If this report is used for promotional purposes, distribution of the report must be accompanied or preceded by a current prospectus. Before investing, please consider the investment objectives, risks, charges, and expenses of the investment. For a current prospectus and, if available, a summary prospectus, containing this information, call1-800-222-8222 or visit the Fund’s website atwfam.com. Read the prospectus carefully before you invest or send money.
Wells Fargo Asset Management (WFAM) is the trade name for certain investment advisory/management firms owned by Wells Fargo & Company. These firms include but are not limited to Wells Capital Management Incorporated and Wells Fargo Funds Management, LLC. Certain products managed by WFAM entities are distributed by Wells Fargo Funds Distributor, LLC (a broker-dealer and Member FINRA).
This material is for general informational and educational purposes only and is NOT intended to provide investment advice or a recommendation of any kind—including a recommendation for any specific investment, strategy, or plan.
INVESTMENT PRODUCTS: NOT FDIC INSURED ◾ NO BANK GUARANTEE ◾ MAY LOSE VALUE
© 2019 Wells Fargo Funds Management, LLC. All rights reserved.
| | |
 | | 403200 07-19 A286/AR286 05-19 |
Annual Report
May 31, 2019

Wells Fargo Core Bond Fund

Beginning on January 1, 2021, as permitted by new regulations adopted by the Securities and Exchange Commission, paper copies of the Wells Fargo Funds’ annual and semi-annual shareholder reports issued after this date will no longer be sent by mail, unless you specifically request paper copies of the reports. Instead, the reports will be made available on the Funds’ website, and you will be notified by mail each time a report is posted and provided with a website address to access the report.
If you already elected to receive shareholder reports electronically, you will not be affected by this change and you need not take any action. You may elect to receive shareholder reports and other communications from the Fund electronically at any time by contacting your financial intermediary (such as a broker-dealer or bank) or, if you are a direct investor, by calling 1-800-222-8222 or by enrolling at wellsfargo.com/advantagedelivery.
You may elect to receive all future reports in paper free of charge. If you invest through a financial intermediary, you can contact your financial intermediary to request that you continue to receive paper copies of your shareholder reports; if you invest directly with the Fund, you can call 1-800-222-8222. Your election to receive reports in paper will apply to all Wells Fargo Funds held in your account with your financial intermediary or, if you are a direct investor, to all Wells Fargo Funds that you hold.

Reduce clutter. Save trees.
Sign up for electronic delivery of prospectuses and shareholder reports atwellsfargo.com/advantagedelivery
Contents
The views expressed and any forward-looking statements are as of May 31, 2019, unless otherwise noted, and are those of the Fund managers and/or Wells Fargo Asset Management. Discussions of individual securities, or the markets generally, or any Wells Fargo Fund are not intended as individual recommendations. Future events or results may vary significantly from those expressed in any forward-looking statements. The views expressed are subject to change at any time in response to changing circumstances in the market. Wells Fargo Asset Management and the Fund disclaim any obligation to publicly update or revise any views expressed or forward-looking statements.
INVESTMENT PRODUCTS: NOT FDIC INSURED ◾ NO BANK GUARANTEE ◾ MAY LOSE VALUE
| | | | |
| 2 | | Wells Fargo Core Bond Fund | | Letter to shareholders (unaudited) |

Andrew Owen
President
Wells Fargo Funds
Dear Shareholder:
We are pleased to offer you this annual report for the Wells Fargo Core Bond Fund for the 12-month period that ended May 31, 2019. Higher short-term interest rates, inflation concerns, trade tensions, and geopolitical events drove investment market volatility for much of 2018, particularly for international stocks. Early 2019 saw stocks and bonds gain with renewed business and investor confidence, but volatility returned late in the period as global growth slowed and geopolitical concerns persisted.
For the period, U.S. stocks, based on the S&P 500 Index,1 gained 3.78% and international stocks, as measured by the MSCI ACWI ex USA Index (Net),2 fell 6.26%. Based on the MSCI EM Index (Net),3 emerging market stocks fell 8.70%. Bond investors saw the Bloomberg Barclays U.S. Aggregate Bond Index4 add 6.40% while the Bloomberg Barclays Global Aggregate ex-USD Index5 rose 0.39%. The Bloomberg Barclays Municipal Bond Index6 added 6.40%, and the ICE BofAML U.S. High Yield Index7 was up 5.37%.
Results for investment indices reflected global concerns.
Global trade tensions escalated during the second quarter of 2018. A tit-for-tat tariff spat intensified between the U.S. and other governments. The U.S. Federal Reserve (Fed) raised the federal funds rate by 25 basis points (bps; 100 bps equal 1.00%) to a target range of between 1.75% and 2.00% in June. Market index results reflected the global concerns. The MSCI ACWI ex USA Index (Net) lost 2.61%, while the Bloomberg Barclays Global Aggregate ex-USD Index dropped 4.76%.
Not all news was bad. The U.S. Bureau of Economic Analysis reported second-quarter annualized gross domestic product (GDP) growth of 4.2%. Hiring improved. Unemployment declined. Consumer confidence and spending increased. The S&P 500 Index recorded a 3.43% second-quarter gain. Stocks of companies with smaller capitalizations did even better, as measured by the Russell 2000® Index,8 adding 7.75%.
| 1 | The S&P 500 Index consists of 500 stocks chosen for market size, liquidity, and industry group representation. It is a market-value-weighted index with each stock’s weight in the index proportionate to its market value. You cannot invest directly in an index. |
| 2 | The Morgan Stanley Capital International (MSCI) All Country World Index (ACWI) ex USA Index (Net) is a free-float-adjusted market-capitalization-weighted index that is designed to measure the equity market performance of developed and emerging markets, excluding the U.S. Source: MSCI. MSCI makes no express or implied warranties or representations and shall have no liability whatsoever with respect to any MSCI data contained herein. The MSCI data may not be further redistributed or used as a basis for other indices or any securities or financial products. This report is not approved, reviewed, or produced by MSCI. You cannot invest directly in an index. |
| 3 | The MSCI Emerging Markets (EM) Index (Net) is a free-float-adjusted market-capitalization-weighted index that is designed to measure the equity market performance of emerging markets. You cannot invest directly in an index. |
| 4 | The Bloomberg Barclays U.S. Aggregate Bond Index is a broad-based benchmark that measures the investment-grade, U.S.-dollar-denominated, fixed-rate taxable bond market, including Treasuries, government-related and corporate securities, mortgage-backed securities (agency fixed-rate and hybrid adjustable-rate mortgage pass-throughs), asset-backed securities, and commercial mortgage-backed securities. You cannot invest directly in an index. |
| 5 | The Bloomberg Barclays Global Aggregate ex-USD Index is an unmanaged index that provides a broad-based measure of the global investment-grade fixed-income markets excluding the U.S.-dollar-denominated debt market. You cannot invest directly in an index. |
| 6 | The Bloomberg Barclays Municipal Bond Index is an unmanaged index composed of long-term tax-exempt bonds with a minimum credit rating of Baa. You cannot invest directly in an index. |
| 7 | The ICE BofAML U.S. High Yield Index is a market-capitalization-weighted index of domestic and Yankee high-yield bonds. The index tracks the performance of high-yield securities traded in the U.S. bond market. You cannot invest directly in an index. Copyright 2019. ICE Data Indices, LLC. All rights reserved. |
| 8 | The Russell 2000® Index measures the performance of the 2,000 smallest companies in the Russell 3000® Index, which represents approximately 8% of the total market capitalization of the Russell 3000® Index. You cannot invest directly in an index. |
| | | | | | |
| Letter to shareholders (unaudited) | | Wells Fargo Core Bond Fund | | | 3 | |
Investors appeared to shake off lingering concerns during the third quarter.
Favorable third-quarter economic indicators and corporate earnings reports encouraged domestic stock investors. U.S. trade negotiations with Mexico and Canada progressed. The Conference Board Consumer Confidence Index®9 reached its highest level in 18 years during September 2018. The Fed raised the federal funds rate by 25 bps to a target range of between 2.00% and 2.25% in September. For the quarter that ended September 30, 2018, the S&P 500 Index added 7.71%.
Investors in international markets were not as confident. Tensions between the U.S. and China increased. The U.S. imposed $200 billion in tariffs on Chinese goods. China reacted with $60 billion in tariffs on U.S. goods. Economic growth in China caused concern. The Bank of England (BoE) raised its monetary policy rate to 0.75% in August 2018. During the quarter, the MSCI ACWI ex USA Index (Net) gained 0.71%. The MSCI EM Index (Net) declined 1.09%. In fixed-income markets, U.S. bonds were flat, as measured by the Bloomberg Barclays U.S. Aggregate Bond Index. The Bloomberg Barclays Global Aggregate ex-USD Index fell 1.74%.
Conflicting data unsettled markets during the fourth quarter.
November’s U.S. midterm elections shifted control of the House of Representatives from Republicans to Democrats, presaging potential partisan clashes. Third-quarter U.S. GDP was announced at an annualized 3.4% rate, lower than the second-quarter rate. Brexit efforts stalled ahead of the March 2019 deadline. The People’s Bank of China cut reserve requirement ratios, accelerated infrastructure spending, and cut taxes even as the value of the yuan declined to low levels last seen in 2008.
December’s S&P 500 Index performance was the worst since 1931. Globally,fixed-income investments fared better than stocks during the last two months of the year. The Fed increased the federal funds rate by 25 bps in December 2018 to a target range of between 2.25% and 2.50%.
The market climbs a wall of worry.
Investors entered 2019 with reasons to be concerned. A partial U.S. government shutdown driven by partisan policy disputes extended into January. Investment returns appeared to reaffirm the adage that markets climb a wall of worry. The S&P 500 Index gained 8.01% for the month of January, the best monthly performance in 30 years. Returns for the MSCI ACWI ex USA Index (Net), the Bloomberg Barclays U.S. Aggregate Bond Index, and the Bloomberg Barclays Global Aggregate ex-USD Index also were positive. The Fed indicated that it would pause its program of regular rate increases during 2019 as inflation remained low.
In February 2019, concerns over slowing global growth reemerged. The Bureau of Economic Analysis announced fourth-quarter 2018 GDP grew at an annualized 2.2% rate, down from levels of the prior two quarters. In a February report, the BoE forecast the slowest growth since the financial crisis for 2019. China and the U.S. continued to wrangle over trade issues.
By the end of March 2019, the combination of dovish Fed sentiment and consistent, if not spectacular, economic and business metrics reinforced investors’ confidence. Monthly job creation data regained momentum. Corporate profits, while lower than 2018’s lofty levels, remained solid. China announced a roughly $300 billion stimulus package through tax and fee cuts intended to reinvigorate economic growth.
December’s S&P 500 Index performance was the worst since 1931.
The S&P 500 Index gained 8.01% for the month of January, the best monthly performance in 30 years.
| 9 | The Conference Board Consumer Confidence Index® measures the degree of optimism on the state of the U.S. economy that consumers are expressing through their activities of saving and spending. You cannot invest directly in an index. |
| | | | |
| 4 | | Wells Fargo Core Bond Fund | | Letter to shareholders (unaudited) |
During April 2019, several broad-based U.S. equity indices reached or approached highs as investors drew confidence from favorable economic projections, sustained low inflation, and solid employment data. First-quarter GDP showed the economy grew at an annualized rate of 3.2% on improvement in business investment and exports. Favorable sentiment extended to foreign markets as the MSCI ACWI ex USA Index (Net) gained 2.64% and the MSCI EM Index (Net) added 2.11% for the month.
May 2019 presented investors with mixed signals in the economy, in the markets, and politically. In the U.S., partisan wrangling ramped up as Democrats and Republicans set their sights on 2020 presidential politics. In the U.K., the Brexit stalemate resulted in the resignation of Prime Minister Theresa May. The European Commission downgraded the 2019 growth forecast for the block of countries to 1.2%. The U.S. increased tariffs on products from China, China responded, and then talks broke down. Ending the month, equities, as measured by the MSCI ACWI (Net),10 dropped 5.93% while bonds, often considered a less risky investment, gained 1.04%, as measured by the Bloomberg Barclays Global Aggregate ex-USD Index.
Don’t let short-term uncertainty derail long-term investment goals.
Periods of investment uncertainty can present challenges, but experience has taught us that maintaining long-term investment goals can be an effective way to plan for the future. To help you create a sound strategy based on your personal goals and risk tolerance, Wells Fargo Funds offers more than 100 mutual funds spanning a wide range of asset classes and investment styles. Although diversification cannot guarantee an investment profit or prevent losses, we believe it can be an effective way to manage investment risk and potentially smooth out overall portfolio performance. We encourage investors to know their investments and to understand that appropriate levels of risk-taking may unlock opportunities.
Thank you for choosing to invest with Wells Fargo Funds. We appreciate your confidence in us and remain committed to helping you meet your financial needs.
Sincerely,

Andrew Owen
President
Wells Fargo Funds
For further information about your Fund, contact your investment professional, visit our website atwfam.com, or call us directly at1-800-222-8222.
| 10 | The MSCI ACWI (Net) is a free-float-adjusted market-capitalization-weighted index that is designed to measure the equity market performance of developed and emerging markets. You cannot invest directly in an index. |
This page is intentionally left blank.
| | | | |
| 6 | | Wells Fargo Core Bond Fund1 | | Performance highlights (unaudited) |
Investment objective
The Fund seeks total return, consisting of income and capital appreciation.
Manager
Wells Fargo Funds Management, LLC
Subadviser for the affiliated master portfolio
Wells Capital Management Incorporated
Portfolio managers
Maulik Bhansali, CFA®‡
Thomas O’Connor, CFA®‡
Jarad Vasquez
Average annual total returns (%) as of May 31, 2019
| | | | | | | | | | | | | | | | | | | | | | | | | | | | | | | | | | |
| | | | | Including sales charge | | | Excluding sales charge | | | Expense ratios2 (%) | |
| | | Inception date | | 1 year | | | 5 year | | | 10 year | | | 1 year | | | 5 year | | | 10 year | | | Gross | | | Net3 | |
| | | | | | | | | |
| Class A (MBFAX) | | 10-31-2001 | | | 1.08 | | | | 1.36 | | | | 3.58 | | | | 5.87 | | | | 2.30 | | | | 4.06 | | | | 0.83 | | | | 0.78 | |
| | | | | | | | | |
| Class C (MBFCX) | | 10-31-2001 | | | 4.04 | | | | 1.53 | | | | 3.25 | | | | 5.04 | | | | 1.53 | | | | 3.25 | | | | 1.58 | | | | 1.53 | |
| | | | | | | | | |
| Class R (WTRRX)4 | | 7-9-2010 | | | – | | | | – | | | | – | | | | 5.61 | | | | 2.04 | | | | 3.76 | | | | 1.08 | | | | 1.03 | |
| | | | | | | | | |
| Class R4 (MBFRX)5 | | 11-30-2012 | | | – | | | | – | | | | – | | | | 6.07 | | | | 2.56 | | | | 4.31 | | | | 0.60 | | | | 0.52 | |
| | | | | | | | | |
| Class R6 (WTRIX)6 | | 11-30-2012 | | | – | | | | – | | | | – | | | | 6.31 | | | | 2.72 | | | | 4.45 | | | | 0.45 | | | | 0.37 | |
| | | | | | | | | |
| Administrator Class (MNTRX) | | 6-30-1997 | | | – | | | | – | | | | – | | | | 5.87 | | | | 2.38 | | | | 4.12 | | | | 0.77 | | | | 0.70 | |
| | | | | | | | | |
| Institutional Class (MBFIX) | | 10-31-2001 | | | – | | | | – | | | | – | | | | 6.18 | | | | 2.65 | | | | 4.40 | | | | 0.50 | | | | 0.42 | |
| | | | | | | | | |
| Bloomberg Barclays U.S. Aggregate Bond Index7 | | – | | | – | | | | – | | | | – | | | | 6.40 | | | | 2.70 | | | | 3.83 | | | | – | | | | – | |
Figures quoted represent past performance, which is no guarantee of future results, and do not reflect taxes that a shareholder may pay on fund distributions or the redemption of fund shares. Investment return and principal value of an investment will fluctuate so that an investor’s shares, when redeemed, may be worth more or less than their original cost. Performance shown without sales charges would be lower if sales charges were reflected. Current performance may be lower or higher than the performance data quoted, which assumes the reinvestment of dividends and capital gains. Current month-end performance is available on the Fund’s website, wfam.com.
Index returns do not include transaction costs associated with buying and selling securities, any mutual fund fees or expenses, or any taxes. It is not possible to invest directly in an index.
For Class A shares, the maximum front-end sales charge is 4.50%. For Class C shares, the maximum contingent deferred sales charge is 1.00%. Performance including a contingent deferred sales charge assumes the sales charge for the corresponding time period. Class R, Class R4, Class R6, Administrator Class, and Institutional Class shares are sold without a front-end sales charge or contingent deferred sales charge.
Bond values fluctuate in response to the financial condition of individual issuers, general market and economic conditions, and changes in interest rates. Changes in market conditions and government policies may lead to periods of heightened volatility in the bond market and reduced liquidity for certain bonds held by the Fund. In general, when interest rates rise, bond values fall and investors may lose principal value. Interest rate changes and their impact on the Fund and its share price can be sudden and unpredictable. The use of derivatives may reduce returns and/or increase volatility. Certain investment strategies tend to increase the total risk of an investment (relative to the broader market). Securities issued by U.S. government agencies or government-sponsored entities may not be guaranteed by the U.S. Treasury. The Fund is exposed to foreign investment risk and mortgage- and asset-backed securities risk. Consult the Fund’s prospectus for additional information on these and other risks.
Please see footnotes on page 7.
| | | | | | |
| Performance highlights (unaudited) | | Wells Fargo Core Bond Fund | | | 7 | |
|
| Growth of $10,000 investment as of May 31, 20198 |
|
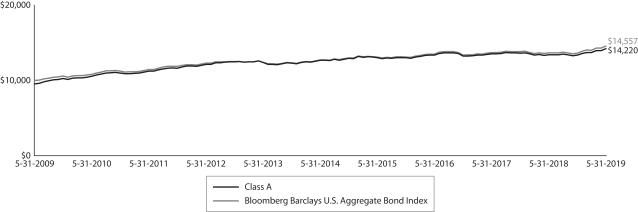 |
| ‡ | CFA® and Chartered Financial Analyst® are trademarks owned by CFA Institute. |
| 1 | The Fund is a gateway feeder fund that invests substantially all of its assets in a single affiliated master portfolio of the Wells Fargo Master Trust with a substantially similar investment objective and substantially identical investment strategies. References to the investment activities of the Fund are intended to refer to the investment activities of the affiliated master portfolio in which it invests. |
| 2 | Reflects the expense ratios as stated in the most recent prospectuses. The expense ratios shown are subject to change and may differ from the annualized expense ratios shown in the financial highlights of this report. |
| 3 | The manager has contractually committed through September 30, 2019, to waive fees and/or reimburse expenses to the extent necessary to cap the expenses of each class after fee waivers at the amounts shown. Brokerage commissions, stamp duty fees, interest, taxes, acquired fund fees and expenses (if any) from funds in which the affiliated master portfolio invests, and extraordinary expenses are excluded from the expense caps. Net expenses from the affiliated master portfolio are included in the expense cap. Prior to or after the commitment expiration date, the cap may be increased or the commitment to maintain the cap may be terminated only with the approval of the Board of Trustees. Without this cap, the Fund’s returns would have been lower. The expense ratio paid by an investor is the net expense ratio (the total annual fund operating expenses after fee waivers) as stated in the prospectuses. |
| 4 | Historical performance shown for Class R shares prior to their inception reflects the performance of Administrator Class shares, adjusted to reflect the higher expenses applicable to Class R shares. |
| 5 | Historical performance shown for Class R4 shares prior to their inception reflects the performance of Institutional Class shares, adjusted to reflect the higher expenses applicable to Class R4 shares. |
| 6 | Historical performance shown for Class R6 shares prior to their inception reflects the performance of Institutional Class shares and includes the higher expenses applicable to Institutional Class shares. If these expenses had not been included, returns for Class R6 shares would be higher. |
| 7 | The Bloomberg Barclays U.S. Aggregate Bond Index is a broad-based benchmark that measures the investment-grade, U.S. dollar–denominated, fixed-rate taxable bond market, including Treasuries, government-related and corporate securities, mortgage-backed securities (agency fixed-rate and hybrid adjustable-rate mortgage pass-throughs), asset-backed securities, and commercial mortgage-backed securities. You cannot invest directly in an index. |
| 8 | The chart compares the performance of Class A shares for the most recent ten years with the Bloomberg Barclays U.S. Aggregate Bond Index. The chart assumes a hypothetical $10,000 investment in Class A shares and reflects all operating expenses and assumes the maximum initial sales charge of 4.50%. |
| 9 | The S&P 500 Index consists of 500 stocks chosen for market size, liquidity, and industry group representation. It is a market-value-weighted index with each stock’s weight in the index proportionate to its market value. You cannot invest directly in an index. |
| 10 | The ten largest holdings, excluding cash, cash equivalents and any money market funds, are calculated based on the value of the securities of the affiliated master portfolio allocable to the Fund divided by the total net assets of the Fund. Holdings are subject to change and may have changed since the date specified. |
| 11 | Amounts represent the portfolio allocation of the affiliated master portfolio which are calculated based on the total long-term investments of the affiliated master portfolio. These amounts are subject to change and may have changed since the date specified. |
| | | | |
| 8 | | Wells Fargo Core Bond Fund | | Performance highlights (unaudited) |
MANAGER’S DISCUSSION
Fund highlights
| ∎ | | The Fund underperformed its benchmark, the Bloomberg Barclays U.S. Aggregate Bond Index, for the 12-month period that ended May 31, 2019. |
| ∎ | | Security selection in credit and asset-backed securities (ABS), particularly within Federal Family Education Loan Program (FFELP) student loan ABS, detracted from performance, as did a small sector overweight to credit during the period. |
| ∎ | | A sector overweight to ABS and commercial mortgage-backed securities (CMBS), driven by our enthusiasm for security selection opportunities in these sectors, was a contributor to performance. |
The global economy and markets faced a range of issues.
Early during the period, the U.S. economy began to cool amid signals of a synchronized deceleration of global growth and weakness in China and parts of Europe. Despite this and with trade and political risks mounting, stocks rose to new highs, as market participants were keenly focused on a growing economy and monetary policy, with forecasts for rate hikes extending through 2020. Fixed-income markets also performed well, while rates trended somewhat higher, despite inflationary pressures remaining nonexistent.
Across the Pacific, President Donald Trump met with North Korean leader Kim Jong Un in Singapore as planned in the first-ever summit meeting between leaders of the contending nations. Meanwhile, The Bank of Japan (BOJ) tweaked its long-running monetary stimulus program in potentially a step toward normalization. On the trade front, as previously signaled and with the looming deadline for implementation, the Trump administration slapped tariffs on $200 billion in Chinese goods while China responded with duties of its own on $60 billion in U.S. goods.
In Europe, political risks were averted as Italy finalized its budget agreement with the European Commission, although Brexit negotiations stalled in Parliament despite the travails of Theresa May. The Turkish financial system fell under significant pressure during the summer months and the Turkish lira tumbled to new lows, exacerbating a broader slide in emerging markets. Parts of Europe are presently in recession, with the major centers of economic activity registering anemic growth.
Toward year-end, credit spreads began to widen despite solid reports of gross domestic product (GDP), earnings growth, and with the unemployment rate touching a 45-year low. Following the U.S. elections in November, Democrats seized control of the House of Representatives while Republicans held onto the Senate, in what was a national referendum on President Trump that drew a record number of voters to the polls. As anticipated, the U.S. Federal Reserve (Fed) unanimously decided to raise its key federal funds rate in December, the third hike of the year, and as it turns out, perhaps the last one for quite a while. Stocks plunged in December amid a ferocious flight to quality and following a refusal by President Trump to sign the Senate’s version of a short-term spending bill, the federal government partially shut down just prior to the Christmas holiday and remained shuttered for over a month.
As we moved into 2019, a more tepid Fed has completely reversed course, sounding off a more dovish tone. Stock and credit markets rebounded in spectacular fashion, with the S&P 500 Index9 posting its best January since 1987. The yield curve inverted somewhat during the first months of the year, perhaps a harbinger of the slowdown underway, a result of trade tensions between the U.S. and China. Futures markets indicated a rate cut in the intermediate term, an astounding reversal of conditions from those heading into year-end.
The return of volatility was short-lived, although these events set the stage for security selection opportunities during early 2019. Despite the reversal of stock prices and credit spreads amid the actions of Fed Chair Jay Powell and the Federal Open Market Committee, we believe that the conditions driving volatility remain firmly in place, with doubts surrounding resolution of trade and political risks, while the global economy continues to sputter. We look forward to employing our risk-constrained investment process in what could be very disorderly markets, laden with security price inefficiencies.
Please see footnotes on page 7.
| | | | | | |
| Performance highlights (unaudited) | | Wells Fargo Core Bond Fund | | | 9 | |
| | | | |
| Ten largest holdings (%) as of May 31, 201910 | |
| |
FNMA, 3.50%, 6-13-2049 | | | 5.26 | |
| |
U.S. Treasury Bond, 2.75%, 11-15-2047 | | | 2.11 | |
| |
U.S. Treasury Note, 2.75%, 9-20-2020 | | | 1.56 | |
| |
U.S. Treasury Note, 2.63%, 7-31-2020 | | | 1.55 | |
| |
U.S. Treasury Bond, 3.00%, 2-15-2048 | | | 1.55 | |
| |
U.S. Treasury Note, 2.50%, 2-28-2021 | | | 1.43 | |
| |
U.S. Treasury Note, 2.38%, 5-15-2029 | | | 1.34 | |
| |
U.S. Treasury Note, 1.63%, 2-15-2026 | | | 1.33 | |
| |
GNMA, 4.00%, 5-20-2049 | | | 1.33 | |
| |
U.S. Treasury Note, 2.13%, 2-29-2024 | | | 1.23 | |
|
| Portfolio allocation as of May 31, 201911 |
|
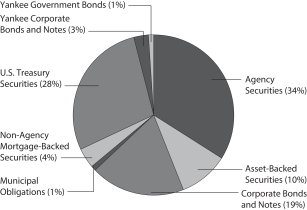 |
Portfolio positioning continues to be driven by our fundamental analysis and assessment of relative-value trading opportunities
We continue to favor ABS with our largest overweight because we view the core sectors of this market as possessing stable fundamentals. We have reduced our position somewhat to control our ABS exposure following its strong performance. We continue to find attractive fundamentals within the core subsectors of the market and relative-value opportunities in both the primary and secondary markets. We found opportunities for favorable security selection within the FFELP and the private student loan spaces.
During the period, we moved to an overweight position in agency mortgage-backed securities (MBS) from an underweight, seeing a healthy opportunity set emerge as market participants adjust to rapid shifts in the interest rate environment. Bottom-up security selection opportunities improved in higher-coupon Government National Mortgage Association securities, along with specified pools and collateralized mortgage obligations (CMOs). The MBS sector is a potential source of significant alpha given heightened interest rate volatility and following a pullback from the Fed, which had been a big buyer of MBS throughout the years of quantitative stimulus.
Based on our fundamental analysis and assessment of relative-value trading opportunities, we maintained a small overweight to credit and have been very close to neutral throughout the period. Although primary market volumes are off from last year, we anticipate a healthy new issuance calendar as a meaningful gateway to liquidity. Despite the tempered overall sector weight to credit, the portfolio is imbedded with dozens of security-level risk exposures, exploiting our view of pricing inefficiencies.
As always, the Fund strategy seeks to neutralize macro variables, including rates and currencies. Therefore, duration had a neutral effect on performance. Instead, the Fund seeks to capture relative value with bottom-up security selection, focused on inefficiently priced securities within our investment universe.
We believe fixed-income markets may provide opportunities in 2019.
Amid these adverse developments, markets have swiftly repriced, with Treasuries now pricing in a likelihood of multiple 25-basis-point (100 basis points equal 1.00%) rate cuts or the possibility of a smaller number of larger cuts within the next 12 months. Across the curve, Treasuries rallied in May at the fastest pace since the financial crisis, and equities had the second-worst May in over 50 years. Given that financial markets are pricing in a much different scenario than previously envisioned, market participants will need to assess if the recent economic weakness can moderate somewhat, mitigating recent deceleration and recessionary concerns. Trade headlines, which took an abrupt shift in May, could portend a more difficult period or could yet again trend toward resolution.
We believe fixed-income markets may provide superior security selection opportunities in 2019 and potentially a period of heightened volatility following upheaval late last year and amid the continued volatile interest rate environment. We will seek to add value through our bottom-up, active, relative-value investment management approach while maintaining a disciplined approach to risk management. We continue to focus on bottom-up security selection and intend to take advantage of relative-value dislocations as they arise. As always, we remain nimble and agile and stand ready to take advantage of security selection opportunities as they arise.
Please see footnotes on page 7.
| | | | |
| 10 | | Wells Fargo Core Bond Fund | | Fund expenses (unaudited) |
As a shareholder of the Fund, you incur two types of costs: (1) transaction costs, including sales charges (loads) on purchase payments and contingent deferred sales charges (if any) on redemptions and (2) ongoing costs, including management fees, distribution (12b-1) and/or shareholder servicing fees, and other Fund expenses. This example is intended to help you understand your ongoing costs (in dollars) of investing in the Fund and to compare these costs with the ongoing costs of investing in other mutual funds.
The example is based on an investment of $1,000 invested at the beginning of the six-month period and held for the entire period from December 1, 2018 to May 31, 2019.
Actual expenses
The “Actual” line of the table below provides information about actual account values and actual expenses. You may use the information in this line, together with the amount you invested, to estimate the expenses that you paid over the period. Simply divide your account value by $1,000 (for example, an $8,600 account value divided by $1,000 = 8.6), then multiply the result by the number in the “Actual” line under the heading entitled “Expenses paid during period” for your applicable class of shares to estimate the expenses you paid on your account during this period.
Hypothetical example for comparison purposes
The “Hypothetical” line of the table below provides information about hypothetical account values and hypothetical expenses based on the Fund’s actual expense ratio and an assumed rate of return of 5% per year before expenses, which is not the Fund’s actual return. The hypothetical account values and expenses may not be used to estimate the actual ending account balance or expenses you paid for the period. You may use this information to compare the ongoing costs of investing in the Fund and other funds. To do so, compare this 5% hypothetical example with the 5% hypothetical examples that appear in the shareholder reports of the other funds.
Please note that the expenses shown in the table are meant to highlight your ongoing costs only and do not reflect any transactional costs, such as sales charges (loads) and contingent deferred sales charges. Therefore, the “Hypothetical” line of the table is useful in comparing ongoing costs only and will not help you determine the relative total costs of owning different funds. In addition, if these transactional costs were included, your costs would have been higher.
| | | | | | | | | | | | | | | | |
| | | Beginning
account value
12-1-2018 | | | Ending
account value
5-31-2019 | | | Expenses
paid during
the period1,2 | | | Annualized net
expense ratio1 | |
Class A | | | | | | | | | | | | | | | | |
| | | | |
Actual | | $ | 1,000.00 | | | $ | 1,063.22 | | | $ | 4.01 | | | | 0.78 | % |
| | | | |
Hypothetical (5% return before expenses) | | $ | 1,000.00 | | | $ | 1,021.04 | | | $ | 3.93 | | | | 0.78 | % |
Class C | | | | | | | | | | | | | | | | |
| | | | |
Actual | | $ | 1,000.00 | | | $ | 1,058.95 | | | $ | 7.85 | | | | 1.53 | % |
| | | | |
Hypothetical (5% return before expenses) | | $ | 1,000.00 | | | $ | 1,017.30 | | | $ | 7.69 | | | | 1.53 | % |
Class R | | | | | | | | | | | | | | | | |
| | | | |
Actual | | $ | 1,000.00 | | | $ | 1,061.48 | | | $ | 5.29 | | | | 1.03 | % |
| | | | |
Hypothetical (5% return before expenses) | | $ | 1,000.00 | | | $ | 1,019.80 | | | $ | 5.19 | | | | 1.03 | % |
Class R4 | | | | | | | | | | | | | | | | |
| | | | |
Actual | | $ | 1,000.00 | | | $ | 1,064.21 | | | $ | 2.68 | | | | 0.52 | % |
| | | | |
Hypothetical (5% return before expenses) | | $ | 1,000.00 | | | $ | 1,022.34 | | | $ | 2.62 | | | | 0.52 | % |
Class R6 | | | | | | | | | | | | | | | | |
| | | | |
Actual | | $ | 1,000.00 | | | $ | 1,065.87 | | | $ | 1.90 | | | | 0.37 | % |
| | | | |
Hypothetical (5% return before expenses) | | $ | 1,000.00 | | | $ | 1,023.09 | | | $ | 1.87 | | | | 0.37 | % |
Administrator Class | | | | | | | | | | | | | | | | |
| | | | |
Actual | | $ | 1,000.00 | | | $ | 1,063.22 | | | $ | 3.60 | | | | 0.70 | % |
| | | | |
Hypothetical (5% return before expenses) | | $ | 1,000.00 | | | $ | 1,021.44 | | | $ | 3.53 | | | | 0.70 | % |
Institutional Class | | | | | | | | | | | | | | | | |
| | | | |
Actual | | $ | 1,000.00 | | | $ | 1,064.78 | | | $ | 2.16 | | | | 0.42 | % |
| | | | |
Hypothetical (5% return before expenses) | | $ | 1,000.00 | | | $ | 1,022.84 | | | $ | 2.12 | | | | 0.42 | % |
| 1 | Amounts reflect net expenses allocated from the affiliated Master Portfolio in which the Fund invests. |
| 2 | Expenses paid is equal to the annualized net expense ratio of each class multiplied by the average account value over the period, multiplied by the number of days in the most recent fiscal half-year divided by the number of days in the fiscal year (to reflect the one-half-year period). |
| | | | | | |
| Portfolio of investments—May 31, 2019 | | Wells Fargo Core Bond Fund | | | 11 | |
| | | | | | | | | | | | | | | | |
| Security name | | | | | | | | | | | Value | |
| | | | |
Investment Companies: 100.40% | | | | | | | | | | | | | | | | |
| | | | |
| Affiliated Master Portfolio: 100.40% | | | | | | | | | | | | | | | | |
| | | | |
Wells Fargo Core Bond Portfolio | | | | | | | | | | | | | | $ | 5,440,706,153 | |
| | | | | | | | | | | | | | | | |
| | | | |
Total Investment Companies (Cost $5,323,727,522) | | | | | | | | | | | | | | | 5,440,706,153 | |
| | | | | | | | | | | | | | | | |
| | | | | | | | |
| Total investments in securities (Cost $5,323,727,522) | | | 100.40 | % | | | 5,440,706,153 | |
| | |
Other assets and liabilities, net | | | (0.40 | ) | | | (21,890,141 | ) |
| | | | | | | | |
| Total net assets | | | 100.00 | % | | $ | 5,418,816,012 | |
| | | | | | | | |
Transactions with the affiliated Master Portfolio were as follows:
| | | | | | | | | | | | | | | | | | | | | | | | | | | | | | | | |
| | | % of
ownership,
beginning of
period | | | % of
ownership,
end of
period | | | Net
realized
gains
(losses) on
securities
transactions
allocated
from
affiliated
Master
Portfolio | | | Net
change in
unrealized
gains
(losses) on
securities
transactions
allocated
from
affiliated
Master
Portfolio | | | Interest
allocated
from
affiliated
Master
Portfolio | | | Affiliated
income
allocated
from
affiliated
Master
Portfolio | | | Value,
end
of period | | | % of
net
assets | |
Wells Fargo Core Bond Portfolio | | | 95 | % | | | 93 | % | | $ | (17,410,516 | ) | | $ | 182,530,737 | | | $ | 170,926,243 | | | $ | 2,009,973 | | | $ | 5,440,706,153 | | | | 100.40 | % |
The accompanying notes are an integral part of these financial statements.
| | | | |
| 12 | | Wells Fargo Core Bond Fund | | Statement of assets and liabilities—May 31, 2019 |
| | | | |
| | | | |
| |
Assets | | | | |
Investments in affiliated Master Portfolio, at value (cost $5,323,727,522) | | $ | 5,440,706,153 | |
Receivable for Fund shares sold | | | 6,578,462 | |
Receivable from manager | | | 112,038 | |
Prepaid expenses and other assets | | | 35,246 | |
| | | | |
Total assets | | | 5,447,431,899 | |
| | | | |
| |
Liabilities | | | | |
Payable for Fund shares redeemed | | | 25,517,940 | |
Dividends payable | | | 2,112,242 | |
Administration fees payable | | | 304,339 | |
Distribution fees payable | | | 25,127 | |
Accrued expenses and other liabilities | | | 656,239 | |
| | | | |
Total liabilities | | | 28,615,887 | |
| | | | |
Total net assets | | $ | 5,418,816,012 | |
| | | | |
| |
NET ASSETS CONSIST OF | | | | |
Paid-in capital | | $ | 5,435,657,316 | |
Total distributable loss | | | (16,841,304 | ) |
| | | | |
Total net assets | | $ | 5,418,816,012 | |
| | | | |
| |
COMPUTATION OF NET ASSET VALUE AND OFFERING PRICE PER SHARE | | | | |
Net assets – Class A | | $ | 302,245,584 | |
Shares outstanding – Class A1 | | | 22,766,174 | |
Net asset value per share – Class A | | | $13.28 | |
Maximum offering price per share – Class A2 | | | $13.91 | |
Net assets – Class C | | $ | 34,493,565 | |
Shares outstanding – Class C1 | | | 2,623,533 | |
Net asset value per share – Class C | | | $13.15 | |
Net assets – Class R | | $ | 8,565,273 | |
Shares outstanding – Class R1 | | | 660,949 | |
Net asset value per share – Class R | | | $12.96 | |
Net assets – Class R4 | | $ | 10,804,612 | |
Share outstanding – Class R41 | | | 834,074 | |
Net asset value per share – Class R4 | | | $12.95 | |
Net assets – Class R6 | | $ | 2,513,644,057 | |
Shares outstanding – Class R61 | | | 194,157,918 | |
Net asset value per share – Class R6 | | | $12.95 | |
Net assets – Administrator Class | | $ | 205,825,349 | |
Shares outstanding – Administrator Class1 | | | 15,882,064 | |
Net asset value per share – Administrator Class | | | $12.96 | |
Net assets – Institutional Class | | $ | 2,343,237,572 | |
Shares outstanding – Institutional Class1 | | | 181,051,411 | |
Net asset value per share – Institutional Class | | | $12.94 | |
| 1 | The Fund has an unlimited number of authorized shares. |
| 2 | Maximum offering price is computed as 100/95.50 of net asset value. On investments of $50,000 or more, the offering price is reduced. |
The accompanying notes are an integral part of these financial statements.
| | | | | | |
| Statement of operations—year ended May 31, 2019 | | Wells Fargo Core Bond Fund | | | 13 | |
| | | | |
| | | | |
| |
Investment income | | | | |
Interest allocated from affiliated Master Portfolio | | $ | 170,926,243 | |
Affiliated income allocated from affiliated Master Portfolio | | | 2,009,973 | |
Expenses allocated from affiliated Master Portfolio | | | (18,400,633 | ) |
| | | | |
Total investment income | | | 154,535,583 | |
| | | | |
| |
Expenses | | | | |
Management fee | | | 2,611,490 | |
Administration fees | | | | |
Class A | | | 493,290 | |
Class C | | | 66,975 | |
Class R | | | 18,393 | |
Class R4 | | | 9,017 | |
Class R6 | | | 669,196 | |
Administrator Class | | | 264,161 | |
Institutional Class | | | 1,923,317 | |
Shareholder servicing fees | | | | |
Class A | | | 770,765 | |
Class C | | | 104,649 | |
Class R | | | 28,499 | |
Class R4 | | | 11,272 | |
Administrator Class | | | 653,486 | |
Distribution fees | | | | |
Class C | | | 313,940 | |
Class R | | | 28,740 | |
Custody and accounting fees | | | 185,654 | |
Professional fees | | | 34,888 | |
Registration fees | | | 260,218 | |
Shareholder report expenses | | | 388,241 | |
Trustees’ fees and expenses | | | 21,324 | |
Other fees and expenses | | | 103,153 | |
| | | | |
Total expenses | | | 8,960,668 | |
Less: Fee waivers and/or expense reimbursements | | | (3,942,997 | ) |
| | | | |
Net expenses | | | 5,017,671 | |
| | | | |
Net investment income | | | 149,517,912 | |
| | | | |
| |
REALIZED AND UNREALIZED GAINS (LOSSES) ON INVESTMENTS | | | | |
Net realized losses on securities transactions allocated from affiliated Master Portfolio | | | (17,410,516 | ) |
Net change in unrealized gains (losses) on securities transactions allocated from affiliated Master Portfolio | | | 182,530,737 | |
| | | | |
Net realized and unrealized gains (losses) on investments | | | 165,120,221 | |
| | | | |
Net increase in net assets resulting from operations | | $ | 314,638,133 | |
| | | | |
The accompanying notes are an integral part of these financial statements.
| | | | |
| 14 | | Wells Fargo Core Bond Fund | | Statement of changes in net assets |
| | | | | | | | | | | | | | | | |
| | | Year ended
May 31, 2019 | | | Year ended
May 31, 20181 | |
| | | | |
Operations | | | | | | | | | | | | | | | | |
Net investment income | | | | | | $ | 149,517,912 | | | | | | | $ | 109,290,228 | |
Net realized losses on investments | | | | | | | (17,410,516 | ) | | | | | | | (51,477,064 | ) |
Net change in unrealized gains (losses) on investments | | | | | | | 182,530,737 | | | | | | | | (93,493,410 | ) |
| | | | |
Net increase (decrease) in net assets resulting from operations | | | | | | | 314,638,133 | | | | | | | | (35,680,246 | ) |
| | | | |
| | | | |
Distributions to shareholders from net investment income and net realized gains | | | | | | | | | | | | | | | | |
Class A | | | | | | | (7,707,522 | ) | | | | | | | (6,146,453 | ) |
Class C | | | | | | | (731,013 | ) | | | | | | | (561,310 | ) |
Class R | | | | | | | (258,514 | ) | | | | | | | (203,058 | ) |
Class R4 | | | | | | | (310,999 | ) | | | | | | | (706,139 | ) |
Class R6 | | | | | | | (65,026,382 | ) | | | | | | | (24,689,238 | ) |
Administrator Class | | | | | | | (6,822,022 | ) | | | | | | | (6,023,458 | ) |
Institutional Class | | | | | | | (68,704,939 | ) | | | | | | | (70,984,919 | ) |
| | | | |
Total distributions to shareholders | | | | | | | (149,561,391 | ) | | | | | | | (109,314,575 | ) |
| | | | |
| | | | |
Capital share transactions | | | Shares | | | | | | | | Shares | | | | | |
Proceeds from shares sold | | | | | | | | | | | | | | | | |
Class A | | | 5,814,230 | | | | 74,731,899 | | | | 5,948,905 | | | | 78,111,325 | |
Class C | | | 504,131 | | | | 6,445,467 | | | | 660,100 | | | | 8,585,693 | |
Class R | | | 192,684 | | | | 2,418,555 | | | | 314,720 | | | | 4,024,861 | |
Class R4 | | | 232,839 | | | | 2,916,548 | | | | 636,388 | | | | 8,152,388 | |
Class R6 | | | 134,743,486 | | | | 1,690,762,705 | | | | 65,439,055 | | | | 837,238,882 | |
Administrator Class | | | 7,054,319 | | | | 87,991,112 | | | | 6,358,669 | | | | 81,613,591 | |
Institutional Class | | | 62,642,714 | | | | 786,483,803 | | | | 109,824,335 | | | | 1,402,149,298 | |
| | | | |
| | | | |
| | | | | | | 2,651,750,089 | | | | | | | | 2,419,876,038 | |
| | | | |
Reinvestment of distributions | | | | | | | | | | | | | | | | |
Class A | | | 517,112 | | | | 6,661,968 | | | | 406,222 | | | | 5,315,016 | |
Class C | | | 27,587 | | | | 351,123 | | | | 23,283 | | | | 301,658 | |
Class R | | | 2,650 | | | | 33,322 | | | | 2,181 | | | | 27,892 | |
Class R4 | | | 24,725 | | | | 310,703 | | | | 51,321 | | | | 658,202 | |
Class R6 | | | 4,654,160 | | | | 58,457,025 | | | | 1,705,109 | | | | 21,706,594 | |
Administrator Class | | | 528,027 | | | | 6,640,587 | | | | 457,541 | | | | 5,851,867 | |
Institutional Class | | | 4,468,964 | | | | 56,130,059 | | | | 4,338,888 | | | | 55,292,897 | |
| | | | |
| | | | |
| | | | | | | 128,584,787 | | | | | | | | 89,154,126 | |
| | | | |
Payment for shares redeemed | | | | | | | | | | | | | | | | |
Class A | | | (8,462,820 | ) | | | (108,862,680 | ) | | | (8,713,141 | ) | | | (114,094,388 | ) |
Class C | | | (1,664,172 | ) | | | (21,223,278 | ) | | | (1,437,868 | ) | | | (18,650,713 | ) |
Class R | | | (508,524 | ) | | | (6,425,841 | ) | | | (414,247 | ) | | | (5,296,848 | ) |
Class R4 | | | (354,232 | ) | | | (4,433,486 | ) | | | (3,109,817 | ) | | | (39,224,105 | ) |
Class R6 | | | (53,758,496 | ) | | | (673,745,873 | ) | | | (20,533,471 | ) | | | (261,667,805 | ) |
Administrator Class | | | (13,129,627 | ) | | | (165,688,347 | ) | | | (14,295,796 | ) | | | (183,753,304 | ) |
Institutional Class | | | (150,751,229 | ) | | | (1,886,370,187 | ) | | | (95,212,522 | ) | | | (1,214,837,005 | ) |
| | | | |
| | | | |
| | | | | | | (2,866,749,692 | ) | | | | | | | (1,837,524,168 | ) |
| | | | |
Net increase (decrease) in net assets resulting from capital share transactions | | | | | | | (86,414,816 | ) | | | | | | | 671,505,996 | |
| | | | |
Total increase in net assets | | | | | | | 78,661,926 | | | | | | | | 526,511,175 | |
| | | | |
| | | | |
Net assets | | | | | | | | | | | | | | | | |
Beginning of period | | | | | | | 5,340,154,086 | | | | | | | | 4,813,642,911 | |
| | | | |
End of period | | | | | | $ | 5,418,816,012 | | | | | | | $ | 5,340,154,086 | |
| | | | |
| 1 | Effective for all filings after November 4, 2018, the SEC prospectively eliminated the requirement to parenthetically disclose undistributed net investment income at the end of the period and permitted the aggregation of distributions, with the exception of tax basis returns of capital. Overdistributed net investment income at May 31, 2018 was $140,624. The disaggregated distributions information for the year ended May 31, 2018 is included in Note 7,Distributions to Shareholders, in the notes to the financial statements. |
The accompanying notes are an integral part of these financial statements.
| | | | | | |
| Financial highlights | | Wells Fargo Core Bond Fund | | | 15 | |
(For a share outstanding throughout each period)
| | | | | | | | | | | | | | | | | | | | |
| | | Year ended May 31 | |
| CLASS A | | 2019 | | | 2018 | | | 2017 | | | 2016 | | | 2015 | |
Net asset value, beginning of period | | | $12.86 | | | | $13.22 | | | | $13.28 | | | | $13.16 | | | | $12.98 | |
Net investment income | | | 0.32 | | | | 0.24 | | | | 0.19 | 1 | | | 0.19 | 1 | | | 0.18 | |
Net realized and unrealized gains (losses) on investments | | | 0.42 | | | | (0.36 | ) | | | 0.00 | | | | 0.12 | | | | 0.19 | |
| | | | | | | | | | | | | | | | | | | | |
Total from investment operations | | | 0.74 | | | | (0.12 | ) | | | 0.19 | | | | 0.31 | | | | 0.37 | |
Distributions to shareholders from | | | | | | | | | | | | | | | | | | | | |
Net investment income | | | (0.32 | ) | | | (0.24 | ) | | | (0.19 | ) | | | (0.19 | ) | | | (0.19 | ) |
Net realized gains | | | 0.00 | | | | 0.00 | | | | (0.06 | ) | | | 0.00 | | | | 0.00 | |
| | | | | | | | | | | | | | | | | | | | |
Total distributions to shareholders | | | (0.32 | ) | | | (0.24 | ) | | | (0.25 | ) | | | (0.19 | ) | | | (0.19 | ) |
Net asset value, end of period | | | $13.28 | | | | $12.86 | | | | $13.22 | | | | $13.28 | | | | $13.16 | |
Total return2 | | | 5.87 | % | | | (0.96 | )% | | | 1.48 | % | | | 2.36 | % | | | 2.85 | % |
Ratios to average net assets (annualized) | | | | | | | | | | | | | | | | | | | | |
Gross expenses3 | | | 0.83 | % | | | 0.83 | % | | | 0.83 | % | | | 0.83 | % | | | 0.83 | % |
Net expenses3 | | | 0.78 | % | | | 0.78 | % | | | 0.78 | % | | | 0.78 | % | | | 0.78 | % |
Net investment income3 | | | 2.50 | % | | | 1.79 | % | | | 1.40 | % | | | 1.43 | % | | | 1.39 | % |
Supplemental data | | | | | | | | | | | | | | | | | | | | |
Portfolio turnover rate4 | | | 577 | % | | | 542 | % | | | 614 | % | | | 667 | % | | | 586 | % |
Net assets, end of period (000s omitted) | | | $302,246 | | | | $320,208 | | | | $360,276 | | | | $699,273 | | | | $506,043 | |
| 1 | Calculated based upon average shares outstanding |
| 2 | Total return calculations do not include any sales charges. |
| 3 | Ratios include net expenses allocated from the affiliated Master Portfolio which were as follows: |
| | | | |
Year ended May 31, 2019 | | | 0.35 | % |
Year ended May 31, 2018 | | | 0.35 | % |
Year ended May 31, 2017 | | | 0.35 | % |
Year ended May 31, 2016 | | | 0.35 | % |
Year ended May 31, 2015 | | | 0.35 | % |
| 4 | Portfolio turnover rate is calculated by multiplying the affiliated Master Portfolio’s percentage of the Fund’s total investments in securities at the end of the period by the affiliated Master Portfolio’s portfolio turnover rate. |
The accompanying notes are an integral part of these financial statements.
| | | | |
| 16 | | Wells Fargo Core Bond Fund | | Financial highlights |
(For a share outstanding throughout each period)
| | | | | | | | | | | | | | | | | | | | |
| | | Year ended May 31 | |
| CLASS C | | 2019 | | | 2018 | | | 2017 | | | 2016 | | | 2015 | |
Net asset value, beginning of period | | | $12.74 | | | | $13.09 | | | | $13.15 | | | | $13.03 | | | | $12.86 | |
Net investment income | | | 0.23 | | | | 0.14 | | | | 0.09 | | | | 0.09 | | | | 0.09 | |
Net realized and unrealized gains (losses) on investments | | | 0.40 | | | | (0.35 | ) | | | 0.00 | | | | 0.12 | | | | 0.17 | |
| | | | | | | | | | | | | | | | | | | | |
Total from investment operations | | | 0.63 | | | | (0.21 | ) | | | 0.09 | | | | 0.21 | | | | 0.26 | |
Distributions to shareholders from | | | | | | | | | | | | | | | | | | | | |
Net investment income | | | (0.22 | ) | | | (0.14 | ) | | | (0.09 | ) | | | (0.09 | ) | | | (0.09 | ) |
Net realized gains | | | 0.00 | | | | 0.00 | | | | (0.06 | ) | | | 0.00 | | | | 0.00 | |
| | | | | | | | | | | | | | | | | | | | |
Total distributions to shareholders | | | (0.22 | ) | | | (0.14 | ) | | | (0.15 | ) | | | (0.09 | ) | | | (0.09 | ) |
Net asset value, end of period | | | $13.15 | | | | $12.74 | | | | $13.09 | | | | $13.15 | | | | $13.03 | |
Total return1 | | | 5.04 | % | | | (1.65 | )% | | | 0.72 | % | | | 1.61 | % | | | 2.02 | % |
Ratios to average net assets (annualized) | | | | | | | | | | | | | | | | | | | | |
Gross expenses2 | | | 1.58 | % | | | 1.58 | % | | | 1.58 | % | | | 1.58 | % | | | 1.58 | % |
Net expenses2 | | | 1.53 | % | | | 1.53 | % | | | 1.53 | % | | | 1.53 | % | | | 1.53 | % |
Net investment income2 | | | 1.75 | % | | | 1.04 | % | | | 0.68 | % | | | 0.68 | % | | | 0.65 | % |
Supplemental data | | | | | | | | | | | | | | | | | | | | |
Portfolio turnover rate3 | | | 577 | % | | | 542 | % | | | 614 | % | | | 667 | % | | | 586 | % |
Net assets, end of period (000s omitted) | | | $34,494 | | | | $47,843 | | | | $59,049 | | | | $66,612 | | | | $72,798 | |
| 1 | Total return calculations do not include any sales charges. |
| 2 | Ratios include net expenses allocated from the affiliated Master Portfolio which were as follows: |
| | | | |
Year ended May 31, 2019 | | | 0.35 | % |
Year ended May 31, 2018 | | | 0.35 | % |
Year ended May 31, 2017 | | | 0.35 | % |
Year ended May 31, 2016 | | | 0.35 | % |
Year ended May 31, 2015 | | | 0.35 | % |
| 3 | Portfolio turnover rate is calculated by multiplying the affiliated Master Portfolio’s percentage of the Fund’s total investments in securities at the end of the period by the affiliated Master Portfolio’s portfolio turnover rate. |
The accompanying notes are an integral part of these financial statements.
| | | | | | |
| Financial highlights | | Wells Fargo Core Bond Fund | | | 17 | |
(For a share outstanding throughout each period)
| | | | | | | | | | | | | | | | | | | | |
| | | Year ended May 31 | |
| CLASS R | | 2019 | | | 2018 | | | 2017 | | | 2016 | | | 2015 | |
Net asset value, beginning of period | | | $12.55 | | | | $12.90 | | | | $12.97 | | | | $12.85 | | | | $12.67 | |
Net investment income | | | 0.28 | 1 | | | 0.20 | 1 | | | 0.15 | 1 | | | 0.15 | 1 | | | 0.15 | 1 |
Net realized and unrealized gains (losses) on investments | | | 0.41 | | | | (0.35 | ) | | | (0.01 | ) | | | 0.12 | | | | 0.18 | |
| | | | | | | | | | | | | | | | | | | | |
Total from investment operations | | | 0.69 | | | | (0.15 | ) | | | 0.14 | | | | 0.27 | | | | 0.33 | |
Distributions to shareholders from | | | | | | | | | | | | | | | | | | | | |
Net investment income | | | (0.28 | ) | | | (0.20 | ) | | | (0.15 | ) | | | (0.15 | ) | | | (0.15 | ) |
Net realized gains | | | 0.00 | | | | 0.00 | | | | (0.06 | ) | | | 0.00 | | | | 0.00 | |
| | | | | | | | | | | | | | | | | | | | |
Total distributions to shareholders | | | (0.28 | ) | | | (0.20 | ) | | | (0.21 | ) | | | (0.15 | ) | | | (0.15 | ) |
Net asset value, end of period | | | $12.96 | | | | $12.55 | | | | $12.90 | | | | $12.97 | | | | $12.85 | |
Total return | | | 5.61 | % | | | (1.19 | )% | | | 1.15 | % | | | 2.13 | % | | | 2.63 | % |
Ratios to average net assets (annualized) | | | | | | | | | | | | | | | | | | | | |
Gross expenses2 | | | 1.07 | % | | | 1.08 | % | | | 1.08 | % | | | 1.08 | % | | | 1.08 | % |
Net expenses2 | | | 1.03 | % | | | 1.03 | % | | | 1.03 | % | | | 1.03 | % | | | 1.03 | % |
Net investment income2 | | | 2.25 | % | | | 1.54 | % | | | 1.18 | % | | | 1.18 | % | | | 1.15 | % |
Supplemental data | | | | | | | | | | | | | | | | | | | | |
Portfolio turnover rate3 | | | 577 | % | | | 542 | % | | | 614 | % | | | 667 | % | | | 586 | % |
Net assets, end of period (000s omitted) | | | $8,565 | | | | $12,230 | | | | $13,826 | | | | $17,985 | | | | $16,411 | |
| 1 | Calculated based upon average shared outstanding |
| 2 | Ratios include net expenses allocated from the affiliated Master Portfolio which were as follows: |
| | | | |
Year ended May 31, 2019 | | | 0.35 | % |
Year ended May 31, 2018 | | | 0.35 | % |
Year ended May 31, 2017 | | | 0.35 | % |
Year ended May 31, 2016 | | | 0.35 | % |
Year ended May 31, 2015 | | | 0.35 | % |
| 3 | Portfolio turnover rate is calculated by multiplying the affiliated Master Portfolio’s percentage of the Fund’s total investments in securities at the end of the period by the affiliated Master Portfolio’s portfolio turnover rate. |
The accompanying notes are an integral part of these financial statements.
| | | | |
| 18 | | Wells Fargo Core Bond Fund | | Financial highlights |
(For a share outstanding throughout each period)
| | | | | | | | | | | | | | | | | | | | |
| | | Year ended May 31 | |
| CLASS R4 | | 2019 | | | 2018 | | | 2017 | | | 2016 | | | 2015 | |
Net asset value, beginning of period | | | $12.55 | | | | $12.89 | | | | $12.95 | | | | $12.83 | | | | $12.66 | |
Net investment income | | | 0.35 | | | | 0.26 | 1 | | | 0.22 | | | | 0.22 | | | | 0.21 | |
Net realized and unrealized gains (losses) on investments | | | 0.40 | | | | (0.34 | ) | | | 0.00 | | | | 0.12 | | | | 0.18 | |
| | | | | | | | | | | | | | | | | | | | |
Total from investment operations | | | 0.75 | | | | (0.08 | ) | | | 0.22 | | | | 0.34 | | | | 0.39 | |
Distributions to shareholders from | | | | | | | | | | | | | | | | | | | | |
Net investment income | | | (0.35 | ) | | | (0.26 | ) | | | (0.22 | ) | | | (0.22 | ) | | | (0.22 | ) |
Net realized gains | | | 0.00 | | | | 0.00 | | | | (0.06 | ) | | | 0.00 | | | | 0.00 | |
| | | | | | | | | | | | | | | | | | | | |
Total distributions to shareholders | | | (0.35 | ) | | | (0.26 | ) | | | (0.28 | ) | | | (0.22 | ) | | | (0.22 | ) |
Net asset value, end of period | | | $12.95 | | | | $12.55 | | | | $12.89 | | | | $12.95 | | | | $12.83 | |
Total return | | | 6.07 | % | | | (0.61 | )% | | | 1.74 | % | | | 2.65 | % | | | 3.07 | % |
Ratios to average net assets (annualized) | | | | | | | | | | | | | | | | | | | | |
Gross expenses2 | | | 0.60 | % | | | 0.60 | % | | | 0.60 | % | | | 0.60 | % | | | 0.59 | % |
Net expenses2 | | | 0.52 | % | | | 0.52 | % | | | 0.52 | % | | | 0.52 | % | | | 0.52 | % |
Net investment income2 | | | 2.76 | % | | | 2.01 | % | | | 1.70 | % | | | 1.69 | % | | | 1.53 | % |
Supplemental data | | | | | | | | | | | | | | | | | | | | |
Portfolio turnover rate3 | | | 577 | % | | | 542 | % | | | 614 | % | | | 667 | % | | | 586 | % |
Net assets, end of period (000s omitted) | | | $10,805 | | | | $11,680 | | | | $43,205 | | | | $41,272 | | | | $49,261 | |
| 1 | Calculated based upon average shared outstanding |
| 2 | Ratios include net expenses allocated from the affiliated Master Portfolio which were as follows: |
| | | | |
Year ended May 31, 2019 | | | 0.35 | % |
Year ended May 31, 2018 | | | 0.35 | % |
Year ended May 31, 2017 | | | 0.35 | % |
Year ended May 31, 2016 | | | 0.35 | % |
Year ended May 31, 2015 | | | 0.35 | % |
| 3 | Portfolio turnover rate is calculated by multiplying the affiliated Master Portfolio’s percentage of the Fund’s total investments in securities at the end of the period by the affiliated Master Portfolio’s portfolio turnover rate. |
The accompanying notes are an integral part of these financial statements.
| | | | | | |
| Financial highlights | | Wells Fargo Core Bond Fund | | | 19 | |
(For a share outstanding throughout each period)
| | | | | | | | | | | | | | | | | | | | |
| | | Year ended May 31 | |
| CLASS R6 | | 2019 | | | 2018 | | | 2017 | | | 2016 | | | 2015 | |
Net asset value, beginning of period | | | $12.54 | | | | $12.89 | | | | $12.95 | | | | $12.83 | | | | $12.66 | |
Net investment income | | | 0.37 | | | | 0.28 | | | | 0.24 | | | | 0.24 | | | | 0.23 | |
Net realized and unrealized gains (losses) on investments | | | 0.41 | | | | (0.35 | ) | | | 0.00 | | | | 0.12 | | | | 0.17 | |
| | | | | | | | | | | | | | | | | | | | |
Total from investment operations | | | 0.78 | | | | (0.07 | ) | | | 0.24 | | | | 0.36 | | | | 0.40 | |
Distributions to shareholders from | | | | | | | | | | | | | | | | | | | | |
Net investment income | | | (0.37 | ) | | | (0.28 | ) | | | (0.24 | ) | | | (0.24 | ) | | | (0.23 | ) |
Net realized gains | | | 0.00 | | | | 0.00 | | | | (0.06 | ) | | | 0.00 | | | | 0.00 | |
| | | | | | | | | | | | | | | | | | | | |
Total distributions to shareholders | | | (0.37 | ) | | | (0.28 | ) | | | (0.30 | ) | | | (0.24 | ) | | | (0.23 | ) |
Net asset value, end of period | | | $12.95 | | | | $12.54 | | | | $12.89 | | | | $12.95 | | | | $12.83 | |
Total return | | | 6.31 | % | | | (0.54 | )% | | | 1.90 | % | | | 2.81 | % | | | 3.23 | % |
Ratios to average net assets (annualized) | | | | | | | | | | | | | | | | | | | | |
Gross expenses1 | | | 0.45 | % | | | 0.45 | % | | | 0.45 | % | | | 0.45 | % | | | 0.45 | % |
Net expenses1 | | | 0.37 | % | | | 0.37 | % | | | 0.37 | % | | | 0.37 | % | | | 0.37 | % |
Net investment income1 | | | 2.92 | % | | | 2.24 | % | | | 1.87 | % | | | 1.84 | % | | | 1.76 | % |
Supplemental data | | | | | | | | | | | | | | | | | | | | |
Portfolio turnover rate2 | | | 577 | % | | | 542 | % | | | 614 | % | | | 667 | % | | | 586 | % |
Net assets, end of period (000s omitted) | | | $2,513,644 | | | | $1,360,847 | | | | $797,896 | | | | $450,791 | | | | $726,165 | |
| 1 | Ratios include net expenses allocated from the affiliated Master Portfolio which were as follows: |
| | | | |
Year ended May 31, 2019 | | | 0.35 | % |
Year ended May 31, 2018 | | | 0.35 | % |
Year ended May 31, 2017 | | | 0.35 | % |
Year ended May 31, 2016 | | | 0.35 | % |
Year ended May 31, 2015 | | | 0.35 | % |
| 2 | Portfolio turnover rate is calculated by multiplying the affiliated Master Portfolio’s percentage of the Fund’s total investments in securities at the end of the period by the affiliated Master Portfolio’s portfolio turnover rate. |
The accompanying notes are an integral part of these financial statements.
| | | | |
| 20 | | Wells Fargo Core Bond Fund | | Financial highlights |
(For a share outstanding throughout each period)
| | | | | | | | | | | | | | | | | | | | |
| | | Year ended May 31 | |
| ADMINISTRATOR CLASS | | 2019 | | | 2018 | | | 2017 | | | 2016 | | | 2015 | |
Net asset value, beginning of period | | | $12.56 | | | | $12.90 | | | | $12.97 | | | | $12.85 | | | | $12.67 | |
Net investment income | | | 0.33 | 1 | | | 0.24 | 1 | | | 0.21 | | | | 0.19 | | | | 0.19 | 1 |
Net realized and unrealized gains (losses) on investments | | | 0.40 | | | | (0.34 | ) | | | (0.02 | ) | | | 0.12 | | | | 0.18 | |
| | | | | | | | | | | | | | | | | | | | |
Total from investment operations | | | 0.73 | | | | (0.10 | ) | | | 0.19 | | | | 0.31 | | | | 0.37 | |
Distributions to shareholders from | | | | | | | | | | | | | | | | | | | | |
Net investment income | | | (0.33 | ) | | | (0.24 | ) | | | (0.20 | ) | | | (0.19 | ) | | | (0.19 | ) |
Net realized gains | | | 0.00 | | | | 0.00 | | | | (0.06 | ) | | | 0.00 | | | | 0.00 | |
| | | | | | | | | | | | | | | | | | | | |
Total distributions to shareholders | | | (0.33 | ) | | | (0.24 | ) | | | (0.26 | ) | | | (0.19 | ) | | | (0.19 | ) |
Net asset value, end of period | | | $12.96 | | | | $12.56 | | | | $12.90 | | | | $12.97 | | | | $12.85 | |
Total return | | | 5.87 | % | | | (0.79 | )% | | | 1.48 | % | | | 2.47 | % | | | 2.96 | % |
Ratios to average net assets (annualized) | | | | | | | | | | | | | | | | | | | | |
Gross expenses2 | | | 0.76 | % | | | 0.77 | % | | | 0.77 | % | | | 0.77 | % | | | 0.77 | % |
Net expenses2 | | | 0.70 | % | | | 0.70 | % | | | 0.70 | % | | | 0.70 | % | | | 0.70 | % |
Net investment income2 | | | 2.58 | % | | | 1.86 | % | | | 1.50 | % | | | 1.51 | % | | | 1.47 | % |
Supplemental data | | | | | | | | | | | | | | | | | | | | |
Portfolio turnover rate3 | | | 577 | % | | | 542 | % | | | 614 | % | | | 667 | % | | | 586 | % |
Net assets, end of period (000s omitted) | | | $205,825 | | | | $269,057 | | | | $373,042 | | | | $529,530 | | | | $487,981 | |
| 1 | Calculated based upon average shared outstanding |
| 2 | Ratios include net expenses allocated from the affiliated Master Portfolio which were as follows: |
| | | | |
Year ended May 31, 2019 | | | 0.35 | % |
Year ended May 31, 2018 | | | 0.35 | % |
Year ended May 31, 2017 | | | 0.35 | % |
Year ended May 31, 2016 | | | 0.35 | % |
Year ended May 31, 2015 | | | 0.35 | % |
| 3 | Portfolio turnover rate is calculated by multiplying the affiliated Master Portfolio’s percentage of the Fund’s total investments in securities at the end of the period by the affiliated Master Portfolio’s portfolio turnover rate. |
The accompanying notes are an integral part of these financial statements.
| | | | | | |
| Financial highlights | | Wells Fargo Core Bond Fund | | | 21 | |
(For a share outstanding throughout each period)
| | | | | | | | | | | | | | | | | | | | |
| | | Year ended May 31 | |
| INSTITUTIONAL CLASS | | 2019 | | | 2018 | | | 2017 | | | 2016 | | | 2015 | |
Net asset value, beginning of period | | | $12.54 | | | | $12.88 | | | | $12.95 | | | | $12.83 | | | | $12.66 | |
Net investment income | | | 0.36 | | | | 0.28 | | | | 0.23 | | | | 0.23 | | | | 0.22 | |
Net realized and unrealized gains (losses) on investments | | | 0.40 | | | | (0.34 | ) | | | (0.01 | ) | | | 0.12 | | | | 0.18 | |
| | | | | | | | | | | | | | | | | | | | |
Total from investment operations | | | 0.76 | | | | (0.06 | ) | | | 0.22 | | | | 0.35 | | | | 0.40 | |
Distributions to shareholders from | | | | | | | | | | | | | | | | | | | | |
Net investment income | | | (0.36 | ) | | | (0.28 | ) | | | (0.23 | ) | | | (0.23 | ) | | | (0.23 | ) |
Net realized gains | | | 0.00 | | | | 0.00 | | | | (0.06 | ) | | | 0.00 | | | | 0.00 | |
| | | | | | | | | | | | | | | | | | | | |
Total distributions to shareholders | | | (0.36 | ) | | | (0.28 | ) | | | (0.29 | ) | | | (0.23 | ) | | | (0.23 | ) |
Net asset value, end of period | | | $12.94 | | | | $12.54 | | | | $12.88 | | | | $12.95 | | | | $12.83 | |
Total return | | | 6.18 | % | | | (0.51 | )% | | | 1.77 | % | | | 2.76 | % | | | 3.17 | % |
Ratios to average net assets (annualized) | | | | | | | | | | | | | | | | | | | | |
Gross expenses1 | | | 0.50 | % | | | 0.50 | % | | | 0.50 | % | | | 0.50 | % | | | 0.50 | % |
Net expenses1 | | | 0.42 | % | | | 0.42 | % | | | 0.42 | % | | | 0.42 | % | | | 0.42 | % |
Net investment income1 | | | 2.86 | % | | | 2.16 | % | | | 1.82 | % | | | 1.79 | % | | | 1.75 | % |
Supplemental data | | | | | | | | | | | | | | | | | | | | |
Portfolio turnover rate2 | | | 577 | % | | | 542 | % | | | 614 | % | | | 667 | % | | | 586 | % |
Net assets, end of period (000s omitted) | | | $2,343,238 | | | | $3,318,290 | | | | $3,166,348 | | | | $2,102,073 | | | | $1,360,398 | |
| 1 | Ratios include net expenses allocated from the affiliated Master Portfolio which were as follows: |
| | | | |
Year ended May 31, 2019 | | | 0.35 | % |
Year ended May 31, 2018 | | | 0.35 | % |
Year ended May 31, 2017 | | | 0.35 | % |
Year ended May 31, 2016 | | | 0.35 | % |
Year ended May 31, 2015 | | | 0.35 | % |
| 2 | Portfolio turnover rate is calculated by multiplying the affiliated Master Portfolio’s percentage of the Fund’s total investments in securities at the end of the period by the affiliated Master Portfolio’s portfolio turnover rate. |
The accompanying notes are an integral part of these financial statements.
| | | | |
| 22 | | Wells Fargo Core Bond Fund | | Notes to financial statements |
1. ORGANIZATION
Wells Fargo Funds Trust (the “Trust”), a Delaware statutory trust organized on March 10, 1999, is an open-end management investment company registered under the Investment Company Act of 1940, as amended (the “1940 Act”). As an investment company, the Trust follows the accounting and reporting guidance in Financial Accounting Standards Board (“FASB”) Accounting Standards Codification Topic 946, Financial Services – Investment Companies. These financial statements report on the Wells Fargo Core Bond Fund (the “Fund”) which is a diversified series of the Trust.
The Fund is a feeder fund in a master-feeder structure that invests substantially all of its assets in a single master portfolio with a substantially identical investment objective and substantially similar investment strategies. The Fund seeks to achieve its investment objective by investing substantially all of its assets in a separate diversified portfolio (the “affiliated Master Portfolio”) of Wells Fargo Master Trust, a registered open-end management investment company. The affiliated Master Portfolio directly acquires portfolio securities and the Fund acquires an indirect interest in those securities. The Fund accounts for its investment in the affiliated Master Portfolio as a partnership investment and records on a daily basis its share of the affiliated Master Portfolio’s income, expense and realized and unrealized gains and losses. The financial statements of the affiliated Master Portfolio for the year ended May 31, 2019 are included in this report and should be read in conjunction with the Fund’s financial statements. As of May 31, 2019, the Fund owned 93% of Wells Fargo Core Bond Portfolio.
2. SIGNIFICANT ACCOUNTING POLICIES
The following significant accounting policies, which are consistently followed in the preparation of the financial statements of the Fund, are in conformity with U.S. generally accepted accounting principles which require management to make estimates and assumptions that affect the reported amounts of assets and liabilities, disclosure of contingent assets and liabilities at the date of the financial statements, and the reported amounts of revenues and expenses during the reporting period. Actual results could differ from those estimates.
Securities valuation
All investments are valued each business day as of the close of regular trading on the New York Stock Exchange (generally 4 p.m. Eastern Time), although the Fund may deviate from this calculation time under unusual or unexpected circumstances.
Investments in the affiliated Master Portfolio are valued daily based on the Fund’s proportionate share of the affiliated Master Portfolio’s net assets, which are also valued daily. Securities held in the affiliated Master Portfolio are valued as discussed in the Notes to Financial Statements of the affiliated Master Portfolio, which are included elsewhere in this report.
Investment transactions, income and expenses
Investments in the affiliated Master Portfolio are recorded on a trade basis. The Fund records daily its proportionate share of the affiliated Master Portfolio’s interest income, expenses and realized and unrealized gains or losses. The Fund also accrues its own expenses.
Distributions to shareholders
Distributions to shareholders from net investment income are declared daily and paid monthly. Distributions from net realized gains, if any, are recorded on the ex-dividend date and paid at least annually. Such distributions are determined in accordance with income tax regulations and may differ from U.S. generally accepted accounting principles. Dividend sources are estimated at the time of declaration. The tax character of distributions is determined as of the Fund’s fiscal year end. Therefore, a portion of the Fund’s distributions made prior to the Fund’s fiscal year end may be categorized as a tax return of capital at year end.
Federal and other taxes
The Fund intends to continue to qualify as a regulated investment company by distributing substantially all of its investment company taxable income and any net realized capital gains (after reduction for capital loss carryforwards) sufficient to relieve it from all, or substantially all, federal income taxes. Accordingly, no provision for federal income taxes was required.
The Fund’s income and federal excise tax returns and all financial records supporting those returns for the prior three fiscal years are subject to examination by the federal and Delaware revenue authorities. Management has analyzed the Fund’s tax positions taken on federal, state, and foreign tax returns for all open tax years and does not believe that there are any uncertain tax positions that require recognition of a tax liability.
| | | | | | |
| Notes to financial statements | | Wells Fargo Core Bond Fund | | | 23 | |
As of May 31, 2019, the aggregate cost of all investments for federal income tax purposes was $5,327,126,703 and the unrealized gains (losses) consisted of:
| | | | |
| |
Gross unrealized gains | | $ | 113,579,450 | |
| |
Gross unrealized losses | | | 0 | |
| |
Net unrealized gains | | $ | 113,579,450 | |
As of May 31, 2019, the Fund had capital loss carryforwards which consist of $66,843,700 in short-term capital losses and $63,431,926 in long-term capital losses.
Class allocations
The separate classes of shares offered by the Fund differ principally in applicable sales charges, distribution, shareholder servicing, and administration fees. Class specific expenses are charged directly to that share class. Investment income, common expenses, and realized and unrealized gains (losses) on investments are allocated daily to each class of shares based on the relative proportion of net assets of each class.
3. FAIR VALUATION MEASUREMENTS
At May 31, 2019, the affiliated Master Portfolio was measured at fair value using the net asset value per share (or its equivalent) as a practical expedient. The investment objective and the value of the affiliated Master Portfolio was as follows:
| | | | | | |
| | |
| Affiliated Master Portfolio | | Investment objective | | Value of
affiliated Master
Portfolio | |
| | |
Wells Fargo Core Bond Portfolio | | Seeks total return, consisting of income and capital appreciation | | $ | 5,440,706,153 | |
The affiliated Master Portfolio does not have a redemption period notice, can be redeemed daily and does not have any unfunded commitments.
4. TRANSACTIONS WITH AFFILIATES
Management fee
Wells Fargo Funds Management, LLC (“Funds Management”), an indirect wholly owned subsidiary of Wells Fargo & Company (“Wells Fargo”), is the manager of the Fund and provides advisory and fund-level administrative services under an investment management agreement. Under the investment management agreement, Funds Management is responsible for, among other services, implementing the investment objectives and strategies of the Fund and providing fund-level administrative services in connection with the Fund’s operations. As long as the Fund continues to invest substantially all of its assets in a single affiliated Master Portfolio, the Fund pays Funds Management an investment management fee only for fund-level administrative services at the following annual rate based on the Fund’s average daily net assets:
| | | | |
| |
| Average daily net assets | | Management fee | |
| |
First $5 billion | | | 0.05 | % |
| |
Next $5 billion | | | 0.04 | |
| |
Over $10 billion | | | 0.03 | |
For the year ended May 31, 2019, the management fee was equivalent to an annual rate of 0.05% of the Fund’s average daily net assets.
Funds Management also serves as the adviser to the affiliated Master Portfolio and is entitled to receive a fee from the affiliated Master Portfolio for those services.
| | | | |
| 24 | | Wells Fargo Core Bond Fund | | Notes to financial statements |
Administration fees
Under a class-level administration agreement, Funds Management provides class-level administrative services to the Fund, which includes paying fees and expenses for services provided by the transfer agent, sub-transfer agents, omnibus account servicers and record-keepers. As compensation for its services under the class-level administration agreement, Funds Management receives an annual fee which is calculated based on the average daily net assets of each class as follows:
| | | | |
| | | Class-level
administration fee | |
| |
Class A, Class C, Class R | | | 0.16 | % |
| |
Class R4, Institutional Class | | | 0.08 | |
| |
Class R6 | | | 0.03 | |
| |
Administrator Class | | | 0.10 | |
Funds Management has contractually waived and/or reimbursed management and administration fees to the extent necessary to maintain certain net operating expense ratios for the Fund. When each class of the Fund has exceeded its expense cap, Funds Management has waived fees and/or reimbursed expenses from fund level expenses on a proportionate basis and then from class specific expenses. When only certain classes exceed their expense caps, waivers and/or reimbursements are applied against class specific expenses before fund level expenses. Net expenses from the affiliated Master Portfolio are included in the expense caps. Funds Management has committed through September 30, 2019 to waive fees and/or reimburse expenses to the extent necessary to cap the Fund’s expenses at 0.78% for Class A shares, 1.53% for Class C shares, 1.03% for Class R shares, 0.52% for Class R4 shares, 0.37% for Class R6 shares, 0.70% for Administrator Class shares, and 0.42% for Institutional Class shares. Prior to or after the commitment expiration date, the cap may be increased or the commitment to maintain the cap may be terminated only with the approval of the Board of Trustees.
Distribution fees
The Trust has adopted a distribution plan for Class C and Class R shares of the Fund pursuant to Rule 12b-1 under the 1940 Act. Distribution fees are charged to Class C and Class R shares and paid to Wells Fargo Funds Distributor, LLC (“Funds Distributor”), the principal underwriter, at an annual rate of 0.75% of the average daily net assets of Class C shares and 0.25% of the average daily net assets of Class R shares.
In addition, Funds Distributor is entitled to receive the front-end sales charge from the purchase of Class A shares and a contingent deferred sales charge on the redemption of certain Class A shares. Funds Distributor is also entitled to receive the contingent deferred sales charges from redemptions of Class C shares. For the year ended May 31, 2019, Funds Distributor received $4,814 from the sale of Class A shares. Funds Distributor did not receive any contingent deferred sales charges from Class A or Class C shares for the year ended May 31, 2019.
Shareholder servicing fees
The Trust has entered into contracts with one or more shareholder servicing agents, whereby Class A, Class C, Class R, and Administrator Class of the Fund are charged a fee at an annual rate of 0.25% of the average daily net assets of each respective class. Class R4 is charged a fee at an annual rate of 0.10% of its average daily net assets. A portion of these total shareholder servicing fees were paid to affiliates of Wells Fargo.
5. INVESTMENT PORTFOLIO TRANSACTIONS
The Fund seeks to achieve its investment objective by investing substantially all of its assets in a single affiliated Master Portfolio. Purchases and sales have been calculated by multiplying the Fund’s ownership percentage of the affiliated Master Portfolio by the affiliated Master Portfolio’s purchases and sales. Purchases and sales of investments, excluding short-term securities, for the year ended May 31, 2019 were as follows:
| | | | | | |
Purchases at cost | | Sales proceeds |
U.S.
government | | Non-U.S.
government | | U.S.
government | | Non-U.S.
government |
| $28,336,904,435 | | $3,924,079,249 | | $28,111,421,704 | | $3,918,741,933 |
| | | | | | |
| Notes to financial statements | | Wells Fargo Core Bond Fund | | | 25 | |
6. BANK BORROWINGS
The Trust (excluding the money market funds), Wells Fargo Master Trust and Wells Fargo Variable Trust are parties to a $280,000,000 revolving credit agreement whereby the Fund is permitted to use bank borrowings for temporary or emergency purposes, such as to fund shareholder redemption requests. Interest under the credit agreement is charged to the Fund based on a borrowing rate equal to the higher of the Federal Funds rate in effect on that day plus 1.25% or the overnight LIBOR rate in effect on that day plus 1.25%. In addition, an annual commitment fee equal to 0.25% of the unused balance is allocated to each participating fund.
For the year ended May 31, 2019, there were no borrowings by the Fund under the agreement.
7. DISTRIBUTIONS TO SHAREHOLDERS
The tax character of distributions paid during the years ended May 31, 2019 and May 31, 2018 were as follows:
| | | | | | | | |
| | | Year ended May 31 | |
| | |
| | | 2019 | | | 2018 | |
| | |
Ordinary income | | $ | 149,561,391 | | | $ | 109,314,575 | |
As of May 31, 2019, the components of distributable earnings on a tax basis were as follows:
| | | | |
Undistributed ordinary income | | Unrealized gains | | Capital loss carryforward |
| | |
| $2,068,662 | | $113,579,450 | | $(130,275,626) |
Effective for all filings after November 4, 2018, the Securities and Exchange Commission eliminated the requirement to separately state the components of distributions to shareholders under U.S. generally accepted accounting principles. The amounts of distributions to shareholders for the year ended May 31, 2018 were as follows:
| | | | |
| | | Net
investment income | |
| |
Class A | | | $6,146,453 | |
| |
Class C | | | 561,310 | |
| |
Class R | | | 203,058 | |
| |
Class R4 | | | 706,139 | |
| |
Class R6 | | | 24,689,238 | |
| |
Administrator Class | | | 6,023,458 | |
| |
Institutional Class | | | 70,984,919 | |
8. INDEMNIFICATION
Under the Trust’s organizational documents, the officers and Trustees have been granted certain indemnification rights against certain liabilities that may arise out of performance of their duties to the Trust. Additionally, in the normal course of business, the Trust may enter into contracts with service providers that contain a variety of indemnification clauses. The Trust’s maximum exposure under these arrangements is dependent on future claims that may be made against the Fund and, therefore, cannot be estimated.
9. NEW ACCOUNTING PRONOUNCEMENT
In August 2018, FASB issued Accounting Standards Update (“ASU”) No. 2018-13, Fair Value Measurement (Topic 820)Disclosure Framework—Changes to the Disclosure Requirements for Fair Value Measurement. ASU 2018-13 updates the disclosure requirements for fair value measurements by modifying or removing certain disclosures and adding certain new disclosures. The amendments are effective for fiscal years, and interim periods within those fiscal years, beginning after December 15, 2019. Early adoption is permitted. Management has adopted the removal and modification of disclosures early, as permitted, and will adopt the additional new disclosures at the effective date.
| | | | |
| 26 | | Wells Fargo Core Bond Fund | | Report of independent registered public accounting firm |
TO THE SHAREHOLDERS OF THE FUND AND BOARD OF TRUSTEES OF WELLS FARGO FUNDS TRUST:
Opinion on the Financial Statements
We have audited the accompanying statement of assets and liabilities of Wells Fargo Core Bond Fund (the Fund), one of the funds constituting Wells Fargo Funds Trust, including the portfolio of investments, as of May 31, 2019, the related statement of operations for the year then ended, the statements of changes in net assets for each of the years in the two-year period then ended, and the related notes (collectively, the financial statements) and the financial highlights for each of the years in the five-year period then ended. In our opinion, the financial statements and financial highlights present fairly, in all material respects, the financial position of the Fund as of May 31, 2019, the results of its operations for the year then ended, the changes in its net assets for each of the years in the two-year period then ended, and the financial highlights for each of the years in the five-year period then ended, in conformity with U.S. generally accepted accounting principles.
Basis for Opinion
These financial statements and financial highlights are the responsibility of the Fund’s management. Our responsibility is to express an opinion on these financial statements and financial highlights based on our audits. We are a public accounting firm registered with the Public Company Accounting Oversight Board (United States) (PCAOB) and are required to be independent with respect to the Fund in accordance with the U.S. federal securities laws and the applicable rules and regulations of the Securities and Exchange Commission and the PCAOB.
We conducted our audits in accordance with the standards of the PCAOB. Those standards require that we plan and perform the audit to obtain reasonable assurance about whether the financial statements and financial highlights are free of material misstatement, whether due to error or fraud. Our audits included performing procedures to assess the risks of material misstatement of the financial statements and financial highlights, whether due to error or fraud, and performing procedures that respond to those risks. Such procedures included examining, on a test basis, evidence regarding the amounts and disclosures in the financial statements and financial highlights. Such procedures also included confirmation of securities owned as of May 31, 2019, by correspondence with the transfer agent. Our audits also included evaluating the accounting principles used and significant estimates made by management, as well as evaluating the overall presentation of the financial statements and financial highlights. We believe that our audits provide a reasonable basis for our opinion.

We have not been able to determine the specific year that we began serving as the auditor of one or more Wells Fargo Funds investment companies; however we are aware that we have served as the auditor of one or more Wells Fargo Funds investment companies since at least 1955.
Boston, Massachusetts
July 26, 2019
| | | | | | |
| Portfolio of investments—May 31, 2019 | | Wells Fargo Core Bond Portfolio | | | 27 | |
| | | | | | | | | | | | | | | | |
| Security name | | Interest rate | | | Maturity date | | | Principal | | | Value | |
| | | | |
Agency Securities: 35.93% | | | | | | | | | | | | | | | | |
| | | | |
FHLMC (1 Month LIBOR +0.30%) ± | | | 2.74 | % | | | 8-15-2040 | | | $ | 7,772,185 | | | $ | 7,779,180 | |
| | | | |
FHLMC | | | 3.00 | | | | 5-1-2047 | | | | 2,314,921 | | | | 2,322,346 | |
| | | | |
FHLMC | | | 3.00 | | | | 10-15-2047 | | | | 20,843,156 | | | | 21,073,723 | |
| | | | |
FHLMC | | | 3.00 | | | | 11-15-2047 | | | | 10,630,330 | | | | 10,803,519 | |
| | | | |
FHLMC | | | 3.00 | | | | 6-15-2048 | | | | 17,807,264 | | | | 17,870,157 | |
| | | | |
FHLMC | | | 3.50 | | | | 5-1-2046 | | | | 12,521,125 | | | | 12,976,534 | |
| | | | |
FHLMC | | | 3.50 | | | | 6-1-2046 | | | | 2,724,710 | | | | 2,823,810 | |
| | | | |
FHLMC | | | 3.50 | | | | 2-1-2048 | | | | 3,454,326 | | | | 3,549,475 | |
| | | | |
FHLMC | | | 3.50 | | | | 2-1-2048 | | | | 20,590,118 | | | | 21,334,919 | |
| | | | |
FHLMC | | | 3.50 | | | | 9-1-2048 | | | | 2,558,774 | | | | 2,619,746 | |
| | | | |
FHLMC | | | 3.50 | | | | 11-1-2048 | | | | 2,324,448 | | | | 2,379,836 | |
| | | | |
FHLMC (12 Month LIBOR +1.64%) ± | | | 3.86 | | | | 7-1-2048 | | | | 3,203,203 | | | | 3,334,327 | |
| | | | |
FHLMC | | | 4.00 | | | | 1-1-2035 | | | | 221,993 | | | | 233,609 | |
| | | | |
FHLMC | | | 4.00 | | | | 1-1-2036 | | | | 352,087 | | | | 370,514 | |
| | | | |
FHLMC | | | 4.00 | | | | 10-1-2036 | | | | 2,252,540 | | | | 2,370,414 | |
| | | | |
FHLMC | | | 4.00 | | | | 3-1-2037 | | | | 536,668 | | | | 561,431 | |
| | | | |
FHLMC | | | 4.00 | | | | 3-1-2037 | | | | 290,226 | | | | 304,600 | |
| | | | |
FHLMC | | | 4.00 | | | | 3-1-2037 | | | | 312,360 | | | | 328,024 | |
| | | | |
FHLMC | | | 4.00 | | | | 4-1-2037 | | | | 2,266,878 | | | | 2,371,488 | |
| | | | |
FHLMC | | | 4.00 | | | | 4-1-2037 | | | | 2,910,994 | | | | 3,063,144 | |
| | | | |
FHLMC | | | 4.00 | | | | 10-1-2048 | | | | 1,128,211 | | | | 1,164,905 | |
| | | | |
FHLMC | | | 4.00 | | | | 11-1-2048 | | | | 491,604 | | | | 507,119 | |
| | | | |
FHLMC | | | 4.00 | | | | 5-1-2049 | | | | 3,475,006 | | | | 3,520,091 | |
| | | | |
FHLMC | | | 4.50 | | | | 6-1-2039 | | | | 255,814 | | | | 280,057 | |
| | | | |
FHLMC | | | 4.50 | | | | 7-1-2039 | | | | 278,358 | | | | 304,788 | |
| | | | |
FHLMC | | | 5.00 | | | | 6-1-2044 | | | | 3,209,000 | | | | 3,505,463 | |
| | | | |
FHLMC | | | 5.00 | | | | 5-1-2048 | | | | 11,800,708 | | | | 12,832,381 | |
| | | | |
FHLMC | | | 6.50 | | | | 4-1-2021 | | | | 273 | | | | 275 | |
| | | | |
FHLMC Series 1590 Class IA (1 Month LIBOR +1.05%) ± | | | 3.49 | | | | 10-15-2023 | | | | 12,875 | | | | 13,064 | |
| | | | |
FHLMC Series 1897 Class K | | | 7.00 | | | | 9-15-2026 | | | | 463 | | | | 507 | |
| | | | |
FHLMC Series 1935 Class FL (1 Month LIBOR +0.70%) ± | | | 3.14 | | | | 2-15-2027 | | | | 1,523 | | | | 1,538 | |
| | | | |
FHLMC Series 2423 Class MC | | | 7.00 | | | | 3-15-2032 | | | | 9,653 | | | | 11,047 | |
| | | | |
FHLMC Series 264 Class 30 | | | 3.00 | | | | 7-15-2042 | | | | 17,947,720 | | | | 18,167,633 | |
| | | | |
FHLMC Series 356 Class 300 | | | 3.00 | | | | 9-15-2047 | | | | 4,724,209 | | | | 4,766,917 | |
| | | | |
FHLMC Series 4705 Class A | | | 4.50 | | | | 9-15-2042 | | | | 6,879,771 | | | | 7,356,358 | |
| | | | |
FHLMC Series 4763 Class CA | | | 3.00 | | | | 9-15-2038 | | | | 1,903,478 | | | | 1,959,254 | |
| | | | |
FHLMC Series 4767 Class KA | | | 3.00 | | | | 3-15-2048 | | | | 9,510,752 | | | | 9,740,875 | |
| | | | |
FHLMC Series 4786 Class DP | | | 4.50 | | | | 7-15-2042 | | | | 5,321,458 | | | | 5,487,563 | |
| | | | |
FHLMC Series 4787 Class AK | | | 3.00 | | | | 5-15-2048 | | | | 15,120,899 | | | | 15,162,545 | |
| | | | |
FHLMC Series 4796 Class AK | | | 3.00 | | | | 5-15-2048 | | | | 18,818,508 | | | | 18,870,338 | |
| | | | |
FNMA | | | 1.50 | | | | 4-25-2043 | | | | 1,829,865 | | | | 1,720,545 | |
| | | | |
FNMA (1 Month LIBOR +0.25%) ± | | | 2.73 | | | | 11-25-2048 | | | | 12,726,690 | | | | 12,642,706 | |
| | | | |
FNMA (1 Month LIBOR +0.35%) ± | | | 2.78 | | | | 5-25-2049 | | | | 7,637,601 | | | | 7,622,310 | |
| | | | |
FNMA (1 Month LIBOR +0.40%) ± | | | 2.90 | | | | 4-25-2059 | | | | 4,776,474 | | | | 4,768,354 | |
| | | | |
FNMA (1 Month LIBOR +0.45%) ± | | | 2.93 | | | | 10-25-2046 | | | | 15,495,075 | | | | 15,509,602 | |
| | | | |
FNMA (12 Month LIBOR +1.60%) ± | | | 2.95 | | | | 8-1-2047 | | | | 4,031,458 | | | | 4,104,842 | |
| | | | |
FNMA (a) | | | 3.00 | | | | 1-1-2049 | | | | 7,964,000 | | | | 7,989,215 | |
| | | | |
FNMA | | | 3.00 | | | | 6-1-2049 | | | | 6,273,857 | | | | 6,270,916 | |
| | | | |
FNMA %% | | | 3.00 | | | | 6-13-2049 | | | | 6,800,000 | | | | 6,830,029 | |
| | | | |
FNMA (12 Month LIBOR +1.62%) ± | | | 3.13 | | | | 3-1-2047 | | | | 5,602,056 | | | | 5,721,342 | |
The accompanying notes are an integral part of these financial statements.
| | | | |
| 28 | | Wells Fargo Core Bond Portfolio | | Portfolio of investments—May 31, 2019 |
| | | | | | | | | | | | | | | | |
| Security name | | Interest rate | | | Maturity date | | | Principal | | | Value | |
| | | | |
Agency Securities(continued) | | | | | | | | | | | | | | | | |
| | | | |
FNMA | | | 3.50 | % | | | 9-1-2033 | | | $ | 831,583 | | | $ | 860,543 | |
| | | | |
FNMA | | | 3.50 | | | | 8-1-2034 | | | | 1,866,314 | | | | 1,931,293 | |
| | | | |
FNMA | | | 3.50 | | | | 5-1-2036 | | | | 7,294,506 | | | | 7,548,155 | |
| | | | |
FNMA | | | 3.50 | | | | 9-1-2036 | | | | 1,211,911 | | | | 1,254,104 | |
| | | | |
FNMA | | | 3.50 | | | | 12-1-2036 | | | | 8,042,566 | | | | 8,322,256 | |
| | | | |
FNMA | | | 3.50 | | | | 5-1-2042 | | | | 18,944,209 | | | | 19,611,927 | |
| | | | |
FNMA | | | 3.50 | | | | 3-1-2046 | | | | 4,890,263 | | | | 5,064,750 | |
| | | | |
FNMA | | | 3.50 | | | | 8-1-2048 | | | | 7,288,073 | | | | 7,536,554 | |
| | | | |
FNMA | | | 3.50 | | | | 4-1-2049 | | | | 33,928,052 | | | | 34,710,279 | |
| | | | |
FNMA | | | 3.50 | | | | 5-1-2049 | | | | 1,878,930 | | | | 1,922,251 | |
| | | | |
FNMA | | | 3.50 | | | | 5-1-2049 | | | | 18,153,501 | | | | 18,572,035 | |
| | | | |
FNMA | | | 3.50 | | | | 5-1-2049 | | | | 38,285,279 | | | | 39,167,953 | |
| | | | |
FNMA %% | | | 3.50 | | | | 6-13-2049 | | | | 299,300,000 | | | | 305,315,218 | |
| | | | |
FNMA %% | | | 3.50 | | | | 7-15-2049 | | | | 38,600,000 | | | | 39,351,645 | |
| | | | |
FNMA | | | 3.50 | | | | 9-1-2052 | | | | 24,211,921 | | | | 24,876,531 | |
| | | | |
FNMA (12 Month LIBOR +1.61%) ± | | | 3.67 | | | | 12-1-2048 | | | | 4,115,194 | | | | 4,254,609 | |
| | | | |
FNMA (12 Month LIBOR +1.62%) ± | | | 3.75 | | | | 8-1-2048 | | | | 2,935,665 | | | | 3,041,350 | |
| | | | |
FNMA (12 Month LIBOR +1.62%) ± | | | 3.83 | | | | 9-1-2048 | | | | 3,019,706 | | | | 3,143,891 | |
| | | | |
FNMA | | | 4.00 | | | | 7-1-2033 | | | | 3,543,166 | | | | 3,692,698 | |
| | | | |
FNMA | | | 4.00 | | | | 9-1-2033 | | | | 6,340,164 | | | | 6,607,755 | |
| | | | |
FNMA | | | 4.00 | | | | 7-1-2036 | | | | 5,820,276 | | | | 6,120,661 | |
| | | | |
FNMA | | | 4.00 | | | | 9-1-2036 | | | | 2,271,970 | | | | 2,387,005 | |
| | | | |
FNMA | | | 4.00 | | | | 11-1-2036 | | | | 1,710,015 | | | | 1,798,258 | |
| | | | |
FNMA | | | 4.00 | | | | 12-1-2036 | | | | 388,227 | | | | 405,880 | |
| | | | |
FNMA | | | 4.00 | | | | 10-1-2037 | | | | 2,983,294 | | | | 3,110,510 | |
| | | | |
FNMA | | | 4.00 | | | | 5-1-2045 | | | | 7,661,814 | | | | 7,958,802 | |
| | | | |
FNMA | | | 4.00 | | | | 8-1-2045 | | | | 5,930,879 | | | | 6,239,448 | |
| | | | |
FNMA | | | 4.00 | | | | 9-1-2045 | | | | 1,462,537 | | | | 1,546,754 | |
| | | | |
FNMA | | | 4.00 | | | | 9-1-2045 | | | | 10,336,134 | | | | 10,873,902 | |
| | | | |
FNMA | | | 4.00 | | | | 11-1-2045 | | | | 5,138,520 | | | | 5,405,883 | |
| | | | |
FNMA | | | 4.00 | | | | 10-1-2046 | | | | 886,135 | | | | 925,379 | |
| | | | |
FNMA | | | 4.00 | | | | 12-1-2046 | | | | 1,031,230 | | | | 1,076,900 | |
| | | | |
FNMA | | | 4.00 | | | | 4-1-2047 | | | | 868,256 | | | | 918,204 | |
| | | | |
FNMA | | | 4.00 | | | | 4-1-2047 | | | | 1,006,073 | | | | 1,043,863 | |
| | | | |
FNMA | | | 4.00 | | | | 4-1-2047 | | | | 983,676 | | | | 1,030,981 | |
| | | | |
FNMA | | | 4.00 | | | | 7-1-2047 | | | | 3,348,699 | | | | 3,496,122 | |
| | | | |
FNMA | | | 4.00 | | | | 9-1-2047 | | | | 4,038,010 | | | | 4,217,957 | |
| | | | |
FNMA | | | 4.00 | | | | 10-1-2047 | | | | 808,205 | | | | 856,771 | |
| | | | |
FNMA | | | 4.00 | | | | 10-1-2047 | | | | 762,318 | | | | 803,967 | |
| | | | |
FNMA | | | 4.00 | | | | 10-1-2047 | | | | 3,079,748 | | | | 3,217,386 | |
| | | | |
FNMA | | | 4.00 | | | | 11-1-2047 | | | | 32,338,964 | | | | 33,664,195 | |
| | | | |
FNMA | | | 4.00 | | | | 11-1-2047 | | | | 483,802 | | | | 505,424 | |
| | | | |
FNMA | | | 4.00 | | | | 11-1-2047 | | | | 967,483 | | | | 1,010,845 | |
| | | | |
FNMA | | | 4.00 | | | | 8-1-2048 | | | | 51,670,751 | | | | 53,760,699 | |
| | | | |
FNMA | | | 4.00 | | | | 9-1-2048 | | | | 36,124,072 | | | | 37,585,243 | |
| | | | |
FNMA | | | 4.00 | | | | 3-1-2049 | | | | 3,463,691 | | | | 3,619,732 | |
| | | | |
FNMA | | | 4.00 | | | | 4-1-2049 | | | | 4,531,609 | | | | 4,735,764 | |
| | | | |
FNMA | | | 4.00 | | | | 5-1-2049 | | | | 572,670 | | | | 598,469 | |
| | | | |
FNMA %% | | | 4.00 | | | | 6-13-2049 | | | | 64,800,000 | | | | 66,875,625 | |
| | | | |
FNMA %% | | | 4.00 | | | | 7-15-2049 | | | | 29,000,000 | | | | 29,920,584 | |
The accompanying notes are an integral part of these financial statements.
| | | | | | |
| Portfolio of investments—May 31, 2019 | | Wells Fargo Core Bond Portfolio | | | 29 | |
| | | | | | | | | | | | | | | | |
| Security name | | Interest rate | | | Maturity date | | | Principal | | | Value | |
| | | | |
Agency Securities(continued) | | | | | | | | | | | | | | | | |
| | | | |
FNMA | | | 4.50 | % | | | 5-1-2034 | | | $ | 1,730,111 | | | $ | 1,839,979 | |
| | | | |
FNMA | | | 4.50 | | | | 6-1-2041 | | | | 313,844 | | | | 336,754 | |
| | | | |
FNMA | | | 4.50 | | | | 3-1-2043 | | | | 3,497,155 | | | | 3,752,170 | |
| | | | |
FNMA | | | 4.50 | | | | 3-1-2044 | | | | 1,078,543 | | | | 1,156,629 | |
| | | | |
FNMA | | | 4.50 | | | | 10-1-2045 | | | | 5,730,221 | | | | 6,145,110 | |
| | | | |
FNMA | | | 4.50 | | | | 2-1-2046 | | | | 144,030 | | | | 154,328 | |
| | | | |
FNMA | | | 4.50 | | | | 3-1-2048 | | | | 2,400,742 | | | | 2,551,151 | |
| | | | |
FNMA | | | 4.50 | | | | 4-1-2048 | | | | 5,088,841 | | | | 5,407,674 | |
| | | | |
FNMA | | | 4.50 | | | | 5-1-2048 | | | | 3,095,520 | | | | 3,289,471 | |
| | | | |
FNMA | | | 4.50 | | | | 10-1-2048 | | | | 3,133,454 | | | | 3,329,847 | |
| | | | |
FNMA | | | 4.50 | | | | 11-1-2048 | | | | 21,705,404 | | | | 22,812,994 | |
| | | | |
FNMA | | | 4.50 | | | | 2-1-2049 | | | | 17,498,127 | | | | 18,912,480 | |
| | | | |
FNMA | | | 4.50 | | | | 2-1-2049 | | | | 9,696,433 | | | | 10,480,208 | |
| | | | |
FNMA | | | 4.50 | | | | 2-1-2049 | | | | 13,431,592 | | | | 14,381,959 | |
| | | | |
FNMA | | | 4.50 | | | | 3-1-2049 | | | | 25,459,580 | | | | 26,755,395 | |
| | | | |
FNMA | | | 4.50 | | | | 3-1-2049 | | | | 4,910,631 | | | | 5,228,098 | |
| | | | |
FNMA | | | 4.50 | | | | 4-1-2049 | | | | 3,683,752 | | | | 3,914,036 | |
| | | | |
FNMA | | | 4.50 | | | | 4-1-2049 | | | | 4,016,638 | | | | 4,341,322 | |
| | | | |
FNMA | | | 4.50 | | | | 5-1-2049 | | | | 1,632,397 | | | | 1,734,442 | |
| | | | |
FNMA | | | 5.00 | | | | 7-1-2044 | | | | 633,314 | | | | 679,408 | |
| | | | |
FNMA | | | 5.00 | | | | 6-1-2048 | | | | 12,398,461 | | | | 13,571,496 | |
| | | | |
FNMA | | | 5.00 | | | | 7-1-2048 | | | | 360,288 | | | | 389,534 | |
| | | | |
FNMA | | | 5.00 | | | | 10-1-2048 | | | | 191,064 | | | | 207,624 | |
| | | | |
FNMA | | | 5.00 | | | | 10-1-2048 | | | | 8,521,437 | | | | 9,327,708 | |
| | | | |
FNMA | | | 5.00 | | | | 11-1-2048 | | | | 15,917,063 | | | | 17,414,095 | |
| | | | |
FNMA | | | 5.00 | | | | 12-1-2048 | | | | 5,529,603 | | | | 6,052,828 | |
| | | | |
FNMA | | | 5.00 | | | | 1-1-2049 | | | | 12,086,243 | | | | 13,067,399 | |
| | | | |
FNMA | | | 5.00 | | | | 1-1-2049 | | | | 1,775,970 | | | | 1,929,910 | |
| | | | |
FNMA | | | 5.00 | | | | 2-1-2049 | | | | 7,684,921 | | | | 8,412,109 | |
| | | | |
FNMA | | | 5.00 | | | | 2-1-2049 | | | | 16,908,378 | | | | 18,373,993 | |
| | | | |
FNMA | | | 5.00 | | | | 2-1-2049 | | | | 32,348,387 | | | | 35,409,069 | |
| | | | |
FNMA | | | 5.00 | | | | 2-1-2049 | | | | 13,753,389 | | | | 15,054,692 | |
| | | | |
FNMA | | | 5.00 | | | | 3-1-2049 | | | | 8,689,914 | | | | 9,443,168 | |
| | | | |
FNMA | | | 6.00 | | | | 4-1-2022 | | | | 4,640 | | | | 5,035 | |
| | | | |
FNMA | | | 6.00 | | | | 2-1-2029 | | | | 5,270 | | | | 5,790 | |
| | | | |
FNMA | | | 6.00 | | | | 3-1-2033 | | | | 36,786 | | | | 41,251 | |
| | | | |
FNMA | | | 6.00 | | | | 11-1-2033 | | | | 13,438 | | | | 15,072 | |
| | | | |
FNMA Series 1999-54 Class LH | | | 6.50 | | | | 11-25-2029 | | | | 8,500 | | | | 9,381 | |
| | | | |
FNMA Series 2005-31 Class PB | | | 5.50 | | | | 4-25-2035 | | | | 70,000 | | | | 77,822 | |
| | | | |
FNMA Series 2017-13 Class PA | | | 3.00 | | | | 8-25-2046 | | | | 5,656,477 | | | | 5,801,468 | |
| | | | |
FNMA Series 2017-M7 Class A2 ±± | | | 2.96 | | | | 2-25-2027 | | | | 2,108,000 | | | | 2,150,471 | |
| | | | |
FNMA Series 2018-14 Class KC | | | 3.00 | | | | 3-25-2048 | | | | 6,010,777 | | | | 6,223,568 | |
| | | | |
FNMA Series 2018-15 Class AB | | | 3.00 | | | | 3-25-2048 | | | | 2,105,957 | | | | 2,121,847 | |
| | | | |
FNMA Series 2018-38 Class LA | | | 3.00 | | | | 6-25-2048 | | | | 21,694,884 | | | | 21,724,504 | |
| | | | |
FNMA Series 2018-43 Class CT | | | 3.00 | | | | 6-25-2048 | | | | 17,703,658 | | | | 17,742,341 | |
| | | | |
FNMA Series 2018-45 Class GA | | | 3.00 | | | | 6-25-2048 | | | | 38,429,250 | | | | 38,513,218 | |
| | | | |
FNMA Series 2018-50 Class BA | | | 3.00 | | | | 7-25-2048 | | | | 40,035,888 | | | | 40,090,585 | |
| | | | |
FNMA Series 2018-56 Class CH | | | 3.00 | | | | 8-25-2048 | | | | 8,808,726 | | | | 8,825,234 | |
| | | | |
FNMA Series 2018-57 Class PT | | | 3.00 | | | | 8-25-2048 | | | | 6,986,720 | | | | 6,999,790 | |
| | | | |
FNMA Series 2018-59 Class DA | | | 3.00 | | | | 8-25-2048 | | | | 19,741,917 | | | | 19,778,914 | |
The accompanying notes are an integral part of these financial statements.
| | | | |
| 30 | | Wells Fargo Core Bond Portfolio | | Portfolio of investments—May 31, 2019 |
| | | | | | | | | | | | | | | | |
| Security name | | Interest rate | | | Maturity date | | | Principal | | | Value | |
| | | | |
Agency Securities(continued) | | | | | | | | | | | | | | | | |
| | | | |
FNMA Series 2018-8 Class KL | | | 2.50 | % | | | 3-25-2047 | | | $ | 7,333,997 | | | $ | 7,298,505 | |
| | | | |
FNMA Series 414 Class A35 | | | 3.50 | | | | 10-25-2042 | | | | 15,790,613 | | | | 16,425,866 | |
| | | | |
GNMA | | | 3.50 | | | | 9-20-2045 | | | | 601,411 | | | | 615,362 | |
| | | | |
GNMA | | | 3.50 | | | | 5-20-2046 | | | | 3,806,574 | | | | 3,924,262 | |
| | | | |
GNMA | | | 3.50 | | | | 7-20-2046 | | | | 15,912,673 | | | | 16,435,132 | |
| | | | |
GNMA | | | 3.50 | | | | 1-20-2047 | | | | 3,217,958 | | | | 3,313,151 | |
| | | | |
GNMA | | | 3.50 | | | | 1-20-2048 | | | | 11,376,554 | | | | 11,706,006 | |
| | | | |
GNMA | | | 3.50 | | | | 1-20-2048 | | | | 6,596,020 | | | | 6,788,998 | |
| | | | |
GNMA | | | 3.50 | | | | 1-20-2048 | | | | 2,121,850 | | | | 2,186,730 | |
| | | | |
GNMA | | | 3.50 | | | | 1-20-2048 | | | | 5,856,638 | | | | 6,020,854 | |
| | | | |
GNMA %% | | | 3.50 | | | | 6-20-2049 | | | | 32,200,000 | | | | 33,095,563 | |
| | | | |
GNMA | | | 4.00 | | | | 12-20-2047 | | | | 18,772,716 | | | | 19,460,356 | |
| | | | |
GNMA | | | 4.00 | | | | 3-20-2048 | | | | 2,515,863 | | | | 2,610,663 | |
| | | | |
GNMA | | | 4.00 | | | | 4-20-2048 | | | | 3,786,190 | | | | 3,928,450 | |
| | | | |
GNMA | | | 4.00 | | | | 4-20-2048 | | | | 2,933,071 | | | | 3,047,301 | |
| | | | |
GNMA | | | 4.00 | | | | 4-20-2048 | | | | 1,914,122 | | | | 1,991,410 | |
| | | | |
GNMA | | | 4.00 | | | | 5-20-2049 | | | | 3,246,669 | | | | 3,381,161 | |
| | | | |
GNMA | | | 4.00 | | | | 5-20-2049 | | | | 74,415,462 | | | | 77,029,268 | |
| | | | |
GNMA %% | | | 4.00 | | | | 6-20-2049 | | | | 9,502,000 | | | | 9,852,990 | |
| | | | |
GNMA | | | 4.50 | | | | 8-15-2047 | | | | 2,184,232 | | | | 2,321,446 | |
| | | | |
GNMA | | | 4.50 | | | | 12-20-2048 | | | | 4,258,263 | | | | 4,439,380 | |
| | | | |
GNMA | | | 4.50 | | | | 1-20-2049 | | | | 6,771,069 | | | | 7,059,393 | |
| | | | |
GNMA | | | 4.50 | | | | 2-20-2049 | | | | 12,727,275 | | | | 13,549,317 | |
| | | | |
GNMA | | | 4.50 | | | | 3-20-2049 | | | | 6,241,885 | | | | 6,613,605 | |
| | | | |
GNMA | | | 4.50 | | | | 3-20-2049 | | | | 1,470,682 | | | | 1,558,262 | |
| | | | |
GNMA | | | 4.50 | | | | 4-20-2049 | | | | 3,279,800 | | | | 3,475,141 | |
| | | | |
GNMA | | | 4.50 | | | | 4-20-2049 | | | | 10,570,166 | | | | 11,031,162 | |
| | | | |
GNMA | | | 4.50 | | | | 5-20-2049 | | | | 2,793,202 | | | | 2,959,539 | |
| | | | |
GNMA | | | 4.50 | | | | 5-20-2049 | | | | 2,546,361 | | | | 2,697,995 | |
| | | | |
GNMA | | | 4.50 | | | | 5-20-2049 | | | | 1,968,397 | | | | 2,085,616 | |
| | | | |
GNMA | | | 4.50 | | | | 5-20-2049 | | | | 4,155,788 | | | | 4,341,521 | |
| | | | |
GNMA | | | 5.00 | | | | 12-20-2039 | | | | 234,653 | | | | 256,320 | |
| | | | |
GNMA | | | 5.00 | | | | 11-20-2045 | | | | 372,761 | | | | 405,941 | |
| | | | |
GNMA | | | 5.00 | | | | 3-20-2048 | | | | 29,981,739 | | | | 31,541,292 | |
| | | | |
GNMA | | | 5.00 | | | | 6-20-2048 | | | | 14,568,377 | | | | 15,247,540 | |
| | | | |
GNMA | | | 5.00 | | | | 11-20-2048 | | | | 583,826 | | | | 610,700 | |
| | | | |
GNMA | | | 5.00 | | | | 12-20-2048 | | | | 18,821,871 | | | | 19,735,604 | |
| | | | |
GNMA | | | 5.00 | | | | 1-20-2049 | | | | 28,304,353 | | | | 29,646,316 | |
| | | | |
GNMA | | | 5.00 | | | | 1-20-2049 | | | | 10,167,594 | | | | 10,886,369 | |
| | | | |
GNMA | | | 5.00 | | | | 2-20-2049 | | | | 7,736,236 | | | | 8,118,569 | |
| | | | |
GNMA | | | 5.00 | | | | 3-20-2049 | | | | 3,855,953 | | | | 4,047,825 | |
| | | | |
GNMA | | | 5.00 | | | | 4-20-2049 | | | | 30,791,094 | | | | 32,332,887 | |
| | | | |
GNMA | | | 5.00 | | | | 5-20-2049 | | | | 26,852,679 | | | | 28,191,898 | |
| | | | |
GNMA %% | | | 5.00 | | | | 6-20-2049 | | | | 3,593,325 | | | | 3,777,446 | |
| | | | |
GNMA Series 2012-141 Class WA ±± | | | 4.53 | | | | 11-16-2041 | | | | 1,787,636 | | | | 1,961,629 | |
| | | | |
GNMA Series 2017-167 Class BQ | | | 2.50 | | | | 8-20-2044 | | | | 8,933,074 | | | | 9,045,641 | |
| | | | |
GNMA Series 2019-20 Class JK | | | 3.50 | | | | 2-20-2049 | | | | 21,699,274 | | | | 22,104,952 | |
| | | | |
Total Agency Securities (Cost $2,060,621,235) | | | | | | | | | | | | | | | 2,092,939,090 | |
| | | | | | | | | | | | | | | | |
The accompanying notes are an integral part of these financial statements.
| | | | | | |
| Portfolio of investments—May 31, 2019 | | Wells Fargo Core Bond Portfolio | | | 31 | |
| | | | | | | | | | | | | | | | |
| Security name | | Interest rate | | | Maturity date | | | Principal | | | Value | |
| | | | |
Asset-Backed Securities: 10.42% | | | | | | | | | | | | | | | | |
| | | | |
Avis Budget Rental Car Funding LLC Series 2017-1A Class A 144A | | | 3.07 | % | | | 9-20-2023 | | | $ | 1,620,000 | | | $ | 1,640,508 | |
| | | | |
Avis Budget Rental Car Funding LLC Series 2019-1A Class A 144A | | | 3.45 | | | | 3-20-2023 | | | | 1,209,000 | | | | 1,233,981 | |
| | | | |
Avis Budget Rental Car Funding LLC Series 2019-2A Class A 144A | | | 3.35 | | | | 9-22-2025 | | | | 10,161,000 | | | | 10,407,626 | |
| | | | |
Capital Auto Receivables Asset Trust Series 2016-1 Class A4 | | | 1.98 | | | | 10-20-2020 | | | | 434,813 | | | | 434,469 | |
| | | | |
Capital Auto Receivables Asset Trust Series 2016-2 Class A4 | | | 1.63 | | | | 1-20-2021 | | | | 532,377 | | | | 531,330 | |
| | | | |
College Avenue Student Loan Trust Series 2017-A Class A1 (1 Month LIBOR +1.65%) 144A± | | | 4.08 | | | | 11-26-2046 | | | | 4,090,008 | | | | 4,158,482 | |
| | | | |
College Avenue Student Loan Trust Series 2018-A Class A2 144A | | | 4.13 | | | | 12-26-2047 | | | | 2,749,636 | | | | 2,887,691 | |
| | | | |
Ford Credit Auto Owner Trust Series 2017-1 Class A 144A | | | 2.62 | | | | 8-15-2028 | | | | 2,398,000 | | | | 2,413,134 | |
| | | | |
Ford Credit Auto Owner Trust Series 2017-2 Class A 144A | | | 2.36 | | | | 3-15-2029 | | | | 13,970,000 | | | | 13,994,093 | |
| | | | |
Ford Credit Auto Owner Trust Series 2018-1 Class A 144A | | | 3.19 | | | | 7-15-2031 | | | | 14,175,000 | | | | 14,481,960 | |
| | | | |
Ford Credit Auto Owner Trust Series 2018-2 Class A 144A | | | 3.47 | | | | 1-15-2030 | | | | 6,304,000 | | | | 6,562,710 | |
| | | | |
Ford Credit Auto Owner Trust Series 2019-1 Class A 144A | | | 3.52 | | | | 7-15-2030 | | | | 11,354,000 | | | | 11,763,396 | |
| | | | |
General Motors Trust Series 2019-1 Class A 144A | | | 2.70 | | | | 4-15-2024 | | | | 5,382,000 | | | | 5,430,350 | |
| | | | |
GM Financial Automobile Leasing Trust Series 2019-2 Class A4 | | | 2.72 | | | | 3-20-2023 | | | | 3,227,000 | | | | 3,257,398 | |
| | | | |
Hertz Vehicle Financing LLC Series 2015-1A Class A 144A | | | 2.73 | | | | 3-25-2021 | | | | 2,816,000 | | | | 2,817,533 | |
| | | | |
Hertz Vehicle Financing LLC Series 2015-3A Class A 144A | | | 2.67 | | | | 9-25-2021 | | | | 5,139,000 | | | | 5,130,967 | |
| | | | |
Hertz Vehicle Financing LLC Series 2016-2A Class A2 144A | | | 2.95 | | | | 3-25-2022 | | | | 4,050,000 | | | | 4,062,164 | |
| | | | |
Hertz Vehicle Financing LLC Series 2016-3A Class B 144A | | | 3.11 | | | | 7-25-2020 | | | | 2,186,000 | | | | 2,185,194 | |
| | | | |
Hertz Vehicle Financing LLC Series 2016-4A Class A 144A | | | 2.65 | | | | 7-25-2022 | | | | 518,000 | | | | 516,831 | |
| | | | |
Hertz Vehicle Financing LLC Series 2017-1A Class A 144A | | | 2.96 | | | | 10-25-2021 | | | | 4,777,000 | | | | 4,790,223 | |
| | | | |
Hertz Vehicle Financing LLC Series 2017-2A Class A 144A | | | 3.29 | | | | 10-25-2023 | | | | 4,212,000 | | | | 4,265,266 | |
| | | | |
Hertz Vehicle Financing LLC Series 2018-2A Class A 144A | | | 3.65 | | | | 6-27-2022 | | | | 5,490,000 | | | | 5,598,546 | |
| | | | |
Hertz Vehicle Financing LLC Series 2018-3A Class A 144A | | | 4.03 | | | | 7-25-2024 | | | | 5,685,000 | | | | 5,918,296 | |
| | | | |
Hertz Vehicle Financing LLC Series 2019-1A Class A 144A | | | 3.71 | | | | 3-25-2023 | | | | 8,669,000 | | | | 8,871,550 | |
| | | | |
Hertz Vehicle Financing LLC Series 2019-2A Class A 144A | | | 3.42 | | | | 5-25-2025 | | | | 15,301,000 | | | | 15,396,862 | |
| | | | |
Hyundai Floorplan Master Owner Trust Series 2019-1 Class A 144A | | | 2.68 | | | | 4-15-2024 | | | | 9,893,000 | | | | 9,981,853 | |
| | | | |
Navient Student Loan Trust Series 2014-1 Class A3 (1 Month LIBOR +0.51%) ± | | | 2.95 | | | | 6-25-2031 | | | | 4,722,189 | | | | 4,657,416 | |
| | | | |
Navient Student Loan Trust Series 2014-AA Class A3 (1 Month LIBOR +1.60%) 144A± | | | 4.04 | | | | 10-15-2031 | | | | 6,169,000 | | | | 6,322,467 | |
| | | | |
Navient Student Loan Trust Series 2014-CTA Class A (1 Month LIBOR +0.70%) 144A± | | | 3.14 | | | | 9-16-2024 | | | | 992,667 | | | | 993,344 | |
| | | | |
Navient Student Loan Trust Series 2015-1 Class A2 (1 Month LIBOR +0.60%) ± | | | 3.04 | | | | 4-25-2040 | | | | 12,562,644 | | | | 12,453,201 | |
| | | | |
Navient Student Loan Trust Series 2015-CA Class B 144A | | | 3.25 | | | | 5-15-2040 | | | | 1,245,931 | | | | 1,245,999 | |
| | | | |
Navient Student Loan Trust Series 2016-1A Class A (1 Month LIBOR +0.70%) 144A± | | | 3.14 | | | | 2-25-2070 | | | | 7,591,081 | | | | 7,503,738 | |
| | | | |
Navient Student Loan Trust Series 2016-3A Class A2 (1 Month LIBOR +0.85%) 144A± | | | 3.29 | | | | 6-25-2065 | | | | 1,994,057 | | | | 2,001,975 | |
| | | | |
Navient Student Loan Trust Series 2016-AA Class A2B (1 Month LIBOR +2.15%) 144A± | | | 4.59 | | | | 12-15-2045 | | | | 2,715,169 | | | | 2,803,206 | |
| | | | |
Navient Student Loan Trust Series 2017-2A Class A (1 Month LIBOR +0.77%) 144A± | | | 3.20 | | | | 9-25-2065 | | | | 8,095,551 | | | | 8,008,330 | |
| | | | |
Navient Student Loan Trust Series 2017-3A Class A (1 Month LIBOR +0.85%) 144A± | | | 3.28 | | | | 2-25-2066 | | | | 8,277,371 | | | | 8,272,828 | |
| | | | |
Navient Student Loan Trust Series 2017-5A Class A (1 Month LIBOR +0.80%) 144A± | | | 3.23 | | | | 7-26-2066 | | | | 3,962,600 | | | | 3,942,365 | |
| | | | |
Navient Student Loan Trust Series 2017-A Class A2B (1 Month LIBOR +0.90%) 144A± | | | 3.34 | | | | 12-16-2058 | | | | 8,966,000 | | | | 9,010,544 | |
| | | | |
Navient Student Loan Trust Series 2018-A Class A2 144A | | | 3.19 | | | | 2-18-2042 | | | | 2,233,000 | | | | 2,258,209 | |
| | | | |
Navient Student Loan Trust Series 2018-BA Class A2A 144A | | | 3.61 | | | | 12-15-2059 | | | | 4,454,000 | | | | 4,596,825 | |
| | | | |
Navient Student Loan Trust Series 2018-CA Class A2 144A | | | 3.52 | | | | 6-16-2042 | | | | 2,507,000 | | | | 2,562,574 | |
| | | | |
Navient Student Loan Trust Series 2018-DA Class A2A 144A | | | 4.00 | | | | 12-15-2059 | | | | 10,280,000 | | | | 10,710,181 | |
| | | | |
Navient Student Loan Trust Series 2018-EA Class A2 144A | | | 4.00 | | | | 12-15-2059 | | | | 6,822,000 | | | | 7,163,011 | |
| | | | |
Navient Student Loan Trust Series 2019-2A Class A2 (1 Month LIBOR +1.00%) 144A± | | | 3.48 | | | | 2-27-2068 | | | | 6,311,000 | | | | 6,366,542 | |
The accompanying notes are an integral part of these financial statements.
| | | | |
| 32 | | Wells Fargo Core Bond Portfolio | | Portfolio of investments—May 31, 2019 |
| | | | | | | | | | | | | | | | |
| Security name | | Interest rate | | | Maturity date | | | Principal | | | Value | |
| | | | |
Asset-Backed Securities(continued) | | | | | | | | | | | | | | | | |
| | | | |
Navient Student Loan Trust Series 2019-A Class A2A 144A | | | 3.42 | % | | | 1-15-2043 | | | $ | 11,950,000 | | | $ | 12,246,140 | |
| | | | |
Navient Student Loan Trust Series 2019-BA Class A2A 144A | | | 3.39 | | | | 12-15-2059 | | | | 8,228,000 | | | | 8,447,038 | |
| | | | |
Navient Student Loan Trust Series 2019-CA Class A2 144A | | | 3.13 | | | | 2-15-2068 | | | | 8,809,000 | | | | 8,966,693 | |
| | | | |
Nelnet Student Loan Trust Series 2004-4 Class A5 (3 Month LIBOR +0.16%) ± | | | 2.74 | | | | 1-25-2037 | | | | 8,034,857 | | | | 7,863,846 | |
| | | | |
Nelnet Student Loan Trust Series 2004-5 Class A5 (3 Month LIBOR +0.18%) ± | | | 2.76 | | | | 10-27-2036 | | | | 2,839,055 | | | | 2,778,652 | |
| | | | |
Nelnet Student Loan Trust Series 2005-1 Class A5 (3 Month LIBOR +0.11%) ± | | | 2.69 | | | | 10-25-2033 | | | | 16,003,054 | | | | 15,829,662 | |
| | | | |
Nelnet Student Loan Trust Series 2005-2 Class A5 (3 Month LIBOR +0.10%) ± | | | 2.71 | | | | 3-23-2037 | | | | 20,170,951 | | | | 19,931,362 | |
| | | | |
Nelnet Student Loan Trust Series 2005-3 Class A5 (3 Month LIBOR +0.12%) ± | | | 2.73 | | | | 12-24-2035 | | | | 18,062,982 | | | | 17,990,259 | |
| | | | |
Nelnet Student Loan Trust Series 2005-4 Class A4 (3 Month LIBOR +0.18%) ± | | | 2.79 | | | | 3-22-2032 | | | | 4,106,160 | | | | 3,965,890 | |
| | | | |
Nelnet Student Loan Trust Series 2010-2A Class A (3 Month LIBOR +0.85%) 144A± | | | 3.45 | | | | 9-25-2048 | | | | 17,184,067 | | | | 17,236,047 | |
| | | | |
Nelnet Student Loan Trust Series 2012-4A Class A (1 Month LIBOR +0.70%) 144A± | | | 3.13 | | | | 9-27-2038 | | | | 13,236,922 | | | | 13,147,897 | |
| | | | |
Nelnet Student Loan Trust Series 2013-1A Class A (1 Month LIBOR +0.60%) 144A± | | | 3.03 | | | | 6-25-2041 | | | | 4,223,425 | | | | 4,174,327 | |
| | | | |
Nelnet Student Loan Trust Series 2014-1A Class A (1 Month LIBOR +0.57%) 144A± | | | 3.00 | | | | 9-25-2041 | | | | 2,253,812 | | | | 2,239,976 | |
| | | | |
Nelnet Student Loan Trust Series 2015-2A Class A2 (1 Month LIBOR +0.60%) 144A± | | | 3.03 | | | | 9-25-2047 | | | | 5,513,620 | | | | 5,467,717 | |
| | | | |
Nelnet Student Loan Trust Series 2016-1A Class A (1 Month LIBOR +0.80%) 144A± | | | 3.23 | | | | 9-25-2065 | | | | 7,821,259 | | | | 7,848,315 | |
| | | | |
Nelnet Student Loan Trust Series 2018-3A Class A2 (1 Month LIBOR +0.44%) 144A± | | | 2.93 | | | | 9-27-2066 | | | | 2,846,000 | | | | 2,831,841 | |
| | | | |
Santander Retail Auto Lease Trust Series 2019-A Class A3 144A | | | 2.77 | | | | 6-20-2022 | | | | 2,936,000 | | | | 2,968,833 | |
| | | | |
SLC Student Loan Trust Series 2005-2 Class A4 (3 Month LIBOR +0.16%) ± | | | 2.77 | | | | 12-15-2039 | | | | 5,478,000 | | | | 5,301,276 | |
| | | | |
SLM Student Loan Trust Series 2003-1 Class A5C (3 Month LIBOR +0.75%) 144A± | | | 3.36 | | | | 12-15-2032 | | | | 3,692,307 | | | | 3,631,679 | |
| | | | |
SLM Student Loan Trust Series 2004-10 Class A7A (3 Month LIBOR +0.60%) 144A± | | | 3.18 | | | | 10-25-2029 | | | | 12,249,000 | | | | 12,191,006 | |
| | | | |
SLM Student Loan Trust Series 2005-3 Class A6 (3 Month LIBOR +0.15%) ± | | | 2.73 | | | | 4-25-2040 | | | | 5,328,000 | | | | 5,127,834 | |
| | | | |
SLM Student Loan Trust Series 2006-1 Class A5 (3 Month LIBOR +0.11%) ± | | | 2.69 | | | | 7-26-2021 | | | | 11,465,566 | | | | 11,290,396 | |
| | | | |
SLM Student Loan Trust Series 2006-10 Class A6 (3 Month LIBOR +0.15%) ± | | | 2.73 | | | | 3-25-2044 | | | | 9,462,000 | | | | 9,036,185 | |
| | | | |
SLM Student Loan Trust Series 2006-3 Class A5 (3 Month LIBOR +0.10%) ± | | | 2.68 | | | | 1-25-2021 | | | | 6,672,960 | | | | 6,595,990 | |
| | | | |
SLM Student Loan Trust Series 2007-1 Class A6 (3 Month LIBOR +0.14%) ± | | | 2.72 | | | | 1-27-2042 | | | | 11,518,000 | | | | 10,913,285 | |
| | | | |
SLM Student Loan Trust Series 2007-2 Class A4 (3 Month LIBOR +0.06%) ± | | | 2.64 | | | | 7-25-2022 | | | | 11,151,452 | | | | 10,845,886 | |
| | | | |
SLM Student Loan Trust Series 2010-1 Class A (1 Month LIBOR +0.40%) ± | | | 2.83 | | | | 3-25-2025 | | | | 1,809,335 | | | | 1,755,998 | |
| | | | |
SLM Student Loan Trust Series 2012-1 Class A3 (1 Month LIBOR +0.95%) ± | | | 3.38 | | | | 9-25-2028 | | | | 12,785,951 | | | | 12,659,479 | |
| | | | |
SLM Student Loan Trust Series 2012-2 Class A (1 Month LIBOR +0.70%) ± | | | 3.13 | | | | 1-25-2029 | | | | 11,032,199 | | | | 10,865,619 | |
| | | | |
SLM Student Loan Trust Series 2012-6 Class A3 (1 Month LIBOR +0.75%) ± | | | 3.18 | | | | 5-26-2026 | | | | 2,926,238 | | | | 2,902,406 | |
| | | | |
SLM Student Loan Trust Series 2013-B Class A2B (1 Month LIBOR +1.10%) 144A± | | | 3.54 | | | | 6-17-2030 | | | | 164,837 | | | | 165,001 | |
| | | | |
SMB Private Education Loan Trust Series 2015-A Class A2B (1 Month LIBOR +1.00%) 144A± | | | 3.44 | | | | 6-15-2027 | | | | 3,658,189 | | | | 3,678,937 | |
| | | | |
SMB Private Education Loan Trust Series 2015-B Class A2A 144A | | | 2.98 | | | | 7-15-2027 | | | | 661,153 | | | | 665,881 | |
| | | | |
SMB Private Education Loan Trust Series 2015-C Class A2B (1 Month LIBOR +1.40%) 144A± | | | 3.84 | | | | 7-15-2027 | | | | 1,988,596 | | | | 2,011,274 | |
| | | | |
SMB Private Education Loan Trust Series 2016-A Class A2A 144A | | | 2.70 | | | | 5-15-2031 | | | | 8,788,194 | | | | 8,816,030 | |
| | | | |
SMB Private Education Loan Trust Series 2016-A Class A2B (1 Month LIBOR +1.50%) 144A± | | | 3.94 | | | | 5-15-2031 | | | | 11,555,866 | | | | 11,776,497 | |
| | | | |
SMB Private Education Loan Trust Series 2016-B Class A2A 144A | | | 2.43 | | | | 2-17-2032 | | | | 4,190,401 | | | | 4,175,251 | |
| | | | |
SMB Private Education Loan Trust Series 2016-B Class A2B (1 Month LIBOR +1.45%) 144A± | | | 3.89 | | | | 2-17-2032 | | | | 11,539,499 | | | | 11,770,636 | |
| | | | |
SMB Private Education Loan Trust Series 2016-C Class A2A 144A | | | 2.34 | | | | 9-15-2034 | | | | 9,445,370 | | | | 9,390,685 | |
| | | | |
SMB Private Education Loan Trust Series 2016-C Class A2B (1 Month LIBOR +1.10%) 144A± | | | 3.54 | | | | 9-15-2034 | | | | 4,524,082 | | | | 4,556,302 | |
| | | | |
SMB Private Education Loan Trust Series 2017-A Class A2B (1 Month LIBOR +0.90%) 144A± | | | 3.34 | | | | 9-15-2034 | | | | 3,416,926 | | | | 3,432,336 | |
| | | | |
SMB Private Education Loan Trust Series 2017-B Class A2B (1 Month LIBOR +0.75%) 144A± | | | 3.19 | | | | 10-15-2035 | | | | 7,998,000 | | | | 7,978,923 | |
| | | | |
SMB Private Education Loan Trust Series 2018-A Class A2B (1 Month LIBOR +0.80%) 144A± | | | 3.24 | | | | 2-15-2036 | | | | 2,732,000 | | | | 2,722,329 | |
The accompanying notes are an integral part of these financial statements.
| | | | | | |
| Portfolio of investments—May 31, 2019 | | Wells Fargo Core Bond Portfolio | | | 33 | |
| | | | | | | | | | | | | | | | |
| Security name | | Interest rate | | | Maturity date | | | Principal | | | Value | |
| | | | |
Asset-Backed Securities(continued) | | | | | | | | | | | | | | | | |
| | | | |
SMB Private Education Loan Trust Series 2018-C Class A2A 144A | | | 3.63 | % | | | 11-15-2035 | | | $ | 1,872,000 | | | $ | 1,950,901 | |
| | | | |
SMB Private Education Loan Trust Series 2018-C Class A2B (1 Month LIBOR +0.75%) 144A± | | | 3.19 | | | | 11-15-2035 | | | | 4,877,000 | | | | 4,847,267 | |
| | | | |
SMB Private Education Loan Trust Series 2019-A Class A2A 144A | | | 3.44 | | | | 7-15-2036 | | | | 9,258,000 | | | | 9,550,951 | |
| | | | |
Structured Asset Securities Corporation Series 1998-2 Class A (1 Month LIBOR +0.52%) ± | | | 2.95 | | | | 2-25-2028 | | | | 6,909 | | | | 6,878 | |
| | | | |
World Financial Network Credit Card Master Trust Series 2016-C Class A | | | 1.72 | | | | 8-15-2023 | | | | 3,854,000 | | | | 3,841,200 | |
| | | | |
World Financial Network Credit Card Master Trust Series 2018-B Class A | | | 3.46 | | | | 7-15-2025 | | | | 2,577,000 | | | | 2,641,759 | |
| | | | |
World Omni Auto Receivables Trust Series 2016-A Class A4 | | | 1.95 | | | | 5-16-2022 | | | | 6,143,000 | | | | 6,110,781 | |
| | | | |
Total Asset-Backed Securities (Cost $601,049,965) | | | | | | | | | | | | | | | 606,746,521 | |
| | | | | | | | | | | | | | | | |
| | | | |
Corporate Bonds and Notes: 19.84% | | | | | | | | | | | | | | | | |
| | | | |
Communication Services: 2.11% | | | | | | | | | | | | | | | | |
| | | | |
| Diversified Telecommunication Services: 0.81% | | | | | | | | | | | | | | | | |
| | | | |
AT&T Incorporated | | | 3.40 | | | | 5-15-2025 | | | | 4,049,000 | | | | 4,091,399 | |
| | | | |
AT&T Incorporated | | | 4.30 | | | | 2-15-2030 | | | | 1,414,000 | | | | 1,462,720 | |
| | | | |
AT&T Incorporated | | | 4.35 | | | | 3-1-2029 | | | | 3,089,000 | | | | 3,224,315 | |
| | | | |
AT&T Incorporated | | | 4.85 | | | | 3-1-2039 | | | | 1,991,000 | | | | 2,043,318 | |
| | | | |
AT&T Incorporated | | | 5.15 | | | | 2-15-2050 | | | | 5,406,000 | | | | 5,661,026 | |
| | | | |
AT&T Incorporated | | | 5.25 | | | | 3-1-2037 | | | | 1,184,000 | | | | 1,271,194 | |
| | | | |
AT&T Incorporated | | | 5.45 | | | | 3-1-2047 | | | | 1,432,000 | | | | 1,575,152 | |
| | | | |
AT&T Incorporated | | | 5.70 | | | | 3-1-2057 | | | | 1,185,000 | | | | 1,330,807 | |
| | | | |
Verizon Communications Incorporated 144A | | | 4.02 | | | | 12-3-2029 | | | | 2,086,000 | | | | 2,204,100 | |
| | | | |
Verizon Communications Incorporated | | | 4.13 | | | | 8-15-2046 | | | | 5,862,000 | | | | 5,871,322 | |
| | | | |
Verizon Communications Incorporated | | | 4.27 | | | | 1-15-2036 | | | | 1,904,000 | | | | 1,968,883 | |
| | | | |
Verizon Communications Incorporated | | | 4.33 | | | | 9-21-2028 | | | | 5,440,000 | | | | 5,886,335 | |
| | | | |
Verizon Communications Incorporated | | | 4.40 | | | | 11-1-2034 | | | | 4,314,000 | | | | 4,588,336 | |
| | | | |
Verizon Communications Incorporated | | | 4.52 | | | | 9-15-2048 | | | | 990,000 | | | | 1,043,231 | |
| | | | |
Verizon Communications Incorporated | | | 4.67 | | | | 3-15-2055 | | | | 526,000 | | | | 563,429 | |
| | | | |
Verizon Communications Incorporated | | | 5.01 | | | | 4-15-2049 | | | | 990,000 | | | | 1,119,026 | |
| | | | |
Verizon Communications Incorporated | | | 5.50 | | | | 3-16-2047 | | | | 2,939,000 | | | | 3,550,577 | |
| | | | |
| | | | | | | | | | | | | | | 47,455,170 | |
| | | | | | | | | | | | | | | | |
| | | | |
| Entertainment: 0.09% | | | | | | | | | | | | | | | | |
| | | | |
The Walt Disney Company « | | | 4.13 | | | | 6-1-2044 | | | | 1,010,000 | | | | 1,100,981 | |
| | | | |
The Walt Disney Company 144A | | | 4.95 | | | | 10-15-2045 | | | | 1,921,000 | | | | 2,345,212 | |
| | | | |
Viacom Incorporated | | | 5.85 | | | | 9-1-2043 | | | | 1,682,000 | | | | 1,877,029 | |
| | | | |
| | | | | | | | | | | | | | | 5,323,222 | |
| | | | | | | | | | | | | | | | |
| | | | |
| Media: 1.21% | | | | | | | | | | | | | | | | |
| | | | |
Charter Communications Operating LLC | | | 4.46 | | | | 7-23-2022 | | | | 1,946,000 | | | | 2,017,373 | |
| | | | |
Comcast Corporation | | | 3.30 | | | | 10-1-2020 | | | | 11,289,000 | | | | 11,408,257 | |
| | | | |
Comcast Corporation | | | 3.45 | | | | 10-1-2021 | | | | 5,001,000 | | | | 5,107,451 | |
| | | | |
Comcast Corporation | | | 3.70 | | | | 4-15-2024 | | | | 6,922,000 | | | | 7,225,837 | |
| | | | |
Comcast Corporation | | | 3.95 | | | | 10-15-2025 | | | | 3,602,000 | | | | 3,814,752 | |
| | | | |
Comcast Corporation | | | 4.00 | | | | 3-1-2048 | | | | 3,022,000 | | | | 3,026,057 | |
| | | | |
Comcast Corporation | | | 4.15 | | | | 10-15-2028 | | | | 4,537,000 | | | | 4,867,278 | |
| | | | |
Comcast Corporation | | | 4.60 | | | | 10-15-2038 | | | | 6,164,000 | | | | 6,735,629 | |
| | | | |
Comcast Corporation | | | 4.70 | | | | 10-15-2048 | | | | 1,012,000 | | | | 1,126,342 | |
The accompanying notes are an integral part of these financial statements.
| | | | |
| 34 | | Wells Fargo Core Bond Portfolio | | Portfolio of investments—May 31, 2019 |
| | | | | | | | | | | | | | | | |
| Security name | | Interest rate | | | Maturity date | | | Principal | | | Value | |
| | | | |
| Media(continued) | | | | | | | | | | | | | | | | |
| | | | |
Comcast Corporation | | | 4.95 | % | | | 10-15-2058 | | | $ | 1,506,000 | | | $ | 1,726,599 | |
| | | | |
Discovery Communications LLC | | | 4.13 | | | | 5-15-2029 | | | | 4,858,000 | | | | 4,892,711 | |
| | | | |
Discovery Communications LLC | | | 5.20 | | | | 9-20-2047 | | | | 2,938,000 | | | | 2,939,414 | |
| | | | |
Discovery Communications LLC | | | 5.30 | | | | 5-15-2049 | | | | 3,069,000 | | | | 3,062,798 | |
| | | | |
Fox Corporation 144A | | | 4.03 | | | | 1-25-2024 | | | | 2,123,000 | | | | 2,223,997 | |
| | | | |
Fox Corporation 144A | | | 4.71 | | | | 1-25-2029 | | | | 1,419,000 | | | | 1,551,848 | |
| | | | |
Fox Corporation 144A | | | 5.58 | | | | 1-25-2049 | | | | 2,273,000 | | | | 2,652,984 | |
| | | | |
Time Warner Cable Incorporated | | | 6.55 | | | | 5-1-2037 | | | | 1,408,000 | | | | 1,558,547 | |
| | | | |
Warner Media LLC | | | 5.35 | | | | 12-15-2043 | | | | 994,000 | | | | 1,072,180 | |
| | | | |
Warner Media LLC | | | 5.38 | | | | 10-15-2041 | | | | 1,590,000 | | | | 1,718,820 | |
| | | | |
Warner Media LLC | | | 3.80 | | | | 2-15-2027 | | | | 1,615,000 | | | | 1,647,812 | |
| | | | |
| | | | | | | | | | | | | | | 70,376,686 | |
| | | | | | | | | | | | | | | | |
| | | | |
Consumer Discretionary: 0.44% | | | | | | | | | | | | | | | | |
| | | | |
| Automobiles: 0.09% | | | | | | | | | | | | | | | | |
| | | | |
General Motors Company | | | 5.95 | | | | 4-1-2049 | | | | 5,270,000 | | | | 5,160,928 | |
| | | | | | | | | | | | | | | | |
| | | | |
| Hotels, Restaurants & Leisure: 0.13% | | | | | | | | | | | | | | | | |
| | | | |
GLP Capital LP / GLP Financing II Incorporated | | | 5.30 | | | | 1-15-2029 | | | | 2,087,000 | | | | 2,220,672 | |
| | | | |
McDonald’s Corporation | | | 4.45 | | | | 9-1-2048 | | | | 1,197,000 | | | | 1,257,128 | |
| | | | |
Starbucks Corporation | | | 3.75 | | | | 12-1-2047 | | | | 696,000 | | | | 649,110 | |
| | | | |
Starbucks Corporation | | | 3.80 | | | | 8-15-2025 | | | | 211,000 | | | | 220,619 | |
| | | | |
Starbucks Corporation | | | 4.45 | | | | 8-15-2049 | | | | 994,000 | | | | 1,025,037 | |
| | | | |
Starbucks Corporation | | | 4.50 | | | | 11-15-2048 | | | | 2,188,000 | | | | 2,274,395 | |
| | | | |
| | | | | | | | | | | | | | | 7,646,961 | |
| | | | | | | | | | | | | | | | |
| | | | |
| Specialty Retail: 0.22% | | | | | | | | | | | | | | | | |
| | | | |
Home Depot Incorporated | | | 4.50 | | | | 12-6-2048 | | | | 2,990,000 | | | | 3,359,436 | |
| | | | |
Lowe’s Companies Incorporated | | | 3.65 | | | | 4-5-2029 | | | | 9,480,000 | | | | 9,593,805 | |
| | | | |
| | | | | | | | | | | | | | | 12,953,241 | |
| | | | | | | | | | | | | | | | |
| | | | |
Consumer Staples: 1.96% | | | | | | | | | | | | | | | | |
| | | | |
| Beverages: 0.56% | | | | | | | | | | | | | | | | |
| | | | |
Anheuser-Busch InBev Company | | | 3.65 | | | | 2-1-2026 | | | | 4,148,000 | | | | 4,223,676 | |
| | | | |
Anheuser-Busch InBev Company | | | 4.90 | | | | 2-1-2046 | | | | 6,566,000 | | | | 6,769,213 | |
| | | | |
Anheuser-Busch InBev Worldwide Incorporated | | | 4.15 | | | | 1-23-2025 | | | | 6,259,000 | | | | 6,612,059 | |
| | | | |
Anheuser-Busch InBev Worldwide Incorporated | | | 4.90 | | | | 1-23-2031 | | | | 3,544,000 | | | | 3,927,197 | |
| | | | |
Anheuser-Busch InBev Worldwide Incorporated | | | 5.55 | | | | 1-23-2049 | | | | 2,377,000 | | | | 2,697,799 | |
| | | | |
Constellation Brands Incorporated | | | 3.20 | | | | 2-15-2023 | | | | 1,002,000 | | | | 1,013,210 | |
| | | | |
Constellation Brands Incorporated | | | 3.50 | | | | 5-9-2027 | | | | 1,432,000 | | | | 1,437,212 | |
| | | | |
Constellation Brands Incorporated | | | 3.60 | | | | 2-15-2028 | | | | 3,163,000 | | | | 3,184,731 | |
| | | | |
Constellation Brands Incorporated | | | 3.70 | | | | 12-6-2026 | | | | 1,689,000 | | | | 1,723,800 | |
| | | | |
Constellation Brands Incorporated | | | 4.40 | | | | 11-15-2025 | | | | 306,000 | | | | 327,037 | |
| | | | |
Constellation Brands Incorporated | | | 4.50 | | | | 5-9-2047 | | | | 596,000 | | | | 601,093 | |
| | | | |
| | | | | | | | | | | | | | | 32,517,027 | |
| | | | | | | | | | | | | | | | |
The accompanying notes are an integral part of these financial statements.
| | | | | | |
| Portfolio of investments—May 31, 2019 | | Wells Fargo Core Bond Portfolio | | | 35 | |
| | | | | | | | | | | | | | | | |
| Security name | | Interest rate | | | Maturity date | | | Principal | | | Value | |
| | | | |
| Food & Staples Retailing: 0.61% | | | | | | | | | | | | | | | | |
| | | | |
Costco Wholesale Corporation | | | 2.75 | % | | | 5-18-2024 | | | $ | 5,158,000 | | | $ | 5,224,439 | |
| | | | |
Costco Wholesale Corporation | | | 3.00 | | | | 5-18-2027 | | | | 6,814,000 | | | | 6,951,417 | |
| | | | |
Walmart Incorporated | | | 3.25 | | | | 7-8-2029 | | | | 5,380,000 | | | | 5,539,873 | |
| | | | |
Walmart Incorporated | | | 3.55 | | | | 6-26-2025 | | | | 5,224,000 | | | | 5,491,256 | |
| | | | |
Walmart Incorporated | | | 3.70 | | | | 6-26-2028 | | | | 10,379,000 | | | | 11,050,069 | |
| | | | |
Walmart Incorporated | | | 4.05 | | | | 6-29-2048 | | | | 1,018,000 | | | | 1,109,533 | |
| | | | |
| | | | | | | | | | | | | | | 35,366,587 | |
| | | | | | | | | | | | | | | | |
| | | | |
| Food Products: 0.52% | | | | | | | | | | | | | | | | |
| | | | |
Kraft Heinz Foods Company | | | 2.80 | | | | 7-2-2020 | | | | 6,027,000 | | | | 6,028,594 | |
| | | | |
Kraft Heinz Foods Company | | | 3.00 | | | | 6-1-2026 | | | | 1,656,000 | | | | 1,562,605 | |
| | | | |
Kraft Heinz Foods Company | | | 4.38 | | | | 6-1-2046 | | | | 2,909,000 | | | | 2,562,778 | |
| | | | |
Kraft Heinz Foods Company | | | 5.20 | | | | 7-15-2045 | | | | 704,000 | | | | 692,355 | |
| | | | |
Mars Incorporated 144A | | | 4.13 | | | | 4-1-2054 | | | | 2,560,000 | | | | 2,635,262 | |
| | | | |
Nestle Holdings Incorporated 144A | | | 3.10 | | | | 9-24-2021 | | | | 2,280,000 | | | | 2,318,240 | |
| | | | |
Nestle Holdings Incorporated 144A | | | 3.35 | | | | 9-24-2023 | | | | 2,988,000 | | | | 3,084,227 | |
| | | | |
Nestle Holdings Incorporated 144A | | | 3.50 | | | | 9-24-2025 | | | | 4,705,000 | | | | 4,917,765 | |
| | | | |
Nestle Holdings Incorporated 144A | | | 3.63 | | | | 9-24-2028 | | | | 2,289,000 | | | | 2,427,207 | |
| | | | |
Nestle Holdings Incorporated 144A | | | 3.90 | | | | 9-24-2038 | | | | 2,254,000 | | | | 2,386,749 | |
| | | | |
Nestle Holdings Incorporated 144A | | | 4.00 | | | | 9-24-2048 | | | | 1,810,000 | | | | 1,921,032 | |
| | | | |
| | | | | | | | | | | | | | | 30,536,814 | |
| | | | | | | | | | | | | | | | |
| | | | |
| Tobacco: 0.27% | | | | | | | | | | | | | | | | |
| | | | |
Altria Group Incorporated | | | 4.40 | | | | 2-14-2026 | | | | 2,151,000 | | | | 2,239,386 | |
| | | | |
Altria Group Incorporated | | | 4.80 | | | | 2-14-2029 | | | | 2,119,000 | | | | 2,213,111 | |
| | | | |
Altria Group Incorporated | | | 5.95 | | | | 2-14-2049 | | | | 1,049,000 | | | | 1,149,416 | |
| | | | |
BAT Capital Corporation | | | 2.30 | | | | 8-14-2020 | | | | 3,055,000 | | | | 3,040,328 | |
| | | | |
BAT Capital Corporation | | | 3.22 | | | | 8-15-2024 | | | | 3,145,000 | | | | 3,113,317 | |
| | | | |
BAT Capital Corporation | | | 4.54 | | | | 8-15-2047 | | | | 627,000 | | | | 564,106 | |
| | | | |
Reynolds American Incorporated | | | 5.85 | | | | 8-15-2045 | | | | 3,037,000 | | | | 3,150,698 | |
| | | | |
| | | | | | | | | | | | | | | 15,470,362 | |
| | | | | | | | | | | | | | | | |
| | | | |
Energy: 1.73% | | | | | | | | | | | | | | | | |
| | | | |
| Oil, Gas & Consumable Fuels: 1.73% | | | | | | | | | | | | | | | | |
| | | | |
Anadarko Finance Company | | | 7.50 | | | | 5-1-2031 | | | | 1,049,000 | | | | 1,371,204 | |
| | | | |
Anadarko Petroleum Corporation | | | 4.85 | | | | 3-15-2021 | | | | 1,805,000 | | | | 1,864,454 | |
| | | | |
Anadarko Petroleum Corporation | | | 6.60 | | | | 3-15-2046 | | | | 1,053,000 | | | | 1,351,932 | |
| | | | |
Andeavor Logistics LP | | | 3.50 | | | | 12-1-2022 | | | | 2,302,000 | | | | 2,343,794 | |
| | | | |
Andeavor Logistics LP | | | 5.20 | | | | 12-1-2047 | | | | 2,856,000 | | | | 2,911,445 | |
| | | | |
BP Capital Markets America Incorporated | | | 3.41 | | | | 2-11-2026 | | | | 5,489,000 | | | | 5,632,860 | |
| | | | |
BP Capital Markets America Incorporated | | | 3.80 | | | | 9-21-2025 | | | | 6,044,000 | | | | 6,343,593 | |
| | | | |
BP Capital Markets America Incorporated | | | 3.94 | | | | 9-21-2028 | | | | 12,407,000 | | | | 13,136,632 | |
| | | | |
Cimarex Energy Company | | | 4.38 | | | | 3-15-2029 | | | | 5,893,000 | | | | 6,149,292 | |
| | | | |
Devon Energy Corporation | | | 5.60 | | | | 7-15-2041 | | | | 3,287,000 | | | | 3,795,609 | |
| | | | |
Energy Transfer Operating Partners LP | | | 5.25 | | | | 4-15-2029 | | | | 1,765,000 | | | | 1,904,713 | |
| | | | |
Energy Transfer Operating Partners LP | | | 5.50 | | | | 6-1-2027 | | | | 3,534,000 | | | | 3,824,444 | |
| | | | |
Energy Transfer Operating Partners LP | | | 5.88 | | | | 1-15-2024 | | | | 5,928,000 | | | | 6,476,263 | |
| | | | |
Energy Transfer Operating Partners LP | | | 6.13 | | | | 12-15-2045 | | | | 1,005,000 | | | | 1,091,380 | |
| | | | |
Energy Transfer Operating Partners LP | | | 6.25 | | | | 4-15-2049 | | | | 3,061,000 | | | | 3,419,222 | |
The accompanying notes are an integral part of these financial statements.
| | | | |
| 36 | | Wells Fargo Core Bond Portfolio | | Portfolio of investments—May 31, 2019 |
| | | | | | | | | | | | | | | | |
| Security name | | Interest rate | | | Maturity date | | | Principal | | | Value | |
| | | | |
| Oil, Gas & Consumable Fuels(continued) | | | | | | | | | | | | | | | | |
| | | | |
Enterprise Products Operating LLC | | | 3.75 | % | | | 2-15-2025 | | | $ | 2,004,000 | | | $ | 2,076,930 | |
| | | | |
Kinder Morgan Energy Partners LP | | | 5.50 | | | | 3-1-2044 | | | | 1,457,000 | | | | 1,550,095 | |
| | | | |
Kinder Morgan Energy Partners LP | | | 6.95 | | | | 1-15-2038 | | | | 1,005,000 | | | | 1,239,066 | |
| | | | |
Kinder Morgan Energy Partners LP | | | 7.30 | | | | 8-15-2033 | | | | 310,000 | | | | 394,096 | |
| | | | |
Kinder Morgan Incorporated 144A | | | 5.00 | | | | 2-15-2021 | | | | 6,143,000 | | | | 6,356,732 | |
| | | | |
Kinder Morgan Incorporated | | | 5.55 | | | | 6-1-2045 | | | | 2,739,000 | | | | 2,971,013 | |
| | | | |
Marathon Oil Corporation | | | 4.40 | | | | 7-15-2027 | | | | 2,103,000 | | | | 2,182,488 | |
| | | | |
Marathon Oil Corporation | | | 5.20 | | | | 6-1-2045 | | | | 2,103,000 | | | | 2,242,840 | |
| | | | |
Marathon Oil Corporation | | | 6.60 | | | | 10-1-2037 | | | | 527,000 | | | | 632,080 | |
| | | | |
Marathon Petroleum Corporation | | | 4.75 | | | | 9-15-2044 | | | | 2,178,000 | | | | 2,190,365 | |
| | | | |
MPLX LP | | | 4.13 | | | | 3-1-2027 | | | | 2,418,000 | | | | 2,450,300 | |
| | | | |
MPLX LP | | | 4.70 | | | | 4-15-2048 | | | | 927,000 | | | | 878,493 | |
| | | | |
MPLX LP | | | 5.50 | | | | 2-15-2049 | | | | 2,683,000 | | | | 2,836,271 | |
| | | | |
Murphy Oil Corporation | | | 5.88 | | | | 12-1-2042 | | | | 220,000 | | | | 194,022 | |
| | | | |
Sunoco Logistics Partner LP | | | 5.30 | | | | 4-1-2044 | | | | 2,579,000 | | | | 2,543,037 | |
| | | | |
Sunoco Logistics Partner LP | | | 5.40 | | | | 10-1-2047 | | | | 985,000 | | | | 994,706 | |
| | | | |
Western Gas Partners LP | | | 5.50 | | | | 8-15-2048 | | | | 2,097,000 | | | | 2,014,235 | |
| | | | |
Williams Companies Incorporated | | | 3.90 | | | | 1-15-2025 | | | | 1,449,000 | | | | 1,491,608 | |
| | | | |
Williams Companies Incorporated | | | 4.55 | | | | 6-24-2024 | | | | 2,467,000 | | | | 2,617,549 | |
| | | | |
Williams Companies Incorporated | | | 5.75 | | | | 6-24-2044 | | | | 1,209,000 | | | | 1,319,952 | |
| | | | |
| | | | | | | | | | | | | | | 100,792,715 | |
| | | | | | | | | | | | | | | | |
| | | | |
Financials: 4.72% | | | | | | | | | | | | | | | | |
| | | | |
| Banks: 2.36% | | | | | | | | | | | | | | | | |
| | | | |
Bank of America Corporation | | | 3.25 | | | | 10-21-2027 | | | | 149,000 | | | | 147,965 | |
| | | | |
Bank of America Corporation (3 Month LIBOR +1.04%) ± | | | 3.42 | | | | 12-20-2028 | | | | 20,677,000 | | | | 20,646,838 | |
| | | | |
Bank of America Corporation (3 Month LIBOR +0.97%) ± | | | 3.46 | | | | 3-15-2025 | | | | 10,854,000 | | | | 11,045,490 | |
| | | | |
Bank of America Corporation (3 Month LIBOR +1.06%) ± | | | 3.56 | | | | 4-23-2027 | | | | 6,319,000 | | | | 6,436,951 | |
| | | | |
Bank of America Corporation (3 Month LIBOR +1.21%) ± | | | 3.97 | | | | 2-7-2030 | | | | 1,909,000 | | | | 1,979,270 | |
| | | | |
Bank of America Corporation (3 Month LIBOR +1.81%) ± | | | 4.24 | | | | 4-24-2038 | | | | 2,219,000 | | | | 2,321,044 | |
| | | | |
Bank of America Corporation (3 Month LIBOR +1.31%) ± | | | 4.27 | | | | 7-23-2029 | | | | 2,529,000 | | | | 2,672,988 | |
| | | | |
BB&T Corporation | | | 3.05 | | | | 6-20-2022 | | | | 6,985,000 | | | | 7,083,171 | |
| | | | |
BB&T Corporation | | | 3.88 | | | | 3-19-2029 | | | | 7,788,000 | | | | 8,121,122 | |
| | | | |
Citibank NA (3 Month LIBOR +0.60%) ± | | | 2.84 | | | | 5-20-2022 | | | | 12,078,000 | | | | 12,110,024 | |
| | | | |
Citigroup Incorporated | | | 3.20 | | | | 10-21-2026 | | | | 3,843,000 | | | | 3,829,329 | |
| | | | |
Citigroup Incorporated (3 Month LIBOR +0.90%) ± | | | 3.35 | | | | 4-24-2025 | | | | 14,798,000 | | | | 14,979,512 | |
| | | | |
Citigroup Incorporated (3 Month LIBOR +1.39%) ± | | | 3.67 | | | | 7-24-2028 | | | | 1,093,000 | | | | 1,108,287 | |
| | | | |
Citigroup Incorporated (3 Month LIBOR +1.34%) ± | | | 3.98 | | | | 3-20-2030 | | | | 5,945,000 | | | | 6,151,300 | |
| | | | |
JPMorgan Chase & Company (3 Month LIBOR +0.70%) ± | | | 3.21 | | | | 4-1-2023 | | | | 12,944,000 | | | | 13,092,929 | |
| | | | |
JPMorgan Chase & Company (3 Month LIBOR +1.16%) ± | | | 3.70 | | | | 5-6-2030 | | | | 5,325,000 | | | | 5,428,702 | |
| | | | |
JPMorgan Chase & Company (3 Month LIBOR +1.36%) ± | | | 3.88 | | | | 7-24-2038 | | | | 7,283,000 | | | | 7,337,407 | |
| | | | |
JPMorgan Chase & Company (3 Month LIBOR +1.12%) ± | | | 4.01 | | | | 4-23-2029 | | | | 3,989,000 | | | | 4,167,703 | |
| | | | |
PNC Financial Services | | | 3.45 | | | | 4-23-2029 | | | | 8,480,000 | | | | 8,660,001 | |
| | | | |
| | | | | | | | | | | | | | | 137,320,033 | |
| | | | | | | | | | | | | | | | |
| | | | |
| Capital Markets: 0.76% | | | | | | | | | | | | | | | | |
| | | | |
Blackrock Incorporated | | | 3.25 | | | | 4-30-2029 | | | | 2,057,000 | | | | 2,105,636 | |
| | | | |
Goldman Sachs Group Incorporated (3 Month LIBOR +0.82%) ± | | | 2.88 | | | | 10-31-2022 | | | | 2,201,000 | | | | 2,198,627 | |
| | | | |
Goldman Sachs Group Incorporated | | | 3.50 | | | | 11-16-2026 | | | | 6,988,000 | | | | 7,010,986 | |
The accompanying notes are an integral part of these financial statements.
| | | | | | |
| Portfolio of investments—May 31, 2019 | | Wells Fargo Core Bond Portfolio | | | 37 | |
| | | | | | | | | | | | | | | | |
| Security name | | Interest rate | | | Maturity date | | | Principal | | | Value | |
| | | | |
| Capital Markets(continued) | | | | | | | | | | | | | | | | |
| | | | |
Goldman Sachs Group Incorporated (3 Month LIBOR +1.43%) ± | | | 4.41 | % | | | 4-23-2039 | | | $ | 2,863,000 | | | $ | 2,955,638 | |
| | | | |
Lazard Group LLC | | | 4.38 | | | | 3-11-2029 | | | | 634,000 | | | | 657,521 | |
| | | | |
Lazard Group LLC | | | 4.50 | | | | 9-19-2028 | | | | 4,123,000 | | | | 4,327,361 | |
| | | | |
Morgan Stanley | | | 2.75 | | | | 5-19-2022 | | | | 24,000 | | | | 24,002 | |
| | | | |
Morgan Stanley | | | 3.70 | | | | 10-23-2024 | | | | 8,292,000 | | | | 8,577,994 | |
| | | | |
Morgan Stanley (3 Month LIBOR +1.43%) ± | | | 4.46 | | | | 4-22-2039 | | | | 1,895,000 | | | | 2,025,590 | |
| | | | |
PPL Capital Funding Incorporated | | | 3.10 | | | | 5-15-2026 | | | | 1,406,000 | | | | 1,379,859 | |
| | | | |
PPL Capital Funding Incorporated | | | 3.40 | | | | 6-1-2023 | | | | 599,000 | | | | 608,939 | |
| | | | |
PPL Capital Funding Incorporated | | | 4.00 | | | | 9-15-2047 | | | | 720,000 | | | | 686,628 | |
| | | | |
PPL Capital Funding Incorporated | | | 4.70 | | | | 6-1-2043 | | | | 399,000 | | | | 426,082 | |
| | | | |
PPL Capital Funding Incorporated | | | 5.00 | | | | 3-15-2044 | | | | 1,490,000 | | | | 1,633,275 | |
| | | | |
The Charles Schwab Corporation | | | 3.25 | | | | 5-22-2029 | | | | 9,705,000 | | | | 9,838,420 | |
| | | | |
| | | | | | | | | | | | | | | 44,456,558 | |
| | | | | | | | | | | | | | | | |
| | | | |
| Consumer Finance: 0.64% | | | | | | | | | | | | | | | | |
| | | | |
Ally Financial Incorporated | | | 3.88 | | | | 5-21-2024 | | | | 4,671,000 | | | | 4,647,645 | |
| | | | |
American Express Company | | | 2.75 | | | | 5-20-2022 | | | | 6,619,000 | | | | 6,644,577 | |
| | | | |
American Express Company | | | 3.13 | | | | 5-20-2026 | | | | 6,619,000 | | | | 6,644,113 | |
| | | | |
Ford Motor Credit Company LLC « | | | 3.82 | | | | 11-2-2027 | | | | 1,887,000 | | | | 1,733,918 | |
| | | | |
Ford Motor Credit Company LLC | | | 4.75 | | | | 1-15-2043 | | | | 8,753,000 | | | | 7,225,419 | |
| | | | |
Ford Motor Credit Company LLC | | | 5.11 | | | | 5-3-2029 | | | | 2,054,000 | | | | 2,016,869 | |
| | | | |
Ford Motor Credit Company LLC | | | 5.29 | | | | 12-8-2046 | | | | 917,000 | | | | 805,364 | |
| | | | |
Synchrony Financial | | | 4.38 | | | | 3-19-2024 | | | | 1,011,000 | | | | 1,039,349 | |
| | | | |
Synchrony Financial | | | 4.50 | | | | 7-23-2025 | | | | 2,016,000 | | | | 2,063,123 | |
| | | | |
Synchrony Financial | | | 5.15 | | | | 3-19-2029 | | | | 4,188,000 | | | | 4,345,955 | |
| | | | |
| | | | | | | | | | | | | | | 37,166,332 | |
| | | | | | | | | | | | | | | | |
| | | | |
| Insurance: 0.96% | | | | | | | | | | | | | | | | |
| | | | |
American International Group Incorporated | | | 4.20 | | | | 4-1-2028 | | | | 3,088,000 | | | | 3,203,218 | |
| | | | |
American International Group Incorporated | | | 4.25 | | | | 3-15-2029 | | | | 2,019,000 | | | | 2,100,323 | |
| | | | |
American International Group Incorporated | | | 4.38 | | | | 1-15-2055 | | | | 1,548,000 | | | | 1,465,046 | |
| | | | |
American International Group Incorporated | | | 4.50 | | | | 7-16-2044 | | | | 1,697,000 | | | | 1,711,658 | |
| | | | |
American International Group Incorporated | | | 6.25 | | | | 5-1-2036 | | | | 1,773,000 | | | | 2,113,168 | |
| | | | |
Aon Corporation | | | 3.75 | | | | 5-2-2029 | | | | 5,775,000 | | | | 5,860,182 | |
| | | | |
Berkshire Hathaway Finance Corporation | | | 4.25 | | | | 1-15-2049 | | | | 6,611,000 | | | | 7,118,745 | |
| | | | |
Liberty Mutual Group Incorporated 144A | | | 4.25 | | | | 6-15-2023 | | | | 449,000 | | | | 471,754 | |
| | | | |
Liberty Mutual Group Incorporated 144A | | | 4.57 | | | | 2-1-2029 | | | | 5,611,000 | | | | 5,978,951 | |
| | | | |
Markel Corporation | | | 5.00 | | | | 5-20-2049 | | | | 3,026,000 | | | | 3,112,584 | |
| | | | |
Prudential Financial Incorporated | | | 4.35 | | | | 2-25-2050 | | | | 5,925,000 | | | | 6,327,939 | |
| | | | |
Prudential Financial Incorporated | | | 4.60 | | | | 5-15-2044 | | | | 994,000 | | | | 1,095,252 | |
| | | | |
Reinsurance Group of America Incorporated | | | 3.90 | | | | 5-15-2029 | | | | 3,984,000 | | | | 4,041,765 | |
| | | | |
Torchmark Corporation | | | 4.55 | | | | 9-15-2028 | | | | 6,044,000 | | | | 6,547,876 | |
| | | | |
Willis North America Incorporated | | | 4.50 | | | | 9-15-2028 | | | | 4,604,000 | | | | 4,861,983 | |
| | | | |
| | | | | | | | | | | | | | | 56,010,444 | |
| | | | | | | | | | | | | | | | |
| | | | |
Health Care: 2.72% | | | | | | | | | | | | | | | | |
| | | | |
| Biotechnology: 0.42% | | | | | | | | | | | | | | | | |
| | | | |
AbbVie Incorporated | | | 2.50 | | | | 5-14-2020 | | | | 7,659,000 | | | | 7,647,333 | |
| | | | |
AbbVie Incorporated | | | 4.25 | | | | 11-14-2028 | | | | 3,541,000 | | | | 3,670,468 | |
The accompanying notes are an integral part of these financial statements.
| | | | |
| 38 | | Wells Fargo Core Bond Portfolio | | Portfolio of investments—May 31, 2019 |
| | | | | | | | | | | | | | | | |
| Security name | | Interest rate | | | Maturity date | | | Principal | | | Value | |
| | | | |
| Biotechnology(continued) | | | | | | | | | | | | | | | | |
| | | | |
AbbVie Incorporated | | | 4.88 | % | | | 11-14-2048 | | | $ | 1,155,000 | | | $ | 1,161,704 | |
| | | | |
Celgene Corporation | | | 2.75 | | | | 2-15-2023 | | | | 7,170,000 | | | | 7,189,482 | |
| | | | |
Celgene Corporation | | | 2.88 | | | | 2-19-2021 | | | | 1,987,000 | | | | 2,000,426 | |
| | | | |
Celgene Corporation | | | 3.90 | | | | 2-20-2028 | | | | 1,068,000 | | | | 1,120,936 | |
| | | | |
Celgene Corporation | | | 4.35 | | | | 11-15-2047 | | | | 985,000 | | | | 1,039,232 | |
| | | | |
Gilead Sciences Incorporated | | | 4.15 | | | | 3-1-2047 | | | | 599,000 | | | | 594,725 | |
| | | | |
| | | | | | | | | | | | | | | 24,424,306 | |
| | | | | | | | | | | | | | | | |
| | | | |
| Health Care Equipment & Supplies: 0.82% | | | | | | | | | | | | | | | | |
| | | | |
Abbott Laboratories | | | 3.40 | | | | 11-30-2023 | | | | 1,118,000 | | | | 1,153,396 | |
| | | | |
Abbott Laboratories | | | 3.75 | | | | 11-30-2026 | | | | 3,651,000 | | | | 3,855,509 | |
| | | | |
Abbott Laboratories | | | 3.88 | | | | 9-15-2025 | | | | 828,000 | | | | 875,361 | |
| | | | |
Abbott Laboratories | | | 4.90 | | | | 11-30-2046 | | | | 5,896,000 | | | | 6,959,981 | |
| | | | |
Becton Dickinson & Company | | | 2.40 | | | | 6-5-2020 | | | | 6,706,000 | | | | 6,681,448 | |
| | | | |
Becton Dickinson & Company | | | 3.36 | | | | 6-6-2024 | | | | 2,267,000 | | | | 2,301,136 | |
| | | | |
Becton Dickinson & Company | | | 3.70 | | | | 6-6-2027 | | | | 3,370,000 | | | | 3,454,274 | |
| | | | |
Becton Dickinson & Company | | | 3.73 | | | | 12-15-2024 | | | | 5,340,000 | | | | 5,507,892 | |
| | | | |
Becton Dickinson & Company | | | 4.69 | | | | 12-15-2044 | | | | 3,178,000 | | | | 3,420,013 | |
| | | | |
Boston Scientific Corporation | | | 3.75 | | | | 3-1-2026 | | | | 3,295,000 | | | | 3,417,714 | |
| | | | |
Boston Scientific Corporation | | | 4.00 | | | | 3-1-2028 | | | | 1,974,000 | | | | 2,066,756 | |
| | | | |
Boston Scientific Corporation | | | 4.00 | | | | 3-1-2029 | | | | 2,434,000 | | | | 2,561,585 | |
| | | | |
Boston Scientific Corporation | | | 4.70 | | | | 3-1-2049 | | | | 2,194,000 | | | | 2,399,369 | |
| | | | |
Edwards Lifesciences Corporation | | | 4.30 | | | | 6-15-2028 | | | | 2,891,000 | | | | 3,072,243 | |
| | | | |
| | | | | | | | | | | | | | | 47,726,677 | |
| | | | | | | | | | | | | | | | |
| | | | |
| Health Care Providers & Services: 0.77% | | | | | | | | | | | | | | | | |
| | | | |
CVS Health Corporation | | | 3.70 | | | | 3-9-2023 | | | | 2,044,000 | | | | 2,089,206 | |
| | | | |
CVS Health Corporation | | | 4.00 | | | | 12-5-2023 | | | | 2,997,000 | | | | 3,099,459 | |
| | | | |
CVS Health Corporation | | | 4.10 | | | | 3-25-2025 | | | | 2,020,000 | | | | 2,091,084 | |
| | | | |
CVS Health Corporation | | | 4.30 | | | | 3-25-2028 | | | | 6,624,000 | | | | 6,825,997 | |
| | | | |
CVS Health Corporation | | | 4.78 | | | | 3-25-2038 | | | | 3,841,000 | | | | 3,827,633 | |
| | | | |
CVS Health Corporation | | | 5.05 | | | | 3-25-2048 | | | | 3,344,000 | | | | 3,399,075 | |
| | | | |
Halfmoon Parent Incorporated 144A | | | 3.40 | | | | 9-17-2021 | | | | 4,529,000 | | | | 4,592,609 | |
| | | | |
Halfmoon Parent Incorporated 144A | | | 3.75 | | | | 7-15-2023 | | | | 5,589,000 | | | | 5,735,166 | |
| | | | |
Halfmoon Parent Incorporated 144A | | | 4.38 | | | | 10-15-2028 | | | | 2,382,000 | | | | 2,500,355 | |
| | | | |
Halfmoon Parent Incorporated 144A | | | 4.80 | | | | 8-15-2038 | | | | 439,000 | | | | 449,142 | |
| | | | |
Halfmoon Parent Incorporated 144A | | | 4.90 | | | | 12-15-2048 | | | | 2,638,000 | | | | 2,699,477 | |
| | | | |
UnitedHealth Group Incorporated | | | 3.50 | | | | 2-15-2024 | | | | 3,345,000 | | | | 3,474,495 | |
| | | | |
UnitedHealth Group Incorporated | | | 3.70 | | | | 12-15-2025 | | | | 2,227,000 | | | | 2,335,335 | |
| | | | |
UnitedHealth Group Incorporated | | | 4.45 | | | | 12-15-2048 | | | | 1,664,000 | | | | 1,836,825 | |
| | | | |
| | | | | | | | | | | | | | | 44,955,858 | |
| | | | | | | | | | | | | | | | |
| | | | |
| Pharmaceuticals: 0.71% | | | | | | | | | | | | | | | | |
| | | | |
Bristol-Myers Squibb Company 144A | | | 2.60 | | | | 5-16-2022 | | | | 8,745,000 | | | | 8,806,862 | |
| | | | |
Bristol-Myers Squibb Company 144A | | | 2.90 | | | | 7-26-2024 | | | | 4,763,000 | | | | 4,825,324 | |
| | | | |
Bristol-Myers Squibb Company 144A | | | 3.20 | | | | 6-15-2026 | | | | 1,108,000 | | | | 1,136,096 | |
| | | | |
Bristol-Myers Squibb Company 144A | | | 3.40 | | | | 7-26-2029 | | | | 5,100,000 | | | | 5,241,448 | |
| | | | |
Bristol-Myers Squibb Company 144A | | | 4.13 | | | | 6-15-2039 | | | | 508,000 | | | | 529,083 | |
| | | | |
Bristol-Myers Squibb Company 144A | | | 4.25 | | | | 10-26-2049 | | | | 400,000 | | | | 422,924 | |
The accompanying notes are an integral part of these financial statements.
| | | | | | |
| Portfolio of investments—May 31, 2019 | | Wells Fargo Core Bond Portfolio | | | 39 | |
| | | | | | | | | | | | | | | | |
| Security name | | Interest rate | | | Maturity date | | | Principal | | | Value | |
| | | | |
| Pharmaceuticals(continued) | | | | | | | | | | | | | | | | |
| | | | |
Merck & Company Incorporated | | | 3.40 | % | | | 3-7-2029 | | | $ | 3,584,000 | | | $ | 3,715,277 | |
| | | | |
Merck & Company Incorporated | | | 4.00 | | | | 3-7-2049 | | | | 3,377,000 | | | | 3,594,807 | |
| | | | |
Pfizer Incorporated | | | 2.80 | | | | 3-11-2022 | | | | 1,987,000 | | | | 2,016,358 | |
| | | | |
Pfizer Incorporated | | | 3.45 | | | | 3-15-2029 | | | | 4,405,000 | | | | 4,588,334 | |
| | | | |
Pfizer Incorporated | | | 4.10 | | | | 9-15-2038 | | | | 1,134,000 | | | | 1,220,401 | |
| | | | |
Pfizer Incorporated | | | 4.20 | | | | 9-15-2048 | | | | 4,877,000 | | | | 5,311,386 | |
| | | | |
| | | | | | | | | | | | | | | 41,408,300 | |
| | | | | | | | | | | | | | | | |
| | | | |
Industrials: 1.73% | | | | | | | | | | | | | | | | |
| | | | |
| Aerospace & Defense: 1.06% | | | | | | | | | | | | | | | | |
| | | | |
Lockheed Martin Corporation | | | 4.07 | | | | 12-15-2042 | | | | 3,535,000 | | | | 3,702,995 | |
| | | | |
Lockheed Martin Corporation | | | 4.09 | | | | 9-15-2052 | | | | 1,672,000 | | | | 1,752,602 | |
| | | | |
Northrop Grumman Corporation | | | 2.55 | | | | 10-15-2022 | | | | 6,508,000 | | | | 6,485,551 | |
| | | | |
Northrop Grumman Corporation | | | 2.93 | | | | 1-15-2025 | | | | 290,000 | | | | 290,511 | |
| | | | |
Northrop Grumman Corporation | | | 3.25 | | | | 8-1-2023 | | | | 6,003,000 | | | | 6,144,795 | |
| | | | |
Northrop Grumman Corporation | | | 3.25 | | | | 1-15-2028 | | | | 2,757,000 | | | | 2,759,374 | |
| | | | |
The Boeing Company | | | 2.70 | | | | 5-1-2022 | | | | 4,371,000 | | | | 4,403,733 | |
| | | | |
The Boeing Company | | | 3.10 | | | | 5-1-2026 | | | | 5,648,000 | | | | 5,731,929 | |
| | | | |
The Boeing Company | | | 3.20 | | | | 3-1-2029 | | | | 4,595,000 | | | | 4,634,024 | |
| | | | |
The Boeing Company | | | 3.50 | | | | 3-1-2039 | | | | 2,149,000 | | | | 2,094,705 | |
| | | | |
The Boeing Company | | | 3.55 | | | | 3-1-2038 | | | | 853,000 | | | | 837,955 | |
| | | | |
The Boeing Company | | | 3.85 | | | | 11-1-2048 | | | | 402,000 | | | | 401,933 | |
| | | | |
The Boeing Company | | | 3.90 | | | | 5-1-2049 | | | | 3,712,000 | | | | 3,738,628 | |
| | | | |
United Technologies Corporation | | | 3.65 | | | | 8-16-2023 | | | | 7,708,000 | | | | 7,996,722 | |
| | | | |
United Technologies Corporation | | | 3.95 | | | | 8-16-2025 | | | | 2,898,000 | | | | 3,059,485 | |
| | | | |
United Technologies Corporation | | | 4.13 | | | | 11-16-2028 | | | | 3,815,000 | | | | 4,046,649 | |
| | | | |
United Technologies Corporation | | | 4.45 | | | | 11-16-2038 | | | | 2,690,000 | | | | 2,897,404 | |
| | | | |
United Technologies Corporation | | | 4.63 | | | | 11-16-2048 | | | | 711,000 | | | | 773,448 | |
| | | | |
| | | | | | | | | | | | | | | 61,752,443 | |
| | | | | | | | | | | | | | | | |
| | | | |
| Air Freight & Logistics: 0.11% | | | | | | | | | | | | | | | | |
| | | | |
FedEx Corporation | | | 4.55 | | | | 4-1-2046 | | | | 2,219,000 | | | | 2,197,583 | |
| | | | |
FedEx Corporation | | | 4.95 | | | | 10-17-2048 | | | | 3,767,000 | | | | 3,922,515 | |
| | | | |
| | | | | | | | | | | | | | | 6,120,098 | |
| | | | | | | | | | | | | | | | |
| | | | |
| Airlines: 0.02% | | | | | | | | | | | | | | | | |
| | | | |
Delta Air Lines Incorporated | | | 4.38 | | | | 4-19-2028 | | | | 1,383,000 | | | | 1,389,095 | |
| | | | | | | | | | | | | | | | |
| | | | |
| Industrial Conglomerates: 0.14% | | | | | | | | | | | | | | | | |
| | | | |
General Electric Company | | | 4.50 | | | | 3-11-2044 | | | | 5,489,000 | | | | 5,169,052 | |
| | | | |
General Electric Company | | | 5.88 | | | | 1-14-2038 | | | | 2,492,000 | | | | 2,746,642 | |
| | | | |
| | | | | | | | | | | | | | | 7,915,694 | |
| | | | | | | | | | | | | | | | |
| | | | |
| Road & Rail: 0.35% | | | | | | | | | | | | | | | | |
| | | | |
Burlington Northern Santa Fe LLC | | | 4.90 | | | | 4-1-2044 | | | | 1,134,000 | | | | 1,318,178 | |
| | | | |
CSX Corporation | | | 4.25 | | | | 3-15-2029 | | | | 2,037,000 | | | | 2,201,622 | |
| | | | |
CSX Corporation | | | 4.75 | | | | 11-15-2048 | | | | 1,432,000 | | | | 1,591,912 | |
| | | | |
Union Pacific Corporation | | | 2.95 | | | | 3-1-2022 | | | | 3,643,000 | | | | 3,688,069 | |
| | | | |
Union Pacific Corporation | | | 3.15 | | | | 3-1-2024 | | | | 2,327,000 | | | | 2,371,330 | |
The accompanying notes are an integral part of these financial statements.
| | | | |
| 40 | | Wells Fargo Core Bond Portfolio | | Portfolio of investments—May 31, 2019 |
| | | | | | | | | | | | | | | | |
| Security name | | Interest rate | | | Maturity date | | | Principal | | | Value | |
| | | | |
| Road & Rail(continued) | | | | | | | | | | | | | | | | |
| | | | |
Union Pacific Corporation | | | 3.70 | % | | | 3-1-2029 | | | $ | 4,169,000 | | | $ | 4,357,691 | |
| | | | |
Union Pacific Corporation | | | 4.30 | | | | 3-1-2049 | | | | 4,479,000 | | | | 4,736,584 | |
| | | | |
| | | | | | | | | | | | | | | 20,265,386 | |
| | | | | | | | | | | | | | | | |
| | | | |
| Transportation Infrastructure: 0.05% | | | | | | | | | | | | | | | | |
| | | | |
Crowley Conro LLC | | | 4.18 | | | | 8-15-2043 | | | | 2,908,640 | | | | 3,175,341 | |
| | | | | | | | | | | | | | | | |
| | | | |
Information Technology: 1.56% | | | | | | | | | | | | | | | | |
| | | | |
| IT Services: 0.34% | | | | | | | | | | | | | | | | |
| | | | |
Fidelity National Information Services Incorporated | | | 3.75 | | | | 5-21-2029 | | | | 3,628,000 | | | | 3,705,935 | |
| | | | |
Fiserv Incorporated | | | 4.20 | | | | 10-1-2028 | | | | 350,000 | | | | 369,906 | |
| | | | |
IBM Corporation | | | 3.30 | | | | 5-15-2026 | | | | 3,304,000 | | | | 3,340,987 | |
| | | | |
IBM Corporation | | | 4.15 | | | | 5-15-2039 | | | | 1,513,000 | | | | 1,551,309 | |
| | | | |
IBM Corporation | | | 4.25 | | | | 5-15-2049 | | | | 2,602,000 | | | | 2,668,792 | |
| | | | |
Mastercard Incorporated | | | 2.95 | | | | 6-1-2029 | | | | 5,045,000 | | | | 5,094,009 | |
| | | | |
Mastercard Incorporated | | | 3.65 | | | | 6-1-2049 | | | | 2,624,000 | | | | 2,664,981 | |
| | | | |
| | | | | | | | | | | | | | | 19,395,919 | |
| | | | | | | | | | | | | | | | |
| | | | |
| Semiconductors & Semiconductor Equipment: 0.37% | | | | | | | | | | | | | | | | |
| | | | |
Broadcom Incorporated 144A | | | 4.25 | | | | 4-15-2026 | | | | 12,742,000 | | | | 12,612,615 | |
| | | | |
Broadcom Incorporated 144A | | | 4.75 | | | | 4-15-2029 | | | | 1,857,000 | | | | 1,830,524 | |
| | | | |
KLA Tencor Corporation | | | 4.10 | | | | 3-15-2029 | | | | 2,421,000 | | | | 2,486,108 | |
| | | | |
Lam Research Corporation | | | 3.75 | | | | 3-15-2026 | | | | 3,270,000 | | | | 3,360,189 | |
| | | | |
Lam Research Corporation | | | 4.88 | | | | 3-15-2049 | | | | 890,000 | | | | 963,646 | |
| | | | |
Texas Instruments Incorporated | | | 3.88 | | | | 3-15-2039 | | | | 336,000 | | | | 354,510 | |
| | | | |
| | | | | | | | | | | | | | | 21,607,592 | |
| | | | | | | | | | | | | | | | |
| | | | |
| Software: 0.52% | | | | | | | | | | | | | | | | |
| | | | |
Microsoft Corporation | | | 3.30 | | | | 2-6-2027 | | | | 4,049,000 | | | | 4,216,472 | |
| | | | |
Microsoft Corporation | | | 3.70 | | | | 8-8-2046 | | | | 1,013,000 | | | | 1,053,470 | |
| | | | |
Microsoft Corporation | | | 4.00 | | | | 2-12-2055 | | | | 2,649,000 | | | | 2,854,108 | |
| | | | |
Microsoft Corporation | | | 4.10 | | | | 2-6-2037 | | | | 3,304,000 | | | | 3,654,625 | |
| | | | |
Microsoft Corporation | | | 4.25 | | | | 2-6-2047 | | | | 7,063,000 | | | | 8,004,264 | |
| | | | |
Microsoft Corporation | | | 4.50 | | | | 2-6-2057 | | | | 2,434,000 | | | | 2,860,699 | |
| | | | |
Oracle Corporation | | | 2.63 | | | | 2-15-2023 | | | | 2,724,000 | | | | 2,718,684 | |
| | | | |
Oracle Corporation | | | 2.95 | | | | 11-15-2024 | | | | 1,457,000 | | | | 1,476,738 | |
| | | | |
Oracle Corporation | | | 3.80 | | | | 11-15-2037 | | | | 1,490,000 | | | | 1,499,588 | |
| | | | |
Oracle Corporation | | | 4.00 | | | | 11-15-2047 | | | | 2,021,000 | | | | 2,039,494 | |
| | | | |
| | | | | | | | | | | | | | | 30,378,142 | |
| | | | | | | | | | | | | | | | |
| | | | |
| Technology Hardware, Storage & Peripherals: 0.33% | | | | | | | | | | | | | | | | |
| | | | |
Apple Incorporated | | | 3.20 | | | | 5-13-2025 | | | | 1,217,000 | | | | 1,250,973 | |
| | | | |
Apple Incorporated | | | 3.20 | | | | 5-11-2027 | | | | 7,543,000 | | | | 7,680,854 | |
| | | | |
Apple Incorporated | | | 4.25 | | | | 2-9-2047 | | | | 2,781,000 | | | | 2,971,068 | |
| | | | |
Apple Incorporated | | | 4.38 | | | | 5-13-2045 | | | | 1,863,000 | | | | 2,029,685 | |
| | | | |
Apple Incorporated | | | 4.65 | | | | 2-23-2046 | | | | 1,970,000 | | | | 2,234,253 | |
| | | | |
Hewlett Packard Enterprise Company | | | 6.35 | | | | 10-15-2045 | | | | 2,981,000 | | | | 3,176,724 | |
| | | | |
| | | | | | | | | | | | | | | 19,343,557 | |
| | | | | | | | | | | | | | | | |
The accompanying notes are an integral part of these financial statements.
| | | | | | |
| Portfolio of investments—May 31, 2019 | | Wells Fargo Core Bond Portfolio | | | 41 | |
| | | | | | | | | | | | | | | | |
| Security name | | Interest rate | | | Maturity date | | | Principal | | | Value | |
| | | | |
Materials: 0.55% | | | | | | | | | | | | | | | | |
| | | | |
| Chemicals: 0.38% | | | | | | | | | | | | | | | | |
| | | | |
Dow Chemical Company | | | 4.25 | % | | | 10-1-2034 | | | $ | 1,392,000 | | | $ | 1,402,207 | |
| | | | |
Dow Chemical Company 144A | | | 4.80 | | | | 5-15-2049 | | | | 2,020,000 | | | | 2,032,497 | |
| | | | |
DowDuPont Incorporated | | | 4.73 | | | | 11-15-2028 | | | | 2,070,000 | | | | 2,261,098 | |
| | | | |
DowDuPont Incorporated | | | 4.21 | | | | 11-15-2023 | | | | 3,055,000 | | | | 3,218,559 | |
| | | | |
DowDuPont Incorporated | | | 5.42 | | | | 11-15-2048 | | | | 2,277,000 | | | | 2,588,681 | |
| | | | |
Huntsman International LLC | | | 4.50 | | | | 5-1-2029 | | | | 5,446,000 | | | | 5,515,165 | |
| | | | |
Huntsman International LLC | | | 5.13 | | | | 11-15-2022 | | | | 1,676,000 | | | | 1,749,435 | |
| | | | |
Mosaic Company | | | 4.05 | | | | 11-15-2027 | | | | 2,322,000 | | | | 2,344,555 | |
| | | | |
Westlake Chemical Corporation | | | 3.60 | | | | 8-15-2026 | | | | 1,184,000 | | | | 1,172,251 | |
| | | | |
| | | | | | | | | | | | | | | 22,284,448 | |
| | | | | | | | | | | | | | | | |
| | | | |
| Metals & Mining: 0.17% | | | | | | | | | | | | | | | | |
| | | | |
Barrick Gold Finance Company LLC | | | 5.70 | | | | 5-30-2041 | | | | 2,401,000 | | | | 2,726,182 | |
| | | | |
Barrick North America Finance LLC | | | 5.75 | | | | 5-1-2043 | | | | 1,539,000 | | | | 1,775,918 | |
| | | | |
Southern Copper Corporation | | | 3.88 | | | | 4-23-2025 | | | | 2,293,000 | | | | 2,306,038 | |
| | | | |
Southern Copper Corporation | | | 5.88 | | | | 4-23-2045 | | | | 2,600,000 | | | | 2,886,819 | |
| | | | |
| | | | | | | | | | | | | | | 9,694,957 | |
| | | | | | | | | | | | | | | | |
| | | | |
Real Estate: 0.70% | | | | | | | | | | | | | | | | |
| | | | |
| Equity REITs: 0.70% | | | | | | | | | | | | | | | | |
| | | | |
Crown Castle International Corporation | | | 5.20 | | | | 2-15-2049 | | | | 991,000 | | | | 1,083,895 | |
| | | | |
DDR Corporation | | | 4.25 | | | | 2-1-2026 | | | | 902,000 | | | | 923,811 | |
| | | | |
DDR Corporation | | | 4.63 | | | | 7-15-2022 | | | | 1,755,000 | | | | 1,820,659 | |
| | | | |
Mid-America Apartments LP | | | 3.60 | | | | 6-1-2027 | | | | 1,399,000 | | | | 1,423,879 | |
| | | | |
Mid-America Apartments LP | | | 3.75 | | | | 6-15-2024 | | | | 4,926,000 | | | | 5,078,494 | |
| | | | |
Mid-America Apartments LP | | | 3.95 | | | | 3-15-2029 | | | | 894,000 | | | | 931,942 | |
| | | | |
Mid-America Apartments LP | | | 4.00 | | | | 11-15-2025 | | | | 2,525,000 | | | | 2,640,722 | |
| | | | |
Mid-America Apartments LP | | | 4.30 | | | | 10-15-2023 | | | | 2,111,000 | | | | 2,218,172 | |
| | | | |
Public Storage | | | 3.09 | | | | 9-15-2027 | | | | 4,347,000 | | | | 4,355,885 | |
| | | | |
Public Storage | | | 3.39 | | | | 5-1-2029 | | | | 2,963,000 | | | | 3,035,415 | |
| | | | |
Regency Centers LP | | | 4.13 | | | | 3-15-2028 | | | | 1,366,000 | | | | 1,439,656 | |
| | | | |
Store Capital Corporation | | | 4.50 | | | | 3-15-2028 | | | | 7,758,000 | | | | 8,043,964 | |
| | | | |
Store Capital Corporation | | | 4.63 | | | | 3-15-2029 | | | | 2,591,000 | | | | 2,713,477 | |
| | | | |
Tanger Properties LP | | | 3.88 | | | | 12-1-2023 | | | | 2,691,000 | | | | 2,724,225 | |
| | | | |
Ventas Realty LP | | | 4.88 | | | | 4-15-2049 | | | | 2,003,000 | | | | 2,182,856 | |
| | | | |
| | | | | | | | | | | | | | | 40,617,052 | |
| | | | | | | | | | | | | | | | |
| | | | |
Utilities: 1.62% | | | | | | | | | | | | | | | | |
| | | | |
| Electric Utilities: 1.20% | | | | | | | | | | | | | | | | |
| | | | |
Commonwealth Edison Company | | | 4.00 | | | | 3-1-2049 | | | | 3,833,000 | | | | 3,995,199 | |
| | | | |
Duke Energy Corporation | | | 1.80 | | | | 9-1-2021 | | | | 4,347,000 | | | | 4,276,190 | |
| | | | |
Duke Energy Indiana Incorporated | | | 3.75 | | | | 5-15-2046 | | | | 994,000 | | | | 990,317 | |
| | | | |
Duke Energy Progress LLC | | | 3.45 | | | | 3-15-2029 | | | | 3,270,000 | | | | 3,364,907 | |
| | | | |
Entergy Arkansas LLC | | | 4.20 | | | | 4-1-2049 | | | | 598,000 | | | | 640,742 | |
| | | | |
FirstEnergy Corporation | | | 3.90 | | | | 7-15-2027 | | | | 1,187,000 | | | | 1,217,373 | |
| | | | |
FirstEnergy Corporation | | | 4.25 | | | | 3-15-2023 | | | | 5,243,000 | | | | 5,495,566 | |
| | | | |
FirstEnergy Corporation | | | 4.85 | | | | 7-15-2047 | | | | 2,168,000 | | | | 2,370,388 | |
The accompanying notes are an integral part of these financial statements.
| | | | |
| 42 | | Wells Fargo Core Bond Portfolio | | Portfolio of investments—May 31, 2019 |
| | | | | | | | | | | | | | | | |
| Security name | | Interest rate | | | Maturity date | | | Principal | | | Value | |
| | | | |
| Electric Utilities(continued) | | | | | | | | | | | | | | | | |
| | | | |
FirstEnergy Transmission LLC 144A | | | 5.45 | % | | | 7-15-2044 | | | $ | 836,000 | | | $ | 977,856 | |
| | | | |
Indiana Michigan Power Company | | | 4.55 | | | | 3-15-2046 | | | | 2,028,000 | | | | 2,244,621 | |
| | | | |
Metropolitan Edison Company 144A | | | 4.30 | | | | 1-15-2029 | | | | 3,253,000 | | | | 3,469,239 | |
| | | | |
Mid-Atlantic Interstate Transmission LLC 144A | | | 4.10 | | | | 5-15-2028 | | | | 4,059,000 | | | | 4,233,848 | |
| | | | |
MidAmerica Energy Company | | | 4.25 | | | | 7-15-2049 | | | | 911,000 | | | | 998,602 | |
| | | | |
Mississippi Power Company | | | 3.95 | | | | 3-30-2028 | | | | 5,059,000 | | | | 5,286,409 | |
| | | | |
NSTAR Electric Company | | | 3.25 | | | | 5-15-2029 | | | | 1,009,000 | | | | 1,031,140 | |
| | | | |
Ohio Power Company | | | 4.00 | | | | 6-1-2049 | | | | 2,427,000 | | | | 2,516,134 | |
| | | | |
PacifiCorp | | | 4.15 | | | | 2-15-2050 | | | | 2,400,000 | | | | 2,587,020 | |
| | | | |
Public Service Electric Company | | | 3.20 | | | | 5-15-2029 | | | | 4,005,000 | | | | 4,092,093 | |
| | | | |
Public Service Electric Company | | | 3.85 | | | | 5-1-2049 | | | | 2,807,000 | | | | 2,949,764 | |
| | | | |
South Carolina Edison Company | | | 3.70 | | | | 8-1-2025 | | | | 2,384,000 | | | | 2,442,711 | |
| | | | |
South Carolina Edison Company | | | 4.13 | | | | 3-1-2048 | | | | 6,617,000 | | | | 6,467,689 | |
| | | | |
Southern California Edison Company | | | 4.65 | | | | 10-1-2043 | | | | 985,000 | | | | 1,017,993 | |
| | | | |
Southern California Edison Company | | | 5.50 | | | | 3-15-2040 | | | | 2,565,000 | | | | 2,931,351 | |
| | | | |
Southwestern Electric Power Company | | | 3.90 | | | | 4-1-2045 | | | | 1,325,000 | | | | 1,307,915 | |
| | | | |
The Southern Company | | | 4.40 | | | | 7-1-2046 | | | | 2,998,000 | | | | 3,044,328 | |
| | | | |
| | | | | | | | | | | | | | | 69,949,395 | |
| | | | | | | | | | | | | | | | |
| | | | |
| Multi-Utilities: 0.42% | | | | | | | | | | | | | | | | |
| | | | |
CenterPoint Energy Incorporated | | | 2.50 | | | | 9-1-2022 | | | | 414,000 | | | | 411,428 | |
| | | | |
CenterPoint Energy Incorporated | | | 3.85 | | | | 2-1-2024 | | | | 1,391,000 | | | | 1,451,517 | |
| | | | |
CenterPoint Energy Incorporated | | | 4.00 | | | | 4-1-2028 | | | | 145,000 | | | | 153,016 | |
| | | | |
CenterPoint Energy Incorporated | | | 4.25 | | | | 11-1-2028 | | | | 3,006,000 | | | | 3,206,381 | |
| | | | |
Dominion Resources Incorporated | | | 1.60 | | | | 8-15-2019 | | | | 3,809,000 | | | | 3,799,906 | |
| | | | |
Dominion Resources Incorporated | | | 2.00 | | | | 8-15-2021 | | | | 2,898,000 | | | | 2,848,634 | |
| | | | |
Nextera Energy Capital Company | | | 3.15 | | | | 4-1-2024 | | | | 4,317,000 | | | | 4,368,728 | |
| | | | |
Nextera Energy Capital Company | | | 3.50 | | | | 4-1-2029 | | | | 974,000 | | | | 993,822 | |
| | | | |
San Diego Gas & Electric Company | | | 4.15 | | | | 5-15-2048 | | | | 10,000 | | | | 10,076 | |
| | | | |
Sempra Energy | | | 2.90 | | | | 2-1-2023 | | | | 2,347,000 | | | | 2,348,587 | |
| | | | |
Sempra Energy | | | 4.00 | | | | 2-1-2048 | | | | 4,223,000 | | | | 3,935,636 | |
| | | | |
Sempra Energy | | | 3.40 | | | | 2-1-2028 | | | | 1,143,000 | | | | 1,126,120 | |
| | | | |
| | | | | | | | | | | | | | | 24,653,851 | |
| | | | | | | | | | | | | | | | |
| | | | |
Total Corporate Bonds and Notes (Cost $1,115,248,300) | | | | | | | | | | | | | | | 1,155,611,191 | |
| | | | | | | | | | | | | | | | |
| | | | |
Foreign Corporate Bonds and Notes @: 0.04% | | | | | | | | | | | | | | | | |
| | | | |
Energy: 0.04% | | | | | | | | | | | | | | | | |
| | | | |
| Oil, Gas & Consumable Fuels: 0.04% | | | | | | | | | | | | | | | | |
| | | | |
EnCana Corporation (CAD) | | | 6.63 | | | | 8-15-2037 | | | | 1,863,000 | | | | 2,229,608 | |
| | | | | | | | | | | | | | | | |
| | | | |
Total Foreign Corporate Bonds and Notes (Cost $2,236,203) | | | | | | | | | | | | | | | 2,229,608 | |
| | | | | | | | | | | | | | | | |
| | | | |
Municipal Obligations: 0.55% | | | | | | | | | | | | | | | | |
| | | | |
California: 0.17% | | | | | | | | | | | | | | | | |
| | | | |
| GO Revenue: 0.17% | | | | | | | | | | | | | | | | |
| | | | |
California Build America Bonds | | | 7.60 | | | | 11-1-2040 | | | $ | 1,580,000 | | | | 2,522,328 | |
| | | | |
Los Angeles CA Community College District Build America Bonds | | | 6.75 | | | | 8-1-2049 | | | | 4,670,000 | | | | 7,343,715 | |
| | | | |
| | | | | | | | | | | | | | | 9,866,043 | |
| | | | | | | | | | | | | | | | |
The accompanying notes are an integral part of these financial statements.
| | | | | | |
| Portfolio of investments—May 31, 2019 | | Wells Fargo Core Bond Portfolio | | | 43 | |
| | | | | | | | | | | | | | | | |
| Security name | | Interest rate | | | Maturity date | | | Principal | | | Value | |
| | | | |
Illinois: 0.02% | | | | | | | | | | | | | | | | |
| | | | |
| GO Revenue: 0.02% | | | | | | | | | | | | | | | | |
| | | | |
Illinois Taxable Pension | | | 5.10 | % | | | 6-1-2033 | | | $ | 1,065,000 | | | $ | 1,098,835 | |
| | | | | | | | | | | | | | | | |
| | | | |
Nevada: 0.09% | | | | | | | | | | | | | | | | |
| | | | |
| Airport Revenue: 0.09% | | | | | | | | | | | | | | | | |
| | | | |
Clark County NV Airport Authority Build America Bonds Series C | | | 6.82 | | | | 7-1-2045 | | | | 3,365,000 | | | | 5,244,723 | |
| | | | | | | | | | | | | | | | |
| | | | |
New York: 0.13% | | | | | | | | | | | | | | | | |
| | | | |
| Airport Revenue: 0.13% | | | | | | | | | | | | | | | | |
| | | | |
Port Authority of New York & New Jersey Consolidated Bonds Series 174 | | | 4.46 | | | | 10-1-2062 | | | | 6,705,000 | | | | 7,917,331 | |
| | | | | | | | | | | | | | | | |
| | | | |
Ohio: 0.04% | | | | | | | | | | | | | | | | |
| | | | |
| Education Revenue: 0.04% | | | | | | | | | | | | | | | | |
| | | | |
Ohio State University General Receipts Taxable Bonds Series A | | | 4.80 | | | | 6-1-2111 | | | | 1,957,000 | | | | 2,360,396 | |
| | | | | | | | | | | | | | | | |
| | | | |
Texas: 0.10% | | | | | | | | | | | | | | | | |
| | | | |
| Transportation Revenue: 0.10% | | | | | | | | | | | | | | | | |
| | | | |
North Texas Tollway Authority | | | 6.72 | | | | 1-1-2049 | | | | 3,609,000 | | | | 5,612,500 | |
| | | | | | | | | | | | | | | | |
| | | | |
Total Municipal Obligations (Cost $25,221,477) | | | | | | | | | | | | | | | 32,099,828 | |
| | | | | | | | | | | | | | | | |
| | | | |
Non-Agency Mortgage-Backed Securities: 4.85% | | | | | | | | | | | | | | | | |
| | | | |
Angel Oak Mortgage Trust Series 2019-2 Class A1 144A±± | | | 3.63 | | | | 3-25-2049 | | | | 3,793,818 | | | | 3,833,183 | |
| | | | |
Barclays Commercial Mortgage Trust Series 2019-C3 Class A4 %% | | | 3.58 | | | | 5-15-2052 | | | | 4,893,000 | | | | 5,122,424 | |
| | | | |
Benchmark Mortgage Trust Series 2018-B1 Class ASB ±± | | | 3.60 | | | | 1-15-2051 | | | | 1,620,000 | | | | 1,702,570 | |
| | | | |
Benchmark Mortgage Trust Series 2019-B11 Class A5 %% | | | 3.54 | | | | 5-15-2052 | | | | 2,229,000 | | | | 2,337,342 | |
| | | | |
Benchmark Mortgage Trust Series 2019-B9 Class A4 | | | 3.75 | | | | 3-15-2052 | | | | 4,399,000 | | | | 4,690,350 | |
| | | | |
Bunker Hill Loan Depositary Trust Series 2019-1 Class A1 144A | | | 3.61 | | | | 10-26-2048 | | | | 2,525,973 | | | | 2,573,810 | |
| | | | |
CD Commercial Mortgage Trust Series 2016-CD1 Class A1 | | | 1.44 | | | | 8-10-2049 | | | | 1,042,187 | | | | 1,029,295 | |
| | | | |
CD Commercial Mortgage Trust Series 2016-CD1 Class ASB | | | 2.62 | | | | 8-10-2049 | | | | 3,720,000 | | | | 3,738,692 | |
| | | | |
CD Commercial Mortgage Trust Series 2017-CD4 Class A4 ±± | | | 3.51 | | | | 5-10-2050 | | | | 2,986,000 | | | | 3,122,493 | |
| | | | |
CD Commercial Mortgage Trust Series 2017-CD4 Class ASB | | | 3.32 | | | | 5-10-2050 | | | | 2,105,000 | | | | 2,174,005 | |
| | | | |
CD Commercial Mortgage Trust Series 2017-CD6 Class ASB | | | 3.33 | | | | 11-13-2050 | | | | 5,323,000 | | | | 5,502,909 | |
| | | | |
CFCRE Commercial Mortgage Trust Series 2016-C3 Class A1 | | | 1.79 | | | | 1-10-2048 | | | | 1,260,426 | | | | 1,251,650 | |
| | | | |
CFCRE Commercial Mortgage Trust Series 2016-C7 Class A2 | | | 3.59 | | | | 12-10-2054 | | | | 2,861,000 | | | | 2,987,497 | |
| | | | |
CFCRE Commercial Mortgage Trust Series 2016-C7 Class A3 | | | 3.84 | | | | 12-10-2054 | | | | 4,014,000 | | | | 4,256,863 | |
| | | | |
CFCRE Commercial Mortgage Trust Series 2017-C8 Class A1 | | | 1.96 | | | | 6-15-2050 | | | | 1,199,141 | | | | 1,190,880 | |
| | | | |
CFCRE Commercial Mortgage Trust Series 2017-C8 Class ASB | | | 3.37 | | | | 6-15-2050 | | | | 2,014,000 | | | | 2,083,631 | |
| | | | |
Citigroup Commercial Mortgage Trust Series 2015-GC29 Class AS | | | 3.46 | | | | 4-10-2048 | | | | 1,353,000 | | | | 1,396,862 | |
| | | | |
Colt Funding LLC Series 2019-1 Class A1 144A±± | | | 3.71 | | | | 3-25-2049 | | | | 3,862,626 | | | | 3,919,805 | |
| | | | |
Colt Funding LLC Series 2019-2 Class A1 144A±± | | | 3.34 | | | | 5-25-2049 | | | | 7,037,909 | | | | 7,119,213 | |
| | | | |
Commercial Mortgage Pass-Through Certificate Series 2012-CR3 Class A3 | | | 2.82 | | | | 10-15-2045 | | | | 2,240,762 | | | | 2,255,420 | |
| | | | |
Commercial Mortgage Pass-Through Certificate Series 2013-CR10 Class A2 | | | 2.97 | | | | 8-10-2046 | | | | 60,931 | | | | 62,262 | |
| | | | |
Commercial Mortgage Pass-Through Certificate Series 2013-CR12 Class A4 | | | 4.05 | | | | 10-10-2046 | | | | 2,289,000 | | | | 2,416,815 | |
| | | | |
Commercial Mortgage Pass-Through Certificate Series 2013-CR9 Class A4 ±± | | | 4.23 | | | | 7-10-2045 | | | | 5,723,302 | | | | 6,102,619 | |
| | | | |
Commercial Mortgage Pass-Through Certificate Series 2016-C1 Class ASB | | | 2.97 | | | | 10-10-2049 | | | | 2,071,000 | | | | 2,095,274 | |
| | | | |
Commercial Mortgage Trust Series 2012-CR4 Class A2 | | | 1.80 | | | | 10-15-2045 | | | | 413,500 | | | | 404,662 | |
| | | | |
Commercial Mortgage Trust Series 2018-COR3 Class A3 | | | 4.23 | | | | 5-10-2051 | | | | 3,866,000 | | | | 4,238,420 | |
| | | | |
Commercial Real Estate Products & Resources Estate
Series 2016-C4 Class ASB | | | 3.09 | | | | 5-10-2058 | | | | 2,871,000 | | | | 2,930,956 | |
The accompanying notes are an integral part of these financial statements.
| | | | |
| 44 | | Wells Fargo Core Bond Portfolio | | Portfolio of investments—May 31, 2019 |
| | | | | | | | | | | | | | | | |
| Security name | | Interest rate | | | Maturity date | | | Principal | | | Value | |
| | | | |
Non-Agency Mortgage-Backed Securities(continued) | | | | | | | | | | | | | | | | |
| | | | |
Credit Suisse Mortgage Trust Series 2016-NSXR Class A4 ±± | | | 3.79 | % | | | 12-15-2049 | | | $ | 8,835,000 | | | $ | 9,328,073 | |
| | | | |
CSAIL Commercial Mortgage Trust Series 2015-C2 Class A4 | | | 3.50 | | | | 6-15-2057 | | | | 2,953,000 | | | | 3,066,978 | |
| | | | |
CSAIL Commercial Mortgage Trust Series 2015-C3 Class A4 | | | 3.72 | | | | 8-15-2048 | | | | 3,721,000 | | | | 3,908,842 | |
| | | | |
CSAIL Commercial Mortgage Trust Series 2015-C4 Class A4 | | | 3.81 | | | | 11-15-2048 | | | | 6,095,200 | | | | 6,445,628 | |
| | | | |
CSAIL Commercial Mortgage Trust Series 2016-C5 Class ASB | | | 3.53 | | | | 11-15-2048 | | | | 865,000 | | | | 895,223 | |
| | | | |
Deutsche Bank Commercial Mortgage Trust Series 2017-C6 Class ASB | | | 3.12 | | | | 6-10-2050 | | | | 1,249,000 | | | | 1,278,900 | |
| | | | |
GS Mortgage Securities Trust Series 2012-GCJ7 Class AAB | | | 2.94 | | | | 5-10-2045 | | | | 252,564 | | | | 252,774 | |
| | | | |
GS Mortgage Securities Trust Series 2014-GCJ18 Class A3 | | | 3.80 | | | | 1-10-2047 | | | | 1,738,083 | | | | 1,815,926 | |
| | | | |
GS Mortgage Securities Trust Series 2015-GC34 Class A4 | | | 3.51 | | | | 10-10-2048 | | | | 2,820,000 | | | | 2,941,299 | |
| | | | |
GS Mortgage Securities Trust Series 2016-GS3 Class AAB | | | 2.78 | | | | 10-10-2049 | | | | 3,117,000 | | | | 3,150,283 | |
| | | | |
GS Mortgage Securities Trust Series 2017-GS6 Class A3 | | | 3.43 | | | | 5-10-2050 | | | | 4,851,364 | | | | 5,043,581 | |
| | | | |
GS Mortgage Securities Trust Series 2017-GSJ7 Class A4 | | | 3.43 | | | | 8-10-2050 | | | | 2,986,000 | | | | 3,085,521 | |
| | | | |
Impact Funding LLC Series 2010-1 Class A1 144A | | | 5.31 | | | | 1-25-2051 | | | | 6,934,249 | | | | 7,495,701 | |
| | | | |
JPMDB Commercial Mortgage Securities Series 2014-C23 Class A4 | | | 3.67 | | | | 9-15-2047 | | | | 2,419,000 | | | | 2,529,491 | |
| | | | |
JPMDB Commercial Mortgage Securities Series 2015-C33 Class A4 | | | 3.77 | | | | 12-15-2048 | | | | 1,554,714 | | | | 1,646,812 | |
| | | | |
JPMDB Commercial Mortgage Securities Series 2017-C5 A5 | | | 3.69 | | | | 3-15-2050 | | | | 5,010,000 | | | | 5,298,611 | |
| | | | |
JPMDB Commercial Mortgage Securities Series 2017-C5 Class ASB | | | 3.49 | | | | 3-15-2050 | | | | 861,000 | | | | 896,891 | |
| | | | |
JPMDB Commercial Mortgage Securities Series 2018-C8 Class A3 | | | 3.94 | | | | 6-15-2051 | | | | 2,516,000 | | | | 2,708,637 | |
| | | | |
JPMDB Commercial Mortgage Securities Series 2018-C8 Class ASB | | | 4.15 | | | | 6-15-2051 | | | | 2,714,000 | | | | 2,938,608 | |
| | | | |
JPMorgan Chase Commercial Mortgage Securities Corporation Series 2014-C20 Class A2 | | | 2.87 | | | | 7-15-2047 | | | | 343,857 | | | | 343,439 | |
| | | | |
JPMorgan Chase Commercial Mortgage Securities Corporation Series 2016-C1 Class A5 | | | 3.58 | | | | 3-15-2049 | | | | 1,992,000 | | | | 2,087,841 | |
| | | | |
JPMorgan Chase Commercial Mortgage Securities Corporation Series 2016-JP2 Class A1 | | | 1.32 | | | | 8-15-2049 | | | | 1,944,816 | | | | 1,922,731 | |
| | | | |
JPMorgan Chase Commercial Mortgage Securities Corporation Series 2017-JP5 Class ASB | | | 3.55 | | | | 3-15-2050 | | | | 6,129,000 | | | | 6,402,446 | |
| | | | |
JPMorgan Chase Commercial Mortgage Securities Corporation Series 2017-JP6 Class ASB | | | 3.28 | | | | 7-15-2050 | | | | 2,343,000 | | | | 2,419,737 | |
| | | | |
JPMorgan Chase Commercial Mortgage Securities Trust
Series 2015-C28 Class A2 | | | 2.77 | | | | 10-15-2048 | | | | 1,730,941 | | | | 1,730,008 | |
| | | | |
JPMorgan Chase Commercial Mortgage Securities Trust
Series 2015-C28 Class A3 | | | 2.91 | | | | 10-15-2048 | | | | 10,965,000 | | | | 11,066,840 | |
| | | | |
JPMorgan Chase Commercial Mortgage Securities Trust
Series 2015-JP2 Class ASB | | | 2.71 | | | | 8-15-2049 | | | | 2,765,000 | | | | 2,783,071 | |
| | | | |
JPMorgan Chase Commercial Mortgage Securities Trust
Series 2019-COR4 Class A5 | | | 4.03 | | | | 3-10-2052 | | | | 3,771,000 | | | | 4,089,098 | |
| | | | |
JPMorgan Mortgage Trust Series 2016-5 Class A1 144A±± | | | 2.64 | | | | 12-25-2046 | | | | 2,825,774 | | | | 2,813,268 | |
| | | | |
JPMorgan Mortgage Trust Series 2017-5 Class A1 144A±± | | | 3.17 | | | | 10-26-2048 | | | | 24,800,015 | | | | 24,929,392 | |
| | | | |
Morgan Stanley Bank of America Merrill Lynch Trust
Series2015-C20 Class A4 | | | 3.25 | | | | 2-15-2048 | | | | 800,041 | | | | 821,456 | |
| | | | |
Morgan Stanley Bank of America Merrill Lynch Trust
Series 2015-C27 Class A4 | | | 3.75 | | | | 12-15-2047 | | | | 754,000 | | | | 796,069 | |
| | | | |
Morgan Stanley Bank of America Merrill Lynch Trust
Series 2016-C30 Class A4 | | | 2.60 | | | | 9-15-2049 | | | | 4,774,000 | | | | 4,709,882 | |
| | | | |
Morgan Stanley Bank of America Merrill Lynch Trust
Series 2016-C30 Class ASB | | | 2.73 | | | | 9-15-2049 | | | | 9,888,000 | | | | 9,951,739 | |
| | | | |
Morgan Stanley Capital I Trust Series 2016-UB11 Class A1 | | | 1.45 | | | | 8-15-2049 | | | | 2,148,210 | | | | 2,125,293 | |
| | | | |
Morgan Stanley Capital I Trust Series 2016-UB11 Class ASB | | | 2.61 | | | | 8-15-2049 | | | | 2,119,000 | | | | 2,120,222 | |
| | | | |
Morgan Stanley Capital I Trust Series 2016-UBS9 Class A1 | | | 1.71 | | | | 3-15-2049 | | | | 1,118,229 | | | | 1,108,348 | |
| | | | |
New Residential Mortgage Loan Trust Series 2019-NQM2 Class A1 144A±± | | | 3.60 | | | | 4-25-2049 | | | | 3,662,094 | | | | 3,719,169 | |
| | | | |
SoFi Professional Loan Program LLC Series 2016-A Class A2 144A | | | 2.76 | | | | 12-26-2036 | | | | 3,102,032 | | | | 3,112,040 | |
| | | | |
SoFi Professional Loan Program LLC Series 2016-D Class A1 (1 Month LIBOR +0.95%) 144A± | | | 3.38 | | | | 1-25-2039 | | | | 559,758 | | | | 562,005 | |
| | | | |
SoFi Professional Loan Program LLC Series 2016-E Class A1 (1 Month LIBOR +0.85%) 144A± | | | 3.28 | | | | 7-25-2039 | | | | 1,229,080 | | | | 1,229,826 | |
| | | | |
SoFi Professional Loan Program LLC Series 2017-A Class A1 (1 Month LIBOR +0.70%) 144A± | | | 3.13 | | | | 3-26-2040 | | | | 1,233,437 | | | | 1,235,901 | |
| | | | |
SoFi Professional Loan Program LLC Series 2017-D Class A2 144A | | | 2.65 | | | | 9-25-2040 | | | | 666,000 | | | | 668,756 | |
The accompanying notes are an integral part of these financial statements.
| | | | | | |
| Portfolio of investments—May 31, 2019 | | Wells Fargo Core Bond Portfolio | | | 45 | |
| | | | | | | | | | | | | | | | |
| Security name | | Interest rate | | | Maturity date | | | Principal | | | Value | |
| | | | |
Non-Agency Mortgage-Backed Securities(continued) | | | | | | | | | | | | | | | | |
| | | | |
SoFi Professional Loan Program LLC Series 2017-E Class A1 (1 Month LIBOR +0.50%) 144A± | | | 2.93 | % | | | 11-26-2040 | | | $ | 968,255 | | | $ | 966,124 | |
| | | | |
SoFi Professional Loan Program LLC Series 2017-E Class A2B 144A | | | 2.72 | | | | 11-26-2040 | | | | 9,979,000 | | | | 9,996,423 | |
| | | | |
SoFi Professional Loan Program LLC Series 2018-B Class A2FX 144A | | | 3.34 | | | | 8-25-2047 | | | | 8,978,000 | | | | 9,169,339 | |
| | | | |
Verus Securitization Trust Series 2019-1 Class A1 144A±± | | | 3.40 | | | | 12-25-2059 | | | | 5,070,778 | | | | 5,139,733 | |
| | | | |
Verus Securitization Trust Series 2019-1 Class A1 144A±± | | | 3.84 | | | | 2-25-2059 | | | | 3,190,075 | | | | 3,241,718 | |
| | | | |
Verus Securitization Trust Series 2019-2 Class A1 144A±± | | | 3.21 | | | | 4-25-2059 | | | | 13,413,000 | | | | 13,412,732 | |
| | | | |
Visio Trust Series 2019-1 Class A1 144A±± | | | 3.57 | | | | 6-25-2054 | | | | 2,758,446 | | | | 2,781,361 | |
| | | | |
Total Non-Agency Mortgage-Backed Securities (Cost $278,130,909) | | | | | | | | | | | | | | | 282,723,688 | |
| | | | | | | | | | | | | | | | |
| | | | |
U.S. Treasury Securities: 29.37% | | | | | | | | | | | | | | | | |
| | | | |
U.S. Treasury Bond | | | 2.75 | | | | 11-15-2042 | | | | 40,480,000 | | | | 42,015,394 | |
| | | | |
U.S. Treasury Bond | | | 2.75 | | | | 8-15-2047 | | | | 55,269,000 | | | | 57,203,415 | |
| | | | |
U.S. Treasury Bond | | | 2.75 | | | | 11-15-2047 | | | | 118,190,000 | | | | 122,303,566 | |
| | | | |
U.S. Treasury Bond | | | 2.88 | | | | 5-15-2049 | | | | 11,761,000 | | | | 12,501,575 | |
| | | | |
U.S. Treasury Bond | | | 3.00 | | | | 2-15-2048 | | | | 82,814,000 | | | | 89,892,009 | |
| | | | |
U.S. Treasury Bond | | | 3.00 | | | | 2-15-2049 | | | | 20,741,000 | | | | 22,581,764 | |
| | | | |
U.S. Treasury Note | | | 1.38 | | | | 8-31-2020 | | | | 38,599,000 | | | | 38,241,658 | |
| | | | |
U.S. Treasury Note | | | 1.38 | | | | 9-30-2020 | | | | 39,925,000 | | | | 39,541,346 | |
| | | | |
U.S. Treasury Note | | | 1.38 | | | | 1-31-2021 | | | | 4,749,000 | | | | 4,699,469 | |
| | | | |
U.S. Treasury Note | | | 1.50 | | | | 7-15-2020 | | | | 22,402,000 | | | | 22,232,235 | |
| | | | |
U.S. Treasury Note | | | 1.63 | | | | 8-31-2022 | | | | 53,681,000 | | | | 53,225,970 | |
| | | | |
U.S. Treasury Note | | | 1.63 | | | | 4-30-2023 | | | | 10,991,000 | | | | 10,869,927 | |
| | | | |
U.S. Treasury Note ## | | | 1.63 | | | | 2-15-2026 | | | | 79,371,000 | | | | 77,411,528 | |
| | | | |
U.S. Treasury Note | | | 2.00 | | | | 8-31-2021 | | | | 28,403,000 | | | | 28,448,489 | |
| | | | |
U.S. Treasury Note | | | 2.00 | | | | 5-31-2024 | | | | 69,541,000 | | | | 69,804,495 | |
| | | | |
U.S. Treasury Note | | | 2.00 | | | | 8-15-2025 | | | | 19,423,000 | | | | 19,419,965 | |
| | | | |
U.S. Treasury Note | | | 2.13 | | | | 1-31-2021 | | | | 29,739,000 | | | | 29,792,437 | |
| | | | |
U.S. Treasury Note | | | 2.13 | | | | 5-31-2021 | | | | 66,635,000 | | | | 66,882,278 | |
| | | | |
U.S. Treasury Note | | | 2.13 | | | | 5-15-2022 | | | | 6,301,000 | | | | 6,343,827 | |
| | | | |
U.S. Treasury Note ## | | | 2.13 | | | | 2-29-2024 | | | | 70,887,000 | | | | 71,493,416 | |
| | | | |
U.S. Treasury Note | | | 2.13 | | | | 5-31-2026 | | | | 13,050,000 | | | | 13,128,504 | |
| | | | |
U.S. Treasury Note | | | 2.25 | | | | 3-31-2021 | | | | 18,801,000 | | | | 18,891,333 | |
| | | | |
U.S. Treasury Note | | | 2.25 | | | | 4-15-2022 | | | | 2,208,000 | | | | 2,229,821 | |
| | | | |
U.S. Treasury Note | | | 2.25 | | | | 1-31-2024 | | | | 12,485,000 | | | | 12,659,107 | |
| | | | |
U.S. Treasury Note | | | 2.25 | | | | 11-15-2024 | | | | 4,078,000 | | | | 4,136,303 | |
| | | | |
U.S. Treasury Note | | | 2.25 | | | | 11-15-2025 | | | | 21,518,000 | | | | 21,820,597 | |
| | | | |
U.S. Treasury Note | | | 2.25 | | | | 11-15-2027 | | | | 43,953,000 | | | | 44,335,698 | |
| | | | |
U.S. Treasury Note | | | 2.38 | | | | 4-15-2021 | | | | 27,337,000 | | | | 27,536,688 | |
| | | | |
U.S. Treasury Note ## | | | 2.38 | | | | 5-15-2029 | | | | 76,356,000 | | | | 77,984,530 | |
| | | | |
U.S. Treasury Note | | | 2.50 | | | | 6-30-2020 | | | | 5,281,000 | | | | 5,296,678 | |
| | | | |
U.S. Treasury Note | | | 2.50 | | | | 12-31-2020 | | | | 54,754,000 | | | | 55,149,683 | |
| | | | |
U.S. Treasury Note | | | 2.50 | | | | 1-31-2021 | | | | 32,970,000 | | | | 33,230,154 | |
| | | | |
U.S. Treasury Note ## | | | 2.50 | | | | 2-28-2021 | | | | 82,256,000 | | | | 82,962,888 | |
| | | | |
U.S. Treasury Note ## | | | 2.63 | | | | 7-31-2020 | | | | 89,499,000 | | | | 89,942,999 | |
| | | | |
U.S. Treasury Note | | | 2.63 | | | | 8-31-2020 | | | | 18,235,000 | | | | 18,341,846 | |
| | | | |
U.S. Treasury Note | | | 2.63 | | | | 11-15-2020 | | | | 4,403,000 | | | | 4,438,774 | |
| | | | |
U.S. Treasury Note ## | | | 2.75 | | | | 9-30-2020 | | | | 89,791,000 | | | | 90,545,104 | |
| | | | |
U.S. Treasury Note | | | 2.75 | | | | 11-30-2020 | | | | 28,200,000 | | | | 28,486,406 | |
| | | | |
U.S. Treasury Note | | | 2.75 | | | | 5-31-2023 | | | | 21,377,000 | | | | 22,057,557 | |
The accompanying notes are an integral part of these financial statements.
| | | | |
| 46 | | Wells Fargo Core Bond Portfolio | | Portfolio of investments—May 31, 2019 |
| | | | | | | | | | | | | | | | |
| Security name | | Interest rate | | | Maturity date | | | Principal | | | Value | |
| | | | |
U.S. Treasury Securities(continued) | | | | | | | | | | | | | | | | |
| | | | |
U.S. Treasury Note | | | 2.75 | % | | | 8-31-2025 | | | $ | 35,864,000 | | | $ | 37,430,248 | |
| | | | |
U.S. Treasury Note | | | 2.88 | | | | 5-31-2025 | | | | 15,478,000 | | | | 16,249,482 | |
| | | | |
U.S. Treasury Note ## | | | 2.88 | | | | 8-15-2028 | | | | 56,514,000 | | | | 60,048,332 | |
| | | | |
U.S. Treasury Note | | | 3.13 | | | | 11-15-2028 | | | | 46,180,000 | | | | 50,092,673 | |
| | | | |
U.S. Treasury Note | | | 6.00 | | | | 2-15-2026 | | | | 7,212,000 | | | | 8,999,787 | |
| | | | |
Total U.S. Treasury Securities (Cost $1,674,777,579) | | | | | | | | | | | | | | | 1,710,899,955 | |
| | | | | | | | | | | | | | | | |
| | | | |
Yankee Corporate Bonds and Notes: 3.61% | | | | | | | | | | | | | | | | |
| | | | |
Communication Services: 0.15% | | | | | | | | | | | | | | | | |
| | | | |
| Wireless Telecommunication Services: 0.15% | | | | | | | | | | | | | | | | |
| | | | |
America Movil SAB de CV | | | 3.63 | | | | 4-22-2029 | | | | 2,665,000 | | | | 2,703,189 | |
| | | | |
America Movil SAB de CV | | | 4.38 | | | | 4-22-2049 | | | | 2,090,000 | | | | 2,148,499 | |
| | | | |
Vodafone Group plc | | | 3.75 | | | | 1-16-2024 | | | | 3,842,000 | | | | 3,941,029 | |
| | | | |
| | | | | | | | | | | | | | | 8,792,717 | |
| | | | | | | | | | | | | | | | |
| | | | |
Consumer Staples: 0.27% | | | | | | | | | | | | | | | | |
| | | | |
| Food Products: 0.27% | | | | | | | | | | | | | | | | |
| | | | |
Danone SA 144A | | | 2.59 | | | | 11-2-2023 | | | | 1,940,000 | | | | 1,922,469 | |
| | | | |
Danone SA 144A | | | 2.95 | | | | 11-2-2026 | | | | 14,218,000 | | | | 14,022,696 | |
| | | | |
| | | | | | | | | | | | | | | 15,945,165 | |
| | | | | | | | | | | | | | | | |
| | | | |
Energy: 0.55% | | | | | | | | | | | | | | | | |
| | | | |
| Energy Equipment & Services: 0.07% | | | | | | | | | | | | | | | | |
| | | | |
Schlumberger Limited 144A | | | 2.65 | | | | 11-20-2022 | | | | 4,032,000 | | | | 4,037,623 | |
| | | | | | | | | | | | | | | | |
| | | | |
| Oil, Gas & Consumable Fuels: 0.48% | | | | | | | | | | | | | | | | |
| | | | |
Ecopetrol SA | | | 5.88 | | | | 5-28-2045 | | | | 1,945,000 | | | | 1,998,293 | |
| | | | |
Enbridge Incorporated | | | 2.90 | | | | 7-15-2022 | | | | 4,272,000 | | | | 4,277,177 | |
| | | | |
Encana Corporation | | | 6.50 | | | | 2-1-2038 | | | | 2,059,000 | | | | 2,452,833 | |
| | | | |
Petroleos Mexicanos Company | | | 2.38 | | | | 4-15-2025 | | | | 2,177,400 | | | | 2,186,178 | |
| | | | |
Petroleos Mexicanos Company | | | 2.46 | | | | 12-15-2025 | | | | 5,645,500 | | | | 5,677,017 | |
| | | | |
Petroleos Mexicanos Company | | | 6.35 | | | | 2-12-2048 | | | | 8,926,000 | | | | 7,791,505 | |
| | | | |
Petroleos Mexicanos Company | | | 6.75 | | | | 9-21-2047 | | | | 3,817,000 | | | | 3,450,186 | |
| | | | |
| | | | | | | | | | | | | | | 27,833,189 | |
| | | | | | | | | | | | | | | | |
| | | | |
Financials: 2.08% | | | | | | | | | | | | | | | | |
| | | | |
| Banks: 1.74% | | | | | | | | | | | | | | | | |
| | | | |
Banco Santander SA | | | 3.80 | | | | 2-23-2028 | | | | 3,000,000 | | | | 2,949,741 | |
| | | | |
Barclays plc (3 Month LIBOR +1.61%) ± | | | 3.93 | | | | 5-7-2025 | | | | 7,157,000 | | | | 7,115,584 | |
| | | | |
Barclays plc (3 Month LIBOR +1.36%) ± | | | 4.34 | | | | 5-16-2024 | | | | 1,595,000 | | | | 1,622,718 | |
| | | | |
Barclays plc (3 Month LIBOR +1.40%) ± | | | 4.61 | | | | 2-15-2023 | | | | 6,463,000 | | | | 6,615,084 | |
| | | | |
Barclays plc (3 Month LIBOR +1.90%) ± | | | 4.97 | | | | 5-16-2029 | | | | 3,680,000 | | | | 3,814,921 | |
| | | | |
Canadian Imperial Bank | | | 3.10 | | | | 4-2-2024 | | | | 11,169,000 | | | | 11,290,485 | |
| | | | |
Danske Bank A/S 144A | | | 5.38 | | | | 1-12-2024 | | | | 3,344,000 | | | | 3,533,546 | |
| | | | |
Danske Bank A/S 144A | | | 3.88 | | | | 9-12-2023 | | | | 5,959,000 | | | | 5,980,793 | |
| | | | |
HSBC Holdings plc (3 Month LIBOR +1.21%) ± | | | 3.80 | | | | 3-11-2025 | | | | 10,619,000 | | | | 10,836,658 | |
| | | | |
HSBC Holdings plc (3 Month LIBOR +1.61%) ± | | | 3.97 | | | | 5-22-2030 | | | | 8,663,000 | | | | 8,749,404 | |
The accompanying notes are an integral part of these financial statements.
| | | | | | |
| Portfolio of investments—May 31, 2019 | | Wells Fargo Core Bond Portfolio | | | 47 | |
| | | | | | | | | | | | | | | | |
| Security name | | Interest rate | | | Maturity date | | | Principal | | | Value | |
| | | | |
| Banks(continued) | | | | | | | | | | | | | | | | |
| | | | |
ING Groep NV | | | 3.55 | % | | | 4-9-2024 | | | $ | 6,023,000 | | | $ | 6,107,923 | |
| | | | |
ING Groep NV | | | 4.05 | | | | 4-9-2029 | | | | 1,238,000 | | | | 1,266,017 | |
| | | | |
Lloyds Banking Group plc | | | 3.90 | | | | 3-12-2024 | | | | 4,775,000 | | | | 4,862,961 | |
| | | | |
Mitsubishi UFJ Financial Group Incorporated | | | 3.22 | | | | 3-7-2022 | | | | 3,718,000 | | | | 3,780,789 | |
| | | | |
Mitsubishi UFJ Financial Group Incorporated | | | 3.41 | | | | 3-7-2024 | | | | 9,095,000 | | | | 9,317,313 | |
| | | | |
Standard Chartered plc (3 Month LIBOR +1.56%) 144A± | | | 3.79 | | | | 5-21-2025 | | | | 5,137,000 | | | | 5,130,918 | |
| | | | |
Standard Chartered plc (3 Month LIBOR +1.91%) 144A± | | | 4.31 | | | | 5-21-2030 | | | | 3,572,000 | | | | 3,552,258 | |
| | | | |
Westpac Banking Corporation | | | 3.30 | | | | 2-26-2024 | | | | 5,017,000 | | | | 5,147,047 | |
| | | | |
| | | | | | | | | | | | | | | 101,674,160 | |
| | | | | | | | | | | | | | | | |
| | | | |
| Capital Markets: 0.16% | | | | | | | | | | | | | | | | |
| | | | |
Credit Suisse Group AG 144A | | | 4.28 | | | | 1-9-2028 | | | | 9,074,000 | | | | 9,317,353 | |
| | | | | | | | | | | | | | | | |
| | | | |
| Consumer Finance: 0.02% | | | | | | | | | | | | | | | | |
| | | | |
UBS Group Funding Switzerland 144A | | | 4.25 | | | | 3-23-2028 | | | | 1,352,000 | | | | 1,417,815 | |
| | | | | | | | | | | | | | | | |
| | | | |
| Diversified Financial Services: 0.11% | | | | | | | | | | | | | | | | |
| | | | |
GE Capital International Funding Company | | | 4.42 | | | | 11-15-2035 | | | | 1,897,000 | | | | 1,803,443 | |
| | | | |
Shell International Finance BV | | | 3.25 | | | | 5-11-2025 | | | | 4,272,000 | | | | 4,395,299 | |
| | | | |
| | | | | | | | | | | | | | | 6,198,742 | |
| | | | | | | | | | | | | | | | |
| | | | |
| Insurance: 0.05% | | | | | | | | | | | | | | | | |
| | | | |
Enstar Group Limited | | | 4.95 | | | | 6-1-2029 | | | | 2,652,000 | | | | 2,644,758 | |
| | | | | | | | | | | | | | | | |
| | | | |
Health Care: 0.10% | | | | | | | | | | | | | | | | |
| | | | |
| Pharmaceuticals: 0.10% | | | | | | | | | | | | | | | | |
| | | | |
Sanofi SA | | | 3.38 | | | | 6-19-2023 | | | | 5,539,000 | | | | 5,720,956 | |
| | | | | | | | | | | | | | | | |
| | | | |
Industrials: 0.15% | | | | | | | | | | | | | | | | |
| | | | |
| Chemicals: 0.03% | | | | | | | | | | | | | | | | |
| | | | |
LYB International Finance II BV | | | 3.50 | | | | 3-2-2027 | | | | 1,974,000 | | | | 1,918,249 | |
| | | | | | | | | | | | | | | | |
| | | | |
| Professional Services: 0.12% | | | | | | | | | | | | | | | | |
| | | | |
IHS Markit Limited | | | 3.63 | | | | 5-1-2024 | | | | 3,460,000 | | | | 3,485,258 | |
| | | | |
IHS Markit Limited | | | 4.25 | | | | 5-1-2029 | | | | 3,460,000 | | | | 3,531,933 | |
| | | | |
| | | | | | | | | | | | | | | 7,017,191 | |
| | | | | | | | | | | | | | | | |
| | | | |
Materials: 0.14% | | | | | | | | | | | | | | | | |
| | | | |
| Metals & Mining: 0.14% | | | | | | | | | | | | | | | | |
| | | | |
Teck Resources Limited | | | 6.25 | | | | 7-15-2041 | | | | 7,522,000 | | | | 7,882,221 | |
| | | | | | | | | | | | | | | | |
| | | | |
Utilities: 0.17% | | | | | | | | | | | | | | | | |
| | | | |
| Electric Utilities: 0.17% | | | | | | | | | | | | | | | | |
| | | | |
Electricite de France SA 144A | | | 4.50 | | | | 9-21-2028 | | | | 5,764,000 | | | | 6,109,130 | |
| | | | |
Electricite de France SA 144A | | | 4.95 | | | | 10-13-2045 | | | | 1,957,000 | | | | 2,091,375 | |
| | | | |
Electricite de France SA 144A | | | 5.00 | | | | 9-21-2048 | | | | 1,656,000 | | | | 1,781,590 | |
| | | | |
| | | | | | | | | | | | | | | 9,982,095 | |
| | | | | | | | | | | | | | | | |
| | | | |
Total Yankee Corporate Bonds and Notes (Cost $206,632,317) | | | | | | | | | | | | | | | 210,382,234 | |
| | | | | | | | | | | | | | | | |
The accompanying notes are an integral part of these financial statements.
| | | | |
| 48 | | Wells Fargo Core Bond Portfolio | | Portfolio of investments—May 31, 2019 |
| | | | | | | | | | | | | | | | |
| Security name | | Interest rate | | | Maturity date | | | Principal | | | Value | |
| | | | |
Yankee Government Bonds: 0.54% | | | | | | | | | | | | | | | | |
| | | | |
Republic of Colombia | | | 5.20 | % | | | 5-15-2049 | | | $ | 3,313,000 | | | $ | 3,536,661 | |
| | | | |
Republic of Paraguay 144A | | | 5.40 | | | | 3-30-2050 | | | | 2,940,000 | | | | 3,075,975 | |
| | | | |
Saudi International Bond 144A | | | 5.25 | | | | 1-16-2050 | | | | 1,871,000 | | | | 2,059,653 | |
| | | | |
State of Qatar 144A | | | 3.38 | | | | 3-14-2024 | | | | 3,924,000 | | | | 4,012,290 | |
| | | | |
United Mexican States | | | 4.50 | | | | 4-22-2029 | | | | 15,049,000 | | | | 15,628,536 | |
| | | | |
United Mexican States | | | 4.60 | | | | 2-10-2048 | | | | 3,504,000 | | | | 3,429,540 | |
| | | | |
Total Yankee Government Bonds (Cost $30,395,578) | | | | | | | | | | | | | | | 31,742,655 | |
| | | | | | | | | | | | | | | | |
| | | | |
| | | Yield | | | | | | Shares | | | | |
| Short-Term Investments: 2.06% | | | | | | | | | | | | | | | | |
| | | | |
| Investment Companies: 2.06% | | | | | | | | | | | | | | | | |
| | | | |
Securities Lending Cash Investments LLC (l)(r)(u) | | | 2.51 | | | | | | | | 2,778,863 | | | | 2,779,141 | |
| | | | |
Wells Fargo Government Money Market Fund Select
Class (l)(u) | | | 2.30 | | | | | | | | 117,422,859 | | | | 117,422,859 | |
| |
Total Short-Term Investments (Cost $120,202,000) | | | | 120,202,000 | |
| | | | | | | | | | | | | | | | |
| | | | | | | | |
| Total investments in securities (Cost $6,114,515,563) | | | 107.21 | % | | | 6,245,576,770 | |
| | |
Other assets and liabilities, net | | | (7.21 | ) | | | (419,831,838 | ) |
| | | | | | | | |
| Total net assets | | | 100.00 | % | | $ | 5,825,744,932 | |
| | | | | | | | |
| ± | Variable rate investment. The rate shown is the rate in effect at period end. |
| (a) | The security is fair valued in accordance with procedures approved by the Board of Trustees. |
| %% | The security is issued on a when-issued basis. |
| ±± | The coupon of the security is adjusted based on the principal and interest payments received from the underlying pool of mortgages as well as the credit quality and the actual prepayment speed of the underlying mortgages. |
| 144A | The security may be resold in transactions exempt from registration, normally to qualified institutional buyers, pursuant to Rule 144A under the Securities Act of 1933. |
| « | All or a portion of this security is on loan. |
| @ | Foreign bond principal is denominated in the local currency of the issuer. |
| ## | All or a portion of this security is segregated for when-issued securities. |
| (l) | The issuer of the security is an affiliated person of the Portfolio as defined in the Investment Company Act of 1940. |
| (r) | The investment is a non-registered investment company purchased with cash collateral received from securities on loan. |
| (u) | The rate represents the 7-day annualized yield at period end. |
Abbreviations:
| FHLMC | Federal Home Loan Mortgage Corporation |
| FNMA | Federal National Mortgage Association |
| GNMA | Government National Mortgage Association |
| LIBOR | London Interbank Offered Rate |
| REIT | Real estate investment trust |
The accompanying notes are an integral part of these financial statements.
| | | | | | |
| Portfolio of investments—May 31, 2019 | | Wells Fargo Core Bond Portfolio | | | 49 | |
Investments in Affiliates
An affiliated investment is an investment in which the Portfolio owns at least 5% of the outstanding voting shares of the issuer or as a result of other relationships, such as the Portfolio and the issuer having the same adviser or investment manager. Transactions with issuers that were either affiliated persons of the Portfolio at the beginning of the period or the end of the period were as follows:
| | | | | | | | | | | | | | | | | | | | | | | | | | | | | | | | | | | | |
| | | Shares,
beginning of
period | | | Shares
purchased | | | Shares
sold | | | Shares,
end of
period | | | Net
realized
gains | | | Net
change in
unrealized
gains
(losses) | | | Income
from
affiliated
securities | | | Value,
end
of period | | | % of
net
assets | |
Short-Term Investments | | | | | | | | | | | | | | | | | | | | | | | | | | | | | | | | | | | | |
Investment Companies | | | | | | | | | | | | | | | | | | | | | | | | | | | | | | | | | | | | |
Securities Lending Cash Investments LLC | | | 57,959,204 | | | | 518,712,870 | | | | 573,893,211 | | | | 2,778,863 | | | $ | 19 | | | $ | 0 | | | $ | 437,848 | | | $ | 2,779,141 | | | | | |
Wells Fargo Government Money Market Fund Select Class | | | 118,801,553 | | | | 4,094,852,367 | | | | 4,096,231,061 | | | | 117,422,859 | | | | 0 | | | | 0 | | | | 2,073,489 | | | | 117,422,859 | | | | | |
| | | | | | | | | | | | | | | | | | | | | | | | | | | | | | | | | | | | |
| | | | | | | | | |
| | | | | | | | | | | | | | | | | | $ | 19 | | | $ | 0 | | | $ | 2,511,337 | | | $ | 120,202,000 | | | | 2.06 | % |
| | | | | | | | | | | | | | | | | | | | | | | | | | | | | | | | | | | | |
The accompanying notes are an integral part of these financial statements.
| | | | |
| 50 | | Wells Fargo Core Bond Portfolio | | Statement of assets and liabilities—May 31, 2019 |
| | | | |
| | | | |
| |
Assets | | | | |
Investments in unaffiliated securities (including $2,704,886 of securities loaned), at value (cost $5,994,313,563) | | $ | 6,125,374,770 | |
Investments in affiliated securities, at value (cost $120,202,000) | | | 120,202,000 | |
Cash | | | 17,794 | |
Receivable for investments sold | | | 610,219,668 | |
Principal paydown receivable | | | 5,579 | |
Receivable for interest | | | 28,918,836 | |
Receivable for securities lending income, net | | | 757 | |
Prepaid expenses and other assets | | | 161,156 | |
| | | | |
Total assets | | | 6,884,900,560 | |
| | | | |
| |
Liabilities | | | | |
Payable for investments purchased | | | 551,733,233 | |
Payable for when-issued transactions | | | 502,478,866 | |
Payable upon receipt of securities loaned | | | 2,773,750 | |
Advisory fee payable | | | 1,773,482 | |
Cash collateral due to broker | | | 293,000 | |
Accrued expenses and other liabilities | | | 103,297 | |
| | | | |
Total liabilities | | | 1,059,155,628 | |
| | | | |
Total net assets | | $ | 5,825,744,932 | |
| | | | |
The accompanying notes are an integral part of these financial statements.
| | | | | | |
| Statement of operations—year ended May 31, 2019 | | Wells Fargo Core Bond Portfolio | | | 51 | |
| | | | |
| | | | |
| |
Investment income | | | | |
Interest | | $ | 184,627,443 | |
Income from affiliated securities | | | 2,169,425 | |
| | | | |
Total investment income | | | 186,796,868 | |
| | | | |
| |
Expenses | | | | |
Advisory fee | | | 19,495,525 | |
Custody and accounting fees | | | 253,103 | |
Professional fees | | | 78,619 | |
Shareholder report expenses | | | 4,077 | |
Trustees’ fees and expenses | | | 20,976 | |
Other fees and expenses | | | 23,114 | |
| | | | |
Net expenses | | | 19,875,414 | |
| | | | |
Net investment income | | | 166,921,454 | |
| | | | |
| |
REALIZED AND UNREALIZED GAINS (LOSSES) ON INVESTMENTS | | | | |
| |
Net realized gains (losses) on: | | | | |
Unaffiliated securities | | | (17,686,421 | ) |
Affiliated securities | | | 19 | |
| | | | |
Net realized losses on investments | | | (17,686,402 | ) |
Net change in unrealized gains (losses) on investments | | | 194,869,104 | |
| | | | |
Net realized and unrealized gains (losses) on investments | | | 177,182,702 | |
| | | | |
Net increase in net assets resulting from operations | | $ | 344,104,156 | |
| | | | |
The accompanying notes are an integral part of these financial statements.
| | | | |
| 52 | | Wells Fargo Core Bond Portfolio | | Statement of changes in net assets |
| | | | | | | | |
| | | Year ended
May 31, 2019 | | | Year ended
May 31, 2018 | |
| | |
Operations | | | | | | | | |
Net investment income | | $ | 166,921,454 | | | $ | 122,888,295 | |
Net realized losses on investments | | | (17,686,402 | ) | | | (55,887,139 | ) |
Net change in unrealized gains (losses) on investments | | | 194,869,104 | | | | (99,688,813 | ) |
| | | | |
Net increase (decrease) in net assets resulting from operations | | | 344,104,156 | | | | (32,687,657 | ) |
| | | | |
| | |
Capital transactions | | | | | | | | |
Transactions in investors’ beneficial interests | | | | | | | | |
Contributions | | | 697,097,878 | | | | 910,938,479 | |
Withdrawals | | | (888,699,376 | ) | | | (395,554,370 | ) |
| | | | |
Net increase (decrease) in net assets resulting from capital transactions | | | (191,601,498 | ) | | | 515,384,109 | |
| | | | |
Total increase in net assets | | | 152,502,658 | | | | 482,696,452 | |
| | | | |
| | |
Net assets | | | | | | | | |
Beginning of period | | | 5,673,242,274 | | | | 5,190,545,822 | |
| | | | |
End of period | | $ | 5,825,744,932 | | | $ | 5,673,242,274 | |
| | | | |
The accompanying notes are an integral part of these financial statements.
| | | | | | |
| Financial highlights | | Wells Fargo Core Bond Portfolio | | | 53 | |
| | | | | | | | | | | | | | | | | | | | |
| | | Year ended May 31 | |
| | | 2019 | | | 2018 | | | 2017 | | | 2016 | | | 2015 | |
Total return | | | 6.30 | % | | | (0.53 | )% | | | 1.89 | % | | | 2.78 | % | | | 3.22 | % |
Ratios to average net assets (annualized) | | | | | | | | | | | | | | | | | | | | |
Gross expenses | | | 0.35 | % | | | 0.35 | % | | | 0.35 | % | | | 0.36 | % | | | 0.37 | % |
Net expenses | | | 0.35 | % | | | 0.35 | % | | | 0.35 | % | | | 0.35 | % | | | 0.35 | % |
Net investment income | | | 2.93 | % | | | 2.23 | % | | | 1.87 | % | | | 1.86 | % | | | 1.82 | % |
Supplemental data | | | | | | | | | | | | | | | | | | | | |
Portfolio turnover rate | | | 577 | % | | | 542 | % | | | 614 | % | | | 667 | % | | | 586 | % |
The accompanying notes are an integral part of these financial statements.
| | | | |
| 54 | | Wells Fargo Core Bond Portfolio | | Notes to financial statements |
1. ORGANIZATION
Wells Fargo Master Trust (the “Trust”), a Delaware statutory trust organized on March 10, 1999, is an open-end management investment company registered under the Investment Company Act of 1940, as amended (the “1940 Act”). As an investment company, the Trust follows the accounting and reporting guidance in Financial Accounting Standards Board (“FASB”) Accounting Standards Codification Topic 946, Financial Services – Investment Companies. These financial statements report on the Wells Fargo Core Bond Portfolio (the “Portfolio”) which is a diversified series of the Trust.
2. SIGNIFICANT ACCOUNTING POLICIES
The following significant accounting policies, which are consistently followed in the preparation of the financial statements of the Portfolio, are in conformity with U.S. generally accepted accounting principles which require management to make estimates and assumptions that affect the reported amounts of assets and liabilities, disclosure of contingent assets and liabilities at the date of the financial statements, and the reported amounts of revenues and expenses during the reporting period. Actual results could differ from those estimates.
Securities valuation
All investments are valued each business day as of the close of regular trading on the New York Stock Exchange (generally 4 p.m. Eastern Time), although the Portfolio may deviate from this calculation time under unusual or unexpected circumstances.
Debt securities are valued at the evaluated bid price provided by an independent pricing service (e.g. taking into account various factors, including yields, maturities, or credit ratings) or, if a reliable price is not available, the quoted bid price from an independent broker-dealer.
The values of securities denominated in foreign currencies are translated into U.S. dollars at rates provided by an independent foreign currency pricing source at a time each business day specified by the Wells Fargo Asset Management Pricing Committee at Wells Fargo Funds Management, LLC (“Funds Management”).
Investments in registered open-end investment companies are valued at net asset value. Interests in non-registered investment companies that are redeemable at net asset value are fair valued normally at net asset value.
Investments which are not valued using any of the methods discussed above are valued at their fair value, as determined in good faith by the Board of Trustees of the Portfolio. The Board of Trustees has established a Valuation Committee comprised of the Trustees and has delegated to it the authority to take any actions regarding the valuation of portfolio securities that the Valuation Committee deems necessary or appropriate, including determining the fair value of portfolio securities, unless the determination has been delegated to the Wells Fargo Asset Management Pricing Committee. The Board of Trustees retains the authority to make or ratify any valuation decisions or approve any changes to the Valuation Procedures as it deems appropriate. On a quarterly basis, the Board of Trustees receives reports on any valuation actions taken by the Valuation Committee or the Wells Fargo Asset Management Pricing Committee which may include items for ratification.
Foreign currency translation
The accounting records of the Portfolio are maintained in U.S. dollars. The values of other assets and liabilities denominated in foreign currencies are translated into U.S. dollars at rates provided by an independent foreign currency pricing source at a time each business day specified by the Wells Fargo Asset Management Pricing Committee. Purchases and sales of securities, and income and expenses are converted at the rate of exchange on the respective dates of such transactions. Net realized foreign exchange gains or losses arise from sales of foreign currencies, currency gains or losses realized between the trade and settlement dates on securities transactions, and the difference between the amounts of dividends, interest and foreign withholding taxes recorded and the U.S. dollar equivalent of the amounts actually paid or received. Net unrealized foreign exchange gains and losses arise from changes in the fair value of assets and liabilities other than investments in securities resulting from changes in exchange rates. The changes in net assets arising from changes in exchange rates of securities and the changes in net assets resulting from changes in market prices of securities are not separately presented. Such changes are included in net realized and unrealized gains or losses from investments
Securities lending
The Portfolio may lend its securities from time to time in order to earn additional income in the form of fees or interest on securities received as collateral or the investment of any cash received as collateral. When securities are on loan, the Portfolio receives interest or dividends on the securities loaned. The Portfolio receives collateral in the form of cash or securities with a value at least equal to the value of the securities on loan. The value of the loaned securities is determined at the close of each business day and any additional required collateral is delivered to the Portfolio on the next business day. In a securities lending transaction, the net asset value of the Portfolio will be affected by an increase or decrease in
| | | | | | |
| Notes to financial statements | | Wells Fargo Core Bond Portfolio | | | 55 | |
the value of the securities loaned and by an increase or decrease in the value of the instrument in which collateral is invested. The amount of securities lending activity undertaken by the Portfolio fluctuates from time to time. In the event of default or bankruptcy by the borrower, the Portfolio may be prevented from recovering the loaned securities or gaining access to the collateral or may experience delays or costs in doing so. In addition, the investment of any cash collateral received may lose all or part of its value. The Portfolio has the right under the lending agreement to recover the securities from the borrower on demand.
The Portfolio lends its securities through an unaffiliated securities lending agent. Cash collateral received in connection with its securities lending transactions is invested in Securities Lending Cash Investments, LLC (the “Securities Lending Fund”). The Securities Lending Fund is exempt from registration under Section 3(c)(7) of the 1940 Act and is managed by Funds Management and is subadvised by Wells Capital Management Incorporated (“WellsCap”), an affiliate of Funds Management and an indirect wholly owned subsidiary of Wells Fargo & Company (“Wells Fargo”). Funds Management receives an advisory fee starting at 0.05% and declining to 0.01% as the average daily net assets of the Securities Lending Fund increase. All of the fees received by Funds Management are paid to WellsCap for its services as subadviser. The Securities Lending Fund seeks to provide a positive return compared to the daily Fed Funds Open Rate by investing in high-quality, U.S. dollar-denominated short-term money market instruments. Securities Lending Fund investments are valued at the evaluated bid price provided by an independent pricing service. Income earned from investment in the Securities Lending Fund (net of fees and rebates), if any, is included in income from affiliated securities on the Statement of Operations.
When-issued transactions
The Portfolio may purchase securities on a forward commitment or when-issued basis. The Portfolio records a when-issued transaction on the trade date and will segregate assets in an amount at least equal in value to the Portfolio’s commitment to purchase when-issued securities. Securities purchased on a when-issued basis are marked-to-market daily and the Portfolio begins earning interest on the settlement date. Losses may arise due to changes in the market value of the underlying securities or if the counterparty does not perform under the contract.
Security transactions and income recognition
Securities transactions are recorded on a trade date basis. Realized gains or losses are recorded on the basis of identified cost.
Interest income is accrued daily and bond discounts are accreted and premiums are amortized daily. To the extent debt obligations are placed on non-accrual status, any related interest income may be reduced by writing off interest receivables when the collection of all or a portion of interest has been determined to be doubtful based on consistently applied procedures and the fair value has decreased. If the issuer subsequently resumes interest payments or when the collectability of interest is reasonably assured, the debt obligation is removed from non-accrual status.
Federal and other taxes
The Portfolio is treated as a separate entity for federal income tax purposes. The Portfolio is not required to pay federal income taxes on its net investment income and net capital gains as it is treated as a partnership for federal income tax purposes. All interest, gains and losses of the Portfolio are deemed to have been “passed through” to the interest holders in proportion to their holdings of the Portfolio regardless of whether such interest and gains have been distributed by the Portfolio.
The Portfolio’s income tax returns and all financial records supporting those returns for the prior three fiscal years are subject to examination by the federal revenue authority. Management has analyzed the Portfolio’s tax positions taken on federal, state, and foreign tax returns for all open tax years and does not believe that there are any uncertain tax positions that require recognition of a tax liability.
As of May 31, 2019, the aggregate cost of all investments for federal income tax purposes was $6,119,860,738 and the unrealized gains (losses) consisted of:
| | | | |
| |
Gross unrealized gains | | $ | 134,431,823 | |
| |
Gross unrealized losses | | | (8,715,791 | ) |
| |
Net unrealized gains | | $ | 125,716,032 | |
3. FAIR VALUATION MEASUREMENTS
Fair value measurements of investments are determined within a framework that has established a fair value hierarchy based upon the various data inputs utilized in determining the value of the Portfolio’s investments. The three-level hierarchy gives the highest priority to unadjusted quoted prices in active markets for identical assets or liabilities (Level 1)
| | | | |
| 56 | | Wells Fargo Core Bond Portfolio | | Notes to financial statements |
and the lowest priority to unobservable inputs (Level 3). The Portfolio’s investments are classified within the fair value hierarchy based on the lowest level of input that is significant to the fair value measurement. The inputs are summarized into three broad levels as follows:
| ∎ | | Level 1 – quoted prices in active markets for identical securities |
| ∎ | | Level 2 – other significant observable inputs (including quoted prices for similar securities, interest rates, prepayment speeds, credit risk, etc.) |
| ∎ | | Level 3 – significant unobservable inputs (including the Portfolio’s own assumptions in determining the fair value of investments) |
The inputs or methodologies used for valuing investments in securities are not necessarily an indication of the risk associated with investing in those securities.
The following is a summary of the inputs used in valuing the Portfolio’s assets and liabilities as of May 31, 2019:
| | | | | | | | | | | | | | | | |
| | | | |
| | | Quoted prices (Level 1) | | | Other significant
observable inputs
(Level 2) | | | Significant
unobservable inputs (Level 3) | | | Total | |
| | | | |
Assets | | | | | | | | | | | | | | | | |
Investments in: | | | | | | | | | | | | | | | | |
| | | | |
Agency securities | | $ | 0 | | | $ | 2,092,939,090 | | | $ | 0 | | | $ | 2,092,939,090 | |
| | | | |
Asset-backed securities | | | 0 | | | | 606,746,521 | | | | 0 | | | | 606,746,521 | |
| | | | |
Corporate bonds and notes | | | 0 | | | | 1,155,611,191 | | | | 0 | | | | 1,155,611,191 | |
| | | | |
Foreign corporate bonds & notes | | | 0 | | | | 2,229,608 | | | | 0 | | | | 2,229,608 | |
| | | | |
Municipal obligations | | | 0 | | | | 32,099,828 | | | | 0 | | | | 32,099,828 | |
| | | | |
Non-agency mortgage-back securities | | | 0 | | | | 282,723,688 | | | | 0 | | | | 282,723,688 | |
| | | | |
U.S. Treasury securities | | | 1,710,899,955 | | | | 0 | | | | 0 | | | | 1,710,899,955 | |
| | | | |
Yankee corporate bonds and notes | | | 0 | | | | 210,382,234 | | | | 0 | | | | 210,382,234 | |
| | | | |
Yankee government bonds | | | 0 | | | | 31,742,655 | | | | 0 | | | | 31,742,655 | |
| | | | |
Short-term investments | | | | | | | | | | | | | | | | |
| | | | |
Investment companies | | | 117,422,859 | | | | 2,779,141 | | | | 0 | | | | 120,202,000 | |
| | | | |
Total assets | | $ | 1,828,322,814 | | | $ | 4,417,253,956 | | | $ | 0 | | | $ | 6,245,576,770 | |
Additional sector, industry or geographic detail is included in the Portfolio of Investments.
At May 31, 2019, the Portfolio did not have any transfers into/out of Level 3.
4. TRANSACTIONS WITH AFFILIATES
Advisory fee
The Trust has entered into an advisory contract with Funds Management, an indirect wholly owned subsidiary of Wells Fargo. The adviser is responsible for implementing investment policies and guidelines and for supervising the subadviser, who is responsible for day-to-day portfolio management of the Portfolio. Pursuant to the contract, Funds Management is entitled to receive an annual advisory fee at the following annual rate based on the Portfolio’s average daily net assets:
| | | | |
| |
| Average daily net assets | | Advisory fee | |
| |
First $500 million | | | 0.400 | % |
| |
Next $500 million | | | 0.375 | |
| |
Next $2 billion | | | 0.350 | |
| |
Next $2 billion | | | 0.325 | |
| |
Next $5 billion | | | 0.300 | |
| |
Over $10 billion | | | 0.290 | |
| | | | | | |
| Notes to financial statements | | Wells Fargo Core Bond Portfolio | | | 57 | |
For the year ended May 31, 2019, the advisory fee was equivalent to an annual rate of 0.34% of the Portfolio’s average daily net assets.
Funds Management has retained the services of a subadviser to provide daily portfolio management to the Portfolio. The fee for subadvisory services is borne by Funds Management. WellsCap, is the subadviser to the Portfolio and is entitled to receive a fee from Funds Management at an annual rate starting at 0.20% and declining to 0.10% as the average daily net assets of the Portfolio increase.
Interfund transactions
The Portfolio may purchase or sell portfolio investment securities to certain other Wells Fargo affiliates pursuant toRule 17a-7 under the 1940 Act and under procedures adopted by the Board of Trustees. The procedures have been designed to ensure that these interfund transactions, which do not incur broker commissions, are effected at current market prices.
5. INVESTMENT PORTFOLIO TRANSACTIONS
Purchases and sales of investments, excluding short-term securities, for the year ended May 31, 2019 were as follows:
| | | | | | |
Purchases at cost | | Sales proceeds |
U.S.
government | | Non-U.S.
government | | U.S.
government | | Non-U.S.
government |
| $30,342,307,183 | | $4,201,786,341 | | $30,100,867,040 | | $4,196,071,303 |
6. BANK BORROWINGS
Effective August 28, 2018, the Trust, along with Wells Fargo Variable Trust and Wells Fargo Funds Trust (excluding the money market funds), are parties to a $280,000,000 revolving credit agreement whereby the Portfolio is permitted to use bank borrowings for temporary or emergency purposes, such as to fund shareholder redemption requests. Interest under the credit agreement is charged to the Portfolio based on a borrowing rate equal to the higher of the Federal Funds rate in effect on that day plus 1.25% or the overnight LIBOR rate in effect on that day plus 1.25%. In addition, an annual commitment fee equal to 0.25% of the unused balance is allocated to each participating fund.
For the year ended May 31, 2019, there were no borrowings by the Portfolio under the agreement.
7. INDEMNIFICATION
Under the Trust’s organizational documents, the officers and Trustees have been granted certain indemnification rights against certain liabilities that may arise out of performance of their duties to the Trust. Additionally, in the normal course of business, the Trust may enter into contracts with service providers that contain a variety of indemnification clauses. The Trust’s maximum exposure under these arrangements is dependent on future claims that may be made against the Portfolio and, therefore, cannot be estimated.
8. NEW ACCOUNTING PRONOUNCEMENTS
In August 2018, FASB issued Accounting Standards Update (“ASU”) No. 2018-13, Fair Value Measurement (Topic 820)Disclosure Framework—Changes to the Disclosure Requirements for Fair Value Measurement. ASU 2018-13 updates the disclosure requirements for fair value measurements by modifying or removing certain disclosures and adding certain new disclosures. The amendments are effective for fiscal years, and interim periods within those fiscal years, beginning after December 15, 2019. Early adoption is permitted. Management has adopted the removal and modification of disclosures early, as permitted, and will adopt the additional new disclosures at the effective date.
In March 2017, FASB issued ASU No. 2017-08,Premium Amortization on Purchased Callable Debt Securities. ASU 2017-08 shortens the amortization period for certain callable debt securities held at a premium. The amendments require the premium to be amortized to the earliest call date. The amendments do not require an accounting change for securities held at a discount; the discount continues to be amortized to maturity. ASU 2017-08 is effective for fiscal years beginning after December 15, 2018 and for interim periods within those fiscal years. Management has evaluated the impact of adopting this ASU and determined that it will not result in any material changes to the disclosures in the financial statements.
| | | | |
| 58 | | Wells Fargo Core Bond Portfolio | | Report of independent registered public accounting firm |
TO THE SHAREHOLDERS OF THE PORTFOLIO AND BOARD OF TRUSTEES OF WELLS FARGO MASTER TRUST:
Opinion on the Financial Statements
We have audited the accompanying statement of assets and liabilities of Wells Fargo Core Bond Portfolio (the Portfolio), one of the portfolios constituting Wells Fargo Master Trust, including the portfolio of investments, as of May 31, 2019, the related statement of operations for the year then ended, the statements of changes in net assets for each of the years in the two-year period then ended, and the related notes (collectively, the financial statements) and the financial highlights for each of the years in the five-year period then ended. In our opinion, the financial statements and financial highlights present fairly, in all material respects, the financial position of the Portfolio as of May 31, 2019, the results of its operations for the year then ended, the changes in its net assets for each of the years in the two-year period then ended, and the financial highlights for each of the years in the five-year period then ended, in conformity with U.S. generally accepted accounting principles.
Basis for Opinion
These financial statements and financial highlights are the responsibility of the Portfolio’s management. Our responsibility is to express an opinion on these financial statements and financial highlights based on our audits. We are a public accounting firm registered with the Public Company Accounting Oversight Board (United States) (PCAOB) and are required to be independent with respect to the Portfolio in accordance with the U.S. federal securities laws and the applicable rules and regulations of the Securities and Exchange Commission and the PCAOB.
We conducted our audits in accordance with the standards of the PCAOB. Those standards require that we plan and perform the audit to obtain reasonable assurance about whether the financial statements and financial highlights are free of material misstatement, whether due to error or fraud. Our audits included performing procedures to assess the risks of material misstatement of the financial statements and financial highlights, whether due to error or fraud, and performing procedures that respond to those risks. Such procedures included examining, on a test basis, evidence regarding the amounts and disclosures in the financial statements and financial highlights. Such procedures also included confirmation of securities owned as of May 31, 2019, by correspondence with the custodian and brokers, or by other appropriate auditing procedures. Our audits also included evaluating the accounting principles used and significant estimates made by management, as well as evaluating the overall presentation of the financial statements and financial highlights. We believe that our audits provide a reasonable basis for our opinion.
We have not been able to determine the specific year that we began serving as the auditor of one or more Wells Fargo Funds investment companies; however we are aware that we have served as the auditor of one or more Wells Fargo Funds investment companies since at least 1955.
Boston, Massachusetts
July 26, 2019
| | | | | | |
| Other information (unaudited) | | Wells Fargo Core Bond Fund | | | 59 | |
TAX INFORMATION
For the fiscal year ended May 31, 2019, $139,712,747 has been designated as interest-related dividends for nonresident alien shareholders pursuant to Section 871 of the Internal Revenue Code.
For the fiscal year ended May 31, 2019, 21.30% of the ordinary income distributed was derived from interest on U.S. government.
PROXY VOTING INFORMATION
A description of the policies and procedures used to determine how to vote proxies relating to portfolio securities is available, upon request, by calling1-800-222-8222, visiting our website at wfam.com, or visiting the SEC website at sec.gov. Information regarding how the proxies related to portfolio securities were voted during the most recent 12-month period ended June 30 is available on the website atwfam.com or by visiting the SEC website at sec.gov.
QUARTERLY PORTFOLIO HOLDINGS
The Fund and Portfolio file their complete schedule of portfolio holdings with the SEC for the first and third quarters of each fiscal year on Form N-Q, which is available by visiting the SEC website at sec.gov. Those forms may be reviewed and copied at the SEC’s Public Reference Room in Washington, DC. Information on the operation of the Public Reference Room may be obtained by calling 1-800-SEC-0330.
| | | | |
| 60 | | Wells Fargo Core Bond Fund | | Other information (unaudited) |
BOARD OF TRUSTEES AND OFFICERS
Each of the Trustees and Officers1 listed in the table below acts in identical capacities for each fund in the Wells Fargo family of funds, which consists of 151 mutual funds comprising the Wells Fargo Funds Trust, Wells Fargo Variable Trust, Wells Fargo Master Trust and four closed-end funds (collectively the “Fund Complex”). This table should be read in conjunction with the Prospectus and the Statement of Additional Information2. The mailing address of each Trustee and Officer is 525 Market Street, 12th Floor, San Francisco, CA 94105. Each Trustee and Officer serves an indefinite term, however, each Trustee serves such term until reaching the mandatory retirement age established by the Trustees.
Independent Trustees
| | | | | | |
Name and year of birth | | Position held and length of service* | | Principal occupations during past five years or longer | | Current other
public company or
investment company
directorships |
| | | |
William R. Ebsworth (Born 1957) | | Trustee, since 2015 | | Retired. From 1984 to 2013, equities analyst, portfolio manager, research director and chief investment officer at Fidelity Management and Research Company in Boston, Tokyo, and Hong Kong, and retired in 2013 as Chief Investment Officer of Fidelity Strategic Advisers, Inc. where he led a team of investment professionals managing client assets. Prior thereto, Board member of Hong Kong Securities Clearing Co., Hong Kong Options Clearing Corp., the Thailand International Fund, Ltd., Fidelity Investments Life Insurance Company, and Empire Fidelity Investments Life Insurance Company. Audit Committee Chair and Investment Committee Chair of the Vincent Memorial Hospital Endowment (non-profit organization). Mr. Ebsworth is a CFA® charterholder. | | N/A |
| | | |
Jane A. Freeman (Born 1953) | | Trustee, since 2015; Chair Liaison, since 2018 | | Retired. From 2012 to 2014 and 1999 to 2008, Chief Financial Officer of Scientific Learning Corporation. From 2008 to 2012, Ms. Freeman provided consulting services related to strategic business projects. Prior to 1999, Portfolio Manager at Rockefeller & Co. and Scudder, Stevens & Clark. Board member of the Harding Loevner Funds from 1996 to 2014, serving as both Lead Independent Director and chair of the Audit Committee. Board member of the Russell Exchange Traded Funds Trust from 2011 to 2012 and the chair of the Audit Committee. Ms. Freeman is a Board Member of The Ruth Bancroft Garden (non-profit organization). She is also an inactive Chartered Financial Analyst. | | N/A |
| | | |
Isaiah Harris, Jr. (Born 1952) | | Trustee, since 2009; Audit Committee Chairman, since 2019 | | Retired. Chairman of the Board of CIGNA Corporation since 2009, and Director since 2005. From 2003 to 2011, Director of Deluxe Corporation. Prior thereto, President and CEO of BellSouth Advertising and Publishing Corp. from 2005 to 2007, President and CEO of BellSouth Enterprises from 2004 to 2005 and President of BellSouth Consumer Services from 2000 to 2003. Emeritus member of the Iowa State University Foundation Board of Governors. Emeritus Member of the Advisory Board of Iowa State University School of Business. Advisory Board Member, Palm Harbor Academy (private school). Advisory Board Member, Child Evangelism Fellowship (non-profit). Mr. Harris is a certified public accountant (inactive status). | | CIGNA Corporation |
| | | |
Judith M. Johnson (Born 1949) | | Trustee, since 2008; Audit Committee Chairman, from 2009 to 2018 | | Retired. Prior thereto, Chief Executive Officer and Chief Investment Officer of Minneapolis Employees Retirement Fund from 1996 to 2008. Ms. Johnson is an attorney, certified public accountant and a certified managerial accountant. | | N/A |
| | | | | | |
| Other information (unaudited) | | Wells Fargo Core Bond Fund | | | 61 | |
| | | | | | |
Name and year of birth | | Position held and length of service* | | Principal occupations during past five years or longer | | Current other
public company or
investment company
directorships |
| | | |
David F. Larcker (Born 1950) | | Trustee, since 2009 | | James Irvin Miller Professor of Accounting at the Graduate School of Business, Stanford University, Director of the Corporate Governance Research Initiative and Senior Faculty of The Rock Center for Corporate Governance since 2006. From 2005 to 2008, Professor of Accounting at the Graduate School of Business, Stanford University. Prior thereto, Ernst & Young Professor of Accounting at The Wharton School, University of Pennsylvania from 1985 to 2005. | | N/A |
| | | |
Olivia S. Mitchell (Born 1953) | | Trustee, since 2006; Nominating and Governance Committee Chairman, since 2018 | | International Foundation of Employee Benefit Plans Professor, Wharton School of the University of Pennsylvania since 1993. Director of Wharton’s Pension Research Council and Boettner Center on Pensions & Retirement Research, and Research Associate at the National Bureau of Economic Research. Previously, Cornell University Professor from 1978 to 1993. | | N/A |
| | | |
Timothy J. Penny (Born 1951) | | Trustee, since 1996; Chairman, since 2018 | | President and Chief Executive Officer of Southern Minnesota Initiative Foundation, a non-profit organization, since 2007. Member of the Board of Trustees of NorthStar Education Finance, Inc., a non-profit organization, since 2007. | | N/A |
| | | |
James G. Polisson (Born 1959) | | Trustee, since 2018 | | Retired. Chief Marketing Officer, Source (ETF) UK Services, Ltd, from 2015 to 2017. From 2012 to 2015, Principal of The Polisson Group, LLC, a management consulting, corporate advisory and principal investing company. Chief Executive Officer and Managing Director at Russell Investments, Global Exchange Traded Funds from 2010 to 2012. Managing Director of Barclays Global Investors from 1998 to 2010 and Global Chief Marketing Officer for iShares and Barclays Global Investors from 2000 to 2010. Trustee of the San Francisco Mechanics’ Institute, a non-profit organization, from 2013 to 2015. Board member of the Russell Exchange Traded Fund Trust from 2011 to 2012. Director of Barclays Global Investors Holdings Deutschland GmbH from 2006 to 2009. Mr. Polisson is an attorney and has a retired status with the Massachusetts and District of Columbia Bar Associations. | | N/A |
| * | Length of service dates reflect the Trustee’s commencement of service with the Trust’s predecessor entities, where applicable. |
| | | | |
| 62 | | Wells Fargo Core Bond Fund | | Other information (unaudited) |
Officers
| | | | | | |
Name and year of birth | | Position held and length of service | | Principal occupations during past five years or longer | | |
| | | |
Andrew Owen (Born 1960) | | President, since 2017 | | Executive Vice President of Wells Fargo & Company and Head of Affiliated Managers, Wells Fargo Asset Management, since 2014. In addition, Mr. Owen is currently President, Chief Executive Officer and Director of Wells Fargo Funds Management, LLC since 2017. Prior thereto, Executive Vice President responsible for marketing, investments and product development for Wells Fargo Funds Management, LLC, from 2009 to 2014. | | |
| | | |
Nancy Wiser1 (Born 1967) | | Treasurer, since 2012 | | Executive Vice President of Wells Fargo Funds Management, LLC since 2011. Chief Operating Officer and Chief Compliance Officer at LightBox Capital Management LLC, from 2008 to 2011. | | |
| | | |
Alexander Kymn (Born 1973) | | Secretary and Chief Legal Officer, since 2018 | | Senior Company Counsel of Wells Fargo Bank, N.A. since 2018 (previously Senior Counsel from 2007 to 2018). Vice President of Wells Fargo Funds Management, LLC from 2008 to 2014. | | |
| | | |
Michael H. Whitaker (Born 1967) | | Chief Compliance Officer, since 2016 | | Senior Vice President and Chief Compliance Officer since 2016. Senior Vice President and Chief Compliance Officer for Fidelity Investments from 2007 to 2016. | | |
| | | |
David Berardi (Born 1975) | | Assistant Treasurer, since 2009 | | Vice President of Wells Fargo Funds Management, LLC since 2009. Vice President of Evergreen Investment Management Company, LLC from 2008 to 2010. Manager of Fund Reporting and Control for Evergreen Investment Management Company, LLC from 2004 to 2010. | | |
| | | |
Jeremy DePalma1 (Born 1974) | | Assistant Treasurer, since 2009 | | Senior Vice President of Wells Fargo Funds Management, LLC since 2009. Senior Vice President of Evergreen Investment Management Company, LLC from 2008 to 2010 and head of the Fund Reporting and Control Team within Fund Administration from 2005 to 2010. | | |
| 1 | Nancy Wiser acts as Treasurer of 65 funds in the Fund Complex. Jeremy DePalma acts as Treasurer of 86 funds and Assistant Treasurer of 65 funds in the Fund Complex. |
| 2 | The Statement of Additional Information includes additional information about the Trustees and is available, without charge, upon request, by calling1-800-222-8222 or by visiting the website atwfam.com. |
| | | | | | |
| Other information (unaudited) | | Wells Fargo Core Bond Fund | | | 63 | |
BOARD CONSIDERATION OF INVESTMENT MANAGEMENT, ADVISORY AND SUB-ADVISORY AGREEMENTS:
Wells Fargo Core Bond Fund and Wells Fargo Core Bond Portfolio
Under the Investment Company Act of 1940 (the “1940 Act”), the Board of Trustees (each, a “Board” and collectively, the “Boards”) of each of Wells Fargo Funds Trust (“Funds Trust”) and Wells Fargo Master Trust (“Master Trust”, and collectively, the “Trusts”) must determine annually whether to approve the continuation of the Trusts’ investment management, advisory and sub-advisory agreements, as applicable. In this regard, at an in-person meeting held on May 21-22, 2019 (the “Meeting”), the Funds Trust Board, all the members of which have no direct or indirect interest in the investment management agreement and are not “interested persons” of the Trusts, as defined in the 1940 Act (the “Independent Trustees”), reviewed and approved for Wells Fargo Core Bond Fund (the “Gateway Fund”) an investment management agreement (the “Gateway Fund Management Agreement”) with Wells Fargo Funds Management, LLC (“Funds Management”).
At the Meeting, the Master Trust Board, all the members of which have no direct or indirect interest in the investment advisory and sub-advisory agreements and are Independent Trustees, reviewed and approved: (i) an investment advisory agreement (the “Master Portfolio Advisory Agreement”) with Funds Management for Wells Fargo Core Bond Portfolio, a portfolio of Master Trust (the “Master Portfolio”); and (ii) an investment sub-advisory agreement (the “Sub-Advisory Agreement”) with Wells Capital Management Incorporated (the “Sub-Adviser”).
The Gateway Fund and the Master Portfolio are collectively referred to as the “Funds.” The Gateway Fund Management Agreement, the Master Portfolio Advisory Agreement and the Sub-Advisory Agreement are collectively referred to as the “Advisory Agreements.”
The Gateway Fund is a gateway feeder fund that invest substantially all of its assets in the Master Portfolio. The Master Portfolio has a substantially similar investment objective and substantially similar investment strategies to the Gateway Fund. Information provided to the Boards regarding the Gateway Fund is also applicable to the Master Portfolio, as relevant.
At the Meeting, the Boards considered the factors and reached the conclusions described below relating to the selection of Funds Management and the Sub-Adviser and the approval of the Advisory Agreements. Prior to the Meeting, including at an in-person meeting in April 2019, the Trustees conferred extensively among themselves and with representatives of Funds Management about these matters. Also, the Boards have adopted a team-based approach, with each team consisting of a sub-set of Trustees, to assist the full Boards in the discharge of their duties in reviewing investment performance and other matters throughout the year. The Independent Trustees were assisted in their evaluation of the Advisory Agreements by independent legal counsel, from whom they received separate legal advice and with whom they met separately.
In providing information to the Boards, Funds Management and the Sub-Adviser were guided by a detailed set of requests for information submitted to them by independent legal counsel on behalf of the Independent Trustees at the start of the Boards’ annual contract renewal process earlier in 2019. In considering and approving the Advisory Agreements, the Trustees considered the information they believed relevant, including but not limited to the information discussed below. The Boards considered not only the specific information presented in connection with the Meeting, but also the knowledge gained over time through interaction with Funds Management and the Sub-Adviser about various topics. In this regard, the Boards reviewed reports of Funds Management at each of their quarterly meetings, which included, among other things, portfolio reviews and investment performance reports. In addition, the Boards and the teams mentioned above confer with portfolio managers at various times throughout the year. The Boards did not identify any particular information or consideration that was all-important or controlling, and each individual Trustee may have attributed different weights to various factors.
After its deliberations, the Funds Trust Board unanimously approved the continuation of the Gateway Fund Management Agreement for a one-year period. Additionally, after its deliberations, the Master Trust Board unanimously approved the continuation of the Master Portfolio Advisory Agreement and the Sub-Advisory Agreement, each for a one-year term. The Boards also determined that the compensation payable to Funds Management and the Sub-Adviser was reasonable. The Boards considered the approval of the Advisory Agreements for the Funds as part of their consideration of agreements for funds across the complex, but their approvals were made on a fund-by-fund basis. The following summarizes a number of important, but not necessarily all, factors considered by the Boards in support of their approvals.
Nature, extent and quality of services
The Boards received and considered various information regarding the nature, extent and quality of services provided to the Funds by Funds Management and the Sub-Adviser under the Advisory Agreements. This information included a
| | | | |
| 64 | | Wells Fargo Core Bond Fund | | Other information (unaudited) |
description of the investment advisory services and Fund-level administrative services, as well as, among other things, a summary of the background and experience of senior management of Wells Fargo Asset Management (“WFAM”), of which Funds Management and the Sub-Adviser are a part, a summary of investments made in the business of WFAM, a summary of certain organizational and personnel changes involving Funds Management and the Sub-Adviser, and a description of Funds Management’s and the Sub-Adviser’s business continuity planning programs and of their approaches to data privacy and cybersecurity. The Boards received and reviewed information about Funds Management’s role as administrator of the Funds’ liquidity risk management program. The Boards also considered the qualifications, background, tenure and responsibilities of each of the portfolio managers primarily responsible for the day-to-day portfolio management of the Funds.
The Boards evaluated the ability of Funds Management and the Sub-Adviser to attract and retain qualified investment professionals, including research, advisory and supervisory personnel. The Boards further considered the compliance programs and compliance records of Funds Management and the Sub-Adviser. In addition, the Boards took into account the full range of services provided to the Funds by Funds Management and its affiliates.
Fund investment performance and expenses
The Boards considered the investment performance results for each of the Funds over various time periods ended December 31, 2018. The Boards considered these results in comparison to the investment performance of funds in a universe that was determined by Broadridge Inc. (“Broadridge”) to be similar to the Gateway Fund (the “Universe”), and in comparison to the Gateway Fund’s benchmark index and to other comparative data. Broadridge is an independent provider of investment company data. The Boards received a description of the methodology used by Broadridge to select the mutual funds in the performance Universe. The Funds Trust Board noted that the investment performance of the Gateway Fund (Administrator Class) was higher than or in range of the average investment performance of its Universe for the one-, five- and ten-year periods under review, but lower than the average investment performance of its Universe for the three-year period under review. The Funds Trust Board also noted that the investment performance of the Gateway Fund was higher than its benchmark, the Bloomberg Barclays U.S. Aggregate Bond Index, for the ten-year period under review, but lower than its benchmark for the one-, three- and five-year periods under review.
The Master Trust Board took note of the investment performance of the Master Portfolio in the context of reviewing the investment performance of the Gateway Fund.
The Funds Trust Board received information concerning, and discussed factors contributing to, the underperformance of the Gateway Fund relative to the Universe and benchmark for the periods identified above. The Funds Trust Board took note of the explanations for the relative underperformance during these periods, including with respect to investment decisions and market factors that affected the Gateway Fund’s investment performance.
The Funds Trust Board also received and considered information regarding the Gateway Fund’s net operating expense ratios, which include fees and expenses of the Master Portfolio, and their various components, including actual management fees assessed at the Gateway Fund and Master Portfolio levels, custodian and other non-management fees, and Rule 12b-1 and non-Rule 12b-1 shareholder service fees. The Funds Trust Board considered these ratios in comparison to the median ratios of funds in class-specific expense groups that were determined by Broadridge to be similar to the Gateway Fund (the “Groups”). The Funds Trust Board received a description of the methodology used by Broadridge to select the mutual funds in the expense Groups and an explanation of how funds comprising expense groups and their expense ratios may vary from year-to-year. Based on the Broadridge reports, the Funds Trust Board noted that the net operating expense ratios of the Gateway Fund were lower than or equal to the median net operating expense ratios of its expense Groups for each share class.
With respect to the Master Portfolio, the Master Trust Board reviewed the fee rates that are payable to Funds Management for investment advisory services (as discussed below), which are the only fees charged at the Master Portfolio level, relative to a corresponding expense Group.
The Boards took into account the Funds’ investment performance and expense information provided to them among the factors considered in deciding to re-approve the Advisory Agreements.
Investment management, advisory and sub-advisory fee rates
The Funds Trust Board noted that Funds Management receives no advisory fees from the Gateway Fund as long as the Gateway Fund continues to invest all (or substantially all) of its assets in a single master portfolio. If the Gateway Fund were to change its investment structure so that it began investing in two or more master portfolios (a fund-of-funds), Funds Management would be entitled to receive an annual fee of 0.25% of the Gateway Fund’s average daily net assets for providing investment advisory services to the Gateway Fund, including allocating the Gateway Fund’s assets to the Master Portfolio.
| | | | | | |
| Other information (unaudited) | | Wells Fargo Core Bond Fund | | | 65 | |
The Funds Trust Board reviewed and considered the contractual fee rates that are payable by the Gateway Fund to Funds Management under the Gateway Fund Management Agreement, as well as the contractual fee rates payable by the Gateway Fund to Funds Management for class-level administrative services under a Class-Level Administration Agreement, which include, among other things, class-level transfer agency and sub-transfer agency costs (collectively, the “Management Rates”).
The Master Trust Board reviewed and considered the contractual investment advisory fee rate that is payable by the Master Portfolio to Funds Management for investment advisory services under the Master Portfolio Advisory Agreement (the “Advisory Agreement Rate”). The Master Trust Board also reviewed and considered the contractual investment sub-advisory fee rate that is payable by Funds Management to the Sub-Adviser for investment sub-advisory services (the “Sub-Advisory Agreement Rate”).
Among other information reviewed by the Funds Trust Board was a comparison of the Gateway Fund’s Management Rate, which include the advisory fees paid at the Master Portfolio level, with the average contractual investment management fee rates of funds in the expense Groups at a common asset level as well as transfer agency costs of the funds in the expense Groups. The Funds Trust Board noted that the Management Rates of the Gateway Fund were equal to or in range of the sum of these average rates for the Gateway Fund’s expense Groups for all share classes.
The Master Trust Board reviewed a comparison of the Advisory Agreement Rate of the Master Portfolio with those of other funds in the Master Portfolio’s expense Group at a common asset level. The Master Trust Board noted that the Advisory Agreement Rate of the Master Portfolio was in range of the median rate for the Master Portfolio’s expense Group.
The Master Trust Board also received and considered information about the portions of the total management fees that were retained by Funds Management after payment of the fees to the Sub-Adviser for sub-advisory services. In assessing the reasonableness of these amounts, the Master Trust Board received and evaluated information about the nature and extent of responsibilities retained and risks assumed by Funds Management and not delegated to or assumed by the Sub-Adviser, and about Funds Management’s on-going oversight services. Given the affiliation between Funds Management and the Sub-Adviser, the Master Trust Board ascribed limited relevance to the allocation of fees between them.
The Boards also received and considered information about the nature and extent of services offered and fee rates charged by Funds Management and the Sub-Adviser to other types of clients with investment strategies similar to those of the Funds. In this regard, the Boards received information about the significantly greater scope of services, and compliance, reporting and other legal burdens and risks of managing proprietary mutual funds compared with those associated with managing assets of other types of clients, including third-party sub-advised fund clients and non-mutual fund clients such as institutional separate accounts.
Based on its consideration of the factors and information it deemed relevant, including those described here, the Funds Trust Board determined that the compensation payable to Funds Management under the Gateway Fund Management Agreement was reasonable, and the Master Trust Board determined that the compensation payable to Funds Management under the Master Portfolio Advisory Agreement and to the Sub-Adviser under the Sub-Advisory Agreement was reasonable.
Profitability
The Boards received and considered information concerning the profitability of Funds Management, as well as the profitability of both WFAM and Wells Fargo & Co. (“Wells Fargo”) from providing services to the fund family as a whole. The Boards noted that the Sub-Adviser’s profitability information with respect to providing services to the Master Portfolio and other funds in the family was subsumed in the WFAM and Wells Fargo profitability analysis.
Funds Management reported on the methodologies and estimates used in calculating profitability, including a description of the methodology used to allocate certain expenses. Among other things, the Boards noted that the levels of profitability reported on a fund-by-fund basis varied widely, depending on factors such as the size, type and age of fund. Based on its review, the Boards did not deem the profits reported by Funds Management, WFAM or Wells Fargo from services provided to the Funds to be at a level that would prevent the Boards from approving the continuation of the Advisory Agreements.
Economies of scale
The Boards received and considered information about the potential for Funds Management to experience economies of scale in the provision of management services to the Funds, the difficulties of calculating economies of scale at an
| | | | |
| 66 | | Wells Fargo Core Bond Fund | | Other information (unaudited) |
individual fund level, and the extent to which potential scale benefits are shared with shareholders. The Boards noted the existence of breakpoints in the Master Portfolio’s advisory fee structure and the Gateway Fund’s management fee structure, which operate generally to reduce the Funds’ expense ratios as the Funds grow in size. The Boards considered that, in addition to management fee breakpoints, Funds Management shares potential economies of scale from its management business in a variety of ways, including through fee waiver and expense reimbursement arrangements, services that benefit shareholders, competitive management fee rates set at the outset without regard to breakpoints, and investments in the business intended to enhance services available to shareholders.
The Boards concluded that Funds Management’s arrangements with respect to each Fund, including contractual breakpoints, constituted a reasonable approach to sharing potential economies of scale with the Funds and their shareholders.
Other benefits to Funds Management and the Sub-Adviser
The Boards received and considered information regarding potential “fall-out” or ancillary benefits received by Funds Management and its affiliates, including the Sub-Adviser, as a result of their relationships with the Funds. Ancillary benefits could include, among others, benefits directly attributable to other relationships with the Funds and benefits potentially derived from an increase in Funds Management’s and the Sub-Adviser’s business as a result of their relationships with the Funds. The Boards noted that various affiliates of Funds Management may receive distribution-related fees, shareholder servicing payments and sub-transfer agency fees in respect of shares sold or held through them and services provided.
The Boards also reviewed information about soft dollar credits earned and utilized by the Sub-Adviser, fees earned by Funds Management and the Sub-Adviser from managing a private investment vehicle for the fund family’s securities lending collateral, and commissions earned by an affiliated broker from portfolio transactions.
Based on their consideration of the factors and information they deemed relevant, including those described here, the Boards did not find that any ancillary benefits received by Funds Management and its affiliates, including the Sub-Adviser, were unreasonable.
Conclusion
At the Meeting, after considering the above-described factors and based on its deliberations and its evaluation of the information described above, the Funds Trust Board unanimously approved the continuation of the Gateway Fund Management Agreement for a one-year period. Additionally, after its deliberations, the Master Trust Board unanimously approved the continuation of the Master Portfolio Advisory Agreement and the Sub-Advisory Agreement for a one-year term. The Boards also determined that the compensation payable to Funds Management and the Sub-Adviser was reasonable.
This page is intentionally left blank.
This page is intentionally left blank.

For more information
More information about Wells Fargo Funds is available free upon request. To obtain literature, please write, visit the Fund’s website, or call:
Wells Fargo Funds
P.O. Box 219967
Kansas City, MO 64121-9967
Website: wfam.com
Individual investors: 1-800-222-8222
Retail investment professionals: 1-888-877-9275
Institutional investment professionals:1-866-765-0778
This report and the financial statements contained herein are submitted for the general information of the shareholders of the Fund. If this report is used for promotional purposes, distribution of the report must be accompanied or preceded by a current prospectus. Before investing, please consider the investment objectives, risks, charges, and expenses of the investment. For a current prospectus and, if available, a summary prospectus, containing this information, call1-800-222-8222 or visit the Fund’s website atwfam.com. Read the prospectus carefully before you invest or send money.
Wells Fargo Asset Management (WFAM) is the trade name for certain investment advisory/management firms owned by Wells Fargo & Company. These firms include but are not limited to Wells Capital Management Incorporated and Wells Fargo Funds Management, LLC. Certain products managed by WFAM entities are distributed by Wells Fargo Funds Distributor, LLC (a broker-dealer and Member FINRA).
This material is for general informational and educational purposes only and is NOT intended to provide investment advice or a recommendation of any kind—including a recommendation for any specific investment, strategy, or plan.
INVESTMENT PRODUCTS: NOT FDIC INSURED ◾ NO BANK GUARANTEE ◾ MAY LOSE VALUE
© 2019 Wells Fargo Funds Management, LLC. All rights reserved.
| | |
 | | 403201 07-19 A287/AR287 05-19 |
Annual Report
May 31, 2019

Wells Fargo Real Return Fund

Beginning on January 1, 2021, as permitted by new regulations adopted by the Securities and Exchange Commission, paper copies of the Wells Fargo Funds’ annual and semi-annual shareholder reports issued after this date will no longer be sent by mail, unless you specifically request paper copies of the reports. Instead, the reports will be made available on the Funds’ website, and you will be notified by mail each time a report is posted and provided with a website address to access the report.
If you already elected to receive shareholder reports electronically, you will not be affected by this change and you need not take any action. You may elect to receive shareholder reports and other communications from the Fund electronically at any time by contacting your financial intermediary (such as a broker-dealer or bank) or, if you are a direct investor, by calling 1-800-222-8222 or by enrolling at wellsfargo.com/advantagedelivery.
You may elect to receive all future reports in paper free of charge. If you invest through a financial intermediary, you can contact your financial intermediary to request that you continue to receive paper copies of your shareholder reports; if you invest directly with the Fund, you can call 1-800-222-8222. Your election to receive reports in paper will apply to all Wells Fargo Funds held in your account with your financial intermediary or, if you are a direct investor, to all Wells Fargo Funds that you hold.

Reduce clutter. Save trees.
Sign up for electronic delivery of prospectuses and shareholder reports atwww.wellsfargo.com/advantagedelivery
Contents
The views expressed and any forward-looking statements are as of May 31, 2019, unless otherwise noted, and are those of the Fund managers and/or Wells Fargo Asset Management. Discussions of individual securities, or the markets generally, or any Wells Fargo Fund are not intended as individual recommendations. Future events or results may vary significantly from those expressed in any forward-looking statements. The views expressed are subject to change at any time in response to changing circumstances in the market. Wells Fargo Asset Management and the Fund disclaim any obligation to publicly update or revise any views expressed or forward-looking statements.
INVESTMENT PRODUCTS: NOT FDIC INSURED ◾ NO BANK GUARANTEE ◾ MAY LOSE VALUE
| | | | |
| 2 | | Wells Fargo Real Return Fund | | Letter to shareholders (unaudited) |

Andrew Owen
President
Wells Fargo Funds
Dear Shareholder:
We are pleased to offer you this annual report for the Wells Fargo Real Return Fund for the 12-month period that ended May 31, 2019. Higher short-term interest rates, inflation concerns, trade tensions, and geopolitical events drove investment market volatility for much of 2018, particularly for international stocks. Early 2019 saw stocks and bonds gain with renewed business and investor confidence, but volatility returned late in the period as global growth slowed and geopolitical concerns persisted.
For the period, U.S. stocks, based on the S&P 500 Index,1 gained 3.78% and international stocks, as measured by the MSCI ACWI ex USA Index (Net),2 fell 6.26%. Based on the MSCI EM Index (Net),3 emerging market stocks fell 8.70%. Bond investors saw the Bloomberg Barclays U.S. Aggregate Bond Index4 add 6.40% while the Bloomberg Barclays Global Aggregate ex-USD Index5 rose 0.39%. The Bloomberg Barclays Municipal Bond Index6 added 6.40%, and the ICE BofAML U.S. High Yield Index7 was up 5.37%.
Results for investment indices reflected global concerns.
Global trade tensions escalated during the second quarter of 2018. A tit-for-tat tariff spat intensified between the U.S. and other governments. The U.S. Federal Reserve (Fed) raised the federal funds rate by 25 basis points (bps; 100 bps equal 1.00%) to a target range of between 1.75% and 2.00% in June. Market index results reflected the global concerns. The MSCI ACWI ex USA Index (Net) lost 2.61%, while the Bloomberg Barclays Global Aggregate ex-USD Index dropped 4.76%.
Not all news was bad. The U.S. Bureau of Economic Analysis reported second-quarter annualized gross domestic product (GDP) growth of 4.2%. Hiring improved. Unemployment declined. Consumer confidence and spending increased. The S&P 500 Index recorded a 3.43% second-quarter gain. Stocks of companies with smaller capitalizations did even better, as measured by the Russell 2000® Index,8 adding 7.75%.
| 1 | The S&P 500 Index consists of 500 stocks chosen for market size, liquidity, and industry group representation. It is a market-value-weighted index with each stock’s weight in the index proportionate to its market value. You cannot invest directly in an index. |
| 2 | The Morgan Stanley Capital International (MSCI) All Country World Index (ACWI) ex USA Index (Net) is a free-float-adjusted market-capitalization-weighted index that is designed to measure the equity market performance of developed and emerging markets, excluding the U.S. Source: MSCI. MSCI makes no express or implied warranties or representations and shall have no liability whatsoever with respect to any MSCI data contained herein. The MSCI data may not be further redistributed or used as a basis for other indices or any securities or financial products. This report is not approved, reviewed, or produced by MSCI. You cannot invest directly in an index. |
| 3 | The MSCI Emerging Markets (EM) Index (Net) is a free-float-adjusted market-capitalization-weighted index that is designed to measure the equity market performance of emerging markets. You cannot invest directly in an index. |
| 4 | The Bloomberg Barclays U.S. Aggregate Bond Index is a broad-based benchmark that measures the investment-grade, U.S.-dollar-denominated, fixed-rate taxable bond market, including Treasuries, government-related and corporate securities, mortgage-backed securities (agency fixed-rate and hybrid adjustable-rate mortgage pass-throughs), asset-backed securities, and commercial mortgage-backed securities. You cannot invest directly in an index. |
| 5 | The Bloomberg Barclays Global Aggregate ex-USD Index is an unmanaged index that provides a broad-based measure of the global investment-grade fixed-income markets excluding the U.S.-dollar-denominated debt market. You cannot invest directly in an index. |
| 6 | The Bloomberg Barclays Municipal Bond Index is an unmanaged index composed of long-term tax-exempt bonds with a minimum credit rating of Baa. You cannot invest directly in an index. |
| 7 | The ICE BofAML U.S. High Yield Index is a market-capitalization-weighted index of domestic and Yankee high-yield bonds. The index tracks the performance of high-yield securities traded in the U.S. bond market. You cannot invest directly in an index. Copyright 2019. ICE Data Indices, LLC. All rights reserved. |
| 8 | The Russell 2000® Index measures the performance of the 2,000 smallest companies in the Russell 3000® Index, which represents approximately 8% of the total market capitalization of the Russell 3000® Index. You cannot invest directly in an index. |
| | | | | | |
| Letter to shareholders (unaudited) | | Wells Fargo Real Return Fund | | | 3 | |
Investors appeared to shake off lingering concerns during the third quarter.
Favorable third-quarter economic indicators and corporate earnings reports encouraged domestic stock investors. U.S. trade negotiations with Mexico and Canada progressed. The Conference Board Consumer Confidence Index®9 reached its highest level in 18 years during September 2018. The Fed raised the federal funds rate by 25 bps to a target range of between 2.00% and 2.25% in September. For the quarter that ended September 30, 2018, the S&P 500 Index added 7.71%.
Investors in international markets were not as confident. Tensions between the U.S. and China increased. The U.S. imposed $200 billion in tariffs on Chinese goods. China reacted with $60 billion in tariffs on U.S. goods. Economic growth in China caused concern. The Bank of England (BoE) raised its monetary policy rate to 0.75% in August 2018. During the quarter, the MSCI ACWI ex USA Index (Net) gained 0.71%. The MSCI EM Index (Net) declined 1.09%. In fixed-income markets, U.S. bonds were flat, as measured by the Bloomberg Barclays U.S. Aggregate Bond Index. The Bloomberg Barclays Global Aggregate ex-USD Index fell 1.74%.
Conflicting data unsettled markets during the fourth quarter.
November’s U.S. midterm elections shifted control of the House of Representatives from Republicans to Democrats, presaging potential partisan clashes. Third-quarter U.S. GDP was announced at an annualized 3.4% rate, lower than the second-quarter rate. Brexit efforts stalled ahead of the March 2019 deadline. The People’s Bank of China cut reserve requirement ratios, accelerated infrastructure spending, and cut taxes even as the value of the yuan declined to low levels last seen in 2008.
December’s S&P 500 Index performance was the worst since 1931. Globally,fixed-income investments fared better than stocks during the last two months of the year. The Fed increased the federal funds rate by 25 bps in December 2018 to a target range of between 2.25% and 2.50%.
The market climbs a wall of worry.
Investors entered 2019 with reasons to be concerned. A partial U.S. government shutdown driven by partisan policy disputes extended into January. Investment returns appeared to reaffirm the adage that markets climb a wall of worry. The S&P 500 Index gained 8.01% for the month of January, the best monthly performance in 30 years. Returns for the MSCI ACWI ex USA Index (Net), the Bloomberg Barclays U.S. Aggregate Bond Index, and the Bloomberg Barclays Global Aggregate ex-USD Index also were positive. The Fed indicated that it would pause its program of regular rate increases during 2019 as inflation remained low.
In February 2019, concerns over slowing global growth reemerged. The Bureau of Economic Analysis announced fourth-quarter 2018 GDP grew at an annualized 2.2% rate, down from levels of the prior two quarters. In a February report, the BoE forecast the slowest growth since the financial crisis for 2019. China and the U.S. continued to wrangle over trade issues.
By the end of March 2019, the combination of dovish Fed sentiment and consistent, if not spectacular, economic and business metrics reinforced investors’ confidence. Monthly job creation data regained momentum. Corporate profits, while lower than 2018’s lofty levels, remained solid. China announced a roughly $300 billion stimulus package through tax and fee cuts intended to reinvigorate economic growth.
December’s S&P 500 Index performance was the worst since 1931.
The S&P 500 Index gained 8.01% for the month of January, the best monthly performance in 30 years.
| 9 | The Conference Board Consumer Confidence Index® measures the degree of optimism on the state of the U.S. economy that consumers are expressing through their activities of saving and spending. You cannot invest directly in an index. |
| | | | |
| 4 | | Wells Fargo Real Return Fund | | Letter to shareholders (unaudited) |
During April 2019, several broad-based U.S. equity indices reached or approached highs as investors drew confidence from favorable economic projections, sustained low inflation, and solid employment data. First-quarter GDP showed the economy grew at an annualized rate of 3.2% on improvement in business investment and exports. Favorable sentiment extended to foreign markets as the MSCI ACWI ex USA Index (Net) gained 2.64% and the MSCI EM Index (Net) added 2.11% for the month.
May 2019 presented investors with mixed signals in the economy, in the markets, and politically. In the U.S., partisan wrangling ramped up as Democrats and Republicans set their sights on 2020 presidential politics. In the U.K., the Brexit stalemate resulted in the resignation of Prime Minister Theresa May. The European Commission downgraded the 2019 growth forecast for the block of countries to 1.2%. The U.S. increased tariffs on products from China, China responded, and then talks broke down. Ending the month, equities, as measured by the MSCI ACWI (Net),10 dropped 5.93% while bonds, often considered a less risky investment, gained 1.04%, as measured by the Bloomberg Barclays Global Aggregate ex-USD Index.
Don’t let short-term uncertainty derail long-term investment goals.
Periods of investment uncertainty can present challenges, but experience has taught us that maintaining long-term investment goals can be an effective way to plan for the future. To help you create a sound strategy based on your personal goals and risk tolerance, Wells Fargo Funds offers more than 100 mutual funds spanning a wide range of asset classes and investment styles. Although diversification cannot guarantee an investment profit or prevent losses, we believe it can be an effective way to manage investment risk and potentially smooth out overall portfolio performance. We encourage investors to know their investments and to understand that appropriate levels of risk-taking may unlock opportunities.
Thank you for choosing to invest with Wells Fargo Funds. We appreciate your confidence in us and remain committed to helping you meet your financial needs.
Sincerely,

Andrew Owen
President
Wells Fargo Funds
For further information about your Fund, contact your investment professional, visit our website atwfam.com, or call us directly at1-800-222-8222.
| 10 | The MSCI ACWI (Net) is a free-float-adjusted market-capitalization-weighted index that is designed to measure the equity market performance of developed and emerging markets. You cannot invest directly in an index. |
This page is intentionally left blank.
| | | | |
| 6 | | Wells Fargo Real Return Fund1 | | Performance highlights (unaudited) |
Investment objective
The Fund seeks returns that exceed the rate of inflation over the long-term.
Manager
Wells Fargo Funds Management, LLC
Subadviser for the affiliated master portfolio
Wells Capital Management Incorporated
Portfolio managers
Kandarp R. Acharya, CFA®‡, FRM
Petros N. Bocray, CFA®‡, FRM
Michael Bradshaw, CFA®‡
Christian L. Chan, CFA®‡
Kayvan Malek
Garth B. Newport, CFA®‡*
Jay N. Mueller, CFA®‡
Thomas M. Price, CFA®‡
Dale Winner, CFA®‡
Average annual total returns (%) as of May 31, 2019
| | | | | | | | | | | | | | | | | | | | | | | | | | | | | | | | | | |
| | | | | Including sales charge | | | Excluding sales charge | | | Expense ratios2 (%) | |
| | | Inception date | | 1 year | | | 5 year | | | 10 year | | | 1 year | | | 5 year | | | 10 year | | | Gross | | | Net3 | |
| | | | | | | | | |
| Class A (IPBAX) | | 2-28-2003 | | | -2.05 | | | | 0.72 | | | | 2.75 | | | | 2.56 | | | | 1.65 | | | | 3.22 | | | | 1.04 | | | | 0.78 | |
| | | | | | | | | |
| Class C (IPBCX) | | 2-28-2003 | | | 0.89 | | | | 0.90 | | | | 2.49 | | | | 1.89 | * | | | 0.90 | | | | 2.49 | | | | 1.79 | | | | 1.53 | |
| | | | | | | | | |
| Class R6 (IPBJX)4 | | 10-31-2016 | | | – | | | | – | | | | – | | | | 2.99 | | | | 1.99 | | | | 3.55 | | | | 0.66 | | | | 0.40 | |
| | | | | | | | | |
| Administrator Class (IPBIX) | | 2-28-2003 | | | – | | | | – | | | | – | | | | 2.78 | | | | 1.90 | | | | 3.50 | | | | 0.98 | | | | 0.60 | |
| | | | | | | | | |
| Institutional Class (IPBNX)5 | | 10-31-2016 | | | – | | | | – | | | | – | | | | 2.95 | * | | | 1.98 | | | | 3.54 | | | | 0.71 | | | | 0.45 | |
| | | | | | | | | |
| Bloomberg Barclays U.S. TIPS Index6 | | – | | | – | | | | – | | | | – | | | | 4.36 | | | | 1.64 | | | | 3.60 | | | | – | | | | – | |
| | | | | | | | | |
| CPI7 | | – | | | – | | | | – | | | | – | | | | 1.79 | | | | 1.48 | | | | 1.82 | | | | – | | | | – | |
| * | | Total return differs from the return in the Financial Highlights in this report. The total return presented is calculated based on the NAV at which the shareholder transactions were processed. The NAV and total return presented in the Financial Highlights reflects certain adjustments made to the net assets of the Fund that are necessary under U.S. generally accepted accounting principles. |
Figures quoted represent past performance, which is no guarantee of future results, and do not reflect taxes that a shareholder may pay on fund distributions or the redemption of fund shares. Investment return and principal value of an investment will fluctuate so that an investor’s shares, when redeemed, may be worth more or less than their original cost. Performance shown without sales charges would be lower if sales charges were reflected. Current performance may be lower or higher than the performance data quoted, which assumes the reinvestment of dividends and capital gains. Current month-end performance is available on the Fund’s website,wfam.com.
Index returns do not include transaction costs associated with buying and selling securities, any mutual fund fees or expenses, or any taxes. It is not possible to invest directly in an index.
For Class A shares, the maximum front-end sales charge is 4.50%. For Class C shares, the maximum contingent deferred sales charge is 1.00%. Performance including a contingent deferred sales charge assumes the sales charge for the corresponding time period. Class R6, Administrator Class, and Institutional shares are sold without a front-end sales charge or contingent deferred sales charge.
Bond values fluctuate in response to the financial condition of individual issuers, general market and economic conditions, and changes in interest rates. Changes in market conditions and government policies may lead to periods of heightened volatility in the bond market and reduced liquidity for certain bonds held by the Fund. In general, when interest rates rise, bond values fall and investors may lose principal value. Interest rate changes and their impact on the Fund and its share price can be sudden and unpredictable. Stock values fluctuate in response to the activities of individual companies and general market and economic conditions. High-yield securities have a greater risk of default and tend to be more volatile than higher-rated debt securities. Loans are subject to risks similar to those associated with other below investment-grade bond investments, such as credit risk (for example, risk of issuer default), below-investment-grade bond risk (for example, risk of greater volatility in value), and risk that the loan may become illiquid or difficult to price. The use of derivatives may reduce returns and/or increase volatility. Foreign investments are especially volatile and can rise or fall dramatically due to differences in the political and economic conditions of the host country. These risks are generally intensified in emerging markets. The Fund is exposed to mortgage- and asset-backed securities risk and small company securities risk. Securities issued by U.S. government agencies or government-sponsored entities may not be guaranteed by the U.S. Treasury. Consult the Fund’s prospectus for additional information on these and other risks.
Please see footnotes on page 7.
| | | | | | |
| Performance highlights (unaudited) | | Wells Fargo Real Return Fund | | | 7 | |
|
| Growth of $10,000 investment as of May 31, 20198 |
|
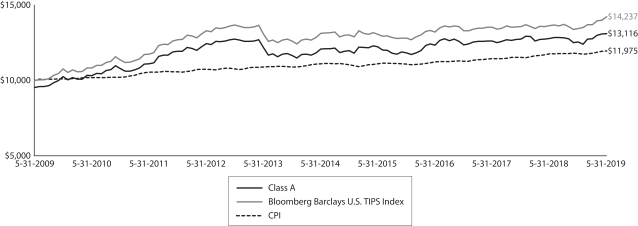 |
| ‡ | CFA® and Chartered Financial Analyst® are trademarks owned by CFA Institute. |
| * | Mr. Newport became a portfolio manager effective March 1, 2019. |
| 1 | The Fund is a gateway feeder fund that invests substantially all of its assets in a single affiliated master portfolio of the Wells Fargo Master Trust with a substantially identical investment objective and substantially similar investment strategies. References to the investment activities of the Fund are intended to refer to the investment activities of the affiliated master portfolio in which it invests. |
| 2 | Reflects the expense ratios as stated in the most recent prospectuses. The expense ratios shown are subject to change and may differ from the annualized expense ratios shown in the financial highlights of this report. |
| 3 | The manager has contractually committed through September 30, 2019, to waive fees and/or reimburse expenses to the extent necessary to cap the expenses of each class after fee waivers at the amounts shown. Brokerage commissions, stamp duty fees, interest, taxes, acquired fund fees and expenses (if any) from funds in which the affiliated master portfolio invests, and extraordinary expenses are excluded from the expense cap. Net expenses from the affiliated master portfolio are included in the expense cap. Prior to or after the commitment expiration date, the cap may be increased or the commitment to maintain the cap may be terminated only with the approval of the Board of Trustees. Without this cap, the Fund’s returns would have been lower. The expense ratio paid by an investor is the net expense ratio (the total annual fund operating expenses after fee waivers) as stated in the prospectuses. |
| 4 | Historical performance shown for the Class R6 shares prior to their inception reflects the performance of the Administrator Class shares, and is not adjusted to reflect Class R6 expenses. If these expenses had been included, returns for Class R6 shares would be higher. |
| 5 | Historical performance shown for the Institutional Class shares prior to their inception reflects the performance of the Administrator Class shares, and is not adjusted to reflect Institutional Class expenses. If these expenses had been included, returns for the Institutional Class shares would be higher. |
| 6 | The Bloomberg Barclays U.S. Treasury Inflation-Protected Securities (TIPS) Index is an index of inflation-indexed-linked U.S. Treasury securities. You cannot invest directly in an index. |
| 7 | The Consumer Price Index (CPI) for All Urban Consumers in U.S. All Items is published monthly by the U.S. government as an indicator of changes in price levels (or inflation) paid by urban consumers for a representative basket of goods and services. You cannot invest directly in an index. |
| 8 | The chart compares the performance of Class A shares since inception with the Bloomberg Barclays U.S. TIPS Index and CPI. The chart assumes a hypothetical $10,000 investment in Class A shares and reflects all operating expenses and assumes the maximum initial sales charge of 4.50%. |
| 9 | The ten largest holdings, excluding cash, cash equivalents and any money market funds, are calculated based on the value of the securities of the affiliated master portfolio allocable to the Fund divided by the total net assets of the Fund. Holdings are subject to change and may have changed since the date specified. |
| 10 | Amounts represent the portfolio allocation of the affiliated master portfolio which are calculated based on the total long-term investments of the affiliated master portfolio. These amounts are subject to change and may have changed since the date specified. |
| | | | |
| 8 | | Wells Fargo Real Return Fund | | Performance highlights (unaudited) |
MANAGER’S DISCUSSION
Fund highlights
| ∎ | | The Fund underperformed its benchmark, the Bloomberg Barclays U.S. Treasury Inflation-Protected Securities (TIPS) Index, for the 12-month period that ended May 31, 2019. |
| ∎ | | As fixed-income investments outperformed equity investments over the period, exposure to stocks, particularly international stocks, detracted from performance. |
| ∎ | | Three of six investment sleeves outperformed their respective benchmarks. |
Positive economic data ruled most of the period.
The 12-month period that ended May 31, 2019, saw the U.S. economy continue on a positive trajectory, producing moderate average gross domestic product growth of 3.1% with a core inflation rate of 2.0%, while unemployment reached a low of 3.6%, the lowest level since 1969.
| | | | |
| Ten largest holdings (%) as of May 31, 20199 | |
| |
TIPS, 0.38%, 7-15-2025 | | | 3.29 | |
| |
TIPS, 0.25%, 1-15-2025 | | | 3.26 | |
| |
TIPS, 0.13%, 7-15-2024 | | | 3.25 | |
| |
TIPS, 0.13%, 1-15-2022 | | | 3.23 | |
| |
TIPS, 0.63%, 7-15-2021 | | | 2.96 | |
| |
TIPS, 0.63%, 1-15-2026 | | | 2.93 | |
| |
TIPS, 0.13%, 1-15-2023 | | | 2.86 | |
| |
TIPS, 0.38%, 7-15-2023 | | | 2.55 | |
| |
TIPS, 0.63%, 1-15-2024 | | | 2.47 | |
| |
TIPS, 0.238%, 1-15-2025 | | | 2.40 | |
Over the past 12 months, the financial markets experienced more volatility than the favorable economic environment might have suggested. Looking back at the financial markets, we saw equities experience a significant decline during the fourth quarter of 2018, as concerns over a partial U.S. government shutdown, central bank tightening, trade tensions, and slowing economic growth shook investors’ confidence. The market volatility of the fourth quarter gave way to a first-quarter 2019 rebound where both equity and fixed-income markets rallied. The two markets seemed joined at the hip as the Federal Reserve’s (Fed’s) updated script signaled an easier policy path for the balance of 2019. Market participants were caught offside by this evolution in the projected policy path, which has resulted in a
broader opportunity set for sector rotation in equities and yield curve trades. We saw a return of volatility toward the end of the 12-month period as concerns over trade (primarily with China and Mexico) caused concerns over global growth to weigh on investors’ minds.
The Fund uses a multi-asset-class strategy to target inflation protection.
During the 12-month period, we maintained allocations to Treasury Inflation-Protected Securities (TIPS) as well as other inflation-sensitive sectors, such as real estate investment trusts (REITs), short-term high-yield bonds, and inflation-sensitive equities. We used this multi-asset-class strategy to target greater inflation protection and real returns than a traditional inflation-hedged strategy might while seeking to achieve similar levels of volatility.
|
| Portfolio allocation as of May 31, 201910 |
|
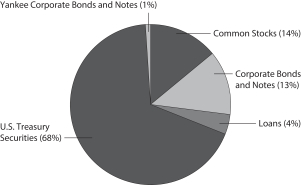 |
Our allocation to TIPS and short-term high-yield issues contributed to performance while the contribution from the inflation-sensitive equities was mixed. REITs posted very strong returns, with earnings results in excess of 20% for the period. The remainder of the equity sleeves detracted from performance. International equities were particularly hard hit, losing more than 17% over the period.
We continue to find TIPS attractive relative to nominal Treasury bonds and notes.
Please see footnotes on page 7.
| | | | | | |
| Performance highlights (unaudited) | | Wells Fargo Real Return Fund | | | 9 | |
Looking ahead, we are cautiously optimistic
Our macroeconomic view is that growth will remain positive but it will be slower over the next 12 months than it was over the preceding 12 months. However, we still hold that absent an exogenous shock—likely an implemented shift in trade policy—a U.S. recession is unlikely in 2019. As always, that view could change with new data. We are concerned about growth prospects in Europe and in the rest of the world but are most concerned about the U.S. trade negotiations with major trading partners. Until the trade negotiations move toward détente and more certainty builds to invoke more aggressive business planning resulting in further growth, we are taking a bit more of a cautious approach to the markets and have started to reduce some risks in the portfolios. Like the Fed, we remain very data dependent and acknowledge that while the U.S. economy may be softening, the levels of growth remain robust and 2019 should remain a target-rich environment for investors.
| | | | |
| 10 | | Wells Fargo Real Return Fund | | Fund expenses (unaudited) |
As a shareholder of the Fund, you incur two types of costs: (1) transaction costs, including sales charges (loads) on purchase payments and contingent deferred sales charges (if any) on redemptions and (2) ongoing costs, including management fees, distribution (12b-1) and/or shareholder servicing fees, and other Fund expenses. This example is intended to help you understand your ongoing costs (in dollars) of investing in the Fund and to compare these costs with the ongoing costs of investing in other mutual funds.
The example is based on an investment of $1,000 invested at the beginning of the six-month period and held for the entire period from December 1, 2018 to May 31, 2019.
Actual expenses
The “Actual” line of the table below provides information about actual account values and actual expenses. You may use the information in this line, together with the amount you invested, to estimate the expenses that you paid over the period. Simply divide your account value by $1,000 (for example, an $8,600 account value divided by $1,000 = 8.6), then multiply the result by the number in the “Actual” line under the heading entitled “Expenses paid during period” for your applicable class of shares to estimate the expenses you paid on your account during this period.
Hypothetical example for comparison purposes
The “Hypothetical” line of the table below provides information about hypothetical account values and hypothetical expenses based on the Fund’s actual expense ratio and an assumed rate of return of 5% per year before expenses, which is not the Fund’s actual return. The hypothetical account values and expenses may not be used to estimate the actual ending account balance or expenses you paid for the period. You may use this information to compare the ongoing costs of investing in the Fund and other funds. To do so, compare this 5% hypothetical example with the 5% hypothetical examples that appear in the shareholder reports of the other funds.
Please note that the expenses shown in the table are meant to highlight your ongoing costs only and do not reflect any transactional costs, such as sales charges (loads) and contingent deferred sales charges. Therefore, the “Hypothetical” line of the table is useful in comparing ongoing costs only and will not help you determine the relative total costs of owning different funds. In addition, if these transactional costs were included, your costs would have been higher.
| | | | | | | | | | | | | | | | |
| | | Beginning
account value
12-1-2018 | | | Ending
account value
5-31-2019 | | | Expenses
paid during
the period1,2 | | | Annualized net
expense ratio1 | |
Class A | | | | | | | | | | | | | | | | |
| | | | |
Actual | | $ | 1,000.00 | | | $ | 1,043.64 | | | $ | 3.89 | | | | 0.76 | % |
| | | | |
Hypothetical (5% return before expenses) | | $ | 1,000.00 | | | $ | 1,021.12 | | | $ | 3.85 | | | | 0.76 | % |
Class C | | | | | | | | | | | | | | | | |
| | | | |
Actual | | $ | 1,000.00 | | | $ | 1,040.99 | | | $ | 7.69 | | | | 1.51 | % |
| | | | |
Hypothetical (5% return before expenses) | | $ | 1,000.00 | | | $ | 1,017.40 | | | $ | 7.60 | | | | 1.51 | % |
Class R6 | | | | | | | | | | | | | | | | |
| | | | |
Actual | | $ | 1,000.00 | | | $ | 1,045.78 | | | $ | 1.96 | | | | 0.38 | % |
| | | | |
Hypothetical (5% return before expenses) | | $ | 1,000.00 | | | $ | 1,023.01 | | | $ | 1.94 | | | | 0.38 | % |
Administrator Class | | | | | | | | | | | | | | | | |
| | | | |
Actual | | $ | 1,000.00 | | | $ | 1,045.43 | | | $ | 2.97 | | | | 0.58 | % |
| | | | |
Hypothetical (5% return before expenses) | | $ | 1,000.00 | | | $ | 1,022.02 | | | $ | 2.94 | | | | 0.58 | % |
Institutional Class | | | | | | | | | | | | | | | | |
| | | | |
Actual | | $ | 1,000.00 | | | $ | 1,046.61 | | | $ | 2.21 | | | | 0.43 | % |
| | | | |
Hypothetical (5% return before expenses) | | $ | 1,000.00 | | | $ | 1,022.77 | | | $ | 2.19 | | | | 0.43 | % |
| 1 | Amounts reflect net expenses allocated from the affiliated Master Portfolio in which the Fund invests. |
| 2 | Expenses paid is equal to the annualized net expense ratio of each class multiplied by the average account value over the period, multiplied by the number of days in the most recent fiscal half-year divided by the number of days in the fiscal year (to reflect the one-half-year period). |
| | | | | | |
| Portfolio of investments—May 31, 2019 | | Wells Fargo Real Return Fund | | | 11 | |
| | | | | | | | | | | | | | | | |
| Security name | | | | | | | | | | | Value | |
| | | | |
Investment Companies: 99.42% | | | | | | | | | | | | | | | | |
| | | | |
| Affiliated Master Portfolio: 99.42% | | | | | | | | | | | | | | | | |
| | | | |
Wells Fargo Real Return Portfolio | | | | | | | | | | | | | | $ | 58,938,344 | |
| | | | | | | | | | | | | | | | |
| | | | |
Total Investment Companies (Cost $57,938,522) | | | | | | | | | | | | | | | 58,938,344 | |
| | | | | | | | | | | | | | | | |
| | | | | | | | |
| Total investments in securities (Cost $57,938,522) | | | 99.42 | % | | | 58,938,344 | |
| | |
Other assets and liabilities, net | | | 0.58 | | | | 343,472 | |
| | | | | | | | |
| Total net assets | | | 100.00 | % | | $ | 59,281,816 | |
| | | | | | | | |
Transactions with the affiliated Master Portfolio were as follows:
| | | | | | | | | | | | | | | | | | | | | | | | | | | | | | | | | | | | |
| | | % of
ownership,
beginning of
period | | | % of
ownership,
end of
period | | | Net realized
gains
(losses) on
securities
transactions
allocated
from
affiliated
Master
Portfolio | | | Net change in
unrealized
gains
(losses) on
securities
transactions
allocated
from
affiliated
Master
Portfolio | | | Interest
allocated
from
affiliated
Master
Portfolio | | | Dividends
allocated
from
affiliated
Master
Portfolio | | | Affiliated
income
allocated
from
affiliated
Master
Portfolio | | | Value,
end
of period | | | % of
net
assets | |
Wells Fargo Real Return Portfolio | | | 53 | % | | | 32 | % | | $ | (830,409 | ) | | $ | 806,875 | | | $ | 1,520,738 | | | $ | 275,164 | | | $ | 15,461 | | | $ | 58,938,344 | | | | 99.42 | % |
The accompanying notes are an integral part of these financial statements.
| | | | |
| 12 | | Wells Fargo Real Return Fund | | Statement of assets and liabilities—May 31, 2019 |
| | | | |
| | | | |
| |
Assets | | | | |
Investments in affiliated Master Portfolio, at value (cost $57,938,522) | | $ | 58,938,344 | |
Receivable for Fund shares sold | | | 179,196 | |
Receivable from manager | | | 38,564 | |
Prepaid expenses and other assets | | | 209,620 | |
| | | | |
Total assets | | | 59,365,724 | |
| | | | |
| |
Liabilities | | | | |
Payable for Fund shares redeemed | | | 59,760 | |
Shareholder servicing fees payable | | | 7,583 | |
Custodian and accounting fees payable | | | 7,263 | |
Administration fees payable | | | 5,377 | |
Distribution fee payable | | | 1,770 | |
Accrued expenses and other liabilities | | | 2,155 | |
| | | | |
Total liabilities | | | 83,908 | |
| | | | |
Total net assets | | $ | 59,281,816 | |
| | | | |
| |
NET ASSETS CONSIST OF | | | | |
Paid-in capital | | $ | 59,004,876 | |
Total distributable earnings | | | 276,940 | |
| | | | |
Total net assets | | $ | 59,281,816 | |
| | | | |
| |
COMPUTATION OF NET ASSET VALUE AND OFFERING PRICE PER SHARE | | | | |
Net assets – Class A | | $ | 17,715,929 | |
Shares outstanding – Class A1 | | | 1,791,498 | |
Net asset value per share – Class A | | | $9.89 | |
Maximum offering price per share – Class A2 | | | $10.36 | |
Net assets – Class C | | $ | 2,552,585 | |
Shares outstanding – Class C1 | | | 262,275 | |
Net asset value per share – Class C | | | $9.73 | |
Net assets – Class R6 | | $ | 14,357,837 | |
Shares outstanding – Class R61 | | | 1,437,240 | |
Net asset value per share – Class R6 | | | $9.99 | |
Net assets – Administrator Class | | $ | 13,561,609 | |
Shares outstanding – Administrator Class1 | | | 1,352,465 | |
Net asset value per share – Administrator Class | | | $10.03 | |
Net assets – Institutional Class | | $ | 11,093,856 | |
Shares outstanding – Institutional Class1 | | | 1,110,085 | |
Net asset value per share – Institutional Class | | | $9.99 | |
| 1 | The Fund has an unlimited number of authorized shares. |
| 2 | Maximum offering price is computed as 100/95.50 of net asset value. On investments of $50,000 or more, the offering price is reduced. |
The accompanying notes are an integral part of these financial statements.
| | | | | | |
| Statement of operations—year ended May 31, 2019 | | Wells Fargo Real Return Fund | | | 13 | |
| | | | |
| | | | |
| |
Investment income | | | | |
Interest allocated from affiliated Master Portfolio | | $ | 1,520,738 | |
Dividends allocated from affiliated Master Portfolio (net of foreign withholding taxes of $7,661) | | | 275,164 | |
Affiliated income allocated from affiliated Master Portfolio | | | 15,461 | |
Expenses allocated from affiliated Master Portfolio | | | (298,432 | ) |
Waivers allocated from affiliated Master Portfolio | | | 34,574 | |
| | | | |
Total investment income | | | 1,547,505 | |
| | | | |
| |
Expenses | | | | |
Management fee | | | 33,440 | |
Administration fees | | | | |
Class A | | | 34,312 | |
Class C | | | 5,293 | |
Class R6 | | | 3,662 | |
Administrator Class | | | 16,653 | |
Institutional Class | | | 10,614 | |
Shareholder servicing fees | | | | |
Class A | | | 53,613 | |
Class C | | | 8,270 | |
Administrator Class | | | 41,632 | |
Distribution fee | | | | |
Class C | | | 24,807 | |
Custody and accounting fees | | | 6,052 | |
Professional fees | | | 32,632 | |
Registration fees | | | 112,365 | |
Shareholder report expenses | | | 27,385 | |
Trustees’ fees and expenses | | | 21,831 | |
Other fees and expenses | | | 11,187 | |
| | | | |
Total expenses | | | 443,748 | |
Less: Fee waivers and/or expense reimbursements | | | (286,177 | ) |
| | | | |
Net expenses | | | 157,571 | |
| | | | |
Net investment income | | | 1,389,934 | |
| | | | |
| |
REALIZED AND UNREALIZED GAINS (LOSSES) ON INVESTMENTS | | | | |
Net realized losses on securities transactions allocated from affiliated Master Portfolio | | | (830,409 | ) |
Net change in unrealized gains (losses) on securities transactions allocated from affiliated Master Portfolio | | | 806,875 | |
| | | | |
Net realized and unrealized gains (losses) on investments | | | (23,534 | ) |
| | | | |
Net increase in net assets resulting from operations | | $ | 1,366,400 | |
| | | | |
The accompanying notes are an integral part of these financial statements.
| | | | |
| 14 | | Wells Fargo Real Return Fund | | Statement of changes in net assets |
| | | | | | | | | | | | | | | | |
| | | Year ended
May 31, 2019 | | | Year ended
May 31, 20181 | |
| | | |
Operations | | | | | | | | | | | | |
Net investment income | | | | | | $ | 1,389,934 | | | | | | | $ | 1,558,167 | |
Net realized gains (losses) on investments | | | | | | | (830,409 | ) | | | | | | | 225,688 | |
Net change in unrealized gains (losses) on investments | | | | | | | 806,875 | | | | | | | | (853,775 | ) |
| | | | |
Net increase in net assets resulting from operations | | | | | | | 1,366,400 | | | | | | | | 930,080 | |
| | | | |
| | | | |
Distributions to shareholders from net investment income and net realized gains | | | | | | | | | | | | | | | | |
Class A | | | | | | | (509,589 | ) | | | | | | | (582,466 | ) |
Class C | | | | | | | (59,497 | ) | | | | | | | (55,795 | ) |
Class R6 | | | | | | | (321,376 | ) | | | | | | | (290,979 | ) |
Administrator Class | | | | | | | (396,758 | ) | | | | | | | (468,083 | ) |
Institutional Class | | | | | | | (349,231 | ) | | | | | | | (187,449 | ) |
| | | | |
Total distributions to shareholders | | | | | | | (1,636,451 | ) | | | | | | | (1,584,772 | ) |
| | | | |
| | | | |
Capital share transactions | | | Shares | | | | | | | | Shares | | | | | |
Proceeds from shares sold | | | | | | | | | | | | | | | | |
Class A | | | 536,260 | | | | 5,211,071 | | | | 1,095,946 | | | | 10,872,363 | |
Class C | | | 115,162 | | | | 1,107,921 | | | | 43,761 | | | | 428,445 | |
Class R6 | | | 315,330 | | | | 3,110,483 | | | | 459,934 | | | | 4,603,532 | |
Administrator Class | | | 418,320 | | | | 4,128,845 | | | | 1,231,825 | | | | 12,417,678 | |
Institutional Class | | | 733,768 | | | | 7,248,113 | | | | 946,110 | | | | 9,485,356 | |
| | | | |
| | | | |
| | | | | | | 20,806,433 | | | | | | | | 37,807,374 | |
| | | | |
Reinvestment of distributions | | | | | | | | | | | | | | | | |
Class A | | | 36,976 | | | | 359,276 | | | | 43,842 | | | | 435,779 | |
Class C | | | 5,600 | | | | 53,596 | | | | 5,160 | | | | 50,665 | |
Class R6 | | | 13,831 | | | | 135,701 | | | | 23,584 | | | | 236,978 | |
Administrator Class | | | 40,010 | | | | 394,108 | | | | 44,920 | | | | 451,385 | |
Institutional Class | | | 35,503 | | | | 348,182 | | | | 18,407 | | | | 184,327 | |
| | | | |
| | | | |
| | | | | | | 1,290,863 | | | | | | | | 1,359,134 | |
| | | | |
Payment for shares redeemed | | | | | | | | | | | | | | | | |
Class A | | | (1,429,739 | ) | | | (13,815,687 | ) | | | (1,472,315 | ) | | | (14,617,222 | ) |
Class C | | | (219,827 | ) | | | (2,105,292 | ) | | | (153,785 | ) | | | (1,504,494 | ) |
Class R6 | | | (71,175 | ) | | | (700,914 | ) | | | (44,403 | ) | | | (444,996 | ) |
Administrator Class | | | (1,441,193 | ) | | | (14,228,082 | ) | | | (1,534,899 | ) | | | (15,428,057 | ) |
Institutional Class | | | (874,093 | ) | | | (8,536,165 | ) | | | (269,640 | ) | | | (2,701,769 | ) |
| | | | |
| | | | |
| | | | | | | (39,386,140 | ) | | | | | | | (34,696,538 | ) |
| | | | |
Net increase (decrease) in net assets resulting from capital share transactions | | | | | | | (17,288,844 | ) | | | | | | | 4,469,970 | |
| | | | |
Total increase (decrease) in net assets | | | | | | | (17,558,895 | ) | | | | | | | 3,815,278 | |
| | | | |
| | |
Net assets | | | | | | | | |
Beginning of period | | | | | | | 76,840,711 | | | | | | | | 73,025,433 | |
| | | | |
End of period | | | | | | $ | 59,281,816 | | | | | | | $ | 76,840,711 | |
| | | | |
| 1 | Effective for all filings after November 4, 2018, the SEC prospectively eliminated the requirement to parenthetically disclose undistributed net investment income at the end of the period and permitted the aggregation of distributions, with the exception of tax basis returns of capital. Undistributed net investment income at May 31, 2018 was $231,384. The disaggregated distributions information for the year ended May 31, 2018 is included in Note 7,Distributions to Shareholders,in the notes to the financial statements. |
The accompanying notes are an integral part of these financial statements.
| | | | | | |
| Financial highlights | | Wells Fargo Real Return Fund | | | 15 | |
(For a share outstanding throughout each period)
| | | | | | | | | | | | | | | | | | | | |
| | | Year ended May 31 | |
| CLASS A | | 2019 | | | 2018 | | | 2017 | | | 2016 | | | 2015 | |
Net asset value, beginning of period | | | $9.87 | | | | $9.96 | | | | $9.95 | | | | $10.07 | | | | $10.11 | |
Net investment income | | | 0.15 | | | | 0.21 | | | | 0.19 | 1 | | | 0.10 | 1 | | | 0.05 | 1 |
Net realized and unrealized gains (losses) on investments | | | 0.09 | | | | (0.09 | ) | | | 0.03 | | | | (0.01 | ) | | | 0.07 | |
| | | | | | | | | | | | | | | | | | | | |
Total from investment operations | | | 0.24 | | | | 0.12 | | | | 0.22 | | | | 0.09 | | | | 0.12 | |
Distributions to shareholders from | | | | | | | | | | | | | | | | |
Net investment income | | | (0.19 | ) | | | (0.21 | ) | | | (0.20 | ) | | | (0.07 | ) | | | (0.08 | ) |
Net realized gain | | | (0.03 | ) | | | 0.00 | | | | (0.01 | ) | | | (0.14 | ) | | | (0.08 | ) |
| | | | | | | | | | | | | | | | | | | | |
Total distributions to shareholders | | | (0.22 | ) | | | (0.21 | ) | | | (0.21 | ) | | | (0.21 | ) | | | (0.16 | ) |
Net asset value, end of period | | | $9.89 | | | | $9.87 | | | | $9.96 | | | | $9.95 | | | | $10.07 | |
Total return2 | | | 2.56 | % | | | 1.25 | % | | | 2.23 | % | | | 1.01 | % | | | 1.24 | % |
Ratios to average net assets (annualized) | | | | | | | | | | | | | | | | |
Gross expenses3 | | | 1.16 | % | | | 1.04 | % | | | 1.11 | % | | | 1.20 | % | | | 1.31 | % |
Net expenses3 | | | 0.77 | % | | | 0.80 | % | | | 0.85 | % | | | 0.85 | % | | | 0.85 | % |
Net investment income3 | | | 1.95 | % | | | 2.15 | % | | | 1.92 | % | | | 0.98 | % | | | 0.47 | % |
Supplemental data | | | | |
Portfolio turnover rate4 | | | 39 | % | | | 29 | % | | | 25 | % | | | 29 | % | | | 57 | % |
Net assets, end of period (000s omitted) | | | $17,716 | | | | $26,133 | | | | $29,678 | | | | $18,938 | | | | $12,977 | |
| 1 | Calculated based upon average shares outstanding |
| 2 | Total return calculations do not include any sales charges. |
| 3 | Ratios include net expenses allocated from the affiliated Master Portfolio which were as follows: |
| | | | |
Year ended May 31, 2019 | | | 0.39 | % |
Year ended May 31, 2018 | | | 0.41 | % |
Year ended May 31, 2017 | | | 0.44 | % |
Year ended May 31, 2016 | | | 0.44 | % |
Year ended May 31, 2015 | | | 0.44 | % |
| 4 | Portfolio turnover rate is calculated by multiplying the affiliated Master Portfolio’s percentage of the Fund’s total investments in securities at the end of the period by the affiliated Master Portfolio’s portfolio turnover rate. |
The accompanying notes are an integral part of these financial statements.
| | | | |
| 16 | | Wells Fargo Real Return Fund | | Financial highlights |
(For a share outstanding throughout each period)
| | | | | | | | | | | | | | | | | | | | |
| | | Year ended May 31 | |
| CLASS C | | 2019 | | | 2018 | | | 2017 | | | 2016 | | | 2015 | |
Net asset value, beginning of period | | | $9.73 | | | | $9.82 | | | | $9.77 | | | | $9.92 | | | | $10.00 | |
Net investment income (loss) | | | 0.10 | 1 | | | 0.03 | | | | 0.04 | | | | 0.03 | 1 | | | (0.03 | )1 |
Net realized and unrealized gains (losses) on investments | | | 0.07 | | | | 0.02 | | | | 0.10 | | | | (0.02 | ) | | | 0.08 | |
| | | | | | | | | | | | | | | | | | | | |
Total from investment operations | | | 0.17 | | | | 0.05 | | | | 0.14 | | | | 0.01 | | | | 0.05 | |
Distributions to shareholders from | | | | | | | | | | | | | | | | |
Net investment income | | | (0.14 | ) | | | (0.14 | ) | | | (0.08 | ) | | | (0.02 | ) | | | (0.05 | ) |
Net realized gain | | | (0.03 | ) | | | 0.00 | | | | (0.01 | ) | | | (0.14 | ) | | | (0.08 | ) |
| | | | | | | | | | | | | | | | | | | | |
Total distributions to shareholders | | | (0.17 | ) | | | (0.14 | ) | | | (0.09 | ) | | | (0.16 | ) | | | (0.13 | ) |
Net asset value, end of period | | | $9.73 | | | | $9.73 | | | | $9.82 | | | | $9.77 | | | | $9.92 | |
Total return2 | | | 1.79 | % | | | 0.53 | % | | | 1.44 | % | | | 0.21 | % | | | 0.46 | % |
Ratios to average net assets (annualized) | | | | | | | | | | | | | | | | |
Gross expenses3 | | | 1.91 | % | | | 1.79 | % | | | 1.86 | % | | | 1.95 | % | | | 2.06 | % |
Net expenses3 | | | 1.52 | % | | | 1.56 | % | | | 1.60 | % | | | 1.60 | % | | | 1.60 | % |
Net investment income (loss)3 | | | 1.08 | % | | | 1.39 | % | | | 1.23 | % | | | 0.30 | % | | | (0.33 | )% |
Supplemental data | | | | |
Portfolio turnover rate4 | | | 39 | % | | | 29 | % | | | 25 | % | | | 29 | % | | | 57 | % |
Net assets, end of period (000s omitted) | | | $2,553 | | | | $3,517 | | | | $4,580 | | | | $5,654 | | | | $7,471 | |
| 1 | Calculated based upon average shares outstanding |
| 2 | Total return calculations do not include any sales charges. |
| 3 | Ratios include net expenses allocated from the affiliated Master Portfolio which were as follows: |
| | | | |
Year ended May 31, 2019 | | | 0.39 | % |
Year ended May 31, 2018 | | | 0.44 | % |
Year ended May 31, 2017 | | | 0.44 | % |
Year ended May 31, 2016 | | | 0.44 | % |
Year ended May 31, 2015 | | | 0.44 | % |
| 4 | Portfolio turnover rate is calculated by multiplying the affiliated Master Portfolio’s percentage of the Fund’s total investments in securities at the end of the period by the affiliated Master Portfolio’s portfolio turnover rate. |
The accompanying notes are an integral part of these financial statements.
| | | | | | |
| Financial highlights | | Wells Fargo Real Return Fund | | | 17 | |
(For a share outstanding throughout each period)
| | | | | | | | | | | | |
| | | Year ended May 31 | |
| CLASS R6 | | 2019 | | | 2018 | | | 20171 | |
Net asset value, beginning of period | | | $9.96 | | | | $10.05 | | | | $10.17 | |
Net investment income | | | 0.23 | 2 | | | 0.22 | | | | 0.10 | |
Net realized and unrealized gains (losses) on investments | | | 0.06 | | | | (0.06 | ) | | | (0.07 | ) |
| | | | | | | | | | | | |
Total from investment operations | | | 0.29 | | | | 0.16 | | | | 0.03 | |
Distributions to shareholders from | | | | | | | | | | | | |
Net investment income | | | (0.23 | ) | | | (0.25 | ) | | | (0.14 | ) |
Net realized gain | | | (0.03 | ) | | | 0.00 | | | | (0.01 | ) |
| | | | | | | | | | | | |
Total distributions to shareholders | | | (0.26 | ) | | | (0.25 | ) | | | (0.15 | ) |
Net asset value, end of period | | | $9.99 | | | | $9.96 | | | | $10.05 | |
Total return3 | | | 2.99 | % | | | 1.63 | % | | | 0.36 | % |
Ratios to average net assets (annualized) | | | | | | | | | | | | |
Gross expenses4 | | | 0.82 | % | | | 0.66 | % | | | 0.69 | % |
Net expenses4 | | | 0.39 | % | | | 0.42 | % | | | 0.47 | % |
Net investment income4 | | | 2.34 | % | | | 2.52 | % | | | 1.32 | % |
Supplemental data | | | | |
Portfolio turnover rate5 | | | 39 | % | | | 29 | % | | | 25 | % |
Net assets, end of period (000s omitted) | | | $14,358 | | | | $11,750 | | | | $7,438 | |
| 1 | For the period from October 31, 2016 (commencement of class operations) to May 31, 2017 |
| 2 | Calculated based upon average shares outstanding |
| 3 | Returns for periods of less than one year are not annualized. |
| 4 | Ratios include net expenses allocated from the affiliated Master Portfolio which were as follows: |
| | | | |
Year ended May 31, 2019 | | | 0.39 | % |
Year ended May 31, 2018 | | | 0.41 | % |
Year ended May 31, 20171 | | | 0.44 | % |
| 5 | Portfolio turnover rate is calculated by multiplying the affiliated Master Portfolio’s percentage of the Fund’s total investments in securities at the end of the period by the affiliated Master Portfolio’s portfolio turnover rate. |
The accompanying notes are an integral part of these financial statements.
| | | | |
| 18 | | Wells Fargo Real Return Fund | | Financial highlights |
(For a share outstanding throughout each period)
| | | | | | | | | | | | | | | | | | | | |
| | | Year ended May 31 | |
| ADMINISTRATOR CLASS | | 2019 | | | 2018 | | | 2017 | | | 2016 | | | 2015 | |
Net asset value, beginning of period | | | $9.99 | | | | $10.06 | | | | $10.03 | | | | $10.15 | | | | $10.17 | |
Net investment income | | | 0.21 | 1 | | | 0.24 | 1 | | | 0.22 | 1 | | | 0.13 | 1 | | | 0.10 | 1 |
Net realized and unrealized gains (losses) on investments | | | 0.06 | | | | (0.09 | ) | | | 0.02 | | | | (0.02 | ) | | | 0.06 | |
| | | | | | | | | | | | | | | | | | | | |
Total from investment operations | | | 0.27 | | | | 0.15 | | | | 0.24 | | | | 0.11 | | | | 0.16 | |
Distributions to shareholders from | | | | | | | | | | | | | | | | |
Net investment income | | | (0.20 | ) | | | (0.22 | ) | | | (0.20 | ) | | | (0.09 | ) | | | (0.10 | ) |
Net realized gain | | | (0.03 | ) | | | 0.00 | | | | (0.01 | ) | | | (0.14 | ) | | | (0.08 | ) |
| | | | | | | | | | | | | | | | | | | | |
Total distributions to shareholders | | | (0.23 | ) | | | (0.22 | ) | | | (0.21 | ) | | | (0.23 | ) | | | (0.18 | ) |
Net asset value, end of period | | | $10.03 | | | | $9.99 | | | | $10.06 | | | | $10.03 | | | | $10.15 | |
Total return | | | 2.78 | % | | | 1.50 | % | | | 2.46 | % | | | 1.21 | % | | | 1.56 | % |
Ratios to average net assets (annualized) | | | | | | | | | | | | | | | | |
Gross expenses2 | | | 1.10 | % | | | 0.97 | % | | | 1.04 | % | | | 1.13 | % | | | 1.27 | % |
Net expenses2 | | | 0.59 | % | | | 0.60 | % | | | 0.60 | % | | | 0.60 | % | | | 0.60 | % |
Net investment income2 | | | 2.15 | % | | | 2.39 | % | | | 2.20 | % | | | 1.30 | % | | | 0.99 | % |
Supplemental data | | | | |
Portfolio turnover rate3 | | | 39 | % | | | 29 | % | | | 25 | % | | | 29 | % | | | 57 | % |
Net assets, end of period (000s omitted) | | | $13,562 | | | | $23,331 | | | | $26,100 | | | | $20,607 | | | | $10,679 | |
| 1 | Calculated based upon average shares outstanding |
| 2 | Ratios include net expenses allocated from the affiliated Master Portfolio which were as follows: |
| | | | |
Year ended May 31, 2019 | | | 0.39 | % |
Year ended May 31, 2018 | | | 0.41 | % |
Year ended May 31, 2017 | | | 0.44 | % |
Year ended May 31, 2016 | | | 0.44 | % |
Year ended May 31, 2015 | | | 0.44 | % |
| 3 | Portfolio turnover rate is calculated by multiplying the affiliated Master Portfolio’s percentage of the Fund’s total investments in securities at the end of the period by the affiliated Master Portfolio’s portfolio turnover rate. |
The accompanying notes are an integral part of these financial statements.
| | | | | | |
| Financial highlights | | Wells Fargo Real Return Fund | | | 19 | |
(For a share outstanding throughout each period)
| | | | | | | | | | | | |
| | | Year ended May 31 | |
| INSTITUTIONAL CLASS | | 2019 | | | 2018 | | | 20171 | |
Net asset value, beginning of period | | | $9.97 | | | | $10.06 | | | | $10.17 | |
Net investment income | | | 0.22 | | | | 0.24 | | | | 0.14 | |
Net realized and unrealized gains (losses) on investments | | | 0.05 | | | | (0.08 | ) | | | (0.10 | ) |
| | | | | | | | | | | | |
Total from investment operations | | | 0.27 | | | | 0.16 | | | | 0.04 | |
Distributions to shareholders from | | | | | | | | | | | | |
Net investment income | | | (0.22 | ) | | | (0.25 | ) | | | (0.14 | ) |
Net realized gain | | | (0.03 | ) | | | 0.00 | | | | (0.01 | ) |
| | | | | | | | | | | | |
Total distributions to shareholders | | | (0.25 | ) | | | (0.25 | ) | | | (0.15 | ) |
Net asset value, end of period | | | $9.99 | | | | $9.97 | | | | $10.06 | |
Total return2 | | | 2.84 | % | | | 1.57 | % | | | 0.41 | % |
Ratios to average net assets (annualized) | | | | | | | | | | | | |
Gross expenses3 | | | 0.84 | % | | | 0.71 | % | | | 0.76 | % |
Net expenses3 | | | 0.44 | % | | | 0.47 | % | | | 0.52 | % |
Net investment income3 | | | 2.20 | % | | | 2.62 | % | | | 2.24 | % |
Supplemental data | | | | |
Portfolio turnover rate4 | | | 39 | % | | | 29 | % | | | 25 | % |
Net assets, end of period (000s omitted) | | | $11,094 | | | | $12,110 | | | | $5,229 | |
| 1 | For the period from October 31, 2016 (commencement of class operations) to May 31, 2017 |
| 2 | Returns for periods of less than one year are not annualized. |
| 3 | Ratios include net expenses allocated from the affiliated Master Portfolio which were as follows: |
| | | | |
Year ended May 31, 2019 | | | 0.39 | % |
Year ended May 31, 2018 | | | 0.41 | % |
Year ended May 31, 20171 | | | 0.44 | % |
| 4 | Portfolio turnover rate is calculated by multiplying the affiliated Master Portfolio’s percentage of the Fund’s total investments in securities at the end of the period by the affiliated Master Portfolio’s portfolio turnover rate. |
The accompanying notes are an integral part of these financial statements.
| | | | |
| 20 | | Wells Fargo Real Return Fund | | Notes to financial statements |
1. ORGANIZATION
Wells Fargo Funds Trust (the “Trust”), a Delaware statutory trust organized on March 10, 1999, is an open-end management investment company registered under the Investment Company Act of 1940, as amended (the “1940 Act”). As an investment company, the Trust follows the accounting and reporting guidance in Financial Accounting Standards Board (“FASB”) Accounting Standards Codification Topic 946, Financial Services – Investment Companies. These financial statements report on the Wells Fargo Real Return Fund (the “Fund”) which is a diversified series of the Trust.
The Fund is a feeder fund in a master-feeder structure that invests substantially all of its assets in a single master portfolio with a substantially identical investment objective and substantially similar investment strategies. The Fund seeks to achieve its investment objective by investing all investable assets in a separate diversified portfolio (the “affiliated Master Portfolio”) of Wells Fargo Master Trust, a registered open-end management investment company. The affiliated Master Portfolio directly acquires portfolio securities and the Fund acquires an indirect interest in those securities. The Fund accounts for its investment in the affiliated Master Portfolio as a partnership investment and records on a daily basis its share of the affiliated Master Portfolio’s income, expense and realized and unrealized gains and losses. The financial statements of the affiliated Master Portfolio for the year ended May 31, 2019 are included in this report and should be read in conjunction with the Fund’s financial statements. As of May 31, 2019, the Fund owned 32% of Wells Fargo Real Return Portfolio.
2. SIGNIFICANT ACCOUNTING POLICIES
The following significant accounting policies, which are consistently followed in the preparation of the financial statements of the Fund, are in conformity with U.S. generally accepted accounting principles which require management to make estimates and assumptions that affect the reported amounts of assets and liabilities, disclosure of contingent assets and liabilities at the date of the financial statements, and the reported amounts of revenues and expenses during the reporting period. Actual results could differ from those estimates.
Securities valuation
All investments are valued each business day as of the close of regular trading on the New York Stock Exchange (generally 4 p.m. Eastern Time), although the Fund may deviate from this calculation time under unusual or unexpected circumstances.
Investments in the affiliated Master Portfolio are valued daily based on the Fund’s proportionate share of the affiliated Master Portfolio’s net assets, which are also valued daily. Securities held in the affiliated Master Portfolio are valued as discussed in the Notes to Financial Statements of the affiliated Master Portfolio, which are included elsewhere in this report.
Investment transactions, income and expenses
Investments in the affiliated Master Portfolio are recorded on a trade basis. The Fund records daily its proportionate share of the affiliated Master Portfolio’s interest and dividend income, expenses and realized and unrealized gains or losses. The Fund also accrues its own expenses.
Distributions to shareholders
Distributions to shareholders are recorded on the ex-dividend date and paid from net investment income monthly and any net realized gains are paid at least annually. Such distributions are determined in accordance with income tax regulations and may differ from U.S. generally accepted accounting principles. Dividend sources are estimated at the time of declaration. The tax character of distributions is determined as of the Fund’s fiscal year end. Therefore, a portion of the Fund’s distributions made prior to the Fund’s fiscal year end may be categorized as a tax return of capital at year end.
Federal and other taxes
The Fund intends to continue to qualify as a regulated investment company by distributing substantially all of its investment company taxable income and any net realized capital gains (after reduction for capital loss carryforwards) sufficient to relieve it from all, or substantially all, federal income taxes. Accordingly, no provision for federal income taxes was required.
The Fund’s income and federal excise tax returns and all financial records supporting those returns for the prior three fiscal years are subject to examination by the federal and Delaware revenue authorities. Management has analyzed the Fund’s tax positions taken on federal, state, and foreign tax returns for all open tax years and does not believe that there are any uncertain tax positions that require recognition of a tax liability.
| | | | | | |
| Notes to financial statements | | Wells Fargo Real Return Fund | | | 21 | |
As of May 31, 2019, the aggregate cost of all investments for federal income tax purposes was $57,981.505 and the unrealized gains (losses) consisted of:
| | | | |
| |
Gross unrealized gains | | $ | 956,839 | |
| |
Gross unrealized losses | | | 0 | |
| |
Net unrealized gains (losses) | | $ | 956,839 | |
As of May 31, 2019, the Fund had capital loss carryforwards which consist of $229,298 in short-term capital losses and $95,581 in long-term capital losses.
As of May 31, 2019, the Fund had current year deferred post-October capital losses consisting of $426,109 in short-term losses and $148,632 in long-term losses which will be recognized on the first day of the following fiscal year.
Class allocations
The separate classes of shares offered by the Fund differ principally in applicable sales charges, distribution, shareholder servicing, and administration fees. Class specific expenses are charged directly to that share class. Investment income, common expenses, and realized and unrealized gains (losses) on investments are allocated daily to each class of shares based on the relative proportion of net assets of each class.
3. FAIR VALUATION MEASUREMENTS
At May 31, 2019, the affiliated Master Portfolio was measured at fair value using the net asset value per share (or its equivalent) as a practical expedient. The investment objective and the value of the affiliate Master Portfolio was as follows:
| | | | | | |
| Affiliated Master Portfolio | | Investment objective | | Value of affiliated
Master Portfolio | |
| | |
Wells Fargo Real Return Portfolio | | Seeks returns that exceed the rate of inflation over the long-term | | | $58,938,344 | |
The affiliated Master Portfolio does not have a redemption period notice, can be redeemed daily and does not have any unfunded commitments.
4. TRANSACTIONS WITH AFFILIATES
Management fee
Wells Fargo Funds Management, LLC (“Funds Management”), an indirect wholly owned subsidiary of Wells Fargo & Company (“Wells Fargo”), is the manager of the Fund and provides advisory and fund-level administrative services under an investment management agreement. Under the investment management agreement, Funds Management is responsible for, among other services, implementing the investment objectives and strategies of the Fund and providing fund-level administrative services in connection with the Fund’s operations. As long as the Fund continues to invest substantially all of its assets in a single affiliated Master Portfolio, the Fund pays Funds Management an investment management fee only for fund-level administrative services at the following annual rate based on the Fund’s average daily net assets:
| | | | |
| Average daily net assets | | Management fee | |
| |
First $5 billion | | | 0.05 | % |
| |
Next $5 billion | | | 0.04 | |
| |
Over $10 billion | | | 0.03 | |
For the year ended May 31, 2019, the management fee was equivalent to an annual rate of 0.05% of the Fund’s average daily net assets.
Funds Management also serves as the adviser to the affiliated Master Portfolio and is entitled to receive a fee from the affiliated Master Portfolio for those services.
Administration fees
Under a class-level administration agreement, Funds Management provides class-level administrative services to the Fund, which includes paying fees and expenses for services provided by the transfer agent, sub-transfer agents, omnibus
| | | | |
| 22 | | Wells Fargo Real Return Fund | | Notes to financial statements |
account servicers and record-keepers. As compensation for its services under the class-level administration agreement, Funds Management receives an annual fee which is calculated based on the average daily net assets of each class as follows:
| | | | |
| | | Class-level
administration fee | |
| |
Class A, Class C | | | 0.16 | % |
| |
Class R6 | | | 0.03 | |
| |
Administrator Class | | | 0.10 | |
| |
Institutional Class | | | 0.08 | |
Funds Management has contractually waived and/or reimbursed management and administration fees to the extent necessary to maintain certain net operating expense ratios for the Fund. When each class of the Fund has exceeded its expense cap, Funds Management has waived fees and/or reimbursed expenses from fund level expenses on a proportionate basis and then from class specific expenses. When only certain classes exceed their expense caps, waivers and/or reimbursements are applied against class specific expenses before fund level expenses. Net expenses from the affiliated Master Portfolio are included in the expense caps. Funds Management has committed through September 30, 2019 to waive fees and/or reimburse expenses to the extent necessary to cap the Fund’s expenses at 0.78% for Class A shares, 1.53% for Class C shares, 0.40% for Class R6 shares, 0.60% for Administrator Class shares, and 0.45% for Institutional Class shares . Prior to or after the commitment expiration date, the cap may be increased or the commitment to maintain the cap may be terminated only with the approval of the Board of Trustees.
Distribution fee
The Trust has adopted a distribution plan for Class C shares of the Fund pursuant to Rule 12b-1 under the 1940 Act. A distribution fee is charged to Class C shares and paid to Wells Fargo Funds Distributor, LLC (“Funds Distributor”), the principal underwriter, at an annual rate of 0.75% of the average daily net assets of Class C shares.
In addition, Funds Distributor is entitled to receive the front-end sales charge from the purchase of Class A shares and a contingent deferred sales charge on the redemption of certain Class A shares. Funds Distributor is also entitled to receive the contingent deferred sales charges from redemptions of Class C shares. For the year ended May 31, 2019, Funds Distributor received $244 from the sale of Class A shares. No contingent deferred sales charges were incurred by Class A and Class C shares for the year ended May 31, 2019.
Shareholder servicing fees
The Trust has entered into contracts with one or more shareholder servicing agents, whereby Class A, Class C, and Administrator Class of the Fund are charged a fee at an annual rate of 0.25% of the average daily net assets of each respective class. A portion of these total shareholder servicing fees were paid to affiliates of Wells Fargo.
5. INVESTMENT PORTFOLIO TRANSACTIONS
The Fund seeks to achieve its investment objective by investing substantially all of its assets in a single affiliated Master Portfolio. Purchases and sales have been calculated by multiplying the Fund’s ownership percentage of the affiliated Master Portfolio by the affiliated Master Portfolio’s purchases and sales. Purchases and sales of investments, excluding short-term securities, for the year ended May 31, 2019 were as follows:
| | | | | | |
Purchases at cost | | Sales proceeds |
U.S.
government | | Non-U.S.
government | | U.S.
government | | Non-U.S.
government |
| $20,329,022 | | $16,681,416 | | $12,915,707 | | $11,734,243 |
6. BANK BORROWINGS
The Trust (excluding the money market funds), Wells Fargo Master Trust and Wells Fargo Variable Trust are parties to a $280,000,000 revolving credit agreement whereby the Fund is permitted to use bank borrowings for temporary or emergency purposes, such as to fund shareholder redemption requests. Interest under the credit agreement is charged to the Fund based on a borrowing rate equal to the higher of the Federal Funds rate in effect on that day plus 1.25% or the overnight LIBOR rate in effect on that day plus 1.25%. In addition, an annual commitment fee equal to 0.25% of the unused balance is allocated to each participating fund.
| | | | | | |
| Notes to financial statements | | Wells Fargo Real Return Fund | | | 23 | |
For the year ended May 31, 2019, there were no borrowings by the Fund under the agreement.
7. DISTRIBUTIONS TO SHAREHOLDERS
The tax character of distributions paid during the years ended May 31, 2019 and May 31, 2018 were as follows:
| | | | | | | | |
| | | Year ended May 31 | |
| | |
| | | 2019 | | | 2018 | |
| | |
Ordinary income | | $ | 1,409,996 | | | $ | 1,584,772 | |
| | |
Long-term capital gain | | | 226,455 | | | | 0 | |
As of May 31, 2019, the components of distributable earnings on a tax basis were as follows:
| | | | | | |
Undistributed ordinary income | | Unrealized gains | | Post-October capital losses deferred | | Capital loss carryforward |
| | | |
| $219,721 | | $956,839 | | $(574,741) | | $(324,879) |
Effective for all filings after November 4, 2018, the Securities and Exchange Commission eliminated the requirement to separately state the components of distributions to shareholders under U.S. generally accepted accounting principles. The amounts of distributions to shareholders for the year ended May 31, 2018 were as follows:
| | | | |
| | | Net investment
income | |
| |
Class A | | | $582,466 | |
| |
Class C | | | 55,795 | |
| |
Class R6 | | | 290,979 | |
| |
Administrator Class | | | 468,083 | |
| |
Institutional Class | | | 187,449 | |
8. INDEMNIFICATION
Under the Trust’s organizational documents, the officers and Trustees have been granted certain indemnification rights against certain liabilities that may arise out of performance of their duties to the Trust. Additionally, in the normal course of business, the Trust may enter into contracts with service providers that contain a variety of indemnification clauses. The Trust’s maximum exposure under these arrangements is dependent on future claims that may be made against the Fund and, therefore, cannot be estimated.
9. NEW ACCOUNTING PRONOUNCEMENT
In August 2018, FASB issued Accounting Standards Update (“ASU”) No. 2018-13, Fair Value Measurement (Topic 820)Disclosure Framework—Changes to the Disclosure Requirements for Fair Value Measurement. ASU 2018-13 updates the disclosure requirements for fair value measurements by modifying or removing certain disclosures and adding certain new disclosures. The amendments are effective for fiscal years, and interim periods within those fiscal years, beginning after December 15, 2019. Early adoption is permitted. Management has adopted the removal and modification of disclosures early, as permitted, and will adopt the additional new disclosures at the effective date.
| | | | |
| 24 | | Wells Fargo Real Return Fund | | Report of independent registered public accounting firm |
TO THE SHAREHOLDERS OF THE FUND AND BOARD OF TRUSTEES OF WELLS FARGO FUNDS TRUST:
Opinion on the Financial Statements
We have audited the accompanying statement of assets and liabilities of Wells Fargo Real Return Fund (the Fund), one of the funds constituting Wells Fargo Funds Trust, including the portfolio of investments, as of May 31, 2019, the related statement of operations for the year then ended, the statements of changes in net assets for each of the years in thetwo-year period then ended, and the related notes (collectively, the financial statements) and the financial highlights for each of the years or periods in the five-year period then ended. In our opinion, the financial statements and financial highlights present fairly, in all material respects, the financial position of the Fund as of May 31, 2019, the results of its operations for the year then ended, the changes in its net assets for each of the years in the two-year period then ended, and the financial highlights for each of the years or periods in the five-year period then ended, in conformity with U.S. generally accepted accounting principles.
Basis for Opinion
These financial statements and financial highlights are the responsibility of the Fund’s management. Our responsibility is to express an opinion on these financial statements and financial highlights based on our audits. We are a public accounting firm registered with the Public Company Accounting Oversight Board (United States) (PCAOB) and are required to be independent with respect to the Fund in accordance with the U.S. federal securities laws and the applicable rules and regulations of the Securities and Exchange Commission and the PCAOB.
We conducted our audits in accordance with the standards of the PCAOB. Those standards require that we plan and perform the audit to obtain reasonable assurance about whether the financial statements and financial highlights are free of material misstatement, whether due to error or fraud. Our audits included performing procedures to assess the risks of material misstatement of the financial statements and financial highlights, whether due to error or fraud, and performing procedures that respond to those risks. Such procedures included examining, on a test basis, evidence regarding the amounts and disclosures in the financial statements and financial highlights. Such procedures also included confirmation of securities owned as of May 31, 2019, by correspondence with the transfer agent. Our audits also included evaluating the accounting principles used and significant estimates made by management, as well as evaluating the overall presentation of the financial statements and financial highlights. We believe that our audits provide a reasonable basis for our opinion.

We have not been able to determine the specific year that we began serving as the auditor of one or more Wells Fargo Funds investment companies; however we are aware that we have served as the auditor of one or more Wells Fargo Funds investment companies since at least 1955.
Boston, Massachusetts
July 26, 2019
| | | | | | |
| Portfolio of investments—May 31, 2019 | | Wells Fargo Real Return Portfolio | | | 25 | |
| | | | | | | | | | | | | | | | |
| Security name | | | | | | | | Shares | | | Value | |
| | | | |
Common Stocks: 13.33% | | | | | | | | | | | | | | | | |
| | | | |
Consumer Staples: 3.46% | | | | | | | | | | | | | | | | |
| | | | |
| Beverages: 0.78% | | | | | | | | | | | | | | | | |
| | | | |
Molson Coors Brewing Company Class B | | | | | | | | | | | 5,931 | | | $ | 326,086 | |
| | | | |
The Coca-Cola Company | | | | | | | | | | | 22,285 | | | | 1,094,862 | |
| |
| | | | 1,420,948 | |
| | | | | | | | | | | | | | | | |
| | | | |
| Food & Staples Retailing: 0.68% | | | | | | | | | | | | | | | | |
| | | | |
Costco Wholesale Corporation | | | | | | | | | | | 1,578 | | | | 378,057 | |
| | | | |
Metro AG | | | | | | | | | | | 7,735 | | | | 121,927 | |
| | | | |
Wal-Mart Stores Incorporated | | | | | | | | | | | 7,347 | | | | 745,280 | |
| |
| | | | 1,245,264 | |
| | | | | | | | | | | | | | | | |
| | | | |
| Food Products: 0.57% | | | | | | | | | | | | | | | | |
| | | | |
Greencore Group plc | | | | | | | | | | | 29,803 | | | | 77,806 | |
| | | | |
Health & Happiness (H&H) International Holdings Limited | | | | | | | | | | | 8,000 | | | | 43,676 | |
| | | | |
Mondelez International Incorporated Class A | | | | | | | | | | | 9,086 | | | | 462,023 | |
| | | | |
Mowi ASA | | | | | | | | | | | 3,549 | | | | 82,321 | |
| | | | |
The Kraft Heinz Company | | | | | | | | | | | 8,860 | | | | 244,979 | |
| | | | |
Tyson Foods Incorporated Class A | | | | | | | | | | | 1,679 | | | | 127,419 | |
| |
| | | | 1,038,224 | |
| | | | | | | | | | | | | | | | |
| | | | |
| Household Products: 1.02% | | | | | | | | | | | | | | | | |
| | | | |
Church & Dwight Company Incorporated | | | | | | | | | | | 5,796 | | | | 431,280 | |
| | | | |
The Clorox Company | | | | | | | | | | | 1,461 | | | | 217,411 | |
| | | | |
The Procter & Gamble Company | | | | | | | | | | | 11,818 | | | | 1,216,190 | |
| |
| | | | 1,864,881 | |
| | | | | | | | | | | | | | | | |
| | | | |
| Personal Products: 0.03% | | | | | | | | | | | | | | | | |
| | | | |
Ontex Group NV | | | | | | | | | | | 3,663 | | | | 62,405 | |
| | | | | | | | | | | | | | | | |
| | | | |
| Tobacco: 0.38% | | | | | | | | | | | | | | | | |
| | | | |
Altria Group Incorporated | | | | | | | | | | | 2,343 | | | | 114,948 | |
| | | | |
Philip Morris International Incorporated | | | | | | | | | | | 7,488 | | | | 577,549 | |
| |
| | | | 692,497 | |
| | | | | | | | | | | | | | | | |
| | | | |
Energy: 2.63% | | | | | | | | | | | | | | | | |
| | | | |
| Energy Equipment & Services: 0.29% | | | | | | | | | | | | | | | | |
| | | | |
Halliburton Company | | | | | | | | | | | 10,318 | | | | 219,670 | |
| | | | |
John Wood Group plc | | | | | | | | | | | 17,402 | | | | 86,066 | |
| | | | |
Schlumberger Limited | | | | | | | | | | | 6,614 | | | | 229,440 | |
| |
| | | | 535,176 | |
| | | | | | | | | | | | | | | | |
| | | | |
| Oil, Gas & Consumable Fuels: 2.34% | | | | | | | | | | | | | | | | |
| | | | |
BP plc | | | | | | | | | | | 37,746 | | | | 937,844 | |
| | | | |
Chevron Corporation | | | | | | | | | | | 7,681 | | | | 874,482 | |
| | | | |
Cimarex Energy Company | | | | | | | | | | | 5,602 | | | | 320,378 | |
| | | | |
Concho Resources Incorporated | | | | | | | | | | | 5,205 | | | | 510,142 | |
The accompanying notes are an integral part of these financial statements.
| | | | |
| 26 | | Wells Fargo Real Return Portfolio | | Portfolio of investments—May 31, 2019 |
| | | | | | | | | | | | | | | | |
| Security name | | | | | | | | Shares | | | Value | |
| | | | |
| Oil, Gas & Consumable Fuels(continued) | | | | | | | | | | | | | | | | |
| | | | |
Cosan Limited Class A | | | | | | | | | | | 4,018 | | | $ | 50,747 | |
| | | | |
Eni SpA | | | | | | | | | | | 3,192 | | | | 48,426 | |
| | | | |
EOG Resources Incorporated | | | | | | | | | | | 9,291 | | | | 760,747 | |
| | | | |
Noble Energy Incorporated | | | | | | | | | | | 13,639 | | | | 291,875 | |
| | | | |
Origin Energy Limited | | | | | | | | | | | 18,880 | | | | 94,037 | |
| | | | |
Phillips 66 | | | | | | | | | | | 4,719 | | | | 381,295 | |
| |
| | | | 4,269,973 | |
| | | | | | | | | | | | | | | | |
| | | | |
Industrials: 0.04% | | | | | | | | | | | | | | | | |
| | | | |
| Industrial Conglomerates: 0.04% | | | | | | | | | | | | | | | | |
| | | | |
Keppel Corporation Limited | | | | | | | | | | | 18,400 | | | | 80,769 | |
| | | | | | | | | | | | | | | | |
| | | | |
Materials: 2.53% | | | | | | | | | | | | | | | | |
| | | | |
| Chemicals: 0.90% | | | | | | | | | | | | | | | | |
| | | | |
Axalta Coating Systems Limited † | | | | | | | | | | | 11,283 | | | | 265,263 | |
| | | | |
Dow Incorporated | | | | | | | | | | | 4,785 | | | | 223,747 | |
| | | | |
DowDuPont Incorporated | | | | | | | | | | | 3,927 | | | | 119,852 | |
| | | | |
Ecolab Incorporated | | | | | | | | | | | 990 | | | | 182,249 | |
| | | | |
Linde plc | | | | | | | | | | | 2,379 | | | | 429,528 | |
| | | | |
OCI NV † | | | | | | | | | | | 3,892 | | | | 88,263 | |
| | | | |
Sasol Limited | | | | | | | | | | | 2,629 | | | | 66,164 | |
| | | | |
The Sherwin-Williams Company | | | | | | | | | | | 662 | | | | 277,676 | |
| |
| | | | 1,652,742 | |
| | | | | | | | | | | | | | | | |
| | | | |
| Construction Materials: 0.15% | | | | | | | | | | | | | | | | |
| | | | |
Martin Marietta Materials Incorporated | | | | | | | | | | | 1,277 | | | | 268,809 | |
| | | | | | | | | | | | | | | | |
| | | | |
| Containers & Packaging: 0.10% | | | | | | | | | | | | | | | | |
| | | | |
Crown Holdings Incorporated † | | | | | | | | | | | 3,249 | | | | 180,092 | |
| | | | | | | | | | | | | | | | |
| | | | |
| Metals & Mining: 1.38% | | | | | | | | | | | | | | | | |
| | | | |
Agnico Eagle Mines Limited | | | | | | | | | | | 5,100 | | | | 222,309 | |
| | | | |
B2Gold Corporation † | | | | | | | | | | | 18,000 | | | | 49,142 | |
| | | | |
Barrick Gold Corporation | | | | | | | | | | | 12,756 | | | | 158,430 | |
| | | | |
Detour Gold Corporation † | | | | | | | | | | | 7,700 | | | | 72,636 | |
| | | | |
Endeavour Mining Corporation † | | | | | | | | | | | 3,100 | | | | 46,284 | |
| | | | |
Evolution Mining Limited | | | | | | | | | | | 26,000 | | | | 69,800 | |
| | | | |
Franco-Nevada Corporation | | | | | | | | | | | 1,600 | | | | 123,540 | |
| | | | |
Fresnillo plc | | | | | | | | | | | 15,563 | | | | 151,108 | |
| | | | |
Gold Fields Limited ADR | | | | | | | | | | | 7,000 | | | | 31,220 | |
| | | | |
Kinross Gold Corporation † | | | | | | | | | | | 27,000 | | | | 88,295 | |
| | | | |
Kirkland Lake Gold Limited | | | | | | | | | | | 3,900 | | | | 134,896 | |
| | | | |
Lundin Mining Corporation | | | | | | | | | | | 15,349 | | | | 68,591 | |
| | | | |
Mag Silver Corporation † | | | | | | | | | | | 4,800 | | | | 46,949 | |
| | | | |
Newcrest Mining Limited | | | | | | | | | | | 8,000 | | | | 151,005 | |
| | | | |
Newmont Mining Corporation | | | | | | | | | | | 7,040 | | | | 232,954 | |
| | | | |
Northern Star Resources Limited | | | | | | | | | | | 11,500 | | | | 77,462 | |
| | | | |
Royal Gold Incorporated | | | | | | | | | | | 4,510 | | | | 396,835 | |
| | | | |
Semafo Incorporated † | | | | | | | | | | | 13,000 | | | | 38,954 | |
The accompanying notes are an integral part of these financial statements.
| | | | | | |
| Portfolio of investments—May 31, 2019 | | Wells Fargo Real Return Portfolio | | | 27 | |
| | | | | | | | | | | | | | | | |
| Security name | | | | | | | | Shares | | | Value | |
| | | | |
| Metals & Mining(continued) | | | | | | | | | | | | | | | | |
| | | | |
SSR Mining Incorporated † | | | | | | | | | | | 3,000 | | | $ | 35,040 | |
| | | | |
Steel Dynamics Incorporated | | | | | | | | | | | 6,818 | | | | 171,473 | |
| | | | |
Torex Gold Resources Incorporated † | | | | | | | | | | | 4,400 | | | | 40,367 | |
| | | | |
Wheaton Precious Metals Corporation | | | | | | | | | | | 5,300 | | | | 117,207 | |
| |
| | | | 2,524,497 | |
| | | | | | | | | | | | | | | | |
| | | | |
Real Estate: 4.67% | | | | | | | | | | | | | | | | |
| | | | |
| Equity REITs: 4.67% | | | | | | | | | | | | | | | | |
| | | | |
Alexandria Real Estate Equities Incorporated | | | | | | | | | | | 2,770 | | | | 405,556 | |
| | | | |
American Homes 4 Rent Class A | | | | | | | | | | | 12,518 | | | | 305,564 | |
| | | | |
American Tower Corporation | | | | | | | | | | | 4,307 | | | | 899,172 | |
| | | | |
Camden Property Trust | | | | | | | | | | | 3,196 | | | | 330,339 | |
| | | | |
CoreSite Realty Corporation | | | | | | | | | | | 1,239 | | | | 144,616 | |
| | | | |
Equinix Incorporated | | | | | | | | | | | 1,728 | | | | 839,445 | |
| | | | |
Equity Residential | | | | | | | | | | | 4,183 | | | | 320,292 | |
| | | | |
Four Corners Property Trust Incorporated | | | | | | | | | | | 11,636 | | | | 334,651 | |
| | | | |
Healthcare Trust of America Incorporated Class A | | | | | | | | | | | 9,696 | | | | 279,148 | |
| | | | |
Host Hotels & Resorts Incorporated | | | | | | | | | | | 9,490 | | | | 171,864 | |
| | | | |
Hudson Pacific Properties Incorporated | | | | | | | | | | | 7,831 | | | | 261,634 | |
| | | | |
Invitation Homes Incorporated | | | | | | | | | | | 12,913 | | | | 330,960 | |
| | | | |
Physicians Realty Trust | | | | | | | | | | | 26,849 | | | | 491,605 | |
| | | | |
Prologis Incorporated | | | | | | | | | | | 8,769 | | | | 646,012 | |
| | | | |
Public Storage Incorporated | | | | | | | | | | | 1,704 | | | | 405,348 | |
| | | | |
Retail Opportunity Investment Corporation | | | | | | | | | | | 19,412 | | | | 324,957 | |
| | | | |
SBA Communications Corporation † | | | | | | | | | | | 2,308 | | | | 499,474 | |
| | | | |
Simon Property Group Incorporated | | | | | | | | | | | 3,725 | | | | 603,785 | |
| | | | |
Sun Communities Incorporated | | | | | | | | | | | 3,300 | | | | 416,691 | |
| | | | |
Ventas Incorporated | | | | | | | | | | | 3,446 | | | | 221,578 | |
| | | | |
VICI Properties Incorporated | | | | | | | | | | | 13,478 | | | | 298,942 | |
| | | | |
| | | | | | | | | | | | | | | 8,531,633 | |
| | | | | | | | | | | | | | | | |
| |
Total Common Stocks (Cost $22,980,733) | | | | 24,367,910 | |
| | | | | | | | | | | | | | | | |
| | | | |
| | | Interest rate | | | Maturity date | | | Principal | | | | |
| Corporate Bonds and Notes: 12.54% | | | | | | | | | | | | | | | | |
| | | | |
Communication Services: 2.33% | | | | | | | | | | | | | | | | |
| | | | |
| Diversified Telecommunication Services: 0.12% | | | | | | | | | | | | | | | | |
| | | | |
Hughes Satellite Systems Corporation | | | 6.50 | % | | | 6-15-2019 | | | $ | 230,000 | | | | 229,575 | |
| | | | | | | | | | | | | | | | |
| | | | |
| Entertainment: 0.25% | | | | | | | | | | | | | | | | |
| | | | |
Netflix Incorporated | | | 5.38 | | | | 2-1-2021 | | | | 450,000 | | | | 462,326 | |
| | | | | | | | | | | | | | | | |
| | | | |
| Media: 1.80% | | | | | | | | | | | | | | | | |
| | | | |
Cable One Incorporated 144A | | | 5.75 | | | | 6-15-2022 | | | | 440,000 | | | | 446,380 | |
| | | | |
DISH DBS Corporation | | | 7.88 | | | | 9-1-2019 | | | | 490,000 | | | | 495,277 | |
| | | | |
National CineMedia LLC | | | 6.00 | | | | 4-15-2022 | | | | 350,000 | | | | 353,063 | |
| | | | |
Nexstar Broadcasting Group Incorporated | | | 5.88 | | | | 11-15-2022 | | | | 315,000 | | | | 320,418 | |
| | | | |
Nexstar Broadcasting Group Incorporated 144A | | | 6.13 | | | | 2-15-2022 | | | | 105,000 | | | | 106,181 | |
The accompanying notes are an integral part of these financial statements.
| | | | |
| 28 | | Wells Fargo Real Return Portfolio | | Portfolio of investments—May 31, 2019 |
| | | | | | | | | | | | | | | | |
| Security name | | Interest rate | | | Maturity date | | | Principal | | | Value | |
| | | | |
| Media(continued) | | | | | | | | | | | | | | | | |
| | | | |
Outfront Media Capital Corporation | | | 5.25 | % | | | 2-15-2022 | | | $ | 400,000 | | | $ | 403,704 | |
| | | | |
Sinclair Television Group Incorporated | | | 6.13 | | | | 10-1-2022 | | | | 400,000 | | | | 406,000 | |
| | | | |
Sirius XM Radio Incorporated 144A | | | 3.88 | | | | 8-1-2022 | | | | 430,000 | | | | 426,775 | |
| | | | |
TEGNA Incorporated | | | 5.13 | | | | 10-15-2019 | | | | 27,000 | | | | 27,002 | |
| | | | |
TEGNA Incorporated | | | 5.13 | | | | 7-15-2020 | | | | 305,000 | | | | 305,000 | |
| |
| | | | 3,289,800 | |
| | | | | | | | | | | | | | | | |
| | | | |
| Wireless Telecommunication Services: 0.16% | | | | | | | | | | | | | | | | |
| | | | |
Sprint Spectrum Company LLC 144A | | | 3.36 | | | | 3-20-2023 | | | | 109,375 | | | | 109,102 | |
| | | | |
T-Mobile USA Incorporated | | | 4.00 | | | | 4-15-2022 | | | | 175,000 | | | | 176,313 | |
| |
| | | | 285,415 | |
| | | | | | | | | | | | | | | | |
| | | | |
Consumer Discretionary: 2.13% | | | | | | | | | | | | | | | | |
| | | | |
| Auto Components: 0.03% | | | | | | | | | | | | | | | | |
| | | | |
Cooper Tire & Rubber Company | | | 8.00 | | | | 12-15-2019 | | | | 50,000 | | | | 51,188 | |
| | | | | | | | | | | | | | | | |
| | | | |
| Distributors: 0.09% | | | | | | | | | | | | | | | | |
| | | | |
LKQ Corporation | | | 4.75 | | | | 5-15-2023 | | | | 170,000 | | | | 170,000 | |
| | | | | | | | | | | | | | | | |
| | | | |
| Diversified Consumer Services: 0.05% | | | | | | | | | | | | | | | | |
| | | | |
TRI Pointe Group Incorporated | | | 4.38 | | | | 6-15-2019 | | | | 92,000 | | | | 91,310 | |
| | | | | | | | | | | | | | | | |
| | | | |
| Hotels, Restaurants & Leisure: 0.55% | | | | | | | | | | | | | | | | |
| | | | |
GLP Capital LP | | | 4.88 | | | | 11-1-2020 | | | | 405,000 | | | | 411,030 | |
| | | | |
MGM Resorts International | | | 6.63 | | | | 12-15-2021 | | | | 200,000 | | | | 213,070 | |
| | | | |
NCL Corporation Limited 144A | | | 4.75 | | | | 12-15-2021 | | | | 373,000 | | | | 375,798 | |
| |
| | | | 999,898 | |
| | | | | | | | | | | | | | | | |
| | | | |
| Household Durables: 0.63% | | | | | | | | | | | | | | | | |
| | | | |
Lennar Corporation | | | 4.50 | | | | 6-15-2019 | | | | 150,000 | | | | 150,000 | |
| | | | |
Lennar Corporation | | | 4.50 | | | | 11-15-2019 | | | | 50,000 | | | | 50,188 | |
| | | | |
Lennar Corporation | | | 6.63 | | | | 5-1-2020 | | | | 305,000 | | | | 313,006 | |
| | | | |
Pulte Group Incorporated | | | 4.25 | | | | 3-1-2021 | | | | 400,000 | | | | 402,000 | |
| | | | |
Toll Brothers Finance Corporation | | | 5.88 | | | | 2-15-2022 | | | | 225,000 | | | | 235,969 | |
| |
| | | | 1,151,163 | |
| | | | | | | | | | | | | | | | |
| | | | |
| Specialty Retail: 0.78% | | | | | | | | | | | | | | | | |
| | | | |
Gap Incorporated | | | 5.95 | | | | 4-12-2021 | | | | 310,000 | | | | 321,352 | |
| | | | |
Group 1 Automotive Incorporated | | | 5.00 | | | | 6-1-2022 | | | | 280,000 | | | | 281,400 | |
| | | | |
L Brands Incorporated | | | 6.63 | | | | 4-1-2021 | | | | 365,000 | | | | 380,969 | |
| | | | |
Penske Auto Group Incorporated | | | 3.75 | | | | 8-15-2020 | | | | 335,000 | | | | 332,906 | |
| | | | |
Penske Auto Group Incorporated | | | 5.75 | | | | 10-1-2022 | | | | 110,000 | | | | 111,100 | |
| |
| | | | 1,427,727 | |
| | | | | | | | | | | | | | | | |
| | | | |
Consumer Staples: 0.29% | | | | | | | | | | | | | | | | |
| | | | |
| Food Products: 0.08% | | | | | | | | | | | | | | | | |
| | | | |
B&G Foods Incorporated | | | 4.63 | | | | 6-1-2021 | | | | 155,000 | | | | 154,225 | |
| | | | | | | | | | | | | | | | |
The accompanying notes are an integral part of these financial statements.
| | | | | | |
| Portfolio of investments—May 31, 2019 | | Wells Fargo Real Return Portfolio | | | 29 | |
| | | | | | | | | | | | | | | | |
| Security name | | Interest rate | | | Maturity date | | | Principal | | | Value | |
| | | | |
| Personal Products: 0.21% | | | | | | | | | | | | | | | | |
| | | | |
Edgewell Personal Care Company | | | 4.70 | % | | | 5-19-2021 | | | $ | 380,000 | | | $ | 377,682 | |
| | | | | | | | | | | | | | | | |
| | | | |
Energy: 0.87% | | | | | | | | | | | | | | | | |
| | | | |
| Oil, Gas & Consumable Fuels: 0.87% | | | | | | | | | | | | | | | | |
| | | | |
Andeavor Logistics LP | | | 5.50 | | | | 10-15-2019 | | | | 75,000 | | | | 75,509 | |
| | | | |
DCP Midstream Operating LP 144A | | | 5.35 | | | | 3-15-2020 | | | | 445,000 | | | | 450,006 | |
| | | | |
Rockies Express Pipeline LLC 144A | | | 5.63 | | | | 4-15-2020 | | | | 405,000 | | | | 411,063 | |
| | | | |
Sabine Pass Liquefaction LLC | | | 6.25 | | | | 3-15-2022 | | | | 250,000 | | | | 269,935 | |
| | | | |
Southern Star Central Corporation 144A | | | 5.13 | | | | 7-15-2022 | | | | 375,000 | | | | 378,638 | |
| |
| | | | 1,585,151 | |
| | | | | | | | | | | | | | | | |
| | | | |
Financials: 1.19% | | | | | | | | | | | | | | | | |
| | | | |
| Banks: 0.17% | | | | | | | | | | | | | | | | |
| | | | |
CIT Group Incorporated | | | 5.00 | | | | 8-15-2022 | | | | 305,000 | | | | 316,291 | |
| | | | | | | | | | | | | | | | |
| | | | |
| Consumer Finance: 0.98% | | | | | | | | | | | | | | | | |
| | | | |
Ally Financial Incorporated | | | 3.75 | | | | 11-18-2019 | | | | 530,000 | | | | 530,265 | |
| | | | |
Ford Motor Credit Company LLC | | | 3.34 | | | | 3-18-2021 | | | | 160,000 | | | | 159,308 | |
| | | | |
Ford Motor Credit Company LLC | | | 5.60 | | | | 1-7-2022 | | | | 160,000 | | | | 167,440 | |
| | | | |
Navient Corporation | | | 5.00 | | | | 10-26-2020 | | | | 400,000 | | | | 404,500 | |
| | | | |
Springleaf Finance Corporation | | | 7.75 | | | | 10-1-2021 | | | | 485,000 | | | | 521,375 | |
| |
| | | | 1,782,888 | |
| | | | | | | | | | | | | | | | |
| | | | |
| Real Estate Management & Development: 0.04% | | | | | | | | | | | | | | | | |
| | | | |
Realogy Group LLC 144A | | | 5.25 | | | | 12-1-2021 | | | | 70,000 | | | | 69,125 | |
| | | | | | | | | | | | | | | | |
| | | | |
Health Care: 1.31% | | | | | | | | | | | | | | | | |
| | | | |
| Health Care Providers & Services: 1.09% | | | | | | | | | | | | | | | | |
| | | | |
Acadia Healthcare Company Incorporated | | | 5.13 | | | | 7-1-2022 | | | | 312,000 | | | | 311,610 | |
| | | | |
Centene Corporation | | | 4.75 | | | | 5-15-2022 | | | | 435,000 | | | | 439,224 | |
| | | | |
DaVita HealthCare Partners Incorporated | | | 5.75 | | | | 8-15-2022 | | | | 350,000 | | | | 353,063 | |
| | | | |
MEDNAX Incorporated 144A | | | 5.25 | | | | 12-1-2023 | | | | 235,000 | | | | 234,413 | |
| | | | |
Molina Healthcare Incorporated | | | 5.38 | | | | 11-15-2022 | | | | 200,000 | | | | 203,940 | |
| | | | |
Select Medical Corporation | | | 6.38 | | | | 6-1-2021 | | | | 155,000 | | | | 155,116 | |
| | | | |
Tenet Healthcare Corporation | | | 6.00 | | | | 10-1-2020 | | | | 290,000 | | | | 297,917 | |
| |
| | | | 1,995,283 | |
| | | | | | | | | | | | | | | | |
| | | | |
| Health Care Technology: 0.22% | | | | | | | | | | | | | | | | |
| | | | |
Quintiles IMS Holdings Incorporated 144A | | | 4.88 | | | | 5-15-2023 | | | | 400,000 | | | | 404,500 | |
| | | | | | | | | | | | | | | | |
| | | | |
Industrials: 1.32% | | | | | | | | | | | | | | | | |
| | | | |
| Aerospace & Defense: 0.44% | | | | | | | | | | | | | | | | |
| | | | |
Alcoa Incorporated | | | 6.15 | | | | 8-15-2020 | | | | 350,000 | | | | 359,625 | |
| | | | |
Moog Incorporated 144A | | | 5.25 | | | | 12-1-2022 | | | | 445,000 | | | | 449,450 | |
| |
| | | | 809,075 | |
| | | | | | | | | | | | | | | | |
| | | | |
| Airlines: 0.42% | | | | | | | | | | | | | | | | |
| | | | |
American Airlines Group Company 144A | | | 5.00 | | | | 6-1-2022 | | | | 400,000 | | | | 404,500 | |
| | | | |
United Continental Holdings Incorporated | | | 4.25 | | | | 10-1-2022 | | | | 360,000 | | | | 360,490 | |
| |
| | | | 764,990 | |
| | | | | | | | | | | | | | | | |
The accompanying notes are an integral part of these financial statements.
| | | | |
| 30 | | Wells Fargo Real Return Portfolio | | Portfolio of investments—May 31, 2019 |
| | | | | | | | | | | | | | | | |
| Security name | | Interest rate | | | Maturity date | | | Principal | | | Value | |
| | | | |
| Commercial Services & Supplies: 0.11% | | | | | | | | | | | | | | | | |
| | | | |
ADT Corporation | | | 6.25 | % | | | 10-15-2021 | | | $ | 200,000 | | | $ | 209,000 | |
| | | | | | | | | | | | | | | | |
| | | | |
| Construction & Engineering: 0.10% | | | | | | | | | | | | | | | | |
| | | | |
United Rentals North America Incorporated | | | 4.63 | | | | 7-15-2023 | | | | 180,000 | | | | 183,150 | |
| | | | | | | | | | | | | | | | |
| | | | |
| Industrial Conglomerates: 0.09% | | | | | | | | | | | | | | | | |
| | | | |
General Electric Company | | | 5.55 | | | | 5-4-2020 | | | | 165,000 | | | | 169,006 | |
| | | | | | | | | | | | | | | | |
| | | | |
| Trading Companies & Distributors: 0.16% | | | | | | | | | | | | | | | | |
| | | | |
Aircastle Limited | | | 5.13 | | | | 3-15-2021 | | | | 275,000 | | | | 284,024 | |
| | | | | | | | | | | | | | | | |
| | | | |
Information Technology: 0.89% | | | | | | | | | | | | | | | | |
| | | | |
| Electronic Equipment, Instruments & Components: 0.19% | | | | | | | | | | | | | | | | |
| | | | |
Anixter International Incorporated | | | 5.13 | | | | 10-1-2021 | | | | 350,000 | | | | 356,657 | |
| | | | | | | | | | | | | | | | |
| | | | |
| Software: 0.26% | | | | | | | | | | | | | | | | |
| | | | |
CDK Global Incorporated | | | 3.80 | | | | 10-15-2019 | | | | 110,000 | | | | 110,000 | |
| | | | |
Symantec Corporation | | | 4.20 | | | | 9-15-2020 | | | | 360,000 | | | | 362,172 | |
| |
| | | | 472,172 | |
| | | | | | | | | | | | | | | | |
| | | | |
| Technology Hardware, Storage & Peripherals: 0.44% | | | | | | | | | | | | | | | | |
| | | | |
EMC Corporation | | | 2.65 | | | | 6-1-2020 | | | | 525,000 | | | | 519,335 | |
| | | | |
NCR Corporation | | | 4.63 | | | | 2-15-2021 | | | | 280,000 | | | | 279,216 | |
| |
| | | | 798,551 | |
| | | | | | | | | | | | | | | | |
| | | | |
Materials: 0.91% | | | | | | | | | | | | | | | | |
| | | | |
| Chemicals: 0.17% | | | | | | | | | | | | | | | | |
| | | | |
Chemours Company | | | 6.63 | | | | 5-15-2023 | | | | 305,000 | | | | 303,856 | |
| | | | | | | | | | | | | | | | |
| | | | |
| Containers & Packaging: 0.27% | | | | | | | | | | | | | | | | |
| | | | |
Berry Global Incorporated | | | 5.50 | | | | 5-15-2022 | | | | 70,000 | | | | 70,525 | |
| | | | |
Reynolds Group Holdings | | | 5.75 | | | | 10-15-2020 | | | | 416,716 | | | | 417,362 | |
| |
| | | | 487,887 | |
| | | | | | | | | | | | | | | | |
| | | | |
| Metals & Mining: 0.47% | | | | | | | | | | | | | | | | |
| | | | |
Freeport-McMoRan Copper & Gold Incorporated | | | 3.55 | | | | 3-1-2022 | | | | 525,000 | | | | 513,345 | |
| | | | |
Steel Dynamics Incorporated | | | 5.13 | | | | 10-1-2021 | | | | 351,000 | | | | 351,878 | |
| |
| | | | 865,223 | |
| | | | | | | | | | | | | | | | |
| | | | |
Real Estate: 0.98% | | | | | | | | | | | | | | | | |
| | | | |
| Equity REITs: 0.55% | | | | | | | | | | | | | | | | |
| | | | |
CoreCivic Incorporated | | | 4.13 | | | | 4-1-2020 | | | | 305,000 | | | | 304,619 | |
| | | | |
Equinix Incorporated | | | 5.38 | | | | 1-1-2022 | | | | 195,000 | | | | 199,388 | |
| | | | |
Sabra Health Care LP | | | 5.50 | | | | 2-1-2021 | | | | 483,000 | | | | 489,946 | |
| | | | |
VEREIT Operating Partnership LP | | | 4.13 | | | | 6-1-2021 | | | | 10,000 | | | | 10,223 | |
| |
| | | | 1,004,176 | |
| | | | | | | | | | | | | | | | |
| | | | |
| Real Estate Management & Development: 0.22% | | | | | | | | | | | | | | | | |
| | | | |
Washington Prime Group Incorporated | | | 3.85 | | | | 4-1-2020 | | | | 400,000 | | | | 397,500 | |
| | | | | | | | | | | | | | | | |
The accompanying notes are an integral part of these financial statements.
| | | | | | |
| Portfolio of investments—May 31, 2019 | | Wells Fargo Real Return Portfolio | | | 31 | |
| | | | | | | | | | | | | | | | |
| Security name | | Interest rate | | | Maturity date | | | Principal | | | Value | |
| | | | |
| Real Estate Management & Development: 0.21% | | | | | | | | | | | | | | | | |
| | | | |
Taylor Morrison Communities Incorporated 144A | | | 5.25 | % | | | 4-15-2021 | | | $ | 395,000 | | | $ | 392,038 | |
| | | | | | | | | | | | | | | | |
| | | | |
Utilities: 0.32% | | | | | | | | | | | | | | | | |
| | | | |
| Independent Power & Renewable Electricity Producers: 0.32% | | | | | | | | | | | | | | | | |
| | | | |
TerraForm Power Operating LLC 144A | | | 4.25 | | | | 1-31-2023 | | | | 415,000 | | | | 401,507 | |
| | | | |
Vistra Energy Corporation | | | 7.63 | | | | 11-1-2024 | | | | 175,000 | | | | 184,091 | |
| |
| | | | 585,598 | |
| | | | | | | | | | | | | | | | |
| |
Total Corporate Bonds and Notes (Cost $23,028,198) | | | | 22,926,450 | |
| | | | | | | | | | | | | | | | |
| | | | |
Loans: 3.86% | | | | | | | | | | | | | | | | |
| | | | |
Communication Services: 0.58% | | | | | | | | | | | | | | | | |
| | | | |
| Diversified Telecommunication Services: 0.07% | | | | | | | | | | | | | | | | |
| | | | |
Level 3 Financing Incorporated (1 Month LIBOR +2.25%) ± | | | 4.69 | | | | 2-22-2024 | | | | 129,470 | | | | 127,301 | |
| | | | | | | | | | | | | | | | |
| | | | |
| Entertainment: 0.08% | | | | | | | | | | | | | | | | |
| | | | |
Live Nation Entertainment Incorporated (1 Month LIBOR +1.75%) ± | | | 4.25 | | | | 10-31-2023 | | | | 137,544 | | | | 137,028 | |
| | | | | | | | | | | | | | | | |
| | | | |
| Media: 0.20% | | | | | | | | | | | | | | | | |
| | | | |
CSC Holdings LLC (1 Month LIBOR +2.50%) ± | | | 4.94 | | | | 1-25-2026 | | | | 372,558 | | | | 367,901 | |
| | | | | | | | | | | | | | | | |
| | | | |
| Wireless Telecommunication Services: 0.23% | | | | | | | | | | | | | | | | |
| | | | |
SBA Senior Finance II LLC (1 Month LIBOR +2.00%) ± | | | 4.44 | | | | 4-11-2025 | | | | 435,173 | | | | 428,319 | |
| | | | | | | | | | | | | | | | |
| | | | |
Consumer Discretionary: 0.24% | | | | | | | | | | | | | | | | |
| | | | |
| Auto Components: 0.10% | | | | | | | | | | | | | | | | |
| | | | |
Allison Transmission Incorporated (2 Month LIBOR +2.00%) ± | | | 4.48 | | | | 3-30-2026 | | | | 30,853 | | | | 30,924 | |
| | | | |
Belron Finance US LLC (3 Month LIBOR +2.50%) ±‡ | | | 4.94 | | | | 11-7-2024 | | | | 158,000 | | | | 157,507 | |
| |
| | | | 188,431 | |
| | | | | | | | | | | | | | | | |
| | | | |
| Hotels, Restaurants & Leisure: 0.12% | | | | | | | | | | | | | | | | |
| | | | |
Wyndham Hotels & Resorts Incorporated (1 Month LIBOR +1.75%) ± | | | 4.19 | | | | 5-30-2025 | | | | 218,900 | | | | 217,670 | |
| | | | | | | | | | | | | | | | |
| | | | |
| Household Products: 0.01% | | | | | | | | | | | | | | | | |
| | | | |
The ServiceMaster Company LLC (1 Month LIBOR +2.50%) ± | | | 4.94 | | | | 11-8-2023 | | | | 14,011 | | | | 13,997 | |
| | | | | | | | | | | | | | | | |
| | | | |
| Specialty Retail: 0.01% | | | | | | | | | | | | | | | | |
| | | | |
Sally Beauty Holdings Incorporated (1 Month LIBOR +2.25%) ±‡ | | | 4.69 | | | | 7-5-2024 | | | | 19,398 | | | | 19,301 | |
| | | | | | | | | | | | | | | | |
| | | | |
Consumer Staples: 0.12% | | | | | | | | | | | | | | | | |
| | | | |
| Food Products: 0.12% | | | | | | | | | | | | | | | | |
| | | | |
Post Holdings Incorporated (1 Month LIBOR +2.00%) ± | | | 4.44 | | | | 5-24-2024 | | | | 74,403 | | | | 74,031 | |
| | | | |
Prestige Brands Incorporated (1 Month LIBOR +2.00%) ± | | | 4.44 | | | | 1-26-2024 | | | | 140,558 | | | | 139,241 | |
| |
| | | | 213,272 | |
| | | | | | | | | | | | | | | | |
| | | | |
Financials: 0.42% | | | | | | | | | | | | | | | | |
| | | | |
| Consumer Finance: 0.21% | | | | | | | | | | | | | | | | |
| | | | |
TransUnion LLC (1 Month LIBOR +2.00%) ± | | | 4.44 | | | | 6-19-2025 | | | | 377,150 | | | | 375,804 | |
| | | | | | | | | | | | | | | | |
The accompanying notes are an integral part of these financial statements.
| | | | |
| 32 | | Wells Fargo Real Return Portfolio | | Portfolio of investments—May 31, 2019 |
| | | | | | | | | | | | | | | | |
| Security name | | Interest rate | | | Maturity date | | | Principal | | | Value | |
| | | | |
| Diversified Financial Services: 0.21% | | | | | | | | | | | | | | | | |
| | | | |
Delos Finance SARL (3 Month LIBOR +1.75%) ± | | | 4.35 | % | | | 10-6-2023 | | | $ | 200,000 | | | $ | 199,416 | |
| | | | |
LPL Holdings Incorporated (1 Month LIBOR +2.25%) ± | | | 4.68 | | | | 9-23-2024 | | | | 193,736 | | | | 192,949 | |
| |
| | | | 392,365 | |
| | | | | | | | | | | | | | | | |
| | | | |
Health Care: 0.23% | | | | | | | | | | | | | | | | |
| | | | |
| Health Care Providers & Services: 0.23% | | | | | | | | | | | | | | | | |
| | | | |
HCA Incorporated (1 Month LIBOR +1.75%) ± | | | 4.19 | | | | 3-17-2023 | | | | 370,820 | | | | 370,513 | |
| | | | |
Select Medical Corporation (1 Month LIBOR +2.50%) ±‡ | | | 4.93 | | | | 3-6-2025 | | | | 49,278 | | | | 49,155 | |
| |
| | | | 419,668 | |
| | | | | | | | | | | | | | | | |
| | | | |
Industrials: 1.05% | | | | | | | | | | | | | | | | |
| | | | |
| Airlines: 0.04% | | | | | | | | | | | | | | | | |
| | | | |
United Airlines Incorporated (1 Month LIBOR +1.75%) ± | | | 4.19 | | | | 4-1-2024 | | | | 68,600 | | | | 68,193 | |
| | | | | | | | | | | | | | | | |
| | | | |
| Commercial Services & Supplies: 0.59% | | | | | | | | | | | | | | | | |
| | | | |
Advanced Disposal Services Incorporated (1 Month LIBOR +2.25%) ± | | | 4.64 | | | | 11-10-2023 | | | | 178,578 | | | | 178,131 | |
| | | | |
Aramark Services Incorporated (1 Month LIBOR +1.75%) ± | | | 4.19 | | | | 3-28-2024 | | | | 45,322 | | | | 45,038 | |
| | | | |
Aramark Services Incorporated (1 Month LIBOR +1.75%) ± | | | 4.19 | | | | 3-11-2025 | | | | 364,323 | | | | 362,046 | |
| | | | |
KAR Auction Services Incorporated (3 Month LIBOR +2.25%) ± | | | 4.88 | | | | 3-11-2021 | | | | 149,050 | | | | 148,678 | |
| | | | |
Multi-Color Corporation (1 Month LIBOR +2.00%) ± | | | 4.44 | | | | 10-31-2024 | | | | 177,750 | | | | 177,083 | |
| | | | |
Sensata Technologies BV (2 Month LIBOR +1.75%) ± | | | 4.25 | | | | 10-14-2021 | | | | 157,883 | | | | 157,940 | |
| |
| | | | 1,068,916 | |
| | | | | | | | | | | | | | | | |
| | | | |
| Communications Equipment: 0.30% | | | | | | | | | | | | | | | | |
| | | | |
Charter Communications Operating LLC (1 Month LIBOR +2.00%) ± | | | 4.44 | | | | 4-30-2025 | | | | 380,188 | | | | 379,279 | |
| | | | |
Virgin Media Bristol LLC (1 Month LIBOR +2.50%) ± | | | 4.94 | | | | 1-15-2026 | | | | 175,000 | | | | 173,317 | |
| |
| | | | 552,596 | |
| | | | | | | | | | | | | | | | |
| | | | |
| Machinery: 0.12% | | | | | | | | | | | | | | | | |
| | | | |
Columbus McKinnon Corporation (3 Month LIBOR +2.50%) ±‡ | | | 5.10 | | | | 1-31-2024 | | | | 45,348 | | | | 45,178 | |
| | | | |
RBS Global Incorporated (1 Month LIBOR +2.00%) ± | | | 4.44 | | | | 8-21-2024 | | | | 181,250 | | | | 180,848 | |
| |
| | | | 226,026 | |
| | | | | | | | | | | | | | | | |
| | | | |
Information Technology: 0.38% | | | | | | | | | | | | | | | | |
| | | | |
| Electronic Equipment, Instruments & Components: 0.22% | | | | | | | | | | | | | | | | |
| | | | |
CDW LLC (1 Month LIBOR +1.75%) ± | | | 4.19 | | | | 8-17-2023 | | | | 197,964 | | | | 197,634 | |
| | | | |
Dell Incorporated (1 Month LIBOR +2.00%) ± | | | 4.44 | | | | 9-7-2023 | | | | 40,387 | | | | 40,154 | |
| | | | |
Zebra Technologies Corporation (1 Month LIBOR +1.75%) ± | | | 4.23 | | | | 10-27-2021 | | | | 159,169 | | | | 158,971 | |
| |
| | | | 396,759 | |
| | | | | | | | | | | | | | | | |
| | | | |
| IT Services: 0.04% | | | | | | | | | | | | | | | | |
| | | | |
First Data Corporation (1 Month LIBOR +2.00%) ± | | | 4.44 | | | | 7-8-2022 | | | | 82,643 | | | | 82,495 | |
| | | | | | | | | | | | | | | | |
| | | | |
| Semiconductors & Semiconductor Equipment: 0.12% | | | | | | | | | | | | | | | | |
| | | | |
Micron Technology Incorporated (1 Month LIBOR +1.75%) ± | | | 4.19 | | | | 4-26-2022 | | | | 216,461 | | | | 216,073 | |
| | | | | | | | | | | | | | | | |
The accompanying notes are an integral part of these financial statements.
| | | | | | |
| Portfolio of investments—May 31, 2019 | | Wells Fargo Real Return Portfolio | | | 33 | |
| | | | | | | | | | | | | | | | |
| Security name | | Interest rate | | | Maturity date | | | Principal | | | Value | |
| | | | |
Materials: 0.72% | | | | | | | | | | | | | | | | |
| | | | |
| Chemicals: 0.42% | | | | | | | | | | | | | | | | |
| | | | |
Ashland LLC (1 Month LIBOR +1.75%) ± | | | 4.19 | % | | | 5-17-2024 | | | $ | 276,771 | | | $ | 275,536 | |
| | | | |
Ineos US Finance LLC (1 Month LIBOR +2.00%) ± | | | 4.44 | | | | 3-31-2024 | | | | 494,797 | | | | 487,771 | |
| |
| | | | 763,307 | |
| | | | | | | | | | | | | | | | |
| | | | |
| Containers & Packaging: 0.30% | | | | | | | | | | | | | | | | |
| | | | |
Berry Plastics Group Incorporated (1 Month LIBOR +1.75%) ± | | | 4.20 | | | | 2-8-2020 | | | | 383,629 | | | | 382,563 | |
| | | | |
Berry Plastics Group Incorporated (1 Month LIBOR +1.75%) ± | | | 4.20 | | | | 1-6-2021 | | | | 180,000 | | | | 179,186 | |
| |
| | | | 561,749 | |
| | | | | | | | | | | | | | | | |
| | | | |
Real Estate: 0.12% | | | | | | | | | | | | | | | | |
| | | | |
| Equity REITs: 0.12% | | | | | | | | | | | | | | | | |
| | | | |
MGM Growth Properties LLC (1 Month LIBOR +2.00%) ± | | | 4.44 | | | | 3-21-2025 | | | | 220,707 | | | | 218,915 | |
| | | | | | | | | | | | | | | | |
| |
Total Loans (Cost $7,117,486) | | | | 7,056,086 | |
| | | | | | | | | | | | | | | | |
| | | | |
| | | | | | Expiration date | | | Shares | | | | |
| Participation Notes: 0.03% | | | | | | | | | | | | | | | | |
| | | | |
Financials: 0.03% | | | | | | | | | | | | | | | | |
| | | | |
| Capital Markets: 0.03% | | | | | | | | | | | | | | | | |
| | | | |
UBS AG (Kweichow Moutai Company Limited) †(a) | | | | | | | 8-13-2019 | | | | 377 | | | | 48,592 | |
| | | | | | | | | | | | | | | | |
| |
Total Participation Notes (Cost $37,201) | | | | 48,592 | |
| | | | | | | | | | | | | | | | |
| | | | |
| | | | | | Maturity date | | | Principal | | | | |
| U.S. Treasury Securities: 67.46% | | | | | | | | | | | | | | | | |
| | | | |
TIPS | | | 0.13 | | | | 4-15-2021 | | | $ | 4,054,957 | | | | 4,016,601 | |
| | | | |
TIPS | | | 0.13 | | | | 1-15-2022 | | | | 5,970,446 | | | | 5,931,511 | |
| | | | |
TIPS | | | 0.13 | | | | 4-15-2022 | | | | 2,639,736 | | | | 2,617,510 | |
| | | | |
TIPS | | | 0.13 | | | | 7-15-2022 | | | | 2,929,840 | | | | 2,919,372 | |
| | | | |
TIPS | | | 0.13 | | | | 1-15-2023 | | | | 5,298,119 | | | | 5,257,344 | |
| | | | |
TIPS | | | 0.13 | | | | 7-15-2024 | | | | 6,012,317 | | | | 5,975,282 | |
| | | | |
TIPS | | | 0.13 | | | | 7-15-2026 | | | | 3,601,009 | | | | 3,553,898 | |
| | | | |
TIPS | | | 0.25 | | | | 1-15-2025 | | | | 6,027,309 | | | | 6,000,314 | |
| | | | |
TIPS | | | 0.38 | | | | 7-15-2023 | | | | 4,659,555 | | | | 4,687,353 | |
| | | | |
TIPS | | | 0.38 | | | | 7-15-2025 | | | | 6,025,314 | | | | 6,056,764 | |
| | | | |
TIPS | | | 0.38 | | | | 1-15-2027 | | | | 3,131,247 | | | | 3,133,948 | |
| | | | |
TIPS | | | 0.38 | | | | 7-15-2027 | | | | 3,596,186 | | | | 3,607,152 | |
| | | | |
TIPS | | | 0.50 | | | | 1-15-2028 | | | | 3,293,182 | | | | 3,326,091 | |
| | | | |
TIPS | | | 0.63 | | | | 7-15-2021 | | | | 5,403,407 | | | | 5,436,777 | |
| | | | |
TIPS | | | 0.63 | | | | 4-15-2023 | | | | 4,043,102 | | | | 4,083,096 | |
| | | | |
TIPS | | | 0.63 | | | | 1-15-2024 | | | | 4,478,420 | | | | 4,541,448 | |
| | | | |
TIPS | | | 0.63 | | | | 1-15-2026 | | | | 5,291,199 | | | | 5,387,166 | |
| | | | |
TIPS | | | 0.63 | | | | 2-15-2043 | | | | 2,029,235 | | | | 1,979,848 | |
| | | | |
TIPS | | | 0.75 | | | | 7-15-2028 | | | | 2,243,507 | | | | 2,323,269 | |
| | | | |
TIPS | | | 0.75 | | | | 2-15-2042 | | | | 2,739,813 | | | | 2,764,190 | |
| | | | |
TIPS | | | 0.75 | | | | 2-15-2045 | | | | 2,386,115 | | | | 2,382,049 | |
| | | | |
TIPS | | | 0.88 | | | | 2-15-2047 | | | | 2,006,441 | | | | 2,066,650 | |
The accompanying notes are an integral part of these financial statements.
| | | | |
| 34 | | Wells Fargo Real Return Portfolio | | Portfolio of investments—May 31, 2019 |
| | | | | | | | | | | | | | | | |
| Security name | | Interest rate | | | Maturity date | | | Principal | | | Value | |
| | | | |
U.S. Treasury Securities(continued) | | | | | | | | | | | | | | | | |
| | | | |
TIPS | | | 1.00 | % | | | 2-15-2046 | | | $ | 2,500,137 | | | $ | 2,646,684 | |
| | | | |
TIPS | | | 1.00 | | | | 2-15-2048 | | | | 1,732,114 | | | | 1,841,420 | |
| | | | |
TIPS | | | 1.00 | | | | 2-15-2049 | | | | 702,214 | | | | 750,221 | |
| | | | |
TIPS | | | 1.13 | | | | 1-15-2021 | | | | 1,789,880 | | | | 1,805,187 | |
| | | | |
TIPS | | | 1.38 | | | | 2-15-2044 | | | | 2,214,547 | | | | 2,532,306 | |
| | | | |
TIPS | | | 1.75 | | | | 1-15-2028 | | | | 2,324,063 | | | | 2,591,749 | |
| | | | |
TIPS | | | 2.00 | | | | 1-15-2026 | | | | 2,882,228 | | | | 3,194,960 | |
| | | | |
TIPS | | | 2.13 | | | | 2-15-2040 | | | | 1,223,362 | | | | 1,569,617 | |
| | | | |
TIPS | | | 2.13 | | | | 2-15-2041 | | | | 1,561,532 | | | | 2,019,740 | |
| | | | |
TIPS | | | 2.38 | | | | 1-15-2025 | | | | 3,958,757 | | | | 4,407,409 | |
| | | | |
TIPS | | | 2.38 | | | | 1-15-2027 | | | | 2,136,954 | | | | 2,458,368 | |
| | | | |
TIPS | | | 2.50 | | | | 1-15-2029 | | | | 2,238,138 | | | | 2,679,294 | |
| | | | |
TIPS | | | 3.38 | | | | 4-15-2032 | | | | 902,399 | | | | 1,230,029 | |
| | | | |
TIPS | | | 3.63 | | | | 4-15-2028 | | | | 1,815,602 | | | | 2,322,489 | |
| | | | |
TIPS | | | 3.88 | | | | 4-15-2029 | | | | 2,381,733 | | | | 3,174,907 | |
| |
Total U.S. Treasury Securities (Cost $120,394,007) | | | | 123,272,013 | |
| | | | | | | | | | | | | | | | |
| | | | |
Yankee Corporate Bonds and Notes: 1.46% | | | | | | | | | | | | | | | | |
| | | | |
Communication Services: 0.23% | | | | | | | | | | | | | | | | |
| | | | |
| Media: 0.23% | | | | | | | | | | | | | | | | |
| | | | |
Nielsen Holding and Finance BV 144A | | | 5.50 | | | | 10-1-2021 | | | | 425,000 | | | | 423,938 | |
| | | | | | | | | | | | | | | | |
| | | | |
Consumer Discretionary: 0.25% | | | | | | | | | | | | | | | | |
| | | | |
| Auto Components: 0.25% | | | | | | | | | | | | | | | | |
| | | | |
IHO Verwaltungs GmbH 144A | | | 4.13 | | | | 9-15-2021 | | | | 450,000 | | | | 459,000 | |
| | | | | | | | | | | | | | | | |
| | | | |
Financials: 0.06% | | | | | | | | | | | | | | | | |
| | | | |
| Diversified Financial Services: 0.06% | | | | | | | | | | | | | | | | |
| | | | |
Virgin Media Finance plc | | | 5.25 | | | | 1-15-2021 | | | | 95,000 | | | | 97,584 | |
| | | | | | | | | | | | | | | | |
| | | | |
Health Care: 0.59% | | | | | | | | | | | | | | | | |
| | | | |
| Pharmaceuticals: 0.59% | | | | | | | | | | | | | | | | |
| | | | |
Bausch Health Companies Incorporated 144A | | | 6.50 | | | | 3-15-2022 | | | | 430,000 | | | | 444,603 | |
| | | | |
Teva Pharmaceutical Finance BV | | | 2.20 | | | | 7-21-2021 | | | | 620,000 | | | | 572,074 | |
| | | | |
Teva Pharmaceutical Finance BV | | | 3.65 | | | | 11-10-2021 | | | | 70,000 | | | | 65,450 | |
| |
| | | | 1,082,127 | |
| | | | | | | | | | | | | | | | |
| | | | |
Information Technology: 0.10% | | | | | | | | | | | | | | | | |
| | | | |
| Communications Equipment: 0.10% | | | | | | | | | | | | | | | | |
| | | | |
Nokia OYJ | | | 3.38 | | | | 6-12-2022 | | | | 180,000 | | | | 179,100 | |
| | | | | | | | | | | | | | | | |
| | | | |
Materials: 0.23% | | | | | | | | | | | | | | | | |
| | | | |
| Chemicals: 0.23% | | | | | | | | | | | | | | | | |
| | | | |
Park Aerospace Holdings Company 144A | | | 5.25 | | | | 8-15-2022 | | | | 400,000 | | | | 416,300 | |
| | | | | | | | | | | | | | | | |
| |
Total Yankee Corporate Bonds and Notes (Cost $2,663,243) | | | | 2,658,049 | |
| | | | | | | | | | | | | | | | |
The accompanying notes are an integral part of these financial statements.
| | | | | | |
| Portfolio of investments—May 31, 2019 | | Wells Fargo Real Return Portfolio | | | 35 | |
| | | | | | | | | | | | | | | | |
| Security name | | Yield | | | | | | Shares | | | Value | |
| | | | |
Short-Term Investments: 1.20% | | | | | | | | | | | | | | | | |
| | | | |
Investment Companies: 1.16% | | | | | | | | | | | | | | | | |
| | | | |
Wells Fargo Government Money Market Fund Select Class (l)(u) | | | 2.30 | % | | | | | | | 2,121,643 | | | $ | 2,121,643 | |
| | | | | | | | | | | | | | | | |
| | | | |
| | | | | | Maturity date | | | Principal | | | | |
| U.S. Treasury Securities: 0.04% | | | | | | | | | | | | | | | | |
| | | | |
U.S. Treasury Bill (z)# | | | 1.85 | | | | 6-13-2019 | | | $ | 75,000 | | | | 74,950 | |
| | | | | | | | | | | | | | | | |
| |
Total Short-Term Investments (Cost $2,196,593) | | | | 2,196,593 | |
| | | | | | | | | | | | | | | | |
| | | | | | | | |
| Total investments in securities (Cost $178,417,461) | | | 99.88 | % | | | 182,525,693 | |
| | |
Other assets and liabilities, net | | | 0.12 | | | | 212,598 | |
| | | | | | | | |
| Total net assets | | | 100.00 | % | | $ | 182,738,291 | |
| | | | | | | | |
| † | Non-income-earning security |
| 144A | The security may be resold in transactions exempt from registration, normally to qualified institutional buyers, pursuant to Rule 144A under the Securities Act of 1933. |
| ± | Variable rate investment. The rate shown is the rate in effect at period end. |
| ‡ | Security is valued using significant unobservable inputs. |
| (a) | The security is fair valued in accordance with procedures approved by the Board of Trustees. |
| (l) | The issuer of the security is an affiliated person of the Fund/Portfolio as defined in the Investment Company Act of 1940. |
| (u) | The rate represents the 7-day annualized yield at period end. |
| (z) | Zero coupon security. The rate represents the current yield to maturity. |
| # | All or portion of this security is segregated as collateral for investments in derivative instruments. |
Abbreviations:
| ADR | American depositary receipt |
| LIBOR | London Interbank Offered Rate |
| TIPS | Treasury inflation-protected securities |
| REIT | Real estate investment trust |
Futures Contracts
| | | | | | | | | | | | | | | | | | | | | | | | |
| Description | | Number of contracts | | | Expiration date | | | Notional cost | | | Notional value | | | Unrealized gains | | | Unrealized losses | |
| | | | | | |
Long | | | | | | | | | | | | | | | | | | | | | | | | |
| | | | | | |
2-Year U.S. Treasury Notes | | | 18 | | | | 9-30-2019 | | | $ | 3,843,169 | | | $ | 3,864,093 | | | $ | 20,924 | | | $ | 0 | |
| | | | | | |
Short | | | | | | | | | | | | | | | | | | | | | | | | |
| | | | | | |
U.S. Ultra Bond | | | (6) | | | | 9-19-2019 | | | | (1,028,474 | ) | | | (1,054,688 | ) | | | 0 | | | | (26,214 | ) |
| | | | | | |
5-Year U.S. Treasury Notes | | | (25) | | | | 9-30-2019 | | | | (2,914,804 | ) | | | (2,934,180 | ) | | | 0 | | | | (19,376 | ) |
| | | | | | |
10-Year U.S. Treasury Notes | | | (11) | | | | 9-19-2019 | | | | (1,380,738 | ) | | | (1,394,250 | ) | | | 0 | | | | (13,512 | ) |
| | | | | | | | | | | | | | | | | | | | | | | | |
| | | | | | |
| | | | | | | | | | | | | | | | | | $ | 20,924 | | | $ | (59,102 | ) |
| | | | | | | | | | | | | | | | | | | | | | | | |
The accompanying notes are an integral part of these financial statements.
| | | | |
| 36 | | Wells Fargo Real Return Portfolio | | Portfolio of investments—May 31, 2019 |
Investments in Affiliates
An affiliated investment is an investment in which the Portfolio owns at least 5% of the outstanding voting shares of the issuer or as a result of other relationships, such as the Portfolio and the issuer having the same adviser or investment manager. Transactions with issuers that were either affiliated persons of the Portfolio at the beginning of the period or the end of the period were as follows:
| | | | | | | | | | | | | | | | | | | | | | | | | | | | | | | | | | | | |
| | | Shares,
beginning of
period | | | Shares
purchased | | | Shares sold | | | Shares,
end of
period | | | Net
realized
gains
(losses) | | | Net
change in
unrealized
gains
(losses) | | | Income
from
affiliated
securities | | | Value, end of period | | | % of
net
assets | |
Short-Term Investments | | | | | | | | | | | | | | | | | | | | | | | | | | | | | | | | | | | | |
Investment Companies | | | | | | | | | | | | | | | | | | | | | | | | | | | | | | | | | | | | |
Securities Lending Cash Investments LLC* | | | 1,733,169 | | | | 10,331,456 | | | | 12,064,625 | | | | 0 | | | $ | 17 | | | $ | 0 | | | $ | 16,714 | | | $ | 0 | | | | | |
Wells Fargo Government Money Market Fund Select Class | | | 2,901,798 | | | | 135,872,250 | | | | 136,652,405 | | | | 2,121,643 | | | | 0 | | | | 0 | | | | 38,478 | | | | 2,121,643 | | | | | |
| | | | | | | | | | | | | | | | | | | | | | | | | | | | | | | | | | | | |
| | | | | | | | | |
| | | | | | | | | | | | | | | | | | $ | 17 | | | $ | 0 | | | $ | 55,192 | | | $ | 2,121,643 | | | | 1.16 | % |
| | | | | | | | | | | | | | | | | | | | | | | | | | | | | | | | | | | | |
| | * | No longer held at the end of the period |
The accompanying notes are an integral part of these financial statements.
| | | | | | |
| Statement of assets and liabilities—May 31, 2019 | | Wells Fargo Real Return Portfolio | | | 37 | |
| | | | |
| | | | |
| |
Assets | | | | |
Investments in unaffiliated securities, at value (cost $176,295,818) | | $ | 180,404,050 | |
Investments in affiliated securities, at value (cost $2,121,643) | | | 2,121,643 | |
Foreign currency, at value (cost $1,084) | | | 1,085 | |
Receivable for investments sold | | | 411,514 | |
Receivable for dividends and interest | | | 651,878 | |
Receivable for daily variation margin on open futures contracts | | | 9,703 | |
Receivable for securities lending income, net | | | 465 | |
Prepaid expenses and other assets | | | 8,414 | |
| | | | |
Total assets | | | 183,608,752 | |
| | | | |
| |
Liabilities | | | | |
Payable for investments purchased | | | 779,413 | |
Advisory fee payable | | | 56,312 | |
Payable for daily variation margin on open futures contracts | | | 33,140 | |
Accrued expenses and other liabilities | | | 1,596 | |
| | | | |
Total liabilities | | | 870,461 | |
| | | | |
Total net assets | | $ | 182,738,291 | |
| | | | |
The accompanying notes are an integral part of these financial statements.
| | | | |
| 38 | | Wells Fargo Real Return Portfolio | | Statement of operations—year ended May 31, 2019 |
| | | | |
| | | | |
| |
Investment income | | | | |
Interest | | $ | 4,556,954 | |
Dividends (net of foreign withholding taxes of $23,930) | | | 834,122 | |
Income from affiliated securities | | | 46,331 | |
| | | | |
Total investment income | | | 5,437,407 | |
| | | | |
| |
Expenses | | | | |
Advisory fee | | | 810,584 | |
Custody and accounting fees | | | 14,405 | |
Professional fees | | | 48,754 | |
Shareholder report expenses | | | 2,439 | |
Trustees’ fees and expenses | | | 21,521 | |
Other fees and expenses | | | 8,599 | |
| | | | |
Total expenses | | | 906,302 | |
Less: Fee waivers and/or expense reimbursements | | | (104,527 | ) |
| | | | |
Net expenses | | | 801,775 | |
| | | | |
Net investment income | | | 4,635,632 | |
| | | | |
| |
REALIZED AND UNREALIZED GAINS (LOSSES) ON INVESTMENTS | | | | |
| |
Net realized gains (losses) on: | | | | |
Unaffiliated securities | | | (2,777,496 | ) |
Affiliated securities | | | 17 | |
Futures contracts | | | (167,963 | ) |
| | | | |
Net realized losses on investments | | | (2,945,442 | ) |
| | | | |
| |
Net change in unrealized gains (losses) on: | | | | |
Unaffiliated securities | | | 3,130,436 | |
Futures contracts | | | (33,442 | ) |
| | | | |
Net change in unrealized gains (losses) on investments | | | 3,096,994 | |
| | | | |
Net realized and unrealized gains (losses) on investments | | | 151,552 | |
| | | | |
Net increase in net assets resulting from operations | | $ | 4,787,184 | |
| | | | |
The accompanying notes are an integral part of these financial statements.
| | | | | | |
| Statement of changes in net assets | | Wells Fargo Real Return Portfolio | | | 39 | |
| | | | | | | | |
| | | Year ended
May 31, 2019 | | | Year ended
May 31, 2018 | |
| | |
Operations | | | | | | | | |
Net investment income | | $ | 4,635,632 | | | $ | 2,993,334 | |
Net realized gains (losses) on investments | | | (2,945,442 | ) | | | 261,172 | |
Net change in unrealized gains (losses) on investments | | | 3,096,994 | | | | (1,297,441 | ) |
| | | | |
Net increase in net assets resulting from operations | | | 4,787,184 | | | | 1,957,065 | |
| | | | |
| |
Capital transactions | | | | |
Transactions in investors’ beneficial interests | | | | | | | | |
Contributions | | | 110,886,812 | | | | 92,220,550 | |
Withdrawals | | | (78,081,410 | ) | | | (38,625,765 | ) |
| | | | |
Net increase in net assets resulting from capital transactions | | | 32,805,402 | | | | 53,594,785 | |
| | | | |
Total increase in net assets | | | 37,592,586 | | | | 55,551,850 | |
| | | | |
| |
Net assets | | | | |
Beginning of period | | | 145,145,705 | | | | 89,593,855 | |
| | | | |
End of period | | $ | 182,738,291 | | | $ | 145,145,705 | |
| | | | |
The accompanying notes are an integral part of these financial statements.
| | | | |
| 40 | | Wells Fargo Real Return Portfolio | | Financial highlights |
| | | | | | | | | | | | | | | | | | | | |
| | | Year ended May 31 | |
| | | 2019 | | | 2018 | | | 2017 | | | 2016 | | | 2015 | |
Total return | | | 2.99 | % | | | 1.67 | % | | | 2.65 | % | | | 1.29 | % | | | 1.50 | % |
Ratios to average net assets (annualized) | | | | | | | | | | | | | | | | | | | | |
Gross expenses | | | 0.45 | % | | | 0.48 | % | | | 0.52 | % | | | 0.56 | % | | | 0.57 | % |
Net expenses | | | 0.40 | % | | | 0.41 | % | | | 0.44 | % | | | 0.44 | % | | | 0.44 | % |
Net investment income | | | 2.29 | % | | | 2.40 | % | | | 2.36 | % | | | 1.45 | % | | | 0.89 | % |
Supplemental data | | | | | | | | | | | | | | | | | | | | |
Portfolio turnover rate | | | 39 | % | | | 29 | % | | | 25 | % | | | 29 | % | | | 57 | % |
The accompanying notes are an integral part of these financial statements.
| | | | | | |
| Notes to financial statements | | Wells Fargo Real Return Portfolio | | | 41 | |
1. ORGANIZATION
Wells Fargo Master Trust (the “Trust”), a Delaware statutory trust organized on March 10, 1999, is an open-end management investment company registered under the Investment Company Act of 1940, as amended (the “1940 Act”). As an investment company, the Trust follows the accounting and reporting guidance in Financial Accounting Standards Board (“FASB”) Accounting Standards Codification Topic 946, Financial Services – Investment Companies. These financial statements report on the Wells Fargo Real Return Portfolio (the “Portfolio”) which is a diversified series of the Trust.
2. SIGNIFICANT ACCOUNTING POLICIES
The following significant accounting policies, which are consistently followed in the preparation of the financial statements of the Portfolio, are in conformity with U.S. generally accepted accounting principles which require management to make estimates and assumptions that affect the reported amounts of assets and liabilities, disclosure of contingent assets and liabilities at the date of the financial statements, and the reported amounts of revenues and expenses during the reporting period. Actual results could differ from those estimates.
Securities valuation
All investments are valued each business day as of the close of regular trading on the New York Stock Exchange (generally 4 p.m. Eastern Time), although the Portfolio may deviate from this calculation time under unusual or unexpected circumstances.
Debt securities are valued at the evaluated bid price provided by an independent pricing service (e.g. taking into account various factors, including yields, maturities, or credit ratings) or, if a reliable price is not available, the quoted bid price from an independent broker-dealer.
Equity securities and futures contracts that are listed on a foreign or domestic exchange or market are valued at the official closing price or, if none, the last sales price. If no sale occurs on the principal exchange or market that day, a fair value price will be determined in accordance with the Portfolio’s Valuation Procedures.
Many securities markets and exchanges outside the U.S. close prior to the close of the New York Stock Exchange and therefore may not fully reflect trading or events that occur after the close of the principal exchange in which the foreign securities are traded, but before the close of the New York Stock Exchange. If such trading or events are expected to materially affect the value of such securities, then fair value pricing procedures approved by the Board of Trustees of the Portfolio are applied. These procedures take into account multiple factors including movements in U.S. securities markets after foreign exchanges close. Foreign securities that are fair valued under these procedures are categorized as Level 2 and the application of these procedures may result in transfers between Level 1 and Level 2. Depending on market activity, such fair valuations may be frequent. Such fair value pricing may result in net asset values that are higher or lower than net asset values based on the last reported sales price or latest quoted bid price. On May 31, 2019, such fair value pricing was not used in pricing foreign securities.
Investments in registered open-end investment companies are valued at net asset value. Interests in non-registered investment companies that are redeemable at net asset value are fair valued normally at net asset value.
Investments which are not valued using any of the methods discussed above are valued at their fair value, as determined in good faith by the Board of Trustees. The Board of Trustees has established a Valuation Committee comprised of the Trustees and has delegated to it the authority to take any actions regarding the valuation of portfolio securities that the Valuation Committee deems necessary or appropriate, including determining the fair value of portfolio securities, unless the determination has been delegated to the Wells Fargo Asset Management Pricing Committee at Wells Fargo Funds Management, LLC (“Funds Management”). The Board of Trustees retains the authority to make or ratify any valuation decisions or approve any changes to the Valuation Procedures as it deems appropriate. On a quarterly basis, the Board of Trustees receives reports on any valuation actions taken by the Valuation Committee or the Wells Fargo Asset Management Pricing Committee which may include items for ratification.
Foreign currency translation
The accounting records of the Portfolio are maintained in U.S. dollars. The values of other assets and liabilities denominated in foreign currencies are translated into U.S. dollars at rates provided by an independent foreign currency pricing source at a time each business day specified by the Wells Fargo Asset Management Pricing Committee. Purchases and sales of securities, and income and expenses are converted at the rate of exchange on the respective dates of such transactions. Net realized foreign exchange gains or losses arise from sales of foreign currencies, currency gains or losses realized between the trade and settlement dates on securities transactions, and the difference between the amounts of dividends, interest and foreign withholding taxes recorded and the U.S. dollar equivalent of the amounts actually paid or
| | | | |
| 42 | | Wells Fargo Real Return Portfolio | | Notes to financial statements |
received. Net unrealized foreign exchange gains and losses arise from changes in the fair value of assets and liabilities other than investments in securities resulting from changes in exchange rates. The changes in net assets arising from changes in exchange rates of securities and the changes in net assets resulting from changes in market prices of securities are not separately presented. Such changes are included in net realized and unrealized gains or losses from investments.
Participation notes
The Portfolio may invest in participation notes to gain exposure to securities in certain foreign markets. Participation notes are issued by banks or broker-dealers and are designed to offer a return linked to a particular underlying foreign security. Participation notes involve transaction costs, which may be higher than those applicable to the underlying foreign security. The holder of the participation note is entitled to receive from the bank or broker-dealer, an amount equal to the dividend paid by the issuer of the underlying foreign security; however, the holder is not entitled to the same rights (i.e., voting rights) as an owner of the underlying foreign security. Investments in participation notes involve risks beyond those normally associated with a direct investment in an underlying security. The Portfolio has no rights against the issuer of the underlying foreign security and participation notes expose the Portfolio to counterparty risk in the event the counterparty does not perform. There is also no assurance there will be a secondary trading market for the participation note or that the trading price of the participation note will equal the underlying value of the foreign security that it seeks to replicate.
Securities lending
The Portfolio may lend its securities from time to time in order to earn additional income in the form of fees or interest on securities received as collateral or the investment of any cash received as collateral. When securities are on loan, the Portfolio receives interest or dividends on the securities loaned. The Portfolio receives collateral in the form of cash or securities with a value at least equal to the value of the securities on loan. The value of the loaned securities is determined at the close of each business day and any additional required collateral is delivered to the Portfolio on the next business day. In a securities lending transaction, the net asset value of the Portfolio will be affected by an increase or decrease in the value of the securities loaned and by an increase or decrease in the value of the instrument in which collateral is invested. The amount of securities lending activity undertaken by the Portfolio fluctuates from time to time. In the event of default or bankruptcy by the borrower, the Portfolio may be prevented from recovering the loaned securities or gaining access to the collateral or may experience delays or costs in doing so. In addition, the investment of any cash collateral received may lose all or part of its value. The Portfolio has the right under the lending agreement to recover the securities from the borrower on demand.
The Portfolio lends its securities through an unaffiliated securities lending agent. Cash collateral received in connection with its securities lending transactions is invested in Securities Lending Cash Investments, LLC (the “Securities Lending Fund”). The Securities Lending Fund is exempt from registration under Section 3(c)(7) of the 1940 Act and is managed by Funds Management and is subadvised by Wells Capital Management Incorporated (“WellsCap”), an affiliate of Funds Management and an indirect wholly owned subsidiary of Wells Fargo & Company (“Wells Fargo”). Funds Management receives an advisory fee starting at 0.05% and declining to 0.01% as the average daily net assets of the Securities Lending Fund increase. All of the fees received by Funds Management are paid to WellsCap for its services as subadviser. The Securities Lending Fund seeks to provide a positive return compared to the daily Fed Funds Open Rate by investing in high-quality, U.S. dollar-denominated short-term money market instruments. Securities Lending Fund investments are valued at the evaluated bid price provided by an independent pricing service. Income earned from investment in the Securities Lending Fund (net of fees and rebates), if any, is included in income from affiliated securities on the Statement of Operations.
When-issued transactions
The Portfolio may purchase securities on a forward commitment or when-issued basis. A Portfolio records a when-issued transaction on the trade date and will segregate assets in an amount at least equal in value to the Portfolio’s commitment to purchase when-issued securities. Securities purchased on a when-issued basis are marked-to-market daily and the Portfolio begins earning interest on the settlement date. Losses may arise due to changes in the market value of the underlying securities or if the counterparty does not perform under the contract.
Loans
The Portfolio may invest in direct debt instruments which are interests in amounts owed to lenders by corporate or other borrowers. The loans pay interest at rates which are periodically reset by reference to a base lending rate plus a spread. Investments in loans may be in the form of participations in loans or assignments of all or a portion of loans from third parties. When the Portfolio purchases participations, it generally has no rights to enforce compliance with terms of the loan agreement with the borrower. As a result, the Portfolio assumes the credit risk of both the borrower and the lender that is selling the participation. When the Portfolio purchases assignments from lenders, it acquires direct rights against the borrower on the loan and may enforce compliance by the borrower with the terms of the loan agreement. Loans may include fully funded term loans or unfunded loan commitments, which are contractual obligations for future funding.
| | | | | | |
| Notes to financial statements | | Wells Fargo Real Return Portfolio | | | 43 | |
Futures contracts
The Portfolio is subject to interest rate risk in the normal course of pursuing its investment objectives. Futures contracts are agreements between the Portfolio and a counter party to buy or sell a specific amount of a commodity, financial instrument or currency at specified price and on a specified date. The Portfolio may buy and sell futures contracts in order to gain exposure to, or protect against, changes in interest rates. The primary risks associated with the use of futures contracts are the imperfect correlation between changes in market values of securities held by the Portfolio and the prices of futures contracts, and the possibility of an illiquid market. Futures contracts are generally entered into on a regulated futures exchange and cleared through a clearinghouse associated with the exchange. With futures contracts, there is minimal counter party risk to the Portfolio since futures contracts are exchange traded and the exchange’s clearinghouse, as counterparty to all exchange traded futures, guarantees the futures contracts against default.
Upon entering into a futures contracts, the Portfolio is required to deposit either cash or securities (initial margin) with the broker in an amount equal to a certain percentage of the contract value. Subsequent payments (variation margin) are paid to or from the broker each day equal to the daily changes in the contract value. Such payments are recorded as unrealized gains or losses and, if any, shown as variation margin receivable (payable) in the Statement of Assets and Liabilities. Should the Portfolio fail to make requested variation margin payments, the broker can gain access to the initial margin to satisfy the Portfolio’s payment obligations. When the contracts are closed, a realized gain or loss is recorded in the Statement of Operations.
Inflation-indexed bonds and TIPS
The Portfolio may invest in inflation-indexed bonds, including Treasury inflation-protected securities (TIPS). Inflation-indexed bonds are fixed income securities whose principal value is periodically adjusted according to the rate of inflation. If the index measuring inflation falls, the principal value of inflation-indexed bonds (other than municipal inflation-indexed bonds and certain corporate inflation-indexed bonds) will be adjusted downward, and consequently the interest payable on these securities (calculated with respect to a smaller principal amount) will be reduced. Repayment of the original bond principal upon maturity (as adjusted for inflation) is guaranteed in the case of U.S. Treasury inflation-indexed bonds. For bonds that do not provide a similar guarantee, the adjusted principal value of the bond repaid at maturity may be less than the original principal. The value of inflation-indexed bonds is expected to change in response to changes in real interest rates. Real interest rates are tied to the relationship between nominal interest rates and the rate of inflation. If nominal interest rates increase at a faster rate than inflation, real interest rates may rise, leading to a decrease in value of inflation-indexed bonds. Inflation-indexed bonds, including TIPS, decline in value when real interest rates rise. In certain interest rate environments, such as when real interest rates are rising faster than nominal interest rates, inflation-indexed bonds may experience greater losses than other fixed income securities with similar durations.
Security transactions and income recognition
Securities transactions are recorded on a trade date basis. Realized gains or losses are recorded on the basis of identified cost.
Interest income is accrued daily and bond discounts are accreted and premiums are amortized daily. To the extent debt obligations are placed on non-accrual status, any related interest income may be reduced by writing off interest receivables when the collection of all or a portion of interest has been determined to be doubtful based on consistently applied procedures and the fair value has decreased. If the issuer subsequently resumes interest payments or when the collectability of interest is reasonably assured, the debt obligation is removed from non-accrual status.
Dividend income is recognized on the ex-dividend date, except for certain dividends from foreign securities, which are recorded as soon as the custodian verifies the ex-dividend date. Dividend income from foreign securities is recorded net of foreign taxes withheld where recovery of such taxes is not assured.
Federal and other taxes
The Portfolio is treated as a separate entity for federal income tax purposes. The Portfolio is not required to pay federal income taxes on its net investment income and net capital gains as it is treated as a partnership for federal income tax purposes. All interest, dividends, gains and losses of the Portfolio are deemed to have been “passed through” to the interest holders in proportion to their holdings of the Portfolio regardless of whether such interest, dividends and gains have been distributed by the Portfolio.
The Portfolio’s income tax returns and all financial records supporting those returns for the prior three fiscal years are subject to examination by the federal revenue authority. Management has analyzed the Portfolio’s tax positions taken on federal, state, and foreign tax returns for all open tax years and does not believe that there are any uncertain tax positions that require recognition of a tax liability.
| | | | |
| 44 | | Wells Fargo Real Return Portfolio | | Notes to financial statements |
As of May 31, 2019, the aggregate cost of all investments for federal income tax purposes was $178,698,746 and the unrealized gains (losses) consisted of:
| | | | |
| |
Gross unrealized gains | | $ | 6,376,057 | |
| |
Gross unrealized losses | | | (2,549,110 | ) |
| |
Net unrealized gains | | $ | 3,826,947 | |
3. FAIR VALUATION MEASUREMENTS
Fair value measurements of investments are determined within a framework that has established a fair value hierarchy based upon the various data inputs utilized in determining the value of the Portfolio’s investments. The three-level hierarchy gives the highest priority to unadjusted quoted prices in active markets for identical assets or liabilities (Level 1) and the lowest priority to unobservable inputs (Level 3). The Portfolio’s investments are classified within the fair value hierarchy based on the lowest level of input that is significant to the fair value measurement. The inputs are summarized into three broad levels as follows:
| ∎ | | Level 1 – quoted prices in active markets for identical securities |
| ∎ | | Level 2 – other significant observable inputs (including quoted prices for similar securities, interest rates, prepayment speeds, credit risk, etc.) |
| ∎ | | Level 3 – significant unobservable inputs (including the Portfolio’s own assumptions in determining the fair value of investments) |
The inputs or methodologies used for valuing investments in securities are not necessarily an indication of the risk associated with investing in those securities.
The following is a summary of the inputs used in valuing the Portfolio’s assets and liabilities as of May 31, 2019:
| | | | | | | | | | | | | | | | |
| | | | |
| | | Quoted prices
(Level 1) | | | Other significant
observable inputs
(Level 2) | | | Significant
unobservable inputs
(Level 3) | | | Total | |
| | | | |
Assets | | | | | | | | | | | | | | | | |
Investments in: | | | | | | | | | | | | | | | | |
| | | | |
Common stocks | | | | | | | | | | | | | | | | |
| | | | |
Consumer staples | | $ | 6,324,219 | | | $ | 0 | | | $ | 0 | | | $ | 6,324,219 | |
| | | | |
Energy | | | 4,805,149 | | | | 0 | | | | 0 | | | | 4,805,149 | |
| | | | |
Industrial | | | 80,769 | | | | 0 | | | | 0 | | | | 80,769 | |
| | | | |
Materials | | | 4,626,140 | | | | 0 | | | | 0 | | | | 4,626,140 | |
| | | | |
Real estate | | | 8,531,633 | | | | 0 | | | | 0 | | | | 8,531,633 | |
| | | | |
Corporate bonds and notes | | | 0 | | | | 22,926,450 | | | | 0 | | | | 22,926,450 | |
| | | | |
Loans | | | 0 | | | | 6,784,945 | | | | 271,141 | | | | 7,056,086 | |
| | | | |
Participation notes | | | | | | | | | | | | | | | | |
| | | | |
Financials | | | 0 | | | | 48,592 | | | | 0 | | | | 48,592 | |
| | | | |
U.S. Treasury securities | | | 123,272,013 | | | | 0 | | | | 0 | | | | 123,272,013 | |
| | | | |
Yankee corporate bonds and notes | | | 0 | | | | 2,658,049 | | | | 0 | | | | 2,658,049 | |
| | | | |
Short-term investments | | | | | | | | | | | | | | | | |
| | | | |
Investment companies | | | 2,121,643 | | | | 0 | | | | 0 | | | | 2,121,643 | |
| | | | |
U.S. Treasury securities | | | 74,950 | | | | 0 | | | | 0 | | | | 74,950 | |
| | | | |
| | | 149,836,516 | | | | 32,418,036 | | | | 271,141 | | | | 182,525,693 | |
| | | | |
Futures contracts | | | 20,924 | | | | 0 | | | | 0 | | | | 20,924 | |
| | | | |
Total assets | | | 149,857,440 | | | $ | 32,418,036 | | | $ | 271,141 | | | $ | 182,546,617 | |
Liabilities | | | | | | | | | | | | | | | | |
| | | | |
Futures contracts | | $ | 59,102 | | | $ | 0 | | | $ | 0 | | | $ | 59,102 | |
| | | | |
Total liabilities | | $ | 59,102 | | | $ | 0 | | | $ | 0 | | | $ | 59,102 | |
| | | | | | |
| Notes to financial statements | | Wells Fargo Real Return Portfolio | | | 45 | |
Additional sector, industry or geographic detail is included in the Portfolio of Investments.
Futures contracts are reported at their cumulative unrealized gains (losses) at measurement date as reported in the table following the Portfolio of Investments. For futures contracts, the current day’s variation margin is reported on the Statement of assets and liabilities. All other assets and liabilities are reported at their market value at measurement date.
At May 31, 2019, the Portfolio had no material transfers into/out of Level 3.
4. TRANSACTIONS WITH AFFILIATES
Advisory fee
The Trust has entered into an advisory contract with Funds Management, an indirect wholly owned subsidiary of Wells Fargo. The adviser is responsible for implementing investment policies and guidelines and for supervising the subadviser, who is responsible for day-to-day portfolio management of the Portfolio. Pursuant to the contract, Funds Management is entitled to receive an annual advisory fee at the following annual rate based on the Portfolio’s average daily net assets:
| | |
| |
| Average daily net assets | | Advisory fee |
| |
First $500 million | | 0.400% |
| |
Next $500 million | | 0.375 |
| |
Next $2 billion | | 0.350 |
| |
Next $2 billion | | 0.325 |
| |
Next $5 billion | | 0.300 |
| |
Over $10 billion | | 0.290 |
For the year ended May 31, 2019, the advisory fee was equivalent to an annual rate of 0.40% of the Portfolio’s average daily net assets.
Funds Management has retained the services of a subadviser to provide daily portfolio management to the Portfolio. The fee for subadvisory services is borne by Funds Management. WellsCap is the subadviser to the Portfolio and is entitled to receive a fee from Funds Management at an annual rate starting at 0.28% and declining to 0.18% as the average daily net assets of the Portfolio increase.
Funds Management has voluntarily waived and/or reimbursed advisory fees to reduce the net operating expense ratio of the Portfolio.
Interfund transactions
The Portfolios may purchase or sell portfolio investment securities to certain other Wells Fargo affiliates pursuant to Rule 17a-7 of the 1940 Act and under procedures adopted by the Board of Trustees. The procedures have been designed to ensure that these interfund transactions, which do not incur broker commissions, are effected at current market prices. Pursuant to these procedures, the Portfolio had $252,500 and $0 in interfund purchases and sales, respectively, during the year ended May 31, 2019.
5. INVESTMENT PORTFOLIO TRANSACTIONS
Purchases and sales of investments, excluding short-term securities, for the year ended May 31, 2019 were as follows:
| | | | | | | | | | | | |
Purchases at cost | | | Sales proceeds | |
U.S.
government | | Non-U.S.
government | | | U.S.
government | | | Non-U.S.
government | |
| | | |
| $63,030,117 | | $ | 51,720,717 | | | $ | 40,045,141 | | | $ | 36,382,011 | |
6. DERIVATIVE TRANSACTIONS
During the year ended May 31, 2019, the Portfolio entered into futures contract to speculate on interest rates and to help manage the duration of its portfolio. The Fund had an average notional amount of $3,291,716 in long futures contracts and $8,151,147 in short futures contracts during the year ended May 31, 2019.
The fair value, realized gains or losses and change in unrealized gains or losses, if any, on derivative instruments are reflected in the corresponding financial statement captions.
| | | | |
| 46 | | Wells Fargo Real Return Portfolio | | Notes to financial statements |
7. BORROWINGS
Effective August 28, 2018, the Trust, along with Wells Fargo Variable Trust and Wells Fargo Funds Trust (excluding the money market funds), are parties to a $280,000,000 revolving credit agreement whereby the Portfolio is permitted to use bank borrowings for temporary or emergency purposes, such as to fund shareholder redemption requests. Interest under the credit agreement is charged to the Portfolio based on a borrowing rate equal to the higher of the Federal Funds rate in effect on that day plus 1.25% or the overnight LIBOR rate in effect on that day plus 1.25%. In addition, an annual commitment fee equal to 0.25% of the unused balance is allocated to each participating fund.
For the year ended May 31, 2019, there were no borrowings by the Portfolio under the agreement.
8. INDEMNIFICATION
Under the Trust’s organizational documents, the officers and Trustees have been granted certain indemnification rights against certain liabilities that may arise out of performance of their duties to the Trust. Additionally, in the normal course of business, the Trust may enter into contracts with service providers that contain a variety of indemnification clauses. The Trust’s maximum exposure under these arrangements is dependent on future claims that may be made against the Portfolio and, therefore, cannot be estimated.
9. NEW ACCOUNTING PRONOUNCEMENTS
In August 2018, FASB issued Accounting Standards Update (“ASU”) No. 2018-13, Fair Value Measurement (Topic 820)Disclosure Framework—Changes to the Disclosure Requirements for Fair Value Measurement. ASU 2018-13 updates the disclosure requirements for fair value measurements by modifying or removing certain disclosures and adding certain new disclosures. The amendments are effective for fiscal years, and interim periods within those fiscal years, beginning after December 15, 2019. Early adoption is permitted. Management has adopted the removal and modification of disclosures early, as permitted, and will adopt the additional new disclosures at the effective date.
In March 2017, FASB issued ASU No. 2017-08,Premium Amortization on Purchased Callable Debt Securities. ASU 2017-08 shortens the amortization period for certain callable debt securities held at a premium. The amendments require the premium to be amortized to the earliest call date. The amendments do not require an accounting change for securities held at a discount; the discount continues to be amortized to maturity. ASU 2017-08 is effective for fiscal years beginning after December 15, 2018 and for interim periods within those fiscal years. Management has evaluated the impact of adopting this ASU and determined that it will not result in any material changes to the disclosures in the financial statements.
| | | | | | |
| Report of independent registered public accounting firm | | Wells Fargo Real Return Portfolio | | | 47 | |
TO THE SHAREHOLDERS OF THE PORTFOLIO AND BOARD OF TRUSTEES OF WELLS FARGO MASTER TRUST:
Opinion on the Financial Statements
We have audited the accompanying statement of assets and liabilities of Wells Fargo Real Return Portfolio (the Portfolio), one of the portfolios constituting Wells Fargo Master Trust, including the portfolio of investments, as of May 31, 2019, the related statement of operations for the year then ended, the statements of changes in net assets for each of the years in the two-year period then ended, and the related notes (collectively, the financial statements) and the financial highlights for each of the years in the five-year period then ended. In our opinion, the financial statements and financial highlights present fairly, in all material respects, the financial position of the Portfolio as of May 31, 2019, the results of its operations for the year then ended, the changes in its net assets for each of the years in the two-year period then ended, and the financial highlights for each of the years in the five-year period then ended, in conformity with U.S. generally accepted accounting principles.
Basis for Opinion
These financial statements and financial highlights are the responsibility of the Portfolio’s management. Our responsibility is to express an opinion on these financial statements and financial highlights based on our audits. We are a public accounting firm registered with the Public Company Accounting Oversight Board (United States) (PCAOB) and are required to be independent with respect to the Portfolio in accordance with the U.S. federal securities laws and the applicable rules and regulations of the Securities and Exchange Commission and the PCAOB.
We conducted our audits in accordance with the standards of the PCAOB. Those standards require that we plan and perform the audit to obtain reasonable assurance about whether the financial statements and financial highlights are free of material misstatement, whether due to error or fraud. Our audits included performing procedures to assess the risks of material misstatement of the financial statements and financial highlights, whether due to error or fraud, and performing procedures that respond to those risks. Such procedures included examining, on a test basis, evidence regarding the amounts and disclosures in the financial statements and financial highlights. Such procedures also included confirmation of securities owned as of May 31, 2019, by correspondence with the custodian and brokers, or by other appropriate auditing procedures. Our audits also included evaluating the accounting principles used and significant estimates made by management, as well as evaluating the overall presentation of the financial statements and financial highlights. We believe that our audits provide a reasonable basis for our opinion.
We have not been able to determine the specific year that we began serving as the auditor of one or more Wells Fargo Funds investment companies; however we are aware that we have served as the auditor of one or more Wells Fargo Funds investment companies since at least 1955.
Boston, Massachusetts
July 26, 2019
| | | | |
| 48 | | Wells Fargo Real Return Fund | | Other information (unaudited) |
TAX INFORMATION
For corporate shareholders, pursuant to Section 854 of the Internal Revenue Code, 8.64% of ordinary income dividends qualify for the corporate dividends-received deduction for the fiscal year ended May 31, 2019.
Pursuant to Section 852 of the Internal Revenue Code, $226,455 was designated as a 20% rate gain distribution for the fiscal year ended May 31, 2019.
Pursuant to Section 854 of the Internal Revenue Code, $217,908 of income dividends paid during the fiscal year ended May 31, 2019 has been designated as qualified dividend income (QDI).
For the fiscal year ended May 31, 2019, $1,144,049 has been designated as interest-related dividends for nonresident alien shareholders pursuant to Section 871 of the Internal Revenue Code.
For the fiscal year ended May 31, 2019, $4,201 has been designated as short-term capital gain dividends for nonresident alien shareholders pursuant to Section 871 of the Internal Revenue Code.
For the fiscal year ended May 31, 2019, 60.39% of the ordinary income distributed was derived from interest on U.S. government
PROXY VOTING INFORMATION
A description of the policies and procedures used to determine how to vote proxies relating to portfolio securities is available, upon request, by calling1-800-222-8222, visiting our website atwfam.com, or visiting the SEC website at sec.gov. Information regarding how the proxies related to portfolio securities were voted during the most recent12-month period ended June 30 is available on the website atwfam.com or by visiting the SEC website at sec.gov.
QUARTERLY PORTFOLIO HOLDINGS
The Fund and Portfolio file their complete schedule of portfolio holdings with the SEC for the first and third quarters of each fiscal year on Form N-Q, which is available by visiting the SEC website at sec.gov. Those forms may be reviewed and copied at the SEC’s Public Reference Room in Washington, DC. Information on the operation of the Public Reference Room may be obtained by calling 1-800-SEC-0330.
| | | | | | |
| Other information (unaudited) | | Wells Fargo Real Return Fund | | | 49 | |
BOARD OF TRUSTEES AND OFFICERS
Each of the Trustees and Officers1 listed in the table below acts in identical capacities for each fund in the Wells Fargo family of funds, which consists of 151 mutual funds comprising the Wells Fargo Funds Trust, Wells Fargo Variable Trust, Wells Fargo Master Trust and four closed-end funds (collectively the “Fund Complex”). This table should be read in conjunction with the Prospectus and the Statement of Additional Information2. The mailing address of each Trustee and Officer is 525 Market Street, 12th Floor, San Francisco, CA 94105. Each Trustee and Officer serves an indefinite term, however, each Trustee serves such term until reaching the mandatory retirement age established by the Trustees.
Independent Trustees
| | | | | | |
Name and year of birth | | Position held and length of service* | | Principal occupations during past five years or longer | | Current other public company or
investment company
directorships |
| | | |
William R. Ebsworth (Born 1957) | | Trustee, since 2015 | | Retired. From 1984 to 2013, equities analyst, portfolio manager, research director and chief investment officer at Fidelity Management and Research Company in Boston, Tokyo, and Hong Kong, and retired in 2013 as Chief Investment Officer of Fidelity Strategic Advisers, Inc. where he led a team of investment professionals managing client assets. Prior thereto, Board member of Hong Kong Securities Clearing Co., Hong Kong Options Clearing Corp., the Thailand International Fund, Ltd., Fidelity Investments Life Insurance Company, and Empire Fidelity Investments Life Insurance Company. Audit Committee Chair and Investment Committee Chair of the Vincent Memorial Hospital Endowment (non-profit organization). Mr. Ebsworth is a CFA® charterholder. | | N/A |
| | | |
Jane A. Freeman (Born 1953) | | Trustee, since 2015; Chair Liaison, since 2018 | | Retired. From 2012 to 2014 and 1999 to 2008, Chief Financial Officer of Scientific Learning Corporation. From 2008 to 2012, Ms. Freeman provided consulting services related to strategic business projects. Prior to 1999, Portfolio Manager at Rockefeller & Co. and Scudder, Stevens & Clark. Board member of the Harding Loevner Funds from 1996 to 2014, serving as both Lead Independent Director and chair of the Audit Committee. Board member of the Russell Exchange Traded Funds Trust from 2011 to 2012 and the chair of the Audit Committee. Ms. Freeman is a Board Member of The Ruth Bancroft Garden (non-profit organization). She is also an inactive Chartered Financial Analyst. | | N/A |
| | | |
Isaiah Harris, Jr. (Born 1952) | | Trustee, since 2009; Audit Committee Chairman, since 2019 | | Retired. Chairman of the Board of CIGNA Corporation since 2009, and Director since 2005. From 2003 to 2011, Director of Deluxe Corporation. Prior thereto, President and CEO of BellSouth Advertising and Publishing Corp. from 2005 to 2007, President and CEO of BellSouth Enterprises from 2004 to 2005 and President of BellSouth Consumer Services from 2000 to 2003. Emeritus member of the Iowa State University Foundation Board of Governors. Emeritus Member of the Advisory Board of Iowa State University School of Business. Advisory Board Member, Palm Harbor Academy (private school). Advisory Board Member, Child Evangelism Fellowship (non-profit). Mr. Harris is a certified public accountant (inactive status). | | CIGNA Corporation |
| | | |
Judith M. Johnson (Born 1949) | | Trustee, since 2008; Audit Committee Chairman, from 2009 to 2018 | | Retired. Prior thereto, Chief Executive Officer and Chief Investment Officer of Minneapolis Employees Retirement Fund from 1996 to 2008. Ms. Johnson is an attorney, certified public accountant and a certified managerial accountant. | | N/A |
| | | | |
| 50 | | Wells Fargo Real Return Fund | | Other information (unaudited) |
| | | | | | |
Name and year of birth | | Position held and length of service* | | Principal occupations during past five years or longer | | Current other public company or
investment company
directorships |
| | | |
David F. Larcker (Born 1950) | | Trustee, since 2009 | | James Irvin Miller Professor of Accounting at the Graduate School of Business, Stanford University, Director of the Corporate Governance Research Initiative and Senior Faculty of The Rock Center for Corporate Governance since 2006. From 2005 to 2008, Professor of Accounting at the Graduate School of Business, Stanford University. Prior thereto, Ernst & Young Professor of Accounting at The Wharton School, University of Pennsylvania from 1985 to 2005. | | N/A |
| | | |
Olivia S. Mitchell (Born 1953) | | Trustee, since 2006; Nominating and Governance Committee Chairman, since 2018 | | International Foundation of Employee Benefit Plans Professor, Wharton School of the University of Pennsylvania since 1993. Director of Wharton’s Pension Research Council and Boettner Center on Pensions & Retirement Research, and Research Associate at the National Bureau of Economic Research. Previously, Cornell University Professor from 1978 to 1993. | | N/A |
| | | |
Timothy J. Penny (Born 1951) | | Trustee, since 1996; Chairman, since 2018 | | President and Chief Executive Officer of Southern Minnesota Initiative Foundation, a non-profit organization, since 2007. Member of the Board of Trustees of NorthStar Education Finance, Inc., a non-profit organization, since 2007. | | N/A |
| | | |
James G. Polisson (Born 1959) | | Trustee, since 2018 | | Retired. Chief Marketing Officer, Source (ETF) UK Services, Ltd, from 2015 to 2017. From 2012 to 2015, Principal of The Polisson Group, LLC, a management consulting, corporate advisory and principal investing company. Chief Executive Officer and Managing Director at Russell Investments, Global Exchange Traded Funds from 2010 to 2012. Managing Director of Barclays Global Investors from 1998 to 2010 and Global Chief Marketing Officer for iShares and Barclays Global Investors from 2000 to 2010. Trustee of the San Francisco Mechanics’ Institute, a non-profit organization, from 2013 to 2015. Board member of the Russell Exchange Traded Fund Trust from 2011 to 2012. Director of Barclays Global Investors Holdings Deutschland GmbH from 2006 to 2009. Mr. Polisson is an attorney and has a retired status with the Massachusetts and District of Columbia Bar Associations. | | N/A |
| * | Length of service dates reflect the Trustee’s commencement of service with the Trust’s predecessor entities, where applicable. |
| | | | | | |
| Other information (unaudited) | | Wells Fargo Real Return Fund | | | 51 | |
Officers
| | | | | | |
Name and year of birth | | Position held and
length of service | | Principal occupations during past five years or longer | | |
| | | |
Andrew Owen (Born 1960) | | President, since 2017 | | Executive Vice President of Wells Fargo & Company and Head of Affiliated Managers, Wells Fargo Asset Management, since 2014. In addition, Mr. Owen is currently President, Chief Executive Officer and Director of Wells Fargo Funds Management, LLC since 2017. Prior thereto, Executive Vice President responsible for marketing, investments and product development for Wells Fargo Funds Management, LLC, from 2009 to 2014. | | |
| | | |
Nancy Wiser1 (Born 1967) | | Treasurer, since 2012 | | Executive Vice President of Wells Fargo Funds Management, LLC since 2011. Chief Operating Officer and Chief Compliance Officer at LightBox Capital Management LLC, from 2008 to 2011. | | |
| | | |
Alexander Kymn (Born 1973) | | Secretary and Chief Legal Officer, since 2018 | | Senior Company Counsel of Wells Fargo Bank, N.A. since 2018 (previously Senior Counsel from 2007 to 2018). Vice President of Wells Fargo Funds Management, LLC from 2008 to 2014. | | |
| | | |
| Michael H. Whitaker (Born 1967) | | Chief Compliance Officer, since 2016 | | Senior Vice President and Chief Compliance Officer since 2016. Senior Vice President and Chief Compliance Officer for Fidelity Investments from 2007 to 2016. | | |
| | | |
David Berardi (Born 1975) | | Assistant Treasurer, since 2009 | | Vice President of Wells Fargo Funds Management, LLC since 2009. Vice President of Evergreen Investment Management Company, LLC from 2008 to 2010. Manager of Fund Reporting and Control for Evergreen Investment Management Company, LLC from 2004 to 2010. | | |
| | | |
Jeremy DePalma1 (Born 1974) | | Assistant Treasurer, since 2009 | | Senior Vice President of Wells Fargo Funds Management, LLC since 2009. Senior Vice President of Evergreen Investment Management Company, LLC from 2008 to 2010 and head of the Fund Reporting and Control Team within Fund Administration from 2005 to 2010. | | |
| 1 | Nancy Wiser acts as Treasurer of 65 funds in the Fund Complex. Jeremy DePalma acts as Treasurer of 86 funds and Assistant Treasurer of 65 funds in the Fund Complex. |
| 2 | The Statement of Additional Information includes additional information about the Trustees and is available, without charge, upon request, by calling 1-800-222-8222 or by visiting the website atwfam.com. |
| | | | |
| 52 | | Wells Fargo Real Return Fund | | Other information (unaudited) |
BOARD CONSIDERATION OF INVESTMENT MANAGEMENT, ADVISORY AND SUB-ADVISORY AGREEMENTS:
Wells Fargo Real Return Fund and Wells Fargo Real Return Portfolio
Under the Investment Company Act of 1940 (the “1940 Act”), the Board of Trustees (each, a “Board” and collectively, the “Boards”) of each of Wells Fargo Funds Trust (“Funds Trust”) and Wells Fargo Master Trust (“Master Trust”, and collectively, the “Trusts”) must determine annually whether to approve the continuation of the Trusts’ investment management, advisory and sub-advisory agreements, as applicable. In this regard, at an in-person meeting held on May 21-22, 2019 (the “Meeting”), the Funds Trust Board, all the members of which have no direct or indirect interest in the investment management agreement and are not “interested persons” of the Trusts, as defined in the 1940 Act (the “Independent Trustees”), reviewed and approved for Wells Fargo Real Return Fund (the “Gateway Fund”) an investment management agreement (the “Gateway Fund Management Agreement”) with Wells Fargo Funds Management, LLC (“Funds Management”).
At the Meeting, the Master Trust Board, all the members of which have no direct or indirect interest in the investment advisory and sub-advisory agreements and are Independent Trustees, reviewed and approved: (i) an investment advisory agreement (the “Master Portfolio Advisory Agreement”) with Funds Management for Wells Fargo Real Return Portfolio, a portfolio of Master Trust (the “Master Portfolio”); and (ii) an investment sub-advisory agreement (the “Sub-Advisory Agreement”) with Wells Capital Management Incorporated (the “Sub-Adviser”).
The Gateway Fund and the Master Portfolio are collectively referred to as the “Funds.” The Gateway Fund Management Agreement, the Master Portfolio Advisory Agreement and the Sub-Advisory Agreement are collectively referred to as the “Advisory Agreements.”
The Gateway Fund is a gateway feeder fund that invest substantially all of its assets in the Master Portfolio. The Master Portfolio has a substantially similar investment objective and substantially similar investment strategies to the Gateway Fund. Information provided to the Boards regarding the Gateway Fund is also applicable to the Master Portfolio, as relevant.
At the Meeting, the Boards considered the factors and reached the conclusions described below relating to the selection of Funds Management and the Sub-Adviser and the approval of the Advisory Agreements. Prior to the Meeting, including at an in-person meeting in April 2019, the Trustees conferred extensively among themselves and with representatives of Funds Management about these matters. Also, the Boards have adopted a team-based approach, with each team consisting of a sub-set of Trustees, to assist the full Boards in the discharge of their duties in reviewing investment performance and other matters throughout the year. The Independent Trustees were assisted in their evaluation of the Advisory Agreements by independent legal counsel, from whom they received separate legal advice and with whom they met separately.
In providing information to the Boards, Funds Management and the Sub-Adviser were guided by a detailed set of requests for information submitted to them by independent legal counsel on behalf of the Independent Trustees at the start of the Boards’ annual contract renewal process earlier in 2019. In considering and approving the Advisory Agreements, the Trustees considered the information they believed relevant, including but not limited to the information discussed below. The Boards considered not only the specific information presented in connection with the Meeting, but also the knowledge gained over time through interaction with Funds Management and the Sub-Adviser about various topics. In this regard, the Boards reviewed reports of Funds Management at each of their quarterly meetings, which included, among other things, portfolio reviews and investment performance reports. In addition, the Boards and the teams mentioned above confer with portfolio managers at various times throughout the year. The Boards did not identify any particular information or consideration that was all-important or controlling, and each individual Trustee may have attributed different weights to various factors.
After its deliberations, the Funds Trust Board unanimously approved the continuation of the Gateway Fund Management Agreement for a one-year period. Additionally, after its deliberations, the Master Trust Board unanimously approved the continuation of the Master Portfolio Advisory Agreement and the Sub-Advisory Agreement, each for a one-year term. The Boards also determined that the compensation payable to Funds Management and the Sub-Adviser was reasonable. The Boards considered the approval of the Advisory Agreements for the Funds as part of their consideration of agreements for funds across the complex, but their approvals were made on a fund-by-fund basis. The following summarizes a number of important, but not necessarily all, factors considered by the Boards in support of their approvals.
Nature, extent and quality of services
The Boards received and considered various information regarding the nature, extent and quality of services provided to the Funds by Funds Management and the Sub-Adviser under the Advisory Agreements. This information included a description
| | | | | | |
| Other information (unaudited) | | Wells Fargo Real Return Fund | | | 53 | |
of the investment advisory services and Fund-level administrative services, as well as, among other things, a summary of the background and experience of senior management of Wells Fargo Asset Management (“WFAM”), of which Funds Management and the Sub-Adviser are a part, a summary of investments made in the business of WFAM, a summary of certain organizational and personnel changes involving Funds Management and the Sub-Adviser, and a description of Funds Management’s and the Sub-Adviser’s business continuity planning programs and of their approaches to data privacy and cybersecurity. The Boards received and reviewed information about Funds Management’s role as administrator of the Funds’ liquidity risk management program. The Boards also considered the qualifications, background, tenure and responsibilities of each of the portfolio managers primarily responsible for the day-to-day portfolio management of the Funds.
The Boards evaluated the ability of Funds Management and the Sub-Adviser to attract and retain qualified investment professionals, including research, advisory and supervisory personnel. The Boards further considered the compliance programs and compliance records of Funds Management and the Sub-Adviser. In addition, the Boards took into account the full range of services provided to the Funds by Funds Management and its affiliates.
Fund investment performance and expenses
The Boards considered the investment performance results for each of the Funds over various time periods ended December 31, 2018. The Boards considered these results in comparison to the investment performance of funds in a universe that was determined by Broadridge Inc. (“Broadridge”) to be similar to the Gateway Fund (the “Universe”), and in comparison to the Gateway Fund’s benchmark index and to other comparative data. Broadridge is an independent provider of investment company data. The Boards received a description of the methodology used by Broadridge to select the mutual funds in the performance Universe. The Funds Trust Board noted that the investment performance of the Gateway Fund (Administrator Class) was higher than the average investment performance of its Universe for the three-, five- and ten-year periods under review, but lower than the average investment performance of its Universe for the one-year period under review. The Funds Trust Board also noted that the investment performance of the Gateway Fund was higher than its benchmark, the Bloomberg Barclays U.S. TIPS Index, for the three- and five-year periods under review, but lower than its benchmark for the one- and ten-year periods under review.
The Master Trust Board took note of the investment performance of the Master Portfolio in the context of reviewing the investment performance of the Gateway Fund.
The Funds Trust Board received information concerning, and discussed factors contributing to, the underperformance of the Gateway Fund relative to the Universe and benchmark for the one-year period identified above. The Funds Trust Board took note of the explanations for the relative underperformance during this period, including with respect to investment decisions and market factors that affected the Gateway Fund’s investment performance.
The Funds Trust Board also received and considered information regarding the Gateway Fund’s net operating expense ratios, which include fees and expenses of the Master Portfolio, and their various components, including actual management fees assessed at the Gateway Fund and Master Portfolio levels, custodian and other non-management fees, and Rule 12b-1 and non-Rule 12b-1 shareholder service fees. The Funds Trust Board considered these ratios in comparison to the median ratios of funds in class-specific expense groups that were determined by Broadridge to be similar to the Gateway Fund (the “Groups”). The Funds Trust Board received a description of the methodology used by Broadridge to select the mutual funds in the expense Groups and an explanation of how funds comprising expense groups and their expense ratios may vary from year-to-year. Based on the Broadridge reports, the Funds Trust Board noted that the net operating expense ratios of the Gateway Fund were lower than or equal to the median net operating expense ratios of its expense Groups for each share class.
With respect to the Master Portfolio, the Master Trust Board reviewed the fee rates that are payable to Funds Management for investment advisory services (as discussed below), which are the only fees charged at the Master Portfolio level, relative to a corresponding expense Group.
The Boards took into account the Funds’ investment performance and expense information provided to them among the factors considered in deciding to re-approve the Advisory Agreements.
Investment management, advisory and sub-advisory fee rates
The Funds Trust Board noted that Funds Management receives no advisory fees from the Gateway Fund as long as the Gateway Fund continues to invest all (or substantially all) of its assets in a single master portfolio. If the Gateway Fund were to change its investment structure so that it began investing in two or more master portfolios (a fund-of-funds), Funds Management would be entitled to receive an annual fee of 0.25% of the Gateway Fund’s average daily net assets for providing investment advisory services to the Gateway Fund, including allocating the Gateway Fund’s assets to the Master Portfolio.
| | | | |
| 54 | | Wells Fargo Real Return Fund | | Other information (unaudited) |
The Funds Trust Board reviewed and considered the contractual fee rates that are payable by the Gateway Fund to Funds Management under the Gateway Fund Management Agreement, as well as the contractual fee rates payable by the Gateway Fund to Funds Management for class-level administrative services under a Class-Level Administration Agreement, which include, among other things, class-level transfer agency and sub-transfer agency costs (collectively, the “Management Rates”).
The Master Trust Board reviewed and considered the contractual investment advisory fee rate that is payable by the Master Portfolio to Funds Management for investment advisory services under the Master Portfolio Advisory Agreement (the “Advisory Agreement Rate”). The Master Trust Board also reviewed and considered the contractual investmentsub-advisory fee rate that is payable by Funds Management to the Sub-Adviser for investment sub-advisory services (the “Sub-Advisory Agreement Rate”).
Among other information reviewed by the Funds Trust Board was a comparison of the Gateway Fund’s Management Rate, which include the advisory fees paid at the Master Portfolio level, with the average contractual investment management fee rates of funds in the expense Groups at a common asset level as well as transfer agency costs of the funds in the expense Groups. The Funds Trust Board noted that the Management Rates of the Gateway Fund were lower than or in range of the sum of these average rates for the Gateway Fund’s expense Groups for all share classes.
The Master Trust Board reviewed a comparison of the Advisory Agreement Rate of the Master Portfolio with those of other funds in the Master Portfolio’s expense Group at a common asset level. The Master Trust Board noted that the Advisory Agreement Rate of the Master Portfolio was in range of the median rate for the Master Portfolio’s expense Group.
The Master Trust Board also received and considered information about the portions of the total management fees that were retained by Funds Management after payment of the fees to the Sub-Adviser for sub-advisory services. In assessing the reasonableness of these amounts, the Master Trust Board received and evaluated information about the nature and extent of responsibilities retained and risks assumed by Funds Management and not delegated to or assumed by the Sub-Adviser, and about Funds Management’s on-going oversight services. Given the affiliation between Funds Management and the Sub-Adviser, the Master Trust Board ascribed limited relevance to the allocation of fees between them.
Based on its consideration of the factors and information it deemed relevant, including those described here, the Funds Trust Board determined that the compensation payable to Funds Management under the Gateway Fund Management Agreement was reasonable, and the Master Trust Board determined that the compensation payable to Funds Management under the Master Portfolio Advisory Agreement and to the Sub-Adviser under the Sub-Advisory Agreement was reasonable.
Profitability
The Boards received and considered information concerning the profitability of Funds Management, as well as the profitability of both WFAM and Wells Fargo & Co. (“Wells Fargo”) from providing services to the fund family as a whole. The Boards noted that the Sub-Adviser’s profitability information with respect to providing services to the Master Portfolio and other funds in the family was subsumed in the WFAM and Wells Fargo profitability analysis.
Funds Management reported on the methodologies and estimates used in calculating profitability, including a description of the methodology used to allocate certain expenses. Among other things, the Boards noted that the levels of profitability reported on a fund-by-fund basis varied widely, depending on factors such as the size, type and age of fund. Based on its review, the Boards did not deem the profits reported by Funds Management, WFAM or Wells Fargo from services provided to the Funds to be at a level that would prevent the Boards from approving the continuation of the Advisory Agreements.
Economies of scale
The Boards received and considered information about the potential for Funds Management to experience economies of scale in the provision of management services to the Funds, the difficulties of calculating economies of scale at an individual fund level, and the extent to which potential scale benefits are shared with shareholders. The Boards noted the existence of breakpoints in the Master Portfolio’s advisory fee structure and the Gateway Fund’s management fee structure, which operate generally to reduce the Funds’ expense ratios as the Funds grow in size. The Boards considered that, in addition to management fee breakpoints, Funds Management shares potential economies of scale from its management business in a variety of ways, including through fee waiver and expense reimbursement arrangements, services that benefit shareholders, competitive management fee rates set at the outset without regard to breakpoints, and investments in the business intended to enhance services available to shareholders.
| | | | | | |
| Other information (unaudited) | | Wells Fargo Real Return Fund | | | 55 | |
The Boards concluded that Funds Management’s arrangements with respect to each Fund, including contractual breakpoints, constituted a reasonable approach to sharing potential economies of scale with the Funds and their shareholders.
Other benefits to Funds Management and the Sub-Adviser
The Boards received and considered information regarding potential “fall-out” or ancillary benefits received by Funds Management and its affiliates, including the Sub-Adviser, as a result of their relationships with the Funds. Ancillary benefits could include, among others, benefits directly attributable to other relationships with the Funds and benefits potentially derived from an increase in Funds Management’s and the Sub-Adviser’s business as a result of their relationships with the Funds. The Boards noted that various affiliates of Funds Management may receive distribution-related fees, shareholder servicing payments and sub-transfer agency fees in respect of shares sold or held through them and services provided.
The Boards also reviewed information about soft dollar credits earned and utilized by the Sub-Adviser, fees earned by Funds Management and the Sub-Adviser from managing a private investment vehicle for the fund family’s securities lending collateral, and commissions earned by an affiliated broker from portfolio transactions.
Based on their consideration of the factors and information they deemed relevant, including those described here, the Boards did not find that any ancillary benefits received by Funds Management and its affiliates, including the Sub-Adviser, were unreasonable.
Conclusion
At the Meeting, after considering the above-described factors and based on its deliberations and its evaluation of the information described above, the Funds Trust Board unanimously approved the continuation of the Gateway Fund Management Agreement for a one-year period. Additionally, after its deliberations, the Master Trust Board unanimously approved the continuation of the Master Portfolio Advisory Agreement and the Sub-Advisory Agreement for a one-year term. The Boards also determined that the compensation payable to Funds Management and the Sub-Adviser was reasonable.
This page is intentionally left blank.

For more information
More information about Wells Fargo Funds is available free upon request. To obtain literature, please write, visit the Fund’s website, or call:
Wells Fargo Funds
P.O. Box 219967
Kansas City, MO 64121-9967
Website: wfam.com
Individual investors: 1-800-222-8222
Retail investment professionals: 1-888-877-9275
Institutional investment professionals:
1-866-765-0778
This report and the financial statements contained herein are submitted for the general information of the shareholders of the Fund. If this report is used for promotional purposes, distribution of the report must be accompanied or preceded by a current prospectus. Before investing, please consider the investment objectives, risks, charges, and expenses of the investment. For a current prospectus and, if available, a summary prospectus, containing this information, call1-800-222-8222 or visit the Fund’s website atwfam.com. Read the prospectus carefully before you invest or send money.
Wells Fargo Asset Management (WFAM) is the trade name for certain investment advisory/management firms owned by Wells Fargo & Company. These firms include but are not limited to Wells Capital Management Incorporated and Wells Fargo Funds Management, LLC. Certain products managed by WFAM entities are distributed by Wells Fargo Funds Distributor, LLC (a broker-dealer and Member FINRA).
This material is for general informational and educational purposes only and is NOT intended to provide investment advice or a recommendation of any kind—including a recommendation for any specific investment, strategy, or plan.
INVESTMENT PRODUCTS: NOT FDIC INSURED ◾ NO BANK GUARANTEE ◾ MAY LOSE VALUE
© 2019 Wells Fargo Funds Management, LLC. All rights reserved.
| | |
 | | 403202 07-19 A288/AR288 05-19 |
(a) As of the end of the period covered by the report, Wells Fargo Funds Trust has adopted a code of ethics that applies to its President and Treasurer. A copy of the code of ethics is filed as an exhibit to this FormN-CSR.
(c) During the period covered by this report, there were no amendments to the provisions of the code of ethics adopted in Item 2(a) above.
(d) During the period covered by this report, there were no implicit or explicit waivers to the provisions of the code of ethics adopted in Item 2(a) above.
| ITEM 3. | AUDIT COMMITTEE FINANCIAL EXPERT |
The Board of Trustees of Wells Fargo Funds Trust has determined that Judith Johnson is an audit committee financial expert, as defined in Item 3 of FormN-CSR. Mrs. Johnson is independent for purposes of Item 3 of FormN-CSR.
| ITEM 4. | PRINCIPAL ACCOUNTANT FEES AND SERVICES |
(a), (b), (c), (d) The following table presents aggregate fees billed in each of the last two fiscal years for services rendered to the Registrant by the Registrant’s principal accountant. These fees were billed to the registrant and were approved by the Registrant’s audit committee.
| | | | | | | | |
| | | Fiscal
year ended
May 31, 2019* | | | Fiscal
year ended
May 31, 2018 | |
Audit fees | | $ | 309,400 | | | $ | 499,226 | |
Audit-related fees | | | — | | | | — | |
Tax fees(1) | | | 63,480 | | | | 102,845 | |
All other fees | | | — | | | | — | |
| | | | | | | | |
| | $ | 372,880 | | | $ | 602,071 | |
| | | | | | | | |
| * | Amounts for the year ended May 31, 2019 exclude the Dynamic Target Date Funds which no longer have a May 31 fiscal year end. |
| (1) | Tax fees consist of fees for tax compliance, tax advice, tax planning and excise tax. |
(e) The Chairman of the Audit Committees is authorized topre-approve: (1) audit services for the mutual funds of Wells Fargo Funds Trust;(2) non-audit tax or compliance consulting or training services provided to the Funds by the independent auditors (“Auditors”) if the fees for any particular engagement are not anticipated to exceed $50,000; and(3) non-audit tax or compliance consulting or training services provided by the Auditors to a Fund’s investment adviser and its controlling entities (wherepre-approval is required because the engagement relates directly to the operations and financial reporting of the Fund) if the fee to the Auditors for any particular engagement is not anticipated to exceed $50,000. For any suchpre-approval sought from the Chairman, Management shall prepare a brief description of the proposed services. If the Chairman approves of such service, he or she shall sign the statement prepared by Management. Such written statement shall be presented to the full Committees at their next regularly scheduled meetings.
(f) Not applicable
(g) Not applicable
(h) Not applicable
| ITEM 5. | AUDIT COMMITTEE OF LISTED REGISTRANTS |
Not applicable.
A Portfolio of Investments for each series of Wells Fargo Funds Trust is included as part of the report to shareholders filed under Item 1 of this Form.
| ITEM 7. | DISCLOSURE OF PROXY VOTING POLICIES AND PROCEDURES FORCLOSED-END MANAGEMENT INVESTMENT COMPANIES |
Not applicable.
| ITEM 8. | PORTFOLIO MANAGERS OFCLOSED-END MANAGEMENT INVESTMENT COMPANIES |
Not applicable.
| ITEM 9. | PURCHASES OF EQUITY SECURITIES BYCLOSED-END MANAGEMENT INVESTMENT COMPANY AND AFFILIATED PURCHASERS |
Not applicable.
| ITEM 10. | SUBMISSION OF MATTERS TO A VOTE OF SECURITY HOLDERS |
There have been no material changes to the procedures by which shareholders may recommend nominees to the registrant’s Board of Trustees that have been implemented since the registrant’s last provided disclosure in response to the requirements of this Item.
| ITEM 11. | CONTROLS AND PROCEDURES |
(a) The President and Treasurer have concluded that the Wells Fargo Funds Trust disclosure controls and procedures (as defined inRule 30a-3(c) under the Investment Company Act of 1940) provide reasonable assurances that material information relating to the registrant is made known to them by the appropriate persons based on their evaluation of these controls and procedures as of a date within 90 days of the filing of this report.
(b) There were no significant changes in the registrant’s internal controls over financial reporting (as defined in Rule30a-3(d) under the Investment Company Act of 1940) that occurred during the most recent fiscal quarter of the period covered by this report that materially affected, or is reasonably likely to materially affect, the registrant’s internal control over financial reporting.
| ITEM 12. | DISCLOSURES OF SECURITIES LENDING ACTIVITES FORCLOSED-END MANAGEMENT INVESTMENT COMPANIES |
Not applicable.
(a)(1) Code of Ethics pursuant to Item 2 of FormN-CSR is filed and attached hereto as Exhibit COE.
(a)(2) Certification pursuant to Rule30a-2(a) under the Investment Company Act of 1940 (17 CFR270.30a-2(a)) is filed and attached hereto as Exhibit 99.CERT.
(b) Certification pursuant to Rule30a-2(b) under the Investment Company Act of 1940 (17 CFR270.30a-2(b)) is filed and attached hereto as Exhibit 99.906CERT.
SIGNATURES
Pursuant to the requirements of the Securities Exchange Act of 1934 and the Investment Company Act of 1940, the registrant has duly caused this report to be signed on its behalf by the undersigned, thereunto duly authorized.
| | |
| Wells Fargo Funds Trust |
| |
| By: | | |
| | /s/ Andrew Owen |
| |
| | Andrew Owen |
| | President |
| |
| Date: | | July 26, 2019 |
Pursuant to the requirements of the Securities Exchange Act of 1934 and the Investment Company Act of 1940, this report has been signed below by the following persons on behalf of the registrant and in the capacities and on the date indicated.
| | |
| Wells Fargo Funds Trust |
| |
| By: | | |
| | /s/ Andrew Owen |
| |
| | Andrew Owen |
| | President |
| |
| Date: | | July 26, 2019 |
| |
| By: | | |
| | /s/ Nancy Wiser |
| |
| | Nancy Wiser |
| | Treasurer |
| |
| Date: | | July 26, 2019 |
| |
| By: | | |
| | /s/ Jeremy DePalma |
| |
| | Jeremy DePalma |
| | Treasurer |
| |
| Date: | | July 26, 2019 |