
UNITED STATES
SECURITIES AND EXCHANGE COMMISSION
Washington, D.C. 20549
FORMN-CSR
CERTIFIED SHAREHOLDER REPORT OF REGISTERED
MANAGEMENT INVESTMENT COMPANIES
Investment Company Act file number:811-09253
Wells Fargo Funds Trust
(Exact name of registrant as specified in charter)
525 Market St., San Francisco, CA 94105
(Address of principal executive offices) (Zip code)
Alexander Kymn
Wells Fargo Funds Management, LLC
525 Market St., San Francisco, CA 94105
(Name and address of agent for service)
Registrant’s telephone number, including area code:800-222-8222
Date of fiscal year end: July 31
Registrant is making a filing for 11 of its series:
Wells Fargo Capital Growth Fund, Wells Fargo Disciplined U.S. Core Fund, Wells Fargo Endeavor Select Fund, Wells Fargo Growth Fund, Wells Fargo Classic Value Fund, Wells Fargo Large Cap Core Fund, Wells Fargo Large Cap Growth Fund, Wells Fargo Large Company Value Fund, Wells Fargo Low Volatility U.S. Equity Fund, Wells Fargo Omega Growth Fund, and Wells Fargo Premier Large Company Growth Fund.
Date of reporting period: July 31, 2019
| ITEM 1. | REPORT TO STOCKHOLDERS |
Annual Report
July 31, 2019
Wells Fargo Capital Growth Fund
Beginning on January 1, 2021, as permitted by new regulations adopted by the Securities and Exchange Commission, paper copies of the Wells Fargo Funds’ annual and semi-annual shareholder reports issued after this date will no longer be sent by mail, unless you specifically request paper copies of the reports. Instead, the reports will be made available on the Funds’ website, and you will be notified by mail each time a report is posted and provided with a website address to access the report.
If you already elected to receive shareholder reports electronically, you will not be affected by this change and you need not take any action. You may elect to receive shareholder reports and other communications from the Fund electronically at any time by contacting your financial intermediary (such as a broker-dealer or bank) or, if you are a direct investor, by calling1-800-222-8222 or by enrolling at wellsfargo.com/advantagedelivery.
You may elect to receive all future reports in paper free of charge. If you invest through a financial intermediary, you can contact your financial intermediary to request that you continue to receive paper copies of your shareholder reports; if you invest directly with the Fund, you can call 1-800-222-8222. Your election to receive reports in paper will apply to all Wells Fargo Funds held in your account with your financial intermediary or, if you are a direct investor, to all Wells Fargo Funds that you hold.
|
|
|
Reduce clutter. Save trees. |
Sign up for electronic delivery of prospectuses and shareholder reports atwellsfargo.com/advantagedelivery |
The views expressed and any forward-looking statements are as of July 31, 2019, unless otherwise noted, and are those of the Fund managers and/or Wells Fargo Asset Management. Discussions of individual securities, or the markets generally, or any Wells Fargo Fund are not intended as individual recommendations. Future events or results may vary significantly from those expressed in any forward-looking statements. The views expressed are subject to change at any time in response to changing circumstances in the market. Wells Fargo Asset Management and the Fund disclaim any obligation to publicly update or revise any views expressed or forward-looking statements.
INVESTMENT PRODUCTS: NOT FDIC INSURED ◾ NO BANK GUARANTEE ◾ MAY LOSE VALUE
Wells Fargo Capital Growth Fund | 1
Letter to shareholders (unaudited)

Andrew Owen
President
Wells Fargo Funds
Dear Shareholder:
We are pleased to offer you this annual report for the Wells Fargo Capital Growth Fund for the 12-month period that ended July 31, 2019. After the first six months of the period yielded either low-single-digit or negative investment returns, U.S. stock and global bond investors generally enjoyed a recovery during the final six months amid continued concerns about global economic growth, international trade, geopolitical tensions, and bouts of market volatility. These concerns negatively influenced international equity markets.
For the period, U.S. stocks, based on the S&P 500 Index,1 gained 7.99% and international stocks, as measured by the MSCI ACWI ex USA Index (Net),2 fell 2.27%. The MSCI EM Index (Net)3 slipped 2.18%. For bond investors, the Bloomberg Barclays U.S. Aggregate Bond Index4 added 8.08%, the Bloomberg Barclays Global Aggregate ex-USD Index5 added 3.74%, the Bloomberg Barclays Municipal Bond Index6 gained 7.31%, and the ICE BofAML U.S. High Yield Index7 added 6.94%.
Entering the fourth quarter of 2018, economic data was encouraging.
Domestic equity investors entered the fourth quarter of 2018 with reasons to be optimistic. The U.S. Bureau of Economic Analysis reported second-quarter annualized gross domestic product (GDP) growth of 4.2%. Hiring improved. Unemployment declined. Consumer confidence and spending increased. Third-quarter corporate earnings reports were generally positive. U.S. trade negotiations with Mexico and Canada progressed. The U.S. Federal Reserve (Fed) raised the federal funds rate by 25 basis points (bps; 100 bps equal 1.00%) to a target range of between 2.00% and 2.25% in September 2018, one of four rate increases implemented during the calendar year, a sign of its confidence in the strength of the U.S. economy.
Investors in international markets were not as confident. Tensions between the U.S. and China increased. The U.S. imposed $200 billion in tariffs on Chinese goods. China reacted with $60 billion in tariffs on U.S. goods. Economic growth in China caused concern. In September 2018, international investors began to factor a number of disconcerting economic and business data points: lower July manufacturers’ and industrial orders in Germany; falling purchasing manager index numbers for August from the United Kingdom, China, and India; and declining household spending for August in Japan. Taken together, the data fed growing concerns over slowing global growth that unnerved investors.
| 1 | The S&P 500 Index consists of 500 stocks chosen for market size, liquidity, and industry group representation. It is a market-value-weighted index with each stock’s weight in the index proportionate to its market value. You cannot invest directly in an index. |
| 2 | The Morgan Stanley Capital International (MSCI) All Country World Index (ACWI) ex USA Index (Net) is a free-float-adjusted market-capitalization weighted index that is designed to measure the equity market performance of developed and emerging markets, excluding the U.S. Source: MSCI. MSCI makes no express or implied warranties or representations and shall have no liability whatsoever with respect to any MSCI data contained herein. The MSCI data may not be further redistributed or used as a basis for other indices or any securities or financial products. This report is not approved, reviewed, or produced by MSCI. You cannot invest directly in an index. |
| 3 | The MSCI Emerging Markets (EM) Index (Net) is a free-float-adjusted market-capitalization-weighted index that is designed to measure the equity market performance of emerging markets. You cannot invest directly in an index. |
| 4 | The Bloomberg Barclays U.S. Aggregate Bond Index is a broad-based benchmark that measures the investment-grade, U.S. dollar-denominated, fixed-rate taxable bond market, including Treasuries, government-related and corporate securities, mortgage-backed securities (agency fixed-rate and hybrid adjustable-rate mortgage pass-throughs), asset-backed securities, and commercial mortgage-backed securities. You cannot invest directly in an index. |
| 5 | The Bloomberg Barclays Global Aggregate ex-USD Index is an unmanaged index that provides a broad-based measure of the global investment-grade fixed-income markets excluding the U.S. dollar-denominated debt market. You cannot invest directly in an index. |
| 6 | The Bloomberg Barclays Municipal Bond Index is an unmanaged index composed of long-term tax-exempt bonds with a minimum credit rating of Baa. You cannot invest directly in an index. |
| 7 | The ICE BofAML U.S. High Yield Index is a market-capitalization-weighted index of domestic and Yankee high-yield bonds. The index tracks the performance of high-yield securities traded in the U.S. bond market. You cannot invest directly in an index. Copyright 2019. ICE Data Indices, LLC. All rights reserved. |
2 | Wells Fargo Capital Growth Fund
Letter to shareholders (unaudited)
Global markets suffered during the fourth quarter of 2018.
November’s U.S. midterm elections shifted control of the House of Representatives from Republicans to Democrats, presaging partisan clashes that followed and caused uncertainty among investors. Third-quarter U.S. GDP was announced at an annualized 3.4% rate, lower than the second-quarter rate. Brexit efforts stalled ahead of the March 2019 deadline. The People’s Bank of China cut reserve requirement ratios, accelerated infrastructure spending, and cut taxes even as the value of the yuan declined to low levels last seen in 2008. A partial U.S. government shutdown driven by partisan policy disputes extended into January.
The combination of news in the U.S. and generally weak economic indicators outside of the U.S. caused investors to seek safe havens. December’s S&P 500 Index performance was the worst since 1931. Globally, fixed-income investments fared better than stocks during the last two months of the year. The Fed increased the federal funds rate by 25 bps in December to a target range of between 2.25% and 2.50%.
The market climbs a wall of worry.
Investors entered 2019 with reasons to be concerned. Investment returns appeared to reaffirm the adage that markets climb a wall of worry. The S&P 500 Index gained 8.01% for the month of January, the best monthly performance in 30 years. Returns for the MSCI ACWI ex USA Index (Net), the Bloomberg Barclays U.S. Aggregate Bond Index, and the Bloomberg Barclays Global Aggregate ex-USD Index also were positive.
In February 2019, signs of slowing global growth grew more ominous. The Bureau of Economic Analysis announced fourth-quarter 2018 GDP grew at an annualized 2.2% rate, down from the levels of the prior two quarters. In a February report, the Bank of England forecasted the slowest growth since the financial crisis for 2019. China and the U.S. continued to wrangle over trade issues.
By the end of March 2019, a combination of dovish Fed sentiment and steady, if not spectacular, U.S. economic and business metrics reinforced investors’ confidence. Monthly job creation data and corporate profits, while less consistent than during 2018, were solid. China announced a roughly $300 billion stimulus package through tax and fee cuts intended to reinvigorate economic growth. During April 2019, favorable sentiment found additional support in reports of sustained low inflation, solid employment data, and first-quarter U.S. GDP of an annualized rate of 3.2%.
During May 2019, markets tumbled on mixed investment signals. In the U.S., partisan wrangling ramped up as Democrats and Republicans set their sights on 2020 presidential politics. The U.K.’s Brexit caused Prime Minister Theresa May to resign. The European Commission downgraded the 2019 growth forecast to 1.2%. The U.S. increased tariffs on products from China, China responded, and then talks broke down. President Donald Trump threatened to turn his foreign policy tariff tool to Mexico over immigration issues.
As had been the case during most of 2019 to date, just as the investment horizon appeared to darken, sentiment turned and U.S. equity markets gained during June and July. The gains, primarily driven by geopolitical and monetary policy events, pushed equity markets to new highs.
President Mario Draghi of the European Central Bank said that if the outlook doesn’t improve, the bank will cut rates or buy more assets to prop up inflation. President Trump backed off of tariff threats against Mexico and China. In the U.S., the Fed implemented a 0.25% federal funds rate cut in July 2019.
“December’s S&P 500 Index performance was the worst since 1931.”
“The S&P 500 Index gained 8.01% for the month of January, the best monthly performance in 30 years.”
Wells Fargo Capital Growth Fund | 3
Letter to shareholders (unaudited)
Later in July 2019, the U.S. reversed course and threatened to impose higher tariffs on China’s exports after talks failed. China responded with tariff threats of its own and devalued the renminbi, a move that roiled global markets. Despite the accommodative approach of central banks, investors continued to have misgivings about the durability of economic growth globally and a pervasively cautious tone influenced the world’s equity and fixed-income markets.
Don’t let short-term uncertainty derail long-term investment goals.
Periods of investment uncertainty can present challenges, but experience has taught us that maintaining long-term investment goals can be an effective way to plan for the future. To help you create a sound strategy based on your personal goals and risk tolerance, Wells Fargo Funds offers more than 100 mutual funds spanning a wide range of asset classes and investment styles. Although diversification cannot guarantee an investment profit or prevent losses, we believe it can be an effective way to manage investment risk and potentially smooth out overall portfolio performance. We encourage investors to know their investments and to understand that appropriate levels of risk-taking may unlock opportunities.
Thank you for choosing to invest with Wells Fargo Funds. We appreciate your confidence in us and remain committed to helping you meet your financial needs.
Sincerely,

Andrew Owen
President
Wells Fargo Funds
|
|
|
For further information about your Fund, contact your investment professional, visit our website at wfam.com, or call us directly at1-800-222-8222. |
4 | Wells Fargo Capital Growth Fund
This page is intentionally left blank.
Performance highlights (unaudited)
Investment objective
The Fund seeks long-term capital appreciation.
Manager
Wells Fargo Funds Management, LLC
Subadviser
Wells Capital Management Incorporated
Portfolio managers
Michael T. Smith, CFA®‡
Christopher J. Warner, CFA®‡
Average annual total returns (%) as of July 31, 2019
| | | | | | | | | | | | | | | | | | | | | | | | | | | | | | | | | | |
| | | | |
| | | | | Including sales charge | | | Excluding sales charge | | | Expense ratios1 (%) | |
| | | | | | | | | |
| | | Inception date | | 1 year | | | 5 year | | | 10 year | | | 1 year | | | 5 year | | | 10 year | | | Gross | | | Net2 | |
| | | | | | | | | | |
| Class A (WFCGX) | | 7-31-2007 | | | 7.92 | | | | 12.66 | | | | 13.97 | | | | 14.50 | | | | 14.00 | | | | 14.64 | | | | 1.27 | | | | 1.12 | |
| | | | | | | | | | |
| Class C (WFCCX) | | 7-31-2007 | | | 12.74 | | | | 13.17 | | | | 13.80 | | | | 13.74 | | | | 13.17 | | | | 13.80 | | | | 2.02 | | | | 1.87 | |
| | | | | | | | | | |
| Class R6 (WFCRX)3 | | 11-30-2012 | | | – | | | | – | | | | – | | | | 15.03 | | | | 14.50 | | | | 15.18 | | | | 0.84 | | | | 0.61 | |
| | | | | | | | | | |
| Administrator Class (WFCDX) | | 6-30-2003 | | | – | | | | – | | | | – | | | | 14.63 | | | | 14.17 | | | | 14.87 | | | | 1.19 | | | | 0.95 | |
| | | | | | | | | | |
| Institutional Class (WWCIX) | | 4-8-2005 | | | – | | | | – | | | | – | | | | 14.89 | | | | 14.43 | | | | 15.15 | | | | 0.94 | | | | 0.71 | |
| | | | | | | | | | |
| Russell 1000® Growth Index4 | | – | | | – | | | | – | | | | – | | | | 10.82 | | | | 14.25 | | | | 15.74 | | | | – | | | | – | |
Figures quoted represent past performance, which is no guarantee of future results, and do not reflect taxes that a shareholder may pay on fund distributions or the redemption of fund shares. Investment return and principal value of an investment will fluctuate so that an investor’s shares, when redeemed, may be worth more or less than their original cost. Performance shown without sales charges would be lower if sales charges were reflected. Current performance may be lower or higher than the performance data quoted, which assumes the reinvestment of dividends and capital gains. Currentmonth-end performance is available on the Fund’s website, wfam.com.
Index returns do not include transaction costs associated with buying and selling securities, any mutual fund fees or expenses, or any taxes. It is not possible to invest directly in an index.
For Class A shares, the maximumfront-end sales charge is 5.75%. For Class C shares, the maximum contingent deferred sales charge is 1.00%. Performance including a contingent deferred sales charge assumes the sales charge for the corresponding time period. Class R6, Administrator Class, and Institutional Class shares are sold without afront-end sales charge or contingent deferred sales charge.
Stock values fluctuate in response to the activities of individual companies and general market and economic conditions. Certain investment strategies tend to increase the total risk of an investment (relative to the broader market). The Fund is exposed to foreign investment risk. Consult the Fund’s prospectus for additional information on these and other risks.
Please see footnotes on page 7.
6 | Wells Fargo Capital Growth Fund
Performance highlights (unaudited)
|
|
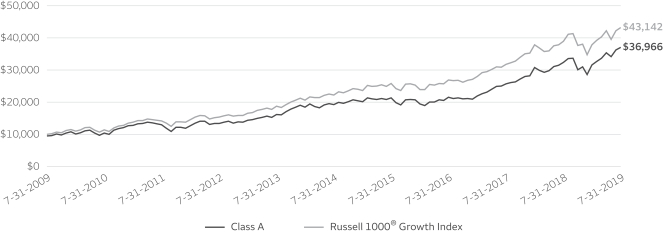
| Growth of $10,000 investment as of July 31, 20195 |
|
|
| ‡ | CFA® and Chartered Financial Analyst® are trademarks owned by CFA Institute. |
| 1 | Reflects the expense ratios as stated in the most recent prospectuses, which include the impact of 0.01% in acquired fund fees and expenses. The expense ratios shown are subject to change and may differ from the annualized expense ratios shown in the financial highlights of this report. |
| 2 | The manager has contractually committed through November 30, 2019, to waive fees and/or reimburse expenses to the extent necessary to cap the expenses of each class after fee waivers at 1.11% for Class A, 1.86% for Class C, 0.60% for Class R6, 0.94% for Administrator Class, and 0.70% for Institutional Class. Brokerage commissions, stamp duty fees, interest, taxes, acquired fund fees and expenses (if any), and extraordinary expenses are excluded from the expense cap. Prior to or after the commitment expiration date, the cap may be increased or the commitment to maintain the cap may be terminated only with the approval of the Board of Trustees. Without this cap, the Fund’s returns would have been lower. The expense ratio paid by an investor is the net expense ratio (the total annual fund operating expenses after fee waivers) as stated in the prospectuses. |
| 3 | Historical performance shown for Class R6 shares prior to their inception reflects the performance of Institutional Class shares, and includes the higher expenses applicable to Institutional Class shares. If these expenses had not been included, returns for Class R6 shares would be higher. |
| 4 | The Russell 1000®Growth Index measures the performance of those Russell 1000 companies with higher price/book ratios and higher forecasted growth values. You cannot invest directly in an index. |
| 5 | The chart compares the performance of Class A shares for the most recent ten years with the Russell 1000®Growth Index. The chart assumes a hypothetical investment of $10,000 in Class A shares and reflects all operating expenses and assumes the maximum initial sales charge of 5.75%. |
| 6 | The ten largest holdings, excluding cash, cash equivalents and any money market funds, are calculated based on the value of the investments divided by total net assets of the Fund. Holdings are subject to change and may have changed since the date specified. |
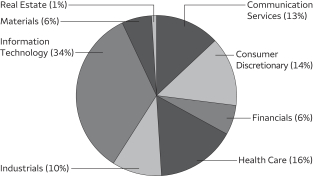
| 7 | Amounts are calculated based on the total long-term investments of the Fund. These amounts are subject to change and may have changed since the date specified. |
Wells Fargo Capital Growth Fund | 7
Performance highlights (unaudited)
MANAGER’S DISCUSSION
Fund highlights
| ∎ | | The Fund outperformed its benchmark, the Russell 1000® Growth Index, for the12-month period that ended July 31, 2019. |
| ∎ | | Stock selection in information technology (IT) and select names within the consumer discretionary sector were key contributors to performance. |
| ∎ | | Stock selection within the communication services sector detracted from performance. |
Volatility reemerged during the middle of the12-month period.
While global stock markets posted positive returns during the12-month period, it was not an entirely smooth ride for investors. Optimism for synchronized global economic growth eventually evolved into a decidedlyrisk-off market driven by escalating uncertainty and investor fear. Mounting geopolitical concerns, rising domestic interest rates, concern over the stability of select emerging market economies, and escalating fears of a trade war between the U.S. and China contributed to market volatility. The Federal Reserve’s shift toward a neutral interest rate policy stance—and eventual easing—helped ease concerns and provided a tailwind for equities to reach new highs by the end of the period.
Despite increased uncertainty, we have not significantly repositioned the Fund. We continue to emphasize companies with a secular rather than a cyclical growth profile. The Fund remains positioned toward companies with high visibility of earnings growth and those positioned on the right side of change. We believe this strategy will prove beneficial should volatility levels remain elevated.
| | | | |
|
| Ten largest holdings(%) as of July 31, 20196 | |
| | |
Microsoft Corporation | | | 8.51 | |
| | |
Amazon.com Incorporated | | | 6.36 | |
| | |
Alphabet Incorporated Class A | | | 5.82 | |
| | |
Visa Incorporated Class A | | | 5.23 | |
| | |
UnitedHealth Group Incorporated | | | 3.96 | |
| | |
Union Pacific Corporation | | | 2.96 | |
| | |
The Home Depot Incorporated | | | 2.91 | |
| | |
Waste Connections Incorporated | | | 2.84 | |
| | |
Total System Services Incorporated | | | 2.46 | |
| | |
Fiserv Incorporated | | | 2.46 | |
The Fund’s IT and select consumer discretionary holdings contributed to relative performance.
Within the IT sector, the Fund’s position in Shopify Incorporated contributed to returns. Shopify, a provider ofe-commerce solutions fordirect-to-consumer brands such as Tesla Motors, Incorporated, traditionally focused on small andmedium-size businesses but is currently penetrating larger businesses via its Shopify Plus offering. Shopify benefits from its customers’ growth by processing payments for smaller customers and charging a fee on each transaction for larger customers. The company’s two vectors of growth—new customers and growth of existing customers—drove higher-than-expected sales and earnings.
Within consumer discretionary, MercadoLibre, Incorporated, was additive to returns. MercadoLibre is the dominant Latin Americane-commerce provider and owns MercadoPago, the leading online payment solution in Latin America. Increasede-commerce penetration in MercadoLibre’s key markets, such as Brazil and Argentina, drove higher sales growth. Customers’ use of MercadoPago both on and off MercadoLibre’se-commerce marketplace provided an additional avenue of growth for the company.
Please see footnotes on page 7.
8 | Wells Fargo Capital Growth Fund
Performance highlights (unaudited)
|
|
| Sector distribution as of July 31, 20197 |
|
 |
Stock selection in the communication services sector detracted from performance.
Within the communication services sector, our position in Alphabet Incorporated detracted from the Fund’s performance. Alphabet is the parent company of Google and other services such as Android, Ads, and YouTube. Shares sold off after the company reported deceleration in revenue growth and other key metrics. Management stated the deceleration resulted from changes implemented at YouTube in 2018 to improve the user experience. These initiatives resulted in more difficult comparisons for 2019. We have continued to hold the position in Alphabet as it is the leader in online advertising and is positioned to potentially benefit from global growth in web usage.
Also within communication services, shares of Activision Blizzard, Incorporated, weighed on returns over the past year. Activision, like many video game software firms, is benefiting from rising digital downloads andin-game monetization opportunities. However, increased competition from both themega-hit “Fortnite,” as well as other publishers, pressured the shares. Activision’s “Call of Duty” franchise continues to perform extremely well, but the potential for greater competition to the company’s other titles caused the company to lower guidance for 2019.
The macro outlook is likely to remain muted, but opportunities abound to find companies on the right side of change.
As we look toward the remainder of 2019, we believe the U.S. economy is likely to avoid recessionary pressures and continue to expand, albeit at a slower rate. We believe, however, the collision of slowing economic growth caused partly by structural challenges such as demographics and elevated debt levels and accelerating change driven by technological innovation creates exciting investment opportunities.
Innovative companies on the right side of change have been benefiting from this environment in which true secular growth is becoming increasingly scarce. In our view,right-side-of-change companies may produce predictable earnings and cash flows into the future—characteristics hard to find in the current economy. In a world starved of growth, investors tend to seek out that which is more certain and reward these attributes with a scarcity premium.
However, we also believe the market will become even more selective regarding profitability. In our view, thescarcity-of-growth narrative is playing out, and valuations have expanded meaningfully for many companies levered to new technologies. We think it is essential to stay laser-focused on finding innovative companies on the right side of change while remaining vigilant about risk management.
Please see footnotes on page 7.
Wells Fargo Capital Growth Fund | 9
Fund expenses (unaudited)
As a shareholder of the Fund, you incur two types of costs: (1) transaction costs, including sales charges (loads) on purchase payments and contingent deferred sales charges (if any) on redemptions and (2) ongoing costs, including management fees, distribution(12b-1) and/or shareholder servicing fees, and other Fund expenses. This example is intended to help you understand your ongoing costs (in dollars) of investing in the Fund and to compare these costs with the ongoing costs of investing in other mutual funds.
The example is based on an investment of $1,000 invested at the beginning of thesix-month period and held for the entire period from February 1, 2019 to July 31, 2019.
Actual expenses
The “Actual” line of the table below provides information about actual account values and actual expenses. You may use the information in this line, together with the amount you invested, to estimate the expenses that you paid over the period. Simply divide your account value by $1,000 (for example, an $8,600 account value divided by $1,000 = 8.6), then multiply the result by the number in the “Actual” line under the heading entitled “Expenses paid during period” for your applicable class of shares to estimate the expenses you paid on your account during this period.
Hypothetical example for comparison purposes
The “Hypothetical” line of the table below provides information about hypothetical account values and hypothetical expenses based on the Fund’s actual expense ratio and an assumed rate of return of 5% per year before expenses, which is not the Fund’s actual return. The hypothetical account values and expenses may not be used to estimate the actual ending account balance or expenses you paid for the period. You may use this information to compare the ongoing costs of investing in the Fund and other funds. To do so, compare this 5% hypothetical example with the 5% hypothetical examples that appear in the shareholder reports of the other funds.
Please note that the expenses shown in the table are meant to highlight your ongoing costs only and do not reflect any transactional costs, such as sales charges (loads) and contingent deferred sales charges. Therefore, the “Hypothetical” line of the table is useful in comparing ongoing costs only and will not help you determine the relative total costs of owning different funds. In addition, if these transactional costs were included, your costs would have been higher.
| | | | | | | | | | | | | | | | |
| | | Beginning
account value
2-1-2019 | | | Ending
account value
7-31-2019 | | | Expenses
paid during
the period¹ | | | Annualized net
expense ratio | |
| | | | | |
Class A | | | | | | | | | | | | | | | | |
| | | | |
Actual | | $ | 1,000.00 | | | $ | 1,172.24 | | | $ | 5.71 | | | | 1.06 | % |
| | | | |
Hypothetical (5% return before expenses) | | $ | 1,000.00 | | | $ | 1,019.54 | | | $ | 5.31 | | | | 1.06 | % |
| | | | | |
Class C | | | | | | | | | | | | | | | | |
| | | | |
Actual | | $ | 1,000.00 | | | $ | 1,168.19 | | | $ | 9.73 | | | | 1.81 | % |
| | | | |
Hypothetical (5% return before expenses) | | $ | 1,000.00 | | | $ | 1,015.82 | | | $ | 9.05 | | | | 1.81 | % |
| | | | | |
Class R6 | | | | | | | | | | | | | | | | |
| | | | |
Actual | | $ | 1,000.00 | | | $ | 1,175.02 | | | $ | 3.24 | | | | 0.60 | % |
| | | | |
Hypothetical (5% return before expenses) | | $ | 1,000.00 | | | $ | 1,021.82 | | | $ | 3.01 | | | | 0.60 | % |
| | | | | |
Administrator Class | | | | | | | | | | | | | | | | |
| | | | |
Actual | | $ | 1,000.00 | | | $ | 1,172.84 | | | $ | 5.06 | | | | 0.94 | % |
| | | | |
Hypothetical (5% return before expenses) | | $ | 1,000.00 | | | $ | 1,020.13 | | | $ | 4.71 | | | | 0.94 | % |
| | | | | |
Institutional Class | | | | | | | | | | | | | | | | |
| | | | |
Actual | | $ | 1,000.00 | | | $ | 1,173.50 | | | $ | 3.77 | | | | 0.70 | % |
| | | | |
Hypothetical (5% return before expenses) | | $ | 1,000.00 | | | $ | 1,021.32 | | | $ | 3.51 | | | | 0.70 | % |
| 1 | Expenses paid is equal to the annualized net expense ratio of each class multiplied by the average account value over the period, multiplied by the number of days in the most recent fiscal half-year divided by the number of days in the fiscal year (to reflect theone-half-year period). |
10 | Wells Fargo Capital Growth Fund
Portfolio of investments—July 31, 2019
| | | | | | | | | | | | | | | | |
| | | | | | | | | Shares | | | Value | |
| Common Stocks: 96.26% | | | | | | | | | | | | | | | | |
| | | | |
Communication Services: 12.72% | | | | | | | | | | | | | | | | |
| | | | |
| Entertainment: 3.88% | | | | | | | | | | | | |
| | | | |
Activision Blizzard Incorporated | | | | | | | | | | | 20,000 | | | $ | 974,800 | |
| | | | |
Netflix Incorporated † | | | | | | | | | | | 5,200 | | | | 1,679,548 | |
| | | | |
Nintendo Company Limited ADR | | | | | | | | | | | 31,450 | | | | 1,452,676 | |
| | | | |
| | | | | | | | | | | | | | | 4,107,024 | |
| | | | | | | | | | | | | | | | |
| | | | |
| Interactive Media & Services: 8.84% | | | | | | | | | | | | |
| | | | |
Alphabet Incorporated Class A † | | | | | | | | | | | 5,058 | | | | 6,161,656 | |
| | | | |
IAC Corporation † | | | | | | | | | | | 7,300 | | | | 1,745,065 | |
| | | | |
Tencent Holdings Limited ADR | | | | | | | | | | | 31,050 | | | | 1,443,825 | |
| | | | |
| | | | | | | | | | | | | | | 9,350,546 | |
| | | | | | | | | | | | | | | | |
| | | | |
Consumer Discretionary: 13.63% | | | | | | | | | | | | | | | | |
| | | | |
| Auto Components: 1.49% | | | | | | | | | | | | |
| | | | |
Aptiv plc | | | | | | | | | | | 18,050 | | | | 1,582,083 | |
| | | | | | | | | | | | | | | | |
| | | | |
| Automobiles: 1.37% | | | | | | | | | | | | |
| | | | |
Ferrari NV | | | | | | | | | | | 9,000 | | | | 1,449,720 | |
| | | | | | | | | | | | | | | | |
| | | | |
| Internet & Direct Marketing Retail: 7.86% | | | | | | | | | | | | |
| | | | |
Amazon.com Incorporated † | | | | | | | | | | | 3,605 | | | | 6,729,742 | |
| | | | |
MercadoLibre Incorporated † | | | | | | | | | | | 2,550 | | | | 1,584,621 | |
| | | | |
| | | | | | | | | | | | | | | 8,314,363 | |
| | | | | | | | | | | | | | | | |
| | | | |
| Specialty Retail: 2.91% | | | | | | | | | | | | |
| | | | |
The Home Depot Incorporated | | | | | | | | | | | 14,433 | | | | 3,084,188 | |
| | | | | | | | | | | | | | | | |
| | | | |
Financials: 5.44% | | | | | | | | | | | | | | | | |
| | | | |
| Capital Markets: 5.44% | | | | | | | | | | | | |
| | | | |
Intercontinental Exchange Incorporated | | | | | | | | | | | 26,375 | | | | 2,317,308 | |
| | | | |
Raymond James Financial Incorporated | | | | | | | | | | | 19,700 | | | | 1,589,199 | |
| | | | |
S&P Global Incorporated | | | | | | | | | | | 7,563 | | | | 1,852,557 | |
| | | | |
| | | | | | | | | | | | | | | 5,759,064 | |
| | | | | | | | | | | | | | | | |
| | | | |
Health Care: 15.28% | | | | | | | | | | | | | | | | |
| | | | |
| Biotechnology: 1.01% | | | | | | | | | | | | |
| | | | |
Exact Sciences Corporation † | | | | | | | | | | | 9,300 | | | | 1,070,523 | |
| | | | | | | | | | | | | | | | |
| | | | |
| Health Care Equipment & Supplies: 9.09% | | | | | | | | | | | | |
| | | | |
Alcon Incorporated † | | | | | | | | | | | 22,000 | | | | 1,292,500 | |
| | | | |
Align Technology Incorporated † | | | | | | | | | | | 4,800 | | | | 1,003,584 | |
| | | | |
Boston Scientific Corporation † | | | | | | | | | | | 60,100 | | | | 2,551,846 | |
| | | | |
DexCom Incorporated † | | | | | | | | | | | 9,750 | | | | 1,529,483 | |
| | | | |
Edwards Lifesciences Corporation † | | | | | | | | | | | 8,300 | | | | 1,766,655 | |
| | | | |
Intuitive Surgical Incorporated † | | | | | | | | | | | 2,850 | | | | 1,480,604 | |
| | | | |
| | | | | | | | | | | | | | | 9,624,672 | |
| | | | | | | | | | | | | | | | |
| | | | |
| Health Care Providers & Services: 3.96% | | | | | | | | | | | | |
| | | | |
UnitedHealth Group Incorporated | | | | | | | | | | | 16,847 | | | | 4,195,071 | |
| | | | | | | | | | | | | | | | |
The accompanying notes are an integral part of these financial statements.
Wells Fargo Capital Growth Fund | 11
Portfolio of investments—July 31, 2019
| | | | | | | | | | | | | | | | |
| | | | | | | | | Shares | | | Value | |
| Life Sciences Tools & Services: 1.22% | | | | | | | | | | | | |
| | | | |
Illumina Incorporated † | | | | | | | | | | | 4,300 | | | $ | 1,287,334 | |
| | | | | | | | | | | | | | | | |
| | | | |
Industrials: 9.16% | | | | | | | | | | | | | | | | |
| | | | |
| Commercial Services & Supplies: 5.17% | | | | | | | | | | | | |
| | | | |
Cintas Corporation | | | | | | | | | | | 9,500 | | | | 2,474,180 | |
| | | | |
Waste Connections Incorporated | | | | | | | | | | | 33,080 | | | | 3,001,018 | |
| | | | |
| | | | | | | | | | | | | | | 5,475,198 | |
| | | | | | | | | | | | | | | | |
| | | | |
| Electrical Equipment: 1.03% | | | | | | | | | | | | |
| | | | |
Rockwell Automation Incorporated | | | | | | | | | | | 6,800 | | | | 1,093,304 | |
| | | | | | | | | | | | | | | | |
| | | | |
| Road & Rail: 2.96% | | | | | | | | | | | | |
| | | | |
Union Pacific Corporation | | | | | | | | | | | 17,400 | | | | 3,131,130 | |
| | | | | | | | | | | | | | | | |
| | | | |
Information Technology: 32.72% | | | | | | | | | | | | | | | | |
| | | | |
| Communications Equipment: 1.87% | | | | | | | | | | | | |
| | | | |
Motorola Solutions Incorporated | | | | | | | | | | | 11,900 | | | | 1,974,924 | |
| | | | | | | | | | | | | | | | |
| | | | |
| IT Services: 16.97% | | | | | | | | | | | | |
| | | | |
Black Knight Incorporated † | | | | | | | | | | | 26,250 | | | | 1,662,150 | |
| | | | |
Fiserv Incorporated † | | | | | | | | | | | 24,664 | | | | 2,600,347 | |
| | | | |
FleetCor Technologies Incorporated † | | | | | | | | | | | 7,450 | | | | 2,117,067 | |
| | | | |
PayPal Holdings Incorporated † | | | | | | | | | | | 21,750 | | | | 2,401,200 | |
| | | | |
Shopify Incorporated Class A † | | | | | | | | | | | 3,300 | | | | 1,049,004 | |
| | | | |
Total System Services Incorporated | | | | | | | | | | | 19,200 | | | | 2,605,824 | |
| | | | |
Visa Incorporated Class A | | | | | | | | | | | 31,070 | | | | 5,530,460 | |
| | | | |
| | | | | | | | | | | | | | | 17,966,052 | |
| | | | | | | | | | | | | | | | |
| | | | |
| Software: 13.88% | | | | | | | | | | | | |
| | | | |
Autodesk Incorporated † | | | | | | | | | | | 10,900 | | | | 1,702,253 | |
| | | | |
Microsoft Corporation | | | | | | | | | | | 66,081 | | | | 9,004,853 | |
| | | | |
Salesforce.com Incorporated † | | | | | | | | | | | 13,430 | | | | 2,074,935 | |
| | | | |
ServiceNow Incorporated † | | | | | | | | | | | 6,880 | | | | 1,908,443 | |
| | | | |
| | | | | | | | | | | | | | | 14,690,484 | |
| | | | | | | | | | | | | | | | |
| | | | |
Materials: 6.22% | | | | | | | | | | | | | | | | |
| | | | |
| Chemicals: 4.73% | | | | | | | | | | | | |
| | | | |
Air Products & Chemicals Incorporated | | | | | | | | | | | 10,700 | | | | 2,442,489 | |
| | | | |
The Sherwin-Williams Company | | | | | | | | | | | 5,000 | | | | 2,565,200 | |
| | | | |
| | | | | | | | | | | | | | | 5,007,689 | |
| | | | | | | | | | | | | | | | |
| | | | |
| Construction Materials: 1.49% | | | | | | | | | | | | |
| | | | |
Vulcan Materials Company | | | | | | | | | | | 11,350 | | | | 1,570,273 | |
| | | | | | | | | | | | | | | | |
| | | | |
Real Estate: 1.09% | | | | | | | | | | | | | | | | |
| | | | |
| Equity REITs: 1.09% | | | | | | | | | | | | |
| | | | |
SBA Communications Corporation † | | | | | | | | | | | 4,700 | | | | 1,153,427 | |
| | | | | | | | | | | | | | | | |
| | | | |
Total Common Stocks (Cost $51,929,547) | | | | | | | | | | | | | | | 101,887,069 | |
| | | | | | | | | | | | | | | | |
The accompanying notes are an integral part of these financial statements.
12 | Wells Fargo Capital Growth Fund
Portfolio of investments—July 31, 2019
| | | | | | | | | | | | | | | | |
| | | Yield | | | | | | Shares | | | Value | |
| Short-Term Investments: 3.89% | | | | | | | | | | | | |
| | | | |
| Investment Companies: 3.89% | | | | | | | | | | | | |
| | | | |
Wells Fargo Government Money Market Fund Select Class (l)(u) | | | 2.26 | % | | | | | | | 4,112,350 | | | $ | 4,112,350 | |
| | | | | | | | | | | | | | | | |
| | | | |
Total Short-Term Investments (Cost $4,112,350) | | | | | | | | | | | | | | | 4,112,350 | |
| | | | | | | | | | | | | | | | |
| | | | | | | | |
| Total investments in securities (Cost $56,041,897) | | | 100.15 | % | | | 105,999,419 | |
| | |
Other assets and liabilities, net | | | (0.15 | ) | | | (154,294 | ) |
| | | | | | | | |
| Total net assets | | | 100.00 | % | | $ | 105,845,125 | |
| | | | | | | | |
| † | Non-income-earning security |
| (l) | The issuer of the security is an affiliated person of the Fund as defined in the Investment Company Act of 1940. |
| (u) | The rate represents the7-day annualized yield at period end. |
Abbreviations:
| ADR | American depositary receipt |
| REIT | Real estate investment trust |
Investments in Affiliates
An affiliated investment is an investment in which the Fund owns at least 5% of the outstanding voting shares of the issuer or as a result of other relationships, such as the Fund and the issuer having the same investment manager. Transactions with issuers that were either affiliated persons of the Fund at the beginning of the period or the end of the period were as follows:
| | | | | | | | | | | | | | | | | | | | | | | | | | | | | | | | | | | | |
| | | Shares,
beginning
of period | | | Shares
purchased | | | Shares
sold | | | Shares,
end of
period | | | Net
realized
gains
(losses) | | | Net
change in
unrealized
gains
(losses) | | | Income
from
affiliated
securities | | | Value,
end
of period | | | % of
net
assets | |
Short-Term Investments | | | | | | | | | | | | | | | | | | | | | | | | | | | | | | | | | | | | |
Investment Companies | | | | | | | | | | | | | | | | | | | | | | | | | | | | | | | | | | | | |
Securities Lending Cash Investments LLC * | | | 1,332,367 | | | | 16,874,602 | | | | 18,206,969 | | | | 0 | | | $ | (1,030 | ) | | $ | 0 | | | $ | 10,122 | # | | $ | 0 | | | | | |
Wells Fargo Government Money Market Fund Select Class | | | 922,555 | | | | 35,178,825 | | | | 31,989,030 | | | | 4,112,350 | | | | 0 | | | | 0 | | | | 32,866 | | | | 4,112,350 | | | | | |
| | | | | | | | | | | | | | | | | | | | | | | | | | | | | | | | | | | | |
| | | | | | | | | |
| | | | | | | | | | | | | | | | | | $ | (1,030 | ) | | $ | 0 | | | $ | 42,988 | | | $ | 4,112,350 | | | | 3.89 | % |
| | | | | | | | | | | | | | | | | | | | | | | | | | | | | | | | | | | | |
| * | No longer held at the end of the period. |
| # | Amount shown represents income before fees and rebates. |
The accompanying notes are an integral part of these financial statements.
Wells Fargo Capital Growth Fund | 13
Statement of assets and liabilities—July 31, 2019
| | | | |
| | | | |
| |
Assets | | | | |
Investments in unaffiliated securities, at value (cost $51,929,547) | | $ | 101,887,069 | |
Investments in affiliated securities, at value (cost $4,112,350) | | | 4,112,350 | |
Receivable for investments sold | | | 83,593 | |
Receivable for Fund shares sold | | | 16,523 | |
Receivable for dividends | | | 26,892 | |
Prepaid expenses and other assets | | | 41,374 | |
| | | | |
Total assets | | | 106,167,801 | |
| | | | |
| |
Liabilities | | | | |
Payable for Fund shares redeemed | | | 177,487 | |
Management fee payable | | | 32,352 | |
Administration fees payable | | | 17,487 | |
Trustees’ fees and expenses payable | | | 4,308 | |
Distribution fee payable | | | 1,364 | |
Accrued expenses and other liabilities | | | 89,678 | |
| | | | |
Total liabilities | | | 322,676 | |
| | | | |
Total net assets | | $ | 105,845,125 | |
| | | | |
| |
Net assets consist of | | | | |
Paid-in capital | | $ | 44,802,993 | |
Total distributable earnings | | | 61,042,132 | |
| | | | |
Total net assets | | $ | 105,845,125 | |
| | | | |
| |
Computation of net asset value and offering price per share | | | | |
Net assets – Class A | | $ | 83,922,477 | |
Shares outstanding – Class A1 | | | 8,872,748 | |
Net asset value per share – Class A | | | $9.46 | |
Maximum offering price per share – Class A2 | | | $10.04 | |
Net assets – Class C | | $ | 2,131,304 | |
Shares outstanding – Class C1 | | | 333,771 | |
Net asset value per share – Class C | | | $6.39 | |
Net assets – Class R6 | | $ | 2,470,662 | |
Shares outstanding – Class R61 | | | 198,972 | |
Net asset value per share – Class R6 | | | $12.42 | |
Net assets – Administrator Class | | $ | 4,986,558 | |
Shares outstanding – Administrator Class1 | | | 437,453 | |
Net asset value per share – Administrator Class | | | $11.40 | |
Net assets – Institutional Class | | $ | 12,334,124 | |
Shares outstanding – Institutional Class1 | | | 1,001,694 | |
Net asset value per share – Institutional Class | | | $12.31 | |
| 1 | The Fund has an unlimited number of authorized shares. |
| 2 | Maximum offering price is computed as 100/94.25 of net asset value. On investments of $50,000 or more, the offering price is reduced. |
The accompanying notes are an integral part of these financial statements.
14 | Wells Fargo Capital Growth Fund
Statement of operations—year ended July 31, 2019
| | | | |
| | | | |
| |
Investment income | | | | |
Dividends (net of foreign withholding taxes of $8,987) | | $ | 812,167 | |
Income from affiliated securities | | | 34,286 | |
| | | | |
Total investment income | | | 846,453 | |
| | | | |
| |
Expenses | | | | |
Management fee | | | 745,417 | |
Administration fees | |
Class A | | | 167,756 | |
Class C | | | 5,413 | |
Class R6 | | | 1,389 | |
Administrator Class | | | 6,781 | |
Institutional Class | | | 18,434 | |
Shareholder servicing fees | |
Class A | | | 199,710 | |
Class C | | | 6,445 | |
Administrator Class | | | 13,041 | |
Distribution fee | |
Class C | | | 19,334 | |
Custody and accounting fees | | | 23,999 | |
Professional fees | | | 50,571 | |
Registration fees | | | 109,500 | |
Shareholder report expenses | | | 34,905 | |
Trustees’ fees and expenses | | | 22,017 | |
Other fees and expenses | | | 12,793 | |
| | | | |
Total expenses | | | 1,437,505 | |
Less: Fee waivers and/or expense reimbursements | | | (368,002 | ) |
| | | | |
Net expenses | | | 1,069,503 | |
| | | | |
Net investment loss | | | (223,050 | ) |
| | | | |
| |
Realized and unrealized gains (losses) on investments | | | | |
Net realized gains (losses) on | |
Unaffiliated securities | | | 14,965,496 | |
Affiliated securities | | | (1,030 | ) |
| | | | |
Net realized gains on investments | | | 14,964,466 | |
Net change in unrealized gains (losses) on investments | | | (2,615,121 | ) |
| | | | |
Net realized and unrealized gains (losses) on investments | | | 12,349,345 | |
| | | | |
Net increase in net assets resulting from operations | | $ | 12,126,295 | |
| | | | |
The accompanying notes are an integral part of these financial statements.
Wells Fargo Capital Growth Fund | 15
Statement of changes in net assets
| | | | | | | | | | | | | | | | |
| | | Year ended
July 31, 2019 | | | Year ended
July 31, 20181 | |
| | | | |
Operations | | | | | | | | | | | | | | | | |
Net investment loss | | | | | | $ | (223,050 | ) | | | | | | $ | (105,891 | ) |
Net realized gains on investments | | | | | | | 14,964,466 | | | | | | | | 84,278,242 | |
Net change in unrealized gains (losses) on investments | | | | | | | (2,615,121 | ) | | | | | | | (34,428,399 | ) |
| | | | |
Net increase in net assets resulting from operations | | | | | | | 12,126,295 | | | | | | | | 49,743,952 | |
| | | | |
| | | | |
Distributions to shareholders from net investment income and net realized gains | | | | | | | | | | | | | | | | |
Class A | | | | | | | (45,016,507 | ) | | | | | | | (10,659,612 | ) |
Class C | | | | | | | (1,770,673 | ) | | | | | | | (475,651 | ) |
Class R4 | | | | | | | N/A | | | | | | | | (1,544 | )2 |
Class R6 | | | | | | | (4,194,378 | ) | | | | | | | (16,512,790 | ) |
Administrator Class | | | | | | | (2,839,109 | ) | | | | | | | (2,322,996 | ) |
Institutional Class | | | | | | | (7,429,012 | ) | | | | | | | (2,869,464 | ) |
| | | | |
Total distributions to shareholders | | | | | | | (61,249,679 | ) | | | | | | | (32,842,057 | ) |
| | | | |
| | | | |
Capital share transactions | | | Shares | | | | | | | | Shares | | | | | |
Proceeds from shares sold | | | | | | | | | | | | | | | | |
Class A | | | 572,554 | | | | 5,446,796 | | | | 324,772 | | | | 5,663,591 | |
Class C | | | 154,137 | | | | 905,087 | | | | 51,472 | | | | 773,137 | |
Class R6 | | | 29,622 | | | | 381,146 | | | | 429,937 | | | | 8,300,687 | |
Administrator Class | | | 30,341 | | | | 351,635 | | | | 98,501 | | | | 1,847,357 | |
Institutional Class | | | 165,425 | | | | 1,990,728 | | | | 180,220 | | | | 3,556,665 | |
| | | | |
| | | | | | | 9,075,392 | | | | | | | | 20,141,437 | |
| | | | |
Reinvestment of distributions | | | | | | | | | | | | | | | | |
Class A | | | 5,508,288 | | | | 44,139,774 | | | | 642,270 | | | | 10,449,869 | |
Class C | | | 301,972 | | | | 1,666,667 | | | | 30,860 | | | | 437,693 | |
Class R4 | | | N/A | | | | N/A | | | | 0 | 2 | | | 0 | 2 |
Class R6 | | | 89,812 | | | | 934,429 | | | | 905,002 | | | | 16,500,487 | |
Administrator Class | | | 291,982 | | | | 2,801,545 | | | | 131,868 | | | | 2,308,838 | |
Institutional Class | | | 716,926 | | | | 7,403,250 | | | | 155,432 | | | | 2,828,945 | |
| | | | |
| | | | | | | 56,945,665 | | | | | | | | 32,525,832 | |
| | | | |
Payment for shares redeemed | | | | | | | | | | | | | | | | |
Class A | | | (1,742,605 | ) | | | (17,335,658 | ) | | | (560,818 | ) | | | (9,909,912 | ) |
Class C | | | (327,409 | ) | | | (2,306,311 | ) | | | (62,592 | ) | | | (954,216 | ) |
Class R4 | | | N/A | | | | N/A | | | | (974 | )2 | | | (18,521 | )2 |
Class R6 | | | (401,198 | ) | | | (4,653,188 | ) | | | (8,922,240 | ) | | | (178,495,590 | ) |
Administrator Class | | | (172,162 | ) | | | (1,897,228 | ) | | | (1,169,379 | ) | | | (22,013,800 | ) |
Institutional Class | | | (822,709 | ) | | | (11,049,745 | ) | | | (661,462 | ) | | | (12,665,267 | ) |
| | | | |
| | | | | | | (37,242,130 | ) | | | | | | | (224,057,306 | ) |
| | | | |
Net increase (decrease) in net assets resulting from capital share transactions | | | | | | | 28,778,927 | | | | | | | | (171,390,037 | ) |
| | | | |
Total decrease in net assets | | | | | | | (20,344,457 | ) | | | | | | | (154,488,142 | ) |
| | | | |
| | | | |
Net assets | | | | | | | | | | | | | | | | |
Beginning of period | | | | | | | 126,189,582 | | | | | | | | 280,677,724 | |
| | | | |
End of period | | | | | | $ | 105,845,125 | | | | | | | $ | 126,189,582 | |
| | | | |
| 1 | Effective for all filings after November 4, 2018, the SEC prospectively eliminated the requirement to parenthetically disclose undistributed net investment income at the end of the period and permitted the aggregation of distributions, with the exception of tax basis returns of capital. Undistributed net investment income at July 31, 2018 was $0. The disaggregated distributions information for the year ended July 31, 2018 is included in Note 8,Distributions to Shareholders, in the notes to the financial statements. |
| 2 | For the period from August 1, 2017 to November 13, 2017. Effective at the close of business on November 13, 2017, Class R4 shares were liquidated and the class was subsequently closed. Class R4 shares are no longer offered by the Fund. |
The accompanying notes are an integral part of these financial statements.
16 | Wells Fargo Capital Growth Fund
Financial highlights
(For a share outstanding throughout each period)
| | | | | | | | | | | | | | | | | | | | |
| | | Year ended July 31 | |
| CLASS A | | 2019 | | | 2018 | | | 2017 | | | 2016 | | | 2015 | |
Net asset value, beginning of period | | | $19.03 | | | | $17.56 | | | | $15.12 | | | | $17.38 | | | | $21.31 | |
Net investment loss | | | (0.03 | )1 | | | (0.06 | )1 | | | (0.03 | )1 | | | (0.03 | )1 | | | (0.07 | )1 |
Net realized and unrealized gains (losses) on investments | | | 0.55 | | | | 4.06 | | | | 2.90 | | | | 0.04 | | | | 2.09 | |
| | | | | | | | | | | | | | | | | | | | |
Total from investment operations | | | 0.52 | | | | 4.00 | | | | 2.87 | | | | 0.01 | | | | 2.02 | |
Distributions to shareholders from | | | | | | | | | | | | | | | | | | | | |
Net investment income | | | 0.00 | | | | 0.00 | | | | (0.02 | ) | | | 0.00 | | | | 0.00 | |
Net realized gains | | | (10.09 | ) | | | (2.53 | ) | | | (0.41 | ) | | | (2.27 | ) | | | (5.95 | ) |
| | | | | | | | | | | | | | | | | | | | |
Total distributions to shareholders | | | (10.09 | ) | | | (2.53 | ) | | | (0.43 | ) | | | (2.27 | ) | | | (5.95 | ) |
Net asset value, end of period | | | $9.46 | | | | $19.03 | | | | $17.56 | | | | $15.12 | | | | $17.38 | |
Total return2 | | | 14.50 | % | | | 25.83 | % | | | 19.52 | % | | | 0.75 | % | | | 11.00 | % |
Ratios to average net assets (annualized) | | | | | | | | | | | | | | | | | | | | |
Gross expenses | | | 1.40 | % | | | 1.26 | % | | | 1.24 | % | | | 1.24 | % | | | 1.27 | % |
Net expenses | | | 1.06 | % | | | 1.06 | % | | | 1.06 | % | | | 1.06 | % | | | 1.11 | % |
Net investment loss | | | (0.26 | )% | | | (0.32 | )% | | | (0.21 | )% | | | (0.18 | )% | | | (0.39 | )% |
Supplemental data | | | | | | | | | | | | | | | | | | | | |
Portfolio turnover rate | | | 20 | % | | | 40 | % | | | 59 | % | | | 85 | % | | | 114 | % |
Net assets, end of period (000s omitted) | | | $83,922 | | | | $86,285 | | | | $72,511 | | | | $77,648 | | | | $17,126 | |
| 1 | Calculated based upon average shares outstanding |
| 2 | Total return calculations do not include any sales charges. |
The accompanying notes are an integral part of these financial statements.
Wells Fargo Capital Growth Fund | 17
Financial highlights
(For a share outstanding throughout each period)
| | | | | | | | | | | | | | | | | | | | |
| | | Year ended July 31 | |
| CLASS C | | 2019 | | | 2018 | | | 2017 | | | 2016 | | | 2015 | |
Net asset value, beginning of period | | | $16.41 | | | | $15.58 | | | | $13.54 | | | | $15.92 | | | | $20.12 | |
Net investment loss | | | (0.07 | )1 | | | (0.16 | )1 | | | (0.13 | )1 | | | (0.13 | )1 | | | (0.20 | )1 |
Net realized and unrealized gains (losses) on investments | | | 0.14 | | | | 3.52 | | | | 2.58 | | | | 0.02 | | | | 1.95 | |
| | | | | | | | | | | | | | | | | | | | |
Total from investment operations | | | 0.07 | | | | 3.36 | | | | 2.45 | | | | (0.11 | ) | | | 1.75 | |
Distributions to shareholders from | | | | | | | | | | | | | | | | | | | | |
Net realized gains | | | (10.09 | ) | | | (2.53 | ) | | | (0.41 | ) | | | (2.27 | ) | | | (5.95 | ) |
Net asset value, end of period | | | $6.39 | | | | $16.41 | | | | $15.58 | | | | $13.54 | | | | $15.92 | |
Total return2 | | | 13.74 | % | | | 24.89 | % | | | 18.65 | % | | | 0.00 | % | | | 10.15 | % |
Ratios to average net assets (annualized) | | | | | | | | | | | | | | | | | | | | |
Gross expenses | | | 2.15 | % | | | 2.01 | % | | | 1.99 | % | | | 1.99 | % | | | 2.02 | % |
Net expenses | | | 1.81 | % | | | 1.81 | % | | | 1.81 | % | | | 1.81 | % | | | 1.86 | % |
Net investment loss | | | (1.03 | )% | | | (1.07 | )% | | | (0.95 | )% | | | (0.98 | )% | | | (1.14 | )% |
Supplemental data | | | | | | | | | | | | | | | | | | | | |
Portfolio turnover rate | | | 20 | % | | | 40 | % | | | 59 | % | | | 85 | % | | | 114 | % |
Net assets, end of period (000s omitted) | | | $2,131 | | | | $3,365 | | | | $2,888 | | | | $3,415 | | | | $4,212 | |
| 1 | Calculated based upon average shares outstanding |
| 2 | Total return calculations do not include any sales charges. |
The accompanying notes are an integral part of these financial statements.
18 | Wells Fargo Capital Growth Fund
Financial highlights
(For a share outstanding throughout each period)
| | | | | | | | | | | | | | | | | | | | |
| | | Year ended July 31 | |
| CLASS R6 | | 2019 | | | 2018 | | | 2017 | | | 2016 | | | 2015 | |
Net asset value, beginning of period | | | $21.55 | | | | $19.52 | | | | $16.70 | | | | $18.87 | | | | $22.56 | |
Net investment income | | | 0.03 | 1 | | | 0.04 | 1 | | | 0.04 | | | | 0.04 | 1 | | | 0.02 | |
Net realized and unrealized gains (losses) on investments | | | 0.93 | | | | 4.52 | | | | 3.24 | | | | 0.06 | | | | 2.24 | |
| | | | | | | | | | | | | | | | | | | | |
Total from investment operations | | | 0.96 | | | | 4.56 | | | | 3.28 | | | | 0.10 | | | | 2.26 | |
Distributions to shareholders from | | | | | | | | | | | | | | | | | | | | |
Net investment income | | | 0.00 | | | | 0.00 | | | | (0.05 | ) | | | 0.00 | | | | 0.00 | |
Net realized gains | | | (10.09 | ) | | | (2.53 | ) | | | (0.41 | ) | | | (2.27 | ) | | | (5.95 | ) |
| | | | | | | | | | | | | | | | | | | | |
Total distributions to shareholders | | | (10.09 | ) | | | (2.53 | ) | | | (0.46 | ) | | | (2.27 | ) | | | (5.95 | ) |
Net asset value, end of period | | | $12.42 | | | | $21.55 | | | | $19.52 | | | | $16.70 | | | | $18.87 | |
Total return | | | 15.03 | % | | | 26.13 | % | | | 20.18 | % | | | 1.20 | % | | | 11.54 | % |
Ratios to average net assets (annualized) | | | | | | | | | | | | | | | | | | | | |
Gross expenses | | | 0.96 | % | | | 0.82 | % | | | 0.81 | % | | | 0.81 | % | | | 0.79 | % |
Net expenses | | | 0.60 | % | | | 0.60 | % | | | 0.60 | % | | | 0.60 | % | | | 0.60 | % |
Net investment income | | | 0.19 | % | | | 0.19 | % | | | 0.23 | % | | | 0.23 | % | | | 0.11 | % |
Supplemental data | | | | | | | | | | | | | | | | | | | | |
Portfolio turnover rate | | | 20 | % | | | 40 | % | | | 59 | % | | | 85 | % | | | 114 | % |
Net assets, end of period (000s omitted) | | | $2,471 | | | | $10,360 | | | | $157,462 | | | | $140,581 | | | | $153,009 | |
| 1 | Calculated based upon average shares outstanding |
The accompanying notes are an integral part of these financial statements.
Wells Fargo Capital Growth Fund | 19
Financial highlights
(For a share outstanding throughout each period)
| | | | | | | | | | | | | | | | | | | | |
| | | Year ended July 31 | |
| ADMINISTRATOR CLASS | | 2019 | | | 2018 | | | 2017 | | | 2016 | | | 2015 | |
Net asset value, beginning of period | | | $20.71 | | | | $18.87 | | | | $16.20 | | | | $18.43 | | | | $22.22 | |
Net investment loss | | | (0.02 | )1 | | | (0.03 | )1 | | | (0.01 | )1 | | | (0.01 | )1 | | | (0.03 | )1 |
Net realized and unrealized gains (losses) on investments | | | 0.80 | | | | 4.40 | | | | 3.12 | | | | 0.05 | | | | 2.19 | |
| | | | | | | | | | | | | | | | | | | | |
Total from investment operations | | | 0.78 | | | | 4.37 | | | | 3.11 | | | | 0.04 | | | | 2.16 | |
Distributions to shareholders from | | | | | | | | | | | | | | | | | | | | |
Net investment income | | | 0.00 | | | | 0.00 | | | | (0.03 | ) | | | 0.00 | | | | 0.00 | |
Net realized gains | | | (10.09 | ) | | | (2.53 | ) | | | (0.41 | ) | | | (2.27 | ) | | | (5.95 | ) |
| | | | | | | | | | | | | | | | | | | | |
Total distributions to shareholders | | | (10.09 | ) | | | (2.53 | ) | | | (0.44 | ) | | | (2.27 | ) | | | (5.95 | ) |
Net asset value, end of period | | | $11.40 | | | | $20.71 | | | | $18.87 | | | | $16.20 | | | | $18.43 | |
Total return | | | 14.63 | % | | | 26.01 | % | | | 19.68 | % | | | 0.88 | % | | | 11.22 | % |
Ratios to average net assets (annualized) | | | | | | | | | | | | | | | | | | | | |
Gross expenses | | | 1.32 | % | | | 1.17 | % | | | 1.16 | % | | | 1.16 | % | | | 1.11 | % |
Net expenses | | | 0.94 | % | | | 0.94 | % | | | 0.94 | % | | | 0.93 | % | | | 0.90 | % |
Net investment loss | | | (0.14 | )% | | | (0.18 | )% | | | (0.04 | )% | | | (0.09 | )% | | | (0.16 | )% |
Supplemental data | | | | | | | | | | | | | | | | | | | | |
Portfolio turnover rate | | | 20 | % | | | 40 | % | | | 59 | % | | | 85 | % | | | 114 | % |
Net assets, end of period (000s omitted) | | | $4,987 | | | | $5,950 | | | | $23,144 | | | | $31,064 | | | | $34,886 | |
| 1 | Calculated based upon average shares outstanding |
The accompanying notes are an integral part of these financial statements.
20 | Wells Fargo Capital Growth Fund
Financial highlights
(For a share outstanding throughout each period)
| | | | | | | | | | | | | | | | | | | | |
| | | Year ended July 31 | |
| INSTITUTIONAL CLASS | | 2019 | | | 2018 | | | 2017 | | | 2016 | | | 2015 | |
Net asset value, beginning of period | | | $21.47 | | | | $19.44 | | | | $16.65 | | | | $18.84 | | | | $22.54 | |
Net investment income | | | 0.01 | 1 | | | 0.01 | 1 | | | 0.02 | 1 | | | 0.03 | 1 | | | 0.02 | 1 |
Net realized and unrealized gains (losses) on investments | | | 0.92 | | | | 4.55 | | | | 3.22 | | | | 0.05 | | | | 2.23 | |
| | | | | | | | | | | | | | | | | | | | |
Total from investment operations | | | 0.93 | | | | 4.56 | | | | 3.24 | | | | 0.08 | | | | 2.25 | |
Distributions to shareholders from | | | | | | | | | | | | | | | | | | | | |
Net investment income | | | 0.00 | | | | 0.00 | | | | (0.04 | ) | | | 0.00 | | | | 0.00 | |
Net realized gains | | | (10.09 | ) | | | (2.53 | ) | | | (0.41 | ) | | | (2.27 | ) | | | (5.95 | ) |
| | | | | | | | | | | | | | | | | | | | |
Total distributions to shareholders | | | (10.09 | ) | | | (2.53 | ) | | | (0.45 | ) | | | (2.27 | ) | | | (5.95 | ) |
Net asset value, end of period | | | $12.31 | | | | $21.47 | | | | $19.44 | | | | $16.65 | | | | $18.84 | |
Total return | | | 14.89 | % | | | 26.25 | % | | | 20.00 | % | | | 1.09 | % | | | 11.50 | % |
Ratios to average net assets (annualized) | | | | | | | | | | | | | | | | | | | | |
Gross expenses | | | 1.06 | % | | | 0.93 | % | | | 0.91 | % | | | 0.91 | % | | | 0.84 | % |
Net expenses | | | 0.70 | % | | | 0.70 | % | | | 0.70 | % | | | 0.68 | % | | | 0.65 | % |
Net investment income | | | 0.09 | % | | | 0.05 | % | | | 0.13 | % | | | 0.16 | % | | | 0.09 | % |
Supplemental data | | | | | | | | | | | | | | | | | | | | |
Portfolio turnover rate | | | 20 | % | | | 40 | % | | | 59 | % | | | 85 | % | | | 114 | % |
Net assets, end of period (000s omitted) | | | $12,334 | | | | $20,229 | | | | $24,653 | | | | $23,670 | | | | $22,578 | |
| 1 | Calculated based upon average shares outstanding |
The accompanying notes are an integral part of these financial statements.
Wells Fargo Capital Growth Fund | 21
Notes to financial statements
1. ORGANIZATION
Wells Fargo Funds Trust (the “Trust”), a Delaware statutory trust organized on March 10, 1999, is anopen-end management investment company registered under the Investment Company Act of 1940, as amended (the “1940 Act”). As an investment company, the Trust follows the accounting and reporting guidance in Financial Accounting Standards Board (“FASB”)Accounting Standards Codification Topic 946, Financial Services – Investment Companies. These financial statements report on the Wells Fargo Capital Growth Fund (the “Fund”) which is a diversified series of the Trust.
Effective at the close of business on November 13, 2017, Class R4 shares were liquidated and the class was subsequently closed. Class R4 shares are no longer offered by the Fund. Information for Class R4 shares reflected in the financial statements represents activity through November 13, 2017.
2. SIGNIFICANT ACCOUNTING POLICIES
The following significant accounting policies, which are consistently followed in the preparation of the financial statements of the Fund, are in conformity with U.S. generally accepted accounting principles which require management to make estimates and assumptions that affect the reported amounts of assets and liabilities, disclosure of contingent assets and liabilities at the date of the financial statements, and the reported amounts of revenues and expenses during the reporting period. Actual results could differ from those estimates.
Securities valuation
All investments are valued each business day as of the close of regular trading on the New York Stock Exchange (generally 4 p.m. Eastern Time), although the Fund may deviate from this calculation time under unusual or unexpected circumstances.
Equity securities that are listed on a foreign or domestic exchange or market are valued at the official closing price or, if none, the last sales price. If no sale occurs on the principal exchange or market that day, a fair value price will be determined in accordance with the Fund’s Valuation Procedures.
Investments in registeredopen-end investment companies are valued at net asset value. Interests innon-registered investment companies that are redeemable at net asset value are fair valued normally at net asset value.
Investments which are not valued using any of the methods discussed above are valued at their fair value, as determined in good faith by the Board of Trustees of the Fund. The Board of Trustees has established a Valuation Committee comprised of the Trustees and has delegated to it the authority to take any actions regarding the valuation of portfolio securities that the Valuation Committee deems necessary or appropriate, including determining the fair value of portfolio securities, unless the determination has been delegated to the Wells Fargo Asset Management Pricing Committee at Wells Fargo Funds Management, LLC (“Funds Management”). The Board of Trustees retains the authority to make or ratify any valuation decisions or approve any changes to the Valuation Procedures as it deems appropriate. On a quarterly basis, the Board of Trustees receives reports on any valuation actions taken by the Valuation Committee or the Wells Fargo Asset Management Pricing Committee which may include items for ratification.
Foreign currency translation
The accounting records of the Fund are maintained in U.S. dollars. The values of other assets and liabilities denominated in foreign currencies are translated into U.S. dollars at rates provided by an independent foreign currency pricing source at a time each business day specified by the Wells Fargo Asset Management Pricing Committee. Purchases and sales of securities, and income and expenses are converted at the rate of exchange on the respective dates of such transactions. Net realized foreign exchange gains or losses arise from sales of foreign currencies, currency gains or losses realized between the trade and settlement dates on securities transactions, and the difference between the amounts of dividends, interest and foreign withholding taxes recorded and the U.S. dollar equivalent of the amounts actually paid or received. Net unrealized foreign exchange gains and losses arise from changes in the fair value of assets and liabilities other than investments in securities resulting from changes in exchange rates. The changes in net assets arising from changes in exchange rates of securities and the changes in net assets resulting from changes in market prices of securities are not separately presented. Such changes are included in net realized and unrealized gains or losses from investments.
Securities lending
The Fund may lend its securities from time to time in order to earn additional income in the form of fees or interest on securities received as collateral or the investment of any cash received as collateral. When securities are on loan, the Fund receives interest or dividends on those securities. Cash collateral received in connection with its securities lending transactions is invested in Securities Lending Cash Investments, LLC (the “Securities Lending Fund”). Investments in Securities Lending Fund
22 | Wells Fargo Capital Growth Fund
Notes to financial statements
are valued at the evaluated bid price provided by an independent pricing service. Income earned from investment in the Securities Lending Fund (net of fees and rebates), if any, is included in income from affiliated securities on the Statement of Operations.
In a securities lending transaction, the net asset value of the Fund will be affected by an increase or decrease in the value of the securities loaned and by an increase or decrease in the value of the instrument in which collateral is invested. The amount of securities lending activity undertaken by the Fund fluctuates from time to time. The Fund has the right under the lending agreement to recover the securities from the borrower on demand. In the event of default or bankruptcy by the borrower, the Fund may be prevented from recovering the loaned securities or gaining access to the collateral or may experience delays or costs in doing so. In such an event, the terms of the agreement allows the unaffiliated securities lending agent to use the collateral to purchase replacement securities on behalf of the Fund or pay the Fund the market value of the loaned securities. The Fund will bear the risk of loss with respect to depreciation of its investment of the cash collateral.
Security transactions and income recognition
Securities transactions are recorded on a trade date basis. Realized gains or losses are recorded on the basis of identified cost.
Dividend income is recognized on theex-dividend date. Dividend income is recorded net of foreign taxes withheld where recovery of such taxes is not assured.
Distributions to shareholders
Distributions to shareholders from net investment income and any net realized gains are recorded on theex-dividend date and paid at least annually. Such distributions are determined in accordance with income tax regulations and may differ from U.S. generally accepted accounting principles. Dividend sources are estimated at the time of declaration. The tax character of distributions is determined as of the Fund’s fiscal year end. Therefore, a portion of the Fund’s distributions made prior to the Fund’s fiscal year end may be categorized as a tax return of capital at year end.
Federal and other taxes
The Fund intends to continue to qualify as a regulated investment company by distributing substantially all of its investment company taxable income and any net realized capital gains (after reduction for capital loss carryforwards) sufficient to relieve it from all, or substantially all, federal income taxes. Accordingly, no provision for federal income taxes was required.
The Fund’s income and federal excise tax returns and all financial records supporting those returns for the prior three fiscal years are subject to examination by the federal and Delaware revenue authorities. Management has analyzed the Fund’s tax positions taken on federal, state, and foreign tax returns for all open tax years and does not believe that there are any uncertain tax positions that require recognition of a tax liability.
As of July 31, 2019, the aggregate cost of all investments for federal income tax purposes was $56,136,293 and the unrealized gains (losses) consisted of:
| | | | |
| |
Gross unrealized gains | | $ | 49,938,919 | |
| |
Gross unrealized losses | | | (75,793 | ) |
| |
Net unrealized gains | | $ | 49,863,126 | |
Reclassifications are made to the Fund’s capital accounts for permanent tax differences to reflect income and gains available for distribution (or available capital loss carryforwards) under federal income tax regulations. U.S. generally accepted accounting principles require that certain components of net assets be adjusted to reflect permanent differences between financial and tax reporting. These reclassifications have no effect on net assets or net asset values per share. The primary permanent difference causing such reclassification is due to net operating losses. At July 31, 2019, as a result of permanentbook-to-tax differences, the following reclassification adjustments were made on the Statement of Assets and Liabilities:
| | |
| Paid-in capital | | Total distributable earnings |
| |
| $(62,640) | | $62,640 |
As of July 31, 2019, the Fund had a qualified late-year ordinary loss of $160,475 which will be recognized on the first day of the following fiscal year.
Wells Fargo Capital Growth Fund | 23
Notes to financial statements
Class allocations
The separate classes of shares offered by the Fund differ principally in applicable sales charges, distribution, shareholder servicing, and administration fees. Class specific expenses are charged directly to that share class. Investment income, common fund-level expenses, and realized and unrealized gains (losses) on investments are allocated daily to each class of shares based on the relative proportion of net assets of each class.
3. FAIR VALUATION MEASUREMENTS
Fair value measurements of investments are determined within a framework that has established a fair value hierarchy based upon the various data inputs utilized in determining the value of the Fund’s investments. The three-level hierarchy gives the highest priority to unadjusted quoted prices in active markets for identical assets or liabilities (Level 1) and the lowest priority to unobservable inputs (Level 3). The Fund’s investments are classified within the fair value hierarchy based on the lowest level of input that is significant to the fair value measurement. The inputs are summarized into three broad levels as follows:
| ∎ | | Level 1 – quoted prices in active markets for identical securities |
| ∎ | | Level 2 – other significant observable inputs (including quoted prices for similar securities, interest rates, prepayment speeds, credit risk, etc.) |
| ∎ | | Level 3 – significant unobservable inputs (including the Fund’s own assumptions in determining the fair value of investments) |
The inputs or methodologies used for valuing investments in securities are not necessarily an indication of the risk associated with investing in those securities.
The following is a summary of the inputs used in valuing the Fund’s assets and liabilities as of July 31, 2019:
| | | | | | | | | | | | | | | | |
| | | | |
| | | Quoted prices (Level 1) | | | Other significant
observable inputs
(Level 2) | | | Significant
unobservable inputs (Level 3) | | | Total | |
| | | | |
Assets | | | | | | | | | | | | | | | | |
Investments in: | | | | | | | | | | | | | | | | |
| | | | |
Common stocks | | | | | | | | | | | | | | | | |
| | | | |
Communication services | | $ | 13,457,570 | | | $ | 0 | | | $ | 0 | | | $ | 13,457,570 | |
| | | | |
Consumer discretionary | | | 14,430,354 | | | | 0 | | | | 0 | | | | 14,430,354 | |
| | | | |
Financials | | | 5,759,064 | | | | 0 | | | | 0 | | | | 5,759,064 | |
| | | | |
Health care | | | 16,177,600 | | | | 0 | | | | 0 | | | | 16,177,600 | |
| | | | |
Industrials | | | 9,699,632 | | | | 0 | | | | 0 | | | | 9,699,632 | |
| | | | |
Information technology | | | 34,631,460 | | | | 0 | | | | 0 | | | | 34,631,460 | |
| | | | |
Materials | | | 6,577,962 | | | | 0 | | | | 0 | | | | 6,577,962 | |
| | | | |
Real estate | | | 1,153,427 | | | | 0 | | | | 0 | | | | 1,153,427 | |
| | | | |
Short-term investments | | | | | | | | | | | | | | | | |
| | | | |
Investment companies | | | 4,112,350 | | | | 0 | | | | 0 | | | | 4,112,350 | |
| | | | |
Total assets | | $ | 105,999,419 | | | $ | 0 | | | $ | 0 | | | $ | 105,999,419 | |
Additional sector, industry or geographic detail is included in the Portfolio of Investments.
For the year ended July 31, 2019, the Fund did not have any transfers into/out of Level 3.
4. TRANSACTIONS WITH AFFILIATES
Management fee
Funds Management, an indirect wholly owned subsidiary of Wells Fargo & Company (“Wells Fargo”), is the manager of the Fund and provides advisory and fund-level administrative services under an investment management agreement. Under the investment management agreement, Funds Management is responsible for, among other services, implementing the investment objectives and strategies of the Fund, supervising the subadviser and providing fund-level administrative services in connection with the
24 | Wells Fargo Capital Growth Fund
Notes to financial statements
Fund’s operations. As compensation for its services under the investment management agreement, Funds Management is entitled to receive a management fee at the following annual rate based on the Fund’s average daily net assets:
| | | | |
| |
| Average daily net assets | | Management fee | |
| |
First $500 million | | | 0.700 | % |
| |
Next $500 million | | | 0.675 | |
| |
Next $1 billion | | | 0.650 | |
| |
Next $2 billion | | | 0.625 | |
| |
Next $1 billion | | | 0.600 | |
| |
Next $3 billion | | | 0.590 | |
| |
Next $2 billion | | | 0.565 | |
| |
Next $2 billion | | | 0.555 | |
| |
Next $4 billion | | | 0.530 | |
| |
Over $16 billion | | | 0.505 | |
For the year ended July 31, 2019, the management fee was equivalent to an annual rate of 0.70% of the Fund’s average daily net assets.
Funds Management has retained the services of a subadviser to provide daily portfolio management to the Fund. The fee for subadvisory services is borne by Funds Management. Wells Capital Management Incorporated (“WellsCap”), an affiliate of Funds Management and an indirect wholly owned subsidiary of Wells Fargo & Company is the subadviser to the Fund and is entitled to receive a fee from Funds Management at an annual rate starting at 0.30% and declining to 0.20% as the average daily net assets of the Fund increase.
Administration fees
Under a class-level administration agreement, Funds Management provides class-level administrative services to the Fund, which includes paying fees and expenses for services provided by the transfer agent,sub-transfer agents, omnibus account servicers and record-keepers. As compensation for its services under the class-level administration agreement, Funds Management receives an annual fee which is calculated based on the average daily net assets of each class as follows:
| | | | |
| |
| | | Class-level
administration fee | |
| |
Class A, Class C | | | 0.21 | % |
| |
Class R6 | | | 0.03 | |
| |
Administrator Class, Institutional Class | | | 0.13 | |
Waivers and/or expense reimbursements
Funds Management has contractually waived and/or reimbursed management and administration fees to the extent necessary to maintain certain net operating expense ratios for the Fund. When each class of the Fund has exceeded its expense cap, Funds Management has waived fees and/or reimbursed expenses from fund-level expenses on a proportionate basis and then from class specific expenses. When only certain classes exceed their expense caps, waivers and/or reimbursements are applied against class specific expenses before fund-level expenses. Funds Management has committed through November 30, 2019 to waive fees and/or reimburse expenses to the extent necessary to cap the Fund’s expenses at 1.11% for Class A shares, 1.86% for Class C shares, 0.60% for Class R6 shares, 0.94% for Administrator Class shares, and 0.70% for Institutional Class shares. Prior to or after the commitment expiration date, the cap may be increased or the commitment to maintain the cap may be terminated only with the approval of the Board of Trustees.
Distribution fee
The Trust has adopted a distribution plan for Class C shares of the Fund pursuant to Rule12b-1 under the 1940 Act. A distribution fee is charged to Class C shares and paid to Wells Fargo Funds Distributor, LLC (“Funds Distributor”), the principal underwriter, at an annual rate of 0.75% of the average daily net assets of Class C shares.
In addition, Funds Distributor is entitled to receive thefront-end sales charge from the purchase of Class A shares and a contingent deferred sales charge on the redemption of certain Class A shares. Funds Distributor is also entitled to receive the
Wells Fargo Capital Growth Fund | 25
Notes to financial statements
contingent deferred sales charges from redemptions of Class C shares. For the year ended July 31, 2019, Funds Distributor received $3,135 from the sale of Class A shares and $12 in contingent deferred sales charges from redemptions of Class C shares. No contingent deferred sales charges were incurred by Class A for the year ended July 31, 2019.
Shareholder servicing fees
The Trust has entered into contracts with one or more shareholder servicing agents, whereby Class A, Class C, and Administrator Class of the Fund are charged a fee at an annual rate of 0.25% of the average daily net assets of each respective class. A portion of these total shareholder servicing fees were paid to affiliates of Wells Fargo.
Interfund transactions
The Fund may purchase or sell portfolio investment securities to certain other Wells Fargo affiliates pursuant to Rule17a-7 under the 1940 Act and under procedures adopted by the Board of Trustees. The procedures have been designed to ensure that these interfund transactions, which do not incur broker commissions, are effected at current market prices.
5. INVESTMENT PORTFOLIO TRANSACTIONS
Purchases and sales of investments, excluding U.S. government obligations (if any) and short-term securities, for the year ended July 31, 2019 were $21,643,534 and $58,016,857, respectively.
6. SECURITIES LENDING TRANSACTIONS
The Fund lends its securities through an unaffiliated securities lending agent and receives collateral in the form of cash or securities with a value at least equal to the value of the securities on loan. The value of the loaned securities is determined at the close of each business day and any increases or decreases in the required collateral are exchanged between the Fund and the counterparty on the next business day. Cash collateral received is invested in the Securities Lending Fund which seeks to provide a positive return compared to the daily Fed Funds Open Rate by investing in high-quality, U.S. dollar-denominated short-term money market instruments and is exempt from registration under Section 3(c)(7) of the 1940 Act. Securities Lending Fund is managed by Funds Management and is subadvised by WellsCap. Funds Management receives an advisory fee starting at 0.05% and declining to 0.01% as the average daily net assets of the Securities Lending Fund increase. All of the fees received by Funds Management are paid to WellsCap for its services as subadviser.
In the event of counterparty default or the failure of a borrower to return a loaned security, the Fund has the right to use the collateral to offset any losses incurred. As of July 31, 2019, the Fund did not have any securities on loan.
7. BANK BORROWINGS
The Trust (excluding the money market funds), Wells Fargo Master Trust and Wells Fargo Variable Trust are parties to a $280,000,000 revolving credit agreement whereby the Fund is permitted to use bank borrowings for temporary or emergency purposes, such as to fund shareholder redemption requests. Interest under the credit agreement is charged to the Fund based on a borrowing rate equal to the higher of the Federal Funds rate in effect on that day plus 1.25% or the overnight LIBOR rate in effect on that day plus 1.25%. In addition, an annual commitment fee equal to 0.25% of the unused balance is allocated to each participating fund.
For the year ended July 31, 2019, there were no borrowings by the Fund under the agreement.
8. DISTRIBUTIONS TO SHAREHOLDERS
The tax character of distributions paid during the years ended July 31, 2019 and July 31, 2018 were as follows:
| | | | | | | | |
| | | Year ended July 31 | |
| | |
| | | 2019 | | | 2018 | |
| | |
Ordinary income | | $ | 0 | | | $ | 5,090,507 | |
| | |
Long-term capital gain | | | 61,249,679 | | | | 27,751,550 | |
As of July 31, 2019, the components of distributable earnings on a tax basis were as follows:
| | | | |
Undistributed long-term gain | | Late-year ordinary losses deferred | | Unrealized
gains |
| | |
| $11,339,481 | | $(160,475) | | $49,863,126 |
26 | Wells Fargo Capital Growth Fund
Notes to financial statements
Effective for all filings after November 4, 2018, the Securities and Exchange Commission eliminated the requirement to separately state the components of distributions to shareholders under U.S. generally accepted accounting principles. The amounts of distributions to shareholders for the year ended July 31, 2018 were as follows:
| | | | |
| |
| | | Net realized
gains | |
| |
Class A | | | $10,659,612 | |
| |
Class C | | | 475,651 | |
| |
Class R4 | | | 1,544 | * |
| |
Class R6 | | | 16,512,790 | |
| |
Administrator Class | | | 2,322,996 | |
| |
Institutional Class | | | 2,869,464 | |
| * | For the period from August 1, 2017 to November 13, 2017. |
9. CONCENTRATION RISK
Concentration risks result from exposure to a limited number of sectors. As of the end of the period, the Fund invests a concentration of its portfolio in the information technology sector. A fund that invests a substantial portion of its assets in any sector may be more affected by changes in that sector than would be a fund whose investments are not heavily weighted in any sector.
10. INDEMNIFICATION
Under the Trust’s organizational documents, the officers and Trustees have been granted certain indemnification rights against certain liabilities that may arise out of performance of their duties to the Trust. Additionally, in the normal course of business, the Trust may enter into contracts with service providers that contain a variety of indemnification clauses. The Trust’s maximum exposure under these arrangements is dependent on future claims that may be made against the Fund and, therefore, cannot be estimated.
11. REORGANIZATION
At a regular meeting of the Board of Trustees held on May 21 and 22, 2019, the Trustees of the Fund approved the merger of the Fund into Wells Fargo Endeavor Select Fund. Wells Fargo Endeavor Select Fund will acquire the assets and assume the liabilities of the Fund in exchange for shares of Wells Fargo Endeavor Select Fund. The merger, which is expected to be atax-free reorganization, does not require approval by shareholders of the Fund and is scheduled to take place on or about September 20, 2019.
12. NEW ACCOUNTING PRONOUNCEMENT
In August 2018, FASB issued Accounting Standards Update (“ASU”)No. 2018-13, Fair Value Measurement (Topic 820)Disclosure Framework—Changes to the Disclosure Requirements for Fair Value Measurement. ASU2018-13 updates the disclosure requirements for fair value measurements by modifying or removing certain disclosures and adding certain new disclosures. The amendments are effective for fiscal years, and interim periods within those fiscal years, beginning after December 15, 2019. Early adoption is permitted. Management has adopted the removal and modification of disclosures early, as permitted, and will adopt the additional new disclosures at the effective date.
Wells Fargo Capital Growth Fund | 27
Report of independent registered public accounting firm
TO THE SHAREHOLDERS OF THE FUND AND BOARD OF TRUSTEES OF WELLS FARGO FUNDS TRUST:
Opinion on the Financial Statements
We have audited the accompanying statement of assets and liabilities of Wells Fargo Capital Growth Fund (the Fund), one of the funds constituting Wells Fargo Funds Trust, including the portfolio of investments, as of July 31, 2019, the related statement of operations for the year then ended, the statements of changes in net assets for each of the years in the two-year period then ended, and the related notes (collectively, the financial statements) and the financial highlights for each of the years in the five-year period then ended. In our opinion, the financial statements and financial highlights present fairly, in all material respects, the financial position of the Fund as of July 31, 2019, the results of its operations for the year then ended, the changes in its net assets for each of the years in the two-year period then ended, and the financial highlights for each of the years in the five-year period then ended, in conformity with U.S. generally accepted accounting principles.
Basis for Opinion
These financial statements and financial highlights are the responsibility of the Fund’s management. Our responsibility is to express an opinion on these financial statements and financial highlights based on our audits. We are a public accounting firm registered with the Public Company Accounting Oversight Board (United States) (PCAOB) and are required to be independent with respect to the Fund in accordance with the U.S. federal securities laws and the applicable rules and regulations of the Securities and Exchange Commission and the PCAOB.
We conducted our audits in accordance with the standards of the PCAOB. Those standards require that we plan and perform the audit to obtain reasonable assurance about whether the financial statements and financial highlights are free of material misstatement, whether due to error or fraud. Our audits included performing procedures to assess the risks of material misstatement of the financial statements and financial highlights, whether due to error or fraud, and performing procedures that respond to those risks. Such procedures included examining, on a test basis, evidence regarding the amounts and disclosures in the financial statements and financial highlights. Such procedures also included confirmation of securities owned as of July 31, 2019, by correspondence with the custodian and transfer agent. Our audits also included evaluating the accounting principles used and significant estimates made by management, as well as evaluating the overall presentation of the financial statements and financial highlights. We believe that our audits provide a reasonable basis for our opinion.

We have not been able to determine the specific year that we began serving as the auditor of one or more Wells Fargo Funds investment companies; however we are aware that we have served as the auditor of one or more Wells Fargo Funds investment companies since at least 1955.
Boston, Massachusetts
September 25, 2019
28 | Wells Fargo Capital Growth Fund
Other information (unaudited)
TAX INFORMATION
Pursuant to Section 852 of the Internal Revenue Code, $61,249,679 was designated as a 20% rate gain distribution for the fiscal year ended July 31, 2019.
PROXY VOTING INFORMATION
A description of the policies and procedures used to determine how to vote proxies relating to portfolio securities is available, upon request, by calling1-800-222-8222, visiting our website atwfam.com, or visiting the SEC website at sec.gov. Information regarding how the proxies related to portfolio securities were voted during the most recent12-month period ended June 30 is available on the website atwfam.comor by visiting the SEC website at sec.gov.
QUARTERLY PORTFOLIO HOLDINGS INFORMATION
The Fund files its complete schedule of portfolio holdings with the SEC for the first and third quarters of each fiscal year on Form N-Q or FormN-PORT, which is available by visiting the SEC website at sec.gov. Those forms may be reviewed and copied at the SEC’s Public Reference Room in Washington, DC. Information on the operation of the Public Reference Room may be obtained by calling1-800-SEC-0330.
Wells Fargo Capital Growth Fund | 29
Other information (unaudited)
BOARD OF TRUSTEES AND OFFICERS
Each of the Trustees and Officers1 listed in the table below acts in identical capacities for each fund in the Wells Fargo family of funds, which consists of 152 mutual funds comprising the Wells Fargo Funds Trust, Wells Fargo Variable Trust, Wells Fargo Master Trust and fourclosed-end funds (collectively the “Fund Complex”). This table should be read in conjunction with the Prospectus and the Statement of Additional Information2. The mailing address of each Trustee and Officer is 525 Market Street, 12th Floor, San Francisco, CA 94105. Each Trustee and Officer serves an indefinite term, however, each Trustee serves such term until reaching the mandatory retirement age established by the Trustees.
Independent Trustees
| | | | | | |
Name and
year of birth | | Position held and
length of service* | | Principal occupations during past five years or longer | | Current other
public company or
investment
company
directorships |
| | | |
| William R. Ebsworth (Born 1957) | | Trustee, since 2015 | | Retired. From 1984 to 2013, equities analyst, portfolio manager, research director and chief investment officer at Fidelity Management and Research Company in Boston, Tokyo, and Hong Kong, and retired in 2013 as Chief Investment Officer of Fidelity Strategic Advisers, Inc. where he led a team of investment professionals managing client assets. Prior thereto, Board member of Hong Kong Securities Clearing Co., Hong Kong Options Clearing Corp., the Thailand International Fund, Ltd., Fidelity Investments Life Insurance Company, and Empire Fidelity Investments Life Insurance Company. Audit Committee Chair and Investment Committee Chair of the Vincent Memorial Hospital Endowment(non-profit organization). Mr. Ebsworth is a CFA® charterholder. | | N/A |
| | | |
| Jane A. Freeman (Born 1953) | | Trustee, since 2015; Chair Liaison, since 2018 | | Retired. From 2012 to 2014 and 1999 to 2008, Chief Financial Officer of Scientific Learning Corporation. From 2008 to 2012, Ms. Freeman provided consulting services related to strategic business projects. Prior to 1999, Portfolio Manager at Rockefeller & Co. and Scudder, Stevens & Clark. Board member of the Harding Loevner Funds from 1996 to 2014, serving as both Lead Independent Director and chair of the Audit Committee. Board member of the Russell Exchange Traded Funds Trust from 2011 to 2012 and the chair of the Audit Committee. Ms. Freeman is a Board Member of The Ruth Bancroft Garden(non-profit organization). She is also an inactive Chartered Financial Analyst. | | N/A |
| | | |
| Isaiah Harris, Jr. (Born 1952) | | Trustee, since 2009; Audit Committee Chairman, since 2019 | | Retired. Chairman of the Board of CIGNA Corporation since 2009, and Director since 2005. From 2003 to 2011, Director of Deluxe Corporation. Prior thereto, President and CEO of BellSouth Advertising and Publishing Corp. from 2005 to 2007, President and CEO of BellSouth Enterprises from 2004 to 2005 and President of BellSouth Consumer Services from 2000 to 2003. Emeritus member of the Iowa State University Foundation Board of Governors. Emeritus Member of the Advisory Board of Iowa State University School of Business. Advisory Board Member, Palm Harbor Academy (private school). Advisory Board Member, Child Evangelism Fellowship(non-profit). Mr. Harris is a certified public accountant (inactive status). | | CIGNA Corporation |
| | | |
| Judith M. Johnson (Born 1949) | | Trustee, since 2008; Audit Committee Chairman, from 2009 to 2018 | | Retired. Prior thereto, Chief Executive Officer and Chief Investment Officer of Minneapolis Employees Retirement Fund from 1996 to 2008. Ms. Johnson is an attorney, certified public accountant and a certified managerial accountant. | | N/A |
30 | Wells Fargo Capital Growth Fund
Other information (unaudited)
| | | | | | |
Name and
year of birth | | Position held and
length of service* | | Principal occupations during past five years or longer | | Current other
public company or
investment
company
directorships |
| | | |
| David F. Larcker (Born 1950) | | Trustee, since 2009 | | James Irvin Miller Professor of Accounting at the Graduate School of Business, Stanford University, Director of the Corporate Governance Research Initiative and Senior Faculty of The Rock Center for Corporate Governance since 2006. From 2005 to 2008, Professor of Accounting at the Graduate School of Business, Stanford University. Prior thereto, Ernst & Young Professor of Accounting at The Wharton School, University of Pennsylvania from 1985 to 2005. | | N/A |
| | | |
| Olivia S. Mitchell (Born 1953) | | Trustee, since 2006; Nominating and Governance Committee Chairman, since 2018 | | International Foundation of Employee Benefit Plans Professor, Wharton School of the University of Pennsylvania since 1993. Director of Wharton’s Pension Research Council and Boettner Center on Pensions & Retirement Research, and Research Associate at the National Bureau of Economic Research. Previously, Cornell University Professor from 1978 to 1993. | | N/A |
| | | |
| Timothy J. Penny (Born 1951) | | Trustee, since 1996; Chairman, since 2018 | | President and Chief Executive Officer of Southern Minnesota Initiative Foundation, anon-profit organization, since 2007. Member of the Board of Trustees of NorthStar Education Finance, Inc., anon-profit organization, since 2007. | | N/A |
| | | |
| James G. Polisson (Born 1959) | | Trustee, since 2018 | | Retired. Chief Marketing Officer, Source (ETF) UK Services, Ltd, from 2015 to 2017. From 2012 to 2015, Principal of The Polisson Group, LLC, a management consulting, corporate advisory and principal investing company. Chief Executive Officer and Managing Director at Russell Investments, Global Exchange Traded Funds from 2010 to 2012. Managing Director of Barclays Global Investors from 1998 to 2010 and Global Chief Marketing Officer for iShares and Barclays Global Investors from 2000 to 2010. Trustee of the San Francisco Mechanics’ Institute, anon-profit organization, from 2013 to 2015. Board member of the Russell Exchange Traded Fund Trust from 2011 to 2012. Director of Barclays Global Investors Holdings Deutschland GmbH from 2006 to 2009. Mr. Polisson is an attorney and has a retired status with the Massachusetts and District of Columbia Bar Associations. | | N/A |
| * | Length of service dates reflect the Trustee’s commencement of service with the Trust’s predecessor entities, where applicable. |
Wells Fargo Capital Growth Fund | 31
Other information (unaudited)
Officers
| | | | |
Name and year of birth | | Position held and
length of service | | Principal occupations during past five years or longer |
| | |
Andrew Owen (Born 1960) | | President, since 2017 | | Executive Vice President of Wells Fargo & Company and Head of Affiliated Managers, Wells Fargo Asset Management, since 2014. In addition, Mr. Owen is currently President, Chief Executive Officer and Director of Wells Fargo Funds Management, LLC since 2017. Prior thereto, Executive Vice President responsible for marketing, investments and product development for Wells Fargo Funds Management, LLC, from 2009 to 2014. |
| | |
| Jeremy DePalma1 (Born 1974) | | Treasurer, since 2012 | | Senior Vice President of Wells Fargo Funds Management, LLC since 2009. Senior Vice President of Evergreen Investment Management Company, LLC from 2008 to 2010 and head of the Fund Reporting and Control Team within Fund Administration from 2005 to 2010. |
| | |
| Alexander Kymn (Born 1973) | | Secretary and Chief Legal Officer, since 2018 | | Senior Company Counsel of Wells Fargo Bank, N.A. since 2018 (previously Senior Counsel from 2007 to 2018). Vice President of Wells Fargo Funds Management, LLC from 2008 to 2014. |
| | |
| Michael H. Whitaker(Born 1967) | | Chief Compliance Officer, since 2016 | | Senior Vice President and Chief Compliance Officer since 2016. Senior Vice President and Chief Compliance Officer for Fidelity Investments from 2007 to 2016. |
| | |
David Berardi (Born 1975) | | Assistant Treasurer, since 2009 | | Vice President of Wells Fargo Funds Management, LLC since 2009. Vice President of Evergreen Investment Management Company, LLC from 2008 to 2010. Manager of Fund Reporting and Control for Evergreen Investment Management Company, LLC from 2004 to 2010. |
| 1 | Jeremy DePalma acts as Treasurer of 87 funds and Assistant Treasurer of 65 funds in the Fund Complex. |
| 2 | The Statement of Additional Information includes additional information about the Trustees and is available, without charge, upon request, by calling1-800-222-8222 or by visiting the website atwfam.com. |
32 | Wells Fargo Capital Growth Fund
Other information (unaudited)
BOARD CONSIDERATION OF INVESTMENT MANAGEMENT ANDSUB-ADVISORY AGREEMENTS:
Wells Fargo Capital Growth Fund
Under the Investment Company Act of 1940 (the “1940 Act”), the Board of Trustees (the “Board”) of Wells Fargo Funds Trust (the “Trust”) must determine annually whether to approve the continuation of the Trust’s investment management andsub-advisory agreements. In this regard, at anin-person meeting held on May21-22, 2019 (the “Meeting”), the Board, all the members of which have no direct or indirect interest in the investment management andsub-advisory agreements and are not “interested persons” of the Trust, as defined in the 1940 Act (the “Independent Trustees”), reviewed and approved for Wells Fargo Capital Growth Fund (the “Fund”): (i) an investment management agreement (the “Management Agreement”) with Wells Fargo Funds Management, LLC (“Funds Management”); and (ii) an investmentsub-advisory agreement (the“Sub-Advisory Agreement”) with Wells Capital Management Incorporated (the“Sub-Adviser”), an affiliate of Funds Management. The Management Agreement and theSub-Advisory Agreement are collectively referred to as the “Advisory Agreements.”
At the Meeting, the Board considered the factors and reached the conclusions described below relating to the selection of Funds Management and theSub-Adviser and the approval of the Advisory Agreements. Prior to the Meeting, including at anin-person meeting in April 2019, the Trustees conferred extensively among themselves and with representatives of Funds Management about these matters. Also, the Board has adopted a team-based approach, with each team consisting of asub-set of Trustees, to assist the full Board in the discharge of its duties in reviewing investment performance and other matters throughout the year. The Independent Trustees were assisted in their evaluation of the Advisory Agreements by independent legal counsel, from whom they received separate legal advice and with whom they met separately.
In providing information to the Board, Funds Management and theSub-Adviser were guided by a detailed set of requests for information submitted to them by independent legal counsel on behalf of the Independent Trustees at the start of the Board’s annual contract renewal process earlier in 2019. In considering and approving the Advisory Agreements, the Trustees considered the information they believed relevant, including but not limited to the information discussed below. The Board considered not only the specific information presented in connection with the Meeting, but also the knowledge gained over time through interaction with Funds Management and theSub-Adviser about various topics. In this regard, the Board reviewed reports of Funds Management at each of its quarterly meetings, which included, among other things, portfolio reviews and investment performance reports. In addition, the Board and the teams mentioned above confer with portfolio managers at various times throughout the year. The Board did not identify any particular information or consideration that wasall-important or controlling, and each individual Trustee may have attributed different weights to various factors.
After its deliberations, the Board unanimously approved the continuation of the Advisory Agreements for aone-year term and determined that the compensation payable to Funds Management and theSub-Adviser under each of the Advisory Agreements was reasonable. The Board considered the approval of the Advisory Agreements for the Fund as part of its consideration of agreements for funds across the complex, but its approvals were made on afund-by-fund basis. The following summarizes a number of important, but not necessarily all, factors considered by the Board in support of its approvals.
Nature, extent and quality of services
The Board received and considered various information regarding the nature, extent and quality of services provided to the Fund by Funds Management and theSub-Adviser under the Advisory Agreements. This information included a description of the investment advisory services and Fund-level administrative services covered by the Management Agreement, as well as, among other things, a summary of the background and experience of senior management of Wells Fargo Asset Management (“WFAM”), of which Funds Management and theSub-Adviser are a part, a summary of investments made in the business of WFAM, a summary of certain organizational and personnel changes involving Funds Management and theSub-Adviser, and a description of Funds Management’s and theSub-Adviser’s business continuity planning programs and of their approaches to data privacy and cybersecurity. The Board received and reviewed information about Funds Management’s role as administrator of the Fund’s liquidity risk management program. The Board also considered the qualifications, background, tenure and responsibilities of each of the portfolio managers primarily responsible for theday-to-day portfolio management of the Fund.
The Board evaluated the ability of Funds Management and theSub-Adviser to attract and retain qualified investment professionals, including research, advisory and supervisory personnel. The Board further considered the compliance programs and compliance records of Funds Management and theSub-Adviser. In addition, the Board took into account the full range of services provided to the Fund by Funds Management and its affiliates.
Wells Fargo Capital Growth Fund | 33
Other information (unaudited)
Fund investment performance and expenses
The Board considered the investment performance results for the Fund over various time periods ended December 31, 2018. The Board considered these results in comparison to the investment performance of funds in a universe that was determined by Broadridge Inc. (“Broadridge”) to be similar to the Fund (the “Universe”), and in comparison to the Fund’s benchmark index and to other comparative data. Broadridge is an independent provider of investment company data. The Board received a description of the methodology used by Broadridge to select the mutual funds in the performance Universe. The Board noted that the investment performance of the Fund (Administrator Class) was higher than or in range of the average investment performance of the Universe for all periods under review. The Board also noted that the investment performance of the Fund was lower than its benchmark index, the Russell 1000® Growth Index, for the five andten-year periods under review, but higher than its benchmark for theone- and three-year periods under review.
The Board received information concerning, and discussed factors contributing to, the underperformance of the Fund relative to the benchmark for the periods identified above. The Board took note of the explanations for the relative underperformance during these periods, including with respect to investment decisions and market factors that affected the Fund’s investment performance. The Board also took note of the Fund’s higher or in range performance relative to the Universe for all periods under review and the index over theone- and three-year time periods under review.
The Board also received and considered information regarding the Fund’s net operating expense ratios and their various components, including actual management fees, custodian and othernon-management fees, and Rule12b-1 andnon-Rule 12b-1 shareholder service fees. The Board considered these ratios in comparison to the median ratios of funds in class-specific expense groups that were determined by Broadridge to be similar to the Fund (the “Groups”). The Board received a description of the methodology used by Broadridge to select the mutual funds in the expense Groups and an explanation of how funds comprising expense groups and their expense ratios may vary fromyear-to-year. Based on the Broadridge reports, the Board noted that the net operating expense ratios of the Fund were lower than the median net operating expense ratios of the expense Groups for each share class.
The Board took into account the Fund’s investment performance and expense information provided to it among the factors considered in deciding tore-approve the Advisory Agreements.
Investment management andsub-advisory fee rates
The Board reviewed and considered the contractual fee rates payable by the Fund to Funds Management under the Management Agreement, as well as the contractual fee rates payable by the Fund to Funds Management for class-level administrative services under a Class-Level Administration Agreement, which include, among other things, class-level transfer agency andsub-transfer agency costs (collectively, the “Management Rates”). The Board also reviewed and considered the contractual investmentsub-advisory fee rates that are payable by Funds Management to theSub-Adviser for investmentsub-advisory services.
Among other information reviewed by the Board was a comparison of the Fund’s Management Rates with the average contractual investment management fee rates of funds in the expense Groups at a common asset level as well as transfer agency costs of the funds in the expense Groups. The Board noted that the Management Rates of the Fund were lower than or in range of the sum of these average rates for the Fund’s expense Groups for all share classes.
The Board also received and considered information about the portion of the total management fee that was retained by Funds Management after payment of the fee to theSub-Adviser forsub-advisory services. In assessing the reasonableness of this amount, the Board received and evaluated information about the nature and extent of responsibilities retained and risks assumed by Funds Management and not delegated to or assumed by theSub-Adviser, and about Funds Management’son-going oversight services. Given the affiliation between Funds Management and theSub-Adviser, the Board ascribed limited relevance to the allocation of fees between them.
The Board also received and considered information about the nature and extent of services offered and fee rates charged by Funds Management and theSub-Adviser to other types of clients with investment strategies similar to those of the Fund. In this regard, the Board received information about the significantly greater scope of services, and compliance, reporting and other legal burdens and risks of managing proprietary mutual funds compared with those associated with managing assets of other types of clients, including third-partysub-advised fund clients andnon-mutual fund clients such as institutional separate accounts.
Based on its consideration of the factors and information it deemed relevant, including those described here, the Board determined that the compensation payable to Funds Management under the Management Agreement and to theSub-Adviser under theSub-Advisory Agreement was reasonable.
34 | Wells Fargo Capital Growth Fund
Other information (unaudited)
Profitability
The Board received and considered information concerning the profitability of Funds Management, as well as the profitability of both WFAM and Wells Fargo & Co. (“Wells Fargo”) from providing services to the fund family as a whole. The Board noted that theSub-Adviser’s profitability information with respect to providing services to the Fund and other funds in the family was subsumed in the WFAM and Wells Fargo profitability analysis.
Funds Management reported on the methodologies and estimates used in calculating profitability, including a description of the methodology used to allocate certain expenses. Among other things, the Board noted that the levels of profitability reported on afund-by-fund basis varied widely, depending on factors such as the size, type and age of fund. Based on its review, the Board did not deem the profits reported by Funds Management, WFAM or Wells Fargo from services provided to the Fund to be at a level that would prevent it from approving the continuation of the Advisory Agreements.
Economies of scale
The Board received and considered information about the potential for Funds Management to experience economies of scale in the provision of management services to the Fund, the difficulties of calculating economies of scale at an individual fund level, and the extent to which potential scale benefits are shared with shareholders. The Board noted the existence of breakpoints in the Fund’s management fee structure, which operate generally to reduce the Fund’s expense ratios as the Fund grows in size. The Board considered that in addition to management fee breakpoints, Funds Management shares potential economies of scale from its management business in a variety of ways, including through fee waiver and expense reimbursement arrangements, services that benefit shareholders, competitive management fee rates set at the outset without regard to breakpoints, and investments in the business intended to enhance services available to shareholders.
The Board concluded that Funds Management’s arrangements with respect to the Fund, including contractual breakpoints, constituted a reasonable approach to sharing potential economies of scale with the Fund and its shareholders.
Other benefits to Funds Management and theSub-Adviser
The Board received and considered information regarding potential“fall-out” or ancillary benefits received by Funds Management and its affiliates, including theSub-Adviser, as a result of their relationships with the Fund. Ancillary benefits could include, among others, benefits directly attributable to other relationships with the Fund and benefits potentially derived from an increase in Funds Management’s and theSub-Adviser’s business as a result of their relationships with the Fund. The Board noted that various affiliates of Funds Management may receive distribution-related fees, shareholder servicing payments andsub-transfer agency fees in respect of shares sold or held through them and services provided.
The Board also reviewed information about soft dollar credits earned and utilized by theSub-Adviser, fees earned by Funds Management and theSub-Adviser from managing a private investment vehicle for the fund family’s securities lending collateral, and commissions earned by an affiliated broker from portfolio transactions.
Based on its consideration of the factors and information it deemed relevant, including those described here, the Board did not find that any ancillary benefits received by Funds Management and its affiliates, including theSub-Adviser, were unreasonable.
Conclusion
At the Meeting, after considering the above-described factors and based on its deliberations and its evaluation of the information described above, the Board unanimously approved the continuation of the Advisory Agreements for aone-year term and determined that the compensation payable to Funds Management and theSub-Adviser under each of the Advisory Agreements was reasonable.
Wells Fargo Capital Growth Fund | 35
This page is intentionally left blank.

For more information
More information about Wells Fargo Funds is available free upon request. To obtain literature, please write, visit the Fund’s website, or call:
Wells Fargo Funds
P.O. Box 219967
Kansas City, MO 64121-9967
Website:wfam.com
Individual investors:1-800-222-8222
Retail investment professionals:1-888-877-9275
Institutional investment professionals:1-866-765-0778

This report and the financial statements contained herein are submitted for the general information of the shareholders of the Fund. If this report is used for promotional purposes, distribution of the report must be accompanied or preceded by a current prospectus. Before investing, please consider the investment objectives, risks, charges, and expenses of the investment. For a current prospectus and, if available, a summary prospectus, containing this information, call1-800-222-8222 or visit the Fund’s website atwfam.com. Read the prospectus carefully before you invest or send money.
Wells Fargo Asset Management (WFAM) is the trade name for certain investment advisory/management firms owned by Wells Fargo & Company. These firms include but are not limited to Wells Capital Management Incorporated and Wells Fargo Funds Management, LLC. Certain products managed by WFAM entities are distributed by Wells Fargo Funds Distributor, LLC (a broker-dealer and Member FINRA).
This material is for general informational and educational purposes only and is NOT intended to provide investment advice or a recommendation of any kind—including a recommendation for any specific investment, strategy, or plan.
INVESTMENT PRODUCTS: NOT FDIC INSURED ◾ NO BANK GUARANTEE ◾ MAY LOSE VALUE
© 2019 Wells Fargo Funds Management, LLC. All rights reserved.
405475 09-19
A200/AR200 07-19
Annual Report
July 31, 2019
Wells Fargo
Disciplined U.S. Core Fund
Beginning on January 1, 2021, as permitted by new regulations adopted by the Securities and Exchange Commission, paper copies of the Wells Fargo Funds’ annual and semi-annual shareholder reports issued after this date will no longer be sent by mail, unless you specifically request paper copies of the reports. Instead, the reports will be made available on the Funds’ website, and you will be notified by mail each time a report is posted and provided with a website address to access the report.
If you already elected to receive shareholder reports electronically, you will not be affected by this change and you need not take any action. You may elect to receive shareholder reports and other communications from the Fund electronically at any time by contacting your financial intermediary (such as a broker-dealer or bank) or, if you are a direct investor, by calling1-800-222-8222 or by enrolling at wellsfargo.com/advantagedelivery.
You may elect to receive all future reports in paper free of charge. If you invest through a financial intermediary, you can contact your financial intermediary to request that you continue to receive paper copies of your shareholder reports; if you invest directly with the Fund, you can call 1-800-222-8222. Your election to receive reports in paper will apply to all Wells Fargo Funds held in your account with your financial intermediary or, if you are a direct investor, to all Wells Fargo Funds that you hold.
|
|
|
Reduce clutter. Save trees. |
Sign up for electronic delivery of prospectuses and shareholder reports atwellsfargo.com/
advantagedelivery |
The views expressed and any forward-looking statements are as of July 31, 2019, unless otherwise noted, and are those of the Fund managers and/or Wells Fargo Asset Management. Discussions of individual securities, or the markets generally, or any Wells Fargo Fund are not intended as individual recommendations. Future events or results may vary significantly from those expressed in any forward-looking statements. The views expressed are subject to change at any time in response to changing circumstances in the market. Wells Fargo Asset Management and the Fund disclaim any obligation to publicly update or revise any views expressed or forward-looking statements.
INVESTMENT PRODUCTS: NOT FDIC INSURED ◾ NO BANK GUARANTEE ◾ MAY LOSE VALUE
Wells Fargo Disciplined U.S. Core Fund | 1
Letter to shareholders (unaudited)

Andrew Owen
President
Wells Fargo Funds
Dear Shareholder:
We are pleased to offer you this annual report for the Wells Fargo Disciplined U.S. Core Fund for the12-month period that ended July 31, 2019. After the first six months of the period yielded eitherlow-single-digit or negative investment returns, U.S. stock and global bond investors generally enjoyed a recovery during the final six months amid continued concerns about global economic growth, international trade, geopolitical tensions, and bouts of market volatility. These concerns negatively influenced international equity markets.
For the period, U.S. stocks, based on the S&P 500 Index,1 gained 7.99% and international stocks, as measured by the MSCI ACWI ex USA Index (Net),2 fell 2.27%. The MSCI EM Index (Net)3 slipped 2.18%. For bond investors, the Bloomberg Barclays U.S. Aggregate Bond Index4 added 8.08%, the Bloomberg Barclays Global Aggregateex-USD Index5 added 3.74%, the Bloomberg Barclays Municipal Bond Index6 gained 7.31%, and the ICE BofAML U.S. High Yield Index7 added 6.94%.
Entering the fourth quarter of 2018, economic data was encouraging.
Domestic equity investors entered the fourth quarter of 2018 with reasons to be optimistic. The U.S. Bureau of Economic Analysis reported second-quarter annualized gross domestic product (GDP) growth of 4.2%. Hiring improved. Unemployment declined. Consumer confidence and spending increased. Third-quarter corporate earnings reports were generally positive. U.S. trade negotiations with Mexico and Canada progressed. The U.S. Federal Reserve (Fed) raised the federal funds rate by 25 basis points (bps; 100 bps equal 1.00%) to a target range of between 2.00% and 2.25% in September 2018, one of four rate increases implemented during the calendar year, a sign of its confidence in the strength of the U.S. economy.
Investors in international markets were not as confident. Tensions between the U.S. and China increased. The U.S. imposed $200 billion in tariffs on Chinese goods. China reacted with $60 billion in tariffs on U.S. goods. Economic growth in China caused concern. In September 2018, international investors began to factor a number of disconcerting economic and business data points: lower July manufacturers’ and industrial orders in Germany; falling purchasing manager index numbers for August from the United Kingdom, China, and India; and declining household spending for August in Japan. Taken together, the data fed growing concerns over slowing global growth that unnerved investors.
| 1 | The S&P 500 Index consists of 500 stocks chosen for market size, liquidity, and industry group representation. It is a market-value-weighted index with each stock’s weight in the index proportionate to its market value. You cannot invest directly in an index. |
| 2 | The Morgan Stanley Capital International (MSCI) All Country World Index (ACWI) ex USA Index (Net) is a free-float-adjusted market-capitalization weighted index that is designed to measure the equity market performance of developed and emerging markets, excluding the U.S. Source: MSCI. MSCI makes no express or implied warranties or representations and shall have no liability whatsoever with respect to any MSCI data contained herein. The MSCI data may not be further redistributed or used as a basis for other indices or any securities or financial products. This report is not approved, reviewed, or produced by MSCI. You cannot invest directly in an index. |
| 3 | The MSCI Emerging Markets (EM) Index (Net) is a free-float-adjusted market-capitalization-weighted index that is designed to measure the equity market performance of emerging markets. You cannot invest directly in an index. |
| 4 | The Bloomberg Barclays U.S. Aggregate Bond Index is a broad-based benchmark that measures the investment-grade, U.S. dollar-denominated, fixed-rate taxable bond market, including Treasuries, government-related and corporate securities, mortgage-backed securities (agency fixed-rate and hybrid adjustable-rate mortgage pass-throughs), asset-backed securities, and commercial mortgage-backed securities. You cannot invest directly in an index. |
| 5 | The Bloomberg Barclays Global Aggregateex-USD Index is an unmanaged index that provides a broad-based measure of the global investment-grade fixed-income markets excluding the U.S. dollar-denominated debt market. You cannot invest directly in an index. |
| 6 | The Bloomberg Barclays Municipal Bond Index is an unmanaged index composed of long-termtax-exempt bonds with a minimum credit rating of Baa. You cannot invest directly in an index. |
| 7 | The ICE BofAML U.S. High Yield Index is a market-capitalization-weighted index of domestic and Yankee high-yield bonds. The index tracks the performance of high-yield securities traded in the U.S. bond market. You cannot invest directly in an index. Copyright 2019. ICE Data Indices, LLC. All rights reserved. |
2 | Wells Fargo Disciplined U.S. Core Fund
Letter to shareholders (unaudited)
Global markets suffered during the fourth quarter of 2018.
November’s U.S. midterm elections shifted control of the House of Representatives from Republicans to Democrats, presaging partisan clashes that followed and caused uncertainty among investors. Third-quarter U.S. GDP was announced at an annualized 3.4% rate, lower than the second-quarter rate. Brexit efforts stalled ahead of the March 2019 deadline. The People’s Bank of China cut reserve requirement ratios, accelerated infrastructure spending, and cut taxes even as the value of the yuan declined to low levels last seen in 2008. A partial U.S. government shutdown driven by partisan policy disputes extended into January.
The combination of news in the U.S. and generally weak economic indicators outside of the U.S. caused investors to seek safe havens. December’s S&P 500 Index performance was the worst since 1931. Globally, fixed-income investments fared better than stocks during the last two months of the year. The Fed increased the federal funds rate by 25 bps in December to a target range of between 2.25% and 2.50%.
The market climbs a wall of worry.
Investors entered 2019 with reasons to be concerned. Investment returns appeared to reaffirm the adage that markets climb a wall of worry. The S&P 500 Index gained 8.01% for the month of January, the best monthly performance in 30 years. Returns for the MSCI ACWI ex USA Index (Net), the Bloomberg Barclays U.S. Aggregate Bond Index, and the Bloomberg Barclays Global Aggregateex-USD Index also were positive.
In February 2019, signs of slowing global growth grew more ominous. The Bureau of Economic Analysis announced fourth-quarter 2018 GDP grew at an annualized 2.2% rate, down from the levels of the prior two quarters. In a February report, the Bank of England forecasted the slowest growth since the financial crisis for 2019. China and the U.S. continued to wrangle over trade issues.
By the end of March 2019, a combination of dovish Fed sentiment and steady, if not spectacular, U.S. economic and business metrics reinforced investors’ confidence. Monthly job creation data and corporate profits, while less consistent than during 2018, were solid. China announced a roughly $300 billion stimulus package through tax and fee cuts intended to reinvigorate economic growth. During April 2019, favorable sentiment found additional support in reports of sustained low inflation, solid employment data, and first-quarter U.S. GDP of an annualized rate of 3.2%.
During May 2019, markets tumbled on mixed investment signals. In the U.S., partisan wrangling ramped up as Democrats and Republicans set their sights on 2020 presidential politics. The U.K.’s Brexit caused Prime Minister Theresa May to resign. The European Commission downgraded the 2019 growth forecast to 1.2%. The U.S. increased tariffs on products from China, China responded, and then talks broke down. President Donald Trump threatened to turn his foreign policy tariff tool to Mexico over immigration issues.
As had been the case during most of 2019 to date, just as the investment horizon appeared to darken, sentiment turned and U.S. equity markets gained during June and July. The gains, primarily driven by geopolitical and monetary policy events, pushed equity markets to new highs.
President Mario Draghi of the European Central Bank said that if the outlook doesn’t improve, the bank will cut rates or buy more assets to prop up inflation. President Trump backed off of tariff threats against Mexico and China. In the U.S., the Fed implemented a 0.25% federal funds rate cut in July 2019.
“December’s S&P 500 Index performance was the worst since 1931.”
“The S&P 500 Index gained 8.01% for the month of January, the best monthly performance in 30 years.”
Wells Fargo Disciplined U.S. Core Fund | 3
Letter to shareholders (unaudited)
Later in July 2019, the U.S. reversed course and threatened to impose higher tariffs on China’s exports after talks failed. China responded with tariff threats of its own and devalued the renminbi, a move that roiled global markets. Despite the accommodative approach of central banks, investors continued to have misgivings about the durability of economic growth globally and a pervasively cautious tone influenced the world’s equity and fixed-income markets.
Don’t let short-term uncertainty derail long-term investment goals.
Periods of investment uncertainty can present challenges, but experience has taught us that maintaining long-term investment goals can be an effective way to plan for the future. To help you create a sound strategy based on your personal goals and risk tolerance, Wells Fargo Funds offers more than 100 mutual funds spanning a wide range of asset classes and investment styles. Although diversification cannot guarantee an investment profit or prevent losses, we believe it can be an effective way to manage investment risk and potentially smooth out overall portfolio performance. We encourage investors to know their investments and to understand that appropriate levels of risk-taking may unlock opportunities.
Thank you for choosing to invest with Wells Fargo Funds. We appreciate your confidence in us and remain committed to helping you meet your financial needs.
Sincerely,

Andrew Owen
President
Wells Fargo Funds
|
|
|
For further information about your Fund, contact your investment professional, visit our website at wfam.com, or call us directly at1-800-222-8222. |
4 | Wells Fargo Disciplined U.S. Core Fund
This page is intentionally left blank.
Performance highlights (unaudited)
Investment objective
The Fund seeks long-term capital appreciation.
Manager
Wells Fargo Funds Management, LLC
Subadviser
Wells Capital Management Incorporated
Portfolio managers
Justin Carr, CFA®‡
Greg W. Golden, CFA®‡
Robert M. Wicentowski, CFA®‡*
Average annual total returns (%) as of July 31, 2019
| | | | | | | | | | | | | | | | | | | | | | | | | | | | | | | | | | |
| | | | |
| | | | | Including sales charge | | | Excluding sales charge | | | Expense ratios1 (%) | |
| | | | | | | | | |
| | | Inception date | | 1 year | | | 5 year | | | 10 year | | | 1 year | | | 5 year | | | 10 year | | | Gross | | | Net2 | |
| | | | | | | | | | |
| Class A (EVSAX)3 | | 2-28-1990 | | | -1.69 | | | | 8.61 | | | | 12.46 | | | | 4.31 | | | | 9.90 | | | | 13.12 | | | | 0.83 | | | | 0.83 | |
| | | | | | | | | | |
| Class C (EVSTX)3 | | 6-30-1999 | | | 2.59 | | | | 9.09 | | | | 12.28 | | | | 3.59 | | | | 9.09 | | | | 12.28 | | | | 1.58 | | | | 1.58 | |
| | | | | | | | | | |
| Class R (EVSHX)3,4 | | 9-30-2015 | | | – | | | | – | | | | – | | | | 4.07 | | | | 9.64 | | | | 12.81 | | | | 1.08 | | | | 1.08 | |
| | | | | | | | | | |
| Class R6 (EVSRX)3,5 | | 9-30-2015 | | | – | | | | – | | | | – | | | | 4.77 | | | | 10.39 | | | | 13.58 | | | | 0.40 | | | | 0.40 | |
| | | | | | | | | | |
| Administrator Class (EVSYX)3 | | 2-21-1995 | | | – | | | | – | | | | – | | | | 4.43 | | | | 10.04 | | | | 13.29 | | | | 0.75 | | | | 0.74 | |
| | | | | | | | | | |
| Institutional Class (EVSIX)3,6 | | 7-30-2010 | | | – | | | | – | | | | – | | | | 4.69 | | | | 10.32 | | | | 13.55 | | | | 0.50 | | | | 0.48 | |
| | | | | | | | | | |
| S&P 500 Index7 | | – | | | – | | | | – | | | | – | | | | 7.99 | | | | 11.34 | | | | 14.03 | | | | – | | | | – | |
Figures quoted represent past performance, which is no guarantee of future results, and do not reflect taxes that a shareholder may pay on fund distributions or the redemption of fund shares. Investment return and principal value of an investment will fluctuate so that an investor’s shares, when redeemed, may be worth more or less than their original cost. Performance shown without sales charges would be lower if sales charges were reflected. Current performance may be lower or higher than the performance data quoted, which assumes the reinvestment of dividends and capital gains. Currentmonth-end performance is available on the Fund’s website,wfam.com.
Index returns do not include transaction costs associated with buying and selling securities, any mutual fund fees or expenses, or any taxes. It is not possible to invest directly in an index.
For Class A shares, the maximumfront-end sales charge is 5.75%. For Class C shares, the maximum contingent deferred sales charge is 1.00%. Performance including a contingent deferred sales charge assumes the sales charge for the corresponding time period. Class R, Class R6, Administrator Class, and Institutional Class shares are sold without afront-end sales charge or contingent deferred sales charge.
Stock values fluctuate in response to the activities of individual companies and general market and economic conditions. The use of derivatives may reduce returns and/or increase volatility. Consult the Fund’s prospectus for additional information on these and other risks.
Please see footnotes on page 7.
6 | Wells Fargo Disciplined U.S. Core Fund
Performance highlights (unaudited)
|
|
| Growth of $10,000 investment as of July 31, 20198 |
|
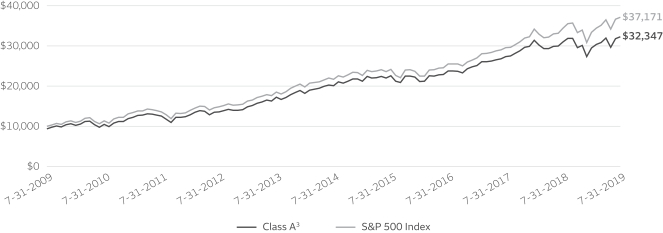
|
| ‡ | CFA® and Chartered Financial Analyst® are trademarks owned by CFA Institute. |
| * | Mr. Wicentowski became a portfolio manager of the Fund on July 1, 2019. |
| 1 | Reflects the expense ratios as stated in the most recent prospectuses. The expense ratios shown are subject to change and may differ from the annualized expense ratios shown in the financial highlights of this report. |
| 2 | The manager has contractually committed through November 30, 2019, to waive fees and/or reimburse expenses to the extent necessary to cap the expenses of each class after fee waivers at 0.87% for Class A, 1.62% for Class C, 1.12% for Class R, 0.43% for Class R6, 0.74% for Administrator Class, and 0.48% for Institutional Class. Brokerage commissions, stamp duty fees, interest, taxes, acquired fund fees and expenses (if any), and extraordinary expenses are excluded from the expense cap. Prior to or after the commitment expiration date, the cap may be increased or the commitment to maintain the cap may be terminated only with the approval of the Board of Trustees. Without this cap, the Fund’s returns would have been lower. The expense ratio paid by an investor is the net expense ratio (the total annual fund operating expenses after fee waivers) as stated in the prospectuses. |
| 3 | Historical performance shown prior to July 19, 2010, is based on the performance of the Fund’s predecessor, Evergreen Enhanced S&P 500 Fund. |
| 4 | Historical performance shown for Class R shares prior to their inception reflects the performance of Administrator Class shares, adjusted to reflect higher expenses applicable to Class R shares. |
| 5 | Historical performance shown for Class R6 shares prior to their inception reflects the performance of Institutional Class shares, and includes the higher expenses applicable to Institutional Class shares. If these expenses had not been included, returns for Class R6 shares would be higher. |
| 6 | Historical performance shown for Institutional Class shares prior to their inception reflects the performance of Administrator Class shares, and includes the higher expenses applicable to Administrator Class shares. If these expenses had not been included, returns for Institutional Class shares would be higher. |
| 7 | The S&P 500 Index consists of 500 stocks chosen for market size, liquidity, and industry group representation. It is a market-value weighted index with each stock’s weight in the index proportionate to its market value. You cannot invest directly in an index. |
| 8 | The chart compares the performance of Class A shares for the most recent ten years with the S&P 500 Index. The chart assumes a hypothetical investment of $10,000 in Class A shares and reflects all operating expenses and assumes the maximum initial sales charge of 5.75%. |
| 9 | The ten largest holdings, excluding cash, cash equivalents and any money market funds, are calculated based on the value of the investments divided by total net assets of the Fund. Holdings are subject to change and may have changed since the date specified. |
| 10 | Amounts are calculated based on the total long-term investments of the Fund. These amounts are subject to change and may have changed since the date specified. |
| * | This security was no longer held at the end of the reporting period. |
Wells Fargo Disciplined U.S. Core Fund | 7
Performance highlights (unaudited)
MANAGER’S DISCUSSION
Fund highlights
| ∎ | | The Fund underperformed its benchmark, the S&P 500 Index, for the12-month period that ended July 31, 2019. |
| ∎ | | Stock selection was the main performance detractor, adding value in only 3 out of 11 sectors. Favorable stock selection came from energy, real estate, and financials. Notable weakness in stock selection was found within materials, consumer staples, and industrials. |
| ∎ | | Sector weighting decisions were modestly dilutive to performance. Contributions to total return came from being overweight real estate and underweight within the financials and industrials sectors. Performance detractors included being overweight energy and underweight within materials, consumer discretionary, and consumer staples. Variation in sector weights were relatively small, as is typical for the strategy. |
The combination of a moderate-growth economy and potential benefits of tax reform boosted investor sentiment and broad market averages over the trailing12-month period. Both manufacturing and retail sales were generally positive and continued job growth offset concerns from the U.S. Federal Reserve’s (Fed’s) stated goal of normalizing interest rates.
| | | | |
|
| Ten largest holdings(%) as of July 31, 20199 | |
| | |
Microsoft Corporation | | | 4.80 | |
| | |
Apple Incorporated | | | 3.86 | |
| | |
Amazon.com Incorporated | | | 3.01 | |
| | |
Berkshire Hathaway Incorporated Class B | | | 1.91 | |
| | |
Johnson & Johnson | | | 1.85 | |
| | |
JPMorgan Chase & Company | | | 1.80 | |
| | |
Alphabet Incorporated Class C | | | 1.79 | |
| | |
Alphabet Incorporated Class A | | | 1.73 | |
| | |
Exxon Mobil Corporation | | | 1.68 | |
| | |
Facebook Incorporated Class A | | | 1.63 | |
Stock selection detracted from performance while sector allocation decisions helped.
Stock selection was the main detractor from performance during the period. The most notable weakness came from the materials sector, specifically due to our holdings of several chemical companies like Huntsman Corporation*, The Mosaic Company*, and Trinseo S.A.* Within consumer staples, performance headwinds came from the beverage industry, where the portfolio’s underweight to The Coca-Cola Company and an overweight position in Molson Coors Brewing Company both detracted from performance.
|
|
| Sector distribution as of July 31, 201910 |
|
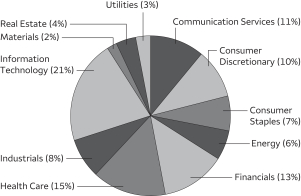 |
Stock selection within the financial sector also contributed to relative results. The portfolio benefited from an underweight to banks and avoiding some of the weakest names like SVB Financial Group, Comerica Incorporated, and Zions Bancorporation. Real estate generated the best sector performance. Having an overweight to this sector, in addition to positive stock selection with overweight positions in American Tower Corporation; Crown Castle International Corporation; and Prologis, Incorporated, proved beneficial. The Fund benefited from being overweight within energy in the oil gas and consumable fuels industry, with an overweight position in Kinder Morgan, Incorporated, which turned in the best performance within the group.
Our market outlook is still somewhat favorable.
During the second quarter of 2019, U.S. and international equity markets advanced slightly as investors attempted to balance favorable market data with uncertainty surrounding a slowing global economy, international tariffs, and potential monetary policy actions by the U.S. Federal Open Market Committee (FOMC). In general,large-cap names outperformed small caps and growth continued to outperform value. The yield on the U.S.10-year Treasury note continued to decline, ending the quarter near 2%. Oil prices fell to start the quarter then rebounded in June following heightened tensions between the U.S. and Iran in the Persian Gulf. U.S. economic data reported throughout the quarter indicated slowing growth. At its June meeting, the FOMC held the target for the federal funds rate to a range of 2.25% to 2.50%. The FOMC noted solid job gains, low unemployment,
Please see footnotes on page 7.
8 | Wells Fargo Disciplined U.S. Core Fund
Performance highlights (unaudited)
and inflation that has declined below 2%. In light of muted inflation pressures and global economic developments, the FOMC revised its interest rate projections downward, indicating support for continued economic expansion. For first-quarter 2019, the blended earnings growth rate for the S&P 500 Index was-0.4%, marking the first year-over-year decline in earnings for the index since second-quarter 2016 when the rate was-3.2%.
We strive to add value relative to the benchmark.
Within the Fund, we strive to add value relative to the benchmark through a full market cycle, independent of overall market direction or movements by style (growth or value) or size (large or small). Our investment process will continue to focus on building a stock portfolio that emphasizes attractive valuations, earnings growth, earnings and sales momentum, earnings quality, and trading momentum. Based on our research and experience, we believe the Fund may provide shareholders with meaningful capital appreciation over time.
Wells Fargo Disciplined U.S. Core Fund | 9
Fund expenses (unaudited)
As a shareholder of the Fund, you incur two types of costs: (1) transaction costs, including sales charges (loads) on purchase payments and contingent deferred sales charges (if any) on redemptions and (2) ongoing costs, including management fees, distribution(12b-1) and/or shareholder servicing fees, and other Fund expenses. This example is intended to help you understand your ongoing costs (in dollars) of investing in the Fund and to compare these costs with the ongoing costs of investing in other mutual funds.
The example is based on an investment of $1,000 invested at the beginning of thesix-month period and held for the entire period from February 1, 2019 to July 31, 2019.
Actual expenses
The “Actual” line of the table below provides information about actual account values and actual expenses. You may use the information in this line, together with the amount you invested, to estimate the expenses that you paid over the period. Simply divide your account value by $1,000 (for example, an $8,600 account value divided by $1,000 = 8.6), then multiply the result by the number in the “Actual” line under the heading entitled “Expenses paid during period” for your applicable class of shares to estimate the expenses you paid on your account during this period.
Hypothetical example for comparison purposes
The “Hypothetical” line of the table below provides information about hypothetical account values and hypothetical expenses based on the Fund’s actual expense ratio and an assumed rate of return of 5% per year before expenses, which is not the Fund’s actual return. The hypothetical account values and expenses may not be used to estimate the actual ending account balance or expenses you paid for the period. You may use this information to compare the ongoing costs of investing in the Fund and other funds. To do so, compare this 5% hypothetical example with the 5% hypothetical examples that appear in the shareholder reports of the other funds.
Please note that the expenses shown in the table are meant to highlight your ongoing costs only and do not reflect any transactional costs, such as sales charges (loads) and contingent deferred sales charges. Therefore, the “Hypothetical” line of the table is useful in comparing ongoing costs only and will not help you determine the relative total costs of owning different funds. In addition, if these transactional costs were included, your costs would have been higher.
| | | | | | | | | | | | | | | | |
| | | Beginning
account value
2-1-2019 | | | Ending
account value
7-31-2019 | | | Expenses
paid during
the period¹ | | | Annualized net
expense ratio | |
| | | | | |
Class A | | | | | | | | | | | | | | | | |
| | | | |
Actual | | $ | 1,000.00 | | | $ | 1,095.00 | | | $ | 4.36 | | | | 0.84 | % |
| | | | |
Hypothetical (5% return before expenses) | | $ | 1,000.00 | | | $ | 1,020.63 | | | $ | 4.21 | | | | 0.84 | % |
| | | | | |
Class C | | | | | | | | | | | | | | | | |
| | | | |
Actual | | $ | 1,000.00 | | | $ | 1,091.60 | | | $ | 8.25 | | | | 1.59 | % |
| | | | |
Hypothetical (5% return before expenses) | | $ | 1,000.00 | | | $ | 1,016.91 | | | $ | 7.95 | | | | 1.59 | % |
| | | | | |
Class R | | | | | | | | | | | | | | | | |
| | | | |
Actual | | $ | 1,000.00 | | | $ | 1,094.10 | | | $ | 5.66 | | | | 1.09 | % |
| | | | |
Hypothetical (5% return before expenses) | | $ | 1,000.00 | | | $ | 1,019.39 | | | $ | 5.46 | | | | 1.09 | % |
| | | | | |
Class R6 | | | | | | | | | | | | | | | | |
| | | | |
Actual | | $ | 1,000.00 | | | $ | 1,097.65 | | | $ | 2.13 | | | | 0.41 | % |
| | | | |
Hypothetical (5% return before expenses) | | $ | 1,000.00 | | | $ | 1,022.76 | | | $ | 2.06 | | | | 0.41 | % |
| | | | | |
Administrator Class | | | | | | | | | | | | | | | | |
| | | | |
Actual | | $ | 1,000.00 | | | $ | 1,095.38 | | | $ | 3.84 | | | | 0.74 | % |
| | | | |
Hypothetical (5% return before expenses) | | $ | 1,000.00 | | | $ | 1,021.12 | | | $ | 3.71 | | | | 0.74 | % |
| | | | | |
Institutional Class | | | | | | | | | | | | | | | | |
| | | | |
Actual | | $ | 1,000.00 | | | $ | 1,097.44 | | | $ | 2.50 | | | | 0.48 | % |
| | | | |
Hypothetical (5% return before expenses) | | $ | 1,000.00 | | | $ | 1,022.41 | | | $ | 2.41 | | | | 0.48 | % |
| 1 | Expenses paid is equal to the annualized net expense ratio of each class multiplied by the average account value over the period, multiplied by the number of days in the most recent fiscal half-year divided by the number of days in the fiscal year (to reflect theone-half-year period). |
10 | Wells Fargo Disciplined U.S. Core Fund
Portfolio of investments—July 31, 2019
| | | | | | | | | | | | | | | | |
| | | | | | | | | Shares | | | Value | |
| Common Stocks: 99.50% | | | | | | | | | | | | | | | | |
| | | | |
Communication Services: 10.64% | | | | | | | | | | | | | | | | |
| | | | |
| Diversified Telecommunication Services: 3.00% | | | | | | | | | | | | |
| | | | |
AT&T Incorporated | | | | | | | | | | | 528,554 | | | $ | 17,997,264 | |
| | | | |
Verizon Communications Incorporated | | | | | | | | | | | 305,633 | | | | 16,892,336 | |
| | | | |
| | | | | | | | | | | | | | | 34,889,600 | |
| | | | | | | | | | | | | | | | |
| | | | |
| Entertainment: 0.87% | | | | | | | | | | | | |
| | | | |
The Walt Disney Company | | | | | | | | | | | 70,973 | | | | 10,149,849 | |
| | | | | | | | | | | | | | | | |
| | | | |
| Interactive Media & Services: 5.15% | | | | | | | | | | | | |
| | | | |
Alphabet Incorporated Class A † | | | | | | | | | | | 16,501 | | | | 20,101,518 | |
| | | | |
Alphabet Incorporated Class C † | | | | | | | | | | | 17,041 | | | | 20,733,444 | |
| | | | |
Facebook Incorporated Class A † | | | | | | | | | | | 97,389 | | | | 18,915,865 | |
| | | | |
| | | | | | | | | | | | | | | 59,750,827 | |
| | | | | | | | | | | | | | | | |
| | | | |
| Media: 1.62% | | | | | | | | | | | | |
| | | | |
Comcast Corporation Class A | | | | | | | | | | | 184,632 | | | | 7,970,563 | |
| | | | |
Discovery Communications Incorporated Class A Ǡ | | | | | | | | | | | 197,222 | | | | 5,977,799 | |
| | | | |
News Corporation Class A | | | | | | | | | | | 366,260 | | | | 4,819,982 | |
| | | | |
| | | | | | | | | | | | | | | 18,768,344 | |
| | | | | | | | | | | | | | | | |
| | | | |
Consumer Discretionary: 10.31% | | | | | | | | | | | | | | | | |
| | | | |
| Automobiles: 1.40% | | | | | | | | | | | | |
| | | | |
Ford Motor Company | | | | | | | | | | | 763,008 | | | | 7,271,466 | |
| | | | |
General Motors Company | | | | | | | | | | | 223,583 | | | | 9,019,338 | |
| | | | |
| | | | | | | | | | | | | | | 16,290,804 | |
| | | | | | | | | | | | | | | | |
| | | | |
| Hotels, Restaurants & Leisure: 1.03% | | | | | | | | | | | | |
| | | | |
Starbucks Corporation | | | | | | | | | | | 125,812 | | | | 11,913,138 | |
| | | | | | | | | | | | | | | | |
| | | | |
| Household Durables: 0.54% | | | | | | | | | | | | |
| | | | |
Garmin Limited | | | | | | | | | | | 30,997 | | | | 2,436,054 | |
| | | | |
Pulte Group Incorporated | | | | | | | | | | | 121,221 | | | | 3,819,674 | |
| | | | |
| | | | | | | | | | | | | | | 6,255,728 | |
| | | | | | | | | | | | | | | | |
| | | | |
| Internet & Direct Marketing Retail: 3.01% | | | | | | | | | | | | |
| | | | |
Amazon.com Incorporated † | | | | | | | | | | | 18,740 | | | | 34,983,457 | |
| | | | | | | | | | | | | | | | |
| | | | |
| Multiline Retail: 0.90% | | | | | | | | | | | | |
| | | | |
Macy’s Incorporated | | | | | | | | | | | 289,316 | | | | 6,576,153 | |
| | | | |
Target Corporation | | | | | | | | | | | 44,619 | | | | 3,855,082 | |
| | | | |
| | | | | | | | | | | | | | | 10,431,235 | |
| | | | | | | | | | | | | | | | |
| | | | |
| Specialty Retail: 1.92% | | | | | | | | | | | | |
| | | | |
Best Buy Company Incorporated | | | | | | | | | | | 84,139 | | | | 6,439,158 | |
| | | | |
The Home Depot Incorporated | | | | | | | | | | | 74,079 | | | | 15,829,942 | |
| | | | |
| | | | | | | | | | | | | | | 22,269,100 | |
| | | | | | | | | | | | | | | | |
| | | | |
| Textiles, Apparel & Luxury Goods: 1.51% | | | | | | | | | | | | |
| | | | |
Nike Incorporated Class B | | | | | | | | | | | 125,200 | | | | 10,770,956 | |
| | | | |
Ralph Lauren Corporation | | | | | | | | | | | 64,979 | | | | 6,772,761 | |
| | | | |
| | | | | | | | | | | | | | | 17,543,717 | |
| | | | | | | | | | | | | | | | |
Wells Fargo Disciplined U.S. Core Fund | 11
The accompanying notes are an integral part of these financial statements.
Portfolio of investments—July 31, 2019
| | | | | | | | | | | | | | | | |
| | | | | | | | | Shares | | | Value | |
Consumer Staples: 6.61% | | | | | | | | | | | | | | | | |
| | | | |
| Beverages: 1.22% | | | | | | | | | | | | |
| | | | |
Molson Coors Brewing Company Class B | | | | | | | | | | | 110,664 | | | $ | 5,974,749 | |
| | | | |
PepsiCo Incorporated | | | | | | | | | | | 37,241 | | | | 4,759,772 | |
| | | | |
The Coca-Cola Company | | | | | | | | | | | 64,736 | | | | 3,407,056 | |
| | | | |
| | | | | | | | | | | | | | | 14,141,577 | |
| | | | | | | | | | | | | | | | |
| | | | |
| Food & Staples Retailing: 2.65% | | | | | | | | | | | | |
| | | | |
Costco Wholesale Corporation | | | | | | | | | | | 8,857 | | | | 2,441,255 | |
| | | | |
The Kroger Company | | | | | | | | | | | 298,353 | | | | 6,313,149 | |
| | | | |
Wal-Mart Stores Incorporated | | | | | | | | | | | 118,761 | | | | 13,108,839 | |
| | | | |
Walgreens Boots Alliance Incorporated | | | | | | | | | | | 162,599 | | | | 8,860,020 | |
| | | | |
| | | | | | | | | | | | | | | 30,723,263 | |
| | | | | | | | | | | | | | | | |
| | | | |
| Food Products: 1.28% | | | | | | | | | | | | |
| | | | |
Cal-Maine Foods Incorporated | | | | | | | | | | | 118,546 | | | | 4,714,574 | |
| | | | |
Lamb Weston Holdings Incorporated | | | | | | | | | | | 41,323 | | | | 2,773,600 | |
| | | | |
Tyson Foods Incorporated Class A | | | | | | | | | | | 93,220 | | | | 7,410,990 | |
| | | | |
| | | | | | | | | | | | | | | 14,899,164 | |
| | | | | | | | | | | | | | | | |
| | | | |
| Household Products: 0.75% | | | | | | | | | | | | |
| | | | |
Colgate-Palmolive Company | | | | | | | | | | | 31,740 | | | | 2,277,028 | |
| | | | |
The Procter & Gamble Company | | | | | | | | | | | 54,919 | | | | 6,482,639 | |
| | | | |
| | | | | | | | | | | | | | | 8,759,667 | |
| | | | | | | | | | | | | | | | |
| | | | |
| Tobacco: 0.71% | | | | | | | | | | | | |
| | | | |
Altria Group Incorporated | | | | | | | | | | | 112,079 | | | | 5,275,559 | |
| | | | |
Philip Morris International Incorporated | | | | | | | | | | | 35,972 | | | | 3,007,619 | |
| | | | |
| | | | | | | | | | | | | | | 8,283,178 | |
| | | | | | | | | | | | | | | | |
| | | | |
Energy: 5.57% | | | | | | | | | | | | | | | | |
| | | | |
| Energy Equipment & Services: 1.04% | | | | | | | | | | | | |
| | | | |
Helmerich & Payne Incorporated | | | | | | | | | | | 127,879 | | | | 6,353,029 | |
| | | | |
Schlumberger Limited | | | | | | | | | | | 143,052 | | | | 5,717,788 | |
| | | | |
| | | | | | | | | | | | | | | 12,070,817 | |
| | | | | | | | | | | | | | | | |
| | | | |
| Oil, Gas & Consumable Fuels: 4.53% | | | | | | | | | | | | |
| | | | |
Chevron Corporation | | | | | | | | | | | 137,813 | | | | 16,966,158 | |
| | | | |
Exxon Mobil Corporation | | | | | | | | | | | 262,462 | | | | 19,516,674 | |
| | | | |
Kinder Morgan Incorporated | | | | | | | | | | | 379,536 | | | | 7,826,032 | |
| | | | |
Valero Energy Corporation | | | | | | | | | | | 96,830 | | | | 8,254,758 | |
| | | | |
| | | | | | | | | | | | | | | 52,563,622 | |
| | | | | | | | | | | | | | | | |
| | | | |
Financials: 13.37% | | | | | | | | | | | | | | | | |
| | | | |
| Banks: 5.35% | | | | | | | | | | | | |
| | | | |
Bank of America Corporation | | | | | | | | | | | 510,948 | | | | 15,675,885 | |
| | | | |
Citigroup Incorporated | | | | | | | | | | | 202,812 | | | | 14,432,102 | |
| | | | |
Citizens Financial Group Incorporated | | | | | | | | | | | 71,414 | | | | 2,660,886 | |
| | | | |
Fifth Third Bancorp | | | | | | | | | | | 118,990 | | | | 3,532,813 | |
| | | | |
JPMorgan Chase & Company | | | | | | | | | | | 179,837 | | | | 20,861,092 | |
| | | | |
Popular Incorporated | | | | | | | | | | | 86,937 | | | | 5,004,094 | |
| | | | |
| | | | | | | | | | | | | | | 62,166,872 | |
| | | | | | | | | | | | | | | | |
12 | Wells Fargo Disciplined U.S. Core Fund
The accompanying notes are an integral part of these financial statements.
Portfolio of investments—July 31, 2019
| | | | | | | | | | | | | | | | |
| | | | | | | | | Shares | | | Value | |
| Capital Markets: 1.49% | | | | | | | | | | | | |
| | | | |
Evercore Partners Incorporated Class A | | | | | | | | | | | 60,244 | | | $ | 5,203,274 | |
| | | | |
Morgan Stanley | | | | | | | | | | | 163,132 | | | | 7,269,162 | |
| | | | |
Waddell & Reed Financial Incorporated Class A | | | | | | | | | | | 273,852 | | | | 4,792,410 | |
| | | | |
| | | | | | | | | | | | | | | 17,264,846 | |
| | | | | | | | | | | | | | | | |
| | | | |
| Consumer Finance: 1.27% | | | | | | | | | | | | |
| | | | |
Capital One Financial Corporation | | | | | | | | | | | 74,330 | | | | 6,869,579 | |
| | | | |
Synchrony Financial | | | | | | | | | | | 221,091 | | | | 7,932,745 | |
| | | | |
| | | | | | | | | | | | | | | 14,802,324 | |
| | | | | | | | | | | | | | | | |
| | | | |
| Diversified Financial Services: 1.91% | | | | | | | | | | | | |
| | | | |
Berkshire Hathaway Incorporated Class B † | | | | | | | | | | | 108,117 | | | | 22,210,475 | |
| | | | | | | | | | | | | | | | |
| | | | |
| Insurance: 3.35% | | | | | | | | | | | | |
| | | | |
Everest Reinsurance Group Limited | | | | | | | | | | | 28,035 | | | | 6,914,552 | |
| | | | |
MetLife Incorporated | | | | | | | | | | | 158,530 | | | | 7,834,553 | |
| | | | |
Prudential Financial Incorporated | | | | | | | | | | | 81,520 | | | | 8,258,791 | |
| | | | |
The Hartford Financial Services Group Incorporated | | | | | | | | | | | 127,432 | | | | 7,343,906 | |
| | | | |
The Progressive Corporation | | | | | | | | | | | 104,818 | | | | 8,488,162 | |
| | | | |
| | | | | | | | | | | | | | | 38,839,964 | |
| | | | | | | | | | | | | | | | |
| | | | |
Health Care: 14.71% | | | | | | | | | | | | | | | | |
| | | | |
| Biotechnology: 2.93% | | | | | | | | | | | | |
| | | | |
AbbVie Incorporated | | | | | | | | | | | 131,017 | | | | 8,728,353 | |
| | | | |
Amgen Incorporated | | | | | | | | | | | 54,859 | | | | 10,235,592 | |
| | | | |
Celgene Corporation † | | | | | | | | | | | 58,174 | | | | 5,343,864 | |
| | | | |
Gilead Sciences Incorporated | | | | | | | | | | | 147,979 | | | | 9,695,584 | |
| | | | |
| | | | | | | | | | | | | | | 34,003,393 | |
| | | | | | | | | | | | | | | | |
| | | | |
| Health Care Equipment & Supplies: 2.53% | | | | | | | | | | | | |
| | | | |
Abbott Laboratories | | | | | | | | | | | 138,992 | | | | 12,106,203 | |
| | | | |
Baxter International Incorporated | | | | | | | | | | | 44,148 | | | | 3,707,108 | |
| | | | |
Danaher Corporation | | | | | | | | | | | 16,421 | | | | 2,307,151 | |
| | | | |
Medtronic plc | | | | | | | | | | | 86,552 | | | | 8,823,111 | |
| | | | |
ResMed Incorporated | | | | | | | | | | | 18,712 | | | | 2,408,234 | |
| | | | |
| | | | | | | | | | | | | | | 29,351,807 | |
| | | | | | | | | | | | | | | | |
| | | | |
| Health Care Providers & Services: 3.98% | | | | | | | | | | | | |
| | | | |
AmerisourceBergen Corporation | | | | | | | | | | | 41,656 | | | | 3,630,320 | |
| | | | |
Anthem Incorporated | | | | | | | | | | | 33,646 | | | | 9,912,448 | |
| | | | |
Cardinal Health Incorporated | | | | | | | | | | | 49,489 | | | | 2,263,132 | |
| | | | |
Humana Incorporated | | | | | | | | | | | 18,927 | | | | 5,616,587 | |
| | | | |
McKesson Corporation | | | | | | | | | | | 52,006 | | | | 7,226,234 | |
| | | | |
UnitedHealth Group Incorporated | | | | | | | | | | | 60,539 | | | | 15,074,816 | |
| | | | |
WellCare Health Plans Incorporated † | | | | | | | | | | | 8,744 | | | | 2,511,714 | |
| | | | |
| | | | | | | | | | | | | | | 46,235,251 | |
| | | | | | | | | | | | | | | | |
| | | | |
| Pharmaceuticals: 5.27% | | | | | | | | | | | | |
| | | | |
Allergan plc | | | | | | | | | | | 24,522 | | | | 3,935,781 | |
| | | | |
Bristol-Myers Squibb Company | | | | | | | | | | | 133,017 | | | | 5,907,285 | |
| | | | |
Eli Lilly & Company | | | | | | | | | | | 83,327 | | | | 9,078,477 | |
| | | | |
Johnson & Johnson | | | | | | | | | | | 164,675 | | | | 21,443,979 | |
| | | | |
Merck & Company Incorporated | | | | | | | | | | | 181,073 | | | | 15,027,248 | |
Wells Fargo Disciplined U.S. Core Fund | 13
The accompanying notes are an integral part of these financial statements.
Portfolio of investments—July 31, 2019
| | | | | | | | | | | | | | | | |
| | | | | | | | | Shares | | | Value | |
| Pharmaceuticals(continued) | | | | | | | | | | | | |
| | | | |
Pfizer Incorporated | | | | | | | | | | | 149,495 | | | $ | 5,806,386 | |
| | | | |
| | | | | | | | | | | | | | | 61,199,156 | |
| | | | | | | | | | | | | | | | |
| | | | |
Industrials: 8.52% | | | | | | | | | | | | | | | | |
| | | | |
| Aerospace & Defense: 1.35% | | | | | | | | | | | | |
| | | | |
Arconic Incorporated | | | | | | | | | | | 120,843 | | | | 3,025,909 | |
| | | | |
Lockheed Martin Corporation | | | | | | | | | | | 10,525 | | | | 3,811,839 | |
| | | | |
Raytheon Company | | | | | | | | | | | 48,232 | | | | 8,792,211 | |
| | | | |
| | | | | | | | | | | | | | | 15,629,959 | |
| | | | | | | | | | | | | | | | |
| | | | |
| Air Freight & Logistics: 0.88% | | | | | | | | | | | | |
| | | | |
C.H. Robinson Worldwide Incorporated | | | | | | | | | | | 82,310 | | | | 6,891,816 | |
| | | | |
Expeditors International of Washington Incorporated | | | | | | | | | | | 44,114 | | | | 3,368,104 | |
| | | | |
| | | | | | | | | | | | | | | 10,259,920 | |
| | | | | | | | | | | | | | | | |
| | | | |
| Airlines: 1.36% | | | | | | | | | | | | |
| | | | |
Delta Air Lines Incorporated | | | | | | | | | | | 146,642 | | | | 8,951,028 | |
| | | | |
United Continental Holdings Incorporated † | | | | | | | | | | | 74,830 | | | | 6,877,625 | |
| | | | |
| | | | | | | | | | | | | | | 15,828,653 | |
| | | | | | | | | | | | | | | | |
| | | | |
| Construction & Engineering: 0.79% | | | | | | | | | | | | |
| | | | |
Fluor Corporation | | | | | | | | | | | 160,118 | | | | 5,205,436 | |
| | | | |
Quanta Services Incorporated | | | | | | | | | | | 105,441 | | | | 3,945,602 | |
| | | | |
| | | | | | | | | | | | | | | 9,151,038 | |
| | | | | | | | | | | | | | | | |
| | | | |
| Electrical Equipment: 0.30% | | | | | | | | | | | | |
| | | | |
Eaton Corporation plc | | | | | | | | | | | 42,937 | | | | 3,528,992 | |
| | | | | | | | | | | | | | | | |
| | | | |
| Industrial Conglomerates: 0.37% | | | | | | | | | | | | |
| | | | |
Honeywell International Incorporated | | | | | | | | | | | 24,780 | | | | 4,273,559 | |
| | | | | | | | | | | | | | | | |
| | | | |
| Machinery: 1.88% | | | | | | | | | | | | |
| | | | |
Caterpillar Incorporated | | | | | | | | | | | 57,396 | | | | 7,557,331 | |
| | | | |
Cummins Incorporated | | | | | | | | | | | 48,139 | | | | 7,894,796 | |
| | | | |
Paccar Incorporated | | | | | | | | | | | 49,926 | | | | 3,501,810 | |
| | | | |
Parker-Hannifin Corporation | | | | | | | | | | | 16,191 | | | | 2,834,720 | |
| | | | |
| | | | | | | | | | | | | | | 21,788,657 | |
| | | | | | | | | | | | | | | | |
| | | | |
| Professional Services: 1.02% | | | | | | | | | | | | |
| | | | |
Manpower Incorporated | | | | | | | | | | | 61,097 | | | | 5,581,211 | |
| | | | |
Robert Half International Incorporated | | | | | | | | | | | 104,554 | | | | 6,316,107 | |
| | | | |
| | | | | | | | | | | | | | | 11,897,318 | |
| | | | | | | | | | | | | | | | |
| | | | |
| Trading Companies & Distributors: 0.57% | | | | | | | | | | | | |
| | | | |
W.W. Grainger Incorporated | | | | | | | | | | | 22,765 | | | | 6,625,298 | |
| | | | | | | | | | | | | | | | |
| | | | |
Information Technology: 21.26% | | | | | | | | | | | | | | | | |
| | | | |
| Communications Equipment: 1.46% | | | | | | | | | | | | |
| | | | |
Cisco Systems Incorporated | | | | | | | | | | | 306,222 | | | | 16,964,699 | |
| | | | | | | | | | | | | | | | |
| | | | |
| Electronic Equipment, Instruments & Components: 0.28% | | | | | | | | | | | | |
| | | | |
Amphenol Corporation Class A | | | | | | | | | | | 34,967 | | | | 3,263,120 | |
| | | | | | | | | | | | | | | | |
14 | Wells Fargo Disciplined U.S. Core Fund
The accompanying notes are an integral part of these financial statements.
Portfolio of investments—July 31, 2019
| | | | | | | | | | | | | | | | |
| | | | | | | | | Shares | | | Value | |
| IT Services: 4.50% | | | | | | | | | | | | |
| | | | |
Accenture plc Class A | | | | | | | | | | | 64,515 | | | $ | 12,424,299 | |
| | | | |
International Business Machines Corporation | | | | | | | | | | | 37,490 | | | | 5,557,518 | |
| | | | |
KBR Incorporated | | | | | | | | | | | 163,113 | | | | 4,302,921 | |
| | | | |
MasterCard Incorporated Class A | | | | | | | | | | | 31,530 | | | | 8,584,673 | |
| | | | |
PayPal Holdings Incorporated † | | | | | | | | | | | 20,005 | | | | 2,208,552 | |
| | | | |
VeriSign Incorporated | | | | | | | | | | | 11,195 | | | | 2,363,153 | |
| | | | |
Visa Incorporated Class A | | | | | | | | | | | 94,423 | | | | 16,807,294 | |
| | | | |
| | | | | | | | | | | | | | | 52,248,410 | |
| | | | | | | | | | | | | | | | |
| | | | |
| Semiconductors & Semiconductor Equipment: 3.60% | | | | | | | | | | | | |
| | | | |
Broadcom Incorporated | | | | | | | | | | | 26,338 | | | | 7,637,757 | |
| | | | |
Intel Corporation | | | | | | | | | | | 355,648 | | | | 17,978,006 | |
| | | | |
Lam Research Corporation | | | | | | | | | | | 22,169 | | | | 4,624,675 | |
| | | | |
Micron Technology Incorporated † | | | | | | | | | | | 200,659 | | | | 9,007,583 | |
| | | | |
Xilinx Incorporated | | | | | | | | | | | 22,954 | | | | 2,621,576 | |
| | | | |
| | | | | | | | | | | | | | | 41,869,597 | |
| | | | | | | | | | | | | | | | |
| | | | |
| Software: 6.61% | | | | | | | | | | | | |
| | | | |
Cadence Design Systems Incorporated † | | | | | | | | | | | 58,486 | | | | 4,322,700 | |
| | | | |
Intuit Incorporated | | | | | | | | | | | 38,290 | | | | 10,618,200 | |
| | | | |
Microsoft Corporation | | | | | | | | | | | 409,075 | | | | 55,744,650 | |
| | | | |
Oracle Corporation | | | | | | | | | | | 107,925 | | | | 6,076,178 | |
| | | | |
| | | | | | | | | | | | | | | 76,761,728 | |
| | | | | | | | | | | | | | | | |
| | | | |
| Technology Hardware, Storage & Peripherals: 4.81% | | | | | | | | | | | | |
| | | | |
Apple Incorporated | | | | | | | | | | | 210,509 | | | | 44,846,837 | |
| | | | |
HP Incorporated | | | | | | | | | | | 353,343 | | | | 7,434,337 | |
| | | | |
Xerox Corporation | | | | | | | | | | | 110,121 | | | | 3,534,884 | |
| | | | |
| | | | | | | | | | | | | | | 55,816,058 | |
| | | | | | | | | | | | | | | | |
| | | | |
Materials: 1.96% | | | | | | | | | | | | | | | | |
| | | | |
| Chemicals: 1.04% | | | | | | | | | | | | |
| | | | |
Ecolab Incorporated | | | | | | | | | | | 8,854 | | | | 1,786,117 | |
| | | | |
FMC Corporation | | | | | | | | | | | 37,578 | | | | 3,247,491 | |
| | | | |
LyondellBasell Industries NV Class A | | | | | | | | | | | 83,830 | | | | 7,015,733 | |
| | | | |
| | | | | | | | | | | | | | | 12,049,341 | |
| | | | | | | | | | | | | | | | |
| | | | |
| Containers & Packaging: 0.21% | | | | | | | | | | | | |
| | | | |
Ball Corporation | | | | | | | | | | | 34,036 | | | | 2,432,893 | |
| | | | | | | | | | | | | | | | |
| | | | |
| Metals & Mining: 0.71% | | | | | | | | | | | | |
| | | | |
Newmont Goldcorp Corporation | | | | | | | | | | | 45,415 | | | | 1,658,556 | |
| | | | |
Nucor Corporation | | | | | | | | | | | 121,980 | | | | 6,633,272 | |
| | | | |
| | | | | | | | | | | | | | | 8,291,828 | |
| | | | | | | | | | | | | | | | |
| | | | |
Real Estate: 3.86% | | | | | | | | | | | | | | | | |
| | | | |
| Equity REITs: 3.86% | | | | | | | | | | | | |
| | | | |
American Tower Corporation | | | | | | | | | | | 39,211 | | | | 8,297,832 | |
| | | | |
Crown Castle International Corporation | | | | | | | | | | | 58,221 | | | | 7,758,530 | |
| | | | |
Equinix Incorporated | | | | | | | | | | | 16,052 | | | | 8,059,709 | |
| | | | |
Host Hotels & Resorts Incorporated | | | | | | | | | | | 82,140 | | | | 1,428,415 | |
| | | | |
Prologis Incorporated | | | | | | | | | | | 103,987 | | | | 8,382,392 | |
Wells Fargo Disciplined U.S. Core Fund | 15
The accompanying notes are an integral part of these financial statements.
Portfolio of investments—July 31, 2019
| | | | | | | | | | | | | | | | |
| | | | | | | | | Shares | | | Value | |
| | | | |
| Equity REITs (continued) | | | | | | | | | | | | |
| | | | |
SBA Communications Corporation | | | | | | | | | | | 18,240 | | | $ | 4,476,278 | |
| | | | |
Weyerhaeuser Company | | | | | | | | | | | 250,230 | | | | 6,358,344 | |
| | | | |
| | | | | | | | | | | | | | | 44,761,500 | |
| | | | | | | | | | | | | | | | |
| | | | |
Utilities: 2.69% | | | | | | | | | | | | | | | | |
| | | | |
| Electric Utilities: 1.34% | | | | | | | | | | | | |
| | | | |
American Electric Power Company Incorporated | | | | | | | | | | | 39,584 | | | | 3,475,871 | |
| | | | |
Exelon Corporation | | | | | | | | | | | 186,779 | | | | 8,416,262 | |
| | | | |
The Southern Company | | | | | | | | | | | 66,067 | | | | 3,712,965 | |
| | | | |
| | | | | | | | | | | | | | | 15,605,098 | |
| | | | | | | | | | | | | | | | |
| | | | |
| Independent Power & Renewable Electricity Producers: 0.61% | | | | | | | | | | | | |
| | | | |
NRG Energy Incorporated | | | | | | | | | | | 206,281 | | | | 7,042,433 | |
| | | | | | | | | | | | | | | | |
| | | | |
| Multi-Utilities: 0.74% | | | | | | | | | | | | |
| | | | |
Dominion Energy Incorporated | | | | | | | | | | | 53,755 | | | | 3,993,458 | |
| | | | |
DTE Energy Company | | | | | | | | | | | 35,999 | | | | 4,575,833 | |
| | | | |
| | | | | | | | | | | | | | | 8,569,291 | |
| | | | | | | | | | | | | | | | |
| | | | |
Total Common Stocks (Cost $829,998,492) | | | | | | | | | | | | | | | 1,155,420,565 | |
| | | | | | | | | | | | | | | | |
| | | | |
| | | | | | | | | | | | | | | | |
| | | Yield | | | | | | | | | | |
| Short-Term Investments: 1.01% | | | | | | | | | | | | |
| | | | |
| Investment Companies: 1.01% | | | | | | | | | | | | |
| | | | |
Securities Lending Cash Investments LLC (l)(r)(u) | | | 2.46 | % | | | | | | | 4,463,040 | | | | 4,463,486 | |
| | | | |
Wells Fargo Government Money Market Fund Select Class (l)(u) | | | 2.26 | | | | | | | | 7,316,959 | | | | 7,316,959 | |
| | | | |
Total Short-Term Investments (Cost $11,780,445) | | | | | | | | | | | | | | | 11,780,445 | |
| | | | | | | | | | | | | | | | |
| | | | | | | | |
| Total investments in securities (Cost $841,778,937) | | | 100.51 | % | | | 1,167,201,010 | |
| | |
Other assets and liabilities, net | | | (0.51 | ) | | | (5,970,407 | ) |
| | | | | | | | |
| Total net assets | | | 100.00 | % | | $ | 1,161,230,603 | |
| | | | | | | | |
| † | Non-income-earning security |
| « | All or a portion of this security is on loan. |
| (l) | The issuer of the security is an affiliated person of the Fund as defined in the Investment Company Act of 1940. |
| (r) | The investment is anon-registered investment company purchased with cash collateral received from securities on loan. |
| (u) | The rate represents the7-day annualized yield at period end. |
Abbreviations:
| REIT | Real estate investment trust |
16 | Wells Fargo Disciplined U.S. Core Fund
The accompanying notes are an integral part of these financial statements.
Portfolio of investments—July 31, 2019
Investments in Affiliates
An affiliated investment is an investment in which the Fund owns at least 5% of the outstanding voting shares of the issuer or as a result of other relationships, such as the Fund and the issuer having the same investment manager. Transactions with issuers that were either affiliated persons of the Fund at the beginning of the period or the end of the period were as follows:
| | | | | | | | | | | | | | | | | | | | | | | | | | | | | | | | | | | | |
| | | Shares,
beginning of
period | | | Shares
purchased | | | Shares
sold | | | Shares,
end of
period | | | Net
realized
gains
(losses) | | | Net
change in
unrealized
gains
(losses) | | | Income
from
affiliated
securities | | | Value,
end
of period | | | % of
net
assets | |
Short-Term Investments | | | | | | | | | | | | | | | | | | | | | | | | | | | | | | | | | | | | |
Investment Companies | | | | | | | | | | | | | | | | | | | | | | | | | | | | | | | | | | | | |
Securities Lending Cash Investments LLC | | | 0 | | | | 46,628,628 | | | | 42,165,588 | | | | 4,463,040 | | | $ | 0 | | | $ | 0 | | | $ | 47,044 | # | | $ | 4,463,486 | | | | | |
Wells Fargo Government Money Market Fund Select Class | | | 9,015,872 | | | | 316,174,189 | | | | 317,873,102 | | | | 7,316,959 | | | | 0 | | | | 0 | | | | 127,232 | | | | 7,316,959 | | | | | |
| | | | | | | | | | | | | | | | | | | | | | | | | | | | | | | | | | | | |
| | | | | | | | | | | | | | | | | | $ | 0 | | | $ | 0 | | | $ | 174,276 | | | $ | 11,780,445 | | | | 1.01 | % |
| | | | | | | | | | | | | | | | | | | | | | | | | | | | | | | | | | | | |
| # | Amount shown represents income before fees and rebates |
The accompanying notes are an integral part of these financial statements.
Wells Fargo Disciplined U.S. Core Fund | 17
Statement of assets and liabilities—July 31, 2019
| | | | |
| | | | |
| |
Assets | | | | |
Investments in unaffiliated securities (including $4,267,648 of securities loaned), at value (cost $829,998,492) | | $ | 1,155,420,565 | |
Investments in affiliated securities, at value (cost $11,780,445) | | | 11,780,445 | |
Receivable for Fund shares sold | | | 336,738 | |
Receivable for dividends | | | 1,382,784 | |
Receivable for securities lending income, net | | | 1,011 | |
Prepaid expenses and other assets | | | 232,651 | |
| | | | |
Total assets | | | 1,169,154,194 | |
| | | | |
| |
Liabilities | | | | |
Payable upon receipt of securities loaned | | | 4,463,817 | |
Payable for Fund shares redeemed | | | 2,811,732 | |
Management fee payable | | | 339,281 | |
Administration fees payable | | | 134,235 | |
Distribution fees payable | | | 24,092 | |
Trustees’ fees and expenses payable | | | 4,379 | |
Accrued expenses and other liabilities | | | 146,055 | |
| | | | |
Total liabilities | | | 7,923,591 | |
| | | | |
Total net assets | | $ | 1,161,230,603 | |
| | | | |
| |
Net assets consist of | | | | |
Paid-in capital | | $ | 799,048,706 | |
Total distributable earnings | | | 362,181,897 | |
| | | | |
Total net assets | | $ | 1,161,230,603 | |
| | | | |
| |
Computation of net asset value and offering price per share | | | | |
Net assets – Class A | | $ | 434,367,099 | |
Shares outstanding – Class A1 | | | 25,120,917 | |
Net asset value per share – Class A | | | $17.29 | |
Maximum offering price per share – Class A2 | | | $18.34 | |
Net assets – Class C | | $ | 38,708,279 | |
Shares outstanding – Class C1 | | | 2,442,540 | |
Net asset value per share – Class C | | | $15.85 | |
Net assets – Class R | | $ | 3,125,625 | |
Shares outstanding – Class R1 | | | 179,239 | |
Net asset value per share – Class R | | | $17.44 | |
Net assets – Class R6 | | $ | 340,605,580 | |
Shares outstanding – Class R61 | | | 19,179,137 | |
Net asset value per share – Class R6 | | | $17.76 | |
Net assets – Administrator Class | | $ | 58,808,377 | |
Shares outstanding – Administrator Class1 | | | 3,303,504 | |
Net asset value per share – Administrator Class | | | $17.80 | |
Net assets – Institutional Class | | $ | 285,615,643 | |
Shares outstanding – Institutional Class1 | | | 16,255,912 | |
Net asset value per share – Institutional Class | | | $17.57 | |
| 1 | The Fund has an unlimited number of authorized shares. |
| 2 | Maximum offering price is computed as 100/94.25 of net asset value. On investments of $50,000 or more, the offering price is reduced. |
The accompanying notes are an integral part of these financial statements.
18 | Wells Fargo Disciplined U.S. Core Fund
Statement of operations—year ended July 31, 2019
| | | | |
| | | | |
| |
Investment income | | | | |
Dividends (net of foreign withholding taxes of $11,313) | | $ | 28,800,875 | |
Income from affiliated securities | | | 212,886 | |
| | | | |
Total investment income | | | 29,013,761 | |
| | | | |
| |
Expenses | | | | |
Management fee | | | 4,450,189 | |
Administration fees | | | | |
Class A | | | 931,308 | |
Class C | | | 94,625 | |
Class R | | | 6,722 | |
Class R6 | | | 115,854 | |
Administrator Class | | | 88,591 | |
Institutional Class | | | 450,186 | |
Shareholder servicing fees | | | | |
Class A | | | 1,108,700 | |
Class C | | | 112,648 | |
Class R | | | 8,003 | |
Administrator Class | | | 169,766 | |
Distribution fees | | | | |
Class C | | | 337,942 | |
Class R | | | 7,989 | |
Custody and accounting fees | | | 59,999 | |
Professional fees | | | 53,403 | |
Registration fees | | | 109,500 | |
Shareholder report expenses | | | 118,457 | |
Trustees’ fees and expenses | | | 21,999 | |
Interest expense | | | 1,040 | |
Other fees and expenses | | | 80,096 | |
| | | | |
Total expenses | | | 8,327,017 | |
Less: Fee waivers and/or expense reimbursements | | | (109,621 | ) |
| | | | |
Net expenses | | | 8,217,396 | |
| | | | |
Net investment income | | | 20,796,365 | |
| | | | |
| |
Realized and unrealized gains (losses) on investments | | | | |
Net realized gains on investments | | | 27,061,264 | |
Net change in unrealized gains (losses) on investments | | | (3,387,087 | ) |
| | | | |
Net realized and unrealized gains (losses) on investments | | | 23,674,177 | |
| | | | |
Net increase in net assets resulting from operations | | $ | 44,470,542 | |
| | | | |
The accompanying notes are an integral part of these financial statements.
Wells Fargo Disciplined U.S. Core Fund | 19
Statement of changes in net assets
| | | | | | | | | | | | | | | | |
| | | Year ended
July 31, 2019 | | | Year ended
July 31, 20181 | |
| | | | |
Operations | | | | | | | | | | | | | | | | |
Net investment income | | | | | | $ | 20,796,365 | | | | | | | $ | 18,267,289 | |
Net realized gains on investments | | | | | | | 27,061,264 | | | | | | | | 58,671,899 | |
Net change in unrealized gains (losses) on investments | | | | | | | (3,387,087 | ) | | | | | | | 83,409,567 | |
| | | | |
Net increase in net assets resulting from operations | | | | | | | 44,470,542 | | | | | | | | 160,348,755 | |
| | | | |
| | | | |
Distributions to shareholders from net investment income and net realized gains | | | | | | | | | | | | | | | | |
Class A | | | | | | | (27,282,105 | ) | | | | | | | (20,704,762 | ) |
Class C | | | | | | | (2,771,228 | ) | | | | | | | (2,046,966 | ) |
Class R | | | | | | | (201,547 | ) | | | | | | | (86,235 | ) |
Class R6 | | | | | | | (25,476,362 | ) | | | | | | | (10,400,864 | ) |
Administrator Class | | | | | | | (3,946,556 | ) | | | | | | | (4,178,646 | ) |
Institutional Class | | | | | | | (24,186,334 | ) | | | | | | | (18,508,153 | ) |
| | | | |
Total distributions to shareholders | | | | | | | (83,864,132 | ) | | | | | | | (55,925,626 | ) |
| | | | |
| | | | |
Capital share transactions | | | Shares | | | | | | | | Shares | | | | | |
Proceeds from shares sold | | | | | | | | | | | | | | | | |
Class A | | | 1,886,725 | | | | 30,921,236 | | | | 3,025,519 | | | | 51,764,763 | |
Class C | | | 472,068 | | | | 6,869,156 | | | | 374,010 | | | | 5,918,031 | |
Class R | | | 37,989 | | | | 635,336 | | | | 106,436 | | | | 1,833,037 | |
Class R6 | | | 3,079,018 | | | | 48,714,888 | | | | 31,753,862 | | | | 558,773,061 | |
Administrator Class | | | 426,111 | | | | 7,266,082 | | | | 801,468 | | | | 14,055,574 | |
Institutional Class | | | 4,282,122 | | | | 73,227,240 | | | | 9,147,678 | | | | 158,493,564 | |
| | | | |
| | | | | | | 167,633,938 | | | | | | | | 790,838,030 | |
| | | | |
Reinvestment of distributions | | | | | | | | | | | | | | | | |
Class A | | | 1,648,190 | | | | 25,532,516 | | | | 1,131,935 | | | | 19,445,471 | |
Class C | | | 177,775 | | | | 2,524,825 | | | | 117,892 | | | | 1,860,460 | |
Class R | | | 12,745 | | | | 199,335 | | | | 4,876 | | | | 84,764 | |
Class R6 | | | 1,506,629 | | | | 23,955,923 | | | | 589,809 | | | | 10,399,263 | |
Administrator Class | | | 235,868 | | | | 3,758,071 | | | | 230,133 | | | | 4,058,515 | |
Institutional Class | | | 1,264,383 | | | | 19,892,703 | | | | 851,853 | | | | 14,861,788 | |
| | | | |
| | | | | | | 75,863,373 | | | | | | | | 50,710,261 | |
| | | | |
Payment for shares redeemed | | | | | | | | | | | | | | | | |
Class A | | | (5,568,268 | ) | | | (92,539,888 | ) | | | (5,686,039 | ) | | | (97,150,526 | ) |
Class C | | | (1,440,204 | ) | | | (21,524,938 | ) | | | (852,666 | ) | | | (13,443,380 | ) |
Class R | | | (55,966 | ) | | | (904,117 | ) | | | (48,086 | ) | | | (836,247 | ) |
Class R6 | | | (9,937,174 | ) | | | (168,483,143 | ) | | | (10,312,522 | ) | | | (185,383,377 | ) |
Administrator Class | | | (2,534,639 | ) | | | (43,971,874 | ) | | | (1,497,144 | ) | | | (26,145,921 | ) |
Institutional Class | | | (12,205,371 | ) | | | (203,720,141 | ) | | | (8,454,555 | ) | | | (147,923,158 | ) |
| | | | |
| | | | | | | (531,144,101 | ) | | | | | | | (470,882,609 | ) |
| | | | |
Net increase (decrease) in net assets resulting from capital share transactions | | | | | | | (287,646,790 | ) | | | | | | | 370,665,682 | |
| | | | |
Total increase (decrease) in net assets | | | | | | | (327,040,380 | ) | | | | | | | 475,088,811 | |
| | | | |
| | | | |
Net assets | | | | | | | | | | | | | | | | |
Beginning of period | | | | | | | 1,488,270,983 | | | | | | | | 1,013,182,172 | |
| | | | |
End of period | | | | | | $ | 1,161,230,603 | | | | | | | $ | 1,488,270,983 | |
| | | | |
| 1 | Effective for all filings after November 4, 2018, the SEC prospectively eliminated the requirement to parenthetically disclose undistributed net investment income at the end of the period and permitted the aggregation of distributions, with the exception of tax basis returns of capital. Undistributed net investment income at July 31, 2018 was $18,219,041. The disaggregated distributions information for the year ended July 31, 2018 is included in Note 8,Distributions to Shareholders, in the notes to the financial statements. |
The accompanying notes are an integral part of these financial statements.
20 | Wells Fargo Disciplined U.S. Core Fund
Financial highlights
(For a share outstanding throughout each period)
| | | | | | | | | | | | | | | | | | | | |
| | | Year ended July 31 | |
| CLASS A | | 2019 | | | 2018 | | | 2017 | | | 2016 | | | 2015 | |
Net asset value, beginning of period | | | $17.70 | | | | $16.30 | | | | $14.50 | | | | $15.45 | | | | $16.29 | |
Net investment income | | | 0.25 | | | | 0.24 | | | | 0.22 | | | | 0.21 | | | | 0.21 | |
Net realized and unrealized gains (losses) on investments | | | 0.38 | | | | 1.90 | | | | 1.94 | | | | 0.47 | | | | 1.60 | |
| | | | | | | | | | | | | | | | | | | | |
Total from investment operations | | | 0.63 | | | | 2.14 | | | | 2.16 | | | | 0.68 | | | | 1.81 | |
Distributions to shareholders from | | | | | | | | | | | | | | | | | | | | |
Net investment income | | | (0.19 | ) | | | (0.15 | ) | | | (0.15 | ) | | | (0.19 | ) | | | (0.16 | ) |
Net realized gains | | | (0.85 | ) | | | (0.59 | ) | | | (0.21 | ) | | | (1.44 | ) | | | (2.49 | ) |
| | | | | | | | | | | | | | | | | | | | |
Total distributions to shareholders | | | (1.04 | ) | | | (0.74 | ) | | | (0.36 | ) | | | (1.63 | ) | | | (2.65 | ) |
Net asset value, end of period | | | $17.29 | | | | $17.70 | | | | $16.30 | | | | $14.50 | | | | $15.45 | |
Total return1 | | | 4.31 | % | | | 13.28 | % | | | 15.12 | % | | | 5.22 | % | | | 12.01 | % |
Ratios to average net assets (annualized) | | | | | | | | | | | | | | | | | | | | |
Gross expenses | | | 0.84 | % | | | 0.83 | % | | | 0.85 | % | | | 0.87 | % | | | 0.89 | % |
Net expenses | | | 0.84 | % | | | 0.83 | % | | | 0.85 | % | | | 0.87 | % | | | 0.89 | % |
Net investment income | | | 1.40 | % | | | 1.33 | % | | | 1.45 | % | | | 1.60 | % | | | 1.43 | % |
Supplemental data | | | | | | | | | | | | | | | | | | | | |
Portfolio turnover rate | | | 63 | % | | | 73 | % | | | 60 | % | | | 52 | % | | | 53 | % |
Net assets, end of period (000s omitted) | | | $434,367 | | | | $480,602 | | | | $467,491 | | | | $412,629 | | | | $331,123 | |
| 1 | Total return calculations do not include any sales charges. |
The accompanying notes are an integral part of these financial statements.
Wells Fargo Disciplined U.S. Core Fund | 21
Financial highlights
(For a share outstanding throughout each period)
| | | | | | | | | | | | | | | | | | | | |
| | | Year ended July 31 | |
| CLASS C | | 2019 | | | 2018 | | | 2017 | | | 2016 | | | 2015 | |
Net asset value, beginning of period | | | $16.28 | | | | $15.04 | | | | $13.45 | | | | $14.50 | | | | $15.47 | |
Net investment income | | | 0.12 | | | | 0.09 | | | | 0.10 | | | | 0.14 | | | | 0.13 | |
Net realized and unrealized gains (losses) on investments | | | 0.35 | | | | 1.76 | | | | 1.79 | | | | 0.38 | | | | 1.48 | |
| | | | | | | | | | | | | | | | | | | | |
Total from investment operations | | | 0.47 | | | | 1.85 | | | | 1.89 | | | | 0.52 | | | | 1.61 | |
Distributions to shareholders from | | | | | | | | | | | | | | | | | | | | |
Net investment income | | | (0.05 | ) | | | (0.02 | ) | | | (0.09 | ) | | | (0.13 | ) | | | (0.09 | ) |
Net realized gains | | | (0.85 | ) | | | (0.59 | ) | | | (0.21 | ) | | | (1.44 | ) | | | (2.49 | ) |
| | | | | | | | | | | | | | | | | | | | |
Total distributions to shareholders | | | (0.90 | ) | | | (0.61 | ) | | | (0.30 | ) | | | (1.57 | ) | | | (2.58 | ) |
Net asset value, end of period | | | $15.85 | | | | $16.28 | | | | $15.04 | | | | $13.45 | | | | $14.50 | |
Total return1 | | | 3.59 | % | | | 12.41 | % | | | 14.27 | % | | | 4.43 | % | | | 11.18 | % |
Ratios to average net assets (annualized) | | | | | | | | | | | | | | | | | | | | |
Gross expenses | | | 1.59 | % | | | 1.58 | % | | | 1.60 | % | | | 1.62 | % | | | 1.64 | % |
Net expenses | | | 1.59 | % | | | 1.58 | % | | | 1.60 | % | | | 1.62 | % | | | 1.64 | % |
Net investment income | | | 0.66 | % | | | 0.58 | % | | | 0.69 | % | | | 0.82 | % | | | 0.66 | % |
Supplemental data | | | | | | | | | | | | | | | | | | | | |
Portfolio turnover rate | | | 63 | % | | | 73 | % | | | 60 | % | | | 52 | % | | | 53 | % |
Net assets, end of period (000s omitted) | | | $38,708 | | | | $52,647 | | | | $54,054 | | | | $46,801 | | | | $20,680 | |
| 1 | Total return calculations do not include any sales charges. |
The accompanying notes are an integral part of these financial statements.
22 | Wells Fargo Disciplined U.S. Core Fund
Financial highlights
(For a share outstanding throughout each period)
| | | | | | | | | | | | | | | | |
| | | Year ended July 31 | |
| CLASS R | | 2019 | | | 2018 | | | 2017 | | | 20161 | |
Net asset value, beginning of period | | | $17.88 | | | | $16.51 | | | | $14.77 | | | | $14.62 | |
Net investment income | | | 0.19 | 2 | | | 0.18 | 2 | | | 0.17 | 2 | | | 0.13 | 2 |
Net realized and unrealized gains (losses) on investments | | | 0.41 | | | | 1.94 | | | | 1.99 | | | | 1.72 | |
| | | | | | | | | | | | | | | | |
Total from investment operations | | | 0.60 | | | | 2.12 | | | | 2.16 | | | | 1.85 | |
Distributions to shareholders from | | | | | | | | | | | | | | | | |
Net investment income | | | (0.19 | ) | | | (0.16 | ) | | | (0.21 | ) | | | (0.26 | ) |
Net realized gains | | | (0.85 | ) | | | (0.59 | ) | | | (0.21 | ) | | | (1.44 | ) |
| | | | | | | | | | | | | | | | |
Total distributions to shareholders | | | (1.04 | ) | | | (0.75 | ) | | | (0.42 | ) | | | (1.70 | ) |
Net asset value, end of period | | | $17.44 | | | | $17.88 | | | | $16.51 | | | | $14.77 | |
Total return3 | | | 4.07 | % | | | 12.97 | % | | | 14.86 | % | | | 13.56 | % |
Ratios to average net assets (annualized) | | | | | | | | | | | | | | | | |
Gross expenses | | | 1.09 | % | | | 1.08 | % | | | 1.10 | % | | | 1.12 | % |
Net expenses | | | 1.09 | % | | | 1.08 | % | | | 1.10 | % | | | 1.12 | % |
Net investment income | | | 1.15 | % | | | 1.04 | % | | | 1.10 | % | | | 1.12 | % |
Supplemental data | | | | | | | | | | | | | | | | |
Portfolio turnover rate | | | 63 | % | | | 73 | % | | | 60 | % | | | 52 | % |
Net assets, end of period (000s omitted) | | | $3,126 | | | | $3,298 | | | | $2,001 | | | | $201 | |
| 1 | For the period from September 30, 2015 (commencement of class operations) to July 31, 2016 |
| 2 | Calculated based upon average shares outstanding |
| 3 | Returns for periods of less than one year are not annualized. |
The accompanying notes are an integral part of these financial statements.
Wells Fargo Disciplined U.S. Core Fund | 23
Financial highlights
(For a share outstanding throughout each period)
| | | | | | | | | | | | | | | | |
| | | Year ended July 31 | |
| CLASS R6 | | 2019 | | | 2018 | | | 2017 | | | 20161 | |
Net asset value, beginning of period | | | $18.17 | | | | $16.71 | | | | $14.86 | | | | $14.62 | |
Net investment income | | | 0.32 | | | | 0.30 | 2 | | | 0.28 | 2 | | | 0.22 | 2 |
Net realized and unrealized gains (losses) on investments | | | 0.40 | | | | 1.97 | | | | 1.99 | | | | 1.72 | |
| | | | | | | | | | | | | | | | |
Total from investment operations | | | 0.72 | | | | 2.27 | | | | 2.27 | | | | 1.94 | |
Distributions to shareholders from | | | | | | | | | | | | | | | | |
Net investment income | | | (0.28 | ) | | | (0.22 | ) | | | (0.21 | ) | | | (0.26 | ) |
Net realized gains | | | (0.85 | ) | | | (0.59 | ) | | | (0.21 | ) | | | (1.44 | ) |
| | | | | | | | | | | | | | | | |
Total distributions to shareholders | | | (1.13 | ) | | | (0.81 | ) | | | (0.42 | ) | | | (1.70 | ) |
Net asset value, end of period | | | $17.76 | | | | $18.17 | | | | $16.71 | | | | $14.86 | |
Total return3 | | | 4.77 | % | | | 13.78 | % | | | 15.56 | % | | | 14.24 | % |
Ratios to average net assets (annualized) | | | | | | | | | | | | | | | | |
Gross expenses | | | 0.41 | % | | | 0.40 | % | | | 0.42 | % | | | 0.44 | % |
Net expenses | | | 0.41 | % | | | 0.40 | % | | | 0.42 | % | | | 0.43 | % |
Net investment income | | | 1.84 | % | | | 1.71 | % | | | 1.77 | % | | | 1.88 | % |
Supplemental data | | | | | | | | | | | | | | | | |
Portfolio turnover rate | | | 63 | % | | | 73 | % | | | 60 | % | | | 52 | % |
Net assets, end of period (000s omitted) | | | $340,606 | | | | $445,678 | | | | $41,770 | | | | $4,024 | |
| 1 | For the period from September 30, 2015 (commencement of class operations) to July 31, 2016 |
| 2 | Calculated based upon average shares outstanding |
| 3 | Returns for periods of less than one year are not annualized. |
The accompanying notes are an integral part of these financial statements.
24 | Wells Fargo Disciplined U.S. Core Fund
Financial highlights
(For a share outstanding throughout each period)
| | | | | | | | | | | | | | | | | | | | |
| | | Year ended July 31 | |
| ADMINISTRATOR CLASS | | 2019 | | | 2018 | | | 2017 | | | 2016 | | | 2015 | |
Net asset value, beginning of period | | | $18.17 | | | | $16.71 | | | | $14.85 | | | | $15.80 | | | | $16.60 | |
Net investment income | | | 0.26 | 1 | | | 0.25 | 1 | | | 0.25 | 1 | | | 0.24 | 1 | | | 0.25 | 1 |
Net realized and unrealized gains (losses) on investments | | | 0.41 | | | | 1.97 | | | | 1.98 | | | | 0.48 | | | | 1.63 | |
| | | | | | | | | | | | | | | | | | | | |
Total from investment operations | | | 0.67 | | | | 2.22 | | | | 2.23 | | | | 0.72 | | | | 1.88 | |
Distributions to shareholders from | | | | | | | | | | | | | | | | | | | | |
Net investment income | | | (0.19 | ) | | | (0.17 | ) | | | (0.16 | ) | | | (0.23 | ) | | | (0.19 | ) |
Net realized gains | | | (0.85 | ) | | | (0.59 | ) | | | (0.21 | ) | | | (1.44 | ) | | | (2.49 | ) |
| | | | | | | | | | | | | | | | | | | | |
Total distributions to shareholders | | | (1.04 | ) | | | (0.76 | ) | | | (0.37 | ) | | | (1.67 | ) | | | (2.68 | ) |
Net asset value, end of period | | | $17.80 | | | | $18.17 | | | | $16.71 | | | | $14.85 | | | | $15.80 | |
Total return | | | 4.43 | % | | | 13.40 | % | | | 15.24 | % | | | 5.36 | % | | | 12.20 | % |
Ratios to average net assets (annualized) | | | | | | | | | | | | | | | | | | | | |
Gross expenses | | | 0.76 | % | | | 0.75 | % | | | 0.77 | % | | | 0.78 | % | | | 0.74 | % |
Net expenses | | | 0.74 | % | | | 0.74 | % | | | 0.74 | % | | | 0.74 | % | | | 0.73 | % |
Net investment income | | | 1.50 | % | | | 1.42 | % | | | 1.60 | % | | | 1.71 | % | | | 1.58 | % |
Supplemental data | | | | | | | | | | | | | | | | | | | | |
Portfolio turnover rate | | | 63 | % | | | 73 | % | | | 60 | % | | | 52 | % | | | 53 | % |
Net assets, end of period (000s omitted) | | | $58,808 | | | | $94,058 | | | | $94,294 | | | | $116,807 | | | | $63,544 | |
| 1 | Calculated based upon average shares outstanding |
The accompanying notes are an integral part of these financial statements.
Wells Fargo Disciplined U.S. Core Fund | 25
Financial highlights
(For a share outstanding throughout each period)
| | | | | | | | | | | | | | | | | | | | |
| | | Year ended July 31 | |
| INSTITUTIONAL CLASS | | 2019 | | | 2018 | | | 2017 | | | 2016 | | | 2015 | |
Net asset value, beginning of period | | | $17.98 | | | | $16.55 | | | | $14.72 | | | | $15.66 | | | | $16.47 | |
Net investment income | | | 0.30 | 1 | | | 0.28 | | | | 0.27 | 1 | | | 0.28 | 1 | | | 0.30 | |
Net realized and unrealized gains (losses) on investments | | | 0.40 | | | | 1.95 | | | | 1.98 | | | | 0.47 | | | | 1.61 | |
| | | | | | | | | | | | | | | | | | | | |
Total from investment operations | | | 0.70 | | | | 2.23 | | | | 2.25 | | | | 0.75 | | | | 1.91 | |
Distributions to shareholders from | | | | | | | | | | | | | | | | | | | | |
Net investment income | | | (0.26 | ) | | | (0.21 | ) | | | (0.21 | ) | | | (0.25 | ) | | | (0.23 | ) |
Net realized gains | | | (0.85 | ) | | | (0.59 | ) | | | (0.21 | ) | | | (1.44 | ) | | | (2.49 | ) |
| | | | | | | | | | | | | | | | | | | | |
Total distributions to shareholders | | | (1.11 | ) | | | (0.80 | ) | | | (0.42 | ) | | | (1.69 | ) | | | (2.72 | ) |
Net asset value, end of period | | | $17.57 | | | | $17.98 | | | | $16.55 | | | | $14.72 | | | | $15.66 | |
Total return | | | 4.69 | % | | | 13.65 | % | | | 15.51 | % | | | 5.64 | % | | | 12.55 | % |
Ratios to average net assets (annualized) | | | | | | | | | | | | | | | | | | | | |
Gross expenses | | | 0.51 | % | | | 0.50 | % | | | 0.52 | % | | | 0.54 | % | | | 0.47 | % |
Net expenses | | | 0.48 | % | | | 0.48 | % | | | 0.48 | % | | | 0.48 | % | | | 0.47 | % |
Net investment income | | | 1.77 | % | | | 1.67 | % | | | 1.76 | % | | | 1.96 | % | | | 1.86 | % |
Supplemental data | | | | | | | | | | | | | | | | | | | | |
Portfolio turnover rate | | | 63 | % | | | 73 | % | | | 60 | % | | | 52 | % | | | 53 | % |
Net assets, end of period (000s omitted) | | | $285,616 | | | | $411,988 | | | | $353,573 | | | | $163,674 | | | | $109,901 | |
| 1 | Calculated based upon average shares outstanding |
The accompanying notes are an integral part of these financial statements.
26 | Wells Fargo Disciplined U.S. Core Fund
Notes to financial statements
1. ORGANIZATION
Wells Fargo Funds Trust (the “Trust”), a Delaware statutory trust organized on March 10, 1999, is anopen-end management investment company registered under the Investment Company Act of 1940, as amended (the “1940 Act”). As an investment company, the Trust follows the accounting and reporting guidance in Financial Accounting Standards Board (“FASB”)Accounting Standards Codification Topic 946, Financial Services – Investment Companies. These financial statements report on the Wells Fargo Disciplined U.S. Core Fund (the “Fund”) which is a diversified series of the Trust.
2. SIGNIFICANT ACCOUNTING POLICIES
The following significant accounting policies, which are consistently followed in the preparation of the financial statements of the Fund, are in conformity with U.S. generally accepted accounting principles which require management to make estimates and assumptions that affect the reported amounts of assets and liabilities, disclosure of contingent assets and liabilities at the date of the financial statements, and the reported amounts of revenues and expenses during the reporting period. Actual results could differ from those estimates.
Securities valuation
All investments are valued each business day as of the close of regular trading on the New York Stock Exchange (generally 4 p.m. Eastern Time), although the Fund may deviate from this calculation time under unusual or unexpected circumstances.
Equity securities that are listed on a foreign or domestic exchange or market are valued at the official closing price or, if none, the last sales price. If no sale occurs on the principal exchange or market that day, a fair value price will be determined in accordance with the Fund’s Valuation Procedures.
Investments in registeredopen-end investment companies are valued at net asset value. Interests innon-registered investment companies that are redeemable at net asset value are fair valued normally at net asset value
Investments which are not valued using any of the methods discussed above are valued at their fair value, as determined in good faith by the Board of Trustees of the Fund. The Board of Trustees has established a Valuation Committee comprised of the Trustees and has delegated to it the authority to take any actions regarding the valuation of portfolio securities that the Valuation Committee deems necessary or appropriate, including determining the fair value of portfolio securities, unless the determination has been delegated to the Wells Fargo Asset Management Pricing Committee at Wells Fargo Funds Management, LLC (“Funds Management”). The Board of Trustees retains the authority to make or ratify any valuation decisions or approve any changes to the Valuation Procedures as it deems appropriate. On a quarterly basis, the Board of Trustees receives reports on any valuation actions taken by the Valuation Committee or the Wells Fargo Asset Management Pricing Committee which may include items for ratification.
Securities lending
The Fund may lend its securities from time to time in order to earn additional income in the form of fees or interest on securities received as collateral or the investment of any cash received as collateral. When securities are on loan, the Fund receives interest or dividends on those securities. Cash collateral received in connection with its securities lending transactions is invested in Securities Lending Cash Investments, LLC (the “Securities Lending Fund”). Investments in Securities Lending Fund are valued at the evaluated bid price provided by an independent pricing service. Income earned from investment in the Securities Lending Fund (net of fees and rebates), if any, is included in income from affiliated securities on the Statement of Operations.
In a securities lending transaction, the net asset value of the Fund will be affected by an increase or decrease in the value of the securities loaned and by an increase or decrease in the value of the instrument in which collateral is invested. The amount of securities lending activity undertaken by the Fund fluctuates from time to time. The Fund has the right under the lending agreement to recover the securities from the borrower on demand. In the event of default or bankruptcy by the borrower, the Fund may be prevented from recovering the loaned securities or gaining access to the collateral or may experience delays or costs in doing so. In such an event, the terms of the agreement allows the unaffiliated securities lending agent to use the collateral to purchase replacement securities on behalf of the Fund or pay the Fund the market value of the loaned securities. The Fund will bear the risk of loss with respect to depreciation of its investment of the cash collateral.
Security transactions and income recognition
Securities transactions are recorded on a trade date basis. Realized gains or losses are recorded on the basis of identified cost.
Dividend income is recognized on theex-dividend date. Dividend income is recorded net of foreign taxes withheld where recovery of such taxes is not assured.
Wells Fargo Disciplined U.S. Core Fund | 27
Notes to financial statements
Distributions to shareholders
Distributions to shareholders from net investment income and any net realized gains are recorded on theex-dividend date and paid at least annually. Such distributions are determined in accordance with income tax regulations and may differ from U.S. generally accepted accounting principles. Dividend sources are estimated at the time of declaration. The tax character of distributions is determined as of the Fund’s fiscal year end. Therefore, a portion of the Fund’s distributions made prior to the Fund’s fiscal year end may be categorized as a tax return of capital at year end.
Federal and other taxes
The Fund intends to continue to qualify as a regulated investment company by distributing substantially all of its investment company taxable income and any net realized capital gains (after reduction for capital loss carryforwards) sufficient to relieve it from all, or substantially all, federal income taxes. Accordingly, no provision for federal income taxes was required.
The Fund’s income and federal excise tax returns and all financial records supporting those returns for the prior three fiscal years are subject to examination by the federal and Delaware revenue authorities. Management has analyzed the Fund’s tax positions taken on federal, state, and foreign tax returns for all open tax years and does not believe that there are any uncertain tax positions that require recognition of a tax liability.
As of July 31, 2019, the aggregate cost of all investments for federal income tax purposes was $850,566,735 and the unrealized gains (losses) consisted of:
| | | | |
| |
Gross unrealized gains | | $ | 339,565,791 | |
| |
Gross unrealized losses | | | (22,931,516 | ) |
| |
Net unrealized gains | | $ | 316,634,275 | |
Class allocations
The separate classes of shares offered by the Fund differ principally in applicable sales charges, distribution, shareholder servicing, and administration fees. Class specific expenses are charged directly to that share class. Investment income, common fund-level expenses, and realized and unrealized gains (losses) on investments are allocated daily to each class of shares based on the relative proportion of net assets of each class.
3. FAIR VALUATION MEASUREMENTS
Fair value measurements of investments are determined within a framework that has established a fair value hierarchy based upon the various data inputs utilized in determining the value of the Fund’s investments. The three-level hierarchy gives the highest priority to unadjusted quoted prices in active markets for identical assets or liabilities (Level 1) and the lowest priority to unobservable inputs (Level 3). The Fund’s investments are classified within the fair value hierarchy based on the lowest level of input that is significant to the fair value measurement. The inputs are summarized into three broad levels as follows:
| ∎ | | Level 1 – quoted prices in active markets for identical securities |
| ∎ | | Level 2 – other significant observable inputs (including quoted prices for similar securities, interest rates, prepayment speeds, credit risk, etc.) |
| ∎ | | Level 3 – significant unobservable inputs (including the Fund’s own assumptions in determining the fair value of investments) |
The inputs or methodologies used for valuing investments in securities are not necessarily an indication of the risk associated with investing in those securities.
28 | Wells Fargo Disciplined U.S. Core Fund
Notes to financial statements
The following is a summary of the inputs used in valuing the Fund’s assets and liabilities as of July 31, 2019:
| | | | | | | | | | | | | | | | |
| | | | |
| | | Quoted prices
(Level 1) | | | Other significant
observable inputs
(Level 2) | | | Significant
unobservable inputs
(Level 3) | | | Total | |
| | | | |
Assets | | | | | | | | | | | | | | | | |
Investments in: | | | | | | | | | | | | | | | | |
| | | | |
Common stocks | | | | | | | | | | | | | | | | |
| | | | |
Communication services | | $ | 123,558,620 | | | $ | 0 | | | $ | 0 | | | $ | 123,558,620 | |
| | | | |
Consumer discretionary | | | 119,687,179 | | | | 0 | | | | 0 | | | | 119,687,179 | |
| | | | |
Consumer staples | | | 76,806,849 | | | | 0 | | | | 0 | | | | 76,806,849 | |
| | | | |
Energy | | | 64,634,439 | | | | 0 | | | | 0 | | | | 64,634,439 | |
| | | | |
Financials | | | 155,284,481 | | | | 0 | | | | 0 | | | | 155,284,481 | |
| | | | |
Health care | | | 170,789,607 | | | | 0 | | | | 0 | | | | 170,789,607 | |
| | | | |
Industrials | | | 98,983,394 | | | | 0 | | | | 0 | | | | 98,983,394 | |
| | | | |
Information technology | | | 246,923,612 | | | | 0 | | | | 0 | | | | 246,923,612 | |
| | | | |
Materials | | | 22,774,062 | | | | 0 | | | | 0 | | | | 22,774,062 | |
| | | | |
Real estate | | | 44,761,500 | | | | 0 | | | | 0 | | | | 44,761,500 | |
| | | | |
Utilities | | | 31,216,822 | | | | 0 | | | | 0 | | | | 31,216,822 | |
| | | | |
Short-term investments | | | | | | | | | | | | | | | | |
| | | | |
Investment companies | | | 11,780,445 | | | | 0 | | | | 0 | | | | 11,780,445 | |
| | | | |
Total assets | | $ | 1,167,201,010 | | | $ | 0 | | | $ | 0 | | | $ | 1,167,201,010 | |
Additional sector, industry or geographic detail is included in the Portfolio of Investments.
For the year ended July 31, 2019, the Fund did not have any transfers into/out of Level 3.
4. TRANSACTIONS WITH AFFILIATES
Management fee
Funds Management, an indirect wholly owned subsidiary of Wells Fargo & Company (“Wells Fargo”), is the manager of the Fund and provides advisory and fund-level administrative services under an investment management agreement. Under the investment management agreement, Funds Management is responsible for, among other services, implementing the investment objectives and strategies of the Fund, supervising the subadviser and providing fund-level administrative services in connection with the Fund’s operations. As compensation for its services under the investment management agreement, Funds Management is entitled to receive a management fee at the following annual rate based on the Fund’s average daily net assets:
| | |
| |
| Average daily net assets | | Management fee |
| |
First $1 billion | | 0.350% |
| |
Next $4 billion | | 0.325 |
| |
Next $5 billion | | 0.290 |
| |
Over $10 billion | | 0.280 |
For the year ended July 31, 2019, the management fee was equivalent to an annual rate of 0.34% of the Fund’s average daily net assets.
Funds Management has retained the services of a subadviser to provide daily portfolio management to the Fund. The fee for subadvisory services is borne by Funds Management. Wells Capital Management Incorporated (“WellsCap”), an affiliate of Funds Management and an indirect wholly owned subsidiary of Wells Fargo, is the subadviser to the Fund and is entitled to receive a fee from Funds Management at an annual rate starting at 0.25% and declining to 0.15% as the average daily net assets of the Fund increase.
Administration fees
Under a class-level administration agreement, Funds Management provides class-level administrative services to the Fund, which includes paying fees and expenses for services provided by the transfer agent,sub-transfer agents, omnibus account
Wells Fargo Disciplined U.S. Core Fund | 29
Notes to financial statements
servicers and record-keepers. As compensation for its services under the class-level administration agreement, Funds Management receives an annual fee which is calculated based on the average daily net assets of each class as follows:
| | |
| |
| | | Class-level
administration fee |
| |
Class A, Class C, Class R | | 0.21% |
| |
Class R6 | | 0.03 |
| |
Administrator Class, Institutional Class | | 0.13 |
Waivers and/or expense reimbursements
Funds Management has contractually waived and/or reimbursed management and administration fees to the extent necessary to maintain certain net operating expense ratios for the Fund. When each class of the Fund has exceeded its expense cap, Funds Management has waived fees and/or reimbursed expenses from fund-level expenses on a proportionate basis and then from class specific expenses. When only certain classes exceed their expense caps, waivers and/or reimbursements are applied against class specific expenses before fund-level expenses. Funds Management has committed through November 30, 2019 to waive fees and/or reimburse expenses to the extent necessary to cap the Fund’s expenses at 0.87% for Class A shares, 1.62% for Class C shares, 1.12% for Class R shares, 0.43% for Class R6 shares, 0.74% for Administrator Class shares, and 0.48% for Institutional Class shares. Prior to or after the commitment expiration date, the cap may be increased or the commitment to maintain the cap may be terminated only with the approval of the Board of Trustees.
Distribution fees
The Trust has adopted a distribution plan for Class C and Class R shares of the Fund pursuant to Rule12b-1 under the 1940 Act. Distribution fees are charged to Class C and Class R shares and paid to Wells Fargo Funds Distributor, LLC (“Funds Distributor”), the principal underwriter, at an annual rate of 0.75% of the average daily net assets of Class C shares and 0.25% of the average daily net assets of Class R shares.
In addition, Funds Distributor is entitled to receive thefront-end sales charge from the purchase of Class A shares and a contingent deferred sales charge on the redemption of certain Class A shares. Funds Distributor is also entitled to receive the contingent deferred sales charges from redemptions of Class C shares. For the year ended July 31, 2019, Funds Distributor received $9,689 from the sale of Class A shares and $114 in contingent deferred sales charges from redemptions of Class C shares. No contingent deferred sales charges were incurred by Class A shares for the year ended July 31, 2019.
Shareholder servicing fees
The Trust has entered into contracts with one or more shareholder servicing agents, whereby Class A, Class C, Class R, and Administrator Class of the Fund are charged a fee at an annual rate of 0.25% of the average daily net assets of each respective class. A portion of these total shareholder servicing fees were paid to affiliates of Wells Fargo.
Interfund transactions
The Fund may purchase or sell portfolio investment securities to certain other Wells Fargo affiliates pursuant to Rule17a-7 under the 1940 Act and under procedures adopted by the Board of Trustees. The procedures have been designed to ensure that these interfund transactions, which do not incur broker commissions, are effected at current market prices.
5. INVESTMENT PORTFOLIO TRANSACTIONS
Purchases and sales of investments, excluding U.S. government obligations (if any) and short-term securities, for the year ended July 31, 2019 were $812,108,850 and $1,159,527,071, respectively.
6. SECURITIES LENDING TRANSACTIONS
The Fund lends its securities through an unaffiliated securities lending agent and receives collateral in the form of cash or securities with a value at least equal to the value of the securities on loan. The value of the loaned securities is determined at the close of each business day and any increases or decreases in the required collateral are exchanged between the Fund and the counterparty on the next business day. Cash collateral received is invested in the Securities Lending Fund which seeks to provide a positive return compared to the daily Fed Funds Open Rate by investing in high-quality, U.S. dollar-denominated short-term money market instruments and is exempt from registration under Section 3(c)(7) of the 1940 Act. Securities Lending Fund is managed by Funds Management and is subadvised by WellsCap. Funds Management receives an advisory fee starting at 0.05% and declining to 0.01% as the average daily net assets of the Securities Lending Fund increase. All of the fees received by Funds Management are paid to WellsCap for its services as subadviser.
30 | Wells Fargo Disciplined U.S. Core Fund
Notes to financial statements
In the event of counterparty default or the failure of a borrower to return a loaned security, the Fund has the right to use the collateral to offset any losses incurred.
As of July 31, 2019, the Fund had securities lending transactions with the following counterparties which are subject to offset:
| | | | | | | | | | | | |
| | | |
| Counterparty | | Value of
securities on loan | | | Collateral
received1 | | | Net amount | |
| | | |
Citigroup Global Market Inc. | | $ | 2,051,987 | | | $ | (2,051,987 | ) | | $ | 0 | |
| | | |
UBS Securities LLC | | | 2,215,661 | | | | (2,215,661 | ) | | | 0 | |
| 1 | Collateral received within this table is limited to the collateral for the net transaction with the counterparty. |
7. BANK BORROWINGS
The Trust (excluding the money market funds), Wells Fargo Master Trust and Wells Fargo Variable Trust are parties to a $280,000,000 revolving credit agreement whereby the Fund is permitted to use bank borrowings for temporary or emergency purposes, such as to fund shareholder redemption requests. Interest under the credit agreement is charged to the Fund based on a borrowing rate equal to the higher of the Federal Funds rate in effect on that day plus 1.25% or the overnight LIBOR rate in effect on that day plus 1.25%. In addition, an annual commitment fee equal to 0.25% of the unused balance is allocated to each participating fund.
During the year ended July 31, 2019, the Fund had average borrowings outstanding of $27,882 at an average interest rate of 3.73% and paid interest in the amount of $1,040.
8. DISTRIBUTIONS TO SHAREHOLDERS
The tax character of distributions paid during the years ended July 31, 2019 and July 31, 2018 were as follows:
| | | | | | | | |
| | | Year ended July 31 | |
| | |
| | | 2019 | | | 2018 | |
| | |
Ordinary income | | $ | 19,978,044 | | | $ | 27,352,794 | |
| | |
Long-term capital gain | | | 63,886,088 | | | | 28,572,832 | |
As of July 31, 2019, the components of distributable earnings on a tax basis were as follows:
| | | | |
Undistributed
ordinary
income | | Undistributed
long-term
gain | | Unrealized
gains
|
| | |
| $20,794,241 | | $24,799,513 | | $316,634,275 |
Effective for all filings after November 4, 2018, the Securities and Exchange Commission eliminated the requirement to separately state the components of distributions to shareholders under U.S. generally accepted accounting principles. The amounts of distributions to shareholders for the year ended July 31, 2018 were as follows:
| | | | | | | | |
| | |
| | | Net
investment
income | | | Net
realized
gains | |
| | |
Class A | | $ | 4,337,310 | | | $ | 16,367,452 | |
| | |
Class C | | | 71,920 | | | | 1,975,046 | |
| | |
Class R | | | 19,170 | | | | 67,065 | |
| | |
Class R6 | | | 2,941,311 | | | | 7,459,553 | |
| | |
Administrator Class | | | 938,093 | | | | 3,240,553 | |
| | |
Institutional Class | | | 5,006,239 | | | | 13,501,914 | |
9. INDEMNIFICATION
Under the Trust’s organizational documents, the officers and Trustees have been granted certain indemnification rights against certain liabilities that may arise out of performance of their duties to the Trust. Additionally, in the normal course of business, the
Wells Fargo Disciplined U.S. Core Fund | 31
Notes to financial statements
Trust may enter into contracts with service providers that contain a variety of indemnification clauses. The Trust’s maximum exposure under these arrangements is dependent on future claims that may be made against the Fund and, therefore, cannot be estimated.
10. NEW ACCOUNTING PRONOUNCEMENT
In August 2018, FASB issued Accounting Standards Update (“ASU”)No. 2018-13, Fair Value Measurement (Topic 820)Disclosure Framework—Changes to the Disclosure Requirements for Fair Value Measurement. ASU2018-13 updates the disclosure requirements for fair value measurements by modifying or removing certain disclosures and adding certain new disclosures. The amendments are effective for fiscal years, and interim periods within those fiscal years, beginning after December 15, 2019. Early adoption is permitted. Management has adopted the removal and modification of disclosures early, as permitted, and will adopt the additional new disclosures at the effective date.
32 | Wells Fargo Disciplined U.S. Core Fund
Report of independent registered public accounting firm
TO THE SHAREHOLDERS OF THE FUND AND BOARD OF TRUSTEES OF WELLS FARGO FUNDS TRUST:
Opinion on the Financial Statements
We have audited the accompanying statement of assets and liabilities of Wells Fargo Disciplined U.S. Core Fund (the Fund), one of the funds constituting Wells Fargo Funds Trust, including the portfolio of investments, as of July 31, 2019, the related statement of operations for the year then ended, the statements of changes in net assets for each of the years in the two-year period then ended, and the related notes (collectively, the financial statements) and the financial highlights for each of the years or periods in the five-year period then ended. In our opinion, the financial statements and financial highlights present fairly, in all material respects, the financial position of the Fund as of July 31, 2019, the results of its operations for the year then ended, the changes in its net assets for each of the years in the two-year period then ended, and the financial highlights for each of the years or periods in the five-year period then ended, in conformity with U.S. generally accepted accounting principles.
Basis for Opinion
These financial statements and financial highlights are the responsibility of the Fund’s management. Our responsibility is to express an opinion on these financial statements and financial highlights based on our audits. We are a public accounting firm registered with the Public Company Accounting Oversight Board (United States) (PCAOB) and are required to be independent with respect to the Fund in accordance with the U.S. federal securities laws and the applicable rules and regulations of the Securities and Exchange Commission and the PCAOB.
We conducted our audits in accordance with the standards of the PCAOB. Those standards require that we plan and perform the audit to obtain reasonable assurance about whether the financial statements and financial highlights are free of material misstatement, whether due to error or fraud. Our audits included performing procedures to assess the risks of material misstatement of the financial statements and financial highlights, whether due to error or fraud, and performing procedures that respond to those risks. Such procedures included examining, on a test basis, evidence regarding the amounts and disclosures in the financial statements and financial highlights. Such procedures also included confirmation of securities owned as of July 31, 2019, by correspondence with the custodian and transfer agent. Our audits also included evaluating the accounting principles used and significant estimates made by management, as well as evaluating the overall presentation of the financial statements and financial highlights. We believe that our audits provide a reasonable basis for our opinion.

We have not been able to determine the specific year that we began serving as the auditor of one or more Wells Fargo Funds investment companies; however we are aware that we have served as the auditor of one or more Wells Fargo Funds investment companies since at least 1955.
Boston, Massachusetts
September 25, 2019
Wells Fargo Disciplined U.S. Core Fund | 33
Other information (unaudited)
TAX INFORMATION
For corporate shareholders, pursuant to Section 854 of the Internal Revenue Code, 100% of ordinary income dividends qualify for the corporate dividends-received deduction for the fiscal year ended July 31, 2019.
Pursuant to Section 852 of the Internal Revenue Code, $63,886,088 was designated as a 20% rate gain distribution for the fiscal year ended July 31, 2019.
Pursuant to Section 854 of the Internal Revenue Code, $19,978,044 of income dividends paid during the fiscal year ended July 31, 2019 has been designated as qualified dividend income (QDI).
For the fiscal year ended July 31, 2019, $85,855 has been designated as interest-related dividends for nonresident alien shareholders pursuant to Section 871 of the Internal Revenue Code.
For the fiscal year ended July 31, 2019, $1,710,747 has been designated as short-term capital gain dividends for nonresident alien shareholders pursuant to Section 871 of the Internal Revenue Code
PROXY VOTING INFORMATION
A description of the policies and procedures used to determine how to vote proxies relating to portfolio securities is available, upon request, by calling1-800-222-8222, visiting our website atwfam.com, or visiting the SEC website at sec.gov. Information regarding how the proxies related to portfolio securities were voted during the most recent12-month period ended June 30 is available on the website atwfam.comor by visiting the SEC website at sec.gov.
QUARTERLY PORTFOLIO HOLDINGS INFORMATION
The Fund files its complete schedule of portfolio holdings with the SEC for the first and third quarters of each fiscal year on FormN-Q or FormN-PORT, which is available by visiting the SEC website at sec.gov. Those forms may be reviewed and copied at the SEC’s Public Reference Room in Washington, DC. Information on the operation of the Public Reference Room may be obtained by calling1-800-SEC-0330.
34 | Wells Fargo Disciplined U.S. Core Fund
Other information (unaudited)
BOARD OF TRUSTEES AND OFFICERS
Each of the Trustees and Officers1 listed in the table below acts in identical capacities for each fund in the Wells Fargo family of funds, which consists of 152 mutual funds comprising the Wells Fargo Funds Trust, Wells Fargo Variable Trust, Wells Fargo Master Trust and fourclosed-end funds (collectively the “Fund Complex”). This table should be read in conjunction with the Prospectus and the Statement of Additional Information2. The mailing address of each Trustee and Officer is 525 Market Street, 12th Floor, San Francisco, CA 94105. Each Trustee and Officer serves an indefinite term, however, each Trustee serves such term until reaching the mandatory retirement age established by the Trustees.
Independent Trustees
| | | | | | |
Name and
year of birth | | Position held and length of service* | | Principal occupations during past five years or longer | | Current other public company or investment
company directorships |
| | | |
William R. Ebsworth (Born 1957) | | Trustee,
since 2015 | | Retired. From 1984 to 2013, equities analyst, portfolio manager, research director and chief investment officer at Fidelity Management and Research Company in Boston, Tokyo, and Hong Kong, and retired in 2013 as Chief Investment Officer of Fidelity Strategic Advisers, Inc. where he led a team of investment professionals managing client assets. Prior thereto, Board member of Hong Kong Securities Clearing Co., Hong Kong Options Clearing Corp., the Thailand International Fund, Ltd., Fidelity Investments Life Insurance Company, and Empire Fidelity Investments Life Insurance Company. Audit Committee Chair and Investment Committee Chair of the Vincent Memorial Hospital Endowment(non-profit organization). Mr. Ebsworth is a CFA® charterholder. | | N/A |
| | | |
Jane A. Freeman (Born 1953) | | Trustee,
since 2015;
Chair Liaison, since 2018 | | Retired. From 2012 to 2014 and 1999 to 2008, Chief Financial Officer of Scientific Learning Corporation. From 2008 to 2012, Ms. Freeman provided consulting services related to strategic business projects. Prior to 1999, Portfolio Manager at Rockefeller & Co. and Scudder, Stevens & Clark. Board member of the Harding Loevner Funds from 1996 to 2014, serving as both Lead Independent Director and chair of the Audit Committee. Board member of the Russell Exchange Traded Funds Trust from 2011 to 2012 and the chair of the Audit Committee. Ms. Freeman is a Board Member of The Ruth Bancroft Garden(non-profit organization). She is also an inactive Chartered Financial Analyst. | | N/A |
| | | |
Isaiah Harris, Jr. (Born 1952) | | Trustee,
since 2009;
Audit Committee Chairman, since 2019 | | Retired. Chairman of the Board of CIGNA Corporation since 2009, and Director since 2005. From 2003 to 2011, Director of Deluxe Corporation. Prior thereto, President and CEO of BellSouth Advertising and Publishing Corp. from 2005 to 2007, President and CEO of BellSouth Enterprises from 2004 to 2005 and President of BellSouth Consumer Services from 2000 to 2003. Emeritus member of the Iowa State University Foundation Board of Governors. Emeritus Member of the Advisory Board of Iowa State University School of Business. Advisory Board Member, Palm Harbor Academy (private school). Advisory Board Member, Child Evangelism Fellowship(non-profit). Mr. Harris is a certified public accountant (inactive status). | | CIGNA Corporation |
| | | |
| Judith M. Johnson (Born 1949) | | Trustee, since 2008;
Audit Committee Chairman, from 2009 to 2018 | | Retired. Prior thereto, Chief Executive Officer and Chief Investment Officer of Minneapolis Employees Retirement Fund from 1996 to 2008. Ms. Johnson is an attorney, certified public accountant and a certified managerial accountant. | | N/A |
Wells Fargo Disciplined U.S. Core Fund | 35
Other information (unaudited)
| | | | | | |
Name and
year of birth | | Position held and length of service* | | Principal occupations during past five years or longer | | Current other public company or investment
company directorships |
| | | |
David F. Larcker (Born 1950) | | Trustee,
since 2009 | | James Irvin Miller Professor of Accounting at the Graduate School of Business, Stanford University, Director of the Corporate Governance Research Initiative and Senior Faculty of The Rock Center for Corporate Governance since 2006. From 2005 to 2008, Professor of Accounting at the Graduate School of Business, Stanford University. Prior thereto, Ernst & Young Professor of Accounting at The Wharton School, University of Pennsylvania from 1985 to 2005. | | N/A |
| | | |
Olivia S. Mitchell (Born 1953) | | Trustee,
since 2006; Nominating and Governance Committee Chairman, since 2018 | | International Foundation of Employee Benefit Plans Professor, Wharton School of the University of Pennsylvania since 1993. Director of Wharton’s Pension Research Council and Boettner Center on Pensions & Retirement Research, and Research Associate at the National Bureau of Economic Research. Previously, Cornell University Professor from 1978 to 1993. | | N/A |
| | | |
Timothy J. Penny (Born 1951) | | Trustee,
since 1996; Chairman, since 2018 | | President and Chief Executive Officer of Southern Minnesota Initiative Foundation, anon-profit organization, since 2007. Member of the Board of Trustees of NorthStar Education Finance, Inc., anon-profit organization, since 2007. | | N/A |
| | | |
James G. Polisson (Born 1959) | | Trustee,
since 2018 | | Retired. Chief Marketing Officer, Source (ETF) UK Services, Ltd, from 2015 to 2017. From 2012 to 2015, Principal of The Polisson Group, LLC, a management consulting, corporate advisory and principal investing company. Chief Executive Officer and Managing Director at Russell Investments, Global Exchange Traded Funds from 2010 to 2012. Managing Director of Barclays Global Investors from 1998 to 2010 and Global Chief Marketing Officer for iShares and Barclays Global Investors from 2000 to 2010. Trustee of the San Francisco Mechanics’ Institute, anon-profit organization, from 2013 to 2015. Board member of the Russell Exchange Traded Fund Trust from 2011 to 2012. Director of Barclays Global Investors Holdings Deutschland GmbH from 2006 to 2009. Mr. Polisson is an attorney and has a retired status with the Massachusetts and District of Columbia Bar Associations. | | N/A |
| * | Length of service dates reflect the Trustee’s commencement of service with the Trust’s predecessor entities, where applicable. |
36 | Wells Fargo Disciplined U.S. Core Fund
Other information (unaudited)
Officers
| | | | |
Name and year of birth | | Position held and length of service | | Principal occupations during past five years or longer |
| | |
Andrew Owen (Born 1960) | | President,
since 2017 | | Executive Vice President of Wells Fargo & Company and Head of Affiliated Managers, Wells Fargo Asset Management, since 2014. In addition, Mr. Owen is currently President, Chief Executive Officer and Director of Wells Fargo Funds Management, LLC since 2017. Prior thereto, Executive Vice President responsible for marketing, investments and product development for Wells Fargo Funds Management, LLC, from 2009 to 2014. |
| | |
Jeremy DePalma1 (Born 1974) | | Treasurer,
since 2012 | | Senior Vice President of Wells Fargo Funds Management, LLC since 2009. Senior Vice President of Evergreen Investment Management Company, LLC from 2008 to 2010 and head of the Fund Reporting and Control Team within Fund Administration from 2005 to 2010. |
| | |
Alexander Kymn (Born 1973) | | Secretary and Chief Legal Officer,
since 2018 | | Senior Company Counsel of Wells Fargo Bank, N.A. since 2018 (previously Senior Counsel from 2007 to 2018). Vice President of Wells Fargo Funds Management, LLC from 2008 to 2014. |
| | |
Michael H. Whitaker (Born 1967) | | Chief Compliance Officer,
since 2016 | | Senior Vice President and Chief Compliance Officer since 2016. Senior Vice President and Chief Compliance Officer for Fidelity Investments from 2007 to 2016. |
| | |
David Berardi (Born 1975) | | Assistant Treasurer,
since 2009 | | Vice President of Wells Fargo Funds Management, LLC since 2009. Vice President of Evergreen Investment Management Company, LLC from 2008 to 2010. Manager of Fund Reporting and Control for Evergreen Investment Management Company, LLC from 2004 to 2010. |
| 1 | Jeremy DePalma acts as Treasurer of 87 funds and Assistant Treasurer of 65 funds in the Fund Complex. |
| 2 | The Statement of Additional Information includes additional information about the Trustees and is available, without charge, upon request, by calling1-800-222-8222 or by visiting the website atwfam.com. |
Wells Fargo Disciplined U.S. Core Fund | 37
Other information (unaudited)
BOARD CONSIDERATION OF INVESTMENT MANAGEMENT ANDSUB-ADVISORY AGREEMENTS:
Wells Fargo Disciplined U.S. Core Fund
Under the Investment Company Act of 1940 (the “1940 Act”), the Board of Trustees (the “Board”) of Wells Fargo Funds Trust (the “Trust”) must determine annually whether to approve the continuation of the Trust’s investment management andsub-advisory agreements. In this regard, at anin-person meeting held on May21-22, 2019 (the “Meeting”), the Board, all the members of which have no direct or indirect interest in the investment management andsub-advisory agreements and are not “interested persons” of the Trust, as defined in the 1940 Act (the “Independent Trustees”), reviewed and approved for Wells Fargo Disciplined U.S. Core Fund(the “Fund”): (i) an investment management agreement (the “Management Agreement”) with Wells Fargo Funds Management, LLC (“Funds Management”); and (ii) an investmentsub-advisory agreement (the“Sub-Advisory Agreement”) with Wells Capital Management Incorporated (the“Sub-Adviser”), an affiliate of Funds Management. The Management Agreement and theSub-Advisory Agreement are collectively referred to as the “Advisory Agreements.”
At the Meeting, the Board considered the factors and reached the conclusions described below relating to the selection of Funds Management and theSub-Adviser and the approval of the Advisory Agreements. Prior to the Meeting, including at anin-person meeting in April 2019, the Trustees conferred extensively among themselves and with representatives of Funds Management about these matters. Also, the Board has adopted a team-based approach, with each team consisting of asub-set of Trustees, to assist the full Board in the discharge of its duties in reviewing investment performance and other matters throughout the year. The Independent Trustees were assisted in their evaluation of the Advisory Agreements by independent legal counsel, from whom they received separate legal advice and with whom they met separately.
In providing information to the Board, Funds Management and theSub-Adviser were guided by a detailed set of requests for information submitted to them by independent legal counsel on behalf of the Independent Trustees at the start of the Board’s annual contract renewal process earlier in 2019. In considering and approving the Advisory Agreements, the Trustees considered the information they believed relevant, including but not limited to the information discussed below. The Board considered not only the specific information presented in connection with the Meeting, but also the knowledge gained over time through interaction with Funds Management and theSub-Adviser about various topics. In this regard, the Board reviewed reports of Funds Management at each of its quarterly meetings, which included, among other things, portfolio reviews and investment performance reports. In addition, the Board and the teams mentioned above confer with portfolio managers at various times throughout the year. The Board did not identify any particular information or consideration that wasall-important or controlling, and each individual Trustee may have attributed different weights to various factors.
After its deliberations, the Board unanimously approved the continuation of the Advisory Agreements for aone-year term and determined that the compensation payable to Funds Management and theSub-Adviser under each of the Advisory Agreements was reasonable. The Board considered the approval of the Advisory Agreements for the Fund as part of its consideration of agreements for funds across the complex, but its approvals were made on afund-by-fund basis. The following summarizes a number of important, but not necessarily all, factors considered by the Board in support of its approvals.
Nature, extent and quality of services
The Board received and considered various information regarding the nature, extent and quality of services provided to the Fund by Funds Management and theSub-Adviser under the Advisory Agreements. This information included a description of the investment advisory services and Fund-level administrative services covered by the Management Agreement, as well as, among other things, a summary of the background and experience of senior management of Wells Fargo Asset Management (“WFAM”), of which Funds Management and theSub-Adviser are a part, a summary of investments made in the business of WFAM, a summary of certain organizational and personnel changes involving Funds Management and theSub-Adviser, and a description of Funds Management’s and theSub-Adviser’s business continuity planning programs and of their approaches to data privacy and cybersecurity. The Board received and reviewed information about Funds Management’s role as administrator of the Fund’s liquidity risk management program. The Board also considered the qualifications, background, tenure and responsibilities of each of the portfolio managers primarily responsible for theday-to-day portfolio management of the Fund.
The Board evaluated the ability of Funds Management and theSub-Adviser to attract and retain qualified investment professionals, including research, advisory and supervisory personnel. The Board further considered the compliance programs and compliance records of Funds Management and theSub-Adviser. In addition, the Board took into account the full range of services provided to the Fund by Funds Management and its affiliates.
38 | Wells Fargo Disciplined U.S. Core Fund
Other information (unaudited)
Fund investment performance and expenses
The Board considered the investment performance results for the Fund over various time periods ended December 31, 2018. The Board considered these results in comparison to the investment performance of funds in a universe that was determined by Broadridge Inc. (“Broadridge”) to be similar to the Fund (the “Universe”), and in comparison to the Fund’s benchmark index and to other comparative data. Broadridge is an independent provider of investment company data. The Board received a description of the methodology used by Broadridge to select the mutual funds in the performance Universe. The Board noted that the investment performance of the Fund (Administrator Class) was higher than the average investment performance of the Universe for the five- andten-year periods under review, but lower than the average investment performance of the Universe for theone- and three-year periods under review. The Board also noted that the investment performance of the Fund was lower than its benchmark index, the S&P 500 Index, for all periods under review.
The Board received information concerning, and discussed factors contributing to, the underperformance of the Fund relative to the Universe and benchmark for the periods identified above. The Board took note of the explanations for the relative underperformance during these periods, including with respect to investment decisions and market factors that affected the Fund’s investment performance. The Board also took note of the Fund’s outperformance relative to the Universe over the longer time periods under review.
The Board also received and considered information regarding the Fund’s net operating expense ratios and their various components, including actual management fees, custodian and othernon-management fees, and Rule12b-1 andnon-Rule12b-1 shareholder service fees. The Board considered these ratios in comparison to the median ratios of funds in class-specific expense groups that were determined by Broadridge to be similar to the Fund (the “Groups”). The Board received a description of the methodology used by Broadridge to select the mutual funds in the expense Groups and an explanation of how funds comprising expense groups and their expense ratios may vary fromyear-to-year. Based on the Broadridge reports, the Board noted that the net operating expense ratios of the Fund were lower than or equal to the median net operating expense ratios of the expense Groups for each share class.
The Board took into account the Fund’s investment performance and expense information provided to it among the factors considered in deciding tore-approve the Advisory Agreements.
Investment management andsub-advisory fee rates
The Board reviewed and considered the contractual fee rates payable by the Fund to Funds Management under the Management Agreement, as well as the contractual fee rates payable by the Fund to Funds Management for class-level administrative services under a Class-Level Administration Agreement, which include, among other things, class-level transfer agency andsub-transfer agency costs (collectively, the “Management Rates”). The Board also reviewed and considered the contractual investmentsub-advisory fee rates that are payable by Funds Management to theSub-Adviser for investmentsub-advisory services.
Among other information reviewed by the Board was a comparison of the Fund’s Management Rates with the average contractual investment management fee rates of funds in the expense Groups at a common asset level as well as transfer agency costs of the funds in the expense Groups. The Board noted that the Management Rates of the Fund were lower than the sum of these average rates for the Fund’s expense Groups for all share classes.
The Board also received and considered information about the portion of the total management fee that was retained by Funds Management after payment of the fee to theSub-Adviser forsub-advisory services. In assessing the reasonableness of this amount, the Board received and evaluated information about the nature and extent of responsibilities retained and risks assumed by Funds Management and not delegated to or assumed by theSub-Adviser, and about Funds Management’son-going oversight services. Given the affiliation between Funds Management and theSub-Adviser, the Board ascribed limited relevance to the allocation of fees between them.
The Board also received and considered information about the nature and extent of services offered and fee rates charged by Funds Management and theSub-Adviser to other types of clients with investment strategies similar to those of the Fund. In this regard, the Board received information about the significantly greater scope of services, and compliance, reporting and other legal burdens and risks of managing proprietary mutual funds compared with those associated with managing assets of other types of clients, including third-partysub-advised fund clients andnon-mutual fund clients such as institutional separate accounts.
Based on its consideration of the factors and information it deemed relevant, including those described here, the Board determined that the compensation payable to Funds Management under the Management Agreement and to theSub-Adviser under theSub-Advisory Agreement was reasonable.
Wells Fargo Disciplined U.S. Core Fund | 39
Other information (unaudited)
Profitability
The Board received and considered information concerning the profitability of Funds Management, as well as the profitability of both WFAM and Wells Fargo & Co. (“Wells Fargo”) from providing services to the fund family as a whole. The Board noted that theSub-Adviser’s profitability information with respect to providing services to the Fund and other funds in the family was subsumed in the WFAM and Wells Fargo profitability analysis.
Funds Management reported on the methodologies and estimates used in calculating profitability, including a description of the methodology used to allocate certain expenses. Among other things, the Board noted that the levels of profitability reported on afund-by-fund basis varied widely, depending on factors such as the size, type and age of fund. Based on its review, the Board did not deem the profits reported by Funds Management, WFAM or Wells Fargo from services provided to the Fund to be at a level that would prevent it from approving the continuation of the Advisory Agreements.
Economies of scale
The Board received and considered information about the potential for Funds Management to experience economies of scale in the provision of management services to the Fund, the difficulties of calculating economies of scale at an individual fund level, and the extent to which potential scale benefits are shared with shareholders. The Board noted the existence of breakpoints in the Fund’s management fee structure, which operate generally to reduce the Fund’s expense ratios as the Fund grows in size. The Board considered that in addition to management fee breakpoints, Funds Management shares potential economies of scale from its management business in a variety of ways, including through fee waiver and expense reimbursement arrangements, services that benefit shareholders, competitive management fee rates set at the outset without regard to breakpoints, and investments in the business intended to enhance services available to shareholders.
The Board concluded that Funds Management’s arrangements with respect to the Fund, including contractual breakpoints, constituted a reasonable approach to sharing potential economies of scale with the Fund and its shareholders.
Other benefits to Funds Management and theSub-Adviser
The Board received and considered information regarding potential“fall-out” or ancillary benefits received by Funds Management and its affiliates, including theSub-Adviser, as a result of their relationships with the Fund. Ancillary benefits could include, among others, benefits directly attributable to other relationships with the Fund and benefits potentially derived from an increase in Funds Management’s and theSub-Adviser’s business as a result of their relationships with the Fund. The Board noted that various affiliates of Funds Management may receive distribution-related fees, shareholder servicing payments andsub-transfer agency fees in respect of shares sold or held through them and services provided.
The Board also reviewed information about soft dollar credits earned and utilized by theSub-Adviser, fees earned by Funds Management and theSub-Adviser from managing a private investment vehicle for the fund family’s securities lending collateral, and commissions earned by an affiliated broker from portfolio transactions.
Based on its consideration of the factors and information it deemed relevant, including those described here, the Board did not find that any ancillary benefits received by Funds Management and its affiliates, including theSub-Adviser, were unreasonable.
Conclusion
At the Meeting, after considering the above-described factors and based on its deliberations and its evaluation of the information described above, the Board unanimously approved the continuation of the Advisory Agreements for aone-year term and determined that the compensation payable to Funds Management and theSub-Adviser under each of the Advisory Agreements was reasonable.
40 | Wells Fargo Disciplined U.S. Core Fund

For more information
More information about Wells Fargo Funds is available free upon request. To obtain literature, please write, visit the Fund’s website, or call:
Wells Fargo Funds
P.O. Box 219967
Kansas City, MO 64121-9967
Website:wfam.com
Individual investors:1-800-222-8222
Retail investment professionals:1-888-877-9275
Institutional investment professionals:1-866-765-0778

This report and the financial statements contained herein are submitted for the general information of the shareholders of the Fund. If this report is used for promotional purposes, distribution of the report must be accompanied or preceded by a current prospectus. Before investing, please consider the investment objectives, risks, charges, and expenses of the investment. For a current prospectus and, if available, a summary prospectus, containing this information, call1-800-222-8222 or visit the Fund’s website atwfam.com. Read the prospectus carefully before you invest or send money.
Wells Fargo Asset Management (WFAM) is the trade name for certain investment advisory/management firms owned by Wells Fargo & Company. These firms include but are not limited to Wells Capital Management Incorporated and Wells Fargo Funds Management, LLC. Certain products managed by WFAM entities are distributed by Wells Fargo Funds Distributor, LLC (a broker-dealer and Member FINRA).
This material is for general informational and educational purposes only and is NOT intended to provide investment advice or a recommendation of any kind—including a recommendation for any specific investment, strategy, or plan.
INVESTMENT PRODUCTS: NOT FDIC INSURED ◾ NO BANK GUARANTEE ◾ MAY LOSE VALUE
© 2019 Wells Fargo Funds Management, LLC. All rights reserved.
405476 09-19
A203/AR203 07-19
Annual Report
July 31, 2019
Wells Fargo Endeavor Select Fund
Beginning on January 1, 2021, as permitted by new regulations adopted by the Securities and Exchange Commission, paper copies of the Wells Fargo Funds’ annual and semi-annual shareholder reports issued after this date will no longer be sent by mail, unless you specifically request paper copies of the reports. Instead, the reports will be made available on the Funds’ website, and you will be notified by mail each time a report is posted and provided with a website address to access the report.
If you already elected to receive shareholder reports electronically, you will not be affected by this change and you need not take any action. You may elect to receive shareholder reports and other communications from the Fund electronically at any time by contacting your financial intermediary (such as a broker-dealer or bank) or, if you are a direct investor, by calling1-800-222-8222 or by enrolling at wellsfargo.com/advantagedelivery.
You may elect to receive all future reports in paper free of charge. If you invest through a financial intermediary, you can contact your financial intermediary to request that you continue to receive paper copies of your shareholder reports; if you invest directly with the Fund, you can call 1-800-222-8222. Your election to receive reports in paper will apply to all Wells Fargo Funds held in your account with your financial intermediary or, if you are a direct investor, to all Wells Fargo Funds that you hold.
|
|
|
Reduce clutter. Save trees. |
Sign up for electronic delivery of prospectuses and shareholder reports atwellsfargo.com/advantagedelivery |
The views expressed and any forward-looking statements are as of July 31, 2019, unless otherwise noted, and are those of the Fund managers and/or Wells Fargo Asset Management. Discussions of individual securities, or the markets generally, or any Wells Fargo Fund are not intended as individual recommendations. Future events or results may vary significantly from those expressed in any forward-looking statements. The views expressed are subject to change at any time in response to changing circumstances in the market. Wells Fargo Asset Management and the Fund disclaim any obligation to publicly update or revise any views expressed or forward-looking statements.
INVESTMENT PRODUCTS: NOT FDIC INSURED ◾ NO BANK GUARANTEE ◾ MAY LOSE VALUE
Wells Fargo Endeavor Select Fund | 1
Letter to shareholders (unaudited)

Andrew Owen
President
Wells Fargo Funds
Dear Shareholder:
We are pleased to offer you this annual report for the Wells Fargo Endeavor Select Fund for the 12-month period that ended July 31, 2019. After the first six months of the period yielded either low-single-digit or negative investment returns, U.S. stock and global bond investors generally enjoyed a recovery during the final six months amid continued concerns about global economic growth, international trade, geopolitical tensions, and bouts of market volatility. These concerns negatively influenced international equity markets.
For the period, U.S. stocks, based on the S&P 500 Index,1 gained 7.99% and international stocks, as measured by the MSCI ACWI ex USA Index (Net),2 fell 2.27%. The MSCI EM Index (Net)3 slipped 2.18%. For bond investors, the Bloomberg Barclays U.S. Aggregate Bond Index4 added 8.08%, the Bloomberg Barclays Global Aggregate ex-USD Index5 added 3.74%, the Bloomberg Barclays Municipal Bond Index6 gained 7.31%, and the ICE BofAML U.S. High Yield Index7 added 6.94%.
Entering the fourth quarter of 2018, economic data was encouraging.
Domestic equity investors entered the fourth quarter of 2018 with reasons to be optimistic. The U.S. Bureau of Economic Analysis reported second-quarter annualized gross domestic product (GDP) growth of 4.2%. Hiring improved. Unemployment declined. Consumer confidence and spending increased. Third-quarter corporate earnings reports were generally positive. U.S. trade negotiations with Mexico and Canada progressed. The U.S. Federal Reserve (Fed) raised the federal funds rate by 25 basis points (bps; 100 bps equal 1.00%) to a target range of between 2.00% and 2.25% in September 2018, one of four rate increases implemented during the calendar year, a sign of its confidence in the strength of the U.S. economy.
Investors in international markets were not as confident. Tensions between the U.S. and China increased. The U.S. imposed $200 billion in tariffs on Chinese goods. China reacted with $60 billion in tariffs on U.S. goods. Economic growth in China caused concern. In September 2018, international investors began to factor a number of disconcerting economic and business data points: lower July manufacturers’ and industrial orders in Germany; falling purchasing manager index numbers for August from the United Kingdom, China, and India; and declining household spending for August in Japan. Taken together, the data fed growing concerns over slowing global growth that unnerved investors.
| 1 | The S&P 500 Index consists of 500 stocks chosen for market size, liquidity, and industry group representation. It is a market-value-weighted index with each stock’s weight in the index proportionate to its market value. You cannot invest directly in an index. |
| 2 | The Morgan Stanley Capital International (MSCI) All Country World Index (ACWI) ex USA Index (Net) is a free-float-adjusted market-capitalization weighted index that is designed to measure the equity market performance of developed and emerging markets, excluding the U.S. Source: MSCI. MSCI makes no express or implied warranties or representations and shall have no liability whatsoever with respect to any MSCI data contained herein. The MSCI data may not be further redistributed or used as a basis for other indices or any securities or financial products. This report is not approved, reviewed, or produced by MSCI. You cannot invest directly in an index. |
| 3 | The MSCI Emerging Markets (EM) Index (Net) is a free-float-adjusted market-capitalization-weighted index that is designed to measure the equity market performance of emerging markets. You cannot invest directly in an index. |
| 4 | The Bloomberg Barclays U.S. Aggregate Bond Index is a broad-based benchmark that measures the investment-grade, U.S. dollar-denominated, fixed-rate taxable bond market, including Treasuries, government-related and corporate securities, mortgage-backed securities (agency fixed-rate and hybrid adjustable-rate mortgage pass-throughs), asset-backed securities, and commercial mortgage-backed securities. You cannot invest directly in an index. |
| 5 | The Bloomberg Barclays Global Aggregate ex-USD Index is an unmanaged index that provides a broad-based measure of the global investment-grade fixed-income markets excluding the U.S. dollar-denominated debt market. You cannot invest directly in an index. |
| 6 | The Bloomberg Barclays Municipal Bond Index is an unmanaged index composed of long-term tax-exempt bonds with a minimum credit rating of Baa. You cannot invest directly in an index. |
| 7 | The ICE BofAML U.S. High Yield Index is a market-capitalization-weighted index of domestic and Yankee high-yield bonds. The index tracks the performance of high-yield securities traded in the U.S. bond market. You cannot invest directly in an index. Copyright 2019. ICE Data Indices, LLC. All rights reserved. |
2 | Wells Fargo Endeavor Select Fund
Letter to shareholders (unaudited)
Global markets suffered during the fourth quarter of 2018.
November’s U.S. midterm elections shifted control of the House of Representatives from Republicans to Democrats, presaging partisan clashes that followed and caused uncertainty among investors. Third-quarter U.S. GDP was announced at an annualized 3.4% rate, lower than the second-quarter rate. Brexit efforts stalled ahead of the March 2019 deadline. The People’s Bank of China cut reserve requirement ratios, accelerated infrastructure spending, and cut taxes even as the value of the yuan declined to low levels last seen in 2008. A partial U.S. government shutdown driven by partisan policy disputes extended into January.
The combination of news in the U.S. and generally weak economic indicators outside of the U.S. caused investors to seek safe havens. December’s S&P 500 Index performance was the worst since 1931. Globally, fixed-income investments fared better than stocks during the last two months of the year. The Fed increased the federal funds rate by 25 bps in December to a target range of between 2.25% and 2.50%.
The market climbs a wall of worry.
Investors entered 2019 with reasons to be concerned. Investment returns appeared to reaffirm the adage that markets climb a wall of worry. The S&P 500 Index gained 8.01% for the month of January, the best monthly performance in 30 years. Returns for the MSCI ACWI ex USA Index (Net), the Bloomberg Barclays U.S. Aggregate Bond Index, and the Bloomberg Barclays Global Aggregate ex-USD Index also were positive.
In February 2019, signs of slowing global growth grew more ominous. The Bureau of Economic Analysis announced fourth-quarter 2018 GDP grew at an annualized 2.2% rate, down from the levels of the prior two quarters. In a February report, the Bank of England forecasted the slowest growth since the financial crisis for 2019. China and the U.S. continued to wrangle over trade issues.
By the end of March 2019, a combination of dovish Fed sentiment and steady, if not spectacular, U.S. economic and business metrics reinforced investors’ confidence. Monthly job creation data and corporate profits, while less consistent than during 2018, were solid. China announced a roughly $300 billion stimulus package through tax and fee cuts intended to reinvigorate economic growth. During April 2019, favorable sentiment found additional support in reports of sustained low inflation, solid employment data, and first-quarter U.S. GDP of an annualized rate of 3.2%.
During May 2019, markets tumbled on mixed investment signals. In the U.S., partisan wrangling ramped up as Democrats and Republicans set their sights on 2020 presidential politics. The U.K.’s Brexit caused Prime Minister Theresa May to resign. The European Commission downgraded the 2019 growth forecast to 1.2%. The U.S. increased tariffs on products from China, China responded, and then talks broke down. President Donald Trump threatened to turn his foreign policy tariff tool to Mexico over immigration issues.
As had been the case during most of 2019 to date, just as the investment horizon appeared to darken, sentiment turned and U.S. equity markets gained during June and July. The gains, primarily driven by geopolitical and monetary policy events, pushed equity markets to new highs.
President Mario Draghi of the European Central Bank said that if the outlook doesn’t improve, the bank will cut rates or buy more assets to prop up inflation. President Trump backed off of tariff threats against Mexico and China. In the U.S., the Fed implemented a 0.25% federal funds rate cut in July 2019.
“December’s S&P 500 Index performance was the worst since 1931.”
“The S&P 500 Index gained 8.01% for the month of January, the best monthly performance in 30 years.”
Wells Fargo Endeavor Select Fund | 3
Letter to shareholders (unaudited)
Later in July 2019, the U.S. reversed course and threatened to impose higher tariffs on China’s exports after talks failed. China responded with tariff threats of its own and devalued the renminbi, a move that roiled global markets. Despite the accommodative approach of central banks, investors continued to have misgivings about the durability of economic growth globally and a pervasively cautious tone influenced the world’s equity and fixed-income markets.
Don’t let short-term uncertainty derail long-term investment goals.
Periods of investment uncertainty can present challenges, but experience has taught us that maintaining long-term investment goals can be an effective way to plan for the future. To help you create a sound strategy based on your personal goals and risk tolerance, Wells Fargo Funds offers more than 100 mutual funds spanning a wide range of asset classes and investment styles. Although diversification cannot guarantee an investment profit or prevent losses, we believe it can be an effective way to manage investment risk and potentially smooth out overall portfolio performance. We encourage investors to know their investments and to understand that appropriate levels of risk-taking may unlock opportunities.
Thank you for choosing to invest with Wells Fargo Funds. We appreciate your confidence in us and remain committed to helping you meet your financial needs.
Sincerely,

Andrew Owen
President
Wells Fargo Funds
|
|
|
For further information about your Fund, contact your investment professional, visit our website at wfam.com, or call us directly at1-800-222-8222. |
4 | Wells Fargo Endeavor Select Fund
This page is intentionally left blank.
Performance highlights (unaudited)
Investment objective
The Fund seeks long-term capital appreciation.
Manager
Wells Fargo Funds Management, LLC
Subadviser
Wells Capital Management Incorporated
Portfolio managers
Michael T. Smith, CFA®‡
Christopher J. Warner, CFA®‡
Average annual total returns (%) as of July 31, 2019
| | | | | | | | | | | | | | | | | | | | | | | | | | | | | | | | | | |
| | | | |
| | | | | Including sales charge | | | Excluding sales charge | | | Expense ratios1 (%) | |
| | | | | | | | | |
| | | Inception date | | 1 year | | | 5 year | | | 10 year | | | 1 year | | | 5 year | | | 10 year | | | Gross | | | Net2 | |
| | | | | | | | | | |
| Class A (STAEX) | | 12-29-2000 | | | 8.68 | | | | 13.13 | | | | 14.25 | | | | 15.37 | | | | 14.47 | | | | 14.92 | | | | 1.26 | | | | 1.21 | |
| | | | | | | | | | |
| Class C (WECCX) | | 12-29-2000 | | | 13.51 | | | | 13.61 | | | | 14.07 | | | | 14.51 | | | | 13.61 | | | | 14.07 | | | | 2.01 | | | | 1.96 | |
| | | | | | | | | | |
| Administrator Class (WECDX) | | 4-8-2005 | | | – | | | | – | | | | – | | | | 15.63 | | | | 14.72 | | | | 15.19 | | | | 1.18 | | | | 1.01 | |
| | | | | | | | | | |
| Institutional Class (WFCIX) | | 4-8-2005 | | | – | | | | – | | | | ��� | | | | 15.76 | | | | 14.94 | | | | 15.41 | | | | 0.93 | | | | 0.81 | |
| | | | | | | | | | |
| Russell 1000® Growth Index3 | | – | | | – | | | | – | | | | – | | | | 10.82 | | | | 14.25 | | | | 15.74 | | | | – | | | | – | |
Figures quoted represent past performance, which is no guarantee of future results, and do not reflect taxes that a shareholder may pay on fund distributions or the redemption of fund shares. Investment return and principal value of an investment will fluctuate so that an investor’s shares, when redeemed, may be worth more or less than their original cost. Performance shown without sales charges would be lower if sales charges were reflected. Current performance may be lower or higher than the performance data quoted, which assumes the reinvestment of dividends and capital gains. Current month-end performance is available on the Fund’s website,wfam.com.
Index returns do not include transaction costs associated with buying and selling securities, any mutual fund fees or expenses, or any taxes. It is not possible to invest directly in an index.
For Class A shares, the maximum front-end sales charge is 5.75%. For Class C shares, the maximum contingent deferred sales charge is 1.00%. Performance including a contingent deferred sales charge assumes the sales charge for the corresponding time period. Administrator Class and Institutional Class shares are sold without a front-end sales charge or contingent deferred sales charge.
Stock values fluctuate in response to the activities of individual companies and general market and economic conditions. Certain investment strategies tend to increase the total risk of an investment (relative to the broader market). The Fund is exposed to foreign investment risk, focused portfolio risk, and smaller-company securities risk. Consult the Fund’s prospectus for additional information on these and other risks.
Please see footnotes on page 7.
6 | Wells Fargo Endeavor Select Fund
Performance highlights (unaudited)
|
|
| Growth of $10,000 investment as of July 31, 20194 |
|
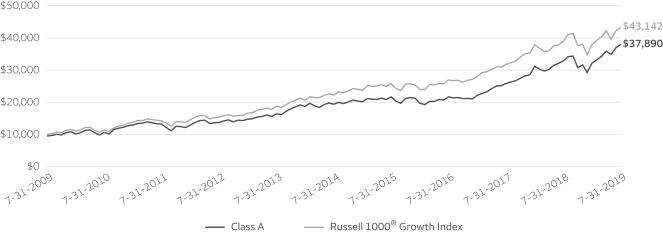 |
| ‡ | CFA® and Chartered Financial Analyst® are trademarks owned by CFA Institute. |
| 1 | Reflects the expense ratios as stated in the most recent prospectuses, which include the impact of 0.01% in acquired fund fees and expenses. The expense ratios shown are subject to change and may differ from the annualized expense ratios shown in the financial highlights of this report. |
| 2 | The manager has contractually committed through November 30, 2020, to waive fees and/or reimburse expenses to the extent necessary to cap the expenses of each class after fee waivers at 1.20% for Class A, 1.95% for Class C, 1.00% for Administrator Class, and 0.80% for Institutional Class. Brokerage commissions, stamp duty fees, interest, taxes, acquired fund fees and expenses (if any), and extraordinary expenses are excluded from the expense cap. Prior to or after the commitment expiration date, the cap may be increased or the commitment to maintain the cap may be terminated only with the approval of the Board of Trustees. Without this cap, the Fund’s returns would have been lower. The expense ratio paid by an investor is the net expense ratio (the total annual fund operating expenses after fee waivers) as stated in the prospectuses. |
| 3 | The Russell 1000® Growth Index measures the performance of those Russell 1000 companies with higher price/book ratios and higher forecasted growth values. You cannot invest directly in an index. |
| 4 | The chart compares the performance of Class A shares for the most recent ten years with the Russell 1000® Growth Index. The chart assumes a hypothetical investment of $10,000 in Class A shares and reflects all operating expenses and assumes the maximum initial sales charge of 5.75%. |
| 5 | The ten largest holdings, excluding cash, cash equivalents and any money market funds, are calculated based on the value of the investments divided by total net assets of the Fund. Holdings are subject to change and may have changed since the date specified. |
| 6 | Amounts are calculated based on the total long-term investments of the Fund. These amounts are subject to change and may have changed since the date specified. |
Wells Fargo Endeavor Select Fund | 7
Performance highlights (unaudited)
MANAGER’S DISCUSSION
Fund highlights
| ∎ | | The Fund outperformed its benchmark, the Russell 1000® Growth Index, for the 12-month period that ended July 31, 2019. |
| ∎ | | Stock selection in the information technology (IT) sector and select names within the consumer discretionary sector were key contributors to performance. |
| ∎ | | Stock selection within the communication services sector detracted from performance. |
Volatility reemerged during the middle of the 12-month period.
While global stock markets posted positive returns during the 12-month period, it was not an entirely smooth ride for investors. Optimism for synchronized global economic growth eventually evolved into a decidedly risk-off market driven by escalating uncertainty and investor fear. Mounting geopolitical concerns, rising domestic interest rates, concern over the stability of select emerging market economies, and escalating fears of a trade war between the U.S. and China contributed to market volatility. The Federal Reserve’s shift toward a neutral interest rate policy stance—and eventual easing—helped ease concerns and provided a tailwind for equities to reach new highs by the end of the period.
Despite increased uncertainty, we have not significantly repositioned the Fund. We continue to emphasize companies with a secular rather than a cyclical growth profile. The Fund remains positioned toward companies with high visibility of earnings growth and those positioned on the right side of change. We believe this strategy will prove beneficial should volatility levels remain elevated.
| | | | |
| |
| Ten largest holdings (%) as of July 31, 20195 | | | |
| | |
Microsoft Corporation | | | 9.05 | |
| | |
Amazon.com Incorporated | | | 6.09 | |
| | |
Alphabet Incorporated Class A | | | 5.42 | |
| | |
Visa Incorporated Class A | | | 5.23 | |
| | |
UnitedHealth Group Incorporated | | | 3.96 | |
| | |
Union Pacific Corporation | | | 3.18 | |
| | |
The Home Depot Incorporated | | | 3.13 | |
| | |
Waste Connections Incorporated | | | 3.08 | |
| | |
The Sherwin-Williams Company | | | 2.91 | |
| | |
Total System Services Incorporated | | | 2.77 | |
The Fund’s IT and select consumer discretionary holdings contributed to relative performance.
Within the IT sector, the Fund’s position in Total System Services, Incorporated, contributed to returns. Total System Services, a leading provider of electronic payment processing services to banks and other financial institutions, saw its shares materially increase on the company’s announcement that it would merge with Global Payments Incorporated. The deal is the third combination announced in the payments industry this year. The merger offers potential benefits from synergies and scale as the combined company will serve 3.5 million mostly small and medium-size businesses.
Within consumer discretionary, MercadoLibre, Incorporated, was additive to returns. MercadoLibre is the dominant Latin American e-commerce provider and owns MercadoPago, the leading online payment solution in Latin America. Increased e-commerce penetration in MercadoLibre’s key markets, such as Brazil and Argentina, drove higher sales growth. Customers’ use of MercadoPago both on and off MercadoLibre’s e-commerce marketplace provided an additional avenue of growth for the company.
Please see footnotes on page 7.
8 | Wells Fargo Endeavor Select Fund
Performance highlights (unaudited)
|
|
| Sector distribution as of July 31, 20196 |
|
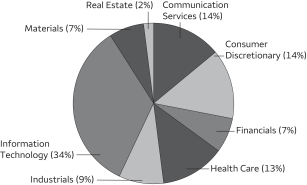 |
Stock selection in the communication services sector detracted from performance.
Within the communication services sector, our position in Alphabet Incorporated detracted from the Fund’s performance. Alphabet is the parent company of Google and other services such as Android, Ads, and YouTube. Shares sold off after the company reported deceleration in revenue growth and other key metrics. Management stated the deceleration resulted from changes implemented at YouTube in 2018 to improve the user experience. These initiatives resulted in more difficult comparisons for 2019. We have continued to hold the position in Alphabet as it is the leader in online advertising and is positioned to potentially benefit from global growth in web usage.
Also within communication services, shares of Activision Blizzard, Incorporated, weighed on returns over the past year. Activision, like many video game software firms, is benefiting from rising digital downloads and in-game monetization opportunities. However, increased competition from both the mega-hit “Fortnite” as well as other publishers pressured the shares. Activision’s “Call of Duty” franchise continues to perform extremely well, but the potential for greater competition to the company’s other titles caused the company to lower guidance for 2019.
The macro outlook is likely to remain muted, but opportunities abound to find companies on the right side of change.
As we look toward the remainder of 2019, we believe the U.S. economy is likely to avoid recessionary pressures and continue to expand albeit at a slower rate. We believe, however, the collision of slowing economic growth—caused partly by structural challenges such as demographics and elevated debt levels—and accelerating change driven by technological innovation creates exciting investment opportunities.
Innovative companies on the right side of change have been benefiting from this environment in which true secular growth is becoming increasingly scarce. In our view, right-side-of-change companies can produce predictable earnings and cash flows into the future—characteristics hard to find in the current economy. In a world starved of growth, investors tend to seek out that which is more certain and reward these attributes with a scarcity premium.
However, we also believe the market may become even more selective regarding profitability. In our view, the scarcity-of-growth narrative is playing out, and valuations have expanded meaningfully for many companies levered to new technologies. We think it is essential to stay laser-focused on finding innovative companies on the right side of change while remaining vigilant about risk management.
Please see footnotes on page 7.
Wells Fargo Endeavor Select Fund | 9
Fund expenses (unaudited)
As a shareholder of the Fund, you incur two types of costs: (1) transaction costs, including sales charges (loads) on purchase payments and contingent deferred sales charges (if any) on redemptions and (2) ongoing costs, including management fees, distribution (12b-1) and/or shareholder servicing fees, and other Fund expenses. This example is intended to help you understand your ongoing costs (in dollars) of investing in the Fund and to compare these costs with the ongoing costs of investing in other mutual funds.
The example is based on an investment of $1,000 invested at the beginning of the six-month period and held for the entire period from February 1, 2019 to July 31, 2019.
Actual expenses
The “Actual” line of the table below provides information about actual account values and actual expenses. You may use the information in this line, together with the amount you invested, to estimate the expenses that you paid over the period. Simply divide your account value by $1,000 (for example, an $8,600 account value divided by $1,000 = 8.6), then multiply the result by the number in the “Actual” line under the heading entitled “Expenses paid during period” for your applicable class of shares to estimate the expenses you paid on your account during this period.
Hypothetical example for comparison purposes
The “Hypothetical” line of the table below provides information about hypothetical account values and hypothetical expenses based on the Fund’s actual expense ratio and an assumed rate of return of 5% per year before expenses, which is not the Fund’s actual return. The hypothetical account values and expenses may not be used to estimate the actual ending account balance or expenses you paid for the period. You may use this information to compare the ongoing costs of investing in the Fund and other funds. To do so, compare this 5% hypothetical example with the 5% hypothetical examples that appear in the shareholder reports of the other funds.
Please note that the expenses shown in the table are meant to highlight your ongoing costs only and do not reflect any transactional costs, such as sales charges (loads) and contingent deferred sales charges. Therefore, the “Hypothetical” line of the table is useful in comparing ongoing costs only and will not help you determine the relative total costs of owning different funds. In addition, if these transactional costs were included, your costs would have been higher.
| | | | | | | | | | | | | | | | |
| | | Beginning
account value
2-1-2019 | | | Ending
account value
7-31-2019 | | | Expenses
paid during
the period¹ | | | Annualized net
expense ratio | |
| | | | | |
Class A | | | | | | | | | | | | | | | | |
| | | | |
Actual | | $ | 1,000.00 | | | $ | 1,181.56 | | | $ | 6.49 | | | | 1.20 | % |
| | | | |
Hypothetical (5% return before expenses) | | $ | 1,000.00 | | | $ | 1,018.84 | | | $ | 6.01 | | | | 1.20 | % |
| | | | | |
Class C | | | | | | | | | | | | | | | | |
| | | | |
Actual | | $ | 1,000.00 | | | $ | 1,176.76 | | | $ | 10.52 | | | | 1.95 | % |
| | | | |
Hypothetical (5% return before expenses) | | $ | 1,000.00 | | | $ | 1,015.12 | | | $ | 9.74 | | | | 1.95 | % |
| | | | | |
Administrator Class | | | | | | | | | | | | | | | | |
| | | | |
Actual | | $ | 1,000.00 | | | $ | 1,182.17 | | | $ | 5.41 | | | | 1.00 | % |
| | | | |
Hypothetical (5% return before expenses) | | $ | 1,000.00 | | | $ | 1,019.84 | | | $ | 5.01 | | | | 1.00 | % |
| | | | | |
Institutional Class | | | | | | | | | | | | | | | | |
| | | | |
Actual | | $ | 1,000.00 | | | $ | 1,183.37 | | | $ | 4.33 | | | | 0.80 | % |
| | | | |
Hypothetical (5% return before expenses) | | $ | 1,000.00 | | | $ | 1,020.83 | | | $ | 4.01 | | | | 0.80 | % |
| 1 | Expenses paid is equal to the annualized net expense ratio of each class multiplied by the average account value over the period, multiplied by the number of days in the most recent fiscal half-year divided by the number of days in the fiscal year (to reflect the one-half-year period). |
10 | Wells Fargo Endeavor Select Fund
Portfolio of investments—July 31, 2019
| | | | | | | | | | | | | | | | |
| | | | | | | | | Shares | | | Value | |
| Common Stocks: 96.56% | | | | | | | | | | | | | | | | |
| | | | |
Communication Services: 13.35% | | | | | | | | | | | | | | | | |
| | | | |
| Entertainment: 4.05% | | | | | | | | | | | | |
| | | | |
Activision Blizzard Incorporated | | | | | | | | | | | 28,800 | | | $ | 1,403,712 | |
| | | | |
Netflix Incorporated † | | | | | | | | | | | 6,400 | | | | 2,067,136 | |
| | | | |
Nintendo Company Limited ADR | | | | | | | | | | | 39,000 | | | | 1,801,410 | |
| | | | |
| | | | | | | | | | | | | | | 5,272,258 | |
| | | | | | | | | | | | | | | | |
| | | | |
| Interactive Media & Services: 9.30% | | | | | | | | | | | | |
| | | | |
Alphabet Incorporated Class A † | | | | | | | | | | | 5,799 | | | | 7,064,342 | |
| | | | |
Alphabet Incorporated Class C † | | | | | | | | | | | 950 | | | | 1,155,846 | |
| | | | |
IAC Corporation † | | | | | | | | | | | 8,900 | | | | 2,127,545 | |
| | | | |
Tencent Holdings Limited ADR | | | | | | | | | | | 38,200 | | | | 1,776,300 | |
| | | | |
| | | | | | | | | | | | | | | 12,124,033 | |
| | | | | | | | | | | | | | | | |
| | | | |
Consumer Discretionary: 13.86% | | | | | | | | | | | | | | | | |
| | | | |
| Auto Components: 1.54% | | | | | | | | | | | | |
| | | | |
Aptiv plc | | | | | | | | | | | 22,900 | | | | 2,007,185 | |
| | | | | | | | | | | | | | | | |
| | | | |
| Automobiles: 1.62% | | | | | | | | | | | | |
| | | | |
Ferrari NV | | | | | | | | | | | 13,100 | | | | 2,110,148 | |
| | | | | | | | | | | | | | | | |
| | | | |
| Internet & Direct Marketing Retail: 7.57% | | | | | | | | | | | | |
| | | | |
Amazon.com Incorporated † | | | | | | | | | | | 4,253 | | | | 7,939,415 | |
| | | | |
MercadoLibre Incorporated † | | | | | | | | | | | 3,100 | | | | 1,926,402 | |
| | | | |
| | | | | | | | | | | | | | | 9,865,817 | |
| | | | | | | | | | | | | | | | |
| | | | |
| Specialty Retail: 3.13% | | | | | | | | | | | | |
| | | | |
The Home Depot Incorporated | | | | | | | | | | | 19,083 | | | | 4,077,846 | |
| | | | | | | | | | | | | | | | |
| | | | |
Financials: 6.38% | | | | | | | | | | | | | | | | |
| | | | |
| Capital Markets: 6.38% | | | | | | | | | | | | |
| | | | |
Intercontinental Exchange Incorporated | | | | | | | | | | | 37,415 | | | | 3,287,282 | |
| | | | |
Raymond James Financial Incorporated | | | | | | | | | | | 25,000 | | | | 2,016,750 | |
| | | | |
S&P Global Incorporated | | | | | | | | | | | 12,278 | | | | 3,007,496 | |
| | | | |
| | | | | | | | | | | | | | | 8,311,528 | |
| | | | | | | | | | | | | | | | |
| | | | |
Health Care: 12.60% | | | | | | | | | | | | | | | | |
| | | | |
| Health Care Equipment & Supplies: 8.65% | | | | | | | | | | | | |
| | | | |
Alcon Incorporated † | | | | | | | | | | | 26,900 | | | | 1,580,375 | |
| | | | |
Boston Scientific Corporation † | | | | | | | | | | | 79,200 | | | | 3,362,832 | |
| | | | |
DexCom Incorporated † | | | | | | | | | | | 14,100 | | | | 2,211,867 | |
| | | | |
Edwards Lifesciences Corporation † | | | | | | | | | | | 10,800 | | | | 2,298,780 | |
| | | | |
Intuitive Surgical Incorporated † | | | | | | | | | | | 3,500 | | | | 1,818,285 | |
| | | | |
| | | | | | | | | | | | | | | 11,272,139 | |
| | | | | | | | | | | | | | | | |
| | | | |
| Health Care Providers & Services: 3.95% | | | | | | | | | | | | |
| | | | |
UnitedHealth Group Incorporated | | | | | | | | | | | 20,700 | | | | 5,154,507 | |
| | | | | | | | | | | | | | | | |
| | | | |
Industrials: 8.94% | | | | | | | | | | | | | | | | |
| | | | |
| Commercial Services & Supplies: 5.76% | | | | | | | | | | | | |
| | | | |
Cintas Corporation | | | | | | | | | | | 13,400 | | | | 3,489,896 | |
| | | | |
Waste Connections Incorporated | | | | | | | | | | | 44,260 | | | | 4,015,267 | |
| | | | |
| | | | | | | | | | | | | | | 7,505,163 | |
| | | | | | | | | | | | | | | | |
The accompanying notes are an integral part of these financial statements.
Wells Fargo Endeavor Select Fund | 11
Portfolio of investments—July 31, 2019
| | | | | | | | | | | | | | | | |
| | | | | | | | | Shares | | | Value | |
| Road & Rail: 3.18% | | | | | | | | | | | | |
| | | | |
Union Pacific Corporation | | | | | | | | | | | 23,000 | | | $ | 4,138,850 | |
| | | | | | | | | | | | | | | | |
| | | | |
Information Technology: 32.68% | | | | | | | | | | | | | | | | |
| | | | |
| Communications Equipment: 2.09% | | | | | | | | | | | | |
| | | | |
Motorola Solutions Incorporated | | | | | | | | | | | 16,400 | | | | 2,721,744 | |
| | | | | | | | | | | | | | | | |
| | | | |
| IT Services: 15.27% | | | | | | | | | | | | |
| | | | |
Fiserv Incorporated † | | | | | | | | | | | 30,330 | | | | 3,197,724 | |
| | | | |
FleetCor Technologies Incorporated † | | | | | | | | | | | 10,600 | | | | 3,012,202 | |
| | | | |
PayPal Holdings Incorporated † | | | | | | | | | | | 29,600 | | | | 3,267,840 | |
| | | | |
Total System Services Incorporated | | | | | | | | | | | 26,600 | | | | 3,610,152 | |
| | | | |
Visa Incorporated Class A | | | | | | | | | | | 38,258 | | | | 6,809,924 | |
| | | | |
| | | | | | | | | | | | | | | 19,897,842 | |
| | | | | | | | | | | | | | | | |
| | | | |
| Software: 15.32% | | | | | | | | | | | | |
| | | | |
Autodesk Incorporated † | | | | | | | | | | | 15,300 | | | | 2,389,401 | |
| | | | |
Microsoft Corporation | | | | | | | | | | | 86,600 | | | | 11,800,982 | |
| | | | |
Salesforce.com Incorporated † | | | | | | | | | | | 18,400 | | | | 2,842,800 | |
| | | | |
ServiceNow Incorporated † | | | | | | | | | | | 10,600 | | | | 2,940,334 | |
| | | | |
| | | | | | | | | | | | | | | 19,973,517 | |
| | | | | | | | | | | | | | | | |
| | | | |
Materials: 6.92% | | | | | | | | | | | | | | | | |
| | | | |
| Chemicals: 5.21% | | | | | | | | | | | | |
| | | | |
Air Products & Chemicals Incorporated | | | | | | | | | | | 13,100 | | | | 2,990,337 | |
| | | | |
The Sherwin-Williams Company | | | | | | | | | | | 7,400 | | | | 3,796,496 | |
| | | | |
| | | | | | | | | | | | | | | 6,786,833 | |
| | | | | | | | | | | | | | | | |
| | | | |
| Construction Materials: 1.71% | | | | | | | | | | | | |
| | | | |
Vulcan Materials Company | | | | | | | | | | | 16,100 | | | | 2,227,435 | |
| | | | | | | | | | | | | | | | |
| | | | |
Real Estate: 1.83% | | | | | | | | | | | | | | | | |
| | | | |
| Equity REITs: 1.83% | | | | | | | | | | | | |
| | | | |
SBA Communications Corporation † | | | | | | | | | | | 9,700 | | | | 2,380,477 | |
| | | | | | | | | | | | | | | | |
| | | | |
Total Common Stocks (Cost $67,736,210) | | | | | | | | | | | | | | | 125,827,322 | |
| | | | | | | | | | | | | | | | |
| | | | |
| | | | | | | | | | | | | | | | |
| | | Yield | | | | | | | | | | |
| Short-Term Investments: 3.31% | | | | | | | | | | | | |
| | | | |
| Investment Companies: 3.31% | | | | | | | | | | | | |
| | | | |
Wells Fargo Government Money Market Fund Select Class (l)(u) | | | 2.26 | % | | | | | | | 4,314,739 | | | | 4,314,739 | |
| | | | | | | | | | | | | | | | |
| | | | |
Total Short-Term Investments (Cost $4,314,739) | | | | | | | | | | | | | | | 4,314,739 | |
| | | | | | | | | | | | | | | | |
| | | | | | | | |
| Total investments in securities (Cost $72,050,949) | | | 99.87 | % | | | 130,142,061 | |
| | |
Other assets and liabilities, net | | | 0.13 | | | | 173,093 | |
| | | | | | | | |
| Total net assets | | | 100.00 | % | | $ | 130,315,154 | |
| | | | | | | | |
| † | Non-income-earning security |
| (l) | The issuer of the security is an affiliated person of the Fund as defined in the Investment Company Act of 1940. |
| (u) | The rate represents the 7-day annualized yield at period end. |
Abbreviations:
| ADR | American depositary receipt |
| REIT | Real estate investment trust |
The accompanying notes are an integral part of these financial statements.
12 | Wells Fargo Endeavor Select Fund
Portfolio of investments—July 31, 2019
Investments in Affiliates
An affiliated investment is an investment in which the Fund owns at least 5% of the outstanding voting shares of the issuer or as a result of other relationships, such as the Fund and the issuer having the same investment manager. Transactions with issuers that were either affiliated persons of the Fund at the beginning of the period or the end of the period were as follows:
| | | | | | | | | | | | | | | | | | | | | | | | | | | | | | | | | | | | |
| | | Shares,
beginning
of period | | | Shares
purchased | | | Shares
sold | | | Shares,
end of
period | | | Net
realized
gains
(losses) | | | Net
change in
unrealized
gains
(losses) | | | Income
from
affiliated
securities | | | Value,
end
of period | | | % of
net
assets | |
Short-Term Investments | | | | | | | | | | | | | | | | | | | | | | | | | | | | | | | | | | | | |
Investment Companies | | | | | | | | | | | | | | | | | | | | | | | | | | | | | | | | | | | | |
Securities Lending Cash Investments LLC* | | | 2,171,758 | | | | 29,643,583 | | | | 31,815,341 | | | | 0 | | | $ | (1,003 | ) | | $ | 0 | | | $ | 24,214 | # | | $ | 0 | | | | | |
Wells Fargo Government Money Market Fund Select Class | | | 2,588,003 | | | | 50,399,202 | | | | 48,672,466 | | | | 4,314,739 | | | | 0 | | | | 0 | | | | 61,730 | | | | 4,314,739 | | | | | |
| | | | | | | | | | | | | | | | | | | | | | | | | | | | | | | | | | | | |
| | | | | | | | | | | | | | | | | | $ | (1,003 | ) | | $ | 0 | | | $ | 85,944 | | | $ | 4,314,739 | | | | 3.31 | % |
| | | | | | | | | | | | | | | | | | | | | | | | | | | | | | | | | | | | |
| * | No longer held at the end of the period. |
| # | Amount shown represents income before fees and rebates. |
The accompanying notes are an integral part of these financial statements.
Wells Fargo Endeavor Select Fund | 13
Statement of assets and liabilities—July 31, 2019
| | | | |
| | | | |
| |
Assets | | | | |
Investments in unaffiliated securities, at value (cost $67,736,210) | | $ | 125,827,322 | |
Investments in affiliated securities, at value (cost $4,314,739) | | | 4,314,739 | |
Receivable for investments sold | | | 102,621 | |
Receivable for Fund shares sold | | | 145,907 | |
Receivable for dividends | | | 32,192 | |
Prepaid expenses and other assets | | | 122,959 | |
| | | | |
Total assets | | | 130,545,740 | |
| | | | |
| |
Liabilities | | | | |
Payable for Fund shares redeemed | | | 89,228 | |
Management fee payable | | | 59,575 | |
Professional fees payable | | | 34,280 | |
Administration fees payable | | | 15,839 | |
Custodian and accounting fees payable | | | 14,887 | |
Trustees’ fees and expenses payable | | | 4,362 | |
Distribution fee payable | | | 1,355 | |
Accrued expenses and other liabilities | | | 11,060 | |
| | | | |
Total liabilities | | | 230,586 | |
| | | | |
Total net assets | | $ | 130,315,154 | |
| | | | |
| |
Net assets consist of | | | | |
Paid-in capital | | $ | 56,933,388 | |
Total distributable earnings | | | 73,381,766 | |
| | | | |
Total net assets | | $ | 130,315,154 | |
| | | | |
| |
Computation of net asset value and offering price per share | | | | |
Net assets – Class A | | $ | 17,939,575 | |
Shares outstanding – Class A1 | | | 2,153,139 | |
Net asset value per share – Class A | | | $8.33 | |
Maximum offering price per share – Class A2 | | | $8.84 | |
Net assets – Class C | | $ | 2,115,595 | |
Shares outstanding – Class C1 | | | 435,618 | |
Net asset value per share – Class C | | | $4.86 | |
Net assets – Administrator Class | | $ | 2,590,300 | |
Shares outstanding – Administrator Class1 | | | 283,117 | |
Net asset value per share – Administrator Class | | | $9.15 | |
Net assets – Institutional Class | | $ | 107,669,684 | |
Shares outstanding – Institutional Class1 | | | 11,121,976 | |
Net asset value per share – Institutional Class | | | $9.68 | |
| 1 | The Fund has an unlimited number of authorized shares. |
| 2 | Maximum offering price is computed as 100/94.25 of net asset value. On investments of $50,000 or more, the offering price is reduced. |
The accompanying notes are an integral part of these financial statements.
14 | Wells Fargo Endeavor Select Fund
Statement of operations—year ended July 31, 2019
| | | | |
| | | | |
| |
Investment income | | | | |
Dividends (net of foreign withholding taxes of $10,340) | | $ | 1,067,333 | |
Income from affiliated securities | | | 67,722 | |
| | | | |
Total investment income | | | 1,135,055 | |
| | | | |
| |
Expenses | | | | |
Management fee | | | 937,210 | |
Administration fees | | | | |
Class A | | | 33,432 | |
Class C | | | 6,244 | |
Administrator Class | | | 3,447 | |
Institutional Class | | | 146,044 | |
Shareholder servicing fees | | | | |
Class A | | | 39,800 | |
Class C | | | 7,433 | |
Administrator Class | | | 6,428 | |
Distribution fee | | | | |
Class C | | | 22,299 | |
Custody and accounting fees | | | 15,103 | |
Professional fees | | | 45,413 | |
Registration fees | | | 59,999 | |
Shareholder report expenses | | | 35,000 | |
Trustees’ fees and expenses | | | 22,091 | |
Other fees and expenses | | | 12,397 | |
| | | | |
Total expenses | | | 1,392,340 | |
Less: Fee waivers and/or expense reimbursements | | | (218,066 | ) |
| | | | |
Net expenses | | | 1,174,274 | |
| | | | |
Net investment loss | | | (39,219 | ) |
| | | | |
| |
Realized and unrealized gains (losses) on investments | | | | |
Net realized gains (losses) on | | | | |
Unaffiliated securities | | | 21,280,819 | |
Affiliated securities | | | (1,003 | ) |
| | | | |
Net realized gains on investments | | | 21,279,816 | |
Net change in unrealized gains (losses) on investments | | | (3,421,390 | ) |
| | | | |
Net realized and unrealized gains (losses) on investments | | | 17,858,426 | |
| | | | |
Net increase in net assets resulting from operations | | $ | 17,819,207 | |
| | | | |
The accompanying notes are an integral part of these financial statements.
Wells Fargo Endeavor Select Fund | 15
Statement of changes in net assets
| | | | | | | | | | | | | | | | |
| | | Year ended
July 31, 2019 | | | Year ended
July 31, 2018¹ | |
| | | | |
Operations | | | | | | | | | | | | | | | | |
Net investment loss | | | | | | $ | (39,219 | ) | | | | | | $ | (234,390 | ) |
Net realized gains on investments | | | | | | | 21,279,816 | | | | | | | | 29,720,347 | |
Net change in unrealized gains (losses) on investments | | | | | | | (3,421,390 | ) | | | | | | | 10,190,328 | |
| | | | |
Net increase in net assets resulting from operations | | | | | | | 17,819,207 | | | | | | | | 39,676,285 | |
| | | | |
| | | | |
Distributions to shareholders from net investment income and net realized gains | | | | | | | | | | | | | | | | |
Class A | | | | | | | (3,430,850 | ) | | | | | | | (2,526,049 | ) |
Class C | | | | | | | (1,168,306 | ) | | | | | | | (946,756 | ) |
Administrator Class | | | | | | | (567,258 | ) | | | | | | | (597,659 | ) |
Institutional Class | | | | | | | (23,115,770 | ) | | | | | | | (24,176,044 | ) |
| | | | |
Total distributions to shareholders | | | | | | | (28,282,184 | ) | | | | | | | (28,246,508 | ) |
| | | | |
| | | | |
Capital share transactions | | | Shares | | | | | | | | Shares | | | | | |
Proceeds from shares sold | | | | | | | | | | | | | | | | |
Class A | | | 695,352 | | | | 5,403,334 | | | | 742,375 | | | | 6,708,296 | |
Class C | | | 135,403 | | | | 567,944 | | | | 68,071 | | | | 431,126 | |
Administrator Class | | | 17,483 | | | | 134,106 | | | | 8,610 | | | | 83,829 | |
Institutional Class | | | 927,530 | | | | 8,358,983 | | | | 829,379 | | | | 8,252,736 | |
| | | | |
| | | | | | | 14,464,367 | | | | | | | | 15,475,987 | |
| | | | |
Reinvestment of distributions | | | | | | | | | | | | | | | | |
Class A | | | 460,780 | | | | 3,073,403 | | | | 267,712 | | | | 2,179,176 | |
Class C | | | 298,729 | | | | 1,168,031 | | | | 168,269 | | | | 942,309 | |
Administrator Class | | | 77,420 | | | | 566,717 | | | | 65,748 | | | | 573,324 | |
Institutional Class | | | 2,976,014 | | | | 23,004,592 | | | | 2,647,483 | | | | 24,092,788 | |
| | | | |
| | | | | | | 27,812,743 | | | | | | | | 27,787,597 | |
| | | | |
Payment for shares redeemed | | | | | | | | | | | | | | | | |
Class A | | | (731,194 | ) | | | (5,639,781 | ) | | | (706,902 | ) | | | (6,353,582 | ) |
Class C | | | (585,440 | ) | | | (2,522,025 | ) | | | (189,968 | ) | | | (1,213,972 | ) |
Administrator Class | | | (114,882 | ) | | | (964,193 | ) | | | (155,500 | ) | | | (1,499,494 | ) |
Institutional Class | | | (5,242,746 | ) | | | (47,188,366 | ) | | | (5,501,471 | ) | | | (55,332,910 | ) |
| | | | |
| | | | | | | (56,314,365 | ) | | | | | | | (64,399,958 | ) |
| | | | |
Net decrease in net assets resulting from capital share transactions | | | | | | | (14,037,255 | ) | | | | | | | (21,136,374 | ) |
| | | | |
Total decrease in net assets | | | | | | | (24,500,232 | ) | | | | | | | (9,706,597 | ) |
| | | | |
| | | | |
Net assets | | | | | | | | | | | | | | | | |
Beginning of period | | | | | | | 154,815,386 | | | | | | | | 164,521,983 | |
| | | | |
End of period | | | | | | $ | 130,315,154 | | | | | | | $ | 154,815,386 | |
| | | | |
| 1 | Effective for all filings after November 4, 2018, the SEC prospectively eliminated the requirement to parenthetically disclose undistributed net investment income at the end of the period and permitted the aggregation of distributions, with the exception of tax basis returns of capital. Undistributed net investment income at July 31, 2018 was $0. The disaggregated distributions information for the year ended July 31, 2018 is included in Note 8,Distributions to Shareholders, in the notes to the financial statements. |
The accompanying notes are an integral part of these financial statements.
16 | Wells Fargo Endeavor Select Fund
Financial highlights
(For a share outstanding throughout each period)
| | | | | | | | | | | | | | | | | | | | |
| | | Year ended July 31 | |
| CLASS A | | 2019 | | | 2018 | | | 2017 | | | 2016 | | | 2015 | |
Net asset value, beginning of period | | | $9.43 | | | | $9.09 | | | | $8.96 | | | | $13.74 | | | | $14.13 | |
Net investment loss | | | (0.03 | )1 | | | (0.04 | )1 | | | (0.03 | )1 | | | (0.04 | )1 | | | (0.08 | )1 |
Net realized and unrealized gains (losses) on investments | | | 0.97 | | | | 2.23 | | | | 1.49 | | | | (0.14 | ) | | | 1.65 | |
| | | | | | | | | | | | | | | | | | | | |
Total from investment operations | | | 0.94 | | | | 2.19 | | | | 1.46 | | | | (0.18 | ) | | | 1.57 | |
Distributions to shareholders from | | | | | | | | | | | | | | | | | | | | |
Net realized gains | | | (2.04 | ) | | | (1.85 | ) | | | (1.33 | ) | | | (4.60 | ) | | | (1.96 | ) |
Net asset value, end of period | | | $8.33 | | | | $9.43 | | | | $9.09 | | | | $8.96 | | | | $13.74 | |
Total return2 | | | 15.37 | % | | | 27.35 | % | | | 19.39 | % | | | (0.07 | )% | | | 12.14 | % |
Ratios to average net assets (annualized) | | | | | | | | | | | | | | | | | | | | |
Gross expenses | | | 1.30 | % | | | 1.25 | % | | | 1.22 | % | | | 1.28 | % | | | 1.24 | % |
Net expenses | | | 1.20 | % | | | 1.20 | % | | | 1.20 | % | | | 1.20 | % | | | 1.23 | % |
Net investment loss | | | (0.35 | )% | | | (0.49 | )% | | | (0.33 | )% | | | (0.36 | )% | | | (0.55 | )% |
Supplemental data | | | | | | | | | | | | | | | | | | | | |
Portfolio turnover rate | | | 20 | % | | | 36 | % | | | 59 | % | | | 79 | % | | | 126 | % |
Net assets, end of period (000s omitted) | | | $17,940 | | | | $16,301 | | | | $12,953 | | | | $18,498 | | | | $26,197 | |
| 1 | Calculated based upon average shares outstanding |
| 2 | Total return calculations do not include any sales charges. |
The accompanying notes are an integral part of these financial statements.
Wells Fargo Endeavor Select Fund | 17
Financial highlights
(For a share outstanding throughout each period)
| | | | | | | | | | | | | | | | | | | | |
| | | Year ended July 31 | |
| CLASS C | | 2019 | | | 2018 | | | 2017 | | | 2016 | | | 2015 | |
Net asset value, beginning of period | | | $6.46 | | | | $6.80 | | | | $7.09 | | | | $11.93 | | | | $12.61 | |
Net investment loss | | | (0.06 | )1 | | | (0.08 | )1 | | | (0.07 | )1 | | | (0.09 | )1 | | | (0.16 | )1 |
Net realized and unrealized gains (losses) on investments | | | 0.50 | | | | 1.59 | | | | 1.11 | | | | (0.15 | ) | | | 1.44 | |
| | | | | | | | | | | | | | | | | | | | |
Total from investment operations | | | 0.44 | | | | 1.51 | | | | 1.04 | | | | (0.24 | ) | | | 1.28 | |
Distributions to shareholders from | | | | | | | | | | | | | | | | | | | | |
Net realized gains | | | (2.04 | ) | | | (1.85 | ) | | | (1.33 | ) | | | (4.60 | ) | | | (1.96 | ) |
Net asset value, end of period | | | $4.86 | | | | $6.46 | | | | $6.80 | | | | $7.09 | | | | $11.93 | |
Total return2 | | | 14.51 | % | | | 26.43 | % | | | 18.46 | % | | | (0.76 | )% | | | 11.21 | % |
Ratios to average net assets (annualized) | | | | | | | | | | | | | | | | | | | | |
Gross expenses | | | 2.05 | % | | | 2.00 | % | | | 1.97 | % | | | 2.03 | % | | | 1.99 | % |
Net expenses | | | 1.95 | % | | | 1.95 | % | | | 1.95 | % | | | 1.95 | % | | | 1.99 | % |
Net investment loss | | | (1.12 | )% | | | (1.22 | )% | | | (1.08 | )% | | | (1.11 | )% | | | (1.32 | )% |
Supplemental data | | | | | | | | | | | | | | | | | | | | |
Portfolio turnover rate | | | 20 | % | | | 36 | % | | | 59 | % | | | 79 | % | | | 126 | % |
Net assets, end of period (000s omitted) | | | $2,116 | | | | $3,792 | | | | $3,676 | | | | $4,845 | | | | $6,914 | |
| 1 | Calculated based upon average shares outstanding |
| 2 | Total return calculations do not include any sales charges. |
The accompanying notes are an integral part of these financial statements.
18 | Wells Fargo Endeavor Select Fund
Financial highlights
(For a share outstanding throughout each period)
| | | | | | | | | | | | | | | | | | | | |
| | | Year ended July 31 | |
| ADMINISTRATOR CLASS | | 2019 | | | 2018 | | | 2017 | | | 2016 | | | 2015 | |
Net asset value, beginning of period | | | $10.12 | | | | $9.62 | | | | $9.38 | | | | $14.13 | | | | $14.45 | |
Net investment income (loss) | | | (0.01 | )1 | | | (0.03 | )1 | | | (0.01 | )1 | | | 0.01 | 1 | | | (0.05 | )1 |
Net realized and unrealized gains (losses) on investments | | | 1.08 | | | | 2.38 | | | | 1.58 | | | | (0.16 | ) | | | 1.69 | |
| | | | | | | | | | | | | | | | | | | | |
Total from investment operations | | | 1.07 | | | | 2.35 | | | | 1.57 | | | | (0.15 | ) | | | 1.64 | |
Distributions to shareholders from | | | | | | | | | | | | | | | | | | | | |
Net realized gains | | | (2.04 | ) | | | (1.85 | ) | | | (1.33 | ) | | | (4.60 | ) | | | (1.96 | ) |
Net asset value, end of period | | | $9.15 | | | | $10.12 | | | | $9.62 | | | | $9.38 | | | | $14.13 | |
Total return | | | 15.63 | % | | | 27.55 | % | | | 19.71 | % | | | 0.16 | % | | | 12.38 | % |
Ratios to average net assets (annualized) | | | | | | | | | | | | | | | | | | | | |
Gross expenses | | | 1.21 | % | | | 1.16 | % | | | 1.14 | % | | | 1.14 | % | | | 1.05 | % |
Net expenses | | | 1.00 | % | | | 1.00 | % | | | 1.00 | % | | | 1.00 | % | | | 0.99 | % |
Net investment income (loss) | | | (0.16 | )% | | | (0.28 | )% | | | (0.12 | )% | | | 0.06 | % | | | (0.32 | )% |
Supplemental data | | | | | | | | | | | | | | | | | | | | |
Portfolio turnover rate | | | 20 | % | | | 36 | % | | | 59 | % | | | 79 | % | | | 126 | % |
Net assets, end of period (000s omitted) | | | $2,590 | | | | $3,068 | | | | $3,695 | | | | $5,254 | | | | $42,776 | |
| 1 | Calculated based upon average shares outstanding |
The accompanying notes are an integral part of these financial statements.
Wells Fargo Endeavor Select Fund | 19
Financial highlights
(For a share outstanding throughout each period)
| | | | | | | | | | | | | | | | | | | | |
| | | Year ended July 31 | |
| INSTITUTIONAL CLASS | | 2019 | | | 2018 | | | 2017 | | | 2016 | | | 2015 | |
Net asset value, beginning of period | | | $10.57 | | | | $9.95 | | | | $9.65 | | | | $14.39 | | | | $14.65 | |
Net investment income (loss) | | | 0.00 | 1,2 | | | (0.01 | )1 | | | 0.00 | 1,2 | | | 0.00 | 1,2 | | | (0.01 | )1 |
Net realized and unrealized gains (losses) on investments | | | 1.15 | | | | 2.49 | | | | 1.64 | | | | (0.14 | ) | | | 1.71 | |
| | | | | | | | | | | | | | | | | | | | |
Total from investment operations | | | 1.15 | | | | 2.48 | | | | 1.64 | | | | (0.14 | ) | | | 1.70 | |
Distributions to shareholders from | | | | | | | | | | | | | | | | | | | | |
Net investment income | | | 0.00 | | | | (0.01 | ) | | | (0.01 | ) | | | 0.00 | | | | 0.00 | |
Net realized gains | | | (2.04 | ) | | | (1.85 | ) | | | (1.33 | ) | | | (4.60 | ) | | | (1.96 | ) |
| | | | | | | | | | | | | | | | | | | | |
Total distributions to shareholders | | | (2.04 | ) | | | (1.86 | ) | | | (1.34 | ) | | | (4.60 | ) | | | (1.96 | ) |
Net asset value, end of period | | | $9.68 | | | | $10.57 | | | | $9.95 | | | | $9.65 | | | | $14.39 | |
Total return | | | 15.76 | % | | | 28.01 | % | | | 19.87 | % | | | 0.27 | % | | | 12.63 | % |
Ratios to average net assets (annualized) | | | | | | | | | | | | | | | | | | | | |
Gross expenses | | | 0.97 | % | | | 0.92 | % | | | 0.89 | % | | | 0.95 | % | | | 0.81 | % |
Net expenses | | | 0.80 | % | | | 0.80 | % | | | 0.80 | % | | | 0.80 | % | | | 0.80 | % |
Net investment income (loss) | | | 0.05 | % | | | (0.08 | )% | | | 0.05 | % | | | 0.04 | % | | | (0.09 | )% |
Supplemental data | | | | | | | | | | | | | | | | | | | | |
Portfolio turnover rate | | | 20 | % | | | 36 | % | | | 59 | % | | | 79 | % | | | 126 | % |
Net assets, end of period (000s omitted) | | | $107,670 | | | | $131,655 | | | | $144,199 | | | | $162,935 | | | | $221,801 | |
| 1 | Calculated based upon average shares outstanding |
| 2 | Amount is less than $0.005. |
The accompanying notes are an integral part of these financial statements.
20 | Wells Fargo Endeavor Select Fund
Notes to financial statements
1. ORGANIZATION
Wells Fargo Funds Trust (the “Trust”), a Delaware statutory trust organized on March 10, 1999, is an open-end management investment company registered under the Investment Company Act of 1940, as amended (the “1940 Act”). As an investment company, the Trust follows the accounting and reporting guidance in Financial Accounting Standards Board (“FASB”) Accounting Standards Codification Topic 946,Financial Services – Investment Companies. These financial statements report on the Wells Fargo Endeavor Select Fund (the “Fund”) which is a diversified series of the Trust.
2. SIGNIFICANT ACCOUNTING POLICIES
The following significant accounting policies, which are consistently followed in the preparation of the financial statements of the Fund, are in conformity with U.S. generally accepted accounting principles which require management to make estimates and assumptions that affect the reported amounts of assets and liabilities, disclosure of contingent assets and liabilities at the date of the financial statements, and the reported amounts of revenues and expenses during the reporting period. Actual results could differ from those estimates.
Securities valuation
All investments are valued each business day as of the close of regular trading on the New York Stock Exchange (generally 4 p.m. Eastern Time), although the Fund may deviate from this calculation time under unusual or unexpected circumstances.
Equity securities that are listed on a foreign or domestic exchange or market are valued at the official closing price or, if none, the last sales price. If no sale occurs on the principal exchange or market that day, a fair value price will be determined in accordance with the Fund’s Valuation Procedures.
Investments in registered open-end investment companies are valued at net asset value. Interests in non-registered investment companies that are redeemable at net asset value are fair valued normally at net asset value.
Investments which are not valued using any of the methods discussed above are valued at their fair value, as determined in good faith by the Board of Trustees of the Fund. The Board of Trustees has established a Valuation Committee comprised of the Trustees and has delegated to it the authority to take any actions regarding the valuation of portfolio securities that the Valuation Committee deems necessary or appropriate, including determining the fair value of portfolio securities, unless the determination has been delegated to the Wells Fargo Asset Management Pricing Committee at Wells Fargo Funds Management, LLC (“Funds Management”). The Board of Trustees retains the authority to make or ratify any valuation decisions or approve any changes to the Valuation Procedures as it deems appropriate. On a quarterly basis, the Board of Trustees receives reports on any valuation actions taken by the Valuation Committee or the Wells Fargo Asset Management Pricing Committee which may include items for ratification.
Foreign currency translation
The accounting records of the Fund are maintained in U.S. dollars. The values of other assets and liabilities denominated in foreign currencies are translated into U.S. dollars at rates provided by an independent foreign currency pricing source at a time each business day specified by the Wells Fargo Asset Management Pricing Committee. Purchases and sales of securities, and income and expenses are converted at the rate of exchange on the respective dates of such transactions. Net realized foreign exchange gains or losses arise from sales of foreign currencies, currency gains or losses realized between the trade and settlement dates on securities transactions, and the difference between the amounts of dividends, interest and foreign withholding taxes recorded and the U.S. dollar equivalent of the amounts actually paid or received. Net unrealized foreign exchange gains and losses arise from changes in the fair value of assets and liabilities other than investments in securities resulting from changes in exchange rates. The changes in net assets arising from changes in exchange rates of securities and the changes in net assets resulting from changes in market prices of securities are not separately presented. Such changes are included in net realized and unrealized gains or losses from investments.
Securities lending
The Fund may lend its securities from time to time in order to earn additional income in the form of fees or interest on securities received as collateral or the investment of any cash received as collateral. When securities are on loan, the Fund receives interest or dividends on those securities. Cash collateral received in connection with its securities lending transactions is invested in Securities Lending Cash Investments, LLC (the “Securities Lending Fund”). Investments in Securities Lending Fund are valued at the evaluated bid price provided by an independent pricing service. Income earned from investment in the Securities Lending Fund (net of fees and rebates), if any, is included in income from affiliated securities on the Statement of Operations.
In a securities lending transaction, the net asset value of the Fund will be affected by an increase or decrease in the value of the securities loaned and by an increase or decrease in the value of the instrument in which collateral is invested. The amount of securities lending activity undertaken by the Fund fluctuates from time to time. The Fund has the right under the lending
Wells Fargo Endeavor Select Fund | 21
Notes to financial statements
agreement to recover the securities from the borrower on demand. In the event of default or bankruptcy by the borrower, the Fund may be prevented from recovering the loaned securities or gaining access to the collateral or may experience delays or costs in doing so. In such an event, the terms of the agreement allows the unaffiliated securities lending agent to use the collateral to purchase replacement securities on behalf of the Fund or pay the Fund the market value of the loaned securities. The Fund will bear the risk of loss with respect to depreciation of its investment of the cash collateral.
Security transactions and income recognition
Securities transactions are recorded on a trade date basis. Realized gains or losses are recorded on the basis of identified cost.
Dividend income is recognized on the ex-dividend date. Dividend income is recorded net of foreign taxes withheld where recovery of such taxes is not assured.
Distributions to shareholders
Distributions to shareholders from net investment income and any net realized gains are recorded on the ex-dividend date and paid at least annually. Such distributions are determined in accordance with income tax regulations and may differ from U.S. generally accepted accounting principles. Dividend sources are estimated at the time of declaration. The tax character of distributions is determined as of the Fund’s fiscal year end. Therefore, a portion of the Fund’s distributions made prior to the Fund’s fiscal year end may be categorized as a tax return of capital at year end.
Federal and other taxes
The Fund intends to continue to qualify as a regulated investment company by distributing substantially all of its investment company taxable income and any net realized capital gains (after reduction for capital loss carryforwards) sufficient to relieve it from all, or substantially all, federal income taxes. Accordingly, no provision for federal income taxes was required.
The Fund’s income and federal excise tax returns and all financial records supporting those returns for the prior three fiscal years are subject to examination by the federal and Delaware revenue authorities. Management has analyzed the Fund’s tax positions taken on federal, state, and foreign tax returns for all open tax years and does not believe that there are any uncertain tax positions that require recognition of a tax liability.
As of July 31, 2019, the aggregate cost of all investments for federal income tax purposes was $72,506,581 and the unrealized gains (losses) consisted of:
| | | | |
| |
Gross unrealized gains | | $ | 57,953,674 | |
| |
Gross unrealized losses | | | (318,194 | ) |
| |
Net unrealized gains | | $ | 57,635,480 | |
Reclassifications are made to the Fund’s capital accounts for permanent tax differences to reflect income and gains available for distribution (or available capital loss carryforwards) under federal income tax regulations. U.S. generally accepted accounting principles require that certain components of net assets be adjusted to reflect permanent differences between financial and tax reporting. In addition, the Fund may utilize equalization accounting for tax purposes and designate earnings and profits, including net realized gains distributed to shareholders on redemption of shares, as a part of the dividends paid deduction for income tax purposes. These reclassifications have no effect on net assets or net asset values per share. The primary permanent difference causing such reclassification is due to equalization payments. At July 31, 2019, as a result of permanent book-to-tax differences, the following reclassification adjustments were made on the Statement of Assets and Liabilities:
| | |
| Paid-in capital | | Total distributable earnings |
| |
| $302,644 | | $(302,644) |
Class allocations
The separate classes of shares offered by the Fund differ principally in applicable sales charges, distribution, shareholder servicing, and administration fees. Class specific expenses are charged directly to that share class. Investment income, common fund-level expenses, and realized and unrealized gains (losses) on investments are allocated daily to each class of shares based on the relative proportion of net assets of each class.
3. FAIR VALUATION MEASUREMENTS
Fair value measurements of investments are determined within a framework that has established a fair value hierarchy based upon the various data inputs utilized in determining the value of the Fund’s investments. The three-level hierarchy gives the highest priority to unadjusted quoted prices in active markets for identical assets or liabilities (Level 1) and the lowest priority to
22 | Wells Fargo Endeavor Select Fund
Notes to financial statements
unobservable inputs (Level 3). The Fund’s investments are classified within the fair value hierarchy based on the lowest level of input that is significant to the fair value measurement. The inputs are summarized into three broad levels as follows:
| ∎ | | Level 1 – quoted prices in active markets for identical securities |
| ∎ | | Level 2 – other significant observable inputs (including quoted prices for similar securities, interest rates, prepayment speeds, credit risk, etc.) |
| ∎ | | Level 3 – significant unobservable inputs (including the Fund’s own assumptions in determining the fair value of investments) |
The inputs or methodologies used for valuing investments in securities are not necessarily an indication of the risk associated with investing in those securities.
The following is a summary of the inputs used in valuing the Fund’s assets and liabilities as of July 31, 2019:
| | | | | | | | | | | | | | | | |
| | | | |
| | | Quoted prices
(Level 1) | | | Other significant
observable inputs
(Level 2) | | | Significant
unobservable inputs (Level 3) | | | Total | |
| | | | |
Assets | | | | | | | | | | | | | | | | |
Investments in: | | | | | | | | | | | | | | | | |
| | | | |
Common stocks | | | | | | | | | | | | | | | | |
| | | | |
Communication services | | $ | 17,396,291 | | | $ | 0 | | | $ | 0 | | | $ | 17,396,291 | |
| | | | |
Consumer discretionary | | | 18,060,996 | | | | 0 | | | | 0 | | | | 18,060,996 | |
| | | | |
Financials | | | 8,311,528 | | | | 0 | | | | 0 | | | | 8,311,528 | |
| | | | |
Health care | | | 16,426,646 | | | | 0 | | | | 0 | | | | 16,426,646 | |
| | | | |
Industrials | | | 11,644,013 | | | | 0 | | | | 0 | | | | 11,644,013 | |
| | | | |
Information technology | | | 42,593,103 | | | | 0 | | | | 0 | | | | 42,593,103 | |
| | | | |
Materials | | | 9,014,268 | | | | 0 | | | | 0 | | | | 9,014,268 | |
| | | | |
Real estate | | | 2,380,477 | | | | 0 | | | | 0 | | | | 2,380,477 | |
| | | | |
Short-term investments | | | | | | | | | | | | | | | | |
| | | | |
Investment companies | | | 4,314,739 | | | | 0 | | | | 0 | | | | 4,314,739 | |
| | | | |
Total assets | | $ | 130,142,061 | | | $ | 0 | | | $ | 0 | | | $ | 130,142,061 | |
Additional sector, industry or geographic detail is included in the Portfolio of Investments.
For the year ended July 31, 2019, the Fund did not have any transfers into/out of Level 3.
4. TRANSACTIONS WITH AFFILIATES
Management fee
Funds Management, an indirect wholly owned subsidiary of Wells Fargo & Company (“Wells Fargo”), is the manager of the Fund and provides advisory and fund-level administrative services under an investment management agreement. Under the investment management agreement, Funds Management is responsible for, among other services, implementing the investment objectives and strategies of the Fund, supervising the subadviser and providing fund-level administrative services in connection with the Fund’s operations. As compensation for its services under the investment management agreement, Funds Management is entitled to receive a management fee at the following annual rate based on the Fund’s average daily net assets:
| | | | |
| |
| Average daily net assets | | Management fee | |
| |
First $500 million | | | 0.700 | % |
| |
Next $500 million | | | 0.675 | |
| |
Next $1 billion | | | 0.650 | |
| |
Next $2 billion | | | 0.625 | |
| |
Next $1 billion | | | 0.600 | |
| |
Next $3 billion | | | 0.590 | |
| |
Next $2 billion | | | 0.565 | |
| |
Next $2 billion | | | 0.555 | |
| |
Next $4 billion | | | 0.530 | |
| |
Over $16 billion | | | 0.505 | |
Wells Fargo Endeavor Select Fund | 23
Notes to financial statements
For the year ended July 31, 2019, the management fee was equivalent to an annual rate of 0.70% of the Fund’s average daily net assets.
Funds Management has retained the services of a subadviser to provide daily portfolio management to the Fund. The fee for subadvisory services is borne by Funds Management. Wells Capital Management Incorporated (“WellsCap”), an affiliate of Funds Management and an indirect wholly owned subsidiary of Wells Fargo, is the subadviser to the Fund and is entitled to receive a fee from Funds Management at an annual rate starting at 0.30% and declining to 0.20% as the average daily net assets of the Fund increase.
Administration fees
Under a class-level administration agreement, Funds Management provides class-level administrative services to the Fund, which includes paying fees and expenses for services provided by the transfer agent, sub-transfer agents, omnibus account servicers and record-keepers. As compensation for its services under the class-level administration agreement, Funds Management receives an annual fee which is calculated based on the average daily net assets of each class as follows:
| | |
| |
| | | Class-level
administration fee |
| |
Class A, Class C | | 0.21% |
| |
Administrator Class, Institutional Class | | 0.13 |
Waivers and/or expense reimbursements
Funds Management has contractually waived and/or reimbursed management and administration fees to the extent necessary to maintain certain net operating expense ratios for the Fund. When each class of the Fund has exceeded its expense cap, Funds Management has waived fees and/or reimbursed expenses from fund-level expenses on a proportionate basis and then from class specific expenses. When only certain classes exceed their expense caps, waivers and/or reimbursements are applied against class specific expenses before fund-level expenses. Funds Management has committed through November 30, 2020 to waive fees and/or reimburse expenses to the extent necessary to cap the Fund’s expenses at 1.20% for Class A shares, 1.95% for Class C shares, 1.00% for Administrator Class shares, and 0.80% for Institutional Class shares. Prior to or after the commitment expiration date, the cap may be increased or the commitment to maintain the cap may be terminated only with the approval of the Board of Trustees.
Distribution fee
The Trust has adopted a distribution plan for Class C shares of the Fund pursuant to Rule 12b-1 under the 1940 Act. A distribution fee is charged to Class C shares and paid to Wells Fargo Funds Distributor, LLC (“Funds Distributor”), the principal underwriter, at an annual rate of 0.75% of the average daily net assets of Class C shares.
In addition, Funds Distributor is entitled to receive the front-end sales charge from the purchase of Class A shares and a contingent deferred sales charge on the redemption of certain Class A shares. Funds Distributor is also entitled to receive the contingent deferred sales charges from redemptions of Class C shares. For the year ended July 31, 2019, Funds Distributor received $2,537 from the sale of Class A shares and $79 in contingent deferred sales charges from redemptions of Class C shares. No contingent deferred sales charges were incurred by Class A for the year ended July 31, 2019.
Shareholder servicing fees
The Trust has entered into contracts with one or more shareholder servicing agents, whereby Class A, Class C, and Administrator Class of the Fund are charged a fee at an annual rate of 0.25% of the average daily net assets of each respective class. A portion of these total shareholder servicing fees were paid to affiliates of Wells Fargo.
Interfund transactions
The Fund may purchase or sell portfolio investment securities to certain other Wells Fargo affiliates pursuant to Rule 17a-7 under the 1940 Act and under procedures adopted by the Board of Trustees. The procedures have been designed to ensure that these interfund transactions, which do not incur broker commissions, are effected at current market prices.
5. INVESTMENT PORTFOLIO TRANSACTIONS
Purchases and sales of investments, excluding U.S. government obligations (if any) and short-term securities, for the year ended July 31, 2019 were $26,787,211 and $70,851,990, respectively.
24 | Wells Fargo Endeavor Select Fund
Notes to financial statements
6. SECURITIES LENDING TRANSACTIONS
The Fund lends its securities through an unaffiliated securities lending agent and receives collateral in the form of cash or securities with a value at least equal to the value of the securities on loan. The value of the loaned securities is determined at the close of each business day and any increases or decreases in the required collateral are exchanged between the Fund and the counterparty on the next business day. Cash collateral received is invested in the Securities Lending Fund which seeks to provide a positive return compared to the daily Fed Funds Open Rate by investing in high-quality, U.S. dollar-denominated short-term money market instruments and is exempt from registration under Section 3(c)(7) of the 1940 Act. Securities Lending Fund is managed by Funds Management and is subadvised by WellsCap. Funds Management receives an advisory fee starting at 0.05% and declining to 0.01% as the average daily net assets of the Securities Lending Fund increase. All of the fees received by Funds Management are paid to WellsCap for its services as subadviser.
In the event of counterparty default or the failure of a borrower to return a loaned security, the Fund has the right to use the collateral to offset any losses incurred. As of July 31, 2019, the Fund did not have any securities on loan.
7. BANK BORROWINGS
The Trust (excluding the money market funds), Wells Fargo Master Trust and Wells Fargo Variable Trust are parties to a $280,000,000 revolving credit agreement whereby the Fund is permitted to use bank borrowings for temporary or emergency purposes, such as to fund shareholder redemption requests. Interest under the credit agreement is charged to the Fund based on a borrowing rate equal to the higher of the Federal Funds rate in effect on that day plus 1.25% or the overnight LIBOR rate in effect on that day plus 1.25%. In addition, an annual commitment fee equal to 0.25% of the unused balance is allocated to each participating fund.
For the year ended July 31, 2019, there were no borrowings by the Fund under the agreement.
8. DISTRIBUTIONS TO SHAREHOLDERS
The tax character of distributions paid during the years ended July 31, 2019 and July 31, 2018 were as follows:
| | | | | | | | |
| | | Year ended July 31 | |
| | |
| | | 2019 | | | 2018 | |
| | |
Ordinary income | | $ | 3,970,538 | | | $ | 3,933,421 | |
| | |
Long-term capital gain | | | 24,311,646 | | | | 24,313,087 | |
As of July 31, 2019, the components of distributable earnings on a tax basis were as follows:
| | | | |
Undistributed ordinary income | | Undistributed long-term gain | | Unrealized gains |
| | |
| $749,865 | | $14,996,421 | | $57,635,480 |
Effective for all filings after November 4, 2018, the Securities and Exchange Commission eliminated the requirement to separately state the components of distributions to shareholders under U.S. generally accepted accounting principles. The amounts of distributions to shareholders for the year ended July 31, 2018 were as follows:
| | | | | | | | |
| | |
| | | Net investment
income | | | Net realized
gains | |
| | |
Class A | | $ | 0 | | | $ | 2,526,049 | |
| | |
Class C | | | 0 | | | | 946,756 | |
| | |
Administrator Class | | | 0 | | | | 597,659 | |
| | |
Institutional Class | | | 159,467 | | | | 24,016,577 | |
9. CONCENTRATION RISK
Concentration risks result from exposure to a limited number of sectors. As of the end of the period, the Fund invests a concentration of its portfolio in the information technology sector. A fund that invests a substantial portion of its assets in any sector may be more affected by changes in that sector than would be a fund whose investments are not heavily weighted in any sector.
Wells Fargo Endeavor Select Fund | 25
Notes to financial statements
10. INDEMNIFICATION
Under the Trust’s organizational documents, the officers and Trustees have been granted certain indemnification rights against certain liabilities that may arise out of performance of their duties to the Trust. Additionally, in the normal course of business, the Trust may enter into contracts with service providers that contain a variety of indemnification clauses. The Trust’s maximum exposure under these arrangements is dependent on future claims that may be made against the Fund and, therefore, cannot be estimated.
11. NEW ACCOUNTING PRONOUNCEMENT
In August 2018, FASB issued Accounting Standards Update (“ASU”) No. 2018-13, Fair Value Measurement (Topic 820)Disclosure Framework—Changes to the Disclosure Requirements for Fair Value Measurement. ASU 2018-13 updates the disclosure requirements for fair value measurements by modifying or removing certain disclosures and adding certain new disclosures. The amendments are effective for fiscal years, and interim periods within those fiscal years, beginning after December 15, 2019. Early adoption is permitted. PManagement has adopted the removal and modification of disclosures early, as permitted, and will adopt the additional new disclosures at the effective date.
26 | Wells Fargo Endeavor Select Fund
Report of independent registered public accounting firm
TO THE SHAREHOLDERS OF THE FUND AND BOARD OF TRUSTEES OF WELLS FARGO FUNDS TRUST:
Opinion on the Financial Statements
We have audited the accompanying statement of assets and liabilities of Wells Fargo Endeavor Select Fund (the Fund), one of the funds constituting Wells Fargo Funds Trust, including the portfolio of investments, as of July 31, 2019, the related statement of operations for the year then ended, the statements of changes in net assets for each of the years in the two-year period then ended, and the related notes (collectively, the financial statements) and the financial highlights for each of the years in the five-year period then ended. In our opinion, the financial statements and financial highlights present fairly, in all material respects, the financial position of the Fund as of July 31, 2019, the results of its operations for the year then ended, the changes in its net assets for each of the years in the two-year period then ended, and the financial highlights for each of the years in the five-year period then ended, in conformity with U.S. generally accepted accounting principles.
Basis for Opinion
These financial statements and financial highlights are the responsibility of the Fund’s management. Our responsibility is to express an opinion on these financial statements and financial highlights based on our audits. We are a public accounting firm registered with the Public Company Accounting Oversight Board (United States) (PCAOB) and are required to be independent with respect to the Fund in accordance with the U.S. federal securities laws and the applicable rules and regulations of the Securities and Exchange Commission and the PCAOB.
We conducted our audits in accordance with the standards of the PCAOB. Those standards require that we plan and perform the audit to obtain reasonable assurance about whether the financial statements and financial highlights are free of material misstatement, whether due to error or fraud. Our audits included performing procedures to assess the risks of material misstatement of the financial statements and financial highlights, whether due to error or fraud, and performing procedures that respond to those risks. Such procedures included examining, on a test basis, evidence regarding the amounts and disclosures in the financial statements and financial highlights. Such procedures also included confirmation of securities owned as of July 31, 2019, by correspondence with the custodian and transfer agent. Our audits also included evaluating the accounting principles used and significant estimates made by management, as well as evaluating the overall presentation of the financial statements and financial highlights. We believe that our audits provide a reasonable basis for our opinion.

We have not been able to determine the specific year that we began serving as the auditor of one or more Wells Fargo Funds investment companies; however we are aware that we have served as the auditor of one or more Wells Fargo Funds investment companies since at least 1955.
Boston, Massachusetts
September 25, 2019
Wells Fargo Endeavor Select Fund | 27
Other information (unaudited)
TAX INFORMATION
For corporate shareholders, pursuant to Section 854 of the Internal Revenue Code, 29.54% of ordinary income dividends qualify for the corporate dividends-received deduction for the fiscal year ended July 31, 2019.
Pursuant to Section 852 of the Internal Revenue Code, $24,614,290 was designated as a 20% rate gain distribution for the fiscal year ended July 31, 2019. Long-term capital gains in the amount of $302,644 were distributed in connection with Fund share redemptions.
Pursuant to Section 854 of the Internal Revenue Code, $1,312,851 of income dividends paid during the fiscal year ended July 31, 2019 has been designated as qualified dividend income (QDI).
For the fiscal year ended July 31, 2019, $3,970,538 has been designated as short-term capital gain dividends for nonresident alien shareholders pursuant to Section 871 of the Internal Revenue Code.
PROXY VOTING INFORMATION
A description of the policies and procedures used to determine how to vote proxies relating to portfolio securities is available, upon request, by calling1-800-222-8222, visiting our website atwfam.com, or visiting the SEC website at sec.gov. Information regarding how the proxies related to portfolio securities were voted during the most recent 12-month period ended June 30 is available on the website atwfam.com or by visiting the SEC website at sec.gov.
QUARTERLY PORTFOLIO HOLDINGS INFORMATION
The Fund files its complete schedule of portfolio holdings with the SEC for the first and third quarters of each fiscal year on Form N-Q or Form N-PORT, which is available by visiting the SEC website at sec.gov. Those forms may be reviewed and copied at the SEC’s Public Reference Room in Washington, DC. Information on the operation of the Public Reference Room may be obtained by calling1-800-SEC-0330.
28 | Wells Fargo Endeavor Select Fund
Other information (unaudited)
BOARD OF TRUSTEES AND OFFICERS
Each of the Trustees and Officers1 listed in the table below acts in identical capacities for each fund in the Wells Fargo family of funds, which consists of 152 mutual funds comprising the Wells Fargo Funds Trust, Wells Fargo Variable Trust, Wells Fargo Master Trust and four closed-end funds (collectively the “Fund Complex”). This table should be read in conjunction with the Prospectus and the Statement of Additional Information2. The mailing address of each Trustee and Officer is 525 Market Street, 12th Floor, San Francisco, CA 94105. Each Trustee and Officer serves an indefinite term, however, each Trustee serves such term until reaching the mandatory retirement age established by the Trustees.
Independent Trustees
| | | | | | |
Name and year of birth | | Position held and
length of service* | | Principal occupations during past five years or longer | | Current other
public company or
investment
company
directorships |
| | | |
William R. Ebsworth (Born 1957) | | Trustee, since 2015 | | Retired. From 1984 to 2013, equities analyst, portfolio manager, research director and chief investment officer at Fidelity Management and Research Company in Boston, Tokyo, and Hong Kong, and retired in 2013 as Chief Investment Officer of Fidelity Strategic Advisers, Inc. where he led a team of investment professionals managing client assets. Prior thereto, Board member of Hong Kong Securities Clearing Co., Hong Kong Options Clearing Corp., the Thailand International Fund, Ltd., Fidelity Investments Life Insurance Company, and Empire Fidelity Investments Life Insurance Company. Audit Committee Chair and Investment Committee Chair of the Vincent Memorial Hospital Endowment (non-profit organization). Mr. Ebsworth is a CFA® charterholder. | | N/A |
| | | |
Jane A. Freeman (Born 1953) | | Trustee, since 2015; Chair Liaison, since 2018 | | Retired. From 2012 to 2014 and 1999 to 2008, Chief Financial Officer of Scientific Learning Corporation. From 2008 to 2012, Ms. Freeman provided consulting services related to strategic business projects. Prior to 1999, Portfolio Manager at Rockefeller & Co. and Scudder, Stevens & Clark. Board member of the Harding Loevner Funds from 1996 to 2014, serving as both Lead Independent Director and chair of the Audit Committee. Board member of the Russell Exchange Traded Funds Trust from 2011 to 2012 and the chair of the Audit Committee. Ms. Freeman is a Board Member of The Ruth Bancroft Garden (non-profit organization). She is also an inactive Chartered Financial Analyst. | | N/A |
| | | |
Isaiah Harris, Jr. (Born 1952) | | Trustee, since 2009; Audit Committee Chairman, since 2019 | | Retired. Chairman of the Board of CIGNA Corporation since 2009, and Director since 2005. From 2003 to 2011, Director of Deluxe Corporation. Prior thereto, President and CEO of BellSouth Advertising and Publishing Corp. from 2005 to 2007, President and CEO of BellSouth Enterprises from 2004 to 2005 and President of BellSouth Consumer Services from 2000 to 2003. Emeritus member of the Iowa State University Foundation Board of Governors. Emeritus Member of the Advisory Board of Iowa State University School of Business. Advisory Board Member, Palm Harbor Academy (private school). Advisory Board Member, Child Evangelism Fellowship (non-profit). Mr. Harris is a certified public accountant (inactive status). | | CIGNA Corporation |
| | | |
Judith M. Johnson (Born 1949) | | Trustee, since 2008; Audit Committee Chairman, from 2009 to 2018 | | Retired. Prior thereto, Chief Executive Officer and Chief Investment Officer of Minneapolis Employees Retirement Fund from 1996 to 2008. Ms. Johnson is an attorney, certified public accountant and a certified managerial accountant. | | N/A |
Wells Fargo Endeavor Select Fund | 29
Other information (unaudited)
| | | | | | |
Name and year of birth | | Position held and
length of service* | | Principal occupations during past five years or longer | | Current other
public company or
investment
company
directorships |
| | | |
David F. Larcker (Born 1950) | | Trustee, since 2009 | | James Irvin Miller Professor of Accounting at the Graduate School of Business, Stanford University, Director of the Corporate Governance Research Initiative and Senior Faculty of The Rock Center for Corporate Governance since 2006. From 2005 to 2008, Professor of Accounting at the Graduate School of Business, Stanford University. Prior thereto, Ernst & Young Professor of Accounting at The Wharton School, University of Pennsylvania from 1985 to 2005. | | N/A |
| | | |
Olivia S. Mitchell (Born 1953) | | Trustee, since 2006; Nominating and Governance Committee Chairman, since 2018 | | International Foundation of Employee Benefit Plans Professor, Wharton School of the University of Pennsylvania since 1993. Director of Wharton’s Pension Research Council and Boettner Center on Pensions & Retirement Research, and Research Associate at the National Bureau of Economic Research. Previously, Cornell University Professor from 1978 to 1993. | | N/A |
| | | |
Timothy J. Penny (Born 1951) | | Trustee, since 1996; Chairman, since 2018 | | President and Chief Executive Officer of Southern Minnesota Initiative Foundation, a non-profit organization, since 2007. Member of the Board of Trustees of NorthStar Education Finance, Inc., a non-profit organization, since 2007. | | N/A |
| | | |
James G. Polisson (Born 1959) | | Trustee, since 2018 | | Retired. Chief Marketing Officer, Source (ETF) UK Services, Ltd, from 2015 to 2017. From 2012 to 2015, Principal of The Polisson Group, LLC, a management consulting, corporate advisory and principal investing company. Chief Executive Officer and Managing Director at Russell Investments, Global Exchange Traded Funds from 2010 to 2012. Managing Director of Barclays Global Investors from 1998 to 2010 and Global Chief Marketing Officer for iShares and Barclays Global Investors from 2000 to 2010. Trustee of the San Francisco Mechanics’ Institute, a non-profit organization, from 2013 to 2015. Board member of the Russell Exchange Traded Fund Trust from 2011 to 2012. Director of Barclays Global Investors Holdings Deutschland GmbH from 2006 to 2009. Mr. Polisson is an attorney and has a retired status with the Massachusetts and District of Columbia Bar Associations. | | N/A |
| * | Length of service dates reflect the Trustee’s commencement of service with the Trust’s predecessor entities, where applicable. |
30 | Wells Fargo Endeavor Select Fund
Other information (unaudited)
Officers
| | | | |
Name and year of birth | | Position held and
length of service | | Principal occupations during past five years or longer |
| | |
Andrew Owen (Born 1960) | | President, since 2017 | | Executive Vice President of Wells Fargo & Company and Head of Affiliated Managers, Wells Fargo Asset Management, since 2014. In addition, Mr. Owen is currently President, Chief Executive Officer and Director of Wells Fargo Funds Management, LLC since 2017. Prior thereto, Executive Vice President responsible for marketing, investments and product development for Wells Fargo Funds Management, LLC, from 2009 to 2014. |
| | |
Jeremy DePalma1 (Born 1974) | | Treasurer, since 2012 | | Senior Vice President of Wells Fargo Funds Management, LLC since 2009. Senior Vice President of Evergreen Investment Management Company, LLC from 2008 to 2010 and head of the Fund Reporting and Control Team within Fund Administration from 2005 to 2010. |
| | |
Alexander Kymn (Born 1973) | | Secretary and Chief Legal Officer, since 2018 | | Senior Company Counsel of Wells Fargo Bank, N.A. since 2018 (previously Senior Counsel from 2007 to 2018). Vice President of Wells Fargo Funds Management, LLC from 2008 to 2014. |
| | |
Michael H. Whitaker (Born 1967) | | Chief Compliance Officer, since 2016 | | Senior Vice President and Chief Compliance Officer since 2016. Senior Vice President and Chief Compliance Officer for Fidelity Investments from 2007 to 2016. |
| | |
David Berardi (Born 1975) | | Assistant Treasurer, since 2009 | | Vice President of Wells Fargo Funds Management, LLC since 2009. Vice President of Evergreen Investment Management Company, LLC from 2008 to 2010. Manager of Fund Reporting and Control for Evergreen Investment Management Company, LLC from 2004 to 2010. |
| 1 | Jeremy DePalma acts as Treasurer of 87 funds and Assistant Treasurer of 65 funds in the Fund Complex. |
| 2 | The Statement of Additional Information includes additional information about the Trustees and is available, without charge, upon request, by calling1-800-222-8222 or by visiting the website atwfam.com. |
Wells Fargo Endeavor Select Fund | 31
Other information (unaudited)
BOARD CONSIDERATION OF INVESTMENT MANAGEMENT AND SUB-ADVISORY AGREEMENTS:
Wells Fargo Endeavor Select Fund
Under the Investment Company Act of 1940 (the “1940 Act”), the Board of Trustees (the “Board”) of Wells Fargo Funds Trust (the “Trust”) must determine annually whether to approve the continuation of the Trust’s investment management andsub-advisory agreements. In this regard, at an in-person meeting held on May 21-22, 2019 (the “Meeting”), the Board, all the members of which have no direct or indirect interest in the investment management and sub-advisory agreements and are not “interested persons” of the Trust, as defined in the 1940 Act (the “Independent Trustees”), reviewed and approved for Wells Fargo Endeavor Select Fund (the “Fund”): (i) an investment management agreement (the “Management Agreement”) with Wells Fargo Funds Management, LLC (“Funds Management”); and (ii) an investment sub-advisory agreement (the“Sub-Advisory Agreement”) with Wells Capital Management Incorporated (the “Sub-Adviser”), an affiliate of Funds Management. The Management Agreement and theSub-Advisory Agreement are collectively referred to as the “Advisory Agreements.”
At the Meeting, the Board considered the factors and reached the conclusions described below relating to the selection of Funds Management and the Sub-Adviser and the approval of the Advisory Agreements. Prior to the Meeting, including at an in-person meeting in April 2019, the Trustees conferred extensively among themselves and with representatives of Funds Management about these matters. Also, the Board has adopted a team-based approach, with each team consisting of a sub-set of Trustees, to assist the full Board in the discharge of its duties in reviewing investment performance and other matters throughout the year. The Independent Trustees were assisted in their evaluation of the Advisory Agreements by independent legal counsel, from whom they received separate legal advice and with whom they met separately.
In providing information to the Board, Funds Management and the Sub-Adviser were guided by a detailed set of requests for information submitted to them by independent legal counsel on behalf of the Independent Trustees at the start of the Board’s annual contract renewal process earlier in 2019. In considering and approving the Advisory Agreements, the Trustees considered the information they believed relevant, including but not limited to the information discussed below. The Board considered not only the specific information presented in connection with the Meeting, but also the knowledge gained over time through interaction with Funds Management and the Sub-Adviser about various topics. In this regard, the Board reviewed reports of Funds Management at each of its quarterly meetings, which included, among other things, portfolio reviews and investment performance reports. In addition, the Board and the teams mentioned above confer with portfolio managers at various times throughout the year. The Board did not identify any particular information or consideration that was all-important or controlling, and each individual Trustee may have attributed different weights to various factors.
After its deliberations, the Board unanimously approved the continuation of the Advisory Agreements for a one-year term and determined that the compensation payable to Funds Management and the Sub-Adviser under each of the Advisory Agreements was reasonable. The Board considered the approval of the Advisory Agreements for the Fund as part of its consideration of agreements for funds across the complex, but its approvals were made on a fund-by-fund basis. The following summarizes a number of important, but not necessarily all, factors considered by the Board in support of its approvals.
Nature, extent and quality of services
The Board received and considered various information regarding the nature, extent and quality of services provided to the Fund by Funds Management and the Sub-Adviser under the Advisory Agreements. This information included a description of the investment advisory services and Fund-level administrative services covered by the Management Agreement, as well as, among other things, a summary of the background and experience of senior management of Wells Fargo Asset Management (“WFAM”), of which Funds Management and the Sub-Adviser are a part, a summary of investments made in the business of WFAM, a summary of certain organizational and personnel changes involving Funds Management and the Sub-Adviser, and a description of Funds Management’s and the Sub-Adviser’s business continuity planning programs and of their approaches to data privacy and cybersecurity. The Board received and reviewed information about Funds Management’s role as administrator of the Fund’s liquidity risk management program. The Board also considered the qualifications, background, tenure and responsibilities of each of the portfolio managers primarily responsible for the day-to-day portfolio management of the Fund.
The Board evaluated the ability of Funds Management and the Sub-Adviser to attract and retain qualified investment professionals, including research, advisory and supervisory personnel. The Board further considered the compliance programs and compliance records of Funds Management and the Sub-Adviser. In addition, the Board took into account the full range of services provided to the Fund by Funds Management and its affiliates.
32 | Wells Fargo Endeavor Select Fund
Other information (unaudited)
Fund investment performance and expenses
The Board considered the investment performance results for the Fund over various time periods ended December 31, 2018. The Board considered these results in comparison to the investment performance of funds in a universe that was determined by Broadridge Inc. (“Broadridge”) to be similar to the Fund (the “Universe”), and in comparison to the Fund’s benchmark index and to other comparative data. Broadridge is an independent provider of investment company data. The Board received a description of the methodology used by Broadridge to select the mutual funds in the performance Universe. The Board noted that the investment performance of the Fund (Administrator Class) was higher than or in range of the average investment performance of the Universe for all periods under review. The Board also noted that the investment performance of the Fund was higher than its benchmark index, the Russell 1000® Growth Index, for the one- and three-year periods under review, but lower than its benchmark for the five- and ten-year periods under review.
The Board received information concerning, and discussed factors contributing to, the underperformance of the Fund relative to the benchmark for the periods identified above. The Board took note of the explanations for the relative underperformance during these periods, including with respect to investment decisions and market factors that affected the Fund’s investment performance. The Board also took note of the Fund’s higher or in range performance relative to the Universe for all periods under review and the index over the one- and three-year time periods under review.
The Board also received and considered information regarding the Fund’s net operating expense ratios and their various components, including actual management fees, custodian and other non-management fees, and Rule 12b-1 and non-Rule 12b-1 shareholder service fees. The Board considered these ratios in comparison to the median ratios of funds in class-specific expense groups that were determined by Broadridge to be similar to the Fund (the “Groups”). The Board received a description of the methodology used by Broadridge to select the mutual funds in the expense Groups and an explanation of how funds comprising expense groups and their expense ratios may vary from year-to-year. Based on the Broadridge reports, the Board noted that the net operating expense ratios of the Fund were lower than or equal to the median net operating expense ratios of the expense Groups for each share class.
The Board took into account the Fund’s investment performance and expense information provided to it among the factors considered in deciding to re-approve the Advisory Agreements.
Investment management and sub-advisory fee rates
The Board reviewed and considered the contractual fee rates payable by the Fund to Funds Management under the Management Agreement, as well as the contractual fee rates payable by the Fund to Funds Management for class-level administrative services under a Class-Level Administration Agreement, which include, among other things, class-level transfer agency and sub-transfer agency costs (collectively, the “Management Rates”). The Board also reviewed and considered the contractual investment sub-advisory fee rates that are payable by Funds Management to the Sub-Adviser for investment sub-advisory services.
Among other information reviewed by the Board was a comparison of the Fund’s Management Rates with the average contractual investment management fee rates of funds in the expense Groups at a common asset level as well as transfer agency costs of the funds in the expense Groups. The Board noted that the Management Rates of the Fund were in range of the sum of these average rates for the Fund’s expense Groups for all share classes.
The Board also received and considered information about the portion of the total management fee that was retained by Funds Management after payment of the fee to the Sub-Adviser for sub-advisory services. In assessing the reasonableness of this amount, the Board received and evaluated information about the nature and extent of responsibilities retained and risks assumed by Funds Management and not delegated to or assumed by the Sub-Adviser, and about Funds Management’s on-going oversight services. Given the affiliation between Funds Management and the Sub-Adviser, the Board ascribed limited relevance to the allocation of fees between them.
The Board also received and considered information about the nature and extent of services offered and fee rates charged by Funds Management and the Sub-Adviser to other types of clients with investment strategies similar to those of the Fund. In this regard, the Board received information about the significantly greater scope of services, and compliance, reporting and other legal burdens and risks of managing proprietary mutual funds compared with those associated with managing assets of other types of clients, including third-party sub-advised fund clients and non-mutual fund clients such as institutional separate accounts.
Based on its consideration of the factors and information it deemed relevant, including those described here, the Board determined that the compensation payable to Funds Management under the Management Agreement and to the Sub-Adviser under the Sub-Advisory Agreement was reasonable.
Wells Fargo Endeavor Select Fund | 33
Other information (unaudited)
Profitability
The Board received and considered information concerning the profitability of Funds Management, as well as the profitability of both WFAM and Wells Fargo & Co. (“Wells Fargo”) from providing services to the fund family as a whole. The Board noted that the Sub-Adviser’s profitability information with respect to providing services to the Fund and other funds in the family was subsumed in the WFAM and Wells Fargo profitability analysis.
Funds Management reported on the methodologies and estimates used in calculating profitability, including a description of the methodology used to allocate certain expenses. Among other things, the Board noted that the levels of profitability reported on a fund-by-fund basis varied widely, depending on factors such as the size, type and age of fund. Based on its review, the Board did not deem the profits reported by Funds Management, WFAM or Wells Fargo from services provided to the Fund to be at a level that would prevent it from approving the continuation of the Advisory Agreements.
Economies of scale
The Board received and considered information about the potential for Funds Management to experience economies of scale in the provision of management services to the Fund, the difficulties of calculating economies of scale at an individual fund level, and the extent to which potential scale benefits are shared with shareholders. The Board noted the existence of breakpoints in the Fund’s management fee structure, which operate generally to reduce the Fund’s expense ratios as the Fund grows in size. The Board considered that in addition to management fee breakpoints, Funds Management shares potential economies of scale from its management business in a variety of ways, including through fee waiver and expense reimbursement arrangements, services that benefit shareholders, competitive management fee rates set at the outset without regard to breakpoints, and investments in the business intended to enhance services available to shareholders.
The Board concluded that Funds Management’s arrangements with respect to the Fund, including contractual breakpoints, constituted a reasonable approach to sharing potential economies of scale with the Fund and its shareholders.
Other benefits to Funds Management and the Sub-Adviser
The Board received and considered information regarding potential “fall-out” or ancillary benefits received by Funds Management and its affiliates, including the Sub-Adviser, as a result of their relationships with the Fund. Ancillary benefits could include, among others, benefits directly attributable to other relationships with the Fund and benefits potentially derived from an increase in Funds Management’s and the Sub-Adviser’s business as a result of their relationships with the Fund. The Board noted that various affiliates of Funds Management may receive distribution-related fees, shareholder servicing payments and sub-transfer agency fees in respect of shares sold or held through them and services provided.
The Board also reviewed information about soft dollar credits earned and utilized by the Sub-Adviser, fees earned by Funds Management and the Sub-Adviser from managing a private investment vehicle for the fund family’s securities lending collateral, and commissions earned by an affiliated broker from portfolio transactions.
Based on its consideration of the factors and information it deemed relevant, including those described here, the Board did not find that any ancillary benefits received by Funds Management and its affiliates, including the Sub-Adviser, were unreasonable.
Conclusion
At the Meeting, after considering the above-described factors and based on its deliberations and its evaluation of the information described above, the Board unanimously approved the continuation of the Advisory Agreements for a one-year term and determined that the compensation payable to Funds Management and the Sub-Adviser under each of the Advisory Agreements was reasonable.
34 | Wells Fargo Endeavor Select Fund
This page is intentionally left blank.
This page is intentionally left blank.

For more information
More information about Wells Fargo Funds is available free upon request. To obtain literature, please write, visit the Fund’s website, or call:
Wells Fargo Funds
P.O. Box 219967
Kansas City, MO 64121-9967
Website:wfam.com
Individual investors:1-800-222-8222
Retail investment professionals:1-888-877-9275
Institutional investment professionals:1-866-765-0778

This report and the financial statements contained herein are submitted for the general information of the shareholders of the Fund. If this report is used for promotional purposes, distribution of the report must be accompanied or preceded by a current prospectus. Before investing, please consider the investment objectives, risks, charges, and expenses of the investment. For a current prospectus and, if available, a summary prospectus, containing this information, call1-800-222-8222 or visit the Fund’s website atwfam.com. Read the prospectus carefully before you invest or send money.
Wells Fargo Asset Management (WFAM) is the trade name for certain investment advisory/management firms owned by Wells Fargo & Company. These firms include but are not limited to Wells Capital Management Incorporated and Wells Fargo Funds Management, LLC. Certain products managed by WFAM entities are distributed by Wells Fargo Funds Distributor, LLC (a broker-dealer and Member FINRA).
This material is for general informational and educational purposes only and is NOT intended to provide investment advice or a recommendation of any kind—including a recommendation for any specific investment, strategy, or plan.
INVESTMENT PRODUCTS: NOT FDIC INSURED ◾ NO BANK GUARANTEE ◾ MAY LOSE VALUE
© 2019 Wells Fargo Funds Management, LLC. All rights reserved.
405477 09-19
A205/AR205 07-19
Annual Report
July 31, 2019
Wells Fargo Growth Fund
Beginning on January 1, 2021, as permitted by new regulations adopted by the Securities and Exchange Commission, paper copies of the Wells Fargo Funds’ annual and semi-annual shareholder reports issued after this date will no longer be sent by mail, unless you specifically request paper copies of the reports. Instead, the reports will be made available on the Funds’ website, and you will be notified by mail each time a report is posted and provided with a website address to access the report.
If you already elected to receive shareholder reports electronically, you will not be affected by this change and you need not take any action. You may elect to receive shareholder reports and other communications from the Fund electronically at any time by contacting your financial intermediary (such as a broker-dealer or bank) or, if you are a direct investor, by calling1-800-222-8222 or by enrolling at wellsfargo.com/advantagedelivery.
You may elect to receive all future reports in paper free of charge. If you invest through a financial intermediary, you can contact your financial intermediary to request that you continue to receive paper copies of your shareholder reports; if you invest directly with the Fund, you can call 1-800-222-8222. Your election to receive reports in paper will apply to all Wells Fargo Funds held in your account with your financial intermediary or, if you are a direct investor, to all Wells Fargo Funds that you hold.
|
|
|
Reduce clutter. Save trees. |
Sign up for electronic delivery of prospectuses and shareholder reports atwellsfargo.com/
advantagedelivery |
The views expressed and any forward-looking statements are as of July 31, 2019, unless otherwise noted, and are those of the Fund managers and/or Wells Fargo Asset Management. Discussions of individual securities, or the markets generally, or any Wells Fargo Fund are not intended as individual recommendations. Future events or results may vary significantly from those expressed in any forward-looking statements. The views expressed are subject to change at any time in response to changing circumstances in the market. Wells Fargo Asset Management and the Fund disclaim any obligation to publicly update or revise any views expressed or forward-looking statements.
INVESTMENT PRODUCTS: NOT FDIC INSURED ◾ NO BANK GUARANTEE ◾ MAY LOSE VALUE
Wells Fargo Growth Fund | 1
Letter to shareholders (unaudited)

Andrew Owen
President
Wells Fargo Funds
Dear Shareholder:
We are pleased to offer you this annual report for the Wells Fargo Growth Fund for the12-month period that ended July 31, 2019. After the first six months of the period yielded eitherlow-single-digit or negative investment returns, U.S. stock and global bond investors generally enjoyed a recovery during the final six months amid continued concerns about global economic growth, international trade, geopolitical tensions, and bouts of market volatility. These concerns negatively influenced international equity markets.
For the period, U.S. stocks, based on the S&P 500 Index,1 gained 7.99% and international stocks, as measured by the MSCI ACWI ex USA Index (Net),2 fell 2.27%. The MSCI EM Index (Net)3 slipped 2.18%. For bond investors, the Bloomberg Barclays U.S. Aggregate Bond Index4 added 8.08%, the Bloomberg Barclays Global Aggregateex-USD Index5 added 3.74%, the Bloomberg Barclays Municipal Bond Index6 gained 7.31%, and the ICE BofAML U.S. High Yield Index7 added 6.94%.
Entering the fourth quarter of 2018, economic data was encouraging.
Domestic equity investors entered the fourth quarter of 2018 with reasons to be optimistic. The U.S. Bureau of Economic Analysis reported second-quarter annualized gross domestic product (GDP) growth of 4.2%. Hiring improved. Unemployment declined. Consumer confidence and spending increased. Third-quarter corporate earnings reports were generally positive. U.S. trade negotiations with Mexico and Canada progressed. The U.S. Federal Reserve (Fed) raised the federal funds rate by 25 basis points (bps; 100 bps equal 1.00%) to a target range of between 2.00% and 2.25% in September 2018, one of four rate increases implemented during the calendar year, a sign of its confidence in the strength of the U.S. economy.
Investors in international markets were not as confident. Tensions between the U.S. and China increased. The U.S. imposed $200 billion in tariffs on Chinese goods. China reacted with $60 billion in tariffs on U.S. goods. Economic growth in China caused concern. In September 2018, international investors began to factor a number of disconcerting economic and business data points: lower July manufacturers’ and industrial orders in Germany; falling purchasing manager index numbers for August from the United Kingdom, China, and India; and declining household spending for August in Japan. Taken together, the data fed growing concerns over slowing global growth that unnerved investors.
| 1 | The S&P 500 Index consists of 500 stocks chosen for market size, liquidity, and industry group representation. It is a market-value-weighted index with each stock’s weight in the index proportionate to its market value. You cannot invest directly in an index. |
| 2 | The Morgan Stanley Capital International (MSCI) All Country World Index (ACWI) ex USA Index (Net) is a free-float-adjusted market-capitalization weighted index that is designed to measure the equity market performance of developed and emerging markets, excluding the U.S. Source: MSCI. MSCI makes no express or implied warranties or representations and shall have no liability whatsoever with respect to any MSCI data contained herein. The MSCI data may not be further redistributed or used as a basis for other indices or any securities or financial products. This report is not approved, reviewed, or produced by MSCI. You cannot invest directly in an index. |
| 3 | The MSCI Emerging Markets (EM) Index (Net) is a free-float-adjusted market-capitalization-weighted index that is designed to measure the equity market performance of emerging markets. You cannot invest directly in an index. |
| 4 | The Bloomberg Barclays U.S. Aggregate Bond Index is a broad-based benchmark that measures the investment-grade, U.S. dollar-denominated, fixed-rate taxable bond market, including Treasuries, government-related and corporate securities, mortgage-backed securities (agency fixed-rate and hybrid adjustable-rate mortgage pass-throughs), asset-backed securities, and commercial mortgage-backed securities. You cannot invest directly in an index. |
| 5 | The Bloomberg Barclays Global Aggregateex-USD Index is an unmanaged index that provides a broad-based measure of the global investment-grade fixed-income markets excluding the U.S. dollar-denominated debt market. You cannot invest directly in an index. |
| 6 | The Bloomberg Barclays Municipal Bond Index is an unmanaged index composed of long-termtax-exempt bonds with a minimum credit rating of Baa. You cannot invest directly in an index. |
| 7 | The ICE BofAML U.S. High Yield Index is a market-capitalization-weighted index of domestic and Yankee high-yield bonds. The index tracks the performance of high-yield securities traded in the U.S. bond market. You cannot invest directly in an index. Copyright 2019. ICE Data Indices, LLC. All rights reserved. |
2 | Wells Fargo Growth Fund
Letter to shareholders (unaudited)
Global markets suffered during the fourth quarter of 2018.
November’s U.S. midterm elections shifted control of the House of Representatives from Republicans to Democrats, presaging partisan clashes that followed and caused uncertainty among investors. Third-quarter U.S. GDP was announced at an annualized 3.4% rate, lower than the second-quarter rate. Brexit efforts stalled ahead of the March 2019 deadline. The People’s Bank of China cut reserve requirement ratios, accelerated infrastructure spending, and cut taxes even as the value of the yuan declined to low levels last seen in 2008. A partial U.S. government shutdown driven by partisan policy disputes extended into January.
The combination of news in the U.S. and generally weak economic indicators outside of the U.S. caused investors to seek safe havens. December’s S&P 500 Index performance was the worst since 1931. Globally, fixed-income investments fared better than stocks during the last two months of the year. The Fed increased the federal funds rate by 25 bps in December to a target range of between 2.25% and 2.50%.
The market climbs a wall of worry.
Investors entered 2019 with reasons to be concerned. Investment returns appeared to reaffirm the adage that markets climb a wall of worry. The S&P 500 Index gained 8.01% for the month of January, the best monthly performance in 30 years. Returns for the MSCI ACWI ex USA Index (Net), the Bloomberg Barclays U.S. Aggregate Bond Index, and the Bloomberg Barclays Global Aggregateex-USD Index also were positive.
In February 2019, signs of slowing global growth grew more ominous. The Bureau of Economic Analysis announced fourth-quarter 2018 GDP grew at an annualized 2.2% rate, down from the levels of the prior two quarters. In a February report, the Bank of England forecasted the slowest growth since the financial crisis for 2019. China and the U.S. continued to wrangle over trade issues.
By the end of March 2019, a combination of dovish Fed sentiment and steady, if not spectacular, U.S. economic and business metrics reinforced investors’ confidence. Monthly job creation data and corporate profits, while less consistent than during 2018, were solid. China announced a roughly $300 billion stimulus package through tax and fee cuts intended to reinvigorate economic growth. During April 2019, favorable sentiment found additional support in reports of sustained low inflation, solid employment data, and first-quarter U.S. GDP of an annualized rate of 3.2%.
During May 2019, markets tumbled on mixed investment signals. In the U.S., partisan wrangling ramped up as Democrats and Republicans set their sights on 2020 presidential politics. The U.K.’s Brexit caused Prime Minister Theresa May to resign. The European Commission downgraded the 2019 growth forecast to 1.2%. The U.S. increased tariffs on products from China, China responded, and then talks broke down. President Donald Trump threatened to turn his foreign policy tariff tool to Mexico over immigration issues.
As had been the case during most of 2019 to date, just as the investment horizon appeared to darken, sentiment turned and U.S. equity markets gained during June and July. The gains, primarily driven by geopolitical and monetary policy events, pushed equity markets to new highs.
President Mario Draghi of the European Central Bank said that if the outlook doesn’t improve, the bank will cut rates or buy more assets to prop up inflation. President Trump backed off of tariff threats against Mexico and China. In the U.S., the Fed implemented a 0.25% federal funds rate cut in July 2019.
“December’s S&P 500 Index performance was the worst since 1931.”
“The S&P 500 Index gained 8.01% for the month of January, the best monthly performance in 30 years.”
Wells Fargo Growth Fund | 3
Letter to shareholders (unaudited)
Later in July 2019, the U.S. reversed course and threatened to impose higher tariffs on China’s exports after talks failed. China responded with tariff threats of its own and devalued the renminbi, a move that roiled global markets. Despite the accommodative approach of central banks, investors continued to have misgivings about the durability of economic growth globally and a pervasively cautious tone influenced the world’s equity and fixed-income markets.
Don’t let short-term uncertainty derail long-term investment goals.
Periods of investment uncertainty can present challenges, but experience has taught us that maintaining long-term investment goals can be an effective way to plan for the future. To help you create a sound strategy based on your personal goals and risk tolerance, Wells Fargo Funds offers more than 100 mutual funds spanning a wide range of asset classes and investment styles. Although diversification cannot guarantee an investment profit or prevent losses, we believe it can be an effective way to manage investment risk and potentially smooth out overall portfolio performance. We encourage investors to know their investments and to understand that appropriate levels of risk-taking may unlock opportunities.
Thank you for choosing to invest with Wells Fargo Funds. We appreciate your confidence in us and remain committed to helping you meet your financial needs.
Sincerely,

Andrew Owen
President
Wells Fargo Funds
|
|
|
For further information about your Fund, contact your investment professional, visit our website at wfam.com, or call us directly at1-800-222-8222. |
4 | Wells Fargo Growth Fund
This page is intentionally left blank.
Performance highlights (unaudited)
Investment objective
The Fund seeks long-term capital appreciation.
Manager
Wells Fargo Funds Management, LLC
Subadviser
Wells Capital Management Incorporated
Portfolio managers
Joseph M. Eberhardy, CFA®‡, CPA
Thomas C. Ognar, CFA®‡
Average annual total returns (%) as of July 31, 2019
| | | | | | | | | | | | | | | | | | | | | | | | | | | | | | | | | | |
| | | | |
| | | | | Including sales charge | | | Excluding sales charge | | | Expense ratios1 (%) | |
| | | | | | | | | |
| | | Inception date | | 1 year | | | 5 year | | | 10 year | | | 1 year | | | 5 year | | | 10 year | | | Gross | | | Net2 | |
| | | | | | | | | | �� |
| Class A (SGRAX) | | 2-24-2000 | | | 7.02 | | | | 12.37 | | | | 16.09 | | | | 13.55 | | | | 13.70 | | | | 16.78 | | | | 1.18 | | | | 1.16 | |
| | | | | | | | | | |
| Class C (WGFCX) | | 12-26-2002 | | | 11.68 | | | | 12.85 | | | | 15.91 | | | | 12.68 | | | | 12.85 | | | | 15.91 | | | | 1.93 | | | | 1.91 | |
| | | | | | | | | | |
| Class R6 (SGRHX)3 | | 9-30-2015 | | | – | | | | – | | | | – | | | | 14.06 | | | | 14.22 | | | | 17.31 | | | | 0.75 | | | | 0.70 | |
| | | | | | | | | | |
| Administrator Class (SGRKX) | | 8-30-2002 | | | – | | | | – | | | | – | | | | 13.78 | | | | 13.93 | | | | 17.05 | | | | 1.10 | | | | 0.96 | |
| | | | | | | | | | |
| Institutional Class (SGRNX) | | 2-24-2000 | | | – | | | | – | | | | – | | | | 14.00 | | | | 14.18 | | | | 17.29 | | | | 0.85 | | | | 0.75 | |
| | | | | | | | | | |
| Russell 3000®Growth Index4 | | – | | | – | | | | – | | | | – | | | | 9.88 | | | | 13.94 | | | | 15.58 | | | | – | | | | – | |
Figures quoted represent past performance, which is no guarantee of future results, and do not reflect taxes that a shareholder may pay on fund distributions or the redemption of fund shares. Investment return and principal value of an investment will fluctuate so that an investor’s shares, when redeemed, may be worth more or less than their original cost. Performance shown without sales charges would be lower if sales charges were reflected. Current performance may be lower or higher than the performance data quoted, which assumes the reinvestment of dividends and capital gains. Currentmonth-end performance is available on the Fund’s website,wfam.com.
Index returns do not include transaction costs associated with buying and selling securities, any mutual fund fees or expenses, or any taxes. It is not possible to invest directly in an index.
For Class A shares, the maximumfront-end sales charge is 5.75%. For Class C shares, the maximum contingent deferred sales charge is 1.00%. Performance including a contingent deferred sales charge assumes the sales charge for the corresponding time period. Class R6, Administrator Class, and Institutional Class shares are sold without afront-end sales charge or contingent deferred sales charge.
Stock values fluctuate in response to the activities of individual companies and general market and economic conditions. Certain investment strategies tend to increase the total risk of an investment (relative to the broader market). The Fund is exposed to foreign investment risk and smaller-company securities risk. Consult the Fund’s prospectus for additional information on these and other risks.
Please see footnotes on page 7.
6 | Wells Fargo Growth Fund
Performance highlights (unaudited)
|
|
| Growth of $10,000 investment as of July 31, 20195 |
|
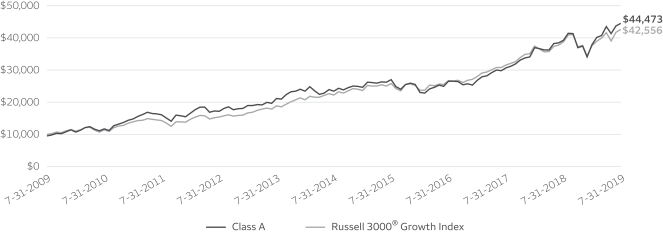
|
| ‡ | CFA® and Chartered Financial Analyst® are trademarks owned by CFA Institute. |
| 1 | Reflects the expense ratios as stated in the most recent prospectuses. The expense ratios shown are subject to change and may differ from the annualized expense ratios shown in the financial highlights of this report. |
| 2 | The manager has contractually committed through November 30, 2019, to waive fees and/or reimburse expenses to the extent necessary to cap the expenses of each class after fee waivers at the amounts shown. Brokerage commissions, stamp duty fees, interest, taxes, acquired fund fees and expenses (if any), and extraordinary expenses are excluded from the expense cap. Prior to or after the commitment expiration date, the cap may be increased or the commitment to maintain the cap may be terminated only with the approval of the Board of Trustees. Without this cap, the Fund’s returns would have been lower. The expense ratio paid by an investor is the net expense ratio (the total annual fund operating expenses after fee waivers) as stated in the prospectuses. |
| 3 | Historical performance shown for Class R6 shares prior to their inception reflects the performance of Institutional Class shares, and includes the higher expenses applicable to Institutional Class shares. If these expenses had not been included, returns for Class R6 shares would be higher. |
| 4 | The Russell 3000® Growth Index measures the performance of those Russell 3000® Index companies with higher price/book ratios and higher forecasted growth values. You cannot invest directly in an index. |
| 5 | The chart compares the performance of Class A shares for the most recent ten years with the Russell 3000®Growth Index. The chart assumes a hypothetical investment of $10,000 in Class A shares and reflects all operating expenses and assumes the maximum initial sales charge of 5.75%. |
| 6 | The ten largest holdings, excluding cash, cash equivalents and any money market funds, are calculated based on the value of the investments divided by total net assets of the Fund. Holdings are subject to change and may have changed since the date specified. |
| 7 | Amounts are calculated based on the total long-term investments of the Fund. These amounts are subject to change and may have changed since the date specified. |
Wells Fargo Growth Fund | 7
Performance highlights (unaudited)
MANAGER’S DISCUSSION
Fund highlights
| ∎ | | The Fund outperformed its benchmark, the Russell 3000® Growth Index, for the12-month period that ended July 31, 2019. |
| ∎ | | Holdings within information technology (IT), health care, financials, and consumer discretionary aided the Fund’s performance for the period. |
| ∎ | | The Fund’s performance was inhibited by stocks within the communication services and materials sectors. |
The equity market pushed higher over the trailingone-year period as solid economic fundamentals have overshadowed periods of negative sentiment, which was particularly pervasive in late 2018. For much of the fourth quarter of 2018, stocks moved sharply lower as a flattening yield curve, corporate debt concerns, a pullback in commodities, tariff and trade concerns, and hues of decelerating global growth flustered markets. Additionally, geopolitical concerns coupled with quantitative easing across the globe have fueled investor concerns. Despite this backdrop, while some economic data has slowed in the U.S., the economy still stands on solid footing with low unemployment and strong consumer confidence. This environment of accommodative fiscal and monetary policy and reasonable energy prices is fostering a healthy landscape for the consumer. The Fund continues to benefit from constructive idiosyncratic dynamics and secular growth catalysts in a variety of areas as many of our portfolio companies are gaining market share in their respective industries.
| | | | |
|
| Ten largest holdings(%) as of July 31, 20196 | |
| | |
Amazon.com Incorporated | | | 7.23 | |
| | |
Alphabet Incorporated Class A | | | 4.96 | |
| | |
Microsoft Corporation | | | 4.66 | |
| | |
Microchip Technology Incorporated | | | 3.36 | |
| | |
MasterCard Incorporated Class A | | | 3.26 | |
| | |
Visa Incorporated Class A | | | 3.09 | |
| | |
Monolithic Power Systems Incorporated | | | 2.48 | |
| | |
Burlington Stores Incorporated | | | 2.44 | |
| | |
Envestnet Incorporated | | | 2.11 | |
| | |
Apple Incorporated | | | 2.09 | |
Performance of health care and IT holdings were beneficial to Fund performance.
Select holdings within the health care sector served as the best-performing area of the Fund. Health care technology firm Veeva Systems Incorporated, which providessoftware-as-a-service (SaaS) solutions to the life sciences industry, reported strong revenue and free cash flow with particular strength from its clinical data management system unit. Other areas of strength within the sector came from Insulet Corporation, which makes insulin delivery systems for people with diabetes, and Novocure Limited, whose flagship product Optune slows cancer cell growth for patients with brain cancer. Other areas of the Fund that
performed well were areas such as SaaS and payment processing industries within IT that generated market-share penetration and margin expansion in their respective vertical markets. Within software, demand remained strong as corporate spending continued to rise, coupled with next-generation cloud computing platforms that garnered a large share of new business at the expense of legacy solutions. Within the payment space, the movement towarde-commerce has had a positive effect on overall demand as more consumers are moving from cash to digital payments.
|
|
| Sector distribution as of July 31, 20197 |
|
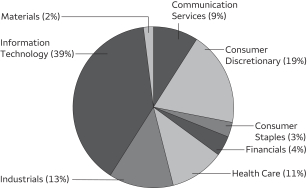 |
Certain communication services and materials stocks detracted from performance.
The main source of weakness from a sector perspective came from communication services as the Fund’s underweight position to Facebook, Incorporated, negatively affected relative performance. In 2018, we reduced our positon after privacy issues surfaced and after Facebook shifted its focus toward monetizing stories and video rather than the traditional newsfeed segment. Recently, we have added back to our position as we have grown more comfortable with its ability to monetize both of these properties within Instagram and the legacy Facebook app.
Within materials, PolyOne Corporation, which makes specialized polymer plastics solutions, detracted from performance as organic sales decelerated due to a slowing of macro demand.
Please see footnotes on page 7.
8 | Wells Fargo Growth Fund
Performance highlights (unaudited)
Areas of focus remain in secular areas like software, payments, and semiconductors.
The Fund continues to be well diversified in a plethora of areas, which include industries within consumer discretionary, health care, communication services, and IT. Some notable segments include the SaaS, payments, and semiconductors industries. The structural advantages of the software space continue to include benefits like a predictable cost of ownership to the customer, flexibility and scale, simplification, and faster implementation times. Within the payments segment, processors like Square, Incorporated, and PayPal Holdings, Incorporated, as well as networks Visa Incorporated and MasterCard Incorporated, continue to capitalize from secular drivers such as the global shift from cash and check to plastic, growth withine-commerce, international and cross-border growth, andpeer-to-peer transfers. Semiconductors, which continue to benefit from the digitization of the economy, are becoming more prevalent in our daily lives as more chips are being used in electrical devices.
Our view of faster-growth stocks is positive.
We continue to be disciplined from a valuation perspective by trimming positions where the valuation gap has narrowed and adding to positions where it has widened. While our process is largelybottom-up, we continue to monitor geopolitical issues like trade tensions between the U.S. and China as well as macroeconomic conditions such as the economic slowdown in Europe, the increasing amount of negative-yielding sovereign debt, and the steep decrease in U.S. Treasury yields. We expect to generate alpha from multiple sectors and industries and are comfortable with our positioning and our focus on SaaS, cloud services, online retail, digital payments, the internet of things, and innovation (SCODIi). We continue to witness a scarcity of growth stock opportunities within the investing universe, which could favor our portfolio in the future. Going forward, given the current economic backdrop, stocks emphasized in our investment process should bode well for the future of the portfolio.
Wells Fargo Growth Fund | 9
Fund expenses (unaudited)
As a shareholder of the Fund, you incur two types of costs: (1) transaction costs, including sales charges (loads) on purchase payments and contingent deferred sales charges (if any) on redemptions and (2) ongoing costs, including management fees, distribution(12b-1) and/or shareholder servicing fees, and other Fund expenses. This example is intended to help you understand your ongoing costs (in dollars) of investing in the Fund and to compare these costs with the ongoing costs of investing in other mutual funds.
The example is based on an investment of $1,000 invested at the beginning of thesix-month period and held for the entire period from February 1, 2019 to July 31, 2019.
Actual expenses
The “Actual” line of the table below provides information about actual account values and actual expenses. You may use the information in this line, together with the amount you invested, to estimate the expenses that you paid over the period. Simply divide your account value by $1,000 (for example, an $8,600 account value divided by $1,000 = 8.6), then multiply the result by the number in the “Actual” line under the heading entitled “Expenses paid during period” for your applicable class of shares to estimate the expenses you paid on your account during this period.
Hypothetical example for comparison purposes
The “Hypothetical” line of the table below provides information about hypothetical account values and hypothetical expenses based on the Fund’s actual expense ratio and an assumed rate of return of 5% per year before expenses, which is not the Fund’s actual return. The hypothetical account values and expenses may not be used to estimate the actual ending account balance or expenses you paid for the period. You may use this information to compare the ongoing costs of investing in the Fund and other funds. To do so, compare this 5% hypothetical example with the 5% hypothetical examples that appear in the shareholder reports of the other funds.
Please note that the expenses shown in the table are meant to highlight your ongoing costs only and do not reflect any transactional costs, such as sales charges (loads) and contingent deferred sales charges. Therefore, the “Hypothetical” line of the table is useful in comparing ongoing costs only and will not help you determine the relative total costs of owning different funds. In addition, if these transactional costs were included, your costs would have been higher.
| | | | | | | | | | | | | | | | |
| | | Beginning
account value
2-1-2019 | | | Ending
account value
7-31-2019 | | | Expenses
paid during
the period¹ | | | Annualized net
expense ratio | |
| | | | | |
Class A | | | | | | | | | | | | | | | | |
| | | | |
Actual | | $ | 1,000.00 | | | $ | 1,175.15 | | | $ | 6.26 | | | | 1.16 | % |
| | | | |
Hypothetical (5% return before expenses) | | $ | 1,000.00 | | | $ | 1,019.04 | | | $ | 5.81 | | | | 1.16 | % |
| | | | | |
Class C | | | | | | | | | | | | | | | | |
| | | | |
Actual | | $ | 1,000.00 | | | $ | 1,170.59 | | | $ | 10.28 | | | | 1.91 | % |
| | | | |
Hypothetical (5% return before expenses) | | $ | 1,000.00 | | | $ | 1,015.32 | | | $ | 9.54 | | | | 1.91 | % |
| | | | | |
Class R6 | | | | | | | | | | | | | | | | |
| | | | |
Actual | | $ | 1,000.00 | | | $ | 1,177.80 | | | $ | 3.78 | | | | 0.70 | % |
| | | | |
Hypothetical (5% return before expenses) | | $ | 1,000.00 | | | $ | 1,021.32 | | | $ | 3.51 | | | | 0.70 | % |
| | | | | |
Administrator Class | | | | | | | | | | | | | | | | |
| | | | |
Actual | | $ | 1,000.00 | | | $ | 1,176.24 | | | $ | 5.18 | | | | 0.96 | % |
| | | | |
Hypothetical (5% return before expenses) | | $ | 1,000.00 | | | $ | 1,020.03 | | | $ | 4.81 | | | | 0.96 | % |
| | | | | |
Institutional Class | | | | | | | | | | | | | | | | |
| | | | |
Actual | | $ | 1,000.00 | | | $ | 1,177.53 | | | $ | 4.05 | | | | 0.75 | % |
| | | | |
Hypothetical (5% return before expenses) | | $ | 1,000.00 | | | $ | 1,021.08 | | | $ | 3.76 | | | | 0.75 | % |
| 1 | Expenses paid is equal to the annualized net expense ratio of each class multiplied by the average account value over the period, multiplied by the number of days in the most recent fiscal half-year divided by the number of days in the fiscal year (to reflect theone-half-year period). |
10 | Wells Fargo Growth Fund
Portfolio of investments—July 31, 2019
| | | | | | | | | | | | | | | | |
| | | | | | | | | Shares | | | Value | |
| Common Stocks: 98.58% | | | | | | | | | | | | | | | | |
| | | | |
Communication Services: 8.78% | | | | | | | | | | | | | | | | |
| | | | |
| Entertainment: 0.66% | | | | | | | | | | | | |
| | | | |
Live Nation Incorporated † | | | | | | | | | | | 8,828 | | | $ | 636,146 | |
| | | | |
Netflix Incorporated † | | | | | | | | | | | 94,340 | | | | 30,470,877 | |
| | | | |
| | | | | | | | | | | | | | | 31,107,023 | |
| | | | | | | | | | | | | | | | |
| | | | |
| Interactive Media & Services: 8.12% | | | | | | | | | | | | |
| | | | |
Alphabet Incorporated Class A † | | | | | | | | | | | 190,535 | | | | 232,109,737 | |
| | | | |
Alphabet Incorporated Class C † | | | | | | | | | | | 19,190 | | | | 23,348,089 | |
| | | | |
CarGurus Incorporated † | | | | | | | | | | | 489,600 | | | | 18,247,392 | |
| | | | |
Facebook Incorporated Class A † | | | | | | | | | | | 436,900 | | | | 84,859,087 | |
| | | | |
Pinterest Incorporated Class A † | | | | | | | | | | | 199,985 | | | | 5,797,565 | |
| | | | |
Twitter Incorporated † | | | | | | | | | | | 359,100 | | | | 15,193,521 | |
| | | | |
| | | | | | | | | | | | | | | 379,555,391 | |
| | | | | | | | | | | | | | | | |
| | | | |
Consumer Discretionary: 18.59% | | | | | | | | | | | | | | | | |
| | | | |
| Diversified Consumer Services: 0.92% | | | | | | | | | | | | |
| | | | |
Bright Horizons Family Solutions Incorporated † | | | | | | | | | | | 128,030 | | | | 19,469,522 | |
| | | | |
Grand Canyon Education Incorporated † | | | | | | | | | | | 217,250 | | | | 23,630,283 | |
| | | | |
| | | | | | | | | | | | | | | 43,099,805 | |
| | | | | | | | | | | | | | | | |
| | | | |
| Hotels, Restaurants & Leisure: 1.60% | | | | | | | | | | | | |
| | | | |
Norwegian Cruise Line Holdings Limited † | | | | | | | | | | | 530,500 | | | | 26,227,920 | |
| | | | |
Royal Caribbean Cruises Limited | | | | | | | | | | | 416,100 | | | | 48,409,074 | |
| | | | |
| | | | | | | | | | | | | | | 74,636,994 | |
| | | | | | | | | | | | | | | | |
| | | | |
| Household Durables: 1.60% | | | | | | | | | | | | |
| | | | |
Roku Incorporated † | | | | | | | | | | | 723,400 | | | | 74,748,922 | |
| | | | | | | | | | | | | | | | |
| | | | |
| Internet & Direct Marketing Retail: 7.62% | | | | | | | | | | | | |
| | | | |
Amazon.com Incorporated † | | | | | | | | | | | 181,070 | | | | 338,017,855 | |
| | | | |
Farfetch Limited Class A †« | | | | | | | | | | | 864,000 | | | | 17,366,400 | |
| | | | |
The RealReal Incorporated † | | | | | | | | | | | 38,823 | | | | 953,105 | |
| | | | |
| | | | | | | | | | | | | | | 356,337,360 | |
| | | | | | | | | | | | | | | | |
| | | | |
| Multiline Retail: 0.71% | | | | | | | | | | | | |
| | | | |
Ollie’s Bargain Outlet Holdings Incorporated † | | | | | | | | | | | 391,100 | | | | 33,122,259 | |
| | | | | | | | | | | | | | | | |
| | | | |
| Specialty Retail: 5.31% | | | | | | | | | | | | |
| | | | |
Burlington Stores Incorporated † | | | | | | | | | | | 632,250 | | | | 114,279,188 | |
| | | | |
CarMax Incorporated † | | | | | | | | | | | 197,700 | | | | 17,350,152 | |
| | | | |
Five Below Incorporated † | | | | | | | | | | | 305,559 | | | | 35,890,960 | |
| | | | |
The Home Depot Incorporated | | | | | | | | | | | 159,710 | | | | 34,128,430 | |
| | | | |
ULTA Beauty Incorporated † | | | | | | | | | | | 133,800 | | | | 46,729,650 | |
| | | | |
| | | | | | | | | | | | | | | 248,378,380 | |
| | | | | | | | | | | | | | | | |
| | | | |
| Textiles, Apparel & Luxury Goods: 0.83% | | | | | | | | | | | | |
| | | | |
Levi Strauss & Company Class A †« | | | | | | | | | | | 2,027,769 | | | | 38,649,277 | |
| | | | | | | | | | | | | | | | |
| | | | |
Consumer Staples: 2.58% | | | | | | | | | | | | | | | | |
| | | | |
| Beverages: 1.57% | | | | | | | | | | | | |
| | | | |
Constellation Brands Incorporated Class A | | | | | | | | | | | 64,310 | | | | 12,657,494 | |
| | | | |
The Coca-Cola Company | | | | | | | | | | | 1,155,100 | | | | 60,792,913 | |
| | | | |
| | | | | | | | | | | | | | | 73,450,407 | |
| | | | | | | | | | | | | | | | |
Wells Fargo Growth Fund | 11
The accompanying notes are an integral part of these financial statements.
Portfolio of investments—July 31, 2019
| | | | | | | | | | | | | | | | |
| | | | | | | | | Shares | | | Value | |
| | | | |
| Food & Staples Retailing: 0.07% | | | | | | | | | | | | |
| | | | |
Grocery Outlet Holding Corporation † | | | | | | | | | | | 83,499 | | | $ | 3,251,451 | |
| | | | | | | | | | | | | | | | |
| | | | |
| Personal Products: 0.94% | | | | | | | | | | | | |
| | | | |
The Estee Lauder Companies Incorporated Class A | | | | | | | | | | | 237,960 | | | | 43,829,852 | |
| | | | | | | | | | | | | | | | |
| | | | |
Energy: 0.40% | | | | | | | | | | | | | | | | |
| | | | |
| Oil, Gas & Consumable Fuels: 0.40% | | | | | | | | | | | | |
| | | | |
Concho Resources Incorporated | | | | | | | | | | | 191,850 | | | | 18,739,908 | |
| | | | | | | | | | | | | | | | |
| | | | |
Financials: 4.08% | | | | | | | | | | | | | | | | |
| | | | |
| Capital Markets: 3.49% | | | | | | | | | | | | |
| | | | |
Assetmark Financial Holdings † | | | | | | | | | | | 94,579 | | | | 2,675,640 | |
| | | | |
CME Group Incorporated | | | | | | | | | | | 102,410 | | | | 19,910,552 | |
| | | | |
MarketAxess Holdings Incorporated | | | | | | | | | | | 259,121 | | | | 87,334,142 | |
| | | | |
Raymond James Financial Incorporated | | | | | | | | | | | 416,340 | | | | 33,586,148 | |
| | | | |
The Charles Schwab Corporation | | | | | | | | | | | 458,050 | | | | 19,796,921 | |
| | | | |
| | | | | | | | | | | | | | | 163,303,403 | |
| | | | | | | | | | | | | | | | |
| | | | |
| Thrifts & Mortgage Finance: 0.59% | | | | | | | | | | | | |
| | | | |
LendingTree Incorporated †« | | | | | | | | | | | 85,260 | | | | 27,499,760 | |
| | | | | | | | | | | | | | | | |
| | | | |
Health Care: 11.18% | | | | | | | | | | | | | | | | |
| | | | |
| Biotechnology: 3.03% | | | | | | | | | | | | |
| | | | |
Alexion Pharmaceuticals Incorporated † | | | | | | | | | | | 577,300 | | | | 65,402,317 | |
| | | | |
Natera Incorporated † | | | | | | | | | | | 617,795 | | | | 17,038,786 | |
| | | | |
Sage Therapeutics Incorporated † | | | | | | | | | | | 93,500 | | | | 14,991,790 | |
| | | | |
Sarepta Therapeutics Incorporated † | | | | | | | | | | | 89,600 | | | | 13,336,960 | |
| | | | |
Vertex Pharmaceuticals Incorporated † | | | | | | | | | | | 186,600 | | | | 31,091,292 | |
| | | | |
| | | | | | | | | | | | | | | 141,861,145 | |
| | | | | | | | | | | | | | | | |
| | | | |
| Health Care Equipment & Supplies: 5.26% | | | | | | | | | | | | |
| | | | |
Boston Scientific Corporation † | | | | | | | | | | | 1,547,520 | | | | 65,707,699 | |
| | | | |
DexCom Incorporated † | | | | | | | | | | | 177,100 | | | | 27,781,677 | |
| | | | |
Edwards Lifesciences Corporation † | | | | | | | | | | | 109,800 | | | | 23,370,930 | |
| | | | |
Insulet Corporation † | | | | | | | | | | | 415,900 | | | | 51,130,746 | |
| | | | |
Novocure Limited † | | | | | | | | | | | 808,600 | | | | 67,291,692 | |
| | | | |
Stryker Corporation | | | | | | | | | | | 51,000 | | | | 10,698,780 | |
| | | | |
| | | | | | | | | | | | | | | 245,981,524 | |
| | | | | | | | | | | | | | | | |
| | | | |
| Health Care Technology: 1.65% | | | | | | | | | | | | |
| | | | |
Health Catalyst Incorporated † | | | | | | | | | | | 47,213 | | | | 2,089,175 | |
| | | | |
Veeva Systems Incorporated Class A † | | | | | | | | | | | 452,250 | | | | 75,028,275 | |
| | | | |
| | | | | | | | | | | | | | | 77,117,450 | |
| | | | | | | | | | | | | | | | |
| | | | |
| Life Sciences Tools & Services: 0.05% | | | | | | | | | | | | |
| | | | |
Adaptive Biotechnologies Corporation † | | | | | | | | | | | 65,003 | | | | 2,505,866 | |
| | | | | | | | | | | | | | | | |
| | | | |
| Pharmaceuticals: 1.19% | | | | | | | | | | | | |
| | | | |
Elanco Animal Health Incorporated † | | | | | | | | | | | 493,405 | | | | 16,262,629 | |
| | | | |
Zoetis Incorporated | | | | | | | | | | | 340,970 | | | | 39,174,043 | |
| | | | |
| | | | | | | | | | | | | | | 55,436,672 | |
| | | | | | | | | | | | | | | | |
12 | Wells Fargo Growth Fund
The accompanying notes are an integral part of these financial statements.
Portfolio of investments—July 31, 2019
| | | | | | | | | | | | | | | | |
| | | | | | | | | Shares | | | Value | |
| | | | |
Industrials: 12.73% | | | | | | | | | | | | | | | | |
| | | | |
| Aerospace & Defense: 1.14% | | | | | | | | | | | | |
| | | | |
The Boeing Company | | | | | | | | | | | 157,080 | | | $ | 53,592,554 | |
| | | | | | | | | | | | | | | | |
| | | | |
| Airlines: 0.23% | | | | | | | | | | | | |
| | | | |
SkyWest Incorporated | | | | | | | | | | | 177,600 | | | | 10,782,096 | |
| | | | | | | | | | | | | | | | |
| | | | |
| Commercial Services & Supplies: 3.37% | | | | | | | | | | | | |
| | | | |
Casella Waste Systems Incorporated Class A † | | | | | | | | | | | 674,124 | | | | 29,391,806 | |
| | | | |
Copart Incorporated † | | | | | | | | | | | 682,070 | | | | 52,880,887 | |
| | | | |
Waste Connections Incorporated | | | | | | | | | | | 830,805 | | | | 75,370,630 | |
| | | | |
| | | | | | | | | | | | | | | 157,643,323 | |
| | | | | | | | | | | | | | | | |
| | | | |
| Industrial Conglomerates: 0.69% | | | | | | | | | | | | |
| | | | |
Roper Technologies Incorporated | | | | | | | | | | | 89,190 | | | | 32,433,944 | |
| | | | | | | | | | | | | | | | |
| | | | |
| Machinery: 0.91% | | | | | | | | | | | | |
| | | | |
Fortive Corporation | | | | | | | | | | | 121,960 | | | | 9,275,058 | |
| | | | |
Milacron Holdings Corporation † | | | | | | | | | | | 1,965,135 | | | | 33,092,873 | |
| | | | |
| | | | | | | | | | | | | | | 42,367,931 | |
| | | | | | | | | | | | | | | | |
| | | | |
| Professional Services: 1.52% | | | | | | | | | | | | |
| | | | |
ASGN Incorporated † | | | | | | | | | | | 410,000 | | | | 25,850,500 | |
| | | | |
CoStar Group Incorporated † | | | | | | | | | | | 57,300 | | | | 35,262,420 | |
| | | | |
TransUnion | | | | | | | | | | | 119,800 | | | | 9,918,242 | |
| | | | |
| | | | | | | | | | | | | | | 71,031,162 | |
| | | | | | | | | | | | | | | | |
| | | | |
| Road & Rail: 4.79% | | | | | | | | | | | | |
| | | | |
CSX Corporation | | | | | | | | | | | 1,190,880 | | | | 83,837,952 | |
| | | | |
Norfolk Southern Corporation | | | | | | | | | | | 379,490 | | | | 72,528,129 | |
| | | | |
Union Pacific Corporation | | | | | | | | | | | 374,760 | | | | 67,438,062 | |
| | | | |
| | | | | | | | | | | | | | | 223,804,143 | |
| | | | | | | | | | | | | | | | |
| | | | |
| Trading Companies & Distributors: 0.08% | | | | | | | | | | | | |
| | | | |
SiteOne Landscape Supply Incorporated † | | | | | | | | | | | 49,500 | | | | 3,656,565 | |
| | | | | | | | | | | | | | | | |
| | | | |
Information Technology: 38.50% | | | | | | | | | | | | | | | | |
| | | | |
| IT Services: 13.27% | | | | | | | | | | | | |
| | | | |
Euronet Worldwide Incorporated † | | | | | | | | | | | 306,500 | | | | 47,786,415 | |
| | | | |
Global Payments Incorporated | | | | | | | | | | | 491,870 | | | | 82,594,810 | |
| | | | |
InterXion Holding NV † | | | | | | | | | | | 161,931 | | | | 12,193,404 | |
| | | | |
MasterCard Incorporated Class A | | | | | | | | | | | 559,470 | | | | 152,326,897 | |
| | | | |
MongoDB Incorporated † | | | | | | | | | | | 144,720 | | | | 20,726,798 | |
| | | | |
PayPal Holdings Incorporated † | | | | | | | | | | | 708,890 | | | | 78,261,456 | |
| | | | |
Square Incorporated Class A † | | | | | | | | | | | 318,300 | | | | 25,594,503 | |
| | | | |
Twilio Incorporated Class A † | | | | | | | | | | | 220,539 | | | | 30,679,180 | |
| | | | |
Visa Incorporated Class A | | | | | | | | | | | 811,610 | | | | 144,466,580 | |
| | | | |
WEX Incorporated † | | | | | | | | | | | 119,089 | | | | 25,969,738 | |
| | | | |
| | | | | | | | | | | | | | | 620,599,781 | |
| | | | | | | | | | | | | | | | |
| | | | |
| Semiconductors & Semiconductor Equipment: 7.61% | | | | | | | | | | | | |
| | | | |
Microchip Technology Incorporated « | | | | | | | | | | | 1,662,290 | | | | 156,953,422 | |
| | | | |
Monolithic Power Systems Incorporated | | | | | | | | | | | 781,070 | | | | 115,723,331 | |
| | | | |
NVIDIA Corporation | | | | | | | | | | | 50,700 | | | | 8,554,104 | |
| | | | |
Texas Instruments Incorporated | | | | | | | | | | | 597,380 | | | | 74,678,474 | |
| | | | |
| | | | | | | | | | | | | | | 355,909,331 | |
| | | | | | | | | | | | | | | | |
Wells Fargo Growth Fund | 13
The accompanying notes are an integral part of these financial statements.
Portfolio of investments—July 31, 2019
| | | | | | | | | | | | | | | | |
| | | | | | | | | Shares | | | Value | |
| | | | |
| Software: 15.53% | | | | | | | | | | | | |
| | | | |
Adobe Systems Incorporated † | | | | | | | | | | | 74,520 | | | $ | 22,271,047 | |
| | | | |
Anaplan Incorporated † | | | | | | | | | | | 289,439 | | | | 16,480,657 | |
| | | | |
BlackLine Incorporated † | | | | | | | | | | | 320,830 | | | | 14,309,018 | |
| | | | |
Dropbox Incorporated Class A † | | | | | | | | | | | 2,101,600 | | | | 49,513,696 | |
| | | | |
Envestnet Incorporated † | | | | | | | | | | | 1,384,470 | | | | 98,865,003 | |
| | | | |
Microsoft Corporation | | | | | | | | | | | 1,597,650 | | | | 217,711,766 | |
| | | | |
Mimecast Limited † | | | | | | | | | | | 968,800 | | | | 46,114,880 | |
| | | | |
New Relic Incorporated † | | | | | | | | | | | 295,460 | | | | 27,528,008 | |
| | | | |
Proofpoint Incorporated † | | | | | | | | | | | 399,390 | | | | 50,403,018 | |
| | | | |
Rapid7 Incorporated † | | | | | | | | | | | 108,300 | | | | 6,568,395 | |
| | | | |
RealPage Incorporated † | | | | | | | | | | | 699,600 | | | | 43,711,008 | |
| | | | |
SailPoint Technologies Holdings Incorporated † | | | | | | | | | | | 414,371 | | | | 8,759,803 | |
| | | | |
Salesforce.com Incorporated † | | | | | | | | | | | 164,380 | | | | 25,396,710 | |
| | | | |
ServiceNow Incorporated † | | | | | | | | | | | 81,190 | | | | 22,521,294 | |
| | | | |
Splunk Incorporated † | | | | | | | | | | | 230,900 | | | | 31,243,079 | |
| | | | |
Tableau Software Incorporated Class A † | | | | | | | | | | | 121,700 | | | | 20,631,801 | |
| | | | |
Talend SA ADR † | | | | | | | | | | | 724,400 | | | | 23,767,564 | |
| | | | |
| | | | | | | | | | | | | | | 725,796,747 | |
| | | | | | | | | | | | | | | | |
| | | | |
| Technology Hardware, Storage & Peripherals: 2.09% | | | | | | | | | | | | |
| | | | |
Apple Incorporated | | | | | | | | | | | 457,840 | | | | 97,538,234 | |
| | | | | | | | | | | | | | | | |
| | | | |
Materials: 1.74% | | | | | | | | | | | | | | | | |
| | | | |
| Chemicals: 1.74% | | | | | | | | | | | | |
| | | | |
Linde plc | | | | | | | | | | | 277,660 | | | | 53,110,805 | |
| | | | |
PolyOne Corporation | | | | | | | | | | | 858,863 | | | | 28,144,940 | |
| | | | |
| | | | | | | | | | | | | | | 81,255,745 | |
| | | | | | | | | | | | | | | | |
| | | | |
Total Common Stocks (Cost $2,182,199,712) | | | | | | | | | | | | | | | 4,609,024,405 | |
| | | | | | | | | | | | | | | | |
| | | | |
| | | | | | | | | | | | | | | | |
| | | Yield | | | | | | | | | | |
| Short-Term Investments: 1.73% | | | | | | | | | | | | |
| | | | |
| Investment Companies: 1.73% | | | | | | | | | | | | |
| | | | |
Securities Lending Cash Investments LLC (l)(r)(u) | | | 2.46 | % | | | | | | | 18,742,078 | | | | 18,743,952 | |
| | | | |
Wells Fargo Government Money Market Fund Select Class (l)(u) | | | 2.26 | | | | | | | | 62,114,127 | | | | 62,114,127 | |
| | | | |
Total Short-Term Investments (Cost $80,856,527) | | | | | | | | | | | | | | | 80,858,079 | |
| | | | | | | | | | | | | | | | |
| | | | | | | | |
| Total investments in securities (Cost $2,263,056,239) | | | 100.31 | % | | | 4,689,882,484 | |
| | |
Other assets and liabilities, net | | | (0.31 | ) | | | (14,370,406 | ) |
| | | | | | | | |
| Total net assets | | | 100.00 | % | | $ | 4,675,512,078 | |
| | | | | | | | |
| † | Non-income-earning security |
| « | All or a portion of this security is on loan. |
| (l) | The issuer of the security is an affiliated person of the Fund as defined in the Investment Company Act of 1940. |
| (r) | The investment is anon-registered investment company purchased with cash collateral received from securities on loan. |
| (u) | The rate represents the7-day annualized yield at period end. |
Abbreviations:
| ADR | American depositary receipt |
14 | Wells Fargo Growth Fund
The accompanying notes are an integral part of these financial statements.
Portfolio of investments—July 31, 2019
Investments in Affiliates
An affiliated investment is an investment in which the Fund owns at least 5% of the outstanding voting shares of the issuer or as a result of other relationships, such as the Fund and the issuer having the same investment manager. Transactions with issuers that were either affiliated persons of the Fund at the beginning of the period or the end of the period were as follows:
| | | | | | | | | | | | | | | | | | | | | | | | | | | | | | | | | | | | |
| | | Shares,
beginning of
period | | | Shares
purchased | | | Shares
sold | | | Shares,
end of
period | | | Net
realized
gains
(losses) | | | Net
change in
unrealized
gains
(losses) | | | Income
from
affiliated
securities | | | Value,
end
of period | | | % of
net
assets | |
Common Stock | | | | | | | | | | | | | | | | | | | | | | | | | | | | | | | | | | | | |
Industrials | | | | | | | | | | | | | | | | | | | | | | | | | | | | | | | | | | | | |
Machinery | | | | | | | | | | | | | | | | | | | | | | | | | | | | | | | | | | | | |
Milacron Holdings Corporation † | | | 3,945,835 | | | | 252,200 | | | | 2,232,900 | | | | 1,965,135 | * | | $ | (7,905,476 | ) | | $ | (14,593,989 | ) | | $ | 0 | | | $ | 0 | * | | | 0.00 | %* |
Short-Term Investments | | | | | | | | | | | | | | | | | | | | | | | | | | | | | | | | | | | | |
Investment Companies | | | | | | | | | | | | | �� | | | | | | | | | | | | | | | | | | | | | | | |
Securities Lending Cash Investments LLC | | | 149,251,008 | | | | 1,128,448,585 | | | | 1,258,957,515 | | | | 18,742,078 | | | | 11,560 | | | | (2,788 | ) | | | 4,959,005 | # | | | 18,743,952 | | | | | |
Wells Fargo Government Money Market Fund Select Class | | | 17,742,561 | | | | 744,173,549 | | | | 699,801,983 | | | | 62,114,127 | | | | 0 | | | | 0 | | | | 625,867 | | | | 62,114,127 | | | | | |
| | | | | | | | | | | | | | | | | | | | | | | | | | | | | | | | | | | | |
| | | | | | | | | | | | | | | | | | | | | | | | | | | | | | | 80,858,079 | | | | 1.73 | % |
| | | | | | | | | | | | | | | | | | | | | | | | | | | | | | | | | | | | |
| | | | | | | | | | | | | | | | | | $ | (7,893,916 | ) | | $ | (14,596,777 | ) | | $ | 5,584,872 | | | $ | 80,858,079 | | | | 1.73 | % |
| | | | | | | | | | | | | | | | | | | | | | | | | | | | | | | | | | | | |
| † | Non-income-earning security |
| * | No longer an affiliate of the Fund at the end of the period |
| # | Amount shown represents income before fees and rebates |
The accompanying notes are an integral part of these financial statements.
Wells Fargo Growth Fund | 15
Statement of assets and liabilities—July 31, 2019
| | | | |
| | | | |
| |
Assets | | | | |
Investments in unaffiliated securities (including $17,912,500 of securities loaned), at value (cost $2,182,199,712) | | $ | 4,609,024,405 | |
Investments in affiliated securities, at value (cost $80,856,527) | | | 80,858,079 | |
Receivable for investments sold | | | 22,348,970 | |
Receivable for Fund shares sold | | | 2,243,613 | |
Receivable for dividends | | | 771,441 | |
Receivable for securities lending income, net | | | 12,653 | |
| | | | |
Total assets | | | 4,715,259,161 | |
| | | | |
| |
Liabilities | | | | |
Payable upon receipt of securities loaned | | | 18,725,395 | |
Payable for investments purchased | | | 13,625,953 | |
Management fee payable | | | 2,581,308 | |
Payable for Fund shares redeemed | | | 2,471,591 | |
Administration fees payable | | | 649,539 | |
Distribution fee payable | | | 101,346 | |
Trustees’ fees and expenses payable | | | 4,300 | |
Accrued expenses and other liabilities | | | 1,587,651 | |
| | | | |
Total liabilities | | | 39,747,083 | |
| | | | |
Total net assets | | $ | 4,675,512,078 | |
| | | | |
| |
Net assets consist of | | | | |
Paid-in capital | | $ | 1,854,006,983 | |
Total distributable earnings | | | 2,821,505,095 | |
| | | | |
Total net assets | | $ | 4,675,512,078 | |
| | | | |
| |
Computation of net asset value and offering price per share | | | | |
Net assets – Class A | | $ | 2,116,542,230 | |
Shares outstanding – Class A1 | | | 59,523,111 | |
Net asset value per share – Class A | | | $35.56 | |
Maximum offering price per share – Class A2 | | | $37.73 | |
Net assets – Class C | | $ | 156,056,111 | |
Shares outstanding – Class C1 | | | 6,032,793 | |
Net asset value per share – Class C | | | $25.87 | |
Net assets – Class R6 | | $ | 337,260,345 | |
Shares outstanding – Class R61 | | | 7,356,924 | |
Net asset value per share – Class R6 | | | $45.84 | |
Net assets – Administrator Class | | $ | 561,900,448 | |
Shares outstanding – Administrator Class1 | | | 13,514,295 | |
Net asset value per share – Administrator Class | | | $41.58 | |
Net assets – Institutional Class | | $ | 1,503,752,944 | |
Shares outstanding – Institutional Class1 | | | 32,907,982 | |
Net asset value per share – Institutional Class | | | $45.70 | |
| 1 | The Fund has an unlimited number of authorized shares. |
| 2 | Maximum offering price is computed as 100/94.25 of net asset value. On investments of $50,000 or more, the offering price is reduced. |
The accompanying notes are an integral part of these financial statements.
16 | Wells Fargo Growth Fund
Statement of operations—year ended July 31, 2019
| | | | |
| | | | |
| |
Investment income | | | | |
Dividends (net of foreign withholding taxes of $87,333) | | $ | 30,313,745 | |
Income from affiliated securities | | | 1,495,379 | |
| | | | |
Total investment income | | | 31,809,124 | |
| | | | |
| |
Expenses | | | | |
Management fee | | | 31,238,968 | |
Administration fees | | | | |
Class A | | | 4,268,389 | |
Class C | | | 341,676 | |
Class R6 | | | 83,693 | |
Administrator Class | | | 672,753 | |
Institutional Class | | | 1,909,274 | |
Shareholder servicing fees | | | | |
Class A | | | 5,081,415 | |
Class C | | | 406,757 | |
Administrator Class | | | 1,292,686 | |
Distribution fee | | | | |
Class C | | | 1,220,250 | |
Custody and accounting fees | | | 157,293 | |
Professional fees | | | 50,954 | |
Registration fees | | | 123,001 | |
Shareholder report expenses | | | 249,999 | |
Trustees’ fees and expenses | | | 22,013 | |
Other fees and expenses | | | 85,512 | |
| | | | |
Total expenses | | | 47,204,633 | |
Less: Fee waivers and/or expense reimbursements | | | (2,583,337 | ) |
| | | | |
Net expenses | | | 44,621,296 | |
| | | | |
Net investment loss | | | (12,812,172 | ) |
| | | | |
| |
Realized and unrealized gains (losses) on investments | | | | |
Net realized gains (losses) on | | | | |
Unaffiliated securities | | | 640,616,814 | |
Affiliated securities | | | (7,893,916 | ) |
| | | | |
Net realized gains on investments | | | 632,722,898 | |
| | | | |
| |
Net change in unrealized gains (losses) on | | | | |
Unaffiliated securities | | | (48,691,469 | ) |
Affiiliated securities | | | (14,596,777 | ) |
| | | | |
Net change in unrealized gains (losses) on investments | | | (63,288,246 | ) |
| | | | |
Net realized and unrealized gains (losses) on investments | | | 569,434,652 | |
| | | | |
Net increase in net assets resulting from operations | | $ | 556,622,480 | |
| | | | |
The accompanying notes are an integral part of these financial statements.
Wells Fargo Growth Fund | 17
Statement of changes in net assets
| | | | | | | | | | | | | | | | |
| | | Year ended
July 31, 2019 | | | Year ended
July 31, 20181 | |
| | | | |
Operations | | | | | | | | | | | | | | | | |
Net investment loss | | | | | | $ | (12,812,172 | ) | | | | | | $ | (13,576,427 | ) |
Net realized gains on investments | | | | | | | 632,722,898 | | | | | | | | 745,731,324 | |
Net change in unrealized gains (losses) on investments | | | | | | | (63,288,246 | ) | | | | | | | 402,450,351 | |
| | | | |
Net increase in net assets resulting from operations | | | | | | | 556,622,480 | | | | | | | | 1,134,605,248 | |
| | | | |
| | | | |
Distributions to shareholders from net investment income and net realized gains | | | | | | | | | | | | | | | | |
Class A | | | | | | | (355,696,811 | ) | | | | | | | (505,431,285 | ) |
Class C | | | | | | | (37,666,442 | ) | | | | | | | (57,934,182 | ) |
Class R6 | | | | | | | (36,585,868 | ) | | | | | | | (16,966,960 | ) |
Administrator Class | | | | | | | (78,768,918 | ) | | | | | | | (138,040,210 | ) |
Institutional Class | | | | | | | (211,847,451 | ) | | | | | | | (379,819,630 | ) |
| | | | |
Total distributions to shareholders | | | | | | | (720,565,490 | ) | | | | | | | (1,098,192,267 | ) |
| | | | |
| | | | |
Capital share transactions | | | Shares | | | | | | | | Shares | | | | | |
Proceeds from shares sold | | | | | | | | | | | | | | | | |
Class A | | | 2,458,750 | | | | 81,981,928 | | | | 2,597,711 | | | | 97,664,924 | |
Class C | | | 746,761 | | | | 17,066,886 | | | | 567,969 | | | | 15,881,145 | |
Class R6 | | | 2,698,823 | | | | 114,509,957 | | | | 4,402,138 | | | | 197,214,825 | |
Administrator Class | | | 2,744,478 | | | | 107,374,673 | | | | 2,015,636 | | | | 86,044,136 | |
Institutional Class | | | 5,400,449 | | | | 232,172,883 | | | | 8,063,218 | | | | 384,247,586 | |
| | | | |
| | | | | | | 553,106,327 | | | | | | | | 781,052,616 | |
| | | | |
Reinvestment of distributions | | | | | | | | | | | | | | | | |
Class A | | | 12,007,593 | | | | 343,056,930 | | | | 14,511,944 | | | | 482,812,377 | |
Class C | | | 1,566,352 | | | | 32,721,099 | | | | 1,880,250 | | | | 49,281,340 | |
Class R6 | | | 995,813 | | | | 36,576,208 | | | | 415,977 | | | | 16,959,366 | |
Administrator Class | | | 2,333,920 | | | | 77,882,902 | | | | 3,626,546 | | | | 136,757,066 | |
Institutional Class | | | 5,586,200 | | | | 204,566,633 | | | | 9,008,188 | | | | 366,543,153 | |
| | | | |
| | | | | | | 694,803,772 | | | | | | | | 1,052,353,302 | |
| | | | |
Payment for shares redeemed | | | | | | | | | | | | | | | | |
Class A | | | (10,353,405 | ) | | | (346,975,927 | ) | | | (10,001,358 | ) | | | (381,655,936 | ) |
Class C | | | (2,391,955 | ) | | | (58,387,097 | ) | | | (2,374,317 | ) | | | (73,235,128 | ) |
Class R6 | | | (1,446,729 | ) | | | (63,083,744 | ) | | | (758,315 | ) | | | (34,584,223 | ) |
Administrator Class | | | (4,421,943 | ) | | | (173,395,539 | ) | | | (7,153,909 | ) | | | (302,587,215 | ) |
Institutional Class | | | (12,123,280 | ) | | | (516,616,632 | ) | | | (18,199,975 | ) | | | (827,075,266 | ) |
| | | | |
| | | | | | | (1,158,458,939 | ) | | | | | | | (1,619,137,768 | ) |
| | | | |
Net increase in net assets resulting from capital share transactions | | | | | | | 89,451,160 | | | | | | | | 214,268,150 | |
| | | | |
Total increase (decrease) in net assets | | | | | | | (74,491,850 | ) | | | | | | | 250,681,131 | |
| | | | |
| | | | |
Net assets | | | | | | | | | | | | | | | | |
Beginning of period | | | | | | | 4,750,003,928 | | | | | | | | 4,499,322,797 | |
| | | | |
End of period | | | | | | $ | 4,675,512,078 | | | | | | | $ | 4,750,003,928 | |
| | | | |
| 1 | Effective for all filings after November 4, 2018, the SEC prospectively eliminated the requirement to parenthetically disclose undistributed net investment income at the end of the period and permitted the aggregation of distributions, with the exception of tax basis returns of capital. Undistributed net investment income at July 31, 2018 was $0. The disaggregated distributions information for the year ended July 31, 2018 is included in Note 8,Distributions to Shareholders, in the notes to the financial statements. |
The accompanying notes are an integral part of these financial statements.
18 | Wells Fargo Growth Fund
Financial highlights
(For a share outstanding throughout each period)
| | | | | | | | | | | | | | | | | | | | |
| | | Year ended July 31 | |
| CLASS A | | 2019 | | | 2018 | | | 2017 | | | 2016 | | | 2015 | |
Net asset value, beginning of period | | | $38.67 | | | | $40.38 | | | | $42.28 | | | | $49.50 | | | | $49.99 | |
Net investment loss | | | (0.13 | ) | | | (0.12 | ) | | | (0.19 | )1 | | | (0.20 | )1 | | | (0.29 | )1 |
Net realized and unrealized gains (losses) on investments | | | 3.73 | | | | 9.49 | | | | 5.61 | | | | (0.99 | ) | | | 7.03 | |
| | | | | | | | | | | | | | | | | | | | |
Total from investment operations | | | 3.60 | | | | 9.37 | | | | 5.42 | | | | (1.19 | ) | | | 6.74 | |
Distributions to shareholders from | | | | | | | | | | | | | | | | | | | | |
Net realized gains | | | (6.71 | ) | | | (11.08 | ) | | | (7.32 | ) | | | (6.03 | ) | | | (7.23 | ) |
Net asset value, end of period | | | $35.56 | | | | $38.67 | | | | $40.38 | | | | $42.28 | | | | $49.50 | |
Total return2 | | | 13.55 | % | | | 27.66 | % | | | 15.95 | % | | | (1.69 | )% | | | 15.01 | % |
Ratios to average net assets (annualized) | | | | | | | | | | | | | | | | | | | | |
Gross expenses | | | 1.18 | % | | | 1.18 | % | | | 1.17 | % | | | 1.15 | % | | | 1.18 | % |
Net expenses | | | 1.16 | % | | | 1.16 | % | | | 1.16 | % | | | 1.14 | % | | | 1.18 | % |
Net investment loss | | | (0.45 | )% | | | (0.45 | )% | | | (0.49 | )% | | | (0.49 | )% | | | (0.59 | )% |
Supplemental data | | | | | | | | | | | | | | | | | | | | |
Portfolio turnover rate | | | 39 | % | | | 37 | % | | | 42 | % | | | 38 | % | | | 35 | % |
Net assets, end of period (000s omitted) | | | $2,116,542 | | | | $2,142,855 | | | | $1,950,551 | | | | $2,582,955 | | | | $1,465,643 | |
| 1 | Calculated based upon average shares outstanding |
| 2 | Total return calculations do not include any sales charges. |
The accompanying notes are an integral part of these financial statements.
Wells Fargo Growth Fund | 19
Financial highlights
(For a share outstanding throughout each period)
| | | | | | | | | | | | | | | | | | | | |
| | | Year ended July 31 | |
| CLASS C | | 2019 | | | 2018 | | | 2017 | | | 2016 | | | 2015 | |
Net asset value, beginning of period | | | $30.33 | | | | $34.05 | | | | $37.07 | | | | $44.51 | | | | $45.95 | |
Net investment loss | | | (0.31 | )1 | | | (0.33 | ) | | | (0.41 | )1 | | | (0.46 | )1 | | | (0.60 | )1 |
Net realized and unrealized gains (losses) on investments | | | 2.56 | | | | 7.69 | | | | 4.71 | | | | (0.95 | ) | | | 6.39 | |
| | | | | | | | | | | | | | | | | | | | |
Total from investment operations | | | 2.25 | | | | 7.36 | | | | 4.30 | | | | (1.41 | ) | | | 5.79 | |
Distributions to shareholders from | | | | | | | | | | | | | | | | | | | | |
Net realized gains | | | (6.71 | ) | | | (11.08 | ) | | | (7.32 | ) | | | (6.03 | ) | | | (7.23 | ) |
Net asset value, end of period | | | $25.87 | | | | $30.33 | | | | $34.05 | | | | $37.07 | | | | $44.51 | |
Total return2 | | | 12.68 | % | | | 26.73 | % | | | 15.05 | % | | | (2.44 | )% | | | 14.16 | % |
Ratios to average net assets (annualized) | | | | | | | | | | | | | | | | | | | | |
Gross expenses | | | 1.93 | % | | | 1.93 | % | | | 1.92 | % | | | 1.90 | % | | | 1.93 | % |
Net expenses | | | 1.91 | % | | | 1.91 | % | | | 1.91 | % | | | 1.89 | % | | | 1.93 | % |
Net investment loss | | | (1.19 | )% | | | (1.19 | )% | | | (1.23 | )% | | | (1.24 | )% | | | (1.34 | )% |
Supplemental data | | | | | | | | | | | | | | | | | | | | |
Portfolio turnover rate | | | 39 | % | | | 37 | % | | | 42 | % | | | 38 | % | | | 35 | % |
Net assets, end of period (000s omitted) | | | $156,056 | | | | $185,346 | | | | $205,607 | | | | $321,032 | | | | $465,833 | |
| 1 | Calculated based upon average shares outstanding |
| 2 | Total return calculations do not include any sales charges. |
The accompanying notes are an integral part of these financial statements.
20 | Wells Fargo Growth Fund
Financial highlights
(For a share outstanding throughout each period)
| | | | | | | | | | | | | | | | |
| | | Year ended July 31 | |
| CLASS R6 | | 2019 | | | 2018 | | | 2017 | | | 20161 | |
Net asset value, beginning of period | | | $47.53 | | | | $47.13 | | | | $47.90 | | | | $48.97 | |
Net investment income (loss) | | | 0.00 | 2,3 | | | (0.01 | )2 | | | (0.02 | )2 | | | (0.02 | ) |
Net realized and unrealized gains (losses) on investments | | | 5.02 | | | | 11.49 | | | | 6.57 | | | | 4.98 | |
| | | | | | | | | | | | | | | | |
Total from investment operations | | | 5.02 | | | | 11.48 | | | | 6.55 | | | | 4.96 | |
Distributions to shareholders from | | | | | | | | | | | | | | | | |
Net realized gains | | | (6.71 | ) | | | (11.08 | ) | | | (7.32 | ) | | | (6.03 | ) |
Net asset value, end of period | | | $45.84 | | | | $47.53 | | | | $47.13 | | | | $47.90 | |
Total return4 | | | 14.06 | % | | | 28.26 | % | | | 16.49 | % | | | 10.89 | % |
Ratios to average net assets (annualized) | | | | | | | | | | | | | | | | |
Gross expenses | | | 0.75 | % | | | 0.75 | % | | | 0.74 | % | | | 0.74 | % |
Net expenses | | | 0.70 | % | | | 0.70 | % | | | 0.70 | % | | | 0.70 | % |
Net investment income (loss) | | | 0.00 | % | | | (0.02 | )% | | | (0.05 | )% | | | (0.23 | )% |
Supplemental data | | | | | | | | | | | | | | | | |
Portfolio turnover rate | | | 39 | % | | | 37 | % | | | 42 | % | | | 38 | % |
Net assets, end of period (000s omitted) | | | $337,260 | | | | $242,838 | | | | $49,454 | | | | $30,906 | |
| 1 | For the period from September 30, 2015 (commencement of class operations) to July 31, 2016 |
| 2 | Calculated based upon average shares outstanding |
| 3 | Amount is less than $0.005. |
| 4 | Returns for periods of less than one year are not annualized. |
The accompanying notes are an integral part of these financial statements.
Wells Fargo Growth Fund | 21
Financial highlights
(For a share outstanding throughout each period)
| | | | | | | | | | | | | | | | | | | | |
| | | Year ended July 31 | |
| ADMINISTRATOR CLASS | | 2019 | | | 2018 | | | 2017 | | | 2016 | | | 2015 | |
Net asset value, beginning of period | | | $43.89 | | | | $44.40 | | | | $45.66 | | | | $52.86 | | | | $52.80 | |
Net investment loss | | | (0.10 | )1 | | | (0.11 | )1 | | | (0.11 | )1 | | | (0.14 | )1 | | | (0.20 | )1 |
Net realized and unrealized gains (losses) on investments | | | 4.50 | | | | 10.68 | | | | 6.17 | | | | (1.03 | ) | | | 7.49 | |
| | | | | | | | | | | | | | | | | | | | |
Total from investment operations | | | 4.40 | | | | 10.57 | | | | 6.06 | | | | (1.17 | ) | | | 7.29 | |
Distributions to shareholders from | | | | | | | | | | | | | | | | | | | | |
Net realized gains | | | (6.71 | ) | | | (11.08 | ) | | | (7.32 | ) | | | (6.03 | ) | | | (7.23 | ) |
Net asset value, end of period | | | $41.58 | | | | $43.89 | | | | $44.40 | | | | $45.66 | | | | $52.86 | |
Total return | | | 13.78 | % | | | 27.90 | % | | | 16.20 | % | | | (1.53 | )% | | | 15.28 | % |
Ratios to average net assets (annualized) | | | | | | | | | | | | | | | | | | | | |
Gross expenses | | | 1.10 | % | | | 1.10 | % | | | 1.09 | % | | | 1.07 | % | | | 1.02 | % |
Net expenses | | | 0.96 | % | | | 0.96 | % | | | 0.96 | % | | | 0.96 | % | | | 0.96 | % |
Net investment loss | | | (0.25 | )% | | | (0.24 | )% | | | (0.27 | )% | | | (0.31 | )% | | | (0.37 | )% |
Supplemental data | | | | | | | | | | | | | | | | | | | | |
Portfolio turnover rate | | | 39 | % | | | 37 | % | | | 42 | % | | | 38 | % | | | 35 | % |
Net assets, end of period (000s omitted) | | | $561,900 | | | | $564,391 | | | | $637,987 | | | | $1,528,288 | | | | $2,349,359 | |
| 1 | Calculated based upon average shares outstanding |
The accompanying notes are an integral part of these financial statements.
22 | Wells Fargo Growth Fund
Financial highlights
(For a share outstanding throughout each period)
| | | | | | | | | | | | | | | | | | | | |
| | | Year ended July 31 | |
| INSTITUTIONAL CLASS | | 2019 | | | 2018 | | | 2017 | | | 2016 | | | 2015 | |
Net asset value, beginning of period | | | $47.43 | | | | $47.07 | | | | $47.87 | | | | $54.99 | | | | $54.54 | |
Net investment loss | | | (0.01 | )1 | | | (0.02 | )1 | | | (0.04 | )1 | | | (0.05 | )1 | | | (0.09 | )1 |
Net realized and unrealized gains (losses) on investments | | | 4.99 | | | | 11.46 | | | | 6.56 | | | | (1.04 | ) | | | 7.77 | |
| | | | | | | | | | | | | | | | | | | | |
Total from investment operations | | | 4.98 | | | | 11.44 | | | | 6.52 | | | | (1.09 | ) | | | 7.68 | |
Distributions to shareholders from | | | | | | | | | | | | | | | | | | | | |
Net realized gains | | | (6.71 | ) | | | (11.08 | ) | | | (7.32 | ) | | | (6.03 | ) | | | (7.23 | ) |
Net asset value, end of period | | | $45.70 | | | | $47.43 | | | | $47.07 | | | | $47.87 | | | | $54.99 | |
Total return | | | 14.00 | % | | | 28.21 | % | | | 16.44 | % | | | (1.31 | )% | | | 15.53 | % |
Ratios to average net assets (annualized) | | | | | | | | | | | | | | | | | | | | |
Gross expenses | | | 0.85 | % | | | 0.85 | % | | | 0.84 | % | | | 0.82 | % | | | 0.76 | % |
Net expenses | | | 0.75 | % | | | 0.75 | % | | | 0.75 | % | | | 0.75 | % | | | 0.75 | % |
Net investment loss | | | (0.03 | )% | | | (0.03 | )% | | | (0.08 | )% | | | (0.10 | )% | | | (0.17 | )% |
Supplemental data | | | | | | | | | | | | | | | | | | | | |
Portfolio turnover rate | | | 39 | % | | | 37 | % | | | 42 | % | | | 38 | % | | | 35 | % |
Net assets, end of period (000s omitted) | | | $1,503,753 | | | | $1,614,575 | | | | $1,655,724 | | | | $2,398,134 | | | | $3,863,196 | |
| 1 | Calculated based upon average shares outstanding |
The accompanying notes are an integral part of these financial statements.
Wells Fargo Growth Fund | 23
Notes to financial statements
1. ORGANIZATION
Wells Fargo Funds Trust (the “Trust”), a Delaware statutory trust organized on March 10, 1999, is anopen-end management investment company registered under the Investment Company Act of 1940, as amended (the “1940 Act”). As an investment company, the Trust follows the accounting and reporting guidance in Financial Accounting Standards Board (“FASB”)Accounting Standards Codification Topic 946, Financial Services – Investment Companies. These financial statements report on the Wells Fargo Growth Fund (the “Fund”) which is a diversified series of the Trust.
2. SIGNIFICANT ACCOUNTING POLICIES
The following significant accounting policies, which are consistently followed in the preparation of the financial statements of the Fund, are in conformity with U.S. generally accepted accounting principles which require management to make estimates and assumptions that affect the reported amounts of assets and liabilities, disclosure of contingent assets and liabilities at the date of the financial statements, and the reported amounts of revenues and expenses during the reporting period. Actual results could differ from those estimates.
Securities valuation
All investments are valued each business day as of the close of regular trading on the New York Stock Exchange (generally 4 p.m. Eastern Time), although the Fund may deviate from this calculation time under unusual or unexpected circumstances.
Equity securities that are listed on a foreign or domestic exchange or market are valued at the official closing price or, if none, the last sales price. If no sale occurs on the principal exchange or market that day, a fair value price will be determined in accordance with the Fund’s Valuation Procedures.
Investments in registeredopen-end investment companies are valued at net asset value. Interests innon-registered investment companies that are redeemable at net asset value are fair valued normally at net asset value.
Investments which are not valued using any of the methods discussed above are valued at their fair value, as determined in good faith by the Board of Trustees of the Fund. The Board of Trustees has established a Valuation Committee comprised of the Trustees and has delegated to it the authority to take any actions regarding the valuation of portfolio securities that the Valuation Committee deems necessary or appropriate, including determining the fair value of portfolio securities, unless the determination has been delegated to the Wells Fargo Asset Management Pricing Committee at Wells Fargo Funds Management, LLC (“Funds Management”). The Board of Trustees retains the authority to make or ratify any valuation decisions or approve any changes to the Valuation Procedures as it deems appropriate. On a quarterly basis, the Board of Trustees receives reports on any valuation actions taken by the Valuation Committee or the Wells Fargo Asset Management Pricing Committee which may include items for ratification.
Foreign currency translation
The accounting records of the Fund are maintained in U.S. dollars. The values of other assets and liabilities denominated in foreign currencies are translated into U.S. dollars at rates provided by an independent foreign currency pricing source at a time each business day specified by the Wells Fargo Asset Management Pricing Committee. Purchases and sales of securities, and income and expenses are converted at the rate of exchange on the respective dates of such transactions. Net realized foreign exchange gains or losses arise from sales of foreign currencies, currency gains or losses realized between the trade and settlement dates on securities transactions, and the difference between the amounts of dividends, interest and foreign withholding taxes recorded and the U.S. dollar equivalent of the amounts actually paid or received. Net unrealized foreign exchange gains and losses arise from changes in the fair value of assets and liabilities other than investments in securities resulting from changes in exchange rates. The changes in net assets arising from changes in exchange rates of securities and the changes in net assets resulting from changes in market prices of securities are not separately presented. Such changes are included in net realized and unrealized gains or losses from investments.
Securities lending
The Fund may lend its securities from time to time in order to earn additional income in the form of fees or interest on securities received as collateral or the investment of any cash received as collateral. When securities are on loan, the Fund receives interest or dividends on those securities. Cash collateral received in connection with its securities lending transactions is invested in Securities Lending Cash Investments, LLC (the “Securities Lending Fund”). Investments in Securities Lending Fund are valued at the evaluated bid price provided by an independent pricing service. Income earned from investment in the Securities Lending Fund (net of fees and rebates), if any, is included in income from affiliated securities on the Statement of Operations.
In a securities lending transaction, the net asset value of the Fund will be affected by an increase or decrease in the value of the securities loaned and by an increase or decrease in the value of the instrument in which collateral is invested. The amount of securities lending activity undertaken by the Fund fluctuates from time to time. The Fund has the right under the lending agreement to recover the securities from the borrower on demand. In the event of default or bankruptcy by the borrower, the Fund may be prevented from recovering the loaned securities or gaining access to the collateral or may experience delays or
24 | Wells Fargo Growth Fund
Notes to financial statements
costs in doing so. In such an event, the terms of the agreement allows the unaffiliated securities lending agent to use the collateral to purchase replacement securities on behalf of the Fund or pay the Fund the market value of the loaned securities. The Fund will bear the risk of loss with respect to depreciation of its investment of the cash collateral.
Security transactions and income recognition
Securities transactions are recorded on a trade date basis. Realized gains or losses are recorded on the basis of identified cost.
Dividend income is recognized on theex-dividend date. Dividend income is recorded net of foreign taxes withheld where recovery of such taxes is not assured.
Distributions to shareholders
Distributions to shareholders from net investment income and any net realized gains are recorded on theex-dividend date and paid at least annually. Such distributions are determined in accordance with income tax regulations and may differ from U.S. generally accepted accounting principles. Dividend sources are estimated at the time of declaration. The tax character of distributions is determined as of the Fund’s fiscal year end. Therefore, a portion of the Fund’s distributions made prior to the Fund’s fiscal year end may be categorized as a tax return of capital at year end.
Federal and other taxes
The Fund intends to continue to qualify as a regulated investment company by distributing substantially all of its investment company taxable income and any net realized capital gains (after reduction for capital loss carryforwards) sufficient to relieve it from all, or substantially all, federal income taxes. Accordingly, no provision for federal income taxes was required.
The Fund’s income and federal excise tax returns and all financial records supporting those returns for the prior three fiscal years are subject to examination by the federal and Delaware revenue authorities. Management has analyzed the Fund’s tax positions taken on federal, state, and foreign tax returns for all open tax years and does not believe that there are any uncertain tax positions that require recognition of a tax liability.
As of July 31, 2019, the aggregate cost of all investments for federal income tax purposes was $2,267,602,076 and the unrealized gains (losses) consisted of:
| | | | |
| |
Gross unrealized gains | | $ | 2,440,543,528 | |
| |
Gross unrealized losses | | | (18,263,120 | ) |
| |
Net unrealized gains | | $ | 2,422,280,408 | |
Reclassifications are made to the Fund’s capital accounts for permanent tax differences to reflect income and gains available for distribution (or available capital loss carryforwards) under federal income tax regulations. U.S. generally accepted accounting principles require that certain components of net assets be adjusted to reflect permanent differences between financial and tax reporting. These reclassifications have no effect on net assets or net asset values per share. The primary permanent difference causing such reclassification is due to net operating losses. At July 31, 2019, as a result of permanentbook-to-tax differences, the following reclassification adjustments were made on the Statement of Assets and Liabilities:
| | |
| Paid-in capital | | Total distributable
earnings |
| |
$(3,705,012) | | $3,705,012 |
As of July 31, 2019, the Fund had a qualified late-year ordinary loss of $9,108,551 which will be recognized on the first day of the following fiscal year.
Class allocations
The separate classes of shares offered by the Fund differ principally in applicable sales charges, distribution, shareholder servicing, and administration fees. Class specific expenses are charged directly to that share class. Investment income, common fund-level expenses, and realized and unrealized gains (losses) on investments are allocated daily to each class of shares based on the relative proportion of net assets of each class.
3. FAIR VALUATION MEASUREMENTS
Fair value measurements of investments are determined within a framework that has established a fair value hierarchy based upon the various data inputs utilized in determining the value of the Fund’s investments. The three-level hierarchy gives the highest priority to unadjusted quoted prices in active markets for identical assets or liabilities (Level 1) and the lowest priority to unobservable inputs (Level 3). The Fund’s investments are classified within the fair value hierarchy based on the lowest level of input that is significant to the fair value measurement. The inputs are summarized into three broad levels as follows:
Wells Fargo Growth Fund | 25
Notes to financial statements
| ∎ | | Level 1 – quoted prices in active markets for identical securities |
| ∎ | | Level 2 – other significant observable inputs (including quoted prices for similar securities, interest rates, prepayment speeds, credit risk, etc.) |
| ∎ | | Level 3 – significant unobservable inputs (including the Fund’s own assumptions in determining the fair value of investments) |
The inputs or methodologies used for valuing investments in securities are not necessarily an indication of the risk associated with investing in those securities.
The following is a summary of the inputs used in valuing the Fund’s assets and liabilities as of July 31, 2019:
| | | | | | | | | | | | | | | | |
| | | | |
| | | Quoted prices (Level 1) | | | Other significant
observable inputs
(Level 2) | | | Significant
unobservable inputs (Level 3) | | | Total | |
| | | | |
Assets | | | | | | | | | | | | | | | | |
Investments in: | | | | | | | | | | | | | | | | |
| | | | |
Common stocks | | | | | | | | | | | | | | | | |
| | | | |
Communication services | | $ | 410,662,414 | | | $ | 0 | | | $ | 0 | | | $ | 410,662,414 | |
| | | | |
Consumer discretionary | | | 868,972,997 | | | | 0 | | | | 0 | | | | 868,972,997 | |
| | | | |
Consumer staples | | | 120,531,710 | | | | 0 | | | | 0 | | | | 120,531,710 | |
| | | | |
Energy | | | 18,739,908 | | | | 0 | | | | 0 | | | | 18,739,908 | |
| | | | |
Financials | | | 190,803,163 | | | | 0 | | | | 0 | | | | 190,803,163 | |
| | | | |
Health care | | | 522,902,657 | | | | 0 | | | | 0 | | | | 522,902,657 | |
| | | | |
Industrials | | | 595,311,718 | | | | 0 | | | | 0 | | | | 595,311,718 | |
| | | | |
Information technology | | | 1,799,844,093 | | | | 0 | | | | 0 | | | | 1,799,844,093 | |
| | | | |
Materials | | | 81,255,745 | | | | 0 | | | | 0 | | | | 81,255,745 | |
| | | | |
Short-term investments | | | | | | | | | | | | | | | | |
| | | | |
Investment companies | | | 80,858,079 | | | | 0 | | | | 0 | | | | 80,858,079 | |
| | | | |
Total assets | | $ | 4,689,882,484 | | | $ | 0 | | | $ | 0 | | | $ | 4,689,882,484 | |
Additional sector, industry or geographic detail is included in the Portfolio of Investments.
For the year ended July 31, 2019, the Fund did not have any transfers into/out of Level 3.
4. TRANSACTIONS WITH AFFILIATES
Management fee
Funds Management, an indirect wholly owned subsidiary of Wells Fargo & Company (“Wells Fargo”), is the manager of the Fund and provides advisory and fund-level administrative services under an investment management agreement. Under the investment management agreement, Funds Management is responsible for, among other services, implementing the investment objectives and strategies of the Fund, supervising the subadviser and providing fund-level administrative services in connection with the Fund’s operations. As compensation for its services under the investment management agreement, Funds Management is entitled to receive a management fee at the following annual rate based on the Fund’s average daily net assets:
| | |
| |
| Average daily net assets | | Management fee |
| |
First $500 million | | 0.800% |
| |
Next $500 million | | 0.750 |
| |
Next $1 billion | | 0.700 |
| |
Next $2 billion | | 0.675 |
| |
Next $1 billion | | 0.650 |
| |
Next $3 billion | | 0.640 |
| |
Next $2 billion | | 0.615 |
| |
Next $2 billion | | 0.605 |
| |
Next $4 billion | | 0.580 |
| |
Over $16 billion | | 0.555 |
26 | Wells Fargo Growth Fund
Notes to financial statements
For the year ended July 31, 2019, the management fee was equivalent to an annual rate of 0.70% of the Fund’s average daily net assets.
Funds Management has retained the services of a subadviser to provide daily portfolio management to the Fund. The fee for subadvisory services is borne by Funds Management. Wells Capital Management Incorporated (“WellsCap”), an affiliated of Funds Management and an indirect wholly owned subsidiary of Wells Fargo, is the subadviser to the Fund and is entitled to receive a fee from Funds Management at an annual rate starting at 0.45% and declining to 0.30% as the average daily net assets of the Fund increase.
Administration fees
Under a class-level administration agreement, Funds Management provides class-level administrative services to the Fund, which includes paying fees and expenses for services provided by the transfer agent,sub-transfer agents, omnibus account servicers and record-keepers. As compensation for its services under the class-level administration agreement, Funds Management receives an annual fee which is calculated based on the average daily net assets of each class as follows:
| | | | |
| |
| | | Class-level
administration fee | |
| |
Class A, Class C | | | 0.21 | % |
| |
Class R6 | | | 0.03 | |
| |
Administrator Class, Institutional Class | | | 0.13 | |
Waivers and/or expense reimbursements
Funds Management has contractually waived and/or reimbursed management and administration fees to the extent necessary to maintain certain net operating expense ratios for the Fund. When each class of the Fund has exceeded its expense cap, Funds Management has waived fees and/or reimbursed expenses from fund-level expenses on a proportionate basis and then from class specific expenses. When only certain classes exceed their expense caps, waivers and/or reimbursements are applied against class specific expenses before fund-level expenses. Funds Management has committed through November 30, 2019 to waive fees and/or reimburse expenses to the extent necessary to cap the Fund’s expenses at 1.16% for Class A shares, 1.91% for Class C shares, 0.70% for Class R6 shares, 0.96% for Administrator Class shares, and 0.75% for Institutional Class shares. Prior to or after the commitment expiration date, the cap may be increased or the commitment to maintain the cap may be terminated only with the approval of the Board of Trustees.
Distribution fee
The Trust has adopted a distribution plan for Class C shares of the Fund pursuant to Rule12b-1 under the 1940 Act. A distribution fee is charged to Class C shares and paid to Wells Fargo Funds Distributor, LLC (“Funds Distributor”), the principal underwriter, at an annual rate of 0.75% of the average daily net assets of Class C shares.
In addition, Funds Distributor is entitled to receive thefront-end sales charge from the purchase of Class A shares and a contingent deferred sales charge on the redemption of certain Class A shares. Funds Distributor is also entitled to receive the contingent deferred sales charges from redemptions of Class C shares. For the year ended July 31, 2019, Funds Distributor received $27,243 from the sale of Class A shares and $260 in contingent deferred sales charges from redemptions of Class C shares. No contingent deferred sales charges were incurred by Class A shares for the year ended July 31, 2019.
Shareholder servicing fees
The Trust has entered into contracts with one or more shareholder servicing agents, whereby Class A, Class C, and Administrator Class of the Fund are charged a fee at an annual rate of 0.25% of the average daily net assets of each respective class. A portion of these total shareholder servicing fees were paid to affiliates of Wells Fargo.
Interfund transactions
The Fund may purchase or sell portfolio investment securities to certain other Wells Fargo affiliates pursuant to Rule17a-7 under the 1940 Act and under procedures adopted by the Board of Trustees. The procedures have been designed to ensure that these interfund transactions, which do not incur broker commissions, are effected at current market prices.
5. INVESTMENT PORTFOLIO TRANSACTIONS
Purchases and sales of investments, excluding U.S. government obligations (if any) and short-term securities, for the year ended July 31, 2019 were $1,749,561,745 and $2,456,087,660, respectively.
Wells Fargo Growth Fund | 27
Notes to financial statements
6. SECURITIES LENDING TRANSACTIONS
The Fund lends its securities through an unaffiliated securities lending agent and receives collateral in the form of cash or securities with a value at least equal to the value of the securities on loan. The value of the loaned securities is determined at the close of each business day and any increases or decreases in the required collateral are exchanged between the Fund and the counterparty on the next business day. Cash collateral received is invested in the Securities Lending Fund which seeks to provide a positive return compared to the daily Fed Funds Open Rate by investing in high-quality, U.S. dollar-denominated short-term money market instruments and is exempt from registration under Section 3(c)(7) of the 1940 Act. Securities Lending Fund is managed by Funds Management and is subadvised by WellsCap. Funds Management receives an advisory fee starting at 0.05% and declining to 0.01% as the average daily net assets of the Securities Lending Fund increase. All of the fees received by Funds Management are paid to WellsCap for its services as subadviser.
In the event of counterparty default or the failure of a borrower to return a loaned security, the Fund has the right to use the collateral to offset any losses incurred.
As of July 31, 2019, the Fund had securities lending transactions with the following counterparties which are subject to offset:
| | | | | | | | | | | | |
| | | |
| Counterparty | | Value of
securities on
loan | | | Collateral
received1 | | | Net amount | |
| | | |
Bank of America Securities Inc. | | $ | 12,816,008 | | | $ | (12,816,008 | ) | | $ | 0 | |
| | | |
Jefferies LLC | | | 322,540 | | | | (322,540 | ) | | | 0 | |
| | | |
Morgan Stanley & Co. LLC | | | 257,310 | | | | (257,310 | ) | | | 0 | |
| | | |
UBS Securities LLC | | | 4,516,642 | | | | (4,516,642 | ) | | | 0 | |
| 1 | Collateral received within this table is limited to the collateral for the net transaction with the counterparty. |
7. BANK BORROWINGS
The Trust (excluding the money market funds), Wells Fargo Master Trust and Wells Fargo Variable Trust are parties to a $280,000,000 revolving credit agreement whereby the Fund is permitted to use bank borrowings for temporary or emergency purposes, such as to fund shareholder redemption requests. Interest under the credit agreement is charged to the Fund based on a borrowing rate equal to the higher of the Federal Funds rate in effect on that day plus 1.25% or the overnight LIBOR rate in effect on that day plus 1.25%. In addition, an annual commitment fee equal to 0.25% of the unused balance is allocated to each participating fund.
For the year ended July 31, 2019, there were no borrowings by the Fund under the agreement.
8. DISTRIBUTIONS TO SHAREHOLDERS
The tax character of distributions paid during the years ended July 31, 2019 and July 31, 2018 were as follows:
| | | | | | | | |
| | | Year ended July 31 | |
| | |
| | | 2019 | | | 2018 | |
| | |
Ordinary income | | $ | 25,417,735 | | | $ | 19,197,330 | |
| | |
Long-term capital gain | | | 695,147,755 | | | | 1,078,994,937 | |
As of July 31, 2019, the components of distributable earnings on a tax basis were as follows:
| | | | |
Undistributed
long-term
gain | | Unrealized
gains | | Late-year
ordinary losses
deferred |
| | |
| $408,333,238 | | $2,422,280,408 | | $(9,108,551) |
28 | Wells Fargo Growth Fund
Notes to financial statements
Effective for all filings after November 4, 2018, the Securities and Exchange Commission eliminated the requirement to separately state the components of distributions to shareholders under U.S. generally accepted accounting principles. The amounts of distributions to shareholders for the year ended July 31, 2018 were as follows:
| | | | |
| |
| | | Net realized
gains | |
| |
Class A | | | $505,431,285 | |
| |
Class C | | | 57,934,182 | |
| |
Class R6 | | | 16,966,960 | |
| |
Administrator Class | | | 138,040,210 | |
| |
Institutional Class | | | 379,819,630 | |
9. CONCENTRATION RISK
Concentration risks result from exposure to a limited number of sectors. As of the end of the period, the Fund invests a concentration of its portfolio in the information technology sector. A fund that invests a substantial portion of its assets in any sector may be more affected by changes in that sector than would be a fund whose investments are not heavily weighted in any sector.
10. INDEMNIFICATION
Under the Trust’s organizational documents, the officers and Trustees have been granted certain indemnification rights against certain liabilities that may arise out of performance of their duties to the Trust. Additionally, in the normal course of business, the Trust may enter into contracts with service providers that contain a variety of indemnification clauses. The Trust’s maximum exposure under these arrangements is dependent on future claims that may be made against the Fund and, therefore, cannot be estimated.
11. REDEMPTIONIN-KIND
After the close of business on July 12, 2018, the Fund redeemed assets through anin-kind redemption. In the redemption transaction, the Fund issued securities with a value of $75,847,965 and cash in the amount of $271,155. The redemptionin-kind by a shareholder of the Institutional Class represented 1.54% of the Fund and is reflected on the Statement of Changes in Net Assets.
12. NEW ACCOUNTING PRONOUNCEMENT
In August 2018, FASB issued Accounting Standards Update (“ASU”)No. 2018-13, Fair Value Measurement (Topic 820)Disclosure Framework—Changes to the Disclosure Requirements for Fair Value Measurement. ASU2018-13 updates the disclosure requirements for fair value measurements by modifying or removing certain disclosures and adding certain new disclosures. The amendments are effective for fiscal years, and interim periods within those fiscal years, beginning after December 15, 2019. Early adoption is permitted. Management has adopted the removal and modification of disclosures early, as permitted, and will adopt the additional new disclosures at the effective date.
Wells Fargo Growth Fund | 29
Report of independent registered public accounting firm
TO THE SHAREHOLDERS OF THE FUND AND BOARD OF TRUSTEES OF WELLS FARGO FUNDS TRUST:
Opinion on the Financial Statements
We have audited the accompanying statement of assets and liabilities of Wells Fargo Growth Fund (the Fund), one of the funds constituting Wells Fargo Funds Trust, including the portfolio of investments, as of July 31, 2019, the related statement of operations for the year then ended, the statements of changes in net assets for each of the years in the two-year period then ended, and the related notes (collectively, the financial statements) and the financial highlights for each of the years or periods in the five-year period then ended. In our opinion, the financial statements and financial highlights present fairly, in all material respects, the financial position of the Fund as of July 31, 2019, the results of its operations for the year then ended, the changes in its net assets for each of the years in the two-year period then ended, and the financial highlights for each of the years or periods in the five-year period then ended, in conformity with U.S. generally accepted accounting principles.
Basis for Opinion
These financial statements and financial highlights are the responsibility of the Fund’s management. Our responsibility is to express an opinion on these financial statements and financial highlights based on our audits. We are a public accounting firm registered with the Public Company Accounting Oversight Board (United States) (PCAOB) and are required to be independent with respect to the Fund in accordance with the U.S. federal securities laws and the applicable rules and regulations of the Securities and Exchange Commission and the PCAOB.
We conducted our audits in accordance with the standards of the PCAOB. Those standards require that we plan and perform the audit to obtain reasonable assurance about whether the financial statements and financial highlights are free of material misstatement, whether due to error or fraud. Our audits included performing procedures to assess the risks of material misstatement of the financial statements and financial highlights, whether due to error or fraud, and performing procedures that respond to those risks. Such procedures included examining, on a test basis, evidence regarding the amounts and disclosures in the financial statements and financial highlights. Such procedures also included confirmation of securities owned as of July 31, 2019, by correspondence with the custodian, transfer agent and brokers, or by other appropriate auditing procedures. Our audits also included evaluating the accounting principles used and significant estimates made by management, as well as evaluating the overall presentation of the financial statements and financial highlights. We believe that our audits provide a reasonable basis for our opinion.

We have not been able to determine the specific year that we began serving as the auditor of one or more Wells Fargo Funds investment companies; however we are aware that we have served as the auditor of one or more Wells Fargo Funds investment companies since at least 1955.
Boston, Massachusetts
September 25, 2019
30 | Wells Fargo Growth Fund
Other information (unaudited)
TAX INFORMATION
For corporate shareholders, pursuant to Section 854 of the Internal Revenue Code, 98.12% of ordinary income dividends qualify for the corporate dividends-received deduction for the fiscal year ended July 31, 2019.
Pursuant to Section 852 of the Internal Revenue Code, $695,147,755 was designated as a 20% rate gain distribution for the fiscal year ended July 31, 2019.
Pursuant to Section 854 of the Internal Revenue Code, $25,417,735 of income dividends paid during the fiscal year ended July 31, 2019 has been designated as qualified dividend income (QDI).
For the fiscal year ended July 31, 2019, $25,417,735 has been designated as short-term capital gain dividends for nonresident alien shareholders pursuant to Section 871 of the Internal Revenue Code.
PROXY VOTING INFORMATION
A description of the policies and procedures used to determine how to vote proxies relating to portfolio securities is available, upon request, by calling1-800-222-8222, visiting our website atwfam.com, or visiting the SEC website at sec.gov. Information regarding how the proxies related to portfolio securities were voted during the most recent12-month period ended June 30 is available on the website atwfam.comor by visiting the SEC website at sec.gov.
QUARTERLY PORTFOLIO HOLDINGS INFORMATION
The Fund files its complete schedule of portfolio holdings with the SEC for the first and third quarters of each fiscal year on Form N-Q or FormN-PORT, which is available by visiting the SEC website at sec.gov. Those forms may be reviewed and copied at the SEC’s Public Reference Room in Washington, DC. Information on the operation of the Public Reference Room may be obtained by calling1-800-SEC-0330.
Wells Fargo Growth Fund | 31
Other information (unaudited)
BOARD OF TRUSTEES AND OFFICERS
Each of the Trustees and Officers1 listed in the table below acts in identical capacities for each fund in the Wells Fargo family of funds, which consists of 152 mutual funds comprising the Wells Fargo Funds Trust, Wells Fargo Variable Trust, Wells Fargo Master Trust and fourclosed-end funds (collectively the “Fund Complex”). This table should be read in conjunction with the Prospectus and the Statement of Additional Information2. The mailing address of each Trustee and Officer is 525 Market Street, 12th Floor, San Francisco, CA 94105. Each Trustee and Officer serves an indefinite term, however, each Trustee serves such term until reaching the mandatory retirement age established by the Trustees.
Independent Trustees
| | | | | | |
Name and year of birth | | Position held and length of service* | | Principal occupations during past five years or longer | | Current other public company or investment
company directorships |
| | | |
William R. Ebsworth (Born 1957) | | Trustee,
since 2015 | | Retired. From 1984 to 2013, equities analyst, portfolio manager, research director and chief investment officer at Fidelity Management and Research Company in Boston, Tokyo, and Hong Kong, and retired in 2013 as Chief Investment Officer of Fidelity Strategic Advisers, Inc. where he led a team of investment professionals managing client assets. Prior thereto, Board member of Hong Kong Securities Clearing Co., Hong Kong Options Clearing Corp., the Thailand International Fund, Ltd., Fidelity Investments Life Insurance Company, and Empire Fidelity Investments Life Insurance Company. Audit Committee Chair and Investment Committee Chair of the Vincent Memorial Hospital Endowment(non-profit organization). Mr. Ebsworth is a CFA® charterholder. | | N/A |
| | | |
Jane A. Freeman (Born 1953) | | Trustee,
since 2015; Chair Liaison,
since 2018 | | Retired. From 2012 to 2014 and 1999 to 2008, Chief Financial Officer of Scientific Learning Corporation. From 2008 to 2012, Ms. Freeman provided consulting services related to strategic business projects. Prior to 1999, Portfolio Manager at Rockefeller & Co. and Scudder, Stevens & Clark. Board member of the Harding Loevner Funds from 1996 to 2014, serving as both Lead Independent Director and chair of the Audit Committee. Board member of the Russell Exchange Traded Funds Trust from 2011 to 2012 and the chair of the Audit Committee. Ms. Freeman is a Board Member of The Ruth Bancroft Garden(non-profit organization). She is also an inactive Chartered Financial Analyst. | | N/A |
| | | |
Isaiah Harris, Jr. (Born 1952) | | Trustee,
since 2009; Audit Committee Chairman,
since 2019 | | Retired. Chairman of the Board of CIGNA Corporation since 2009, and Director since 2005. From 2003 to 2011, Director of Deluxe Corporation. Prior thereto, President and CEO of BellSouth Advertising and Publishing Corp. from 2005 to 2007, President and CEO of BellSouth Enterprises from 2004 to 2005 and President of BellSouth Consumer Services from 2000 to 2003. Emeritus member of the Iowa State University Foundation Board of Governors. Emeritus Member of the Advisory Board of Iowa State University School of Business. Advisory Board Member, Palm Harbor Academy (private school). Advisory Board Member, Child Evangelism Fellowship(non-profit). Mr. Harris is a certified public accountant (inactive status). | | CIGNA Corporation |
| | | |
| Judith M. Johnson (Born 1949) | | Trustee,
since 2008; Audit Committee Chairman, from 2009 to 2018 | | Retired. Prior thereto, Chief Executive Officer and Chief Investment Officer of Minneapolis Employees Retirement Fund from 1996 to 2008. Ms. Johnson is an attorney, certified public accountant and a certified managerial accountant. | | N/A |
32 | Wells Fargo Growth Fund
Other information (unaudited)
| | | | | | |
Name and year of birth | | Position held and length of service* | | Principal occupations during past five years or longer | | Current other public company or investment
company directorships |
| | | |
David F. Larcker (Born 1950) | | Trustee,
since 2009 | | James Irvin Miller Professor of Accounting at the Graduate School of Business, Stanford University, Director of the Corporate Governance Research Initiative and Senior Faculty of The Rock Center for Corporate Governance since 2006. From 2005 to 2008, Professor of Accounting at the Graduate School of Business, Stanford University. Prior thereto, Ernst & Young Professor of Accounting at The Wharton School, University of Pennsylvania from 1985 to 2005. | | N/A |
| | | |
Olivia S. Mitchell (Born 1953) | | Trustee,
since 2006; Nominating and Governance Committee Chairman, since 2018 | | International Foundation of Employee Benefit Plans Professor, Wharton School of the University of Pennsylvania since 1993. Director of Wharton’s Pension Research Council and Boettner Center on Pensions & Retirement Research, and Research Associate at the National Bureau of Economic Research. Previously, Cornell University Professor from 1978 to 1993. | | N/A |
| | | |
Timothy J. Penny (Born 1951) | | Trustee,
since 1996; Chairman,
since 2018 | | President and Chief Executive Officer of Southern Minnesota Initiative Foundation, anon-profit organization, since 2007. Member of the Board of Trustees of NorthStar Education Finance, Inc., anon-profit organization, since 2007. | | N/A |
| | | |
James G. Polisson (Born 1959) | | Trustee,
since 2018 | | Retired. Chief Marketing Officer, Source (ETF) UK Services, Ltd, from 2015 to 2017. From 2012 to 2015, Principal of The Polisson Group, LLC, a management consulting, corporate advisory and principal investing company. Chief Executive Officer and Managing Director at Russell Investments, Global Exchange Traded Funds from 2010 to 2012. Managing Director of Barclays Global Investors from 1998 to 2010 and Global Chief Marketing Officer for iShares and Barclays Global Investors from 2000 to 2010. Trustee of the San Francisco Mechanics’ Institute, anon-profit organization, from 2013 to 2015. Board member of the Russell Exchange Traded Fund Trust from 2011 to 2012. Director of Barclays Global Investors Holdings Deutschland GmbH from 2006 to 2009. Mr. Polisson is an attorney and has a retired status with the Massachusetts and District of Columbia Bar Associations. | | N/A |
| * | Length of service dates reflect the Trustee’s commencement of service with the Trust’s predecessor entities, where applicable. |
Wells Fargo Growth Fund | 33
Other information (unaudited)
Officers
| | | | |
Name and
year of birth | | Position held and
length of service | | Principal occupations during past five years or longer |
| | |
Andrew Owen (Born 1960) | | President,
since 2017 | | Executive Vice President of Wells Fargo & Company and Head of Affiliated Managers, Wells Fargo Asset Management, since 2014. In addition, Mr. Owen is currently President, Chief Executive Officer and Director of Wells Fargo Funds Management, LLC since 2017. Prior thereto, Executive Vice President responsible for marketing, investments and product development for Wells Fargo Funds Management, LLC, from 2009 to 2014. |
| | |
Jeremy DePalma1 (Born 1974) | | Treasurer,
since 2012 | | Senior Vice President of Wells Fargo Funds Management, LLC since 2009. Senior Vice President of Evergreen Investment Management Company, LLC from 2008 to 2010 and head of the Fund Reporting and Control Team within Fund Administration from 2005 to 2010. |
| | |
Alexander Kymn (Born 1973) | | Secretary and Chief Legal Officer,
since 2018 | | Senior Company Counsel of Wells Fargo Bank, N.A. since 2018 (previously Senior Counsel from 2007 to 2018). Vice President of Wells Fargo Funds Management, LLC from 2008 to 2014. |
| | |
Michael H. Whitaker (Born 1967) | | Chief Compliance Officer,
since 2016 | | Senior Vice President and Chief Compliance Officer since 2016. Senior Vice President and Chief Compliance Officer for Fidelity Investments from 2007 to 2016. |
| | |
David Berardi (Born 1975) | | Assistant Treasurer,
since 2009 | | Vice President of Wells Fargo Funds Management, LLC since 2009. Vice President of Evergreen Investment Management Company, LLC from 2008 to 2010. Manager of Fund Reporting and Control for Evergreen Investment Management Company, LLC from 2004 to 2010. |
| 1 | Jeremy DePalma acts as Treasurer of 87 funds and Assistant Treasurer of 65 funds in the Fund Complex. |
| 2 | The Statement of Additional Information includes additional information about the Trustees and is available, without charge, upon request, by calling1-800-222-8222 or by visiting the website atwfam.com. |
34 | Wells Fargo Growth Fund
Other information (unaudited)
BOARD CONSIDERATION OF INVESTMENT MANAGEMENT ANDSUB-ADVISORY AGREEMENTS:
Wells Fargo Growth Fund
Under the Investment Company Act of 1940 (the “1940 Act”), the Board of Trustees (the “Board”) of Wells Fargo Funds Trust (the “Trust”) must determine annually whether to approve the continuation of the Trust’s investment management andsub-advisory agreements. In this regard, at anin-person meeting held on May21-22, 2019 (the “Meeting”), the Board, all the members of which have no direct or indirect interest in the investment management andsub-advisory agreements and are not “interested persons” of the Trust, as defined in the 1940 Act (the “Independent Trustees”), reviewed and approved for Wells Fargo Growth Fund (the “Fund”): (i) an investment management agreement (the “Management Agreement”) with Wells Fargo Funds Management, LLC (“Funds Management”); and (ii) an investmentsub-advisory agreement (the“Sub-Advisory Agreement”) with Wells Capital Management Incorporated (the“Sub-Adviser”), an affiliate of Funds Management. The Management Agreement and theSub-Advisory Agreement are collectively referred to as the “Advisory Agreements.”
At the Meeting, the Board considered the factors and reached the conclusions described below relating to the selection of Funds Management and theSub-Adviser and the approval of the Advisory Agreements. Prior to the Meeting, including at anin-person meeting in April 2019, the Trustees conferred extensively among themselves and with representatives of Funds Management about these matters. Also, the Board has adopted a team-based approach, with each team consisting of asub-set of Trustees, to assist the full Board in the discharge of its duties in reviewing investment performance and other matters throughout the year. The Independent Trustees were assisted in their evaluation of the Advisory Agreements by independent legal counsel, from whom they received separate legal advice and with whom they met separately.
In providing information to the Board, Funds Management and theSub-Adviser were guided by a detailed set of requests for information submitted to them by independent legal counsel on behalf of the Independent Trustees at the start of the Board’s annual contract renewal process earlier in 2019. In considering and approving the Advisory Agreements, the Trustees considered the information they believed relevant, including but not limited to the information discussed below. The Board considered not only the specific information presented in connection with the Meeting, but also the knowledge gained over time through interaction with Funds Management and theSub-Adviser about various topics. In this regard, the Board reviewed reports of Funds Management at each of its quarterly meetings, which included, among other things, portfolio reviews and investment performance reports. In addition, the Board and the teams mentioned above confer with portfolio managers at various times throughout the year. The Board did not identify any particular information or consideration that wasall-important or controlling, and each individual Trustee may have attributed different weights to various factors.
After its deliberations, the Board unanimously approved the continuation of the Advisory Agreements for aone-year term and determined that the compensation payable to Funds Management and theSub-Adviser under each of the Advisory Agreements was reasonable. The Board considered the approval of the Advisory Agreements for the Fund as part of its consideration of agreements for funds across the complex, but its approvals were made on afund-by-fund basis. The following summarizes a number of important, but not necessarily all, factors considered by the Board in support of its approvals.
Nature, extent and quality of services
The Board received and considered various information regarding the nature, extent and quality of services provided to the Fund by Funds Management and theSub-Adviser under the Advisory Agreements. This information included a description of the investment advisory services and Fund-level administrative services covered by the Management Agreement, as well as, among other things, a summary of the background and experience of senior management of Wells Fargo Asset Management (“WFAM”), of which Funds Management and theSub-Adviser are a part, a summary of investments made in the business of WFAM, a summary of certain organizational and personnel changes involving Funds Management and theSub-Adviser, and a description of Funds Management’s and theSub-Adviser’s business continuity planning programs and of their approaches to data privacy and cybersecurity. The Board received and reviewed information about Funds Management’s role as administrator of the Fund’s liquidity risk management program. The Board also considered the qualifications, background, tenure and responsibilities of each of the portfolio managers primarily responsible for theday-to-day portfolio management of the Fund.
The Board evaluated the ability of Funds Management and theSub-Adviser to attract and retain qualified investment professionals, including research, advisory and supervisory personnel. The Board further considered the compliance programs and compliance records of Funds Management and theSub-Adviser. In addition, the Board took into account the full range of services provided to the Fund by Funds Management and its affiliates.
Wells Fargo Growth Fund | 35
Other information (unaudited)
Fund investment performance and expenses
The Board considered the investment performance results for the Fund over various time periods ended December 31, 2018. The Board considered these results in comparison to the investment performance of funds in a universe that was determined by Broadridge Inc. (“Broadridge”) to be similar to the Fund (the “Universe”), and in comparison to the Fund’s benchmark index and to other comparative data. Broadridge is an independent provider of investment company data. The Board received a description of the methodology used by Broadridge to select the mutual funds in the performance Universe. The Board noted that the investment performance of the Fund (Administrator Class) was higher than the average investment performance of the Universe for all periods under review. The Board also noted that the investment performance of the Fund was higher than its benchmark index, the Russell 3000® Growth Index, for theone-, andten-year periods under review, but lower than its benchmark for the three- and five-year periods under review.
The Board received information concerning, and discussed factors contributing to, the underperformance of the Fund relative to the benchmark for the periods identified above. The Board took note of the explanations for the relative underperformance during these periods, including with respect to investment decisions and market factors that affected the Fund’s investment performance. The Board also took note of the Fund’s outperformance relative to the Universe for all periods under review and the index over theone- andten-year time periods under review.
The Board also received and considered information regarding the Fund’s net operating expense ratios and their various components, including actual management fees, custodian and othernon-management fees, and Rule12b-1 andnon-Rule12b-1 shareholder service fees. The Board considered these ratios in comparison to the median ratios of funds in class-specific expense groups that were determined by Broadridge to be similar to the Fund (the “Groups”). The Board received a description of the methodology used by Broadridge to select the mutual funds in the expense Groups and an explanation of how funds comprising expense groups and their expense ratios may vary fromyear-to-year. Based on the Broadridge reports, the Board noted that the net operating expense ratios of the Fund were lower than, equal to, or in range of the median net operating expense ratios of the expense Groups for each share class.
The Board took into account the Fund’s investment performance and expense information provided to it among the factors considered in deciding tore-approve the Advisory Agreements.
Investment management andsub-advisory fee rates
The Board reviewed and considered the contractual fee rates payable by the Fund to Funds Management under the Management Agreement, as well as the contractual fee rates payable by the Fund to Funds Management for class-level administrative services under a Class-Level Administration Agreement, which include, among other things, class-level transfer agency andsub-transfer agency costs (collectively, the “Management Rates”). The Board also reviewed and considered the contractual investmentsub-advisory fee rates that are payable by Funds Management to theSub-Adviser for investmentsub-advisory services.
Among other information reviewed by the Board was a comparison of the Fund’s Management Rates with the average contractual investment management fee rates of funds in the expense Groups at a common asset level as well as transfer agency costs of the funds in the expense Groups. The Board noted that the Management Rates of the Fund were in range of the sum of these average rates for the Fund’s expense Groups for the Institutional and R6 share classes, but higher than the sum of these average rates for the Fund’s expense Groups for the Class A and Administrator share classes. However, the Board noted that the net operating expense ratios of the Fund were lower than, equal to or in range of the median net operating expense ratios of the expense Groups for each share class.
The Board also received and considered information about the portion of the total management fee that was retained by Funds Management after payment of the fee to theSub-Adviser forsub-advisory services. In assessing the reasonableness of this amount, the Board received and evaluated information about the nature and extent of responsibilities retained and risks assumed by Funds Management and not delegated to or assumed by theSub-Adviser, and about Funds Management’son-going oversight services. Given the affiliation between Funds Management and theSub-Adviser, the Board ascribed limited relevance to the allocation of fees between them.
The Board also received and considered information about the nature and extent of services offered and fee rates charged by Funds Management and theSub-Adviser to other types of clients with investment strategies similar to those of the Fund. In this regard, the Board received information about the significantly greater scope of services, and compliance, reporting and other legal burdens and risks of managing proprietary mutual funds compared with those associated with managing assets of other types of clients, including third-partysub-advised fund clients andnon-mutual fund clients such as institutional separate accounts.
36 | Wells Fargo Growth Fund
Other information (unaudited)
Based on its consideration of the factors and information it deemed relevant, including those described here, the Board determined that the compensation payable to Funds Management under the Management Agreement and to theSub-Adviser under theSub-Advisory Agreement was reasonable.
Profitability
The Board received and considered information concerning the profitability of Funds Management, as well as the profitability of both WFAM and Wells Fargo & Co. (“Wells Fargo”) from providing services to the fund family as a whole. The Board noted that theSub-Adviser’s profitability information with respect to providing services to the Fund and other funds in the family was subsumed in the WFAM and Wells Fargo profitability analysis.
Funds Management reported on the methodologies and estimates used in calculating profitability, including a description of the methodology used to allocate certain expenses. Among other things, the Board noted that the levels of profitability reported on afund-by-fund basis varied widely, depending on factors such as the size, type and age of fund. Based on its review, the Board did not deem the profits reported by Funds Management, WFAM or Wells Fargo from services provided to the Fund to be at a level that would prevent it from approving the continuation of the Advisory Agreements.
Economies of scale
The Board received and considered information about the potential for Funds Management to experience economies of scale in the provision of management services to the Fund, the difficulties of calculating economies of scale at an individual fund level, and the extent to which potential scale benefits are shared with shareholders. The Board noted the existence of breakpoints in the Fund’s management fee structure, which operate generally to reduce the Fund’s expense ratios as the Fund grows in size. The Board considered that in addition to management fee breakpoints, Funds Management shares potential economies of scale from its management business in a variety of ways, including through fee waiver and expense reimbursement arrangements, services that benefit shareholders, competitive management fee rates set at the outset without regard to breakpoints, and investments in the business intended to enhance services available to shareholders.
The Board concluded that Funds Management’s arrangements with respect to the Fund, including contractual breakpoints, constituted a reasonable approach to sharing potential economies of scale with the Fund and its shareholders.
Other benefits to Funds Management and theSub-Adviser
The Board received and considered information regarding potential“fall-out” or ancillary benefits received by Funds Management and its affiliates, including theSub-Adviser, as a result of their relationships with the Fund. Ancillary benefits could include, among others, benefits directly attributable to other relationships with the Fund and benefits potentially derived from an increase in Funds Management’s and theSub-Adviser’s business as a result of their relationships with the Fund. The Board noted that various affiliates of Funds Management may receive distribution-related fees, shareholder servicing payments andsub-transfer agency fees in respect of shares sold or held through them and services provided.
The Board also reviewed information about soft dollar credits earned and utilized by theSub-Adviser, fees earned by Funds Management and theSub-Adviser from managing a private investment vehicle for the fund family’s securities lending collateral, and commissions earned by an affiliated broker from portfolio transactions.
Based on its consideration of the factors and information it deemed relevant, including those described here, the Board did not find that any ancillary benefits received by Funds Management and its affiliates, including theSub-Adviser, were unreasonable.
Conclusion
At the Meeting, after considering the above-described factors and based on its deliberations and its evaluation of the information described above, the Board unanimously approved the continuation of the Advisory Agreements for aone-year term and determined that the compensation payable to Funds Management and theSub-Adviser under each of the Advisory Agreements was reasonable.
Wells Fargo Growth Fund | 37
This page is intentionally left blank.
This page is intentionally left blank.
This page is intentionally left blank.

For more information
More information about Wells Fargo Funds is available free upon request. To obtain literature, please write, visit the Fund’s website, or call:
Wells Fargo Funds
P.O. Box 219967
Kansas City, MO 64121-9967
Website:wfam.com
Individual investors:1-800-222-8222
Retail investment professionals:1-888-877-9275
Institutional investment professionals:1-866-765-0778

This report and the financial statements contained herein are submitted for the general information of the shareholders of the Fund. If this report is used for promotional purposes, distribution of the report must be accompanied or preceded by a current prospectus. Before investing, please consider the investment objectives, risks, charges, and expenses of the investment. For a current prospectus and, if available, a summary prospectus, containing this information, call1-800-222-8222 or visit the Fund’s website atwfam.com. Read the prospectus carefully before you invest or send money.
Wells Fargo Asset Management (WFAM) is the trade name for certain investment advisory/management firms owned by Wells Fargo & Company. These firms include but are not limited to Wells Capital Management Incorporated and Wells Fargo Funds Management, LLC. Certain products managed by WFAM entities are distributed by Wells Fargo Funds Distributor, LLC (a broker-dealer and Member FINRA).
This material is for general informational and educational purposes only and is NOT intended to provide investment advice or a recommendation of any kind—including a recommendation for any specific investment, strategy, or plan.
INVESTMENT PRODUCTS: NOT FDIC INSURED ◾ NO BANK GUARANTEE ◾ MAY LOSE VALUE
© 2019 Wells Fargo Funds Management, LLC. All rights reserved.
405478 09-19
A206/AR206 07-19
Annual Report
July 31, 2019
Wells Fargo Classic Value Fund
(formerly, Wells Fargo Intrinsic Value Fund)
Beginning on January 1, 2021, as permitted by new regulations adopted by the Securities and Exchange Commission, paper copies of the Wells Fargo Funds’ annual and semi-annual shareholder reports issued after this date will no longer be sent by mail, unless you specifically request paper copies of the reports. Instead, the reports will be made available on the Funds’ website, and you will be notified by mail each time a report is posted and provided with a website address to access the report.
If you already elected to receive shareholder reports electronically, you will not be affected by this change and you need not take any action. You may elect to receive shareholder reports and other communications from the Fund electronically at any time by contacting your financial intermediary (such as a broker-dealer or bank) or, if you are a direct investor, by calling1-800-222-8222 or by enrolling at wellsfargo.com/advantagedelivery.
You may elect to receive all future reports in paper free of charge. If you invest through a financial intermediary, you can contact your financial intermediary to request that you continue to receive paper copies of your shareholder reports; if you invest directly with the Fund, you can call 1-800-222-8222. Your election to receive reports in paper will apply to all Wells Fargo Funds held in your account with your financial intermediary or, if you are a direct investor, to all Wells Fargo Funds that you hold.
|
|
|
Reduce clutter. Save trees. |
Sign up for electronic delivery of prospectuses and shareholder reports atwellsfargo.com/advantagedelivery |
The views expressed and any forward-looking statements are as of July 31, 2019, unless otherwise noted, and are those of the Fund managers and/or Wells Fargo Asset Management. Discussions of individual securities, or the markets generally, or any Wells Fargo Fund are not intended as individual recommendations. Future events or results may vary significantly from those expressed in any forward-looking statements. The views expressed are subject to change at any time in response to changing circumstances in the market. Wells Fargo Asset Management and the Fund disclaim any obligation to publicly update or revise any views expressed or forward-looking statements.
INVESTMENT PRODUCTS: NOT FDIC INSURED ◾ NO BANK GUARANTEE ◾ MAY LOSE VALUE
Wells Fargo Classic Value Fund | 1
Letter to shareholders (unaudited)

Andrew Owen
President
Wells Fargo Funds
Dear Shareholder:
We are pleased to offer you this annual report for the Wells Fargo Classic Value Fund for the 12-month period that ended July 31, 2019. Effective April 1, 2019, the Fund changed its name from Wells Fargo Intrinsic Value Fund to Wells Fargo Classic Value Fund. After the first six months of the period yielded either low-single-digit or negative investment returns, U.S. stock and global bond investors generally enjoyed a recovery during the final six months amid continued concerns about global economic growth, international trade, geopolitical tensions, and bouts of market volatility. These concerns negatively influenced international equity markets.
For the period, U.S. stocks, based on the S&P 500 Index,1 gained 7.99% and international stocks, as measured by the MSCI ACWI ex USA Index (Net),2 fell 2.27%. The MSCI EM Index (Net)3 slipped 2.18%. For bond investors, the Bloomberg Barclays U.S. Aggregate Bond Index4 added 8.08%, the Bloomberg Barclays Global Aggregate ex-USD Index5 added 3.74%, the Bloomberg Barclays Municipal Bond Index6 gained 7.31%, and the ICE BofAML U.S. High Yield Index7 added 6.94%.
Entering the fourth quarter of 2018, economic data was encouraging.
Domestic equity investors entered the fourth quarter of 2018 with reasons to be optimistic. The U.S. Bureau of Economic Analysis reported second-quarter annualized gross domestic product (GDP) growth of 4.2%. Hiring improved. Unemployment declined. Consumer confidence and spending increased. Third-quarter corporate earnings reports were generally positive. U.S. trade negotiations with Mexico and Canada progressed. The U.S. Federal Reserve (Fed) raised the federal funds rate by 25 basis points (bps; 100 bps equal 1.00%) to a target range of between 2.00% and 2.25% in September 2018, one of four rate increases implemented during the calendar year, a sign of its confidence in the strength of the U.S. economy.
Investors in international markets were not as confident. Tensions between the U.S. and China increased. The U.S. imposed $200 billion in tariffs on Chinese goods. China reacted with $60 billion in tariffs on U.S. goods. Economic growth in China caused concern. In September 2018, international investors began to factor a number of disconcerting economic and business data points: lower July manufacturers’ and industrial orders in Germany; falling purchasing manager index numbers for August from the United Kingdom, China, and India; and declining household spending for August in Japan. Taken together, the data fed growing concerns over slowing global growth that unnerved investors.
| 1 | The S&P 500 Index consists of 500 stocks chosen for market size, liquidity, and industry group representation. It is a market-value-weighted index with each stock’s weight in the index proportionate to its market value. You cannot invest directly in an index. |
| 2 | The Morgan Stanley Capital International (MSCI) All Country World Index (ACWI) ex USA Index (Net) is a free-float-adjusted market-capitalization weighted index that is designed to measure the equity market performance of developed and emerging markets, excluding the U.S. Source: MSCI. MSCI makes no express or implied warranties or representations and shall have no liability whatsoever with respect to any MSCI data contained herein. The MSCI data may not be further redistributed or used as a basis for other indices or any securities or financial products. This report is not approved, reviewed, or produced by MSCI. You cannot invest directly in an index. |
| 3 | The MSCI Emerging Markets (EM) Index (Net) is a free-float-adjusted market-capitalization-weighted index that is designed to measure the equity market performance of emerging markets. You cannot invest directly in an index. |
| 4 | The Bloomberg Barclays U.S. Aggregate Bond Index is a broad-based benchmark that measures the investment-grade, U.S. dollar-denominated, fixed-rate taxable bond market, including Treasuries, government-related and corporate securities, mortgage-backed securities (agency fixed-rate and hybrid adjustable-rate mortgage pass-throughs), asset-backed securities, and commercial mortgage-backed securities. You cannot invest directly in an index. |
| 5 | The Bloomberg Barclays Global Aggregate ex-USD Index is an unmanaged index that provides a broad-based measure of the global investment-grade fixed-income markets excluding the U.S. dollar-denominated debt market. You cannot invest directly in an index. |
| 6 | The Bloomberg Barclays Municipal Bond Index is an unmanaged index composed of long-term tax-exempt bonds with a minimum credit rating of Baa. You cannot invest directly in an index. |
| 7 | The ICE BofAML U.S. High Yield Index is a market-capitalization-weighted index of domestic and Yankee high-yield bonds. The index tracks the performance of high-yield securities traded in the U.S. bond market. You cannot invest directly in an index. Copyright 2019. ICE Data Indices, LLC. All rights reserved. |
2 | Wells Fargo Classic Value Fund
Letter to shareholders (unaudited)
Global markets suffered during the fourth quarter of 2018.
November’s U.S. midterm elections shifted control of the House of Representatives from Republicans to Democrats, presaging partisan clashes that followed and caused uncertainty among investors. Third-quarter U.S. GDP was announced at an annualized 3.4% rate, lower than the second-quarter rate. Brexit efforts stalled ahead of the March 2019 deadline. The People’s Bank of China cut reserve requirement ratios, accelerated infrastructure spending, and cut taxes even as the value of the yuan declined to low levels last seen in 2008. A partial U.S. government shutdown driven by partisan policy disputes extended into January.
The combination of news in the U.S. and generally weak economic indicators outside of the U.S. caused investors to seek safe havens. December’s S&P 500 Index performance was the worst since 1931. Globally, fixed-income investments fared better than stocks during the last two months of the year. The Fed increased the federal funds rate by 25 bps in December to a target range of between 2.25% and 2.50%.
The market climbs a wall of worry.
Investors entered 2019 with reasons to be concerned. Investment returns appeared to reaffirm the adage that markets climb a wall of worry. The S&P 500 Index gained 8.01% for the month of January, the best monthly performance in 30 years. Returns for the MSCI ACWI ex USA Index (Net), the Bloomberg Barclays U.S. Aggregate Bond Index, and the Bloomberg Barclays Global Aggregate ex-USD Index also were positive.
In February 2019, signs of slowing global growth grew more ominous. The Bureau of Economic Analysis announced fourth-quarter 2018 GDP grew at an annualized 2.2% rate, down from the levels of the prior two quarters. In a February report, the Bank of England forecasted the slowest growth since the financial crisis for 2019. China and the U.S. continued to wrangle over trade issues.
By the end of March 2019, a combination of dovish Fed sentiment and steady, if not spectacular, U.S. economic and business metrics reinforced investors’ confidence. Monthly job creation data and corporate profits, while less consistent than during 2018, were solid. China announced a roughly $300 billion stimulus package through tax and fee cuts intended to reinvigorate economic growth. During April 2019, favorable sentiment found additional support in reports of sustained low inflation, solid employment data, and first-quarter U.S. GDP of an annualized rate of 3.2%.
During May 2019, markets tumbled on mixed investment signals. In the U.S., partisan wrangling ramped up as Democrats and Republicans set their sights on 2020 presidential politics. The U.K.’s Brexit caused Prime Minister Theresa May to resign. The European Commission downgraded the 2019 growth forecast to 1.2%. The U.S. increased tariffs on products from China, China responded, and then talks broke down. President Donald Trump threatened to turn his foreign policy tariff tool to Mexico over immigration issues.
As had been the case during most of 2019 to date, just as the investment horizon appeared to darken, sentiment turned and U.S. equity markets gained during June and July. The gains, primarily driven by geopolitical and monetary policy events, pushed equity markets to new highs.
President Mario Draghi of the European Central Bank said that if the outlook doesn’t improve, the bank will cut rates or buy more assets to prop up inflation. President Trump backed off of tariff threats against Mexico and China. In the U.S., the Fed implemented a 0.25% federal funds rate cut in July 2019.
“December’s S&P 500 Index performance was the worst since 1931.”
“The S&P 500 Index gained 8.01% for the month of January, the best monthly performance in 30 years.”
Wells Fargo Classic Value Fund | 3
Letter to shareholders (unaudited)
Later in July 2019, the U.S. reversed course and threatened to impose higher tariffs on China’s exports after talks failed. China responded with tariff threats of its own and devalued the renminbi, a move that roiled global markets. Despite the accommodative approach of central banks, investors continued to have misgivings about the durability of economic growth globally and a pervasively cautious tone influenced the world’s equity and fixed-income markets.
Don’t let short-term uncertainty derail long-term investment goals.
Periods of investment uncertainty can present challenges, but experience has taught us that maintaining long-term investment goals can be an effective way to plan for the future. To help you create a sound strategy based on your personal goals and risk tolerance, Wells Fargo Funds offers more than 100 mutual funds spanning a wide range of asset classes and investment styles. Although diversification cannot guarantee an investment profit or prevent losses, we believe it can be an effective way to manage investment risk and potentially smooth out overall portfolio performance. We encourage investors to know their investments and to understand that appropriate levels of risk-taking may unlock opportunities.
Thank you for choosing to invest with Wells Fargo Funds. We appreciate your confidence in us and remain committed to helping you meet your financial needs.
Sincerely,

Andrew Owen
President
Wells Fargo Funds
|
|
|
For further information about your Fund, contact your investment professional, visit our website at wfam.com, or call us directly at1-800-222-8222. |
4 | Wells Fargo Classic Value Fund
This page is intentionally left blank.
Performance highlights (unaudited)
Investment objective
The Fund seeks long-term capital appreciation.
Manager
Wells Fargo Funds Management, LLC
Subadviser
Wells Capital Management Incorporated
Portfolio managers
Miguel E. Giaconi, CFA®‡
Jean-Baptiste Nadal, CFA®‡
Average annual total returns (%) as of July 31, 2019
| | | | | | | | | | | | | | | | | | | | | | | | | | | | | | | | | | |
| | | | |
| | | | | Including sales charge | | | Excluding sales charge | | | Expense ratios1 (%) | |
| | | | | | | | | |
| | | Inception date | | 1 year | | | 5 year | | | 10 year | | | 1 year | | | 5 year | | | 10 year | | | Gross | | | Net2 | |
| | | | | | | | | | |
| Class A (EIVAX)3 | | 8-1-2006 | | | 2.76 | | | | 7.07 | | | | 11.37 | | | | 9.03 | | | | 8.34 | | | | 12.03 | | | | 1.18 | | | | 1.11 | |
| | | | | | | | | | |
| Class C (EIVCX)3 | | 8-1-2006 | | | 7.16 | | | | 7.53 | | | | 11.18 | | | | 8.16 | | | | 7.53 | | | | 11.18 | | | | 1.93 | | | | 1.86 | |
| | | | | | | | | | |
| Class R (EIVTX)3,4 | | 3-1-2013 | | | – | | | | – | | | | – | | | | 8.70 | | | | 8.08 | | | | 11.77 | | | | 1.43 | | | | 1.36 | |
| | | | | | | | | | |
| Class R6 (EIVFX)3,5 | | 11-30-2012 | | | – | | | | – | | | | – | | | | 10.38 | | | | 9.02 | | | | 12.54 | | | | 0.75 | | | | 0.65 | |
| | | | | | | | | | |
| Administrator Class (EIVDX)3,6 | | 7-30-2010 | | | – | | | | – | | | | – | | | | 9.21 | | | | 8.53 | | | | 12.24 | | | | 1.10 | | | | 0.95 | |
| | | | | | | | | | |
| Institutional Class (EIVIX)3 | | 8-1-2006 | | | – | | | | – | | | | – | | | | 9.44 | | | | 8.80 | | | | 12.47 | | | | 0.85 | | | | 0.70 | |
| | | | | | | | | | |
| Russell 1000® Value Index7 | | – | | | – | | | | – | | | | – | | | | 5.20 | | | | 8.01 | | | | 12.40 | | | | – | | | | – | |
Figures quoted represent past performance, which is no guarantee of future results, and do not reflect taxes that a shareholder may pay on fund distributions or the redemption of fund shares. Investment return and principal value of an investment will fluctuate so that an investor’s shares, when redeemed, may be worth more or less than their original cost. Performance shown without sales charges would be lower if sales charges were reflected. Current performance may be lower or higher than the performance data quoted, which assumes the reinvestment of dividends and capital gains. Current month-end performance is available on the Fund’s website,wfam.com.
Index returns do not include transaction costs associated with buying and selling securities, any mutual fund fees or expenses, or any taxes. It is not possible to invest directly in an index.
For Class A shares, the maximum front-end sales charge is 5.75%. For Class C shares, the maximum contingent deferred sales charge is 1.00%. Performance including a contingent deferred sales charge assumes the sales charge for the corresponding time period. Class R, Class R6, Administrator Class, and Institutional Class shares are sold without a front-end sales charge or contingent deferred sales charge.
Stock values fluctuate in response to the activities of individual companies and general market and economic conditions. Certain investment strategies tend to increase the total risk of an investment (relative to the broader market). The Fund is exposed to foreign investment risk and focused portfolio risk. Consult the Fund’s prospectus for additional information on these and other risks.
Please see footnotes on page 7.
6 | Wells Fargo Classic Value Fund
Performance highlights (unaudited)
|
|
| Growth of $10,000 investment as of July 31, 20198 |
|
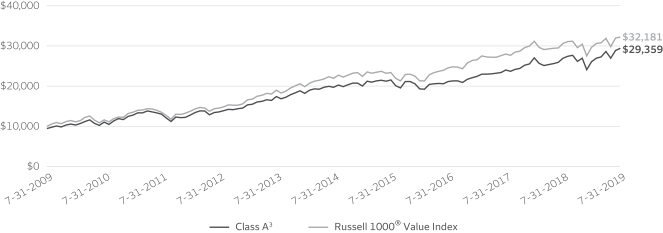
|
| ‡ | CFA® and Chartered Financial Analyst® are trademarks owned by CFA Institute. |
| 1 | Reflects the expense ratios as stated in the most recent prospectuses. The expense ratios shown are subject to change and may differ from the annualized expense ratios shown in the financial highlights of this report. |
| 2 | The manager has contractually committed through November 30, 2019, to waive fees and/or reimburse expenses to the extent necessary to cap the expenses of each class after fee waivers at the amounts shown. Brokerage commissions, stamp duty fees, interest, taxes, acquired fund fees and expenses (if any), and extraordinary expenses are excluded from the expense cap. Prior to or after the commitment expiration date, the cap may be increased or the commitment to maintain the cap may be terminated only with the approval of the Board of Trustees. Without this cap, the Fund’s returns would have been lower. The expense ratio paid by an investor is the net expense ratio (the total annual fund operating expenses after fee waivers) as stated in the prospectuses. |
| 3 | Historical performance shown prior to July 19, 2010, is based on the performance of the Fund’s predecessor, Evergreen Intrinsic Value Fund. |
| 4 | Historical performance shown for Class R shares prior to their inception reflects the performance of Institutional Class shares, adjusted to reflect the higher expenses applicable to Class R shares. |
| 5 | Historical performance shown for Class R6 shares prior to their inception reflects the performance of Institutional Class shares, and includes the higher expenses applicable to Institutional Class shares. If these expenses had not been included, returns for Class R6 shares would be higher. |
| 6 | Historical performance shown for Administrator Class shares prior to their inception reflects the performance of Institutional Class shares, adjusted to reflect the higher expenses applicable to Administrator Class shares. |
| 7 | The Russell 1000® Value Index measures the performance of those Russell 1000 companies with lower price/book ratios and lower forecasted growth values. You cannot invest directly in an index. |
| 8 | The chart compares the performance of Class A shares for the most recent ten years with the Russell 1000® Value Index. The chart assumes a hypothetical investment of $10,000 in Class A shares and reflects all operating expenses and assumes the maximum initial sales charge of 5.75%. |
| 9 | The ten largest holdings, excluding cash, cash equivalents and any money market funds, are calculated based on the value of the investments divided by total net assets of the Fund. Holdings are subject to change and may have changed since the date specified. |
| 10 | Amounts are calculated based on the total long-term investments of the Fund. These amounts are subject to change and may have changed since the date specified. |
| * | This security is no longer held at the end of the reporting period. |
Wells Fargo Classic Value Fund | 7
Performance highlights (unaudited)
MANAGER’S DISCUSSION
Fund highlights
| ∎ | | The Fund outperformed its benchmark, the Russell 1000® Value Index, for the 12-month period that ended July 31, 2019. |
| ∎ | | Stock selection in the information technology (IT), financials, materials, and consumer discretionary sectors contributed to relative performance. |
| ∎ | | Stock selection in the industrials and energy sectors detracted from the Fund’s relative performance. |
Strong market performance from the Russell 1000® Value Index during the reporting period was driven mainly by strong corporate earnings growth, positive effects of tax reform, and economic growth combined with muted inflation. We continued to adhere to our disciplined investment process that relies predominantly on discounted free cash flow. We also continued our focus on individual companies rather than on broad, top-down economic or sector forecasts. To manage risk, we maintained the Fund’s broad diversification by sector, industry, and position.
| | | | |
|
| Ten largest holdings (%) as of July 31, 20199 | |
| | |
Comcast Corporation Class A | | | 3.34 | |
| | |
Mondelez International Incorporated Class A | | | 3.26 | |
| | |
Medtronic plc | | | 3.24 | |
| | |
Merck & Company Incorporated | | | 3.02 | |
| | |
Alphabet Incorporated Class C | | | 3.01 | |
| | |
Vulcan Materials Company | | | 2.93 | |
| | |
Dollar Tree Incorporated | | | 2.92 | |
| | |
NXP Semiconductors NV | | | 2.86 | |
| | |
Honeywell International Incorporated | | | 2.83 | |
| | |
US Bancorp | | | 2.81 | |
|
|
| Sector distribution as of July 31, 201910 |
|
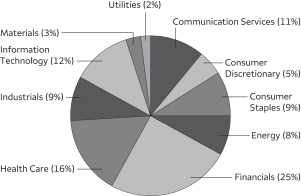 |
Stock selection across several sectors contributed to Fund performance.
Within the IT sector, the largest contributors to the Fund’s performance were specialty wireless communication provider Motorola Solutions, Incorporated; computer software giant Microsoft Corporation; and multinational networking equipment provider, Cisco Systems, Incorporated. Global insurance brokerage and consulting firm Aon plc* and the largest private-label credit card provider Synchrony Financial were the Fund’s top contributors within the financials sector. The Fund’s sole holding in the materials sector, Vulcan Materials Company, a supplier of construction aggregates—crushed stone, sand, and gravel—enhanced relative value. In the consumer discretionary sector, discount variety retailer Dollar Tree, Incorporated, and Advance Auto Parts, Incorporated, a retailer/distributor of aftermarket automotive parts, added value.
Security selection in two sectors was the Fund’s main detractor from relative performance.
Within the industrials sector, the primary detractor was the second-largest airplane leasing company, AerCap Holdings, N.V. Stock selection in the energy sector also detracted from relative return—especially EOG Resources, Incorporated, a U.S. oil shale exploration and production company, and Schlumberger Limited, a global leader in oil-field services.
During the period, we made changes to the Fund’s portfolio based on our fundamental research.
As a result of trades, stock price movements, and the annual reconstitution of the FTSE Russell family of indices, the Fund’s positioning relative to its benchmark shifted noticeably during the period. The most notable sector-weighting change within the Fund was an increase in the health care sector’s weighting. We added positions in two health care companies: specialty distributor of products and services to smaller office-based medical, dental, and animal health practitioners Henry Schein, Incorporated, and leading medical devices player Medtronic plc. In all cases, trades within the Fund were made based on fundamental bottom-up research and were not top-down sector allocation decisions.
Please see footnotes on page 7.
8 | Wells Fargo Classic Value Fund
Performance highlights (unaudited)
We continued to focus on our investment strategy and process.
The team’s approach is to remain cautious in this environment, as strong first-half 2019 returns increase the challenges of finding attractively priced opportunities within various sectors. We are seeking opportunities in the traditional defensive sectors in order to manage our risk exposures. Our IT exposure looks prudent, in our view, with a tilt toward companies potentially benefiting from long-term structural trends related to the cloud. Our financials exposure is diversified and less dependent on a rising interest rate scenario. Our investments in health care have been additive to relative performance, but as the 2020 election nears, political rhetoric may create headwinds for pharmaceutical pricing. Free cash flow generation within the energy sector should improve as companies continue to control both operating costs and capital expenditures.
We identify several risks that may affect short-term returns, including trade wars, geopolitical events, global economic growth weakening further and affecting the U.S. economy, and congressional investigations into the White House.
We continue to believe that our long-term focus on company fundamentals, our determination to seek out mispricing opportunities in the marketplace, and our ability to identify catalysts that create or unlock value over our investment time horizon should return value for shareholders over a complete market cycle.
Wells Fargo Classic Value Fund | 9
Fund expenses (unaudited)
As a shareholder of the Fund, you incur two types of costs: (1) transaction costs, including sales charges (loads) on purchase payments and contingent deferred sales charges (if any) on redemptions and (2) ongoing costs, including management fees, distribution (12b-1) and/or shareholder servicing fees, and other Fund expenses. This example is intended to help you understand your ongoing costs (in dollars) of investing in the Fund and to compare these costs with the ongoing costs of investing in other mutual funds.
The example is based on an investment of $1,000 invested at the beginning of the six-month period and held for the entire period from February 1, 2019 to July 31, 2019.
Actual expenses
The “Actual” line of the table below provides information about actual account values and actual expenses. You may use the information in this line, together with the amount you invested, to estimate the expenses that you paid over the period. Simply divide your account value by $1,000 (for example, an $8,600 account value divided by $1,000 = 8.6), then multiply the result by the number in the “Actual” line under the heading entitled “Expenses paid during period” for your applicable class of shares to estimate the expenses you paid on your account during this period.
Hypothetical example for comparison purposes
The “Hypothetical” line of the table below provides information about hypothetical account values and hypothetical expenses based on the Fund’s actual expense ratio and an assumed rate of return of 5% per year before expenses, which is not the Fund’s actual return. The hypothetical account values and expenses may not be used to estimate the actual ending account balance or expenses you paid for the period. You may use this information to compare the ongoing costs of investing in the Fund and other funds. To do so, compare this 5% hypothetical example with the 5% hypothetical examples that appear in the shareholder reports of the other funds.
Please note that the expenses shown in the table are meant to highlight your ongoing costs only and do not reflect any transactional costs, such as sales charges (loads) and contingent deferred sales charges. Therefore, the “Hypothetical” line of the table is useful in comparing ongoing costs only and will not help you determine the relative total costs of owning different funds. In addition, if these transactional costs were included, your costs would have been higher.
| | | | | | | | | | | | | | | | |
| | | Beginning
account value
2-1-2019 | | | Ending
account value
7-31-2019 | | | Expenses
paid during
the period¹ | | | Annualized net
expense ratio | |
| | | | | |
Class A | | | | | | | | | | | | | | | | |
| | | | |
Actual | | $ | 1,000.00 | | | $ | 1,128.01 | | | $ | 5.80 | | | | 1.10 | % |
| | | | |
Hypothetical (5% return before expenses) | | $ | 1,000.00 | | | $ | 1,019.34 | | | $ | 5.51 | | | | 1.10 | % |
| | | | | |
Class C | | | | | | | | | | | | | | | | |
| | | | |
Actual | | $ | 1,000.00 | | | $ | 1,123.35 | | | $ | 9.79 | | | | 1.86 | % |
| | | | |
Hypothetical (5% return before expenses) | | $ | 1,000.00 | | | $ | 1,015.57 | | | $ | 9.30 | | | | 1.86 | % |
| | | | | |
Class R | | | | | | | | | | | | | | | | |
| | | | |
Actual | | $ | 1,000.00 | | | $ | 1,126.06 | | | $ | 7.17 | | | | 1.36 | % |
| | | | |
Hypothetical (5% return before expenses) | | $ | 1,000.00 | | | $ | 1,018.05 | | | $ | 6.80 | | | | 1.36 | % |
| | | | | |
Class R6 | | | | | | | | | | | | | | | | |
| | | | |
Actual | | $ | 1,000.00 | | | $ | 1,131.23 | | | $ | 3.43 | | | | 0.65 | % |
| | | | |
Hypothetical (5% return before expenses) | | $ | 1,000.00 | | | $ | 1,021.57 | | | $ | 3.26 | | | | 0.65 | % |
| | | | | |
Administrator Class | | | | | | | | | | | | | | | | |
| | | | |
Actual | | $ | 1,000.00 | | | $ | 1,128.27 | | | $ | 5.01 | | | | 0.95 | % |
| | | | |
Hypothetical (5% return before expenses) | | $ | 1,000.00 | | | $ | 1,020.08 | | | $ | 4.76 | | | | 0.95 | % |
| | | | | |
Institutional Class | | | | | | | | | | | | | | | | |
| | | | |
Actual | | $ | 1,000.00 | | | $ | 1,129.91 | | | $ | 3.70 | | | | 0.70 | % |
| | | | |
Hypothetical (5% return before expenses) | | $ | 1,000.00 | | | $ | 1,021.32 | | | $ | 3.51 | | | | 0.70 | % |
| 1 | Expenses paid is equal to the annualized net expense ratio of each class multiplied by the average account value over the period, multiplied by the number of days in the most recent fiscal half-year divided by the number of days in the fiscal year (to reflect the one-half-year period). |
10 | Wells Fargo Classic Value Fund
Portfolio of investments—July 31, 2019
| | | | | | | | | | | | | | | | |
| | | | | | | | | Shares | | | Value | |
| Common Stocks: 97.65% | | | | | | | | | | | | | | | | |
| | | | |
Communication Services: 11.03% | | | | | | | | | | | | | | | | |
| | | | |
| Diversified Telecommunication Services: 2.29% | | | | | | | | | | | | |
| | | | |
Verizon Communications Incorporated | | | | | | | | | | | 362,400 | | | $ | 20,029,848 | |
| | | | | | | | | | | | | | | | |
| | | | |
| Entertainment: 2.39% | | | | | | | | | | | | |
| | | | |
The Walt Disney Company | | | | | | | | | | | 145,800 | | | | 20,850,858 | |
| | | | | | | | | | | | | | | | |
| | | | |
| Interactive Media & Services: 3.01% | | | | | | | | | | | | |
| | | | |
Alphabet Incorporated Class C † | | | | | | | | | | | 21,600 | | | | 26,280,288 | |
| | | | | | | | | | | | | | | | |
| | | | |
| Media: 3.34% | | | | | | | | | | | | |
| | | | |
Comcast Corporation Class A | | | | | | | | | | | 676,800 | | | | 29,217,456 | |
| | | | | | | | | | | | | | | | |
| | | | |
Consumer Discretionary: 5.25% | | | | | | | | | | | | | | | | |
| | | | |
| Multiline Retail: 2.92% | | | | | | | | | | | | |
| | | | |
Dollar Tree Incorporated † | | | | | | | | | | | 250,500 | | | | 25,488,375 | |
| | | | | | | | | | | | | | | | |
| | | | |
| Specialty Retail: 2.33% | | | | | | | | | | | | |
| | | | |
Advance Auto Parts Incorporated | | | | | | | | | | | 135,500 | | | | 20,411,720 | |
| | | | | | | | | | | | | | | | |
| | | | |
Consumer Staples: 8.81% | | | | | | | | | | | | | | | | |
| | | | |
| Food Products: 8.81% | | | | | | | | | | | | |
| | | | |
Archer Daniels Midland Company | | | | | | | | | | | 496,000 | | | | 20,375,680 | |
| | | | |
ConAgra Foods Incorporated | | | | | | | | | | | 324,200 | | | | 9,359,654 | |
| | | | |
Kellogg Company | | | | | | | | | | | 321,500 | | | | 18,717,730 | |
| | | | |
Mondelez International Incorporated Class A | | | | | | | | | | | 532,700 | | | | 28,494,123 | |
| | | | |
| | | | | | | | | | | | | | | 76,947,187 | |
| | | | | | | | | | | | | | | | |
| | | | |
Energy: 7.83% | | | | | | | | | | | | | | | | |
| | | | |
| Energy Equipment & Services: 1.63% | | | | | | | | | | | | |
| | | | |
Schlumberger Limited | | | | | | | | | | | 266,900 | | | | 10,667,993 | |
| | | | |
TechnipFMC plc | | | | | | | | | | | 130,000 | | | | 3,580,200 | |
| | | | |
| | | | | | | | | | | | | | | 14,248,193 | |
| | | | | | | | | | | | | | | | |
| | | | |
| Oil, Gas & Consumable Fuels: 6.20% | | | | | | | | | | | | |
| | | | |
Chevron Corporation | | | | | | | | | | | 170,800 | | | | 21,027,188 | |
| | | | |
ConocoPhillips | | | | | | | | | | | 289,703 | | | | 17,115,653 | |
| | | | |
EOG Resources Incorporated | | | | | | | | | | | 186,200 | | | | 15,985,270 | |
| | | | |
| | | | | | | | | | | | | | | 54,128,111 | |
| | | | | | | | | | | | | | | | |
| | | | |
Financials: 23.95% | | | | | | | | | | | | | | | | |
| | | | |
| Banks: 15.37% | | | | | | | | | | | | |
| | | | |
Bank of America Corporation | | | | | | | | | | | 724,100 | | | | 22,215,388 | |
| | | | |
BB&T Corporation | | | | | | | | | | | 435,800 | | | | 22,456,774 | |
| | | | |
CIT Group Incorporated | | | | | | | | | | | 435,200 | | | | 21,999,360 | |
| | | | |
JPMorgan Chase & Company | | | | | | | | | | | 173,600 | | | | 20,137,600 | |
| | | | |
PNC Financial Services Group Incorporated | | | | | | | | | | | 160,500 | | | | 22,935,450 | |
| | | | |
US Bancorp | | | | | | | | | | | 430,200 | | | | 24,585,930 | |
| | | | |
| | | | | | | | | | | | | | | 134,330,502 | |
| | | | | | | | | | | | | | | | |
| | | | |
| Capital Markets: 2.06% | | | | | | | | | | | | |
| | | | |
Intercontinental Exchange Incorporated | | | | | | | | | | | 204,800 | | | | 17,993,728 | |
| | | | | | | | | | | | | | | | |
The accompanying notes are an integral part of these financial statements.
Wells Fargo Classic Value Fund | 11
Portfolio of investments—July 31, 2019
| | | | | | | | | | | | | | | | |
| | | | | | | | | Shares | | | Value | |
| Consumer Finance: 1.65% | | | | | | | | | | | | |
| | | | |
Synchrony Financial | | | | | | | | | | | 401,900 | | | $ | 14,420,172 | |
| | | | | | | | | | | | | | | | |
| | | | |
| Insurance: 4.87% | | | | | | | | | | | | |
| | | | |
American International Group Incorporated | | | | | | | | | | | 383,300 | | | | 21,460,967 | |
| | | | |
The Allstate Corporation | | | | | | | | | | | 196,300 | | | | 21,082,620 | |
| | | | |
| | | | | | | | | | | | | | | 42,543,587 | |
| | | | | | | | | | | | | | | | |
| | | | |
Health Care: 15.11% | | | | | | | | | | | | | | | | |
| | | | |
| Biotechnology: 2.32% | | | | | | | | | | | | |
| | | | |
Gilead Sciences Incorporated | | | | | | | | | | | 309,000 | | | | 20,245,680 | |
| | | | | | | | | | | | | | | | |
| | | | |
| Health Care Equipment & Supplies: 3.24% | | | | | | | | | | | | |
| | | | |
Medtronic plc | | | | | | | | | | | 277,900 | | | | 28,329,126 | |
| | | | | | | | | | | | | | | | |
| | | | |
| Health Care Providers & Services: 5.27% | | | | | | | | | | | | |
| | | | |
Cigna Corporation | | | | | | | | | | | 134,500 | | | | 22,854,240 | |
| | | | |
Henry Schein Incorporated † | | | | | | | | | | | 348,000 | | | | 23,155,920 | |
| | | | |
| | | | | | | | | | | | | | | 46,010,160 | |
| | | | | | | | | | | | | | | | |
| | | | |
| Pharmaceuticals: 4.28% | | | | | | | | | | | | |
| | | | |
Eli Lilly & Company | | | | | | | | | | | 101,000 | | | | 11,003,950 | |
| | | | |
Merck & Company Incorporated | | | | | | | | | | | 318,000 | | | | 26,390,820 | |
| | | | |
| | | | | | | | | | | | | | | 37,394,770 | |
| | | | | | | | | | | | | | | | |
| | | | |
Industrials: 9.05% | | | | | | | | | | | | | | | | |
| | | | |
| Aerospace & Defense: 2.56% | | | | | | | | | | | | |
| | | | |
General Dynamics Corporation | | | | | | | | | | | 120,300 | | | | 22,368,582 | |
| | | | | | | | | | | | | | | | |
| | | | |
| Air Freight & Logistics: 1.80% | | | | | | | | | | | | |
| | | | |
United Parcel Service Incorporated Class B | | | | | | | | | | | 131,600 | | | | 15,722,252 | |
| | | | | | | | | | | | | | | | |
| | | | |
| Electrical Equipment: 0.80% | | | | | | | | | | | | |
| | | | |
Sensata Technologies Holding plc † | | | | | | | | | | | 147,400 | | | | 6,991,182 | |
| | | | | | | | | | | | | | | | |
| | | | |
| Industrial Conglomerates: 2.82% | | | | | | | | | | | | |
| | | | |
Honeywell International Incorporated | | | | | | | | | | | 143,200 | | | | 24,696,272 | |
| | | | | | | | | | | | | | | | |
| | | | |
| Trading Companies & Distributors: 1.07% | | | | | | | | | | | | |
| | | | |
AerCap Holdings NV † | | | | | | | | | | | 171,000 | | | | 9,324,630 | |
| | | | | | | | | | | | | | | | |
| | | | |
Information Technology: 11.43% | | | | | | | | | | | | | | | | |
| | | | |
| Communications Equipment: 4.36% | | | | | | | | | | | | |
| | | | |
Cisco Systems Incorporated | | | | | | | | | | | 302,100 | | | | 16,736,340 | |
| | | | |
Motorola Solutions Incorporated | | | | | | | | | | | 128,900 | | | | 21,392,244 | |
| | | | |
| | | | | | | | | | | | | | | 38,128,584 | |
| | | | | | | | | | | | | | | | |
| | | | |
| Semiconductors & Semiconductor Equipment: 2.86% | | | | | | | | | | | | |
| | | | |
NXP Semiconductors NV | | | | | | | | | | | 241,400 | | | | 24,958,346 | |
| | | | | | | | | | | | | | | | |
| | | | |
| Software: 2.49% | | | | | | | | | | | | |
| | | | |
Microsoft Corporation | | | | | | | | | | | 159,900 | | | | 21,789,573 | |
| | | | | | | | | | | | | | | | |
| | | | |
| Technology Hardware, Storage & Peripherals: 1.72% | | | | | | | | | | | | |
| | | | |
Apple Incorporated | | | | | | | | | | | 70,500 | | | | 15,019,320 | |
| | | | | | | | | | | | | | | | |
The accompanying notes are an integral part of these financial statements.
12 | Wells Fargo Classic Value Fund
Portfolio of investments—July 31, 2019
| | | | | | | | | | | | | | | | |
| | | | | | | | | Shares | | | Value | |
Materials: 2.93% | | | | | | | | | | | | | | | | |
| | | | |
| Construction Materials: 2.93% | | | | | | | | | | | | |
| | | | |
Vulcan Materials Company | | | | | | | | | | | 184,800 | | | $ | 25,567,080 | |
| | | | | | | | | | | | | | | | |
| | | | |
Utilities: 2.26% | | | | | | | | | | | | | | | | |
| | | | |
| Electric Utilities: 2.26% | | | | | | | | | | | | |
| | | | |
NextEra Energy Incorporated | | | | | | | | | | | 95,200 | | | | 19,722,584 | |
| | | | | | | | | | | | | | | | |
| | | | |
Total Common Stocks (Cost $657,285,582) | | | | | | | | | | | | | | | 853,158,166 | |
| | | | | | | | | | | | | | | | |
| | | | |
| | | | | | | | | | | | | | | | |
| | | Yield | | | | | | | | | | |
| Short-Term Investments: 2.43% | | | | | | | | | | | | |
| | | | |
| Investment Companies: 2.43% | | | | | | | | | | | | |
| | | | |
Wells Fargo Government Money Market Fund Select Class (l)(u) | | | 2.26 | % | | | | | | | 21,251,512 | | | | 21,251,512 | |
| | | | | | | | | | | | | | | | |
| | | | |
Total Short-Term Investments (Cost $21,251,512) | | | | | | | | | | | | | | | 21,251,512 | |
| | | | | | | | | | | | | | | | |
| | | | | | | | |
| Total investments in securities (Cost $678,537,094) | | | 100.08 | % | | | 874,409,678 | |
| | |
Other assets and liabilities, net | | | (0.08 | ) | | | (700,045 | ) |
| | | | | | | | |
| Total net assets | | | 100.00 | % | | $ | 873,709,633 | |
| | | | | | | | |
| † | Non-income-earning security |
| (l) | The issuer of the security is an affiliated person of the Fund as defined in the Investment Company Act of 1940. |
| (u) | The rate represents the 7-day annualized yield at period end. |
Investments in Affiliates
An affiliated investment is an investment in which the Fund owns at least 5% of the outstanding voting shares of the issuer or as a result of other relationships, such as the Fund and the issuer having the same investment manager. Transactions with issuers that were either affiliated persons of the Fund at the beginning of the period or the end of the period were as follows:
| | | | | | | | | | | | | | | | | | | | | | | | | | | | | | | | | | | | |
| | | Shares,
beginning
of period | | | Shares
purchased | | | Shares
sold | | | Shares,
end of
period | | | Net
realized
gains
(losses) | | | Net
change in
unrealized
gains
(losses) | | | Income
from
affiliated
securities | | | Value,
end
of period | | | % of
net
assets | |
Short-Term Investments | | | | | | | | | | | | | | | | | | | | | | | | | | | | | | | | | | | | |
Investment Companies | | | | | | | | | | | | | | | | | | | | | | | | | | | | | | | | | | | | |
Securities Lending Cash Investments LLC * | | | 22,455,104 | | | | 140,486,684 | | | | 162,941,788 | | | | 0 | | | $ | 1,459 | | | $ | 0 | | | $ | 358,002 | # | | $ | 0 | | | | | |
Wells Fargo Government Money Market Fund Select Class | | | 9,615,845 | | | | 201,440,126 | | | | 189,804,459 | | | | 21,251,512 | | | | 0 | | | | 0 | | | | 239,395 | | | | 21,251,512 | | | | | |
| | | | | | | | | | | | | | | | | | | | | | | | | | | | | | | | | | | | |
| | | | | | | | | | | | | | | | | | $ | 1,459 | | | $ | 0 | | | $ | 597,397 | | | $ | 21,251,512 | | | | 2.43 | % |
| | | | | | | | | | | | | | | | | | | | | | | | | | | | | | | | | | | | |
| * | No longer held at the end of the period. |
| # | Amount shown represents income before fees and rebates. |
The accompanying notes are an integral part of these financial statements.
Wells Fargo Classic Value Fund | 13
Statement of assets and liabilities—July 31, 2019
| | | | |
| | | | |
| |
Assets | | | | |
Investments in unaffiliated securities, at value (cost $657,285,582) | | $ | 853,158,166 | |
Investments in affiliated securities, at value (cost $21,251,512) | | | 21,251,512 | |
Receivable for Fund shares sold | | | 16,205 | |
Receivable for dividends | | | 853,464 | |
Prepaid expenses and other assets | | | 6,652 | |
| | | | |
Total assets | | | 875,285,999 | |
| | | | |
| |
Liabilities | | | | |
Payable for Fund shares redeemed | | | 687,604 | |
Management fee payable | | | 416,630 | |
Shareholder servicing fees payable | | | 159,933 | |
Administration fees payable | | | 116,657 | |
Distribution fees payable | | | 4,757 | |
Trustees’ fees and expenses payable | | | 4,526 | |
Accrued expenses and other liabilities | | | 186,259 | |
| | | | |
Total liabilities | | | 1,576,366 | |
| | | | |
Total net assets | | $ | 873,709,633 | |
| | | | |
| |
Net assets consist of | | | | |
Paid-in capital | | $ | 603,912,301 | |
Total distributable earnings | | | 269,797,332 | |
| | | | |
Total net assets | | $ | 873,709,633 | |
| | | | |
| |
Computation of net asset value and offering price per share | | | | |
Net assets – Class A | | $ | 291,110,555 | |
Shares outstanding – Class A1 | | | 22,170,919 | |
Net asset value per share – Class A | | | $13.13 | |
Maximum offering price per share – Class A2 | | | $13.93 | |
Net assets – Class C | | $ | 7,370,148 | |
Shares outstanding – Class C1 | | | 577,879 | |
Net asset value per share – Class C | | | $12.75 | |
Net assets – Class R | | $ | 87,680 | |
Shares outstanding – Class R1 | | | 6,633 | |
Net asset value per share – Class R | | | $13.22 | |
Net assets – Class R6 | | $ | 4,231,324 | |
Shares outstanding – Class R61 | | | 327,350 | |
Net asset value per share – Class R6 | | | $12.93 | |
Net assets – Administrator Class | | $ | 464,041,313 | |
Shares outstanding – Administrator Class1 | | | 33,603,751 | |
Net asset value per share – Administrator Class | | | $13.81 | |
Net assets – Institutional Class | | $ | 106,868,613 | |
Shares outstanding – Institutional Class1 | | | 8,083,949 | |
Net asset value per share – Institutional Class | | | $13.22 | |
| 1 | The Fund has an unlimited number of authorized shares. |
| 2 | Maximum offering price is computed as 100/94.25 of net asset value. On investments of $50,000 or more, the offering price is reduced. |
The accompanying notes are an integral part of these financial statements.
14 | Wells Fargo Classic Value Fund
Statement of operations—year ended July 31, 2019
| | | | |
| | | | |
| |
Investment income | | | | |
Dividends (net of foreign withholding taxes of $260,917) | | $ | 15,983,955 | |
Income from affiliated securities | | | 431,064 | |
| | | | |
Total investment income | | | 16,415,019 | |
| | | | |
| |
Expenses | | | | |
Management fee | | | 5,916,910 | |
Administration fees | | | | |
Class A | | | 586,743 | |
Class C | | | 28,303 | |
Class R | | | 162 | |
Class R6 | | | 477 | |
Administrator Class | | | 583,043 | |
Institutional Class | | | 149,526 | |
Shareholder servicing fees | | | | |
Class A | | | 673,520 | |
Class C | | | 33,693 | |
Class R | | | 193 | |
Administrator Class | | | 1,118,472 | |
Distribution fees | | | | |
Class C | | | 101,057 | |
Class R | | | 187 | |
Custody and accounting fees | | | 35,153 | |
Professional fees | | | 44,778 | |
Registration fees | | | 100,028 | |
Shareholder report expenses | | | 89,998 | |
Trustees’ fees and expenses | | | 21,999 | |
Other fees and expenses | | | 29,199 | |
| | | | |
Total expenses | | | 9,513,441 | |
Less: Fee waivers and/or expense reimbursements | | | (1,112,124 | ) |
| | | | |
Net expenses | | | 8,401,317 | |
| | | | |
Net investment income | | | 8,013,702 | |
| | | | |
| |
Realized and unrealized gains (losses) on investments | | | | |
Net realized gains on | | | | |
Unaffiliated securities | | | 76,995,283 | |
Affiliated securities | | | 1,459 | |
| | | | |
Net realized gains on investments | | | 76,996,742 | |
Net change in unrealized gains (losses) on investments | | | (13,962,337 | ) |
| | | | |
Net realized and unrealized gains (losses) on investments | | | 63,034,405 | |
| | | | |
Net increase in net assets resulting from operations | | $ | 71,048,107 | |
| | | | |
The accompanying notes are an integral part of these financial statements.
Wells Fargo Classic Value Fund | 15
Statement of changes in net assets
| | | | | | | | | | | | | | | | |
| | | Year ended July 31, 2019 | | | Year ended July 31, 20181 | |
| | | | |
Operations | | | | | | | | | | | | | | | | |
Net investment income | | | | | | $ | 8,013,702 | | | | | | | $ | 8,762,212 | |
Net realized gains on investments | | | | | | | 76,996,742 | | | | | | | | 72,505,918 | |
Net change in unrealized gains (losses) on investments | | | | | | | (13,962,337 | ) | | | | | | | 27,765,454 | |
| | | | |
Net increase in net assets resulting from operations | | | | | | | 71,048,107 | | | | | | | | 109,033,584 | |
| | | | |
| | | | |
Distributions to shareholders from net investment income and net realized gains | | | | | | | | | | | | | | | | |
Class A | | | | | | | (20,592,244 | ) | | | | | | | (23,575,879 | ) |
Class C | | | | | | | (1,289,606 | ) | | | | | | | (1,660,929 | ) |
Class R | | | | | | | (5,465 | ) | | | | | | | (4,009 | ) |
Class R6 | | | | | | | (8,549 | ) | | | | | | | (208,873 | ) |
Administrator Class | | | | | | | (32,970,858 | ) | | | | | | | (36,749,268 | ) |
Institutional Class | | | | | | | (9,914,802 | ) | | | | | | | (12,727,579 | ) |
| | | | |
Total distributions to shareholders | | | | | | | (64,781,524 | ) | | | | | | | (74,926,537 | ) |
| | | | |
| | | | |
Capital share transactions | | | Shares | | | | | | | | Shares | | | | | |
Proceeds from shares sold | | | | | | | | | | | | | | | | |
Class A | | | 1,095,957 | | | | 13,103,460 | | | | 331,519 | | | | 4,190,768 | |
Class C | | | 39,212 | | | | 474,330 | | | | 19,728 | | | | 240,572 | |
Class R | | | 620 | | | | 7,723 | | | | 1,671 | | | | 20,842 | |
Class R6 | | | 338,872 | | | | 4,112,428 | | | | 12,234 | | | | 151,356 | |
Administrator Class | | | 156,229 | | | | 2,025,198 | | | | 128,470 | | | | 1,686,875 | |
Institutional Class | | | 340,168 | | | | 4,276,101 | | | | 594,996 | | | | 7,543,156 | |
| | | | |
| | | | | | | 23,999,240 | | | | | | | | 13,833,569 | |
| | | | |
Reinvestment of distributions | | | | | | | | | | | | | | | | |
Class A | | | 1,707,185 | | | | 19,644,349 | | | | 1,816,483 | | | | 22,389,992 | |
Class C | | | 110,427 | | | | 1,234,002 | | | | 131,832 | | | | 1,579,351 | |
Class R | | | 372 | | | | 4,309 | | | | 220 | | | | 2,728 | |
Class R6 | | | 65 | | | | 713 | | | | 16,488 | | | | 201,277 | |
Administrator Class | | | 2,569,095 | | | | 31,093,029 | | | | 2,684,570 | | | | 34,693,107 | |
Institutional Class | | | 740,566 | | | | 8,584,300 | | | | 901,012 | | | | 11,188,786 | |
| | | | |
| | | | | | | 60,560,702 | | | | | | | | 70,055,241 | |
| | | | |
Payment for shares redeemed | | | | | | | | | | | | | | | | |
Class A | | | (2,824,686 | ) | | | (34,934,918 | ) | | | (3,243,108 | ) | | | (40,904,939 | ) |
Class C | | | (1,137,730 | ) | | | (13,185,582 | ) | | | (349,959 | ) | | | (4,293,957 | ) |
Class R | | | (1 | ) | | | (14 | ) | | | (33 | ) | | | (423 | ) |
Class R4 | | | N/A | | | | N/A | | | | (1,342 | )2 | | | (17,226 | )2 |
Class R6 | | | (211,115 | ) | | | (2,800,996 | ) | | | (21,179 | ) | | | (269,458 | ) |
Administrator Class | | | (3,428,830 | ) | | | (44,447,112 | ) | | | (3,402,317 | ) | | | (44,953,219 | ) |
Institutional Class | | | (3,443,010 | ) | | | (40,683,763 | ) | | | (3,859,490 | ) | | | (48,539,311 | ) |
| | | | |
| | | | | | | (136,052,385 | ) | | | | | | | (138,978,533 | ) |
| | | | |
Net decrease in net assets resulting from capital share transactions | | | | | | | (51,492,443 | ) | | | | | | | (55,089,723 | ) |
| | | | |
Total decrease in net assets | | | | | | | (45,225,860 | ) | | | | | | | (20,982,676 | ) |
| | | | |
| | | | |
Net assets | | | | | | | | | | | | | | | | |
Beginning of period | | | | | | | 918,935,493 | | | | | | | | 939,918,169 | |
| | | | |
End of period | | | | | | $ | 873,709,633 | | | | | | | $ | 918,935,493 | |
| | | | |
| 1 | Effective for all filings after November 4, 2018, the SEC prospectively eliminated the requirement to parenthetically disclose undistributed net investment income at the end of the period and permitted the aggregation of distributions, with the exception of tax basis returns of capital. Undistributed net investment income at July 31, 2018 was $7,412,219. The disaggregated distributions information for the year ended July 31, 2018 is included in Note 8,Distributions to Shareholders, in the notes to the financial statements. |
| 2 | For the period from August 1, 2017 to November 13, 2017. Effective at the close of business on November 13, 2017, Class R4 shares were liquidated and the class was subsequently closed. Class R4 shares are no longer offered by the Fund, |
The accompanying notes are an integral part of these financial statements.
16 | Wells Fargo Classic Value Fund
Financial highlights
(For a share outstanding throughout each period)
| | | | | | | | | | | | | | | | | | | | |
| | | Year ended July 31 | |
| CLASS A | | 2019 | | | 2018 | | | 2017 | | | 2016 | | | 2015 | |
Net asset value, beginning of period | | | $13.05 | | | | $12.61 | | | | $12.01 | | | | $13.73 | | | | $13.60 | |
Net investment income | | | 0.10 | | | | 0.11 | | | | 0.12 | 1 | | | 0.13 | | | | 0.10 | |
Net realized and unrealized gains (losses) on investments | | | 0.94 | | | | 1.39 | | | | 1.43 | | | | (0.42 | ) | | | 1.09 | |
| | | | | | | | | | | | | | | | | | | | |
Total from investment operations | | | 1.04 | | | | 1.50 | | | | 1.55 | | | | (0.29 | ) | | | 1.19 | |
Distributions to shareholders from | | | | | | | | | | | | | | | | | | | | |
Net investment income | | | (0.12 | ) | | | (0.06 | ) | | | (0.14 | ) | | | (0.11 | ) | | | (0.07 | ) |
Net realized gains | | | (0.84 | ) | | | (1.00 | ) | | | (0.81 | ) | | | (1.32 | ) | | | (0.99 | ) |
| | | | | | | | | | | | | | | | | | | | |
Total distributions to shareholders | | | (0.96 | ) | | | (1.06 | ) | | | (0.95 | ) | | | (1.43 | ) | | | (1.06 | ) |
Net asset value, end of period | | | $13.13 | | | | $13.05 | | | | $12.61 | | | | $12.01 | | | | $13.73 | |
Total return2 | | | 9.03 | % | | | 12.43 | % | | | 13.50 | % | | | (1.73 | )% | | | 9.19 | % |
Ratios to average net assets (annualized) | | | | | | | | | | | | | | | | | | | | |
Gross expenses | | | 1.18 | % | | | 1.18 | % | | | 1.17 | % | | | 1.17 | % | | | 1.20 | % |
Net expenses | | | 1.10 | % | | | 1.10 | % | | | 1.10 | % | | | 1.10 | % | | | 1.16 | % |
Net investment income | | | 0.81 | % | | | 0.83 | % | | | 0.95 | % | | | 1.12 | % | | | 0.75 | % |
Supplemental data | | | | | | | | | | | | | | | | | | | | |
Portfolio turnover rate | | | 27 | % | | | 21 | % | | | 27 | % | | | 34 | % | | | 29 | % |
Net assets, end of period (000s omitted) | | | $291,111 | | | | $289,683 | | | | $293,599 | | | | $318,543 | | | | $372,443 | |
| 1 | Calculated based upon average shares outstanding |
| 2 | Total return calculations do not include any sales charges. |
The accompanying notes are an integral part of these financial statements.
Wells Fargo Classic Value Fund | 17
Financial highlights
(For a share outstanding throughout each period)
| | | | | | | | | | | | | | | | | | | | |
| | | Year ended July 31 | |
| CLASS C | | 2019 | | | 2018 | | | 2017 | | | 2016 | | | 2015 | |
Net asset value, beginning of period | | | $12.69 | | | | $12.31 | | | | $11.74 | | | | $13.45 | | | | $13.36 | |
Net investment income | | | 0.00 | 1,2 | | | 0.01 | 1 | | | 0.02 | 1 | | | 0.03 | | | | 0.00 | 2 |
Net realized and unrealized gains (losses) on investments | | | 0.92 | | | | 1.37 | | | | 1.40 | | | | (0.41 | ) | | | 1.08 | |
| | | | | | | | | | | | | | | | | | | | |
Total from investment operations | | | 0.92 | | | | 1.38 | | | | 1.42 | | | | (0.38 | ) | | | 1.08 | |
Distributions to shareholders from | | | | | | | | | | | | | | | | | | | | |
Net investment income | | | (0.02 | ) | | | 0.00 | | | | (0.04 | ) | | | (0.01 | ) | | | 0.00 | |
Net realized gains | | | (0.84 | ) | | | (1.00 | ) | | | (0.81 | ) | | | (1.32 | ) | | | (0.99 | ) |
| | | | | | | | | | | | | | | | | | | | |
Total distributions to shareholders | | | (0.86 | ) | | | (1.00 | ) | | | (0.85 | ) | | | (1.33 | ) | | | (0.99 | ) |
Net asset value, end of period | | | $12.75 | | | | $12.69 | | | | $12.31 | | | | $11.74 | | | | $13.45 | |
Total return3 | | | 8.16 | % | | | 11.65 | % | | | 12.58 | % | | | (2.47 | )% | | | 8.42 | % |
Ratios to average net assets (annualized) | | | | | | | | | | | | | | | | | | | | |
Gross expenses | | | 1.94 | % | | | 1.93 | % | | | 1.93 | % | | | 1.93 | % | | | 1.96 | % |
Net expenses | | | 1.86 | % | | | 1.86 | % | | | 1.86 | % | | | 1.86 | % | | | 1.91 | % |
Net investment income | | | 0.03 | % | | | 0.08 | % | | | 0.20 | % | | | 0.37 | % | | | 0.00 | % |
Supplemental data | | | | | | | | | | | | | | | | | | | | |
Portfolio turnover rate | | | 27 | % | | | 21 | % | | | 27 | % | | | 34 | % | | | 29 | % |
Net assets, end of period (000s omitted) | | | $7,370 | | | | $19,874 | | | | $21,727 | | | | $28,756 | | | | $36,098 | |
| 1 | Calculated based upon average shares outstanding |
| 2 | Amount is less than $0.005. |
| 3 | Total return calculations do not include any sales charges. |
The accompanying notes are an integral part of these financial statements.
18 | Wells Fargo Classic Value Fund
Financial highlights
(For a share outstanding throughout each period)
| | | | | | | | | | | | | | | | | | | | |
| | | Year ended July 31 | |
| CLASS R | | 2019 | | | 2018 | | | 2017 | | | 2016 | | | 2015 | |
Net asset value, beginning of period | | | $13.15 | | | | $12.70 | | | | $12.09 | | | | $13.81 | | | | $13.66 | |
Net investment income | | | 0.06 | | | | 0.05 | | | | 0.08 | 1 | | | 0.10 | | | | 0.05 | |
Net realized and unrealized gains (losses) on investments | | | 0.95 | | | | 1.44 | | | | 1.45 | | | | (0.43 | ) | | | 1.12 | |
| | | | | | | | | | | | | | | | | | | | |
Total from investment operations | | | 1.01 | | | | 1.49 | | | | 1.53 | | | | (0.33 | ) | | | 1.17 | |
Distributions to shareholders from | | | | | | | | | | | | | | | | | | | | |
Net investment income | | | (0.10 | ) | | | (0.04 | ) | | | (0.11 | ) | | | (0.07 | ) | | | (0.03 | ) |
Net realized gains | | | (0.84 | ) | | | (1.00 | ) | | | (0.81 | ) | | | (1.32 | ) | | | (0.99 | ) |
| | | | | | | | | | | | | | | | | | | | |
Total distributions to shareholders | | | (0.94 | ) | | | (1.04 | ) | | | (0.92 | ) | | | (1.39 | ) | | | (1.02 | ) |
Net asset value, end of period | | | $13.22 | | | | $13.15 | | | | $12.70 | | | | $12.09 | | | | $13.81 | |
Total return | | | 8.70 | % | | | 12.21 | % | | | 13.22 | % | | | (1.99 | )% | | | 8.96 | % |
Ratios to average net assets (annualized) | | | | | | | | | | | | | | | | | | | | |
Gross expenses | | | 1.43 | % | | | 1.44 | % | | | 1.44 | % | | | 1.44 | % | | | 1.47 | % |
Net expenses | | | 1.36 | % | | | 1.36 | % | | | 1.36 | % | | | 1.36 | % | | | 1.40 | % |
Net investment income | | | 0.55 | % | | | 0.56 | % | | | 0.69 | % | | | 0.86 | % | | | 0.50 | % |
Supplemental data | | | | | | | | | | | | | | | | | | | | |
Portfolio turnover rate | | | 27 | % | | | 21 | % | | | 27 | % | | | 34 | % | | | 29 | % |
Net assets, end of period (000s omitted) | | | $88 | | | | $74 | | | | $48 | | | | $43 | | | | $41 | |
| 1 | Calculated based upon average shares outstanding |
The accompanying notes are an integral part of these financial statements.
Wells Fargo Classic Value Fund | 19
Financial highlights
(For a share outstanding throughout each period)
| | | | | | | | | | | | | | | | | | | | |
| | | Year ended July 31 | |
| CLASS R6 | | 2019 | | | 2018 | | | 2017 | | | 2016 | | | 2015 | |
Net asset value, beginning of period | | | $12.92 | | | | $12.49 | | | | $11.90 | | | | $13.62 | | | | $13.60 | |
Net investment income | | | 0.16 | 1 | | | 0.16 | | | | 0.17 | 1 | | | 0.17 | | | | 0.17 | 1 |
Net realized and unrealized gains (losses) on investments | | | 1.00 | | | | 1.39 | | | | 1.42 | | | | (0.40 | ) | | | 1.08 | |
| | | | | | | | | | | | | | | | | | | | |
Total from investment operations | | | 1.16 | | | | 1.55 | | | | 1.59 | | | | (0.23 | ) | | | 1.25 | |
Distributions to shareholders from | | | | | | | | | | | | | | | | | | | | |
Net investment income | | | (0.31 | ) | | | (0.12 | ) | | | (0.19 | ) | | | (0.17 | ) | | | (0.24 | ) |
Net realized gains | | | (0.84 | ) | | | (1.00 | ) | | | (0.81 | ) | | | (1.32 | ) | | | (0.99 | ) |
| | | | | | | | | | | | | | | | | | | | |
Total distributions to shareholders | | | (1.15 | ) | | | (1.12 | ) | | | (1.00 | ) | | | (1.49 | ) | | | (1.23 | ) |
Net asset value, end of period | | | $12.93 | | | | $12.92 | | | | $12.49 | | | | $11.90 | | | | $13.62 | |
Total return | | | 10.38 | % | | | 12.96 | % | | | 14.03 | % | | | (1.30 | )% | | | 9.74 | % |
Ratios to average net assets (annualized) | | | | | | | | | | | | | | | | | | | | |
Gross expenses | | | 0.76 | % | | | 0.75 | % | | | 0.75 | % | | | 0.75 | % | | | 0.74 | % |
Net expenses | | | 0.65 | % | | | 0.65 | % | | | 0.65 | % | | | 0.65 | % | | | 0.65 | % |
Net investment income | | | 1.27 | % | | | 1.29 | % | | | 1.40 | % | | | 1.47 | % | | | 1.25 | % |
Supplemental data | | | | | | | | | | | | | | | | | | | | |
Portfolio turnover rate | | | 27 | % | | | 21 | % | | | 27 | % | | | 34 | % | | | 29 | % |
Net assets, end of period (000s omitted) | | | $4,231 | | | | $2,578 | | | | $2,397 | | | | $2,842 | | | | $169 | |
| 1 | Calculated based upon average shares outstanding |
The accompanying notes are an integral part of these financial statements.
20 | Wells Fargo Classic Value Fund
Financial highlights
(For a share outstanding throughout each period)
| | | | | | | | | | | | | | | | | | | | |
| | | Year ended July 31 | |
| ADMINISTRATOR CLASS | | 2019 | | | 2018 | | | 2017 | | | 2016 | | | 2015 | |
Net asset value, beginning of period | | | $13.68 | | | | $13.17 | | | | $12.51 | | | | $14.25 | | | | $14.08 | |
Net investment income | | | 0.12 | | | | 0.13 | | | | 0.14 | 1 | | | 0.15 | | | | 0.13 | |
Net realized and unrealized gains (losses) on investments | | | 1.00 | | | | 1.47 | | | | 1.49 | | | | (0.43 | ) | | | 1.14 | |
| | | | | | | | | | | | | | | | | | | | |
Total from investment operations | | | 1.12 | | | | 1.60 | | | | 1.63 | | | | (0.28 | ) | | | 1.27 | |
Distributions to shareholders from | | | | | | | | | | | | | | | | | | | | |
Net investment income | | | (0.15 | ) | | | (0.09 | ) | | | (0.16 | ) | | | (0.14 | ) | | | (0.11 | ) |
Net realized gains | | | (0.84 | ) | | | (1.00 | ) | | | (0.81 | ) | | | (1.32 | ) | | | (0.99 | ) |
| | | | | | | | | | | | | | | | | | | | |
Total distributions to shareholders | | | (0.99 | ) | | | (1.09 | ) | | | (0.97 | ) | | | (1.46 | ) | | | (1.10 | ) |
Net asset value, end of period | | | $13.81 | | | | $13.68 | | | | $13.17 | | | | $12.51 | | | | $14.25 | |
Total return | | | 9.21 | % | | | 12.63 | % | | | 13.66 | % | | | (1.58 | )% | | | 9.42 | % |
Ratios to average net assets (annualized) | | | | | | | | | | | | | | | | | | | | |
Gross expenses | | | 1.11 | % | | | 1.10 | % | | | 1.10 | % | | | 1.10 | % | | | 1.06 | % |
Net expenses | | | 0.95 | % | | | 0.95 | % | | | 0.95 | % | | | 0.95 | % | | | 0.95 | % |
Net investment income | | | 0.96 | % | | | 0.98 | % | | | 1.10 | % | | | 1.27 | % | | | 0.95 | % |
Supplemental data | | | | | | | | | | | | | | | | | | | | |
Portfolio turnover rate | | | 27 | % | | | 21 | % | | | 27 | % | | | 34 | % | | | 29 | % |
Net assets, end of period (000s omitted) | | | $464,041 | | | | $469,464 | | | | $459,650 | | | | $470,152 | | | | $529,293 | |
| 1 | Calculated based upon average shares outstanding |
The accompanying notes are an integral part of these financial statements.
Wells Fargo Classic Value Fund | 21
Financial highlights
(For a share outstanding throughout each period)
| | | | | | | | | | | | | | | | | | | | |
| | | Year ended July 31 | |
| INSTITUTIONAL CLASS | | 2019 | | | 2018 | | | 2017 | | | 2016 | | | 2015 | |
Net asset value, beginning of period | | | $13.14 | | | | $12.68 | | | | $12.08 | | | | $13.80 | | | | $13.67 | |
Net investment income | | | 0.15 | 1 | | | 0.22 | | | | 0.17 | 1 | | | 0.18 | | | | 0.15 | |
Net realized and unrealized gains (losses) on investments | | | 0.94 | | | | 1.35 | | | | 1.43 | | | | (0.41 | ) | | | 1.11 | |
| | | | | | | | | | | | | | | | | | | | |
Total from investment operations | | | 1.09 | | | | 1.57 | | | | 1.60 | | | | (0.23 | ) | | | 1.26 | |
Distributions to shareholders from | | | | | | | | | | | | | | | | | | | | |
Net investment income | | | (0.17 | ) | | | (0.11 | ) | | | (0.19 | ) | | | (0.17 | ) | | | (0.14 | ) |
Net realized gains | | | (0.84 | ) | | | (1.00 | ) | | | (0.81 | ) | | | (1.32 | ) | | | (0.99 | ) |
| | | | | | | | | | | | | | | | | | | | |
Total distributions to shareholders | | | (1.01 | ) | | | (1.11 | ) | | | (1.00 | ) | | | (1.49 | ) | | | (1.13 | ) |
Net asset value, end of period | | | $13.22 | | | | $13.14 | | | | $12.68 | | | | $12.08 | | | | $13.80 | |
Total return | | | 9.44 | % | | | 12.96 | % | | | 13.88 | % | | | (1.27 | )% | | | 9.66 | % |
Ratios to average net assets (annualized) | | | | | | | | | | | | | | | | | | | | |
Gross expenses | | | 0.86 | % | | | 0.85 | % | | | 0.85 | % | | | 0.85 | % | | | 0.79 | % |
Net expenses | | | 0.70 | % | | | 0.70 | % | | | 0.70 | % | | | 0.70 | % | | | 0.70 | % |
Net investment income | | | 1.22 | % | | | 1.24 | % | | | 1.36 | % | | | 1.52 | % | | | 1.20 | % |
Supplemental data | | | | | | | | | | | | | | | | | | | | |
Portfolio turnover rate | | | 27 | % | | | 21 | % | | | 27 | % | | | 34 | % | | | 29 | % |
Net assets, end of period (000s omitted) | | | $106,869 | | | | $137,263 | | | | $162,480 | | | | $215,175 | | | | $255,565 | |
| 1 | Calculated based upon average shares outstanding |
The accompanying notes are an integral part of these financial statements.
22 | Wells Fargo Classic Value Fund
Notes to financial statements
1. ORGANIZATION
Wells Fargo Funds Trust (the “Trust”), a Delaware statutory trust organized on March 10, 1999, is an open-end management investment company registered under the Investment Company Act of 1940, as amended (the “1940 Act”). As an investment company, the Trust follows the accounting and reporting guidance in Financial Accounting Standards Board (“FASB”) Accounting Standards Codification Topic 946, Financial Services – Investment Companies. These financial statements report on the Wells Fargo Classic Value Fund (formerly, Wells Fargo Intrinsic Value Fund) (the “Fund”) which is a diversified series of the Trust.
Effective at the close of business on November 13, 2017, Class R4 shares were liquidated and the class was subsequently closed. Class R4 shares are no longer offered by the Fund. Information for Class R4 shares reflected in the financial statements represents activity through November 13, 2017.
2. SIGNIFICANT ACCOUNTING POLICIES
The following significant accounting policies, which are consistently followed in the preparation of the financial statements of the Fund, are in conformity with U.S. generally accepted accounting principles which require management to make estimates and assumptions that affect the reported amounts of assets and liabilities, disclosure of contingent assets and liabilities at the date of the financial statements, and the reported amounts of revenues and expenses during the reporting period. Actual results could differ from those estimates.
Securities valuation
All investments are valued each business day as of the close of regular trading on the New York Stock Exchange (generally 4 p.m. Eastern Time), although the Fund may deviate from this calculation time under unusual or unexpected circumstances.
Equity securities that are listed on a foreign or domestic exchange or market are valued at the official closing price or, if none, the last sales price. If no sale occurs on the principal exchange or market that day, a fair value price will be determined in accordance with the Fund’s Valuation Procedures.
Investments in registered open-end investment companies are valued at net asset value. Interests in non-registered investment companies that are redeemable at net asset value are fair valued normally at net asset value.
Investments which are not valued using any of the methods discussed above are valued at their fair value, as determined in good faith by the Board of Trustees of the Fund. The Board of Trustees has established a Valuation Committee comprised of the Trustees and has delegated to it the authority to take any actions regarding the valuation of portfolio securities that the Valuation Committee deems necessary or appropriate, including determining the fair value of portfolio securities, unless the determination has been delegated to the Wells Fargo Asset Management Pricing Committee at Wells Fargo Funds Management, LLC (“Funds Management”). The Board of Trustees retains the authority to make or ratify any valuation decisions or approve any changes to the Valuation Procedures as it deems appropriate. On a quarterly basis, the Board of Trustees receives reports on any valuation actions taken by the Valuation Committee or the Wells Fargo Asset Management Pricing Committee which may include items for ratification.
Securities lending
The Fund may lend its securities from time to time in order to earn additional income in the form of fees or interest on securities received as collateral or the investment of any cash received as collateral. When securities are on loan, the Fund receives interest or dividends on those securities. Cash collateral received in connection with its securities lending transactions is invested in Securities Lending Cash Investments, LLC (the “Securities Lending Fund”). Investments in Securities Lending Fund are valued at the evaluated bid price provided by an independent pricing service. Income earned from investment in the Securities Lending Fund (net of fees and rebates), if any, is included in income from affiliated securities on the Statement of Operations.
In a securities lending transaction, the net asset value of the Fund will be affected by an increase or decrease in the value of the securities loaned and by an increase or decrease in the value of the instrument in which collateral is invested. The amount of securities lending activity undertaken by the Fund fluctuates from time to time. The Fund has the right under the lending agreement to recover the securities from the borrower on demand. In the event of default or bankruptcy by the borrower, the Fund may be prevented from recovering the loaned securities or gaining access to the collateral or may experience delays or costs in doing so. In such an event, the terms of the agreement allows the unaffiliated securities lending agent to use the collateral to purchase replacement securities on behalf of the Fund or pay the Fund the market value of the loaned securities. The Fund will bear the risk of loss with respect to depreciation of its investment of the cash collateral.
Wells Fargo Classic Value Fund | 23
Notes to financial statements
Security transactions and income recognition
Securities transactions are recorded on a trade date basis. Realized gains or losses are recorded on the basis of identified cost.
Dividend income is recognized on the ex-dividend date. Dividend income is recorded net of foreign taxes withheld where recovery of such taxes is not assured.
Distributions to shareholders
Distributions to shareholders from net investment income and any net realized gains are recorded on the ex-dividend date and paid at least annually. Such distributions are determined in accordance with income tax regulations and may differ from U.S. generally accepted accounting principles. Dividend sources are estimated at the time of declaration. The tax character of distributions is determined as of the Fund’s fiscal year end. Therefore, a portion of the Fund’s distributions made prior to the Fund’s fiscal year end may be categorized as a tax return of capital at year end.
Federal and other taxes
The Fund intends to continue to qualify as a regulated investment company by distributing substantially all of its investment company taxable income and any net realized capital gains (after reduction for capital loss carryforwards) sufficient to relieve it from all, or substantially all, federal income taxes. Accordingly, no provision for federal income taxes was required.
The Fund’s income and federal excise tax returns and all financial records supporting those returns for the prior three fiscal years are subject to examination by the federal and Delaware revenue authorities. Management has analyzed the Fund’s tax positions taken on federal, state, and foreign tax returns for all open tax years and does not believe that there are any uncertain tax positions that require recognition of a tax liability.
As of July 31, 2019, the aggregate cost of all investments for federal income tax purposes was $679,586,733 and the unrealized gains (losses) consisted of:
| | | | |
| |
Gross unrealized gains | | $ | 213,932,903 | |
| |
Gross unrealized losses | | | (19,109,958 | ) |
| |
Net unrealized gains | | $ | 194,822,945 | |
Class allocations
The separate classes of shares offered by the Fund differ principally in applicable sales charges, distribution, shareholder servicing, and administration fees. Class specific expenses are charged directly to that share class. Investment income, common fund-level expenses, and realized and unrealized gains (losses) on investments are allocated daily to each class of shares based on the relative proportion of net assets of each class.
3. FAIR VALUATION MEASUREMENTS
Fair value measurements of investments are determined within a framework that has established a fair value hierarchy based upon the various data inputs utilized in determining the value of the Fund’s investments. The three-level hierarchy gives the highest priority to unadjusted quoted prices in active markets for identical assets or liabilities (Level 1) and the lowest priority to unobservable inputs (Level 3). The Fund’s investments are classified within the fair value hierarchy based on the lowest level of input that is significant to the fair value measurement. The inputs are summarized into three broad levels as follows:
| ∎ | | Level 1 – quoted prices in active markets for identical securities |
| ∎ | | Level 2 – other significant observable inputs (including quoted prices for similar securities, interest rates, prepayment speeds, credit risk, etc.) |
| ∎ | | Level 3 – significant unobservable inputs (including the Fund’s own assumptions in determining the fair value of investments) |
The inputs or methodologies used for valuing investments in securities are not necessarily an indication of the risk associated with investing in those securities.
24 | Wells Fargo Classic Value Fund
Notes to financial statements
The following is a summary of the inputs used in valuing the Fund’s assets and liabilities as of July 31, 2019:
| | | | | | | | | | | | | | | | |
| | | | |
| | | Quoted prices
(Level 1) | | | Other significant
observable inputs
(Level 2) | | | Significant
unobservable inputs (Level 3) | | | Total | |
| | | | |
Assets | | | | | | | | | | | | | | | | |
Investments in: | | | | | | | | | | | | | | | | |
| | | | |
Common stocks | | | | | | | | | | | | | | | | |
| | | | |
Communication services | | $ | 96,378,450 | | | $ | 0 | | | $ | 0 | | | $ | 96,378,450 | |
| | | | |
Consumer discretionary | | | 45,900,095 | | | | 0 | | | | 0 | | | | 45,900,095 | |
| | | | |
Consumer staples | | | 76,947,187 | | | | 0 | | | | 0 | | | | 76,947,187 | |
| | | | |
Energy | | | 68,376,304 | | | | 0 | | | | 0 | | | | 68,376,304 | |
| | | | |
Financials | | | 209,287,989 | | | | 0 | | | | 0 | | | | 209,287,989 | |
| | | | |
Health care | | | 131,979,736 | | | | 0 | | | | 0 | | | | 131,979,736 | |
| | | | |
Industrials | | | 79,102,918 | | | | 0 | | | | 0 | | | | 79,102,918 | |
| | | | |
Information technology | | | 99,895,823 | | | | 0 | | | | 0 | | | | 99,895,823 | |
| | | | |
Materials | | | 25,567,080 | | | | 0 | | | | 0 | | | | 25,567,080 | |
| | | | |
Utilities | | | 19,722,584 | | | | 0 | | | | 0 | | | | 19,722,584 | |
| | | | |
Short-term investments | | | | | | | | | | | | | | | | |
| | | | |
Investment companies | | | 21,251,512 | | | | 0 | | | | 0 | | | | 21,251,512 | |
| | | | |
Total assets | | $ | 874,409,678 | | | $ | 0 | | | $ | 0 | | | $ | 874,409,678 | |
Additional sector, industry or geographic detail is included in the Portfolio of Investments.
For the year ended July 31, 2019, the Fund did not have any transfers into/out of Level 3.
4. TRANSACTIONS WITH AFFILIATES
Management fee
Funds Management, an indirect wholly owned subsidiary of Wells Fargo & Company (“Wells Fargo”), is the manager of the Fund and provides advisory and fund-level administrative services under an investment management agreement. Under the investment management agreement, Funds Management is responsible for, among other services, implementing the investment objectives and strategies of the Fund, supervising the subadviser and providing fund-level administrative services in connection with the Fund’s operations. As compensation for its services under the investment management agreement, Funds Management is entitled to receive a management fee at the following annual rate based on the Fund’s average daily net assets:
| | | | |
| |
| Average daily net assets | | Management fee | |
| |
First $500 million | | | 0.700 | % |
| |
Next $500 million | | | 0.675 | |
| |
Next $1 billion | | | 0.650 | |
| |
Next $2 billion | | | 0.625 | |
| |
Next $1 billion | | | 0.600 | |
| |
Next $3 billion | | | 0.590 | |
| |
Next $2 billion | | | 0.565 | |
| |
Next $2 billion | | | 0.555 | |
| |
Next $4 billion | | | 0.530 | |
| |
Over $16 billion | | | 0.505 | |
For the year ended July 31, 2019, the management fee was equivalent to an annual rate of 0.69% of the Fund’s average daily net assets.
Funds Management has retained the services of a subadviser to provide daily portfolio management to the Fund. The fee for subadvisory services is borne by Funds Management. Wells Capital Management Incorporated (“WellsCap”), an affiliate of Funds Management and an indirect wholly owned subsidiary of Wells Fargo, is the subadviser to the Fund and is entitled to receive a fee from Funds Management at an annual rate starting at 0.35% and declining to 0.25% as the average daily net assets of the Fund increase.
Wells Fargo Classic Value Fund | 25
Notes to financial statements
Administration fees
Under a class-level administration agreement, Funds Management provides class-level administrative services to the Fund, which includes paying fees and expenses for services provided by the transfer agent, sub-transfer agents, omnibus account servicers and record-keepers. As compensation for its services under the class-level administration agreement, Funds Management receives an annual fee which is calculated based on the average daily net assets of each class as follows:
| | | | |
| |
| | | Class-level
administration fee | |
| |
Class A, Class C, Class R | | | 0.21 | % |
| |
Class R6 | | | 0.03 | |
| |
Administrator Class, Institutional Class | | | 0.13 | |
Waivers and/or expense reimbursements
Funds Management has contractually waived and/or reimbursed management and administration fees to the extent necessary to maintain certain net operating expense ratios for the Fund. When each class of the Fund has exceeded its expense cap, Funds Management has waived fees and/or reimbursed expenses from fund-level expenses on a proportionate basis and then from class specific expenses. When only certain classes exceed their expense caps, waivers and/or reimbursements are applied against class specific expenses before fund-level expenses. Funds Management has committed through November 30, 2019 to waive fees and/or reimburse expenses to the extent necessary to cap the Fund’s expenses at 1.11% for Class A shares, 1.86% for Class C shares, 1.36% for Class R shares, 0.65% for Class R6 shares, 0.95% for Administrator Class shares and 0.70% for Institutional Class shares. Prior to or after the commitment expiration date, the cap may be increased or the commitment to maintain the cap may be terminated only with the approval of the Board of Trustees.
Distribution fees
The Trust has adopted a distribution plan for Class C and Class R shares of the Fund pursuant to Rule 12b-1 under the 1940 Act. Distribution fees are charged to Class C and Class R shares and paid to Wells Fargo Funds Distributor, LLC (“Funds Distributor”), the principal underwriter, at an annual rate of 0.75% of the average daily net assets of Class C shares and 0.25% of the average daily net assets of Class R shares.
In addition, Funds Distributor is entitled to receive the front-end sales charge from the purchase of Class A shares and a contingent deferred sales charge on the redemption of certain Class A shares. Funds Distributor is also entitled to receive the contingent deferred sales charges from redemptions of Class C shares. For the year ended July 31, 2019, Funds Distributor received $3,274 from the sale of Class A shares. No contingent deferred sales charges were incurred by Class A and Class C shares for the year ended July 31, 2019.
Shareholder servicing fees
The Trust has entered into contracts with one or more shareholder servicing agents, whereby Class A, Class C, Class R, and Administrator Class of the Fund are charged a fee at an annual rate of 0.25% of the average daily net assets of each respective class. A portion of these total shareholder servicing fees were paid to affiliates of Wells Fargo.
5. INVESTMENT PORTFOLIO TRANSACTIONS
Purchases and sales of investments, excluding U.S. government obligations (if any) and short-term securities, for the year ended July 31, 2019 were $230,342,662 and $349,660,125, respectively.
6. SECURITIES LENDING TRANSACTIONS
The Fund lends its securities through an unaffiliated securities lending agent and receives collateral in the form of cash or securities with a value at least equal to the value of the securities on loan. The value of the loaned securities is determined at the close of each business day and any increases or decreases in the required collateral are exchanged between the Fund and the counterparty on the next business day. Cash collateral received is invested in the Securities Lending Fund which seeks to provide a positive return compared to the daily Fed Funds Open Rate by investing in high-quality, U.S. dollar-denominated short-term money market instruments and is exempt from registration under Section 3(c)(7) of the 1940 Act. Securities Lending Fund is managed by Funds Management and is subadvised by WellsCap. Funds Management receives an advisory fee starting at 0.05% and declining to 0.01% as the average daily net assets of the Securities Lending Fund increase. All of the fees received by Funds Management are paid to WellsCap for its services as subadviser.
In the event of counterparty default or the failure of a borrower to return a loaned security, the Fund has the right to use the collateral to offset any losses incurred. As of July 31, 2019, the Fund did not have any securities on loan.
26 | Wells Fargo Classic Value Fund
Notes to financial statements
7. BANK BORROWINGS
The Trust (excluding the money market funds), Wells Fargo Master Trust and Wells Fargo Variable Trust are parties to a $280,000,000 revolving credit agreement whereby the Fund is permitted to use bank borrowings for temporary or emergency purposes, such as to fund shareholder redemption requests. Interest under the credit agreement is charged to the Fund based on a borrowing rate equal to the higher of the Federal Funds rate in effect on that day plus 1.25% or the overnight LIBOR rate in effect on that day plus 1.25%. In addition, an annual commitment fee equal to 0.25% of the unused balance is allocated to each participating fund.
For the year ended July 31, 2019, there were no borrowings by the Fund under the agreement.
8. DISTRIBUTIONS TO SHAREHOLDERS
The tax character of distributions paid during the years ended July 31, 2019 and July 31, 2018 were as follows:
| | | | | | | | |
| | | Year ended July 31 | |
| | |
| | | 2019 | | | 2018 | |
| | |
Ordinary income | | $ | 9,595,122 | | | $ | 6,045,623 | |
| | |
Long-term capital gain | | | 55,186,402 | | | | 68,880,914 | |
As of July 31, 2019, the components of distributable earnings on a tax basis were as follows:
| | | | |
Undistributed ordinary income | | Undistributed long-term gain | | Unrealized gains |
| | |
$6,627,271 | | $68,463,682 | | $194,822,945 |
Effective for all filings after November 4, 2018, the Securities and Exchange Commission eliminated the requirement to separately state the components of distributions to shareholders under U.S. generally accepted accounting principles. The amounts of distributions to shareholders for the year ended July 31, 2018 were as follows:
| | | | | | | | |
| | |
| | | Net investment
income | | | Net realized
gains | |
| | |
Class A | | | $1,516,748 | | | | $22,059,131 | |
| | |
Class C | | | 0 | | | | 1,660,929 | |
| | |
Class R | | | 163 | | | | 3,846 | |
| | |
Class R6 | | | 23,745 | | | | 185,128 | |
| | |
Administrator Class | | | 3,138,315 | | | | 33,610,953 | |
| | |
Institutional Class | | | 1,366,652 | | | | 11,360,927 | |
9. CONCENTRATION RISK
Concentration risks result from exposure to a limited number of sectors. As of the end of the period, the Fund invests a concentration of its portfolio in the financials sector. A fund that invests a substantial portion of its assets in any sector may be more affected by changes in that sector than would be a fund whose investments are not heavily weighted in any sector.
10. INDEMNIFICATION
Under the Trust’s organizational documents, the officers and Trustees have been granted certain indemnification rights against certain liabilities that may arise out of performance of their duties to the Trust. Additionally, in the normal course of business, the Trust may enter into contracts with service providers that contain a variety of indemnification clauses. The Trust’s maximum exposure under these arrangements is dependent on future claims that may be made against the Fund and, therefore, cannot be estimated.
11. NEW ACCOUNTING PRONOUNCEMENT
In August 2018, FASB issued Accounting Standards Update (“ASU”) No. 2018-13, Fair Value Measurement (Topic 820)Disclosure Framework—Changes to the Disclosure Requirements for Fair Value Measurement. ASU 2018-13 updates the disclosure requirements for fair value measurements by modifying or removing certain disclosures and adding certain new disclosures. The amendments are effective for fiscal years, and interim periods within those fiscal years, beginning after December 15, 2019. Early adoption is permitted. Management has adopted the removal and modification of disclosures early, as permitted, and will adopt the additional new disclosures at the effective date.
Wells Fargo Classic Value Fund | 27
Report of independent registered public accounting firm
TO THE SHAREHOLDERS OF THE FUND AND BOARD OF TRUSTEES OF WELLS FARGO FUNDS TRUST:
Opinion on the Financial Statements
We have audited the accompanying statement of assets and liabilities of Wells Fargo Classic Value Fund (formerly, Wells Fargo Intrinsic Value Fund) (the Fund), one of the funds constituting Wells Fargo Funds Trust, including the portfolio of investments, as of July 31, 2019, the related statement of operations for the year then ended, the statements of changes in net assets for each of the years in the two-year period then ended, and the related notes (collectively, the financial statements) and the financial highlights for each of the years in the five-year period then ended. In our opinion, the financial statements and financial highlights present fairly, in all material respects, the financial position of the Fund as of July 31, 2019, the results of its operations for the year then ended, the changes in its net assets for each of the years in the two-year period then ended, and the financial highlights for each of the years in the five-year period then ended, in conformity with U.S. generally accepted accounting principles.
Basis for Opinion
These financial statements and financial highlights are the responsibility of the Fund’s management. Our responsibility is to express an opinion on these financial statements and financial highlights based on our audits. We are a public accounting firm registered with the Public Company Accounting Oversight Board (United States) (PCAOB) and are required to be independent with respect to the Fund in accordance with the U.S. federal securities laws and the applicable rules and regulations of the Securities and Exchange Commission and the PCAOB.
We conducted our audits in accordance with the standards of the PCAOB. Those standards require that we plan and perform the audit to obtain reasonable assurance about whether the financial statements and financial highlights are free of material misstatement, whether due to error or fraud. Our audits included performing procedures to assess the risks of material misstatement of the financial statements and financial highlights, whether due to error or fraud, and performing procedures that respond to those risks. Such procedures included examining, on a test basis, evidence regarding the amounts and disclosures in the financial statements and financial highlights. Such procedures also included confirmation of securities owned as of July 31, 2019, by correspondence with the custodian and transfer agent. Our audits also included evaluating the accounting principles used and significant estimates made by management, as well as evaluating the overall presentation of the financial statements and financial highlights. We believe that our audits provide a reasonable basis for our opinion.

We have not been able to determine the specific year that we began serving as the auditor of one or more Wells Fargo Funds investment companies; however we are aware that we have served as the auditor of one or more Wells Fargo Funds investment companies since at least 1955.
Boston, Massachusetts
September 25, 2019
28 | Wells Fargo Classic Value Fund
Other information (unaudited)
TAX INFORMATION
For corporate shareholders, pursuant to Section 854 of the Internal Revenue Code, 100% of ordinary income dividends qualify for the corporate dividends-received deduction for the fiscal year ended July 31, 2019.
Pursuant to Section 852 of the Internal Revenue Code, $55,186,402 was designated as a 20% rate gain distribution for the fiscal year ended July 31, 2019.
Pursuant to Section 854 of the Internal Revenue Code, $9,595,122 of income dividends paid during the fiscal year ended July 31, 2019 has been designated as qualified dividend income (QDI).
For the fiscal year ended July 31, 2019, $77,576 has been designated as interest-related dividends for nonresident alien shareholders pursuant to Section 871 of the Internal Revenue Code.
PROXY VOTING INFORMATION
A description of the policies and procedures used to determine how to vote proxies relating to portfolio securities is available, upon request, by calling1-800-222-8222, visiting our website atwfam.com, or visiting the SEC website at sec.gov. Information regarding how the proxies related to portfolio securities were voted during the most recent 12-month period ended June 30 is available on the website atwfam.comor by visiting the SEC website at sec.gov.
QUARTERLY PORTFOLIO HOLDINGS INFORMATION
The Fund files its complete schedule of portfolio holdings with the SEC for the first and third quarters of each fiscal year on Form N-Q or Form N-PORT, which is available by visiting the SEC website at sec.gov. Those forms may be reviewed and copied at the SEC’s Public Reference Room in Washington, DC. Information on the operation of the Public Reference Room may be obtained by calling 1-800-SEC-0330.
Wells Fargo Classic Value Fund | 29
Other information (unaudited)
BOARD OF TRUSTEES AND OFFICERS
Each of the Trustees and Officers1 listed in the table below acts in identical capacities for each fund in the Wells Fargo family of funds, which consists of 152 mutual funds comprising the Wells Fargo Funds Trust, Wells Fargo Variable Trust, Wells Fargo Master Trust and four closed-end funds (collectively the “Fund Complex”). This table should be read in conjunction with the Prospectus and the Statement of Additional Information2. The mailing address of each Trustee and Officer is 525 Market Street, 12th Floor, San Francisco, CA 94105. Each Trustee and Officer serves an indefinite term, however, each Trustee serves such term until reaching the mandatory retirement age established by the Trustees.
Independent Trustees
| | | | | | |
Name and year of birth | | Position held and
length of service* | | Principal occupations during past five years or longer | | Current other
public company or
investment
company
directorships |
| | | |
William R. Ebsworth (Born 1957) | | Trustee, since 2015 | | Retired. From 1984 to 2013, equities analyst, portfolio manager, research director and chief investment officer at Fidelity Management and Research Company in Boston, Tokyo, and Hong Kong, and retired in 2013 as Chief Investment Officer of Fidelity Strategic Advisers, Inc. where he led a team of investment professionals managing client assets. Prior thereto, Board member of Hong Kong Securities Clearing Co., Hong Kong Options Clearing Corp., the Thailand International Fund, Ltd., Fidelity Investments Life Insurance Company, and Empire Fidelity Investments Life Insurance Company. Audit Committee Chair and Investment Committee Chair of the Vincent Memorial Hospital Endowment (non-profit organization). Mr. Ebsworth is a CFA® charterholder. | | N/A |
| | | |
Jane A. Freeman (Born 1953) | | Trustee, since 2015; Chair Liaison, since 2018 | | Retired. From 2012 to 2014 and 1999 to 2008, Chief Financial Officer of Scientific Learning Corporation. From 2008 to 2012, Ms. Freeman provided consulting services related to strategic business projects. Prior to 1999, Portfolio Manager at Rockefeller & Co. and Scudder, Stevens & Clark. Board member of the Harding Loevner Funds from 1996 to 2014, serving as both Lead Independent Director and chair of the Audit Committee. Board member of the Russell Exchange Traded Funds Trust from 2011 to 2012 and the chair of the Audit Committee. Ms. Freeman is a Board Member of The Ruth Bancroft Garden (non-profit organization). She is also an inactive Chartered Financial Analyst. | | N/A |
| | | |
Isaiah Harris, Jr. (Born 1952) | | Trustee, since 2009; Audit Committee Chairman, since 2019 | | Retired. Chairman of the Board of CIGNA Corporation since 2009, and Director since 2005. From 2003 to 2011, Director of Deluxe Corporation. Prior thereto, President and CEO of BellSouth Advertising and Publishing Corp. from 2005 to 2007, President and CEO of BellSouth Enterprises from 2004 to 2005 and President of BellSouth Consumer Services from 2000 to 2003. Emeritus member of the Iowa State University Foundation Board of Governors. Emeritus Member of the Advisory Board of Iowa State University School of Business. Advisory Board Member, Palm Harbor Academy (private school). Advisory Board Member, Child Evangelism Fellowship (non-profit). Mr. Harris is a certified public accountant (inactive status). | | CIGNA Corporation |
| | | |
Judith M. Johnson (Born 1949) | | Trustee, since 2008; Audit Committee Chairman, from 2009 to 2018 | | Retired. Prior thereto, Chief Executive Officer and Chief Investment Officer of Minneapolis Employees Retirement Fund from 1996 to 2008. Ms. Johnson is an attorney, certified public accountant and a certified managerial accountant. | | N/A |
30 | Wells Fargo Classic Value Fund
Other information (unaudited)
| | | | | | |
Name and year of birth | | Position held and
length of service* | | Principal occupations during past five years or longer | | Current other
public company or
investment
company
directorships |
| | | |
David F. Larcker (Born 1950) | | Trustee, since 2009 | | James Irvin Miller Professor of Accounting at the Graduate School of Business, Stanford University, Director of the Corporate Governance Research Initiative and Senior Faculty of The Rock Center for Corporate Governance since 2006. From 2005 to 2008, Professor of Accounting at the Graduate School of Business, Stanford University. Prior thereto, Ernst & Young Professor of Accounting at The Wharton School, University of Pennsylvania from 1985 to 2005. | | N/A |
| | | |
Olivia S. Mitchell (Born 1953) | | Trustee, since 2006; Nominating and Governance Committee Chairman, since 2018 | | International Foundation of Employee Benefit Plans Professor, Wharton School of the University of Pennsylvania since 1993. Director of Wharton’s Pension Research Council and Boettner Center on Pensions & Retirement Research, and Research Associate at the National Bureau of Economic Research. Previously, Cornell University Professor from 1978 to 1993. | | N/A |
| | | |
Timothy J. Penny (Born 1951) | | Trustee, since 1996; Chairman, since 2018 | | President and Chief Executive Officer of Southern Minnesota Initiative Foundation, a non-profit organization, since 2007. Member of the Board of Trustees of NorthStar Education Finance, Inc., a non-profit organization, since 2007. | | N/A |
| | | |
James G. Polisson (Born 1959) | | Trustee, since 2018 | | Retired. Chief Marketing Officer, Source (ETF) UK Services, Ltd, from 2015 to 2017. From 2012 to 2015, Principal of The Polisson Group, LLC, a management consulting, corporate advisory and principal investing company. Chief Executive Officer and Managing Director at Russell Investments, Global Exchange Traded Funds from 2010 to 2012. Managing Director of Barclays Global Investors from 1998 to 2010 and Global Chief Marketing Officer for iShares and Barclays Global Investors from 2000 to 2010. Trustee of the San Francisco Mechanics’ Institute, a non-profit organization, from 2013 to 2015. Board member of the Russell Exchange Traded Fund Trust from 2011 to 2012. Director of Barclays Global Investors Holdings Deutschland GmbH from 2006 to 2009. Mr. Polisson is an attorney and has a retired status with the Massachusetts and District of Columbia Bar Associations. | | N/A |
| * | Length of service dates reflect the Trustee’s commencement of service with the Trust’s predecessor entities, where applicable. |
Wells Fargo Classic Value Fund | 31
Other information (unaudited)
Officers
| | | | |
Name and year of birth | | Position held and
length of service | | Principal occupations during past five years or longer |
| | |
Andrew Owen (Born 1960) | | President, since 2017 | | Executive Vice President of Wells Fargo & Company and Head of Affiliated Managers, Wells Fargo Asset Management, since 2014. In addition, Mr. Owen is currently President, Chief Executive Officer and Director of Wells Fargo Funds Management, LLC since 2017. Prior thereto, Executive Vice President responsible for marketing, investments and product development for Wells Fargo Funds Management, LLC, from 2009 to 2014. |
| | |
Jeremy DePalma1 (Born 1974) | | Treasurer, since 2012 | | Senior Vice President of Wells Fargo Funds Management, LLC since 2009. Senior Vice President of Evergreen Investment Management Company, LLC from 2008 to 2010 and head of the Fund Reporting and Control Team within Fund Administration from 2005 to 2010. |
| | |
Alexander Kymn (Born 1973) | | Secretary and Chief Legal Officer, since 2018 | | Senior Company Counsel of Wells Fargo Bank, N.A. since 2018 (previously Senior Counsel from 2007 to 2018). Vice President of Wells Fargo Funds Management, LLC from 2008 to 2014. |
| | |
Michael H. Whitaker (Born 1967) | | Chief Compliance Officer, since 2016 | | Senior Vice President and Chief Compliance Officer since 2016. Senior Vice President and Chief Compliance Officer for Fidelity Investments from 2007 to 2016. |
| | |
David Berardi (Born 1975) | | Assistant Treasurer, since 2009 | | Vice President of Wells Fargo Funds Management, LLC since 2009. Vice President of Evergreen Investment Management Company, LLC from 2008 to 2010. Manager of Fund Reporting and Control for Evergreen Investment Management Company, LLC from 2004 to 2010. |
| 1 | Jeremy DePalma acts as Treasurer of 87 funds and Assistant Treasurer of 65 funds in the Fund Complex. |
| 2 | The Statement of Additional Information includes additional information about the Trustees and is available, without charge, upon request, by calling 1-800-222-8222 or by visiting the website atwfam.com. |
32 | Wells Fargo Classic Value Fund
Other information (unaudited)
BOARD CONSIDERATION OF INVESTMENT MANAGEMENT AND SUB-ADVISORY AGREEMENTS:
Wells Fargo Classic Value Fund
Under the Investment Company Act of 1940 (the “1940 Act”), the Board of Trustees (the “Board”) of Wells Fargo Funds Trust (the “Trust”) must determine annually whether to approve the continuation of the Trust’s investment management and sub-advisory agreements. In this regard, at an in-person meeting held on May 21-22, 2019 (the “Meeting”), the Board, all the members of which have no direct or indirect interest in the investment management and sub-advisory agreements and are not “interested persons” of the Trust, as defined in the 1940 Act (the “Independent Trustees”), reviewed and approved for Wells Fargo Classic Value Fund (the “Fund”): (i) an investment management agreement (the “Management Agreement”) with Wells Fargo Funds Management, LLC (“Funds Management”); and (ii) an investment sub-advisory agreement (the “Sub-Advisory Agreement”) with Wells Capital Management Incorporated (the “Sub-Adviser”), an affiliate of Funds Management. The Management Agreement and the Sub-Advisory Agreement are collectively referred to as the “Advisory Agreements.”
At the Meeting, the Board considered the factors and reached the conclusions described below relating to the selection of Funds Management and the Sub-Adviser and the approval of the Advisory Agreements. Prior to the Meeting, including at an in-person meeting in April 2019, the Trustees conferred extensively among themselves and with representatives of Funds Management about these matters. Also, the Board has adopted a team-based approach, with each team consisting of a sub-set of Trustees, to assist the full Board in the discharge of its duties in reviewing investment performance and other matters throughout the year. The Independent Trustees were assisted in their evaluation of the Advisory Agreements by independent legal counsel, from whom they received separate legal advice and with whom they met separately.
In providing information to the Board, Funds Management and the Sub-Adviser were guided by a detailed set of requests for information submitted to them by independent legal counsel on behalf of the Independent Trustees at the start of the Board’s annual contract renewal process earlier in 2019. In considering and approving the Advisory Agreements, the Trustees considered the information they believed relevant, including but not limited to the information discussed below. The Board considered not only the specific information presented in connection with the Meeting, but also the knowledge gained over time through interaction with Funds Management and the Sub-Adviser about various topics. In this regard, the Board reviewed reports of Funds Management at each of its quarterly meetings, which included, among other things, portfolio reviews and investment performance reports. In addition, the Board and the teams mentioned above confer with portfolio managers at various times throughout the year. The Board did not identify any particular information or consideration that was all-important or controlling, and each individual Trustee may have attributed different weights to various factors.
After its deliberations, the Board unanimously approved the continuation of the Advisory Agreements for a one-year term and determined that the compensation payable to Funds Management and the Sub-Adviser under each of the Advisory Agreements was reasonable. The Board considered the approval of the Advisory Agreements for the Fund as part of its consideration of agreements for funds across the complex, but its approvals were made on a fund-by-fund basis. The following summarizes a number of important, but not necessarily all, factors considered by the Board in support of its approvals.
Nature, extent and quality of services
The Board received and considered various information regarding the nature, extent and quality of services provided to the Fund by Funds Management and the Sub-Adviser under the Advisory Agreements. This information included a description of the investment advisory services and Fund-level administrative services covered by the Management Agreement, as well as, among other things, a summary of the background and experience of senior management of Wells Fargo Asset Management (“WFAM”), of which Funds Management and the Sub-Adviser are a part, a summary of investments made in the business of WFAM, a summary of certain organizational and personnel changes involving Funds Management and the Sub-Adviser, and a description of Funds Management’s and the Sub-Adviser’s business continuity planning programs and of their approaches to data privacy and cybersecurity. The Board received and reviewed information about Funds Management’s role as administrator of the Fund’s liquidity risk management program. The Board also considered the qualifications, background, tenure and responsibilities of each of the portfolio managers primarily responsible for the day-to-day portfolio management of the Fund.
The Board evaluated the ability of Funds Management and the Sub-Adviser to attract and retain qualified investment professionals, including research, advisory and supervisory personnel. The Board further considered the compliance programs and compliance records of Funds Management and the Sub-Adviser. In addition, the Board took into account the full range of services provided to the Fund by Funds Management and its affiliates.
Wells Fargo Classic Value Fund | 33
Other information (unaudited)
Fund investment performance and expenses
The Board considered the investment performance results for the Fund over various time periods ended December 31, 2018. The Board considered these results in comparison to the investment performance of funds in a universe that was determined by Broadridge Inc. (“Broadridge”) to be similar to the Fund (the “Universe”), and in comparison to the Fund’s benchmark index and to other comparative data. Broadridge is an independent provider of investment company data. The Board received a description of the methodology used by Broadridge to select the mutual funds in the performance Universe. The Board noted that the investment performance of the Fund (Class A) was in range of the average investment performance of the Universe for the ten-year period and equal to the average investment performance for the Universe for the one-year period under review, but lower than the average investment performance of the Universe for the three- and five-year periods under review. The Board also noted that the investment performance of the Fund was lower than its benchmark index, the Russell 1000® Value Index, for the three- and five-year periods under review, but higher than its benchmark for the one- and ten-year periods under review.
The Board received information concerning, and discussed factors contributing to, the underperformance of the Fund relative to the Universe and benchmark for the periods identified above. The Board took note of the explanations for the relative underperformance during these periods, including with respect to investment decisions and market factors that affected the Fund’s investment performance. The Board also took note of the Fund’s outperformance relative to the Universe and benchmark over the one- and ten-year periods under review.
The Board also received and considered information regarding the Fund’s net operating expense ratios and their various components, including actual management fees, custodian and other non-management fees, and Rule 12b-1 and non-Rule 12b-1 shareholder service fees. The Board considered these ratios in comparison to the median ratios of funds in class-specific expense groups that were determined by Broadridge to be similar to the Fund (the “Groups”). The Board received a description of the methodology used by Broadridge to select the mutual funds in the expense Groups and an explanation of how funds comprising expense groups and their expense ratios may vary from year-to-year. Based on the Broadridge reports, the Board noted that the net operating expense ratios of the Fund were lower than or in range of the median net operating expense ratios of the expense Groups for Class A, Administrator Class, Institutional Class and Class R6 share classes, but higher than the median net operating expense ratios of the expense Groups for the Class R share class.
The Board took into account the Fund’s investment performance and expense information provided to it among the factors considered in deciding to re-approve the Advisory Agreements.
Investment management and sub-advisory fee rates
The Board reviewed and considered the contractual fee rates payable by the Fund to Funds Management under the Management Agreement, as well as the contractual fee rates payable by the Fund to Funds Management for class-level administrative services under a Class-Level Administration Agreement, which include, among other things, class-level transfer agency and sub-transfer agency costs (collectively, the “Management Rates”). The Board also reviewed and considered the contractual investment sub-advisory fee rates that are payable by Funds Management to the Sub-Adviser for investmentsub-advisory services.
Among other information reviewed by the Board was a comparison of the Fund’s Management Rates with the average contractual investment management fee rates of funds in the expense Groups at a common asset level as well as transfer agency costs of the funds in the expense Groups. The Board noted that the Management Rates of the Fund were in range of the sum of these average rates for the Fund’s expense Groups for the Institutional share class, but higher than the sum of these average rates for the Fund’s expense Groups for the Class R, Class A, Administrator Class and Class R6 share classes.
The Board also received and considered information about the portion of the total management fee that was retained by Funds Management after payment of the fee to the Sub-Adviser for sub-advisory services. In assessing the reasonableness of this amount, the Board received and evaluated information about the nature and extent of responsibilities retained and risks assumed by Funds Management and not delegated to or assumed by the Sub-Adviser, and about Funds Management’s on-going oversight services. Given the affiliation between Funds Management and the Sub-Adviser, the Board ascribed limited relevance to the allocation of fees between them.
The Board also received and considered information about the nature and extent of services offered and fee rates charged by Funds Management and the Sub-Adviser to other types of clients with investment strategies similar to those of the Fund. In this regard, the Board received information about the significantly greater scope of services, and compliance, reporting and other legal burdens and risks of managing proprietary mutual funds compared with those associated with managing assets of other types of clients, including third-party sub-advised fund clients and non-mutual fund clients such as institutional separate accounts.
34 | Wells Fargo Classic Value Fund
Other information (unaudited)
Based on its consideration of the factors and information it deemed relevant, including those described here, the Board determined that the compensation payable to Funds Management under the Management Agreement and to the Sub-Adviser under the Sub-Advisory Agreement was reasonable.
Profitability
The Board received and considered information concerning the profitability of Funds Management, as well as the profitability of both WFAM and Wells Fargo & Co. (“Wells Fargo”) from providing services to the fund family as a whole. The Board noted that the Sub-Adviser’s profitability information with respect to providing services to the Fund and other funds in the family was subsumed in the WFAM and Wells Fargo profitability analysis.
Funds Management reported on the methodologies and estimates used in calculating profitability, including a description of the methodology used to allocate certain expenses. Among other things, the Board noted that the levels of profitability reported on a fund-by-fund basis varied widely, depending on factors such as the size, type and age of fund. Based on its review, the Board did not deem the profits reported by Funds Management, WFAM or Wells Fargo from services provided to the Fund to be at a level that would prevent it from approving the continuation of the Advisory Agreements.
Economies of scale
The Board received and considered information about the potential for Funds Management to experience economies of scale in the provision of management services to the Fund, the difficulties of calculating economies of scale at an individual fund level, and the extent to which potential scale benefits are shared with shareholders. The Board noted the existence of breakpoints in the Fund’s management fee structure, which operate generally to reduce the Fund’s expense ratios as the Fund grows in size. The Board considered that in addition to management fee breakpoints, Funds Management shares potential economies of scale from its management business in a variety of ways, including through fee waiver and expense reimbursement arrangements, services that benefit shareholders, competitive management fee rates set at the outset without regard to breakpoints, and investments in the business intended to enhance services available to shareholders.
The Board concluded that Funds Management’s arrangements with respect to the Fund, including contractual breakpoints, constituted a reasonable approach to sharing potential economies of scale with the Fund and its shareholders.
Other benefits to Funds Management and the Sub-Adviser
The Board received and considered information regarding potential “fall-out” or ancillary benefits received by Funds Management and its affiliates, including the Sub-Adviser, as a result of their relationships with the Fund. Ancillary benefits could include, among others, benefits directly attributable to other relationships with the Fund and benefits potentially derived from an increase in Funds Management’s and the Sub-Adviser’s business as a result of their relationships with the Fund. The Board noted that various affiliates of Funds Management may receive distribution-related fees, shareholder servicing payments and sub-transfer agency fees in respect of shares sold or held through them and services provided.
The Board also reviewed information about soft dollar credits earned and utilized by the Sub-Adviser, fees earned by Funds Management and the Sub-Adviser from managing a private investment vehicle for the fund family’s securities lending collateral, and commissions earned by an affiliated broker from portfolio transactions.
Based on its consideration of the factors and information it deemed relevant, including those described here, the Board did not find that any ancillary benefits received by Funds Management and its affiliates, including the Sub-Adviser, were unreasonable.
Conclusion
At the Meeting, after considering the above-described factors and based on its deliberations and its evaluation of the information described above, the Board unanimously approved the continuation of the Advisory Agreements for a one-year term and determined that the compensation payable to Funds Management and the Sub-Adviser under each of the Advisory Agreements was reasonable.
Wells Fargo Classic Value Fund | 35
This page is intentionally left blank.

For more information
More information about Wells Fargo Funds is available free upon request. To obtain literature, please write, visit the Fund’s website, or call:
Wells Fargo Funds
P.O. Box 219967
Kansas City, MO 64121-9967
Website:wfam.com
Individual investors:1-800-222-8222
Retail investment professionals:1-888-877-9275
Institutional investment professionals:1-866-765-0778

This report and the financial statements contained herein are submitted for the general information of the shareholders of the Fund. If this report is used for promotional purposes, distribution of the report must be accompanied or preceded by a current prospectus. Before investing, please consider the investment objectives, risks, charges, and expenses of the investment. For a current prospectus and, if available, a summary prospectus, containing this information, call1-800-222-8222 or visit the Fund’s website atwfam.com. Read the prospectus carefully before you invest or send money.
Wells Fargo Asset Management (WFAM) is the trade name for certain investment advisory/management firms owned by Wells Fargo & Company. These firms include but are not limited to Wells Capital Management Incorporated and Wells Fargo Funds Management, LLC. Certain products managed by WFAM entities are distributed by Wells Fargo Funds Distributor, LLC (a broker-dealer and Member FINRA).
This material is for general informational and educational purposes only and is NOT intended to provide investment advice or a recommendation of any kind—including a recommendation for any specific investment, strategy, or plan.
INVESTMENT PRODUCTS: NOT FDIC INSURED ◾ NO BANK GUARANTEE ◾ MAY LOSE VALUE
© 2019 Wells Fargo Funds Management, LLC. All rights reserved.
405479 09-19
A207/AR207 07-19
Annual Report
July 31, 2019
Wells Fargo Large Cap Core Fund
Beginning on January 1, 2021, as permitted by new regulations adopted by the Securities and Exchange Commission, paper copies of the Wells Fargo Funds’ annual and semi-annual shareholder reports issued after this date will no longer be sent by mail, unless you specifically request paper copies of the reports. Instead, the reports will be made available on the Funds’ website, and you will be notified by mail each time a report is posted and provided with a website address to access the report.
If you already elected to receive shareholder reports electronically, you will not be affected by this change and you need not take any action. You may elect to receive shareholder reports and other communications from the Fund electronically at any time by contacting your financial intermediary (such as a broker-dealer or bank) or, if you are a direct investor, by calling1-800-222-8222 or by enrolling at wellsfargo.com/advantagedelivery.
You may elect to receive all future reports in paper free of charge. If you invest through a financial intermediary, you can contact your financial intermediary to request that you continue to receive paper copies of your shareholder reports; if you invest directly with the Fund, you can call 1-800-222-8222. Your election to receive reports in paper will apply to all Wells Fargo Funds held in your account with your financial intermediary or, if you are a direct investor, to all Wells Fargo Funds that you hold.
|
|
|
Reduce clutter. Save trees. |
Sign up for electronic delivery of prospectuses and shareholder reports atwellsfargo.com/advantagedelivery |
The views expressed and any forward-looking statements are as of July 31, 2019, unless otherwise noted, and are those of the Fund managers and/or Wells Fargo Asset Management. Discussions of individual securities, or the markets generally, or any Wells Fargo Fund are not intended as individual recommendations. Future events or results may vary significantly from those expressed in any forward-looking statements. The views expressed are subject to change at any time in response to changing circumstances in the market. Wells Fargo Asset Management and the Fund disclaim any obligation to publicly update or revise any views expressed or forward-looking statements.
INVESTMENT PRODUCTS: NOT FDIC INSURED ◾ NO BANK GUARANTEE ◾ MAY LOSE VALUE
Wells Fargo Large Cap Core Fund | 1
Letter to shareholders (unaudited)

Andrew Owen
President
Wells Fargo Funds
Dear Shareholder:
We are pleased to offer you this annual report for the Wells Fargo Large Cap Core Fund for the 12-month period that ended July 31, 2019. After the first six months of the period yielded either low-single-digit or negative investment returns, U.S. stock and global bond investors generally enjoyed a recovery during the final six months amid continued concerns about global economic growth, international trade, geopolitical tensions, and bouts of market volatility. These concerns negatively influenced international equity markets.
For the period, U.S. stocks, based on the S&P 500 Index,1 gained 7.99% and international stocks, as measured by the MSCI ACWI ex USA Index (Net),2 fell 2.27%. The MSCI EM Index (Net)3 slipped 2.18%. For bond investors, the Bloomberg Barclays U.S. Aggregate Bond Index4 added 8.08%, the Bloomberg Barclays Global Aggregate ex-USD Index5 added 3.74%, the Bloomberg Barclays Municipal Bond Index6 gained 7.31%, and the ICE BofAML U.S. High Yield Index7 added 6.94%.
Entering the fourth quarter of 2018, economic data was encouraging.
Domestic equity investors entered the fourth quarter of 2018 with reasons to be optimistic. The U.S. Bureau of Economic Analysis reported second-quarter annualized gross domestic product (GDP) growth of 4.2%. Hiring improved. Unemployment declined. Consumer confidence and spending increased. Third-quarter corporate earnings reports were generally positive. U.S. trade negotiations with Mexico and Canada progressed. The U.S. Federal Reserve (Fed) raised the federal funds rate by 25 basis points (bps; 100 bps equal 1.00%) to a target range of between 2.00% and 2.25% in September 2018, one of four rate increases implemented during the calendar year, a sign of its confidence in the strength of the U.S. economy.
Investors in international markets were not as confident. Tensions between the U.S. and China increased. The U.S. imposed $200 billion in tariffs on Chinese goods. China reacted with $60 billion in tariffs on U.S. goods. Economic growth in China caused concern. In September 2018, international investors began to factor a number of disconcerting economic and business data points: lower July manufacturers’ and industrial orders in Germany; falling purchasing manager index numbers for August from the United Kingdom, China, and India; and declining household spending for August in Japan. Taken together, the data fed growing concerns over slowing global growth that unnerved investors.
| 1 | The S&P 500 Index consists of 500 stocks chosen for market size, liquidity, and industry group representation. It is a market-value-weighted index with each stock’s weight in the index proportionate to its market value. You cannot invest directly in an index. |
| 2 | The Morgan Stanley Capital International (MSCI) All Country World Index (ACWI) ex USA Index (Net) is a free-float-adjusted market-capitalization weighted index that is designed to measure the equity market performance of developed and emerging markets, excluding the U.S. Source: MSCI. MSCI makes no express or implied warranties or representations and shall have no liability whatsoever with respect to any MSCI data contained herein. The MSCI data may not be further redistributed or used as a basis for other indices or any securities or financial products. This report is not approved, reviewed, or produced by MSCI. You cannot invest directly in an index. |
| 3 | The MSCI Emerging Markets (EM) Index (Net) is a free-float-adjusted market-capitalization-weighted index that is designed to measure the equity market performance of emerging markets. You cannot invest directly in an index. |
| 4 | The Bloomberg Barclays U.S. Aggregate Bond Index is a broad-based benchmark that measures the investment-grade, U.S. dollar-denominated, fixed-rate taxable bond market, including Treasuries, government-related and corporate securities, mortgage-backed securities (agency fixed-rate and hybrid adjustable-rate mortgage pass-throughs), asset-backed securities, and commercial mortgage-backed securities. You cannot invest directly in an index. |
| 5 | The Bloomberg Barclays Global Aggregate ex-USD Index is an unmanaged index that provides a broad-based measure of the global investment-grade fixed-income markets excluding the U.S. dollar-denominated debt market. You cannot invest directly in an index. |
| 6 | The Bloomberg Barclays Municipal Bond Index is an unmanaged index composed of long-term tax-exempt bonds with a minimum credit rating of Baa. You cannot invest directly in an index. |
| 7 | The ICE BofAML U.S. High Yield Index is a market-capitalization-weighted index of domestic and Yankee high-yield bonds. The index tracks the performance of high-yield securities traded in the U.S. bond market. You cannot invest directly in an index. Copyright 2019. ICE Data Indices, LLC. All rights reserved. |
2 | Wells Fargo Large Cap Core Fund
Letter to shareholders (unaudited)
Global markets suffered during the fourth quarter of 2018.
November’s U.S. midterm elections shifted control of the House of Representatives from Republicans to Democrats, presaging partisan clashes that followed and caused uncertainty among investors. Third-quarter U.S. GDP was announced at an annualized 3.4% rate, lower than the second-quarter rate. Brexit efforts stalled ahead of the March 2019 deadline. The People’s Bank of China cut reserve requirement ratios, accelerated infrastructure spending, and cut taxes even as the value of the yuan declined to low levels last seen in 2008. A partial U.S. government shutdown driven by partisan policy disputes extended into January.
The combination of news in the U.S. and generally weak economic indicators outside of the U.S. caused investors to seek safe havens. December’s S&P 500 Index performance was the worst since 1931. Globally, fixed-income investments fared better than stocks during the last two months of the year. The Fed increased the federal funds rate by 25 bps in December to a target range of between 2.25% and 2.50%.
The market climbs a wall of worry.
Investors entered 2019 with reasons to be concerned. Investment returns appeared to reaffirm the adage that markets climb a wall of worry. The S&P 500 Index gained 8.01% for the month of January, the best monthly performance in 30 years. Returns for the MSCI ACWI ex USA Index (Net), the Bloomberg Barclays U.S. Aggregate Bond Index, and the Bloomberg Barclays Global Aggregate ex-USD Index also were positive.
In February 2019, signs of slowing global growth grew more ominous. The Bureau of Economic Analysis announced fourth-quarter 2018 GDP grew at an annualized 2.2% rate, down from the levels of the prior two quarters. In a February report, the Bank of England forecasted the slowest growth since the financial crisis for 2019. China and the U.S. continued to wrangle over trade issues.
By the end of March 2019, a combination of dovish Fed sentiment and steady, if not spectacular, U.S. economic and business metrics reinforced investors’ confidence. Monthly job creation data and corporate profits, while less consistent than during 2018, were solid. China announced a roughly $300 billion stimulus package through tax and fee cuts intended to reinvigorate economic growth. During April 2019, favorable sentiment found additional support in reports of sustained low inflation, solid employment data, and first-quarter U.S. GDP of an annualized rate of 3.2%.
During May 2019, markets tumbled on mixed investment signals. In the U.S., partisan wrangling ramped up as Democrats and Republicans set their sights on 2020 presidential politics. The U.K.’s Brexit caused Prime Minister Theresa May to resign. The European Commission downgraded the 2019 growth forecast to 1.2%. The U.S. increased tariffs on products from China, China responded, and then talks broke down. President Donald Trump threatened to turn his foreign policy tariff tool to Mexico over immigration issues.
As had been the case during most of 2019 to date, just as the investment horizon appeared to darken, sentiment turned and U.S. equity markets gained during June and July. The gains, primarily driven by geopolitical and monetary policy events, pushed equity markets to new highs.
President Mario Draghi of the European Central Bank said that if the outlook doesn’t improve, the bank will cut rates or buy more assets to prop up inflation. President Trump backed off of tariff threats against Mexico and China. In the U.S., the Fed implemented a 0.25% federal funds rate cut in July 2019.
“December’s S&P 500 Index performance was the worst since 1931.”
“The S&P 500 Index gained 8.01% for the month of January, the best monthly performance in 30 years.”
Wells Fargo Large Cap Core Fund | 3
Letter to shareholders (unaudited)
Later in July 2019, the U.S. reversed course and threatened to impose higher tariffs on China’s exports after talks failed. China responded with tariff threats of its own and devalued the renminbi, a move that roiled global markets. Despite the accommodative approach of central banks, investors continued to have misgivings about the durability of economic growth globally and a pervasively cautious tone influenced the world’s equity and fixed-income markets.
Don’t let short-term uncertainty derail long-term investment goals.
Periods of investment uncertainty can present challenges, but experience has taught us that maintaining long-term investment goals can be an effective way to plan for the future. To help you create a sound strategy based on your personal goals and risk tolerance, Wells Fargo Funds offers more than 100 mutual funds spanning a wide range of asset classes and investment styles. Although diversification cannot guarantee an investment profit or prevent losses, we believe it can be an effective way to manage investment risk and potentially smooth out overall portfolio performance. We encourage investors to know their investments and to understand that appropriate levels of risk-taking may unlock opportunities.
Thank you for choosing to invest with Wells Fargo Funds. We appreciate your confidence in us and remain committed to helping you meet your financial needs.
Sincerely,

Andrew Owen
President
Wells Fargo Funds
|
|
|
For further information about your Fund, contact your investment professional, visit our website at wfam.com, or call us directly at1-800-222-8222. |
4 | Wells Fargo Large Cap Core Fund
This page is intentionally left blank.
Performance highlights (unaudited)
Investment objective
The Fund seeks long-term capital appreciation.
Manager
Wells Fargo Funds Management, LLC
Subadviser
Wells Capital Management Incorporated
Portfolio managers
John R. Campbell, CFA®‡
Jeff C. Moser, CFA®‡
Average annual total returns (%) as of July 31, 2019
| | | | | | | | | | | | | | | | | | | | | | | | | | | | | | | | | | |
| | | | |
| | | | | Including sales charge | | | Excluding sales charge | | | Expense ratios1 (%) | |
| | | | | | | | | |
| | | Inception date | | 1 year | | | 5 year | | | 10 year | | | 1 year | | | 5 year | | | 10 year | | | Gross | | | Net2 | |
| | | | | | | | | | |
| Class A (EGOAX)3 | | 12-17-2007 | | | -4.71 | | | | 7.64 | | | | 11.94 | | | | 1.10 | | | | 8.92 | | | | 12.59 | | | | 1.18 | | | | 1.08 | |
| | | | | | | | | | |
| Class C (EGOCX)3 | | 12-17-2007 | | | -0.66 | | | | 8.11 | | | | 11.74 | | | | 0.34 | | | | 8.11 | | | | 11.74 | | | | 1.93 | | | | 1.83 | |
| | | | | | | | | | |
| Class R (EGOHX)3,4 | | 9-30-2015 | | | | | | | | | | | | | | | 0.87 | | | | 8.66 | | | | 12.32 | | | | 1.43 | | | | 1.33 | |
| | | | | | | | | | |
| Class R6 (EGORX)3,5 | | 9-30-2015 | | | – | | | | – | | | | – | | | | 1.60 | | | | 10.05 | | | | 13.43 | | | | 0.75 | | | | 0.65 | |
| | | | | | | | | | |
| Administrator Class (WFLLX)3,6 | | 7-16-2010 | | | – | | | | – | | | | – | | | | 1.26 | | | | 9.10 | | | | 12.81 | | | | 1.10 | | | | 0.97 | |
| | | | | | | | | | |
| Institutional Class (EGOIX) | | 12-17-2007 | | | – | | | | – | | | | – | | | | 1.56 | | | | 9.40 | | | | 13.10 | | | | 0.85 | | | | 0.67 | |
| | | | | | | | | | |
| S&P 500 Index7 | | – | | | – | | | | – | | | | – | | | | 7.99 | | | | 11.34 | | | | 14.03 | | | | – | | | | – | |
Figures quoted represent past performance, which is no guarantee of future results, and do not reflect taxes that a shareholder may pay on fund distributions or the redemption of fund shares. Investment return and principal value of an investment will fluctuate so that an investor’s shares, when redeemed, may be worth more or less than their original cost. Performance shown without sales charges would be lower if sales charges were reflected. Current performance may be lower or higher than the performance data quoted, which assumes the reinvestment of dividends and capital gains. Current month-end performance is available on the Fund’s website,wfam.com.
Index returns do not include transaction costs associated with buying and selling securities, any mutual fund fees or expenses, or any taxes. It is not possible to invest directly in an index.
For Class A shares, the maximum front-end sales charge is 5.75%. For Class C shares, the maximum contingent deferred sales charge is 1.00%. Performance including a contingent deferred sales charge assumes the sales charge for the corresponding time period. Class R, Class R6, Administrator Class, and Institutional Class shares are sold without a front-end sales charge or contingent deferred sales charge.
Stock values fluctuate in response to the activities of individual companies and general market and economic conditions. Certain investment strategies tend to increase the total risk of an investment (relative to the broader market). The Fund is exposed to foreign investment risk and focused portfolio risk. Consult the Fund’s prospectus for additional information on these and other risks.
Please see footnotes on page 7.
6 | Wells Fargo Large Cap Core Fund
Performance highlights (unaudited)
|
|
| Growth of $10,000 investment as of July 31, 20198 |
|
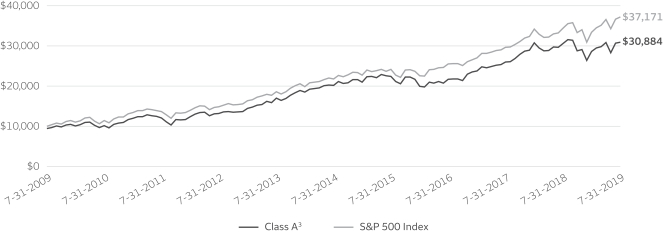
|
| ‡ | CFA® and Chartered Financial Analyst® are trademarks owned by CFA Institute. |
| 1 | Reflects the expense ratios as stated in the most recent prospectuses. The expense ratios shown are subject to change and may differ from the annualized expense ratios shown in the financial highlights of this report. |
| 2 | The manager has contractually committed through November 30, 2019, to waive fees and/or reimburse expenses to the extent necessary to cap the expenses of each class after fee waivers at the amounts shown. Brokerage commissions, stamp duty fees, interest, taxes, acquired fund fees and expenses (if any), and extraordinary expenses are excluded from the expense cap. Prior to or after the commitment expiration date, the cap may be increased or the commitment to maintain the cap may be terminated only with the approval of the Board of Trustees. Without this cap, the Fund’s returns would have been lower. The expense ratio paid by an investor is the net expense ratio (the total annual fund operating expenses after fee waivers) as stated in the prospectuses. |
| 3 | Historical performance shown prior to July 19, 2010, is based on the performance of the Fund’s predecessor, Evergreen Golden Large Cap Core Fund. |
| 4 | Historical performance shown for Class R shares prior to their inception reflects the performance of Administrator Class shares, adjusted to reflect higher expenses applicable to Class R shares. |
| 5 | Historical performance shown for Class R6 shares prior to their inception reflects the performance of Institutional Class shares, adjusted to reflect higher expenses applicable to Class R6 shares. |
| 6 | Historical performance shown for Administrator Class shares prior to their inception reflects the performance of Institutional Class shares, adjusted to reflect higher expenses applicable to Administrator Class shares. |
| 7 | The S&P 500 Index consists of 500 stocks chosen for market size, liquidity, and industry group representation. It is a market-value weighted index with each stock’s weight in the index proportionate to its market value. You cannot invest directly in an index. |
| 8 | The chart compares the performance of Class A shares for the most recent ten years with the S&P 500 Index. The chart assumes a hypothetical investment of $10,000 in Class A shares and reflects all operating expenses and assumes the maximum initial sales charge of 5.75%. |
| 9 | The ten largest holdings, excluding cash, cash equivalents and any money market funds, are calculated based on the value of the investments divided by total net assets of the Fund. Holdings are subject to change and may have changed since the date specified. |
| 10 | Amounts are calculated based on the total long-term investments of the Fund. These amounts are subject to change and may have changed since the date specified. |
| * | This security was no longer held at the end of the reporting period. |
Wells Fargo Large Cap Core Fund | 7
Performance highlights (unaudited)
MANAGER’S DISCUSSION
Fund highlights
| ∎ | | The Fund underperformed its benchmark, the S&P 500 Index, for the 12-month period that ended July 31, 2019. |
| ∎ | | Stock selection, a smaller size bias, and valuation characteristics, such as price-to-earnings (P/E), were detractors to performance relative to the benchmark index. |
| ∎ | | The Fund’s top performers on an absolute basis came from the information technology (IT) sector with favorable performance from VMware, Incorporated; Zebra Technologies Corporation; and Microsoft Corporation. |
Heightened uncertainty and volatility influenced investors.
During the second half of 2018, the U.S. economy began to decelerate and trade tensions between the U.S. and China began to intensify. However, the Federal Reserve (Fed) raised the federal funds rate by 25 basis points (bps; 100 bps equal 1.00%) at its September and December 2018 meetings. Investors began to worry about the possibility of an imminent recession and the market sold off sharply in the fourth quarter. The markets rebounded sharply as 2019 opened as Fed officials began to change their rhetoric around the future path of interest rates with a bias toward accommodation. As 2019 progressed, the economy stabilized but corporate earnings weakened. In July 2019, the Fed reduced the federal funds rate by 25 bps, delivering the first rate cut in over a decade. The heightened level of uncertainty and volatility in the market generally influenced investors to favor companies with higher earnings growth expectations, larger capitalizations, and stocks with lower volatility.
The Fund was misaligned with the large-cap growth theme that drove the market.
Characteristics that are typically favored in the portfolio include attractive valuation, earnings consistency, profitability, improving sentiment, and momentum. For the trailing 12 months, those characteristics have been misaligned with market trends, leading to weak relative performance. The smaller size, lower P/E, and better profitability characteristics favored by our quantitative stock selection model has led to a higher exposure to cyclical value companies rather than secular growth companies. The market has continued its extended trend of vastly preferring secular growth stocks over value. During the brief periods favoring value, a narrow segment of the market focused on low-volatility, high-dividend-paying companies outperformed. These companies are typically found in the utilities, consumer staples, and communication services sectors. We currently maintain an underweight exposure to these sectors.
| | | | |
|
| Ten largest holdings (%) as of July 31, 20199 | |
| | |
Apple Incorporated | | | 3.09 | |
| | |
Microsoft Corporation | | | 3.06 | |
| | |
Costco Wholesale Corporation | | | 2.80 | |
| | |
The Home Depot Incorporated | | | 2.57 | |
| | |
JPMorgan Chase & Company | | | 2.51 | |
| | |
Target Corporation | | | 2.51 | |
| | |
American Tower Corporation | | | 2.47 | |
| | |
Baxter International Incorporated | | | 2.39 | |
| | |
Zebra Technologies Corporation Class A | | | 2.35 | |
| | |
EMCOR Group Incorporated | | | 2.33 | |
IT and real estate investment trust (REIT) sectors produced some top-performing stocks.
The IT and REIT sectors were the best-performing sectors in the index. Several of the Fund’s best performers on an absolute basis came from those sectors represented by VMware, Zebra Technologies, and Microsoft (IT) and American Tower Corporation and Prologis Incorporated (REIT).
The Fund’s worst detractors were Macy’s Incorporated, NVIDIA Corporation*, Huntsman Corporation, Valero Energy Corporation*, and Marathon Petroleum Corporation*.
Please see footnotes on page 7.
8 | Wells Fargo Large Cap Core Fund
Performance highlights (unaudited)
|
|
| Sector distribution as of July 31, 201910 |
|
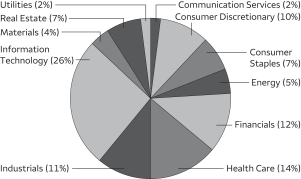 |
Our market outlook is favorable.
We continue to keep in mind that while U.S. economic growth is expected to be lower than 2018, it is most likely to remain positive in the coming months as unemployment remains near a record low, consumer confidence remains high, and personal incomes are growing. Corporate fundamentals have deteriorated somewhat as the earnings outlook has weakened. However, investment spending and corporate balance sheets remain healthy. With the downward revision to earnings expectations over the past several months, consensus estimates have been lowered to a point that they may lead to an upside surprise. However, we recognize that the largest source of risk to earnings is linked to uncertainty regarding trade sanctions, which have the
potential to result in higher input costs, higher labor costs, and profit-margin compression. Further delays to a negotiated trade settlement could cause market disappointment while the resolution of the dispute may provide only a small positive catalyst.
Monetary policy could likely support the market during the second half of 2019. The Fed’s June post-meeting statement dropped the earlier promise to be patient, noting instead that officials would “act as appropriate to sustain the expansion.” Before the end of the period, the Fed lowered the federal funds rate by a quarter percentage point.
As we monitor the macroeconomic environment, we will continue to diligently focus on company fundamentals and disciplined portfolio risk management.
Please see footnotes on page 7.
Wells Fargo Large Cap Core Fund | 9
Fund expenses (unaudited)
As a shareholder of the Fund, you incur two types of costs: (1) transaction costs, including sales charges (loads) on purchase payments and contingent deferred sales charges (if any) on redemptions and (2) ongoing costs, including management fees, distribution (12b-1) and/or shareholder servicing fees, and other Fund expenses. This example is intended to help you understand your ongoing costs (in dollars) of investing in the Fund and to compare these costs with the ongoing costs of investing in other mutual funds.
The example is based on an investment of $1,000 invested at the beginning of the six-month period and held for the entire period from February 1, 2019 to July 31, 2019.
Actual expenses
The “Actual” line of the table below provides information about actual account values and actual expenses. You may use the information in this line, together with the amount you invested, to estimate the expenses that you paid over the period. Simply divide your account value by $1,000 (for example, an $8,600 account value divided by $1,000 = 8.6), then multiply the result by the number in the “Actual” line under the heading entitled “Expenses paid during period” for your applicable class of shares to estimate the expenses you paid on your account during this period.
Hypothetical example for comparison purposes
The “Hypothetical” line of the table below provides information about hypothetical account values and hypothetical expenses based on the Fund’s actual expense ratio and an assumed rate of return of 5% per year before expenses, which is not the Fund’s actual return. The hypothetical account values and expenses may not be used to estimate the actual ending account balance or expenses you paid for the period. You may use this information to compare the ongoing costs of investing in the Fund and other funds. To do so, compare this 5% hypothetical example with the 5% hypothetical examples that appear in the shareholder reports of the other funds.
Please note that the expenses shown in the table are meant to highlight your ongoing costs only and do not reflect any transactional costs, such as sales charges (loads) and contingent deferred sales charges. Therefore, the “Hypothetical” line of the table is useful in comparing ongoing costs only and will not help you determine the relative total costs of owning different funds. In addition, if these transactional costs were included, your costs would have been higher.
| | | | | | | | | | | | | | | | |
| | | Beginning
account value 2-1-2019 | | | Ending
account value 7-31-2019 | | | Expenses
paid during the period¹ | | | Annualized net
expense ratio | |
| | | | | |
Class A | | | | | | | | | | | | | | | | |
| | | | |
Actual | | $ | 1,000.00 | | | $ | 1,080.91 | | | $ | 5.57 | | | | 1.08 | % |
| | | | |
Hypothetical (5% return before expenses) | | $ | 1,000.00 | | | $ | 1,019.44 | | | $ | 5.41 | | | | 1.08 | % |
| | | | | |
Class C | | | | | | | | | | | | | | | | |
| | | | |
Actual | | $ | 1,000.00 | | | $ | 1,077.47 | | | $ | 9.43 | | | | 1.83 | % |
| | | | |
Hypothetical (5% return before expenses) | | $ | 1,000.00 | | | $ | 1,015.72 | | | $ | 9.15 | | | | 1.83 | % |
| | | | | |
Class R | | | | | | | | | | | | | | | | |
| | | | |
Actual | | $ | 1,000.00 | | | $ | 1,079.65 | | | $ | 6.86 | | | | 1.33 | % |
| | | | |
Hypothetical (5% return before expenses) | | $ | 1,000.00 | | | $ | 1,018.20 | | | $ | 6.66 | | | | 1.33 | % |
| | | | | |
Class R6 | | | | | | | | | | | | | | | | |
| | | | |
Actual | | $ | 1,000.00 | | | $ | 1,084.16 | | | $ | 3.36 | | | | 0.65 | % |
| | | | |
Hypothetical (5% return before expenses) | | $ | 1,000.00 | | | $ | 1,021.57 | | | $ | 3.26 | | | | 0.65 | % |
| | | | | |
Administrator Class | | | | | | | | | | | | | | | | |
| | | | |
Actual | | $ | 1,000.00 | | | $ | 1,082.23 | | | $ | 5.01 | | | | 0.97 | % |
| | | | |
Hypothetical (5% return before expenses) | | $ | 1,000.00 | | | $ | 1,019.98 | | | $ | 4.86 | | | | 0.97 | % |
| | | | | |
Institutional Class | | | | | | | | | | | | | | | | |
| | | | |
Actual | | $ | 1,000.00 | | | $ | 1,083.43 | | | $ | 3.46 | | | | 0.67 | % |
| | | | |
Hypothetical (5% return before expenses) | | $ | 1,000.00 | | | $ | 1,021.47 | | | $ | 3.36 | | | | 0.67 | % |
| 1 | Expenses paid is equal to the annualized net expense ratio of each class multiplied by the average account value over the period, multiplied by the number of days in the most recent fiscal half-year divided by the number of days in the fiscal year (to reflect the one-half-year period). |
10 | Wells Fargo Large Cap Core Fund
Portfolio of investments—July 31, 2019
| | | | | | | | | | | | | | | | |
| | | | | | | | | Shares | | | Value | |
| Common Stocks: 99.47% | | | | | | | | | | | | | | | | |
| | | | |
Communication Services: 2.13% | | | | | | | | | | | | | | | | |
| | | | |
| Interactive Media & Services: 2.13% | | | | | | | | | | | | |
| | | | |
Alphabet Incorporated Class C † | | | | | | | | | | | 17,864 | | | $ | 21,734,772 | |
| | | | | | | | | | | | | | | | |
| | | | |
Consumer Discretionary: 9.82% | | | | | | | | | | | | | | | | |
| | | | |
| Auto Components: 1.43% | | | | | | | | | | | | |
| | | | |
Lear Corporation | | | | | | | | | | | 115,356 | | | | 14,624,834 | |
| | | | | | | | | | | | | | | | |
| | | | |
| Multiline Retail: 3.83% | | | | | | | | | | | | |
| | | | |
Macy’s Incorporated | | | | | | | | | | | 594,884 | | | | 13,521,713 | |
| | | | |
Target Corporation | | | | | | | | | | | 296,112 | | | | 25,584,077 | |
| | | | |
| | | | | | | | | | | | | | | 39,105,790 | |
| | | | | | | | | | | | | | | | |
| | | | |
| Specialty Retail: 4.56% | | | | | | | | | | | | |
| | | | |
The Home Depot Incorporated | | | | | | | | | | | 122,998 | | | | 26,283,443 | |
| | | | |
The TJX Companies Incorporated | | | | | | | | | | | 371,021 | | | | 20,242,906 | |
| | | | |
| | | | | | | | | | | | | | | 46,526,349 | |
| | | | | | | | | | | | | | | | |
| | | | |
Consumer Staples: 7.13% | | | | | | | | | | | | | | | | |
| | | | |
| Food & Staples Retailing: 7.13% | | | | | | | | | | | | |
| | | | |
Casey’s General Stores Incorporated | | | | | | | | | | | 135,608 | | | | 21,956,291 | |
| | | | |
Costco Wholesale Corporation | | | | | | | | | | | 103,759 | | | | 28,599,093 | |
| | | | |
Wal-Mart Stores Incorporated | | | | | | | | | | | 201,510 | | | | 22,242,674 | |
| | | | |
| | | | | | | | | | | | | | | 72,798,058 | |
| | | | | | | | | | | | | | | | |
| | | | |
Energy: 5.28% | | | | | | | | | | | | | | | | |
| | | | |
| Oil, Gas & Consumable Fuels: 5.28% | | | | | | | | | | | | |
| | | | |
Chevron Corporation | | | | | | | | | | | 133,714 | | | | 16,461,531 | |
| | | | |
ConocoPhillips | | | | | | | | | | | 318,083 | | | | 18,792,344 | |
| | | | |
Exxon Mobil Corporation | | | | | | | | | | | 251,096 | | | | 18,671,499 | |
| | | | |
| | | | | | | | | | | | | | | 53,925,374 | |
| | | | | | | | | | | | | | | | |
| | | | |
Financials: 11.75% | | | | | | | | | | | | | | | | |
| | | | |
| Banks: 6.17% | | | | | | | | | | | | |
| | | | |
Citizens Financial Group Incorporated | | | | | | | | | | | 429,533 | | | | 16,004,400 | |
| | | | |
Fifth Third Bancorp | | | | | | | | | | | 718,126 | | | | 21,321,161 | |
| | | | |
JPMorgan Chase & Company | | | | | | | | | | | 221,080 | | | | 25,645,280 | |
| | | | |
| | | | | | | | | | | | | | | 62,970,841 | |
| | | | | | | | | | | | | | | | |
| | | | |
| Capital Markets: 1.69% | | | | | | | | | | | | |
| | | | |
Evercore Partners Incorporated Class A | | | | | | | | | | | 199,745 | | | | 17,251,976 | |
| | | | | | | | | | | | | | | | |
| | | | |
| Insurance: 3.89% | | | | | | | | | | | | |
| | | | |
Prudential Financial Incorporated | | | | | | | | | | | 159,607 | | | | 16,169,785 | |
| | | | |
The Progressive Corporation | | | | | | | | | | | 290,843 | | | | 23,552,466 | |
| | | | |
| | | | | | | | | | | | | | | 39,722,251 | |
| | | | | | | | | | | | | | | | |
Health Care: 14.14% | | | | | | | | | | | | | | | | |
| | | | |
| Biotechnology: 2.70% | | | | | | | | | | | | |
| | | | |
AbbVie Incorporated | | | | | | | | | | | 167,481 | | | | 11,157,584 | |
| | | | |
Amgen Incorporated | | | | | | | | | | | 87,889 | | | | 16,398,330 | |
| | | | |
| | | | | | | | | | | | | | | 27,555,914 | |
| | | | | | | | | | | | | | | | |
The accompanying notes are an integral part of these financial statements.
Wells Fargo Large Cap Core Fund | 11
Portfolio of investments—July 31, 2019
| | | | | | | | | | | | | | | | |
| | | | | | | | | Shares | | | Value | |
| Health Care Equipment & Supplies: 4.05% | | | | | | | | | | | | |
| | | | |
Baxter International Incorporated | | | | | | | | | | | 290,314 | | | $ | 24,377,667 | |
| | | | |
Varian Medical Systems Incorporated † | | | | | | | | | | | 144,778 | | | | 16,992,594 | |
| | | | |
| | | | | | | | | | | | | | | 41,370,261 | |
| | | | | | | | | | | | | | | | |
| | | | |
| Health Care Providers & Services: 5.74% | | | | | | | | | | | | |
| | | | |
Anthem Incorporated | | | | | | | | | | | 73,250 | | | | 21,580,183 | |
| | | | |
Centene Corporation † | | | | | | | | | | | 311,661 | | | | 16,234,421 | |
| | | | |
UnitedHealth Group Incorporated | | | | | | | | | | | 83,362 | | | | 20,757,972 | |
| | | | |
| | | | | | | | | | | | | | | 58,572,576 | |
| | | | | | | | | | | | | | | | |
| | | | |
| Pharmaceuticals: 1.65% | | | | | | | | | | | | |
| | | | |
Johnson & Johnson | | | | | | | | | | | 129,441 | | | | 16,855,807 | |
| | | | | | | | | | | | | | | | |
| | | | |
Industrials: 11.52% | | | | | | | | | | | | | | | | |
| | | | |
| Aerospace & Defense: 2.08% | | | | | | | | | | | | |
| | | | |
Lockheed Martin Corporation | | | | | | | | | | | 58,637 | | | | 21,236,562 | |
| | | | | | | | | | | | | | | | |
| | | | |
| Airlines: 1.95% | | | | | | | | | | | | |
| | | | |
Delta Air Lines Incorporated | | | | | | | | | | | 325,963 | | | | 19,896,782 | |
| | | | | | | | | | | | | | | | |
| | | | |
| Construction & Engineering: 2.33% | | | | | | | | | | | | |
| | | | |
EMCOR Group Incorporated | | | | | | | | | | | 282,476 | | | | 23,838,150 | |
| | | | | | | | | | | | | | | | |
| | | | |
| Machinery: 3.53% | | | | | | | | | | | | |
| | | | |
Allison Transmission Holdings Incorporated | | | | | | | | | | | 401,592 | | | | 18,453,152 | |
| | | | |
Cummins Incorporated | | | | | | | | | | | 107,346 | | | | 17,604,744 | |
| | | | |
| | | | | | | | | | | | | | | 36,057,896 | |
| | | | | | | | | | | | | | | | |
| | | | |
| Trading Companies & Distributors: 1.63% | | | | | | | | | | | | |
| | | | |
Applied Industrial Technologies Incorporated | | | | | | | | | | | 273,935 | | | | 16,666,205 | |
| | | | | | | | | | | | | | | | |
| | | | |
Information Technology: 25.89% | | | | | | | | | | | | | | | | |
| | | | |
| Communications Equipment: 2.30% | | | | | | | | | | | | |
| | | | |
Cisco Systems Incorporated | | | | | | | | | | | 424,634 | | | | 23,524,724 | |
| | | | | | | | | | | | | | | | |
| | | | |
| Electronic Equipment, Instruments & Components: 6.24% | | | | | | | | | | | | |
| | | | |
CDW Corporation of Delaware | | | | | | | | | | | 181,727 | | | | 21,472,862 | |
| | | | |
Jabil Circuit Incorporated | | | | | | | | | | | 588,581 | | | | 18,175,381 | |
| | | | |
Zebra Technologies Corporation Class A † | | | | | | | | | | | 113,961 | | | | 24,033,235 | |
| | | | |
| | | | | | | | | | | | | | | 63,681,478 | |
| | | | | | | | | | | | | | | | |
| | | | |
| Semiconductors & Semiconductor Equipment: 3.74% | | | | | | | | | | | | |
| | | | |
Intel Corporation | | | | | | | | | | | 383,815 | | | | 19,401,848 | |
| | | | |
Xilinx Incorporated | | | | | | | | | | | 164,698 | | | | 18,810,159 | |
| | | | |
| | | | | | | | | | | | | | | 38,212,007 | |
| | | | | | | | | | | | | | | | |
| | | | |
| Software: 10.52% | | | | | | | | | | | | |
| | | | |
Fortinet Incorporated † | | | | | | | | | | | 237,260 | | | | 19,054,351 | |
| | | | |
Intuit Incorporated | | | | | | | | | | | 71,059 | | | | 19,705,370 | |
| | | | |
Microsoft Corporation | | | | | | | | | | | 229,646 | | | | 31,293,860 | |
| | | | |
Oracle Corporation | | | | | | | | | | | 346,845 | | | | 19,527,373 | |
| | | | |
VMware Incorporated Class A | | | | | | | | | | | 101,986 | | | | 17,795,534 | |
| | | | |
| | | | | | | | | | | | | | | 107,376,488 | |
| | | | | | | | | | | | | | | | |
| | | | |
| Technology Hardware, Storage & Peripherals: 3.09% | | | | | | | | | | | | |
| | | | |
Apple Incorporated | | | | | | | | | | | 148,114 | | | | 31,554,207 | |
| | | | | | | | | | | | | | | | |
The accompanying notes are an integral part of these financial statements.
12 | Wells Fargo Large Cap Core Fund
Portfolio of investments—July 31, 2019
| | | | | | | | | | | | | | | | |
| | | | | | | | | Shares | | | Value | |
Materials: 3.57% | | | | | | | | | | | | | | | | |
| | | | |
| Chemicals: 1.44% | | | | | | | | | | | | |
| | | | |
Huntsman Corporation | | | | | | | | | | | 713,270 | | | $ | 14,657,699 | |
| | | | | | | | | | | | | | | | |
| | | | |
| Metals & Mining: 2.13% | | | | | | | | | | | | |
| | | | |
Reliance Steel & Aluminum Company | | | | | | | | | | | 217,889 | | | | 21,778,006 | |
| | | | | | | | | | | | | | | | |
| | | | |
Real Estate: 6.62% | | | | | | | | | | | | | | | | |
| | | | |
| Equity REITs: 4.45% | | | | | | | | | | | | |
| | | | |
American Tower Corporation | | | | | | | | | | | 118,958 | | | | 25,173,892 | |
| | | | |
Prologis Incorporated | | | | | | | | | | | 251,879 | | | | 20,303,966 | |
| | | | |
| | | | | | | | | | | | | | | 45,477,858 | |
| | | | | | | | | | | | | | | | |
| | | | |
| Real Estate Management & Development: 2.17% | | | | | | | | | | | | |
| | | | |
CBRE Group Incorporated Class A † | | | | | | | | | | | 418,236 | | | | 22,170,690 | |
| | | | | | | | | | | | | | | | |
| | | | |
Utilities: 1.62% | | | | | | | | | | | | | | | | |
| | | | |
| Multi-Utilities: 1.62% | | | | | | | | | | | | |
| | | | |
CenterPoint Energy Incorporated | | | | | | | | | | | 571,775 | | | | 16,587,193 | |
| | | | | | | | | | | | | | | | |
| | | | |
Total Common Stocks (Cost $818,013,308) | | | | | | | | | | | | | | | 1,015,730,748 | |
| | | | | | | | | | | | | | | | |
| | | | |
| | | | | | | | | | | | | | | | |
| | | Yield | | | | | | | | | | |
| Short-Term Investments: 0.53% | | | | | | | | | | | | |
| | | | |
| Investment Companies: 0.53% | | | | | | | | | | | | |
| | | | |
Wells Fargo Government Money Market Fund Select Class (l)(u) | | | 2.26 | % | | | | | | | 5,360,147 | | | | 5,360,147 | |
| | | | | | | | | | | | | | | | |
| | | | |
Total Short-Term Investments (Cost $5,360,147) | | | | | | | | | | | | | | | 5,360,147 | |
| | | | | | | | | | | | | | | | |
| | | | | | | | |
| Total investments in securities (Cost $823,373,455) | | | 100.00 | % | | | 1,021,090,895 | |
| | |
Other assets and liabilities, net | | | 0.00 | | | | 29,686 | |
| | | | | | | | |
| Total net assets | | | 100.00 | % | | $ | 1,021,120,581 | |
| | | | | | | | |
| † | Non-income-earning security |
| (l) | The issuer of the security is an affiliated person of the Fund as defined in the Investment Company Act of 1940. |
| (u) | The rate represents the 7-day annualized yield at period end. |
Abbreviations:
| REIT | Real estate investment trust |
Investments in Affiliates
An affiliated investment is an investment in which the Fund owns at least 5% of the outstanding voting shares of the issuer or as a result of other relationships, such as the Fund and the issuer having the same investment manager. Transactions with issuers that were either affiliated persons of the Fund at the beginning of the period or the end of the period were as follows:
| | | | | | | | | | | | | | | | | | | | | | | | | | | | | | | | | | | | |
| | | Shares beginning
of period | | | Shares
purchased | | | Shares sold | | | Shares end of period | | | Net
realied
gains
(losses) | | | Net
change in
unrealized
gains
(losses) | | | Income
from
affiliated
securities | | | Value, end of period | | | % of
net assets | |
Short-Term Investments | | | | | | | | | | | | | | | | | | | | | | | | | | | | | | | | | | | | |
Investment Companies | | | | | | | | | | | | | | | | | | | | | | | | | | | | | | | | | | | | |
Securities Lending Cash Investments LLC * | | | 0 | | | | 47,671,858 | | | | 47,671,858 | | | | 0 | | | $ | 0 | | | $ | 0 | | | $ | 45,138 | # | | $ | 0 | | | | | |
Wells Fargo Government Money Market Fund Select Class | | | 10,016,109 | | | | 154,604,837 | | | | 159,260,799 | | | | 5,360,147 | | | | 0 | | | | 0 | | | | 205,041 | | | | 5,360,147 | | | | | |
| | | | | | | | | | | | | | | | | | | | | | | | | | | | | | | | | | | | |
| | | | | | | | | |
| | | | | | | | | | | | | | | | | | $ | 0 | | | $ | 0 | | | $ | 250,179 | | | $ | 5,360,147 | | | | 0.53 | % |
| | | | | | | | | | | | | | | | | | | | | | | | | | | | | | | | | | | | |
| * | No longer held at the end of the period. |
| # | Amount shown represents income before fees and rebates. |
The accompanying notes are an integral part of these financial statements.
Wells Fargo Large Cap Core Fund | 13
Statement of assets and liabilities—July 31, 2019
| | | | |
| | | | |
| |
Assets | | | | |
Investments in unaffiliated securities, at value (cost $818,013,308) | | $ | 1,015,730,748 | |
Investments in affiliated securities, at value (cost $5,360,147) | | | 5,360,147 | |
Receivable for Fund shares sold | | | 884,748 | |
Receivable for dividends | | | 617,700 | |
Prepaid expenses and other assets | | | 16,290 | |
| | | | |
Total assets | | | 1,022,609,633 | |
| | | | |
| |
Liabilities | | | | |
Payable for Fund shares redeemed | | | 788,525 | |
Management fee payable | | | 467,107 | |
Administration fees payable | | | 139,977 | |
Distribution fees payable | | | 31,079 | |
Trustees’ fees and expenses payable | | | 4,309 | |
Accrued expenses and other liabilities | | | 58,055 | |
| | | | |
Total liabilities | | | 1,489,052 | |
| | | | |
Total net assets | | $ | 1,021,120,581 | |
| | | | |
| |
Net assets consist of | | | | |
Paid-in capital | | $ | 732,660,784 | |
Total distributable earnings | | | 288,459,797 | |
| | | | |
Total net assets | | $ | 1,021,120,581 | |
| | | | |
| |
Computation of net asset value and offering price per share | | | | |
Net assets – Class A | | $ | 341,045,229 | |
Shares outstanding – Class A1 | | | 18,361,265 | |
Net asset value per share – Class A | | | $18.57 | |
Maximum offering price per share – Class A2 | | | $19.70 | |
Net assets – Class C | | $ | 47,648,550 | |
Shares outstanding – Class C1 | | | 2,614,807 | |
Net asset value per share – Class C | | | $18.22 | |
Net assets – Class R | | $ | 2,042,600 | |
Shares outstanding – Class R1 | | | 109,966 | |
Net asset value per share – Class R | | | $18.57 | |
Net assets – Class R6 | | $ | 13,223,159 | |
Shares outstanding – Class R61 | | | 708,004 | |
Net asset value per share – Class R6 | | | $18.68 | |
Net assets – Administrator Class | | $ | 16,566,428 | |
Shares outstanding – Administrator Class1 | | | 880,434 | |
Net asset value per share – Administrator Class | | | $18.82 | |
Net assets – Institutional Class | | $ | 600,594,615 | |
Shares outstanding – Institutional Class1 | | | 32,117,903 | |
Net asset value per share – Institutional Class | | | $18.70 | |
| 1 | The Fund has an unlimited number of authorized shares. |
| 2 | Maximum offering price is computed as 100/94.25 of net asset value. On investments of $50,000 or more, the offering price is reduced. |
The accompanying notes are an integral part of these financial statements.
14 | Wells Fargo Large Cap Core Fund
Statement of operations—year ended July 31, 2019
| | | | |
| | | | |
| |
Investment income | | | | |
Dividends | | $ | 26,240,997 | |
Income from affiliated securities | | | 210,704 | |
| | | | |
Total investment income | | | 26,451,701 | |
| | | | |
| |
Expenses | | | | |
Management fee | | | 7,261,281 | |
Administration fees | | | | |
Class A | | | 709,549 | |
Class C | | | 111,130 | |
Class R | | | 4,191 | |
Class R6 | | | 4,049 | |
Administrator Class | | | 25,958 | |
Institutional Class | | | 823,392 | |
Shareholder servicing fees | | | | |
Class A | | | 844,702 | |
Class C | | | 132,298 | |
Class R | | | 4,989 | |
Administrator Class | | | 49,671 | |
Distribution fees | | | | |
Class C | | | 396,893 | |
Class R | | | 4,976 | |
Custody and accounting fees | | | 57,999 | |
Professional fees | | | 46,596 | |
Registration fees | | | 119,997 | |
Shareholder report expenses | | | 151,197 | |
Trustees’ fees and expenses | | | 22,098 | |
Interest expense | | | 595 | |
Other fees and expenses | | | 27,742 | |
| | | | |
Total expenses | | | 10,799,303 | |
Less: Fee waivers and/or expense reimbursements | | | (1,629,593 | ) |
| | | | |
Net expenses | | | 9,169,710 | |
| | | | |
Net investment income | | | 17,281,991 | |
| | | | |
| |
Realized and unrealized gains (losses) on investments | | | | |
Net realized gains on investments | | | 109,914,369 | |
Net change in unrealized gains (losses) on investments | | | (118,294,629 | ) |
| | | | |
Net realized and unrealized gains (losses) on investments | | | (8,380,260 | ) |
| | | | |
Net increase in net assets resulting from operations | | $ | 8,901,731 | |
| | | | |
The accompanying notes are an integral part of these financial statements.
Wells Fargo Large Cap Core Fund | 15
Statement of changes in net assets
| | | | | | | | | | | | | | | | |
| | | Year ended
July 31, 2019 | | | Year ended
July 31, 20181 | |
| | | | |
Operations | | | | | | | | | | | | | | | | |
Net investment income | | | | | | $ | 17,281,991 | | | | | | | $ | 10,468,177 | |
Net realized gains on investments | | | | | | | 109,914,369 | | | | | | | | 93,764,997 | |
Net change in unrealized gains (losses) on investments | | | | | | | (118,294,629 | ) | | | | | | | 76,367,116 | |
| | | | |
Net increase in net assets resulting from operations | | | | | | | 8,901,731 | | | | | | | | 180,600,290 | |
| | | | |
| | | | |
Distributions to shareholders from net investment income and net realized gains | | | | | | | | | | | | | | | | |
Class A | | | | | | | (37,574,345 | ) | | | | | | | (6,205,749 | ) |
Class C | | | | | | | (5,864,767 | ) | | | | | | | (697,513 | ) |
Class R | | | | | | | (218,389 | ) | | | | | | | (24,344 | ) |
Class R6 | | | | | | | (1,664,230 | ) | | | | | | | (13,463 | ) |
Administrator Class | | | | | | | (2,269,291 | ) | | | | | | | (646,297 | ) |
Institutional Class | | | | | | | (74,264,283 | ) | | | | | | | (14,330,177 | ) |
| | | | |
Total distributions to shareholders | | | | | | | (121,855,305 | ) | | | | | | | (21,917,543 | ) |
| | | | |
| | | | |
Capital share transactions | | | Shares | | | | | | | | Shares | | | | | |
Proceeds from shares sold | | | | | | | | | | | | | | | | |
Class A | | | 2,037,136 | | | | 37,064,625 | | | | 1,110,773 | | | | 22,158,115 | |
Class C | | | 396,352 | | | | 7,080,379 | | | | 379,357 | | | | 7,444,081 | |
Class R | | | 14,501 | | | | 264,703 | | | | 64,450 | | | | 1,271,370 | |
Class R6 | | | 159,006 | | | | 3,008,830 | | | | 768,314 | | | | 15,462,838 | |
Administrator Class | | | 58,875 | | | | 1,101,323 | | | | 183,497 | | | | 3,604,364 | |
Institutional Class | | | 8,077,444 | | | | 146,618,727 | | | | 7,081,551 | | | | 141,445,213 | |
| | | | |
| | | | | | | 195,138,587 | | | | | | | | 191,385,981 | |
| | | | |
Reinvestment of distributions | | | | | | | | | | | | | | | | |
Class A | | | 2,156,895 | | | | 36,026,156 | | | | 301,834 | | | | 5,924,919 | |
Class C | | | 305,502 | | | | 4,991,915 | | | | 30,164 | | | | 580,958 | |
Class R | | | 12,855 | | | | 214,625 | | | | 1,208 | | | | 23,747 | |
Class R6 | | | 23,922 | | | | 403,097 | | | | 644 | | | | 12,693 | |
Administrator Class | | | 133,494 | | | | 2,258,572 | | | | 31,853 | | | | 632,062 | |
Institutional Class | | | 4,092,477 | | | | 68,868,016 | | | | 658,543 | | | | 12,996,677 | |
| | | | |
| | | | | | | 112,762,381 | | | | | | | | 20,171,056 | |
| | | | |
Payment for shares redeemed | | | | | | | | | | | | | | | | |
Class A | | | (3,169,819 | ) | | | (58,713,000 | ) | | | (2,398,895 | ) | | | (47,209,115 | ) |
Class C | | | (1,097,796 | ) | | | (19,481,544 | ) | | | (828,652 | ) | | | (16,059,336 | ) |
Class R | | | (15,514 | ) | | | (283,465 | ) | | | (43,438 | ) | | | (851,162 | ) |
Class R6 | | | (202,585 | ) | | | (3,787,142 | ) | | | (48,034 | ) | | | (992,474 | ) |
Administrator Class | | | (520,733 | ) | | | (9,967,464 | ) | | | (768,837 | ) | | | (15,531,475 | ) |
Institutional Class | | | (13,024,243 | ) | | | (237,625,707 | ) | | | (9,084,266 | ) | | | (179,681,555 | ) |
| | | | |
| | | | | | | (329,858,322 | ) | | | | | | | (260,325,117 | ) |
| | | | |
Net decrease in net assets resulting from capital share transactions | | | | | | | (21,957,354 | ) | | | | | | | (48,768,080 | ) |
| | | | |
Total increase (decrease) in net assets | | | | | | | (134,910,928 | ) | | | | | | | 109,914,667 | |
| | | | |
| | | | |
Net assets | | | | | | | | | | | | | | | | |
Beginning of period | | | | | | | 1,156,031,509 | | | | | | | | 1,046,116,842 | |
| | | | |
End of period | | | | | | $ | 1,021,120,581 | | | | | | | $ | 1,156,031,509 | |
| | | | |
| 1 | Effective for all filings after November 4, 2018, the SEC prospectively eliminated the requirement to parenthetically disclose undistributed net investment income at the end of the period and permitted the aggregation of distributions, with the exception of tax basis returns of capital. Undistributed net investment income at July 31, 2018 was $5,856,737. The disaggregated distributions information for the year ended July 31, 2018 is included in Note 8,Distributions to Shareholders,in the notes to the financial statements. |
The accompanying notes are an integral part of these financial statements.
16 | Wells Fargo Large Cap Core Fund
Financial highlights
(For a share outstanding throughout each period)
| | | | | | | | | | | | | | | | | | | | |
| | | Year ended July 31 | |
| CLASS A | | 2019 | | | 2018 | | | 2017 | | | 2016 | | | 2015 | |
Net asset value, beginning of period | | | $20.82 | | | | $18.01 | | | | $15.13 | | | | $15.81 | | | | $14.30 | |
Net investment income | | | 0.25 | | | | 0.15 | | | | 0.15 | | | | 0.10 | | | | 0.06 | |
Net realized and unrealized gains (losses) on investments | | | (0.29 | ) | | | 3.01 | | | | 2.85 | | | | (0.60 | ) | | | 1.50 | |
| | | | | | | | | | | | | | | | | | | | |
Total from investment operations | | | (0.04 | ) | | | 3.16 | | | | 3.00 | | | | (0.50 | ) | | | 1.56 | |
Distributions to shareholders from | | | | | | | | | | | | | | | | | | | | |
Net investment income | | | (0.16 | ) | | | (0.13 | ) | | | (0.12 | ) | | | (0.05 | ) | | | (0.05 | ) |
Net realized gains | | | (2.05 | ) | | | (0.22 | ) | | | 0.00 | | | | (0.13 | ) | | | 0.00 | |
| | | | | | | | | | | | | | | | | | | | |
Total distributions to shareholders | | | (2.21 | ) | | | (0.35 | ) | | | (0.12 | ) | | | (0.18 | ) | | | (0.05 | ) |
Net asset value, end of period | | | $18.57 | | | | $20.82 | | | | $18.01 | | | | $15.13 | | | | $15.81 | |
Total return1 | | | 1.10 | % | | | 17.66 | % | | | 19.94 | % | | | (3.18 | )% | | | 10.99 | % |
Ratios to average net assets (annualized) | | | | | | | | | | | | | | | | | | | | |
Gross expenses | | | 1.19 | % | | | 1.18 | % | | | 1.19 | % | | | 1.20 | % | | | 1.26 | % |
Net expenses | | | 1.08 | % | | | 1.10 | % | | | 1.14 | % | | | 1.14 | % | | | 1.14 | % |
Net investment income | | | 1.42 | % | | | 0.73 | % | | | 0.82 | % | | | 0.80 | % | | | 0.35 | % |
Supplemental data | | | | | | | | | | | | | | | | | | | | |
Portfolio turnover rate | | | 45 | % | | | 33 | % | | | 50 | % | | | 51 | % | | | 44 | % |
Net assets, end of period (000s omitted) | | | $341,045 | | | | $360,937 | | | | $329,974 | | | | $359,971 | | | | $97,041 | |
| 1 | Total return calculations do not include any sales charges. |
The accompanying notes are an integral part of these financial statements.
Wells Fargo Large Cap Core Fund | 17
Financial highlights
(For a share outstanding throughout each period)
| | | | | | | | | | | | | | | | | | | | |
| | | Year ended July 31 | |
| CLASS C | | 2019 | | | 2018 | | | 2017 | | | 2016 | | | 2015 | |
Net asset value, beginning of period | | | $20.44 | | | | $17.70 | | | | $14.87 | | | | $15.61 | | | | $14.17 | |
Net investment income (loss) | | | 0.13 | | | | (0.00 | )1 | | | 0.00 | 2 | | | 0.00 | 2,3 | | | (0.06 | )3 |
Net realized and unrealized gains (losses) on investments | | | (0.30 | ) | | | 2.96 | | | | 2.83 | | | | (0.61 | ) | | | 1.50 | |
| | | | | | | | | | | | | | | | | | | | |
Total from investment operations | | | (0.17 | ) | | | 2.96 | | | | 2.83 | | | | (0.61 | ) | | | 1.44 | |
Distributions to shareholders from | | | | | | | | | | | | | | | | | | | | |
Net realized gains | | | (2.05 | ) | | | (0.22 | ) | | | 0.00 | | | | (0.13 | ) | | | 0.00 | |
Net asset value, end of period | | | $18.22 | | | | $20.44 | | | | $17.70 | | | | $14.87 | | | | $15.61 | |
Total return4 | | | 0.34 | % | | | 16.78 | % | | | 19.03 | % | | | (3.90 | )% | | | 10.16 | % |
Ratios to average net assets (annualized) | | | | | | | | | | | | | | | | | | | | |
Gross expenses | | | 1.94 | % | | | 1.93 | % | | | 1.94 | % | | | 1.95 | % | | | 2.01 | % |
Net expenses | | | 1.83 | % | | | 1.85 | % | | | 1.89 | % | | | 1.89 | % | | | 1.89 | % |
Net investment income (loss) | | | 0.67 | % | | | (0.02 | )% | | | 0.07 | % | | | 0.02 | % | | | (0.38 | )% |
Supplemental data | | | | | | | | | | | | | | | | | | | | |
Portfolio turnover rate | | | 45 | % | | | 33 | % | | | 50 | % | | | 51 | % | | | 44 | % |
Net assets, end of period (000s omitted) | | | $47,649 | | | | $61,529 | | | | $60,697 | | | | $71,512 | | | | $53,076 | |
| 1 | Amount is more than $(0.005). |
| 2 | Amount is less than $0.005. |
| 3 | Calculated based upon average shares outstanding |
| 4 | Total return calculations do not include any sales charges. |
The accompanying notes are an integral part of these financial statements.
18 | Wells Fargo Large Cap Core Fund
Financial highlights
(For a share outstanding throughout each period)
| | | | | | | | | | | | | | | | |
| | | Year ended July 31 | |
| CLASS R | | 2019 | | | 2018 | | | 2017 | | | 20161 | |
Net asset value, beginning of period | | | $20.81 | | | | $18.04 | | | | $15.17 | | | | $14.66 | |
Net investment income | | | 0.21 | | | | 0.12 | | | | 0.13 | | | | 0.06 | |
Net realized and unrealized gains (losses) on investments | | | (0.29 | ) | | | 2.99 | | | | 2.84 | | | | 0.66 | |
| | | | | | | | | | | | | | | | |
Total from investment operations | | | (0.08 | ) | | | 3.11 | | | | 2.97 | | | | 0.72 | |
Distributions to shareholders from | | | | | | | | | | | | | | | | |
Net investment income | | | (0.11 | ) | | | (0.12 | ) | | | (0.10 | ) | | | (0.08 | ) |
Net realized gains | | | (2.05 | ) | | | (0.22 | ) | | | 0.00 | | | | (0.13 | ) |
| | | | | | | | | | | | | | | | |
Total distributions to shareholders | | | (2.16 | ) | | | (0.34 | ) | | | (0.10 | ) | | | (0.21 | ) |
Net asset value, end of period | | | $18.57 | | | | $20.81 | | | | $18.04 | | | | $15.17 | |
Total return2 | | | 0.87 | % | | | 17.37 | % | | | 19.64 | % | | | 4.90 | % |
Ratios to average net assets (annualized) | | | | | | | | | | | | | | | | |
Gross expenses | | | 1.44 | % | | | 1.43 | % | | | 1.44 | % | | | 1.46 | % |
Net expenses | | | 1.33 | % | | | 1.34 | % | | | 1.39 | % | | | 1.39 | % |
Net investment income | | | 1.18 | % | | | 0.48 | % | | | 0.51 | % | | | 0.52 | % |
Supplemental data | | | | | | | | | | | | | | | | |
Portfolio turnover rate | | | 45 | % | | | 33 | % | | | 50 | % | | | 51 | % |
Net assets, end of period (000s omitted) | | | $2,043 | | | | $2,042 | | | | $1,369 | | | | $26 | |
| 1 | For the period from September 30, 2015 (commencement of class operations) to July 31, 2016 |
| 2 | Returns for periods of less than one year are not annualized. |
The accompanying notes are an integral part of these financial statements.
Wells Fargo Large Cap Core Fund | 19
Financial highlights
(For a share outstanding throughout each period)
| | | | | | | | | | | | | | | | |
| | | Year ended July 31 | |
| CLASS R6 | | 2019 | | | 2018 | | | 2017 | | | 20161 | |
Net asset value, beginning of period | | | $20.92 | | | | $18.09 | | | | $15.24 | | | | $14.66 | |
Net investment income | | | 0.34 | | | | 0.22 | 2 | | | 0.25 | 2 | | | 0.20 | |
Net realized and unrealized gains (losses) on investments | | | (0.30 | ) | | | 3.04 | | | | 3.33 | | | | 0.62 | |
| | | | | | | | | | | | | | | | |
Total from investment operations | | | 0.04 | | | | 3.26 | | | | 3.58 | | | | 0.82 | |
Distributions to shareholders from | | | | | | | | | | | | | | | | |
Net investment income | | | (0.23 | ) | | | (0.21 | ) | | | (0.73 | ) | | | (0.11 | ) |
Net realized gains | | | (2.05 | ) | | | (0.22 | ) | | | 0.00 | | | | (0.13 | ) |
| | | | | | | | | | | | | | | | |
Total distributions to shareholders | | | (2.28 | ) | | | (0.43 | ) | | | (0.73 | ) | | | (0.24 | ) |
Net asset value, end of period | | | $18.68 | | | | $20.92 | | | | $18.09 | | | | $15.24 | |
Total return3 | | | 1.60 | % | | | 18.16 | % | | | 24.01 | % | | | 5.57 | % |
Ratios to average net assets (annualized) | | | | | | | | | | | | | | | | |
Gross expenses | | | 0.75 | % | | | 0.75 | % | | | 0.76 | % | | | 0.77 | % |
Net expenses | | | 0.65 | % | | | 0.65 | % | | | 0.68 | % | | | 0.68 | % |
Net investment income | | | 1.83 | % | | | 1.08 | % | | | 1.62 | % | | | 1.31 | % |
Supplemental data | | | | | | | | | | | | | | | | |
Portfolio turnover rate | | | 45 | % | | | 33 | % | | | 50 | % | | | 51 | % |
Net assets, end of period (000s omitted) | | | $13,223 | | | | $15,225 | | | | $122 | | | | $2,449 | |
| 1 | For the period from September 30, 2015 (commencement of class operations) to July 31, 2016 |
| 2 | Calculated based upon average shares outstanding |
| 3 | Returns for periods of less than one year are not annualized. |
The accompanying notes are an integral part of these financial statements.
20 | Wells Fargo Large Cap Core Fund
Financial highlights
(For a share outstanding throughout each period)
| | | | | | | | | | | | | | | | | | | | |
| | | Year ended July 31 | |
| ADMINISTRATOR CLASS | | 2019 | | | 2018 | | | 2017 | | | 2016 | | | 2015 | |
Net asset value, beginning of period | | | $21.05 | | | | $18.21 | | | | $15.18 | | | | $15.87 | | | | $14.34 | |
Net investment income | | | 0.29 | 1 | | | 0.17 | 1 | | | 0.16 | 1 | | | 0.15 | | | | 0.10 | |
Net realized and unrealized gains (losses) on investments | | | (0.30 | ) | | | 3.05 | | | | 2.87 | | | | (0.62 | ) | | | 1.50 | |
| | | | | | | | | | | | | | | | | | | | |
Total from investment operations | | | (0.01 | ) | | | 3.22 | | | | 3.03 | | | | (0.47 | ) | | | 1.60 | |
Distributions to shareholders from | | | | | | | | | | | | | | | | | | | | |
Net investment income | | | (0.17 | ) | | | (0.16 | ) | | | (0.00 | )2 | | | (0.09 | ) | | | (0.07 | ) |
Net realized gains | | | (2.05 | ) | | | (0.22 | ) | | | 0.00 | | | | (0.13 | ) | | | 0.00 | |
| | | | | | | | | | | | | | | | | | | | |
Total distributions to shareholders | | | (2.22 | ) | | | (0.38 | ) | | | (0.00 | )2 | | | (0.22 | ) | | | (0.07 | ) |
Net asset value, end of period | | | $18.82 | | | | $21.05 | | | | $18.21 | | | | $15.18 | | | | $15.87 | |
Total return3 | | | 1.26 | % | | | 17.81 | % | | | 19.99 | % | | | (2.98 | )% | | | 11.28 | % |
Ratios to average net assets (annualized) | | | | | | | | | | | | | | | | | | | | |
Gross expenses | | | 1.10 | % | | | 1.10 | % | | | 1.10 | % | | | 1.12 | % | | | 1.11 | % |
Net expenses | | | 0.97 | % | | | 0.98 | % | | | 1.00 | % | | | 0.96 | % | | | 0.90 | % |
Net investment income | | | 1.52 | % | | | 0.86 | % | | | 1.00 | % | | | 0.95 | % | | | 0.61 | % |
Supplemental data | | | | | | | | | | | | | | | | | | | | |
Portfolio turnover rate | | | 45 | % | | | 33 | % | | | 50 | % | | | 51 | % | | | 44 | % |
Net assets, end of period (000s omitted) | | | $16,566 | | | | $25,444 | | | | $32,091 | | | | $57,879 | | | | $83,692 | |
| 1 | Calculated based upon average shares outstanding |
| 2 | Amount is less than $0.005. |
The accompanying notes are an integral part of these financial statements.
Wells Fargo Large Cap Core Fund | 21
Financial highlights
(For a share outstanding throughout each period)
| | | | | | | | | | | | | | | | | | | | |
| | | Year ended July 31 | |
| INSTITUTIONAL CLASS | | 2019 | | | 2018 | | | 2017 | | | 2016 | | | 2015 | |
Net asset value, beginning of period | | | $20.95 | | | | $18.12 | | | | $15.23 | | | | $15.91 | | | | $14.35 | |
Net investment income | | | 0.34 | | | | 0.23 | | | | 0.18 | | | | 0.18 | 1 | | | 0.14 | 1 |
Net realized and unrealized gains (losses) on investments | | | (0.30 | ) | | | 3.03 | | | | 2.91 | | | | (0.62 | ) | | | 1.50 | |
| | | | | | | | | | | | | | | | | | | | |
Total from investment operations | | | 0.04 | | | | 3.26 | | | | 3.09 | | | | (0.44 | ) | | | 1.64 | |
Distributions to shareholders from | | | | | | | | | | | | | | | | | | | | |
Net investment income | | | (0.24 | ) | | | (0.21 | ) | | | (0.20 | ) | | | (0.11 | ) | | | (0.08 | ) |
Net realized gains | | | (2.05 | ) | | | (0.22 | ) | | | 0.00 | | | | (0.13 | ) | | | 0.00 | |
| | | | | | | | | | | | | | | | | | | | |
Total distributions to shareholders | | | (2.29 | ) | | | (0.43 | ) | | | (0.20 | ) | | | (0.24 | ) | | | (0.08 | ) |
Net asset value, end of period | | | $18.70 | | | | $20.95 | | | | $18.12 | | | | $15.23 | | | | $15.91 | |
Total return | | | 1.56 | % | | | 18.16 | % | | | 20.43 | % | | | (2.75 | )% | | | 11.51 | % |
Ratios to average net assets (annualized) | | | | | | | | | | | | | | | | | | | | |
Gross expenses | | | 0.86 | % | | | 0.85 | % | | | 0.86 | % | | | 0.87 | % | | | 0.84 | % |
Net expenses | | | 0.67 | % | | | 0.68 | % | | | 0.70 | % | | | 0.70 | % | | | 0.66 | % |
Net investment income | | | 1.82 | % | | | 1.15 | % | | | 1.23 | % | | | 1.22 | % | | | 0.86 | % |
Supplemental data | | | | | | | | | | | | | | | | | | | | |
Portfolio turnover rate | | | 45 | % | | | 33 | % | | | 50 | % | | | 51 | % | | | 44 | % |
Net assets, end of period (000s omitted) | | | $600,595 | | | | $690,855 | | | | $621,864 | | | | $412,678 | | | | $63,235 | |
| 1 | Calculated based upon average shares outstanding |
The accompanying notes are an integral part of these financial statements.
22 | Wells Fargo Large Cap Core Fund
Notes to financial statements
1. ORGANIZATION
Wells Fargo Funds Trust (the “Trust”), a Delaware statutory trust organized on March 10, 1999, is an open-end management investment company registered under the Investment Company Act of 1940, as amended (the “1940 Act”). As an investment company, the Trust follows the accounting and reporting guidance in Financial Accounting Standards Board (“FASB”) Accounting Standards Codification Topic 946, Financial Services – Investment Companies. These financial statements report on the Wells Fargo Large Cap Core Fund (the “Fund”) which is a diversified series of the Trust.
2. SIGNIFICANT ACCOUNTING POLICIES
The following significant accounting policies, which are consistently followed in the preparation of the financial statements of the Fund, are in conformity with U.S. generally accepted accounting principles which require management to make estimates and assumptions that affect the reported amounts of assets and liabilities, disclosure of contingent assets and liabilities at the date of the financial statements, and the reported amounts of revenues and expenses during the reporting period. Actual results could differ from those estimates.
Securities valuation
All investments are valued each business day as of the close of regular trading on the New York Stock Exchange (generally 4 p.m. Eastern Time), although the Fund may deviate from this calculation time under unusual or unexpected circumstances.
Equity securities that are listed on a foreign or domestic exchange or market are valued at the official closing price or, if none, the last sales price. If no sale occurs on the principal exchange or market that day, a fair value price will be determined in accordance with the Fund’s Valuation Procedures.
Investments in registered open-end investment companies are valued at net asset value. Interests in non-registered investment companies that are redeemable at net asset value are fair valued normally at net asset value.
Investments which are not valued using any of the methods discussed above are valued at their fair value, as determined in good faith by the Board of Trustees of the Fund. The Board of Trustees has established a Valuation Committee comprised of the Trustees and has delegated to it the authority to take any actions regarding the valuation of portfolio securities that the Valuation Committee deems necessary or appropriate, including determining the fair value of portfolio securities, unless the determination has been delegated to the Wells Fargo Asset Management Pricing Committee at Wells Fargo Funds Management, LLC (“Funds Management”). The Board of Trustees retains the authority to make or ratify any valuation decisions or approve any changes to the Valuation Procedures as it deems appropriate. On a quarterly basis, the Board of Trustees receives reports on any valuation actions taken by the Valuation Committee or the Wells Fargo Asset Management Pricing Committee which may include items for ratification.
Securities lending
The Fund may lend its securities from time to time in order to earn additional income in the form of fees or interest on securities received as collateral or the investment of any cash received as collateral. When securities are on loan, the Fund receives interest or dividends on those securities. Cash collateral received in connection with its securities lending transactions is invested in Securities Lending Cash Investments, LLC (the “Securities Lending Fund”). Investments in Securities Lending Fund are valued at the evaluated bid price provided by an independent pricing service. Income earned from investment in the Securities Lending Fund (net of fees and rebates), if any, is included in income from affiliated securities on the Statement of Operations.
In a securities lending transaction, the net asset value of the Fund will be affected by an increase or decrease in the value of the securities loaned and by an increase or decrease in the value of the instrument in which collateral is invested. The amount of securities lending activity undertaken by the Fund fluctuates from time to time. The Fund has the right under the lending agreement to recover the securities from the borrower on demand. In the event of default or bankruptcy by the borrower, the Fund may be prevented from recovering the loaned securities or gaining access to the collateral or may experience delays or costs in doing so. In such an event, the terms of the agreement allows the unaffiliated securities lending agent to use the collateral to purchase replacement securities on behalf of the Fund or pay the Fund the market value of the loaned securities. The Fund will bear the risk of loss with respect to depreciation of its investment of the cash collateral.
Security transactions and income recognition
Securities transactions are recorded on a trade date basis. Realized gains or losses are recorded on the basis of identified cost.
Dividend income is recognized on the ex-dividend date.
Wells Fargo Large Cap Core Fund | 23
Notes to financial statements
Distributions to shareholders
Distributions to shareholders from net investment income and any net realized gains are recorded on the ex-dividend date and paid at least annually. Such distributions are determined in accordance with income tax regulations and may differ from U.S. generally accepted accounting principles. Dividend sources are estimated at the time of declaration. The tax character of distributions is determined as of the Fund’s fiscal year end. Therefore, a portion of the Fund’s distributions made prior to the Fund’s fiscal year end may be categorized as a tax return of capital at year end.
Federal and other taxes
The Fund intends to continue to qualify as a regulated investment company by distributing substantially all of its investment company taxable income and any net realized capital gains (after reduction for capital loss carryforwards) sufficient to relieve it from all, or substantially all, federal income taxes. Accordingly, no provision for federal income taxes was required.
The Fund’s income and federal excise tax returns and all financial records supporting those returns for the prior three fiscal years are subject to examination by the federal and Delaware revenue authorities. Management has analyzed the Fund’s tax positions taken on federal, state, and foreign tax returns for all open tax years and does not believe that there are any uncertain tax positions that require recognition of a tax liability.
As of July 31, 2019, the aggregate cost of all investments for federal income tax purposes was $824,391,987 and the unrealized gains (losses) consisted of:
| | | | |
| |
Gross unrealized gains | | $ | 230,746,534 | |
| |
Gross unrealized losses | | | (34,047,626 | ) |
| |
Net unrealized gains | | $ | 196,698,908 | |
Reclassifications are made to the Fund’s capital accounts for permanent tax differences to reflect income and gains available for distribution (or available capital loss carryforwards) under federal income tax regulations. U.S. generally accepted accounting principles require that certain components of net assets be adjusted to reflect permanent differences between financial and tax reporting. In addition, the Fund may utilize equalization accounting for tax purposes and designate earnings and profits, including net realized gains distributed to shareholders on redemption of shares, as a part of the dividends paid deduction for income tax purposes. These reclassifications have no effect on net assets or net asset values per share. The primary permanent difference causing such reclassifications is due to equalization payments. At July, 31, 2019, as a result of permanent book-to-tax differences, the following reclassification adjustments were made on the Statement of Assets and Liabilities:
| | |
| Paid-in capital | | Total distributable earnings |
| |
| $2,074,664 | | $(2,074,664) |
Class allocations
The separate classes of shares offered by the Fund differ principally in applicable sales charges, distribution, shareholder servicing, and administration fees. Class specific expenses are charged directly to that share class. Investment income, common fund-level expenses, and realized and unrealized gains (losses) on investments are allocated daily to each class of shares based on the relative proportion of net assets of each class.
3. FAIR VALUATION MEASUREMENTS
Fair value measurements of investments are determined within a framework that has established a fair value hierarchy based upon the various data inputs utilized in determining the value of the Fund’s investments. The three-level hierarchy gives the highest priority to unadjusted quoted prices in active markets for identical assets or liabilities (Level 1) and the lowest priority to unobservable inputs (Level 3). The Fund’s investments are classified within the fair value hierarchy based on the lowest level of input that is significant to the fair value measurement. The inputs are summarized into three broad levels as follows:
| ∎ | | Level 1 – quoted prices in active markets for identical securities |
| ∎ | | Level 2 – other significant observable inputs (including quoted prices for similar securities, interest rates, prepayment speeds, credit risk, etc.) |
| ∎ | | Level 3 – significant unobservable inputs (including the Fund’s own assumptions in determining the fair value of investments) |
The inputs or methodologies used for valuing investments in securities are not necessarily an indication of the risk associated with investing in those securities.
24 | Wells Fargo Large Cap Core Fund
Notes to financial statements
The following is a summary of the inputs used in valuing the Fund’s assets and liabilities as of July 31, 2019:
| | | | | | | | | | | | | | | | |
| | | | |
| | | Quoted prices (Level 1) | | | Other significant
observable inputs
(Level 2) | | | Significant
unobservable inputs (Level 3) | | | Total | |
| | | | |
Assets | | | | | | | | | | | | | | | | |
Investments in: | | | | | | | | | | | | | | | | |
| | | | |
Common stocks | | | | | | | | | | | | | | | | |
| | | | |
Communication services | | $ | 21,734,772 | | | $ | 0 | | | $ | 0 | | | $ | 21,734,772 | |
| | | | |
Consumer discretionary | | | 100,256,973 | | | | 0 | | | | 0 | | | | 100,256,973 | |
| | | | |
Consumer staples | | | 72,798,058 | | | | 0 | | | | 0 | | | | 72,798,058 | |
| | | | |
Energy | | | 53,925,374 | | | | 0 | | | | 0 | | | | 53,925,374 | |
| | | | |
Financials | | | 119,945,068 | | | | 0 | | | | 0 | | | | 119,945,068 | |
| | | | |
Health care | | | 144,354,558 | | | | 0 | | | | 0 | | | | 144,354,558 | |
| | | | |
Industrials | | | 117,695,595 | | | | 0 | | | | 0 | | | | 117,695,595 | |
| | | | |
Information technology | | | 264,348,904 | | | | 0 | | | | 0 | | | | 264,348,904 | |
| | | | |
Materials | | | 36,435,705 | | | | 0 | | | | 0 | | | | 36,435,705 | |
| | | | |
Real estate | | | 67,648,548 | | | | 0 | | | | 0 | | | | 67,648,548 | |
| | | | |
Utilities | | | 16,587,193 | | | | 0 | | | | 0 | | | | 16,587,193 | |
| | | | |
Short-term investments | | | | | | | | | | | | | | | | |
| | | | |
Investment companies | | | 5,360,147 | | | | 0 | | | | 0 | | | | 5,360,147 | |
| | | | |
Total assets | | $ | 1,021,090,895 | | | $ | 0 | | | $ | 0 | | | $ | 1,021,090,895 | |
Additional sector, industry or geographic detail is included in the Portfolio of Investments.
For the year ended July 31, 2019, the Fund did not have any transfers into/out of Level 3.
4. TRANSACTIONS WITH AFFILIATES
Management fee
Funds Management, an indirect wholly owned subsidiary of Wells Fargo & Company (“Wells Fargo”), is the manager of the Fund and provides advisory and fund-level administrative services under an investment management agreement. Under the investment management agreement, Funds Management is responsible for, among other services, implementing the investment objectives and strategies of the Fund, supervising the subadviser and providing fund-level administrative services in connection with the Fund’s operations. As compensation for its services under the investment management agreement, Funds Management is entitled to receive a management fee at the following annual rate based on the Fund’s average daily net assets:
| | | | |
| |
| Average daily net assets | | Management fee | |
| |
First $500 million | | | 0.700 | % |
| |
Next $500 million | | | 0.675 | |
| |
Next $1 billion | | | 0.650 | |
| |
Next $2 billion | | | 0.625 | |
| |
Next $1 billion | | | 0.600 | |
| |
Next $3 billion | | | 0.590 | |
| |
Next $2 billion | | | 0.565 | |
| |
Next $2 billion | | | 0.555 | |
| |
Next $4 billion | | | 0.530 | |
| |
Over $16 billion | | | 0.505 | |
For the year ended July 31, 2019, the management fee was equivalent to an annual rate of 0.69% of the Fund’s average daily net assets.
Wells Fargo Large Cap Core Fund | 25
Notes to financial statements
Funds Management has retained the services of a subadviser to provide daily portfolio management to the Fund. The fee for subadvisory services is borne by Funds Management. Wells Capital Management Incorporated (“WellsCap”), an affiliate of Funds Management and an indirect wholly owned subsidiary of Wells Fargo, is the subadviser to the Fund and is entitled to receive a fee from Funds Management at an annual rate starting at 0.35% and declining to 0.30% as the average daily net assets of the Fund increase.
Administration fees
Under a class-level administration agreement, Funds Management provides class-level administrative services to the Fund, which includes paying fees and expenses for services provided by the transfer agent, sub-transfer agents, omnibus account servicers and record-keepers. As compensation for its services under the class-level administration agreement, Funds Management receives an annual fee which is calculated based on the average daily net assets of each class as follows:
| | | | |
| |
| | | Class-level
administration fee | |
| |
Class A, Class C, Class R | | | 0.21 | % |
| |
Class R6 | | | 0.03 | |
| |
Administrator Class, Institutional Class | | | 0.13 | |
Waivers and/or expense reimbursements
Funds Management has contractually waived and/or reimbursed management and administration fees to the extent necessary to maintain certain net operating expense ratios for the Fund. When each class of the Fund has exceeded its expense cap, Funds Management has waived fees and/or reimbursed expenses from fund-level expenses on a proportionate basis and then from class specific expenses. When only certain classes exceed their expense caps, waivers and/or reimbursements are applied against class specific expenses before fund-level expenses. Funds Management has committed through November 30, 2019 to waive fees and/or reimburse expenses to the extent necessary to cap the Fund’s expenses at 1.08% for Class A shares, 1.83% for Class C shares, 1.33% for Class R shares, 0.65% for Class R6 shares, 0.97% for Administrator Class shares, and 0.67% for Institutional Class shares. Prior to or after the commitment expiration date, the cap may be increased or the commitment to maintain the cap may be terminated only with the approval of the Board of Trustees.
Distribution fees
The Trust has adopted a distribution plan for Class C and Class R shares of the Fund pursuant to Rule 12b-1 under the 1940 Act. Distribution fees are charged to Class C and Class R shares and paid to Wells Fargo Funds Distributor, LLC (“Funds Distributor”), the principal underwriter, at an annual rate of 0.75% of the average daily net assets of Class C shares and 0.25% of the average daily net assets of Class R shares.
In addition, Funds Distributor is entitled to receive the front-end sales charge from the purchase of Class A shares and a contingent deferred sales charge on the redemption of certain Class A shares. Funds Distributor is also entitled to receive the contingent deferred sales charges from redemptions of Class C shares. For the year ended July 31, 2019, Funds Distributor received $10,619 from the sale of Class A shares and $107 in contingent deferred sales charges from redemptions of Class C shares. No contingent deferred sales charges were incurred by Class A shares for the year ended July 31, 2019.
Shareholder servicing fees
The Trust has entered into contracts with one or more shareholder servicing agents, whereby Class A, Class C, Class R and Administrator Class of the Fund are charged a fee at an annual rate of 0.25% of the average daily net assets of each respective class. A portion of these total shareholder servicing fees were paid to affiliates of Wells Fargo.
Interfund transactions
The Fund may purchase or sell portfolio investment securities to certain other Wells Fargo affiliates pursuant to Rule 17a-7 under the 1940 Act and under procedures adopted by the Board of Trustees. The procedures have been designed to ensure that these interfund transactions, which do not incur broker commissions, are effected at current market prices.
5. INVESTMENT PORTFOLIO TRANSACTIONS
Purchases and sales of investments, excluding U.S. government obligations (if any) and short-term securities, for the year ended July 31, 2019 were $472,741,655 and $593,401,086, respectively.
26 | Wells Fargo Large Cap Core Fund
Notes to financial statements
6. SECURITIES LENDING TRANSACTIONS
The Fund lends its securities through an unaffiliated securities lending agent and receives collateral in the form of cash or securities with a value at least equal to the value of the securities on loan. The value of the loaned securities is determined at the close of each business day and any increases or decreases in the required collateral are exchanged between the Fund and the counterparty on the next business day. Cash collateral received is invested in the Securities Lending Fund which seeks to provide a positive return compared to the daily Fed Funds Open Rate by investing in high-quality, U.S. dollar-denominated short-term money market instruments and is exempt from registration under Section 3(c)(7) of the 1940 Act. Securities Lending Fund is managed by Funds Management and is subadvised by WellsCap. Funds Management receives an advisory fee starting at 0.05% and declining to 0.01% as the average daily net assets of the Securities Lending Fund increase. All of the fees received by Funds Management are paid to WellsCap for its services as subadviser.
In the event of counterparty default or the failure of a borrower to return a loaned security, the Fund has the right to use the collateral to offset any losses incurred. As of July 31, 2019, the Fund did not have any securities on loan.
7. BANK BORROWINGS
The Trust (excluding the money market funds), Wells Fargo Master Trust and Wells Fargo Variable Trust are parties to a $280,000,000 revolving credit agreement whereby the Fund is permitted to use bank borrowings for temporary or emergency purposes, such as to fund shareholder redemption requests. Interest under the credit agreement is charged to the Fund based on a borrowing rate equal to the higher of the Federal Funds rate in effect on that day plus 1.25% or the overnight LIBOR rate in effect on that day plus 1.25%. In addition, an annual commitment fee equal to 0.25% of the unused balance is allocated to each participating fund.
During the year ended July 31, 2019, the Fund had average borrowings outstanding of $16,903 at an average rate of 3.52% and paid interest in the amount of $595.
8. DISTRIBUTIONS TO SHAREHOLDERS
The tax character of distributions paid during the years ended July 31, 2019 and July 31, 2018 were as follows:
| | | | | | | | |
| | | Year ended July 31 | |
| | |
| | | 2019 | | | 2018 | |
| | |
Ordinary income | | $ | 11,587,477 | | | $ | 9,746,479 | |
| | |
Long-term capital gain | | | 110,267,828 | | | | 12,171,064 | |
As of July 31, 2019, the components of distributable earnings on a tax basis were as follows:
| | | | |
Undistributed ordinary income | | Undistributed long-term gain | | Unrealized gains |
| | |
| $9,601,980 | | $82,158,950 | | $196,698,908 |
Effective for all filings after November 4, 2018, the Securities and Exchange Commission eliminated the requirement to separately state the components of distributions to shareholders under U.S. generally accepted accounting principles. The amounts of distributions to shareholders for the year ended July 31, 2018 were as follows:
| | | | | | | | |
| | |
| | | Net investment
income | | | Net realized
gains | |
| | |
Class A | | | $2,344,339 | | | | $3,861,410 | |
| | |
Class C | | | 0 | | | | 697,513 | |
| | |
Class R | | | 8,939 | | | | 15,405 | |
| | |
Class R6 | | | 6,623 | | | | 6,840 | |
| | |
Administrator Class | | | 275,902 | | | | 370,395 | |
| | |
Institutional Class | | | 7,110,676 | | | | 7,219,501 | |
Wells Fargo Large Cap Core Fund | 27
Notes to financial statements
9. CONCENTRATION RISK
Concentration risks result from exposure to a limited number of sectors. As of the end of the period, the Fund invests a concentration of its portfolio in the information technology sector. A fund that invests a substantial portion of its assets in any sector may be more affected by changes in that sector than would be a fund whose investments are not heavily weighted in any sector.
10. INDEMNIFICATION
Under the Trust’s organizational documents, the officers and Trustees have been granted certain indemnification rights against certain liabilities that may arise out of performance of their duties to the Trust. Additionally, in the normal course of business, the Trust may enter into contracts with service providers that contain a variety of indemnification clauses. The Trust’s maximum exposure under these arrangements is dependent on future claims that may be made against the Fund and, therefore, cannot be estimated.
11. NEW ACCOUNTING PRONOUNCEMENT
In August 2018, FASB issued Accounting Standards Update (“ASU”) No. 2018-13, Fair Value Measurement (Topic 820)Disclosure Framework—Changes to the Disclosure Requirements for Fair Value Measurement. ASU 2018-13 updates the disclosure requirements for fair value measurements by modifying or removing certain disclosures and adding certain new disclosures. The amendments are effective for fiscal years, and interim periods within those fiscal years, beginning after December 15, 2019. Early adoption is permitted. Management has adopted the removal and modification of disclosures early, as permitted, and will adopt the additional new disclosures at the effective date.
28 | Wells Fargo Large Cap Core Fund
Report of independent registered public accounting firm
TO THE SHAREHOLDERS OF THE FUND AND BOARD OF TRUSTEES OF WELLS FARGO FUNDS TRUST:
Opinion on the Financial Statements
We have audited the accompanying statement of assets and liabilities of Wells Fargo Large Cap Core Fund (the Fund), one of the funds constituting Wells Fargo Funds Trust, including the portfolio of investments, as of July 31, 2019, the related statement of operations for the year then ended, the statements of changes in net assets for each of the years in the two-year period then ended, and the related notes (collectively, the financial statements) and the financial highlights for each of the years or periods in the five-year period then ended. In our opinion, the financial statements and financial highlights present fairly, in all material respects, the financial position of the Fund as of July 31, 2019, the results of its operations for the year then ended, the changes in its net assets for each of the years in the two-year period then ended, and the financial highlights for each of the years or periods in the five-year period then ended, in conformity with U.S. generally accepted accounting principles.
Basis for Opinion
These financial statements and financial highlights are the responsibility of the Fund’s management. Our responsibility is to express an opinion on these financial statements and financial highlights based on our audits. We are a public accounting firm registered with the Public Company Accounting Oversight Board (United States) (PCAOB) and are required to be independent with respect to the Fund in accordance with the U.S. federal securities laws and the applicable rules and regulations of the Securities and Exchange Commission and the PCAOB.
We conducted our audits in accordance with the standards of the PCAOB. Those standards require that we plan and perform the audit to obtain reasonable assurance about whether the financial statements and financial highlights are free of material misstatement, whether due to error or fraud. Our audits included performing procedures to assess the risks of material misstatement of the financial statements and financial highlights, whether due to error or fraud, and performing procedures that respond to those risks. Such procedures included examining, on a test basis, evidence regarding the amounts and disclosures in the financial statements and financial highlights. Such procedures also included confirmation of securities owned as of July 31, 2019, by correspondence with the custodian and transfer agent. Our audits also included evaluating the accounting principles used and significant estimates made by management, as well as evaluating the overall presentation of the financial statements and financial highlights. We believe that our audits provide a reasonable basis for our opinion.

We have not been able to determine the specific year that we began serving as the auditor of one or more Wells Fargo Funds investment companies; however we are aware that we have served as the auditor of one or more Wells Fargo Funds investment companies since at least 1955.
Boston, Massachusetts
September 25, 2019
Wells Fargo Large Cap Core Fund | 29
Other information (unaudited)
TAX INFORMATION
For corporate shareholders, pursuant to Section 854 of the Internal Revenue Code, 100% of ordinary income dividends qualify for the corporate dividends-received deduction for the fiscal year ended July 31, 2019.
Pursuant to Section 852 of the Internal Revenue Code, $110,393,181 was designated as a 20% rate gain distribution for the fiscal year ended July 31, 2019. Long-term capital gains in the amount of $125,353 were distributed in connection with Fund share redemptions.
Pursuant to Section 854 of the Internal Revenue Code, $13,536,789 of income dividends paid during the fiscal year ended July 31, 2019 has been designated as qualified dividend income (QDI).
PROXY VOTING INFORMATION
A description of the policies and procedures used to determine how to vote proxies relating to portfolio securities is available, upon request, by calling1-800-222-8222, visiting our website atwfam.com, or visiting the SEC website at sec.gov. Information regarding how the proxies related to portfolio securities were voted during the most recent 12-month period ended June 30 is available on the website atwfam.comor by visiting the SEC website at sec.gov.
QUARTERLY PORTFOLIO HOLDINGS INFORMATION
The Fund files its complete schedule of portfolio holdings with the SEC for the first and third quarters of each fiscal year on Form N-Q or Form N-PORT, which is available by visiting the SEC website at sec.gov. Those forms may be reviewed and copied at the SEC’s Public Reference Room in Washington, DC. Information on the operation of the Public Reference Room may be obtained by calling 1-800-SEC-0330.
30 | Wells Fargo Large Cap Core Fund
Other information (unaudited)
BOARD OF TRUSTEES AND OFFICERS
Each of the Trustees and Officers1 listed in the table below acts in identical capacities for each fund in the Wells Fargo family of funds, which consists of 152 mutual funds comprising the Wells Fargo Funds Trust, Wells Fargo Variable Trust, Wells Fargo Master Trust and four closed-end funds (collectively the “Fund Complex”). This table should be read in conjunction with the Prospectus and the Statement of Additional Information2. The mailing address of each Trustee and Officer is 525 Market Street, 12th Floor, San Francisco, CA 94105. Each Trustee and Officer serves an indefinite term, however, each Trustee serves such term until reaching the mandatory retirement age established by the Trustees.
Independent Trustees
| | | | | | |
Name and year of birth | | Position held and length of service* | | Principal occupations during past five years or longer | | Current other
public company or
investment
company
directorships |
| | | |
William R. Ebsworth (Born 1957) | | Trustee, since 2015 | | Retired. From 1984 to 2013, equities analyst, portfolio manager, research director and chief investment officer at Fidelity Management and Research Company in Boston, Tokyo, and Hong Kong, and retired in 2013 as Chief Investment Officer of Fidelity Strategic Advisers, Inc. where he led a team of investment professionals managing client assets. Prior thereto, Board member of Hong Kong Securities Clearing Co., Hong Kong Options Clearing Corp., the Thailand International Fund, Ltd., Fidelity Investments Life Insurance Company, and Empire Fidelity Investments Life Insurance Company. Audit Committee Chair and Investment Committee Chair of the Vincent Memorial Hospital Endowment (non-profit organization). Mr. Ebsworth is a CFA® charterholder. | | N/A |
| | | |
Jane A. Freeman (Born 1953) | | Trustee, since 2015; Chair Liaison, since 2018 | | Retired. From 2012 to 2014 and 1999 to 2008, Chief Financial Officer of Scientific Learning Corporation. From 2008 to 2012, Ms. Freeman provided consulting services related to strategic business projects. Prior to 1999, Portfolio Manager at Rockefeller & Co. and Scudder, Stevens & Clark. Board member of the Harding Loevner Funds from 1996 to 2014, serving as both Lead Independent Director and chair of the Audit Committee. Board member of the Russell Exchange Traded Funds Trust from 2011 to 2012 and the chair of the Audit Committee. Ms. Freeman is a Board Member of The Ruth Bancroft Garden (non-profit organization). She is also an inactive Chartered Financial Analyst. | | N/A |
| | | |
Isaiah Harris, Jr. (Born 1952) | | Trustee, since 2009; Audit Committee Chairman, since 2019 | | Retired. Chairman of the Board of CIGNA Corporation since 2009, and Director since 2005. From 2003 to 2011, Director of Deluxe Corporation. Prior thereto, President and CEO of BellSouth Advertising and Publishing Corp. from 2005 to 2007, President and CEO of BellSouth Enterprises from 2004 to 2005 and President of BellSouth Consumer Services from 2000 to 2003. Emeritus member of the Iowa State University Foundation Board of Governors. Emeritus Member of the Advisory Board of Iowa State University School of Business. Advisory Board Member, Palm Harbor Academy (private school). Advisory Board Member, Child Evangelism Fellowship (non-profit). Mr. Harris is a certified public accountant (inactive status). | | CIGNA Corporation |
| | | |
Judith M. Johnson (Born 1949) | | Trustee, since 2008; Audit Committee Chairman, from 2009 to 2018 | | Retired. Prior thereto, Chief Executive Officer and Chief Investment Officer of Minneapolis Employees Retirement Fund from 1996 to 2008. Ms. Johnson is an attorney, certified public accountant and a certified managerial accountant. | | N/A |
Wells Fargo Large Cap Core Fund | 31
Other information (unaudited)
| | | | | | |
Name and year of birth | | Position held and length of service* | | Principal occupations during past five years or longer | | Current other
public company or
investment
company
directorships |
| | | |
David F. Larcker (Born 1950) | | Trustee, since 2009 | | James Irvin Miller Professor of Accounting at the Graduate School of Business, Stanford University, Director of the Corporate Governance Research Initiative and Senior Faculty of The Rock Center for Corporate Governance since 2006. From 2005 to 2008, Professor of Accounting at the Graduate School of Business, Stanford University. Prior thereto, Ernst & Young Professor of Accounting at The Wharton School, University of Pennsylvania from 1985 to 2005. | | N/A |
| | | |
Olivia S. Mitchell (Born 1953) | | Trustee, since 2006; Nominating and Governance Committee Chairman, since 2018 | | International Foundation of Employee Benefit Plans Professor, Wharton School of the University of Pennsylvania since 1993. Director of Wharton’s Pension Research Council and Boettner Center on Pensions & Retirement Research, and Research Associate at the National Bureau of Economic Research. Previously, Cornell University Professor from 1978 to 1993. | | N/A |
| | | |
Timothy J. Penny (Born 1951) | | Trustee, since 1996; Chairman, since 2018 | | President and Chief Executive Officer of Southern Minnesota Initiative Foundation, a non-profit organization, since 2007. Member of the Board of Trustees of NorthStar Education Finance, Inc., a non-profit organization, since 2007. | | N/A |
| | | |
James G. Polisson (Born 1959) | | Trustee, since 2018 | | Retired. Chief Marketing Officer, Source (ETF) UK Services, Ltd, from 2015 to 2017. From 2012 to 2015, Principal of The Polisson Group, LLC, a management consulting, corporate advisory and principal investing company. Chief Executive Officer and Managing Director at Russell Investments, Global Exchange Traded Funds from 2010 to 2012. Managing Director of Barclays Global Investors from 1998 to 2010 and Global Chief Marketing Officer for iShares and Barclays Global Investors from 2000 to 2010. Trustee of the San Francisco Mechanics’ Institute, a non-profit organization, from 2013 to 2015. Board member of the Russell Exchange Traded Fund Trust from 2011 to 2012. Director of Barclays Global Investors Holdings Deutschland GmbH from 2006 to 2009. Mr. Polisson is an attorney and has a retired status with the Massachusetts and District of Columbia Bar Associations. | | N/A |
| * | Length of service dates reflect the Trustee’s commencement of service with the Trust’s predecessor entities, where applicable. |
32 | Wells Fargo Large Cap Core Fund
Other information (unaudited)
Officers
| | | | |
Name and year of birth | | Position held and length of service | | Principal occupations during past five years or longer |
| | |
Andrew Owen (Born 1960) | | President, since 2017 | | Executive Vice President of Wells Fargo & Company and Head of Affiliated Managers, Wells Fargo Asset Management, since 2014. In addition, Mr. Owen is currently President, Chief Executive Officer and Director of Wells Fargo Funds Management, LLC since 2017. Prior thereto, Executive Vice President responsible for marketing, investments and product development for Wells Fargo Funds Management, LLC, from 2009 to 2014. |
| | |
Jeremy DePalma1 (Born 1974) | | Treasurer, since 2012 | | Senior Vice President of Wells Fargo Funds Management, LLC since 2009. Senior Vice President of Evergreen Investment Management Company, LLC from 2008 to 2010 and head of the Fund Reporting and Control Team within Fund Administration from 2005 to 2010. |
| | |
Alexander Kymn (Born 1973) | | Secretary and Chief Legal Officer, since 2018 | | Senior Company Counsel of Wells Fargo Bank, N.A. since 2018 (previously Senior Counsel from 2007 to 2018). Vice President of Wells Fargo Funds Management, LLC from 2008 to 2014. |
| | |
Michael H. Whitaker (Born 1967) | | Chief Compliance Officer, since 2016 | | Senior Vice President and Chief Compliance Officer since 2016. Senior Vice President and Chief Compliance Officer for Fidelity Investments from 2007 to 2016. |
| | |
David Berardi (Born 1975) | | Assistant Treasurer, since 2009 | | Vice President of Wells Fargo Funds Management, LLC since 2009. Vice President of Evergreen Investment Management Company, LLC from 2008 to 2010. Manager of Fund Reporting and Control for Evergreen Investment Management Company, LLC from 2004 to 2010. |
| 1 | Jeremy DePalma acts as Treasurer of 87 funds and Assistant Treasurer of 65 funds in the Fund Complex. |
| 2 | The Statement of Additional Information includes additional information about the Trustees and is available, without charge, upon request, by calling 1-800-222-8222 or by visiting the website atwfam.com. |
Wells Fargo Large Cap Core Fund | 33
Other information (unaudited)
BOARD CONSIDERATION OF INVESTMENT MANAGEMENT AND SUB-ADVISORY AGREEMENTS:
Wells Fargo Large Cap Core Fund
Under the Investment Company Act of 1940 (the “1940 Act”), the Board of Trustees (the “Board”) of Wells Fargo Funds Trust (the “Trust”) must determine annually whether to approve the continuation of the Trust’s investment management andsub-advisory agreements. In this regard, at an in-person meeting held on May 21-22, 2019 (the “Meeting”), the Board, all the members of which have no direct or indirect interest in the investment management and sub-advisory agreements and are not “interested persons” of the Trust, as defined in the 1940 Act (the “Independent Trustees”), reviewed and approved for Wells Fargo Large Cap Core Fund (the “Fund”): (i) an investment management agreement (the “Management Agreement”) with Wells Fargo Funds Management, LLC (“Funds Management”); and (ii) an investment sub-advisory agreement (the“Sub-Advisory Agreement”) with Wells Capital Management Incorporated (the “Sub-Adviser”), an affiliate of Funds Management. The Management Agreement and theSub-Advisory Agreement are collectively referred to as the “Advisory Agreements.”
At the Meeting, the Board considered the factors and reached the conclusions described below relating to the selection of Funds Management and the Sub-Adviser and the approval of the Advisory Agreements. Prior to the Meeting, including at anin-person meeting in April 2019, the Trustees conferred extensively among themselves and with representatives of Funds Management about these matters. Also, the Board has adopted a team-based approach, with each team consisting of a sub-set of Trustees, to assist the full Board in the discharge of its duties in reviewing investment performance and other matters throughout the year. The Independent Trustees were assisted in their evaluation of the Advisory Agreements by independent legal counsel, from whom they received separate legal advice and with whom they met separately.
In providing information to the Board, Funds Management and the Sub-Adviser were guided by a detailed set of requests for information submitted to them by independent legal counsel on behalf of the Independent Trustees at the start of the Board’s annual contract renewal process earlier in 2019. In considering and approving the Advisory Agreements, the Trustees considered the information they believed relevant, including but not limited to the information discussed below. The Board considered not only the specific information presented in connection with the Meeting, but also the knowledge gained over time through interaction with Funds Management and the Sub-Adviser about various topics. In this regard, the Board reviewed reports of Funds Management at each of its quarterly meetings, which included, among other things, portfolio reviews and investment performance reports. In addition, the Board and the teams mentioned above confer with portfolio managers at various times throughout the year. The Board did not identify any particular information or consideration that was all-important or controlling, and each individual Trustee may have attributed different weights to various factors.
After its deliberations, the Board unanimously approved the continuation of the Advisory Agreements for a one-year term and determined that the compensation payable to Funds Management and the Sub-Adviser under each of the Advisory Agreements was reasonable. The Board considered the approval of the Advisory Agreements for the Fund as part of its consideration of agreements for funds across the complex, but its approvals were made on a fund-by-fund basis. The following summarizes a number of important, but not necessarily all, factors considered by the Board in support of its approvals.
Nature, extent and quality of services
The Board received and considered various information regarding the nature, extent and quality of services provided to the Fund by Funds Management and the Sub-Adviser under the Advisory Agreements. This information included a description of the investment advisory services and Fund-level administrative services covered by the Management Agreement, as well as, among other things, a summary of the background and experience of senior management of Wells Fargo Asset Management (“WFAM”), of which Funds Management and the Sub-Adviser are a part, a summary of investments made in the business of WFAM, a summary of certain organizational and personnel changes involving Funds Management and the Sub-Adviser, and a description of Funds Management’s and the Sub-Adviser’s business continuity planning programs and of their approaches to data privacy and cybersecurity. The Board received and reviewed information about Funds Management’s role as administrator of the Fund’s liquidity risk management program. The Board also considered the qualifications, background, tenure and responsibilities of each of the portfolio managers primarily responsible for the day-to-day portfolio management of the Fund.
The Board evaluated the ability of Funds Management and the Sub-Adviser to attract and retain qualified investment professionals, including research, advisory and supervisory personnel. The Board further considered the compliance programs and compliance records of Funds Management and the Sub-Adviser. In addition, the Board took into account the full range of services provided to the Fund by Funds Management and its affiliates.
34 | Wells Fargo Large Cap Core Fund
Other information (unaudited)
Fund investment performance and expenses
The Board considered the investment performance results for the Fund over various time periods ended December 31, 2018. The Board considered these results in comparison to the investment performance of funds in a universe that was determined by Broadridge Inc. (“Broadridge”) to be similar to the Fund (the “Universe”), and in comparison to the Fund’s benchmark index and to other comparative data. Broadridge is an independent provider of investment company data. The Board received a description of the methodology used by Broadridge to select the mutual funds in the performance Universe. The Board noted that the investment performance of the Fund (Class A) was higher than the average investment performance of the Universe for the three-, five- and ten-year periods under review, but lower than the average investment performance of the Universe for the one-year period under review. The Board also noted that the investment performance of the Fund was lower than its benchmark index, the S&P 500 Index, for all periods under review.
The Board received information concerning, and discussed factors contributing to, the underperformance of the Fund relative to the Universe and benchmark for the periods identified above. The Board took note of the explanations for the relative underperformance during these periods, including with respect to investment decisions and market factors that affected the Fund’s investment performance. The Board also took note of the Fund’s outperformance relative to the Universe over the longer time periods under review.
The Board also received and considered information regarding the Fund’s net operating expense ratios and their various components, including actual management fees, custodian and other non-management fees, and Rule 12b-1 and non-Rule 12b-1 shareholder service fees. The Board considered these ratios in comparison to the median ratios of funds in class-specific expense groups that were determined by Broadridge to be similar to the Fund (the “Groups”). The Board received a description of the methodology used by Broadridge to select the mutual funds in the expense Groups and an explanation of how funds comprising expense groups and their expense ratios may vary from year-to-year. Based on the Broadridge reports, the Board noted that the net operating expense ratios of the Fund were lower than or in range of the median net operating expense ratios of the expense Groups for each share class.
The Board took into account the Fund’s investment performance and expense information provided to it among the factors considered in deciding to re-approve the Advisory Agreements.
Investment management and sub-advisory fee rates
The Board reviewed and considered the contractual fee rates payable by the Fund to Funds Management under the Management Agreement, as well as the contractual fee rates payable by the Fund to Funds Management for class-level administrative services under a Class-Level Administration Agreement, which include, among other things, class-level transfer agency and sub-transfer agency costs (collectively, the “Management Rates”). The Board also reviewed and considered the contractual investment sub-advisory fee rates that are payable by Funds Management to the Sub-Adviser for investmentsub-advisory services.
Among other information reviewed by the Board was a comparison of the Fund’s Management Rates with the average contractual investment management fee rates of funds in the expense Groups at a common asset level as well as transfer agency costs of the funds in the expense Groups. The Board noted that the Management Rates of the Fund were equal to or in range of the sum of these average rates for the Fund’s expense Groups for the Class R, Class A, Administrator Class and Institutional share classes, but higher than the sum of these average rates for the Fund’s expense Groups for the Class R6 share class. However, the Board noted that the net operating expense ratios of the Fund were lower than or in range of the median net operating expense ratios of the expense Groups for each share class.
The Board also received and considered information about the portion of the total management fee that was retained by Funds Management after payment of the fee to the Sub-Adviser for sub-advisory services. In assessing the reasonableness of this amount, the Board received and evaluated information about the nature and extent of responsibilities retained and risks assumed by Funds Management and not delegated to or assumed by the Sub-Adviser, and about Funds Management’son-going oversight services. Given the affiliation between Funds Management and the Sub-Adviser, the Board ascribed limited relevance to the allocation of fees between them.
The Board also received and considered information about the nature and extent of services offered and fee rates charged by Funds Management and the Sub-Adviser to other types of clients with investment strategies similar to those of the Fund. In this regard, the Board received information about the significantly greater scope of services, and compliance, reporting and other legal burdens and risks of managing proprietary mutual funds compared with those associated with managing assets of other types of clients, including third-party sub-advised fund clients and non-mutual fund clients such as institutional separate accounts.
Wells Fargo Large Cap Core Fund | 35
Other information (unaudited)
Based on its consideration of the factors and information it deemed relevant, including those described here, the Board determined that the compensation payable to Funds Management under the Management Agreement and to the Sub-Adviser under the Sub-Advisory Agreement was reasonable.
Profitability
The Board received and considered information concerning the profitability of Funds Management, as well as the profitability of both WFAM and Wells Fargo & Co. (“Wells Fargo”) from providing services to the fund family as a whole. The Board noted that the Sub-Adviser’s profitability information with respect to providing services to the Fund and other funds in the family was subsumed in the WFAM and Wells Fargo profitability analysis.
Funds Management reported on the methodologies and estimates used in calculating profitability, including a description of the methodology used to allocate certain expenses. Among other things, the Board noted that the levels of profitability reported on a fund-by-fund basis varied widely, depending on factors such as the size, type and age of fund. Based on its review, the Board did not deem the profits reported by Funds Management, WFAM or Wells Fargo from services provided to the Fund to be at a level that would prevent it from approving the continuation of the Advisory Agreements.
Economies of scale
The Board received and considered information about the potential for Funds Management to experience economies of scale in the provision of management services to the Fund, the difficulties of calculating economies of scale at an individual fund level, and the extent to which potential scale benefits are shared with shareholders. The Board noted the existence of breakpoints in the Fund’s management fee structure, which operate generally to reduce the Fund’s expense ratios as the Fund grows in size. The Board considered that in addition to management fee breakpoints, Funds Management shares potential economies of scale from its management business in a variety of ways, including through fee waiver and expense reimbursement arrangements, services that benefit shareholders, competitive management fee rates set at the outset without regard to breakpoints, and investments in the business intended to enhance services available to shareholders.
The Board concluded that Funds Management’s arrangements with respect to the Fund, including contractual breakpoints, constituted a reasonable approach to sharing potential economies of scale with the Fund and its shareholders.
Other benefits to Funds Management and the Sub-Adviser
The Board received and considered information regarding potential “fall-out” or ancillary benefits received by Funds Management and its affiliates, including the Sub-Adviser, as a result of their relationships with the Fund. Ancillary benefits could include, among others, benefits directly attributable to other relationships with the Fund and benefits potentially derived from an increase in Funds Management’s and the Sub-Adviser’s business as a result of their relationships with the Fund. The Board noted that various affiliates of Funds Management may receive distribution-related fees, shareholder servicing payments and sub-transfer agency fees in respect of shares sold or held through them and services provided.
The Board also reviewed information about soft dollar credits earned and utilized by the Sub-Adviser, fees earned by Funds Management and the Sub-Adviser from managing a private investment vehicle for the fund family’s securities lending collateral, and commissions earned by an affiliated broker from portfolio transactions.
Based on its consideration of the factors and information it deemed relevant, including those described here, the Board did not find that any ancillary benefits received by Funds Management and its affiliates, including the Sub-Adviser, were unreasonable.
Conclusion
At the Meeting, after considering the above-described factors and based on its deliberations and its evaluation of the information described above, the Board unanimously approved the continuation of the Advisory Agreements for a one-year term and determined that the compensation payable to Funds Management and the Sub-Adviser under each of the Advisory Agreements was reasonable.
36 | Wells Fargo Large Cap Core Fund

For more information
More information about Wells Fargo Funds is available free upon request. To obtain literature, please write, visit the Fund’s website, or call:
Wells Fargo Funds
P.O. Box 219967
Kansas City, MO 64121-9967
Website:wfam.com
Individual investors:1-800-222-8222
Retail investment professionals:1-888-877-9275
Institutional investment professionals:1-866-765-0778

This report and the financial statements contained herein are submitted for the general information of the shareholders of the Fund. If this report is used for promotional purposes, distribution of the report must be accompanied or preceded by a current prospectus. Before investing, please consider the investment objectives, risks, charges, and expenses of the investment. For a current prospectus and, if available, a summary prospectus, containing this information, call1-800-222-8222 or visit the Fund’s website atwfam.com. Read the prospectus carefully before you invest or send money.
Wells Fargo Asset Management (WFAM) is the trade name for certain investment advisory/management firms owned by Wells Fargo & Company. These firms include but are not limited to Wells Capital Management Incorporated and Wells Fargo Funds Management, LLC. Certain products managed by WFAM entities are distributed by Wells Fargo Funds Distributor, LLC (a broker-dealer and Member FINRA).
This material is for general informational and educational purposes only and is NOT intended to provide investment advice or a recommendation of any kind—including a recommendation for any specific investment, strategy, or plan.
INVESTMENT PRODUCTS: NOT FDIC INSURED ◾ NO BANK GUARANTEE ◾ MAY LOSE VALUE
© 2019 Wells Fargo Funds Management, LLC. All rights reserved.
405480 09-19
A208/AR208 07-19
Annual Report
July 31, 2019
Wells Fargo Large Cap Growth Fund
Beginning on January 1, 2021, as permitted by new regulations adopted by the Securities and Exchange Commission, paper copies of the Wells Fargo Funds’ annual and semi-annual shareholder reports issued after this date will no longer be sent by mail, unless you specifically request paper copies of the reports. Instead, the reports will be made available on the Funds’ website, and you will be notified by mail each time a report is posted and provided with a website address to access the report.
If you already elected to receive shareholder reports electronically, you will not be affected by this change and you need not take any action. You may elect to receive shareholder reports and other communications from the Fund electronically at any time by contacting your financial intermediary (such as a broker-dealer or bank) or, if you are a direct investor, by calling1-800-222-8222 or by enrolling at wellsfargo.com/advantagedelivery.
You may elect to receive all future reports in paper free of charge. If you invest through a financial intermediary, you can contact your financial intermediary to request that you continue to receive paper copies of your shareholder reports; if you invest directly with the Fund, you can call 1-800-222-8222. Your election to receive reports in paper will apply to all Wells Fargo Funds held in your account with your financial intermediary or, if you are a direct investor, to all Wells Fargo Funds that you hold.
|
|
|
Reduce clutter. Save trees. |
Sign up for electronic delivery of prospectuses and shareholder reports atwellsfargo.com/advantagedelivery |
The views expressed and any forward-looking statements are as of July 31, 2019, unless otherwise noted, and are those of the Fund managers and/or Wells Fargo Asset Management. Discussions of individual securities, or the markets generally, or any Wells Fargo Fund are not intended as individual recommendations. Future events or results may vary significantly from those expressed in any forward-looking statements. The views expressed are subject to change at any time in response to changing circumstances in the market. Wells Fargo Asset Management and the Fund disclaim any obligation to publicly update or revise any views expressed or forward-looking statements.
INVESTMENT PRODUCTS: NOT FDIC INSURED ◾ NO BANK GUARANTEE ◾ MAY LOSE VALUE
Wells Fargo Large Cap Growth Fund | 1
Letter to shareholders (unaudited)

Andrew Owen
President
Wells Fargo Funds
Dear Shareholder:
We are pleased to offer you this annual report for the Wells Fargo Large Cap Growth Fund for the 12-month period that ended July 31, 2019. After the first six months of the period yielded either low-single-digit or negative investment returns, U.S. stock and global bond investors generally enjoyed a recovery during the final six months amid continued concerns about global economic growth, international trade, geopolitical tensions, and bouts of market volatility. These concerns negatively influenced international equity markets.
For the period, U.S. stocks, based on the S&P 500 Index,1 gained 7.99% and international stocks, as measured by the MSCI ACWI ex USA Index (Net),2 fell 2.27%. The MSCI EM Index (Net)3 slipped 2.18%. For bond investors, the Bloomberg Barclays U.S. Aggregate Bond Index4 added 8.08%, the Bloomberg Barclays Global Aggregate ex-USD Index5 added 3.74%, the Bloomberg Barclays Municipal Bond Index6 gained 7.31%, and the ICE BofAML U.S. High Yield Index7 added 6.94%.
Entering the fourth quarter of 2018, economic data was encouraging.
Domestic equity investors entered the fourth quarter of 2018 with reasons to be optimistic. The U.S. Bureau of Economic Analysis reported second-quarter annualized gross domestic product (GDP) growth of 4.2%. Hiring improved. Unemployment declined. Consumer confidence and spending increased. Third-quarter corporate earnings reports were generally positive. U.S. trade negotiations with Mexico and Canada progressed. The U.S. Federal Reserve (Fed) raised the federal funds rate by 25 basis points (bps; 100 bps equal 1.00%) to a target range of between 2.00% and 2.25% in September 2018, one of four rate increases implemented during the calendar year, a sign of its confidence in the strength of the U.S. economy.
Investors in international markets were not as confident. Tensions between the U.S. and China increased. The U.S. imposed $200 billion in tariffs on Chinese goods. China reacted with $60 billion in tariffs on U.S. goods. Economic growth in China caused concern. In September 2018, international investors began to factor a number of disconcerting economic and business data points: lower July manufacturers’ and industrial orders in Germany; falling purchasing manager index numbers for August from the United Kingdom, China, and India; and declining household spending for August in Japan. Taken together, the data fed growing concerns over slowing global growth that unnerved investors.
| 1 | The S&P 500 Index consists of 500 stocks chosen for market size, liquidity, and industry group representation. It is a market-value-weighted index with each stock’s weight in the index proportionate to its market value. You cannot invest directly in an index. |
| 2 | The Morgan Stanley Capital International (MSCI) All Country World Index (ACWI) ex USA Index (Net) is a free-float-adjusted market-capitalization weighted index that is designed to measure the equity market performance of developed and emerging markets, excluding the U.S. Source: MSCI. MSCI makes no express or implied warranties or representations and shall have no liability whatsoever with respect to any MSCI data contained herein. The MSCI data may not be further redistributed or used as a basis for other indices or any securities or financial products. This report is not approved, reviewed, or produced by MSCI. You cannot invest directly in an index. |
| 3 | The MSCI Emerging Markets (EM) Index (Net) is a free-float-adjusted market-capitalization-weighted index that is designed to measure the equity market performance of emerging markets. You cannot invest directly in an index. |
| 4 | The Bloomberg Barclays U.S. Aggregate Bond Index is a broad-based benchmark that measures the investment-grade, U.S. dollar-denominated, fixed-rate taxable bond market, including Treasuries, government-related and corporate securities, mortgage-backed securities (agency fixed-rate and hybrid adjustable-rate mortgage pass-throughs), asset-backed securities, and commercial mortgage-backed securities. You cannot invest directly in an index. |
| 5 | The Bloomberg Barclays Global Aggregate ex-USD Index is an unmanaged index that provides a broad-based measure of the global investment-grade fixed-income markets excluding the U.S. dollar-denominated debt market. You cannot invest directly in an index. |
| 6 | The Bloomberg Barclays Municipal Bond Index is an unmanaged index composed of long-term tax-exempt bonds with a minimum credit rating of Baa. You cannot invest directly in an index. |
| 7 | The ICE BofAML U.S. High Yield Index is a market-capitalization-weighted index of domestic and Yankee high-yield bonds. The index tracks the performance of high-yield securities traded in the U.S. bond market. You cannot invest directly in an index. Copyright 2019. ICE Data Indices, LLC. All rights reserved. |
2 | Wells Fargo Large Cap Growth Fund
Letter to shareholders (unaudited)
Global markets suffered during the fourth quarter of 2018.
November’s U.S. midterm elections shifted control of the House of Representatives from Republicans to Democrats, presaging partisan clashes that followed and caused uncertainty among investors. Third-quarter U.S. GDP was announced at an annualized 3.4% rate, lower than the second-quarter rate. Brexit efforts stalled ahead of the March 2019 deadline. The People’s Bank of China cut reserve requirement ratios, accelerated infrastructure spending, and cut taxes even as the value of the yuan declined to low levels last seen in 2008. A partial U.S. government shutdown driven by partisan policy disputes extended into January.
The combination of news in the U.S. and generally weak economic indicators outside of the U.S. caused investors to seek safe havens. December’s S&P 500 Index performance was the worst since 1931. Globally, fixed-income investments fared better than stocks during the last two months of the year. The Fed increased the federal funds rate by 25 bps in December to a target range of between 2.25% and 2.50%.
The market climbs a wall of worry.
Investors entered 2019 with reasons to be concerned. Investment returns appeared to reaffirm the adage that markets climb a wall of worry. The S&P 500 Index gained 8.01% for the month of January, the best monthly performance in 30 years. Returns for the MSCI ACWI ex USA Index (Net), the Bloomberg Barclays U.S. Aggregate Bond Index, and the Bloomberg Barclays Global Aggregate ex-USD Index also were positive.
In February 2019, signs of slowing global growth grew more ominous. The Bureau of Economic Analysis announced fourth-quarter 2018 GDP grew at an annualized 2.2% rate, down from the levels of the prior two quarters. In a February report, the Bank of England forecasted the slowest growth since the financial crisis for 2019. China and the U.S. continued to wrangle over trade issues.
By the end of March 2019, a combination of dovish Fed sentiment and steady, if not spectacular, U.S. economic and business metrics reinforced investors’ confidence. Monthly job creation data and corporate profits, while less consistent than during 2018, were solid. China announced a roughly $300 billion stimulus package through tax and fee cuts intended to reinvigorate economic growth. During April 2019, favorable sentiment found additional support in reports of sustained low inflation, solid employment data, and first-quarter U.S. GDP of an annualized rate of 3.2%.
During May 2019, markets tumbled on mixed investment signals. In the U.S., partisan wrangling ramped up as Democrats and Republicans set their sights on 2020 presidential politics. The U.K.’s Brexit caused Prime Minister Theresa May to resign. The European Commission downgraded the 2019 growth forecast to 1.2%. The U.S. increased tariffs on products from China, China responded, and then talks broke down. President Donald Trump threatened to turn his foreign policy tariff tool to Mexico over immigration issues.
As had been the case during most of 2019 to date, just as the investment horizon appeared to darken, sentiment turned and U.S. equity markets gained during June and July. The gains, primarily driven by geopolitical and monetary policy events, pushed equity markets to new highs.
President Mario Draghi of the European Central Bank said that if the outlook doesn’t improve, the bank will cut rates or buy more assets to prop up inflation. President Trump backed off of tariff threats against Mexico and China. In the U.S., the Fed implemented a 0.25% federal funds rate cut in July 2019.
“December’s S&P 500 Index performance was the worst since 1931.”
“The S&P 500 Index gained 8.01% for the month of January, the best monthly performance in 30 years.”
Wells Fargo Large Cap Growth Fund | 3
Letter to shareholders (unaudited)
Later in July 2019, the U.S. reversed course and threatened to impose higher tariffs on China’s exports after talks failed. China responded with tariff threats of its own and devalued the renminbi, a move that roiled global markets. Despite the accommodative approach of central banks, investors continued to have misgivings about the durability of economic growth globally and a pervasively cautious tone influenced the world’s equity and fixed-income markets.
Don’t let short-term uncertainty derail long-term investment goals.
Periods of investment uncertainty can present challenges, but experience has taught us that maintaining long-term investment goals can be an effective way to plan for the future. To help you create a sound strategy based on your personal goals and risk tolerance, Wells Fargo Funds offers more than 100 mutual funds spanning a wide range of asset classes and investment styles. Although diversification cannot guarantee an investment profit or prevent losses, we believe it can be an effective way to manage investment risk and potentially smooth out overall portfolio performance. We encourage investors to know their investments and to understand that appropriate levels of risk-taking may unlock opportunities.
Thank you for choosing to invest with Wells Fargo Funds. We appreciate your confidence in us and remain committed to helping you meet your financial needs.
Sincerely,

Andrew Owen
President
Wells Fargo Funds
|
|
|
For further information about your Fund, contact your investment professional, visit our website at wfam.com, or call us directly at1-800-222-8222. |
4 | Wells Fargo Large Cap Growth Fund
This page is intentionally left blank.
Performance highlights (unaudited)
Investment objective
The Fund seeks long-term capital appreciation.
Manager
Wells Fargo Funds Management, LLC
Subadviser
Wells Capital Management Incorporated
Portfolio managers
Joseph M. Eberhardy, CFA®‡, CPA
Bob Gruendyke, CFA®‡
Thomas C. Ognar, CFA®‡
Average annual total returns (%) as of July 31, 2019
| | | | | | | | | | | | | | | | | | | | | | | | | | | | | | | | | | |
| | | | |
| | | | | Including sales charge | | | Excluding sales charge | | | Expense ratios1 (%) | |
| | | | | | | | | |
| | | Inception date | | 1 year | | | 5 year | | | 10 year | | | 1 year | | | 5 year | | | 10 year | | | Gross | | | Net2 | |
| | | | | | | | | | |
| Class A (STAFX)3 | | 7-30-2010 | | | 4.62 | | | | 11.49 | | | | 14.00 | | | | 11.00 | | | | 12.82 | | | | 14.68 | | | | 1.17 | | | | 1.07 | |
| | | | | | | | | | |
| Class C (STOFX)4 | | 7-30-2010 | | | 9.17 | | | | 11.97 | | | | 13.83 | | | | 10.17 | | | | 11.97 | | | | 13.83 | | | | 1.92 | | | | 1.82 | |
| | | | | | | | | | |
| Class R (STMFX)5 | | 6-15-2012 | | | – | | | | – | | | | – | | | | 10.74 | | | | 12.53 | | | | 14.41 | | | | 1.42 | | | | 1.32 | |
| | | | | | | | | | |
| Class R4 (SLGRX)6 | | 11-30-2012 | | | | | | | | | | | | | | | 11.32 | | | | 13.14 | | | | 15.00 | | | | 0.89 | | | | 0.80 | |
| | | | | | | | | | |
| Class R6 (STFFX)7 | | 11-30-2012 | | | – | | | | – | | | | – | | | | 11.46 | | | | 13.30 | | | | 15.11 | | | | 0.74 | | | | 0.65 | |
| | | | | | | | | | |
| Administrator Class (STDFX)8 | | 7-30-2010 | | | – | | | | – | | | | – | | | | 11.14 | | | | 12.96 | | | | 14.81 | | | | 1.09 | | | | 0.95 | |
| | | | | | | | | | |
| Institutional Class (STNFX)9 | | 7-30-2010 | | | – | | | | – | | | | – | | | | 11.37 | | | | 13.21 | | | | 15.05 | | | | 0.84 | | | | 0.75 | |
| | | | | | | | | | |
| Russell 1000® Growth Index10 | | – | | | – | | | | – | | | | – | | | | 10.82 | | | | 14.25 | | | | 15.74 | | | | – | | | | – | |
Figures quoted represent past performance, which is no guarantee of future results, and do not reflect taxes that a shareholder may pay on fund distributions or the redemption of fund shares. Investment return and principal value of an investment will fluctuate so that an investor’s shares, when redeemed, may be worth more or less than their original cost. Performance shown without sales charges would be lower if sales charges were reflected. Current performance may be lower or higher than the performance data quoted, which assumes the reinvestment of dividends and capital gains. Current month-end performance is available on the Fund’s website, wfam.com.
Index returns do not include transaction costs associated with buying and selling securities, any mutual fund fees or expenses, or any taxes. It is not possible to invest directly in an index.
For Class A shares, the maximum front-end sales charge is 5.75%. For Class C shares, the maximum contingent deferred sales charge is 1.00%. Performance including a contingent deferred sales charge assumes the sales charge for the corresponding time period. Class R, Class R4, Class R6, Administrator Class, and Institutional Class shares are sold without a front-end sales charge or contingent deferred sales charge.
Stock values fluctuate in response to the activities of individual companies and general market and economic conditions. Certain investment strategies tend to increase the total risk of an investment (relative to the broader market). The Fund is exposed to foreign investment risk. Consult the Fund’s prospectus for additional information on these and other risks.
Please see footnotes on page 7.
6 | Wells Fargo Large Cap Growth Fund
Performance highlights (unaudited)
|
|
| Growth of $10,000 investment as of July 31, 201911 |
|
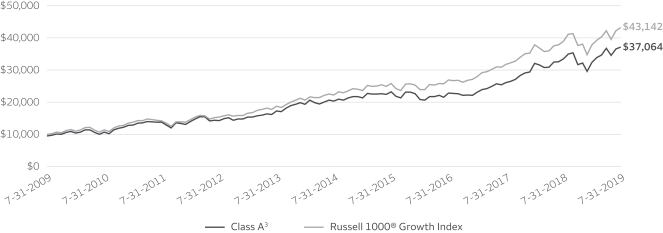
|
| ‡ | CFA® and Chartered Financial Analyst® are trademarks owned by CFA Institute. |
| 1 | Reflects the expense ratios as stated in the most recent prospectuses. The expense ratios shown are subject to change and may differ from the annualized expense ratios shown in the financial highlights of this report. |
| 2 | The manager has contractually committed through November 30, 2019, to waive fees and/or reimburse expenses to the extent necessary to cap the expenses of each class after fee waivers at the amounts shown. Brokerage commissions, stamp duty fees, interest, taxes, acquired fund fees and expenses (if any), and extraordinary expenses are excluded from the expense cap. Prior to or after the commitment expiration date, the cap may be increased or the commitment to maintain the cap may be terminated only with the approval of the Board of Trustees. Without this cap, the Fund’s returns would have been lower. The expense ratio paid by an investor is the net expense ratio (the total annual fund operating expenses after fee waivers) as stated in the prospectuses. |
| 3 | Historical performance shown for Class A shares prior to their inception reflects the performance of the former Investor Class shares and includes the higher expenses applicable to the former Investor Class shares. If these expenses had not been included, returns for Class A shares would be higher. |
| 4 | Historical performance shown for Class C shares prior to their inception reflects the performance of the former Investor Class shares, adjusted to reflect the higher expenses applicable to Class C shares. |
| 5 | Historical performance shown for Class R shares prior to their inception reflects the performance of the former Investor Class shares, adjusted to reflect the higher expenses applicable to Class R shares. |
| 6 | Historical performance shown for Class R4 shares prior to their inception reflects the performance of Institutional Class shares, adjusted to reflect the higher expenses applicable to Class R4 shares. |
| 7 | Historical performance shown for Class R6 shares prior to their inception reflects the performance of Institutional Class shares, and includes the higher expenses applicable to Institutional Class shares. If these expenses had not been included, returns for Class R6 shares would be higher. |
| 8 | Historical performance shown for Administrator Class shares prior to their inception reflects the performance of the former Investor Class shares, and includes the higher expenses applicable to the former Investor Class shares. If these expenses had not been included, returns for Administrator Class shares would be higher. |
| 9 | Historical performance shown for Institutional Class shares prior to their inception reflects the performance of the former Investor Class shares, and includes the higher expenses applicable to the former Investor Class shares. If these expenses had not been included, returns for Institutional Class shares would be higher. |
| 10 | The Russell 1000® Growth Index measures the performance of those Russell 1000 companies with higher price/book ratios and higher forecasted growth values. You cannot invest directly in an index. |
| 11 | The chart compares the performance of Class A shares for the most recent ten years with the Russell 1000® Growth Index. The chart assumes a hypothetical investment of $10,000 in Class A shares and reflects all operating expenses and assumes the maximum initial sales charge of 5.75%. |
| 12 | The ten largest holdings, excluding cash, cash equivalents and any money market funds, are calculated based on the value of the investments divided by total net assets of the Fund. Holdings are subject to change and may have changed since the date specified. |
| 13 | Amounts are calculated based on the total long-term investments of the Fund. These amounts are subject to change and may have changed since the date specified. |
Wells Fargo Large Cap Growth Fund | 7
Performance highlights (unaudited)
MANAGER’S DISCUSSION
Fund highlights
| ∎ | | The Fund (Class A excluding sales charges) outperformed its benchmark, the Russell 1000® Growth Index, for the 12-month period that ended July 31, 2019. |
| ∎ | | Holdings within information technology (IT) and health care and an underweight to consumer staples aided the Fund’s performance for the period. |
| ∎ | | The Fund’s performance was inhibited by stocks within the consumer discretionary and communication services sectors. |
The equity market pushed higher over the trailing one-year period as solid economic fundamentals have overshadowed periods of negative sentiment, which was particularly pervasive in late 2018. For much of the fourth quarter of 2018, stocks moved sharply lower as a flattening yield curve, corporate debt concerns, a pullback in commodities, tariff and trade concerns, and hues of decelerating global growth flustered markets. Additionally, geopolitical concerns coupled with quantitative easing across the globe have fueled investor concerns. Despite this backdrop, while some economic data has slowed in the U.S., the economy still stands on solid footing with low unemployment and strong consumer confidence. This environment of accommodative fiscal and monetary policy and reasonable energy prices is fostering a healthy landscape for the consumer. The Fund continues to benefit from constructive idiosyncratic dynamics and secular growth catalysts in a variety of areas as many of our portfolio companies are gaining market share in their respective industries.
| | | | |
|
| Ten largest holdings (%) as of July 31, 201912 | |
| | |
Microsoft Corporation | | | 8.11 | |
| | |
Amazon.com Incorporated | | | 7.92 | |
| | |
MasterCard Incorporated Class A | | | 4.03 | |
| | |
Visa Incorporated Class A | | | 3.66 | |
| | |
Alphabet Incorporated Class A | | | 3.49 | |
| | |
Microchip Technology Incorporated | | | 3.44 | |
| | |
Alphabet Incorporated Class C | | | 3.30 | |
| | |
Facebook Incorporated Class A | | | 2.88 | |
| | |
Texas Instruments Incorporated | | | 2.68 | |
| | |
Burlington Stores Incorporated | | | 2.30 | |
Performance of health care and IT holdings were beneficial to Fund performance.
Select holdings within the health care sector served as a strong area of the Fund. Health care firm Zoetis, Incorporated, which makes medicines and vaccines for animals, rallied sharply as it garnered increased demand for its products from both its companion animal and livestock segments. Other areas of the Fund that performed well included software-as-a-service (SaaS) and payment processing industries within IT that generated market-share penetration and margin expansion in their respective vertical markets. Within software, demand remained strong as corporate spending continued to rise, coupled with next-
generation cloud-computing platforms that garnered a large share of new business at the expense of legacy solutions. Within the payment space, the movement toward e-commerce had a positive effect on overall demand as more consumers moved from cash to digital payments.
|
|
| Sector distribution as of July 31, 201913 |
|
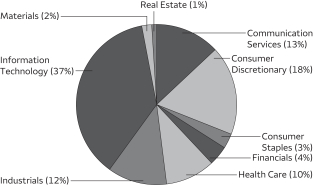 |
Certain communication services stocks detracted from performance.
The main source of weakness from a sector perspective came from communication services as the Fund’s underweight position to Facebook, Incorporated, negatively affected relative performance. In 2018, we reduced our positon after privacy issues surfaced and after Facebook shifted its focus toward monetizing stories and video rather than the traditional newsfeed segment. Recently, we have added back to our position as we have grown more comfortable with its ability to monetize both of these properties within Instagram and the legacy Facebook app.
Please see footnotes on page 7.
8 | Wells Fargo Large Cap Growth Fund
Performance highlights (unaudited)
Areas of focus remain in secular areas like software, payments, and semiconductors.
The Fund continues to be well diversified in a plethora of areas, which include industries within consumer discretionary, health care, communication services, and IT. Some notable segments include the SaaS, payments, and semiconductors industries. The structural advantages of the software space continue to include benefits like a predictable cost of ownership to the customer, flexibility and scale, simplification, and faster implementation times. Within the payments segment, processors like Square, Incorporated, and PayPal Holdings, Incorporated, as well as networks Visa Incorporated and MasterCard Incorporated, continued to capitalize from secular drivers such as the global shift from cash and check to plastic, growth within e-commerce, international and cross-border growth, and peer-to-peer transfers. Semiconductors, which continue to benefit from the digitization of the economy, are becoming more prevalent in our daily lives as more chips are being used in electrical devices.
Our view of faster-growth stocks is positive.
We continue to be disciplined from a valuation perspective by trimming positions where the valuation gap has narrowed and adding to positions where it has widened. While our process is largely bottom-up, we continue to monitor geopolitical issues like trade tensions between the U.S. and China as well as macroeconomic conditions such as the economic slowdown in Europe, the increasing amount of negative-yielding sovereign debt, and the steep decrease in U.S. Treasury yields. We expect to generate alpha from multiple sectors and industries and remain comfortable with our positioning and our focus on SaaS, cloud services, online retail, digital payments, the internet of things, and innovation (SCODIi). We continue to witness a scarcity of growth stock opportunities within the investing universe, which could favor our portfolio in the future. Going forward, given the current economic backdrop, stocks emphasized in our investment process should bode well for the future of the portfolio.
Wells Fargo Large Cap Growth Fund | 9
Fund expenses (unaudited)
As a shareholder of the Fund, you incur two types of costs: (1) transaction costs, including sales charges (loads) on purchase payments and contingent deferred sales charges (if any) on redemptions and (2) ongoing costs, including management fees, distribution (12b-1) and/or shareholder servicing fees, and other Fund expenses. This example is intended to help you understand your ongoing costs (in dollars) of investing in the Fund and to compare these costs with the ongoing costs of investing in other mutual funds.
The example is based on an investment of $1,000 invested at the beginning of the six-month period and held for the entire period from February 1, 2019 to July 31, 2019.
Actual expenses
The “Actual” line of the table below provides information about actual account values and actual expenses. You may use the information in this line, together with the amount you invested, to estimate the expenses that you paid over the period. Simply divide your account value by $1,000 (for example, an $8,600 account value divided by $1,000 = 8.6), then multiply the result by the number in the “Actual” line under the heading entitled “Expenses paid during period” for your applicable class of shares to estimate the expenses you paid on your account during this period.
Hypothetical example for comparison purposes
The “Hypothetical” line of the table below provides information about hypothetical account values and hypothetical expenses based on the Fund’s actual expense ratio and an assumed rate of return of 5% per year before expenses, which is not the Fund’s actual return. The hypothetical account values and expenses may not be used to estimate the actual ending account balance or expenses you paid for the period. You may use this information to compare the ongoing costs of investing in the Fund and other funds. To do so, compare this 5% hypothetical example with the 5% hypothetical examples that appear in the shareholder reports of the other funds.
Please note that the expenses shown in the table are meant to highlight your ongoing costs only and do not reflect any transactional costs, such as sales charges (loads) and contingent deferred sales charges. Therefore, the “Hypothetical” line of the table is useful in comparing ongoing costs only and will not help you determine the relative total costs of owning different funds. In addition, if these transactional costs were included, your costs would have been higher.
| | | | | | | | | | | | | | | | |
| | | Beginning
account value
2-1-2019 | | | Ending
account value
7-31-2019 | | | Expenses
paid during
the period¹ | | | Annualized net
expense ratio | |
| | | | | |
Class A | | | | | | | | | | | | | | | | |
| | | | |
Actual | | $ | 1,000.00 | | | $ | 1,145.26 | | | $ | 5.69 | | | | 1.07 | % |
| | | | |
Hypothetical (5% return before expenses) | | $ | 1,000.00 | | | $ | 1,019.49 | | | $ | 5.36 | | | | 1.07 | % |
| | | | | |
Class C | | | | | | | | | | | | | | | | |
| | | | |
Actual | | $ | 1,000.00 | | | $ | 1,141.00 | | | $ | 9.66 | | | | 1.82 | % |
| | | | |
Hypothetical (5% return before expenses) | | $ | 1,000.00 | | | $ | 1,015.77 | | | $ | 9.10 | | | | 1.82 | % |
| | | | | |
Class R | | | | | | | | | | | | | | | | |
| | | | |
Actual | | $ | 1,000.00 | | | $ | 1,144.12 | | | $ | 7.02 | | | | 1.32 | % |
| | | | |
Hypothetical (5% return before expenses) | | $ | 1,000.00 | | | $ | 1,018.25 | | | $ | 6.61 | | | | 1.32 | % |
| | | | | |
Class R4 | | | | | | | | | | | | | | | | |
| | | | |
Actual | | $ | 1,000.00 | | | $ | 1,146.98 | | | $ | 4.26 | | | | 0.80 | % |
| | | | |
Hypothetical (5% return before expenses) | | $ | 1,000.00 | | | $ | 1,020.83 | | | $ | 4.01 | | | | 0.80 | % |
| | | | | |
Class R6 | | | | | | | | | | | | | | | | |
| | | | |
Actual | | $ | 1,000.00 | | | $ | 1,147.48 | | | $ | 3.46 | | | | 0.65 | % |
| | | | |
Hypothetical (5% return before expenses) | | $ | 1,000.00 | | | $ | 1,021.57 | | | $ | 3.26 | | | | 0.65 | % |
| | | | | |
Administrator Class | | | | | | | | | | | | | | | | |
| | | | |
Actual | | $ | 1,000.00 | | | $ | 1,146.07 | | | $ | 5.06 | | | | 0.95 | % |
| | | | |
Hypothetical (5% return before expenses) | | $ | 1,000.00 | | | $ | 1,020.08 | | | $ | 4.76 | | | | 0.95 | % |
| | | | | |
Institutional Class | | | | | | | | | | | | | | | | |
| | | | |
Actual | | $ | 1,000.00 | | | $ | 1,147.15 | | | $ | 3.99 | | | | 0.75 | % |
| | | | |
Hypothetical (5% return before expenses) | | $ | 1,000.00 | | | $ | 1,021.08 | | | $ | 3.76 | | | | 0.75 | % |
| 1 | Expenses paid is equal to the annualized net expense ratio of each class multiplied by the average account value over the period, multiplied by the number of days in the most recent fiscal half-year divided by the number of days in the fiscal year (to reflect the one-half-year period). |
10 | Wells Fargo Large Cap Growth Fund
Portfolio of investments—July 31, 2019
| | | | | | | | | | | | | | | | |
| | | | | | | | | Shares | | | Value | |
| Common Stocks: 99.15% | | | | | | | | | | | | | | | | |
| | | | |
Communication Services: 12.45% | | | | | | | | | | | | | | | | |
| | | | |
| Entertainment: 1.66% | | | | | | | | | | | | |
| | | | |
Live Nation Incorporated † | | | | | | | | | | | 639 | | | $ | 46,046 | |
| | | | |
Netflix Incorporated † | | | | | | | | | | | 30,120 | | | | 9,728,459 | |
| | | | |
The Walt Disney Company | | | | | | | | | | | 49,800 | | | | 7,121,898 | |
| | | | |
| | | | | | | | | | | | | | | 16,896,403 | |
| | | | | | | | | | | | | | | | |
| | | | |
| Interactive Media & Services: 10.79% | | | | | | | | | | | | |
| | | | |
Alphabet Incorporated Class A † | | | | | | | | | | | 29,230 | | | | 35,607,986 | |
| | | | |
Alphabet Incorporated Class C † | | | | | | | | | | | 27,670 | | | | 33,665,536 | |
| | | | |
Facebook Incorporated Class A † | | | | | | | | | | | 151,170 | | | | 29,361,749 | |
| | | | |
Match Group Incorporated † | | | | | | | | | | | 63,900 | | | | 4,811,031 | |
| | | | |
Pinterest Incorporated Class A †« | | | | | | | | | | | 45,306 | | | | 1,313,421 | |
| | | | |
Twitter Incorporated † | | | | | | | | | | | 127,500 | | | | 5,394,525 | |
| | | | |
| | | | | | | | | | | | | | | 110,154,248 | |
| | | | | | | | | | | | | | | | |
| | | | |
Consumer Discretionary: 17.87% | | | | | | | | | | | | | | | | |
| | | | |
| Hotels, Restaurants & Leisure: 2.45% | | | | | | | | | | | | |
| | | | |
Carnival Corporation | | | | | | | | | | | 134,740 | | | | 6,363,770 | |
| | | | |
Norwegian Cruise Line Holdings Limited † | | | | | | | | | | | 157,300 | | | | 7,776,912 | |
| | | | |
Royal Caribbean Cruises Limited | | | | | | | | | | | 93,100 | | | | 10,831,254 | |
| | | | |
| | | | | | | | | | | | | | | 24,971,936 | |
| | | | | | | | | | | | | | | | |
| | | | |
| Internet & Direct Marketing Retail: 7.92% | | | | | | | | | | | | |
| | | | |
Amazon.com Incorporated † | | | | | | | | | | | 43,280 | | | | 80,794,238 | |
| | | | | | | | | | | | | | | | |
| | | | |
| Specialty Retail: 6.20% | | | | | | | | | | | | |
| | | | |
Burlington Stores Incorporated † | | | | | | | | | | | 129,700 | | | | 23,443,275 | |
| | | | |
CarMax Incorporated † | | | | | | | | | | | 57,700 | | | | 5,063,752 | |
| | | | |
O’Reilly Automotive Incorporated † | | | | | | | | | | | 8,400 | | | | 3,198,384 | |
| | | | |
The Home Depot Incorporated | | | | | | | | | | | 85,960 | | | | 18,368,792 | |
| | | | |
ULTA Beauty Incorporated † | | | | | | | | | | | 37,800 | | | | 13,201,650 | |
| | | | |
| | | | | | | | | | | | | | | 63,275,853 | |
| | | | | | | | | | | | | | | | |
| | | | |
| Textiles, Apparel & Luxury Goods: 1.30% | | | | | | | | | | | | |
| | | | |
Levi Strauss & Company Class A †« | | | | | | | | | | | 532,400 | | | | 10,147,544 | |
| | | | |
Nike Incorporated Class B | | | | | | | | | | | 36,100 | | | | 3,105,683 | |
| | | | |
| | | | | | | | | | | | | | | 13,253,227 | |
| | | | | | | | | | | | | | | | |
| | | | |
Consumer Staples: 3.08% | | | | | | | | | | | | | | | | |
| | | | |
| Beverages: 1.54% | | | | | | | | | | | | |
| | | | |
The Coca-Cola Company | | | | | | | | | | | 299,080 | | | | 15,740,580 | |
| | | | | | | | | | | | | | | | |
| | | | |
| Personal Products: 1.54% | | | | | | | | | | | | |
| | | | |
The Estee Lauder Companies Incorporated Class A | | | | | | | | | | | 84,940 | | | | 15,645,099 | |
| | | | | | | | | | | | | | | | |
| | | | |
Energy: 0.41% | | | | | | | | | | | | | | | | |
| | | | |
| Oil, Gas & Consumable Fuels: 0.41% | | | | | | | | | | | | |
| | | | |
Concho Resources Incorporated | | | | | | | | | | | 42,840 | | | | 4,184,611 | |
| | | | | | | | | | | | | | | | |
The accompanying notes are an integral part of these financial statements.
Wells Fargo Large Cap Growth Fund | 11
Portfolio of investments—July 31, 2019
| | | | | | | | | | | | | | | | |
| | | | | | | | | Shares | | | Value | |
Financials: 4.03% | | | | | | | | | | | | | | | | |
| | | | |
| Capital Markets: 3.21% | | | | | | | | | | | | |
| | | | |
BlackRock Incorporated | | | | | | | | | | | 5,600 | | | $ | 2,619,008 | |
| | | | |
CME Group Incorporated | | | | | | | | | | | 54,330 | | | | 10,562,839 | |
| | | | |
Raymond James Financial Incorporated | | | | | | | | | | | 35,100 | | | | 2,831,517 | |
| | | | |
The Charles Schwab Corporation | | | | | | | | | | | 388,190 | | | | 16,777,572 | |
| | | | |
| | | | | | | | | | | | | | | 32,790,936 | |
| | | | | | | | | | | | | | | | |
| | | | |
| Insurance: 0.82% | | | | | | | | | | | | |
| | | | |
The Progressive Corporation | | | | | | | | | | | 103,070 | | | | 8,346,609 | |
| | | | | | | | | | | | | | | | |
| | | | |
Health Care: 9.95% | | | | | | | | | | | | | | | | |
| | | | |
| Biotechnology: 2.02% | | | | | | | | | | | | |
| | | | |
Alexion Pharmaceuticals Incorporated † | | | | | | | | | | | 126,700 | | | | 14,353,843 | |
| | | | |
Vertex Pharmaceuticals Incorporated † | | | | | | | | | | | 37,390 | | | | 6,229,922 | |
| | | | |
| | | | | | | | | | | | | | | 20,583,765 | |
| | | | | | | | | | | | | | | | |
| | | | |
| Health Care Equipment & Supplies: 5.44% | | | | | | | | | | | | |
| | | | |
Abbott Laboratories | | | | | | | | | | | 132,790 | | | | 11,566,009 | |
| | | | |
Baxter International Incorporated | | | | | | | | | | | 49,890 | | | | 4,189,263 | |
| | | | |
Boston Scientific Corporation † | | | | | | | | | | | 446,640 | | | | 18,964,334 | |
| | | | |
Edwards Lifesciences Corporation † | | | | | | | | | | | 34,800 | | | | 7,407,180 | |
| | | | |
Intuitive Surgical Incorporated † | | | | | | | | | | | 5,300 | | | | 2,753,403 | |
| | | | |
Stryker Corporation | | | | | | | | | | | 50,700 | | | | 10,635,846 | |
| | | | |
| | | | | | | | | | | | | | | 55,516,035 | |
| | | | | | | | | | | | | | | | |
| | | | |
| Life Sciences Tools & Services: 0.57% | | | | | | | | | | | | |
| | | | |
Agilent Technologies Incorporated | | | | | | | | | | | 84,670 | | | | 5,876,945 | |
| | | | | | | | | | | | | | | | |
| | | | |
| Pharmaceuticals: 1.92% | | | | | | | | | | | | |
| | | | |
Zoetis Incorporated | | | | | | | | | | | 170,290 | | | | 19,564,618 | |
| | | | | | | | | | | | | | | | |
| | | | |
| Industrials: 11.88% | | | | | | | | | | | | |
| | | | |
| Aerospace & Defense: 1.19% | | | | | | | | | | | | |
| | | | |
The Boeing Company | | | | | | | | | | | 35,640 | | | | 12,159,655 | |
| | | | | | | | | | | | | | | | |
| | | | |
| Air Freight & Logistics: 0.53% | | | | | | | | | | | | |
| | | | |
C.H. Robinson Worldwide Incorporated | | | | | | | | | | | 64,900 | | | | 5,434,077 | |
| | | | | | | | | | | | | | | | |
| | | | |
| Commercial Services & Supplies: 1.89% | | | | | | | | | | | | |
| | | | |
Waste Connections Incorporated | | | | | | | | | | | 213,080 | | | | 19,330,618 | |
| | | | | | | | | | | | | | | | |
| | | | |
| Industrial Conglomerates: 1.27% | | | | | | | | | | | | |
| | | | |
Roper Technologies Incorporated | | | | | | | | | | | 35,630 | | | | 12,956,850 | |
| | | | | | | | | | | | | | | | |
| | | | |
| Machinery: 0.87% | | | | | | | | | | | | |
| | | | |
Fortive Corporation | | | | | | | | | | | 116,260 | | | | 8,841,573 | |
| | | | | | | | | | | | | | | | |
| | | | |
| Road & Rail: 6.13% | | | | | | | | | | | | |
| | | | |
CSX Corporation | | | | | | | | | | | 327,300 | | | | 23,041,920 | |
| | | | |
Norfolk Southern Corporation | | | | | | | | | | | 106,370 | | | | 20,329,434 | |
| | | | |
Union Pacific Corporation | | | | | | | | | | | 106,550 | | | | 19,173,673 | |
| | | | |
| | | | | | | | | | | | | | | 62,545,027 | |
| | | | | | | | | | | | | | | | |
The accompanying notes are an integral part of these financial statements.
12 | Wells Fargo Large Cap Growth Fund
Portfolio of investments—July 31, 2019
| | | | | | | | | | | | | | | | |
| | | | | | | | | Shares | | | Value | |
Information Technology: 37.18% | | | | | | | | | | | | | | | | |
| | | | |
| IT Services: 13.95% | | | | | | | | | | | | |
| | | | |
Fidelity National Information Services Incorporated | | | | | | | | | | | 160,554 | | | $ | 21,393,775 | |
| | | | |
Global Payments Incorporated | | | | | | | | | | | 24,400 | | | | 4,097,248 | |
| | | | |
MasterCard Incorporated Class A | | | | | | | | | | | 151,080 | | | | 41,134,552 | |
| | | | |
PayPal Holdings Incorporated † | | | | | | | | | | | 207,480 | | | | 22,905,792 | |
| | | | |
Shopify Incorporated Class A † | | | | | | | | | | | 16,930 | | | | 5,381,708 | |
| | | | |
Square Incorporated Class A † | | | | | | | | | | | 125,570 | | | | 10,097,084 | |
| | | | |
Visa Incorporated Class A | | | | | | | | | | | 209,830 | | | | 37,349,740 | |
| | | | |
| | | | | | | | | | | | | | | 142,359,899 | |
| | | | | | | | | | | | | | | | |
| | | | |
| Semiconductors & Semiconductor Equipment: 6.51% | | | | | | | | | | | | |
| | | | |
Microchip Technology Incorporated « | | | | | | | | | | | 371,520 | | | | 35,078,918 | |
| | | | |
NVIDIA Corporation | | | | | | | | | | | 23,600 | | | | 3,981,792 | |
| | | | |
Texas Instruments Incorporated | | | | | | | | | | | 218,720 | | | | 27,342,187 | |
| | | | |
| | | | | | | | | | | | | | | 66,402,897 | |
| | | | | | | | | | | | | | | | |
| | | | |
| Software: 14.59% | | | | | | | | | | | | |
| | | | |
Adobe Systems Incorporated † | | | | | | | | | | | 46,340 | | | | 13,849,172 | |
| | | | |
Dropbox Incorporated Class A † | | | | | | | | | | | 439,100 | | | | 10,345,196 | |
| | | | |
Microsoft Corporation | | | | | | | | | | | 607,400 | | | | 82,770,398 | |
| | | | |
Salesforce.com Incorporated † | | | | | | | | | | | 87,480 | | | | 13,515,660 | |
| | | | |
ServiceNow Incorporated † | | | | | | | | | | | 43,720 | | | | 12,127,491 | |
| | | | |
Splunk Incorporated † | | | | | | | | | | | 79,480 | | | | 10,754,439 | |
| | | | |
VMware Incorporated Class A | | | | | | | | | | | 26,110 | | | | 4,555,934 | |
| | | | |
Zoom Video Communications Incorporated †« | | | | | | | | | | | 10,155 | | | | 969,904 | |
| | | | |
| | | | | | | | | | | | | | | 148,888,194 | |
| | | | | | | | | | | | | | | | |
| | | | |
| Technology Hardware, Storage & Peripherals: 2.13% | | | | | | | | | | | | |
| | | | |
Apple Incorporated | | | | | | | | | | | 101,840 | | | | 21,695,994 | |
| | | | | | | | | | | | | | | | |
| | | | |
Materials: 1.88% | | | | | | | | | | | | | | | | |
| | | | |
| Chemicals: 1.88% | | | | | | | | | | | | |
| | | | |
Air Products & Chemicals Incorporated | | | | | | | | | | | 31,820 | | | | 7,263,551 | |
| | | | |
Linde plc | | | | | | | | | | | 62,440 | | | | 11,943,523 | |
| | | | |
| | | | | | | | | | | | | | | 19,207,074 | |
| | | | | | | | | | | | | | | | |
| | | | |
Real Estate: 0.42% | | | | | | | | | | | | | | | | |
| | | | |
| Real Estate Management & Development: 0.42% | | | | | | | | | | | | |
| | | | |
CBRE Group Incorporated Class A † | | | | | | | | | | | 80,900 | | | | 4,288,509 | |
| | | | | | | | | | | | | | | | |
| | | | |
Total Common Stocks (Cost $488,156,376) | | | | | | | | | | | | | | | 1,011,705,470 | |
| | | | | | | | | | | | | | | | |
| | | | |
| | | | | | | | | | | | | | | | |
The accompanying notes are an integral part of these financial statements.
Wells Fargo Large Cap Growth Fund | 13
Portfolio of investments—July 31, 2019
| | | | | | | | | | | | | | | | |
| | | Yield | | | | | | Shares | | | Value | |
| Short-Term Investments: 4.43% | | | | | | | | | | | | |
| | | | |
| Investment Companies: 4.43% | | | | | | | | | | | | |
| | | | |
Securities Lending Cash Investments LLC (l)(r)(u) | | | 2.46 | % | | | | | | | 39,213,509 | | | $ | 39,217,430 | |
| | | | |
Wells Fargo Government Money Market Fund Select Class (l)(u) | | | 2.26 | | | | | | | | 5,937,879 | | | | 5,937,879 | |
| | | | | | | | | | | | | | | | |
| | | | |
Total Short-Term Investments (Cost $45,155,433) | | | | | | | | | | | | | | | 45,155,309 | |
| | | | | | | | | | | | | | | | |
| | | | | | | | |
| Total investments in securities (Cost $533,311,809) | | | 103.58 | % | | | 1,056,860,779 | |
| | |
Other assets and liabilities, net | | | (3.58 | ) | | | (36,510,050 | ) |
| | | | | | | | |
| Total net assets | | | 100.00 | % | | $ | 1,020,350,729 | |
| | | | | | | | |
| † | Non-income-earning security |
| « | All or a portion of this security is on loan. |
| (l) | The issuer of the security is an affiliated person of the Fund as defined in the Investment Company Act of 1940. |
| (r) | The investment is a non-registered investment company purchased with cash collateral received from securities on loan. |
| (u) | The rate represents the 7-day annualized yield at period end. |
Investments in Affiliates
An affiliated investment is an investment in which the Fund owns at least 5% of the outstanding voting shares of the issuer or as a result of other relationships, such as the Fund and the issuer having the same investment manager. Transactions with issuers that were either affiliated persons of the Fund at the beginning of the period or the end of the period were as follows:
| | | | | | | | | | | | | | | | | | | | | | | | | | | | | | | | | | | | |
| | | Shares,
beginning of
period | | | Shares
purchased | | | Shares
sold | | | Shares,
end of
period | | | Net
realized
gains
(losses) | | | Net
change in
unrealized
gains
(losses) | | | Income
from
affiliated
securities | | | Value,
end
of period | | | % of
net
assets | |
Short-Term Investments | | | | | | | | | | | | | | | | | | | | | | | | | | | | | | | | | | | | |
Investment Companies | | | | | | | | | | | | | | | | | | | | | | | | | | | | | | | | | | | | |
Securities Lending Cash Investments LLC | | | 38,751,625 | | | | 234,377,257 | | | | 233,915,373 | | | | 39,213,509 | | | $ | (696 | ) | | $ | (124 | ) | | $ | 702,904 | # | | $ | 39,217,430 | | | | | |
Wells Fargo Government Money Market Fund Select Class | | | 10,229,653 | | | | 186,067,946 | | | | 190,359,720 | | | | 5,937,879 | | | | 0 | | | | 0 | | | | 145,700 | | | | 5,937,879 | | | | | |
| | | | | | | | | | | | | | | | | | | | | | | | | | | | | | | | | | | | |
| | | | | | | | | | | | | | | | | | $ | (696 | ) | | $ | (124 | ) | | $ | 848,604 | | | $ | 45,155,309 | | | | 4.43 | % |
| | | | | | | | | | | | | | | | | | | | | | | | | | | | | | | | | | | | |
| # | Amount shown represents income before fees and rebates. |
The accompanying notes are an integral part of these financial statements.
14 | Wells Fargo Large Cap Growth Fund
Statement of assets and liabilities—July 31, 2019
| | | | |
| | | | |
| |
Assets | | | | |
Investments in unaffiliated securities (including $37,618,193 of securities loaned), at value (cost $488,156,376) | | $ | 1,011,705,470 | |
Investments in affiliated securities, at value (cost $45,155,433) | | | 45,155,309 | |
Receivable for investments sold | | | 17,535,940 | |
Receivable for Fund shares sold | | | 86,904 | |
Receivable for dividends | | | 334,955 | |
Receivable for securities lending income, net | | | 4,578 | |
Prepaid expenses and other assets | | | 33,174 | |
| | | | |
Total assets | | | 1,074,856,330 | |
| | | | |
| |
Liabilities | | | | |
Payable upon receipt of securities loaned | | | 39,216,803 | |
Payable for investments purchased | | | 13,783,729 | |
Payable for Fund shares redeemed | | | 592,267 | |
Management fee payable | | | 508,953 | |
Administration fees payable | | | 123,530 | |
Distribution fees payable | | | 8,457 | |
Trustees’ fees and expenses payable | | | 4,248 | |
Accrued expenses and other liabilities | | | 267,614 | |
| | | | |
Total liabilities | | | 54,505,601 | |
| | | | |
Total net assets | | $ | 1,020,350,729 | |
| | | | |
| |
Net assets consist of | | | | |
Paid-in capital | | $ | 419,582,618 | |
Total distributable earnings | | | 600,768,111 | |
| | | | |
Total net assets | | $ | 1,020,350,729 | |
| | | | |
| |
Computation of net asset value and offering price per share | | | | |
Net assets – Class A | | $ | 529,109,827 | |
Shares outstanding – Class A1 | | | 11,963,517 | |
Net asset value per share – Class A | | | $44.23 | |
Maximum offering price per share – Class A2 | | | $46.93 | |
Net assets – Class C | | $ | 11,504,455 | |
Shares outstanding – Class C1 | | | 291,938 | |
Net asset value per share – Class C | | | $39.41 | |
Net assets – Class R | | $ | 4,499,146 | |
Shares outstanding – Class R1 | | | 104,966 | |
Net asset value per share – Class R | | | $42.86 | |
Net assets – Class R4 | | $ | 895,659 | |
Share outstanding – Class R41 | | | 19,589 | |
Net asset value per share – Class R4 | | | $45.72 | |
Net assets – Class R6 | | $ | 326,989,992 | |
Shares outstanding – Class R61 | | | 7,098,875 | |
Net asset value per share – Class R6 | | | $46.06 | |
Net assets – Administrator Class | | $ | 67,157,753 | |
Shares outstanding – Administrator Class1 | | | 1,496,553 | |
Net asset value per share – Administrator Class | | | $44.87 | |
Net assets – Institutional Class | | $ | 80,193,897 | |
Shares outstanding – Institutional Class1 | | | 1,749,612 | |
Net asset value per share – Institutional Class | | | $45.84 | |
| 1 | The Fund has an unlimited number of authorized shares. |
| 2 | Maximum offering price is computed as 100/94.25 of net asset value. On investments of $50,000 or more, the offering price is reduced. |
The accompanying notes are an integral part of these financial statements.
Wells Fargo Large Cap Growth Fund | 15
Statement of operations—year ended July 31, 2019
| | | | |
| | | | |
| |
Investment income | | | | |
Dividends (net of foreign withholding taxes of $19,929) | | $ | 9,718,508 | |
Income from affiliated securities | | | 250,185 | |
| | | | |
Total investment income | | | 9,968,693 | |
| | | | |
| |
Expenses | | | | |
Management fee | | | 6,829,072 | |
Administration fees | | | | |
Class A | | | 1,075,776 | |
Class C | | | 27,640 | |
Class R | | | 10,798 | |
Class R4 | | | 1,181 | |
Class R6 | | | 94,257 | |
Administrator Class | | | 86,253 | |
Institutional Class | | | 105,815 | |
Shareholder servicing fees | | | | |
Class A | | | 1,280,686 | |
Class C | | | 32,905 | |
Class R | | | 12,627 | |
Class R4 | | | 1,476 | |
Administrator Class | | | 164,685 | |
Distribution fees | | | | |
Class C | | | 98,716 | |
Class R | | | 12,854 | |
Custody and accounting fees | | | 43,534 | |
Professional fees | | | 42,760 | |
Registration fees | | | 116,044 | |
Shareholder report expenses | | | 78,234 | |
Trustees’ fees and expenses | | | 21,999 | |
Other fees and expenses | | | 28,755 | |
| | | | |
Total expenses | | | 10,166,067 | |
Less: Fee waivers and/or expense reimbursements | | | (1,082,490 | ) |
| | | | |
Net expenses | | | 9,083,577 | |
| | | | |
Net investment income | | | 885,116 | |
| | | | |
| |
Realized and unrealized gains (losses) on investments | | | | |
Net realized gains (losses) on | | | | |
Unaffiliated securities | | | 127,678,828 | |
Affiliated securities | | | (696 | ) |
| | | | |
Net realized gains on investments | | | 127,678,132 | |
| | | | |
| |
Net change in unrealized gains (losses) on | | | | |
Unaffiliated securities | | | (27,477,331 | ) |
Affiliated securities | | | (124 | ) |
| | | | |
Net change in unrealized gains (losses) on investments | | | (27,477,455 | ) |
| | | | |
Net realized and unrealized gains (losses) on investments | | | 100,200,677 | |
| | | | |
Net increase in net assets resulting from operations | | $ | 101,085,793 | |
| | | | |
The accompanying notes are an integral part of these financial statements.
16 | Wells Fargo Large Cap Growth Fund
Statement of changes in net assets
| | | | | | | | | | | | | | | | |
| | | Year ended
July 31, 2019 | | | Year ended
July 31, 20181 | |
| | | | |
Operations | | | | | | | | | | | | | | | | |
Net investment income | | | | | | $ | 885,116 | | | | | | | $ | 137,464 | |
Net realized gains on investments | | | | | | | 127,678,132 | | | | | | | | 234,857,518 | |
Net change in unrealized gains (losses) on investments | | | | | | | (27,477,455 | ) | | | | | | | 33,368,008 | |
| | | | |
Net increase in net assets resulting from operations | | | | | | | 101,085,793 | | | | | | | | 268,362,990 | |
| | | | |
| | | | |
Distributions to shareholders from net investment income and net realized gains | | | | | | | | | | | | | | | | |
Class A | | | | | | | (111,706,240 | ) | | | | | | | (94,299,274 | ) |
Class C | | | | | | | (3,431,246 | ) | | | | | | | (2,995,367 | ) |
Class R | | | | | | | (1,280,121 | ) | | | | | | | (1,226,176 | ) |
Class R4 | | | | | | | (455,047 | ) | | | | | | | (86,325 | ) |
Class R6 | | | | | | | (66,047,400 | ) | | | | | | | (60,894,090 | ) |
Administrator Class | | | | | | | (14,492,251 | ) | | | | | | | (12,791,477 | ) |
Institutional Class | | | | | | | (18,149,003 | ) | | | | | | | (29,593,244 | ) |
| | | | |
Total distributions to shareholders | | | | | | | (215,561,308 | ) | | | | | | | (201,885,953 | ) |
| | | | |
| | | | |
Capital share transactions | | | Shares | | | | | | | | Shares | | | | | |
Proceeds from shares sold | | | | | | | | | | | | | | | | |
Class A | | | 399,711 | | | | 17,356,631 | | | | 350,829 | | | | 17,319,919 | |
Class C | | | 71,966 | | | | 2,571,501 | | | | 45,353 | | | | 2,068,446 | |
Class R | | | 49,362 | | | | 1,986,257 | | | | 59,909 | | | | 2,827,726 | |
Class R4 | | | 9,684 | | | | 457,992 | | | | 35,016 | | | | 1,707,466 | |
Class R6 | | | 780,490 | | | | 34,878,326 | | | | 1,558,098 | | | | 79,758,923 | |
Administrator Class | | | 156,702 | | | | 7,081,152 | | | | 200,283 | | | | 10,104,338 | |
Institutional Class | | | 275,036 | | | | 12,403,795 | | | | 238,407 | | | | 12,259,125 | |
| | | | |
| | | | | | | 76,735,654 | | | | | | | | 126,045,943 | |
| | | | |
Reinvestment of distributions | | | | | | | | | | | | | | | | |
Class A | | | 2,918,252 | | | | 107,245,772 | | | | 1,969,729 | | | | 89,405,992 | |
Class C | | | 92,097 | | | | 3,029,996 | | | | 60,978 | | | | 2,564,729 | |
Class R | | | 9,145 | | | | 326,200 | | | | 3,414 | | | | 151,866 | |
Class R4 | | | 11,892 | | | | 451,084 | | | | 1,781 | | | | 82,592 | |
Class R6 | | | 1,625,721 | | | | 62,084,213 | | | | 1,305,992 | | | | 60,875,276 | |
Administrator Class | | | 388,367 | | | | 14,470,567 | | | | 278,848 | | | | 12,776,830 | |
Institutional Class | | | 407,144 | | | | 15,475,547 | | | | 442,110 | | | | 20,540,888 | |
| | | | |
| | | | | | | 203,083,379 | | | | | | | | 186,398,173 | |
| | | | |
Payment for shares redeemed | | | | | | | | | | | | | | | | |
Class A | | | (1,635,497 | ) | | | (70,467,127 | ) | | | (2,346,522 | ) | | | (122,033,744 | ) |
Class C | | | (197,048 | ) | | | (7,247,118 | ) | | | (91,221 | ) | | | (4,306,948 | ) |
Class R | | | (64,781 | ) | | | (2,603,006 | ) | | | (81,531 | ) | | | (3,970,677 | ) |
Class R4 | | | (41,238 | ) | | | (1,706,882 | ) | | | (4,157 | ) | | | (212,862 | ) |
Class R6 | | | (1,438,307 | ) | | | (65,749,149 | ) | | | (2,739,730 | ) | | | (142,658,457 | ) |
Administrator Class | | | (555,121 | ) | | | (25,132,488 | ) | | | (576,443 | ) | | | (29,889,749 | ) |
Institutional Class | | | (729,747 | ) | | | (33,022,472 | ) | | | (2,213,468 | ) | | | (110,506,781 | ) |
| | | | |
| | | | | | | (205,928,242 | ) | | | | | | | (413,579,218 | ) |
| | | | |
Net increase (decrease) in net assets resulting from capital share transactions | | | | | | | 73,890,791 | | | | | | | | (101,135,102 | ) |
| | | | |
Total decrease in net assets | | | | | | | (40,584,724 | ) | | | | | | | (34,658,065 | ) |
| | | | |
| | | | |
Net assets | | | | | | | | | | | | | | | | |
Beginning of period | | | | | | | 1,060,935,453 | | | | | | | | 1,095,593,518 | |
| | | | |
End of period | | | | | | $ | 1,020,350,729 | | | | | | | $ | 1,060,935,453 | |
| | | | |
| 1 | Effective for all filings after November 4, 2018, the SEC prospectively eliminated the requirement to parenthetically disclose undistributed net investment income at the end of the period and permitted the aggregation of distributions, with the exception of tax basis returns of capital. Undistributed net investment income at July 31, 2018 was $112,534. The disaggregated distributions information for the year ended July 31, 2018 is included in Note 8,Distributions to Shareholders, in the notes to the financial statements. |
The accompanying notes are an integral part of these financial statements.
Wells Fargo Large Cap Growth Fund | 17
Financial highlights
(For a share outstanding throughout each period)
| | | | | | | | | | | | | | | | | | | | |
| | | Year ended July 31 | |
| CLASS A | | 2019 | | | 2018 | | | 2017 | | | 2016 | | | 2015 | |
Net asset value, beginning of period | | | $52.01 | | | | $50.10 | | | | $46.05 | | | | $49.55 | | | | $45.30 | |
Net investment loss | | | (0.03 | )1 | | | (0.08 | ) | | | (0.03 | )1 | | | (0.03 | )1 | | | (0.01 | )1 |
Net realized and unrealized gains (losses) on investments | | | 3.47 | | | | 12.56 | | | | 6.39 | | | | (0.92 | ) | | | 6.33 | |
| | | | | | | | | | | | | | | | | | | | |
Total from investment operations | | | 3.44 | | | | 12.48 | | | | 6.36 | | | | (0.95 | ) | | | 6.32 | |
Distributions to shareholders from | | | | | | | | | | | | | | | | | | | | |
Net investment income | | | 0.00 | | | | 0.00 | | | | 0.00 | | | | (0.00 | )2 | | | 0.00 | |
Net realized gains | | | (11.22 | ) | | | (10.57 | ) | | | (2.31 | ) | | | (2.55 | ) | | | (2.07 | ) |
| | | | | | | | | | | | | | | | | | | | |
Total distributions to shareholders | | | (11.22 | ) | | | (10.57 | ) | | | (2.31 | ) | | | (2.55 | ) | | | (2.07 | ) |
Net asset value, end of period | | | $44.23 | | | | $52.01 | | | | $50.10 | | | | $46.05 | | | | $49.55 | |
Total return3 | | | 11.00 | % | | | 27.98 | % | | | 14.60 | % | | | (1.83 | )% | | | 14.35 | % |
Ratios to average net assets (annualized) | | | | | | | | | | | | | | | | | | | | |
Gross expenses | | | 1.18 | % | | | 1.17 | % | | | 1.17 | % | | | 1.16 | % | | | 1.20 | % |
Net expenses | | | 1.07 | % | | | 1.07 | % | | | 1.07 | % | | | 1.07 | % | | | 1.07 | % |
Net investment loss | | | (0.07 | )% | | | (0.16 | )% | | | (0.06 | )% | | | (0.06 | )% | | | (0.02 | )% |
Supplemental data | | | | | | | | | | | | | | | | | | | | |
Portfolio turnover rate | | | 43 | % | | | 34 | % | | | 40 | % | | | 31 | % | | | 26 | % |
Net assets, end of period (000s omitted) | | | $529,110 | | | | $534,694 | | | | $516,410 | | | | $576,502 | | | | $184,504 | |
| 1 | Calculated based upon average shares outstanding |
| 2 | Amount is less than $0.005. |
| 3 | Total return calculations do not include any sales charges. |
The accompanying notes are an integral part of these financial statements.
18 | Wells Fargo Large Cap Growth Fund
Financial highlights
(For a share outstanding throughout each period)
| | | | | | | | | | | | | | | | | | | | |
| | | Year ended July 31 | |
| CLASS C | | 2019 | | | 2018 | | | 2017 | | | 2016 | | | 2015 | |
Net asset value, beginning of period | | | $47.97 | | | | $47.25 | | | | $43.88 | | | | $47.68 | | | | $43.99 | |
Net investment loss | | | (0.32 | )1 | | | (0.31 | ) | | | (0.35 | )1 | | | (0.32 | )1 | | | (0.42 | ) |
Net realized and unrealized gains (losses) on investments | | | 2.98 | | | | 11.60 | | | | 6.03 | | | | (0.93 | ) | | | 6.18 | |
| | | | | | | | | | | | | | | | | | | | |
Total from investment operations | | | 2.66 | | | | 11.29 | | | | 5.68 | | | | (1.25 | ) | | | 5.76 | |
Distributions to shareholders from | | | | | | | | | | | | | | | | | | | | |
Net realized gains | | | (11.22 | ) | | | (10.57 | ) | | | (2.31 | ) | | | (2.55 | ) | | | (2.07 | ) |
Net asset value, end of period | | | $39.41 | | | | $47.97 | | | | $47.25 | | | | $43.88 | | | | $47.68 | |
Total return2 | | | 10.17 | % | | | 27.03 | % | | | 13.74 | % | | | (2.56 | )% | | | 13.47 | % |
Ratios to average net assets (annualized) | | | | | | | | | | | | | | | | | | | | |
Gross expenses | | | 1.93 | % | | | 1.92 | % | | | 1.91 | % | | | 1.91 | % | | | 1.95 | % |
Net expenses | | | 1.82 | % | | | 1.82 | % | | | 1.82 | % | | | 1.82 | % | | | 1.82 | % |
Net investment loss | | | (0.80 | )% | | | (0.90 | )% | | | (0.81 | )% | | | (0.75 | )% | | | (0.77 | )% |
Supplemental data | | | | | | | | | | | | | | | | | | | | |
Portfolio turnover rate | | | 43 | % | | | 34 | % | | | 40 | % | | | 31 | % | | | 26 | % |
Net assets, end of period (000s omitted) | | | $11,504 | | | | $15,586 | | | | $14,640 | | | | $18,877 | | | | $22,839 | |
| 1 | Calculated based upon average shares outstanding |
| 2 | Total return calculations do not include any sales charges. |
The accompanying notes are an integral part of these financial statements.
Wells Fargo Large Cap Growth Fund | 19
Financial highlights
(For a share outstanding throughout each period)
| | | | | | | | | | | | | | | | | | | | |
| | | Year ended July 31 | |
| CLASS R | | 2019 | | | 2018 | | | 2017 | | | 2016 | | | 2015 | |
Net asset value, beginning of period | | | $50.89 | | | | $49.34 | | | | $45.50 | | | | $49.11 | | | | $45.03 | |
Net investment loss | | | (0.13 | )1 | | | (0.20 | )1 | | | (0.14 | )1 | | | (0.10 | )1 | | | (0.16 | )1 |
Net realized and unrealized gains (losses) on investments | | | 3.32 | | | | 12.32 | | | | 6.29 | | | | (0.96 | ) | | | 6.31 | |
| | | | | | | | | | | | | | | | | | | | |
Total from investment operations | | | 3.19 | | | | 12.12 | | | | 6.15 | | | | (1.06 | ) | | | 6.15 | |
Distributions to shareholders from | | | | | | | | | | | | | | | | | | | | |
Net realized gains | | | (11.22 | ) | | | (10.57 | ) | | | (2.31 | ) | | | (2.55 | ) | | | (2.07 | ) |
Net asset value, end of period | | | $42.86 | | | | $50.89 | | | | $49.34 | | | | $45.50 | | | | $49.11 | |
Total return | | | 10.74 | % | | | 27.65 | % | | | 14.30 | % | | | (2.08 | )% | | | 14.05 | % |
Ratios to average net assets (annualized) | | | | | | | | | | | | | | | | | | | | |
Gross expenses | | | 1.42 | % | | | 1.42 | % | | | 1.41 | % | | | 1.41 | % | | | 1.45 | % |
Net expenses | | | 1.32 | % | | | 1.32 | % | | | 1.32 | % | | | 1.32 | % | | | 1.32 | % |
Net investment loss | | | (0.29 | )% | | | (0.40 | )% | | | (0.31 | )% | | | (0.23 | )% | | | (0.28 | )% |
Supplemental data | | | | | | | | | | | | | | | | | | | | |
Portfolio turnover rate | | | 43 | % | | | 34 | % | | | 40 | % | | | 31 | % | | | 26 | % |
Net assets, end of period (000s omitted) | | | $4,499 | | | | $5,661 | | | | $6,387 | | | | $8,218 | | | | $12,086 | |
| 1 | Calculated based upon average shares outstanding |
The accompanying notes are an integral part of these financial statements.
20 | Wells Fargo Large Cap Growth Fund
Financial highlights
(For a share outstanding throughout each period)
| | | | | | | | | | | | | | | | | | | | |
| | | Year ended July 31 | |
| CLASS R4 | | 2019 | | | 2018 | | | 2017 | | | 2016 | | | 2015 | |
Net asset value, beginning of period | | | $53.23 | | | | $50.94 | | | | $46.69 | | | | $50.23 | | | | $45.76 | |
Net investment income | | | 0.11 | 1 | | | 0.05 | 1 | | | 0.11 | 1 | | | 0.13 | | | | 0.07 | |
Net realized and unrealized gains (losses) on investments | | | 3.60 | | | | 12.81 | | | | 6.50 | | | | (0.95 | ) | | | 6.47 | �� |
| | | | | | | | | | | | | | | | | | | | |
Total from investment operations | | | 3.71 | | | | 12.86 | | | | 6.61 | | | | (0.82 | ) | | | 6.54 | |
Distributions to shareholders from | | | | | | | | | | | | | | | | | | | | |
Net investment income | | | 0.00 | | | | 0.00 | | | | (0.05 | ) | | | (0.17 | ) | | | 0.00 | |
Net realized gains | | | (11.22 | ) | | | (10.57 | ) | | | (2.31 | ) | | | (2.55 | ) | | | (2.07 | ) |
| | | | | | | | | | | | | | | | | | | | |
Total distributions to shareholders | | | (11.22 | ) | | | (10.57 | ) | | | (2.36 | ) | | | (2.72 | ) | | | (2.07 | ) |
Net asset value, end of period | | | $45.72 | | | | $53.23 | | | | $50.94 | | | | $46.69 | | | | $50.23 | |
Total return | | | 11.32 | % | | | 28.31 | % | | | 14.96 | % | | | (1.54 | )% | | | 14.69 | % |
Ratios to average net assets (annualized) | | | | | | | | | | | | | | | | | | | | |
Gross expenses | | | 0.90 | % | | | 0.90 | % | | | 0.88 | % | | | 0.88 | % | | | 0.87 | % |
Net expenses | | | 0.80 | % | | | 0.80 | % | | | 0.80 | % | | | 0.78 | % | | | 0.75 | % |
Net investment income | | | 0.24 | % | | | 0.10 | % | | | 0.25 | % | | | 0.27 | % | | | 0.17 | % |
Supplemental data | | | | | | | | | | | | | | | | | | | | |
Portfolio turnover rate | | | 43 | % | | | 34 | % | | | 40 | % | | | 31 | % | | | 26 | % |
Net assets, end of period (000s omitted) | | | $896 | | | | $2,089 | | | | $337 | | | | $8,400 | | | | $7,205 | |
| 1 | Calculated based upon average shares outstanding |
The accompanying notes are an integral part of these financial statements.
Wells Fargo Large Cap Growth Fund | 21
Financial highlights
(For a share outstanding throughout each period)
| | | | | | | | | | | | | | | | | | | | |
| | | Year ended July 31 | |
| CLASS R6 | | 2019 | | | 2018 | | | 2017 | | | 2016 | | | 2015 | |
Net asset value, beginning of period | | | $53.49 | | | | $51.12 | | | | $46.82 | | | | $50.34 | | | | $45.82 | |
Net investment income | | | 0.16 | 1 | | | 0.14 | | | | 0.17 | | | | 0.22 | | | | 0.07 | 1 |
Net realized and unrealized gains (losses) on investments | | | 3.65 | | | | 12.85 | | | | 6.52 | | | | (0.97 | ) | | | 6.56 | |
| | | | | | | | | | | | | | | | | | | | |
Total from investment operations | | | 3.81 | | | | 12.99 | | | | 6.69 | | | | (0.75 | ) | | | 6.63 | |
Distributions to shareholders from | | | | | | | | | | | | | | | | | | | | |
Net investment income | | | (0.02 | ) | | | (0.05 | ) | | | (0.08 | ) | | | (0.22 | ) | | | (0.04 | ) |
Net realized gains | | | (11.22 | ) | | | (10.57 | ) | | | (2.31 | ) | | | (2.55 | ) | | | (2.07 | ) |
| | | | | | | | | | | | | | | | | | | | |
Total distributions to shareholders | | | (11.24 | ) | | | (10.62 | ) | | | (2.39 | ) | | | (2.77 | ) | | | (2.11 | ) |
Net asset value, end of period | | | $46.06 | | | | $53.49 | | | | $51.12 | | | | $46.82 | | | | $50.34 | |
Total return | | | 11.46 | % | | | 28.51 | % | | | 15.09 | % | | | (1.39 | )% | | | 14.88 | % |
Ratios to average net assets (annualized) | | | | | | | | | | | | | | | | | | | | |
Gross expenses | | | 0.75 | % | | | 0.75 | % | | | 0.74 | % | | | 0.73 | % | | | 0.72 | % |
Net expenses | | | 0.65 | % | | | 0.65 | % | | | 0.65 | % | | | 0.64 | % | | | 0.60 | % |
Net investment income | | | 0.35 | % | | | 0.27 | % | | | 0.36 | % | | | 0.39 | % | | | 0.13 | % |
Supplemental data | | | | | | | | | | | | | | | | | | | | |
Portfolio turnover rate | | | 43 | % | | | 34 | % | | | 40 | % | | | 31 | % | | | 26 | % |
Net assets, end of period (000s omitted) | | | $326,990 | | | | $327,943 | | | | $307,048 | | | | $225,805 | | | | $117,741 | |
| 1 | Calculated based upon average shares outstanding |
The accompanying notes are an integral part of these financial statements.
22 | Wells Fargo Large Cap Growth Fund
Financial highlights
(For a share outstanding throughout each period)
| | | | | | | | | | | | | | | | | | | | |
| | | Year ended July 31 | |
| ADMINISTRATOR CLASS | | 2019 | | | 2018 | | | 2017 | | | 2016 | | | 2015 | |
Net asset value, beginning of period | | | $52.54 | | | | $50.46 | | | | $46.32 | | | | $49.84 | | | | $45.50 | |
Net investment income (loss) | | | 0.02 | | | | (0.01 | ) | | | 0.05 | | | | 0.05 | | | | 0.05 | |
Net realized and unrealized gains (losses) on investments | | | 3.53 | | | | 12.66 | | | | 6.41 | | | | (0.94 | ) | | | 6.36 | |
| | | | | | | | | | | | | | | | | | | | |
Total from investment operations | | | 3.55 | | | | 12.65 | | | | 6.46 | | | | (0.89 | ) | | | 6.41 | |
Distributions to shareholders from | | | | | | | | | | | | | | | | | | | | |
Net investment income | | | 0.00 | | | | 0.00 | | | | (0.01 | ) | | | (0.08 | ) | | | 0.00 | |
Net realized gains | | | (11.22 | ) | | | (10.57 | ) | | | (2.31 | ) | | | (2.55 | ) | | | (2.07 | ) |
| | | | | | | | | | | | | | | | | | | | |
Total distributions to shareholders | | | (11.22 | ) | | | (10.57 | ) | | | (2.32 | ) | | | (2.63 | ) | | | (2.07 | ) |
Net asset value, end of period | | | $44.87 | | | | $52.54 | | | | $50.46 | | | | $46.32 | | | | $49.84 | |
Total return | | | 11.14 | % | | | 28.14 | % | | | 14.75 | % | | | (1.71 | )% | | | 14.48 | % |
Ratios to average net assets (annualized) | | | | | | | | | | | | | | | | | | | | |
Gross expenses | | | 1.10 | % | | | 1.09 | % | | | 1.08 | % | | | 1.08 | % | | | 1.05 | % |
Net expenses | | | 0.95 | % | | | 0.95 | % | | | 0.95 | % | | | 0.95 | % | | | 0.95 | % |
Net investment income (loss) | | | 0.05 | % | | | (0.03 | )% | | | 0.06 | % | | | 0.12 | % | | | 0.10 | % |
Supplemental data | | | | | | | | | | | | | | | | | | | | |
Portfolio turnover rate | | | 43 | % | | | 34 | % | | | 40 | % | | | 31 | % | | | 26 | % |
Net assets, end of period (000s omitted) | | | $67,158 | | | | $79,154 | | | | $80,937 | | | | $237,577 | | | | $262,535 | |
The accompanying notes are an integral part of these financial statements.
Wells Fargo Large Cap Growth Fund | 23
Financial highlights
(For a share outstanding throughout each period)
| | | | | | | | | | | | | | | | | | | | |
| | | Year ended July 31 | |
| INSTITUTIONAL CLASS | | 2019 | | | 2018 | | | 2017 | | | 2016 | | | 2015 | |
Net asset value, beginning of period | | | $53.31 | | | | $51.00 | | | | $46.74 | | | | $50.30 | | | | $45.80 | |
Net investment income | | | 0.12 | 1 | | | 0.10 | 1 | | | 0.12 | 1 | | | 0.17 | 1 | | | 0.19 | 1 |
Net realized and unrealized gains (losses) on investments | | | 3.63 | | | | 12.80 | | | | 6.51 | | | | (0.96 | ) | | | 6.41 | |
| | | | | | | | | | | | | | | | | | | | |
Total from investment operations | | | 3.75 | | | | 12.90 | | | | 6.63 | | | | (0.79 | ) | | | 6.60 | |
Distributions to shareholders from | | | | | | | | | | | | | | | | | | | | |
Net investment income | | | 0.00 | | | | (0.02 | ) | | | (0.06 | ) | | | (0.22 | ) | | | (0.03 | ) |
Net realized gains | | | (11.22 | ) | | | (10.57 | ) | | | (2.31 | ) | | | (2.55 | ) | | | (2.07 | ) |
| | | | | | | | | | | | | | | | | | | | |
Total distributions to shareholders | | | (11.22 | ) | | | (10.59 | ) | | | (2.37 | ) | | | (2.77 | ) | | | (2.10 | ) |
Net asset value, end of period | | | $45.84 | | | | $53.31 | | | | $51.00 | | | | $46.74 | | | | $50.30 | |
Total return | | | 11.37 | % | | | 28.37 | % | | | 14.98 | % | | | (1.49 | )% | | | 14.82 | % |
Ratios to average net assets (annualized) | | | | | | | | | | | | | | | | | | | | |
Gross expenses | | | 0.85 | % | | | 0.84 | % | | | 0.83 | % | | | 0.83 | % | | | 0.78 | % |
Net expenses | | | 0.75 | % | | | 0.75 | % | | | 0.75 | % | | | 0.71 | % | | | 0.65 | % |
Net investment income | | | 0.26 | % | | | 0.18 | % | | | 0.27 | % | | | 0.37 | % | | | 0.40 | % |
Supplemental data | | | | | | | | | | | | | | | | | | | | |
Portfolio turnover rate | | | 43 | % | | | 34 | % | | | 40 | % | | | 31 | % | | | 26 | % |
Net assets, end of period (000s omitted) | | | $80,194 | | | | $95,809 | | | | $169,836 | | | | $316,310 | | | | $534,975 | |
| 1 | Calculated based upon average shares outstanding |
The accompanying notes are an integral part of these financial statements.
24 | Wells Fargo Large Cap Growth Fund
Notes to financial statements
1. ORGANIZATION
Wells Fargo Funds Trust (the “Trust”), a Delaware statutory trust organized on March 10, 1999, is an open-end management investment company registered under the Investment Company Act of 1940, as amended (the “1940 Act”). As an investment company, the Trust follows the accounting and reporting guidance in Financial Accounting Standards Board (“FASB”) Accounting Standards Codification Topic 946, Financial Services – Investment Companies. These financial statements report on the Wells Fargo Large Cap Growth Fund (the “Fund”) which is a diversified series of the Trust.
2. SIGNIFICANT ACCOUNTING POLICIES
The following significant accounting policies, which are consistently followed in the preparation of the financial statements of the Fund, are in conformity with U.S. generally accepted accounting principles which require management to make estimates and assumptions that affect the reported amounts of assets and liabilities, disclosure of contingent assets and liabilities at the date of the financial statements, and the reported amounts of revenues and expenses during the reporting period. Actual results could differ from those estimates.
Securities valuation
All investments are valued each business day as of the close of regular trading on the New York Stock Exchange (generally 4 p.m. Eastern Time), although the Fund may deviate from this calculation time under unusual or unexpected circumstances.
Equity securities that are listed on a foreign or domestic exchange or market are valued at the official closing price or, if none, the last sales price. If no sale occurs on the principal exchange or market that day, a fair value price will be determined in accordance with the Fund’s Valuation Procedures.
Investments in registered open-end investment companies are valued at net asset value. Interests in non-registered investment companies that are redeemable at net asset value are fair valued normally at net asset value.
Investments which are not valued using any of the methods discussed above are valued at their fair value, as determined in good faith by the Board of Trustees of the Fund. The Board of Trustees has established a Valuation Committee comprised of the Trustees and has delegated to it the authority to take any actions regarding the valuation of portfolio securities that the Valuation Committee deems necessary or appropriate, including determining the fair value of portfolio securities, unless the determination has been delegated to the Wells Fargo Asset Management Pricing Committee at Wells Fargo Funds Management, LLC (“Funds Management”). The Board of Trustees retains the authority to make or ratify any valuation decisions or approve any changes to the Valuation Procedures as it deems appropriate. On a quarterly basis, the Board of Trustees receives reports on any valuation actions taken by the Valuation Committee or the Wells Fargo Asset Management Pricing Committee which may include items for ratification.
Foreign currency translation
The accounting records of the Fund are maintained in U.S. dollars. The values of other assets and liabilities denominated in foreign currencies are translated into U.S. dollars at rates provided by an independent foreign currency pricing source at a time each business day specified by the Wells Fargo Asset Management Pricing Committee. Purchases and sales of securities, and income and expenses are converted at the rate of exchange on the respective dates of such transactions. Net realized foreign exchange gains or losses arise from sales of foreign currencies, currency gains or losses realized between the trade and settlement dates on securities transactions, and the difference between the amounts of dividends, interest and foreign withholding taxes recorded and the U.S. dollar equivalent of the amounts actually paid or received. Net unrealized foreign exchange gains and losses arise from changes in the fair value of assets and liabilities other than investments in securities resulting from changes in exchange rates. The changes in net assets arising from changes in exchange rates of securities and the changes in net assets resulting from changes in market prices of securities are not separately presented. Such changes are included in net realized and unrealized gains or losses from investments.
Securities lending
The Fund may lend its securities from time to time in order to earn additional income in the form of fees or interest on securities received as collateral or the investment of any cash received as collateral. When securities are on loan, the Fund receives interest or dividends on those securities. Cash collateral received in connection with its securities lending transactions is invested in Securities Lending Cash Investments, LLC (the “Securities Lending Fund”). Investments in Securities Lending Fund are valued at the evaluated bid price provided by an independent pricing service. Income earned from investment in the Securities Lending Fund (net of fees and rebates), if any, is included in income from affiliated securities on the Statement of Operations.
In a securities lending transaction, the net asset value of the Fund will be affected by an increase or decrease in the value of the securities loaned and by an increase or decrease in the value of the instrument in which collateral is invested. The amount of
Wells Fargo Large Cap Growth Fund | 25
Notes to financial statements
securities lending activity undertaken by the Fund fluctuates from time to time. The Fund has the right under the lending agreement to recover the securities from the borrower on demand. In the event of default or bankruptcy by the borrower, the Fund may be prevented from recovering the loaned securities or gaining access to the collateral or may experience delays or costs in doing so. In such an event, the terms of the agreement allows the unaffiliated securities lending agent to use the collateral to purchase replacement securities on behalf of the Fund or pay the Fund the market value of the loaned securities. The Fund will bear the risk of loss with respect to depreciation of its investment of the cash collateral.
Security transactions and income recognition
Securities transactions are recorded on a trade date basis. Realized gains or losses are recorded on the basis of identified cost.
Dividend income is recognized on the ex-dividend date. Dividend income is recorded net of foreign taxes withheld where recovery of such taxes is not assured.
Distributions to shareholders
Distributions to shareholders from net investment income and any net realized gains are recorded on the ex-dividend date and paid at least annually. Such distributions are determined in accordance with income tax regulations and may differ from U.S. generally accepted accounting principles. Dividend sources are estimated at the time of declaration. The tax character of distributions is determined as of the Fund’s fiscal year end. Therefore, a portion of the Fund’s distributions made prior to the Fund’s fiscal year end may be categorized as a tax return of capital at year end.
Federal and other taxes
The Fund intends to continue to qualify as a regulated investment company by distributing substantially all of its investment company taxable income and any net realized capital gains (after reduction for capital loss carryforwards) sufficient to relieve it from all, or substantially all, federal income taxes. Accordingly, no provision for federal income taxes was required.
The Fund’s income and federal excise tax returns and all financial records supporting those returns for the prior three fiscal years are subject to examination by the federal and Delaware revenue authorities. Management has analyzed the Fund’s tax positions taken on federal, state, and foreign tax returns for all open tax years and does not believe that there are any uncertain tax positions that require recognition of a tax liability.
As of July 31, 2019, the aggregate cost of all investments for federal income tax purposes was $534,545,716 and the unrealized gains (losses) consisted of:
| | | | |
| |
Gross unrealized gains | | $ | 525,744,062 | |
| |
Gross unrealized losses | | | (3,428,999 | ) |
| |
Net unrealized gains | | $ | 522,315,063 | |
Class allocations
The separate classes of shares offered by the Fund differ principally in applicable sales charges, distribution, shareholder servicing, and administration fees. Class specific expenses are charged directly to that share class. Investment income, common fund-level expenses, and realized and unrealized gains (losses) on investments are allocated daily to each class of shares based on the relative proportion of net assets of each class.
3. FAIR VALUATION MEASUREMENTS
Fair value measurements of investments are determined within a framework that has established a fair value hierarchy based upon the various data inputs utilized in determining the value of the Fund’s investments. The three-level hierarchy gives the highest priority to unadjusted quoted prices in active markets for identical assets or liabilities (Level 1) and the lowest priority to unobservable inputs (Level 3). The Fund’s investments are classified within the fair value hierarchy based on the lowest level of input that is significant to the fair value measurement. The inputs are summarized into three broad levels as follows:
| ∎ | | Level 1 – quoted prices in active markets for identical securities |
| ∎ | | Level 2 – other significant observable inputs (including quoted prices for similar securities, interest rates, prepayment speeds, credit risk, etc.) |
| ∎ | | Level 3 – significant unobservable inputs (including the Fund’s own assumptions in determining the fair value of investments) |
The inputs or methodologies used for valuing investments in securities are not necessarily an indication of the risk associated with investing in those securities.
26 | Wells Fargo Large Cap Growth Fund
Notes to financial statements
The following is a summary of the inputs used in valuing the Fund’s assets and liabilities as of July 31, 2019:
| | | | | | | | | | | | | | | | |
| | | | |
| | | Quoted prices
(Level 1) | | | Other significant
observable inputs
(Level 2) | | | Significant
unobservable inputs (Level 3) | | | Total | |
| | | | |
Assets | | | | | | | | | | | | | | | | |
Investments in: | | | | | | | | | | | | | | | | |
| | | | |
Common stocks | | | | | | | | | | | | | | | | |
| | | | |
Communication services | | $ | 127,050,651 | | | $ | 0 | | | $ | 0 | | | $ | 127,050,651 | |
| | | | |
Consumer discretionary | | | 182,295,254 | | | | 0 | | | | 0 | | | | 182,295,254 | |
| | | | |
Consumer staples | | | 31,385,679 | | | | 0 | | | | 0 | | | | 31,385,679 | |
| | | | |
Energy | | | 4,184,611 | | | | 0 | | | | 0 | | | | 4,184,611 | |
| | | | |
Financials | | | 41,137,545 | | | | 0 | | | | 0 | | | | 41,137,545 | |
| | | | |
Health care | | | 101,541,363 | | | | 0 | | | | 0 | | | | 101,541,363 | |
| | | | |
Industrials | | | 121,267,800 | | | | 0 | | | | 0 | | | | 121,267,800 | |
| | | | |
Information technology | | | 379,346,984 | | | | 0 | | | | 0 | | | | 379,346,984 | |
| | | | |
Materials | | | 19,207,074 | | | | 0 | | | | 0 | | | | 19,207,074 | |
| | | | |
Real estate | | | 4,288,509 | | | | 0 | | | | 0 | | | | 4,288,509 | |
| | | | |
Short-term investments | | | | | | | | | | | | | | | | |
| | | | |
Investment companies | | | 45,155,309 | | | | 0 | | | | 0 | | | | 45,155,309 | |
| | | | |
Total assets | | $ | 1,056,860,779 | | | $ | 0 | | | $ | 0 | | | $ | 1,056,860,779 | |
Additional sector, industry or geographic detail is included in the Portfolio of Investments.
For the year ended July 31, 2019, the Fund did not have any transfers into/out of Level 3.
4. TRANSACTIONS WITH AFFILIATES
Management fee
Funds Management, an indirect wholly owned subsidiary of Wells Fargo & Company (“Wells Fargo”), is the manager of the Fund and provides advisory and fund-level administrative services under an investment management agreement. Under the investment management agreement, Funds Management is responsible for, among other services, implementing the investment objectives and strategies of the Fund, supervising the subadviser and providing fund-level administrative services in connection with the Fund’s operations. As compensation for its services under the investment management agreement, Funds Management is entitled to receive a management fee at the following annual rate based on the Fund’s average daily net assets:
| | | | |
| |
| Average daily net assets | | Management fee | |
| |
First $500 million | | | 0.700 | % |
| |
Next $500 million | | | 0.675 | |
| |
Next $1 billion | | | 0.650 | |
| |
Next $2 billion | | | 0.625 | |
| |
Next $1 billion | | | 0.600 | |
| |
Next $3 billion | | | 0.590 | |
| |
Next $2 billion | | | 0.565 | |
| |
Next $2 billion | | | 0.555 | |
| |
Next $4 billion | | | 0.530 | |
| |
Over $16 billion | | | 0.505 | |
For the year ended July 31, 2019, the management fee was equivalent to an annual rate of 0.69% of the Fund’s average daily net assets.
Funds Management has retained the services of a subadviser to provide daily portfolio management to the Fund. The fee for subadvisory services is borne by Funds Management. Wells Capital Management Incorporated (“WellsCap”), an affiliate of
Wells Fargo Large Cap Growth Fund | 27
Notes to financial statements
Funds Management and an indirect wholly owned subsidiary of Wells Fargo, is the subadviser to the Fund and is entitled to receive a fee from Funds Management at an annual rate starting at 0.30% and declining to 0.20% as the average daily net assets of the Fund increase.
Administration fees
Under a class-level administration agreement, Funds Management provides class-level administrative services to the Fund, which includes paying fees and expenses for services provided by the transfer agent, sub-transfer agents, omnibus account servicers and record-keepers. As compensation for its services under the class-level administration agreement, Funds Management receives an annual fee which is calculated based on the average daily net assets of each class as follows:
| | |
| |
| | | Class-level
administration fee |
| |
Class A, Class C, Class R | | 0.21% |
| |
Class R4 | | 0.08 |
| |
Class R6 | | 0.03 |
| |
Administrator Class, Institutional Class | | 0.13 |
Waivers and/or expense reimbursements
Funds Management has contractually waived and/or reimbursed management and administration fees to the extent necessary to maintain certain net operating expense ratios for the Fund. When each class of the Fund has exceeded its expense cap, Funds Management has waived fees and/or reimbursed expenses from fund-level expenses on a proportionate basis and then from class specific expenses. When only certain classes exceed their expense caps, waivers and/or reimbursements are applied against class specific expenses before fund-level expenses. Funds Management has committed through November 30, 2019 to waive fees and/or reimburse expenses to the extent necessary to cap the Fund’s expenses at 1.07% for Class A shares, 1.82% for Class C shares, 1.32% for Class R shares, 0.80% for Class R4 shares, 0.65% for Class R6 shares, 0.95% for Administrator Class shares, and 0.75% for Institutional Class shares. Prior to or after the commitment expiration date, the cap may be increased or the commitment to maintain the cap may be terminated only with the approval of the Board of Trustees.
Distribution fees
The Trust has adopted a distribution plan for Class C and Class R shares of the Fund pursuant to Rule 12b-1 under the 1940 Act. Distribution fees are charged to Class C and Class R shares and paid to Wells Fargo Funds Distributor, LLC (“Funds Distributor”), the principal underwriter, at an annual rate of 0.75% of the average daily net assets of Class C shares and 0.25% of the average daily net assets of Class R shares.
In addition, Funds Distributor is entitled to receive the front-end sales charge from the purchase of Class A shares and a contingent deferred sales charge on the redemption of certain Class A shares. Funds Distributor is also entitled to receive the contingent deferred sales charges from redemptions of Class C shares. For the year ended July 31, 2019, Funds Distributor received $2,480 from the sale of Class A shares. No contingent deferred sales charges were incurred by Class A and Class C shares for the year ended July 31, 2019.
Shareholder servicing fees
The Trust has entered into contracts with one or more shareholder servicing agents, whereby Class A, Class C, Class R, and Administrator Class of the Fund are charged a fee at an annual rate of 0.25% of the average daily net assets of each respective class. Class R4 is charged a fee at an annual rate of 0.10% of its average daily net assets. A portion of these total shareholder servicing fees were paid to affiliates of Wells Fargo.
Interfund transactions
The Fund may purchase or sell portfolio investment securities to certain other Wells Fargo affiliates pursuant to Rule 17a-7 under the 1940 Act and under procedures adopted by the Board of Trustees. The procedures have been designed to ensure that these interfund transactions, which do not incur broker commissions, are effected at current market prices.
5. INVESTMENT PORTFOLIO TRANSACTIONS
Purchases and sales of investments, excluding U.S. government obligations (if any) and short-term securities, for the year ended July 31, 2019 were $425,574,794 and $561,765,594, respectively.
28 | Wells Fargo Large Cap Growth Fund
Notes to financial statements
6. SECURITIES LENDING TRANSACTIONS
The Fund lends its securities through an unaffiliated securities lending agent and receives collateral in the form of cash or securities with a value at least equal to the value of the securities on loan. The value of the loaned securities is determined at the close of each business day and any increases or decreases in the required collateral are exchanged between the Fund and the counterparty on the next business day. Cash collateral received is invested in the Securities Lending Fund which seeks to provide a positive return compared to the daily Fed Funds Open Rate by investing in high-quality, U.S. dollar-denominated short-term money market instruments and is exempt from registration under Section 3(c)(7) of the 1940 Act. Securities Lending Fund is managed by Funds Management and is subadvised by WellsCap. Funds Management receives an advisory fee starting at 0.05% and declining to 0.01% as the average daily net assets of the Securities Lending Fund increase. All of the fees received by Funds Management are paid to WellsCap for its services as subadviser.
In the event of counterparty default or the failure of a borrower to return a loaned security, the Fund has the right to use the collateral to offset any losses incurred.
As of July 31, 2019, the Fund had securities lending transactions with the following counterparties which are subject to offset:
| | | | | | | | | | | | |
| | | |
| Counterparty | | Value of securities on
loan | | | Collateral
received1 | | | Net amount | |
| | | |
Bank of America Securities Inc. | | $ | 31,707,871 | | | $ | (31,707,871 | ) | | $ | 0 | |
| | | |
Deutsche Bank Securities Inc. | | | 66,857 | | | | (66,857 | ) | | | 0 | |
| | | |
JPMorgan Securities LLC | | | 1,902,188 | | | | (1,902,188 | ) | | | 0 | |
| | | |
Morgan Stanley & Co. LLC | | | 2,443,492 | | | | (2,443,492 | ) | | | 0 | |
| | | |
Nomura Securities International Inc. | | | 659,974 | | | | (659,974 | ) | | | 0 | |
| | | |
UBS AG | | | 837,811 | | | | (837,811 | ) | | | 0 | |
| 1 | Collateral received within this table is limited to the collateral for the net transaction with the counterparty. |
7. BANK BORROWINGS
The Trust (excluding the money market funds), Wells Fargo Master Trust and Wells Fargo Variable Trust are parties to a $280,000,000 revolving credit agreement whereby the Fund is permitted to use bank borrowings for temporary or emergency purposes, such as to fund shareholder redemption requests. Interest under the credit agreement is charged to the Fund based on a borrowing rate equal to the higher of the Federal Funds rate in effect on that day plus 1.25% or the overnight LIBOR rate in effect on that day plus 1.25%. In addition, an annual commitment fee equal to 0.25% of the unused balance is allocated to each participating fund.
For the year ended July 31, 2019, there were no borrowings by the Fund under the agreement.
8. DISTRIBUTIONS TO SHAREHOLDERS
The tax character of distributions paid during the years ended July 31, 2019 and July 31, 2018 were as follows:
| | | | | | | | |
| | | Year ended July 31 | |
| | |
| | | 2019 | | | 2018 | |
| | |
Ordinary income | | $ | 137,477 | | | $ | 445,466 | |
| | |
Long-term capital gain | | | 215,423,831 | | | | 201,440,487 | |
As of July 31, 2019, the components of distributable earnings on a tax basis were as follows:
| | | | |
Undistributed ordinary income | | Undistributed long-term gain | | Unrealized gains |
| | |
| $884,116 | | $77,593,192 | | $522,315,063 |
Wells Fargo Large Cap Growth Fund | 29
Notes to financial statements
Effective for all filings after November 4, 2018, the Securities and Exchange Commission eliminated the requirement to separately state the components of distributions to shareholders under U.S. generally accepted accounting principles. The amounts of distributions to shareholders for the year ended July 31, 2018 were as follows:
| | | | | | | | |
| | |
| | | Net investment
income | | | Net realized
gains | |
| | |
Class A | | $ | 0 | | | $ | 94,299,274 | |
| | |
Class C | | | 0 | | | | 2,995,367 | |
| | |
Class R | | | 0 | | | | 1,226,176 | |
| | |
Class R4 | | | 0 | | | | 86,325 | |
| | |
Class R6 | | | 368,832 | | | | 60,525,258 | |
| | |
Administrator Class | | | 0 | | | | 12,791,477 | |
| | |
Institutional Class | | | 76,634 | | | | 29,516,610 | |
9. CONCENTRATION RISK
Concentration risks result from exposure to a limited number of sectors. As of the end of the period, the Fund invests a concentration of its portfolio in the information technology sector. A fund that invests a substantial portion of its assets in any sector may be more affected by changes in that sector than would be a fund whose investments are not heavily weighted in any sector.
10. INDEMNIFICATION
Under the Trust’s organizational documents, the officers and Trustees have been granted certain indemnification rights against certain liabilities that may arise out of performance of their duties to the Trust. Additionally, in the normal course of business, the Trust may enter into contracts with service providers that contain a variety of indemnification clauses. The Trust’s maximum exposure under these arrangements is dependent on future claims that may be made against the Fund and, therefore, cannot be estimated.
11. NEW ACCOUNTING PRONOUNCEMENT
In August 2018, FASB issued Accounting Standards Update (“ASU”) No. 2018-13, Fair Value Measurement (Topic 820)Disclosure Framework—Changes to the Disclosure Requirements for Fair Value Measurement. ASU 2018-13 updates the disclosure requirements for fair value measurements by modifying or removing certain disclosures and adding certain new disclosures. The amendments are effective for fiscal years, and interim periods within those fiscal years, beginning after December 15, 2019. Early adoption is permitted. Management has adopted the removal and modification of disclosures early, as permitted, and will adopt the additional new disclosures at the effective date.
30 | Wells Fargo Large Cap Growth Fund
Report of independent registered public accounting firm
TO THE SHAREHOLDERS OF THE FUND AND BOARD OF TRUSTEES OF WELLS FARGO FUNDS TRUST:
Opinion on the Financial Statements
We have audited the accompanying statement of assets and liabilities of Wells Fargo Large Cap Growth Fund (the Fund), one of the funds constituting Wells Fargo Funds Trust, including the portfolio of investments, as of July 31, 2019, the related statement of operations for the year then ended, the statements of changes in net assets for each of the years in the two-year period then ended, and the related notes (collectively, the financial statements) and the financial highlights for each of the years in the five-year period then ended. In our opinion, the financial statements and financial highlights present fairly, in all material respects, the financial position of the Fund as of July 31, 2019, the results of its operations for the year then ended, the changes in its net assets for each of the years in the two-year period then ended, and the financial highlights for each of the years in the five-year period then ended, in conformity with U.S. generally accepted accounting principles.
Basis for Opinion
These financial statements and financial highlights are the responsibility of the Fund’s management. Our responsibility is to express an opinion on these financial statements and financial highlights based on our audits. We are a public accounting firm registered with the Public Company Accounting Oversight Board (United States) (PCAOB) and are required to be independent with respect to the Fund in accordance with the U.S. federal securities laws and the applicable rules and regulations of the Securities and Exchange Commission and the PCAOB.
We conducted our audits in accordance with the standards of the PCAOB. Those standards require that we plan and perform the audit to obtain reasonable assurance about whether the financial statements and financial highlights are free of material misstatement, whether due to error or fraud. Our audits included performing procedures to assess the risks of material misstatement of the financial statements and financial highlights, whether due to error or fraud, and performing procedures that respond to those risks. Such procedures included examining, on a test basis, evidence regarding the amounts and disclosures in the financial statements and financial highlights. Such procedures also included confirmation of securities owned as of July 31, 2019, by correspondence with the custodian, transfer agent and brokers, or by other appropriate auditing procedures. Our audits also included evaluating the accounting principles used and significant estimates made by management, as well as evaluating the overall presentation of the financial statements and financial highlights. We believe that our audits provide a reasonable basis for our opinion.

We have not been able to determine the specific year that we began serving as the auditor of one or more Wells Fargo Funds investment companies; however we are aware that we have served as the auditor of one or more Wells Fargo Funds investment companies since at least 1955.
Boston, Massachusetts
September 25, 2019
Wells Fargo Large Cap Growth Fund | 31
Other information (unaudited)
TAX INFORMATION
For corporate shareholders, pursuant to Section 854 of the Internal Revenue Code, 100% of ordinary income dividends qualify for the corporate dividends-received deduction for the fiscal year ended July 31, 2019.
Pursuant to Section 852 of the Internal Revenue Code, $215,423,831 was designated as a 20% rate gain distribution for the fiscal year ended July 31, 2019.
Pursuant to Section 854 of the Internal Revenue Code, $137,477 of income dividends paid during the fiscal year ended July 31, 2019 has been designated as qualified dividend income (QDI).
For the fiscal year ended July 31, 2019, $1,609 has been designated as interest-related dividends for nonresident alien shareholders pursuant to Section 871 of the Internal Revenue Code.
PROXY VOTING INFORMATION
A description of the policies and procedures used to determine how to vote proxies relating to portfolio securities is available, upon request, by calling1-800-222-8222, visiting our website atwfam.com, or visiting the SEC website at sec.gov. Information regarding how the proxies related to portfolio securities were voted during the most recent 12-month period ended June 30 is available on the website atwfam.comor by visiting the SEC website at sec.gov.
QUARTERLY PORTFOLIO HOLDINGS INFORMATION
The Fund files its complete schedule of portfolio holdings with the SEC for the first and third quarters of each fiscal year on Form N-Q or Form N-PORT, which is available by visiting the SEC website at sec.gov. Those forms may be reviewed and copied at the SEC’s Public Reference Room in Washington, DC. Information on the operation of the Public Reference Room may be obtained by calling 1-800-SEC-0330.
32 | Wells Fargo Large Cap Growth Fund
Other information (unaudited)
BOARD OF TRUSTEES AND OFFICERS
Each of the Trustees and Officers1 listed in the table below acts in identical capacities for each fund in the Wells Fargo family of funds, which consists of 152 mutual funds comprising the Wells Fargo Funds Trust, Wells Fargo Variable Trust, Wells Fargo Master Trust and four closed-end funds (collectively the “Fund Complex”). This table should be read in conjunction with the Prospectus and the Statement of Additional Information2. The mailing address of each Trustee and Officer is 525 Market Street, 12th Floor, San Francisco, CA 94105. Each Trustee and Officer serves an indefinite term, however, each Trustee serves such term until reaching the mandatory retirement age established by the Trustees.
Independent Trustees
| | | | | | |
Name and year of birth | | Position held and
length of service* | | Principal occupations during past five years or longer | | Current other
public company or
investment
company
directorships |
| | | |
| William R. Ebsworth (Born 1957) | | Trustee, since 2015 | | Retired. From 1984 to 2013, equities analyst, portfolio manager, research director and chief investment officer at Fidelity Management and Research Company in Boston, Tokyo, and Hong Kong, and retired in 2013 as Chief Investment Officer of Fidelity Strategic Advisers, Inc. where he led a team of investment professionals managing client assets. Prior thereto, Board member of Hong Kong Securities Clearing Co., Hong Kong Options Clearing Corp., the Thailand International Fund, Ltd., Fidelity Investments Life Insurance Company, and Empire Fidelity Investments Life Insurance Company. Audit Committee Chair and Investment Committee Chair of the Vincent Memorial Hospital Endowment (non-profit organization). Mr. Ebsworth is a CFA® charterholder. | | N/A |
| | | |
| Jane A. Freeman (Born 1953) | | Trustee, since 2015; Chair Liaison, since 2018 | | Retired. From 2012 to 2014 and 1999 to 2008, Chief Financial Officer of Scientific Learning Corporation. From 2008 to 2012, Ms. Freeman provided consulting services related to strategic business projects. Prior to 1999, Portfolio Manager at Rockefeller & Co. and Scudder, Stevens & Clark. Board member of the Harding Loevner Funds from 1996 to 2014, serving as both Lead Independent Director and chair of the Audit Committee. Board member of the Russell Exchange Traded Funds Trust from 2011 to 2012 and the chair of the Audit Committee. Ms. Freeman is a Board Member of The Ruth Bancroft Garden (non-profit organization). She is also an inactive Chartered Financial Analyst. | | N/A |
| | | |
| Isaiah Harris, Jr. (Born 1952) | | Trustee, since 2009; Audit Committee Chairman, since 2019 | | Retired. Chairman of the Board of CIGNA Corporation since 2009, and Director since 2005. From 2003 to 2011, Director of Deluxe Corporation. Prior thereto, President and CEO of BellSouth Advertising and Publishing Corp. from 2005 to 2007, President and CEO of BellSouth Enterprises from 2004 to 2005 and President of BellSouth Consumer Services from 2000 to 2003. Emeritus member of the Iowa State University Foundation Board of Governors. Emeritus Member of the Advisory Board of Iowa State University School of Business. Advisory Board Member, Palm Harbor Academy (private school). Advisory Board Member, Child Evangelism Fellowship (non-profit). Mr. Harris is a certified public accountant (inactive status). | | CIGNA Corporation |
| | | |
| Judith M. Johnson (Born 1949) | | Trustee, since 2008; Audit Committee Chairman, from 2009 to 2018 | | Retired. Prior thereto, Chief Executive Officer and Chief Investment Officer of Minneapolis Employees Retirement Fund from 1996 to 2008. Ms. Johnson is an attorney, certified public accountant and a certified managerial accountant. | | N/A |
Wells Fargo Large Cap Growth Fund | 33
Other information (unaudited)
| | | | | | |
Name and year of birth | | Position held and
length of service* | | Principal occupations during past five years or longer | | Current other
public company or
investment
company
directorships |
| | | |
| David F. Larcker (Born 1950) | | Trustee, since 2009 | | James Irvin Miller Professor of Accounting at the Graduate School of Business, Stanford University, Director of the Corporate Governance Research Initiative and Senior Faculty of The Rock Center for Corporate Governance since 2006. From 2005 to 2008, Professor of Accounting at the Graduate School of Business, Stanford University. Prior thereto, Ernst & Young Professor of Accounting at The Wharton School, University of Pennsylvania from 1985 to 2005. | | N/A |
| | | |
| Olivia S. Mitchell (Born 1953) | | Trustee, since 2006; Nominating and Governance Committee Chairman, since 2018 | | International Foundation of Employee Benefit Plans Professor, Wharton School of the University of Pennsylvania since 1993. Director of Wharton’s Pension Research Council and Boettner Center on Pensions & Retirement Research, and Research Associate at the National Bureau of Economic Research. Previously, Cornell University Professor from 1978 to 1993. | | N/A |
| | | |
| Timothy J. Penny (Born 1951) | | Trustee, since 1996; Chairman, since 2018 | | President and Chief Executive Officer of Southern Minnesota Initiative Foundation, a non-profit organization, since 2007. Member of the Board of Trustees of NorthStar Education Finance, Inc., a non-profit organization, since 2007. | | N/A |
| | | |
| James G. Polisson (Born 1959) | | Trustee, since 2018 | | Retired. Chief Marketing Officer, Source (ETF) UK Services, Ltd, from 2015 to 2017. From 2012 to 2015, Principal of The Polisson Group, LLC, a management consulting, corporate advisory and principal investing company. Chief Executive Officer and Managing Director at Russell Investments, Global Exchange Traded Funds from 2010 to 2012. Managing Director of Barclays Global Investors from 1998 to 2010 and Global Chief Marketing Officer for iShares and Barclays Global Investors from 2000 to 2010. Trustee of the San Francisco Mechanics’ Institute, a non-profit organization, from 2013 to 2015. Board member of the Russell Exchange Traded Fund Trust from 2011 to 2012. Director of Barclays Global Investors Holdings Deutschland GmbH from 2006 to 2009. Mr. Polisson is an attorney and has a retired status with the Massachusetts and District of Columbia Bar Associations. | | N/A |
| * | Length of service dates reflect the Trustee’s commencement of service with the Trust’s predecessor entities, where applicable. |
34 | Wells Fargo Large Cap Growth Fund
Other information (unaudited)
Officers
| | | | |
Name and year of birth | | Position held and
length of service | | Principal occupations during past five years or longer |
| | |
Andrew Owen (Born 1960) | | President, since 2017 | | Executive Vice President of Wells Fargo & Company and Head of Affiliated Managers, Wells Fargo Asset Management, since 2014. In addition, Mr. Owen is currently President, Chief Executive Officer and Director of Wells Fargo Funds Management, LLC since 2017. Prior thereto, Executive Vice President responsible for marketing, investments and product development for Wells Fargo Funds Management, LLC, from 2009 to 2014. |
| | |
Jeremy DePalma1 (Born 1974) | | Treasurer, since 2012 | | Senior Vice President of Wells Fargo Funds Management, LLC since 2009. Senior Vice President of Evergreen Investment Management Company, LLC from 2008 to 2010 and head of the Fund Reporting and Control Team within Fund Administration from 2005 to 2010. |
| | |
Alexander Kymn (Born 1973) | | Secretary and Chief Legal Officer, since 2018 | | Senior Company Counsel of Wells Fargo Bank, N.A. since 2018 (previously Senior Counsel from 2007 to 2018). Vice President of Wells Fargo Funds Management, LLC from 2008 to 2014. |
| | |
Michael H. Whitaker (Born 1967) | | Chief Compliance Officer, since 2016 | | Senior Vice President and Chief Compliance Officer since 2016. Senior Vice President and Chief Compliance Officer for Fidelity Investments from 2007 to 2016. |
| | |
David Berardi (Born 1975) | | Assistant Treasurer, since 2009 | | Vice President of Wells Fargo Funds Management, LLC since 2009. Vice President of Evergreen Investment Management Company, LLC from 2008 to 2010. Manager of Fund Reporting and Control for Evergreen Investment Management Company, LLC from 2004 to 2010. |
| 1 | Jeremy DePalma acts as Treasurer of 87 funds and Assistant Treasurer of 65 funds in the Fund Complex. |
| 2 | The Statement of Additional Information includes additional information about the Trustees and is available, without charge, upon request, by calling1-800-222-8222 or by visiting the website atwfam.com. |
Wells Fargo Large Cap Growth Fund | 35
Other information (unaudited)
BOARD CONSIDERATION OF INVESTMENT MANAGEMENT AND SUB-ADVISORY AGREEMENTS:
Wells Fargo Large Cap Growth Fund
Under the Investment Company Act of 1940 (the “1940 Act”), the Board of Trustees (the “Board”) of Wells Fargo Funds Trust (the “Trust”) must determine annually whether to approve the continuation of the Trust’s investment management and sub-advisory agreements. In this regard, at an in-person meeting held on May 21-22, 2019 (the “Meeting”), the Board, all the members of which have no direct or indirect interest in the investment management and sub-advisory agreements and are not “interested persons” of the Trust, as defined in the 1940 Act (the “Independent Trustees”), reviewed and approved for Wells Fargo Large Cap Growth Fund (the “Fund”): (i) an investment management agreement (the “Management Agreement”) with Wells Fargo Funds Management, LLC (“Funds Management”); and (ii) an investment sub-advisory agreement (the “Sub-Advisory Agreement”) with Wells Capital Management Incorporated (the “Sub-Adviser”), an affiliate of Funds Management. The Management Agreement and the Sub-Advisory Agreement are collectively referred to as the “Advisory Agreements.”
At the Meeting, the Board considered the factors and reached the conclusions described below relating to the selection of Funds Management and the Sub-Adviser and the approval of the Advisory Agreements. Prior to the Meeting, including at an in-person meeting in April 2019, the Trustees conferred extensively among themselves and with representatives of Funds Management about these matters. Also, the Board has adopted a team-based approach, with each team consisting of a sub-set of Trustees, to assist the full Board in the discharge of its duties in reviewing investment performance and other matters throughout the year. The Independent Trustees were assisted in their evaluation of the Advisory Agreements by independent legal counsel, from whom they received separate legal advice and with whom they met separately.
In providing information to the Board, Funds Management and the Sub-Adviser were guided by a detailed set of requests for information submitted to them by independent legal counsel on behalf of the Independent Trustees at the start of the Board’s annual contract renewal process earlier in 2019. In considering and approving the Advisory Agreements, the Trustees considered the information they believed relevant, including but not limited to the information discussed below. The Board considered not only the specific information presented in connection with the Meeting, but also the knowledge gained over time through interaction with Funds Management and the Sub-Adviser about various topics. In this regard, the Board reviewed reports of Funds Management at each of its quarterly meetings, which included, among other things, portfolio reviews and investment performance reports. In addition, the Board and the teams mentioned above confer with portfolio managers at various times throughout the year. The Board did not identify any particular information or consideration that was all-important or controlling, and each individual Trustee may have attributed different weights to various factors.
After its deliberations, the Board unanimously approved the continuation of the Advisory Agreements for a one-year term and determined that the compensation payable to Funds Management and the Sub-Adviser under each of the Advisory Agreements was reasonable. The Board considered the approval of the Advisory Agreements for the Fund as part of its consideration of agreements for funds across the complex, but its approvals were made on a fund-by-fund basis. The following summarizes a number of important, but not necessarily all, factors considered by the Board in support of its approvals.
Nature, extent and quality of services
The Board received and considered various information regarding the nature, extent and quality of services provided to the Fund by Funds Management and the Sub-Adviser under the Advisory Agreements. This information included a description of the investment advisory services and Fund-level administrative services covered by the Management Agreement, as well as, among other things, a summary of the background and experience of senior management of Wells Fargo Asset Management (“WFAM”), of which Funds Management and the Sub-Adviser are a part, a summary of investments made in the business of WFAM, a summary of certain organizational and personnel changes involving Funds Management and the Sub-Adviser, and a description of Funds Management’s and the Sub-Adviser’s business continuity planning programs and of their approaches to data privacy and cybersecurity. The Board received and reviewed information about Funds Management’s role as administrator of the Fund’s liquidity risk management program. The Board also considered the qualifications, background, tenure and responsibilities of each of the portfolio managers primarily responsible for the day-to-day portfolio management of the Fund.
The Board evaluated the ability of Funds Management and the Sub-Adviser to attract and retain qualified investment professionals, including research, advisory and supervisory personnel. The Board further considered the compliance programs and compliance records of Funds Management and the Sub-Adviser. In addition, the Board took into account the full range of services provided to the Fund by Funds Management and its affiliates.
36 | Wells Fargo Large Cap Growth Fund
Other information (unaudited)
Fund investment performance and expenses
The Board considered the investment performance results for the Fund over various time periods ended December 31, 2018. The Board considered these results in comparison to the investment performance of funds in a universe that was determined by Broadridge Inc. (“Broadridge”) to be similar to the Fund (the “Universe”), and in comparison to the Fund’s benchmark index and to other comparative data. Broadridge is an independent provider of investment company data. The Board received a description of the methodology used by Broadridge to select the mutual funds in the performance Universe. The Board noted that the investment performance of the Fund (Administrator Class) was higher than, equal to, or in range of the average investment performance of the Universe for all periods under review. The Board also noted that the investment performance of the Fund was lower than its benchmark index, the Russell 1000® Growth Index, for the three-, five- and ten-year periods under review, but higher than its benchmark for the one-year period under review.
The Board received information concerning, and discussed factors contributing to, the underperformance of the Fund relative to the benchmark for the periods identified above. The Board took note of the explanations for the relative underperformance during these periods, including with respect to investment decisions and market factors that affected the Fund’s investment performance. The Board also took note of the Fund’s outperformance relative to the Universe for all periods under review and the index over the one-year time period under review.
The Board also received and considered information regarding the Fund’s net operating expense ratios and their various components, including actual management fees, custodian and other non-management fees, and Rule 12b-1 and non-Rule 12b-1 shareholder service fees. The Board considered these ratios in comparison to the median ratios of funds in class-specific expense groups that were determined by Broadridge to be similar to the Fund (the “Groups”). The Board received a description of the methodology used by Broadridge to select the mutual funds in the expense Groups and an explanation of how funds comprising expense groups and their expense ratios may vary from year-to-year. Based on the Broadridge reports, the Board noted that the net operating expense ratios of the Fund were lower than or equal to the median net operating expense ratios of the expense Groups for each share class.
The Board took into account the Fund’s investment performance and expense information provided to it among the factors considered in deciding to re-approve the Advisory Agreements.
Investment management and sub-advisory fee rates
The Board reviewed and considered the contractual fee rates payable by the Fund to Funds Management under the Management Agreement, as well as the contractual fee rates payable by the Fund to Funds Management for class-level administrative services under a Class-Level Administration Agreement, which include, among other things, class-level transfer agency and sub-transfer agency costs (collectively, the “Management Rates”). The Board also reviewed and considered the contractual investment sub-advisory fee rates that are payable by Funds Management to the Sub-Adviser for investment sub-advisory services.
Among other information reviewed by the Board was a comparison of the Fund’s Management Rates with the average contractual investment management fee rates of funds in the expense Groups at a common asset level as well as transfer agency costs of the funds in the expense Groups. The Board noted that the Management Rates of the Fund were lower than or in range of the sum of these average rates for the Fund’s expense Groups for all share classes.
The Board also received and considered information about the portion of the total management fee that was retained by Funds Management after payment of the fee to the Sub-Adviser for sub-advisory services. In assessing the reasonableness of this amount, the Board received and evaluated information about the nature and extent of responsibilities retained and risks assumed by Funds Management and not delegated to or assumed by the Sub-Adviser, and about Funds Management’s on-going oversight services. Given the affiliation between Funds Management and the Sub-Adviser, the Board ascribed limited relevance to the allocation of fees between them.
The Board also received and considered information about the nature and extent of services offered and fee rates charged by Funds Management and the Sub-Adviser to other types of clients with investment strategies similar to those of the Fund. In this regard, the Board received information about the significantly greater scope of services, and compliance, reporting and other legal burdens and risks of managing proprietary mutual funds compared with those associated with managing assets of other types of clients, including third-party sub-advised fund clients and non-mutual fund clients such as institutional separate accounts.
Based on its consideration of the factors and information it deemed relevant, including those described here, the Board determined that the compensation payable to Funds Management under the Management Agreement and to the Sub-Adviser under the Sub-Advisory Agreement was reasonable.
Wells Fargo Large Cap Growth Fund | 37
Other information (unaudited)
Profitability
The Board received and considered information concerning the profitability of Funds Management, as well as the profitability of both WFAM and Wells Fargo & Co. (“Wells Fargo”) from providing services to the fund family as a whole. The Board noted that the Sub-Adviser’s profitability information with respect to providing services to the Fund and other funds in the family was subsumed in the WFAM and Wells Fargo profitability analysis.
Funds Management reported on the methodologies and estimates used in calculating profitability, including a description of the methodology used to allocate certain expenses. Among other things, the Board noted that the levels of profitability reported on a fund-by-fund basis varied widely, depending on factors such as the size, type and age of fund. Based on its review, the Board did not deem the profits reported by Funds Management, WFAM or Wells Fargo from services provided to the Fund to be at a level that would prevent it from approving the continuation of the Advisory Agreements.
Economies of scale
The Board received and considered information about the potential for Funds Management to experience economies of scale in the provision of management services to the Fund, the difficulties of calculating economies of scale at an individual fund level, and the extent to which potential scale benefits are shared with shareholders. The Board noted the existence of breakpoints in the Fund’s management fee structure, which operate generally to reduce the Fund’s expense ratios as the Fund grows in size. The Board considered that in addition to management fee breakpoints, Funds Management shares potential economies of scale from its management business in a variety of ways, including through fee waiver and expense reimbursement arrangements, services that benefit shareholders, competitive management fee rates set at the outset without regard to breakpoints, and investments in the business intended to enhance services available to shareholders.
The Board concluded that Funds Management’s arrangements with respect to the Fund, including contractual breakpoints, constituted a reasonable approach to sharing potential economies of scale with the Fund and its shareholders.
Other benefits to Funds Management and the Sub-Adviser
The Board received and considered information regarding potential “fall-out” or ancillary benefits received by Funds Management and its affiliates, including the Sub-Adviser, as a result of their relationships with the Fund. Ancillary benefits could include, among others, benefits directly attributable to other relationships with the Fund and benefits potentially derived from an increase in Funds Management’s and the Sub-Adviser’s business as a result of their relationships with the Fund. The Board noted that various affiliates of Funds Management may receive distribution-related fees, shareholder servicing payments and sub-transfer agency fees in respect of shares sold or held through them and services provided.
The Board also reviewed information about soft dollar credits earned and utilized by the Sub-Adviser, fees earned by Funds Management and the Sub-Adviser from managing a private investment vehicle for the fund family’s securities lending collateral, and commissions earned by an affiliated broker from portfolio transactions.
Based on its consideration of the factors and information it deemed relevant, including those described here, the Board did not find that any ancillary benefits received by Funds Management and its affiliates, including the Sub-Adviser, were unreasonable.
Conclusion
At the Meeting, after considering the above-described factors and based on its deliberations and its evaluation of the information described above, the Board unanimously approved the continuation of the Advisory Agreements for a one-year term and determined that the compensation payable to Funds Management and the Sub-Adviser under each of the Advisory Agreements was reasonable.
38 | Wells Fargo Large Cap Growth Fund
This page is intentionally left blank.
This page is intentionally left blank.

For more information
More information about Wells Fargo Funds is available free upon request. To obtain literature, please write, visit the Fund’s website, or call:
Wells Fargo Funds
P.O. Box 219967
Kansas City, MO 64121-9967
Website:wfam.com
Individual investors:1-800-222-8222
Retail investment professionals:1-888-877-9275
Institutional investment professionals:1-866-765-0778

This report and the financial statements contained herein are submitted for the general information of the shareholders of the Fund. If this report is used for promotional purposes, distribution of the report must be accompanied or preceded by a current prospectus. Before investing, please consider the investment objectives, risks, charges, and expenses of the investment. For a current prospectus and, if available, a summary prospectus, containing this information, call1-800-222-8222 or visit the Fund’s website atwfam.com. Read the prospectus carefully before you invest or send money.
Wells Fargo Asset Management (WFAM) is the trade name for certain investment advisory/management firms owned by Wells Fargo & Company. These firms include but are not limited to Wells Capital Management Incorporated and Wells Fargo Funds Management, LLC. Certain products managed by WFAM entities are distributed by Wells Fargo Funds Distributor, LLC (a broker-dealer and Member FINRA).
This material is for general informational and educational purposes only and is NOT intended to provide investment advice or a recommendation of any kind—including a recommendation for any specific investment, strategy, or plan.
INVESTMENT PRODUCTS: NOT FDIC INSURED ◾ NO BANK GUARANTEE ◾ MAY LOSE VALUE
© 2019 Wells Fargo Funds Management, LLC. All rights reserved.
405481 09-19
A209/AR209 07-19
Annual Report
July 31, 2019
Wells Fargo
Large Company Value Fund
Beginning on January 1, 2021, as permitted by new regulations adopted by the Securities and Exchange Commission, paper copies of the Wells Fargo Funds’ annual and semi-annual shareholder reports issued after this date will no longer be sent by mail, unless you specifically request paper copies of the reports. Instead, the reports will be made available on the Funds’ website, and you will be notified by mail each time a report is posted and provided with a website address to access the report.
If you already elected to receive shareholder reports electronically, you will not be affected by this change and you need not take any action. You may elect to receive shareholder reports and other communications from the Fund electronically at any time by contacting your financial intermediary (such as a broker-dealer or bank) or, if you are a direct investor, by calling1-800-222-8222 or by enrolling at wellsfargo.com/advantagedelivery.
You may elect to receive all future reports in paper free of charge. If you invest through a financial intermediary, you can contact your financial intermediary to request that you continue to receive paper copies of your shareholder reports; if you invest directly with the Fund, you can call 1-800-222-8222. Your election to receive reports in paper will apply to all Wells Fargo Funds held in your account with your financial intermediary or, if you are a direct investor, to all Wells Fargo Funds that you hold.
|
|
|
Reduce clutter. Save trees. |
Sign up for electronic delivery of prospectuses and shareholder reports atwellsfargo.com/advantagedelivery |
The views expressed and any forward-looking statements are as of July 31, 2019, unless otherwise noted, and are those of the Fund managers and/or Wells Fargo Asset Management. Discussions of individual securities, or the markets generally, or any Wells Fargo Fund are not intended as individual recommendations. Future events or results may vary significantly from those expressed in any forward-looking statements. The views expressed are subject to change at any time in response to changing circumstances in the market. Wells Fargo Asset Management and the Fund disclaim any obligation to publicly update or revise any views expressed or forward-looking statements.
INVESTMENT PRODUCTS: NOT FDIC INSURED ◾ NO BANK GUARANTEE ◾ MAY LOSE VALUE
Wells Fargo Large Company Value Fund | 1
Letter to shareholders (unaudited)

Andrew Owen
President
Wells Fargo Funds
Dear Shareholder:
We are pleased to offer you this annual report for the Wells Fargo Large Company Value Fund for the 12-month period that ended July 31, 2019. After the first six months of the period yielded either low-single-digit or negative investment returns, U.S. stock and global bond investors generally enjoyed a recovery during the final six months amid continued concerns about global economic growth, international trade, geopolitical tensions, and bouts of market volatility. These concerns negatively influenced international equity markets.
For the period, U.S. stocks, based on the S&P 500 Index,1 gained 7.99% and international stocks, as measured by the MSCI ACWI ex USA Index (Net),2 fell 2.27%. The MSCI EM Index (Net)3 slipped 2.18%. For bond investors, the Bloomberg Barclays U.S. Aggregate Bond Index4 added 8.08%, the Bloomberg Barclays Global Aggregate ex-USD Index5 added 3.74%, the Bloomberg Barclays Municipal Bond Index6 gained 7.31%, and the ICE BofAML U.S. High Yield Index7 added 6.94%.
Entering the fourth quarter of 2018, economic data was encouraging.
Domestic equity investors entered the fourth quarter of 2018 with reasons to be optimistic. The U.S. Bureau of Economic Analysis reported second-quarter annualized gross domestic product (GDP) growth of 4.2%. Hiring improved. Unemployment declined. Consumer confidence and spending increased. Third-quarter corporate earnings reports were generally positive. U.S. trade negotiations with Mexico and Canada progressed. The U.S. Federal Reserve (Fed) raised the federal funds rate by 25 basis points (bps; 100 bps equal 1.00%) to a target range of between 2.00% and 2.25% in September 2018, one of four rate increases implemented during the calendar year, a sign of its confidence in the strength of the U.S. economy.
Investors in international markets were not as confident. Tensions between the U.S. and China increased. The U.S. imposed $200 billion in tariffs on Chinese goods. China reacted with $60 billion in tariffs on U.S. goods. Economic growth in China caused concern. In September 2018, international investors began to factor a number of disconcerting economic and business data points: lower July manufacturers’ and industrial orders in Germany; falling purchasing manager index numbers for August from the United Kingdom, China, and India; and declining household spending for August in Japan. Taken together, the data fed growing concerns over slowing global growth that unnerved investors.
| 1 | The S&P 500 Index consists of 500 stocks chosen for market size, liquidity, and industry group representation. It is a market-value-weighted index with each stock’s weight in the index proportionate to its market value. You cannot invest directly in an index. |
| 2 | The Morgan Stanley Capital International (MSCI) All Country World Index (ACWI) ex USA Index (Net) is a free-float-adjusted market-capitalization weighted index that is designed to measure the equity market performance of developed and emerging markets, excluding the U.S. Source: MSCI. MSCI makes no express or implied warranties or representations and shall have no liability whatsoever with respect to any MSCI data contained herein. The MSCI data may not be further redistributed or used as a basis for other indices or any securities or financial products. This report is not approved, reviewed, or produced by MSCI. You cannot invest directly in an index. |
| 3 | The MSCI Emerging Markets (EM) Index (Net) is a free-float-adjusted market-capitalization-weighted index that is designed to measure the equity market performance of emerging markets. You cannot invest directly in an index. |
| 4 | The Bloomberg Barclays U.S. Aggregate Bond Index is a broad-based benchmark that measures the investment-grade, U.S. dollar-denominated, fixed-rate taxable bond market, including Treasuries, government-related and corporate securities, mortgage-backed securities (agency fixed-rate and hybrid adjustable-rate mortgage pass-throughs), asset-backed securities, and commercial mortgage-backed securities. You cannot invest directly in an index. |
| 5 | The Bloomberg Barclays Global Aggregate ex-USD Index is an unmanaged index that provides a broad-based measure of the global investment-grade fixed-income markets excluding the U.S. dollar-denominated debt market. You cannot invest directly in an index. |
| 6 | The Bloomberg Barclays Municipal Bond Index is an unmanaged index composed of long-term tax-exempt bonds with a minimum credit rating of Baa. You cannot invest directly in an index. |
| 7 | The ICE BofAML U.S. High Yield Index is a market-capitalization-weighted index of domestic and Yankee high-yield bonds. The index tracks the performance of high-yield securities traded in the U.S. bond market. You cannot invest directly in an index. Copyright 2019. ICE Data Indices, LLC. All rights reserved. |
2 | Wells Fargo Large Company Value Fund
Letter to shareholders (unaudited)
Global markets suffered during the fourth quarter of 2018.
November’s U.S. midterm elections shifted control of the House of Representatives from Republicans to Democrats, presaging partisan clashes that followed and caused uncertainty among investors. Third-quarter U.S. GDP was announced at an annualized 3.4% rate, lower than the second-quarter rate. Brexit efforts stalled ahead of the March 2019 deadline. The People’s Bank of China cut reserve requirement ratios, accelerated infrastructure spending, and cut taxes even as the value of the yuan declined to low levels last seen in 2008. A partial U.S. government shutdown driven by partisan policy disputes extended into January.
The combination of news in the U.S. and generally weak economic indicators outside of the U.S. caused investors to seek safe havens. December’s S&P 500 Index performance was the worst since 1931. Globally, fixed-income investments fared better than stocks during the last two months of the year. The Fed increased the federal funds rate by 25 bps in December to a target range of between 2.25% and 2.50%.
The market climbs a wall of worry.
Investors entered 2019 with reasons to be concerned. Investment returns appeared to reaffirm the adage that markets climb a wall of worry. The S&P 500 Index gained 8.01% for the month of January, the best monthly performance in 30 years. Returns for the MSCI ACWI ex USA Index (Net), the Bloomberg Barclays U.S. Aggregate Bond Index, and the Bloomberg Barclays Global Aggregate ex-USD Index also were positive.
In February 2019, signs of slowing global growth grew more ominous. The Bureau of Economic Analysis announced fourth-quarter 2018 GDP grew at an annualized 2.2% rate, down from the levels of the prior two quarters. In a February report, the Bank of England forecasted the slowest growth since the financial crisis for 2019. China and the U.S. continued to wrangle over trade issues.
By the end of March 2019, a combination of dovish Fed sentiment and steady, if not spectacular, U.S. economic and business metrics reinforced investors’ confidence. Monthly job creation data and corporate profits, while less consistent than during 2018, were solid. China announced a roughly $300 billion stimulus package through tax and fee cuts intended to reinvigorate economic growth. During April 2019, favorable sentiment found additional support in reports of sustained low inflation, solid employment data, and first-quarter U.S. GDP of an annualized rate of 3.2%.
During May 2019, markets tumbled on mixed investment signals. In the U.S., partisan wrangling ramped up as Democrats and Republicans set their sights on 2020 presidential politics. The U.K.’s Brexit caused Prime Minister Theresa May to resign. The European Commission downgraded the 2019 growth forecast to 1.2%. The U.S. increased tariffs on products from China, China responded, and then talks broke down. President Donald Trump threatened to turn his foreign policy tariff tool to Mexico over immigration issues.
As had been the case during most of 2019 to date, just as the investment horizon appeared to darken, sentiment turned and U.S. equity markets gained during June and July. The gains, primarily driven by geopolitical and monetary policy events, pushed equity markets to new highs.
President Mario Draghi of the European Central Bank said that if the outlook doesn’t improve, the bank will cut rates or buy more assets to prop up inflation. President Trump backed off of tariff threats against Mexico and China. In the U.S., the Fed implemented a 0.25% federal funds rate cut in July 2019.
“December’s S&P 500 Index performance was the worst since 1931.”
“The S&P 500 Index gained 8.01% for the month of January, the best monthly performance in 30 years.”
Wells Fargo Large Company Value Fund | 3
Letter to shareholders (unaudited)
Later in July 2019, the U.S. reversed course and threatened to impose higher tariffs on China’s exports after talks failed. China responded with tariff threats of its own and devalued the renminbi, a move that roiled global markets. Despite the accommodative approach of central banks, investors continued to have misgivings about the durability of economic growth globally and a pervasively cautious tone influenced the world’s equity and fixed-income markets.
Don’t let short-term uncertainty derail long-term investment goals.
Periods of investment uncertainty can present challenges, but experience has taught us that maintaining long-term investment goals can be an effective way to plan for the future. To help you create a sound strategy based on your personal goals and risk tolerance, Wells Fargo Funds offers more than 100 mutual funds spanning a wide range of asset classes and investment styles. Although diversification cannot guarantee an investment profit or prevent losses, we believe it can be an effective way to manage investment risk and potentially smooth out overall portfolio performance. We encourage investors to know their investments and to understand that appropriate levels of risk-taking may unlock opportunities.
Thank you for choosing to invest with Wells Fargo Funds. We appreciate your confidence in us and remain committed to helping you meet your financial needs.
Sincerely,

Andrew Owen
President
Wells Fargo Funds
|
|
|
For further information about your Fund, contact your investment professional, visit our website at wfam.com, or call us directly at1-800-222-8222. |
4 | Wells Fargo Large Company Value Fund
This page is intentionally left blank.
Performance highlights (unaudited)
Investment objective
The Fund seeks long-term capital appreciation.
Manager
Wells Fargo Funds Management, LLC
Subadviser
Wells Capital Management Incorporated
Portfolio managers
Dennis Bein, CFA®‡
Ryan Brown, CFA®‡
Harindra de Silva, Ph.D., CFA®‡
Average annual total returns (%) as of July 31, 2019
| | | | | | | | | | | | | | | | | | | | | | | | | | | | | | | | | | |
| | | | |
| | | | | Including sales charge | | | Excluding sales charge | | | Expense ratios1 (%) | |
| | | | | | | | | |
| | | Inception date | | 1 year | | | 5 year | | | 10 year | | | 1 year | | | 5 year | | | 10 year | | | Gross | | | Net2 | |
| | | | | | | | | | |
| Class A (WLCAX) | | 3-31-2008 | | | -4.38 | | | | 4.57 | | | | 9.45 | | | | 1.44 | | | | 5.82 | | | | 10.10 | | | | 0.95 | | | | 0.84 | |
| | | | | | | | | | |
| Class C (WFLVX) | | 3-31-2008 | | | -0.24 | | | | 5.04 | | | | 9.29 | | | | 0.76 | | | | 5.04 | | | | 9.29 | | | | 1.70 | | | | 1.59 | |
| | | | | | | | | | |
| Class R6 (WTLVX)3 | | 4-7-2017 | | | – | | | | – | | | | – | | | | 1.92 | | | | 6.28 | | | | 10.61 | | | | 0.52 | | | | 0.41 | |
| | | | | | | | | | |
| Administrator Class (WWIDX) | | 12-31-2001 | | | – | | | | – | | | | – | | | | 1.61 | | | | 5.98 | | | | 10.33 | | | | 0.87 | | | | 0.76 | |
| | | | | | | | | | |
| Institutional Class (WLCIX) | | 3-31-2008 | | | – | | | | – | | | | – | | | | 1.86 | | | | 6.23 | | | | 10.59 | | | | 0.62 | | | | 0.51 | |
| | | | | | | | | | |
| Russell 1000® Value Index4 | | – | | | – | | | | – | | | | – | | | | 5.20 | | | | 8.01 | | | | 12.40 | | | | – | | | | – | |
Figures quoted represent past performance, which is no guarantee of future results, and do not reflect taxes that a shareholder may pay on fund distributions or the redemption of fund shares. Investment return and principal value of an investment will fluctuate so that an investor’s shares, when redeemed, may be worth more or less than their original cost. Performance shown without sales charges would be lower if sales charges were reflected. Current performance may be lower or higher than the performance data quoted, which assumes the reinvestment of dividends and capital gains. Current month-end performance is available on the Fund’s website,wfam.com.
Index returns do not include transaction costs associated with buying and selling securities, any mutual fund fees or expenses, or any taxes. It is not possible to invest directly in an index.
For Class A shares, the maximum front-end sales charge is 5.75%. For Class C shares, the maximum contingent deferred sales charge is 1.00%. Performance including a contingent deferred sales charge assumes the sales charge for the corresponding time period. Class R6, Administrator Class, and Institutional Class shares are sold without a front-end sales charge or contingent deferred sales charge.
Stock values fluctuate in response to the activities of individual companies and general market and economic conditions. Certain investment strategies tend to increase the total risk of an investment (relative to the broader market). The Fund is exposed to foreign investment risk. Consult the Fund’s prospectus for additional information on these and other risks.
Please see footnotes on page 7.
6 | Wells Fargo Large Company Value Fund
Performance highlights (unaudited)
|
|
| Growth of $10,000 investment as of July 31, 20195 |
|
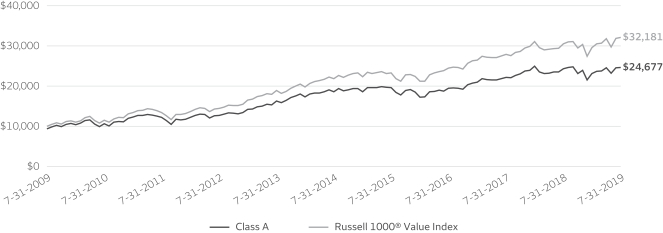
|
| ‡ | CFA® and Chartered Financial Analyst® are trademarks owned by CFA Institute. |
| 1 | Reflects the expense ratios as stated in the most recent prospectuses, which include the impact of 0.01% in acquired fund fees and expenses. The expense ratios shown are subject to change and may differ from the annualized expense ratios shown in the financial highlights of this report. |
| 2 | The manager has contractually committed through November 30, 2019, to waive fees and/or reimburse expenses to the extent necessary to cap the expenses of each class after fee waivers at 0.83% for Class A, 1.58% for Class C, 0.40% for Class R6, 0.75% for Administrator Class, and 0.50% for Institutional Class. Brokerage commissions, stamp duty fees, interest, taxes, acquired fund fees and expenses (if any), and extraordinary expenses are excluded from the expense cap. Prior to or after the commitment expiration date, the cap may be increased or the commitment to maintain the cap may be terminated only with the approval of the Board of Trustees. Without this cap, the Fund’s returns would have been lower. The expense ratio paid by an investor is the net expense ratio (the total annual fund operating expenses after fee waivers) as stated in the prospectuses. |
| 3 | Historical performance shown for the Class R6 shares prior to their inception reflects the performance of the Institutional Class shares, and is not adjusted to reflect Class R6 expenses. If these expenses had been included, returns for Class R6 shares would be higher. |
| 4 | The Russell 1000® Value Index measures the performance of those Russell 1000 companies with lower price/book ratios and lower forecasted growth values. You cannot invest directly in an index. |
| 5 | The chart compares the performance of Class A shares for the most recent ten years with the Russell 1000® Value Index. The chart assumes a hypothetical investment of $10,000 in Class A shares and reflects all operating expenses and assumes the maximum initial sales charge of 5.75%. |
| 6 | The Conference Board Consumer Confidence Index® measures the degree of optimism on the state of the U.S. economy that consumers are expressing through their activities of saving and spending. You cannot invest directly in an index. |
| 7 | The S&P 500 Index consists of 500 stocks chosen for market size, liquidity, and industry group representation. It is a market-value-weighted index with each stock’s weight in the index proportionate to its market value. You cannot invest directly in an index. |
| 8 | The ten largest holdings, excluding cash, cash equivalents and any money market funds, are calculated based on the value of the investments divided by total net assets of the Fund. Holdings are subject to change and may have changed since the date specified. |
| 9 | Amounts are calculated based on the total long-term investments of the Fund. These amounts are subject to change and may have changed since the date specified. |
| * | This security was no longer held at the end of the reporting period. |
Wells Fargo Large Company Value Fund | 7
Performance highlights (unaudited)
MANAGER’S DISCUSSION
Fund highlights
| ∎ | | The Fund underperformed its benchmark, the Russell 1000® Value Index, for the 12-month period that ended July 31, 2019. |
| ∎ | | The Fund’s underperformance was primarily due to poor selection within health care and real estate. A modest underweight position to information technology (IT) also negatively affected relative performance. |
| ∎ | | Stock selection within the consumer discretionary and consumer staples sectors helped relative performance. The Fund’s overweight to the communication services sector helped as well. |
U.S. stocks delivered strong results during the reporting period.
Markets posted positive returns for the one-year period despite the Russell 1000 Index® returning -13.82% in the fourth quarter of 2018. December’s big sell-off seemed to result from concerns over the government shutdown. December started with an argument between the Federal Reserve (Fed) and the White House over rising interest rates and ended with a confrontation between Congress and the White House over budget issues. Both led to increased market volatility.
Early in the period, the strength of the domestic economy helped move stocks higher. Consumer spending figures were strong, driving overall growth for the economy. Continued growth also helped consumer confidence, with The Conference Board Consumer Confidence Index®6hitting an 18-year high. In addition, August’s unemployment rate was 3.9%, a low not seen since December 2000.
Fed officials raised the federal funds rate in December 2018 and initially reaffirmed the outlook for further gradual hikes well into 2019. The quarter-point increase in December 2018 boosted the benchmark federal funds rate to 2.50%.
The tone surrounding interest rates changed later in the 12-month period when economic growth slowed. For example, only 20,000 new jobs were added in February 2019. In addition, earnings growth disappointed as the first-quarter earnings growth estimate for the S&P 500 Index7 fell from 2.9% to -3.9%. Consumer spending growth also pulled back as January’s personal spending report showed 0.1% growth and retail sales in February fell 0.2%. As a result, the Fed initially indicated there would be no further interest rate hikes during 2019. In fact, in response to increasing trade tensions and slowing global economic growth, the Fed lowered interest rates after the close of the 12-month period—on July 31, 2019—its first rate cut since 2008.
| | | | |
|
| Ten largest holdings (%) as of July 31, 20198 | |
| | |
Berkshire Hathaway Incorporated Class B | | | 4.33 | |
| | |
JPMorgan Chase & Company | | | 4.29 | |
| | |
Johnson & Johnson | | | 3.95 | |
| | |
The Procter & Gamble Company | | | 3.90 | |
| | |
Pfizer Incorporated | | | 3.08 | |
| | |
Bank of America Corporation | | | 2.46 | |
| | |
Verizon Communications Incorporated | | | 2.42 | |
| | |
ConocoPhillips | | | 2.33 | |
| | |
Altria Group Incorporated | | | 2.22 | |
| | |
ONEOK Incorporated | | | 2.22 | |
Detractors included stock selection within health care and real estate and a modest IT underweight.
Positions in Pfizer Incorporated and Mylan N.V.* were large detractors in the health care sector, while positions in CoreCivic Incorporated and Xenia Hotels & Resorts, Incorporated*, were detractors in the real estate sector. By design, the investment process does not take large relative positions to benchmark weights. During the period, a modest underweight position to IT negatively influenced relative results.
Please see footnotes on page 7.
8 | Wells Fargo Large Company Value Fund
Performance highlights (unaudited)
|
|
| Sector distribution as of July 31, 20199 |
|
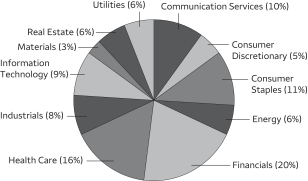 |
Selection within consumer discretionary and consumer staples helped relative performance.
From a sector standpoint, an overweight to the communication services sector contributed to relative performance. Within consumer discretionary, overweight positions to Yum China Holdings, Incorporated, and Carnival Corporation* were top individual contributors to relative performance. Within consumer staples, overweight positions to both The Procter & Gamble Company and PepsiCo, Incorporated, were top contributors to performance.
Going forward, our investment philosophy and process remain the same.
The investment philosophy employed in our value-equity strategy is that security returns are predictable based on common fundamental factors and that market inefficiencies caused by patterns of investor behavior and economic change may be exploited to earn an excess return. The stock selection model uses over 70 fundamental, technical, and proprietary factors to build a diversified portfolio that we believe is well positioned to generate excess returns over a three- to five-year market cycle.
During the period, the portfolio had an overweight position to valuation characteristics that negatively affected results. Specifically, our process was overweight companies with above-average earnings and cash flow relative to price, which hurt as investors deemphasized valuation when selecting securities. An emphasis to companies with above-average quality characteristics, such as strong profit margins and return on equity, helped results because companies with these qualities outperformed during the period.
Our process is based on the fundamental belief that there is persistency in the types of characteristics investors prefer. If this belief holds going forward, we expect the Fund to potentially benefit from being properly positioned toward stocks with characteristics favored by investors over the long term. We continue to focus on companies with above-average quality metrics, such as stocks with strong profit margins and return on assets. In addition, we continue to emphasize stocks with certain attractive valuation characteristics, such as stocks with above-average cash flow-to-price ratios and dividend yields. Finally, we will continue to deemphasize risk, such as companies with above-average volatility of analyst earnings expectations.
Please see footnotes on page 7.
Wells Fargo Large Company Value Fund | 9
Fund expenses (unaudited)
As a shareholder of the Fund, you incur two types of costs: (1) transaction costs, including sales charges (loads) on purchase payments and contingent deferred sales charges (if any) on redemptions and (2) ongoing costs, including management fees, distribution (12b-1) and/or shareholder servicing fees, and other Fund expenses. This example is intended to help you understand your ongoing costs (in dollars) of investing in the Fund and to compare these costs with the ongoing costs of investing in other mutual funds.
The example is based on an investment of $1,000 invested at the beginning of the six-month period and held for the entire period from February 1, 2019 to July 31, 2019.
Actual expenses
The “Actual” line of the table below provides information about actual account values and actual expenses. You may use the information in this line, together with the amount you invested, to estimate the expenses that you paid over the period. Simply divide your account value by $1,000 (for example, an $8,600 account value divided by $1,000 = 8.6), then multiply the result by the number in the “Actual” line under the heading entitled “Expenses paid during period” for your applicable class of shares to estimate the expenses you paid on your account during this period.
Hypothetical example for comparison purposes
The “Hypothetical” line of the table below provides information about hypothetical account values and hypothetical expenses based on the Fund’s actual expense ratio and an assumed rate of return of 5% per year before expenses, which is not the Fund’s actual return. The hypothetical account values and expenses may not be used to estimate the actual ending account balance or expenses you paid for the period. You may use this information to compare the ongoing costs of investing in the Fund and other funds. To do so, compare this 5% hypothetical example with the 5% hypothetical examples that appear in the shareholder reports of the other funds.
Please note that the expenses shown in the table are meant to highlight your ongoing costs only and do not reflect any transactional costs, such as sales charges (loads) and contingent deferred sales charges. Therefore, the “Hypothetical” line of the table is useful in comparing ongoing costs only and will not help you determine the relative total costs of owning different funds. In addition, if these transactional costs were included, your costs would have been higher.
| | | | | | | | | | | | | | | | |
| | | Beginning
account value
2-1-2019 | | | Ending
account value
7-31-2019 | | | Expenses
paid during
the period¹ | | | Annualized net
expense ratio | |
| | | | | |
Class A | | | | | | | | | | | | | | | | |
| | | | |
Actual | | $ | 1,000.00 | | | $ | 1,063.84 | | | $ | 4.25 | | | | 0.83 | % |
| | | | |
Hypothetical (5% return before expenses) | | $ | 1,000.00 | | | $ | 1,020.68 | | | $ | 4.16 | | | | 0.83 | % |
| | | | | |
Class C | | | | | | | | | | | | | | | | |
| | | | |
Actual | | $ | 1,000.00 | | | $ | 1,059.96 | | | $ | 8.07 | | | | 1.58 | % |
| | | | |
Hypothetical (5% return before expenses) | | $ | 1,000.00 | | | $ | 1,016.96 | | | $ | 7.90 | | | | 1.58 | % |
| | | | | |
Class R6 | | | | | | | | | | | | | | | | |
| | | | |
Actual | | $ | 1,000.00 | | | $ | 1,066.14 | | | $ | 2.05 | | | | 0.40 | % |
| | | | |
Hypothetical (5% return before expenses) | | $ | 1,000.00 | | | $ | 1,022.81 | | | $ | 2.01 | | | | 0.40 | % |
| | | | | |
Administrator Class | | | | | | | | | | | | | | | | |
| | | | |
Actual | | $ | 1,000.00 | | | $ | 1,065.19 | | | $ | 3.84 | | | | 0.75 | % |
| | | | |
Hypothetical (5% return before expenses) | | $ | 1,000.00 | | | $ | 1,021.08 | | | $ | 3.76 | | | | 0.75 | % |
| | | | | |
Institutional Class | | | | | | | | | | | | | | | | |
| | | | |
Actual | | $ | 1,000.00 | | | $ | 1,065.66 | | | $ | 2.56 | | | | 0.50 | % |
| | | | |
Hypothetical (5% return before expenses) | | $ | 1,000.00 | | | $ | 1,022.32 | | | $ | 2.51 | | | | 0.50 | % |
| 1 | Expenses paid is equal to the annualized net expense ratio of each class multiplied by the average account value over the period, multiplied by the number of days in the most recent fiscal half-year divided by the number of days in the fiscal year (to reflect the one-half-year period). |
10 | Wells Fargo Large Company Value Fund
Portfolio of investments—July 31, 2019
| | | | | | | | | | | | | | | | |
| | | | | | | | | Shares | | | Value | |
| Common Stocks: 98.81% | | | | | | | | | | | | | | | | |
| | | | |
Communication Services: 10.21% | | | | | | | | | | | | | | | | |
| | | | |
| Diversified Telecommunication Services: 4.15% | | | | | | | | | | | | |
| | | | |
AT&T Incorporated | | | | | | | | | | | 109,070 | | | $ | 3,713,834 | |
| | | | |
Verizon Communications Incorporated | | | | | | | | | | | 93,534 | | | | 5,169,624 | |
| | | | |
| | | | | | | | | | | | | | | 8,883,458 | |
| | | | | | | | | | | | | | | | |
| | | | |
| Entertainment: 1.58% | | | | | | | | | | | | |
| | | | |
Viacom Incorporated Class B | | | | | | | | | | | 111,078 | | | | 3,371,217 | |
| | | | | | | | | | | | | | | | |
| | | | |
| Interactive Media & Services: 0.98% | | | | | | | | | | | | |
| | | | |
Alphabet Incorporated Class A † | | | | | | | | | | | 656 | | | | 799,139 | |
| | | | |
IAC Corporation † | | | | | | | | | | | 5,400 | | | | 1,290,870 | |
| | | | |
| | | | | | | | | | | | | | | 2,090,009 | |
| | | | | | | | | | | | | | | | |
| | | | |
| Media: 3.50% | | | | | | | | | | | | |
| | | | |
Charter Communications Incorporated Class A † | | | | | | | | | | | 11,813 | | | | 4,552,494 | |
| | | | |
Comcast Corporation Class A | | | | | | | | | | | 67,868 | | | | 2,929,862 | |
| | | | |
| | | | | | | | | | | | | | | 7,482,356 | |
| | | | | | | | | | | | | | | | |
| | | | |
Consumer Discretionary: 4.60% | | | | | | | | | | | | | | | | |
| | | | |
| Hotels, Restaurants & Leisure: 3.36% | | | | | | | | | | | | |
| | | | |
Aramark | | | | | | | | | | | 48,159 | | | | 1,742,874 | |
| | | | |
Boyd Gaming Corporation | | | | | | | | | | | 36,792 | | | | 974,620 | |
| | | | |
McDonald’s Corporation | | | | | | | | | | | 6,131 | | | | 1,291,924 | |
| | | | |
Yum China Holdings Incorporated | | | | | | | | | | | 69,604 | | | | 3,166,982 | |
| | | | |
| | | | | | | | | | | | | | | 7,176,400 | |
| | | | | | | | | | | | | | | | |
| | | | |
| Specialty Retail: 0.66% | | | | | | | | | | | | |
| | | | |
Lowe’s Companies Incorporated | | | | | | | | | | | 13,993 | | | | 1,418,890 | |
| | | | | | | | | | | | | | | | |
| | | | |
| Textiles, Apparel & Luxury Goods: 0.58% | | | | | | | | | | | | |
| | | | |
Lululemon Athletica Incorporated † | | | | | | | | | | | 6,502 | | | | 1,242,467 | |
| | | | | | | | | | | | | | | | |
| | | | |
Consumer Staples: 11.13% | | | | | | | | | | | | | | | | |
| | | | |
| Beverages: 0.95% | | | | | | | | | | | | |
| | | | |
PepsiCo Incorporated | | | | | | | | | | | 15,829 | | | | 2,023,104 | |
| | | | | | | | | | | | | | | | |
| | | | |
| Food & Staples Retailing: 2.06% | | | | | | | | | | | | |
| | | | |
Costco Wholesale Corporation | | | | | | | | | | | 16,003 | | | | 4,410,907 | |
| | | | | | | | | | | | | | | | |
| | | | |
| Food Products: 2.00% | | | | | | | | | | | | |
| | | | |
Archer Daniels Midland Company | | | | | | | | | | | 99,115 | | | | 4,071,644 | |
| | | | |
Ingredion Incorporated | | | | | | | | | | | 2,789 | | | | 215,562 | |
| | | | |
| | | | | | | | | | | | | | | 4,287,206 | |
| | | | | | | | | | | | | | | | |
| | | | |
| Household Products: 3.90% | | | | | | | | | | | | |
| | | | |
The Procter & Gamble Company | | | | | | | | | | | 70,667 | | | | 8,341,533 | |
| | | | | | | | | | | | | | | | |
| | | | |
| Tobacco: 2.22% | | | | | | | | | | | | |
| | | | |
Altria Group Incorporated | | | | | | | | | | | 100,791 | | | | 4,744,232 | |
| | | | | | | | | | | | | | | | |
The accompanying notes are an integral part of these financial statements.
Wells Fargo Large Company Value Fund | 11
Portfolio of investments—July 31, 2019
| | | | | | | | | | | | | | | | |
| | | | | | | | | Shares | | | Value | |
Energy: 6.00% | | | | | | | | | | | | | | | | |
| | | | |
| Oil, Gas & Consumable Fuels: 6.00% | | | | | | | | | | | | |
| | | | |
ConocoPhillips | | | | | | | | | | | 84,175 | | | $ | 4,973,059 | |
| | | | |
CVR Energy Incorporated | | | | | | | | | | | 9,137 | | | | 484,901 | |
| | | | |
Marathon Petroleum Corporation | | | | | | | | | | | 7,610 | | | | 429,128 | |
| | | | |
ONEOK Incorporated | | | | | | | | | | | 67,636 | | | | 4,739,931 | |
| | | | |
Phillips 66 | | | | | | | | | | | 5,738 | | | | 588,489 | |
| | | | |
The Williams Companies Incorporated | | | | | | | | | | | 17,782 | | | | 438,148 | |
| | | | |
Valero Energy Corporation | | | | | | | | | | | 13,777 | | | | 1,174,489 | |
| | | | |
| | | | | | | | | | | | | | | 12,828,145 | |
| | | | | | | | | | | | | | | | |
| | | | |
Financials: 19.26% | | | | | | | | | | | | | | | | |
| | | | |
| Banks: 7.91% | | | | | | | | | | | | |
| | | | |
Bank of America Corporation | | | | | | | | | | | 171,699 | | | | 5,267,725 | |
| | | | |
Bank of N.T. Butterfield & Son Limited | | | | | | | | | | | 19,569 | | | | 615,054 | |
| | | | |
Citigroup Incorporated | | | | | | | | | | | 26,237 | | | | 1,867,025 | |
| | | | |
JPMorgan Chase & Company | | | | | | | | | | | 79,109 | | | | 9,176,644 | |
| | | | |
| | | | | | | | | | | | | | | 16,926,448 | |
| | | | | | | | | | | | | | | | |
| | | | |
| Capital Markets: 2.38% | | | | | | | | | | | | |
| | | | |
Ameriprise Financial Incorporated | | | | | | | | | | | 17,693 | | | | 2,574,508 | |
| | | | |
Bank of New York Mellon Corporation | | | | | | | | | | | 49,493 | | | | 2,322,212 | |
| | | | |
BlackRock Incorporated | | | | | | | | | | | 414 | | | | 193,620 | |
| | | | |
| | | | | | | | | | | | | | | 5,090,340 | |
| | | | | | | | | | | | | | | | |
| | | | |
| Consumer Finance: 2.39% | | | | | | | | | | | | |
| | | | |
Ally Financial Incorporated | | | | | | | | | | | 140,838 | | | | 4,634,979 | |
| | | | |
Capital One Financial Corporation | | | | | | | | | | | 5,105 | | | | 471,804 | |
| | | | |
| | | | | | | | | | | | | | | 5,106,783 | |
| | | | | | | | | | | | | | | | |
| | | | |
| Diversified Financial Services: 4.54% | | | | | | | | | | | | |
| | | | |
Berkshire Hathaway Incorporated Class B † | | | | | | | | | | | 45,034 | | | | 9,251,335 | |
| | | | |
Cannae Holdings Incorporated † | | | | | | | | | | | 15,618 | | | | 452,141 | |
| | | | |
| | | | | | | | | | | | | | | 9,703,476 | |
| | | | | | | | | | | | | | | | |
| | | | |
| Insurance: 2.04% | | | | | | | | | | | | |
| | | | |
Old Republic International Corporation | | | | | | | | | | | 191,488 | | | | 4,367,841 | |
| | | | | | | | | | | | | | | | |
| | | | |
Health Care: 16.24% | | | | | | | | | | | | | | | | |
| | | | |
| Biotechnology: 4.30% | | | | | | | | | | | | |
| | | | |
Alexion Pharmaceuticals Incorporated † | | | | | | | | | | | 21,243 | | | | 2,406,619 | |
| | | | |
Amgen Incorporated | | | | | | | | | | | 9,753 | | | | 1,819,715 | |
| | | | |
Arena Pharmaceuticals Incorporated † | | | | | | | | | | | 41,466 | | | | 2,599,089 | |
| | | | |
Gilead Sciences Incorporated | | | | | | | | | | | 36,133 | | | | 2,367,434 | |
| | | | |
| | | | | | | | | | | | | | | 9,192,857 | |
| | | | | | | | | | | | | | | | |
| | | | |
| Health Care Equipment & Supplies: 1.53% | | | | | | | | | | | | |
| | | | |
West Pharmaceutical Services Incorporated | | | | | | | | | | | 23,831 | | | | 3,271,281 | |
| | | | | | | | | | | | | | | | |
| | | | |
| Health Care Providers & Services: 0.46% | | | | | | | | | | | | |
| | | | |
Cardinal Health Incorporated | | | | | | | | | | | 8,562 | | | | 391,540 | |
| | | | |
Laboratory Corporation of America Holdings † | | | | | | | | | | | 3,517 | | | | 589,168 | |
| | | | |
| | | | | | | | | | | | | | | 980,708 | |
| | | | | | | | | | | | | | | | |
The accompanying notes are an integral part of these financial statements.
12 | Wells Fargo Large Company Value Fund
Portfolio of investments—July 31, 2019
| | | | | | | | | | | | | | | | |
| | | | | | | | | Shares | | | Value | |
| Health Care Technology: 1.08% | | | | | | | | | | | | | | | | |
| | | | |
Veeva Systems Incorporated Class A † | | | | | | | | | | | 13,957 | | | $ | 2,315,466 | |
| | | | | | | | | | | | | | | | |
| | | | |
| Life Sciences Tools & Services: 1.34% | | | | | | | | | | | | |
| | | | |
Agilent Technologies Incorporated | | | | | | | | | | | 41,421 | | | | 2,875,032 | |
| | | | | | | | | | | | | | | | |
| | | | |
| Pharmaceuticals: 7.53% | | | | | | | | | | | | |
| | | | |
Johnson & Johnson | | | | | | | | | | | 64,858 | | | | 8,445,809 | |
| | | | |
Merck & Company Incorporated | | | | | | | | | | | 231 | | | | 19,171 | |
| | | | |
Pfizer Incorporated | | | | | | | | | | | 169,849 | | | | 6,596,935 | |
| | | | |
Zoetis Incorporated | | | | | | | | | | | 9,040 | | | | 1,038,606 | |
| | | | |
| | | | | | | | | | | | | | | 16,100,521 | |
| | | | | | | | | | | | | | | | |
| | | | |
Industrials: 8.08% | | | | | | | | | | | | | | | | |
| | | | |
| Aerospace & Defense: 0.92% | | | | | | | | | | | | |
| | | | |
Huntington Ingalls Industries Incorporated | | | | | | | | | | | 440 | | | | 100,452 | |
| | | | |
The Boeing Company | | | | | | | | | | | 5,497 | | | | 1,875,466 | |
| | | | |
| | | | | | | | | | | | | | | 1,975,918 | |
| | | | | | | | | | | | | | | | |
| | | | |
| Air Freight & Logistics: 1.07% | | | | | | | | | | | | |
| | | | |
United Parcel Service Incorporated Class B | | | | | | | | | | | 19,142 | | | | 2,286,895 | |
| | | | | | | | | | | | | | | | |
| | | | |
| Airlines: 2.39% | | | | | | | | | | | | |
| | | | |
SkyWest Incorporated | | | | | | | | | | | 7,935 | | | | 481,734 | |
| | | | |
Southwest Airlines Company | | | | | | | | | | | 89,998 | | | | 4,637,597 | |
| | | | |
| | | | | | | | | | | | | | | 5,119,331 | |
| | | | | | | | | | | | | | | | |
| | | | |
| Commercial Services & Supplies: 1.70% | | | | | | | | | | | | |
| | | | |
Republic Services Incorporated | | | | | | | | | | | 38,023 | | | | 3,370,739 | |
| | | | |
Waste Management Incorporated | | | | | | | | | | | 2,179 | | | | 254,943 | |
| | | | |
| | | | | | | | | | | | | | | 3,625,682 | |
| | | | | | | | | | | | | | | | |
| | | | |
| Professional Services: 0.09% | | | | | | | | | | | | |
| | | | |
CoStar Group Incorporated † | | | | | | | | | | | 320 | | | | 196,928 | |
| | | | | | | | | | | | | | | | |
| | | | |
| Road & Rail: 1.91% | | | | | | | | | | | | |
| | | | |
Norfolk Southern Corporation | | | | | | | | | | | 11,447 | | | | 2,187,751 | |
| | | | |
Union Pacific Corporation | | | | | | | | | | | 10,493 | | | | 1,888,215 | |
| | | | |
| | | | | | | | | | | | | | | 4,075,966 | |
| | | | | | | | | | | | | | | | |
| | | | |
Information Technology: 8.83% | | | | | | | | | | | | | | | | |
| | | | |
| Communications Equipment: 1.38% | | | | | | | | | | | | |
| | | | |
Cisco Systems Incorporated | | | | | | | | | | | 53,382 | | | | 2,957,363 | |
| | | | | | | | | | | | | | | | |
| | | | |
| IT Services: 3.51% | | | | | | | | | | | | |
| | | | |
DXC Technology Company | | | | | | | | | | | 20,150 | | | | 1,123,766 | |
| | | | |
Leidos Holdings Incorporated | | | | | | | | | | | 6,267 | | | | 514,521 | |
| | | | |
MasterCard Incorporated Class A | | | | | | | | | | | 16,293 | | | | 4,436,095 | |
| | | | |
Paychex Incorporated | | | | | | | | | | | 10,822 | | | | 898,767 | |
| | | | |
PayPal Holdings Incorporated † | | | | | | | | | | | 4,765 | | | | 526,056 | |
| | | | |
| | | | | | | | | | | | | | | 7,499,205 | |
| | | | | | | | | | | | | | | | |
The accompanying notes are an integral part of these financial statements.
Wells Fargo Large Company Value Fund | 13
Portfolio of investments—July 31, 2019
| | | | | | | | | | | | | | | | |
| | | | | | | | | Shares | | | Value | |
| Semiconductors & Semiconductor Equipment: 2.58% | | | | | | | | | | | | |
| | | | |
Cabot Microelectronics Corporation | | | | | | | | | | | 7,432 | | | $ | 904,103 | |
| | | | |
Intel Corporation | | | | | | | | | | | 54,105 | | | | 2,735,008 | |
| | | | |
Maxim Integrated Products Incorporated | | | | | | | | | | | 31,860 | | | | 1,885,793 | |
| | | | |
| | | | | | | | | | | | | | | 5,524,904 | |
| | | | | | | | | | | | | | | | |
| | | | |
| Software: 0.09% | | | | | | | | | | | | |
| | | | |
Intuit Incorporated | | | | | | | | | | | 647 | | | | 179,420 | |
| | | | | | | | | | | | | | | | |
| | | | |
| Technology Hardware, Storage & Peripherals: 1.27% | | | | | | | | | | | | |
| | | | |
HP Incorporated | | | | | | | | | | | 129,190 | | | | 2,718,158 | |
| | | | | | | | | | | | | | | | |
| | | | |
Materials: 2.65% | | | | | | | | | | | | | | | | |
| | | | |
| Chemicals: 1.01% | | | | | | | | | | | | |
| | | | |
The Mosaic Company | | | | | | | | | | | 86,135 | | | | 2,169,741 | |
| | | | | | | | | | | | | | | | |
| | | | |
| Metals & Mining: 1.64% | | | | | | | | | | | | |
| | | | |
Carpenter Technology Corporation | | | | | | | | | | | 6,501 | | | | 292,610 | |
| | | | |
Royal Gold Incorporated | | | | | | | | | | | 28,017 | | | | 3,206,546 | |
| | | | |
| | | | | | | | | | | | | | | 3,499,156 | |
| | | | | | | | | | | | | | | | |
| | | | |
Real Estate: 5.46% | | | | | | | | | | | | | | | | |
| | | | |
| Equity REITs: 5.46% | | | | | | | | | | | | |
| | | | |
CoreCivic Incorporated | | | | | | | | | | | 169,661 | | | | 2,879,145 | |
| | | | |
Hannon Armstrong Sustainable | | | | | | | | | | | 46,092 | | | | 1,265,225 | |
| | | | |
Mack-Cali Realty Corporation | | | | | | | | | | | 92,936 | | | | 2,210,018 | |
| | | | |
Outfront Media Incorporated | | | | | | | | | | | 96,893 | | | | 2,633,552 | |
| | | | |
The Geo Group Incorporated | | | | | | | | | | | 118,978 | | | | 2,118,998 | |
| | | | |
Ventas Incorporated | | | | | | | | | | | 8,293 | | | | 558,036 | |
| | | | |
Weingarten Realty Investors | | | | | | | | | | | 414 | | | | 11,555 | |
| | | | |
| | | | | | | | | | | | | | | 11,676,529 | |
| | | | | | | | | | | | | | | | |
| | | | |
Utilities: 6.35% | | | | | | | | | | | | | | | | |
| | | | |
| Electric Utilities: 4.58% | | | | | | | | | | | | |
| | | | |
Duke Energy Corporation | | | | | | | | | | | 38,572 | | | | 3,344,964 | |
| | | | |
NextEra Energy Incorporated | | | | | | | | | | | 11,295 | | | | 2,339,985 | |
| | | | |
Pinnacle West Capital Corporation | | | | | | | | | | | 45,146 | | | | 4,118,218 | |
| | | | |
| | | | | | | | | | | | | | | 9,803,167 | |
| | | | | | | | | | | | | | | | |
| | | | |
| Multi-Utilities: 1.77% | | | | | | | | | | | | |
| | | | |
Ameren Corporation | | | | | | | | | | | 8,767 | | | | 663,574 | |
| | | | |
Dominion Energy Incorporated | | | | | | | | | | | 10,393 | | | | 772,096 | |
| | | | |
MDU Resources Group Incorporated | | | | | | | | | | | 88,012 | | | | 2,353,441 | |
| | | | |
| | | | | | | | | | | | | | | 3,789,111 | |
| | | | | | | | | | | | | | | | |
| | | | |
Total Common Stocks (Cost $192,906,643) | | | | | | | | | | | | | | | 211,328,151 | |
| | | | | | | | | | | | | | | | |
The accompanying notes are an integral part of these financial statements.
14 | Wells Fargo Large Company Value Fund
Portfolio of investments—July 31, 2019
| | | | | | | | | | | | | | | | |
| | | Yield | | | | | | Shares | | | Value | |
Short-Term Investments: 0.77% | | | | | | | | | | | | | | | | |
| | | | |
| Investment Companies: 0.77% | | | | | | | | | | | | |
| | | | |
Wells Fargo Government Money Market Fund Select Class (l)(u) | | | 2.26 | % | | | | | | | 1,645,324 | | | $ | 1,645,324 | |
| | | | | | | | | | | | | | | | |
| | | | |
Total Short-Term Investments (Cost $1,645,324) | | | | | | | | | | | | | | | 1,645,324 | |
| | | | | | | | | | | | | | | | |
| | | | | | | | |
| Total investments in securities (Cost $194,551,967) | | | 99.58 | % | | | 212,973,475 | |
| | |
Other assets and liabilities, net | | | 0.42 | | | | 890,123 | |
| | | | | | | | |
| Total net assets | | | 100.00 | % | | $ | 213,863,598 | |
| | | | | | | | |
| † | Non-income-earning security |
| (l) | The issuer of the security is an affiliated person of the Fund as defined in the Investment Company Act of 1940. |
| (u) | The rate represents the 7-day annualized yield at period end. |
Abbreviations:
| REIT | Real estate investment trust |
Futures Contracts
| | | | | | | | | | | | | | | | | | | | | | | | |
| Description | | Number of
contracts | | | Expiration
date | | | Notional
cost | | | Notional
value | | | Unrealized
gains | | | Unrealized
losses | |
Long | | | | | | | | | | | | | | | | | | | | | | | | |
S&P 500 E-Mini Index | | | 15 | | | | 9-20-2019 | | | $ | 2,238,784 | | | $ | 2,236,725 | | | $ | 0 | | | $ | (2,059 | ) |
Investments in Affiliates
An affiliated investment is an investment in which the Fund owns at least 5% of the outstanding voting shares of the issuer or as a result of other relationships, such as the Fund and the issuer having the same investment manager. Transactions with issuers that were either affiliated persons of the Fund at the beginning of the period or the end of the period were as follows:
| | | | | | | | | | | | | | | | | | | | | | | | | | | | | | | | | | | | |
| | | Shares,
beginning
of period | | | Shares
purchased | | | Shares
sold | | | Shares,
end of
period | | | Net
realized
gains
(losses) | | | Net
change in
unrealized
gains
(losses) | | | Income
from
affiliated
securities | | | Value, end
of period | | | % of
net
assets | |
Short-Term Investments | | | | | | | | | | | | | | | | | | | | | | | | | | | | | | | | | | | | |
Investment Companies | | | | | | | | | | | | | | | | | | | | | | | | | | | | | | | | | | | | |
Wells Fargo Government Money Market Fund Select Class | | | 4,171,660 | | | | 37,345,603 | | | | 39,871,939 | | | | 1,645,324 | | | $ | 0 | | | $ | 0 | | | $ | 85,694 | | | $ | 1,645,324 | | | | 0.77 | % |
The accompanying notes are an integral part of these financial statements.
Wells Fargo Large Company Value Fund | 15
Statement of assets and liabilities—July 31, 2019
| | | | |
| | | | |
| |
Assets | | | | |
Investments in unaffiliated securities, at value (cost $192,906,643) | | $ | 211,328,151 | |
Investments in affiliated securities, at value (cost $1,645,324) | | | 1,645,324 | |
Segregated cash for futures contracts | | | 800,000 | |
Receivable for Fund shares sold | | | 5,279 | |
Receivable for dividends | | | 295,700 | |
Prepaid expenses and other assets | | | 88,063 | |
| | | | |
Total assets | | | 214,162,517 | |
| | | | |
| |
Liabilities | | | | |
Payable for Fund shares redeemed | | | 96,396 | |
Management fee payable | | | 48,100 | |
Shareholder servicing fees payable | | | 45,437 | |
Administration fees payable | | | 37,552 | |
Payable for daily variation margin on open futures contracts | | | 27,500 | |
Professional fees payable | | | 26,587 | |
Trustees’ fees and expenses payable | | | 4,203 | |
Distribution fee payable | | | 696 | |
Accrued expenses and other liabilities | | | 12,448 | |
| | | | |
Total liabilities | | | 298,919 | |
| | | | |
Total net assets | | $ | 213,863,598 | |
| | | | |
| |
Net assets consist of | | | | |
Paid-in capital | | $ | 198,351,390 | |
Total distributable earnings | | | 15,512,208 | |
| | | | |
Total net assets | | $ | 213,863,598 | |
| | | | |
| |
Computation of net asset value and offering price per share | | | | |
Net assets – Class A | | $ | 196,075,401 | |
Shares outstanding – Class A1 | | | 15,170,282 | |
Net asset value per share – Class A | | | $12.92 | |
Maximum offering price per share – Class A2 | | | $13.71 | |
Net assets – Class C | | $ | 966,019 | |
Shares outstanding – Class C1 | | | 72,412 | |
Net asset value per share – Class C | | | $13.34 | |
Net assets – Class R6 | | $ | 20,199 | |
Shares outstanding – Class R61 | | | 1,549 | |
Net asset value per share – Class R6 | | | $13.04 | |
Net assets – Administrator Class | | $ | 13,854,194 | |
Shares outstanding – Administrator Class1 | | | 1,061,091 | |
Net asset value per share – Administrator Class | | | $13.06 | |
Net assets – Institutional Class | | $ | 2,947,785 | |
Shares outstanding – Institutional Class1 | | | 226,045 | |
Net asset value per share – Institutional Class | | | $13.04 | |
| 1 | The Fund has an unlimited number of authorized shares. |
| 2 | Maximum offering price is computed as 100/94.25 of net asset value. On investments of $50,000 or more, the offering price is reduced. |
The accompanying notes are an integral part of these financial statements.
16 | Wells Fargo Large Company Value Fund
Statement of operations—year ended July 31, 2019
| | | | |
| | | | |
| |
Investment income | | | | |
Dividends (net of foreign withholding taxes of $25) | | $ | 5,949,692 | |
Income from affiliated securities | | | 85,694 | |
| | | | |
Total investment income | | | 6,035,386 | |
| | | | |
| |
Expenses | | | | |
Management fee | | | 904,480 | |
Administration fees | | | | |
Class A | | | 418,196 | |
Class C | | | 3,988 | |
Class R6 | | | 7 | |
Administrator Class | | | 20,232 | |
Institutional Class | | | 12,345 | |
Shareholder servicing fees | | | | |
Class A | | | 497,852 | |
Class C | | | 4,748 | |
Administrator Class | | | 38,909 | |
Distribution fee | | | | |
Class C | | | 14,226 | |
Custody and accounting fees | | | 21,999 | |
Professional fees | | | 40,420 | |
Registration fees | | | 80,001 | |
Shareholder report expenses | | | 59,999 | |
Trustees’ fees and expenses | | | 21,999 | |
Interest expense | | | 549 | |
Other fees and expenses | | | 13,365 | |
| | | | |
Total expenses | | | 2,153,315 | |
Less: Fee waivers and/or expense reimbursements | | | (305,607 | ) |
| | | | |
Net expenses | | | 1,847,708 | |
| | | | |
Net investment income | | | 4,187,678 | |
| | | | |
| |
Realized and unrealized gains (losses) on investments | | | | |
Net realized gains (losses) on | | | | |
Unaffiliated securities | | | (2,051,486 | ) |
Futures contracts | | | 274,927 | |
| | | | |
Net realized losses on investments | | | (1,776,559 | ) |
| | | | |
| |
Net change in unrealized gains (losses) on | | | | |
Unaffiliated securities | | | (1,118,834 | ) |
Futures contracts | | | (100,670 | ) |
| | | | |
Net change in unrealized gains (losses) on investments | | | (1,219,504 | ) |
| | | | |
Net realized and unrealized gains (losses) on investments | | | (2,996,063 | ) |
| | | | |
Net increase in net assets resulting from operations | | $ | 1,191,615 | |
| | | | |
The accompanying notes are an integral part of these financial statements.
Wells Fargo Large Company Value Fund | 17
Statement of changes in net assets
| | | | | | | | | | | | | | | | |
| | | Year ended
July 31, 2019 | | | Year ended
July 31, 20181 | |
| | | |
Operations | | | | | | | | | | | | |
Net investment income | | | | | | $ | 4,187,678 | | | | | | | $ | 3,343,736 | |
Net realized gains (losses) on investments | | | | | | | (1,776,559 | ) | | | | | | | 26,456,759 | |
Net change in unrealized gains (losses) on investments | | | | | | | (1,219,504 | ) | | | | | | | (6,608,842 | ) |
| | | | |
Net increase in net assets resulting from operations | | | | | | | 1,191,615 | | | | | | | | 23,191,653 | |
| | | | |
| | | | |
Distributions to shareholders from net investment income and net realized gains | | | | | | | | | | | | | | | | |
Class A | | | | | | | (23,627,979 | ) | | | | | | | (46,029,469 | ) |
Class C | | | | | | | (266,385 | ) | | | | | | | (659,195 | ) |
Class R6 | | | | | | | (2,636 | ) | | | | | | | (6,656 | ) |
Administrator Class | | | | | | | (1,888,886 | ) | | | | | | | (3,673,062 | ) |
Institutional Class | | | | | | | (1,871,851 | ) | | | | | | | (3,556,512 | ) |
| | | | |
Total distributions to shareholders | | | | | | | (27,657,737 | ) | | | | | | | (53,924,894 | ) |
| | | | |
| | | | |
Capital share transactions | | | Shares | | | | | | | | Shares | | | | | |
Proceeds from shares sold | | | | | | | | | | | | | | | | |
Class A | | | 328,569 | | | | 4,172,689 | | | | 243,128 | | | | 3,569,805 | |
Class C | | | 6,704 | | | | 85,717 | | | | 4,796 | | | | 75,911 | |
Class R6 | | | 0 | | | | 0 | | | | 297 | | | | 5,000 | |
Administrator Class | | | 14,518 | | | | 189,634 | | | | 26,318 | | | | 380,870 | |
Institutional Class | | | 68,756 | | | | 908,749 | | | | 128,944 | | | | 1,889,629 | |
| | | | |
| | | | | | | 5,356,789 | | | | | | | | 5,921,215 | |
| | | | |
Reinvestment of distributions | | | | | | | | | | | | | | | | |
Class A | | | 1,878,949 | | | | 23,010,284 | | | | 3,111,809 | | | | 44,581,220 | |
Class C | | | 19,913 | | | | 248,892 | | | | 42,242 | | | | 618,917 | |
Class R6 | | | 0 | | | | 0 | | | | 72 | | | | 1,037 | |
Administrator Class | | | 150,186 | | | | 1,857,902 | | | | 250,317 | | | | 3,619,530 | |
Institutional Class | | | 39,382 | | | | 487,708 | | | | 203,584 | | | | 2,943,466 | |
| | | | |
| | | | | | | 25,604,786 | | | | | | | | 51,764,170 | |
| | | | |
Payment for shares redeemed | | | | | | | | | | | | | | | | |
Class A | | | (1,858,015 | ) | | | (24,202,649 | ) | | | (1,908,557 | ) | | | (28,835,984 | ) |
Class C | | | (151,734 | ) | | | (1,973,099 | ) | | | (48,634 | ) | | | (725,165 | ) |
Class R6 | | | 0 | | | | 0 | | | | (369 | ) | | | (5,292 | ) |
Administrator Class | | | (251,379 | ) | | | (3,187,791 | ) | | | (227,193 | ) | | | (3,486,080 | ) |
Institutional Class | | | (1,090,005 | ) | | | (12,813,608 | ) | | | (104,675 | ) | | | (1,560,195 | ) |
| | | | |
| | | | | | | (42,177,147 | ) | | | | | | | (34,612,716 | ) |
| | | | |
Net increase (decrease) in net assets resulting from capital share transactions | | | | | | | (11,215,572 | ) | | | | | | | 23,072,669 | |
| | | | |
Total decrease in net assets | | | | | | | (37,681,694 | ) | | | | | | | (7,660,572 | ) |
| | | | |
| | |
Net assets | | | | | | | | |
Beginning of period | | | | | | | 251,545,292 | | | | | | | | 259,205,864 | |
| | | | |
End of period | | | | | | $ | 213,863,598 | | | | | | | $ | 251,545,292 | |
| | | | |
| 1 | Effective for all filings after November 4, 2018, the SEC prospectively eliminated the requirement to parenthetically disclose undistributed net investment income at the end of the period and permitted the aggregation of distributions, with the exception of tax basis returns of capital. Undistributed net investment income at July 31, 2018 was $792,952. The disaggregated distributions information for the year ended July 31, 2018 is included in Note 8,Distributions to Shareholders,in the notes to the financial statements. |
The accompanying notes are an integral part of these financial statements.
18 | Wells Fargo Large Company Value Fund
Financial highlights
(For a share outstanding throughout each period)
| | | | | | | | | | | | | | | | | | | | |
| | | Year ended July 31 | |
| CLASS A | | 2019 | | | 2018 | | | 2017 | | | 2016 | | | 2015 | |
Net asset value, beginning of period | | | $14.46 | | | | $16.54 | | | | $14.58 | | | | $16.10 | | | | $16.82 | |
Net investment income | | | 0.24 | | | | 0.19 | | | | 0.14 | | | | 0.17 | | | | 0.13 | 1 |
Net realized and unrealized gains (losses) on investments | | | (0.15 | ) | | | 1.29 | | | | 1.93 | | | | (0.41 | ) | | | 0.78 | |
| | | | | | | | | | | | | | | | | | | | |
Total from investment operations | | | 0.09 | | | | 1.48 | | | | 2.07 | | | | (0.24 | ) | | | 0.91 | |
Distributions to shareholders from | | | | | | | | | | | | | | | | | | | | |
Net investment income | | | (0.25 | ) | | | (0.18 | ) | | | (0.11 | ) | | | (0.16 | ) | | | (0.13 | ) |
Net realized gains | | | (1.38 | ) | | | (3.38 | ) | | | 0.00 | | | | (1.12 | ) | | | (1.50 | ) |
| | | | | | | | | | | | | | | | | | | | |
Total distributions to shareholders | | | (1.63 | ) | | | (3.56 | ) | | | (0.11 | ) | | | (1.28 | ) | | | (1.63 | ) |
Net asset value, end of period | | | $12.92 | | | | $14.46 | | | | $16.54 | | | | $14.58 | | | | $16.10 | |
Total return2 | | | 1.44 | % | | | 9.39 | % | | | 14.24 | % | | | (0.98 | )% | | | 5.72 | % |
Ratios to average net assets (annualized) | | | | | | | | | | | | | | | | | | | | |
Gross expenses | | | 0.97 | % | | | 0.94 | % | | | 1.09 | % | | | 1.24 | % | | | 1.27 | % |
Net expenses | | | 0.83 | % | | | 0.83 | % | | | 0.96 | % | | | 1.10 | % | | | 1.10 | % |
Net investment income | | | 1.84 | % | | | 1.28 | % | | | 0.91 | % | | | 1.19 | % | | | 0.76 | % |
Supplemental data | | | | | | | | | | | | | | | | | | | | |
Portfolio turnover rate | | | 221 | % | | | 258 | % | | | 221 | % | | | 50 | % | | | 71 | % |
Net assets, end of period (000s omitted) | | | $196,075 | | | | $214,247 | | | | $221,207 | | | | $218,922 | | | | $104,453 | |
| 1 | Calculated based upon average shares outstanding |
| 2 | Total return calculations do not include any sales charges. |
The accompanying notes are an integral part of these financial statements.
Wells Fargo Large Company Value Fund | 19
Financial highlights
(For a share outstanding throughout each period)
| | | | | | | | | | | | | | | | | | | | |
| | | Year ended July 31 | |
| CLASS C | | 2019 | | | 2018 | | | 2017 | | | 2016 | | | 2015 | |
Net asset value, beginning of period | | | $14.81 | | | | $16.86 | | | | $14.90 | | | | $16.41 | | | | $17.12 | |
Net investment income | | | 0.16 | 1 | | | 0.08 | | | | 0.03 | 1 | | | 0.06 | | | | 0.00 | 2 |
Net realized and unrealized gains (losses) on investments | | | (0.15 | ) | | | 1.30 | | | | 1.96 | | | | (0.40 | ) | | | 0.80 | |
| | | | | | | | | | | | | | | | | | | | |
Total from investment operations | | | 0.01 | | | | 1.38 | | | | 1.99 | | | | (0.34 | ) | | | 0.80 | |
Distributions to shareholders from | | | | | | | | | | | | | | | | | | | | |
Net investment income | | | (0.10 | ) | | | (0.05 | ) | | | (0.03 | ) | | | (0.05 | ) | | | (0.01 | ) |
Net realized gains | | | (1.38 | ) | | | (3.38 | ) | | | 0.00 | | | | (1.12 | ) | | | (1.50 | ) |
| | | | | | | | | | | | | | | | | | | | |
Total distributions to shareholders | | | (1.48 | ) | | | (3.43 | ) | | | (0.03 | ) | | | (1.17 | ) | | | (1.51 | ) |
Net asset value, end of period | | | $13.34 | | | | $14.81 | | | | $16.86 | | | | $14.90 | | | | $16.41 | |
Total return3 | | | 0.76 | % | | | 8.49 | % | | | 13.40 | % | | | (1.68 | )% | | | 4.92 | % |
Ratios to average net assets (annualized) | | | | | | | | | | | | | | | | | | | | |
Gross expenses | | | 1.71 | % | | | 1.69 | % | | | 1.84 | % | | | 1.99 | % | | | 2.02 | % |
Net expenses | | | 1.58 | % | | | 1.58 | % | | | 1.72 | % | | | 1.85 | % | | | 1.85 | % |
Net investment income | | | 1.15 | % | | | 0.55 | % | | | 0.16 | % | | | 0.44 | % | | | 0.01 | % |
Supplemental data | | | | | | | | | | | | | | | | | | | | |
Portfolio turnover rate | | | 221 | % | | | 258 | % | | | 221 | % | | | 50 | % | | | 71 | % |
Net assets, end of period (000s omitted) | | | $966 | | | | $2,926 | | | | $3,356 | | | | $3,674 | | | | $4,488 | |
| 1 | Calculated based upon average shares outstanding |
| 2 | Amount is less than $0.005. |
| 3 | Total return calculations do not include any sales charges. |
The accompanying notes are an integral part of these financial statements.
20 | Wells Fargo Large Company Value Fund
Financial highlights
(For a share outstanding throughout each period)
| | | | | | | | | | | | |
| | | Year ended July 31 | |
| CLASS R6 | | 2019 | | | 2018 | | | 20171 | |
Net asset value, beginning of period | | | $14.59 | | | | $16.66 | | | | $16.14 | |
Net investment income | | | 0.30 | | | | 0.26 | | | | 0.03 | 2 |
Net realized and unrealized gains (losses) on investments | | | (0.14 | ) | | | 1.30 | | | | 0.49 | |
| | | | | | | | | | | | |
Total from investment operations | | | 0.16 | | | | 1.56 | | | | 0.52 | |
Distributions to shareholders from | | | | | | | | | | | | |
Net investment income | | | (0.33 | ) | | | (0.25 | ) | | | 0.00 | |
Net realized gains | | | (1.38 | ) | | | (3.38 | ) | | | 0.00 | |
| | | | | | | | | | | | |
Total distributions to shareholders | | | (1.71 | ) | | | (3.63 | ) | | | 0.00 | |
Net asset value, end of period | | | $13.04 | | | | $14.59 | | | | $16.66 | |
Total return3 | | | 1.92 | % | | | 9.88 | % | | | 3.22 | % |
Ratios to average net assets (annualized) | | | | | | | | | | | | |
Gross expenses | | | 0.55 | % | | | 0.51 | % | | | 0.49 | % |
Net expenses | | | 0.40 | % | | | 0.40 | % | | | 0.40 | % |
Net investment income | | | 2.26 | % | | | 1.73 | % | | | 0.52 | % |
Supplemental data | | | | | | | | | | | | |
Portfolio turnover rate | | | 221 | % | | | 258 | % | | | 221 | % |
Net assets, end of period (000s omitted) | | | $20 | | | | $23 | | | | $26 | |
| 1 | For the period from April 7, 2017 (commencement of class operations) to July 31, 2017 |
| 2 | Calculated based upon average shares outstanding |
| 3 | Returns for periods of less than one year are not annualized. |
The accompanying notes are an integral part of these financial statements.
Wells Fargo Large Company Value Fund | 21
Financial highlights
(For a share outstanding throughout each period)
| | | | | | | | | | | | | | | | | | | | |
| | | Year ended July 31 | |
| ADMINISTRATOR CLASS | | 2019 | | | 2018 | | | 2017 | | | 2016 | | | 2015 | |
Net asset value, beginning of period | | | $14.59 | | | | $16.66 | | | | $14.68 | | | | $16.20 | | | | $16.93 | |
Net investment income | | | 0.26 | | | | 0.20 | | | | 0. 16 | 1 | | | 0.20 | | | | 0.17 | |
Net realized and unrealized gains (losses) on investments | | | (0.14 | ) | | | 1.30 | | | | 1.94 | | | | (0.41 | ) | | | 0.78 | |
| | | | | | | | | | | | | | | | | | | | |
Total from investment operations | | | 0.12 | | | | 1.50 | | | | 2.10 | | | | (0.21 | ) | | | 0.95 | |
Distributions to shareholders from | | | | | | | | | | | | | | | | | | | | |
Net investment income | | | (0.27 | ) | | | (0.19 | ) | | | (0.12 | ) | | | (0.19 | ) | | | (0.18 | ) |
Net realized gains | | | (1.38 | ) | | | (3.38 | ) | | | 0.00 | | | | (1.12 | ) | | | (1.50 | ) |
| | | | | | | | | | | | | | | | | | | | |
Total distributions to shareholders | | | (1.65 | ) | | | (3.57 | ) | | | (0.12 | ) | | | (1.31 | ) | | | (1.68 | ) |
Net asset value, end of period | | | $13.06 | | | | $14.59 | | | | $16.66 | | | | $14.68 | | | | $16.20 | |
Total return | | | 1.61 | % | | | 9.44 | % | | | 14.35 | % | | | (0.79 | )% | | | 5.95 | % |
Ratios to average net assets (annualized) | | | | | | | | | | | | | | | | | | | | |
Gross expenses | | | 0.89 | % | | | 0.86 | % | | | 1.01 | % | | | 1.16 | % | | | 1.12 | % |
Net expenses | | | 0.75 | % | | | 0.75 | % | | | 0.87 | % | | | 0.93 | % | | | 0.85 | % |
Net investment income | | | 1.93 | % | | | 1.37 | % | | | 1.01 | % | | | 1.35 | % | | | 1.01 | % |
Supplemental data | | | | | | | | | | | | | | | | | | | | |
Portfolio turnover rate | | | 221 | % | | | 258 | % | | | 221 | % | | | 50 | % | | | 71 | % |
Net assets, end of period (000s omitted) | | | $13,854 | | | | $16,744 | | | | $18,296 | | | | $24,164 | | | | $30,177 | |
| 1 | Calculated based upon average shares outstanding |
The accompanying notes are an integral part of these financial statements.
22 | Wells Fargo Large Company Value Fund
Financial highlights
(For a share outstanding throughout each period)
| | | | | | | | | | | | | | | | | | | | |
| | | Year ended July 31 | |
| INSTITUTIONAL CLASS | | 2019 | | | 2018 | | | 2017 | | | 2016 | | | 2015 | |
Net asset value, beginning of period | | | $14.58 | | | | $16.65 | | | | $14.66 | | | | $16.17 | | | | $16.91 | |
Net investment income | | | 0.29 | 1 | | | 0.24 | | | | 0.19 | 1 | | | 0.21 | 1 | | | 0.20 | 1 |
Net realized and unrealized gains (losses) on investments | | | (0.14 | ) | | | 1.30 | | | | 1.94 | | | | (0.38 | ) | | | 0.78 | |
| | | | | | | | | | | | | | | | | | | | |
Total from investment operations | | | 0.15 | | | | 1.54 | | | | 2.13 | | | | (0.17 | ) | | | 0.98 | |
Distributions to shareholders from | | | | | | | | | | | | | | | | | | | | |
Net investment income | | | (0.31 | ) | | | (0.23 | ) | | | (0.14 | ) | | | (0.22 | ) | | | (0.22 | ) |
Net realized gains | | | (1.38 | ) | | | (3.38 | ) | | | 0.00 | | | | (1.12 | ) | | | (1.50 | ) |
| | | | | | | | | | | | | | | | | | | | |
Total distributions to shareholders | | | (1.69 | ) | | | (3.61 | ) | | | (0.14 | ) | | | (1.34 | ) | | | (1.72 | ) |
Net asset value, end of period | | | $13.04 | | | | $14.58 | | | | $16.65 | | | | $14.66 | | | | $16.17 | |
Total return | | | 1.86 | % | | | 9.77 | % | | | 14.61 | % | | | (0.54 | )% | | | 6.14 | % |
Ratios to average net assets (annualized) | | | | | | | | | | | | | | | | | | | | |
Gross expenses | | | 0.63 | % | | | 0.62 | % | | | 0.74 | % | | | 0.91 | % | | | 0.85 | % |
Net expenses | | | 0.50 | % | | | 0.50 | % | | | 0.61 | % | | | 0.74 | % | | | 0.65 | % |
Net investment income | | | 2.14 | % | | | 1.60 | % | | | 1.21 | % | | | 1.52 | % | | | 1.23 | % |
Supplemental data | | | | | | | | | | | | | | | | | | | | |
Portfolio turnover rate | | | 221 | % | | | 258 | % | | | 221 | % | | | 50 | % | | | 71 | % |
Net assets, end of period (000s omitted) | | | $2,948 | | | | $17,606 | | | | $16,321 | | | | $9,343 | | | | $1,483 | |
| 1 | Calculated based upon average shares outstanding |
The accompanying notes are an integral part of these financial statements.
Wells Fargo Large Company Value Fund | 23
Notes to financial statements
1. ORGANIZATION
Wells Fargo Funds Trust (the “Trust”), a Delaware statutory trust organized on March 10, 1999, is an open-end management investment company registered under the Investment Company Act of 1940, as amended (the “1940 Act”). As an investment company, the Trust follows the accounting and reporting guidance in Financial Accounting Standards Board (“FASB”) Accounting Standards Codification Topic 946, Financial Services – Investment Companies. These financial statements report on the Wells Fargo Large Company Value Fund (the “Fund”) which is a diversified series of the Trust.
2. SIGNIFICANT ACCOUNTING POLICIES
The following significant accounting policies, which are consistently followed in the preparation of the financial statements of the Fund, are in conformity with U.S. generally accepted accounting principles which require management to make estimates and assumptions that affect the reported amounts of assets and liabilities, disclosure of contingent assets and liabilities at the date of the financial statements, and the reported amounts of revenues and expenses during the reporting period. Actual results could differ from those estimates.
Securities valuation
All investments are valued each business day as of the close of regular trading on the New York Stock Exchange (generally 4 p.m. Eastern Time), although the Fund may deviate from this calculation time under unusual or unexpected circumstances.
Equity securities and futures contracts that are listed on a foreign or domestic exchange or market are valued at the official closing price or, if none, the last sales price. If no sale occurs on the principal exchange or market that day, a fair value price will be determined in accordance with the Fund’s Valuation Procedures.
Investments in registered open-end investment companies are valued at net asset value.
Investments which are not valued using any of the methods discussed above are valued at their fair value, as determined in good faith by the Board of Trustees of the Fund. The Board of Trustees has established a Valuation Committee comprised of the Trustees and has delegated to it the authority to take any actions regarding the valuation of portfolio securities that the Valuation Committee deems necessary or appropriate, including determining the fair value of portfolio securities, unless the determination has been delegated to the Wells Fargo Asset Management Pricing Committee at Wells Fargo Funds Management, LLC (“Funds Management”). The Board of Trustees retains the authority to make or ratify any valuation decisions or approve any changes to the Valuation Procedures as it deems appropriate. On a quarterly basis, the Board of Trustees receives reports on any valuation actions taken by the Valuation Committee or the Wells Fargo Asset Management Pricing Committee which may include items for ratification.
Foreign currency translation
The accounting records of the Fund are maintained in U.S. dollars. The values of other assets and liabilities denominated in foreign currencies are translated into U.S. dollars at rates provided by an independent foreign currency pricing source at a time each business day specified by the Wells Fargo Asset Management Pricing Committee. Purchases and sales of securities, and income and expenses are converted at the rate of exchange on the respective dates of such transactions. Net realized foreign exchange gains or losses arise from sales of foreign currencies, currency gains or losses realized between the trade and settlement dates on securities transactions, and the difference between the amounts of dividends, interest and foreign withholding taxes recorded and the U.S. dollar equivalent of the amounts actually paid or received. Net unrealized foreign exchange gains and losses arise from changes in the fair value of assets and liabilities other than investments in securities resulting from changes in exchange rates. The changes in net assets arising from changes in exchange rates of securities and the changes in net assets resulting from changes in market prices of securities are not separately presented. Such changes are included in net realized and unrealized gains or losses from investments.
Futures contracts
Futures contracts are agreements between the Fund and a counterparty to buy or sell a specific amount of a commodity, financial instrument or currency at a specified price and on a specified date. The Fund may buy and sell futures contracts in order to gain exposure to, or protect against, changes in security values and is subject to equity price risk. The primary risks associated with the use of futures contracts are the imperfect correlation between changes in market values of securities held by the Fund and the prices of futures contracts, and the possibility of an illiquid market. Futures contracts are generally entered into on a regulated futures exchange and cleared through a clearinghouse associated with the exchange. With futures contracts, there is minimal counterparty risk to the Fund since futures contracts are exchange traded and the exchange’s clearinghouse, as the counterparty to all exchange traded futures, guarantees the futures contracts against default.
24 | Wells Fargo Large Company Value Fund
Notes to financial statements
Upon entering into a futures contracts, the Fund is required to deposit either cash or securities (initial margin) with the broker in an amount equal to a certain percentage of the contract value. Subsequent payments (variation margin) are paid to or from the broker each day equal to the daily changes in the contract value. Such payments are recorded as unrealized gains or losses and, if any, shown as variation margin receivable (payable) in the Statement of Assets and Liabilities. Should the Fund fail to make requested variation margin payments, the broker can gain access to the initial margin to satisfy the Fund’s payment obligations. When the contracts are closed, a realized gain or loss is recorded in the Statement of Operations.
Security transactions and income recognition
Securities transactions are recorded on a trade date basis. Realized gains or losses are recorded on the basis of identified cost.
Dividend income is recognized on the ex-dividend date. Dividend income is recorded net of foreign taxes withheld where recovery of such taxes is not assured.
Distributions to shareholders
Distributions to shareholders are recorded on the ex-dividend date and paid from net investment income quarterly and any net realized gains are paid at least annually. Such distributions are determined in accordance with income tax regulations and may differ from U.S. generally accepted accounting principles. Dividend sources are estimated at the time of declaration. The tax character of distributions is determined as of the Fund’s fiscal year end. Therefore, a portion of the Fund’s distributions made prior to the Fund’s fiscal year end may be categorized as a tax return of capital at year end.
Federal and other taxes
The Fund intends to continue to qualify as a regulated investment company by distributing substantially all of its investment company taxable income and any net realized capital gains (after reduction for capital loss carryforwards) sufficient to relieve it from all, or substantially all, federal income taxes. Accordingly, no provision for federal income taxes was required.
The Fund’s income and federal excise tax returns and all financial records supporting those returns for the prior three fiscal years are subject to examination by the federal and Delaware revenue authorities. Management has analyzed the Fund’s tax positions taken on federal, state, and foreign tax returns for all open tax years and does not believe that there are any uncertain tax positions that require recognition of a tax liability.
As of July 31, 2019, the aggregate cost of all investments for federal income tax purposes was $195,533,541 and the unrealized gains (losses) consisted of:
| | | | |
| |
Gross unrealized gains | | $ | 22,042,445 | |
| |
Gross unrealized losses | | | (4,604,570 | ) |
| |
Net unrealized gains | | $ | 17,437,875 | |
Reclassifications are made to the Fund’s capital accounts for permanent tax differences to reflect income and gains available for distribution (or available capital loss carryforwards) under federal income tax regulations. U.S. generally accepted accounting principles require that certain components of net assets be adjusted to reflect permanent differences between financial and tax reporting. These reclassifications have no effect on net assets or net asset values per share. At July 31, 2019, as a result of permanent book-to-tax differences, the following reclassification adjustments were made on the Statement of Assets and Liabilities:
| | |
| Paid-in capital | | Total distributable
earnings |
| |
| $47,830 | | $(47,830) |
As of July 31, 2019, the Fund had current year net deferred post-October capital losses consisting of $2,430,946 in short-term losses which will be recognized on the first day of the following fiscal year.
Class allocations
The separate classes of shares offered by the Fund differ principally in applicable sales charges, distribution, shareholder servicing, and administration fees. Class specific expenses are charged directly to that share class. Investment income, common fund-level expenses, and realized and unrealized gains (losses) on investments are allocated daily to each class of shares based on the relative proportion of net assets of each class.
Wells Fargo Large Company Value Fund | 25
Notes to financial statements
3. FAIR VALUATION MEASUREMENTS
Fair value measurements of investments are determined within a framework that has established a fair value hierarchy based upon the various data inputs utilized in determining the value of the Fund’s investments. The three-level hierarchy gives the highest priority to unadjusted quoted prices in active markets for identical assets or liabilities (Level 1) and the lowest priority to unobservable inputs (Level 3). The Fund’s investments are classified within the fair value hierarchy based on the lowest level of input that is significant to the fair value measurement. The inputs are summarized into three broad levels as follows:
| ∎ | | Level 1 – quoted prices in active markets for identical securities |
| ∎ | | Level 2 – other significant observable inputs (including quoted prices for similar securities, interest rates, prepayment speeds, credit risk, etc.) |
| ∎ | | Level 3 – significant unobservable inputs (including the Fund’s own assumptions in determining the fair value of investments) |
The inputs or methodologies used for valuing investments in securities are not necessarily an indication of the risk associated with investing in those securities.
The following is a summary of the inputs used in valuing the Fund’s assets and liabilities as of July 31, 2019:
| | | | | | | | | | | | | | | | |
| | | | |
| | | Quoted prices
(Level 1) | | | Other significant
observable inputs
(Level 2) | | | Significant
unobservable inputs (Level 3) | | | Total | |
| | | | |
Assets | | | | | | | | | | | | | | | | |
Investments in: | | | | | | | | | | | | | | | | |
| | | | |
Common stocks | | | | | | | | | | | | | | | | |
| | | | |
Communication services | | $ | 21,827,040 | | | $ | 0 | | | $ | 0 | | | $ | 21,827,040 | |
| | | | |
Consumer discretionary | | | 9,837,757 | | | | 0 | | | | 0 | | | | 9,837,757 | |
| | | | |
Consumer staples | | | 23,806,982 | | | | 0 | | | | 0 | | | | 23,806,982 | |
| | | | |
Energy | | | 12,828,145 | | | | 0 | | | | 0 | | | | 12,828,145 | |
| | | | |
Financials | | | 41,194,888 | | | | 0 | | | | 0 | | | | 41,194,888 | |
| | | | |
Health care | | | 34,735,865 | | | | 0 | | | | 0 | | | | 34,735,865 | |
| | | | |
Industrials | | | 17,280,720 | | | | 0 | | | | 0 | | | | 17,280,720 | |
| | | | |
Information technology | | | 18,879,050 | | | | 0 | | | | 0 | | | | 18,879,050 | |
| | | | |
Materials | | | 5,668,897 | | | | 0 | | | | 0 | | | | 5,668,897 | |
| | | | |
Real estate | | | 11,676,529 | | | | 0 | | | | 0 | | | | 11,676,529 | |
| | | | |
Utilities | | | 13,592,278 | | | | 0 | | | | 0 | | | | 13,592,278 | |
| | | | |
Short-term investments | | | | | | | | | | | | | | | | |
| | | | |
Investment companies | | | 1,645,324 | | | | 0 | | | | 0 | | | | 1,645,324 | |
| | | | |
Total assets | | $ | 212,973,475 | | | $ | 0 | | | $ | 0 | | | $ | 212,973,475 | |
| | | | |
Liabilities | | | | | | | | | | | | | | | | |
| | | | |
Futures contracts | | $ | 2,059 | | | $ | 0 | | | $ | 0 | | | $ | 2,059 | |
| | | | |
Total liabilities | | $ | 2,059 | | | $ | 0 | | | $ | 0 | | | $ | 2,059 | |
Additional sector, industry or geographic detail is included in the Portfolio of Investments.
Futures contracts are reported at their cumulative unrealized gains (losses) at measurement date as reported in the table following the Portfolio of Investments. For futures contracts the current day’s variation margin is reported on the Statement of Assets and Liabilities. All other assets and liabilities are reported at their market value at measurement date.
For the year ended July 31, 2019, the Fund did not have any transfers into/out of Level 3.
4. TRANSACTIONS WITH AFFILIATES
Management fee
Funds Management, an indirect wholly owned subsidiary of Wells Fargo & Company (“Wells Fargo”), is the manager of the Fund and provides advisory and fund-level administrative services under an investment management agreement. Under the investment management agreement, Funds Management is responsible for, among other services, implementing the investment objectives and
26 | Wells Fargo Large Company Value Fund
Notes to financial statements
strategies of the Fund, supervising the subadviser and providing fund-level administrative services in connection with the Fund’s operations. As compensation for its services under the investment management agreement, Funds Management is entitled to receive a management fee at the following annual rate based on the Fund’s average daily net assets:
| | | | |
| |
| Average daily net assets | | Management fee | |
| |
First $1 billion | | | 0.400 | % |
| |
Next $4 billion | | | 0.375 | |
| |
Next $5 billion | | | 0.340 | |
| |
Over $10 billion | | | 0.330 | |
For the year ended July 31, 2019, the management fee was equivalent to an annual rate of 0.40% of the Fund’s average daily net assets.
Funds Management has retained the services of a subadviser to provide daily portfolio management to the Fund. The fee for subadvisory services is borne by Funds Management. Wells Capital Management Incorporated (“Wells Cap”), an affiliate of Funds Management and an indirect wholly owned subsidiary of Wells Fargo, is the subadviser to the Fund and is entitled to receive a fee from Funds Management at an annual rate starting at 0.25% and declining to 0.15% as the average daily net assets of the Fund increase. Prior to November 1, 2018, Analytic Investors, LLC served as the subadviser and received an annual fee from Funds Management at the same rates. On November 1, 2018, Analytic Investors, LLC was consolidated into WellsCap.
Administration fees
Under a class-level administration agreement, Funds Management provides class-level administrative services to the Fund, which includes paying fees and expenses for services provided by the transfer agent, sub-transfer agents, omnibus account servicers and record-keepers. As compensation for its services under the class-level administration agreement, Funds Management receives an annual fee which is calculated based on the average daily net assets of each class as follows:
| | | | |
| |
| | | Class-level
administration fee | |
| |
Class A, Class C | | | 0.21 | % |
| |
Class R6 | | | 0.03 | |
| |
Administrator Class, Institutional Class | | | 0.13 | |
Waivers and/or expense reimbursements
Funds Management has contractually waived and/or reimbursed management and administration fees to the extent necessary to maintain certain net operating expense ratios for the Fund. When each class of the Fund has exceeded its expense cap, Funds Management has waived fees and/or reimbursed expenses from fund-level expenses on a proportionate basis and then from class specific expenses. When only certain classes exceed their expense caps, waivers and/or reimbursements are applied against class specific expenses before fund-level expenses. Funds Management has committed through November 30, 2019 to waive fees and/or reimburse expenses to the extent necessary to cap the Fund’s expenses at 0.83% for Class A shares, 1.58% for Class C shares, 0.40% for Class R6 shares, 0.75% for Administrator Class shares and 0.50% for Institutional Class shares. Prior to or after the commitment expiration date, the cap may be increased or the commitment to maintain the cap may be terminated only with the approval of the Board of Trustees.
Distribution fee
The Trust has adopted a distribution plan for Class C shares of the Fund pursuant to Rule 12b-1 under the 1940 Act. A distribution fee is charged to Class C shares and paid to Wells Fargo Funds Distributor, LLC (“Funds Distributor”), the principal underwriter, at an annual rate of 0.75% of the average daily net assets of Class C shares.
In addition, Funds Distributor is entitled to receive the front-end sales charge from the purchase of Class A shares and a contingent deferred sales charge on the redemption of certain Class A shares. Funds Distributor is also entitled to receive the contingent deferred sales charges from redemptions of Class C shares. For the year ended July 31, 2019, Funds Distributor received $1,599 from the sale of Class A shares. No contingent deferred sales charges were incurred by Class A and Class C shares for the year ended July 31, 2019.
Shareholder servicing fees
The Trust has entered into contracts with one or more shareholder servicing agents, whereby Class A, Class C, and Administrator Class of the Fund are charged a fee at an annual rate of 0.25% of the average daily net assets of each respective class. A portion of these total shareholder servicing fees were paid to affiliates of Wells Fargo.
Wells Fargo Large Company Value Fund | 27
Notes to financial statements
Interfund transactions
The Fund may purchase or sell portfolio investment securities to certain other Wells Fargo affiliates pursuant to Rule 17a-7 under the 1940 Act and under procedures adopted by the Board of Trustees. The procedures have been designed to ensure that these interfund transactions, which do not incur broker commissions, are effected at current market prices.
5. INVESTMENT PORTFOLIO TRANSACTIONS
Purchases and sales of investments, excluding U.S. government obligations (if any) and short-term securities, for the year ended July 31, 2019 were $491,579,600 and $523,159,216, respectively.
6. DERIVATIVE TRANSACTIONS
During the year ended July 31, 2019, the Fund entered into futures contracts to gain market exposure. The Fund had an average notional amount of $4,748,998 in long futures contracts during the year ended July 31, 2019.
The fair value, realized gains or losses and change in unrealized gains or losses, if any, on derivative instruments are reflected in the corresponding financial statement captions.
7. BANK BORROWINGS
The Trust (excluding the money market funds), Wells Fargo Master Trust and Wells Fargo Variable Trust are parties to a $280,000,000 revolving credit agreement whereby the Fund is permitted to use bank borrowings for temporary or emergency purposes, such as to fund shareholder redemption requests. Interest under the credit agreement is charged to the Fund based on a borrowing rate equal to the higher of the Federal Funds rate in effect on that day plus 1.25% or the overnight LIBOR rate in effect on that day plus 1.25%. In addition, an annual commitment fee equal to 0.25% of the unused balance is allocated to each participating fund.
During the year ended July 31, 2019, the Fund had average borrowings outstanding of $14,718 at an average rate of 3.73% and paid interest in the amount of $549.
8. DISTRIBUTIONS TO SHAREHOLDERS
The tax character of distributions paid during the years ended July 31, 2019 and July 31, 2018 were as follows:
| | | | | | | | |
| | | Year ended July 31 | |
| | |
| | | 2019 | | | 2018 | |
| | |
Ordinary income | | $ | 21,161,855 | | | $ | 6,104,081 | |
| | |
Long-term capital gain | | | 6,495,882 | | | | 47,820,813 | |
As of July 31, 2019, the components of distributable earnings on a tax basis were as follows:
| | | | |
Undistributed
ordinary
income | | Unrealized
gains | | Post-October
capital losses
deferred |
| | |
| $516,275 | | $17,437,875 | | $(2,430,946) |
Effective for all filings after November 4, 2018, the Securities and Exchange Commission eliminated the requirement to separately state the components of distributions to shareholders under U.S. generally accepted accounting principles. The amounts of distributions to shareholders for the year ended July 31, 2018 were as follows:
| | | | | | | | |
| | |
| | | Net investment
income | | | Net realized
gains | |
| | |
Class A | | | $2,599,881 | | | | $43,429,588 | |
| | |
Class C | | | 11,926 | | | | 647,269 | |
| | |
Class R6 | | | 420 | | | | 6,236 | |
| | |
Administrator Class | | | 218,142 | | | | 3,454,920 | |
| | |
Institutional Class | | | 253,844 | | | | 3,302,668 | |
28 | Wells Fargo Large Company Value Fund
Notes to financial statements
9. INDEMNIFICATION
Under the Trust’s organizational documents, the officers and Trustees have been granted certain indemnification rights against certain liabilities that may arise out of performance of their duties to the Trust. Additionally, in the normal course of business, the Trust may enter into contracts with service providers that contain a variety of indemnification clauses. The Trust’s maximum exposure under these arrangements is dependent on future claims that may be made against the Fund and, therefore, cannot be estimated.
10. NEW ACCOUNTING PRONOUNCEMENT
In August 2018, FASB issued Accounting Standards Update (“ASU”) No. 2018-13, Fair Value Measurement (Topic 820)Disclosure Framework—Changes to the Disclosure Requirements for Fair Value Measurement. ASU 2018-13 updates the disclosure requirements for fair value measurements by modifying or removing certain disclosures and adding certain new disclosures. The amendments are effective for fiscal years, and interim periods within those fiscal years, beginning after December 15, 2019. Early adoption is permitted. Management has adopted the removal and modification of disclosures early, as permitted, and will adopt the additional new disclosures at the effective date.
Wells Fargo Large Company Value Fund | 29
Report of independent registered public accounting firm
TO THE SHAREHOLDERS OF THE FUND AND BOARD OF TRUSTEES OF WELLS FARGO FUNDS TRUST:
Opinion on the Financial Statements
We have audited the accompanying statement of assets and liabilities of Wells Fargo Large Company Value Fund (the Fund), one of the funds constituting Wells Fargo Funds Trust, including the portfolio of investments, as of July 31, 2019, the related statement of operations for the year then ended, the statements of changes in net assets for each of the years in the two-year period then ended, and the related notes (collectively, the financial statements) and the financial highlights for each of the years or periods in the five-year period then ended. In our opinion, the financial statements and financial highlights present fairly, in all material respects, the financial position of the Fund as of July 31, 2019, the results of its operations for the year then ended, the changes in its net assets for each of the years in the two-year period then ended, and the financial highlights for each of the years or periods in the five-year period then ended, in conformity with U.S. generally accepted accounting principles.
Basis for Opinion
These financial statements and financial highlights are the responsibility of the Fund’s management. Our responsibility is to express an opinion on these financial statements and financial highlights based on our audits. We are a public accounting firm registered with the Public Company Accounting Oversight Board (United States) (PCAOB) and are required to be independent with respect to the Fund in accordance with the U.S. federal securities laws and the applicable rules and regulations of the Securities and Exchange Commission and the PCAOB.
We conducted our audits in accordance with the standards of the PCAOB. Those standards require that we plan and perform the audit to obtain reasonable assurance about whether the financial statements and financial highlights are free of material misstatement, whether due to error or fraud. Our audits included performing procedures to assess the risks of material misstatement of the financial statements and financial highlights, whether due to error or fraud, and performing procedures that respond to those risks. Such procedures included examining, on a test basis, evidence regarding the amounts and disclosures in the financial statements and financial highlights. Such procedures also included confirmation of securities owned as of July 31, 2019, by correspondence with the custodian, transfer agent and brokers. Our audits also included evaluating the accounting principles used and significant estimates made by management, as well as evaluating the overall presentation of the financial statements and financial highlights. We believe that our audits provide a reasonable basis for our opinion.

We have not been able to determine the specific year that we began serving as the auditor of one or more Wells Fargo Funds investment companies; however we are aware that we have served as the auditor of one or more Wells Fargo Funds investment companies since at least 1955.
Boston, Massachusetts
September 25, 2019
30 | Wells Fargo Large Company Value Fund
Other information (unaudited)
TAX INFORMATION
For corporate shareholders, pursuant to Section 854 of the Internal Revenue Code, 34.33% of ordinary income dividends qualify for the corporate dividends-received deduction for the fiscal year ended July 31, 2019.
Pursuant to Section 852 of the Internal Revenue Code, $6,495,882 was designated as a 20% rate gain distribution for the fiscal year ended July 31, 2019.
Pursuant to Section 854 of the Internal Revenue Code, $7,183,269 of income dividends paid during the fiscal year ended July 31, 2019, has been designated as qualified dividend income (QDI).
For the fiscal year ended July 31, 2019, $67,582 has been designated as interest-related dividends for nonresident alien shareholders pursuant to Section 871 of the Internal Revenue Code.
For the fiscal year ended July 31, 2019, $16,686,503 has been designated as short-term capital gain dividends for nonresident alien shareholders pursuant to Section 871 of the Internal Revenue Code.
PROXY VOTING INFORMATION
A description of the policies and procedures used to determine how to vote proxies relating to portfolio securities is available, upon request, by calling1-800-222-8222, visiting our website atwfam.com, or visiting the SEC website at sec.gov. Information regarding how the proxies related to portfolio securities were voted during the most recent 12-month period ended June 30 is available on the website atwfam.comor by visiting the SEC website at sec.gov.
QUARTERLY PORTFOLIO HOLDINGS INFORMATION
The Fund files its complete schedule of portfolio holdings with the SEC for the first and third quarters of each fiscal year on Form N-Q or Form N-PORT, which is available by visiting the SEC website at sec.gov. Those forms may be reviewed and copied at the SEC’s Public Reference Room in Washington, DC. Information on the operation of the Public Reference Room may be obtained by calling 1-800-SEC-0330.
Wells Fargo Large Company Value Fund | 31
Other information (unaudited)
BOARD OF TRUSTEES AND OFFICERS
Each of the Trustees and Officers1 listed in the table below acts in identical capacities for each fund in the Wells Fargo family of funds, which consists of 152 mutual funds comprising the Wells Fargo Funds Trust, Wells Fargo Variable Trust, Wells Fargo Master Trust and four closed-end funds (collectively the “Fund Complex”). This table should be read in conjunction with the Prospectus and the Statement of Additional Information2. The mailing address of each Trustee and Officer is 525 Market Street, 12th Floor, San Francisco, CA 94105. Each Trustee and Officer serves an indefinite term, however, each Trustee serves such term until reaching the mandatory retirement age established by the Trustees.
Independent Trustees
| | | | | | |
Name and
year of birth | | Position held and
length of service* | | Principal occupations during past five years or longer | | Current other
public company or
investment
company
directorships |
| | | |
| William R. Ebsworth (Born 1957) | | Trustee, since 2015 | | Retired. From 1984 to 2013, equities analyst, portfolio manager, research director and chief investment officer at Fidelity Management and Research Company in Boston, Tokyo, and Hong Kong, and retired in 2013 as Chief Investment Officer of Fidelity Strategic Advisers, Inc. where he led a team of investment professionals managing client assets. Prior thereto, Board member of Hong Kong Securities Clearing Co., Hong Kong Options Clearing Corp., the Thailand International Fund, Ltd., Fidelity Investments Life Insurance Company, and Empire Fidelity Investments Life Insurance Company. Audit Committee Chair and Investment Committee Chair of the Vincent Memorial Hospital Endowment (non-profit organization). Mr. Ebsworth is a CFA® charterholder. | | N/A |
| | | |
| Jane A. Freeman (Born 1953) | | Trustee, since 2015; Chair Liaison, since 2018 | | Retired. From 2012 to 2014 and 1999 to 2008, Chief Financial Officer of Scientific Learning Corporation. From 2008 to 2012, Ms. Freeman provided consulting services related to strategic business projects. Prior to 1999, Portfolio Manager at Rockefeller & Co. and Scudder, Stevens & Clark. Board member of the Harding Loevner Funds from 1996 to 2014, serving as both Lead Independent Director and chair of the Audit Committee. Board member of the Russell Exchange Traded Funds Trust from 2011 to 2012 and the chair of the Audit Committee. Ms. Freeman is a Board Member of The Ruth Bancroft Garden (non-profit organization). She is also an inactive Chartered Financial Analyst. | | N/A |
| | | |
| Isaiah Harris, Jr. (Born 1952) | | Trustee, since 2009; Audit Committee Chairman, since 2019 | | Retired. Chairman of the Board of CIGNA Corporation since 2009, and Director since 2005. From 2003 to 2011, Director of Deluxe Corporation. Prior thereto, President and CEO of BellSouth Advertising and Publishing Corp. from 2005 to 2007, President and CEO of BellSouth Enterprises from 2004 to 2005 and President of BellSouth Consumer Services from 2000 to 2003. Emeritus member of the Iowa State University Foundation Board of Governors. Emeritus Member of the Advisory Board of Iowa State University School of Business. Advisory Board Member, Palm Harbor Academy (private school). Advisory Board Member, Child Evangelism Fellowship (non-profit). Mr. Harris is a certified public accountant (inactive status). | | CIGNA Corporation |
| | | |
| Judith M. Johnson (Born 1949) | | Trustee, since 2008; Audit Committee Chairman, from 2009 to 2018 | | Retired. Prior thereto, Chief Executive Officer and Chief Investment Officer of Minneapolis Employees Retirement Fund from 1996 to 2008. Ms. Johnson is an attorney, certified public accountant and a certified managerial accountant. | | N/A |
32 | Wells Fargo Large Company Value Fund
Other information (unaudited)
| | | | | | |
Name and
year of birth | | Position held and
length of service* | | Principal occupations during past five years or longer | | Current other
public company or
investment
company
directorships |
| | | |
| David F. Larcker (Born 1950) | | Trustee, since 2009 | | James Irvin Miller Professor of Accounting at the Graduate School of Business, Stanford University, Director of the Corporate Governance Research Initiative and Senior Faculty of The Rock Center for Corporate Governance since 2006. From 2005 to 2008, Professor of Accounting at the Graduate School of Business, Stanford University. Prior thereto, Ernst & Young Professor of Accounting at The Wharton School, University of Pennsylvania from 1985 to 2005. | | N/A |
| | | |
| Olivia S. Mitchell (Born 1953) | | Trustee, since 2006; Nominating and Governance Committee Chairman, since 2018 | | International Foundation of Employee Benefit Plans Professor, Wharton School of the University of Pennsylvania since 1993. Director of Wharton’s Pension Research Council and Boettner Center on Pensions & Retirement Research, and Research Associate at the National Bureau of Economic Research. Previously, Cornell University Professor from 1978 to 1993. | | N/A |
| | | |
| Timothy J. Penny (Born 1951) | | Trustee, since 1996; Chairman, since 2018 | | President and Chief Executive Officer of Southern Minnesota Initiative Foundation, a non-profit organization, since 2007. Member of the Board of Trustees of NorthStar Education Finance, Inc., a non-profit organization, since 2007. | | N/A |
| | | |
| James G. Polisson (Born 1959) | | Trustee, since 2018 | | Retired. Chief Marketing Officer, Source (ETF) UK Services, Ltd, from 2015 to 2017. From 2012 to 2015, Principal of The Polisson Group, LLC, a management consulting, corporate advisory and principal investing company. Chief Executive Officer and Managing Director at Russell Investments, Global Exchange Traded Funds from 2010 to 2012. Managing Director of Barclays Global Investors from 1998 to 2010 and Global Chief Marketing Officer for iShares and Barclays Global Investors from 2000 to 2010. Trustee of the San Francisco Mechanics’ Institute, a non-profit organization, from 2013 to 2015. Board member of the Russell Exchange Traded Fund Trust from 2011 to 2012. Director of Barclays Global Investors Holdings Deutschland GmbH from 2006 to 2009. Mr. Polisson is an attorney and has a retired status with the Massachusetts and District of Columbia Bar Associations. | | N/A |
| * | Length of service dates reflect the Trustee’s commencement of service with the Trust’s predecessor entities, where applicable. |
Wells Fargo Large Company Value Fund | 33
Other information (unaudited)
Officers
| | | | |
Name and
year of birth | | Position held and
length of service | | Principal occupations during past five years or longer |
| | |
Andrew Owen
(Born 1960) | | President, since 2017 | | Executive Vice President of Wells Fargo & Company and Head of Affiliated Managers, Wells Fargo Asset Management, since 2014. In addition, Mr. Owen is currently President, Chief Executive Officer and Director of Wells Fargo Funds Management, LLC since 2017. Prior thereto, Executive Vice President responsible for marketing, investments and product development for Wells Fargo Funds Management, LLC, from 2009 to 2014. |
| | |
Jeremy DePalma1
(Born 1974) | | Treasurer, since 2012 | | Senior Vice President of Wells Fargo Funds Management, LLC since 2009. Senior Vice President of Evergreen Investment Management Company, LLC from 2008 to 2010 and head of the Fund Reporting and Control Team within Fund Administration from 2005 to 2010. |
| | |
Alexander Kymn
(Born 1973) | | Secretary and Chief Legal Officer, since 2018 | | Senior Company Counsel of Wells Fargo Bank, N.A. since 2018 (previously Senior Counsel from 2007 to 2018). Vice President of Wells Fargo Funds Management, LLC from 2008 to 2014. |
| | |
Michael H. Whitaker
(Born 1967) | | Chief Compliance Officer, since 2016 | | Senior Vice President and Chief Compliance Officer since 2016. Senior Vice President and Chief Compliance Officer for Fidelity Investments from 2007 to 2016. |
| | |
David Berardi
(Born 1975) | | Assistant Treasurer, since 2009 | | Vice President of Wells Fargo Funds Management, LLC since 2009. Vice President of Evergreen Investment Management Company, LLC from 2008 to 2010. Manager of Fund Reporting and Control for Evergreen Investment Management Company, LLC from 2004 to 2010. |
| 1 | Jeremy DePalma acts as Treasurer of 87 funds and Assistant Treasurer of 65 funds in the Fund Complex. |
| 2 | The Statement of Additional Information includes additional information about the Trustees and is available, without charge, upon request, by calling1-800-222-8222 or by visiting the website atwfam.com. |
34 | Wells Fargo Large Company Value Fund
Other information (unaudited)
BOARD CONSIDERATION OF INVESTMENT MANAGEMENT AND SUB-ADVISORY AGREEMENTS:
Wells Fargo Large Company Value Fund
Under the Investment Company Act of 1940 (the “1940 Act”), the Board of Trustees (the “Board”) of Wells Fargo Funds Trust (the “Trust”) must determine annually whether to approve the continuation of the Trust’s investment management and sub-advisory agreements. In this regard, at an in-person meeting held on May 21-22, 2019 (the “Meeting”), the Board, all the members of which have no direct or indirect interest in the investment management and sub-advisory agreements and are not “interested persons” of the Trust, as defined in the 1940 Act (the “Independent Trustees”), reviewed and approved for Wells Fargo Large Company Value Fund (the “Fund”): (i) an investment management agreement (the “Management Agreement”) with Wells Fargo Funds Management, LLC (“Funds Management”); and (ii) an investment sub-advisory agreement (the “Sub-Advisory Agreement”) with Wells Capital Management Incorporated (the “Sub-Adviser”), an affiliate of Funds Management. The Management Agreement and the Sub-Advisory Agreement are collectively referred to as the “Advisory Agreements.”
At the Meeting, the Board considered the factors and reached the conclusions described below relating to the selection of Funds Management and the Sub-Adviser and the approval of the Advisory Agreements. Prior to the Meeting, including at an in-person meeting in April 2019, the Trustees conferred extensively among themselves and with representatives of Funds Management about these matters. Also, the Board has adopted a team-based approach, with each team consisting of a sub-set of Trustees, to assist the full Board in the discharge of its duties in reviewing investment performance and other matters throughout the year. The Independent Trustees were assisted in their evaluation of the Advisory Agreements by independent legal counsel, from whom they received separate legal advice and with whom they met separately.
In providing information to the Board, Funds Management and the Sub-Adviser were guided by a detailed set of requests for information submitted to them by independent legal counsel on behalf of the Independent Trustees at the start of the Board’s annual contract renewal process earlier in 2019. In considering and approving the Advisory Agreements, the Trustees considered the information they believed relevant, including but not limited to the information discussed below. The Board considered not only the specific information presented in connection with the Meeting, but also the knowledge gained over time through interaction with Funds Management and the Sub-Adviser about various topics. In this regard, the Board reviewed reports of Funds Management at each of its quarterly meetings, which included, among other things, portfolio reviews and investment performance reports. In addition, the Board and the teams mentioned above confer with portfolio managers at various times throughout the year. The Board did not identify any particular information or consideration that was all-important or controlling, and each individual Trustee may have attributed different weights to various factors.
After its deliberations, the Board unanimously approved the continuation of the Advisory Agreements for a one-year term and determined that the compensation payable to Funds Management and the Sub-Adviser under each of the Advisory Agreements was reasonable. The Board considered the approval of the Advisory Agreements for the Fund as part of its consideration of agreements for funds across the complex, but its approvals were made on a fund-by-fund basis. The following summarizes a number of important, but not necessarily all, factors considered by the Board in support of its approvals.
Nature, extent and quality of services
The Board received and considered various information regarding the nature, extent and quality of services provided to the Fund by Funds Management and the Sub-Adviser under the Advisory Agreements. This information included a description of the investment advisory services and Fund-level administrative services covered by the Management Agreement, as well as, among other things, a summary of the background and experience of senior management of Wells Fargo Asset Management (“WFAM”), of which Funds Management and the Sub-Adviser are a part, a summary of investments made in the business of WFAM, a summary of certain organizational and personnel changes involving Funds Management and the Sub-Adviser, and a description of Funds Management’s and the Sub-Adviser’s business continuity planning programs and of their approaches to data privacy and cybersecurity. The Board received and reviewed information about Funds Management’s role as administrator of the Fund’s liquidity risk management program. The Board also considered the qualifications, background, tenure and responsibilities of each of the portfolio managers primarily responsible for the day-to-day portfolio management of the Fund.
The Board evaluated the ability of Funds Management and the Sub-Adviser to attract and retain qualified investment professionals, including research, advisory and supervisory personnel. The Board further considered the compliance programs and compliance records of Funds Management and the Sub-Adviser. In addition, the Board took into account the full range of services provided to the Fund by Funds Management and its affiliates.
Wells Fargo Large Company Value Fund | 35
Other information (unaudited)
Fund investment performance and expenses
The Board considered the investment performance results for the Fund over various time periods ended December 31, 2018. The Board considered these results in comparison to the investment performance of funds in a universe that was determined by Broadridge Inc. (“Broadridge”) to be similar to the Fund (the “Universe”), and in comparison to the Fund’s benchmark index and to other comparative data. Broadridge is an independent provider of investment company data. The Board received a description of the methodology used by Broadridge to select the mutual funds in the performance Universe. The Board noted that the investment performance of the Fund (Administrator Class) was lower than the average investment performance of the Universe for all periods under review. The Board also noted that the investment performance of the Fund was lower than its benchmark index, the Russell 1000® Value Index, for all periods under review.
The Board received information concerning, and discussed factors contributing to, the underperformance of the Fund relative to the Universe and benchmark for the periods identified above. The Board took note of the explanations for the relative underperformance during these periods, including with respect to investment decisions and market factors that affected the Fund’s investment performance. The Board also took note that the Sub-Adviser began serving as sub-adviser to the Fund as of February 1, 2017, and that investment performance information for the Fund for periods prior to February 1, 2017 does not reflect the investment performance of the Sub-Adviser or changes to its investment strategy that became effective on February 1, 2017.
The Board also received and considered information regarding the Fund’s net operating expense ratios and their various components, including actual management fees, custodian and other non-management fees, and Rule 12b-1 and non-Rule 12b-1 shareholder service fees. The Board considered these ratios in comparison to the median ratios of funds in class-specific expense groups that were determined by Broadridge to be similar to the Fund (the “Groups”). The Board received a description of the methodology used by Broadridge to select the mutual funds in the expense Groups and an explanation of how funds comprising expense groups and their expense ratios may vary from year-to-year. Based on the Broadridge reports, the Board noted that the net operating expense ratios of the Fund were lower than the median net operating expense ratios of the expense Groups for each share class.
The Board took into account the Fund’s investment performance and expense information provided to it among the factors considered in deciding to re-approve the Advisory Agreements.
Investment management and sub-advisory fee rates
The Board reviewed and considered the contractual fee rates payable by the Fund to Funds Management under the Management Agreement, as well as the contractual fee rates payable by the Fund to Funds Management for class-level administrative services under a Class-Level Administration Agreement, which include, among other things, class-level transfer agency and sub-transfer agency costs (collectively, the “Management Rates”). The Board also reviewed and considered the contractual investment sub-advisory fee rates that are payable by Funds Management to the Sub-Adviser for investment sub-advisory services.
Among other information reviewed by the Board was a comparison of the Fund’s Management Rates with the average contractual investment management fee rates of funds in the expense Groups at a common asset level as well as transfer agency costs of the funds in the expense Groups. The Board noted that the Management Rates of the Fund were lower than the sum of these average rates for the Fund’s expense Groups for all share classes.
The Board also received and considered information about the portion of the total management fee that was retained by Funds Management after payment of the fee to the Sub-Adviser for sub-advisory services. In assessing the reasonableness of this amount, the Board received and evaluated information about the nature and extent of responsibilities retained and risks assumed by Funds Management and not delegated to or assumed by the Sub-Adviser, and about Funds Management’s on-going oversight services. Given the affiliation between Funds Management and the Sub-Adviser, the Board ascribed limited relevance to the allocation of fees between them.
The Board also received and considered information about the nature and extent of services offered and fee rates charged by Funds Management and the Sub-Adviser to other types of clients with investment strategies similar to those of the Fund. In this regard, the Board received information about the significantly greater scope of services, and compliance, reporting and other legal burdens and risks of managing proprietary mutual funds compared with those associated with managing assets of other types of clients, including third-party sub-advised fund clients and non-mutual fund clients such as institutional separate accounts.
Based on its consideration of the factors and information it deemed relevant, including those described here, the Board determined that the compensation payable to Funds Management under the Management Agreement and to the Sub-Adviser under the Sub-Advisory Agreement was reasonable.
36 | Wells Fargo Large Company Value Fund
Other information (unaudited)
Profitability
The Board received and considered information concerning the profitability of Funds Management, as well as the profitability of both WFAM and Wells Fargo & Co. (“Wells Fargo”) from providing services to the fund family as a whole. The Board noted that the Sub-Adviser’s profitability information with respect to providing services to the Fund and other funds in the family was subsumed in the WFAM and Wells Fargo profitability analysis.
Funds Management reported on the methodologies and estimates used in calculating profitability, including a description of the methodology used to allocate certain expenses. Among other things, the Board noted that the levels of profitability reported on a fund-by-fund basis varied widely, depending on factors such as the size, type and age of fund. Based on its review, the Board did not deem the profits reported by Funds Management, WFAM or Wells Fargo from services provided to the Fund to be at a level that would prevent it from approving the continuation of the Advisory Agreements.
Economies of scale
The Board received and considered information about the potential for Funds Management to experience economies of scale in the provision of management services to the Fund, the difficulties of calculating economies of scale at an individual fund level, and the extent to which potential scale benefits are shared with shareholders. The Board noted the existence of breakpoints in the Fund’s management fee structure, which operate generally to reduce the Fund’s expense ratios as the Fund grows in size. The Board considered that in addition to management fee breakpoints, Funds Management shares potential economies of scale from its management business in a variety of ways, including through fee waiver and expense reimbursement arrangements, services that benefit shareholders, competitive management fee rates set at the outset without regard to breakpoints, and investments in the business intended to enhance services available to shareholders.
The Board concluded that Funds Management’s arrangements with respect to the Fund, including contractual breakpoints, constituted a reasonable approach to sharing potential economies of scale with the Fund and its shareholders.
Other benefits to Funds Management and the Sub-Adviser
The Board received and considered information regarding potential “fall-out” or ancillary benefits received by Funds Management and its affiliates, including the Sub-Adviser, as a result of their relationships with the Fund. Ancillary benefits could include, among others, benefits directly attributable to other relationships with the Fund and benefits potentially derived from an increase in Funds Management’s and the Sub-Adviser’s business as a result of their relationships with the Fund. The Board noted that various affiliates of Funds Management may receive distribution-related fees, shareholder servicing payments and sub-transfer agency fees in respect of shares sold or held through them and services provided.
The Board also reviewed information about soft dollar credits earned and utilized by the Sub-Adviser, fees earned by Funds Management and the Sub-Adviser from managing a private investment vehicle for the fund family’s securities lending collateral, and commissions earned by an affiliated broker from portfolio transactions.
Based on its consideration of the factors and information it deemed relevant, including those described here, the Board did not find that any ancillary benefits received by Funds Management and its affiliates, including the Sub-Adviser, were unreasonable.
Conclusion
At the Meeting, after considering the above-described factors and based on its deliberations and its evaluation of the information described above, the Board unanimously approved the continuation of the Advisory Agreements for a one-year term and determined that the compensation payable to Funds Management and the Sub-Adviser under each of the Advisory Agreements was reasonable.
Wells Fargo Large Company Value Fund | 37
This page is intentionally left blank.
This page is intentionally left blank.
This page is intentionally left blank.

For more information
More information about Wells Fargo Funds is available free upon request. To obtain literature, please write, visit the Fund’s website, or call:
Wells Fargo Funds
P.O. Box 219967
Kansas City, MO 64121-9967
Website:wfam.com
Individual investors:1-800-222-8222
Retail investment professionals:1-888-877-9275
Institutional investment professionals:1-866-765-0778

This report and the financial statements contained herein are submitted for the general information of the shareholders of the Fund. If this report is used for promotional purposes, distribution of the report must be accompanied or preceded by a current prospectus. Before investing, please consider the investment objectives, risks, charges, and expenses of the investment. For a current prospectus and, if available, a summary prospectus, containing this information, call1-800-222-8222 or visit the Fund’s website atwfam.com. Read the prospectus carefully before you invest or send money.
Wells Fargo Asset Management (WFAM) is the trade name for certain investment advisory/management firms owned by Wells Fargo & Company. These firms include but are not limited to Wells Capital Management Incorporated and Wells Fargo Funds Management, LLC. Certain products managed by WFAM entities are distributed by Wells Fargo Funds Distributor, LLC (a broker-dealer and Member FINRA).
This material is for general informational and educational purposes only and is NOT intended to provide investment advice or a recommendation of any kind—including a recommendation for any specific investment, strategy, or plan.
INVESTMENT PRODUCTS: NOT FDIC INSURED ◾ NO BANK GUARANTEE ◾ MAY LOSE VALUE
© 2019 Wells Fargo Funds Management, LLC. All rights reserved.
405482 09-19
A210/AR210 07-19
Annual Report
July 31, 2019
Wells Fargo
Low Volatility U.S. Equity Fund
Beginning on January 1, 2021, as permitted by new regulations adopted by the Securities and Exchange Commission, paper copies of the Wells Fargo Funds’ annual and semi-annual shareholder reports issued after this date will no longer be sent by mail, unless you specifically request paper copies of the reports. Instead, the reports will be made available on the Funds’ website, and you will be notified by mail each time a report is posted and provided with a website address to access the report.
If you already elected to receive shareholder reports electronically, you will not be affected by this change and you need not take any action. You may elect to receive shareholder reports and other communications from the Fund electronically at any time by contacting your financial intermediary (such as a broker-dealer or bank) or, if you are a direct investor, by calling1-800-222-8222 or by enrolling at wellsfargo.com/advantagedelivery.
You may elect to receive all future reports in paper free of charge. If you invest through a financial intermediary, you can contact your financial intermediary to request that you continue to receive paper copies of your shareholder reports; if you invest directly with the Fund, you can call 1-800-222-8222. Your election to receive reports in paper will apply to all Wells Fargo Funds held in your account with your financial intermediary or, if you are a direct investor, to all Wells Fargo Funds that you hold.
|
|
|
Reduce clutter. Save trees. |
Sign up for electronic delivery of prospectuses and shareholder reports atwellsfargo.com/advantagedelivery |
The views expressed and any forward-looking statements are as of July 31, 2019, unless otherwise noted, and are those of the Fund managers and/or Wells Fargo Asset Management. Discussions of individual securities, or the markets generally, or any Wells Fargo Fund are not intended as individual recommendations. Future events or results may vary significantly from those expressed in any forward-looking statements. The views expressed are subject to change at any time in response to changing circumstances in the market. Wells Fargo Asset Management and the Fund disclaim any obligation to publicly update or revise any views expressed or forward-looking statements.
INVESTMENT PRODUCTS: NOT FDIC INSURED ◾ NO BANK GUARANTEE ◾ MAY LOSE VALUE
Wells Fargo Low Volatility U.S. Equity Fund | 1
Letter to shareholders (unaudited)

Andrew Owen
President
Wells Fargo Funds
Dear Shareholder:
We are pleased to offer you this annual report for the Wells Fargo Low Volatility U.S. Equity Fund for the 12-month period that ended July 31, 2019. After the first six months of the period yielded either low-single-digit or negative investment returns, U.S. stock and global bond investors generally enjoyed a recovery during the final six months amid continued concerns about global economic growth, international trade, geopolitical tensions, and bouts of market volatility. These concerns negatively influenced international equity markets.
For the period, U.S. stocks, based on the S&P 500 Index,1 gained 7.99% and international stocks, as measured by the MSCI ACWI ex USA Index (Net),2 fell 2.27%. The MSCI EM Index (Net)3 slipped 2.18%. For bond investors, the Bloomberg Barclays U.S. Aggregate Bond Index4 added 8.08%, the Bloomberg Barclays Global Aggregate ex-USD Index5 added 3.74%, the Bloomberg Barclays Municipal Bond Index6 gained 7.31%, and the ICE BofAML U.S. High Yield Index7 added 6.94%.
Entering the fourth quarter of 2018, economic data was encouraging.
Domestic equity investors entered the fourth quarter of 2018 with reasons to be optimistic. The U.S. Bureau of Economic Analysis reported second-quarter annualized gross domestic product (GDP) growth of 4.2%. Hiring improved. Unemployment declined. Consumer confidence and spending increased. Third-quarter corporate earnings reports were generally positive. U.S. trade negotiations with Mexico and Canada progressed. The U.S. Federal Reserve (Fed) raised the federal funds rate by 25 basis points (bps; 100 bps equal 1.00%) to a target range of between 2.00% and 2.25% in September 2018, one of four rate increases implemented during the calendar year, a sign of its confidence in the strength of the U.S. economy.
Investors in international markets were not as confident. Tensions between the U.S. and China increased. The U.S. imposed $200 billion in tariffs on Chinese goods. China reacted with $60 billion in tariffs on U.S. goods. Economic growth in China caused concern. In September 2018, international investors began to factor a number of disconcerting economic and business data points: lower July manufacturers’ and industrial orders in Germany; falling purchasing manager index numbers for August from the United Kingdom, China, and India; and declining household spending for August in Japan. Taken together, the data fed growing concerns over slowing global growth that unnerved investors.
| 1 | The S&P 500 Index consists of 500 stocks chosen for market size, liquidity, and industry group representation. It is a market-value-weighted index with each stock’s weight in the index proportionate to its market value. You cannot invest directly in an index. |
| 2 | The Morgan Stanley Capital International (MSCI) All Country World Index (ACWI) ex USA Index (Net) is a free-float-adjusted market-capitalization weighted index that is designed to measure the equity market performance of developed and emerging markets, excluding the U.S. Source: MSCI. MSCI makes no express or implied warranties or representations and shall have no liability whatsoever with respect to any MSCI data contained herein. The MSCI data may not be further redistributed or used as a basis for other indices or any securities or financial products. This report is not approved, reviewed, or produced by MSCI. You cannot invest directly in an index. |
| 3 | The MSCI Emerging Markets (EM) Index (Net) is a free-float-adjusted market-capitalization-weighted index that is designed to measure the equity market performance of emerging markets. You cannot invest directly in an index. |
| 4 | The Bloomberg Barclays U.S. Aggregate Bond Index is a broad-based benchmark that measures the investment-grade, U.S. dollar-denominated, fixed-rate taxable bond market, including Treasuries, government-related and corporate securities, mortgage-backed securities (agency fixed-rate and hybrid adjustable-rate mortgage pass-throughs), asset-backed securities, and commercial mortgage-backed securities. You cannot invest directly in an index. |
| 5 | The Bloomberg Barclays Global Aggregate ex-USD Index is an unmanaged index that provides a broad-based measure of the global investment-grade fixed-income markets excluding the U.S. dollar-denominated debt market. You cannot invest directly in an index. |
| 6 | The Bloomberg Barclays Municipal Bond Index is an unmanaged index composed of long-term tax-exempt bonds with a minimum credit rating of Baa. You cannot invest directly in an index. |
| 7 | The ICE BofAML U.S. High Yield Index is a market-capitalization-weighted index of domestic and Yankee high-yield bonds. The index tracks the performance of high-yield securities traded in the U.S. bond market. You cannot invest directly in an index. Copyright 2019. ICE Data Indices, LLC. All rights reserved. |
2 | Wells Fargo Low Volatility U.S. Equity Fund
Letter to shareholders (unaudited)
Global markets suffered during the fourth quarter of 2018.
November’s U.S. midterm elections shifted control of the House of Representatives from Republicans to Democrats, presaging partisan clashes that followed and caused uncertainty among investors. Third-quarter U.S. GDP was announced at an annualized 3.4% rate, lower than the second-quarter rate. Brexit efforts stalled ahead of the March 2019 deadline. The People’s Bank of China cut reserve requirement ratios, accelerated infrastructure spending, and cut taxes even as the value of the yuan declined to low levels last seen in 2008. A partial U.S. government shutdown driven by partisan policy disputes extended into January.
The combination of news in the U.S. and generally weak economic indicators outside of the U.S. caused investors to seek safe havens. December’s S&P 500 Index performance was the worst since 1931. Globally, fixed-income investments fared better than stocks during the last two months of the year. The Fed increased the federal funds rate by 25 bps in December to a target range of between 2.25% and 2.50%.
The market climbs a wall of worry.
Investors entered 2019 with reasons to be concerned. Investment returns appeared to reaffirm the adage that markets climb a wall of worry. The S&P 500 Index gained 8.01% for the month of January, the best monthly performance in 30 years. Returns for the MSCI ACWI ex USA Index (Net), the Bloomberg Barclays U.S. Aggregate Bond Index, and the Bloomberg Barclays Global Aggregate ex-USD Index also were positive.
In February 2019, signs of slowing global growth grew more ominous. The Bureau of Economic Analysis announced fourth-quarter 2018 GDP grew at an annualized 2.2% rate, down from the levels of the prior two quarters. In a February report, the Bank of England forecasted the slowest growth since the financial crisis for 2019. China and the U.S. continued to wrangle over trade issues.
By the end of March 2019, a combination of dovish Fed sentiment and steady, if not spectacular, U.S. economic and business metrics reinforced investors’ confidence. Monthly job creation data and corporate profits, while less consistent than during 2018, were solid. China announced a roughly $300 billion stimulus package through tax and fee cuts intended to reinvigorate economic growth. During April 2019, favorable sentiment found additional support in reports of sustained low inflation, solid employment data, and first-quarter U.S. GDP of an annualized rate of 3.2%.
During May 2019, markets tumbled on mixed investment signals. In the U.S., partisan wrangling ramped up as Democrats and Republicans set their sights on 2020 presidential politics. The U.K.’s Brexit caused Prime Minister Theresa May to resign. The European Commission downgraded the 2019 growth forecast to 1.2%. The U.S. increased tariffs on products from China, China responded, and then talks broke down. President Donald Trump threatened to turn his foreign policy tariff tool to Mexico over immigration issues.
As had been the case during most of 2019 to date, just as the investment horizon appeared to darken, sentiment turned and U.S. equity markets gained during June and July. The gains, primarily driven by geopolitical and monetary policy events, pushed equity markets to new highs.
President Mario Draghi of the European Central Bank said that if the outlook doesn’t improve, the bank will cut rates or buy more assets to prop up inflation. President Trump backed off of tariff threats against Mexico and China. In the U.S., the Fed implemented a 0.25% federal funds rate cut in July 2019.
“December’s S&P 500 Index performance was the worst since 1931.”
“The S&P 500 Index gained 8.01% for the month of January, the best monthly performance in 30 years.”
Wells Fargo Low Volatility U.S. Equity Fund | 3
Letter to shareholders (unaudited)
Later in July 2019, the U.S. reversed course and threatened to impose higher tariffs on China’s exports after talks failed. China responded with tariff threats of its own and devalued the renminbi, a move that roiled global markets. Despite the accommodative approach of central banks, investors continued to have misgivings about the durability of economic growth globally and a pervasively cautious tone influenced the world’s equity and fixed-income markets.
Don’t let short-term uncertainty derail long-term investment goals.
Periods of investment uncertainty can present challenges, but experience has taught us that maintaining long-term investment goals can be an effective way to plan for the future. To help you create a sound strategy based on your personal goals and risk tolerance, Wells Fargo Funds offers more than 100 mutual funds spanning a wide range of asset classes and investment styles. Although diversification cannot guarantee an investment profit or prevent losses, we believe it can be an effective way to manage investment risk and potentially smooth out overall portfolio performance. We encourage investors to know their investments and to understand that appropriate levels of risk-taking may unlock opportunities.
Thank you for choosing to invest with Wells Fargo Funds. We appreciate your confidence in us and remain committed to helping you meet your financial needs.
Sincerely,

Andrew Owen
President
Wells Fargo Funds
|
|
|
For further information about your Fund, contact your investment professional, visit our website at wfam.com, or call us directly at
1-800-222-8222. |
4 | Wells Fargo Low Volatility U.S. Equity Fund
This page is intentionally left blank.
Performance highlights (unaudited)
Investment objective
The Fund seeks long-term capital appreciation.
Manager
Wells Fargo Funds Management, LLC
Subadviser
Wells Capital Management Incorporated
Portfolio managers
Dennis Bein, CFA®‡
Ryan Brown, CFA®‡
Harindra de Silva, Ph.D., CFA®‡
Average annual total returns (%) as of July 31, 2019
| | | | | | | | | | | | | | | | | | | | | | | | | | |
| | | | |
| | | | | Including sales charge | | | Excluding sales charge | | | Expense ratios1 (%) | |
| | | | | | | |
| | | Inception date | | 1 year | | | Since
inception | | | 1 year | | | Since
inception | | | Gross | | | Net2 | |
| | | | | | | | |
| Class A (WLVLX) | | 10-31-2016 | | | 6.34 | | | | 9.17 | | | | 12.87 | | | | 11.55 | | | | 1.56 | | | | 0.74 | |
| | | | | | | | |
| Class C (WLVKX) | | 10-31-2016 | | | 11.15 | | | | 10.74 | | | | 12.15 | | | | 10.74 | | | | 2.31 | | | | 1.49 | |
| | | | | | | | |
| Class R6 (WLVJX) | | 10-31-2016 | | | – | | | | – | | | | 13.39 | | | | 12.03 | | | | 1.13 | | | | 0.31 | |
| | | | | | | | |
| Administrator Class (WLVDX) | | 10-31-2016 | | | – | | | | – | | | | 13.00 | | | | 11.63 | | | | 1.48 | | | | 0.66 | |
| | | | | | | | |
| Institutional Class (WLVOX) | | 10-31-2016 | | | – | | | | – | | | | 13.28 | | | | 11.93 | | | | 1.23 | | | | 0.41 | |
| | | | | | | | |
| Russell 1000® Index3 | | – | | | – | | | | – | | | | 8.00 | | | | 15.36 | * | | | – | | | | – | |
| * | Return is based on inception of the Fund. |
Figures quoted represent past performance, which is no guarantee of future results, and do not reflect taxes that a shareholder may pay on fund distributions or the redemption of fund shares. Investment return and principal value of an investment will fluctuate so that an investor’s shares, when redeemed, may be worth more or less than their original cost. Performance shown without sales charges would be lower if sales charges were reflected. Current performance may be lower or higher than the performance data quoted, which assumes the reinvestment of dividends and capital gains. Currentmonth-end performance is available on the Fund’s website,wfam.com.
Index returns do not include transaction costs associated with buying and selling securities, any mutual fund fees or expenses, or any taxes. It is not possible to invest directly in an index.
For Class A shares, the maximumfront-end sales charge is 5.75%. For Class C shares, the maximum contingent deferred sales charge is 1.00%. Performance including a contingent deferred sales charge assumes the sales charge for the corresponding time period. Class R6, Administrator Class, and Institutional Class shares are sold without afront-end sales charge or contingent deferred sales charge.
Stock values fluctuate in response to the activities of individual companies and general market and economic conditions. Certain investment strategies tend to increase the total risk of an investment (relative to the broader market). The Fund is exposed to smaller-company securities risk. Consult the Fund’s prospectus for additional information on these and other risks.
Please see footnotes on page 7.
6 | Wells Fargo Low Volatility U.S. Equity Fund
Performance highlights (unaudited)
|
|
| Growth of $10,000 investment as of July 31, 20194 |
|
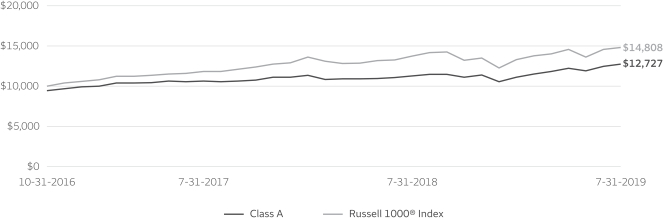
|
| ‡ | CFA® and Chartered Financial Analyst® are trademarks owned by CFA Institute. |
| 1 | Reflects the expense ratios as stated in the most recent prospectuses, which include the impact of 0.01% in acquired fund fees and expenses. The expense ratios shown are subject to change and may differ from the annualized expense ratios shown in the financial highlights of this report. |
| 2 | The manager has contractually committed through November 30, 2019, to waive fees and/or reimburse expenses to the extent necessary to cap the expenses of each class after fee waivers at 0.73% for Class A, 1.48% for Class C, 0.30% for Class R6, 0.65% for Administrator Class, and 0.40% for Institutional Class. Brokerage commissions, stamp duty fees, interest, taxes, acquired fund fees and expenses (if any), and extraordinary expenses are excluded from the expense cap. Prior to or after the commitment expiration date, the cap may be increased or the commitment to maintain the cap may be terminated only with the approval of the Board of Trustees. Without this cap, the Fund’s returns would have been lower. The expense ratio paid by an investor is the net expense ratio (the total annual fund operating expenses after fee waivers) as stated in the prospectuses. |
| 3 | The Russell 1000® Index measures the performance of the 1,000 largest companies in the Russell 3000® Index, which represents approximately 92% of the total market capitalization of the Russell 3000® Index. You cannot invest directly in an index. |
| 4 | The chart compares the performance of Class A shares since inception with the Russell 1000® Index. The chart assumes a hypothetical investment of $10,000 in Class A shares and reflects all operating expenses and assumes the maximum initial sales charge of 5.75%. |
| 5 | The Conference Board Consumer Confidence Index® measures the degree of optimism on the state of the U.S. economy that consumers are expressing through their activities of saving and spending. You cannot invest directly in an index. |
| 6 | The S&P 500 Index consists of 500 stocks chosen for market size, liquidity, and industry group representation. It is a market-value-weighted index with each stock’s weight in the index proportionate to its market value. You cannot invest directly in an index. |
| 7 | The ten largest holdings, excluding cash, cash equivalents and any money market funds, are calculated based on the value of the investments divided by total net assets of the Fund. Holdings are subject to change and may have changed since the date specified. |
| 8 | Amounts are calculated based on the total long-term investments of the Fund. These amounts are subject to change and may have changed since the date specified. |
Wells Fargo Low Volatility U.S. Equity Fund | 7
Performance highlights (unaudited)
MANAGER’S DISCUSSION
Fund highlights
| ∎ | | The Fund outperformed its benchmark, the Russell 1000® Index, for the12-month period that ended July 31, 2019. |
| ∎ | | Primary contributors to Fund performance during the reporting period included our focus on lower-risk/lower-beta stocks, which outperformed both high-risk stocks and the index during the period. Beta is a measure of a stock’s volatility relative to general market movements. Lower-beta stocks tend to deliver lower variation in returns compared with the overall market. In addition, an underweight position to the high-risk energy sector helped relative results. |
| ∎ | | An underweight position to information technology was a detractor as this sector posted strong returns during the period. |
U.S. stocks delivered strong results during the reporting period.
Markets posted positive returns for theone-year period despite the Russell 1000® Index returning-13.82% in the fourth quarter of 2018. December’s bigsell-off seemed to result from concerns over the government shutdown. December started with an argument between the Federal Reserve (Fed) and the White House over rising interest rates and ended with a confrontation between Congress and the White House over budget issues. Both led to increased market volatility.
Early in the period, the strength of the domestic economy helped move stocks higher. Consumer spending figures were strong, driving overall growth for the economy. Continued growth also helped consumer confidence, with The Conference Board Consumer Confidence Index®5 hitting an18-year high. In addition, August’s unemployment rate was 3.9%, a low not seen since December 2000.
Fed officials raised the federal funds rate in December 2018, and initially reaffirmed the outlook for further gradual hikes well into 2019. The quarter-point increase in December 2018 boosted the benchmark federal funds rate to 2.50%.
The tone surrounding interest rates changed later in the12-month period when economic growth slowed. For example, only 20,000 new jobs were added in February. In addition, earnings growth disappointed as the first-quarter earnings growth estimate for the S&P 500 Index6 fell from 2.9% to-3.9%. Consumer spending growth also pulled back as January’s personal spending report showed 0.1% growth and retail sales in February fell 0.2%. As a result, the Fed initially indicated there would be no further interest rate hikes during 2019. In fact, in response to increasing trade tensions and slowing global economic growth, the Fed lowered interest rates after the close of the12-month period—on July 31, 2019—its first rate cut since 2008.
| | | | |
|
| Ten largest holdings (%) as of July 31, 20197 | |
| | |
Republic Services Incorporated | | | 2.51 | |
| | |
The Coca-Cola Company | | | 2.49 | |
| | |
Waste Management Incorporated | | | 2.49 | |
| | |
The Hershey Company | | | 2.39 | |
| | |
The Procter & Gamble Company | | | 2.30 | |
| | |
Paychex Incorporated | | | 2.26 | |
| | |
CME Group Incorporated | | | 2.23 | |
| | |
Booz Allen Hamilton Holding Corporation | | | 2.22 | |
| | |
Royal Gold Incorporated | | | 2.13 | |
| | |
PepsiCo Incorporated | | | 2.09 | |
Our emphases on risk management and high-quality stocks proved favorable during the reporting period.
Lack of exposure to the energy sector helped the Fund’s relative performance. The Fund lacks exposure primarily because this sector has exhibited considerably higher relative volatility in recent years. In addition, overweight position to the lower-risk utilities and consumer discretionary and staples sectors also helped relative returns.
Stock selection was strong in the majority of sectors, led by financials, where an overweight position to MarketAxess Holdings, Incorporated, was a top contributor to relative performance. Security selection was also strong within
consumer staples, where overweight positions to The Hershey Company and The Procter & Gamble Company proved beneficial. Furthermore, stock selection was strong within industrials where an overweight position to Waste Management, Incorporated, helped. Within utilities, an overweight position to NextEra Energy, Incorporated, helped relative returns during the period.
Lower-risk/lower-beta stocks outperformed both high-risk stocks and the index during the period. For example, stocks within the lowest-risk quintile returned 15.70%, whereas stocks within the highest-risk quintile returned 6.07%. As a result, a significant overweight to thelow-risk quintile and a significant underweight to the highest-risk quintile helped results.
Please see footnotes on page 7.
8 | Wells Fargo Low Volatility U.S. Equity Fund
Performance highlights (unaudited)
|
|
| Sector distribution as of July 31, 20198 |
|
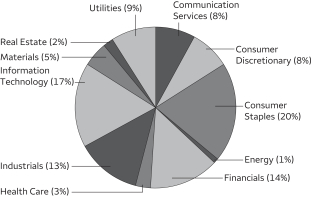 |
The Fund seeks to have less volatility than the overall stock market.
Our investment process focuses primarily on volatility reduction. We seek to maintain a standard deviation (variation between highest and lowest returns) that is 20% to 30% less than that of the index while delivering a similar or higher level of return over a full market cycle. Using our fundamental and statistical risk models, we construct the portfolio by quantitatively identifying companies that possess lower forecasted risks.
Due to ourlow-volatility emphasis, sector weights within the Fund tend to deviate meaningfully from those of the benchmark. During the period, the Fund held underweights to sectors that generally exhibited higher betas, such as energy, and overweight positions to consumer staples and utilities, sectors that are considered defensive in nature.
Going forward, we will continue to favorlow-beta stocks as they serve the Fund’s goal: to reduce volatility.
Using our fundamental and statistical risk models, we will quantitatively identify companies with lower forecasted risks. In addition, we will use our comprehensive alpha-prediction model when selecting lower-risk stocks. Alpha measures the excess return of an investment vehicle, such as a mutual fund, relative to the return of its index. Our process quantitatively forecasts returns using over 70 fundamental, technical, and proprietary factors, also known as alpha signals. As a result, our process not only assesses investment opportunities from a risk perspective but also from an alpha standpoint. We believe this increases the likelihood that over a full market cycle, the Fund may provide investors with lower overall portfolio risk relative to the index while delivering a similar or higher level of return.
Please see footnotes on page 7.
Wells Fargo Low Volatility U.S. Equity Fund | 9
Fund expenses (unaudited)
As a shareholder of the Fund, you incur two types of costs: (1) transaction costs, including sales charges (loads) on purchase payments and contingent deferred sales charges (if any) on redemptions and (2) ongoing costs, including management fees, distribution(12b-1) and/or shareholder servicing fees, and other Fund expenses. This example is intended to help you understand your ongoing costs (in dollars) of investing in the Fund and to compare these costs with the ongoing costs of investing in other mutual funds.
The example is based on an investment of $1,000 invested at the beginning of thesix-month period and held for the entire period from February 1, 2019 to July 31, 2019.
Actual expenses
The “Actual” line of the table below provides information about actual account values and actual expenses. You may use the information in this line, together with the amount you invested, to estimate the expenses that you paid over the period. Simply divide your account value by $1,000 (for example, an $8,600 account value divided by $1,000 = 8.6), then multiply the result by the number in the “Actual” line under the heading entitled “Expenses paid during period” for your applicable class of shares to estimate the expenses you paid on your account during this period.
Hypothetical example for comparison purposes
The “Hypothetical” line of the table below provides information about hypothetical account values and hypothetical expenses based on the Fund’s actual expense ratio and an assumed rate of return of 5% per year before expenses, which is not the Fund’s actual return. The hypothetical account values and expenses may not be used to estimate the actual ending account balance or expenses you paid for the period. You may use this information to compare the ongoing costs of investing in the Fund and other funds. To do so, compare this 5% hypothetical example with the 5% hypothetical examples that appear in the shareholder reports of the other funds.
Please note that the expenses shown in the table are meant to highlight your ongoing costs only and do not reflect any transactional costs, such as sales charges (loads) and contingent deferred sales charges. Therefore, the “Hypothetical” line of the table is useful in comparing ongoing costs only and will not help you determine the relative total costs of owning different funds. In addition, if these transactional costs were included, your costs would have been higher.
| | | | | | | | | | | | | | | | |
| | | Beginning
account value
2-1-2019 | | | Ending
account value
7-31-2019 | | | Expenses
paid during
the period¹ | | | Annualized net
expense ratio | |
| | | | | |
Class A | | | | | | | | | | | | | | | | |
| | | | |
Actual | | $ | 1,000.00 | | | $ | 1,147.06 | | | $ | 3.89 | | | | 0.73 | % |
| | | | |
Hypothetical (5% return before expenses) | | $ | 1,000.00 | | | $ | 1,021.17 | | | $ | 3.66 | | | | 0.73 | % |
| | | | | |
Class C | | | | | | | | | | | | | | | | |
| | | | |
Actual | | $ | 1,000.00 | | | $ | 1,142.72 | | | $ | 7.86 | | | | 1.48 | % |
| | | | |
Hypothetical (5% return before expenses) | | $ | 1,000.00 | | | $ | 1,017.46 | | | $ | 7.40 | | | | 1.48 | % |
| | | | | |
Class R6 | | | | | | | | | | | | | | | | |
| | | | |
Actual | | $ | 1,000.00 | | | $ | 1,148.96 | | | $ | 1.60 | | | | 0.30 | % |
| | | | |
Hypothetical (5% return before expenses) | | $ | 1,000.00 | | | $ | 1,023.31 | | | $ | 1.50 | | | | 0.30 | % |
| | | | | |
Administrator Class | | | | | | | | | | | | | | | | |
| | | | |
Actual | | $ | 1,000.00 | | | $ | 1,147.20 | | | $ | 3.46 | | | | 0.65 | % |
| | | | |
Hypothetical (5% return before expenses) | | $ | 1,000.00 | | | $ | 1,021.57 | | | $ | 3.26 | | | | 0.65 | % |
| | | | | |
Institutional Class | | | | | | | | | | | | | | | | |
| | | | |
Actual | | $ | 1,000.00 | | | $ | 1,148.96 | | | $ | 2.13 | | | | 0.40 | % |
| | | | |
Hypothetical (5% return before expenses) | | $ | 1,000.00 | | | $ | 1,022.81 | | | $ | 2.01 | | | | 0.40 | % |
| 1 | Expenses paid is equal to the annualized net expense ratio of each class multiplied by the average account value over the period, multiplied by the number of days in the most recent fiscal half-year divided by the number of days in the fiscal year (to reflect theone-half-year period). |
10 | Wells Fargo Low Volatility U.S. Equity Fund
Portfolio of investments—July 31, 2019
| | | | | | | | | | | | | | | | |
| | | | | | | | | Shares | | | Value | |
| Common Stocks: 97.14% | |
|
Communication Services: 8.18% | |
|
| Entertainment: 4.35% | |
| | | | |
Cinemark Holdings Incorporated | | | | | | | | | | | 18,704 | | | $ | 746,664 | |
| | | | |
The Madison Square Garden Company Class A † | | | | | | | | | | | 1,857 | | | | 538,604 | |
| | | | |
The Walt Disney Company | | | | | | | | | | | 2,083 | | | | 297,890 | |
| | | | |
Zynga Incorporated Class A † | | | | | | | | | | | 22,481 | | | | 143,429 | |
| | | | |
| | | | | | | | | | | | | | | 1,726,587 | |
| | | | | | | | | | | | | | | | |
|
| Interactive Media & Services: 0.58% | |
| | | | |
IAC Corporation † | | | | | | | | | | | 961 | | | | 229,727 | |
| | | | | | | | | | | | | | | | |
|
| Media: 3.25% | |
| | | | |
Cable One Incorporated | | | | | | | | | | | 617 | | | | 750,766 | |
| | | | |
John Wiley & Sons Incorporated Class A | | | | | | | | | | | 798 | | | | 36,317 | |
| | | | |
Omnicom Group Incorporated | | | | | | | | | | | 6,313 | | | | 506,429 | |
| | | | |
| | | | | | | | | | | | | | | 1,293,512 | |
| | | | | | | | | | | | | | | | |
|
Consumer Discretionary: 7.62% | |
|
| Diversified Consumer Services: 1.67% | |
| | | | |
Bright Horizons Family Solutions Incorporated † | | | | | | | | | | | 466 | | | | 70,865 | |
| | | | |
Graham Holdings Company Class B | | | | | | | | | | | 77 | | | | 57,190 | |
| | | | |
H&R Block Incorporated | | | | | | | | | | | 19,369 | | | | 536,328 | |
| | | | |
| | | | | | | | | | | | | | | 664,383 | |
| | | | | | | | | | | | | | | | |
|
| Hotels, Restaurants & Leisure: 0.39% | |
| | | | |
Darden Restaurants Incorporated | | | | | | | | | | | 1 | | | | 122 | |
| | | | |
Six Flags Entertainment Corporation | | | | | | | | | | | 2,886 | | | | 152,467 | |
| | | | |
| | | | | | | | | | | | | | | 152,589 | |
| | | | | | | | | | | | | | | | |
|
| Household Durables: 0.99% | |
| | | | |
NVR Incorporated † | | | | | | | | | | | 118 | | | | 394,608 | |
| | | | | | | | | | | | | | | | |
|
| Internet & Direct Marketing Retail: 2.64% | |
| | | | |
Booking Holdings Incorporated † | | | | | | | | | | | 300 | | | | 565,983 | |
| | | | |
eBay Incorporated | | | | | | | | | | | 11,715 | | | | 482,541 | |
| | | | |
| | | | | | | | | | | | | | | 1,048,524 | |
| | | | | | | | | | | | | | | | |
|
| Specialty Retail: 1.57% | |
| | | | |
ULTA Beauty Incorporated † | | | | | | | | | | | 1,789 | | | | 624,808 | |
| | | | | | | | | | | | | | | | |
|
| Textiles, Apparel & Luxury Goods: 0.36% | |
| | | | |
lululemon athletica Incorporated † | | | | | | | | | | | 742 | | | | 141,789 | |
| | | | | | | | | | | | | | | | |
|
Consumer Staples: 19.51% | |
|
| Beverages: 4.58% | |
| | | | |
PepsiCo Incorporated | | | | | | | | | | | 6,485 | | | | 828,848 | |
| | | | |
The Coca-Cola Company | | | | | | | | | | | 18,823 | | | | 990,654 | |
| | | | |
| | | | | | | | | | | | | | | 1,819,502 | |
| | | | | | | | | | | | | | | | |
The accompanying notes are an integral part of these financial statements.
Wells Fargo Low Volatility U.S. Equity Fund | 11
Portfolio of investments—July 31, 2019
| | | | | | | | | | | | | | | | |
| | | | | | | | | Shares | | | Value | |
| Food & Staples Retailing: 3.61% | |
| | | | |
Costco Wholesale Corporation | | | | | | | | | | | 2,525 | | | $ | 695,966 | |
| | | | |
Sysco Corporation | | | | | | | | | | | 10,725 | | | | 735,413 | |
| | | | |
| | | | | | | | | | | | | | | 1,431,379 | |
| | | | | | | | | | | | | | | | |
|
| Food Products: 4.61% | |
| | | | |
Flowers Foods Incorporated | | | | | | | | | | | 13,327 | | | | 315,850 | |
| | | | |
Lamb Weston Holdings Incorporated | | | | | | | | | | | 7,725 | | | | 518,502 | |
| | | | |
The Hershey Company | | | | | | | | | | | 6,266 | | | | 950,803 | |
| | | | |
Tyson Foods Incorporated Class A | | | | | | | | | | | 561 | | | | 44,599 | |
| | | | |
| | | | | | | | | | | | | | | 1,829,754 | |
| | | | | | | | | | | | | | | | |
|
| Household Products: 4.54% | |
| | | | |
Colgate-Palmolive Company | | | | | | | | | | | 6,020 | | | | 431,875 | |
| | | | |
The Clorox Company | | | | | | | | | | | 2,823 | | | | 459,020 | |
| | | | |
The Procter & Gamble Company | | | | | | | | | | | 7,741 | | | | 913,748 | |
| | | | |
| | | | | | | | | | | | | | | 1,804,643 | |
| | | | | | | | | | | | | | | | |
|
| Tobacco: 2.17% | |
| | | | |
Altria Group Incorporated | | | | | | | | | | | 7,222 | | | | 339,939 | |
| | | | |
Philip Morris International Incorporated | | | | | | | | | | | 6,249 | | | | 522,479 | |
| | | | |
| | | | | | | | | | | | | | | 862,418 | |
| | | | | | | | | | | | | | | | |
|
Energy: 0.41% | |
|
| Energy Equipment & Services: 0.22% | |
| | | | |
Baker Hughes Incorporated | | | | | | | | | | | 3,465 | | | | 87,976 | |
| | | | | | | | | | | | | | | | |
|
| Oil, Gas & Consumable Fuels: 0.19% | |
| | | | |
ConocoPhillips | | | | | | | | | | | 1,276 | | | | 75,386 | |
| | | | | | | | | | | | | | | | |
|
Financials: 14.07% | |
|
| Capital Markets: 7.16% | |
| | | | |
CBOE Holdings Incorporated | | | | | | | | | | | 6,337 | | | | 692,697 | |
| | | | |
CME Group Incorporated | | | | | | | | | | | 4,563 | | | | 887,138 | |
| | | | |
FactSet Research Systems Incorporated | | | | | | | | | | | 1,042 | | | | 288,946 | |
| | | | |
Intercontinental Exchange Incorporated | | | | | | | | | | | 1,732 | | | | 152,173 | |
| | | | |
Janus Henderson Group plc | | | | | | | | | | | 1,277 | | | | 25,629 | |
| | | | |
MarketAxess Holdings Incorporated | | | | | | | | | | | 1,977 | | | | 666,328 | |
| | | | |
Morningstar Incorporated | | | | | | | | | | | 687 | | | | 104,410 | |
| | | | |
Virtu Financial Incorporated Class A | | | | | | | | | | | 1,174 | | | | 25,452 | |
| | | | |
| | | | | | | | | | | | | | | 2,842,773 | |
| | | | | | | | | | | | | | | | |
|
| Insurance: 4.24% | |
| | | | |
American Financial Group Incorporated | | | | | | | | | | | 5,506 | | | | 563,704 | |
| | | | |
American National Insurance Company | | | | | | | | | | | 379 | | | | 45,867 | |
| | | | |
Arch Capital Group Limited † | | | | | | | | | | | 6,753 | | | | 261,273 | |
| | | | |
Mercury General Corporation | | | | | | | | | | | 3,451 | | | | 195,706 | |
| | | | |
Old Republic International Corporation | | | | | | | | | | | 10,458 | | | | 238,547 | |
| | | | |
The Progressive Corporation | | | | | | | | | | | 4,667 | | | | 377,934 | |
| | | | |
| | | | | | | | | | | | | | | 1,683,031 | |
| | | | | | | | | | | | | | | | |
The accompanying notes are an integral part of these financial statements.
12 | Wells Fargo Low Volatility U.S. Equity Fund
Portfolio of investments—July 31, 2019
| | | | | | | | | | | | | | | | |
| | | | | | | | | Shares | | | Value | |
| Mortgage REITs: 2.67% | |
| | | | |
AGNC Investment Corporation | | | | | | | | | | | 15,735 | | | $ | 269,698 | |
| | | | |
Annaly Capital Management Incorporated | | | | | | | | | | | 20,527 | | | | 196,033 | |
| | | | |
Chimera Investment Corporation | | | | | | | | | | | 643 | | | | 12,397 | |
| | | | |
MFA Financial Incorporated | | | | | | | | | | | 55,154 | | | | 396,006 | |
| | | | |
Starwood Property Trust Incorporated | | | | | | | | | | | 8,023 | | | | 186,374 | |
| | | | |
| | | | | | | | | | | | | | | 1,060,508 | |
| | | | | | | | | | | | | | | | |
|
Health Care: 2.93% | |
|
| Health Care Equipment & Supplies: 1.11% | |
| | | | |
Varian Medical Systems Incorporated † | | | | | | | | | | | 1,189 | | | | 139,553 | |
| | | | |
West Pharmaceutical Services Incorporated | | | | | | | | | | | 2,197 | | | | 301,582 | |
| | | | |
| | | | | | | | | | | | | | | 441,135 | |
| | | | | | | | | | | | | | | | |
|
| Health Care Providers & Services: 0.34% | |
| | | | |
Anthem Incorporated | | | | | | | | | | | 252 | | | | 74,242 | |
| | | | |
Chemed Corporation | | | | | | | | | | | 153 | | | | 62,025 | |
| | | | |
| | | | | | | | | | | | | | | 136,267 | |
| | | | | | | | | | | | | | | | |
|
| Life Sciences Tools & Services: 1.43% | |
| | | | |
Bio-Rad Laboratories Incorporated Class A † | | | | | | | | | | | 1,803 | | | | 567,765 | |
| | | | | | | | | | | | | | | | |
|
| Pharmaceuticals: 0.05% | |
| | | | |
Merck & Company Incorporated | | | | | | | | | | | 229 | | | | 19,005 | |
| | | | | | | | | | | | | | | | |
|
Industrials: 13.11% | |
|
| Aerospace & Defense: 5.03% | |
| | | | |
BWX Technologies Incorporated | | | | | | | | | | | 4,481 | | | | 241,571 | |
| | | | |
Curtiss-Wright Corporation | | | | | | | | | | | 1,305 | | | | 165,617 | |
| | | | |
Huntington Ingalls Industries Incorporated | | | | | | | | | | | 1,270 | | | | 289,941 | |
| | | | |
Lockheed Martin Corporation | | | | | | | | | | | 2,007 | | | | 726,875 | |
| | | | |
Raytheon Company | | | | | | | | | | | 3,136 | | | | 571,661 | |
| | | | |
| | | | | | | | | | | | | | | 1,995,665 | |
| | | | | | | | | | | | | | | | |
|
| Air Freight & Logistics: 0.85% | |
| | | | |
Expeditors International of Washington Incorporated | | | | | | | | | | | 4,435 | | | | 338,612 | |
| | | | | | | | | | | | | | | | |
|
| Commercial Services & Supplies: 5.02% | |
| | | | |
ADT Incorporated | | | | | | | | | | | 1,638 | | | | 10,401 | |
| | | | |
Republic Services Incorporated | | | | | | | | | | | 11,239 | | | | 996,337 | |
| | | | |
Waste Management Incorporated | | | | | | | | | | | 8,445 | | | | 988,065 | |
| | | | |
| | | | | | | | | | | | | | | 1,994,803 | |
| | | | | | | | | | | | | | | | |
|
Industrial Conglomerates: 0.75% | |
| | | | |
Honeywell International Incorporated | | | | | | | | | | | 1,720 | | | | 296,631 | |
| | | | | | | | | | | | | | | | |
|
Machinery: 1.34% | |
| | | | |
The Toro Company | | | | | | | | | | | 7,327 | | | | 533,552 | |
| | | | | | | | | | | | | | | | |
|
Road & Rail: 0.12% | |
| | | | |
Schneider National Incorporated Class B | | | | | | | | | | | 2,344 | | | | 45,239 | |
| | | | | | | | | | | | | | | | |
The accompanying notes are an integral part of these financial statements.
Wells Fargo Low Volatility U.S. Equity Fund | 13
Portfolio of investments—July 31, 2019
| | | | | | | | | | | | | | | | |
| | | | | | | | | Shares | | | Value | |
Information Technology: 16.07% | |
|
| Communications Equipment: 1.29% | |
| | | | |
Motorola Solutions Incorporated | | | | | | | | | | | 3,081 | | | $ | 511,323 | |
| | | | | | | | | | | | | | | | |
|
Electronic Equipment, Instruments & Components: 1.95% | |
| | | | |
CDW Corporation of Delaware | | | | | | | | | | | 1,366 | | | | 161,407 | |
| | | | |
FLIR Systems Incorporated | | | | | | | | | | | 2,974 | | | | 147,689 | |
| | | | |
National Instruments Corporation | | | | | | | | | | | 11,172 | | | | 466,543 | |
| | | | |
| | | | | | | | | | | | | | | 775,639 | |
| | | | | | | | | | | | | | | | |
|
| IT Services: 9.92% | |
| | | | |
Amdocs Limited | | | | | | | | | | | 12,802 | | | | 819,200 | |
| | | | |
Automatic Data Processing Incorporated | | | | | | | | | | | 3,728 | | | | 620,787 | |
| | | | |
Booz Allen Hamilton Holding Corporation | | | | | | | | | | | 12,809 | | | | 880,619 | |
| | | | |
Genpact Limited | | | | | | | | | | | 16,448 | | | | 652,657 | |
| | | | |
Jack Henry & Associates Incorporated | | | | | | | | | | | 514 | | | | 71,806 | |
| | | | |
Paychex Incorporated | | | | | | | | | | | 10,796 | | | | 896,608 | |
| | | | |
| | | | | | | | | | | | | | | 3,941,677 | |
| | | | | | | | | | | | | | | | |
|
| Semiconductors & Semiconductor Equipment: 0.56% | |
| | | | |
Maxim Integrated Products Incorporated | | | | | | | | | | | 3,725 | | | | 220,483 | |
| | | | | | | | | | | | | | | | |
|
| Software: 2.35% | |
| | | | |
Cadence Design Systems Incorporated † | | | | | | | | | | | 3,890 | | | | 287,510 | |
| | | | |
CDK Global Incorporated | | | | | | | | | | | 8,550 | | | | 443,488 | |
| | | | |
Citrix Systems Incorporated | | | | | | | | | | | 562 | | | | 52,963 | |
| | | | |
Symantec Corporation | | | | | | | | | | | 487 | | | | 10,500 | |
| | | | |
Synopsys Incorporated † | | | | | | | | | | | 450 | | | | 59,742 | |
| | | | |
Teradata Corporation † | | | | | | | | | | | 2,142 | | | | 78,440 | |
| | | | |
| | | | | | | | | | | | | | | 932,643 | |
| | | | | | | | | | | | | | | | |
|
Materials: 4.51% | |
|
| Chemicals: 0.37% | |
| | | | |
Valvoline Incorporated | | | | | | | | | | | 7,382 | | | | 149,043 | |
| | | | | | | | | | | | | | | | |
|
| Containers & Packaging: 0.84% | |
| | | | |
Ardagh Group SA | | | | | | | | | | | 1,941 | | | | 32,279 | |
| | | | |
Sonoco Products Company | | | | | | | | | | | 5,008 | | | | 300,630 | |
| | | | |
| | | | | | | | | | | | | | | 332,909 | |
| | | | | | | | | | | | | | | | |
|
| Metals & Mining: 3.30% | |
| | | | |
Newmont Goldcorp Corporation | | | | | | | | | | | 12,726 | | | | 464,753 | |
| | | | |
Royal Gold Incorporated | | | | | | | | | | | 7,375 | | | | 844,069 | |
| | | | |
| | | | | | | | | | | | | | | 1,308,822 | |
| | | | | | | | | | | | | | | | |
|
Real Estate: 2.17% | |
|
| Equity REITs: 2.17% | |
| | | | |
Apple Hospitality REIT Incorporated | | | | | | | | | | | 11,977 | | | | 188,159 | |
| | | | |
Equity Commonwealth | | | | | | | | | | | 5 | | | | 168 | |
| | | | |
VICI Properties Incorporated | | | | | | | | | | | 31,488 | | | | 671,954 | |
| | | | |
| | | | | | | | | | | | | | | 860,281 | |
| | | | | | | | | | | | | | | | |
The accompanying notes are an integral part of these financial statements.
14 | Wells Fargo Low Volatility U.S. Equity Fund
Portfolio of investments—July 31, 2019
| | | | | | | | | | | | | | | | |
| | | | | | | | | Shares | | | Value | |
Utilities: 8.56% | |
|
| Electric Utilities: 5.78% | |
| | | | |
American Electric Power Company Incorporated | | | | | | | | | | | 2,997 | | | $ | 263,167 | |
| | | | |
Hawaiian Electric Industries Incorporated | | | | | | | | | | | 8,736 | | | | 391,373 | |
| | | | |
NextEra Energy Incorporated | | | | | | | | | | | 3,495 | | | | 724,059 | |
| | | | |
Pinnacle West Capital Corporation | | | | | | | | | | | 7,372 | | | | 672,474 | |
| | | | |
Xcel Energy Incorporated | | | | | | | | | | | 4,132 | | | | 246,308 | |
| | | | |
| | | | | | | | | | | | | | | 2,297,381 | |
| | | | | | | | | | | | | | | | |
| | | | |
| Multi-Utilities: 2.78% | | | | | | | | | | | | |
| | | | |
Ameren Corporation | | | | | | | | | | | 1,347 | | | | 101,954 | |
| | | | |
CenterPoint Energy Incorporated | | | | | | | | | | | 3,079 | | | | 89,322 | |
| | | | |
CMS Energy Corporation | | | | | | | | | | | 8,189 | | | | 476,764 | |
| | | | |
Dominion Energy Incorporated | | | | | | | | | | | 482 | | | | 35,808 | |
| | | | |
DTE Energy Company | | | | | | | | | | | 3,144 | | | | 399,634 | |
| | | | |
| | | | | | | | | | | | | | | 1,103,482 | |
| | | | | | | | | | | | | | | | |
| | | | |
Total Common Stocks (Cost $33,070,968) | | | | | | | | | | | | | | | 38,576,254 | |
| | | | | | | | | | | | | | | | |
| | | | |
| | | | | | | | | | | | | | | | |
| | | Yield | | | | | | | | | | |
Short-Term Investments: 2.90% | | | | | | | | | | | | | | | | |
| | | | |
| Investment Companies: 2.90% | | | | | | | | | | | | |
| | | | |
Wells Fargo Government Money Market Fund Select Class (I)(u) | | | 2.26 | % | | | | | | | 1,153,395 | | | | 1,153,395 | |
| | | | | | | | | | | | | | | | |
| | | | |
Total Short-Term Investments (Cost $1,153,395) | | | | | | | | | | | | | | | 1,153,395 | |
| | | | | | | | | | | | | | | | |
| | | | | | | | |
| Total investments in securities (Cost $34,224,363) | | | 100.04 | % | | | 39,729,649 | |
| | |
Other assets and liabilities, net | | | (0.04 | ) | | | (15,394 | ) |
| | | | | | | | |
| Total net assets | | | 100.00 | % | | $ | 39,714,255 | |
| | | | | | | | |
| † | Non-income-earning security |
| (I) | The issue of the security is an affiliated person of the Fund as defined in the Investment Company Act of 1940. |
| (u) | The rate represents the7-day annualized yield at period end. |
Abbreviations:
| REIT | Real state investment trust |
Investments in Affiliates
An affiliated investment is an investment in which the Fund owns at least 5% of the outstanding voting shares of the issuer or as a result of other relationships, such as the Fund and the issuer having the same investment manager. Transactions with issuers that were either affiliated persons of the Fund at the beginning of the period or the end of the period were as follows:
| | | | | | | | | | | | | | | | | | | | | | | | | | | | | | | | | | | | |
| | | Shares,
beginning
of period | | | Shares
purchased | | | Shares
sold | | | Shares,
end of
period | | | Net
realized
gains
(losses) | | | Net
change in
unrealized
gains
(losses) | | | Income
from
affiliated
securities | | | Value,
end
of period | | | % of
net
assets | |
Short-Term Investments | | | | | | | | | | | | | | | | | | | | | | | | | | | | | | | | | | | | |
Investment Companies | | | | | | | | | | | | | | | | | | | | | | | | | | | | | | | | | | | | |
Wells Fargo Government Money Market Fund Select Class | | | 922,225 | | | | 8,045,325 | | | | 7,814,155 | | | | 1,153,395 | | | $ | 0 | | | $ | 0 | | | $ | 21,366 | | | $ | 1,153,395 | | | | 2.90 | % |
The accompanying notes are an integral part of these financial statements.
Wells Fargo Low Volatility U.S. Equity Fund | 15
Statement of assets and liabilities—July 31, 2019
| | | | |
| | | | |
| |
Assets | | | | |
Investments in unaffiliated securities, at value (cost $33,070,968) | | $ | 38,576,254 | |
Investments in affiliated securities, at value (cost $1,153,395) | | | 1,153,395 | |
Receivable for Fund shares sold | | | 13,775 | |
Receivable for dividends | | | 31,943 | |
Receivable from manager | | | 10,872 | |
Prepaid expenses and other assets | | | 17,131 | |
| | | | |
Total assets | | | 39,803,370 | |
| | | | |
| |
Liabilities | | | | |
Professional fees payable | | | 44,690 | |
Shareholder report expenses payable | | | 23,404 | |
Custodian and accounting fees payable | | | 10,261 | |
Administration fees payable | | | 4,409 | |
Trustees’ fees and expenses payable | | | 4,318 | |
Payable for Fund shares redeemed | | | 1,500 | |
Distribution fee payable | | | 123 | |
Accrued expenses and other liabilities | | | 410 | |
| | | | |
Total liabilities | | | 89,115 | |
| | | | |
Total net assets | | $ | 39,714,255 | |
| | | | |
| |
Net assets consist of | | | | |
Paid-in capital | | $ | 33,488,336 | |
Total distributable earnings | | | 6,225,919 | |
| | | | |
Total net assets | | $ | 39,714,255 | |
| | | | |
| |
Computation of net asset value and offering price per share | | | | |
Net assets – Class A | | $ | 1,538,915 | |
Shares outstanding – Class A1 | | | 127,275 | |
Net asset value per share – Class A | | | $12.09 | |
Maximum offering price per share – Class A2 | | | $12.83 | |
Net assets – Class C | | $ | 304,514 | |
Shares outstanding – Class C1 | | | 25,363 | |
Net asset value per share – Class C | | | $12.01 | |
Net assets – Class R6 | | $ | 1,216,795 | |
Shares outstanding – Class R61 | | | 100,480 | |
Net asset value per share – Class R6 | | | $12.11 | |
Net assets – Administrator Class | | $ | 121,339 | |
Shares outstanding – Administrator Class1 | | | 10,042 | |
Net asset value per share – Administrator Class | | | $12.08 | |
Net assets – Institutional Class | | $ | 36,532,692 | |
Shares outstanding – Institutional Class1 | | | 3,017,333 | |
Net asset value per share – Institutional Class | | | $12.11 | |
| ¹ | The Fund has an unlimited number of authorized shares. |
| ² | Maximum offering price is computed as 100/94.25 of net asset value. On investments of $50,000 or more, the offering price is reduced. |
The accompanying notes are an integral part of these financial statements.
16 | Wells Fargo Low Volatility U.S. Equity Fund
Statement of operations—year ended July 31, 2019
| | | | |
| | | | |
| |
Investment income | | | | |
Dividends (net of foreign withholding taxes of $406) | | $ | 943,694 | |
Income from affiliated securities | | | 21,366 | |
| | | | |
Total investment income | | | 965,060 | |
| | | | |
| |
Expenses | | | | |
Management fee | | | 148,227 | |
Administration fees | |
Class A | | | 2,785 | |
Class C | | | 500 | |
Class R6 | | | 341 | |
Administrator Class | | | 147 | |
Institutional Class | | | 44,514 | |
Shareholder servicing fees | |
Class A | | | 3,316 | |
Class C | | | 596 | |
Administrator Class | | | 284 | |
Distribution fee | |
Class C | | | 1,636 | |
Custody and accounting fees | | | 12,724 | |
Professional fees | | | 53,341 | |
Registration fees | | | 89,133 | |
Shareholder report expenses | | | 49,998 | |
Trustees’ fees and expenses | | | 21,999 | |
Other fees and expenses | | | 9,070 | |
| | | | |
Total expenses | | | 438,611 | |
Less: Fee waivers and/or expense reimbursements | | | (271,405 | ) |
| | | | |
Net expenses | | | 167,206 | |
| | | | |
Net investment income | | | 797,854 | |
| | | | |
| |
Realized and unrealized gains (losses) on investments | | | | |
Net realized gains on investments | | | 1,004,676 | |
Net change in unrealized gains (losses) on investments | | | 2,805,492 | |
| | | | |
Net realized and unrealized gains (losses) on investments | | | 3,810,168 | |
| | | | |
Net increase in net assets resulting from operations | | $ | 4,608,022 | |
| | | | |
The accompanying notes are an integral part of these financial statements.
Wells Fargo Low Volatility U.S. Equity Fund | 17
Statement of changes in net assets
| | | | | | | | | | | | | | | | |
| | | Year ended
July 31, 2019 | | | Year ended
July 31, 20181 | |
| | | | |
Operations | | | | | | | | | | | | | | | | |
Net investment income | | | | | | $ | 797,854 | | | | | | | $ | 709,204 | |
Net realized gains on investments | | | | | | | 1,004,676 | | | | | | | | 1,575,047 | |
Net change in unrealized gains (losses) on investments | | | | | | | 2,805,492 | | | | | | | | 219,615 | |
| | | | |
Net increase in net assets resulting from operations | | | | | | | 4,608,022 | | | | | | | | 2,503,866 | |
| | | | |
| | | | |
Distribution to shareholders from net investment income and net realized gains | | | | | | | | | | | | | | | | |
Class A | | | | | | | (97,183 | ) | | | | | | | (39,204 | ) |
Class C | | | | | | | (13,679 | ) | | | | | | | (2,805 | ) |
Class R6 | | | | | | | (88,854 | ) | | | | | | | (41,008 | ) |
Administrator Class | | | | | | | (8,480 | ) | | | | | | | (3,707 | ) |
Institutional Class | | | | | | | (2,610,423 | ) | | | | | | | (1,251,431 | ) |
| | | | |
Total distributions to shareholders | | | | | | | (2,818,619 | ) | | | | | | | (1,338,155 | ) |
| | | | |
| | | | |
Capital share transactions | | | Shares | | | | | | | | Shares | | | | | |
Proceeds from shares sold | | | | | | | | | | | | | | | | |
Class A | | | 22,375 | | | | 258,259 | | | | 36,479 | | | | 411,267 | |
Class C | | | 14,213 | | | | 159,144 | | | | 7,545 | | | | 83,872 | |
Institutional Class | | | 98,413 | | | | 1,093,577 | | | | 321,940 | | | | 3,618,353 | |
| | | | |
| | | | | | | 1,510,980 | | | | | | | | 4,113,492 | |
| | | | |
Reinvestment of distributions | | | | | | | | | | | | | | | | |
Class A | | | 8,338 | | | | 88,821 | | | | 3,092 | | | | 35,640 | |
Class C | | | 567 | | | | 5,999 | | | | 3 | | | | 37 | |
Institutional Class | | | 50,399 | | | | 537,420 | | | | 25,951 | | | | 299,171 | |
| | | | |
| | | | | | | 632,240 | | | | | | | | 334,848 | |
| | | | |
Payment for shares redeemed | | | | | | | | | | | | | | | | |
Class A | | | (16,971 | ) | | | (182,876 | ) | | | (23,744 | ) | | | (260,000 | ) |
Class C | | | (5,662 | ) | | | (66,877 | ) | | | (1,331 | ) | | | (15,125 | ) |
Class R | | | N/A | | | | N/A | | | | (10,037 | )2 | | | (114,115 | )2 |
Institutional Class | | | (205,601 | ) | | | (2,340,479 | ) | | | (227,303 | ) | | | (2,583,866 | ) |
| | | | |
| | | | | | | (2,590,232 | ) | | | | | | | (2,973,106 | ) |
| | | | |
Net increase (decrease) in net assets resulting from capital share transactions | | | | | | | (447,012 | ) | | | | | | | 1,475,234 | |
| | | | |
Total increase in net assets | | | | | | | 1,342,391 | | | | | | | | 2,640,945 | |
| | | | |
| | | | |
Net assets | | | | | | | | | | | | | | | | |
Beginning of period | | | | | | | 38,371,864 | | | | | | | | 35,730,919 | |
| | | | |
End of period | | | | | | $ | 39,714,255 | | | | | | | $ | 38,371,864 | |
| | | | |
| 1 | Effective for all filings after November 4, 2018, the SEC prospectively eliminated the requirement to parenthetically disclose undistributed net Investment at the end of the period and permitted the aggregation of distribution, with the exception of tax basis returns of capital. Undistributed net investment income at July 31, 2018 was $364,175. The disaggregated distributions information for the year ended July 31, 2018 is included in Note 7,Distribution to Shareholders, in the notes to the financial statements. |
| 2 | For the period from August 1, 2017 to November 13, 2017. Effective at the close of business on November 13, 2017, Class R shares were liquidated and the class was subsequently closed. Class R shares are no longer offered by the Fund. |
The accompanying notes are an integral part of these financial statements.
18 | Wells Fargo Low Volatility U.S. Equity Fund
Financial highlights
(For a share outstanding throughout each period)
| | | | | | | | | | | | |
| | | Year ended July 31 | |
| CLASS A | | 2019 | | | 2018 | | | 20171 | |
Net asset value, beginning of period | | | $11.56 | | | | $11.21 | | | | $10.00 | |
Net investment income | | | 0.19 | | | | 0.16 | | | | 0.13 | |
Net realized and unrealized gains (losses) on investments | | | 1.17 | | | | 0.54 | | | | 1.12 | |
| | | | | | | | | | | | |
Total from investment operations | | | 1.36 | | | | 0.70 | | | | 1.25 | |
Distributions to shareholders from | | | | | | | | | | | | |
Net investment income | | | (0.18 | ) | | | (0.17 | ) | | | (0.04 | ) |
Net realized gains | | | (0.65 | ) | | | (0.18 | ) | | | 0.00 | |
| | | | | | | | | | | | |
Total distributions to shareholders | | | (0.83 | ) | | | (0.35 | ) | | | (0.04 | ) |
Net asset value, end of period | | | $12.09 | | | | $11.56 | | | | $11.21 | |
Total return2 | | | 12.87 | % | | | 6.32 | % | | | 12.53 | % |
Ratios to average net assets (annualized) | | | | | | | | | | | | |
Gross expenses | | | 1.50 | % | | | 1.55 | % | | | 1.61 | % |
Net expenses | | | 0.76 | % | | | 0.83 | % | | | 0.82 | % |
Net investment income | | | 1.83 | % | | | 1.53 | % | | | 1.78 | % |
Supplemental data | | | | | | | | | | | | |
Portfolio turnover rate | | | 74 | % | | | 75 | % | | | 39 | % |
Net assets, end of period (000s omitted) | | | $1,539 | | | | $1,312 | | | | $1,096 | |
| 1 | For the period from October 31, 2016 (commencement of class operations) to July 31, 2017 |
| 2 | Total return calculations do not include any sales charges. Returns for periods of less than one year are not annualized. |
The accompanying notes are an integral part of these financial statements.
Wells Fargo Low Volatility U.S. Equity Fund | 19
Financial highlights
(For a share outstanding throughout each period)
| | | | | | | | | | | | |
| | | Year ended July 31 | |
| CLASS C | | 2019 | | | 2018 | | | 20171 | |
Net asset value, beginning of period | | | $11.49 | | | | $11.16 | | | | $10.00 | |
Net investment income | | | 0.11 | | | | 0.08 | | | | 0.08 | |
Net realized and unrealized gains (losses) on investments | | | 1.17 | | | | 0.52 | | | | 1.11 | |
| | | | | | | | | | | | |
Total from investment operations | | | 1.28 | | | | 0.60 | | | | 1.19 | |
Distributions to shareholders from | | | | | | | | | | | | |
Net investment income | | | (0.11 | ) | | | (0.09 | ) | | | (0.03 | ) |
Net realized gains | | | (0.65 | ) | | | (0.18 | ) | | | 0.00 | |
| | | | | | | | | | | | |
Total distributions to shareholders | | | (0.76 | ) | | | (0.27 | ) | | | (0.03 | ) |
Net asset value, end of period | | | $12.01 | | | | $11.49 | | | | $11.16 | |
Total return2 | | | 12.15 | % | | | 5.45 | % | | | 11.91 | % |
Ratios to average net assets (annualized) | | | | | | | | | | | | |
Gross expenses | | | 2.18 | % | | | 2.31 | % | | | 2.40 | % |
Net expenses | | | 1.51 | % | | | 1.58 | % | | | 1.58 | % |
Net investment income | | | 1.10 | % | | | 0.76 | % | | | 1.01 | % |
Supplemental data | | | | | | | | | | | | |
Portfolio turnover rate | | | 74 | % | | | 75 | % | | | 39 | % |
Net assets, end of period (000s omitted) | | | $305 | | | | $187 | | | | $112 | |
| 1 | For the period from October 31, 2016 (commencement of class operations) to July 31, 2017 |
| 2 | Total return calculations do not include any sales charges. Returns for periods of less than one year are not annualized. |
The accompanying notes are an integral part of these financial statements.
20 | Wells Fargo Low Volatility U.S. Equity Fund
Financial highlights
(For a share outstanding throughout each period)
| | | | | | | | | | | | |
| | | Year ended July 31 | |
| CLASS R6 | | 2019 | | | 2018 | | | 20171 | |
Net asset value, beginning of period | | | $11.58 | | | | $11.24 | | | | $10.00 | |
Net investment income | | | 0.26 | | | | 0.22 | | | | 0.18 | |
Net realized and unrealized gains (losses) on investments | | | 1.15 | | | | 0.52 | | | | 1.11 | |
| | | | | | | | | | | | |
Total from investment operations | | | 1.41 | | | | 0.74 | | | | 1.29 | |
Distributions to shareholders from | | | | | | | | | | | | |
Net investment income | | | (0.23 | ) | | | (0.22 | ) | | | (0.05 | ) |
Net realized gains | | | (0.65 | ) | | | (0.18 | ) | | | 0.00 | |
| | | | | | | | | | | | |
Total distributions to shareholders | | | (0.88 | ) | | | (0.40 | ) | | | (0.05 | ) |
Net asset value, end of period | | | $12.11 | | | | $11.58 | | | | $11.24 | |
Total return2 | | | 13.39 | % | | | 6.70 | % | | | 12.94 | % |
Ratios to average net assets (annualized) | | | | | | | | | | | | |
Gross expenses | | | 1.07 | % | | | 1.12 | % | | | 1.22 | % |
Net expenses | | | 0.33 | % | | | 0.40 | % | | | 0.40 | % |
Net investment income | | | 2.27 | % | | | 1.96 | % | | | 2.19 | % |
Supplemental data | | | | | | | | | | | | |
Portfolio turnover rate | | | 74 | % | | | 75 | % | | | 39 | % |
Net assets, end of period (000s omitted) | | | $1,217 | | | | $1,164 | | | | $1,129 | |
| 1 | For the period from October 31, 2016 (commencement of class operations) to July 31, 2017 |
| 2 | Returns for periods of less than one year are not annualized. |
The accompanying notes are an integral part of these financial statements.
Wells Fargo Low Volatility U.S. Equity Fund | 21
Financial highlights
(For a share outstanding throughout each period)
| | | | | | | | | | | | |
| | | Year ended July 31 | |
| ADMINISTRATOR CLASS | | 2019 | | | 2018 | | | 20171 | |
Net asset value, beginning of period | | | $11.55 | | | | $11.21 | | | | $10.00 | |
Net investment income | | | 0.22 | | | | 0.18 | | | | 0.15 | |
Net realized and unrealized gains (losses) on investments | | | 1.15 | | | | 0.53 | | | | 1.10 | |
| | | | | | | | | | | | |
Total from investment operations | | | 1.37 | | | | 0.71 | | | | 1.25 | |
Distributions to shareholders from | | | | | | | | | | | | |
Net investment income | | | (0.19 | ) | | | (0.19 | ) | | | (0.04 | ) |
Net realized gains | | | (0.65 | ) | | | (0.18 | ) | | | 0.00 | |
| | | | | | | | | | | | |
Total distributions to shareholders | | | (0.84 | ) | | | (0.37 | ) | | | (0.04 | ) |
Net asset value, end of period | | | $12.08 | | | | $11.55 | | | | $11.21 | |
Total return2 | | | 13.00 | % | | | 6.36 | % | | | 12.57 | % |
Ratios to average net assets (annualized) | | | | | | | | | | | | |
Gross expenses | | | 1.42 | % | | | 1.47 | % | | | 1.57 | % |
Net expenses | | | 0.68 | % | | | 0.75 | % | | | 0.75 | % |
Net investment income | | | 1.92 | % | | | 1.61 | % | | | 1.87 | % |
Supplemental data | | | | | | | | | | | | |
Portfolio turnover rate | | | 74 | % | | | 75 | % | | | 39 | % |
Net assets, end of period (000s omitted) | | | $121 | | | | $116 | | | | $113 | |
| 1 | For the period from October 31, 2016 (commencement of class operations) to July 31, 2017 |
| 2 | Returns for periods of less than one year are not annualized. |
The accompanying notes are an integral part of these financial statements.
22 | Wells Fargo Low Volatility U.S. Equity Fund
Financial highlights
(For a share outstanding throughout each period)
| | | | | | | | | | | | |
| | | Year ended July 31 | |
| INSTITUTIONAL CLASS | | 2019 | | | 2018 | | | 20171 | |
Net asset value, beginning of period | | | $11.58 | | | | $11.23 | | | | $10.00 | |
Net investment income | | | 0.25 | | | | 0.20 | | | | 0.16 | |
Net realized and unrealized gains (losses) on investments | | | 1.15 | | | | 0.54 | | | | 1.12 | |
| | | | | | | | | | | | |
Total from investment operations | | | 1.40 | | | | 0.74 | | | | 1.28 | |
Distributions to shareholders from | | | | | | | | | | | | |
Net investment income | | | (0.22 | ) | | | (0.21 | ) | | | (0.05 | ) |
Net realized gains | | | (0.65 | ) | | | (0.18 | ) | | | 0.00 | |
| | | | | | | | | | | | |
Total distributions to shareholders | | | (0.87 | ) | | | (0.39 | ) | | | (0.05 | ) |
Net asset value, end of period | | | $12.11 | | | | $11.58 | | | | $11.23 | |
Total return2 | | | 13.28 | % | | | 6.64 | % | | | 12.82 | % |
Ratios to average net assets (annualized) | | | | | | | | | | | | |
Gross expenses | | | 1.17 | % | | | 1.22 | % | | | 1.31 | % |
Net expenses | | | 0.43 | % | | | 0.50 | % | | | 0.50 | % |
Net investment income | | | 2.17 | % | | | 1.87 | % | | | 2.09 | % |
Supplemental data | | | | | | | | | | | | |
Portfolio turnover rate | | | 74 | % | | | 75 | % | | | 39 | % |
Net assets, end of period (000s omitted) | | | $36,533 | | | | $35,593 | | | | $33,169 | |
| 1 | For the period from October 31, 2016 (commencement of class operations) to July 31, 2017 |
| 2 | Returns for periods of less than one year are not annualized. |
The accompanying notes are an integral part of these financial statements.
Wells Fargo Low Volatility U.S. Equity Fund | 23
Notes to financial statements
1. ORGANIZATION
Wells Fargo Funds Trust (the “Trust”), a Delaware statutory trust organized on March 10, 1999, is anopen-end management investment company registered under the Investment Company Act of 1940, as amended (the “1940 Act”). As an investment company, the Trust follows the accounting and reporting guidance in Financial Accounting Standards Board (“FASB”)Accounting Standards Codification Topic 946, Financial Services – Investment Companies. These financial statements report on the Wells Fargo Low Volatility U.S. Equity Fund (the “Fund”) which is a diversified series of the Trust.
Effective at the close of business on November 13, 2017, Class R shares were liquidated and the class was subsequently closed. Class R shares are no longer offered by the Fund. Information for Class R shares reflected in the financial statements represents activity through November 13, 2017.
2. SIGNIFICANT ACCOUNTING POLICIES
The following significant accounting policies, which are consistently followed in the preparation of the financial statements of the Fund, are in conformity with U.S. generally accepted accounting principles which require management to make estimates and assumptions that affect the reported amounts of assets and liabilities, disclosure of contingent assets and liabilities at the date of the financial statements, and the reported amounts of revenues and expenses during the reporting period. Actual results could differ from those estimates.
Securities valuation
All investments are valued each business day as of the close of regular trading on the New York Stock Exchange (generally 4 p.m. Eastern Time), although the Fund may deviate from this calculation time under unusual or unexpected circumstances.
Equity securities that are listed on a foreign or domestic exchange or market are valued at the official closing price or, if none, the last sales price. If no sale occurs on the principal exchange or market that day, a fair value price will be determined in accordance with the Fund’s Valuation Procedures.
Investments in registeredopen-end investment companies are valued at net asset value.
Investments which are not valued using any of the methods discussed above are valued at their fair value, as determined in good faith by the Board of Trustees of the Fund. The Board of Trustees has established a Valuation Committee comprised of the Trustees and has delegated to it the authority to take any actions regarding the valuation of portfolio securities that the Valuation Committee deems necessary or appropriate, including determining the fair value of portfolio securities, unless the determination has been delegated to the Wells Fargo Asset Management Pricing Committee at Wells Fargo Funds Management, LLC (“Funds Management”). The Board of Trustees retains the authority to make or ratify any valuation decisions or approve any changes to the Valuation Procedures as it deems appropriate. On a quarterly basis, the Board of Trustees receives reports on any valuation actions taken by the Valuation Committee or the Wells Fargo Asset Management Pricing Committee which may include items for ratification.
Security transactions and income recognition
Securities transactions are recorded on a trade date basis. Realized gains or losses are recorded on the basis of identified cost.
Dividend income is recognized on theex-dividend date. Dividend income is recorded net of foreign taxes withheld where recovery of such taxes is not assured.
Distributions to shareholders
Distributions to shareholders from net investment income and any net realized gains are recorded on theex-dividend date and paid at least annually. Such distributions are determined in accordance with income tax regulations and may differ from U.S. generally accepted accounting principles. Dividend sources are estimated at the time of declaration. The tax character of distributions is determined as of the Fund’s fiscal year end. Therefore, a portion of the Fund’s distributions made prior to the Fund’s fiscal year end may be categorized as a tax return of capital at year end.
Federal and other taxes
The Fund intends to continue to qualify as a regulated investment company by distributing substantially all of its investment company taxable income and any net realized capital gains (after reduction for capital loss carryforwards) sufficient to relieve it from all, or substantially all, federal income taxes. Accordingly, no provision for federal income taxes was required.
The Fund’s income and federal excise tax returns and all financial records supporting those returns for the prior three fiscal years are subject to examination by the federal and Delaware revenue authorities. Management has analyzed the Fund’s tax positions taken on federal, state, and foreign tax returns for all open tax years and does not believe that there are any uncertain tax positions that require recognition of a tax liability.
24 | Wells Fargo Low Volatility U.S. Equity Fund
Notes to financial statements
As of July 31, 2019, the aggregate cost of all investments for federal income tax purposes was $34,363,309 and the unrealized gains (losses) consisted of:
| | | | |
| |
Gross unrealized gains | | $ | 5,947,622 | |
| |
Gross unrealized losses | | | (581,282 | ) |
| |
Net unrealized gains | | $ | 5,366,340 | |
Class allocations
The separate classes of shares offered by the Fund differ principally in applicable sales charges, distribution, shareholder servicing, and administration fees. Class specific expenses are charged directly to that share class. Investment income, common fund-level expenses, and realized and unrealized gains (losses) on investments are allocated daily to each class of shares based on the relative proportion of net assets of each class.
3. FAIR VALUATION MEASUREMENTS
Fair value measurements of investments are determined within a framework that has established a fair value hierarchy based upon the various data inputs utilized in determining the value of the Fund’s investments. The three-level hierarchy gives the highest priority to unadjusted quoted prices in active markets for identical assets or liabilities (Level 1) and the lowest priority to unobservable inputs (Level 3). The Fund’s investments are classified within the fair value hierarchy based on the lowest level of input that is significant to the fair value measurement. The inputs are summarized into three broad levels as follows:
| ∎ | | Level 1 – quoted prices in active markets for identical securities |
| ∎ | | Level 2 – other significant observable inputs (including quoted prices for similar securities, interest rates, prepayment speeds, credit risk, etc.) |
| ∎ | | Level 3 – significant unobservable inputs (including the Fund’s own assumptions in determining the fair value of investments) |
The inputs or methodologies used for valuing investments in securities are not necessarily an indication of the risk associated with investing in those securities.
The following is a summary of the inputs used in valuing the Fund’s assets and liabilities as of July 31, 2019:
| | | | | | | | | | | | | | | | |
| | | | |
| | | Quoted prices
(Level 1) | | | Other significant
observable inputs
(Level 2) | | | Significant
unobservable inputs (Level 3) | | | Total | |
| | | | |
Assets | | | | | | | | | | | | | | | | |
Investments in: | | | | | | | | | | | | | | | | |
| | | | |
Common stocks | | | | | | | | | | | | | | | | |
| | | | |
Communication services | | $ | 3,249,826 | | | $ | 0 | | | $ | 0 | | | $ | 3,249,826 | |
| | | | |
Consumer discretionary | | | 3,026,701 | | | | 0 | | | | 0 | | | | 3,026,701 | |
| | | | |
Consumer staples | | | 7,747,696 | | | | 0 | | | | 0 | | | | 7,747,696 | |
| | | | |
Energy | | | 163,362 | | | | 0 | | | | 0 | | | | 163,362 | |
| | | | |
Financials | | | 5,586,312 | | | | 0 | | | | 0 | | | | 5,586,312 | |
| | | | |
Health care | | | 1,164,172 | | | | 0 | | | | 0 | | | | 1,164,172 | |
| | | | |
Industrials | | | 5,204,502 | | | | 0 | | | | 0 | | | | 5,204,502 | |
| | | | |
Information technology | | | 6,381,765 | | | | 0 | | | | 0 | | | | 6,381,765 | |
| | | | |
Materials | | | 1,790,774 | | | | 0 | | | | 0 | | | | 1,790,774 | |
| | | | |
Real estate | | | 860,281 | | | | 0 | | | | 0 | | | | 860,281 | |
| | | | |
Utilities | | | 3,400,863 | | | | 0 | | | | 0 | | | | 3,400,863 | |
| | | | |
Short-term investments | | | | | | | | | | | | | | | | |
| | | | |
Investment companies | | | 1,153,395 | | | | 0 | | | | 0 | | | | 1,153,395 | |
| | | | |
Total assets | | $ | 39,729,649 | | | $ | 0 | | | $ | 0 | | | $ | 39,729,649 | |
Additional sector, industry or geographic detail is included in the Portfolio of Investments.
For the year ended July 31, 2019, the Fund did not have any transfers into/out of Level 3.
Wells Fargo Low Volatility U.S. Equity Fund | 25
Notes to financial statements
4. TRANSACTIONS WITH AFFILIATES
Management fee
Funds Management, an indirect wholly owned subsidiary of Wells Fargo & Company (“Wells Fargo”), is the manager of the Fund and provides advisory and fund-level administrative services under an investment management agreement. Under the investment management agreement, Funds Management is responsible for, among other services, implementing the investment objectives and strategies of the Fund, supervising the subadviser and providing fund-level administrative services in connection with the Fund’s operations. As compensation for its services under the investment management agreement, Funds Management is entitled to receive a management fee at the following annual rate based on the Fund’s average daily net assets:
| | | | |
| |
| Average daily net assets | | Management fee | |
| |
First $1 billion | | | 0.400 | % |
| |
Next $4 billion | | | 0.375 | |
| |
Next $5 billion | | | 0.340 | |
| |
Over $10 billion | | | 0.330 | |
For the year ended July 31, 2019, the management fee was equivalent to an annual rate of 0.40% of the Fund’s average daily net assets.
Funds Management has retained the services of a subadviser to provide daily portfolio management to the Fund. The fee for subadvisory services is borne by Funds Management. Wells Capital Management Incorporated (“WellsCap”), an affiliate of Funds Management and an indirect wholly owned subsidiary of Wells Fargo, is the subadviser to the Fund and is entitled to receive a fee from Funds Management at an annual rate starting at 0.20% and declining to 0.12% as the average daily net assets of the Fund increase. Prior to November 1, 2018, Analytic Investors, LLC served as the subadviser and received an annual fee from Funds Management at the same rates. On November 1, 2018, Analytic Investors, LLC was consolidated into WellsCap.
Administration fees
Under a class-level administration agreement, Funds Management provides class-level administrative services to the Fund, which includes paying fees and expenses for services provided by the transfer agent,sub-transfer agents, omnibus account servicers and record-keepers. As compensation for its services under the class-level administration agreement, Funds Management receives an annual fee which is calculated based on the average daily net assets of each class as follows:
| | | | |
| |
| | | Class-level
administration fee | |
| |
Class A, Class C | | | 0.21 | % |
| |
Class R6 | | | 0.03 | |
| |
Administrator Class, Institutional Class | | | 0.13 | |
Waivers and/or expense reimbursements
Funds Management has contractually waived and/or reimbursed management and administration fees to the extent necessary to maintain certain net operating expense ratios for the Fund. When each class of the Fund has exceeded its expense cap, Funds Management has waived fees and/or reimbursed expenses from fund-level expenses on a proportionate basis and then from class specific expenses. When only certain classes exceed their expense caps, waivers and/or reimbursements are applied against class specific expenses before fund-level expenses. Funds Management has committed through November 30, 2019 to waive fees and/or reimburse expenses to the extent necessary to cap the Fund’s expenses at 0.73% for Class A shares, 1.48% for Class C shares, 0.30% for Class R6 shares, 0.65% for Administrator Class shares, and 0.40% for Institutional Class shares. Prior to or after the commitment expiration date, the cap may be increased or the commitment to maintain the cap may be terminated only with the approval of the Board of Trustees. Prior to December 1, 2018, the Fund’s expenses were capped at 0.83% for Class A shares, 1.58% for Class C shares, 0.40% for Class R6 shares, 0.75% for Administrator Class shares, and 0.50% for Institutional Class shares.
Distribution fee
The Trust has adopted a distribution plan for Class C shares of the Fund pursuant to Rule12b-1 under the 1940 Act. A distribution fee is charged to Class C shares and paid to Wells Fargo Funds Distributor, LLC (“Funds Distributor”), the principal underwriter, at an annual rate of 0.75% of the average daily net assets of Class C shares.
26 | Wells Fargo Low Volatility U.S. Equity Fund
Notes to financial statements
In addition, Funds Distributor is entitled to receive thefront-end sales charge from the purchase of Class A shares and a contingent deferred sales charge on the redemption of certain Class A shares. Funds Distributor is also entitled to receive the contingent deferred sales charges from redemptions of Class C shares. For the year ended July 31, 2019, Funds Distributor received $87 from the sale of Class A shares. No contingent deferred sales charges were incurred by Class A and Class C shares for the year ended July 31, 2019.
Shareholder servicing fees
The Trust has entered into contracts with one or more shareholder servicing agents, whereby Class A, Class C, and Administrator Class of the Fund are charged a fee at an annual rate of 0.25% of the average daily net assets of each respective class. A portion of these total shareholder servicing fees were paid to affiliates of Wells Fargo.
Interfund transactions
The Fund may purchase or sell portfolio investment securities to certain other Wells Fargo affiliates pursuant to Rule17a-7 under the 1940 Act and under procedures adopted by the Board of Trustees. The procedures have been designed to ensure that these interfund transactions, which do not incur broker commissions, are effected at current market prices.
5. INVESTMENT PORTFOLIO TRANSACTIONS
Purchases and sales of investments, excluding U.S. government obligations (if any) and short-term securities, for the year ended July 31, 2019 were $26,664,512 and $29,273,718, respectively.
6. BANK BORROWINGS
The Trust (excluding the money market funds), Wells Fargo Master Trust and Wells Fargo Variable Trust are parties to a $280,000,000 revolving credit agreement whereby the Fund is permitted to use bank borrowings for temporary or emergency purposes, such as to fund shareholder redemption requests. Interest under the credit agreement is charged to the Fund based on a borrowing rate equal to the higher of the Federal Funds rate in effect on that day plus 1.25% or the overnight LIBOR rate in effect on that day plus 1.25%. In addition, an annual commitment fee equal to 0.25% of the unused balance is allocated to each participating fund.
For the year ended July 31, 2019, there were no borrowings by the Fund under the agreement.
7. DISTRIBUTIONS TO SHAREHOLDERS
The tax character of distributions paid during the years ended July 31, 2019 and July 31, 2018 were as follows:
| | | | | | | | |
| | | Year ended July 31 | |
| | |
| | | 2019 | | | 2018 | |
| | |
Ordinary income | | $ | 979,209 | | | $ | 1,337,744 | |
| | |
Long-term capital gain | | | 1,839,410 | | | | 411 | |
As of July 31, 2019, the components of distributable earnings on a tax basis were as follows:
| | | | |
Undistributed ordinary income | | Undistributed long-term gain | | Unrealized gains |
| | |
| $443,618 | | $415,961 | | $5,366,340 |
Effective for all filings after November 4, 2018, the Securities and Exchange Commission eliminated the requirement to separately state the components of distributions to shareholders under U.S. generally accepted accounting principles. The amounts of distributions to shareholders for the year ended July 31, 2018 were as follows:
| | | | | | | | |
| | |
| | | Net investment
income | | | Net realized
gains | |
| | |
Class A | | $ | 19,083 | | | $ | 20,121 | |
| | |
Class C | | | 941 | | | | 1,864 | |
| | |
Class R6 | | | 22,574 | | | | 18,434 | |
| | |
Administrator Class | | | 1,865 | | | | 1,842 | |
| | |
Institutional Class | | | 665,070 | | | | 586,361 | |
Wells Fargo Low Volatility U.S. Equity Fund | 27
Notes to financial statements
8. INDEMNIFICATION
Under the Trust’s organizational documents, the officers and Trustees have been granted certain indemnification rights against certain liabilities that may arise out of performance of their duties to the Trust. Additionally, in the normal course of business, the Trust may enter into contracts with service providers that contain a variety of indemnification clauses. The Trust’s maximum exposure under these arrangements is dependent on future claims that may be made against the Fund and, therefore, cannot be estimated.
9. NEW ACCOUNTING PRONOUNCEMENT
In August 2018, FASB issued Accounting Standards Update (“ASU”)No. 2018-13, Fair Value Measurement (Topic 820)Disclosure Framework—Changes to the Disclosure Requirements for Fair Value Measurement. ASU2018-13 updates the disclosure requirements for fair value measurements by modifying or removing certain disclosures and adding certain new disclosures. The amendments are effective for fiscal years, and interim periods within those fiscal years, beginning after December 15, 2019. Early adoption is permitted. Management has adopted the removal and modification of disclosures early, as permitted, and will adopt the additional new disclosures at the effective date.
28 | Wells Fargo Low Volatility U.S. Equity Fund
Report of independent registered public accounting firm
TO THE SHAREHOLDERS OF THE FUND AND BOARD OF TRUSTEES OF WELLS FARGO FUNDS TRUST:
Opinion on the Financial Statements
We have audited the accompanying statement of assets and liabilities of Wells Fargo Low Volatility U.S. Equity Fund (the Fund), one of the funds constituting Wells Fargo Funds Trust, including the portfolio of investments, as of July 31, 2019, the related statement of operations for the year then ended, the statements of changes in net assets for each of the years in the two-year period then ended, and the related notes (collectively, the financial statements) and the financial highlights for each of the years or periods in the period from October 31, 2016 (commencement of operations) to July 31, 2019. In our opinion, the financial statements and financial highlights present fairly, in all material respects, the financial position of the Fund as of July 31, 2019, the results of its operations for the year then ended, the changes in its net assets for each of the years in the two-year period then ended, and the financial highlights for each of the years or periods from the commencement of operations to July 31, 2019, in conformity with U.S. generally accepted accounting principles.
Basis for Opinion
These financial statements and financial highlights are the responsibility of the Fund’s management. Our responsibility is to express an opinion on these financial statements and financial highlights based on our audits. We are a public accounting firm registered with the Public Company Accounting Oversight Board (United States) (PCAOB) and are required to be independent with respect to the Fund in accordance with the U.S. federal securities laws and the applicable rules and regulations of the Securities and Exchange Commission and the PCAOB.
We conducted our audits in accordance with the standards of the PCAOB. Those standards require that we plan and perform the audit to obtain reasonable assurance about whether the financial statements and financial highlights are free of material misstatement, whether due to error or fraud. Our audits included performing procedures to assess the risks of material misstatement of the financial statements and financial highlights, whether due to error or fraud, and performing procedures that respond to those risks. Such procedures included examining, on a test basis, evidence regarding the amounts and disclosures in the financial statements and financial highlights. Such procedures also included confirmation of securities owned as of July 31, 2019, by correspondence with the custodian and transfer agent. Our audits also included evaluating the accounting principles used and significant estimates made by management, as well as evaluating the overall presentation of the financial statements and financial highlights. We believe that our audits provide a reasonable basis for our opinion.

We have not been able to determine the specific year that we began serving as the auditor of one or more Wells Fargo Funds investment companies; however we are aware that we have served as the auditor of one or more Wells Fargo Funds investment companies since at least 1955.
Boston, Massachusetts
September 25, 2019
Wells Fargo Low Volatility U.S. Equity Fund | 29
Other information (unaudited)
TAX INFORMATION
For corporate shareholders, pursuant to Section 854 of the Internal Revenue Code, 69.31% of ordinary income dividends qualify for the corporate dividends-received deduction for the fiscal year ended July 31, 2019.
Pursuant to Section 852 of the Internal Revenue Code, $1,839,410 was designated as a 20% rate gain distribution for the fiscal year ended July 31, 2019.
Pursuant to Section 854 of the Internal Revenue Code, $718,260 of income dividends paid during the fiscal year ended July 31, 2019 has been designated as qualified dividend income (QDI).
For the fiscal year ended July 31, 2019, $12,963 has been designated as interest-related dividends for nonresident alien shareholders pursuant to Section 871 of the Internal Revenue Code.
For the fiscal year ended July 31, 2019, $260,798 has been designated as short-term capital gain dividends for nonresident alien shareholders pursuant to Section 871 of the Internal Revenue Code.
PROXY VOTING INFORMATION
A description of the policies and procedures used to determine how to vote proxies relating to portfolio securities is available, upon request, by calling1-800-222-8222, visiting our website atwfam.com, or visiting the SEC website at sec.gov. Information regarding how the proxies related to portfolio securities were voted during the most recent12-month period ended June 30 is available on the website atwfam.comor by visiting the SEC website at sec.gov.
QUARTERLY PORTFOLIO HOLDINGS INFORMATION
The Fund files its complete schedule of portfolio holdings with the SEC for the first and third quarters of each fiscal year on Form N-Q or FormN-PORT, which is available by visiting the SEC website at sec.gov. Those forms may be reviewed and copied at the SEC’s Public Reference Room in Washington, DC. Information on the operation of the Public Reference Room may be obtained by calling1-800-SEC-0330.
30 | Wells Fargo Low Volatility U.S. Equity Fund
Other information (unaudited)
BOARD OF TRUSTEES AND OFFICERS
Each of the Trustees and Officers1 listed in the table below acts in identical capacities for each fund in the Wells Fargo family of funds, which consists of 152 mutual funds comprising the Wells Fargo Funds Trust, Wells Fargo Variable Trust, Wells Fargo Master Trust and fourclosed-end funds (collectively the “Fund Complex”). This table should be read in conjunction with the Prospectus and the Statement of Additional Information2. The mailing address of each Trustee and Officer is 525 Market Street, 12th Floor, San Francisco, CA 94105. Each Trustee and Officer serves an indefinite term, however, each Trustee serves such term until reaching the mandatory retirement age established by the Trustees.
Independent Trustees
| | | | | | |
Name and
year of birth | | Position held and
length of service* | | Principal occupations during past five years or longer | | Current other
public company or
investment
company
directorships |
| | | |
William R. Ebsworth
(Born 1957) | | Trustee,
since 2015 | | Retired. From 1984 to 2013, equities analyst, portfolio manager, research director and chief investment officer at Fidelity Management and Research Company in Boston, Tokyo, and Hong Kong, and retired in 2013 as Chief Investment Officer of Fidelity Strategic Advisers, Inc. where he led a team of investment professionals managing client assets. Prior thereto, Board member of Hong Kong Securities Clearing Co., Hong Kong Options Clearing Corp., the Thailand International Fund, Ltd., Fidelity Investments Life Insurance Company, and Empire Fidelity Investments Life Insurance Company. Audit Committee Chair and Investment Committee Chair of the Vincent Memorial Hospital Endowment(non-profit organization). Mr. Ebsworth is a CFA® charterholder. | | N/A |
| | | |
Jane A. Freeman
(Born 1953) | | Trustee,
since 2015;
Chair Liaison, since 2018 | | Retired. From 2012 to 2014 and 1999 to 2008, Chief Financial Officer of Scientific Learning Corporation. From 2008 to 2012, Ms. Freeman provided consulting services related to strategic business projects. Prior to 1999, Portfolio Manager at Rockefeller & Co. and Scudder, Stevens & Clark. Board member of the Harding Loevner Funds from 1996 to 2014, serving as both Lead Independent Director and chair of the Audit Committee. Board member of the Russell Exchange Traded Funds Trust from 2011 to 2012 and the chair of the Audit Committee. Ms. Freeman is a Board Member of The Ruth Bancroft Garden(non-profit organization). She is also an inactive Chartered Financial Analyst. | | N/A |
| | | |
Isaiah Harris, Jr.
(Born 1952) | | Trustee,
since 2009;
Audit Committee Chairman,
since 2019 | | Retired. Chairman of the Board of CIGNA Corporation since 2009, and Director since 2005. From 2003 to 2011, Director of Deluxe Corporation. Prior thereto, President and CEO of BellSouth Advertising and Publishing Corp. from 2005 to 2007, President and CEO of BellSouth Enterprises from 2004 to 2005 and President of BellSouth Consumer Services from 2000 to 2003. Emeritus member of the Iowa State University Foundation Board of Governors. Emeritus Member of the Advisory Board of Iowa State University School of Business. Advisory Board Member, Palm Harbor Academy (private school). Advisory Board Member, Child Evangelism Fellowship(non-profit). Mr. Harris is a certified public accountant (inactive status). | | CIGNA Corporation |
| | | |
Judith M. Johnson
(Born 1949) | | Trustee,
since 2008;
Audit Committee
Chairman, from 2009 to 2018 | | Retired. Prior thereto, Chief Executive Officer and Chief Investment Officer of Minneapolis Employees Retirement Fund from 1996 to 2008. Ms. Johnson is an attorney, certified public accountant and a certified managerial accountant. | | N/A |
Wells Fargo Low Volatility U.S. Equity Fund | 31
Other information (unaudited)
| | | | | | |
Name and
year of birth | | Position held and
length of service* | | Principal occupations during past five years or longer | | Current other
public company or
investment
company
directorships |
| | | |
David F. Larcker
(Born 1950) | | Trustee,
since 2009 | | James Irvin Miller Professor of Accounting at the Graduate School of Business, Stanford University, Director of the Corporate Governance Research Initiative and Senior Faculty of The Rock Center for Corporate Governance since 2006. From 2005 to 2008, Professor of Accounting at the Graduate School of Business, Stanford University. Prior thereto, Ernst & Young Professor of Accounting at The Wharton School, University of Pennsylvania from 1985 to 2005. | | N/A |
| | | |
Olivia S. Mitchell
(Born 1953) | | Trustee,
since 2006; Nominating and Governance Committee Chairman,
since 2018 | | International Foundation of Employee Benefit Plans Professor, Wharton School of the University of Pennsylvania since 1993. Director of Wharton’s Pension Research Council and Boettner Center on Pensions & Retirement Research, and Research Associate at the National Bureau of Economic Research. Previously, Cornell University Professor from 1978 to 1993. | | N/A |
| | | |
Timothy J. Penny
(Born 1951) | | Trustee,
since 1996; Chairman,
since 2018 | | President and Chief Executive Officer of Southern Minnesota Initiative Foundation, anon-profit organization, since 2007. Member of the Board of Trustees of NorthStar Education Finance, Inc., anon-profit organization, since 2007. | | N/A |
| | | |
James G. Polisson
(Born 1959) | | Trustee,
since 2018 | | Retired. Chief Marketing Officer, Source (ETF) UK Services, Ltd, from 2015 to 2017. From 2012 to 2015, Principal of The Polisson Group, LLC, a management consulting, corporate advisory and principal investing company. Chief Executive Officer and Managing Director at Russell Investments, Global Exchange Traded Funds from 2010 to 2012. Managing Director of Barclays Global Investors from 1998 to 2010 and Global Chief Marketing Officer for iShares and Barclays Global Investors from 2000 to 2010. Trustee of the San Francisco Mechanics’ Institute, anon-profit organization, from 2013 to 2015. Board member of the Russell Exchange Traded Fund Trust from 2011 to 2012. Director of Barclays Global Investors Holdings Deutschland GmbH from 2006 to 2009. Mr. Polisson is an attorney and has a retired status with the Massachusetts and District of Columbia Bar Associations. | | N/A |
| * | Length of service dates reflect the Trustee’s commencement of service with the Trust’s predecessor entities, where applicable. |
32 | Wells Fargo Low Volatility U.S. Equity Fund
Other information (unaudited)
Officers
| | | | |
Name and
year of birth | | Position held and
length of service | | Principal occupations during past five years or longer |
| | |
Andrew Owen
(Born 1960) | | President,
since 2017 | | Executive Vice President of Wells Fargo & Company and Head of Affiliated Managers, Wells Fargo Asset Management, since 2014. In addition, Mr. Owen is currently President, Chief Executive Officer and Director of Wells Fargo Funds Management, LLC since 2017. Prior thereto, Executive Vice President responsible for marketing, investments and product development for Wells Fargo Funds Management, LLC, from 2009 to 2014. |
| | |
Nancy Wiser1
(Born 1967) | | Treasurer,
since 2012 | | Executive Vice President of Wells Fargo Funds Management, LLC since 2011. Chief Operating Officer and Chief Compliance Officer at LightBox Capital Management LLC, from 2008 to 2011. |
| | |
Alexander Kymn
(Born 1973) | | Secretary and Chief Legal Officer,
since 2018 | | Senior Company Counsel of Wells Fargo Bank, N.A. since 2018 (previously Senior Counsel from 2007 to 2018). Vice President of Wells Fargo Funds Management, LLC from 2008 to 2014. |
| | |
Michael H. Whitaker
(Born 1967) | | Chief Compliance Officer,
since 2016 | | Senior Vice President and Chief Compliance Officer since 2016. Senior Vice President and Chief Compliance Officer for Fidelity Investments from 2007 to 2016. |
| | |
David Berardi
(Born 1975) | | Assistant Treasurer,
since 2009 | | Vice President of Wells Fargo Funds Management, LLC since 2009. Vice President of Evergreen Investment Management Company, LLC from 2008 to 2010. Manager of Fund Reporting and Control for Evergreen Investment Management Company, LLC from 2004 to 2010. |
| | |
Jeremy DePalma1
(Born 1974) | | Assistant Treasurer,
since 2009 | | Senior Vice President of Wells Fargo Funds Management, LLC since 2009. Senior Vice President of Evergreen Investment Management Company, LLC from 2008 to 2010 and head of the Fund Reporting and Control Team within Fund Administration from 2005 to 2010. |
| 1 | Nancy Wiser acts as Treasurer of 65 funds in the Fund Complex. Jeremy DePalma acts as Treasurer of 87 funds and Assistant Treasurer of 65 funds in the Fund Complex. |
| 2 | The Statement of Additional Information includes additional information about the Trustees and is available, without charge, upon request, by calling1-800-222-8222 or by visiting the website atwfam.com. |
Wells Fargo Low Volatility U.S. Equity Fund | 33
Other information (unaudited)
BOARD CONSIDERATION OF INVESTMENT MANAGEMENT ANDSUB-ADVISORY AGREEMENTS:
Wells Fargo Low Volatility U.S. Equity Fund
Under the Investment Company Act of 1940 (the “1940 Act”), the Board of Trustees (the “Board”) of Wells Fargo Funds Trust (the “Trust”) must determine annually whether to approve the continuation of the Trust’s investment management andsub-advisory agreements. In this regard, at anin-person meeting held on May21-22, 2019 (the “Meeting”), the Board, all the members of which have no direct or indirect interest in the investment management andsub-advisory agreements and are not “interested persons” of the Trust, as defined in the 1940 Act (the “Independent Trustees”), reviewed and approved for Wells Fargo Low Volatility U.S. Equity Fund(the “Fund”): (i) an investment management agreement (the “Management Agreement”) with Wells Fargo Funds Management, LLC (“Funds Management”); and (ii) an investmentsub-advisory agreement (the“Sub-Advisory Agreement”) with Wells Capital Management Incorporated (the“Sub-Adviser”), an affiliate of Funds Management. The Management Agreement and theSub-Advisory Agreement are collectively referred to as the “Advisory Agreements.”
At the Meeting, the Board considered the factors and reached the conclusions described below relating to the selection of Funds Management and theSub-Adviser and the approval of the Advisory Agreements. Prior to the Meeting, including at anin-person meeting in April 2019, the Trustees conferred extensively among themselves and with representatives of Funds Management about these matters. Also, the Board has adopted a team-based approach, with each team consisting of asub-set of Trustees, to assist the full Board in the discharge of its duties in reviewing investment performance and other matters throughout the year. The Independent Trustees were assisted in their evaluation of the Advisory Agreements by independent legal counsel, from whom they received separate legal advice and with whom they met separately.
In providing information to the Board, Funds Management and theSub-Adviser were guided by a detailed set of requests for information submitted to them by independent legal counsel on behalf of the Independent Trustees at the start of the Board’s annual contract renewal process earlier in 2019. In considering and approving the Advisory Agreements, the Trustees considered the information they believed relevant, including but not limited to the information discussed below. The Board considered not only the specific information presented in connection with the Meeting, but also the knowledge gained over time through interaction with Funds Management and theSub-Adviser about various topics. In this regard, the Board reviewed reports of Funds Management at each of its quarterly meetings, which included, among other things, portfolio reviews and investment performance reports. In addition, the Board and the teams mentioned above confer with portfolio managers at various times throughout the year. The Board did not identify any particular information or consideration that wasall-important or controlling, and each individual Trustee may have attributed different weights to various factors.
After its deliberations, the Board unanimously approved the continuation of the Advisory Agreements for aone-year term and determined that the compensation payable to Funds Management and theSub-Adviser under each of the Advisory Agreements was reasonable. The Board considered the approval of the Advisory Agreements for the Fund as part of its consideration of agreements for funds across the complex, but its approvals were made on afund-by-fund basis. The following summarizes a number of important, but not necessarily all, factors considered by the Board in support of its approvals.
Nature, extent and quality of services
The Board received and considered various information regarding the nature, extent and quality of services provided to the Fund by Funds Management and theSub-Adviser under the Advisory Agreements. This information included a description of the investment advisory services and Fund-level administrative services covered by the Management Agreement, as well as, among other things, a summary of the background and experience of senior management of Wells Fargo Asset Management (“WFAM”), of which Funds Management and theSub-Adviser are a part, a summary of investments made in the business of WFAM, a summary of certain organizational and personnel changes involving Funds Management and theSub-Adviser, and a description of Funds Management’s and theSub-Adviser’s business continuity planning programs and of their approaches to data privacy and cybersecurity. The Board received and reviewed information about Funds Management’s role as administrator of the Fund’s liquidity risk management program. The Board also considered the qualifications, background, tenure and responsibilities of each of the portfolio managers primarily responsible for theday-to-day portfolio management of the Fund.
The Board evaluated the ability of Funds Management and theSub-Adviser to attract and retain qualified investment professionals, including research, advisory and supervisory personnel. The Board further considered the compliance programs and compliance records of Funds Management and theSub-Adviser. In addition, the Board took into account the full range of services provided to the Fund by Funds Management and its affiliates.
34 | Wells Fargo Low Volatility U.S. Equity Fund
Other information (unaudited)
Fund investment performance and expenses
The Board considered the investment performance results for the Fund over various time periods ended December 31, 2018. The Board considered these results in comparison to the investment performance of funds in a universe that was determined by Broadridge Inc. (“Broadridge”) to be similar to the Fund (the “Universe”), and in comparison to the Fund’s benchmark index and to other comparative data. Broadridge is an independent provider of investment company data. The Board received a description of the methodology used by Broadridge to select the mutual funds in the performance Universe. The Board noted that the investment performance of the Fund (Administrator Class) was higher than the average investment performance of the Universe for theone-year period under review. The Board also noted that the investment performance of the Fund was in range of its benchmark index, the Russell 1000® Index, for theone-year period under review.
The Board also received and considered information regarding the Fund’s net operating expense ratios and their various components, including actual management fees, custodian and othernon-management fees, and Rule12b-1 andnon-Rule12b-1 shareholder service fees. The Board considered these ratios in comparison to the median ratios of funds in class-specific expense groups that were determined by Broadridge to be similar to the Fund (the “Groups”). The Board received a description of the methodology used by Broadridge to select the mutual funds in the expense Groups and an explanation of how funds comprising expense groups and their expense ratios may vary fromyear-to-year. Based on the Broadridge reports, the Board noted that the net operating expense ratios of the Fund were lower than the median net operating expense ratios of the expense Groups for each share class.
The Board took into account the Fund’s investment performance and expense information provided to it among the factors considered in deciding tore-approve the Advisory Agreements.
Investment management andsub-advisory fee rates
The Board reviewed and considered the contractual fee rates payable by the Fund to Funds Management under the Management Agreement, as well as the contractual fee rates payable by the Fund to Funds Management for class-level administrative services under a Class-Level Administration Agreement, which include, among other things, class-level transfer agency andsub-transfer agency costs (collectively, the “Management Rates”). The Board also reviewed and considered the contractual investmentsub-advisory fee rates that are payable by Funds Management to theSub-Adviser for investmentsub-advisory services.
Among other information reviewed by the Board was a comparison of the Fund’s Management Rates with the average contractual investment management fee rates of funds in the expense Groups at a common asset level as well as transfer agency costs of the funds in the expense Groups. The Board noted that the Management Rates of the Fund were lower than the sum of these average rates for the Fund’s expense Groups for all share classes.
The Board also received and considered information about the portion of the total management fee that was retained by Funds Management after payment of the fee to theSub-Adviser forsub-advisory services. In assessing the reasonableness of this amount, the Board received and evaluated information about the nature and extent of responsibilities retained and risks assumed by Funds Management and not delegated to or assumed by theSub-Adviser, and about Funds Management’son-going oversight services. Given the affiliation between Funds Management and theSub-Adviser, the Board ascribed limited relevance to the allocation of fees between them.
The Board also received and considered information about the nature and extent of services offered and fee rates charged by Funds Management and theSub-Adviser to other types of clients with investment strategies similar to those of the Fund. In this regard, the Board received information about the significantly greater scope of services, and compliance, reporting and other legal burdens and risks of managing proprietary mutual funds compared with those associated with managing assets of other types of clients, including third-partysub-advised fund clients andnon-mutual fund clients such as institutional separate accounts.
Based on its consideration of the factors and information it deemed relevant, including those described here, the Board determined that the compensation payable to Funds Management under the Management Agreement and to theSub-Adviser under theSub-Advisory Agreement was reasonable.
Profitability
The Board received and considered information concerning the profitability of Funds Management, as well as the profitability of both WFAM and Wells Fargo & Co. (“Wells Fargo”) from providing services to the fund family as a whole. The Board noted that theSub-Adviser’s profitability information with respect to providing services to the Fund and other funds in the family was subsumed in the WFAM and Wells Fargo profitability analysis.
Wells Fargo Low Volatility U.S. Equity Fund | 35
Other information (unaudited)
Funds Management reported on the methodologies and estimates used in calculating profitability, including a description of the methodology used to allocate certain expenses. Among other things, the Board noted that the levels of profitability reported on afund-by-fund basis varied widely, depending on factors such as the size, type and age of fund. Based on its review, the Board did not deem the profits reported by Funds Management, WFAM or Wells Fargo from services provided to the Fund to be at a level that would prevent it from approving the continuation of the Advisory Agreements.
Economies of scale
The Board received and considered information about the potential for Funds Management to experience economies of scale in the provision of management services to the Fund, the difficulties of calculating economies of scale at an individual fund level, and the extent to which potential scale benefits are shared with shareholders. The Board noted the existence of breakpoints in the Fund’s management fee structure, which operate generally to reduce the Fund’s expense ratios as the Fund grows in size. The Board considered that in addition to management fee breakpoints, Funds Management shares potential economies of scale from its management business in a variety of ways, including through fee waiver and expense reimbursement arrangements, services that benefit shareholders, competitive management fee rates set at the outset without regard to breakpoints, and investments in the business intended to enhance services available to shareholders.
The Board concluded that Funds Management’s arrangements with respect to the Fund, including contractual breakpoints, constituted a reasonable approach to sharing potential economies of scale with the Fund and its shareholders.
Other benefits to Funds Management and theSub-Adviser
The Board received and considered information regarding potential“fall-out” or ancillary benefits received by Funds Management and its affiliates, including theSub-Adviser, as a result of their relationships with the Fund. Ancillary benefits could include, among others, benefits directly attributable to other relationships with the Fund and benefits potentially derived from an increase in Funds Management’s and theSub-Adviser’s business as a result of their relationships with the Fund. The Board noted that various affiliates of Funds Management may receive distribution-related fees, shareholder servicing payments andsub-transfer agency fees in respect of shares sold or held through them and services provided.
The Board also reviewed information about soft dollar credits earned and utilized by theSub-Adviser, fees earned by Funds Management and theSub-Adviser from managing a private investment vehicle for the fund family’s securities lending collateral, and commissions earned by an affiliated broker from portfolio transactions.
Based on its consideration of the factors and information it deemed relevant, including those described here, the Board did not find that any ancillary benefits received by Funds Management and its affiliates, including theSub-Adviser, were unreasonable.
Conclusion
At the Meeting, after considering the above-described factors and based on its deliberations and its evaluation of the information described above, the Board unanimously approved the continuation of the Advisory Agreements for aone-year term and determined that the compensation payable to Funds Management and theSub-Adviser under each of the Advisory Agreements was reasonable.
36 | Wells Fargo Low Volatility U.S. Equity Fund

For more information
More information about Wells Fargo Funds is available free upon request. To obtain literature, please write, visit the Fund’s website, or call:
Wells Fargo Funds
P.O. Box 219967
Kansas City, MO 64121-9967
Website:wfam.com
Individual investors:1-800-222-8222
Retail investment professionals:1-888-877-9275
Institutional investment professionals:1-866-765-0778

This report and the financial statements contained herein are submitted for the general information of the shareholders of the Fund. If this report is used for promotional purposes, distribution of the report must be accompanied or preceded by a current prospectus. Before investing, please consider the investment objectives, risks, charges, and expenses of the investment. For a current prospectus and, if available, a summary prospectus, containing this information, call1-800-222-8222 or visit the Fund’s website atwfam.com. Read the prospectus carefully before you invest or send money.
Wells Fargo Asset Management (WFAM) is the trade name for certain investment advisory/management firms owned by Wells Fargo & Company. These firms include but are not limited to Wells Capital Management Incorporated and Wells Fargo Funds Management, LLC. Certain products managed by WFAM entities are distributed by Wells Fargo Funds Distributor, LLC (a broker-dealer and Member FINRA).
This material is for general informational and educational purposes only and is NOT intended to provide investment advice or a recommendation of any kind—including a recommendation for any specific investment, strategy, or plan.
INVESTMENT PRODUCTS: NOT FDIC INSURED ◾ NO BANK GUARANTEE ◾ MAY LOSE VALUE
© 2019 Wells Fargo Funds Management, LLC. All rights reserved.
405483 09-19
A270/AR270 07-19
Annual Report
July 31, 2019
Wells Fargo Omega Growth Fund
Beginning on January 1, 2021, as permitted by new regulations adopted by the Securities and Exchange Commission, paper copies of the Wells Fargo Funds’ annual and semi-annual shareholder reports issued after this date will no longer be sent by mail, unless you specifically request paper copies of the reports. Instead, the reports will be made available on the Funds’ website, and you will be notified by mail each time a report is posted and provided with a website address to access the report.
If you already elected to receive shareholder reports electronically, you will not be affected by this change and you need not take any action. You may elect to receive shareholder reports and other communications from the Fund electronically at any time by contacting your financial intermediary (such as a broker-dealer or bank) or, if you are a direct investor, by calling1-800-222-8222 or by enrolling at wellsfargo.com/advantagedelivery.
You may elect to receive all future reports in paper free of charge. If you invest through a financial intermediary, you can contact your financial intermediary to request that you continue to receive paper copies of your shareholder reports; if you invest directly with the Fund, you can call 1-800-222-8222. Your election to receive reports in paper will apply to all Wells Fargo Funds held in your account with your financial intermediary or, if you are a direct investor, to all Wells Fargo Funds that you hold.
|
|
|
Reduce clutter. Save trees. |
Sign up for electronic delivery of prospectuses and shareholder reports atwellsfargo.com/advantagedelivery |
The views expressed and any forward-looking statements are as of July 31, 2019, unless otherwise noted, and are those of the Fund managers and/or Wells Fargo Asset Management. Discussions of individual securities, or the markets generally, or any Wells Fargo Fund are not intended as individual recommendations. Future events or results may vary significantly from those expressed in any forward-looking statements. The views expressed are subject to change at any time in response to changing circumstances in the market. Wells Fargo Asset Management and the Fund disclaim any obligation to publicly update or revise any views expressed or forward-looking statements.
INVESTMENT PRODUCTS: NOT FDIC INSURED ◾ NO BANK GUARANTEE ◾ MAY LOSE VALUE
Wells Fargo Omega Growth Fund | 1
Letter to shareholders (unaudited)

Andrew Owen
President
Wells Fargo Funds
Dear Shareholder:
We are pleased to offer you this annual report for the Wells Fargo Omega Growth Fund for the 12-month period that ended July 31, 2019. After the first six months of the period yielded either low-single-digit or negative investment returns, U.S. stock and global bond investors generally enjoyed a recovery during the final six months amid continued concerns about global economic growth, international trade, geopolitical tensions, and bouts of market volatility. These concerns negatively influenced international equity markets.
For the period, U.S. stocks, based on the S&P 500 Index,1 gained 7.99% and international stocks, as measured by the MSCI ACWI ex USA Index (Net),2 fell 2.27%. The MSCI EM Index (Net)3 slipped 2.18%. For bond investors, the Bloomberg Barclays U.S. Aggregate Bond Index4 added 8.08%, the Bloomberg Barclays Global Aggregate ex-USD Index5 added 3.74%, the Bloomberg Barclays Municipal Bond Index6 gained 7.31%, and the ICE BofAML U.S. High Yield Index7 added 6.94%.
Entering the fourth quarter of 2018, economic data was encouraging.
Domestic equity investors entered the fourth quarter of 2018 with reasons to be optimistic. The U.S. Bureau of Economic Analysis reported second-quarter annualized gross domestic product (GDP) growth of 4.2%. Hiring improved. Unemployment declined. Consumer confidence and spending increased. Third-quarter corporate earnings reports were generally positive. U.S. trade negotiations with Mexico and Canada progressed. The U.S. Federal Reserve (Fed) raised the federal funds rate by 25 basis points (bps; 100 bps equal 1.00%) to a target range of between 2.00% and 2.25% in September 2018, one of four rate increases implemented during the calendar year, a sign of its confidence in the strength of the U.S. economy.
Investors in international markets were not as confident. Tensions between the U.S. and China increased. The U.S. imposed $200 billion in tariffs on Chinese goods. China reacted with $60 billion in tariffs on U.S. goods. Economic growth in China caused concern. In September 2018, international investors began to factor a number of disconcerting economic and business data points: lower July manufacturers’ and industrial orders in Germany; falling purchasing manager index numbers for August from the United Kingdom, China, and India; and declining household spending for August in Japan. Taken together, the data fed growing concerns over slowing global growth that unnerved investors.
| 1 | The S&P 500 Index consists of 500 stocks chosen for market size, liquidity, and industry group representation. It is a market-value-weighted index with each stock’s weight in the index proportionate to its market value. You cannot invest directly in an index. |
| 2 | The Morgan Stanley Capital International (MSCI) All Country World Index (ACWI) ex USA Index (Net) is a free-float-adjusted market-capitalization weighted index that is designed to measure the equity market performance of developed and emerging markets, excluding the U.S. Source: MSCI. MSCI makes no express or implied warranties or representations and shall have no liability whatsoever with respect to any MSCI data contained herein. The MSCI data may not be further redistributed or used as a basis for other indices or any securities or financial products. This report is not approved, reviewed, or produced by MSCI. You cannot invest directly in an index. |
| 3 | The MSCI Emerging Markets (EM) Index (Net) is a free-float-adjusted market-capitalization-weighted index that is designed to measure the equity market performance of emerging markets. You cannot invest directly in an index. |
| 4 | The Bloomberg Barclays U.S. Aggregate Bond Index is a broad-based benchmark that measures the investment-grade, U.S. dollar-denominated, fixed-rate taxable bond market, including Treasuries, government-related and corporate securities, mortgage-backed securities (agency fixed-rate and hybrid adjustable-rate mortgage pass-throughs), asset-backed securities, and commercial mortgage-backed securities. You cannot invest directly in an index. |
| 5 | The Bloomberg Barclays Global Aggregate ex-USD Index is an unmanaged index that provides a broad-based measure of the global investment-grade fixed-income markets excluding the U.S. dollar-denominated debt market. You cannot invest directly in an index. |
| 6 | The Bloomberg Barclays Municipal Bond Index is an unmanaged index composed of long-term tax-exempt bonds with a minimum credit rating of Baa. You cannot invest directly in an index. |
| 7 | The ICE BofAML U.S. High Yield Index is a market-capitalization-weighted index of domestic and Yankee high-yield bonds. The index tracks the performance of high-yield securities traded in the U.S. bond market. You cannot invest directly in an index. Copyright 2019. ICE Data Indices, LLC. All rights reserved. |
2 | Wells Fargo Omega Growth Fund
Letter to shareholders (unaudited)
Global markets suffered during the fourth quarter of 2018.
November’s U.S. midterm elections shifted control of the House of Representatives from Republicans to Democrats, presaging partisan clashes that followed and caused uncertainty among investors. Third-quarter U.S. GDP was announced at an annualized 3.4% rate, lower than the second-quarter rate. Brexit efforts stalled ahead of the March 2019 deadline. The People’s Bank of China cut reserve requirement ratios, accelerated infrastructure spending, and cut taxes even as the value of the yuan declined to low levels last seen in 2008. A partial U.S. government shutdown driven by partisan policy disputes extended into January.
The combination of news in the U.S. and generally weak economic indicators outside of the U.S. caused investors to seek safe havens. December’s S&P 500 Index performance was the worst since 1931. Globally, fixed-income investments fared better than stocks during the last two months of the year. The Fed increased the federal funds rate by 25 bps in December to a target range of between 2.25% and 2.50%.
The market climbs a wall of worry.
Investors entered 2019 with reasons to be concerned. Investment returns appeared to reaffirm the adage that markets climb a wall of worry. The S&P 500 Index gained 8.01% for the month of January, the best monthly performance in 30 years. Returns for the MSCI ACWI ex USA Index (Net), the Bloomberg Barclays U.S. Aggregate Bond Index, and the Bloomberg Barclays Global Aggregate ex-USD Index also were positive.
In February 2019, signs of slowing global growth grew more ominous. The Bureau of Economic Analysis announced fourth-quarter 2018 GDP grew at an annualized 2.2% rate, down from the levels of the prior two quarters. In a February report, the Bank of England forecasted the slowest growth since the financial crisis for 2019. China and the U.S. continued to wrangle over trade issues.
By the end of March 2019, a combination of dovish Fed sentiment and steady, if not spectacular, U.S. economic and business metrics reinforced investors’ confidence. Monthly job creation data and corporate profits, while less consistent than during 2018, were solid. China announced a roughly $300 billion stimulus package through tax and fee cuts intended to reinvigorate economic growth. During April 2019, favorable sentiment found additional support in reports of sustained low inflation, solid employment data, and first-quarter U.S. GDP of an annualized rate of 3.2%.
During May 2019, markets tumbled on mixed investment signals. In the U.S., partisan wrangling ramped up as Democrats and Republicans set their sights on 2020 presidential politics. The U.K.’s Brexit caused Prime Minister Theresa May to resign. The European Commission downgraded the 2019 growth forecast to 1.2%. The U.S. increased tariffs on products from China, China responded, and then talks broke down. President Donald Trump threatened to turn his foreign policy tariff tool to Mexico over immigration issues.
As had been the case during most of 2019 to date, just as the investment horizon appeared to darken, sentiment turned and U.S. equity markets gained during June and July. The gains, primarily driven by geopolitical and monetary policy events, pushed equity markets to new highs.
President Mario Draghi of the European Central Bank said that if the outlook doesn’t improve, the bank will cut rates or buy more assets to prop up inflation. President Trump backed off of tariff threats against Mexico and China. In the U.S., the Fed implemented a 0.25% federal funds rate cut in July 2019.
“December’s S&P 500 Index performance was the worst since 1931.”
“The S&P 500 Index gained 8.01% for the month of January, the best monthly performance in 30 years.”
Wells Fargo Omega Growth Fund | 3
Letter to shareholders (unaudited)
Later in July 2019, the U.S. reversed course and threatened to impose higher tariffs on China’s exports after talks failed. China responded with tariff threats of its own and devalued the renminbi, a move that roiled global markets. Despite the accommodative approach of central banks, investors continued to have misgivings about the durability of economic growth globally and a pervasively cautious tone influenced the world’s equity and fixed-income markets.
Don’t let short-term uncertainty derail long-term investment goals.
Periods of investment uncertainty can present challenges, but experience has taught us that maintaining long-term investment goals can be an effective way to plan for the future. To help you create a sound strategy based on your personal goals and risk tolerance, Wells Fargo Funds offers more than 100 mutual funds spanning a wide range of asset classes and investment styles. Although diversification cannot guarantee an investment profit or prevent losses, we believe it can be an effective way to manage investment risk and potentially smooth out overall portfolio performance. We encourage investors to know their investments and to understand that appropriate levels of risk-taking may unlock opportunities.
Thank you for choosing to invest with Wells Fargo Funds. We appreciate your confidence in us and remain committed to helping you meet your financial needs.
Sincerely,

Andrew Owen
President
Wells Fargo Funds
|
|
|
For further information about your Fund, contact your investment professional, visit our website at wfam.com, or call us directly at1-800-222-8222. |
4 | Wells Fargo Omega Growth Fund
This page is intentionally left blank.
Performance highlights (unaudited)
Investment objective
The Fund seeks long-term capital appreciation.
Manager
Wells Fargo Funds Management, LLC
Subadviser
Wells Capital Management Incorporated
Portfolio managers
Michael T. Smith, CFA®‡
Christopher J. Warner, CFA®‡
Average annual total returns (%) as of July 31, 2019
| | | | | | | | | | | | | | | | | | | | | | | | | | | | | | | | | | |
| | | | |
| | | | | Including sales charge | | | Excluding sales charge | | | Expense ratios1 (%) | |
| | | | | | | | | |
| | | Inception date | | 1 year | | | 5 year | | | 10 year | | | 1 year | | | 5 year | | | 10 year | | | Gross | | | Net2 | |
| | | | | | | | | | |
| Class A (EKOAX)3 | | 4-29-1968 | | | 7.34 | | | | 11.67 | | | | 14.39 | | | | 13.89 | | | | 13.00 | | | | 15.07 | | | | 1.28 | | | | 1.28 | |
| | | | | | | | | | |
| Class C (EKOCX)3 | | 8-2-1993 | | | 12.04 | | | | 12.15 | | | | 14.21 | | | | 13.04 | | | | 12.15 | | | | 14.21 | | | | 2.03 | | | | 2.03 | |
| | | | | | | | | | |
| Class R (EKORX)3 | | 10-10-2003 | | | – | | | | – | | | | – | | | | 13.63 | | | | 12.72 | | | | 14.78 | | | | 1.53 | | | | 1.53 | |
| | | | | | | | | | |
| Administrator Class (EOMYX)3 | | 1-13-1997 | | | – | | | | – | | | | – | | | | 14.12 | | | | 13.22 | | | | 15.32 | | | | 1.20 | | | | 1.10 | |
| | | | | | | | | | |
| Institutional Class (EKONX)3,4 | | 7-30-2010 | | | – | | | | – | | | | – | | | | 14.39 | | | | 13.51 | | | | 15.59 | | | | 0.95 | | | | 0.85 | |
| | | | | | | | | | |
| Russell 3000® Growth Index5 | | – | | | – | | | | – | | | | – | | | | 9.88 | | | | 13.94 | | | | 15.58 | | | | – | | | | – | |
Figures quoted represent past performance, which is no guarantee of future results, and do not reflect taxes that a shareholder may pay on fund distributions or the redemption of fund shares. Investment return and principal value of an investment will fluctuate so that an investor’s shares, when redeemed, may be worth more or less than their original cost. Performance shown without sales charges would be lower if sales charges were reflected. Current performance may be lower or higher than the performance data quoted, which assumes the reinvestment of dividends and capital gains. Current month-end performance is available on the Fund’s website,wfam.com.
Index returns do not include transaction costs associated with buying and selling securities, any mutual fund fees or expenses, or any taxes. It is not possible to invest directly in an index.
For Class A shares, the maximum front-end sales charge is 5.75%. For Class C shares, the maximum contingent deferred sales charge is 1.00%. Performance including a contingent deferred sales charge assumes the sales charge for the corresponding time period. Class R, Administrator Class, and Institutional Class shares are sold without a front-end sales charge or contingent deferred sales charge.
Stock values fluctuate in response to the activities of individual companies and general market and economic conditions. Certain investment strategies tend to increase the total risk of an investment (relative to the broader market). The Fund is exposed to foreign investment risk and smaller-company securities risk. Consult the Fund’s prospectus for additional information on these and other risks.
Please see footnotes on page 7.
6 | Wells Fargo Omega Growth Fund
Performance highlights (unaudited)
|
|
| Growth of $10,000 investment as of July 31, 20196 |
|

|
| ‡ | CFA® and Chartered Financial Analyst® are trademarks owned by CFA Institute. |
| 1 | Reflects the expense ratios as stated in the most recent prospectuses. The expense ratios shown are subject to change and may differ from the annualized expense ratios shown in the financial highlights of this report. |
| 2 | The manager has contractually committed through November 30, 2019, to waive fees and/or reimburse expenses to the extent necessary to cap the expenses of each class after fee waivers at 1.30% for Class A, 2.05% for Class C, 1.55% for Class R, 1.10% for Administrator Class, and 0.85% for Institutional Class. Brokerage commissions, stamp duty fees, interest, taxes, acquired fund fees and expenses (if any), and extraordinary expenses are excluded from the expense cap. Prior to or after the commitment expiration date, the cap may be increased or the commitment to maintain the cap may be terminated only with the approval of the Board of Trustees. Without this cap, the Fund’s returns would have been lower. The expense ratio paid by an investor is the net expense ratio (the total annual fund operating expenses after fee waivers) as stated in the prospectuses. |
| 3 | Historical performance shown prior to July 19, 2010, is based on the performance of the Fund’s predecessor, Evergreen Omega Fund. |
| 4 | Historical performance shown for Institutional Class shares prior to their inception reflects the performance of Administrator Class shares, and includes the higher expenses applicable to Administrator Class shares. If these expenses had not been included, returns for Institutional Class shares would be higher. |
| 5 | The Russell 3000® Growth Index measures the performance of those Russell 3000® Index companies with higher price/book ratios and higher forecasted growth values. You cannot invest directly in an index. |
| 6 | The chart compares the performance of Class A shares for the most recent ten years with the Russell 3000® Growth Index. The chart assumes a hypothetical investment of $10,000 in Class A shares and reflects all operating expenses and assumes the maximum initial sales charge of 5.75%. |
| 7 | The ten largest holdings, excluding cash, cash equivalents and any money market funds, are calculated based on the value of the investments divided by total net assets of the Fund. Holdings are subject to change and may have changed since the date specified. |
| 8 | Amounts are calculated based on the total long-term investments of the Fund. These amounts are subject to change and may have changed since the date specified. |
| * | This security was no longer held at the end of the reporting period. |
Wells Fargo Omega Growth Fund | 7
Performance highlights (unaudited)
MANAGER’S DISCUSSION
Fund highlights
| ∎ | | The Fund outperformed its benchmark, the Russell 3000® Growth Index, for the 12-month period that ended July 31, 2019. |
| ∎ | | Stock selection in information technology (IT) and select names within the consumer discretionary sector were key contributors to performance. |
| ∎ | | Security selection within the communication services sector as well as select holdings within the industrials sector detracted from performance. |
Volatility reemerged during the middle of the 12-month period.
While global stock markets posted positive returns during the 12-month period, it was not an entirely smooth ride for investors. Optimism for synchronized global economic growth eventually evolved into a decidedly risk-off market driven by escalating uncertainty and investor fear. Mounting geopolitical concerns, rising domestic interest rates, concern over the stability of select emerging market economies, and escalating fears of a trade war between the U.S. and China contributed to market volatility. The Federal Reserve’s shift toward a neutral policy stance—and eventual easing—helped ease concerns and provided a tailwind for equities to reach new highs by the end of the period.
Despite increased uncertainty, we have not significantly repositioned the Fund. We continue to emphasize companies with a secular rather than a cyclical growth profile. The Fund remains positioned toward companies with high visibility of earnings growth and those positioned on the right side of change. We believe this strategy will prove beneficial should volatility levels remain elevated.
| | | | |
|
| Ten largest holdings (%) as of July 31, 20197 | |
| | |
Microsoft Corporation | | | 8.06 | |
| | |
Amazon.com Incorporated | | | 5.90 | |
| | |
Visa Incorporated Class A | | | 4.64 | |
| | |
Alphabet Incorporated Class A | | | 3.88 | |
| | |
UnitedHealth Group Incorporated | | | 3.33 | |
| | |
Union Pacific Corporation | | | 2.31 | |
| | |
Waste Connections Incorporated | | | 2.19 | |
| | |
PayPal Holdings Incorporated | | | 2.00 | |
| | |
Boston Scientific Corporation | | | 1.92 | |
| | |
Motorola Solutions Incorporated | | | 1.84 | |
The Fund’s IT and select consumer discretionary holdings contributed to performance relative to the index.
Within the IT sector, the Fund’s position in Shopify Incorporated contributed to returns. Shopify, a provider of e-commerce solutions for direct-to-consumer brands such as Tesla Motors, Incorporated, traditionally focused on small and medium-size businesses but is currently penetrating larger businesses via its Shopify Plus offering. Shopify benefits from its customers’ growth by processing payments for smaller customers and charging a fee on each transaction for larger customers. The company’s two vectors of growth—new customers and growth of existing customers—drove higher-than-expected sales and earnings.
Within consumer discretionary, MercadoLibre, Incorporated, was additive to returns. MercadoLibre is the dominant Latin American e-commerce provider and owns MercadoPago, the leading online payment solution in Latin America. Increasede-commerce penetration in MercadoLibre’s key markets, such as Brazil and Argentina, drove higher sales growth. Customers’ use of MercadoPago both on and off MercadoLibre’s e-commerce marketplace provided an additional avenue of growth for the company.
Please see footnotes on page 7.
8 | Wells Fargo Omega Growth Fund
Performance highlights (unaudited)
|
|
| Sector distribution as of July 31, 20198 |
|
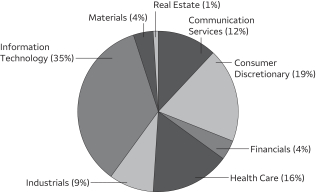 |
Security selection within the communication services sector as well as select industrials holdings detracted from relative performance.
Within communication services, shares of Facebook, Incorporated*, weighed on performance. During the period, concern surrounding the company’s data privacy issues continued to mount. Investors feared that the issue would lead to increased regulatory burden and associated costs for Facebook. Additionally, lower user engagement and slowing advertising growth pressured the shares.
Among industrial holdings, Evoqua Water Technologies Corporation* detracted from performance as shares declined sharply after the water treatment company reported disappointing results, reduced guidance, and
announced a restructuring plan. Rising raw material costs hurt profitability as well. Additionally within the sector, SiteOne Landscape Supply, Incorporated*, weighed on returns over the past year as concerns over the housing market and increased competition hurt shares of the landscape materials supplier.
The macro outlook is likely to remain muted, but opportunities abound to find companies on the right side of change.
As we look toward the remainder of 2019, we believe the U.S. economy is likely to avoid recessionary pressures and continue to expand albeit at a slower rate. We believe, however, the collision of slowing economic growth—caused partly by structural challenges such as demographics and elevated debt levels—and accelerating change driven by technological innovation creates exciting investment opportunities.
Innovative companies on the right side of change have been benefiting from this environment in which true secular growth is becoming increasingly scarce. In our view, right-side-of-change companies may produce predictable earnings and cash flows into the future—characteristics hard to find in the current economy. In a world starved of growth, investors tend to seek out that which is more certain and reward these attributes with a scarcity premium.
However, we also believe the market could become even more selective regarding profitability. In our view, the scarcity-of-growth narrative is playing out, and valuations have expanded meaningfully for many companies levered to new technologies. We think it is essential to stay laser-focused on finding innovative companies on the right side of change while remaining vigilant about risk management.
Please see footnotes on page 7.
Wells Fargo Omega Growth Fund | 9
Fund expenses (unaudited)
As a shareholder of the Fund, you incur two types of costs: (1) transaction costs, including sales charges (loads) on purchase payments and contingent deferred sales charges (if any) on redemptions and (2) ongoing costs, including management fees, distribution (12b-1) and/or shareholder servicing fees, and other Fund expenses. This example is intended to help you understand your ongoing costs (in dollars) of investing in the Fund and to compare these costs with the ongoing costs of investing in other mutual funds.
The example is based on an investment of $1,000 invested at the beginning of the six-month period and held for the entire period from February 1, 2019 to July 31, 2019.
Actual expenses
The “Actual” line of the table below provides information about actual account values and actual expenses. You may use the information in this line, together with the amount you invested, to estimate the expenses that you paid over the period. Simply divide your account value by $1,000 (for example, an $8,600 account value divided by $1,000 = 8.6), then multiply the result by the number in the “Actual” line under the heading entitled “Expenses paid during period” for your applicable class of shares to estimate the expenses you paid on your account during this period.
Hypothetical example for comparison purposes
The “Hypothetical” line of the table below provides information about hypothetical account values and hypothetical expenses based on the Fund’s actual expense ratio and an assumed rate of return of 5% per year before expenses, which is not the Fund’s actual return. The hypothetical account values and expenses may not be used to estimate the actual ending account balance or expenses you paid for the period. You may use this information to compare the ongoing costs of investing in the Fund and other funds. To do so, compare this 5% hypothetical example with the 5% hypothetical examples that appear in the shareholder reports of the other funds.
Please note that the expenses shown in the table are meant to highlight your ongoing costs only and do not reflect any transactional costs, such as sales charges (loads) and contingent deferred sales charges. Therefore, the “Hypothetical” line of the table is useful in comparing ongoing costs only and will not help you determine the relative total costs of owning different funds. In addition, if these transactional costs were included, your costs would have been higher.
| | | | | | | | | | | | | | | | |
| | | Beginning
account value
2-1-2019 | | | Ending
account value
7-31-2019 | | | Expenses
paid during
the period¹ | | | Annualized net
expense ratio | |
| | | | | |
Class A | | | | | | | | | | | | | | | | |
| | | | |
Actual | | $ | 1,000.00 | | | $ | 1,175.26 | | | $ | 6.90 | | | | 1.28 | % |
| | | | |
Hypothetical (5% return before expenses) | | $ | 1,000.00 | | | $ | 1,018.45 | | | $ | 6.41 | | | | 1.28 | % |
| | | | | |
Class C | | | | | | | | | | | | | | | | |
| | | | |
Actual | | $ | 1,000.00 | | | $ | 1,170.92 | | | $ | 10.93 | | | | 2.03 | % |
| | | | |
Hypothetical (5% return before expenses) | | $ | 1,000.00 | | | $ | 1,014.73 | | | $ | 10.14 | | | | 2.03 | % |
| | | | | |
Class R | | | | | | | | | | | | | | | | |
| | | | |
Actual | | $ | 1,000.00 | | | $ | 1,173.73 | | | $ | 8.25 | | | | 1.53 | % |
| | | | |
Hypothetical (5% return before expenses) | | $ | 1,000.00 | | | $ | 1,017.21 | | | $ | 7.65 | | | | 1.53 | % |
| | | | | |
Administrator Class | | | | | | | | | | | | | | | | |
| | | | |
Actual | | $ | 1,000.00 | | | $ | 1,176.31 | | | $ | 5.94 | | | | 1.10 | % |
| | | | |
Hypothetical (5% return before expenses) | | $ | 1,000.00 | | | $ | 1,019.34 | | | $ | 5.51 | | | | 1.10 | % |
| | | | | |
Institutional Class | | | | | | | | | | | | | | | | |
| | | | |
Actual | | $ | 1,000.00 | | | $ | 1,177.72 | | | $ | 4.59 | | | | 0.85 | % |
| | | | |
Hypothetical (5% return before expenses) | | $ | 1,000.00 | | | $ | 1,020.58 | | | $ | 4.26 | | | | 0.85 | % |
| 1 | Expenses paid is equal to the annualized net expense ratio of each class multiplied by the average account value over the period, multiplied by the number of days in the most recent fiscal half-year divided by the number of days in the fiscal year (to reflect the one-half-year period). |
10 | Wells Fargo Omega Growth Fund
Portfolio of investments—July 31, 2019
| | | | | | | | | | | | | | | | |
| | | | | | | | | Shares | | | Value | |
| Common Stocks: 99.66% | | | | | | | | | | | | | | | | |
| | | | |
Communication Services: 12.17% | | | | | | | | | | | | | | | | |
| | | | |
| Entertainment: 4.21% | | | | | | | | | | | | |
| | | | |
Netflix Incorporated † | | | | | | | | | | | 38,700 | | | $ | 12,499,713 | |
| | | | |
Nintendo Company Limited ADR | | | | | | | | | | | 244,938 | | | | 11,313,686 | |
| | | | |
Take-Two Interactive Software Incorporated † | | | | | | | | | | | 97,000 | | | | 11,884,440 | |
| | | | |
| | | | | | | | | | | | | | | 35,697,839 | |
| | | | | | | | | | | | | | | | |
| | | | |
| Interactive Media & Services: 7.96% | | | | | | | | | | | | |
| | | | |
Alphabet Incorporated Class A † | | | | | | | | | | | 27,000 | | | | 32,891,400 | |
| | | | |
Alphabet Incorporated Class C † | | | | | | | | | | | 8,185 | | | | 9,958,526 | |
| | | | |
IAC Corporation † | | | | | | | | | | | 59,400 | | | | 14,199,570 | |
| | | | |
Tencent Holdings Limited ADR | | | | | | | | | | | 226,400 | | | | 10,527,600 | |
| | | | |
| | | | | | | | | | | | | | | 67,577,096 | |
| | | | | | | | | | | | | | | | |
| | | | |
Consumer Discretionary: 19.03% | | | | | | | | | | | | | | | | |
| | | | |
| Auto Components: 1.52% | | | | | | | | | | | | |
| | | | |
Aptiv plc | | | | | | | | | | | 147,600 | | | | 12,937,140 | |
| | | | | | | | | | | | | | | | |
| | | | |
| Automobiles: 1.12% | | | | | | | | | | | | |
| | | | |
Ferrari NV | | | | | | | | | | | 58,900 | | | | 9,487,612 | |
| | | | | | | | | | | | | | | | |
| | | | |
| Diversified Consumer Services: 2.41% | | | | | | | | | | | | |
| | | | |
Adtalem Global Education Incorporated † | | | | | | | | | | | 185,400 | | | | 8,782,398 | |
| | | | |
Bright Horizons Family Solutions Incorporated † | | | | | | | | | | | 76,657 | | | | 11,657,230 | |
| | | | |
| | | | | | | | | | | | | | | 20,439,628 | |
| | | | | | | | | | | | | | | | |
| | | | |
| Hotels, Restaurants & Leisure: 4.35% | | | | | | | | | | | | |
| | | | |
Chipotle Mexican Grill Incorporated † | | | | | | | | | | | 16,700 | | | | 13,285,351 | |
| | | | |
Domino’s Pizza Incorporated | | | | | | | | | | | 44,300 | | | | 10,832,679 | |
| | | | |
Vail Resorts Incorporated | | | | | | | | | | | 51,802 | | | | 12,770,229 | |
| | | | |
| | | | | | | | | | | | | | | 36,888,259 | |
| | | | | | | | | | | | | | | | |
| | | | |
| Internet & Direct Marketing Retail: 7.37% | | | | | | | | | | | | |
| | | | |
Amazon.com Incorporated † | | | | | | | | | | | 26,800 | | | | 50,029,704 | |
| | | | |
MercadoLibre Incorporated † | | | | | | | | | | | 20,100 | | | | 12,490,542 | |
| | | | |
| | | | | | | | | | | | | | | 62,520,246 | |
| | | | | | | | | | | | | | | | |
| | | | |
| Specialty Retail: 1.51% | | | | | | | | | | | | |
| | | | |
The Home Depot Incorporated | | | | | | | | | | | 60,000 | | | | 12,821,400 | |
| | | | | | | | | | | | | | | | |
| | | | |
| Textiles, Apparel & Luxury Goods: 0.75% | | | | | | | | | | | | |
| | | | |
Under Armour Incorporated Class C † | | | | | | | | | | | 311,700 | | | | 6,339,978 | |
| | | | | | | | | | | | | | | | |
| | | | |
Financials: 3.65% | | | | | | | | | | | | | | | | |
| | | | |
| Capital Markets: 2.87% | | | | | | | | | | | | |
| | | | |
Intercontinental Exchange Incorporated | | | | | | | | | | | 165,800 | | | | 14,567,188 | |
| | | | |
Raymond James Financial Incorporated | | | | | | | | | | | 121,202 | | | | 9,777,365 | |
| | | | |
| | | | | | | | | | | | | | | 24,344,553 | |
| | | | | | | | | | | | | | | | |
| | | | |
| Consumer Finance: 0.78% | | | | | | | | | | | | |
| | | | |
SLM Corporation | | | | | | | | | | | 721,885 | | | | 6,576,372 | |
| | | | | | | | | | | | | | | | |
The accompanying notes are an integral part of these financial statements.
Wells Fargo Omega Growth Fund | 11
Portfolio of investments—July 31, 2019
| | | | | | | | | | | | | | | | |
| | | | | | | | | Shares | | | Value | |
Health Care: 16.01% | | | | | | | | | | | | | | | | |
| | | | |
| Biotechnology: 1.37% | | | | | | | | | | | | |
| | | | |
Exact Sciences Corporation † | | | | | | | | | | | 78,900 | | | $ | 9,082,179 | |
| | | | |
Sarepta Therapeutics Incorporated † | | | | | | | | | | | 17,100 | | | | 2,545,335 | |
| | | | |
| | | | | | | | | | | | | | | 11,627,514 | |
| | | | | | | | | | | | | | | | |
| | | | |
| Health Care Equipment & Supplies: 8.01% | | | | | | | | | | | | |
| | | | |
Alcon Incorporated † | | | | | | | | | | | 140,600 | | | | 8,260,250 | |
| | | | |
Align Technology Incorporated † | | | | | | | | | | | 37,700 | | | | 7,882,316 | |
| | | | |
Boston Scientific Corporation † | | | | | | | | | | | 383,100 | | | | 16,266,426 | |
| | | | |
DexCom Incorporated † | | | | | | | | | | | 77,900 | | | | 12,220,173 | |
| | | | |
Edwards Lifesciences Corporation † | | | | | | | | | | | 55,200 | | | | 11,749,320 | |
| | | | |
Intuitive Surgical Incorporated † | | | | | | | | | | | 22,300 | | | | 11,585,073 | |
| | | | |
| | | | | | | | | | | | | | | 67,963,558 | |
| | | | | | | | | | | | | | | | |
| | | | |
| Health Care Providers & Services: 4.32% | | | | | | | | | | | | |
| | | | |
HealthEquity Incorporated † | | | | | | | | | | | 102,248 | | | | 8,382,291 | |
| | | | |
UnitedHealth Group Incorporated | | | | | | | | | | | 113,600 | | | | 28,287,536 | |
| | | | |
| | | | | | | | | | | | | | | 36,669,827 | |
| | | | | | | | | | | | | | | | |
| | | | |
| Life Sciences Tools & Services: 1.18% | | | | | | | | | | | | |
| | | | |
Illumina Incorporated † | | | | | | | | | | | 33,300 | | | | 9,969,354 | |
| | | | | | | | | | | | | | | | |
| | | | |
| Pharmaceuticals: 1.13% | | | | | | | | | | | | |
| | | | |
Elanco Animal Health Incorporated † | | | | | | | | | | | 289,924 | | | | 9,555,895 | |
| | | | |
Eli Lilly & Company | | | | | | | | | | | 1 | | | | 109 | |
| | | | |
| | | | | | | | | | | | | | | 9,556,004 | |
| | | | | | | | | | | | | | | | |
| | | | |
Industrials: 9.41% | | | | | | | | | | | | | | | | |
| | | | |
| Aerospace & Defense: 1.33% | | | | | | | | | | | | |
| | | | |
Teledyne Technologies Incorporated † | | | | | | | | | | | 38,800 | | | | 11,301,664 | |
| | | | | | | | | | | | | | | | |
| | | | |
| Commercial Services & Supplies: 3.67% | | | | | | | | | | | | |
| | | | |
Cintas Corporation | | | | | | | | | | | 48,000 | | | | 12,501,120 | |
| | | | |
Waste Connections Incorporated | | | | | | | | | | | 204,922 | | | | 18,590,524 | |
| | | | |
| | | | | | | | | | | | | | | 31,091,644 | |
| | | | | | | | | | | | | | | | |
| | | | |
| Electrical Equipment: 1.18% | | | | | | | | | | | | |
| | | | |
Rockwell Automation Incorporated | | | | | | | | | | | 62,500 | | | | 10,048,750 | |
| | | | | | | | | | | | | | | | |
| | | | |
| Road & Rail: 2.31% | | | | | | | | | | | | |
| | | | |
Union Pacific Corporation | | | | | | | | | | | 108,800 | | | | 19,578,560 | |
| | | | | | | | | | | | | | | | |
| | | | |
| Trading Companies & Distributors: 0.92% | | | | | | | | | | | | |
| | | | |
Univar Incorporated † | | | | | | | | | | | 351,328 | | | | 7,771,375 | |
| | | | | | | | | | | | | | | | |
| | | | |
Information Technology: 34.54% | | | | | | | | | | | | | | | | |
| | | | |
| Communications Equipment: 1.84% | | | | | | | | | | | | |
| | | | |
Motorola Solutions Incorporated | | | | | | | | | | | 94,000 | | | | 15,600,240 | |
| | | | | | | | | | | | | | | | |
| | | | |
| Electronic Equipment, Instruments & Components: 1.56% | | | | | | | | | | | | |
| | | | |
Littelfuse Incorporated | | | | | | | | | | | 31,500 | | | | 5,322,240 | |
| | | | |
Zebra Technologies Corporation Class A † | | | | | | | | | | | 37,600 | | | | 7,929,464 | |
| | | | |
| | | | | | | | | | | | | | | 13,251,704 | |
| | | | | | | | | | | | | | | | |
The accompanying notes are an integral part of these financial statements.
12 | Wells Fargo Omega Growth Fund
Portfolio of investments—July 31, 2019
| | | | | | | | | | | | | | | | |
| | | | | | | | | Shares | | | Value | |
| IT Services: 18.75% | | | | | | | | | | | | |
| | | | |
Black Knight Incorporated † | | | | | | | | | | | 240,900 | | | $ | 15,253,788 | |
| | | | |
EPAM Systems Incorporated † | | | | | | | | | | | 69,841 | | | | 13,534,487 | |
| | | | |
Euronet Worldwide Incorporated † | | | | | | | | | | | 76,700 | | | | 11,958,297 | |
| | | | |
Fiserv Incorporated † | | | | | | | | | | | 144,440 | | | | 15,228,320 | |
| | | | |
PayPal Holdings Incorporated † | | | | | | | | | | | 154,000 | | | | 17,001,600 | |
| | | | |
Shopify Incorporated Class A † | | | | | | | | | | | 26,200 | | | | 8,328,456 | |
| | | | |
Square Incorporated Class A † | | | | | | | | | | | 126,900 | | | | 10,204,029 | |
| | | | |
Total System Services Incorporated | | | | | | | | | | | 106,200 | | | | 14,413,464 | |
| | | | |
Visa Incorporated Class A | | | | | | | | | | | 221,104 | | | | 39,356,512 | |
| | | | |
WEX Incorporated † | | | | | | | | | | | 63,202 | | | | 13,782,460 | |
| | | | |
| | | | | | | | | | | | | | | 159,061,413 | |
| | | | | | | | | | | | | | | | |
| | | | |
| Software: 12.39% | | | | | | | | | | | | |
| | | | |
Autodesk Incorporated † | | | | | | | | | | | 59,800 | | | | 9,338,966 | |
| | | | |
Microsoft Corporation | | | | | | | | | | | 501,900 | | | | 68,393,913 | |
| | | | |
Salesforce.com Incorporated † | | | | | | | | | | | 82,200 | | | | 12,699,900 | |
| | | | |
ServiceNow Incorporated † | | | | | | | | | | | 52,700 | | | | 14,618,453 | |
| | | | |
| | | | | | | | | | | | | | | 105,051,232 | |
| | | | | | | | | | | | | | | | |
| | | | |
Materials: 4.19% | | | | | | | | | | | | | | | | |
| | | | |
| Chemicals: 2.83% | | | | | | | | | | | | |
| | | | |
Ingevity Corporation † | | | | | | | | | | | 86,700 | | | | 8,543,418 | |
| | | | |
The Sherwin-Williams Company | | | | | | | | | | | 30,100 | | | | 15,442,505 | |
| | | | |
| | | | | | | | | | | | | | | 23,985,923 | |
| | | | | | | | | | | | | | | | |
| | | | |
| Construction Materials: 1.36% | | | | | | | | | | | | |
| | | | |
Vulcan Materials Company | | | | | | | | | | | 83,700 | | | | 11,579,895 | |
| | | | | | | | | | | | | | | | |
| | | | |
Real Estate: 0.66% | | | | | | | | | | | | | | | | |
| | | | |
| Equity REITs: 0.66% | | | | | | | | | | | | |
| | | | |
SBA Communications Corporation | | | | | | | | | | | 22,800 | | | | 5,595,348 | |
| | | | | | | | | | | | | | | | |
| | | | |
Total Common Stocks (Cost $493,953,920) | | | | | | | | | | | | | | | 845,334,128 | |
| | | | | | | | | | | | | | | | |
| | | | |
| | | | | | | | | | | | | | | | |
| | | Yield | | | | | | | | | | |
| Short-Term Investments: 0.74% | | | | | | | | | | | | |
| | | | |
| Investment Companies: 0.74% | | | | | | | | | | | | |
| | | | |
Wells Fargo Government Money Market Fund Select Class (l)(u) | | | 2.26 | % | | | | | | | 6,308,644 | | | | 6,308,644 | |
| | | | | | | | | | | | | | | | |
| | | | |
Total Short-Term Investments (Cost $6,308,644) | | | | | | | | | | | | | | | 6,308,644 | |
| | | | | | | | | | | | | | | | |
| | | | | | | | |
| Total investments in securities (Cost $500,262,564) | | | 100.40 | % | | | 851,642,772 | |
| | |
Other assets and liabilities, net | | | (0.40 | ) | | | (3,416,547 | ) |
| | | | | | | | |
| Total net assets | | | 100.00 | % | | $ | 848,226,225 | |
| | | | | | | | |
| † | Non-income-earning security |
| (l) | The issuer of the security is an affiliated person of the Fund as defined in the Investment Company Act of 1940. |
| (u) | The rate represents the 7-day annualized yield at period end. |
Abbreviations:
| ADR | American depositary receipt |
| REIT | Real estate investment trust |
The accompanying notes are an integral part of these financial statements.
Wells Fargo Omega Growth Fund | 13
Portfolio of investments—July 31, 2019
Investments in Affiliates
An affiliated investment is an investment in which the Fund owns at least 5% of the outstanding voting shares of the issuer or as a result of other relationships, such as the Fund and the issuer having the same investment manager. Transactions with issuers that were either affiliated persons of the Fund at the beginning of the period or the end of the period were as follows:
| | | | | | | | | | | | | | | | | | | | | | | | | | | | | | | | | | | | |
| | | Shares,
beginning
of period | | | Shares
purchased | | | Shares
sold | | | Shares,
end of
period | | | Net
realized
gains
(losses) | | | Net
change in
unrealized
gains
(losses) | | | Income
from
affiliated
securities | | | Value,
end
of period | | | % of
net
assets | |
Short-Term Investments | | | | | | | | | | | | | | | | | | | | | | | | | | | | | | | | | | | | |
Investment Companies | | | | | | | | | | | | | | | | | | | | | | | | | | | | | | | | | | | | |
Securities Lending Cash Investments LLC * | | | 6,508,449 | | | | 162,057,067 | | | | 168,565,516 | | | | 0 | | | $ | (3,860 | ) | | $ | 0 | | | | 225,189 | # | | $ | 0 | | | | | |
Wells Fargo Government Money Market Fund Select Class | | | 5,594,599 | | | | 176,175,282 | | | | 175,461,237 | | | | 6,308,644 | | | | 0 | | | | 0 | | | | 142,260 | | | | 6,308,644 | | | | | |
| | | | | | | | | | | | | | | | | | | | | | | | | | | | | | | | | | | | |
| | | | | | | | | |
| | | | | | | | | | | | | | | | | | $ | (3,860 | ) | | $ | 0 | | | $ | 367,449 | | | $ | 6,308,644 | | | | 0.74 | % |
| | | | | | | | | | | | | | | | | | | | | | | | | | | | | | | | | | | | |
| * | No longer held at the end of the period |
| # | Amount shown represents income before fees and rebates. |
The accompanying notes are an integral part of these financial statements.
14 | Wells Fargo Omega Growth Fund
Statement of assets and liabilities—July 31, 2019
| | | | |
| | | | |
| |
Assets | | | | |
Investments in unaffiliated securities, at value (cost $493,953,920) | | $ | 845,334,128 | |
Investments in affiliated securities, at value (cost $6,308,644) | | | 6,308,644 | |
Receivable for investments sold | | | 1,131,494 | |
Receivable for Fund shares sold | | | 172,873 | |
Receivable for dividends | | | 33,022 | |
Prepaid expenses and other assets | | | 52,442 | |
| | | | |
Total assets | | | 853,032,603 | |
| | | | |
| |
Liabilities | | | | |
Payable for investments purchased | | | 3,245,203 | |
Payable for Fund shares redeemed | | | 605,942 | |
Management fee payable | | | 556,500 | |
Administration fees payable | | | 145,347 | |
Distribution fees payable | | | 18,429 | |
Trustees’ fees and expenses payable | | | 4,342 | |
Accrued expenses and other liabilities | | | 230,615 | |
| | | | |
Total liabilities | | | 4,806,378 | |
| | | | |
Total net assets | | $ | 848,226,225 | |
| | | | |
| |
Net assets consist of | | | | |
Paid-in capital | | $ | 465,977,657 | |
Total distributable earnings | | | 382,248,568 | |
| | | | |
Total net assets | | $ | 848,226,225 | |
| | | | |
| |
Computation of net asset value and offering price per share | | | | |
Net assets – Class A | | $ | 714,410,983 | |
Shares outstanding – Class A1 | | | 12,943,469 | |
Net asset value per share – Class A | | | $55.19 | |
Maximum offering price per share – Class A2 | | | $58.56 | |
Net assets – Class C | | $ | 26,122,116 | |
Shares outstanding – Class C1 | | | 728,983 | |
Net asset value per share – Class C | | | $35.83 | |
Net assets – Class R | | $ | 6,096,609 | |
Shares outstanding – Class R1 | | | 117,651 | |
Net asset value per share – Class R | | | $51.82 | |
Net assets – Administrator Class | | $ | 26,140,632 | |
Shares outstanding – Administrator Class1 | | | 431,481 | |
Net asset value per share – Administrator Class | | | $60.58 | |
Net assets – Institutional Class | | $ | 75,455,885 | |
Shares outstanding – Institutional Class1 | | | 1,203,544 | |
Net asset value per share – Institutional Class | | | $62.69 | |
| 1 | The Fund has an unlimited number of authorized shares. |
| 2 | Maximum offering price is computed as 100/94.25 of net asset value. On investments of $50,000 or more, the offering price is reduced. |
The accompanying notes are an integral part of these financial statements.
Wells Fargo Omega Growth Fund | 15
Statement of operations—year ended July 31, 2019
| | | | |
| | | | |
| |
Investment income | | | | |
Dividends (net of foreign withholding taxes of $74,321) | | $ | 4,863,433 | |
Income from affiliated securities | | | 257,263 | |
| | | | |
Total investment income | | | 5,120,696 | |
| | | | |
| |
Expenses | | | | |
Management fee | | | 6,196,391 | |
Administration fees | | | | |
Class A | | | 1,372,435 | |
Class C | | | 88,873 | |
Class R | | | 13,244 | |
Administrator Class | | | 31,337 | |
Institutional Class | | | 86,553 | |
Shareholder servicing fees | | | | |
Class A | | | 1,633,851 | |
Class C | | | 105,802 | |
Class R | | | 15,526 | |
Administrator Class | | | 59,057 | |
Distribution fees | | | | |
Class C | | | 317,310 | |
Class R | | | 15,766 | |
Custody and accounting fees | | | 42,417 | |
Professional fees | | | 52,177 | |
Registration fees | | | 84,578 | |
Shareholder report expenses | | | 120,001 | |
Trustees’ fees and expenses | | | 21,999 | |
Other fees and expenses | | | 20,960 | |
| | | | |
Total expenses | | | 10,278,277 | |
Less: Fee waivers and/or expense reimbursements | | | (94,134 | ) |
| | | | |
Net expenses | | | 10,184,143 | |
| | | | |
Net investment loss | | | (5,063,447 | ) |
| | | | |
| |
Realized and unrealized gains (losses) on investments | | | | |
Net realized gains (losses) on | | | | |
Unaffiliated securities | | | 47,929,014 | |
Affiliated securities | | | (3,860 | ) |
| | | | |
Net realized gains on investments | | | 47,925,154 | |
Net change in unrealized gains (losses) on investments | | | 60,465,004 | |
| | | | |
Net realized and unrealized gains (losses) on investments | | | 108,390,158 | |
| | | | |
Net increase in net assets resulting from operations | | $ | 103,326,711 | |
| | | | |
The accompanying notes are an integral part of these financial statements.
16 | Wells Fargo Omega Growth Fund
Statement of changes in net assets
| | | | | | | | | | | | | | | | |
| | | Year ended July 31, 2019 | | | Year ended July 31, 20181 | |
| | | | |
Operations | | | | | | | | | | | | | | | | |
Net investment loss | | | | | | $ | (5,063,447 | ) | | | | | | $ | (5,063,493 | ) |
Net realized gains on investments | | | | | | | 47,925,154 | | | | | | | | 102,987,066 | |
Net change in unrealized gains (losses) on investments | | | | | | | 60,465,004 | | | | | | | | 85,525,118 | |
| | | | |
Net increase in net assets resulting from operations | | | | | | | 103,326,711 | | | | | | | | 183,448,691 | |
| | | | |
| | | | |
Distributions to shareholders from net investment income and net realized gains | | | | | | | | | | | | | | | | |
Class A | | | | | | | (68,419,305 | ) | | | | | | | (78,031,973 | ) |
Class C | | | | | | | (8,678,201 | ) | | | | | | | (10,985,719 | ) |
Class R | | | | | | | (707,933 | ) | | | | | | | (974,995 | ) |
Administrator Class | | | | | | | (2,403,661 | ) | | | | | | | (2,304,666 | ) |
Institutional Class | | | | | | | (6,323,228 | ) | | | | | | | (6,956,178 | ) |
| | | | |
Total distributions to shareholders | | | | | | | (86,532,328 | ) | | | | | | | (99,253,531 | ) |
| | | | |
| | | | |
Capital share transactions | | | Shares | | | | | | | | Shares | | | | | |
Proceeds from shares sold | | | | | | | | | | | | | | | | |
Class A | | | 957,256 | | | | 46,969,436 | | | | 362,012 | | | | 18,469,654 | |
Class C | | | 74,164 | | | | 2,327,314 | | | | 55,872 | | | | 2,013,265 | |
Class R | | | 28,311 | | | | 1,316,755 | | | | 59,297 | | | | 2,898,358 | |
Administrator Class | | | 21,538 | | | | 1,243,245 | | | | 59,693 | | | | 3,308,304 | |
Institutional Class | | | 247,352 | | | | 14,363,418 | | | | 204,162 | | | | 11,775,351 | |
| | | | |
| | | | | | | 66,220,168 | | | | | | | | 38,464,932 | |
| | | | |
Reinvestment of distributions | | | | | | | | | | | | | | | | |
Class A | | | 1,458,710 | | | | 65,102,208 | | | | 1,554,465 | | | | 74,101,364 | |
Class C | | | 288,212 | | | | 8,392,731 | | | | 318,920 | | | | 10,604,105 | |
Class R | | | 9,582 | | | | 402,155 | | | | 11,375 | | | | 514,829 | |
Administrator Class | | | 44,842 | | | | 2,194,127 | | | | 39,989 | | | | 2,065,019 | |
Institutional Class | | | 123,606 | | | | 6,249,540 | | | | 123,732 | | | | 6,562,759 | |
| | | | |
| | | | | | | 82,340,761 | | | | | | | | 93,848,076 | |
| | | | |
Payment for shares redeemed | | | | | | | | | | | | | | | | |
Class A | | | (1,573,949 | ) | | | (79,522,009 | ) | | | (1,588,303 | ) | | | (81,411,378 | ) |
Class C | | | (1,265,970 | ) | | | (40,375,871 | ) | | | (456,893 | ) | | | (16,729,771 | ) |
Class R | | | (64,569 | ) | | | (3,197,822 | ) | | | (59,515 | ) | | | (2,895,636 | ) |
Administrator Class | | | (41,328 | ) | | | (2,257,844 | ) | | | (66,020 | ) | | | (3,608,448 | ) |
Institutional Class | | | (227,834 | ) | | | (13,026,557 | ) | | | (429,386 | ) | | | (24,161,795 | ) |
| | | | |
| | | | | | | (138,380,103 | ) | | | | | | | (128,807,028 | ) |
| | | | |
Net increase in net assets resulting from capital share transactions | | | | | | | 10,180,826 | | | | | | | | 3,505,980 | |
| | | | |
Total increase in net assets | | | | | | | 26,975,209 | | | | | | | | 87,701,140 | |
| | | | |
| | | | |
Net assets | | | | | | | | | | | | | | | | |
Beginning of period | | | | | | | 821,251,016 | | | | | | | | 733,549,876 | |
| | | | |
End of period | | | | | | $ | 848,226,225 | | | | | | | $ | 821,251,016 | |
| | | | |
| 1 | Effective for all filings after November 4, 2018, the SEC prospectively eliminated the requirement to parenthetically disclose undistributed net investment income at the end of the period and permitted the aggregation of distributions, with the exception of tax basis returns of capital. Accumulated net investment loss at July 31, 2018 was $23,665. The disaggregated distributions information for the year ended July 31, 2018 is included in Note 8,Distributions to Shareholders, in the notes to the financial statements. |
The accompanying notes are an integral part of these financial statements.
Wells Fargo Omega Growth Fund | 17
Financial highlights
(For a share outstanding throughout each period)
| | | | | | | | | | | | | | | | | | | | |
| | | Year ended July 31 | |
| CLASS A | | 2019 | | | 2018 | | | 2017 | | | 2016 | | | 2015 | |
Net asset value, beginning of period | | | $54.77 | | | | $49.43 | | | | $42.73 | | | | $48.29 | | | | $49.99 | |
Net investment loss | | | (0.33 | )1 | | | (0.32 | )1 | | | (0.22 | )1 | | | (0.19 | )1 | | | (0.28 | )1 |
Net realized and unrealized gains (losses) on investments | | | 6.56 | | | | 12.57 | | | | 8.07 | | | | (1.44 | ) | | | 5.12 | |
| | | | | | | | | | | | | | | | | | | | |
Total from investment operations | | | 6.23 | | | | 12.25 | | | | 7.85 | | | | (1.63 | ) | | | 4.84 | |
Distributions to shareholders from | | | | | | | | | | | | | | | | | | | | |
Net realized gains | | | (5.81 | ) | | | (6.91 | ) | | | (1.15 | ) | | | (3.93 | ) | | | (6.54 | ) |
Net asset value, end of period | | | $55.19 | | | | $54.77 | | | | $49.43 | | | | $42.73 | | | | $48.29 | |
Total return2 | | | 13.89 | % | | | 26.86 | % | | | 18.88 | % | | | (3.07 | )% | | | 10.65 | % |
Ratios to average net assets (annualized) | | | | | | | | | | | | | | | | | | | | |
Gross expenses | | | 1.28 | % | | | 1.28 | % | | | 1.28 | % | | | 1.28 | % | | | 1.32 | % |
Net expenses | | | 1.28 | % | | | 1.28 | % | | | 1.28 | % | | | 1.28 | % | | | 1.30 | % |
Net investment loss | | | (0.64 | )% | | | (0.63 | )% | | | (0.50 | )% | | | (0.47 | )% | | | (0.58 | )% |
Supplemental data | | | | | | | | | | | | | | | | | | | | |
Portfolio turnover rate | | | 39 | % | | | 48 | % | | | 76 | % | | | 84 | % | | | 94 | % |
Net assets, end of period (000s omitted) | | | $714,411 | | | | $662,751 | | | | $581,967 | | | | $573,304 | | | | $685,005 | |
| 1 | Calculated based upon average shares outstanding |
| 2 | Total return calculations do not include any sales charges. |
The accompanying notes are an integral part of these financial statements.
18 | Wells Fargo Omega Growth Fund
Financial highlights
(For a share outstanding throughout each period)
| | | | | | | | | | | | | | | | | | | | |
| | | Year ended July 31 | |
| CLASS C | | 2019 | | | 2018 | | | 2017 | | | 2016 | | | 2015 | |
Net asset value, beginning of period | | | $38.02 | | | | $36.47 | | | | $32.07 | | | | $37.55 | | | | $40.56 | |
Net investment loss | | | (0.48 | )1 | | | (0.50 | )1 | | | (0.41 | )1 | | | (0.39 | )1 | | | (0.51 | )1 |
Net realized and unrealized gains (losses) on investments | | | 4.10 | | | | 8.96 | | | | 5.96 | | | | (1.16 | ) | | | 4.04 | |
| | | | | | | | | | | | | | | | | | | | |
Total from investment operations | | | 3.62 | | | | 8.46 | | | | 5.55 | | | | (1.55 | ) | | | 3.53 | |
Distributions to shareholders from | | | | | | | | | | | | | | | | | | | | |
Net realized gains | | | (5.81 | ) | | | (6.91 | ) | | | (1.15 | ) | | | (3.93 | ) | | | (6.54 | ) |
Net asset value, end of period | | | $35.83 | | | | $38.02 | | | | $36.47 | | | | $32.07 | | | | $37.55 | |
Total return2 | | | 13.04 | % | | | 25.88 | % | | | 18.00 | % | | | (3.75 | )% | | | 9.79 | % |
Ratios to average net assets (annualized) | | | | | | | | | | | | | | | | | | | | |
Gross expenses | | | 2.03 | % | | | 2.03 | % | | | 2.03 | % | | | 2.03 | % | | | 2.07 | % |
Net expenses | | | 2.03 | % | | | 2.03 | % | | | 2.03 | % | | | 2.03 | % | | | 2.05 | % |
Net investment loss | | | (1.40 | )% | | | (1.38 | )% | | | (1.24 | )% | | | (1.22 | )% | | | (1.33 | )% |
Supplemental data | | | | | | | | | | | | | | | | | | | | |
Portfolio turnover rate | | | 39 | % | | | 48 | % | | | 76 | % | | | 84 | % | | | 94 | % |
Net assets, end of period (000s omitted) | | | $26,122 | | | | $62,074 | | | | $62,543 | | | | $74,337 | | | | $99,100 | |
| 1 | Calculated based upon average shares outstanding |
| 2 | Total return calculations do not include any sales charges. |
The accompanying notes are an integral part of these financial statements.
Wells Fargo Omega Growth Fund | 19
Financial highlights
(For a share outstanding throughout each period)
| | | | | | | | | | | | | | | | | | | | |
| | | Year ended July 31 | |
| CLASS R | | 2019 | | | 2018 | | | 2017 | | | 2016 | | | 2015 | |
Net asset value, beginning of period | | | $51.92 | | | | $47.30 | | | | $41.04 | | | | $46.66 | | | | $48.62 | |
Net investment loss | | | (0.43 | )1 | | | (0.43 | )1 | | | (0.30 | )1 | | | (0.29 | )1 | | | (0.39 | )1 |
Net realized and unrealized gains (losses) on investments | | | 6.14 | | | | 11.96 | | | | 7.71 | | | | (1.40 | ) | | | 4.97 | |
| | | | | | | | | | | | | | | | | | | | |
Total from investment operations | | | 5.71 | | | | 11.53 | | | | 7.41 | | | | (1.69 | ) | | | 4.58 | |
Distributions to shareholders from | | | | | | | | | | | | | | | | | | | | |
Net realized gains | | | (5.81 | ) | | | (6.91 | ) | | | (1.15 | ) | | | (3.93 | ) | | | (6.54 | ) |
Net asset value, end of period | | | $51.82 | | | | $51.92 | | | | $47.30 | | | | $41.04 | | | | $46.66 | |
Total return | | | 13.63 | % | | | 26.53 | % | | | 18.58 | % | | | (3.30 | )% | | | 10.38 | % |
Ratios to average net assets (annualized) | | | | | | | | | | | | | | | | | | | | |
Gross expenses | | | 1.53 | % | | | 1.53 | % | | | 1.53 | % | | | 1.53 | % | | | 1.57 | % |
Net expenses | | | 1.53 | % | | | 1.53 | % | | | 1.53 | % | | | 1.53 | % | | | 1.55 | % |
Net investment loss | | | (0.88 | )% | | | (0.88 | )% | | | (0.72 | )% | | | (0.71 | )% | | | (0.83 | )% |
Supplemental data | | | | | | | | | | | | | | | | | | | | |
Portfolio turnover rate | | | 39 | % | | | 48 | % | | | 76 | % | | | 84 | % | | | 94 | % |
Net assets, end of period (000s omitted) | | | $6,097 | | | | $7,494 | | | | $6,298 | | | | $10,122 | | | | $17,199 | |
| 1 | Calculated based upon average shares outstanding |
The accompanying notes are an integral part of these financial statements.
20 | Wells Fargo Omega Growth Fund
Financial highlights
(For a share outstanding throughout each period)
| | | | | | | | | | | | | | | | | | | | |
| | | Year ended July 31 | |
| ADMINISTRATOR CLASS | | 2019 | | | 2018 | | | 2017 | | | 2016 | | | 2015 | |
Net asset value, beginning of period | | | $59.39 | | | | $52.99 | | | | $45.65 | | | | $51.20 | | | | $52.50 | |
Net investment loss | | | (0.25 | )1 | | | (0.25 | )1 | | | (0.12 | )1 | | | (0.12 | )1 | | | (0.17 | )1 |
Net realized and unrealized gains (losses) on investments | | | 7.25 | | | | 13.56 | | | | 8.61 | | | | (1.50 | ) | | | 5.41 | |
| | | | | | | | | | | | | | | | | | | | |
Total from investment operations | | | 7.00 | | | | 13.31 | | | | 8.49 | | | | (1.62 | ) | | | 5.24 | |
Distributions to shareholders from | | | | | | | | | | | | | | | | | | | | |
Net realized gains | | | (5.81 | ) | | | (6.91 | ) | | | (1.15 | ) | | | (3.93 | ) | | | (6.54 | ) |
Net asset value, end of period | | | $60.58 | | | | $59.39 | | | | $52.99 | | | | $45.65 | | | | $51.20 | |
Total return | | | 14.12 | % | | | 27.07 | % | | | 19.08 | % | | | (2.84 | )% | | | 10.91 | % |
Ratios to average net assets (annualized) | | | | | | | | | | | | | | | | | | | | |
Gross expenses | | | 1.20 | % | | | 1.20 | % | | | 1.20 | % | | | 1.19 | % | | | 1.15 | % |
Net expenses | | | 1.10 | % | | | 1.10 | % | | | 1.10 | % | | | 1.08 | % | | | 1.05 | % |
Net investment loss | | | (0.45 | )% | | | (0.45 | )% | | | (0.25 | )% | | | (0.27 | )% | | | (0.33 | )% |
Supplemental data | | | | | | | | | | | | | | | | | | | | |
Portfolio turnover rate | | | 39 | % | | | 48 | % | | | 76 | % | | | 84 | % | | | 94 | % |
Net assets, end of period (000s omitted) | | | $26,141 | | | | $24,140 | | | | $19,754 | | | | $38,039 | | | | $86,756 | |
| 1 | Calculated based upon average shares outstanding |
The accompanying notes are an integral part of these financial statements.
Wells Fargo Omega Growth Fund | 21
Financial highlights
(For a share outstanding throughout each period)
| | | | | | | | | | | | | | | | | | | | |
| | | Year ended July 31 | |
| INSTITUTIONAL CLASS | | 2019 | | | 2018 | | | 2017 | | | 2016 | | | 2015 | |
Net asset value, beginning of period | | | $61.10 | | | | $54.21 | | | | $46.55 | | | | $52.01 | | | | $53.10 | |
Net investment loss | | | (0.12 | )1 | | | (0.11 | )1 | | | (0.03 | )1 | | | (0.00 | )2 | | | (0.04 | )1 |
Net realized and unrealized gains (losses) on investments | | | 7.52 | | | | 13.91 | | | | 8.84 | | | | (1.53 | ) | | | 5.49 | |
| | | | | | | | | | | | | | | | | | | | |
Total from investment operations | | | 7.40 | | | | 13.80 | | | | 8.81 | | | | (1.53 | ) | | | 5.45 | |
Distributions to shareholders from | | | | | | | | | | | | | | | | | | | | |
Net realized gains | | | (5.81 | ) | | | (6.91 | ) | | | (1.15 | ) | | | (3.93 | ) | | | (6.54 | ) |
Net asset value, end of period | | | $62.69 | | | | $61.10 | | | | $54.21 | | | | $46.55 | | | | $52.01 | |
Total return | | | 14.39 | % | | | 27.39 | % | | | 19.40 | % | | | (2.61 | )% | | | 11.20 | % |
Ratios to average net assets (annualized) | | | | | | | | | | | | | | | | | | | | |
Gross expenses | | | 0.95 | % | | | 0.95 | % | | | 0.95 | % | | | 0.95 | % | | | 0.90 | % |
Net expenses | | | 0.85 | % | | | 0.85 | % | | | 0.85 | % | | | 0.83 | % | | | 0.80 | % |
Net investment loss | | | (0.20 | )% | | | (0.20 | )% | | | (0.06 | )% | | | (0.01 | )% | | | (0.09 | )% |
Supplemental data | | | | | | | | | | | | | | | | | | | | |
Portfolio turnover rate | | | 39 | % | | | 48 | % | | | 76 | % | | | 84 | % | | | 94 | % |
Net assets, end of period (000s omitted) | | | $75,456 | | | | $64,792 | | | | $62,987 | | | | $76,980 | | | | $87,085 | |
| 1 | Calculated based upon average shares outstanding |
| 2 | Amount is more than $(0.005). |
The accompanying notes are an integral part of these financial statements.
22 | Wells Fargo Omega Growth Fund
Notes to financial statements
1. ORGANIZATION
Wells Fargo Funds Trust (the “Trust”), a Delaware statutory trust organized on March 10, 1999, is an open-end management investment company registered under the Investment Company Act of 1940, as amended (the “1940 Act”). As an investment company, the Trust follows the accounting and reporting guidance in Financial Accounting Standards Board (“FASB”) Accounting Standards Codification Topic 946, Financial Services – Investment Companies. These financial statements report on the Wells Fargo Omega Growth Fund (the “Fund”) which is a diversified series of the Trust.
2. SIGNIFICANT ACCOUNTING POLICIES
The following significant accounting policies, which are consistently followed in the preparation of the financial statements of the Fund, are in conformity with U.S. generally accepted accounting principles which require management to make estimates and assumptions that affect the reported amounts of assets and liabilities, disclosure of contingent assets and liabilities at the date of the financial statements, and the reported amounts of revenues and expenses during the reporting period. Actual results could differ from those estimates.
Securities valuation
All investments are valued each business day as of the close of regular trading on the New York Stock Exchange (generally 4 p.m. Eastern Time), although the Fund may deviate from this calculation time under unusual or unexpected circumstances.
Equity securities that are listed on a foreign or domestic exchange or market are valued at the official closing price or, if none, the last sales price. If no sale occurs on the principal exchange or market that day, a fair value price will be determined in accordance with the Fund’s Valuation Procedures.
Investments in registered open-end investment companies are valued at net asset value. Interests in non-registered investment companies that are redeemable at net asset value are fair valued normally at net asset value.
Investments which are not valued using any of the methods discussed above are valued at their fair value, as determined in good faith by the Board of Trustees of the Fund. The Board of Trustees has established a Valuation Committee comprised of the Trustees and has delegated to it the authority to take any actions regarding the valuation of portfolio securities that the Valuation Committee deems necessary or appropriate, including determining the fair value of portfolio securities, unless the determination has been delegated to the Wells Fargo Asset Management Pricing Committee at Wells Fargo Funds Management, LLC (“Funds Management”). The Board of Trustees retains the authority to make or ratify any valuation decisions or approve any changes to the Valuation Procedures as it deems appropriate. On a quarterly basis, the Board of Trustees receives reports on any valuation actions taken by the Valuation Committee or the Wells Fargo Asset Management Pricing Committee which may include items for ratification.
Foreign currency translation
The accounting records of the Fund are maintained in U.S. dollars. The values of other assets and liabilities denominated in foreign currencies are translated into U.S. dollars at rates provided by an independent foreign currency pricing source at a time each business day specified by the Wells Fargo Asset Management Pricing Committee. Purchases and sales of securities, and income and expenses are converted at the rate of exchange on the respective dates of such transactions. Net realized foreign exchange gains or losses arise from sales of foreign currencies, currency gains or losses realized between the trade and settlement dates on securities transactions, and the difference between the amounts of dividends, interest and foreign withholding taxes recorded and the U.S. dollar equivalent of the amounts actually paid or received. Net unrealized foreign exchange gains and losses arise from changes in the fair value of assets and liabilities other than investments in securities resulting from changes in exchange rates. The changes in net assets arising from changes in exchange rates of securities and the changes in net assets resulting from changes in market prices of securities are not separately presented. Such changes are included in net realized and unrealized gains or losses from investments.
Securities lending
The Fund may lend its securities from time to time in order to earn additional income in the form of fees or interest on securities received as collateral or the investment of any cash received as collateral. When securities are on loan, the Fund receives interest or dividends on those securities. Cash collateral received in connection with its securities lending transactions is invested in Securities Lending Cash Investments, LLC (the “Securities Lending Fund”). Investments in Securities Lending Fund are valued at the evaluated bid price provided by an independent pricing service. Income earned from investment in the Securities Lending Fund (net of fees and rebates), if any, is included in income from affiliated securities on the Statement of Operations.
In a securities lending transaction, the net asset value of the Fund will be affected by an increase or decrease in the value of the securities loaned and by an increase or decrease in the value of the instrument in which collateral is invested. The amount of
Wells Fargo Omega Growth Fund | 23
Notes to financial statements
securities lending activity undertaken by the Fund fluctuates from time to time. The Fund has the right under the lending agreement to recover the securities from the borrower on demand. In the event of default or bankruptcy by the borrower, the Fund may be prevented from recovering the loaned securities or gaining access to the collateral or may experience delays or costs in doing so. In such an event, the terms of the agreement allows the unaffiliated securities lending agent to use the collateral to purchase replacement securities on behalf of the Fund or pay the Fund the market value of the loaned securities. The Fund will bear the risk of loss with respect to depreciation of its investment of the cash collateral.
Security transactions and income recognition
Securities transactions are recorded on a trade date basis. Realized gains or losses are recorded on the basis of identified cost.
Dividend income is recognized on the ex-dividend date. Dividend income is recorded net of foreign taxes withheld where recovery of such taxes is not assured.
Distributions to shareholders
Distributions to shareholders from net investment income and any net realized gains are recorded on the ex-dividend date and paid at least annually. Such distributions are determined in accordance with income tax regulations and may differ from U.S. generally accepted accounting principles. Dividend sources are estimated at the time of declaration. The tax character of distributions is determined as of the Fund’s fiscal year end. Therefore, a portion of the Fund’s distributions made prior to the Fund’s fiscal year end may be categorized as a tax return of capital at year end.
Federal and other taxes
The Fund intends to continue to qualify as a regulated investment company by distributing substantially all of its investment company taxable income and any net realized capital gains (after reduction for capital loss carryforwards) sufficient to relieve it from all, or substantially all, federal income taxes. Accordingly, no provision for federal income taxes was required.
The Fund’s income and federal excise tax returns and all financial records supporting those returns for the prior three fiscal years are subject to examination by the federal and Delaware revenue authorities. Management has analyzed the Fund’s tax positions taken on federal, state, and foreign tax returns for all open tax years and does not believe that there are any uncertain tax positions that require recognition of a tax liability.
As of July 31, 2019, the aggregate cost of all investments for federal income tax purposes was $501,059,848 and the unrealized gains (losses) consisted of:
| | | | |
| |
Gross unrealized gains | | $ | 355,617,614 | |
| |
Gross unrealized losses | | | (5,034,690 | ) |
| |
Net unrealized gains | | $ | 350,582,924 | |
As of July 31, 2019, the Fund had a qualified late-year ordinary loss of $2,084,034 which will be recognized on the first day of the following fiscal year.
Class allocations
The separate classes of shares offered by the Fund differ principally in applicable sales charges, distribution, shareholder servicing, and administration fees. Class specific expenses are charged directly to that share class. Investment income, common fund-level expenses, and realized and unrealized gains (losses) on investments are allocated daily to each class of shares based on the relative proportion of net assets of each class.
3. FAIR VALUATION MEASUREMENTS
Fair value measurements of investments are determined within a framework that has established a fair value hierarchy based upon the various data inputs utilized in determining the value of the Fund’s investments. The three-level hierarchy gives the highest priority to unadjusted quoted prices in active markets for identical assets or liabilities (Level 1) and the lowest priority to unobservable inputs (Level 3). The Fund’s investments are classified within the fair value hierarchy based on the lowest level of input that is significant to the fair value measurement. The inputs are summarized into three broad levels as follows:
| ∎ | | Level 1 – quoted prices in active markets for identical securities |
| ∎ | | Level 2 – other significant observable inputs (including quoted prices for similar securities, interest rates, prepayment speeds, credit risk, etc.) |
| ∎ | | Level 3 – significant unobservable inputs (including the Fund’s own assumptions in determining the fair value of investments) |
24 | Wells Fargo Omega Growth Fund
Notes to financial statements
The inputs or methodologies used for valuing investments in securities are not necessarily an indication of the risk associated with investing in those securities.
The following is a summary of the inputs used in valuing the Fund’s assets and liabilities as of July 31, 2019:
| | | | | | | | | | | | | | | | |
| | | | |
| | | Quoted prices
(Level 1) | | | Other significant
observable inputs
(Level 2) | | | Significant
unobservable inputs (Level 3) | | | Total | |
| | | | |
Assets | | | | | | | | | | | | | | | | |
Investments in: | | | | | | | | | | | | | | | | |
| | | | |
Common stocks | | | | | | | | | | | | | | | | |
| | | | |
Communication services | | $ | 103,274,935 | | | $ | 0 | | | $ | 0 | | | $ | 103,274,935 | |
| | | | |
Consumer discretionary | | | 161,434,263 | | | | 0 | | | | 0 | | | | 161,434,263 | |
| | | | |
Financials | | | 30,920,925 | | | | 0 | | | | 0 | | | | 30,920,925 | |
| | | | |
Health care | | | 135,786,257 | | | | 0 | | | | 0 | | | | 135,786,257 | |
| | | | |
Industrials | | | 79,791,993 | | | | 0 | | | | 0 | | | | 79,791,993 | |
| | | | |
Information technology | | | 292,964,589 | | | | 0 | | | | 0 | | | | 292,964,589 | |
| | | | |
Materials | | | 35,565,818 | | | | 0 | | | | 0 | | | | 35,565,818 | |
| | | | |
Real estate | | | 5,595,348 | | | | 0 | | | | 0 | | | | 5,595,348 | |
| | | | |
Short-term investments | | | | | | | | | | | | | | | | |
| | | | |
Investment companies | | | 6,308,644 | | | | 0 | | | | 0 | | | | 6,308,644 | |
| | | | |
Total assets | | $ | 851,642,772 | | | $ | 0 | | | $ | 0 | | | $ | 851,642,772 | |
Additional sector, industry or geographic detail is included in the Portfolio of Investments.
For the year ended July 31, 2019, the Fund did not have any transfers into/out of Level 3.
4. TRANSACTIONS WITH AFFILIATES
Management fee
Funds Management, an indirect wholly owned subsidiary of Wells Fargo & Company (“Wells Fargo”), is the manager of the Fund and provides advisory and fund-level administrative services under an investment management agreement. Under the investment management agreement, Funds Management is responsible for, among other services, implementing the investment objectives and strategies of the Fund, supervising the subadviser and providing fund-level administrative services in connection with the Fund’s operations. As compensation for its services under the investment management agreement, Funds Management is entitled to receive a management fee at the following annual rate based on the Fund’s average daily net assets:
| | | | |
| |
| Average daily net assets | | Management fee | |
| |
First $500 million | | | 0.800 | % |
| |
Next $500 million | | | 0.750 | |
| |
Next $1 billion | | | 0.700 | |
| |
Next $2 billion | | | 0.675 | |
| |
Next $1 billion | | | 0.650 | |
| |
Next $3 billion | | | 0.640 | |
| |
Next $2 billion | | | 0.615 | |
| |
Next $2 billion | | | 0.605 | |
| |
Next $4 billion | | | 0.580 | |
| |
Over $16 billion | | | 0.555 | |
For the year ended July 31, 2019, the management fee was equivalent to an annual rate of 0.78% of the Fund’s average daily net assets.
Funds Management has retained the services of a subadviser to provide daily portfolio management to the Fund. The fee for subadvisory services is borne by Funds Management. Wells Capital Management Incorporated (“WellsCap”), an affiliate of Funds
Wells Fargo Omega Growth Fund | 25
Notes to financial statements
Management and an indirect wholly owned subsidiary of Wells Fargo, is the subadviser to the Fund and is entitled to receive a fee from Funds Management at an annual rate starting at 0.45% and declining to 0.30% as the average daily net assets of the Fund increase.
Administration fees
Under a class-level administration agreement, Funds Management provides class-level administrative services to the Fund, which includes paying fees and expenses for services provided by the transfer agent, sub-transfer agents, omnibus account servicers and record-keepers. As compensation for its services under the class-level administration agreement, Funds Management receives an annual fee which is calculated based on the average daily net assets of each class as follows:
| | | | |
| |
| | | Class-level
administration fee | |
| |
Class A, Class C, Class R | | | 0.21 | % |
| |
Administrator Class, Institutional Class | | | 0.13 | |
Waivers and/or expense reimbursements
Funds Management has contractually waived and/or reimbursed management and administration fees to the extent necessary to maintain certain net operating expense ratios for the Fund. When each class of the Fund has exceeded its expense cap, Funds Management has waived fees and/or reimbursed expenses from fund-level expenses on a proportionate basis and then from class specific expenses. When only certain classes exceed their expense caps, waivers and/or reimbursements are applied against class specific expenses before fund-level expenses. Funds Management has committed through November 30, 2019 to waive fees and/or reimburse expenses to the extent necessary to cap the Fund’s expenses at 1.30% for Class A shares, 2.05% for Class C shares, 1.55% for Class R shares, 1.10% for Administrator Class shares, and 0.85% for Institutional Class shares. Prior to or after the commitment expiration date, the cap may be increased or the commitment to maintain the cap may be terminated only with the approval of the Board of Trustees.
Distribution fees
The Trust has adopted a distribution plan for Class C and Class R shares of the Fund pursuant to Rule 12b-1 under the 1940 Act. Distribution fees are charged to Class C and Class R shares and paid to Wells Fargo Funds Distributor, LLC (“Funds Distributor”), the principal underwriter, at an annual rate of 0.75% of the average daily net assets of Class C shares and 0.25% of the average daily net assets of Class R shares.
In addition, Funds Distributor is entitled to receive the front-end sales charge from the purchase of Class A shares and a contingent deferred sales charge on the redemption of certain Class A shares. Funds Distributor is also entitled to receive the contingent deferred sales charges from redemptions of Class C shares. For the year ended July 31, 2019, Funds Distributor received $16,122 from the sale of Class A shares and $24 in contingent deferred sales charges from redemptions of Class C shares. No contingent deferred sales charges were incurred by Class A for the year ended July 31, 2019.
Shareholder servicing fees
The Trust has entered into contracts with one or more shareholder servicing agents, whereby Class A, Class C, Class R, and Administrator Class of the Fund are charged a fee at an annual rate of 0.25% of the average daily net assets of each respective class. A portion of these total shareholder servicing fees were paid to affiliates of Wells Fargo.
Interfund transactions
The Fund may purchase or sell portfolio investment securities to certain other Wells Fargo affiliates pursuant to Rule 17a-7 under the 1940 Act and under procedures adopted by the Board of Trustees. The procedures have been designed to ensure that these interfund transactions, which do not incur broker commissions, are effected at current market prices.
5. INVESTMENT PORTFOLIO TRANSACTIONS
Purchases and sales of investments, excluding U.S. government obligations (if any) and short-term securities, for the year ended July 31, 2019 were $313,160,986 and $391,826,079, respectively.
6. SECURITIES LENDING TRANSACTIONS
The Fund lends its securities through an unaffiliated securities lending agent and receives collateral in the form of cash or securities with a value at least equal to the value of the securities on loan. The value of the loaned securities is determined at the close of each business day and any increases or decreases in the required collateral are exchanged between the Fund and the counterparty on the next business day. Cash collateral received is invested in the Securities Lending Fund which seeks to
26 | Wells Fargo Omega Growth Fund
Notes to financial statements
provide a positive return compared to the daily Fed Funds Open Rate by investing in high-quality, U.S. dollar-denominated short-term money market instruments and is exempt from registration under Section 3(c)(7) of the 1940 Act. Securities Lending Fund is managed by Funds Management and is subadvised by WellsCap. Funds Management receives an advisory fee starting at 0.05% and declining to 0.01% as the average daily net assets of the Securities Lending Fund increase. All of the fees received by Funds Management are paid to WellsCap for its services as subadviser.
In the event of counterparty default or the failure of a borrower to return a loaned security, the Fund has the right to use the collateral to offset any losses incurred. As of July 31, 2019, the Fund did not have any securities on loan.
7. BANK BORROWINGS
The Trust (excluding the money market funds), Wells Fargo Master Trust and Wells Fargo Variable Trust are parties to a $280,000,000 revolving credit agreement whereby the Fund is permitted to use bank borrowings for temporary or emergency purposes, such as to fund shareholder redemption requests. Interest under the credit agreement is charged to the Fund based on a borrowing rate equal to the higher of the Federal Funds rate in effect on that day plus 1.25% or the overnight LIBOR rate in effect on that day plus 1.25%. In addition, an annual commitment fee equal to 0.25% of the unused balance is allocated to each participating fund.
For the year ended July 31, 2019, there were no borrowings by the Fund under the agreement.
8. DISTRIBUTIONS TO SHAREHOLDERS
The tax character of distributions paid during the years ended July 31, 2019 and July 31, 2018 were as follows:
| | | | | | | | |
| | | Year ended July 31 | |
| | |
| | | 2019 | | | 2018 | |
| | |
Ordinary income | | $ | 12,379,292 | | | $ | 0 | |
| | |
Long-term capital gain | | | 74,153,036 | | | | 99,253,531 | |
As of July 31, 2019, the components of distributable earnings on a tax basis were as follows:
| | | | |
Undistributed long-term gain | | Unrealized gains | | Late-year ordinary losses deferred |
| | |
| $33,772,771 | | $350,582,924 | | $(2,084,034) |
Effective for all filings after November 4, 2018, the Securities and Exchange Commission eliminated the requirement to separately state the components of distributions to shareholders under U.S. generally accepted accounting principles. The amounts of distributions to shareholders for the year ended July 31, 2018 were as follows:
| | | | |
| |
| | | Net realized
gains | |
| |
Class A | | | $78,031,973 | |
| |
Class C | | | 10,985,719 | |
| |
Class R | | | 974,995 | |
| |
Administrator Class | | | 2,304,666 | |
| |
Institutional Class | | | 6,956,178 | |
9. CONCENTRATION RISK
Concentration risks result from exposure to a limited number of sectors. As of the end of the period, the Fund invests a concentration of its portfolio in the information technology sector. A fund that invests a substantial portion of its assets in any sector may be more affected by changes in that sector than would be a fund whose investments are not heavily weighted in any sector.
Wells Fargo Omega Growth Fund | 27
Notes to financial statements
10. INDEMNIFICATION
Under the Trust’s organizational documents, the officers and Trustees have been granted certain indemnification rights against certain liabilities that may arise out of performance of their duties to the Trust. Additionally, in the normal course of business, the Trust may enter into contracts with service providers that contain a variety of indemnification clauses. The Trust’s maximum exposure under these arrangements is dependent on future claims that may be made against the Fund and, therefore, cannot be estimated.
11. NEW ACCOUNTING PRONOUNCEMENT
In August 2018, FASB issued Accounting Standards Update (“ASU”) No. 2018-13, Fair Value Measurement (Topic 820)Disclosure Framework—Changes to the Disclosure Requirements for Fair Value Measurement. ASU 2018-13 updates the disclosure requirements for fair value measurements by modifying or removing certain disclosures and adding certain new disclosures. The amendments are effective for fiscal years, and interim periods within those fiscal years, beginning after December 15, 2019. Early adoption is permitted. Management has adopted the removal and modification of disclosures early, as permitted, and will adopt the additional new disclosures at the effective date.
28 | Wells Fargo Omega Growth Fund
Report of independent registered public accounting firm
TO THE SHAREHOLDERS OF THE FUND AND BOARD OF TRUSTEES OF WELLS FARGO FUNDS TRUST:
Opinion on the Financial Statements
We have audited the accompanying statement of assets and liabilities of Wells Fargo Omega Growth Fund (the Fund), one of the funds constituting Wells Fargo Funds Trust, including the portfolio of investments, as of July 31, 2019, the related statement of operations for the year then ended, the statements of changes in net assets for each of the years in the two-year period then ended, and the related notes (collectively, the financial statements) and the financial highlights for each of the years in the five-year period then ended. In our opinion, the financial statements and financial highlights present fairly, in all material respects, the financial position of the Fund as of July 31, 2019, the results of its operations for the year then ended, the changes in its net assets for each of the years in the two-year period then ended, and the financial highlights for each of the years in the five-year period then ended, in conformity with U.S. generally accepted accounting principles.
Basis for Opinion
These financial statements and financial highlights are the responsibility of the Fund’s management. Our responsibility is to express an opinion on these financial statements and financial highlights based on our audits. We are a public accounting firm registered with the Public Company Accounting Oversight Board (United States) (PCAOB) and are required to be independent with respect to the Fund in accordance with the U.S. federal securities laws and the applicable rules and regulations of the Securities and Exchange Commission and the PCAOB.
We conducted our audits in accordance with the standards of the PCAOB. Those standards require that we plan and perform the audit to obtain reasonable assurance about whether the financial statements and financial highlights are free of material misstatement, whether due to error or fraud. Our audits included performing procedures to assess the risks of material misstatement of the financial statements and financial highlights, whether due to error or fraud, and performing procedures that respond to those risks. Such procedures included examining, on a test basis, evidence regarding the amounts and disclosures in the financial statements and financial highlights. Such procedures also included confirmation of securities owned as of July 31, 2019, by correspondence with the custodian, transfer agent and brokers, or by other appropriate auditing procedures. Our audits also included evaluating the accounting principles used and significant estimates made by management, as well as evaluating the overall presentation of the financial statements and financial highlights. We believe that our audits provide a reasonable basis for our opinion.

We have not been able to determine the specific year that we began serving as the auditor of one or more Wells Fargo Funds investment companies; however we are aware that we have served as the auditor of one or more Wells Fargo Funds investment companies since at least 1955.
Boston, Massachusetts
September 25, 2019
Wells Fargo Omega Growth Fund | 29
Other information (unaudited)
TAX INFORMATION
For corporate shareholders, pursuant to Section 854 of the Internal Revenue Code, 31.99% of ordinary income dividends qualify for the corporate dividends-received deduction for the fiscal year ended July 31, 2019.
Pursuant to Section 852 of the Internal Revenue Code, $74,153,036 was designated as a 20% rate gain distribution for the fiscal year ended July 31, 2019.
Pursuant to Section 854 of the Internal Revenue Code, $4,549,390 of income dividends paid during the fiscal year ended July 31, 2019 has been designated as qualified dividend income (QDI).
For the fiscal year ended July 31, 2019, $12,379,292 has been designated as short-term capital gain dividends for nonresident alien shareholders pursuant to Section 871 of the Internal Revenue Code.
PROXY VOTING INFORMATION
A description of the policies and procedures used to determine how to vote proxies relating to portfolio securities is available, upon request, by calling1-800-222-8222, visiting our website atwfam.com, or visiting the SEC website at sec.gov. Information regarding how the proxies related to portfolio securities were voted during the most recent 12-month period ended June 30 is available on the website atwfam.comor by visiting the SEC website at sec.gov.
QUARTERLY PORTFOLIO HOLDINGS INFORMATION
The Fund files its complete schedule of portfolio holdings with the SEC for the first and third quarters of each fiscal year on Form N-Q or Form N-PORT, which is available by visiting the SEC website at sec.gov. Those forms may be reviewed and copied at the SEC’s Public Reference Room in Washington, DC. Information on the operation of the Public Reference Room may be obtained by calling 1-800-SEC-0330.
30 | Wells Fargo Omega Growth Fund
Other information (unaudited)
BOARD OF TRUSTEES AND OFFICERS
Each of the Trustees and Officers1 listed in the table below acts in identical capacities for each fund in the Wells Fargo family of funds, which consists of 152 mutual funds comprising the Wells Fargo Funds Trust, Wells Fargo Variable Trust, Wells Fargo Master Trust and four closed-end funds (collectively the “Fund Complex”). This table should be read in conjunction with the Prospectus and the Statement of Additional Information2. The mailing address of each Trustee and Officer is 525 Market Street, 12th Floor, San Francisco, CA 94105. Each Trustee and Officer serves an indefinite term, however, each Trustee serves such term until reaching the mandatory retirement age established by the Trustees.
Independent Trustees
| | | | | | |
Name and year of birth | | Position held and
length of service* | | Principal occupations during past five years or longer | | Current other public company or investment company directorships |
| | | |
William R. Ebsworth (Born 1957) | | Trustee, since 2015 | | Retired. From 1984 to 2013, equities analyst, portfolio manager, research director and chief investment officer at Fidelity Management and Research Company in Boston, Tokyo, and Hong Kong, and retired in 2013 as Chief Investment Officer of Fidelity Strategic Advisers, Inc. where he led a team of investment professionals managing client assets. Prior thereto, Board member of Hong Kong Securities Clearing Co., Hong Kong Options Clearing Corp., the Thailand International Fund, Ltd., Fidelity Investments Life Insurance Company, and Empire Fidelity Investments Life Insurance Company. Audit Committee Chair and Investment Committee Chair of the Vincent Memorial Hospital Endowment (non-profit organization). Mr. Ebsworth is a CFA® charterholder. | | N/A |
| | | |
Jane A. Freeman (Born 1953) | | Trustee, since 2015; Chair Liaison, since 2018 | | Retired. From 2012 to 2014 and 1999 to 2008, Chief Financial Officer of Scientific Learning Corporation. From 2008 to 2012, Ms. Freeman provided consulting services related to strategic business projects. Prior to 1999, Portfolio Manager at Rockefeller & Co. and Scudder, Stevens & Clark. Board member of the Harding Loevner Funds from 1996 to 2014, serving as both Lead Independent Director and chair of the Audit Committee. Board member of the Russell Exchange Traded Funds Trust from 2011 to 2012 and the chair of the Audit Committee. Ms. Freeman is a Board Member of The Ruth Bancroft Garden (non-profit organization). She is also an inactive Chartered Financial Analyst. | | N/A |
| | | |
Isaiah Harris, Jr. (Born 1952) | | Trustee, since 2009; Audit Committee Chairman, since 2019 | | Retired. Chairman of the Board of CIGNA Corporation since 2009, and Director since 2005. From 2003 to 2011, Director of Deluxe Corporation. Prior thereto, President and CEO of BellSouth Advertising and Publishing Corp. from 2005 to 2007, President and CEO of BellSouth Enterprises from 2004 to 2005 and President of BellSouth Consumer Services from 2000 to 2003. Emeritus member of the Iowa State University Foundation Board of Governors. Emeritus Member of the Advisory Board of Iowa State University School of Business. Advisory Board Member, Palm Harbor Academy (private school). Advisory Board Member, Child Evangelism Fellowship (non-profit). Mr. Harris is a certified public accountant (inactive status). | | CIGNA Corporation |
| | | |
Judith M. Johnson (Born 1949) | | Trustee, since 2008; Audit Committee Chairman, from 2009 to 2018 | | Retired. Prior thereto, Chief Executive Officer and Chief Investment Officer of Minneapolis Employees Retirement Fund from 1996 to 2008. Ms. Johnson is an attorney, certified public accountant and a certified managerial accountant. | | N/A |
Wells Fargo Omega Growth Fund | 31
Other information (unaudited)
| | | | | | |
Name and year of birth | | Position held and
length of service* | | Principal occupations during past five years or longer | | Current other public company or investment company directorships |
| | | |
David F. Larcker (Born 1950) | | Trustee, since 2009 | | James Irvin Miller Professor of Accounting at the Graduate School of Business, Stanford University, Director of the Corporate Governance Research Initiative and Senior Faculty of The Rock Center for Corporate Governance since 2006. From 2005 to 2008, Professor of Accounting at the Graduate School of Business, Stanford University. Prior thereto, Ernst & Young Professor of Accounting at The Wharton School, University of Pennsylvania from 1985 to 2005. | | N/A |
| | | |
Olivia S. Mitchell (Born 1953) | | Trustee, since 2006; Nominating and Governance Committee Chairman, since 2018 | | International Foundation of Employee Benefit Plans Professor, Wharton School of the University of Pennsylvania since 1993. Director of Wharton’s Pension Research Council and Boettner Center on Pensions & Retirement Research, and Research Associate at the National Bureau of Economic Research. Previously, Cornell University Professor from 1978 to 1993. | | N/A |
| | | |
Timothy J. Penny (Born 1951) | | Trustee, since 1996; Chairman, since 2018 | | President and Chief Executive Officer of Southern Minnesota Initiative Foundation, a non-profit organization, since 2007. Member of the Board of Trustees of NorthStar Education Finance, Inc., a non-profit organization, since 2007. | | N/A |
| | | |
James G. Polisson (Born 1959) | | Trustee, since 2018 | | Retired. Chief Marketing Officer, Source (ETF) UK Services, Ltd, from 2015 to 2017. From 2012 to 2015, Principal of The Polisson Group, LLC, a management consulting, corporate advisory and principal investing company. Chief Executive Officer and Managing Director at Russell Investments, Global Exchange Traded Funds from 2010 to 2012. Managing Director of Barclays Global Investors from 1998 to 2010 and Global Chief Marketing Officer for iShares and Barclays Global Investors from 2000 to 2010. Trustee of the San Francisco Mechanics’ Institute, a non-profit organization, from 2013 to 2015. Board member of the Russell Exchange Traded Fund Trust from 2011 to 2012. Director of Barclays Global Investors Holdings Deutschland GmbH from 2006 to 2009. Mr. Polisson is an attorney and has a retired status with the Massachusetts and District of Columbia Bar Associations. | | N/A |
| * | Length of service dates reflect the Trustee’s commencement of service with the Trust’s predecessor entities, where applicable. |
32 | Wells Fargo Omega Growth Fund
Other information (unaudited)
Officers
| | | | |
Name and year of birth | | Position held and
length of service | | Principal occupations during past five years or longer |
| | |
Andrew Owen (Born 1960) | | President, since 2017 | | Executive Vice President of Wells Fargo & Company and Head of Affiliated Managers, Wells Fargo Asset Management, since 2014. In addition, Mr. Owen is currently President, Chief Executive Officer and Director of Wells Fargo Funds Management, LLC since 2017. Prior thereto, Executive Vice President responsible for marketing, investments and product development for Wells Fargo Funds Management, LLC, from 2009 to 2014. |
| | |
Jeremy DePalma1 (Born 1974) | | Treasurer, since 2012 | | Senior Vice President of Wells Fargo Funds Management, LLC since 2009. Senior Vice President of Evergreen Investment Management Company, LLC from 2008 to 2010 and head of the Fund Reporting and Control Team within Fund Administration from 2005 to 2010. |
| | |
Alexander Kymn (Born 1973) | | Secretary and Chief Legal Officer, since 2018 | | Senior Company Counsel of Wells Fargo Bank, N.A. since 2018 (previously Senior Counsel from 2007 to 2018). Vice President of Wells Fargo Funds Management, LLC from 2008 to 2014. |
| | |
Michael H. Whitaker (Born 1967) | | Chief Compliance Officer, since 2016 | | Senior Vice President and Chief Compliance Officer since 2016. Senior Vice President and Chief Compliance Officer for Fidelity Investments from 2007 to 2016. |
| | |
David Berardi (Born 1975) | | Assistant Treasurer, since 2009 | | Vice President of Wells Fargo Funds Management, LLC since 2009. Vice President of Evergreen Investment Management Company, LLC from 2008 to 2010. Manager of Fund Reporting and Control for Evergreen Investment Management Company, LLC from 2004 to 2010. |
| 1 | Jeremy DePalma acts as Treasurer of 87 funds and Assistant Treasurer of 65 funds in the Fund Complex. |
| 2 | The Statement of Additional Information includes additional information about the Trustees and is available, without charge, upon request, by calling1-800-222-8222 or by visiting the website atwfam.com. |
Wells Fargo Omega Growth Fund | 33
Other information (unaudited)
BOARD CONSIDERATION OF INVESTMENT MANAGEMENT AND SUB-ADVISORY AGREEMENTS:
Wells Fargo Omega Growth Fund
Under the Investment Company Act of 1940 (the “1940 Act”), the Board of Trustees (the “Board”) of Wells Fargo Funds Trust (the “Trust”) must determine annually whether to approve the continuation of the Trust’s investment management and sub-advisory agreements. In this regard, at an in-person meeting held on May 21-22, 2019 (the “Meeting”), the Board, all the members of which have no direct or indirect interest in the investment management and sub-advisory agreements and are not “interested persons” of the Trust, as defined in the 1940 Act (the “Independent Trustees”), reviewed and approved for Wells Fargo Omega Growth Fund (the “Fund”): (i) an investment management agreement (the “Management Agreement”) with Wells Fargo Funds Management, LLC (“Funds Management”); and (ii) an investment sub-advisory agreement (the “Sub-Advisory Agreement”) with Wells Capital Management Incorporated (the “Sub-Adviser”), an affiliate of Funds Management. The Management Agreement and the Sub-Advisory Agreement are collectively referred to as the “Advisory Agreements.”
At the Meeting, the Board considered the factors and reached the conclusions described below relating to the selection of Funds Management and the Sub-Adviser and the approval of the Advisory Agreements. Prior to the Meeting, including at an in-person meeting in April 2019, the Trustees conferred extensively among themselves and with representatives of Funds Management about these matters. Also, the Board has adopted a team-based approach, with each team consisting of a sub-set of Trustees, to assist the full Board in the discharge of its duties in reviewing investment performance and other matters throughout the year. The Independent Trustees were assisted in their evaluation of the Advisory Agreements by independent legal counsel, from whom they received separate legal advice and with whom they met separately.
In providing information to the Board, Funds Management and the Sub-Adviser were guided by a detailed set of requests for information submitted to them by independent legal counsel on behalf of the Independent Trustees at the start of the Board’s annual contract renewal process earlier in 2019. In considering and approving the Advisory Agreements, the Trustees considered the information they believed relevant, including but not limited to the information discussed below. The Board considered not only the specific information presented in connection with the Meeting, but also the knowledge gained over time through interaction with Funds Management and the Sub-Adviser about various topics. In this regard, the Board reviewed reports of Funds Management at each of its quarterly meetings, which included, among other things, portfolio reviews and investment performance reports. In addition, the Board and the teams mentioned above confer with portfolio managers at various times throughout the year. The Board did not identify any particular information or consideration that was all-important or controlling, and each individual Trustee may have attributed different weights to various factors.
After its deliberations, the Board unanimously approved the continuation of the Advisory Agreements for a one-year term and determined that the compensation payable to Funds Management and the Sub-Adviser under each of the Advisory Agreements was reasonable. The Board considered the approval of the Advisory Agreements for the Fund as part of its consideration of agreements for funds across the complex, but its approvals were made on a fund-by-fund basis. The following summarizes a number of important, but not necessarily all, factors considered by the Board in support of its approvals.
Nature, extent and quality of services
The Board received and considered various information regarding the nature, extent and quality of services provided to the Fund by Funds Management and the Sub-Adviser under the Advisory Agreements. This information included a description of the investment advisory services and Fund-level administrative services covered by the Management Agreement, as well as, among other things, a summary of the background and experience of senior management of Wells Fargo Asset Management (“WFAM”), of which Funds Management and the Sub-Adviser are a part, a summary of investments made in the business of WFAM, a summary of certain organizational and personnel changes involving Funds Management and the Sub-Adviser, and a description of Funds Management’s and the Sub-Adviser’s business continuity planning programs and of their approaches to data privacy and cybersecurity. The Board received and reviewed information about Funds Management’s role as administrator of the Fund’s liquidity risk management program. The Board also considered the qualifications, background, tenure and responsibilities of each of the portfolio managers primarily responsible for the day-to-day portfolio management of the Fund.
The Board evaluated the ability of Funds Management and the Sub-Adviser to attract and retain qualified investment professionals, including research, advisory and supervisory personnel. The Board further considered the compliance programs and compliance records of Funds Management and the Sub-Adviser. In addition, the Board took into account the full range of services provided to the Fund by Funds Management and its affiliates.
34 | Wells Fargo Omega Growth Fund
Other information (unaudited)
Fund investment performance and expenses
The Board considered the investment performance results for the Fund over various time periods ended December 31, 2018. The Board considered these results in comparison to the investment performance of funds in a universe that was determined by Broadridge Inc. (“Broadridge”) to be similar to the Fund (the “Universe”), and in comparison to the Fund’s benchmark index and to other comparative data. Broadridge is an independent provider of investment company data. The Board received a description of the methodology used by Broadridge to select the mutual funds in the performance Universe. The Board noted that the investment performance of the Fund (Administrator Class) was higher than the average investment performance of the Universe for all periods under review. The Board also noted that the investment performance of the Fund was lower than its benchmark index, the Russell 3000® Growth Index, for the five- and ten-year periods under review, but higher than or in range of its benchmark for the one- and three-year periods under review.
The Board received information concerning, and discussed factors contributing to, the underperformance of the Fund relative to the benchmark for the periods identified above. The Board took note of the explanations for the relative underperformance during these periods, including with respect to investment decisions and market factors that affected the Fund’s investment performance. The Board also took note of the Fund’s outperformance relative to the Universe for all periods under review and the benchmark over the shorter time periods under review.
The Board also received and considered information regarding the Fund’s net operating expense ratios and their various components, including actual management fees, custodian and other non-management fees, and Rule 12b-1 and non-Rule 12b-1 shareholder service fees. The Board considered these ratios in comparison to the median ratios of funds in class-specific expense groups that were determined by Broadridge to be similar to the Fund (the “Groups”). The Board received a description of the methodology used by Broadridge to select the mutual funds in the expense Groups and an explanation of how funds comprising expense groups and their expense ratios may vary from year-to-year. Based on the Broadridge reports, the Board noted that the net operating expense ratios of the Fund were lower than or in range of the median net operating expense ratios of the expense Groups for each share class.
The Board took into account the Fund’s investment performance and expense information provided to it among the factors considered in deciding to re-approve the Advisory Agreements.
Investment management and sub-advisory fee rates
The Board reviewed and considered the contractual fee rates payable by the Fund to Funds Management under the Management Agreement, as well as the contractual fee rates payable by the Fund to Funds Management for class-level administrative services under a Class-Level Administration Agreement, which include, among other things, class-level transfer agency and sub-transfer agency costs (collectively, the “Management Rates”). The Board also reviewed and considered the contractual investment sub-advisory fee rates that are payable by Funds Management to the Sub-Adviser for investment sub-advisory services.
Among other information reviewed by the Board was a comparison of the Fund’s Management Rates with the average contractual investment management fee rates of funds in the expense Groups at a common asset level as well as transfer agency costs of the funds in the expense Groups. The Board noted that the Management Rates of the Fund were lower than or in range of the sum of these average rates for the Fund’s expense Groups for the Class R and Administrator Class share classes, but higher than the sum of these average rates for the Fund’s expense Groups for the Class A and Institutional share classes. However, the Board noted that the net operating expense ratios of the Fund were lower than or in range of the median net operating expense ratios of the expense Groups for each share class.
The Board also received and considered information about the portion of the total management fee that was retained by Funds Management after payment of the fee to the Sub-Adviser for sub-advisory services. In assessing the reasonableness of this amount, the Board received and evaluated information about the nature and extent of responsibilities retained and risks assumed by Funds Management and not delegated to or assumed by the Sub-Adviser, and about Funds Management’s on-going oversight services. Given the affiliation between Funds Management and the Sub-Adviser, the Board ascribed limited relevance to the allocation of fees between them.
The Board also received and considered information about the nature and extent of services offered and fee rates charged by Funds Management and the Sub-Adviser to other types of clients with investment strategies similar to those of the Fund. In this regard, the Board received information about the significantly greater scope of services, and compliance, reporting and other legal burdens and risks of managing proprietary mutual funds compared with those associated with managing assets of other types of clients, including third-party sub-advised fund clients and non-mutual fund clients such as institutional separate accounts.
Wells Fargo Omega Growth Fund | 35
Other information (unaudited)
Based on its consideration of the factors and information it deemed relevant, including those described here, the Board determined that the compensation payable to Funds Management under the Management Agreement and to the Sub-Adviser under the Sub-Advisory Agreement was reasonable.
Profitability
The Board received and considered information concerning the profitability of Funds Management, as well as the profitability of both WFAM and Wells Fargo & Co. (“Wells Fargo”) from providing services to the fund family as a whole. The Board noted that the Sub-Adviser’s profitability information with respect to providing services to the Fund and other funds in the family was subsumed in the WFAM and Wells Fargo profitability analysis.
Funds Management reported on the methodologies and estimates used in calculating profitability, including a description of the methodology used to allocate certain expenses. Among other things, the Board noted that the levels of profitability reported on a fund-by-fund basis varied widely, depending on factors such as the size, type and age of fund. Based on its review, the Board did not deem the profits reported by Funds Management, WFAM or Wells Fargo from services provided to the Fund to be at a level that would prevent it from approving the continuation of the Advisory Agreements.
Economies of scale
The Board received and considered information about the potential for Funds Management to experience economies of scale in the provision of management services to the Fund, the difficulties of calculating economies of scale at an individual fund level, and the extent to which potential scale benefits are shared with shareholders. The Board noted the existence of breakpoints in the Fund’s management fee structure, which operate generally to reduce the Fund’s expense ratios as the Fund grows in size. The Board considered that in addition to management fee breakpoints, Funds Management shares potential economies of scale from its management business in a variety of ways, including through fee waiver and expense reimbursement arrangements, services that benefit shareholders, competitive management fee rates set at the outset without regard to breakpoints, and investments in the business intended to enhance services available to shareholders.
The Board concluded that Funds Management’s arrangements with respect to the Fund, including contractual breakpoints, constituted a reasonable approach to sharing potential economies of scale with the Fund and its shareholders.
Other benefits to Funds Management and the Sub-Adviser
The Board received and considered information regarding potential “fall-out” or ancillary benefits received by Funds Management and its affiliates, including the Sub-Adviser, as a result of their relationships with the Fund. Ancillary benefits could include, among others, benefits directly attributable to other relationships with the Fund and benefits potentially derived from an increase in Funds Management’s and the Sub-Adviser’s business as a result of their relationships with the Fund. The Board noted that various affiliates of Funds Management may receive distribution-related fees, shareholder servicing payments and sub-transfer agency fees in respect of shares sold or held through them and services provided.
The Board also reviewed information about soft dollar credits earned and utilized by the Sub-Adviser, fees earned by Funds Management and the Sub-Adviser from managing a private investment vehicle for the fund family’s securities lending collateral, and commissions earned by an affiliated broker from portfolio transactions.
Based on its consideration of the factors and information it deemed relevant, including those described here, the Board did not find that any ancillary benefits received by Funds Management and its affiliates, including the Sub-Adviser, were unreasonable.
Conclusion
At the Meeting, after considering the above-described factors and based on its deliberations and its evaluation of the information described above, the Board unanimously approved the continuation of the Advisory Agreements for a one-year term and determined that the compensation payable to Funds Management and the Sub-Adviser under each of the Advisory Agreements was reasonable.
36 | Wells Fargo Omega Growth Fund

For more information
More information about Wells Fargo Funds is available free upon request. To obtain literature, please write, visit the Fund’s website, or call:
Wells Fargo Funds
P.O. Box 219967
Kansas City, MO 64121-9967
Website:wfam.com
Individual investors:1-800-222-8222
Retail investment professionals:1-888-877-9275
Institutional investment professionals:1-866-765-0778

This report and the financial statements contained herein are submitted for the general information of the shareholders of the Fund. If this report is used for promotional purposes, distribution of the report must be accompanied or preceded by a current prospectus. Before investing, please consider the investment objectives, risks, charges, and expenses of the investment. For a current prospectus and, if available, a summary prospectus, containing this information, call1-800-222-8222 or visit the Fund’s website atwfam.com. Read the prospectus carefully before you invest or send money.
Wells Fargo Asset Management (WFAM) is the trade name for certain investment advisory/management firms owned by Wells Fargo & Company. These firms include but are not limited to Wells Capital Management Incorporated and Wells Fargo Funds Management, LLC. Certain products managed by WFAM entities are distributed by Wells Fargo Funds Distributor, LLC (a broker-dealer and Member FINRA).
This material is for general informational and educational purposes only and is NOT intended to provide investment advice or a recommendation of any kind—including a recommendation for any specific investment, strategy, or plan.
INVESTMENT PRODUCTS: NOT FDIC INSURED ◾ NO BANK GUARANTEE ◾ MAY LOSE VALUE
© 2019 Wells Fargo Funds Management, LLC. All rights reserved.
405484 09-19
A211/AR211 07-19
Annual Report
July 31, 2019
Wells Fargo
Premier Large Company Growth Fund
Beginning on January 1, 2021, as permitted by new regulations adopted by the Securities and Exchange Commission, paper copies of the Wells Fargo Funds’ annual and semi-annual shareholder reports issued after this date will no longer be sent by mail, unless you specifically request paper copies of the reports. Instead, the reports will be made available on the Funds’ website, and you will be notified by mail each time a report is posted and provided with a website address to access the report.
If you already elected to receive shareholder reports electronically, you will not be affected by this change and you need not take any action. You may elect to receive shareholder reports and other communications from the Fund electronically at any time by contacting your financial intermediary (such as a broker-dealer or bank) or, if you are a direct investor, by calling1-800-222-8222 or by enrolling at wellsfargo.com/advantagedelivery.
You may elect to receive all future reports in paper free of charge. If you invest through a financial intermediary, you can contact your financial intermediary to request that you continue to receive paper copies of your shareholder reports; if you invest directly with the Fund, you can call 1-800-222-8222. Your election to receive reports in paper will apply to all Wells Fargo Funds held in your account with your financial intermediary or, if you are a direct investor, to all Wells Fargo Funds that you hold.
|
|
|
Reduce clutter. Save trees. |
Sign up for electronic delivery of prospectuses and shareholder reports atwellsfargo.com/
advantagedelivery |
The views expressed and any forward-looking statements are as of July 31, 2019, unless otherwise noted, and are those of the Fund managers and/or Wells Fargo Asset Management. Discussions of individual securities, or the markets generally, or any Wells Fargo Fund are not intended as individual recommendations. Future events or results may vary significantly from those expressed in any forward-looking statements. The views expressed are subject to change at any time in response to changing circumstances in the market. Wells Fargo Asset Management and the Fund disclaim any obligation to publicly update or revise any views expressed or forward-looking statements.
INVESTMENT PRODUCTS: NOT FDIC INSURED ◾ NO BANK GUARANTEE ◾ MAY LOSE VALUE
Wells Fargo Premier Large Company Growth Fund | 1
Letter to shareholders (unaudited)

Andrew Owen
President
Wells Fargo Funds
Dear Shareholder:
We are pleased to offer you this annual report for the Wells Fargo Premier Large Company Growth Fund for the12-month period that ended July 31, 2019. After the first six months of the period yielded eitherlow-single-digit or negative investment returns, U.S. stock and global bond investors generally enjoyed a recovery during the final six months amid continued concerns about global economic growth, international trade, geopolitical tensions, and bouts of market volatility. These concerns negatively influenced international equity markets.
For the period, U.S. stocks, based on the S&P 500 Index,1 gained 7.99% and international stocks, as measured by the MSCI ACWI ex USA Index (Net),2 fell 2.27%. The MSCI EM Index (Net)3 slipped 2.18%. For bond investors, the Bloomberg Barclays U.S. Aggregate Bond Index4 added 8.08%, the Bloomberg Barclays Global Aggregateex-USD Index5 added 3.74%, the Bloomberg Barclays Municipal Bond Index6 gained 7.31%, and the ICE BofAML U.S. High Yield Index7 added 6.94%.
Entering the fourth quarter of 2018, economic data was encouraging.
Domestic equity investors entered the fourth quarter of 2018 with reasons to be optimistic. The U.S. Bureau of Economic Analysis reported second-quarter annualized gross domestic product (GDP) growth of 4.2%. Hiring improved. Unemployment declined. Consumer confidence and spending increased. Third-quarter corporate earnings reports were generally positive. U.S. trade negotiations with Mexico and Canada progressed. The U.S. Federal Reserve (Fed) raised the federal funds rate by 25 basis points (bps; 100 bps equal 1.00%) to a target range of between 2.00% and 2.25% in September 2018, one of four rate increases implemented during the calendar year, a sign of its confidence in the strength of the U.S. economy.
Investors in international markets were not as confident. Tensions between the U.S. and China increased. The U.S. imposed $200 billion in tariffs on Chinese goods. China reacted with $60 billion in tariffs on U.S. goods. Economic growth in China caused concern. In September 2018, international investors began to factor a number of disconcerting economic and business data points: lower July manufacturers’ and industrial orders in Germany; falling purchasing manager index numbers for August from the United Kingdom, China, and India; and declining household spending for August in Japan. Taken together, the data fed growing concerns over slowing global growth that unnerved investors.
| 1 | The S&P 500 Index consists of 500 stocks chosen for market size, liquidity, and industry group representation. It is a market-value-weighted index with each stock’s weight in the index proportionate to its market value. You cannot invest directly in an index. |
| 2 | The Morgan Stanley Capital International (MSCI) All Country World Index (ACWI) ex USA Index (Net) is a free-float-adjusted market-capitalization weighted index that is designed to measure the equity market performance of developed and emerging markets, excluding the U.S. Source: MSCI. MSCI makes no express or implied warranties or representations and shall have no liability whatsoever with respect to any MSCI data contained herein. The MSCI data may not be further redistributed or used as a basis for other indices or any securities or financial products. This report is not approved, reviewed, or produced by MSCI. You cannot invest directly in an index. |
| 3 | The MSCI Emerging Markets (EM) Index (Net) is a free-float-adjusted market-capitalization-weighted index that is designed to measure the equity market performance of emerging markets. You cannot invest directly in an index. |
| 4 | The Bloomberg Barclays U.S. Aggregate Bond Index is a broad-based benchmark that measures the investment-grade, U.S. dollar-denominated, fixed-rate taxable bond market, including Treasuries, government-related and corporate securities, mortgage-backed securities (agency fixed-rate and hybrid adjustable-rate mortgage pass-throughs), asset-backed securities, and commercial mortgage-backed securities. You cannot invest directly in an index. |
| 5 | The Bloomberg Barclays Global Aggregateex-USD Index is an unmanaged index that provides a broad-based measure of the global investment-grade fixed-income markets excluding the U.S. dollar-denominated debt market. You cannot invest directly in an index. |
| 6 | The Bloomberg Barclays Municipal Bond Index is an unmanaged index composed of long-termtax-exempt bonds with a minimum credit rating of Baa. You cannot invest directly in an index. |
| 7 | The ICE BofAML U.S. High Yield Index is a market-capitalization-weighted index of domestic and Yankee high-yield bonds. The index tracks the performance of high-yield securities traded in the U.S. bond market. You cannot invest directly in an index. Copyright 2019. ICE Data Indices, LLC. All rights reserved. |
2 | Wells Fargo Premier Large Company Growth Fund
Letter to shareholders (unaudited)
Global markets suffered during the fourth quarter of 2018.
November’s U.S. midterm elections shifted control of the House of Representatives from Republicans to Democrats, presaging partisan clashes that followed and caused uncertainty among investors. Third-quarter U.S. GDP was announced at an annualized 3.4% rate, lower than the second-quarter rate. Brexit efforts stalled ahead of the March 2019 deadline. The People’s Bank of China cut reserve requirement ratios, accelerated infrastructure spending, and cut taxes even as the value of the yuan declined to low levels last seen in 2008. A partial U.S. government shutdown driven by partisan policy disputes extended into January.
The combination of news in the U.S. and generally weak economic indicators outside of the U.S. caused investors to seek safe havens. December’s S&P 500 Index performance was the worst since 1931. Globally, fixed-income investments fared better than stocks during the last two months of the year. The Fed increased the federal funds rate by 25 bps in December to a target range of between 2.25% and 2.50%.
The market climbs a wall of worry.
Investors entered 2019 with reasons to be concerned. Investment returns appeared to reaffirm the adage that markets climb a wall of worry. The S&P 500 Index gained 8.01% for the month of January, the best monthly performance in 30 years. Returns for the MSCI ACWI ex USA Index (Net), the Bloomberg Barclays U.S. Aggregate Bond Index, and the Bloomberg Barclays Global Aggregateex-USD Index also were positive.
In February 2019, signs of slowing global growth grew more ominous. The Bureau of Economic Analysis announced fourth-quarter 2018 GDP grew at an annualized 2.2% rate, down from the levels of the prior two quarters. In a February report, the Bank of England forecasted the slowest growth since the financial crisis for 2019. China and the U.S. continued to wrangle over trade issues.
By the end of March 2019, a combination of dovish Fed sentiment and steady, if not spectacular, U.S. economic and business metrics reinforced investors’ confidence. Monthly job creation data and corporate profits, while less consistent than during 2018, were solid. China announced a roughly $300 billion stimulus package through tax and fee cuts intended to reinvigorate economic growth. During April 2019, favorable sentiment found additional support in reports of sustained low inflation, solid employment data, and first-quarter U.S. GDP of an annualized rate of 3.2%.
During May 2019, markets tumbled on mixed investment signals. In the U.S., partisan wrangling ramped up as Democrats and Republicans set their sights on 2020 presidential politics. The U.K.’s Brexit caused Prime Minister Theresa May to resign. The European Commission downgraded the 2019 growth forecast to 1.2%. The U.S. increased tariffs on products from China, China responded, and then talks broke down. President Donald Trump threatened to turn his foreign policy tariff tool to Mexico over immigration issues.
As had been the case during most of 2019 to date, just as the investment horizon appeared to darken, sentiment turned and U.S. equity markets gained during June and July. The gains, primarily driven by geopolitical and monetary policy events, pushed equity markets to new highs.
President Mario Draghi of the European Central Bank said that if the outlook doesn’t improve, the bank will cut rates or buy more assets to prop up inflation. President Trump backed off of tariff threats against Mexico and China. In the U.S., the Fed implemented a 0.25% federal funds rate cut in July 2019.
“December’s S&P 500 Index performance was the worst since 1931.”
“The S&P 500 Index gained 8.01% for the month of January, the best monthly performance in 30 years.”
Wells Fargo Premier Large Company Growth Fund | 3
Letter to shareholders (unaudited)
Later in July 2019, the U.S. reversed course and threatened to impose higher tariffs on China’s exports after talks failed. China responded with tariff threats of its own and devalued the renminbi, a move that roiled global markets. Despite the accommodative approach of central banks, investors continued to have misgivings about the durability of economic growth globally and a pervasively cautious tone influenced the world’s equity and fixed-income markets.
Don’t let short-term uncertainty derail long-term investment goals.
Periods of investment uncertainty can present challenges, but experience has taught us that maintaining long-term investment goals can be an effective way to plan for the future. To help you create a sound strategy based on your personal goals and risk tolerance, Wells Fargo Funds offers more than 100 mutual funds spanning a wide range of asset classes and investment styles. Although diversification cannot guarantee an investment profit or prevent losses, we believe it can be an effective way to manage investment risk and potentially smooth out overall portfolio performance. We encourage investors to know their investments and to understand that appropriate levels of risk-taking may unlock opportunities.
Thank you for choosing to invest with Wells Fargo Funds. We appreciate your confidence in us and remain committed to helping you meet your financial needs.
Sincerely,

Andrew Owen
President
Wells Fargo Funds
|
|
|
For further information about your Fund, contact your investment professional, visit our website at wfam.com, or call us directly at1-800-222-8222. |
4 | Wells Fargo Premier Large Company Growth Fund
This page is intentionally left blank.
Performance highlights (unaudited)
Investment objective
The Fund seeks long-term capital appreciation.
Manager
Wells Fargo Funds Management, LLC
Subadviser
Wells Capital Management Incorporated
Portfolio managers
Joseph M. Eberhardy, CFA®‡, CPA
Bob Gruendyke, CFA®‡
Thomas C. Ognar, CFA®‡
Average annual total returns (%) as of July 31, 2019
| | | | | | | | | | | | | | | | | | | | | | | | | | | | | | | | | | |
| | | | |
| | | | | Including sales charge | | | Excluding sales charge | | | Expense ratios1 (%) | |
| | | | | | | | | |
| | | Inception date | | 1 year | | | 5 year | | | 10 year | | | 1 year | | | 5 year | | | 10 year | | | Gross | | | Net2 | |
| | | | | | | | | | |
| Class A (EKJAX)3 | | 1-20-1998 | | | 6.49 | | | | 11.41 | | | | 14.28 | | | | 12.97 | | | | 12.74 | | | | 14.96 | | | | 1.15 | | | | 1.11 | |
| | | | | | | | | | |
| Class C (EKJCX)3 | | 1-22-1998 | | | 11.09 | | | | 11.90 | | | | 14.10 | | | | 12.09 | | | | 11.90 | | | | 14.10 | | | | 1.90 | | | | 1.86 | |
| | | | | | | | | | |
| Class R4 (EKJRX)3,4 | | 11-30-2012 | | | – | | | | – | | | | – | | | | 13.21 | | | | 13.08 | | | | 15.31 | | | | 0.87 | | | | 0.80 | |
| | | | | | | | | | |
| Class R6 (EKJFX)3,5 | | 11-30-2012 | | | – | | | | – | | | | – | | | | 13.40 | | | | 13.25 | | | | 15.43 | | | | 0.72 | | | | 0.65 | |
| | | | | | | | | | |
| Administrator Class (WFPDX)3,6 | | 7-16-2010 | | | – | | | | – | | | | – | | | | 13.02 | | | | 12.87 | | | | 15.10 | | | | 1.07 | | | | 1.00 | |
| | | | | | | | | | |
| Institutional Class (EKJYX)3 | | 6-30-1999 | | | – | | | | – | | | | – | | | | 13.38 | | | | 13.21 | | | | 15.40 | | | | 0.82 | | | | 0.70 | |
| | | | | | | | | | |
| Russell 1000® Growth Index7 | | – | | | – | | | | – | | | | – | | | | 10.82 | | | | 14.25 | | | | 15.74 | | | | – | | | | – | |
Figures quoted represent past performance, which is no guarantee of future results, and do not reflect taxes that a shareholder may pay on fund distributions or the redemption of fund shares. Investment return and principal value of an investment will fluctuate so that an investor’s shares, when redeemed, may be worth more or less than their original cost. Performance shown without sales charges would be lower if sales charges were reflected. Current performance may be lower or higher than the performance data quoted, which assumes the reinvestment of dividends and capital gains. Currentmonth-end performance is available on the Fund’s website,wfam.com.
Index returns do not include transaction costs associated with buying and selling securities, any mutual fund fees or expenses, or any taxes. It is not possible to invest directly in an index.
For Class A shares, the maximumfront-end sales charge is 5.75%. For Class C shares, the maximum contingent deferred sales charge is 1.00%. Performance including a contingent deferred sales charge assumes the sales charge for the corresponding time period. Class R4, Class R6, Administrator Class, and Institutional Class shares are sold without afront-end sales charge or contingent deferred sales charge.
Stock values fluctuate in response to the activities of individual companies and general market and economic conditions. Certain investment strategies tend to increase the total risk of an investment (relative to the broader market). The Fund is exposed to foreign investment risk. Consult the Fund’s prospectus for additional information on these and other risks.
Please see footnotes on page 7.
6 | Wells Fargo Premier Large Company Growth Fund
Performance highlights (unaudited)
|
|
| Growth of $10,000 investment as of July 31, 20198 |
|
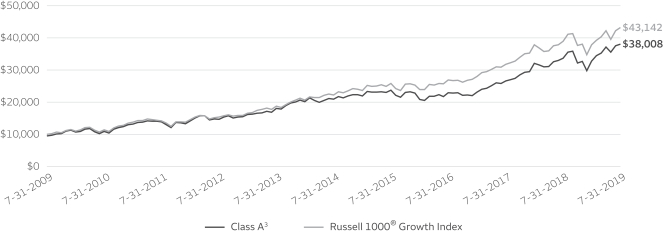
|
| ‡ | CFA® and Chartered Financial Analyst® are trademarks owned by CFA Institute. |
| 1 | Reflects the expense ratios as stated in the most recent prospectuses. The expense ratios shown are subject to change and may differ from the annualized expense ratios shown in the financial highlights of this report. |
| 2 | The manager has contractually committed through November 30, 2019, to waive fees and/or reimburse expenses to the extent necessary to cap the expenses of each class after fee waivers at the amounts shown. Brokerage commissions, stamp duty fees, interest, taxes, acquired fund fees and expenses (if any), and extraordinary expenses are excluded from the expense cap. Prior to or after the commitment expiration date, the cap may be increased or the commitment to maintain the cap may be terminated only with the approval of the Board of Trustees. Without this cap, the Fund’s returns would have been lower. The expense ratio paid by an investor is the net expense ratio (the total annual fund operating expenses after fee waivers) as stated in the prospectuses. |
| 3 | Historical performance shown prior to July 19, 2010, is based on the performance of the Fund’s predecessor, Evergreen Large Company Growth Fund. |
| 4 | Historical performance shown for Class R4 shares prior to their inception reflects the performance of Institutional Class shares, adjusted to reflect the higher expenses applicable to Class R4 shares. |
| 5 | Historical performance shown for Class R6 shares prior to their inception reflects the performance of Institutional Class shares, and includes the higher expenses applicable to Institutional Class shares. If these expenses had not been included, returns for Class R6 shares would be higher. |
| 6 | Historical performance shown for Administrator Class shares prior to their inception reflects the performance of Institutional Class shares, adjusted to reflect the higher expenses applicable to Administrator Class shares. |
| 7 | The Russell 1000® Growth Index measures the performance of those Russell 1000 companies with higher price/book ratios and higher forecasted growth values. You cannot invest directly in an index. |
| 8 | The chart compares the performance of Class A shares for the most recent ten years with the Russell 1000® Growth Index. The chart assumes a hypothetical investment of $10,000 in Class A shares and reflects all operating expenses and assumes the maximum initial sales charge of 5.75%. |
| 9 | The ten largest holdings, excluding cash, cash equivalents and any money market funds, are calculated based on the value of the investments divided by total net assets of the Fund. Holdings are subject to change and may have changed since the date specified. |
| 10 | Amounts are calculated based on the total long-term investments of the Fund. These amounts are subject to change and may have changed since the date specified. |
Wells Fargo Premier Large Company Growth Fund | 7
Performance highlights (unaudited)
MANAGER’S DISCUSSION
Fund highlights
| ∎ | | The Fund outperformed its benchmark, the Russell 1000® Growth Index, for the12-month period that ended July 31, 2019. |
| ∎ | | Holdings within information technology (IT), health care, financials, and industrials aided the Fund’s performance for the period. |
| ∎ | | The Fund’s performance was inhibited by stocks within the communication services sectors. |
The equity market pushed higher over the trailingone-year period as solid economic fundamentals have overshadowed periods of negative sentiment, which was particularly pervasive in late 2018. For much of the fourth quarter of 2018, stocks moved sharply lower as a flattening yield curve, corporate debt concerns, a pullback in commodities, tariff and trade concerns, and hues of decelerating global growth flustered markets. Additionally, geopolitical concerns coupled with quantitative easing across the globe have fueled investor concerns. Despite this backdrop, while some economic data has slowed in the U.S., the economy still stands on solid footing with low unemployment and strong consumer confidence. This environment of accommodative fiscal and monetary policy and reasonable energy prices is fostering a healthy landscape for the consumer. The Fund continues to benefit from constructive idiosyncratic dynamics and secular growth catalysts in a variety of areas as many of our portfolio companies are gaining market share in their respective industries.
| | | | |
|
| Ten largest holdings(%) as of July 31, 20199 | |
| | |
Amazon.com Incorporated | | | 7.08 | |
| | |
Microsoft Corporation | | | 5.54 | |
| | |
Alphabet Incorporated Class A | | | 5.15 | |
| | |
Visa Incorporated Class A | | | 4.07 | |
| | |
MasterCard Incorporated Class A | | | 3.87 | |
| | |
Microchip Technology Incorporated | | | 2.81 | |
| | |
Texas Instruments Incorporated | | | 2.14 | |
| | |
PayPal Holdings Incorporated | | | 1.98 | |
| | |
CoStar Group Incorporated | | | 1.92 | |
| | |
Union Pacific Corporation | | | 1.91 | |
Performance of health care and IT holdings were beneficial to Fund performance.
Select holdings within the health care sector served as the best-performing area of the Fund. Health care technology firm Veeva Systems Incorporated, which providessoftware-as-a-solution (SaaS) solutions to the life sciences industry, reported strong revenue and free cash flow with particular strength from its clinical data management system unit. Other areas of strength within the sector came from Insulet Corporation, which makes insulin delivery systems for people with diabetes, and Zoetis, Incorporated, which makes medicines and vaccines for animals. Other areas of the Fund that performed well were areas such as
SaaS and payment processing industries within IT that generated market-share penetration and margin expansion in their respective markets comprised of customers with similar product needs. Within software, demand remained strong as corporate spending continued to rise, coupled with next-generation cloud-computing platforms that garnered a large share of new business at the expense of legacy solutions. Within the payment space, the movement towarde-commerce has had a positive effect on overall demand as more consumers are moving from cash to digital payments.
|
|
| Sector distribution as of July 31, 201910 |
|
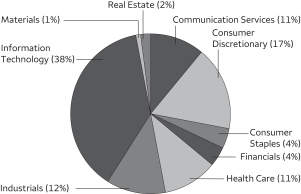 |
Certain communication services stocks detracted from performance.
The main source of weakness from a sector perspective came from communication services as the Fund’s underweight position to Facebook, Incorporated, negatively affected relative performance. In 2018, we reduced our positon after privacy issues surfaced and after Facebook shifted its focus toward monetizing stories and video rather than the traditional newsfeed segment. Recently, we have added back to our position as we have grown more comfortable with its ability to monetize both of these properties within Instagram and the legacy Facebook app.
Please see footnotes on page 7.
8 | Wells Fargo Premier Large Company Growth Fund
Performance highlights (unaudited)
Areas of focus remain in secular areas like software, payments, and semiconductors.
The Fund continues to be well diversified in a plethora of areas, which include industries within consumer discretionary, health care, communication services, and IT. Some notable segments include the SaaS, payments, and semiconductors industries. The structural advantages of the software space continue to include benefits like a predictable cost of ownership to the customer, flexibility and scale, simplification, and faster implementation times. Within the payments segment, processors like Square, Incorporated, and PayPal Holdings, Incorporated, as well as networks Visa Incorporated and MasterCard Incorporated, continue to capitalize from secular drivers such as the global shift from cash and check to plastic, growth withine-commerce, international and cross-border growth, andpeer-to-peer transfers. Semiconductors, which continue to benefit from the digitization of the economy, are becoming more prevalent in our daily lives as more chips are being used in electrical devices.
Our view of faster-growth stocks is positive.
We continue to be disciplined from a valuation perspective by trimming positions where the valuation gap has narrowed and adding to positions where it has widened. While our process is largelybottom-up, we continue to monitor geopolitical issues like trade tensions between the U.S. and China as well as macroeconomic conditions such as the economic slowdown in Europe, the increasing amount of negative-yielding sovereign debt and the steep decrease in U.S. Treasury yields. Our goal is to generate alpha from multiple sectors and industries. We remain comfortable with our positioning and our focus on SaaS, cloud services, online retail, digital payments, the internet of things, and innovation (SCODIi). We continue to witness a scarcity of growth stock opportunities within the investing universe, which could favor our portfolio in the future. Going forward, given the current economic backdrop, stocks emphasized in our investment process should bode well for the future of the portfolio.
Wells Fargo Premier Large Company Growth Fund | 9
Fund expenses (unaudited)
As a shareholder of the Fund, you incur two types of costs: (1) transaction costs, including sales charges (loads) on purchase payments and contingent deferred sales charges (if any) on redemptions and (2) ongoing costs, including management fees, distribution(12b-1) and/or shareholder servicing fees, and other Fund expenses. This example is intended to help you understand your ongoing costs (in dollars) of investing in the Fund and to compare these costs with the ongoing costs of investing in other mutual funds.
The example is based on an investment of $1,000 invested at the beginning of thesix-month period and held for the entire period from February 1, 2019 to July 31, 2019.
Actual expenses
The “Actual” line of the table below provides information about actual account values and actual expenses. You may use the information in this line, together with the amount you invested, to estimate the expenses that you paid over the period. Simply divide your account value by $1,000 (for example, an $8,600 account value divided by $1,000 = 8.6), then multiply the result by the number in the “Actual” line under the heading entitled “Expenses paid during period” for your applicable class of shares to estimate the expenses you paid on your account during this period.
Hypothetical example for comparison purposes
The “Hypothetical” line of the table below provides information about hypothetical account values and hypothetical expenses based on the Fund’s actual expense ratio and an assumed rate of return of 5% per year before expenses, which is not the Fund’s actual return. The hypothetical account values and expenses may not be used to estimate the actual ending account balance or expenses you paid for the period. You may use this information to compare the ongoing costs of investing in the Fund and other funds. To do so, compare this 5% hypothetical example with the 5% hypothetical examples that appear in the shareholder reports of the other funds.
Please note that the expenses shown in the table are meant to highlight your ongoing costs only and do not reflect any transactional costs, such as sales charges (loads) and contingent deferred sales charges. Therefore, the “Hypothetical” line of the table is useful in comparing ongoing costs only and will not help you determine the relative total costs of owning different funds. In addition, if these transactional costs were included, your costs would have been higher.
| | | | | | | | | | | | | | | | |
| | | Beginning
account value
2-1-2019 | | | Ending
account value
7-31-2019 | | | Expenses
paid during
the period¹ | | | Annualized net
expense ratio | |
| | | | | |
Class A | | | | | | | | | | | | | | | | |
| | | | |
Actual | | $ | 1,000.00 | | | $ | 1,162.16 | | | $ | 5.95 | | | | 1.11 | % |
| | | | |
Hypothetical (5% return before expenses) | | $ | 1,000.00 | | | $ | 1,019.29 | | | $ | 5.56 | | | | 1.11 | % |
| | | | | |
Class C | | | | | | | | | | | | | | | | |
| | | | |
Actual | | $ | 1,000.00 | | | $ | 1,157.25 | | | $ | 9.95 | | | | 1.86 | % |
| | | | |
Hypothetical (5% return before expenses) | | $ | 1,000.00 | | | $ | 1,015.57 | | | $ | 9.30 | | | | 1.86 | % |
| | | | | |
Class R4 | | | | | | | | | | | | | | | | |
| | | | |
Actual | | $ | 1,000.00 | | | $ | 1,163.28 | | | $ | 4.29 | | | | 0.80 | % |
| | | | |
Hypothetical (5% return before expenses) | | $ | 1,000.00 | | | $ | 1,020.83 | | | $ | 4.01 | | | | 0.80 | % |
| | | | | |
Class R6 | | | | | | | | | | | | | | | | |
| | | | |
Actual | | $ | 1,000.00 | | | $ | 1,164.87 | | | $ | 3.49 | | | | 0.65 | % |
| | | | |
Hypothetical (5% return before expenses) | | $ | 1,000.00 | | | $ | 1,021.57 | | | $ | 3.26 | | | | 0.65 | % |
| | | | | |
Administrator Class | | | | | | | | | | | | | | | | |
| | | | |
Actual | | $ | 1,000.00 | | | $ | 1,162.12 | | | $ | 5.36 | | | | 1.00 | % |
| | | | |
Hypothetical (5% return before expenses) | | $ | 1,000.00 | | | $ | 1,019.84 | | | $ | 5.01 | | | | 1.00 | % |
| | | | | |
Institutional Class | | | | | | | | | | | | | | | | |
| | | | |
Actual | | $ | 1,000.00 | | | $ | 1,164.73 | | | $ | 3.76 | | | | 0.70 | % |
| | | | |
Hypothetical (5% return before expenses) | | $ | 1,000.00 | | | $ | 1,021.32 | | | $ | 3.51 | | | | 0.70 | % |
| 1 | Expenses paid is equal to the annualized net expense ratio of each class multiplied by the average account value over the period, multiplied by the number of days in the most recent fiscal half-year divided by the number of days in the fiscal year (to reflect theone-half-year period). |
10 | Wells Fargo Premier Large Company Growth Fund
Portfolio of investments—July 31, 2019
| | | | | | | | | | | | | | | | |
| | | | | | | | | Shares | | | Value | |
| Common Stocks: 99.81% | | | | | | | | | | | | | | | | |
| | | | |
Communication Services: 11.05% | | | | | | | | | | | | | | | | |
| | | | |
| Entertainment: 1.65% | | | | | | | | | | | | |
| | | | |
Live Nation Incorporated † | | | | | | | | | | | 419,160 | | | $ | 30,204,670 | |
| | | | |
Netflix Incorporated † | | | | | | | | | | | 45,620 | | | | 14,734,804 | |
| | | | |
| | | | | | | | | | | | | | | 44,939,474 | |
| | | | | | | | | | | | | | | | |
| | | | |
| Interactive Media & Services: 9.40% | | | | | | | | | | | | |
| | | | |
Alphabet Incorporated Class A † | | | | | | | | | | | 114,990 | | | | 140,080,818 | |
| | | | |
Alphabet Incorporated Class C † | | | | | | | | | | | 20,738 | | | | 25,231,510 | |
| | | | |
Facebook Incorporated Class A † | | | | | | | | | | | 262,430 | | | | 50,971,779 | |
| | | | |
Match Group Incorporated | | | | | | | | | | | 246,460 | | | | 18,555,973 | |
| | | | |
Pinterest Incorporated Class A †« | | | | | | | | | | | 718,635 | | | | 20,833,229 | |
| | | | |
| | | | | | | | | | | | | | | 255,673,309 | |
| | | | | | | | | | | | | | | | |
| | | | |
Consumer Discretionary: 17.32% | | | | | | | | | | | | | | | | |
| | | | |
| Hotels, Restaurants & Leisure: 2.32% | | | | | | | | | | | | |
| | | | |
Planet Fitness Incorporated Class A † | | | | | | | | | | | 322,710 | | | | 25,384,369 | |
| | | | |
Royal Caribbean Cruises Limited | | | | | | | | | | | 325,710 | | | | 37,893,101 | |
| | | | |
| | | | | | | | | | | | | | | 63,277,470 | |
| | | | | | | | | | | | | | | | |
| | | | |
| Household Durables: 0.63% | | | | | | | | | | | | |
| | | | |
Roku Incorporated † | | | | | | | | | | | 165,650 | | | | 17,116,615 | |
| | | | | | | | | | | | | | | | |
| | | | |
| Internet & Direct Marketing Retail: 7.91% | | | | | | | | | | | | |
| | | | |
Amazon.com Incorporated † | | | | | | | | | | | 103,140 | | | | 192,539,689 | |
| | | | |
Farfetch Limited Class A † | | | | | | | | | | | 521,731 | | | | 10,486,793 | |
| | | | |
MercadoLibre Incorporated † | | | | | | | | | | | 19,600 | | | | 12,179,832 | |
| | | | |
| | | | | | | | | | | | | | | 215,206,314 | |
| | | | | | | | | | | | | | | | |
| | | | |
| Specialty Retail: 5.28% | | | | | | | | | | | | |
| | | | |
Burlington Stores Incorporated † | | | | | | | | | | | 206,060 | | | | 37,245,345 | |
| | | | |
CarMax Incorporated † | | | | | | | | | | | 269,345 | | | | 23,637,717 | |
| | | | |
Five Below Incorporated † | | | | | | | | | | | 206,950 | | | | 24,308,347 | |
| | | | |
O’Reilly Automotive Incorporated † | | | | | | | | | | | 94,380 | | | | 35,936,129 | |
| | | | |
ULTA Beauty Incorporated † | | | | | | | | | | | 64,960 | | | | 22,687,280 | |
| | | | |
| | | | | | | | | | | | | | | 143,814,818 | |
| | | | | | | | | | | | | | | | |
| | | | |
| Textiles, Apparel & Luxury Goods: 1.18% | | | | | | | | | | | | |
| | | | |
Deckers Outdoor Corporation † | | | | | | | | | | | 117,720 | | | | 18,397,282 | |
| | | | |
Levi Strauss & Company Class A † | | | | | | | | | | | 714,789 | | | | 13,623,878 | |
| | | | |
| | | | | | | | | | | | | | | 32,021,160 | |
| | | | | | | | | | | | | | | | |
| | | | |
Consumer Staples: 3.71% | | | | | | | | | | | | | | | | |
| | | | |
| Beverages: 2.17% | | | | | | | | | | | | |
| | | | |
Constellation Brands Incorporated Class A | | | | | | | | | | | 91,880 | | | | 18,083,822 | |
| | | | |
The Coca-Cola Company | | | | | | | | | | | 780,560 | | | | 41,080,873 | |
| | | | |
| | | | | | | | | | | | | | | 59,164,695 | |
| | | | | | | | | | | | | | | | |
| | | | |
| Food & Staples Retailing: 0.54% | | | | | | | | | | | | |
| | | | |
Costco Wholesale Corporation | | | | | | | | | | | 53,280 | | | | 14,685,566 | |
| | | | | | | | | | | | | | | | |
Wells Fargo Premier Large Company Growth Fund | 11
The accompanying notes are an integral part of these financial statements.
Portfolio of investments—July 31, 2019
| | | | | | | | | | | | | | | | |
| | | | | | | | | Shares | | | Value | |
| | | | |
| Personal Products: 1.00% | | | | | | | | | | | | |
| | | | |
The Estee Lauder Companies Incorporated Class A | | | | | | | | | | | 147,430 | | | $ | 27,155,132 | |
| | | | | | | | | | | | | | | | |
| | | | |
Financials: 3.94% | | | | | | | | | | | | | | | | |
| | | | |
| Capital Markets: 3.35% | | | | | | | | | | | | |
| | | | |
CME Group Incorporated | | | | | | | | | | | 197,750 | | | | 38,446,555 | |
| | | | |
MarketAxess Holdings Incorporated | | | | | | | | | | | 88,480 | | | | 29,821,299 | |
| | | | |
Raymond James Financial Incorporated | | | | | | | | | | | 158,566 | | | | 12,791,519 | |
| | | | |
The Charles Schwab Corporation | | | | | | | | | | | 232,960 | | | | 10,068,531 | |
| | | | |
| | | | | | | | | | | | | | | 91,127,904 | |
| | | | | | | | | | | | | | | | |
| | | | |
| Thrifts & Mortgage Finance: 0.59% | | | | | | | | | | | | |
| | | | |
LendingTree Incorporated † | | | | | | | | | | | 49,870 | | | | 16,085,070 | |
| | | | | | | | | | | | | | | | |
| | | | |
Health Care: 10.54% | | | | | | | | | | | | | | | | |
| | | | |
| Biotechnology: 2.83% | | | | | | | | | | | | |
| | | | |
Alexion Pharmaceuticals Incorporated † | | | | | | | | | | | 288,682 | | | | 32,704,784 | |
| | | | |
Sage Therapeutics Incorporated † | | | | | | | | | | | 98,500 | | | | 15,793,490 | |
| | | | |
Sarepta Therapeutics Incorporated † | | | | | | | | | | | 116,220 | | | | 17,299,347 | |
| | | | |
Vertex Pharmaceuticals Incorporated † | | | | | | | | | | | 66,300 | | | | 11,046,906 | |
| | | | |
| | | | | | | | | | | | | | | 76,844,527 | |
| | | | | | | | | | | | | | | | |
| | | | |
| Health Care Equipment & Supplies: 4.30% | | | | | | | | | | | | |
| | | | |
Abbott Laboratories | | | | | | | | | | | 483,420 | | | | 42,105,882 | |
| | | | |
Boston Scientific Corporation † | | | | | | | | | | | 1,104,820 | | | | 46,910,657 | |
| | | | |
Insulet Corporation † | | | | | | | | | | | 228,200 | | | | 28,054,908 | |
| | | | |
| | | | | | | | | | | | | | | 117,071,447 | |
| | | | | | | | | | | | | | | | |
| | | | |
| Health Care Technology: 0.74% | | | | | | | | | | | | |
| | | | |
Veeva Systems Incorporated Class A † | | | | | | | | | | | 121,060 | | | | 20,083,854 | |
| | | | | | | | | | | | | | | | |
| | | | |
| Life Sciences Tools & Services: 0.20% | | | | | | | | | | | | |
| | | | |
Agilent Technologies Incorporated | | | | | | | | | | | 78,100 | | | | 5,420,921 | |
| | | | | | | | | | | | | | | | |
| | | | |
| Pharmaceuticals: 2.47% | | | | | | | | | | | | |
| | | | |
Elanco Animal Health Incorporated † | | | | | | | | | | | 560,840 | | | | 18,485,286 | |
| | | | |
Zoetis Incorporated | | | | | | | | | | | 424,948 | | | | 48,822,276 | |
| | | | |
| | | | | | | | | | | | | | | 67,307,562 | |
| | | | | | | | | | | | | | | | |
| | | | |
Industrials: 12.16% | | | | | | | | | | | | | | | | |
| | | | |
| Aerospace & Defense: 1.32% | | | | | | | | | | | | |
| | | | |
HEICO Corporation | | | | | | | | | | | 232,822 | | | | 31,838,409 | |
| | | | |
The Boeing Company | | | | | | | | | | | 12,240 | | | | 4,176,043 | |
| | | | |
| | | | | | | | | | | | | | | 36,014,452 | |
| | | | | | | | | | | | | | | | |
| | | | |
| Commercial Services & Supplies: 2.26% | | | | | | | | | | | | |
| | | | |
Copart Incorporated † | | | | | | | | | | | 288,770 | | | | 22,388,338 | |
| | | | |
Waste Connections Incorporated | | | | | | | | | | | 430,505 | | | | 39,055,414 | |
| | | | |
| | | | | | | | | | | | | | | 61,443,752 | |
| | | | | | | | | | | | | | | | |
| | | | |
| Industrial Conglomerates: 1.22% | | | | | | | | | | | | |
| | | | |
Roper Technologies Incorporated | | | | | | | | | | | 91,380 | | | | 33,230,337 | |
| | | | | | | | | | | | | | | | |
| | | | |
| Machinery: 0.43% | | | | | | | | | | | | |
| | | | |
Fortive Corporation | | | | | | | | | | | 153,005 | | | | 11,636,030 | |
| | | | | | | | | | | | | | | | |
12 | Wells Fargo Premier Large Company Growth Fund
The accompanying notes are an integral part of these financial statements.
Portfolio of investments—July 31, 2019
| | | | | | | | | | | | | | | | |
| | | | | | | | | Shares | | | Value | |
| | | | |
| Professional Services: 3.59% | | | | | | | | | | | | |
| | | | |
CoStar Group Incorporated † | | | | | | | | | | | 84,970 | | | $ | 52,290,538 | |
| | | | |
Insperity Incorporated | | | | | | | | | | | 107,300 | | | | 11,411,355 | |
| | | | |
TransUnion | | | | | | | | | | | 411,110 | | | | 34,035,797 | |
| | | | |
| | | | | | | | | | | | | | | 97,737,690 | |
| | | | | | | | | | | | | | | | |
| | | | |
| Road & Rail: 3.34% | | | | | | | | | | | | |
| | | | |
CSX Corporation | | | | | | | | | | | 115,300 | | | | 8,117,120 | |
| | | | |
Norfolk Southern Corporation | | | | | | | | | | | 160,700 | | | | 30,712,984 | |
| | | | |
Union Pacific Corporation | | | | | | | | | | | 289,060 | | | | 52,016,347 | |
| | | | |
| | | | | | | | | | | | | | | 90,846,451 | |
| | | | | | | | | | | | | | | | |
| | | | |
Information Technology: 37.87% | | | | | | | | | | | | | | | | |
| | | | |
| IT Services: 16.23% | | | | | | | | | | | | |
| | | | |
Black Knight Incorporated † | | | | | | | | | | | 377,470 | | | | 23,901,400 | |
| | | | |
Euronet Worldwide Incorporated † | | | | | | | | | | | 158,486 | | | | 24,709,552 | |
| | | | |
Global Payments Incorporated | | | | | | | | | | | 185,490 | | | | 31,147,481 | |
| | | | |
InterXion Holding NV † | | | | | | | | | | | 481,660 | | | | 36,268,998 | |
| | | | |
MasterCard Incorporated Class A | | | | | | | | | | | 386,320 | | | | 105,183,346 | |
| | | | |
PayPal Holdings Incorporated † | | | | | | | | | | | 487,250 | | | | 53,792,400 | |
| | | | |
Shopify Incorporated Class A † | | | | | | | | | | | 15,290 | | | | 4,860,385 | |
| | | | |
Square Incorporated Class A † | | | | | | | | | | | 170,348 | | | | 13,697,683 | |
| | | | |
Visa Incorporated Class A | | | | | | | | | | | 622,120 | | | | 110,737,360 | |
| | | | |
WEX Incorporated † | | | | | | | | | | | 170,870 | | | | 37,261,621 | |
| | | | |
| | | | | | | | | | | | | | | 441,560,226 | |
| | | | | | | | | | | | | | | | |
| | | | |
| Semiconductors & Semiconductor Equipment: 6.48% | | | | | | | | | | | | |
| | | | |
Microchip Technology Incorporated « | | | | | | | | | | | 810,640 | | | | 76,540,629 | |
| | | | |
Monolithic Power Systems Incorporated | | | | | | | | | | | 157,660 | | | | 23,358,906 | |
| | | | |
NXP Semiconductors NV | | | | | | | | | | | 176,830 | | | | 18,282,454 | |
| | | | |
Texas Instruments Incorporated | | | | | | | | | | | 465,190 | | | | 58,153,402 | |
| | | | |
| | | | | | | | | | | | | | | 176,335,391 | |
| | | | | | | | | | | | | | | | |
| | | | |
| Software: 14.88% | | | | | | | | | | | | |
| | | | |
Adobe Systems Incorporated † | | | | | | | | | | | 163,549 | | | | 48,878,254 | |
| | | | |
Crowdstrike Holdings Incorporated Class A †« | | | | | | | | | | | 136,335 | | | | 12,143,358 | |
| | | | |
Dropbox Incorporated Class A † | | | | | | | | | | | 1,396,470 | | | | 32,900,833 | |
| | | | |
Microsoft Corporation | | | | | | | | | | | 1,105,790 | | | | 150,686,003 | |
| | | | |
Proofpoint Incorporated † | | | | | | | | | | | 284,190 | | | | 35,864,778 | |
| | | | |
RealPage Incorporated † | | | | | | | | | | | 384,610 | | | | 24,030,433 | |
| | | | |
Salesforce.com Incorporated † | | | | | | | | | | | 248,790 | | | | 38,438,055 | |
| | | | |
ServiceNow Incorporated † | | | | | | | | | | | 116,320 | | | | 32,266,005 | |
| | | | |
Splunk Incorporated † | | | | | | | | | | | 179,935 | | | | 24,347,005 | |
| | | | |
Zoom Video Communications Incorporated †« | | | | | | | | | | | 55,426 | | | | 5,293,737 | |
| | | | |
| | | | | | | | | | | | | | | 404,848,461 | |
| | | | | | | | | | | | | | | | |
| | | | |
| Technology Hardware, Storage & Peripherals: 0.28% | | | | | | | | | | | | |
| | | | |
Apple Incorporated | | | | | | | | | | | 36,360 | | | | 7,746,134 | |
| | | | | | | | | | | | | | | | |
| | | | |
Materials: 1.38% | | | | | | | | | | | | | | | | |
| | | | |
| Chemicals: 1.38% | | | | | | | | | | | | |
| | | | |
Linde plc | | | | | | | | | | | 196,210 | | | | 37,531,049 | |
| | | | | | | | | | | | | | | | |
Wells Fargo Premier Large Company Growth Fund | 13
The accompanying notes are an integral part of these financial statements.
Portfolio of investments—July 31, 2019
| | | | | | | | | | | | | | | | |
| | | | | | | | | Shares | | | Value | |
Real Estate: 1.84% | | | | | | | | | | | | | | | | |
| | | | |
| Equity REITs: 0.87% | | | | | | | | | | | | |
| | | | |
SBA Communications Corporation † | | | | | | | | | | | 96,270 | | | $ | 23,625,621 | |
| | | | | | | | | | | | | | | | |
| | | | |
| Real Estate Management & Development: 0.97% | | | | | | | | | | | | |
| | | | |
CBRE Group Incorporated Class A † | | | | | | | | | | | 498,370 | | | | 26,418,592 | |
| | | | | | | | | | | | | | | | |
| | | | |
Total Common Stocks (Cost $1,534,604,968) | | | | | | | | | | | | | | | 2,715,970,024 | |
| | | | | | | | | | | | | | | | |
| | | | |
| | | | | | | | | | | | | | | | |
| | | Yield | | | | | | | | | | |
| Short-Term Investments: 3.64% | | | | | | | | | | | | |
| | | | |
| Investment Companies: 3.64% | | | | | | | | | | | | |
| | | | |
Securities Lending Cash Investments LLC (l)(r)(u) | | | 2.46 | % | | | | | | | 96,444,554 | | | | 96,454,199 | |
| | | | |
Wells Fargo Government Money Market Fund Select Class (l)(u) | | | 2.26 | | | | | | | | 2,551,452 | | | | 2,551,452 | |
| | | | |
Total Short-Term Investments (Cost $99,005,651) | | | | | | | | | | | | | | | 99,005,651 | |
| | | | | | | | | | | | | | | | |
| | | | | | | | |
| Total investments in securities (Cost $1,633,610,619) | | | 103.45 | % | | | 2,814,975,675 | |
| | |
Other assets and liabilities, net | | | (3.45 | ) | | | (93,877,611 | ) |
| | | | | | | | |
| Total net assets | | | 100.00 | % | | $ | 2,721,098,064 | |
| | | | | | | | |
| † | Non-income-earning security |
| « | All or a portion of this security is on loan. |
| (l) | The issuer of the security is an affiliated person of the Fund as defined in the Investment Company Act of 1940. |
| (r) | The investment is anon-registered investment company purchased with cash collateral received from securities on loan. |
| (u) | The rate represents the7-day annualized yield at period end. |
Abbreviations:
| REIT | Real estate investment trust |
Investments in Affiliates
An affiliated investment is an investment in which the Fund owns at least 5% of the outstanding voting shares of the issuer or as a result of other relationships, such as the Fund and the issuer having the same investment manager. Transactions with issuers that were either affiliated persons of the Fund at the beginning of the period or the end of the period were as follows:
| | | | | | | | | | | | | | | | | | | | | | | | | | | | | | | | | | | | |
| | | Shares,
beginning of
period | | | Shares
purchased | | | Shares
sold | | | Shares,
end of
period | | | Net
realized
gains
(losses) | | | Net
change in
unrealized
gains
(losses) | | | Income
from
affiliated
securities | | | Value,
end
of period | | | % of
net
assets | |
Short-Term Investments | | | | | | | | | | | | | | | | | | | | | | | | | | | | | | | | | | | | |
Investment Companies | | | | | | | | | | | | | | | | | | | | | | | | | | | | | | | | | | | | |
Securities Lending Cash Investments LLC | | | 94,411,945 | | | | 634,485,474 | | | | 632,452,865 | | | | 96,444,554 | | | $ | 1,613 | | | $ | 0 | | | $ | 2,191,968 | # | | $ | 96,454,199 | | | | | |
Wells Fargo Government Money Market Fund Select Class | | | 9,566,578 | | | | 760,829,878 | | | | 767,845,004 | | | | 2,551,452 | | | | 0 | | | | 0 | | | | 305,840 | | | | 2,551,452 | | | | | |
| | | | | | | | | | | | | | | | | | | | | | | | | | | | | | | | | | | | |
| | | | | | | | | | | | | | | | | | $ | 1,613 | | | $ | 0 | | | $ | 2,497,808 | | | $ | 99,005,651 | | | | 3.64 | % |
| | | | | | | | | | | | | | | | | | | | | | | | | | | | | | | | | | | | |
| # | Amount shown represents income before fees and rebates |
The accompanying notes are an integral part of these financial statements.
14 | Wells Fargo Premier Large Company Growth Fund
Statement of assets and liabilities—July 31, 2019
| | | | |
| | | | |
| |
Assets | | | | |
Investments in unaffiliated securities (including $92,309,900 of securities loaned), at value (cost $1,534,604,968) | | $ | 2,715,970,024 | |
Investments in affiliated securities, at value (cost $99,005,651) | | | 99,005,651 | |
Receivable for investments sold | | | 7,264,293 | |
Receivable for Fund shares sold | | | 1,026,563 | |
Receivable for dividends | | | 789,715 | |
Receivable for securities lending income, net | | | 25,516 | |
Prepaid expenses and other assets | | | 73,006 | |
| | | | |
Total assets | | | 2,824,154,768 | |
| | | | |
| |
Liabilities | | | | |
Payable upon receipt of securities loaned | | | 96,449,625 | |
Payable for Fund shares redeemed | | | 2,241,755 | |
Overdraft due to custodian bank | | | 1,568,113 | |
Management fee payable | | | 1,405,499 | |
Administration fees payable | | | 318,447 | |
Payable for investments purchased | | | 238,401 | |
Distribution fee payable | | | 99,512 | |
Trustees’ fees and expenses payable | | | 4,350 | |
Accrued expenses and other liabilities | | | 731,002 | |
| | | | |
Total liabilities | | | 103,056,704 | |
| | | | |
Total net assets | | $ | 2,721,098,064 | |
| | | | |
| |
Net assets consist of | | | | |
Paid-in capital | | $ | 1,348,253,118 | |
Total distributable earnings | | | 1,372,844,946 | |
| | | | |
Total net assets | | $ | 2,721,098,064 | |
| | | | |
| |
Computation of net asset value and offering price per share | | | | |
Net assets – Class A | | $ | 1,050,751,030 | |
Shares outstanding – Class A1 | | | 74,071,913 | |
Net asset value per share – Class A | | | $14.19 | |
Maximum offering price per share – Class A2 | | | $15.06 | |
Net assets – Class C | | $ | 153,403,702 | |
Shares outstanding – Class C1 | | | 14,683,712 | |
Net asset value per share – Class C | | | $10.45 | |
Net assets – Class R4 | | $ | 3,940,471 | |
Share outstanding – Class R41 | | | 264,577 | |
Net asset value per share – Class R4 | | | $14.89 | |
Net assets – Class R6 | | $ | 820,383,082 | |
Shares outstanding – Class R61 | | | 54,259,163 | |
Net asset value per share – Class R6 | | | $15.12 | |
Net assets – Administrator Class | | $ | 49,041,535 | |
Shares outstanding – Administrator Class1 | | | 3,385,982 | |
Net asset value per share – Administrator Class | | | $14.48 | |
Net assets – Institutional Class | | $ | 643,578,244 | |
Shares outstanding – Institutional Class1 | | | 42,744,550 | |
Net asset value per share – Institutional Class | | | $15.06 | |
| 1 | The Fund has an unlimited number of authorized shares. |
| 2 | Maximum offering price is computed as 100/94.25 of net asset value. On investments of $50,000 or more, the offering price is reduced. |
The accompanying notes are an integral part of these financial statements.
Wells Fargo Premier Large Company Growth Fund | 15
Statement of operations—year ended July 31, 2019
| | | | |
| | | | |
| |
Investment income | | | | |
Dividends (net of foreign withholding taxes of $45,217) | | $ | 16,258,886 | |
Income from affiliated securities | | | 791,955 | |
| | | | |
Total investment income | | | 17,050,841 | |
| | | | |
| |
Expenses | | | | |
Management fee | | | 15,953,526 | |
Administration fees | | | | |
Class A | | | 2,113,939 | |
Class C | | | 357,637 | |
Class R4 | | | 2,998 | |
Class R6 | | | 71,058 | |
Administrator Class | | | 65,607 | |
Institutional Class | | | 1,227,950 | |
Shareholder servicing fees | | | | |
Class A | | | 2,516,595 | |
Class C | | | 425,759 | |
Class R4 | | | 3,748 | |
Administrator Class | | | 126,167 | |
Distribution fee | | | | |
Class C | | | 1,277,068 | |
Custody and accounting fees | | | 120,001 | |
Professional fees | | | 53,950 | |
Registration fees | | | 130,254 | |
Shareholder report expenses | | | 211,101 | |
Trustees’ fees and expenses | | | 21,999 | |
Other fees and expenses | | | 53,268 | |
| | | | |
Total expenses | | | 24,732,625 | |
Less: Fee waivers and/or expense reimbursements | | | (1,705,104 | ) |
| | | | |
Net expenses | | | 23,027,521 | |
| | | | |
Net investment loss | | | (5,976,680 | ) |
| | | | |
| |
Realized and unrealized gains (losses) on investments | | | | |
Net realized gains on | | | | |
Unaffiliated securities | | | 281,041,244 | |
Affiliated securities | | | 1,613 | |
| | | | |
Net realized gains on investments | | | 281,042,857 | |
Net change in unrealized gains (losses) on investments | | | 880,406 | |
| | | | |
Net realized and unrealized gains (losses) on investments | | | 281,923,263 | |
| | | | |
Net increase in net assets resulting from operations | | $ | 275,946,583 | |
| | | | |
The accompanying notes are an integral part of these financial statements.
16 | Wells Fargo Premier Large Company Growth Fund
Statement of changes in net assets
| | | | | | | | | | | | | | | | |
| | | Year ended
July 31, 2019 | | | Year ended
July 31, 20181 | |
| | | | |
Operations | | | | | | | | | | | | | | | | |
Net investment loss | | | | | | $ | (5,976,680 | ) | | | | | | $ | (5,025,277 | ) |
Net realized gains on investments | | | | | | | 281,042,857 | | | | | | | | 395,034,238 | |
Net change in unrealized gains (losses) on investments | | | | | | | 880,406 | | | | | | | | 194,196,842 | |
| | | | |
Net increase in net assets resulting from operations | | | | | | | 275,946,583 | | | | | | | | 584,205,803 | |
| | | | |
| | | | |
Distributions to shareholders from net investment income and net realized gains | | | | | | | | | | | | | | | | |
Class A | | | | | | | (157,260,447 | ) | | | | | | | (227,679,727 | ) |
Class C | | | | | | | (37,119,006 | ) | | | | | | | (54,543,209 | ) |
Class R4 | | | | | | | (524,816 | ) | | | | | | | (746,155 | ) |
Class R6 | | | | | | | (27,912,392 | ) | | | | | | | (37,680,602 | ) |
Administrator Class | | | | | | | (7,935,426 | ) | | | | | | | (18,099,486 | ) |
Institutional Class | | | | | | | (149,877,161 | ) | | | | | | | (222,234,431 | ) |
| | | | |
Total distributions to shareholders | | | | | | | (380,629,248 | ) | | | | | | | (560,983,610 | ) |
| | | | |
| | | | |
Capital share transactions | | | Shares | | | | | | | | Shares | | | | | |
Proceeds from shares sold | | | | | | | | | | | | | | | | |
Class A | | | 4,978,668 | | | | 64,852,617 | | | | 3,267,334 | | | | 47,146,306 | |
Class C | | | 1,500,469 | | | | 13,864,166 | | | | 1,584,503 | | | | 17,609,853 | |
Class R4 | | | 40,306 | | | | 500,326 | | | | 75,453 | | | | 1,179,600 | |
Class R6 | | | 43,509,076 | | | | 654,543,608 | | | | 1,545,725 | | | | 24,664,037 | |
Administrator Class | | | 330,627 | | | | 4,405,388 | | | | 561,343 | | | | 8,469,670 | |
Institutional Class | | | 9,977,465 | | | | 140,174,907 | | | | 13,231,358 | | | | 209,203,798 | |
| | | | |
| | | | | | | 878,341,012 | | | | | | | | 308,273,264 | |
| | | | |
Reinvestment of distributions | | | | | | | | | | | | | | | | |
Class A | | | 12,562,848 | | | | 146,357,178 | | | | 15,972,127 | | | | 209,554,313 | |
Class C | | | 3,761,732 | | | | 32,426,128 | | | | 4,459,739 | | | | 46,202,895 | |
Class R4 | | | 42,768 | | | | 522,194 | | | | 54,558 | | | | 741,983 | |
Class R6 | | | 2,036,361 | | | | 25,210,147 | | | | 2,631,345 | | | | 36,154,683 | |
Administrator Class | | | 643,091 | | | | 7,646,354 | | | | 1,320,910 | | | | 17,607,730 | |
Institutional Class | | | 11,058,800 | | | | 136,355,009 | | | | 14,695,591 | | | | 201,476,557 | |
| | | | |
| | | | | | | 348,517,010 | | | | | | | | 511,738,161 | |
| | | | |
Payment for shares redeemed | | | | | | | | | | | | | | | | |
Class A | | | (12,892,646 | ) | | | (172,044,344 | ) | | | (14,159,720 | ) | | | (208,175,400 | ) |
Class C | | | (7,522,098 | ) | | | (72,094,200 | ) | | | (5,118,687 | ) | | | (60,638,200 | ) |
Class R4 | | | (56,058 | ) | | | (848,702 | ) | | | (118,356 | ) | | | (1,890,437 | ) |
Class R6 | | | (3,699,221 | ) | | | (52,309,727 | ) | | | (2,515,229 | ) | | | (39,250,052 | ) |
Administrator Class | | | (1,338,333 | ) | | | (18,694,385 | ) | | | (3,480,442 | ) | | | (50,915,269 | ) |
Institutional Class | | | (44,233,595 | ) | | | (636,259,361 | ) | | | (21,905,645 | ) | | | (330,565,468 | ) |
| | | | |
| | | | | | | (952,250,719 | ) | | | | | | | (691,434,826 | ) |
| | | | |
Net increase in net assets resulting from capital share transactions | | | | | | | 274,607,303 | | | | | | | | 128,576,599 | |
| | | | |
Total increase in net assets | | | | | | | 169,924,638 | | | | | | | | 151,798,792 | |
| | | | |
| | | | |
Net assets | | | | | | | | | | | | | | | | |
Beginning of period | | | | | | | 2,551,173,426 | | | | | | | | 2,399,374,634 | |
| | | | |
End of period | | | | | | $ | 2,721,098,064 | | | | | | | $ | 2,551,173,426 | |
| | | | |
| 1 | Effective for all filings after November 4, 2018, the SEC prospectively eliminated the requirement to parenthetically disclose undistributed net investment income at the end of the period and permitted the aggregation of distributions, with the exception of tax basis returns of capital. Accumulated net investment loss at July 31, 2018 was $18,243. The disaggregated distributions information for the year ended July 31, 2018 is included in Note 8,Distributions to Shareholders, in the notes to the financial statements. |
The accompanying notes are an integral part of these financial statements.
Wells Fargo Premier Large Company Growth Fund | 17
Financial highlights
(For a share outstanding throughout each period)
| | | | | | | | | | | | | | | | | | | | |
| | | Year ended July 31 | |
| CLASS A | | 2019 | | | 2018 | | | 2017 | | | 2016 | | | 2015 | |
Net asset value, beginning of period | | | $15.10 | | | | $15.34 | | | | $14.68 | | | | $16.28 | | | | $14.55 | |
Net investment loss | | | (0.05 | ) | | | (0.05 | ) | | | (0.03 | )1 | | | (0.03 | ) | | | (0.03 | ) |
Net realized and unrealized gains (losses) on investments | | | 1.50 | | | | 3.56 | | | | 2.12 | | | | (0.52 | ) | | | 1.97 | |
| | | | | | | | | | | | | | | | | | | | |
Total from investment operations | | | 1.45 | | | | 3.51 | | | | 2.09 | | | | (0.55 | ) | | | 1.94 | |
Distributions to shareholders from | | | | | | | | | | | | | | | | | | | | |
Net realized gains | | | (2.36 | ) | | | (3.75 | ) | | | (1.43 | ) | | | (1.05 | ) | | | (0.21 | ) |
Net asset value, end of period | | | $14.19 | | | | $15.10 | | | | $15.34 | | | | $14.68 | | | | $16.28 | |
Total return2 | | | 12.97 | % | | | 26.54 | % | | | 16.01 | % | | | (3.22 | )% | | | 13.46 | % |
Ratios to average net assets (annualized) | | | | | | | | | | | | | | | | | | | | |
Gross expenses | | | 1.15 | % | | | 1.15 | % | | | 1.14 | % | | | 1.13 | % | | | 1.16 | % |
Net expenses | | | 1.11 | % | | | 1.11 | % | | | 1.11 | % | | | 1.11 | % | | | 1.12 | % |
Net investment loss | | | (0.40 | )% | | | (0.34 | )% | | | (0.20 | )% | | | (0.17 | )% | | | (0.18 | )% |
Supplemental data | | | | | | | | | | | | | | | | | | | | |
Portfolio turnover rate | | | 60 | % | | | 45 | % | | | 65 | % | | | 47 | % | | | 44 | % |
Net assets, end of period (000s omitted) | | | $1,050,751 | | | | $1,048,632 | | | | $986,791 | | | | $1,697,746 | | | | $2,280,107 | |
| 1 | Calculated based upon average shares outstanding |
| 2 | Total return calculations do not include any sales charges. |
The accompanying notes are an integral part of these financial statements.
18 | Wells Fargo Premier Large Company Growth Fund
Financial highlights
(For a share outstanding throughout each period)
| | | | | | | | | | | | | | | | | | | | |
| | | Year ended July 31 | |
| CLASS C | | 2019 | | | 2018 | | | 2017 | | | 2016 | | | 2015 | |
Net asset value, beginning of period | | | $11.87 | | | | $12.86 | | | | $12.64 | | | | $14.27 | | | | $12.87 | |
Net investment loss | | | (0.12 | )1 | | | (0.13 | )1 | | | (0.12 | )1 | | | (0.12 | )1 | | | (0.13 | )1 |
Net realized and unrealized gains (losses) on investments | | | 1.06 | | | | 2.89 | | | | 1.77 | | | | (0.46 | ) | | | 1.74 | |
| | | | | | | | | | | | | | | | | | | | |
Total from investment operations | | | 0.94 | | | | 2.76 | | | | 1.65 | | | | (0.58 | ) | | | 1.61 | |
Distributions to shareholders from | | | | | | | | | | | | | | | | | | | | |
Net realized gains | | | (2.36 | ) | | | (3.75 | ) | | | (1.43 | ) | | | (1.05 | ) | | | (0.21 | ) |
Net asset value, end of period | | | $10.45 | | | | $11.87 | | | | $12.86 | | | | $12.64 | | | | $14.27 | |
Total return2 | | | 12.09 | % | | | 25.68 | % | | | 15.05 | % | | | (3.92 | )% | | | 12.65 | % |
Ratios to average net assets (annualized) | | | | | | | | | | | | | | | | | | | | |
Gross expenses | | | 1.90 | % | | | 1.90 | % | | | 1.89 | % | | | 1.88 | % | | | 1.91 | % |
Net expenses | | | 1.86 | % | | | 1.86 | % | | | 1.86 | % | | | 1.86 | % | | | 1.87 | % |
Net investment loss | | | (1.14 | )% | | | (1.09 | )% | | | (0.95 | )% | | | (0.92 | )% | | | (0.93 | )% |
Supplemental data | | | | | | | | | | | | | | | | | | | | |
Portfolio turnover rate | | | 60 | % | | | 45 | % | | | 65 | % | | | 47 | % | | | 44 | % |
Net assets, end of period (000s omitted) | | | $153,404 | | | | $201,138 | | | | $206,026 | | | | $296,896 | | | | $388,290 | |
| 1 | Calculated based upon average shares outstanding |
| 2 | Total return calculations do not include any sales charges. |
The accompanying notes are an integral part of these financial statements.
Wells Fargo Premier Large Company Growth Fund | 19
Financial highlights
(For a share outstanding throughout each period)
| | | | | | | | | | | | | | | | | | | | |
| | | Year ended July 31 | |
| CLASS R4 | | 2019 | | | 2018 | | | 2017 | | | 2016 | | | 2015 | |
Net asset value, beginning of period | | | $15.69 | | | | $15.75 | | | | $15.00 | | | | $16.56 | | | | $14.75 | |
Net investment income (loss) | | | (0.03 | ) | | | (0.00 | )1,2 | | | 0.01 | 1 | | | 0.02 | 1 | | | 0.02 | |
Net realized and unrealized gains (losses) on investments | | | 1.59 | | | | 3.69 | | | | 2.17 | | | | (0.53 | ) | | | 2.00 | |
| | | | | | | | | | | | | | | | | | | | |
Total from investment operations | | | 1.56 | | | | 3.69 | | | | 2.18 | | | | (0.51 | ) | | | 2.02 | |
Distributions to shareholders from | | | | | | | | | | | | | | | | | | | | |
Net realized gains | | | (2.36 | ) | | | (3.75 | ) | | | (1.43 | ) | | | (1.05 | ) | | | (0.21 | ) |
Net asset value, end of period | | | $14.89 | | | | $15.69 | | | | $15.75 | | | | $15.00 | | | | $16.56 | |
Total return | | | 13.21 | % | | | 27.06 | % | | | 16.30 | % | | | (2.91 | )% | | | 13.82 | % |
Ratios to average net assets (annualized) | | | | | | | | | | | | | | | | | | | | |
Gross expenses | | | 0.87 | % | | | 0.87 | % | | | 0.86 | % | | | 0.85 | % | | | 0.83 | % |
Net expenses | | | 0.80 | % | | | 0.80 | % | | | 0.80 | % | | | 0.80 | % | | | 0.80 | % |
Net investment income (loss) | | | (0.10 | )% | | | (0.02 | )% | | | 0.09 | % | | | 0.13 | % | | | 0.13 | % |
Supplemental data | | | | | | | | | | | | | | | | | | | | |
Portfolio turnover rate | | | 60 | % | | | 45 | % | | | 65 | % | | | 47 | % | | | 44 | % |
Net assets, end of period (000s omitted) | | | $3,940 | | | | $3,727 | | | | $3,559 | | | | $3,988 | | | | $2,129 | |
| 1 | Calculated based upon average shares outstanding |
| 2 | Amount is more than $(0.005). |
The accompanying notes are an integral part of these financial statements.
20 | Wells Fargo Premier Large Company Growth Fund
Financial highlights
(For a share outstanding throughout each period)
| | | | | | | | | | | | | | | | | | | | |
| | | Year ended July 31 | |
| CLASS R6 | | 2019 | | | 2018 | | | 2017 | | | 2016 | | | 2015 | |
Net asset value, beginning of period | | | $15.87 | | | | $15.87 | | | | $15.08 | | | | $16.62 | | | | $14.77 | |
Net investment income (loss) | | | (0.00 | )1,2 | | | 0.02 | 1 | | | 0.03 | 1 | | | 0.04 | 1 | | | 0.05 | |
Net realized and unrealized gains (losses) on investments | | | 1.61 | | | | 3.73 | | | | 2.19 | | | | (0.53 | ) | | | 2.01 | |
| | | | | | | | | | | | | | | | | | | | |
Total from investment operations | | | 1.61 | | | | 3.75 | | | | 2.22 | | | | (0.49 | ) | | | 2.06 | |
Distributions to shareholders from | | | | | | | | | | | | | | | | | | | | |
Net realized gains | | | (2.36 | ) | | | (3.75 | ) | | | (1.43 | ) | | | (1.05 | ) | | | (0.21 | ) |
Net asset value, end of period | | | $15.12 | | | | $15.87 | | | | $15.87 | | | | $15.08 | | | | $16.62 | |
Total return | | | 13.40 | % | | | 27.27 | % | | | 16.48 | % | | | (2.78 | )% | | | 14.00 | % |
Ratios to average net assets (annualized) | | | | | | | | | | | | | | | | | | | | |
Gross expenses | | | 0.71 | % | | | 0.72 | % | | | 0.71 | % | | | 0.70 | % | | | 0.68 | % |
Net expenses | | | 0.65 | % | | | 0.65 | % | | | 0.65 | % | | | 0.65 | % | | | 0.65 | % |
Net investment income (loss) | | | (0.02 | )% | | | 0.12 | % | | | 0.25 | % | | | 0.28 | % | | | 0.29 | % |
Supplemental data | | | | | | | | | | | | | | | | | | | | |
Portfolio turnover rate | | | 60 | % | | | 45 | % | | | 65 | % | | | 47 | % | | | 44 | % |
Net assets, end of period (000s omitted) | | | $820,383 | | | | $196,934 | | | | $170,657 | | | | $179,198 | | | | $166,768 | |
| 1 | Calculated based upon average shares outstanding |
| 2 | Amount is more than $(0.005). |
The accompanying notes are an integral part of these financial statements.
Wells Fargo Premier Large Company Growth Fund | 21
Financial highlights
(For a share outstanding throughout each period)
| | | | | | | | | | | | | | | | | | | | |
| | | Year ended July 31 | |
| ADMINISTRATOR CLASS | | 2019 | | | 2018 | | | 2017 | | | 2016 | | | 2015 | |
Net asset value, beginning of period | | | $15.35 | | | | $15.52 | | | | $14.82 | | | | $16.41 | | | | $14.63 | |
Net investment loss | | | (0.04 | )1 | | | (0.03 | )1 | | | (0.01 | )1 | | | (0.00 | )1,2 | | | (0.00 | )2 |
Net realized and unrealized gains (losses) on investments | | | 1.53 | | | | 3.61 | | | | 2.14 | | | | (0.54 | ) | | | 1.99 | |
| | | | | | | | | | | | | | | | | | | | |
Total from investment operations | | | 1.49 | | | | 3.58 | | | | 2.13 | | | | (0.54 | ) | | | 1.99 | |
Distributions to shareholders from | | | | | | | | | | | | | | | | | | | | |
Net realized gains | | | (2.36 | ) | | | (3.75 | ) | | | (1.43 | ) | | | (1.05 | ) | | | (0.21 | ) |
Net asset value, end of period | | | $14.48 | | | | $15.35 | | | | $15.52 | | | | $14.82 | | | | $16.41 | |
Total return | | | 13.02 | % | | | 26.70 | % | | | 16.14 | % | | | (3.13 | )% | | | 13.73 | % |
Ratios to average net assets (annualized) | | | | | | | | | | | | | | | | | | | | |
Gross expenses | | | 1.07 | % | | | 1.07 | % | | | 1.06 | % | | | 1.04 | % | | | 1.00 | % |
Net expenses | | | 1.00 | % | | | 1.00 | % | | | 1.00 | % | | | 0.98 | % | | | 0.95 | % |
Net investment loss | | | (0.29 | )% | | | (0.22 | )% | | | (0.06 | )% | | | (0.02 | )% | | | (0.01 | )% |
Supplemental data | | | | | | | | | | | | | | | | | | | | |
Portfolio turnover rate | | | 60 | % | | | 45 | % | | | 65 | % | | | 47 | % | | | 44 | % |
Net assets, end of period (000s omitted) | | | $49,042 | | | | $57,582 | | | | $82,998 | | | | $292,900 | | | | $1,129,970 | |
| 1 | Calculated based upon average shares outstanding |
| 2 | Amount is more than $(0.005). |
The accompanying notes are an integral part of these financial statements.
22 | Wells Fargo Premier Large Company Growth Fund
Financial highlights
(For a share outstanding throughout each period)
| | | | | | | | | | | | | | | | | | | | |
| | | Year ended July 31 | |
| INSTITUTIONAL CLASS | | 2019 | | | 2018 | | | 2017 | | | 2016 | | | 2015 | |
Net asset value, beginning of period | | | $15.82 | | | | $15.84 | | | | $15.06 | | | | $16.61 | | | | $14.77 | |
Net investment income | | | 0.00 | 1,2 | | | 0.01 | 1 | | | 0.02 | 1 | | | 0.03 | 1 | | | 0.03 | |
Net realized and unrealized gains (losses) on investments | | | 1.60 | | | | 3.72 | | | | 2.19 | | | | (0.53 | ) | | | 2.02 | |
| | | | | | | | | | | | | | | | | | | | |
Total from investment operations | | | 1.60 | | | | 3.73 | | | | 2.21 | | | | (0.50 | ) | | | 2.05 | |
Distributions to shareholders from | | | | | | | | | | | | | | | | | | | | |
Net realized gains | | | (2.36 | ) | | | (3.75 | ) | | | (1.43 | ) | | | (1.05 | ) | | | (0.21 | ) |
Net asset value, end of period | | | $15.06 | | | | $15.82 | | | | $15.84 | | | | $15.06 | | | | $16.61 | |
Total return | | | 13.38 | % | | | 27.17 | % | | | 16.44 | % | | | (2.85 | )% | | | 14.01 | % |
Ratios to average net assets (annualized) | | | | | | | | | | | | | | | | | | | | |
Gross expenses | | | 0.82 | % | | | 0.82 | % | | | 0.81 | % | | | 0.80 | % | | | 0.74 | % |
Net expenses | | | 0.70 | % | | | 0.70 | % | | | 0.70 | % | | | 0.70 | % | | | 0.70 | % |
Net investment income | | | 0.02 | % | | | 0.07 | % | | | 0.19 | % | | | 0.23 | % | | | 0.23 | % |
Supplemental data | | | | | | | | | | | | | | | | | | | | |
Portfolio turnover rate | | | 60 | % | | | 45 | % | | | 65 | % | | | 47 | % | | | 44 | % |
Net assets, end of period (000s omitted) | | | $643,578 | | | | $1,043,161 | | | | $949,344 | | | | $1,097,976 | | | | $1,313,281 | |
| 1 | Calculated based upon average shares outstanding |
| 2 | Amount is less than $0.005. |
The accompanying notes are an integral part of these financial statements.
Wells Fargo Premier Large Company Growth Fund | 23
Notes to financial statements
1. ORGANIZATION
Wells Fargo Funds Trust (the “Trust”), a Delaware statutory trust organized on March 10, 1999, is anopen-end management investment company registered under the Investment Company Act of 1940, as amended (the “1940 Act”). As an investment company, the Trust follows the accounting and reporting guidance in Financial Accounting Standards Board (“FASB”)Accounting Standards Codification Topic 946, Financial Services – Investment Companies. These financial statements report on the Wells Fargo Premier Large Company Growth Fund (the “Fund”) which is a diversified series of the Trust.
2. SIGNIFICANT ACCOUNTING POLICIES
The following significant accounting policies, which are consistently followed in the preparation of the financial statements of the Fund, are in conformity with U.S. generally accepted accounting principles which require management to make estimates and assumptions that affect the reported amounts of assets and liabilities, disclosure of contingent assets and liabilities at the date of the financial statements, and the reported amounts of revenues and expenses during the reporting period. Actual results could differ from those estimates.
Securities valuation
All investments are valued each business day as of the close of regular trading on the New York Stock Exchange (generally 4 p.m. Eastern Time), although the Fund may deviate from this calculation time under unusual or unexpected circumstances.
Equity securities that are listed on a foreign or domestic exchange or market are valued at the official closing price or, if none, the last sales price. If no sale occurs on the principal exchange or market that day, a fair value price will be determined in accordance with the Fund’s Valuation Procedures.
Investments in registeredopen-end investment companies are valued at net asset value. Interests innon-registered investment companies that are redeemable at net asset value are fair valued normally at net asset value.
Investments which are not valued using any of the methods discussed above are valued at their fair value, as determined in good faith by the Board of Trustees of the Fund. The Board of Trustees has established a Valuation Committee comprised of the Trustees and has delegated to it the authority to take any actions regarding the valuation of portfolio securities that the Valuation Committee deems necessary or appropriate, including determining the fair value of portfolio securities, unless the determination has been delegated to the Wells Fargo Asset Management Pricing Committee at Wells Fargo Funds Management, LLC (“Funds Management”). The Board of Trustees retains the authority to make or ratify any valuation decisions or approve any changes to the Valuation Procedures as it deems appropriate. On a quarterly basis, the Board of Trustees receives reports on any valuation actions taken by the Valuation Committee or the Wells Fargo Asset Management Pricing Committee which may include items for ratification.
Foreign currency translation
The accounting records of the Fund are maintained in U.S. dollars. The values of other assets and liabilities denominated in foreign currencies are translated into U.S. dollars at rates provided by an independent foreign currency pricing source at a time each business day specified by the Wells Fargo Asset Management Pricing Committee. Purchases and sales of securities, and income and expenses are converted at the rate of exchange on the respective dates of such transactions. Net realized foreign exchange gains or losses arise from sales of foreign currencies, currency gains or losses realized between the trade and settlement dates on securities transactions, and the difference between the amounts of dividends, interest and foreign withholding taxes recorded and the U.S. dollar equivalent of the amounts actually paid or received. Net unrealized foreign exchange gains and losses arise from changes in the fair value of assets and liabilities other than investments in securities resulting from changes in exchange rates. The changes in net assets arising from changes in exchange rates of securities and the changes in net assets resulting from changes in market prices of securities are not separately presented. Such changes are included in net realized and unrealized gains or losses from investments.
Securities lending
The Fund may lend its securities from time to time in order to earn additional income in the form of fees or interest on securities received as collateral or the investment of any cash received as collateral. When securities are on loan, the Fund receives interest or dividends on those securities. Cash collateral received in connection with its securities lending transactions is invested in Securities Lending Cash Investments, LLC (the “Securities Lending Fund”). Investments in Securities Lending Fund are valued at the evaluated bid price provided by an independent pricing service. Income earned from investment in the Securities Lending Fund (net of fees and rebates), if any, is included in income from affiliated securities on the Statement of Operations.
In a securities lending transaction, the net asset value of the Fund will be affected by an increase or decrease in the value of the securities loaned and by an increase or decrease in the value of the instrument in which collateral is invested. The amount of securities lending activity undertaken by the Fund fluctuates from time to time. The Fund has the right under the lending agreement to recover the securities from the borrower on demand. In the event of default or bankruptcy by the borrower, the Fund may be prevented from recovering the loaned securities or gaining access to the collateral or may experience delays or
24 | Wells Fargo Premier Large Company Growth Fund
Notes to financial statements
costs in doing so. In such an event, the terms of the agreement allows the unaffiliated securities lending agent to use the collateral to purchase replacement securities on behalf of the Fund or pay the Fund the market value of the loaned securities. The Fund will bear the risk of loss with respect to depreciation of its investment of the cash collateral.
Security transactions and income recognition
Securities transactions are recorded on a trade date basis. Realized gains or losses are recorded on the basis of identified cost.
Dividend income is recognized on theex-dividend date. Dividend income is recorded net of foreign taxes withheld where recovery of such taxes is not assured.
Distributions to shareholders
Distributions to shareholders from net investment income and any net realized gains are recorded on theex-dividend date and paid at least annually. Such distributions are determined in accordance with income tax regulations and may differ from U.S. generally accepted accounting principles. Dividend sources are estimated at the time of declaration. The tax character of distributions is determined as of the Fund’s fiscal year end. Therefore, a portion of the Fund’s distributions made prior to the Fund’s fiscal year end may be categorized as a tax return of capital at year end.
Federal and other taxes
The Fund intends to continue to qualify as a regulated investment company by distributing substantially all of its investment company taxable income and any net realized capital gains (after reduction for capital loss carryforwards) sufficient to relieve it from all, or substantially all, federal income taxes. Accordingly, no provision for federal income taxes was required.
The Fund’s income and federal excise tax returns and all financial records supporting those returns for the prior three fiscal years are subject to examination by the federal and Delaware revenue authorities. Management has analyzed the Fund’s tax positions taken on federal, state, and foreign tax returns for all open tax years and does not believe that there are any uncertain tax positions that require recognition of a tax liability.
As of July 31, 2019, the aggregate cost of all investments for federal income tax purposes was $1,638,133,287 and the unrealized gains (losses) consisted of:
| | | | |
| |
Gross unrealized gains | | $ | 1,191,166,803 | |
| |
Gross unrealized losses | | | (14,324,415 | ) |
| |
Net unrealized gains | | $ | 1,176,842,388 | |
Reclassifications are made to the Fund’s capital accounts for permanent tax differences to reflect income and gains available for distribution (or available capital loss carryforwards) under federal income tax regulations. U.S. generally accepted accounting principles require that certain components of net assets be adjusted to reflect permanent differences between financial and tax reporting. These reclassifications have no effect on net assets or net asset values per share. The primary permanent difference causing such reclassification is due to net operating losses. At July 31, 2019, as a result of permanentbook-to-tax differences, the following reclassification adjustments were made on the Statement of Assets and Liabilities:
| | |
| Paid-in capital | | Total distributable
earnings |
| |
| $(1,420,015) | | $1,420,015 |
As of July 31, 2019, the Fund had a qualified late-year ordinary loss of $4,559,091 which will be recognized on the first day of the following fiscal year.
Class allocations
The separate classes of shares offered by the Fund differ principally in applicable sales charges, distribution, shareholder servicing, and administration fees. Class specific expenses are charged directly to that share class. Investment income, common fund-level expenses, and realized and unrealized gains (losses) on investments are allocated daily to each class of shares based on the relative proportion of net assets of each class.
3. FAIR VALUATION MEASUREMENTS
Fair value measurements of investments are determined within a framework that has established a fair value hierarchy based upon the various data inputs utilized in determining the value of the Fund’s investments. The three-level hierarchy gives the highest priority to unadjusted quoted prices in active markets for identical assets or liabilities (Level 1) and the lowest priority to unobservable inputs (Level 3). The Fund’s investments are classified within the fair value hierarchy based on the lowest level of input that is significant to the fair value measurement. The inputs are summarized into three broad levels as follows:
Wells Fargo Premier Large Company Growth Fund | 25
Notes to financial statements
| ∎ | | Level 1 – quoted prices in active markets for identical securities |
| ∎ | | Level 2 – other significant observable inputs (including quoted prices for similar securities, interest rates, prepayment speeds, credit risk, etc.) |
| ∎ | | Level 3 – significant unobservable inputs (including the Fund’s own assumptions in determining the fair value of investments) |
The inputs or methodologies used for valuing investments in securities are not necessarily an indication of the risk associated with investing in those securities.
The following is a summary of the inputs used in valuing the Fund’s assets and liabilities as of July 31, 2019:
| | | | | | | | | | | | | | | | |
| | | | |
| | | Quoted prices
(Level 1) | | | Other significant
observable inputs
(Level 2) | | | Significant
unobservable inputs (Level 3) | | | Total | |
| | | | |
Assets | | | | | | | | | | | | | | | | |
Investments in: | | | | | | | | | | | | | | | | |
| | | | |
Common stocks | | | | | | | | | | | | | | | | |
| | | | |
Communication services | | $ | 300,612,783 | | | $ | 0 | | | $ | 0 | | | $ | 300,612,783 | |
| | | | |
Consumer discretionary | | | 471,436,377 | | | | 0 | | | | 0 | | | | 471,436,377 | |
| | | | |
Consumer staples | | | 101,005,393 | | | | 0 | | | | 0 | | | | 101,005,393 | |
| | | | |
Financials | | | 107,212,974 | | | | 0 | | | | 0 | | | | 107,212,974 | |
| | | | |
Health care | | | 286,728,311 | | | | 0 | | | | 0 | | | | 286,728,311 | |
| | | | |
Industrials | | | 330,908,712 | | | | 0 | | | | 0 | | | | 330,908,712 | |
| | | | |
Information technology | | | 1,030,490,212 | | | | 0 | | | | 0 | | | | 1,030,490,212 | |
| | | | |
Materials | | | 37,531,049 | | | | 0 | | | | 0 | | | | 37,531,049 | |
| | | | |
Real estate | | | 50,044,213 | | | | 0 | | | | 0 | | | | 50,044,213 | |
| | | | |
Short-term investments | | | | | | | | | | | | | | | | |
| | | | |
Investment companies | | | 99,005,651 | | | | 0 | | | | 0 | | | | 99,005,651 | |
| | | | |
Total assets | | $ | 2,814,975,675 | | | $ | 0 | | | $ | 0 | | | $ | 2,814,975,675 | |
Additional sector, industry or geographic detail is included in the Portfolio of Investments.
For the year ended July 31, 2019, the Fund did not have any transfers into/out of Level 3.
4. TRANSACTIONS WITH AFFILIATES
Management fee
Funds Management, an indirect wholly owned subsidiary of Wells Fargo & Company (“Wells Fargo”), is the manager of the Fund and provides advisory and fund-level administrative services under an investment management agreement. Under the investment management agreement, Funds Management is responsible for, among other services, implementing the investment objectives and strategies of the Fund, supervising the subadviser and providing fund-level administrative services in connection with the Fund’s operations. As compensation for its services under the investment management agreement, Funds Management is entitled to receive a management fee at the following annual rate based on the Fund’s average daily net assets:
| | |
| |
| Average daily net assets | | Management fee |
| |
First $500 million | | 0.700% |
| |
Next $500 million | | 0.675 |
| |
Next $1 billion | | 0.650 |
| |
Next $2 billion | | 0.625 |
| |
Next $1 billion | | 0.600 |
| |
Next $3 billion | | 0.590 |
| |
Next $2 billion | | 0.565 |
| |
Next $2 billion | | 0.555 |
| |
Next $4 billion | | 0.530 |
| |
Over $16 billion | | 0.505 |
26 | Wells Fargo Premier Large Company Growth Fund
Notes to financial statements
For the year ended July 31, 2019, the management fee was equivalent to an annual rate of 0.66% of the Fund’s average daily net assets.
Funds Management has retained the services of a subadviser to provide daily portfolio management to the Fund. The fee for subadvisory services is borne by Funds Management. Wells Capital Management Incorporated (“WellsCap”), an affiliate of Funds Management and an indirect wholly owned subsidiary of Wells Fargo, is the subadviser to the Fund and is entitled to receive a fee from Funds Management at an annual rate starting at 0.35% and declining to 0.275% as the average daily net assets of the Fund increase.
Administration fees
Under a class-level administration agreement, Funds Management provides class-level administrative services to the Fund, which includes paying fees and expenses for services provided by the transfer agent,sub-transfer agents, omnibus account servicers and record-keepers. As compensation for its services under the class-level administration agreement, Funds Management receives an annual fee which is calculated based on the average daily net assets of each class as follows:
| | |
| |
| | | Class-level
administration fee |
| |
Class A, Class C | | 0.21% |
| |
Class R4 | | 0.08 |
| |
Class R6 | | 0.03 |
| |
Administrator Class, Institutional Class | | 0.13 |
Waivers and/or expense reimbursements
Funds Management has contractually waived and/or reimbursed management and administration fees to the extent necessary to maintain certain net operating expense ratios for the Fund. When each class of the Fund has exceeded its expense cap, Funds Management has waived fees and/or reimbursed expenses from fund-level expenses on a proportionate basis and then from class specific expenses. When only certain classes exceed their expense caps, waivers and/or reimbursements are applied against class specific expenses before fund-level expenses. Funds Management has committed through November 30, 2019 to waive fees and/or reimburse expenses to the extent necessary to cap the Fund’s expenses at 1.11% for Class A shares, 1.86% for Class C shares, 0.80% for Class R4 shares, 0.65% for Class R6 shares, 1.00% for Administrator class shares, and 0.70% for Institutional Class shares. Prior to or after the commitment expiration date, the cap may be increased or the commitment to maintain the cap may be terminated only with the approval of the Board of Trustees.
Distribution fee
The Trust has adopted a distribution plan for Class C shares of the Fund pursuant to Rule12b-1 under the 1940 Act. A distribution fee is charged to Class C shares and paid to Wells Fargo Funds Distributor, LLC (“Funds Distributor”), the principal underwriter, at an annual rate of 0.75% of the average daily net assets of Class C shares.
In addition, Funds Distributor is entitled to receive thefront-end sales charge from the purchase of Class A shares and a contingent deferred sales charge on the redemption of certain Class A shares. Funds Distributor is also entitled to receive the contingent deferred sales charges from redemptions of Class C shares. For the year ended July 31, 2019, Funds Distributor received $34,496 from the sale of Class A. No contingent deferred sales charges were incurred by Class A and Class C shares for the year ended July 31, 2019.
Shareholder servicing fees
The Trust has entered into contracts with one or more shareholder servicing agents, whereby Class A, Class C, and Administrator Class of the Fund are charged a fee at an annual rate of 0.25% of the average daily net assets of each respective class. Class R4 is charged a fee at an annual rate of 0.10% of its average daily net assets. A portion of these total shareholder servicing fees were paid to affiliates of Wells Fargo.
Interfund transactions
The Fund may purchase or sell portfolio investment securities to certain other Wells Fargo affiliates pursuant to Rule17a-7 under the 1940 Act and under procedures adopted by the Board of Trustees. The procedures have been designed to ensure that these interfund transactions, which do not incur broker commissions, are effected at current market prices.
5. INVESTMENT PORTFOLIO TRANSACTIONS
Purchases and sales of investments, excluding U.S. government obligations (if any) and short-term securities, for the year ended July 31, 2019 were $1,438,462,381 and $1,547,934,306, respectively.
Wells Fargo Premier Large Company Growth Fund | 27
Notes to financial statements
6. SECURITIES LENDING TRANSACTIONS
The Fund lends its securities through an unaffiliated securities lending agent and receives collateral in the form of cash or securities with a value at least equal to the value of the securities on loan. The value of the loaned securities is determined at the close of each business day and any increases or decreases in the required collateral are exchanged between the Fund and the counterparty on the next business day. Cash collateral received is invested in the Securities Lending Fund which seeks to provide a positive return compared to the daily Fed Funds Open Rate by investing in high-quality, U.S. dollar-denominated short-term money market instruments and is exempt from registration under Section 3(c)(7) of the 1940 Act. Securities Lending Fund is managed by Funds Management and is subadvised by WellsCap. Funds Management receives an advisory fee starting at 0.05% and declining to 0.01% as the average daily net assets of the Securities Lending Fund increase. All of the fees received by Funds Management are paid to WellsCap for its services as subadviser.
In the event of counterparty default or the failure of a borrower to return a loaned security, the Fund has the right to use the collateral to offset any losses incurred.
As of July 31, 2019, the Fund had securities lending transactions with the following counterparties which are subject to offset:
| | | | | | | | | | | | |
| | | |
| Counterparty | | Value of
securities on
loan | | | Collateral
received1 | | | Net amount | |
| | | |
Bank of America Securities Inc. | | $ | 64,986,263 | | | $ | (64,986,263 | ) | | $ | 0 | |
| | | |
Bank of Nova Scotia | | | 706,774 | | | | (706,774 | ) | | | 0 | |
| | | |
Barclays Capital Inc. | | | 426,153 | | | | (426,153 | ) | | | 0 | |
| | | |
BMO Capital Markets Corp. | | | 802,284 | | | | (802,284 | ) | | | 0 | |
| | | |
Deutsche Bank Securities Inc. | | | 1,757,384 | | | | (1,757,384 | ) | | | 0 | |
| | | |
Jefferies LLC | | | 11,490,030 | | | | (11,490,030 | ) | | | 0 | |
| | | |
Morgan Stanley & Co. LLC | | | 9,708,751 | | | | (9,708,751 | ) | | | 0 | |
| | | |
UBS Securities LLC | | | 2,432,261 | | | | (2,432,261 | ) | | | 0 | |
| 1 | Collateral received within this table is limited to the collateral for the net transaction with the counterparty. |
7. BANK BORROWINGS
The Trust (excluding the money market funds), Wells Fargo Master Trust and Wells Fargo Variable Trust are parties to a $280,000,000 revolving credit agreement whereby the Fund is permitted to use bank borrowings for temporary or emergency purposes, such as to fund shareholder redemption requests. Interest under the credit agreement is charged to the Fund based on a borrowing rate equal to the higher of the Federal Funds rate in effect on that day plus 1.25% or the overnight LIBOR rate in effect on that day plus 1.25%. In addition, an annual commitment fee equal to 0.25% of the unused balance is allocated to each participating fund.
For the year ended July 31, 2019, there were no borrowings by the Fund under the agreement.
8. DISTRIBUTIONS TO SHAREHOLDERS
The tax character of distributions paid during the years ended July 31, 2019 and July 31, 2018 were as follows:
| | | | | | | | |
| | | Year ended July 31 | |
| | |
| | | 2019 | | | 2018 | |
| | |
Ordinary income | | $ | 2,032,129 | | | $ | 0 | |
| | |
Long-term capital gain | | | 378,597,119 | | | | 560,983,610 | |
As of July 31, 2019, the components of distributable earnings on a tax basis were as follows:
| | | | |
Undistributed long-term gain | | Unrealized gains | | Late-year ordinary losses deferred |
| | |
| $200,579,451 | | $1,176,842,388 | | $(4,559,091) |
28 | Wells Fargo Premier Large Company Growth Fund
Notes to financial statements
Effective for all filings after November 4, 2018, the Securities and Exchange Commission eliminated the requirement to separately state the components of distributions to shareholders under U.S. generally accepted accounting principles. The amounts of distributions to shareholders for the year ended July 31, 2018 were as follows:
| | | | |
| |
| | | Net realized
gains | |
| |
Class A | | | $227,679,727 | |
| |
Class C | | | 54,543,209 | |
| |
Class R4 | | | 746,155 | |
| |
Class R6 | | | 37,680,602 | |
| |
Administrator Class | | | 18,099,486 | |
| |
Institutional Class | | | 222,234,431 | |
9. CONCENTRATION RISK
Concentration risks result from exposure to a limited number of sectors. As of the end of the period, the Fund invests a concentration of its portfolio in the information technology sector. A fund that invests a substantial portion of its assets in any sector may be more affected by changes in that sector than would be a fund whose investments are not heavily weighted in any sector.
10. INDEMNIFICATION
Under the Trust’s organizational documents, the officers and Trustees have been granted certain indemnification rights against certain liabilities that may arise out of performance of their duties to the Trust. Additionally, in the normal course of business, the Trust may enter into contracts with service providers that contain a variety of indemnification clauses. The Trust’s maximum exposure under these arrangements is dependent on future claims that may be made against the Fund and, therefore, cannot be estimated.
11. NEW ACCOUNTING PRONOUNCEMENT
In August 2018, FASB issued Accounting Standards Update (“ASU”)No. 2018-13, Fair Value Measurement (Topic 820)Disclosure Framework—Changes to the Disclosure Requirements for Fair Value Measurement. ASU2018-13 updates the disclosure requirements for fair value measurements by modifying or removing certain disclosures and adding certain new disclosures. The amendments are effective for fiscal years, and interim periods within those fiscal years, beginning after December 15, 2019. Early adoption is permitted. Management has adopted the removal and modification of disclosures early, as permitted, and will adopt the additional new disclosures at the effective date.
Wells Fargo Premier Large Company Growth Fund | 29
Report of independent registered public accounting firm
TO THE SHAREHOLDERS OF THE FUND AND BOARD OF TRUSTEES OF WELLS FARGO FUNDS TRUST:
Opinion on the Financial Statements
We have audited the accompanying statement of assets and liabilities of Wells Fargo Premier Large Company Growth Fund (the Fund), one of the funds constituting Wells Fargo Funds Trust, including the portfolio of investments, as of July 31, 2019, the related statement of operations for the year then ended, the statements of changes in net assets for each of the years in the two-year period then ended, and the related notes (collectively, the financial statements) and the financial highlights for each of the years in the five-year period then ended. In our opinion, the financial statements and financial highlights present fairly, in all material respects, the financial position of the Fund as of July 31, 2019, the results of its operations for the year then ended, the changes in its net assets for each of the years in the two-year period then ended, and the financial highlights for each of the years in the five-year period then ended, in conformity with U.S. generally accepted accounting principles.
Basis for Opinion
These financial statements and financial highlights are the responsibility of the Fund’s management. Our responsibility is to express an opinion on these financial statements and financial highlights based on our audits. We are a public accounting firm registered with the Public Company Accounting Oversight Board (United States) (PCAOB) and are required to be independent with respect to the Fund in accordance with the U.S. federal securities laws and the applicable rules and regulations of the Securities and Exchange Commission and the PCAOB.
We conducted our audits in accordance with the standards of the PCAOB. Those standards require that we plan and perform the audit to obtain reasonable assurance about whether the financial statements and financial highlights are free of material misstatement, whether due to error or fraud. Our audits included performing procedures to assess the risks of material misstatement of the financial statements and financial highlights, whether due to error or fraud, and performing procedures that respond to those risks. Such procedures included examining, on a test basis, evidence regarding the amounts and disclosures in the financial statements and financial highlights. Such procedures also included confirmation of securities owned as of July 31, 2019, by correspondence with the custodian, transfer agent and brokers, or by other appropriate auditing procedures. Our audits also included evaluating the accounting principles used and significant estimates made by management, as well as evaluating the overall presentation of the financial statements and financial highlights. We believe that our audits provide a reasonable basis for our opinion.

We have not been able to determine the specific year that we began serving as the auditor of one or more Wells Fargo Funds investment companies; however we are aware that we have served as the auditor of one or more Wells Fargo Funds investment companies since at least 1955.
Boston, Massachusetts
September 25, 2019
30 | Wells Fargo Premier Large Company Growth Fund
Other information (unaudited)
TAX INFORMATION
For corporate shareholders, pursuant to Section 854 of the Internal Revenue Code, 100% of ordinary income dividends qualify for the corporate dividends-received deduction for the fiscal year ended July 31, 2019.
Pursuant to Section 852 of the Internal Revenue Code, $378,597,119 was designated as a 20% rate gain distribution for the fiscal year ended July 31, 2019.
Pursuant to Section 854 of the Internal Revenue Code, $2,032,129 of income dividends paid during the fiscal year ended July 31, 2019 has been designated as qualified dividend income (QDI).
For the fiscal year ended July 31, 2019, $2,032,129 has been designated as short-term capital gain dividends for nonresident alien shareholders pursuant to Section 871 of the Internal Revenue Code.
PROXY VOTING INFORMATION
A description of the policies and procedures used to determine how to vote proxies relating to portfolio securities is available, upon request, by calling1-800-222-8222, visiting our website atwfam.com, or visiting the SEC website at sec.gov. Information regarding how the proxies related to portfolio securities were voted during the most recent12-month period ended June 30 is available on the website atwfam.comor by visiting the SEC website at sec.gov.
QUARTERLY PORTFOLIO HOLDINGS INFORMATION
The Fund files its complete schedule of portfolio holdings with the SEC for the first and third quarters of each fiscal year on Form N-Q or FormN-PORT, which is available by visiting the SEC website at sec.gov. Those forms may be reviewed and copied at the SEC’s Public Reference Room in Washington, DC. Information on the operation of the Public Reference Room may be obtained by calling1-800-SEC-0330.
Wells Fargo Premier Large Company Growth Fund | 31
Other information (unaudited)
BOARD OF TRUSTEES AND OFFICERS
Each of the Trustees and Officers1 listed in the table below acts in identical capacities for each fund in the Wells Fargo family of funds, which consists of 152 mutual funds comprising the Wells Fargo Funds Trust, Wells Fargo Variable Trust, Wells Fargo Master Trust and fourclosed-end funds (collectively the “Fund Complex”). This table should be read in conjunction with the Prospectus and the Statement of Additional Information2. The mailing address of each Trustee and Officer is 525 Market Street, 12th Floor, San Francisco, CA 94105. Each Trustee and Officer serves an indefinite term, however, each Trustee serves such term until reaching the mandatory retirement age established by the Trustees.
Independent Trustees
| | | | | | |
Name and year of birth | | Position held and
length of service* | | Principal occupations during past five years or longer | | Current other
public company or
investment
company
directorships |
| | | |
| William R. Ebsworth (Born 1957) | | Trustee,
since 2015 | | Retired. From 1984 to 2013, equities analyst, portfolio manager, research director and chief investment officer at Fidelity Management and Research Company in Boston, Tokyo, and Hong Kong, and retired in 2013 as Chief Investment Officer of Fidelity Strategic Advisers, Inc. where he led a team of investment professionals managing client assets. Prior thereto, Board member of Hong Kong Securities Clearing Co., Hong Kong Options Clearing Corp., the Thailand International Fund, Ltd., Fidelity Investments Life Insurance Company, and Empire Fidelity Investments Life Insurance Company. Audit Committee Chair and Investment Committee Chair of the Vincent Memorial Hospital Endowment(non-profit organization). Mr. Ebsworth is a CFA® charterholder. | | N/A |
| | | |
Jane A. Freeman
(Born 1953) | | Trustee,
since 2015;
Chair Liaison,
since 2018 | | Retired. From 2012 to 2014 and 1999 to 2008, Chief Financial Officer of Scientific Learning Corporation. From 2008 to 2012, Ms. Freeman provided consulting services related to strategic business projects. Prior to 1999, Portfolio Manager at Rockefeller & Co. and Scudder, Stevens & Clark. Board member of the Harding Loevner Funds from 1996 to 2014, serving as both Lead Independent Director and chair of the Audit Committee. Board member of the Russell Exchange Traded Funds Trust from 2011 to 2012 and the chair of the Audit Committee. Ms. Freeman is a Board Member of The Ruth Bancroft Garden(non-profit organization). She is also an inactive Chartered Financial Analyst. | | N/A |
| | | |
Isaiah Harris, Jr.
(Born 1952) | | Trustee,
since 2009;
Audit Committee
Chairman,
since 2019 | | Retired. Chairman of the Board of CIGNA Corporation since 2009, and Director since 2005. From 2003 to 2011, Director of Deluxe Corporation. Prior thereto, President and CEO of BellSouth Advertising and Publishing Corp. from 2005 to 2007, President and CEO of BellSouth Enterprises from 2004 to 2005 and President of BellSouth Consumer Services from 2000 to 2003. Emeritus member of the Iowa State University Foundation Board of Governors. Emeritus Member of the Advisory Board of Iowa State University School of Business. Advisory Board Member, Palm Harbor Academy (private school). Advisory Board Member, Child Evangelism Fellowship(non-profit). Mr. Harris is a certified public accountant (inactive status). | | CIGNA Corporation |
| | | |
Judith M. Johnson
(Born 1949) | | Trustee,
since 2008;
Audit Committee
Chairman, from
2009 to 2018 | | Retired. Prior thereto, Chief Executive Officer and Chief Investment Officer of Minneapolis Employees Retirement Fund from 1996 to 2008. Ms. Johnson is an attorney, certified public accountant and a certified managerial accountant. | | N/A |
32 | Wells Fargo Premier Large Company Growth Fund
Other information (unaudited)
| | | | | | |
Name and year of birth | | Position held and
length of service* | | Principal occupations during past five years or longer | | Current other
public company or
investment
company
directorships |
| | | |
David F. Larcker
(Born 1950) | | Trustee,
since 2009 | | James Irvin Miller Professor of Accounting at the Graduate School of Business, Stanford University, Director of the Corporate Governance Research Initiative and Senior Faculty of The Rock Center for Corporate Governance since 2006. From 2005 to 2008, Professor of Accounting at the Graduate School of Business, Stanford University. Prior thereto, Ernst & Young Professor of Accounting at The Wharton School, University of Pennsylvania from 1985 to 2005. | | N/A |
| | | |
Olivia S. Mitchell
(Born 1953) | | Trustee,
since 2006; Nominating and Governance Committee Chairman,
since 2018 | | International Foundation of Employee Benefit Plans Professor, Wharton School of the University of Pennsylvania since 1993. Director of Wharton’s Pension Research Council and Boettner Center on Pensions & Retirement Research, and Research Associate at the National Bureau of Economic Research. Previously, Cornell University Professor from 1978 to 1993. | | N/A |
| | | |
Timothy J. Penny
(Born 1951) | | Trustee,
since 1996;
Chairman,
since 2018 | | President and Chief Executive Officer of Southern Minnesota Initiative Foundation, anon-profit organization, since 2007. Member of the Board of Trustees of NorthStar Education Finance, Inc., anon-profit organization, since 2007. | | N/A |
| | | |
James G. Polisson
(Born 1959) | | Trustee,
since 2018 | | Retired. Chief Marketing Officer, Source (ETF) UK Services, Ltd, from 2015 to 2017. From 2012 to 2015, Principal of The Polisson Group, LLC, a management consulting, corporate advisory and principal investing company. Chief Executive Officer and Managing Director at Russell Investments, Global Exchange Traded Funds from 2010 to 2012. Managing Director of Barclays Global Investors from 1998 to 2010 and Global Chief Marketing Officer for iShares and Barclays Global Investors from 2000 to 2010. Trustee of the San Francisco Mechanics’ Institute, anon-profit organization, from 2013 to 2015. Board member of the Russell Exchange Traded Fund Trust from 2011 to 2012. Director of Barclays Global Investors Holdings Deutschland GmbH from 2006 to 2009. Mr. Polisson is an attorney and has a retired status with the Massachusetts and District of Columbia Bar Associations. | | N/A |
| * | Length of service dates reflect the Trustee’s commencement of service with the Trust’s predecessor entities, where applicable. |
Wells Fargo Premier Large Company Growth Fund | 33
Other information (unaudited)
Officers
| | | | |
Name and
year of birth | | Position held and
length of service | | Principal occupations during past five years or longer |
| | |
Andrew Owen
(Born 1960) | | President,
since 2017 | | Executive Vice President of Wells Fargo & Company and Head of Affiliated Managers, Wells Fargo Asset Management, since 2014. In addition, Mr. Owen is currently President, Chief Executive Officer and Director of Wells Fargo Funds Management, LLC since 2017. Prior thereto, Executive Vice President responsible for marketing, investments and product development for Wells Fargo Funds Management, LLC, from 2009 to 2014. |
| | |
Jeremy DePalma1
(Born 1974) | | Treasurer,
since 2012 | | Senior Vice President of Wells Fargo Funds Management, LLC since 2009. Senior Vice President of Evergreen Investment Management Company, LLC from 2008 to 2010 and head of the Fund Reporting and Control Team within Fund Administration from 2005 to 2010. |
| | |
Alexander Kymn
(Born 1973) | | Secretary and
Chief Legal
Officer,
since 2018 | | Senior Company Counsel of Wells Fargo Bank, N.A. since 2018 (previously Senior Counsel from 2007 to 2018). Vice President of Wells Fargo Funds Management, LLC from 2008 to 2014. |
| | |
| Michael H. Whitaker(Born 1967) | | Chief Compliance Officer,
since 2016 | | Senior Vice President and Chief Compliance Officer since 2016. Senior Vice President and Chief Compliance Officer for Fidelity Investments from 2007 to 2016. |
| | |
David Berardi
(Born 1975) | | Assistant Treasurer,
since 2009 | | Vice President of Wells Fargo Funds Management, LLC since 2009. Vice President of Evergreen Investment Management Company, LLC from 2008 to 2010. Manager of Fund Reporting and Control for Evergreen Investment Management Company, LLC from 2004 to 2010. |
| 1 | Jeremy DePalma acts as Treasurer of 87 funds and Assistant Treasurer of 65 funds in the Fund Complex. |
| 2 | The Statement of Additional Information includes additional information about the Trustees and is available, without charge, upon request, by calling1-800-222-8222 or by visiting the website atwfam.com. |
34 | Wells Fargo Premier Large Company Growth Fund
Other information (unaudited)
BOARD CONSIDERATION OF INVESTMENT MANAGEMENT ANDSUB-ADVISORY AGREEMENTS:
Wells Fargo Premier Large Company Growth Fund
Under the Investment Company Act of 1940 (the “1940 Act”), the Board of Trustees (the “Board”) of Wells Fargo Funds Trust (the “Trust”) must determine annually whether to approve the continuation of the Trust’s investment management andsub-advisory agreements. In this regard, at anin-person meeting held on May21-22, 2019 (the “Meeting”), the Board, all the members of which have no direct or indirect interest in the investment management andsub-advisory agreements and are not “interested persons” of the Trust, as defined in the 1940 Act (the “Independent Trustees”), reviewed and approved for Wells Fargo Premier Large Company Growth Fund(the “Fund”): (i) an investment management agreement (the “Management Agreement”) with Wells Fargo Funds Management, LLC (“Funds Management”); and (ii) an investmentsub-advisory agreement (the“Sub-Advisory Agreement”) with Wells Capital Management Incorporated (the“Sub-Adviser”), an affiliate of Funds Management. The Management Agreement and theSub-Advisory Agreement are collectively referred to as the “Advisory Agreements.”
At the Meeting, the Board considered the factors and reached the conclusions described below relating to the selection of Funds Management and theSub-Adviser and the approval of the Advisory Agreements. Prior to the Meeting, including at anin-person meeting in April 2019, the Trustees conferred extensively among themselves and with representatives of Funds Management about these matters. Also, the Board has adopted a team-based approach, with each team consisting of asub-set of Trustees, to assist the full Board in the discharge of its duties in reviewing investment performance and other matters throughout the year. The Independent Trustees were assisted in their evaluation of the Advisory Agreements by independent legal counsel, from whom they received separate legal advice and with whom they met separately.
In providing information to the Board, Funds Management and theSub-Adviser were guided by a detailed set of requests for information submitted to them by independent legal counsel on behalf of the Independent Trustees at the start of the Board’s annual contract renewal process earlier in 2019. In considering and approving the Advisory Agreements, the Trustees considered the information they believed relevant, including but not limited to the information discussed below. The Board considered not only the specific information presented in connection with the Meeting, but also the knowledge gained over time through interaction with Funds Management and theSub-Adviser about various topics. In this regard, the Board reviewed reports of Funds Management at each of its quarterly meetings, which included, among other things, portfolio reviews and investment performance reports. In addition, the Board and the teams mentioned above confer with portfolio managers at various times throughout the year. The Board did not identify any particular information or consideration that wasall-important or controlling, and each individual Trustee may have attributed different weights to various factors.
After its deliberations, the Board unanimously approved the continuation of the Advisory Agreements for aone-year term and determined that the compensation payable to Funds Management and theSub-Adviser under each of the Advisory Agreements was reasonable. The Board considered the approval of the Advisory Agreements for the Fund as part of its consideration of agreements for funds across the complex, but its approvals were made on afund-by-fund basis. The following summarizes a number of important, but not necessarily all, factors considered by the Board in support of its approvals.
Nature, extent and quality of services
The Board received and considered various information regarding the nature, extent and quality of services provided to the Fund by Funds Management and theSub-Adviser under the Advisory Agreements. This information included a description of the investment advisory services and Fund-level administrative services covered by the Management Agreement, as well as, among other things, a summary of the background and experience of senior management of Wells Fargo Asset Management (“WFAM”), of which Funds Management and theSub-Adviser are a part, a summary of investments made in the business of WFAM, a summary of certain organizational and personnel changes involving Funds Management and theSub-Adviser, and a description of Funds Management’s and theSub-Adviser’s business continuity planning programs and of their approaches to data privacy and cybersecurity. The Board received and reviewed information about Funds Management’s role as administrator of the Fund’s liquidity risk management program. The Board also considered the qualifications, background, tenure and responsibilities of each of the portfolio managers primarily responsible for theday-to-day portfolio management of the Fund.
The Board evaluated the ability of Funds Management and theSub-Adviser to attract and retain qualified investment professionals, including research, advisory and supervisory personnel. The Board further considered the compliance programs and compliance records of Funds Management and theSub-Adviser. In addition, the Board took into account the full range of services provided to the Fund by Funds Management and its affiliates.
Wells Fargo Premier Large Company Growth Fund | 35
Other information (unaudited)
Fund investment performance and expenses
The Board considered the investment performance results for the Fund over various time periods ended December 31, 2018. The Board considered these results in comparison to the investment performance of funds in a universe that was determined by Broadridge Inc. (“Broadridge”) to be similar to the Fund (the “Universe”), and in comparison to the Fund’s benchmark index and to other comparative data. Broadridge is an independent provider of investment company data. The Board received a description of the methodology used by Broadridge to select the mutual funds in the performance Universe. The Board noted that the investment performance of the Fund (Class A) was higher than the average investment performance of the Universe for all periods under review. The Board also noted that the investment performance of the Fund was lower than its benchmark index, the Russell 1000® Growth Index, for the three-, five- andten-year periods under review, but higher than its benchmark for theone-year period under review.
The Board received information concerning, and discussed factors contributing to, the underperformance of the Fund relative to the benchmark for the periods identified above. The Board took note of the explanations for the relative underperformance during these periods, including with respect to investment decisions and market factors that affected the Fund’s investment performance. The Board also took note of the Fund’s outperformance relative to the Universe for all periods under review and the benchmark over theone-year period under review.
The Board also received and considered information regarding the Fund’s net operating expense ratios and their various components, including actual management fees, custodian and othernon-management fees, and Rule12b-1 andnon-Rule12b-1 shareholder service fees. The Board considered these ratios in comparison to the median ratios of funds in class-specific expense groups that were determined by Broadridge to be similar to the Fund (the “Groups”). The Board received a description of the methodology used by Broadridge to select the mutual funds in the expense Groups and an explanation of how funds comprising expense groups and their expense ratios may vary fromyear-to-year. Based on the Broadridge reports, the Board noted that the net operating expense ratios of the Fund were lower than, equal to or in range of the median net operating expense ratios of the expense Groups for each share class.
The Board took into account the Fund’s investment performance and expense information provided to it among the factors considered in deciding tore-approve the Advisory Agreements.
Investment management andsub-advisory fee rates
The Board reviewed and considered the contractual fee rates payable by the Fund to Funds Management under the Management Agreement, as well as the contractual fee rates payable by the Fund to Funds Management for class-level administrative services under a Class-Level Administration Agreement, which include, among other things, class-level transfer agency andsub-transfer agency costs (collectively, the “Management Rates”). The Board also reviewed and considered the contractual investmentsub-advisory fee rates that are payable by Funds Management to theSub-Adviser for investmentsub-advisory services.
Among other information reviewed by the Board was a comparison of the Fund’s Management Rates with the average contractual investment management fee rates of funds in the expense Groups at a common asset level as well as transfer agency costs of the funds in the expense Groups. The Board noted that the Management Rates of the Fund were lower than or in range of the sum of these average rates for the Fund’s expense Groups for all share classes.
The Board also received and considered information about the portion of the total management fee that was retained by Funds Management after payment of the fee to theSub-Adviser forsub-advisory services. In assessing the reasonableness of this amount, the Board received and evaluated information about the nature and extent of responsibilities retained and risks assumed by Funds Management and not delegated to or assumed by theSub-Adviser, and about Funds Management’son-going oversight services. Given the affiliation between Funds Management and theSub-Adviser, the Board ascribed limited relevance to the allocation of fees between them.
The Board also received and considered information about the nature and extent of services offered and fee rates charged by Funds Management and theSub-Adviser to other types of clients with investment strategies similar to those of the Fund. In this regard, the Board received information about the significantly greater scope of services, and compliance, reporting and other legal burdens and risks of managing proprietary mutual funds compared with those associated with managing assets of other types of clients, including third-partysub-advised fund clients andnon-mutual fund clients such as institutional separate accounts.
Based on its consideration of the factors and information it deemed relevant, including those described here, the Board determined that the compensation payable to Funds Management under the Management Agreement and to theSub-Adviser under theSub-Advisory Agreement was reasonable.
36 | Wells Fargo Premier Large Company Growth Fund
Other information (unaudited)
Profitability
The Board received and considered information concerning the profitability of Funds Management, as well as the profitability of both WFAM and Wells Fargo & Co. (“Wells Fargo”) from providing services to the fund family as a whole. The Board noted that theSub-Adviser’s profitability information with respect to providing services to the Fund and other funds in the family was subsumed in the WFAM and Wells Fargo profitability analysis.
Funds Management reported on the methodologies and estimates used in calculating profitability, including a description of the methodology used to allocate certain expenses. Among other things, the Board noted that the levels of profitability reported on afund-by-fund basis varied widely, depending on factors such as the size, type and age of fund. Based on its review, the Board did not deem the profits reported by Funds Management, WFAM or Wells Fargo from services provided to the Fund to be at a level that would prevent it from approving the continuation of the Advisory Agreements.
Economies of scale
The Board received and considered information about the potential for Funds Management to experience economies of scale in the provision of management services to the Fund, the difficulties of calculating economies of scale at an individual fund level, and the extent to which potential scale benefits are shared with shareholders. The Board noted the existence of breakpoints in the Fund’s management fee structure, which operate generally to reduce the Fund’s expense ratios as the Fund grows in size. The Board considered that in addition to management fee breakpoints, Funds Management shares potential economies of scale from its management business in a variety of ways, including through fee waiver and expense reimbursement arrangements, services that benefit shareholders, competitive management fee rates set at the outset without regard to breakpoints, and investments in the business intended to enhance services available to shareholders.
The Board concluded that Funds Management’s arrangements with respect to the Fund, including contractual breakpoints, constituted a reasonable approach to sharing potential economies of scale with the Fund and its shareholders.
Other benefits to Funds Management and theSub-Adviser
The Board received and considered information regarding potential“fall-out” or ancillary benefits received by Funds Management and its affiliates, including theSub-Adviser, as a result of their relationships with the Fund. Ancillary benefits could include, among others, benefits directly attributable to other relationships with the Fund and benefits potentially derived from an increase in Funds Management’s and theSub-Adviser’s business as a result of their relationships with the Fund. The Board noted that various affiliates of Funds Management may receive distribution-related fees, shareholder servicing payments andsub-transfer agency fees in respect of shares sold or held through them and services provided.
The Board also reviewed information about soft dollar credits earned and utilized by theSub-Adviser, fees earned by Funds Management and theSub-Adviser from managing a private investment vehicle for the fund family’s securities lending collateral, and commissions earned by an affiliated broker from portfolio transactions.
Based on its consideration of the factors and information it deemed relevant, including those described here, the Board did not find that any ancillary benefits received by Funds Management and its affiliates, including theSub-Adviser, were unreasonable.
Conclusion
At the Meeting, after considering the above-described factors and based on its deliberations and its evaluation of the information described above, the Board unanimously approved the continuation of the Advisory Agreements for aone-year term and determined that the compensation payable to Funds Management and theSub-Adviser under each of the Advisory Agreements was reasonable.
Wells Fargo Premier Large Company Growth Fund | 37
This page is intentionally left blank.
This page is intentionally left blank.
This page is intentionally left blank.

For more information
More information about Wells Fargo Funds is available free upon request. To obtain literature, please write, visit the Fund’s website, or call:
Wells Fargo Funds
P.O. Box 219967
Kansas City, MO 64121-9967
Website:wfam.com
Individual investors:1-800-222-8222
Retail investment professionals:1-888-877-9275
Institutional investment professionals:1-866-765-0778

This report and the financial statements contained herein are submitted for the general information of the shareholders of the Fund. If this report is used for promotional purposes, distribution of the report must be accompanied or preceded by a current prospectus. Before investing, please consider the investment objectives, risks, charges, and expenses of the investment. For a current prospectus and, if available, a summary prospectus, containing this information, call1-800-222-8222 or visit the Fund’s website atwfam.com. Read the prospectus carefully before you invest or send money.
Wells Fargo Asset Management (WFAM) is the trade name for certain investment advisory/management firms owned by Wells Fargo & Company. These firms include but are not limited to Wells Capital Management Incorporated and Wells Fargo Funds Management, LLC. Certain products managed by WFAM entities are distributed by Wells Fargo Funds Distributor, LLC (a broker-dealer and Member FINRA).
This material is for general informational and educational purposes only and is NOT intended to provide investment advice or a recommendation of any kind—including a recommendation for any specific investment, strategy, or plan.
INVESTMENT PRODUCTS: NOT FDIC INSURED ◾ NO BANK GUARANTEE ◾ MAY LOSE VALUE
© 2019 Wells Fargo Funds Management, LLC. All rights reserved.
405485 09-19
A212/AR212 07-19
(a) As of the end of the period covered by the report, Wells Fargo Funds Trust has adopted a code of ethics that applies to its President and Treasurer. A copy of the code of ethics is filed as an exhibit to this FormN-CSR.
(c) During the period covered by this report, there were no amendments to the provisions of the code of ethics adopted in Item 2(a) above.
(d) During the period covered by this report, there were no implicit or explicit waivers to the provisions of the code of ethics adopted in Item 2(a) above.
| ITEM 3. | AUDIT COMMITTEE FINANCIAL EXPERT |
The Board of Trustees of Wells Fargo Funds Trust has determined that Judith Johnson is an audit committee financial expert, as defined in Item 3 of FormN-CSR. Mrs. Johnson is independent for purposes of Item 3 of FormN-CSR.
| ITEM 4. | PRINCIPAL ACCOUNTANT FEES AND SERVICES |
(a), (b), (c), (d) The following table presents aggregate fees billed in each of the last two fiscal years for services rendered to the Registrant by the Registrant’s principal accountant. These fees were billed to the registrant and were approved by the Registrant’s audit committee.
| | | | | | | | |
| | | Fiscal
year ended
July 31, 2019 | | | Fiscal
year ended
July 31, 2018 | |
Audit fees | | $ | 352,690 | | | $ | 347,729 | |
Audit-related fees | | | — | | | | — | |
Tax fees(1) | | | 46,970 | | | | 46,695 | |
All other fees | | | — | | | | — | |
| | | | | | | | |
| | $ | 399,660 | | | $ | 394,424 | |
| | | | | | | | |
| (1) | Tax fees consist of fees for tax compliance, tax advice, tax planning and excise tax. |
(e) The Chairman of the Audit Committees is authorized topre-approve: (1) audit services for the mutual funds of Wells Fargo Funds Trust;(2) non-audit tax or compliance consulting or training services provided to the Funds by the independent auditors (“Auditors”) if the fees for any particular engagement are not anticipated to exceed $50,000; and(3) non-audit tax or compliance consulting or training services provided by the Auditors to a Fund’s investment adviser and its controlling entities (wherepre-approval is required because the engagement relates directly to the operations and financial reporting of the Fund) if the fee to the Auditors for any particular engagement is not anticipated to exceed $50,000. For any suchpre-approval sought from the Chairman, Management shall prepare a brief description of the proposed services.
If the Chairman approves of such service, he or she shall sign the statement prepared by Management. Such written statement shall be presented to the full Committees at their next regularly scheduled meetings.
(f) Not applicable
(g) Not applicable
(h) Not applicable
| ITEM 5. | AUDIT COMMITTEE OF LISTED REGISTRANTS |
Not applicable.
A Portfolio of Investments for each series of Wells Fargo Funds Trust is included as part of the report to shareholders filed under Item 1 of this Form.
| ITEM 7. | DISCLOSURE OF PROXY VOTING POLICIES AND PROCEDURES FORCLOSED-END MANAGEMENT INVESTMENT COMPANIES |
Not applicable.
| ITEM 8. | PORTFOLIO MANAGERS OFCLOSED-END MANAGEMENT INVESTMENT COMPANIES |
Not applicable.
| ITEM 9. | PURCHASES OF EQUITY SECURITIES BYCLOSED-END MANAGEMENT INVESTMENT COMPANY AND AFFILIATED PURCHASERS |
Not applicable.
| ITEM 10. | SUBMISSION OF MATTERS TO A VOTE OF SECURITY HOLDERS |
There have been no material changes to the procedures by which shareholders may recommend nominees to the registrant’s Board of Trustees that have been implemented since the registrant’s last provided disclosure in response to the requirements of this Item.
| ITEM 11. | CONTROLS AND PROCEDURES |
(a) The President and Treasurer have concluded that the Wells Fargo Funds Trust disclosure controls and procedures (as defined inRule 30a-3(c) under the Investment Company Act of 1940) provide reasonable assurances that material information relating to the registrant is made known to them by the appropriate persons based on their evaluation of these controls and procedures as of a date within 90 days of the filing of this report.
(b) There were no significant changes in the registrant’s internal controls over financial reporting (as defined in Rule30a-3(d) under the Investment Company Act of 1940) that occurred during the most recent fiscal half-year of the period covered by this report that materially affected, or is reasonably likely to materially affect, the registrant’s internal control over financial reporting.
| ITEM 12. | DISCLOSURES OF SECURITIES LENDING ACTIVITES FORCLOSED-ENDMANAGEMENT INVESTMENT COMPANIES |
Not applicable.
(a)(1) Code of Ethics pursuant to Item 2 of FormN-CSR is filed and attached hereto as Exhibit COE.
(a)(2) Certification pursuant to Rule30a-2(a) under the Investment Company Act of 1940 (17 CFR270.30a-2(a)) is filed and attached hereto as Exhibit 99.CERT.
(b) Certification pursuant to Rule30a-2(b) under the Investment Company Act of 1940 (17 CFR270.30a-2(b)) is filed and attached hereto as Exhibit 99.906CERT.
SIGNATURES
Pursuant to the requirements of the Securities Exchange Act of 1934 and the Investment Company Act of 1940, the registrant has duly caused this report to be signed on its behalf by the undersigned, thereunto duly authorized.
| | |
| Wells Fargo Funds Trust |
| |
| By: | | |
| | /s/ Andrew Owen |
| |
| | Andrew Owen |
| | President |
| |
| Date: | | September 25, 2019 |
Pursuant to the requirements of the Securities Exchange Act of 1934 and the Investment Company Act of 1940, this report has been signed below by the following persons on behalf of the registrant and in the capacities and on the date indicated.
| | |
| Wells Fargo Funds Trust |
| |
| By: | | |
| | /s/ Andrew Owen |
| |
| | Andrew Owen |
| | President |
| |
| Date: | | September 25, 2019 |
| |
| By: | | |
| | /s/ Nancy Wiser |
| |
| | Nancy Wiser |
| | Treasurer |
| |
| Date: | | September 25, 2019 |
| |
| By: | | |
| | /s/ Jeremy DePalma |
| |
| | Jeremy DePalma |
| | Treasurer |
| |
| Date: | | September 25, 2019 |