
UNITED STATES
SECURITIES AND EXCHANGE COMMISSION
Washington, D.C. 20549
FORMN-CSR
CERTIFIED SHAREHOLDER REPORT OF REGISTERED
MANAGEMENT INVESTMENT COMPANIES
Investment Company Act file number: 811-09253
Wells Fargo Funds Trust
(Exact name of registrant as specified in charter)
525 Market St., San Francisco, CA 94105
(Address of principal executive offices) (Zip code)
Catherine Kennedy
Wells Fargo Funds Management, LLC
525 Market St., San Francisco, CA 94105
(Name and address of agent for service)
Registrant’s telephone number, including area code:800-222-8222
Date of fiscal year end: September 30
Registrant is making a filing for 12 of its series:
Wells Fargo Diversified Capital Builder Fund, Wells Fargo Diversified Income Builder Fund, Wells Fargo Index Asset Allocation Fund, Wells Fargo International Bond Fund, Wells Fargo Strategic Income Fund, Wells Fargo Global Investment Grade Credit Fund, Wells Fargo C&B Mid Cap Value Fund, Wells Fargo Common Stock Fund, Wells Fargo Discovery Fund, Wells Fargo Enterprise Fund, Wells Fargo Opportunity Fund, and Wells Fargo Special Mid Cap Value Fund.
Date of reporting period: September 30, 2019
ITEM 1. REPORT TO STOCKHOLDERS
Annual Report
September 30, 2019
Wells Fargo
Diversified Capital Builder Fund
Beginning on January 1, 2021, as permitted by new regulations adopted by the Securities and Exchange Commission, paper copies of the Wells Fargo Funds’ annual and semi-annual shareholder reports issued after this date will no longer be sent by mail, unless you specifically request paper copies of the reports. Instead, the reports will be made available on the Funds’ website, and you will be notified by mail each time a report is posted and provided with a website address to access the report.
If you already elected to receive shareholder reports electronically, you will not be affected by this change and you need not take any action. You may elect to receive shareholder reports and other communications from the Fund electronically at any time by contacting your financial intermediary (such as a broker-dealer or bank) or, if you are a direct investor, by calling1-800-222-8222 or by enrolling at wellsfargo.com/advantagedelivery.
You may elect to receive all future reports in paper free of charge. If you invest through a financial intermediary, you can contact your financial intermediary to request that you continue to receive paper copies of your shareholder reports; if you invest directly with the Fund, you can call 1-800-222-8222. Your election to receive reports in paper will apply to all Wells Fargo Funds held in your account with your financial intermediary or, if you are a direct investor, to all Wells Fargo Funds that you hold.
|
|
|
Reduce clutter. Save trees. |
Sign up for electronic delivery of prospectuses and shareholder reports at wellsfargo.com/ advantagedelivery |
The views expressed and any forward-looking statements are as of September 30, 2019, unless otherwise noted, and are those of the Fund managers and/or Wells Fargo Asset Management. Discussions of individual securities, or the markets generally, or any Wells Fargo Fund are not intended as individual recommendations. Future events or results may vary significantly from those expressed in any forward-looking statements. The views expressed are subject to change at any time in response to changing circumstances in the market. Wells Fargo Asset Management and the Fund disclaim any obligation to publicly update or revise any views expressed or forward-looking statements.
INVESTMENT PRODUCTS: NOT FDIC INSURED ◾ NO BANK GUARANTEE ◾ MAY LOSE VALUE
Wells Fargo Diversified Capital Builder Fund | 1
Letter to shareholders (unaudited)

Andrew Owen
President
Wells Fargo Funds
“December’s S&P 500 Index performance was the worst since 1931.”
Dear Shareholder:
We are pleased to offer you this annual report for the Wells Fargo Diversified Capital Builder Fund for the12-month period that ended September 30, 2019. After the first half of the period yielded eitherlow-single-digit or negative investment returns, U.S. stock and global bond investors generally saw markets recover during the second half amid intensifying market volatility, global economic growth concerns, international trade stare downs, and simmering geopolitical tensions.
Overall, fixed-income investors enjoyed a distinct advantage over stock investors. For the period, U.S. stocks, based on the S&P 500 Index,1 gained 4.25% and international stocks, as measured by the MSCI ACWI ex USA Index (Net),2 fell 1.23%. The MSCI EM Index (Net)3 slipped 2.02%. Among fixed income investors, the Bloomberg Barclays U.S. Aggregate Bond Index4 added 10.30%, the Bloomberg Barclays Global Aggregateex-USD Index5 added 5.34%, the Bloomberg Barclays Municipal Bond Index6 gained 8.55%, and the ICE BofAML U.S. High Yield Index7 added 6.30%.
Investors confronted unsettling events during the fourth quarter of 2018.
During the fourth quarter of 2018, investors grew concerned about the pace and sustainability of the global economic expansion. The U.S. Bureau of Economic Analysis reported third-quarter U.S. gross domestic product (GDP) was 3.4% on an annualized basis, which was down from the second-quarter rate. A partial U.S. government shutdown occurred, which extended into January 2019. Brexit efforts stalled, causing uncertainty for the eurozone. The value of the renminbi declined even as the People’s Bank of China cut reserve requirement ratios, accelerated infrastructure spending, and cut taxes in efforts to spur economic activity.
The combination of news in the U.S. and generally weak economic indicators outside of the U.S. caused investors to seek safe havens. December’s S&P 500 Index performance was the worst since 1931. Globally, fixed-income investments fared better than stocks during the last two months of the year. Even as indicators suggested growth was restrained, the U.S. Federal Reserve (Fed) increased the federal funds rate by 25 basis points (bps; 100 bps equal 1.00%) in December 2018 to a target range of between 2.25% and 2.50%. Many observers expressed concerns that higher rates could slow the economy further.
| 1 | The S&P 500 Index consists of 500 stocks chosen for market size, liquidity, and industry group representation. It is a market-value-weighted index with each stock’s weight in the index proportionate to its market value. You cannot invest directly in an index. |
| 2 | The Morgan Stanley Capital International (MSCI) All Country World Index (ACWI) ex USA Index (Net) is a free-float-adjusted market-capitalization weighted index that is designed to measure the equity market performance of developed and emerging markets, excluding the U.S. Source: MSCI. MSCI makes no express or implied warranties or representations and shall have no liability whatsoever with respect to any MSCI data contained herein. The MSCI data may not be further redistributed or used as a basis for other indices or any securities or financial products. This report is not approved, reviewed, or produced by MSCI. You cannot invest directly in an index. |
| 3 | The MSCI Emerging Markets (EM) Index (Net) is a free-float-adjusted market-capitalization-weighted index that is designed to measure the equity market performance of emerging markets. You cannot invest directly in an index. |
| 4 | The Bloomberg Barclays U.S. Aggregate Bond Index is a broad-based benchmark that measures the investment-grade, U.S. dollar-denominated, fixed-rate taxable bond market, including Treasuries, government-related and corporate securities, mortgage-backed securities (agency fixed-rate and hybrid adjustable-rate mortgage pass-throughs), asset-backed securities, and commercial mortgage-backed securities. You cannot invest directly in an index. |
| 5 | The Bloomberg Barclays Global Aggregateex-USD Index is an unmanaged index that provides a broad-based measure of the global investment-grade fixed-income markets excluding the U.S. dollar-denominated debt market. You cannot invest directly in an index. |
| 6 | The Bloomberg Barclays Municipal Bond Index is an unmanaged index composed of long-termtax-exempt bonds with a minimum credit rating of Baa. You cannot invest directly in an index. |
| 7 | The ICE BofAML U.S. High Yield Index is a market-capitalization-weighted index of domestic and Yankee high-yield bonds. The index tracks the performance of high-yield securities traded in the U.S. bond market. You cannot invest directly in an index. Copyright 2019. ICE Data Indices, LLC. All rights reserved. |
2 | Wells Fargo Diversified Capital Builder Fund
Letter to shareholders (unaudited)
The market climbs a wall of worry.
Investment returns early in 2019 appeared to reaffirm the adage that markets climb a wall of worry as the new year began. The S&P 500 Index gained 8.01% for the month of January, the best monthly performance in 30 years. Returns for the MSCI ACWI ex USA Index (Net), the Bloomberg Barclays U.S. Aggregate Bond Index, and the Bloomberg Barclays Global Aggregateex-USD Index also were positive.
In February 2019, signs of slowing global growth grew more ominous. The Bureau of Economic Analysis announced fourth-quarter 2018 GDP grew at an annualized 2.2% rate, a slower rate than reported for the prior two quarters. In a February report, the Bank of England forecast the slowest growth for 2019 since the financial crisis. China and the U.S. continued to wrangle over trade issues. By the end of the first quarter of 2019, more accommodative Fed sentiment and steady, if not spectacular, U.S. economic and business metrics encouraged domestic investors.
Early second-quarter 2019 enthusiasm among investors faded.
During April 2019, favorable sentiment found additional support in reports of sustained low inflation, solid employment data, and first-quarter U.S. GDP of an annualized rate of 3.2%. During May, markets tumbled on mixed investment signals. In the U.S., partisan wrangling ramped up as Democrats and Republicans set their sights on 2020 presidential politics. The U.K.’s Brexit disagreements caused Prime Minister Theresa May to resign. Boris Johnson succeeded her only to exacerbate uncertainty about Brexit’s resolution ahead of an October 2019 deadline. The European Commission downgraded the 2019 growth forecast to 1.2%. The U.S. increased tariffs on products from China, China responded, and then talks broke down. President Donald Trump threatened to turn his foreign policy tariff tool to Mexico over immigration issues.
During the third quarter of 2019, investors regrouped. Just as the investment horizon appeared to darken, sentiment turned and U.S. equity markets gained during June and July. The gains, primarily driven by geopolitical and monetary policy events, pushed equity markets to new highs. European Central Bank President Mario Draghi said that if the outlook doesn’t improve, the bank would cut rates or buy more assets to prop up inflation. President Trump backed off of tariff threats against Mexico and China. In the U.S., the Fed implemented a 0.25% federal funds rate cut in July.
Later in July 2019, the U.S. reversed course and threatened to impose higher tariffs on China’s exports after talks failed. China responded with tariff threats of its own and devalued the renminbi, a move that roiled global markets. Major U.S. stock market indices closed July with the worst weekly results of the year. Bond prices gained as Treasury yields fell to levels not seen since November 2016 and the yield curve inverted at multiple points along the30-year arc.
In a microcosm, August 2019 encapsulated many of the unnerving events that plagued investors during the prior 11 months. The U.S.-China trade relationship swung from antagonistic to hopeful and back again with no evident compromise on the horizon. Evidence of a continued global economic slowdown mounted. Central banks in China, New Zealand, and Thailand cut interest rates. Industrial and manufacturing data declined in China, Canada, Japan, and Germany. Adding to the uncertain environment, Italy’s prime minister resigned, many feared a crackdown in Hong Kong as protesters sustained their calls for reform throughout the month, and Boris Johnson planned to suspend Parliament as Brexit’s deadline neared.
In the U.S., September saw the Fed join other central banks in cutting interest rates. Manufacturing data in the U.S., as reported by the Institute for Supply Management, disappointed investors. The U.S. Congress announced it would pursue an impeachment investigation of President Trump. Meanwhile, the Brexit impasse showed no signs of
“The S&P 500 Index gained 8.01% for the month of January, the best monthly performance in 30 years.”
Wells Fargo Diversified Capital Builder Fund | 3
Letter to shareholders (unaudited)
|
|
|
For further information about your Fund, contact your investment professional, visit our website at wfam.com, or call us directly at1-800-222-8222. |
resolution. Officials in China said that hitting the country’s economic growth goals for the year would be difficult considering the weight of tariffs and trade restrictions. So while the S&P 500 Index finished the third quarter withyear-to-date returns that were the best in more than 20 years, amid signs of equity investors taking money out of the stock market, concerns about future returns remained.
Don’t let short-term uncertainty derail long-term investment goals.
Periods of investment uncertainty can present challenges, but experience has taught us that maintaining long-term investment goals can be an effective way to plan for the future. To help you create a sound strategy based on your personal goals and risk tolerance, Wells Fargo Funds offers more than 100 mutual funds spanning a wide range of asset classes and investment styles. Although diversification cannot guarantee an investment profit or prevent losses, we believe it can be an effective way to manage investment risk and potentially smooth out overall portfolio performance. We encourage investors to know their investments and to understand that appropriate levels of risk-taking may potentially unlock opportunities.
Thank you for choosing to invest with Wells Fargo Funds. We appreciate your confidence in us and remain committed to helping you meet your financial needs.
Sincerely,

Andrew Owen
President
Wells Fargo Funds
4 | Wells Fargo Diversified Capital Builder Fund
This page is intentionally left blank.
Performance highlights (unaudited)
Investment objective
The Fund seeks long-term total return, consisting of capital appreciation and current income.
Manager
Wells Fargo Funds Management, LLC
Subadviser
Wells Capital Management Incorporated
Portfolio managers
Robert Junkin‡
Margaret Patel
Average annual total returns (%) as of September 30, 20191
| | | | | | | | | | | | | | | | | | | | | | | | | | | | | | | | | | |
| | | | |
| | | | | Including sales charge | | | Excluding sales charge | | | Expense ratios2 (%) | |
| | | | | | | | | |
| | | Inception date | | 1 year | | | 5 year | | | 10 year | | | 1 year | | | 5 year | | | 10 year | | | Gross | | | Net3 | |
| | | | | | | | | | |
| Class A (EKBAX) | | 1-20-1998 | | | -0.44 | | | | 8.95 | | | | 11.05 | | | | 5.60 | | | | 10.26 | | | | 11.70 | | | | 1.12 | | | | 1.12 | |
| | | | | | | | | | |
| Class C (EKBCX) | | 1-22-1998 | | | 3.81 | | | | 9.43 | | | | 10.87 | | | | 4.81 | | | | 9.43 | | | | 10.87 | | | | 1.87 | | | | 1.87 | |
| | | | | | | | | | |
| Administrator Class (EKBDX)4 | | 7-30-2010 | | | – | | | | – | | | | – | | | | 5.67 | | | | 10.38 | | | | 11.89 | | | | 1.04 | | | | 1.04 | |
| | | | | | | | | | |
| Institutional Class (EKBYX) | | 1-26-1998 | | | – | | | | – | | | | – | | | | 5.98 | | | | 10.64 | | | | 12.13 | | | | 0.79 | | | | 0.78 | |
| | | | | | | | | | |
| Diversified Capital Builder Blended Index5 | | – | | | – | | | | – | | | | – | | | | 4.65 | | | | 9.36 | | | | 11.95 | | | | – | | | | – | |
| | | | | | | | | | |
| ICE BofAML U.S. Cash Pay High Yield Index6 | | – | | | – | | | | – | | | | – | | | | 6.34 | | | | 5.36 | | | | 7.82 | | | | – | | | | – | |
| | | | | | | | | | |
| Russell 1000® Index7 | | – | | | – | | | | – | | | | – | | | | 3.87 | | | | 10.62 | | | | 13.23 | | | | – | | | | – | |
Figures quoted represent past performance, which is no guarantee of future results, and do not reflect taxes that a shareholder may pay on fund distributions or the redemption of fund shares. Investment return and principal value of an investment will fluctuate so that an investor’s shares, when redeemed, may be worth more or less than their original cost. Performance shown without sales charges would be lower if sales charges were reflected. Current performance may be lower or higher than the performance data quoted, which assumes the reinvestment of dividends and capital gains. Currentmonth-end performance is available on the Fund’s website, wfam.com.
Index returns do not include transaction costs associated with buying and selling securities, any mutual fund fees or expenses, or any taxes. It is not possible to invest directly in an index.
For Class A shares, the maximumfront-end sales charge is 5.75%. For Class C shares, the maximum contingent deferred sales charge is 1.00%. Performance including a contingent deferred sales charge assumes the sales charge for the corresponding time period. Administrator Class and Institutional Class shares are sold without afront-end sales charge or contingent deferred sales charge.
Balanced funds may invest in stocks and bonds. Stock values fluctuate in response to the activities of individual companies and general market and economic conditions. Bond values fluctuate in response to the financial condition of individual issuers, general market and economic conditions, and changes in interest rates. Changes in market conditions and government policies may lead to periods of heightened volatility in the bond market and reduced liquidity for certain bonds held by the Fund. In general, when interest rates rise, bond values fall and investors may lose principal value. Interest rate changes and their impact on the Fund and its share price can be sudden and unpredictable. Certain investment strategies tend to increase the total risk of an investment (relative to the broader market). The Fund is exposed to foreign investment risk, high-yield securities risk, and smaller-company securities risk. Consult the Fund’s prospectus for additional information on these and other risks.
Please see footnotes on page 7.
6 | Wells Fargo Diversified Capital Builder Fund
Performance highlights (unaudited)
|
|
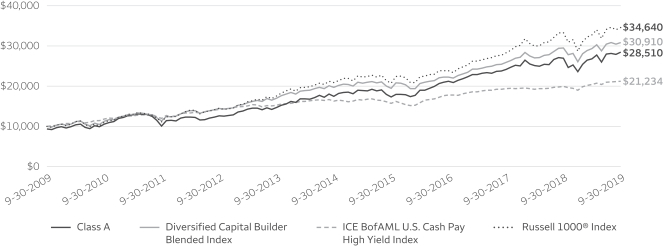
| Growth of $10,000 investment as of September 30, 20198 |
|
|
| ‡ | Mr. Junkin became a portfolio manager of the Fund on April 1, 2019. |
| 1 | Historical performance prior to July 12, 2010, is based on the performance of the Fund’s predecessor, Evergreen Diversified Capital Builder Fund. |
| 2 | Reflects the expense ratios as stated in the most recent prospectuses. The expense ratios shown are subject to change and may differ from the annualized expense ratios shown in the financial highlights of this report. |
| 3 | The manager has contractually committed through January 31, 2020, to waive fees and/or reimburse expenses to the extent necessary to cap the expenses of each class after fee waivers at 1.20% for Class A, 1.95% for Class C, 1.05% for Administrator Class, and 0.78% for Institutional Class. Brokerage commissions, stamp duty fees, interest, taxes, acquired fund fees and expenses (if any), and extraordinary expenses are excluded from the expense cap. Prior to or after the commitment expiration date, the cap may be increased or the commitment to maintain the cap may be terminated only with the approval of the Board of Trustees. Without this cap, the Fund’s returns would have been lower. The expense ratio paid by an investor is the net expense ratio (the total annual fund operating expenses after fee waivers) as stated in the prospectuses. |
| 4 | Historical performance for Administrator Class shares prior to their inception reflects the performance of Institutional Class shares and has been adjusted to reflect the higher expenses applicable to Administrator Class shares. |
| 5 | Source: Wells Fargo Funds Management, LLC. The Diversified Capital Builder Blended Index is composed 75% of the Russell 1000® Index and 25% of the ICE BofAML U.S. Cash Pay High Yield Index. You cannot invest directly in an index. |
| 6 | The ICE BofAML U.S. Cash Pay High Yield Index is an unmanaged market index that provides a broad-based performance measure of thenon-investment grade U.S. domestic bond index. You cannot invest directly in an index. Copyright 2019. ICE Data Indices, LLC. All rights reserved. |
| 7 | The Russell 1000® Index measures the performance of the 1,000 largest companies in the Russell 3000® Index, which represents approximately 92% of the total market capitalization of the Russell 3000® Index. You cannot invest directly in an index. |
| 8 | The chart compares the performance of Class A shares for the most recent ten years with the Diversified Capital Builder Blended Index, the ICE BofAML U.S. Cash Pay High Yield Index, and the Russell 1000® Index. The chart assumes a hypothetical investment of $10,000 in Class A shares and reflects all operating expenses and assumes the maximum initial sales charge of 5.75%. |
| 9 | The ten largest holdings, excluding cash, cash equivalents and any money market funds, are calculated based on the value of the investments divided by total net assets of the Fund. Holdings are subject to change and may have changed since the date specified. |
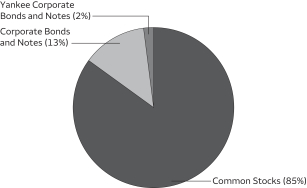
| 10 | Amounts are calculated based on the total long-term investments of the Fund. These amounts are subject to change and may have changed since the date specified. |
| * | This security was no longer held at the end of the reporting period. |
Wells Fargo Diversified Capital Builder Fund | 7
Performance highlights (unaudited)
MANAGER’S DISCUSSION
Fund highlights
| ∎ | | The Fund outperformed its benchmark, the Diversified Capital Builder Blended Index, for the12-month period that ended September 30, 2019. |
| ∎ | | The Fund outperformed the benchmark because of outperformance in the consumer discretionary, industrials, and utilities sectors. |
| ∎ | | Information technology (IT) holdings also contributed. Although our holdings somewhat underperformed the sector’s performance in the Russell 1000® Index, IT outperformed other sectors of the market. |
| ∎ | | Our health care holdings had performance about equal to the index’s overall performance, but the performance of Fund holdings in the health care sector significantly outperformed the stocks in the index’s health care sector. |
| ∎ | | Underperforming sectors were the communication services and real estate sectors. |
| ∎ | | In the Fund’s bond portfolio, holdings moderately outperformed the ICE BofAML U.S. Cash Pay High Yield Index due to our above-average-quality holdings. Better-quality below-investment-grade bonds outperformed lower-quality high-yield issues. |
In the first quarter of the Fund’s fiscal year, which ended December 31, 2018, stock prices fell sharply as a result of the Federal Reserve’s (Fed’s) strategy of gradually raising short-term interest rates. The lower prices reflected market participants’ concern that higher rates, even from low levels, would tighten financial conditions and slow the economy, precipitating a recession. However, in January, the Fed reversed course, indicating a policy more sensitive to financial and market conditions in the formulation of future monetary policy. The stock market reacted positively and reached record levels in the fourth and final quarter of the Fund’s fiscal year that ended September 30, 2019.
Reflecting the change in outlook toward the Fed policy of gradually raising rates over the fiscal year, rates on intermediate-maturity Treasury bonds fell steadily during the period. Bond performance in the corporate market also was generally positive, with interest rates declining alongside the drops in Treasury yields, resulting in price increases for most corporate bonds.
| | | | |
|
| Ten largest holdings (%) as of September 30, 20199 | |
| | |
Broadcom Incorporated | | | 3.75 | |
| | |
Vistra Energy Corporation | | | 3.66 | |
| | |
American Electric Power Company Incorporated | | | 3.31 | |
| | |
Amphenol Corporation Class A | | | 3.24 | |
| | |
DTE Energy Company | | | 3.13 | |
| | |
CMS Energy Corporation | | | 3.07 | |
| | |
Atmos Energy Corporation | | | 2.99 | |
| | |
Adobe Systems Incorporated | | | 2.88 | |
| | |
Akamai Technologies Incorporated | | | 2.82 | |
| | |
Leidos Holdings Incorporated | | | 2.57 | |
Stocks gained in value during the period
After an initial setback in equity performance, most stocks gained in value during the fiscal year. Companies continued to report rising sales and profits. In addition, most companies maintained the historically high profit margins that have been characteristic of the market advance since the financial crisis in 2008. By the last quarter of the fiscal year, however, market levels flattened out as investors became concerned about slowing economic growth not only in the U.S. but also in the rest of the world, where economic conditions are not as robust as in the U.S. Additional concerns about tariffs and restrictions on international trade possibly causing slower growth globally also contributed to market caution at the end of the fiscal year.
Please see footnotes on page 7.
8 | Wells Fargo Diversified Capital Builder Fund
Performance highlights (unaudited)
|
|
| Portfolio composition as of September 30, 201910 |
|
 |
The Fund outperformed relative to its benchmark despite being overweight stocks, which trailed bonds over the12-month period. Within the equity portfolio, its holdings in the health care, utilities, industrials, and consumer discretionary sectors outperformed the return of the equity benchmark. In addition, the Fund’s IT sector holdings, while slightly lagging the sector return of the benchmark, substantially outpaced the average market gain and thus substantially added to incremental returns. Sectors detracting from performance were holdings in the communication services, real estate, materials, and consumer staples sectors.
Equity outperformers in health care included Danaher Corporation and Thermo Fisher Scientific Incorporated. In the utilities sector, American Electric Power Company, Incorporated; CMS Energy Corporation; and DTE Energy Company added to performance. In the IT sector, Akamai Technologies, Incorporated, added value, as did Cypress Semiconductor Corporation, which gained substantially in price after it accepted an acquisition offer from Infineon Technologies AG.
Detractors included energy sector holdings Andeavor Logistics LP* and Centennial Resource Development Incorporated*; materials sector holding Berry Global Group, Incorporated; and IT holdings Salesforce.com, Incorporated, and Corning Incorporated.
U.S. Treasury rates moved lower
In the bond market, interest rates for U.S. Treasury securities, after moving up in the first quarter of the fiscal year, steadily declined over the period’s last three quarters. To illustrate, Treasury issues maturing in 10 years fell from 3.06% at the beginning of the fiscal year to 1.67% bymonth-end September 2019.
High-yield bonds, which historically have been more sensitive to prospects of future economic growth than investment-grade bonds, had price trends that reflected both their equity-like and fixed-income characteristics. In the first quarter of the fiscal year, prices of high-yield bonds dropped, reflecting sharp price corrections in the equity market. However, as the Fed reversed course on monetary policy at the beginning of 2019, prices of high-yield bonds rose as Treasury rates fell. These fluctuations resulted in double-digit total returns for most high-yield bonds based on interest income combined with capital appreciation as yields fell. To illustrate, at the end of September 2018, the average yield to maturity of the index of high-yield bonds was 6.28%, with a yield advantage over similar-maturity U.S. Treasury bonds of 366 basis points (bps; 100 bps equal 1.00%). But at the end of the fiscal year that ended September 30, 2019, the yield to maturity had fallen to 5.87%, with a yield advantage over similar-maturity Treasuries of 420 bps.
In general, lower-quality high-yield bonds underperformed higher-quality high-yield bonds because investors became more concerned with the prospects of poor-credit-quality companies should future economic growth slow materially.
Relative outperformers in the bond portfolio included health care sector holdings AMN Healthcare Services, Incorporated, and DaVita HealthCare Partners Incorporated. In the industrials sector, Resideo Funding Incorporated and SPX FLOW, Incorporated, contributed to performance. Technology sector bonds of Gartner, Incorporated; Seagate Technology plc; and TTM Technologies, Incorporated, outperformed other holdings in the sector. Bond detractors included pharmaceutical company Mallinckrodt plc*; materials sector holding Rayonier Advanced Materials Incorporated; and industrials sector investment CommScope Holding Company, Incorporated.
Our outlook remains one of cautious optimism
The Fund’s positioning reflects our expectation for continued economic growth over the next year, although at levels probably around 1.5% to 2.0%, or somewhat lower than recent economic growth rates. We find stock prices reasonable compared with the earnings growth potential of many stocks. Thus, we are optimistic that equities may provide returns well above those available on the very low yields of risk-free alternatives. In addition, with yields of Treasuries likely to be at low levels for the foreseeable future, we feel stock dividend yields are attractive alternatives to yields offered on short-term fixed-income securities. Within the fixed-income assets of the Fund, virtually all of the bond holdings are of companies with U.S. public equity outstanding, which we think provides a more flexible capital structure and more transparent reporting of financial results. We expect these high-yield bonds to provide a competitive return to that available on lower-yielding, higher-rated bonds.
Please see footnotes on page 7.
Wells Fargo Diversified Capital Builder Fund | 9
Fund expenses (unaudited)
As a shareholder of the Fund, you incur two types of costs: (1) transaction costs, including sales charges (loads) on purchase payments and contingent deferred sales charges (if any) on redemptions and (2) ongoing costs, including management fees, distribution(12b-1) and/or shareholder servicing fees, and other Fund expenses. This example is intended to help you understand your ongoing costs (in dollars) of investing in the Fund and to compare these costs with the ongoing costs of investing in other mutual funds.
The example is based on an investment of $1,000 invested at the beginning of thesix-month period and held for the entire period from April 1, 2019 to September 30, 2019.
Actual expenses
The “Actual” line of the table below provides information about actual account values and actual expenses. You may use the information in this line, together with the amount you invested, to estimate the expenses that you paid over the period. Simply divide your account value by $1,000 (for example, an $8,600 account value divided by $1,000 = 8.6), then multiply the result by the number in the “Actual” line under the heading entitled “Expenses paid during period” for your applicable class of shares to estimate the expenses you paid on your account during this period.
Hypothetical example for comparison purposes
The “Hypothetical” line of the table below provides information about hypothetical account values and hypothetical expenses based on the Fund’s actual expense ratio and an assumed rate of return of 5% per year before expenses, which is not the Fund’s actual return. The hypothetical account values and expenses may not be used to estimate the actual ending account balance or expenses you paid for the period. You may use this information to compare the ongoing costs of investing in the Fund and other funds. To do so, compare this 5% hypothetical example with the 5% hypothetical examples that appear in the shareholder reports of the other funds.
Please note that the expenses shown in the table are meant to highlight your ongoing costs only and do not reflect any transactional costs, such as sales charges (loads) and contingent deferred sales charges. Therefore, the “Hypothetical” line of the table is useful in comparing ongoing costs only and will not help you determine the relative total costs of owning different funds. In addition, if these transactional costs were included, your costs would have been higher.
| | | | | | | | | | | | | | | | |
| | | Beginning
account value
4-1-2019 | | | Ending
account value
9-30-2019 | | | Expenses
paid during
the period¹ | | | Annualized net
expense ratio | |
| | | | | |
Class A | | | | | | | | | | | | | | | | |
| | | | |
Actual | | $ | 1,000.00 | | | $ | 1,062.68 | | | $ | 5.76 | | | | 1.11 | % |
| | | | |
Hypothetical (5% return before expenses) | | $ | 1,000.00 | | | $ | 1,019.49 | | | $ | 5.64 | | | | 1.11 | % |
| | | | | |
Class C | | | | | | | | | | | | | | | | |
| | | | |
Actual | | $ | 1,000.00 | | | $ | 1,058.99 | | | $ | 9.63 | | | | 1.86 | % |
| | | | |
Hypothetical (5% return before expenses) | | $ | 1,000.00 | | | $ | 1,015.71 | | | $ | 9.43 | | | | 1.86 | % |
| | | | | |
Administrator Class | | | | | | | | | | | | | | | | |
| | | | |
Actual | | $ | 1,000.00 | | | $ | 1,062.93 | | | $ | 5.35 | | | | 1.03 | % |
| | | | |
Hypothetical (5% return before expenses) | | $ | 1,000.00 | | | $ | 1,019.89 | | | $ | 5.23 | | | | 1.03 | % |
| | | | | |
Institutional Class | | | | | | | | | | | | | | | | |
| | | | |
Actual | | $ | 1,000.00 | | | $ | 1,064.79 | | | $ | 4.05 | | | | 0.78 | % |
| | | | |
Hypothetical (5% return before expenses) | | $ | 1,000.00 | | | $ | 1,021.15 | | | $ | 3.96 | | | | 0.78 | % |
| 1 | Expenses paid is equal to the annualized net expense ratio of each class multiplied by the average account value over the period, multiplied by the number of days in the most recent fiscal half-year divided by the number of days in the fiscal year (to reflect theone-half-year period). |
10 | Wells Fargo Diversified Capital Builder Fund
Portfolio of investments—September 30, 2019
| | | | | | | | | | | | | | | | |
| | | | | | | | | Shares | | | Value | |
| Common Stocks: 84.04% | | | | | | | | | | | | | | | | |
| | | | |
Communication Services: 1.35% | | | | | | | | | | | | | | | | |
| | | | |
| Media: 1.35% | | | | | | | | | | | | |
Comcast Corporation Class A | | | | | | | | | | | 330,000 | | | $ | 14,876,400 | |
| | | | | | | | | | | | | | | | |
| | | | |
Consumer Discretionary: 0.53% | | | | | | | | | | | | | | | | |
| | | | |
| Specialty Retail: 0.53% | | | | | | | | | | | | |
The Home Depot Incorporated | | | | | | | | | | | 25,000 | | | | 5,800,500 | |
| | | | | | | | | | | | | | | | |
| | | | |
Consumer Staples: 0.33% | | | | | | | | | | | | | | | | |
| | | | |
| Food Products: 0.33% | | | | | | | | | | | | |
Lamb Weston Holdings Incorporated | | | | | | | | | | | 50,001 | | | | 3,636,073 | |
| | | | | | | | | | | | | | | | |
| | | | |
Energy: 1.11% | | | | | | | | | | | | | | | | |
| | | | |
| Oil, Gas & Consumable Fuels: 1.11% | | | | | | | | | | | | |
Kinder Morgan Incorporated | | | | | | | | | | | 10,000 | | | | 206,100 | |
ONEOK Incorporated | | | | | | | | | | | 160,000 | | | | 11,790,400 | |
Plains All American Pipeline LP | | | | | | | | | | | 15,000 | | | | 311,250 | |
| | | | |
| | | | | | | | | | | | | | | 12,307,750 | |
| | | | | | | | | | | | | | | | |
| | | | |
Financials: 1.30% | | | | | | | | | | | | | | | | |
| | | | |
| Insurance: 1.30% | | | | | | | | | | | | |
Chubb Limited | | | | | | | | | | | 35,000 | | | | 5,650,400 | |
The Allstate Corporation | | | | | | | | | | | 80,000 | | | | 8,694,400 | |
| | | | |
| | | | | | | | | | | | | | | 14,344,800 | |
| | | | | | | | | | | | | | | | |
| | | | |
Health Care: 8.21% | | | | | | | | | | | | | | | | |
| | | | |
| Health Care Equipment & Supplies: 3.63% | | | | | | | | | | | | |
Abbott Laboratories | | | | | | | | | | | 100,000 | | | | 8,367,000 | |
Becton Dickinson & Company | | | | | | | | | | | 45,000 | | | | 11,383,200 | |
Danaher Corporation | | | | | | | | | | | 140,000 | | | | 20,220,200 | |
ElectroCore LLC Ǡ | | | | | | | | | | | 30,000 | | | | 65,700 | |
| | | | |
| | | | | | | | | | | | | | | 40,036,100 | |
| | | | | | | | | | | | | | | | |
| | | | |
| Health Care Providers & Services: 0.11% | | | | | | | | | | | | |
HCA Healthcare Incorporated | | | | | | | | | | | 10,000 | | | | 1,204,200 | |
| | | | | | | | | | | | | | | | |
| | | | |
| Life Sciences Tools & Services: 2.91% | | | | | | | | | | | | |
Agilent Technologies Incorporated | | | | | | | | | | | 80,000 | | | | 6,130,400 | |
Bio-Rad Laboratories Incorporated Class A † | | | | | | | | | | | 15,000 | | | | 4,991,100 | |
Illumina Incorporated † | | | | | | | | | | | 2,000 | | | | 608,440 | |
Thermo Fisher Scientific Incorporated | | | | | | | | | | | 70,000 | | | | 20,388,900 | |
| | | | |
| | | | | | | | | | | | | | | 32,118,840 | |
| | | | | | | | | | | | | | | | |
| | | | |
| Pharmaceuticals: 1.56% | | | | | | | | | | | | |
Bristol-Myers Squibb Company | | | | | | | | | | | 110,000 | | | | 5,578,100 | |
Horizon Therapeutics plc † | | | | | | | | | | | 100,000 | | | | 2,723,000 | |
Merck KGaA ADR | | | | | | | | | | | 400,000 | | | | 8,992,000 | |
| | | | |
| | | | | | | | | | | | | | | 17,293,100 | |
| | | | | | | | | | | | | | | | |
| | | | |
Industrials: 12.15% | | | | | | | | | | | | | | | | |
| | | | |
| Aerospace & Defense: 5.37% | | | | | | | | | | | | |
Curtiss-Wright Corporation | | | | | | | | | | | 165,000 | | | | 21,346,050 | |
Huntington Ingalls Industries Incorporated | | | | | | | | | | | 65,000 | | | | 13,766,350 | |
Wells Fargo Diversified Capital Builder Fund | 11
Portfolio of investments—September 30, 2019
| | | | | | | | | | | | | | | | |
| | | | | | | | | Shares | | | Value | |
| | | | |
| Aerospace & Defense (continued) | | | | | | | | | | | | |
L3Harris Technologies Incorporated | | | | | | | | | | | 50,000 | | | $ | 10,432,000 | |
Lockheed Martin Corporation | | | | | | | | | | | 20,000 | | | | 7,801,200 | |
Raytheon Company | | | | | | | | | | | 30,000 | | | | 5,885,700 | |
| | | | |
| | | | | | | | | | | | | | | 59,231,300 | |
| | | | | | | | | | | | | | | | |
| | | | |
| Building Products: 0.21% | | | | | | | | | | | | |
Apogee Enterprises Incorporated | | | | | | | | | | | 60,000 | | | | 2,339,400 | |
| | | | | | | | | | | | | | | | |
| | | | |
| Electrical Equipment: 1.37% | | | | | | | | | | | | |
AMETEK Incorporated | | | | | | | | | | | 165,000 | | | | 15,150,300 | |
| | | | | | | | | | | | | | | | |
| | | | |
| Industrial Conglomerates: 0.65% | | | | | | | | | | | | |
Honeywell International Incorporated | | | | | | | | | | | 15,000 | | | | 2,538,000 | |
Roper Technologies Incorporated | | | | | | | | | | | 13,000 | | | | 4,635,800 | |
| | | | |
| | | | | | | | | | | | | | | 7,173,800 | |
| | | | | | | | | | | | | | | | |
| | | | |
| Machinery: 4.55% | | | | | | | | | | | | |
Crane Company | | | | | | | | | | | 100,000 | | | | 8,063,000 | |
IDEX Corporation | | | | | | | | | | | 120,000 | | | | 19,665,600 | |
John Bean Technologies Corporation | | | | | | | | | | | 180,000 | | | | 17,897,400 | |
Oshkosh Corporation | | | | | | | | | | | 60,000 | | | | 4,548,000 | |
| | | | |
| | | | | | | | | | | | | | | 50,174,000 | |
| | | | | | | | | | | | | | | | |
| | | | |
Information Technology: 30.97% | | | | | | | | | | | | | | | | |
| | | | |
| Communications Equipment: 1.26% | | | | | | | | | | | | |
Cisco Systems Incorporated | | | | | | | | | | | 280,000 | | | | 13,834,800 | |
| | | | | | | | | | | | | | | | |
| | | | |
| Electronic Equipment, Instruments & Components: 6.91% | | | | | | | | | | | | |
Amphenol Corporation Class A | | | | | | | | | | | 370,000 | | | | 35,705,000 | |
Corning Incorporated | | | | | | | | | | | 670,000 | | | | 19,108,400 | |
FLIR Systems Incorporated | | | | | | | | | | | 345,000 | | | | 18,143,550 | |
MTS Systems Corporation | | | | | | | | | | | 60,000 | | | | 3,315,000 | |
| | | | |
| | | | | | | | | | | | | | | 76,271,950 | |
| | | | | | | | | | | | | | | | |
| | | | |
| IT Services: 5.38% | | | | | | | | | | | | |
Akamai Technologies Incorporated † | | | | | | | | | | | 340,000 | | | | 31,069,200 | |
Leidos Holdings Incorporated | | | | | | | | | | | 330,000 | | | | 28,340,400 | |
| | | | |
| | | | | | | | | | | | | | | 59,409,600 | |
| | | | | | | | | | | | | | | | |
| | | | |
| Semiconductors & Semiconductor Equipment: 8.90% | | | | | | | | | | | | |
Advanced Micro Devices Incorporated † | | | | | | | | | | | 610,000 | | | | 17,683,900 | |
Broadcom Incorporated | | | | | | | | | | | 150,000 | | | | 41,410,500 | |
Microchip Technology Incorporated | | | | | | | | | | | 235,000 | | | | 21,833,850 | |
Micron Technology Incorporated † | | | | | | | | | | | 35,000 | | | | 1,499,750 | |
Texas Instruments Incorporated | | | | | | | | | | | 70,000 | | | | 9,046,800 | |
Xilinx Incorporated | | | | | | | | | | | 70,000 | | | | 6,713,000 | |
| | | | |
| | | | | | | | | | | | | | | 98,187,800 | |
| | | | | | | | | | | | | | | | |
| | | | |
| Software: 7.71% | | | | | | | | | | | | |
Adobe Systems Incorporated † | | | | | | | | | | | 115,000 | | | | 31,768,750 | |
ANSYS Incorporated † | | | | | | | | | | | 45,000 | | | | 9,961,200 | |
Nutanix Incorporated Class A † | | | | | | | | | | | 50,000 | | | | 1,312,500 | |
Palo Alto Networks Incorporated † | | | | | | | | | | | 55,000 | | | | 11,210,650 | |
Salesforce.com Incorporated † | | | | | | | | | | | 80,000 | | | | 11,875,200 | |
12 | Wells Fargo Diversified Capital Builder Fund
Portfolio of investments—September 30, 2019
| | | | | | | | | | | | | | | | |
| | | | | | | | | Shares | | | Value | |
| | | | |
| Software (continued) | | | | | | | | | | | | |
ServiceNow Incorporated † | | | | | | | | | | | 37,000 | | | $ | 9,392,450 | |
Synopsys Incorporated † | | | | | | | | | | | 70,000 | | | | 9,607,500 | |
| | | | |
| | | | | | | | | | | | | | | 85,128,250 | |
| | | | | | | | | | | | | | | | |
| | | | |
| Technology Hardware, Storage & Peripherals: 0.81% | | | | | | | | | | | | |
Pure Storage Incorporated Class A † | | | | | | | | | | | 175,000 | | | | 2,964,500 | |
Western Digital Corporation | | | | | | | | | | | 100,000 | | | | 5,964,000 | |
| | | | |
| | | | | | | | | | | | | | | 8,928,500 | |
| | | | | | | | | | | | | | | | |
| | | | |
Materials: 7.99% | | | | | | | | | | | | | | | | |
| | | | |
| Chemicals: 6.26% | | | | | | | | | | | | |
Celanese Corporation Series A | | | | | | | | | | | 75,000 | | | | 9,171,750 | |
Eastman Chemical Company | | | | | | | | | | | 80,000 | | | | 5,906,400 | |
Huntsman Corporation | | | | | | | | | | | 630,000 | | | | 14,653,800 | |
LyondellBasell Industries NV Class A | | | | | | | | | | | 280,000 | | | | 25,051,600 | |
Olin Corporation | | | | | | | | | | | 60,000 | | | | 1,123,200 | |
The Sherwin-Williams Company | | | | | | | | | | | 17,000 | | | | 9,347,790 | |
Tronox Holdings plc Class A | | | | | | | | | | | 150,000 | | | | 1,245,000 | |
Westlake Chemical Corporation | | | | | | | | | | | 40,000 | | | | 2,620,800 | |
| | | | |
| | | | | | | | | | | | | | | 69,120,340 | |
| | | | | | | | | | | | | | | | |
| | | | |
| Containers & Packaging: 1.73% | | | | | | | | | | | | |
AptarGroup Incorporated | | | | | | | | | | | 81,500 | | | | 9,653,675 | |
Berry Global Group Incorporated † | | | | | | | | | | | 240,000 | | | | 9,424,800 | |
| | | | |
| | | | | | | | | | | | | | | 19,078,475 | |
| | | | | | | | | | | | | | | | |
| | | | |
Real Estate: 2.38% | | | | | | | | | | | | | | | | |
| | | | |
| Equity REITs: 2.38% | | | | | | | | | | | | |
Crown Castle International Corporation | | | | | | | | | | | 150,000 | | | | 20,851,500 | |
Iron Mountain Incorporated | | | | | | | | | | | 50,000 | | | | 1,619,500 | |
Saul Centers Incorporated | | | | | | | | | | | 70,000 | | | | 3,815,700 | |
| | | | |
| | | | | | | | | | | | | | | 26,286,700 | |
| | | | | | | | | | | | | | | | |
| | | | |
Utilities: 17.72% | | | | | | | | | | | | | | | | |
| | | | |
| Electric Utilities: 4.76% | | | | | | | | | | | | |
American Electric Power Company Incorporated | | | | | | | | | | | 390,000 | | | | 36,539,100 | |
Pinnacle West Capital Corporation | | | | | | | | | | | 165,000 | | | | 16,016,550 | |
| | | | |
| | | | | | | | | | | | | | | 52,555,650 | |
| | | | | | | | | | | | | | | | |
| | | | |
| Gas Utilities: 2.99% | | | | | | | | | | | | |
Atmos Energy Corporation | | | | | | | | | | | 290,000 | | | | 33,028,100 | |
| | | | | | | | | | | | | | | | |
| | | | |
| Independent Power & Renewable Electricity Producers: 3.66% | | | | | | | | | | | | |
Vistra Energy Corporation | | | | | | | | | | | 1,510,000 | | | | 40,362,300 | |
| | | | | | | | | | | | | | | | |
| | | | |
| Multi-Utilities: 6.31% | | | | | | | | | | | | |
CMS Energy Corporation | | | | | | | | | | | 530,000 | | | | 33,893,500 | |
DTE Energy Company | | | | | | | | | | | 260,000 | | | | 34,569,600 | |
NiSource Incorporated | | | | | | | | | | | 40,000 | | | | 1,196,800 | |
| | | | |
| | | | | | | | | | | | | | | 69,659,900 | |
| | | | | | | | | | | | | | | | |
| | | | |
Total Common Stocks (Cost $766,056,388) | | | | | | | | | | | | | | | 927,538,928 | |
| | | | | | | | | | | | | | | | |
Wells Fargo Diversified Capital Builder Fund | 13
Portfolio of investments—September 30, 2019
| | | | | | | | | | | | | | | | |
| | | | | |
| | | | | | | | | | | | | | | | |
| | | Interest
rate | | | Maturity
date | | | Principal | | | Value | |
| Corporate Bonds and Notes: 13.17% | | | | | | | | | | | | | | | | |
| | | | |
Communication Services: 0.23% | | | | | | | | | | | | | | | | |
| | | | |
| Media: 0.23% | | | | | | | | | | | | |
McGraw-Hill Global Education Holdings LLC 144A« | | | 7.88 | % | | | 5-15-2024 | | | $ | 3,000,000 | | | $ | 2,595,000 | |
| | | | | | | | | | | | | | | | |
| | | | |
Consumer Discretionary: 0.44% | | | | | | | | | | | | | | | | |
| | | | |
| Hotels, Restaurants & Leisure: 0.19% | | | | | | | | | | | | |
Speedway Motorsports Incorporated | | | 5.13 | | | | 2-1-2023 | | | | 2,000,000 | | | | 2,030,000 | |
| | | | | | | | | | | | | | | | |
| | | | |
| Household Durables: 0.25% | | | | | | | | | | | | |
Installed Building Company 144A | | | 5.75 | | | | 2-1-2028 | | | | 2,700,000 | | | | 2,784,374 | |
| | | | | | | | | | | | | | | | |
| | | | |
Consumer Staples: 0.19% | | | | | | | | | | | | | | | | |
| | | | |
| Food Products: 0.19% | | | | | | | | | | | | |
Lamb Weston Holdings Incorporated 144A | | | 4.88 | | | | 11-1-2026 | | | | 2,000,000 | | | | 2,095,000 | |
| | | | | | | | | | | | | | | | |
| | | | |
Health Care: 3.38% | | | | | | | | | | | | | | | | |
| | | | |
| Health Care Equipment & Supplies: 0.68% | | | | | | | | | | | | |
Teleflex Incorporated | | | 4.88 | | | | 6-1-2026 | | | | 7,175,000 | | | | 7,479,938 | |
| | | | | | | | | | | | | | | | |
| | | | |
| Health Care Providers & Services: 2.61% | | | | | | | | | | | | |
AMN Healthcare Incorporated 144A | | | 5.13 | | | | 10-1-2024 | | | | 13,512,000 | | | | 14,018,700 | |
DaVita Incorporated | | | 5.00 | | | | 5-1-2025 | | | | 7,000,000 | | | | 6,973,750 | |
DaVita Incorporated | | | 5.13 | | | | 7-15-2024 | | | | 1,000,000 | | | | 1,016,250 | |
West Street Merger Subordinate Bond Incorporated 144A | | | 6.38 | | | | 9-1-2025 | | | | 7,400,000 | | | | 6,808,000 | |
| | | | |
| | | | | | | | | | | | | | | 28,816,700 | |
| | | | | | | | | | | | | | | | |
| | | | |
| Pharmaceuticals: 0.09% | | | | | | | | | | | | |
Catalent Pharma Solutions Incorporated 144A | | | 4.88 | | | | 1-15-2026 | | | | 1,000,000 | | | | 1,028,750 | |
| | | | | | | | | | | | | | | | |
| | | | |
Industrials: 3.57% | | | | | | | | | | | | | | | | |
| | | | |
| Aerospace & Defense: 0.81% | | | | | | | | | | | | |
TransDigm Group Incorporated | | | 6.38 | | | | 6-15-2026 | | | | 7,000,000 | | | | 7,358,750 | |
TransDigm Group Incorporated | | | 6.50 | | | | 5-15-2025 | | | | 1,500,000 | | | | 1,556,250 | |
| | | | |
| | | | | | | | | | | | | | | 8,915,000 | |
| | | | | | | | | | | | | | | | |
| | | | |
| Commercial Services & Supplies: 0.14% | | | | | | | | | | | | |
ACCO Brands Corporation 144A | | | 5.25 | | | | 12-15-2024 | | | | 1,500,000 | | | | 1,552,500 | |
| | | | | | | | | | | | | | | | |
| | | | |
| Electrical Equipment: 1.25% | | | | | | | | | | | | |
Resideo Funding Incorporated 144A | | | 6.13 | | | | 11-1-2026 | | | | 13,112,000 | | | | 13,833,160 | |
| | | | | | | | | | | | | | | | |
| | | | |
| Machinery: 1.00% | | | | | | | | | | | | |
SPX FLOW Incorporated 144A | | | 5.88 | | | | 8-15-2026 | | | | 10,500,000 | | | | 10,972,500 | |
| | | | | | | | | | | | | | | | |
| | | | |
| Trading Companies & Distributors: 0.37% | | | | | | | | | | | | |
WESCO Distribution Incorporated | | | 5.38 | | | | 6-15-2024 | | | | 4,000,000 | | | | 4,130,000 | |
| | | | | | | | | | | | | | | | |
| | | | |
Information Technology: 3.41% | | | | | | | | | | | | | | | | |
| | | | |
| Communications Equipment: 0.51% | | | | | | | | | | | | |
CommScope Incorporated 144A | | | 5.50 | | | | 6-15-2024 | | | | 6,000,000 | | | | 5,638,080 | |
| | | | | | | | | | | | | | | | |
14 | Wells Fargo Diversified Capital Builder Fund
Portfolio of investments—September 30, 2019
| | | | | | | | | | | | | | | | |
| | | Interest
rate | | | Maturity
date | | | Principal | | | Value | |
| Electronic Equipment, Instruments & Components: 1.50% | | | | | | | | | | | | |
MTS Systems Corporation 144A | | | 5.75 | % | | | 8-15-2027 | | | $ | 3,000,000 | | | $ | 3,120,000 | |
TTM Technologies Incorporated 144A« | | | 5.63 | | | | 10-1-2025 | | | | 13,505,000 | | | | 13,505,000 | |
| | | | |
| | | | | | | | | | | | | | | 16,625,000 | |
| | | | | | | | | | | | | | | | |
| | | | |
| IT Services: 0.93% | | | | | | | | | | | | |
Gartner Incorporated 144A | | | 5.13 | | | | 4-1-2025 | | | | 9,779,000 | | | | 10,231,279 | |
| | | | | | | | | | | | | | | | |
| | | | |
| Software: 0.28% | | | | | | | | | | | | |
Nuance Communications Company | | | 6.00 | | | | 7-1-2024 | | | | 3,000,000 | | | | 3,135,000 | |
| | | | | | | | | | | | | | | | |
| | | | |
| Technology Hardware, Storage & Peripherals: 0.19% | | | | | | | | | | | | |
Western Digital Corporation | | | 4.75 | | | | 2-15-2026 | | | | 2,000,000 | | | | 2,057,500 | |
| | | | | | | | | | | | | | | | |
| | | | |
Materials: 1.76% | | | | | | | | | | | | | | | | |
| | | | |
| Chemicals: 1.58% | | | | | | | | | | | | |
Koppers Incorporated 144A | | | 6.00 | | | | 2-15-2025 | | | | 8,190,000 | | | | 8,195,160 | |
Olin Corporation | | | 5.50 | | | | 8-15-2022 | | | | 1,000,000 | | | | 1,055,000 | |
Platform Specialty Products Corporation 144A | | | 5.88 | | | | 12-1-2025 | | | | 3,000,000 | | | | 3,139,800 | |
Rayonier Advanced Materials Products Incorporated 144A | | | 5.50 | | | | 6-1-2024 | | | | 4,130,000 | | | | 3,017,481 | |
Valvoline Incorporated | | | 4.38 | | | | 8-15-2025 | | | | 2,000,000 | | | | 2,035,000 | |
| | | | |
| | | | | | | | | | | | | | | 17,442,441 | |
| | | | | | | | | | | | | | | | |
| | | | |
| Containers & Packaging: 0.18% | | | | | | | | | | | | |
Berry Global Incorporated 144A | | | 4.50 | | | | 2-15-2026 | | | | 2,000,000 | | | | 1,972,500 | |
| | | | | | | | | | | | | | | | |
| | | | |
Real Estate: 0.19% | | | | | | | | | | | | | | | | |
| | | | |
| Equity REITs: 0.19% | | | | | | | | | | | | |
Iron Mountain Incorporated 144A | | | 5.38 | | | | 6-1-2026 | | | | 2,000,000 | | | | 2,060,000 | |
| | | | | | | | | | | | | | | | |
| | | | |
Total Corporate Bonds and Notes (Cost $143,012,081) | | | | | | | | | | | | | | | 145,394,722 | |
| | | | | | | | | | | | | | | | |
| | | | |
| Yankee Corporate Bonds and Notes: 1.93% | | | | | | | | | | | | |
| | | | |
Financials: 0.43% | | | | | | | | | | | | | | | | |
| | | | |
| Diversified Financial Services: 0.43% | | | | | | | | | | | | |
Tronox Finance plc 144A | | | 5.75 | | | | 10-1-2025 | | | | 5,000,000 | | | | 4,728,750 | |
| | | | | | | | | | | | | | | | |
| | | | |
Information Technology: 1.50% | | | | | | | | | | | | | | | | |
| | | | |
| Technology Hardware, Storage & Peripherals: 1.50% | | | | | | | | | | | | |
Seagate HDD | | | 4.75 | | | | 6-1-2023 | | | | 9,500,000 | | | | 9,937,684 | |
Seagate HDD | | | 4.88 | | | | 6-1-2027 | | | | 6,396,000 | | | | 6,604,561 | |
| | | | |
| | | | | | | | | | | | | | | 16,542,245 | |
| | | | | | | | | | | | | | | | |
| | | | |
Total Yankee Corporate Bonds and Notes (Cost $20,013,880) | | | | | | | | | | | | | | | 21,270,995 | |
| | | | | | | | | | | | | | | | |
| | | | |
| | | | | | | | | | | | | | | | |
| | | Yield | | | | | | Shares | | | | |
| Short-Term Investments: 1.04% | | | | | | | | | | | | |
| | | | |
| Investment Companies: 1.04% | | | | | | | | | | | | |
Securities Lending Cash Investments LLC (l)(r)(u) | | | 2.11 | | | | | | | | 5,714,900 | | | | 5,715,472 | |
Wells Fargo Government Money Market Fund Select Class (l)(u) | | | 1.88 | | | | | | | | 5,712,610 | | | | 5,712,610 | |
| | | | |
Total Short-Term Investments (Cost $11,428,082) | | | | | | | | | | | | | | | 11,428,082 | |
| | | | | | | | | | | | | | | | |
| | | | | | | | |
| Total investments in securities (Cost $940,510,431) | | | 100.18 | % | | | 1,105,632,727 | |
| | |
Other assets and liabilities, net | | | (0.18 | ) | | | (2,003,789 | ) |
| | | | | | | | |
| Total net assets | | | 100.00 | % | | $ | 1,103,628,938 | |
| | | | | | | | |
Wells Fargo Diversified Capital Builder Fund | 15
Portfolio of investments—September 30, 2019
| « | All or a portion of this security is on loan. |
| † | Non-income-earning security |
| 144A | The security may be resold in transactions exempt from registration, normally to qualified institutional buyers, pursuant to Rule 144A under the Securities Act of 1933. |
| (l) | The issuer of the security is an affiliated person of the Fund as defined in the Investment Company Act of 1940. |
| (r) | The investment is anon-registered investment company purchased with cash collateral received from securities on loan. |
| (u) | The rate represents the7-day annualized yield at period end. |
Abbreviations:
| ADR | American depositary receipt |
| REIT | Real estate investment trust |
Investments in Affiliates
An affiliated investment is an investment in which the Fund owns at least 5% of the outstanding voting shares of the issuer or as a result of other relationships, such as the Fund and the issuer having the same investment manager. Transactions with issuers that were either affiliated persons of the Fund at the beginning of the period or the end of the period were as follows:
| | | | | | | | | | | | | | | | | | | | | | | | | | | | | | | | | | | | |
| | | Shares,
beginning of
period | | | Shares
purchased | | | Shares
sold | | | Shares,
end of
period | | | Net
realized
gains
(losses) | | | Net
change in
unrealized
gains
(losses) | | | Income
from
affiliated
securities | | | Value,
end of
period | | | % of
net
assets | |
Short-Term Investments | | | | | | | | | | | | | | | | | | | | | | | | | | | | | | | | | | | | |
Investment Companies | | | | | | | | | | | | | | | | | | | | | | | | | | | | | | | | | | | | |
Securities Lending Cash Investments LLC | | | 14,415,390 | | | | 146,589,697 | | | | 155,290,187 | | | | 5,714,900 | | | $ | (670 | ) | | $ | 0 | | | $ | 390,629 | # | | $ | 5,715,472 | | | | | |
Wells Fargo Government Money Market Fund Select Class | | | 22,600,022 | | | | 416,436,441 | | | | 433,323,853 | | | | 5,712,610 | | | | 0 | | | | 0 | | | | 353,260 | | | | 5,712,610 | | | | | |
| | | | | | | | | | | | | | | | | | | | | | | | | | | | | | | | | | | | |
| | | | | | | | | |
| | | | | | | | | | | | | | | | | | $ | (670 | ) | | $ | 0 | | | $ | 743,889 | | | $ | 11,428,082 | | | | 1.04 | % |
| | | | | | | | | | | | | | | | | | | | | | | | | | | | | | | | | | | | |
| # | Amount shown represents income before fees and rebates |
The accompanying notes are an integral part of these financial statements.
16 | Wells Fargo Diversified Capital Builder Fund
Statement of assets and liabilities—September 30, 2019
| | | | |
| | | | |
| |
Assets | | | | |
Investments in unaffiliated securities, (including $5,528,453 of securities on loan) at value (cost $929,082,349) | | $ | 1,094,204,645 | |
Investments in affiliated securities, at value (cost $11,428,082) | | | 11,428,082 | |
Receivable for Fund shares sold | | | 1,405,406 | |
Receivable for dividends and interest | | | 3,935,775 | |
Receivable for securities lending income, net | | | 3,434 | |
Prepaid expenses and other assets | | | 175,321 | |
| | | | |
Total assets | | | 1,111,152,663 | |
| | | | |
| |
Liabilities | | | | |
Payable upon receipt of securities loaned | | | 5,716,509 | |
Payable for Fund shares redeemed | | | 829,750 | |
Management fee payable | | | 557,828 | |
Administration fees payable | | | 165,472 | |
Distribution fee payable | | | 72,181 | |
Trustees’ fees and expenses payable | | | 2,246 | |
Accrued expenses and other liabilities | | | 179,739 | |
| | | | |
Total liabilities | | | 7,523,725 | |
| | | | |
Total net assets | | $ | 1,103,628,938 | |
| | | | |
| |
Net assets consist of | | | | |
Paid-in capital | | $ | 890,051,184 | |
Total distributable earnings | | | 213,577,754 | |
| | | | |
Total net assets | | $ | 1,103,628,938 | |
| | | | |
| |
Computation of net asset value and offering price per share | | | | |
Net assets – Class A | | $ | 616,345,852 | |
Shares outstanding – Class A1 | | | 57,528,842 | |
Net asset value per share – Class A | | | $10.71 | |
Maximum offering price per share – Class A2 | | | $11.36 | |
Net assets – Class C | | $ | 118,296,693 | |
Shares outstanding – Class C1 | | | 11,066,066 | |
Net asset value per share – Class C | | | $10.69 | |
Net assets – Administrator Class | | $ | 9,707,918 | |
Shares outstanding – Administrator Class1 | | | 905,183 | |
Net asset value per share – Administrator Class | | | $10.72 | |
Net assets – Institutional Class | | $ | 359,278,475 | |
Shares outstanding – Institutional Class1 | | | 33,771,722 | |
Net asset value per share – Institutional Class | | | $10.64 | |
| 1 | The Fund has an unlimited number of authorized shares. |
| 2 | Maximum offering price is computed as 100/94.25 of net asset value. On investments of $50,000 or more, the offering price is reduced. |
The accompanying notes are an integral part of these financial statements.
Wells Fargo Diversified Capital Builder Fund | 17
Statement of operations—year ended September 30, 2019
| | | | |
| | | | |
| |
Investment income | | | | |
Dividends (net of foreign withholding taxes of $15,223) | | $ | 14,061,326 | |
Interest | | | 11,364,415 | |
Income from affiliated securities | | | 405,545 | |
| | | | |
Total investment income | | | 25,831,286 | |
| | | | |
| |
Expenses | | | | |
Management fee | | | 6,415,796 | |
Administration fees | |
Class A | | | 1,203,693 | |
Class C | | | 241,778 | |
Administrator Class | | | 14,593 | |
Institutional Class | | | 431,848 | |
Shareholder servicing fees | |
Class A | | | 1,432,968 | |
Class C | | | 287,831 | |
Administrator Class | | | 28,063 | |
Distribution fee | |
Class C | | | 863,471 | |
Custody and accounting fees | | | 49,001 | |
Professional fees | | | 46,111 | |
Registration fees | | | 104,733 | |
Shareholder report expenses | | | 104,733 | |
Trustees’ fees and expenses | | | 21,652 | |
Other fees and expenses | | | 33,789 | |
| | | | |
Total expenses | | | 11,280,060 | |
Less: Fee waivers and/or expense reimbursements | | | | |
Administrator Class | | | (101 | ) |
Institutional Class | | | (23,260 | ) |
| | | | |
Net expenses | | | 11,256,699 | |
| | | | |
Net investment income | | | 14,574,587 | |
| | | | |
| |
Realized and unrealized gains (losses) on investments | | | | |
Net realized gains (losses) on | | | | |
Unaffiliated securities | | | 53,802,578 | |
Affiliated securities | | | (670 | ) |
| | | | |
Net realized gains on investments | | | 53,801,908 | |
Net change in unrealized gains (losses) on investments | | | (8,891,274 | ) |
| | | | |
Net realized and unrealized gains (losses) on investments | | | 44,910,634 | |
| | | | |
Net increase in net assets resulting from operations | | $ | 59,485,221 | |
| | | | |
The accompanying notes are an integral part of these financial statements.
18 | Wells Fargo Diversified Capital Builder Fund
Statement of changes in net assets
| | | | | | | | | | | | | | | | |
| | | Year ended
September 30, 2019 | | | Year ended
September 30, 2018 | |
| | | | |
Operations | | | | | | | | | | | | | | | | |
Net investment income | | | | | | $ | 14,574,587 | | | | | | | $ | 9,550,632 | |
Net realized gains on investments | | | | | | | 53,801,908 | | | | | | | | 45,547,043 | |
Net change in unrealized gains (losses) on investments | | | | | | | (8,891,274 | ) | | | | | | | 53,496,076 | |
| | | | |
Net increase in net assets resulting from operations | | | | | | | 59,485,221 | | | | | | | | 108,593,751 | |
| | | | |
| | | | |
Distributions to shareholders from net investment income and net realized gains | | | | | | | | | | | | | | | | |
Class A | | | | | | | (36,253,338 | ) | | | | | | | (31,088,631 | ) |
Class C | | | | | | | (7,460,798 | ) | | | | | | | (5,826,986 | ) |
Administrator Class | | | | | | | (764,433 | ) | | | | | | | (638,260 | ) |
Institutional Class | | | | | | | (21,977,654 | ) | | | | | | | (16,658,344 | ) |
| | | | |
Total distributions to shareholders | | | | | | | (66,456,223 | ) | | | | | | | (54,212,221 | ) |
| | | | |
| | | | |
Capital share transactions | | | Shares | | | | | | | | Shares | | | | | |
Proceeds from shares sold | | | | | | | | | | | | | | | | |
Class A | | | 9,391,056 | | | | 93,260,195 | | | | 4,168,569 | | | | 43,865,273 | |
Class C | | | 4,595,019 | | | | 46,061,402 | | | | 3,054,283 | | | | 32,032,658 | |
Administrator Class | | | 227,726 | | | | 2,281,752 | | | | 507,748 | | | | 5,354,505 | |
Institutional Class | | | 15,448,752 | | | | 154,786,786 | | | | 10,093,186 | | | | 106,245,129 | |
| | | | |
| | | | | | | 296,390,135 | | | | | | | | 187,497,565 | |
| | | | |
Reinvestment of distributions | | | | | | | | | | | | | | | | |
Class A | | | 3,667,392 | | | | 34,796,863 | | | | 2,909,042 | | | | 29,709,824 | |
Class C | | | 774,676 | | | | 7,255,587 | | | | 555,563 | | | | 5,639,821 | |
Administrator Class | | | 79,989 | | | | 758,159 | | | | 60,161 | | | | 615,499 | |
Institutional Class | | | 2,124,090 | | | | 20,080,474 | | | | 1,566,794 | | | | 15,933,541 | |
| | | | |
| | | | | | | 62,891,083 | | | | | | | | 51,898,685 | |
| | | | |
Payment for shares redeemed | | | | | | | | | | | | | | | | |
Class A | | | (8,342,798 | ) | | | (83,876,599 | ) | | | (7,765,843 | ) | | | (81,546,998 | ) |
Class C | | | (6,420,901 | ) | | | (63,323,374 | ) | | | (2,906,268 | ) | | | (30,438,895 | ) |
Administrator Class | | | (671,418 | ) | | | (7,048,173 | ) | | | (290,129 | ) | | | (3,037,359 | ) |
Institutional Class | | | (13,982,283 | ) | | | (140,897,557 | ) | | | (7,121,216 | ) | | | (73,887,823 | ) |
| | | | |
| | | | | | | (295,145,703 | ) | | | | | | | (188,911,075 | ) |
| | | | |
Net increase in net assets resulting from capital share transactions | | | | | | | 64,135,515 | | | | | | | | 50,485,175 | |
| | | | |
Total increase in net assets | | | | | | | 57,164,513 | | | | | | | | 104,866,705 | |
| | | | |
| | | | |
Net assets | | | | | | | | | | | | | | | | |
Beginning of period | | | | | | | 1,046,464,425 | | | | | | | | 941,597,720 | |
| | | | |
End of period | | | | | | $ | 1,103,628,938 | | | | | | | $ | 1,046,464,425 | |
| | | | |
The accompanying notes are an integral part of these financial statements.
Wells Fargo Diversified Capital Builder Fund | 19
Financial highlights
(For a share outstanding throughout each period)
| | | | | | | | | | | | | | | | | | | | |
| | | Year ended September 30 | |
| CLASS A | | 2019 | | | 2018 | | | 2017 | | | 2016 | | | 2015 | |
Net asset value, beginning of period | | | $10.88 | | | | $10.30 | | | | $9.96 | | | | $9.12 | | | | $9.31 | |
Net investment income | | | 0.14 | | | | 0.10 | | | | 0.14 | 1 | | | 0.17 | | | | 0.11 | |
Net realized and unrealized gains (losses) on investments | | | 0.37 | | | | 1.06 | | | | 1.12 | | | | 1.71 | | | | (0.20 | ) |
| | | | | | | | | | | | | | | | | | | | |
Total from investment operations | | | 0.51 | | | | 1.16 | | | | 1.26 | | | | 1.88 | | | | (0.09 | ) |
Distributions to shareholders from | | | | | | | | | | | | | | | | | | | | |
Net investment income | | | (0.14 | ) | | | (0.09 | ) | | | (0.14 | ) | | | (0.15 | ) | | | (0.10 | ) |
Net realized gains | | | (0.54 | ) | | | (0.49 | ) | | | (0.78 | ) | | | (0.89 | ) | | | 0.00 | |
| | | | | | | | | | | | | | | | | | | | |
Total distributions to shareholders | | | (0.68 | ) | | | (0.58 | ) | | | (0.92 | ) | | | (1.04 | ) | | | (0.10 | ) |
Net asset value, end of period | | | $10.71 | | | | $10.88 | | | | $10.30 | | | | $9.96 | | | | $9.12 | |
Total return2 | | | 5.60 | % | | | 11.72 | % | | | 13.62 | % | | | 22.85 | % | | | (1.05 | )% |
Ratios to average net assets (annualized) | | | | | | | | | | | | | | | | | | | | |
Gross expenses | | | 1.12 | % | | | 1.11 | % | | | 1.12 | % | | | 1.14 | % | | | 1.19 | % |
Net expenses | | | 1.12 | % | | | 1.11 | % | | | 1.12 | % | | | 1.14 | % | | | 1.19 | % |
Net investment income | | | 1.38 | % | | | 0.96 | % | | | 1.43 | % | | | 1.77 | % | | | 1.17 | % |
Supplemental data | | | | | | | | | | | | | | | | | | | | |
Portfolio turnover rate | | | 61 | % | | | 31 | % | | | 54 | % | | | 73 | % | | | 69 | % |
Net assets, end of period (000s omitted) | | | $616,346 | | | | $574,760 | | | | $551,272 | | | | $467,503 | | | | $402,303 | |
| 1 | Calculated based upon average shares outstanding |
| 2 | Total return calculations do not include any sales charges. |
The accompanying notes are an integral part of these financial statements.
20 | Wells Fargo Diversified Capital Builder Fund
Financial highlights
(For a share outstanding throughout each period)
| | | | | | | | | | | | | | | | | | | | |
| | | Year ended September 30 | |
| CLASS C | | 2019 | | | 2018 | | | 2017 | | | 2016 | | | 2015 | |
Net asset value, beginning of period | | | $10.86 | | | | $10.28 | | | | $9.96 | | | | $9.12 | | | | $9.32 | |
Net investment income | | | 0.06 | | | | 0.02 | | | | 0.08 | | | | 0.10 | | | | 0.05 | |
Net realized and unrealized gains (losses) on investments | | | 0.37 | | | | 1.06 | | | | 1.11 | | | | 1.72 | | | | (0.22 | ) |
| | | | | | | | | | | | | | | | | | | | |
Total from investment operations | | | 0.43 | | | | 1.08 | | | | 1.19 | | | | 1.82 | | | | (0.17 | ) |
Distributions to shareholders from | | | | | | | | | | | | | | | | | | | | |
Net investment income | | | (0.06 | ) | | | (0.01 | ) | | | (0.09 | ) | | | (0.09 | ) | | | (0.03 | ) |
Net realized gains | | | (0.54 | ) | | | (0.49 | ) | | | (0.78 | ) | | | (0.89 | ) | | | 0.00 | |
| | | | | | | | | | | | | | | | | | | | |
Total distributions to shareholders | | | (0.60 | ) | | | (0.50 | ) | | | (0.87 | ) | | | (0.98 | ) | | | (0.03 | ) |
Net asset value, end of period | | | $10.69 | | | | $10.86 | | | | $10.28 | | | | $9.96 | | | | $9.12 | |
Total return1 | | | 4.81 | % | | | 10.88 | % | | | 12.85 | % | | | 21.96 | % | | | (1.88 | )% |
Ratios to average net assets (annualized) | | | | | | | | | | | | | | | | | | | | |
Gross expenses | | | 1.87 | % | | | 1.87 | % | | | 1.87 | % | | | 1.89 | % | | | 1.94 | % |
Net expenses | | | 1.87 | % | | | 1.87 | % | | | 1.87 | % | | | 1.89 | % | | | 1.94 | % |
Net investment income | | | 0.65 | % | | | 0.21 | % | | | 0.65 | % | | | 1.03 | % | | | 0.41 | % |
Supplemental data | | | | | | | | | | | | | | | | | | | | |
Portfolio turnover rate | | | 61 | % | | | 31 | % | | | 54 | % | | | 73 | % | | | 69 | % |
Net assets, end of period (000s omitted) | | | $118,297 | | | | $131,601 | | | | $117,346 | | | | $67,630 | | | | $53,373 | |
| 1 | Total return calculations do not include any sales charges. |
The accompanying notes are an integral part of these financial statements.
Wells Fargo Diversified Capital Builder Fund | 21
Financial highlights
(For a share outstanding throughout each period)
| | | | | | | | | | | | | | | | | | | | |
| | | Year ended September 30 | |
| ADMINISTRATOR CLASS | | 2019 | | | 2018 | | | 2017 | | | 2016 | | | 2015 | |
Net asset value, beginning of period | | | $10.89 | | | | $10.32 | | | | $9.97 | | | | $9.12 | | | | $9.32 | |
Net investment income | | | 0.15 | 1 | | | 0.11 | 1 | | | 0.16 | 1 | | | 0.18 | 1 | | | 0.14 | 1 |
Net realized and unrealized gains (losses) on investments | | | 0.37 | | | | 1.06 | | | | 1.12 | | | | 1.73 | | | | (0.22 | ) |
| | | | | | | | | | | | | | | | | | | | |
Total from investment operations | | | 0.52 | | | | 1.17 | | | | 1.28 | | | | 1.91 | | | | (0.08 | ) |
Distributions to shareholders from | | | | | | | | | | | | | | | | | | | | |
Net investment income | | | (0.15 | ) | | | (0.11 | ) | | | (0.15 | ) | | | (0.17 | ) | | | (0.12 | ) |
Net realized gains | | | (0.54 | ) | | | (0.49 | ) | | | (0.78 | ) | | | (0.89 | ) | | | 0.00 | |
| | | | | | | | | | | | | | | | | | | | |
Total distributions to shareholders | | | (0.69 | ) | | | (0.60 | ) | | | (0.93 | ) | | | (1.06 | ) | | | (0.12 | ) |
Net asset value, end of period | | | $10.72 | | | | $10.89 | | | | $10.32 | | | | $9.97 | | | | $9.12 | |
Total return | | | 5.67 | % | | | 11.73 | % | | | 13.75 | % | | | 23.14 | % | | | (0.92 | )% |
Ratios to average net assets (annualized) | | | | | | | | | | | | | | | | | | | | |
Gross expenses | | | 1.04 | % | | | 1.03 | % | | | 1.04 | % | | | 1.06 | % | | | 1.05 | % |
Net expenses | | | 1.04 | % | | | 1.03 | % | | | 1.04 | % | | | 1.03 | % | | | 0.95 | % |
Net investment income | | | 1.47 | % | | | 1.04 | % | | | 1.58 | % | | | 1.89 | % | | | 1.41 | % |
Supplemental data | | | | | | | | | | | | | | | | | | | | |
Portfolio turnover rate | | | 61 | % | | | 31 | % | | | 54 | % | | | 73 | % | | | 69 | % |
Net assets, end of period (000s omitted) | | | $9,708 | | | | $13,821 | | | | $10,225 | | | | $21,398 | | | | $7,898 | |
| 1 | Calculated based upon average shares outstanding |
The accompanying notes are an integral part of these financial statements.
22 | Wells Fargo Diversified Capital Builder Fund
Financial highlights
(For a share outstanding throughout each period)
| | | | | | | | | | | | | | | | | | | | |
| | | Year ended September 30 | |
| INSTITUTIONAL CLASS | | 2019 | | | 2018 | | | 2017 | | | 2016 | | | 2015 | |
Net asset value, beginning of period | | | $10.81 | | | | $10.25 | | | | $9.90 | | | | $9.07 | | | | $9.27 | |
Net investment income | | | 0.18 | | | | 0.14 | | | | 0.19 | | | | 0.20 | | | | 0.15 | |
Net realized and unrealized gains (losses) on investments | | | 0.36 | | | | 1.05 | | | | 1.11 | | | | 1.71 | | | | (0.21 | ) |
| | | | | | | | | | | | | | | | | | | | |
Total from investment operations | | | 0.54 | | | | 1.19 | | | | 1.30 | | | | 1.91 | | | | (0.06 | ) |
Distributions to shareholders from | | | | | | | | | | | | | | | | | | | | |
Net investment income | | | (0.17 | ) | | | (0.14 | ) | | | (0.17 | ) | | | (0.19 | ) | | | (0.14 | ) |
Net realized gains | | | (0.54 | ) | | | (0.49 | ) | | | (0.78 | ) | | | (0.89 | ) | | | 0.00 | |
| | | | | | | | | | | | | | | | | | | | |
Total distributions to shareholders | | | (0.71 | ) | | | (0.63 | ) | | | (0.95 | ) | | | (1.08 | ) | | | (0.14 | ) |
Net asset value, end of period | | | $10.64 | | | | $10.81 | | | | $10.25 | | | | $9.90 | | | | $9.07 | |
Total return | | | 5.98 | % | | | 12.04 | % | | | 14.11 | % | | | 23.28 | % | | | (0.75 | )% |
Ratios to average net assets (annualized) | | | | | | | | | | | | | | | | | | | | |
Gross expenses | | | 0.79 | % | | | 0.79 | % | | | 0.79 | % | | | 0.81 | % | | | 0.79 | % |
Net expenses | | | 0.78 | % | | | 0.78 | % | | | 0.78 | % | | | 0.78 | % | | | 0.77 | % |
Net investment income | | | 1.73 | % | | | 1.30 | % | | | 1.71 | % | | | 2.14 | % | | | 1.58 | % |
Supplemental data | | | | | | | | | | | | | | | | | | | | |
Portfolio turnover rate | | | 61 | % | | | 31 | % | | | 54 | % | | | 73 | % | | | 69 | % |
Net assets, end of period (000s omitted) | | | $359,278 | | | | $326,283 | | | | $262,754 | | | | $122,769 | | | | $97,251 | |
The accompanying notes are an integral part of these financial statements.
Wells Fargo Diversified Capital Builder Fund | 23
Notes to financial statements
1. ORGANIZATION
Wells Fargo Funds Trust (the “Trust”), a Delaware statutory trust organized on March 10, 1999, is anopen-end management investment company registered under the Investment Company Act of 1940, as amended (the “1940 Act”). As an investment company, the Trust follows the accounting and reporting guidance in Financial Accounting Standards Board (“FASB”)Accounting Standards Codification Topic 946, Financial Services – Investment Companies. These financial statements report on the Wells Fargo Diversified Capital Builder Fund (the “Fund”) which is a diversified series of the Trust.
2. SIGNIFICANT ACCOUNTING POLICIES
The following significant accounting policies, which are consistently followed in the preparation of the financial statements of the Fund, are in conformity with U.S. generally accepted accounting principles which require management to make estimates and assumptions that affect the reported amounts of assets and liabilities, disclosure of contingent assets and liabilities at the date of the financial statements, and the reported amounts of revenues and expenses during the reporting period. Actual results could differ from those estimates.
Securities valuation
All investments are valued each business day as of the close of regular trading on the New York Stock Exchange (generally 4 p.m. Eastern Time), although the Fund may deviate from this calculation time under unusual or unexpected circumstances.
Equity securities that are listed on a foreign or domestic exchange or market are valued at the official closing price or, if none, the last sales price. If no sale occurs on the principal exchange or market that day, a fair value price will be determined in accordance with the Fund’s Valuation Procedures.
Debt securities are valued at the evaluated bid price provided by an independent pricing service (e.g. taking into account various factors, including yields, maturities, or credit ratings) or, if a reliable price is not available, the quoted bid price from an independent broker-dealer.
Investments in registeredopen-end investment companies are valued at net asset value. Interests innon-registered investment companies that are redeemable at net asset value are fair valued normally at net asset value.
Investments which are not valued using any of the methods discussed above are valued at their fair value, as determined in good faith by the Board of Trustees of the Fund. The Board of Trustees has established a Valuation Committee comprised of the Trustees and has delegated to it the authority to take any actions regarding the valuation of portfolio securities that the Valuation Committee deems necessary or appropriate, including determining the fair value of portfolio securities, unless the determination has been delegated to the Wells Fargo Asset Management Pricing Committee at Wells Fargo Funds Management, LLC (“Funds Management”).The Board of Trustees retains the authority to make or ratify any valuation decisions or approve any changes to the Valuation Procedures as it deems appropriate. On a quarterly basis, the Board of Trustees receives reports on any valuation actions taken by the Valuation Committee or the Wells Fargo Asset Management Pricing Committee which may include items for ratification.
Securities lending
The Fund may lend its securities from time to time in order to earn additional income in the form of fees or interest on securities received as collateral or the investment of any cash received as collateral. When securities are on loan, the Fund receives interest or dividends on those securities. Cash collateral received in connection with its securities lending transactions is invested in Securities Lending Cash Investments, LLC (the “Securities Lending Fund”). Investments in Securities Lending Fund are valued at the evaluated bid price provided by an independent pricing service. Income earned from investment in the Securities Lending Fund (net of fees and rebates), if any, is included in income from affiliated securities on the Statement of Operations.
In a securities lending transaction, the net asset value of the Fund is affected by an increase or decrease in the value of the securities loaned and by an increase or decrease in the value of the instrument in which collateral is invested. The amount of securities lending activity undertaken by the Fund fluctuates from time to time. The Fund has the right under the lending agreement to recover the securities from the borrower on demand. In the event of default or bankruptcy by the borrower, the Fund may be prevented from recovering the loaned securities or gaining access to the collateral or may experience delays or costs in doing so. In such an event, the terms of the agreement allows the unaffiliated securities lending agent to use the collateral to purchase replacement securities on behalf of the Fund or pay the Fund the market value of the loaned securities. The Fund bears the risk of loss with respect to depreciation of its investment of the cash collateral.
Security transactions and income recognition
Securities transactions are recorded on a trade date basis. Realized gains or losses are recorded on the basis of identified cost.
24 | Wells Fargo Diversified Capital Builder Fund
Notes to financial statements
Dividend income is recognized on theex-dividend date. Dividend income is record net of foreign taxes withheld where recovery of such taxes is not assured.
Interest income is accrued daily and bond discounts are accreted and premiums are amortized daily. To the extent debt obligations are placed onnon-accrual status, any related interest income may be reduced by writing off interest receivables when the collection of all or a portion of interest has been determined to be doubtful based on consistently applied procedures and the fair value has decreased. If the issuer subsequently resumes interest payments or when the collectability of interest is reasonably assured, the debt obligation is removed fromnon-accrual status.
Distributions to shareholders
Distributions to shareholders are recorded on theex-dividend date and paid from net investment income quarterly and any net realized gains are paid at least annually. Such distributions are determined in accordance with income tax regulations and may differ from U.S. generally accepted accounting principles. Dividend sources are estimated at the time of declaration. The tax character of distributions is determined as of the Fund’s fiscal year end. Therefore, a portion of the Fund’s distributions made prior to the Fund’s fiscal year end may be categorized as a tax return of capital at year end.
Federal and other taxes
The Fund intends to continue to qualify as a regulated investment company by distributing substantially all of its investment company taxable income and any net realized capital gains (after reduction for capital loss carryforwards) sufficient to relieve it from all, or substantially all, federal income taxes. Accordingly, no provision for federal income taxes was required.
The Fund’s income and federal excise tax returns and all financial records supporting those returns for the prior three fiscal years are subject to examination by the federal and Delaware revenue authorities. Management has analyzed the Fund’s tax positions taken on federal, state, and foreign tax returns for all open tax years and does not believe that there are any uncertain tax positions that require recognition of a tax liability.
As of September 30, 2019, the aggregate cost of all investments for federal income tax purposes was $940,484,688 and the unrealized gains (losses) consisted of:
| | | | |
| |
Gross unrealized gains | | $ | 190,008,181 | |
| |
Gross unrealized losses | | | (24,860,142 | ) |
| |
Net unrealized gains | | $ | 165,148,039 | |
Reclassifications are made to the Fund’s capital accounts for permanent tax differences to reflect income and gains available for distribution (or available capital loss carryforwards) under federal income tax regulations. U.S. generally accepted accounting principles require that certain components of net assets be adjusted to reflect permanent differences between financial and tax reporting. These reclassifications have no effect on net assets or net asset values per share. At September 30, 2019, as a result of permanentbook-to-tax differences, the following reclassification adjustments were made on the Statement of Assets and Liabilities:
| | |
| Paid-in capital | | Total distributable earnings |
| |
| $(11,830) | | $11,830 |
Class allocations
The separate classes of shares offered by the Fund differ principally in applicable sales charges, distribution, shareholder servicing, and administration fees. Class specific expenses are charged directly to that share class. Investment income, common fund-level expenses, and realized and unrealized gains (losses) on investments are allocated daily to each class of shares based on the relative proportion of net assets of each class.
3. FAIR VALUATION MEASUREMENTS
Fair value measurements of investments are determined within a framework that has established a fair value hierarchy based upon the various data inputs utilized in determining the value of the Fund’s investments. The three-level hierarchy gives the highest priority to unadjusted quoted prices in active markets for identical assets or liabilities (Level 1) and the lowest priority to
Wells Fargo Diversified Capital Builder Fund | 25
Notes to financial statements
unobservable inputs (Level 3). The Fund’s investments are classified within the fair value hierarchy based on the lowest level of input that is significant to the fair value measurement. The inputs are summarized into three broad levels as follows:
| ∎ | | Level 1 – quoted prices in active markets for identical securities |
| ∎ | | Level 2 – other significant observable inputs (including quoted prices for similar securities, interest rates, prepayment speeds, credit risk, etc.) |
| ∎ | | Level 3 – significant unobservable inputs (including the Fund’s own assumptions in determining the fair value of investments) |
The inputs or methodologies used for valuing investments in securities are not necessarily an indication of the risk associated with investing in those securities.
The following is a summary of the inputs used in valuing the Fund’s assets and liabilities as of September 30, 2019:
| | | | | | | | | | | | | | | | |
| | | | |
| | | Quoted prices
(Level 1) | | | Other significant
observable inputs
(Level 2) | | | Significant
unobservable inputs (Level 3) | | | Total | |
| | | | |
Assets | | | | | | | | | | | | | | | | |
Investments in: | | | | | | | | | | | | | | | | |
| | | | |
Common stocks | | | | | | | | | | | | | | | | |
| | | | |
Communication services | | $ | 14,876,400 | | | $ | 0 | | | $ | 0 | | | $ | 14,876,400 | |
| | | | |
Consumer discretionary | | | 5,800,500 | | | | 0 | | | | 0 | | | | 5,800,500 | |
| | | | |
Consumer staples | | | 3,636,073 | | | | 0 | | | | 0 | | | | 3,636,073 | |
| | | | |
Energy | | | 12,307,750 | | | | 0 | | | | 0 | | | | 12,307,750 | |
| | | | |
Financials | | | 14,344,800 | | | | 0 | | | | 0 | | | | 14,344,800 | |
| | | | |
Health care | | | 90,652,240 | | | | 0 | | | | 0 | | | | 90,652,240 | |
| | | | |
Industrials | | | 134,068,800 | | | | 0 | | | | 0 | | | | 134,068,800 | |
| | | | |
Information technology | | | 341,760,900 | | | | 0 | | | | 0 | | | | 341,760,900 | |
| | | | |
Materials | | | 88,198,815 | | | | 0 | | | | 0 | | | | 88,198,815 | |
| | | | |
Real estate | | | 26,286,700 | | | | 0 | | | | 0 | | | | 26,286,700 | |
| | | | |
Utilities | | | 195,605,950 | | | | 0 | | | | 0 | | | | 195,605,950 | |
| | | | |
Corporate bonds and notes | | | 0 | | | | 145,394,722 | | | | 0 | | | | 145,394,722 | |
| | | | |
Yankee corporate bonds and notes | | | 0 | | | | 21,270,995 | | | | 0 | | | | 21,270,995 | |
| | | | |
Short-term investments | | | | | | | | | | | | | | | | |
| | | | |
Investment companies | | | 11,428,082 | | | | 0 | | | | 0 | | | | 11,428,082 | |
| | | | |
Total assets | | $ | 938,967,010 | | | $ | 166,665,717 | | | $ | 0 | | | $ | 1,105,632,727 | |
Additional sector, industry or geographic detail is included in the Portfolio of Investments.
For the year ended September 30, 2019, the Fund did not have any transfers into/out of Level 3.
4. TRANSACTIONS WITH AFFILIATES
Management fee
Funds Management, an indirect wholly owned subsidiary of Wells Fargo & Company (“Wells Fargo”), is the manager of the Fund and provides advisory and fund-level administrative services under an investment management agreement. Under the investment management agreement, Funds Management is responsible for, among other services, implementing the investment objectives and strategies of the Fund, supervising the subadviser and providing fund-level administrative services in connection with the Fund’s
26 | Wells Fargo Diversified Capital Builder Fund
Notes to financial statements
operations. As compensation for its services under the investment management agreement, Funds Management is entitled to receive a management fee at the following annual rate based on the Fund’s average daily net assets:
| | |
| |
| Average daily net assets | | Management fee |
| |
First $500 million | | 0.650% |
| |
Next $500 million | | 0.600 |
| |
Next $2 billion | | 0.550 |
| |
Next $2 billion | | 0.525 |
| |
Next $5 billion | | 0.490 |
| |
Over $10 billion | | 0.480 |
For the year ended September 30, 2019, the management fee was equivalent to an annual rate of 0.62% of the Fund’s average daily net assets.
Funds Management has retained the services of a subadviser to provide daily portfolio management to the Fund. The fee for subadvisory services is borne by Funds Management. Wells Capital Management Incorporated (“WellsCap”), an affiliate of Funds Management and an indirect wholly owned subsidiary of Wells Fargo, is the subadviser to the Fund and is entitled to receive a fee from Funds Management at an annual rate starting at 0.35% and declining to 0.20% as the average daily net assets of the Fund increase.
Administration fees
Under a class-level administration agreement, Funds Management provides class-level administrative services to the Fund, which includes paying fees and expenses for services provided by the transfer agent,sub-transfer agents, omnibus account servicers and record-keepers. As compensation for its services under the class-level administration agreement, Funds Management receives an annual fee which is calculated based on the average daily net assets of each class as follows:
| | |
| |
| | | Class-level
administration fee |
| |
Class A, Class C | | 0.21% |
| |
Administrator Class, Institutional Class | | 0.13 |
Waivers and/or expense reimbursements
Funds Management has contractually waived and/or reimbursed management and administration fees to the extent necessary to maintain certain net operating expense ratios for the Fund. When each class of the Fund has exceeded its expense cap, Funds Management has waived fees and/or reimbursed expenses from fund-level expenses on a proportionate basis and then from class specific expenses. When only certain classes exceed their expense caps, waivers and/or reimbursements are applied against class specific expenses before fund-level expenses. Funds Management has committed through January 31, 2020 to waive fees and/or reimburse expenses to the extent necessary to cap the Fund’s expenses at 1.20% for Class A shares, 1.95% for Class C shares, 1.05% for Administrator Class shares, and 0.78% for Institutional Class shares. Prior to or after the commitment expiration date, the cap may be increased or the commitment to maintain the cap may be terminated only with the approval of the Board of Trustees.
Distribution fee
The Trust has adopted a distribution plan for Class C shares of the Fund pursuant to Rule12b-1 under the 1940 Act. A distribution fee is charged to Class C shares and paid to Wells Fargo Funds Distributor, LLC (“Funds Distributor”), the principal underwriter, at an annual rate of 0.75% of the average daily net assets of Class C shares.
In addition, Funds Distributor is entitled to receive thefront-end sales charge from the purchase of Class A shares and a contingent deferred sales charge on the redemption of certain Class A shares. Funds Distributor is also entitled to receive the contingent deferred sales charges from redemptions of Class C shares. For the year ended September 30, 2019, Funds Distributor received $71,907 from the sale of Class A shares and $496, in contingent deferred sales charges from redemptions Class C shares. No contingent deferred sales charges were incurred by Class A shares for the year ended September 30, 2019.
Wells Fargo Diversified Capital Builder Fund | 27
Notes to financial statements
Shareholder servicing fees
The Trust has entered into contracts with one or more shareholder servicing agents, whereby Class A, Class C, and Administrator Class of the Fund are charged a fee at an annual rate of 0.25% of the average daily net assets of each respective class. A portion of these total shareholder servicing fees were paid to affiliates of Wells Fargo.
Interfund transactions
The Fund may purchase or sell portfolio investment securities to certain other Wells Fargo affiliates pursuant to Rule17a-7 under the 1940 Act and under procedures adopted by the Board of Trustees. The procedures have been designed to ensure that these interfund transactions, which do not incur broker commissions, are effected at current market prices. Pursuant to these procedures, the Fund had $49,948,125 and $8,145,000 in interfund purchases and sales, respectively, during the year ended September 30, 2019.
5. INVESTMENT PORTFOLIO TRANSACTIONS
Purchases and sales of investments, excluding U.S. government obligations (if any) and short-term securities, for the year ended September 30, 2019 were $642,159,124 and $618,990,792, respectively.
6. SECURITIES LENDING TRANSACTIONS
The Fund lends its securities through an unaffiliated securities lending agent and receives collateral in the form of cash or securities with a value at least equal to the value of the securities on loan. The value of the loaned securities is determined at the close of each business day and any increases or decreases in the required collateral are exchanged between the Fund and the counterparty on the next business day. Cash collateral received is invested in the Securities Lending Fund which seeks to provide a positive return compared to the daily Fed Funds Open Rate by investing in high-quality, U.S. dollar-denominated short-term money market instruments and is exempt from registration under Section 3(c)(7) of the 1940 Act. Securities Lending Fund is managed by Funds Management and is subadvised by WellsCap. Funds Management receives an advisory fee starting at 0.05% and declining to 0.01% as the average daily net assets of the Securities Lending Fund increase. All of the fees received by Funds Management are paid to WellsCap for its services as subadviser.
In the event of counterparty default or the failure of a borrower to return a loaned security, the Fund has the right to use the collateral to offset any losses incurred. As of September 30, 2019 the Fund had securities lending transactions with the following counterparties which are subject to offset:
| | | | | | | | | | | | |
| | | |
| Counterparty | | Value of
securities on
loan | | | Collateral
received1 | | | Net amount | |
| | | |
Barclays Capital Inc. | | $ | 62,415 | | | $ | (62,415 | ) | | $ | 0 | |
| | | |
Citigroup Global Markets Inc. | | | 2,550,038 | | | | (2,550,038 | ) | | | 0 | |
| | | |
JPMorgan Securities LLC | | | 2,916,000 | | | | (2,916,000 | ) | | | 0 | |
| 1 | Collateral received within this table is limited to the collateral for the net transaction with the counterparty. |
7. BANK BORROWINGS
The Trust (excluding the money market funds), Wells Fargo Master Trust and Wells Fargo Variable Trust are parties to a $280,000,000 revolving credit agreement whereby the Fund is permitted to use bank borrowings for temporary or emergency purposes, such as to fund shareholder redemption requests. Interest under the credit agreement is charged to the Fund based on a borrowing rate equal to the higher of the Federal Funds rate in effect on that day plus 1.25% or the overnight LIBOR rate in effect on that day plus 1.25%. In addition, an annual commitment fee equal to 0.25% of the unused balance is allocated to each participating fund.
For the year ended September 30, 2019, there were no borrowings by the Fund under the agreement.
8. DISTRIBUTIONS TO SHAREHOLDERS
The tax character of distributions paid during the years ended September 30, 2019 and September 30, 2018 were as follows:
| | | | | | | | |
| | | Year ended September 30 | |
| | |
| | | 2019 | | | 2018 | |
| | |
Ordinary income | | $ | 14,455,943 | | | $ | 25,392,045 | |
| | |
Long-term capital gain | | | 52,000,280 | | | | 28,820,176 | |
28 | Wells Fargo Diversified Capital Builder Fund
Notes to financial statements
As of September 30, 2019, the components of distributable earnings on a tax basis were as follows:
| | | | |
Undistributed ordinary
income | | Undistributed long-term
gain | | Unrealized gains |
| | |
| $5,229,614 | | $43,305,460 | | $165,148,039 |
9. INDEMNIFICATION
Under the Trust’s organizational documents, the officers and Trustees have been granted certain indemnification rights against certain liabilities that may arise out of performance of their duties to the Trust. Additionally, in the normal course of business, the Trust may enter into contracts with service providers that contain a variety of indemnification clauses. The Trust’s maximum exposure under these arrangements is dependent on future claims that may be made against the Fund and, therefore, cannot be estimated.
10. NEW ACCOUNTING PRONOUNCEMENTS
In August 2018, FASB issued Accounting Standards Update (“ASU”)No. 2018-13, Fair Value Measurement (Topic 820)Disclosure Framework – Changes to the Disclosure Requirements for Fair Value Measurement. ASU2018-13 updates the disclosure requirements for fair value measurements by modifying or removing certain disclosures and adding certain new disclosures. The amendments are effective for fiscal years, and interim periods within those fiscal years, beginning after December 15, 2019. Early adoption is permitted. Management has adopted the removal and modification of disclosures early, as permitted, and will adopt the additional new disclosures at the effective date.
In March 2017, FASB issued ASUNo. 2017-08,Premium Amortization on Purchased Callable Debt Securities. ASU2017-08 shortens the amortization period for certain callable debt securities held at a premium and requires the premium to be amortized to the earliest call date. The amendments do not require an accounting change for securities held at a discount and discounts will continue to be accreted to the maturity date of the security. ASU2017-08 is effective for fiscal years beginning after December 15, 2018 and for interim periods within those fiscal years. During the current reporting period, management of the Fund adopted the change in accounting policy which did not have a material impact to the Fund’s financial statements.
Wells Fargo Diversified Capital Builder Fund | 29
Report of independent registered public accounting firm
TO THE SHAREHOLDERS OF THE FUND AND BOARD OF TRUSTEES OF WELLS FARGO FUNDS TRUST:
Opinion on the Financial Statements
We have audited the accompanying statement of assets and liabilities of Wells Fargo Diversified Capital Builder Fund (the Fund), one of the funds constituting Wells Fargo Funds Trust, including the portfolio of investments, as of September 30, 2019, the related statement of operations for the year then ended, the statements of changes in net assets for each of the years in the two-year period then ended, and the related notes (collectively, the financial statements) and the financial highlights for each of the years in the five-year period then ended. In our opinion, the financial statements and financial highlights present fairly, in all material respects, the financial position of the Fund as of September 30, 2019, the results of its operations for the year then ended, the changes in its net assets for each of the years in the two-year period then ended, and the financial highlights for each of the years in the five-year period then ended, in conformity with U.S. generally accepted accounting principles.
Basis for Opinion
These financial statements and financial highlights are the responsibility of the Fund’s management. Our responsibility is to express an opinion on these financial statements and financial highlights based on our audits. We are a public accounting firm registered with the Public Company Accounting Oversight Board (United States) (PCAOB) and are required to be independent with respect to the Fund in accordance with the U.S. federal securities laws and the applicable rules and regulations of the Securities and Exchange Commission and the PCAOB.
We conducted our audits in accordance with the standards of the PCAOB. Those standards require that we plan and perform the audit to obtain reasonable assurance about whether the financial statements and financial highlights are free of material misstatement, whether due to error or fraud. Our audits included performing procedures to assess the risks of material misstatement of the financial statements and financial highlights, whether due to error or fraud, and performing procedures that respond to those risks. Such procedures included examining, on a test basis, evidence regarding the amounts and disclosures in the financial statements and financial highlights. Such procedures also included confirmation of securities owned as of September 30, 2019, by correspondence with the custodian and transfer agent. Our audits also included evaluating the accounting principles used and significant estimates made by management, as well as evaluating the overall presentation of the financial statements and financial highlights. We believe that our audits provide a reasonable basis for our opinion.

We have not been able to determine the specific year that we began serving as the auditor of one or more Wells Fargo Funds investment companies; however we are aware that we have served as the auditor of one or more Wells Fargo Funds investment companies since at least 1955.
Boston, Massachusetts
November 25, 2019
30 | Wells Fargo Diversified Capital Builder Fund
Other information (unaudited)
TAX INFORMATION
For corporate shareholders, pursuant to Section 854 of the Internal Revenue Code, 63.16% of ordinary income dividends qualify for the corporate dividends-received deduction for the fiscal year ended September 30, 2019.
Pursuant to Section 852 of the Internal Revenue Code, $52,000,280 was designated as a 20% rate gain distribution for the fiscal year ended September 30, 2019.
Pursuant to Section 854 of the Internal Revenue Code, $10,071,413 of income dividends paid during the fiscal year ended September 30, 2019 has been designated as qualified dividend income (QDI).
For the fiscal year ended September 30, 2019, $5,979,385 has been designated as interest-related dividends for nonresident alien shareholders pursuant to Section 871 of the Internal Revenue Code.
PROXY VOTING INFORMATION
A description of the policies and procedures used to determine how to vote proxies relating to portfolio securities is available, upon request, by calling1-800-222-8222, visiting our website atwfam.com, or visiting the SEC website at sec.gov. Information regarding how the proxies related to portfolio securities were voted during the most recent12-month period ended June 30 is available on the website atwfam.comor by visiting the SEC website at sec.gov.
QUARTERLY PORTFOLIO HOLDINGS INFORMATION
The Fund files its complete schedule of portfolio holdings with the SEC for the first and third quarters of each fiscal year on Form N-Q or FormN-PORT, which is available by visiting the SEC website at sec.gov. Those forms may be reviewed and copied at the SEC’s Public Reference Room in Washington, DC. Information on the operation of the Public Reference Room may be obtained by calling1-800-SEC-0330.
Wells Fargo Diversified Capital Builder Fund | 31
Other information (unaudited)
BOARD OF TRUSTEES AND OFFICERS
Each of the Trustees and Officers1 listed in the table below acts in identical capacities for each fund in the Wells Fargo family of funds, which consists of 150 mutual funds comprising the Wells Fargo Funds Trust, Wells Fargo Variable Trust, Wells Fargo Master Trust and fourclosed-end funds (collectively the “Fund Complex”). This table should be read in conjunction with the Prospectus and the Statement of Additional Information2. The mailing address of each Trustee and Officer is 525 Market Street, 12th Floor, San Francisco, CA 94105. Each Trustee and Officer serves an indefinite term, however, each Trustee serves such term until reaching the mandatory retirement age established by the Trustees.
Independent Trustees
| | | | | | |
Name and year of birth | | Position held and
length of service* | | Principal occupations during past five years or longer | | Current other
public company or
investment
company
directorships |
| | | |
| William R. Ebsworth (Born 1957) | | Trustee,
since 2015 | | Retired. From 1984 to 2013, equities analyst, portfolio manager, research director and chief investment officer at Fidelity Management and Research Company in Boston, Tokyo, and Hong Kong, and retired in 2013 as Chief Investment Officer of Fidelity Strategic Advisers, Inc. where he led a team of investment professionals managing client assets. Prior thereto, Board member of Hong Kong Securities Clearing Co., Hong Kong Options Clearing Corp., the Thailand International Fund, Ltd., Fidelity Investments Life Insurance Company, and Empire Fidelity Investments Life Insurance Company. Audit Committee Chair and Investment Committee Chair of the Vincent Memorial Hospital Endowment(non-profit organization). Mr. Ebsworth is a CFA® charterholder. | | N/A |
| | | |
| Jane A. Freeman (Born 1953) | | Trustee, since 2015;
Chair Liaison, since 2018 | | Retired. From 2012 to 2014 and 1999 to 2008, Chief Financial Officer of Scientific Learning Corporation. From 2008 to 2012, Ms. Freeman provided consulting services related to strategic business projects. Prior to 1999, Portfolio Manager at Rockefeller & Co. and Scudder, Stevens & Clark. Board member of the Harding Loevner Funds from 1996 to 2014, serving as both Lead Independent Director and chair of the Audit Committee. Board member of the Russell Exchange Traded Funds Trust from 2011 to 2012 and the chair of the Audit Committee. Ms. Freeman is a Board Member of The Ruth Bancroft Garden(non-profit organization). She is also an inactive Chartered Financial Analyst. | | N/A |
| | | |
Isaiah Harris, Jr.
(Born 1952) | | Trustee, since 2009;
Audit Committee Chairman, since 2019 | | Retired. Chairman of the Board of CIGNA Corporation since 2009, and Director since 2005. From 2003 to 2011, Director of Deluxe Corporation. Prior thereto, President and CEO of BellSouth Advertising and Publishing Corp. from 2005 to 2007, President and CEO of BellSouth Enterprises from 2004 to 2005 and President of BellSouth Consumer Services from 2000 to 2003. Emeritus member of the Iowa State University Foundation Board of Governors. Emeritus Member of the Advisory Board of Iowa State University School of Business. Advisory Board Member, Palm Harbor Academy (private school). Advisory Board Member, Child Evangelism Fellowship(non-profit). Mr. Harris is a certified public accountant (inactive status). | | CIGNA Corporation |
| | | |
Judith M. Johnson
(Born 1949) | | Trustee, since 2008;
Audit Committee Chairman, from 2009 to 2018 | | Retired. Prior thereto, Chief Executive Officer and Chief Investment Officer of Minneapolis Employees Retirement Fund from 1996 to 2008. Ms. Johnson is an attorney, certified public accountant and a certified managerial accountant. | | N/A |
32 | Wells Fargo Diversified Capital Builder Fund
Other information (unaudited)
| | | | | | |
Name and year of birth | | Position held and
length of service* | | Principal occupations during past five years or longer | | Current other
public company or
investment
company
directorships |
| | | |
David F. Larcker
(Born 1950) | | Trustee, since 2009 | | James Irvin Miller Professor of Accounting at the Graduate School of Business, Stanford University, Director of the Corporate Governance Research Initiative and Senior Faculty of The Rock Center for Corporate Governance since 2006. From 2005 to 2008, Professor of Accounting at the Graduate School of Business, Stanford University. Prior thereto, Ernst & Young Professor of Accounting at The Wharton School, University of Pennsylvania from 1985 to 2005. | | N/A |
| | | |
Olivia S. Mitchell
(Born 1953) | | Trustee, since 2006; Nominating and Governance Committee Chairman, since 2018 | | International Foundation of Employee Benefit Plans Professor, Wharton School of the University of Pennsylvania since 1993. Director of Wharton’s Pension Research Council and Boettner Center on Pensions & Retirement Research, and Research Associate at the National Bureau of Economic Research. Previously, Cornell University Professor from 1978 to 1993. | | N/A |
| | | |
Timothy J. Penny
(Born 1951) | | Trustee, since 1996; Chairman, since 2018 | | President and Chief Executive Officer of Southern Minnesota Initiative Foundation, anon-profit organization, since 2007. Member of the Board of Trustees of NorthStar Education Finance, Inc., anon-profit organization, since 2007. | | N/A |
| | | |
James G. Polisson
(Born 1959) | | Trustee, since 2018 | | Retired. Chief Marketing Officer, Source (ETF) UK Services, Ltd, from 2015 to 2017. From 2012 to 2015, Principal of The Polisson Group, LLC, a management consulting, corporate advisory and principal investing company. Chief Executive Officer and Managing Director at Russell Investments, Global Exchange Traded Funds from 2010 to 2012. Managing Director of Barclays Global Investors from 1998 to 2010 and Global Chief Marketing Officer for iShares and Barclays Global Investors from 2000 to 2010. Trustee of the San Francisco Mechanics’ Institute, anon-profit organization, from 2013 to 2015. Board member of the Russell Exchange Traded Fund Trust from 2011 to 2012. Director of Barclays Global Investors Holdings Deutschland GmbH from 2006 to 2009. Mr. Polisson is an attorney and has a retired status with the Massachusetts and District of Columbia Bar Associations. | | N/A |
| * | Length of service dates reflect the Trustee’s commencement of service with the Trust’s predecessor entities, where applicable. |
Wells Fargo Diversified Capital Builder Fund | 33
Other information (unaudited)
Officers
| | | | |
Name and
year of birth | | Position held and
length of service | | Principal occupations during past five years or longer |
| | |
Andrew Owen (Born 1960) | | President, since 2017 | | Executive Vice President of Wells Fargo & Company and Head of Affiliated Managers, Wells Fargo Asset Management, since 2014. In addition, Mr. Owen is currently President, Chief Executive Officer and Director of Wells Fargo Funds Management, LLC since 2017. Prior thereto, Executive Vice President responsible for marketing, investments and product development for Wells Fargo Funds Management, LLC, from 2009 to 2014. |
| | |
| Jeremy DePalma1 (Born 1974) | | Treasurer, since 2012 | | Senior Vice President of Wells Fargo Funds Management, LLC since 2009. Senior Vice President of Evergreen Investment Management Company, LLC from 2008 to 2010 and head of the Fund Reporting and Control Team within Fund Administration from 2005 to 2010. |
| | |
Michelle Rhee3 (Born 1966) | | Chief Legal Officer, since 2019 | | Secretary of Wells Fargo Funds Management, LLC, Chief Legal Counsel of Wells Fargo Asset Management and Assistant General Counsel of Wells Fargo Bank, N.A. since 2018. Associate General Counsel and Managing Director of Bank of America Corporation from 2004 to 2018. |
| | |
| Catherine Kennedy4 (Born 1969) | | Secretary,
since 2019 | | Vice President of Wells Fargo Funds Management, LLC and Senior Counsel of the Wells Fargo Legal Department since 2010. Vice President and Senior Counsel of Evergreen Investment Management Company, LLC from 1998 to 2010. |
| | |
| Michael H. Whitaker(Born 1967) | | Chief Compliance Officer, since 2016 | | Chief Compliance Officer of Wells Fargo Asset Management since 2016. Senior Vice President and Chief Compliance Officer for Fidelity Investments from 2007 to 2016. |
| | |
David Berardi (Born 1975) | | Assistant Treasurer, since 2009 | | Vice President of Wells Fargo Funds Management, LLC since 2009. Vice President of Evergreen Investment Management Company, LLC from 2008 to 2010. Manager of Fund Reporting and Control for Evergreen Investment Management Company, LLC from 2004 to 2010. |
| 1 | Jeremy DePalma acts as Treasurer of 86 funds and Assistant Treasurer of 64 funds in the Fund Complex. |
| 2 | The Statement of Additional Information includes additional information about the Trustees and is available, without charge, upon request, by calling1-800-222-8222 or by visiting the website atwfam.com. |
| 3 | Michelle Rhee became Chief Legal Officer effective October 22, 2019. |
| 4 | Catherine Kennedy became Secretary effective October 22, 2019. |
34 | Wells Fargo Diversified Capital Builder Fund
Other information (unaudited)
BOARD CONSIDERATION OF INVESTMENT MANAGEMENT ANDSUB-ADVISORY AGREEMENTS:
Wells Fargo Diversified Capital Builder Fund
Under the Investment Company Act of 1940 (the “1940 Act”), the Board of Trustees (the “Board”) of Wells Fargo Funds Trust (the “Trust”) must determine annually whether to approve the continuation of the Trust’s investment management andsub-advisory agreements. In this regard, at anin-person meeting held on May21-22, 2019 (the “Meeting”), the Board, all the members of which have no direct or indirect interest in the investment management andsub-advisory agreements and are not “interested persons” of the Trust, as defined in the 1940 Act (the “Independent Trustees”), reviewed and approved for Wells Fargo Diversified Capital Builder Fund(the “Fund”): (i) an investment management agreement (the “Management Agreement”) with Wells Fargo Funds Management, LLC (“Funds Management”); and (ii) an investmentsub-advisory agreement (the“Sub-Advisory Agreement”) with Wells Capital Management Incorporated (the“Sub-Adviser”), an affiliate of Funds Management. The Management Agreement and theSub-Advisory Agreement are collectively referred to as the “Advisory Agreements.”
At the Meeting, the Board considered the factors and reached the conclusions described below relating to the selection of Funds Management and theSub-Adviser and the approval of the Advisory Agreements. Prior to the Meeting, including at anin-person meeting in April 2019, the Trustees conferred extensively among themselves and with representatives of Funds Management about these matters. Also, the Board has adopted a team-based approach, with each team consisting of asub-set of Trustees, to assist the full Board in the discharge of its duties in reviewing investment performance and other matters throughout the year. The Independent Trustees were assisted in their evaluation of the Advisory Agreements by independent legal counsel, from whom they received separate legal advice and with whom they met separately.
In providing information to the Board, Funds Management and theSub-Adviser were guided by a detailed set of requests for information submitted to them by independent legal counsel on behalf of the Independent Trustees at the start of the Board’s annual contract renewal process earlier in 2019. In considering and approving the Advisory Agreements, the Trustees considered the information they believed relevant, including but not limited to the information discussed below. The Board considered not only the specific information presented in connection with the Meeting, but also the knowledge gained over time through interaction with Funds Management and theSub-Adviser about various topics. In this regard, the Board reviewed reports of Funds Management at each of its quarterly meetings, which included, among other things, portfolio reviews and investment performance reports. In addition, the Board and the teams mentioned above confer with portfolio managers at various times throughout the year. The Board did not identify any particular information or consideration that wasall-important or controlling, and each individual Trustee may have attributed different weights to various factors.
After its deliberations, the Board unanimously approved the continuation of the Advisory Agreements for aone-year term and determined that the compensation payable to Funds Management and theSub-Adviser under each of the Advisory Agreements was reasonable. The Board considered the approval of the Advisory Agreements for the Fund as part of its consideration of agreements for funds across the complex, but its approvals were made on afund-by-fund basis. The following summarizes a number of important, but not necessarily all, factors considered by the Board in support of its approvals.
Nature, extent and quality of services
The Board received and considered various information regarding the nature, extent and quality of services provided to the Fund by Funds Management and theSub-Adviser under the Advisory Agreements. This information included a description of the investment advisory services and Fund-level administrative services covered by the Management Agreement, as well as, among other things, a summary of the background and experience of senior management of Wells Fargo Asset Management (“WFAM”), of which Funds Management and theSub-Adviser are a part, a summary of investments made in the business of WFAM, a summary of certain organizational and personnel changes involving Funds Management and theSub-Adviser, and a description of Funds Management’s and theSub-Adviser’s business continuity planning programs and of their approaches to data privacy and cybersecurity. The Board received and reviewed information about Funds Management’s role as administrator of the Fund’s liquidity risk management program. The Board also considered the qualifications, background, tenure and responsibilities of each of the portfolio managers primarily responsible for theday-to-day portfolio management of the Fund.
The Board evaluated the ability of Funds Management and theSub-Adviser to attract and retain qualified investment professionals, including research, advisory and supervisory personnel. The Board further considered the compliance programs and compliance records of Funds Management and theSub-Adviser. In addition, the Board took into account the full range of services provided to the Fund by Funds Management and its affiliates.
Wells Fargo Diversified Capital Builder Fund | 35
Other information (unaudited)
Fund investment performance and expenses
The Board considered the investment performance results for the Fund over various time periods ended December 31, 2018. The Board considered these results in comparison to the investment performance of funds in a universe that was determined by Broadridge Inc. (“Broadridge”) to be similar to the Fund (the “Universe”), and in comparison to the Fund’s benchmark index and to other comparative data. Broadridge is an independent provider of investment company data. The Board received a description of the methodology used by Broadridge to select the mutual funds in the performance Universe. The Board noted that the investment performance of the Fund (Class A) was higher than the average investment performance of the Universe for all periods under review. The Board also noted that the investment performance of the Fund was lower than its benchmark index, the Diversified Capital Builder Blended Index, for theone-year period under review, but higher than its benchmark for the three-, five- andten-year periods under review.
The Board also received and considered information regarding the Fund’s net operating expense ratios and their various components, including actual management fees, custodian and othernon-management fees, and Rule12b-1 andnon-Rule12b-1 shareholder service fees. The Board considered these ratios in comparison to the median ratios of funds in class-specific expense groups that were determined by Broadridge to be similar to the Fund (the “Groups”). The Board received a description of the methodology used by Broadridge to select the mutual funds in the expense Groups and an explanation of how funds comprising expense groups and their expense ratios may vary fromyear-to-year. Based on the Broadridge reports, the Board noted that the net operating expense ratios of the Fund were lower than or in range of the median net operating expense ratios of the expense Groups for each share class.
The Board took into account the Fund’s investment performance and expense information provided to it among the factors considered in deciding tore-approve the Advisory Agreements.
Investment management andsub-advisory fee rates
The Board reviewed and considered the contractual fee rates payable by the Fund to Funds Management under the Management Agreement, as well as the contractual fee rates payable by the Fund to Funds Management for class-level administrative services under a Class-Level Administration Agreement, which include, among other things, class-level transfer agency andsub-transfer agency costs (collectively, the “Management Rates”). The Board also reviewed and considered the contractual investmentsub-advisory fee rates that are payable by Funds Management to theSub-Adviser for investmentsub-advisory services.
Among other information reviewed by the Board was a comparison of the Fund’s Management Rates with the average contractual investment management fee rates of funds in the expense Groups at a common asset level as well as transfer agency costs of the funds in the expense Groups. The Board noted that the Management Rates of the Fund were in range of the sum of these average rates for the Fund’s expense Groups for all share classes. The Board also noted that the net operating expense ratio cap for Class A would be reduced.
The Board also received and considered information about the portion of the total management fee that was retained by Funds Management after payment of the fee to theSub-Adviser forsub-advisory services. In assessing the reasonableness of this amount, the Board received and evaluated information about the nature and extent of responsibilities retained and risks assumed by Funds Management and not delegated to or assumed by theSub-Adviser, and about Funds Management’son-going oversight services. Given the affiliation between Funds Management and theSub-Adviser, the Board ascribed limited relevance to the allocation of fees between them.
Based on its consideration of the factors and information it deemed relevant, including those described here, the Board determined that the compensation payable to Funds Management under the Management Agreement and to theSub-Adviser under theSub-Advisory Agreement was reasonable.
Profitability
The Board received and considered information concerning the profitability of Funds Management, as well as the profitability of both WFAM and Wells Fargo & Co. (“Wells Fargo”) from providing services to the fund family as a whole. The Board noted that theSub-Adviser’s profitability information with respect to providing services to the Fund and other funds in the family was subsumed in the WFAM and Wells Fargo profitability analysis.
Funds Management reported on the methodologies and estimates used in calculating profitability, including a description of the methodology used to allocate certain expenses. Among other things, the Board noted that the levels of profitability reported on afund-by-fund basis varied widely, depending on factors such as the size, type and age of fund. Based on its review, the Board did not deem the profits reported by Funds Management, WFAM or Wells Fargo from services provided to the Fund to be at a level that would prevent it from approving the continuation of the Advisory Agreements.
36 | Wells Fargo Diversified Capital Builder Fund
Other information (unaudited)
Economies of scale
The Board received and considered information about the potential for Funds Management to experience economies of scale in the provision of management services to the Fund, the difficulties of calculating economies of scale at an individual fund level, and the extent to which potential scale benefits are shared with shareholders. The Board noted the existence of breakpoints in the Fund’s management fee structure, which operate generally to reduce the Fund’s expense ratios as the Fund grows in size. The Board considered that in addition to management fee breakpoints, Funds Management shares potential economies of scale from its management business in a variety of ways, including through fee waiver and expense reimbursement arrangements, services that benefit shareholders, competitive management fee rates set at the outset without regard to breakpoints, and investments in the business intended to enhance services available to shareholders.
The Board concluded that Funds Management’s arrangements with respect to the Fund, including contractual breakpoints, constituted a reasonable approach to sharing potential economies of scale with the Fund and its shareholders.
Other benefits to Funds Management and theSub-Adviser
The Board received and considered information regarding potential“fall-out” or ancillary benefits received by Funds Management and its affiliates, including theSub-Adviser, as a result of their relationships with the Fund. Ancillary benefits could include, among others, benefits directly attributable to other relationships with the Fund and benefits potentially derived from an increase in Funds Management’s and theSub-Adviser’s business as a result of their relationships with the Fund. The Board noted that various affiliates of Funds Management may receive distribution-related fees, shareholder servicing payments andsub-transfer agency fees in respect of shares sold or held through them and services provided.
The Board also reviewed information about soft dollar credits earned and utilized by theSub-Adviser, fees earned by Funds Management and theSub-Adviser from managing a private investment vehicle for the fund family’s securities lending collateral, and commissions earned by an affiliated broker from portfolio transactions.
Based on its consideration of the factors and information it deemed relevant, including those described here, the Board did not find that any ancillary benefits received by Funds Management and its affiliates, including theSub-Adviser, were unreasonable.
Conclusion
At the Meeting, after considering the above-described factors and based on its deliberations and its evaluation of the information described above, the Board unanimously approved the continuation of the Advisory Agreements for aone-year term and determined that the compensation payable to Funds Management and theSub-Adviser under each of the Advisory Agreements was reasonable.
Wells Fargo Diversified Capital Builder Fund | 37
This page is intentionally left blank.
This page is intentionally left blank.
This page is intentionally left blank.

For more information
More information about Wells Fargo Funds is available free upon request. To obtain literature, please write, visit the Fund’s website, or call:
Wells Fargo Funds
P.O. Box 219967
Kansas City, MO 64121-9967
Website:wfam.com
Individual investors:1-800-222-8222
Retail investment professionals:1-888-877-9275
Institutional investment professionals:1-866-765-0778

This report and the financial statements contained herein are submitted for the general information of the shareholders of the Fund. If this report is used for promotional purposes, distribution of the report must be accompanied or preceded by a current prospectus. Before investing, please consider the investment objectives, risks, charges, and expenses of the investment. For a current prospectus and, if available, a summary prospectus, containing this information, call1-800-222-8222 or visit the Fund’s website atwfam.com. Read the prospectus carefully before you invest or send money.
Wells Fargo Asset Management (WFAM) is the trade name for certain investment advisory/management firms owned by Wells Fargo & Company. These firms include but are not limited to Wells Capital Management Incorporated and Wells Fargo Funds Management, LLC. Certain products managed by WFAM entities are distributed by Wells Fargo Funds Distributor, LLC (a broker-dealer and Member FINRA).
This material is for general informational and educational purposes only and is NOT intended to provide investment advice or a recommendation of any kind—including a recommendation for any specific investment, strategy, or plan.
INVESTMENT PRODUCTS: NOT FDIC INSURED ◾ NO BANK GUARANTEE ◾ MAY LOSE VALUE
© 2019 Wells Fargo & Company. All rights reserved.
406800 11-19
A225/AR225 09-19
Annual Report
September 30, 2019
Wells Fargo
Diversified Income Builder Fund
Beginning on January 1, 2021, as permitted by new regulations adopted by the Securities and Exchange Commission, paper copies of the Wells Fargo Funds’ annual and semi-annual shareholder reports issued after this date will no longer be sent by mail, unless you specifically request paper copies of the reports. Instead, the reports will be made available on the Funds’ website, and you will be notified by mail each time a report is posted and provided with a website address to access the report.
If you already elected to receive shareholder reports electronically, you will not be affected by this change and you need not take any action. You may elect to receive shareholder reports and other communications from the Fund electronically at any time by contacting your financial intermediary (such as a broker-dealer or bank) or, if you are a direct investor, by calling1-800-222-8222 or by enrolling at wellsfargo.com/advantagedelivery.
You may elect to receive all future reports in paper free of charge. If you invest through a financial intermediary, you can contact your financial intermediary to request that you continue to receive paper copies of your shareholder reports; if you invest directly with the Fund, you can call 1-800-222-8222. Your election to receive reports in paper will apply to all Wells Fargo Funds held in your account with your financial intermediary or, if you are a direct investor, to all Wells Fargo Funds that you hold.
|
|
|
Reduce clutter. Save trees. |
Sign up for electronic delivery of prospectuses and shareholder reports at wellsfargo.com/ advantagedelivery |
The views expressed and any forward-looking statements are as of September 30, 2019, unless otherwise noted, and are those of the Fund managers and/or Wells Fargo Asset Management. Discussions of individual securities, or the markets generally, or any Wells Fargo Fund are not intended as individual recommendations. Future events or results may vary significantly from those expressed in any forward-looking statements. The views expressed are subject to change at any time in response to changing circumstances in the market. Wells Fargo Asset Management and the Fund disclaim any obligation to publicly update or revise any views expressed or forward-looking statements.
INVESTMENT PRODUCTS: NOT FDIC INSURED ◾ NO BANK GUARANTEE ◾ MAY LOSE VALUE
Wells Fargo Diversified Income Builder Fund | 1
Letter to shareholders (unaudited)

Andrew Owen
President
Wells Fargo Funds
“December’s S&P 500 Index performance was the worst since 1931.”
Dear Shareholder:
We are pleased to offer you this annual report for the Wells Fargo Diversified Income Builder Fund for the12-month period that ended September 30, 2019. After the first half of the period yielded eitherlow-single-digit or negative investment returns, U.S. stock and global bond investors generally saw markets recover during the second half amid intensifying market volatility, global economic growth concerns, international trade stare downs, and simmering geopolitical tensions.
Overall, fixed-income investors enjoyed a distinct advantage over stock investors. For the period, U.S. stocks, based on the S&P 500 Index,1 gained 4.25% and international stocks, as measured by the MSCI ACWI ex USA Index (Net),2 fell 1.23%. The MSCI EM Index (Net)3 slipped 2.02%. Among fixed income investors, the Bloomberg Barclays U.S. Aggregate Bond Index4 added 10.30%, the Bloomberg Barclays Global Aggregateex-USD Index5 added 5.34%, the Bloomberg Barclays Municipal Bond Index6 gained 8.55%, and the ICE BofAML U.S. High Yield Index7 added 6.30%.
Investors confronted unsettling events during the fourth quarter of 2018.
During the fourth quarter of 2018, investors grew concerned about the pace and sustainability of the global economic expansion. The U.S. Bureau of Economic Analysis reported third-quarter U.S. gross domestic product (GDP) was 3.4% on an annualized basis, which was down from the second-quarter rate. A partial U.S. government shutdown occurred, which extended into January 2019. Brexit efforts stalled, causing uncertainty for the eurozone. The value of the renminbi declined even as the People’s Bank of China cut reserve requirement ratios, accelerated infrastructure spending, and cut taxes in efforts to spur economic activity.
The combination of news in the U.S. and generally weak economic indicators outside of the U.S. caused investors to seek safe havens. December’s S&P 500 Index performance was the worst since 1931. Globally, fixed-income investments fared better than stocks during the last two months of the year. Even as indicators suggested growth was restrained, the U.S. Federal Reserve (Fed) increased the federal funds rate by 25 basis points (bps; 100 bps equal 1.00%) in December 2018 to a target range of between 2.25% and 2.50%. Many observers expressed concerns that higher rates could slow the economy further.
| 1 | The S&P 500 Index consists of 500 stocks chosen for market size, liquidity, and industry group representation. It is a market-value-weighted index with each stock’s weight in the index proportionate to its market value. You cannot invest directly in an index. |
| 2 | The Morgan Stanley Capital International (MSCI) All Country World Index (ACWI) ex USA Index (Net) is a free-float-adjusted market-capitalization weighted index that is designed to measure the equity market performance of developed and emerging markets, excluding the U.S. Source: MSCI. MSCI makes no express or implied warranties or representations and shall have no liability whatsoever with respect to any MSCI data contained herein. The MSCI data may not be further redistributed or used as a basis for other indices or any securities or financial products. This report is not approved, reviewed, or produced by MSCI. You cannot invest directly in an index. |
| 3 | The MSCI Emerging Markets (EM) Index (Net) is a free-float-adjusted market-capitalization-weighted index that is designed to measure the equity market performance of emerging markets. You cannot invest directly in an index. |
| 4 | The Bloomberg Barclays U.S. Aggregate Bond Index is a broad-based benchmark that measures the investment-grade, U.S. dollar-denominated, fixed-rate taxable bond market, including Treasuries, government-related and corporate securities, mortgage-backed securities (agency fixed-rate and hybrid adjustable-rate mortgage pass-throughs), asset-backed securities, and commercial mortgage-backed securities. You cannot invest directly in an index. |
| 5 | The Bloomberg Barclays Global Aggregateex-USD Index is an unmanaged index that provides a broad-based measure of the global investment-grade fixed-income markets excluding the U.S. dollar-denominated debt market. You cannot invest directly in an index. |
| 6 | The Bloomberg Barclays Municipal Bond Index is an unmanaged index composed of long-termtax-exempt bonds with a minimum credit rating of Baa. You cannot invest directly in an index. |
| 7 | The ICE BofAML U.S. High Yield Index is a market-capitalization-weighted index of domestic and Yankee high-yield bonds. The index tracks the performance of high-yield securities traded in the U.S. bond market. You cannot invest directly in an index. Copyright 2019. ICE Data Indices, LLC. All rights reserved. |
2 | Wells Fargo Diversified Income Builder Fund
Letter to shareholders (unaudited)
The market climbs a wall of worry.
Investment returns early in 2019 appeared to reaffirm the adage that markets climb a wall of worry as the new year began. The S&P 500 Index gained 8.01% for the month of January, the best monthly performance in 30 years. Returns for the MSCI ACWI ex USA Index (Net), the Bloomberg Barclays U.S. Aggregate Bond Index, and the Bloomberg Barclays Global Aggregateex-USD Index also were positive.
In February 2019, signs of slowing global growth grew more ominous. The Bureau of Economic Analysis announced fourth-quarter 2018 GDP grew at an annualized 2.2% rate, a slower rate than reported for the prior two quarters. In a February report, the Bank of England forecast the slowest growth for 2019 since the financial crisis. China and the U.S. continued to wrangle over trade issues. By the end of the first quarter of 2019, more accommodative Fed sentiment and steady, if not spectacular, U.S. economic and business metrics encouraged domestic investors.
Early second-quarter 2019 enthusiasm among investors faded.
During April 2019, favorable sentiment found additional support in reports of sustained low inflation, solid employment data, and first-quarter U.S. GDP of an annualized rate of 3.2%. During May, markets tumbled on mixed investment signals. In the U.S., partisan wrangling ramped up as Democrats and Republicans set their sights on 2020 presidential politics. The U.K.’s Brexit disagreements caused Prime Minister Theresa May to resign. Boris Johnson succeeded her only to exacerbate uncertainty about Brexit’s resolution ahead of an October 2019 deadline. The European Commission downgraded the 2019 growth forecast to 1.2%. The U.S. increased tariffs on products from China, China responded, and then talks broke down. President Donald Trump threatened to turn his foreign policy tariff tool to Mexico over immigration issues.
During the third quarter of 2019, investors regrouped. Just as the investment horizon appeared to darken, sentiment turned and U.S. equity markets gained during June and July. The gains, primarily driven by geopolitical and monetary policy events, pushed equity markets to new highs. European Central Bank President Mario Draghi said that if the outlook doesn’t improve, the bank would cut rates or buy more assets to prop up inflation. President Trump backed off of tariff threats against Mexico and China. In the U.S., the Fed implemented a 0.25% federal funds rate cut in July.
Later in July 2019, the U.S. reversed course and threatened to impose higher tariffs on China’s exports after talks failed. China responded with tariff threats of its own and devalued the renminbi, a move that roiled global markets. Major U.S. stock market indices closed July with the worst weekly results of the year. Bond prices gained as Treasury yields fell to levels not seen since November 2016 and the yield curve inverted at multiple points along the30-year arc.
In a microcosm, August 2019 encapsulated many of the unnerving events that plagued investors during the prior 11 months. The U.S.-China trade relationship swung from antagonistic to hopeful and back again with no evident compromise on the horizon. Evidence of a continued global economic slowdown mounted. Central banks in China, New Zealand, and Thailand cut interest rates. Industrial and manufacturing data declined in China, Canada, Japan, and Germany. Adding to the uncertain environment, Italy’s prime minister resigned, many feared a crackdown in Hong Kong as protesters sustained their calls for reform throughout the month, and Boris Johnson planned to suspend Parliament as Brexit’s deadline neared.
In the U.S., September saw the Fed join other central banks in cutting interest rates. Manufacturing data in the U.S., as reported by the Institute for Supply Management, disappointed investors. The U.S. Congress announced it would pursue an impeachment investigation of President Trump. Meanwhile, the Brexit impasse showed no signs of
“The S&P 500 Index gained 8.01% for the month of January, the best monthly performance in 30 years.”
Wells Fargo Diversified Income Builder Fund | 3
Letter to shareholders (unaudited)
|
|
|
For further information about your Fund, contact your investment professional, visit our website at wfam.com, or call us directly at1-800-222-8222. |
resolution. Officials in China said that hitting the country’s economic growth goals for the year would be difficult considering the weight of tariffs and trade restrictions. So while the S&P 500 Index finished the third quarter withyear-to-date returns that were the best in more than 20 years, amid signs of equity investors taking money out of the stock market, concerns about future returns remained.
Don’t let short-term uncertainty derail long-term investment goals.
Periods of investment uncertainty can present challenges, but experience has taught us that maintaining long-term investment goals can be an effective way to plan for the future. To help you create a sound strategy based on your personal goals and risk tolerance, Wells Fargo Funds offers more than 100 mutual funds spanning a wide range of asset classes and investment styles. Although diversification cannot guarantee an investment profit or prevent losses, we believe it can be an effective way to manage investment risk and potentially smooth out overall portfolio performance. We encourage investors to know their investments and to understand that appropriate levels of risk-taking may potentially unlock opportunities.
Thank you for choosing to invest with Wells Fargo Funds. We appreciate your confidence in us and remain committed to helping you meet your financial needs.
Sincerely,

Andrew Owen
President
Wells Fargo Funds
4 | Wells Fargo Diversified Income Builder Fund
This page is intentionally left blank.
Performance highlights (unaudited)
Investment objective
The Fund seeks long-term total return, consisting of current income and capital appreciation.
Manager
Wells Fargo Funds Management, LLC
Subadviser
Wells Capital Management Incorporated
Portfolio managers
Kandarp R. Acharya, CFA®‡, FRM
Margaret Patel
Average annual total returns (%) as of September 30, 20191
| | | | | | | | | | | | | | | | | | | | | | | | | | | | | | | | | | |
| | | | |
| | | | | Including sales charge | | | Excluding sales charge | | | Expense ratios2 (%) | |
| | | | | | | | | |
| | | Inception date | | 1 year | | | 5 year | | | 10 year | | | 1 year | | | 5 year | | | 10 year | | | Gross | | | Net3 | |
| | | | | | | | | | |
| Class A (EKSAX) | | 4-14-1987 | | | -1.55 | | | | 4.66 | | | | 7.15 | | | | 4.51 | | | | 5.92 | | | | 7.79 | | | | 1.04 | | | | 0.85 | |
| | | | | | | | | | |
| Class C (EKSCX) | | 2-1-1993 | | | 2.71 | | | | 5.09 | | | | 6.98 | | | | 3.71 | | | | 5.09 | | | | 6.98 | | | | 1.79 | | | | 1.60 | |
| | | | | | | | | | |
| Class R6 (EKSRX)4 | | 7-31-2018 | | | – | | | | – | | | | – | | | | 5.07 | | | | 6.29 | | | | 8.19 | | | | 0.61 | | | | 0.42 | |
| | | | | | | | | | |
| Administrator Class (EKSDX)5 | | 7-30-2010 | | | – | | | | – | | | | – | | | | 4.52 | | | | 6.03 | | | | 7.95 | | | | 0.96 | | | | 0.77 | |
| | | | | | | | | | |
| Institutional Class (EKSYX) | | 1-13-1997 | | | – | | | | – | | | | – | | | | 4.80 | | | | 6.26 | | | | 8.18 | | | | 0.71 | | | | 0.52 | |
| | | | | | | | | | |
| Diversified Income Builder Blended Index6 | | – | | | – | | | | – | | | | – | | | | 5.67 | | | | 6.85 | | | | 9.30 | | | | – | | | | – | |
| | | | | | | | | | |
| ICE BofAML U.S. Cash Pay High Yield Index7 | | – | | | – | | | | – | | | | – | | | | 6.34 | | | | 5.36 | | | | 7.82 | | | | – | | | | – | |
| | | | | | | | | | |
| Russell 1000® Index8 | | – | | | – | | | | – | | | | – | | | | 3.87 | | | | 10.62 | | | | 13.23 | | | | – | | | | – | |
Figures quoted represent past performance, which is no guarantee of future results, and do not reflect taxes that a shareholder may pay on fund distributions or the redemption of fund shares. Investment return and principal value of an investment will fluctuate so that an investor’s shares, when redeemed, may be worth more or less than their original cost. Performance shown without sales charges would be lower if sales charges were reflected. Current performance may be lower or higher than the performance data quoted, which assumes the reinvestment of dividends and capital gains. Currentmonth-end performance is available on the Fund’s website,wfam.com.
Index returns do not include transaction costs associated with buying and selling securities, any mutual fund fees or expenses, or any taxes. It is not possible to invest directly in an index.
For Class A shares, the maximumfront-end sales charge is 5.75%. For Class C shares, the maximum contingent deferred sales charge is 1.00%. Performance including a contingent deferred sales charge assumes the sales charge for the corresponding time period. Class R6, Administrator Class, and Institutional Class shares are sold without afront-end sales charge or contingent deferred sales charge.
Balanced funds may invest in stocks and bonds. Stock values fluctuate in response to the activities of individual companies and general market and economic conditions. Bond values fluctuate in response to the financial condition of individual issuers, general market and economic conditions, and changes in interest rates. Changes in market conditions and government policies may lead to periods of heightened volatility in the bond market and reduced liquidity for certain bonds held by the Fund. In general, when interest rates rise, bond values fall and investors may lose principal value. Interest rate changes and their impact on the Fund and its share price can be sudden and unpredictable. Certain investment strategies tend to increase the total risk of an investment (relative to the broader market). The Fund is exposed to foreign investment risk, high-yield securities risk, and smaller-company securities risk. Consult the Fund’s prospectus for additional information on these and other risks.
Please see footnotes on page 7.
6 | Wells Fargo Diversified Income Builder Fund
Performance highlights (unaudited)
|
|
| Growth of $10,000 investment as of September 30, 20199 |
|
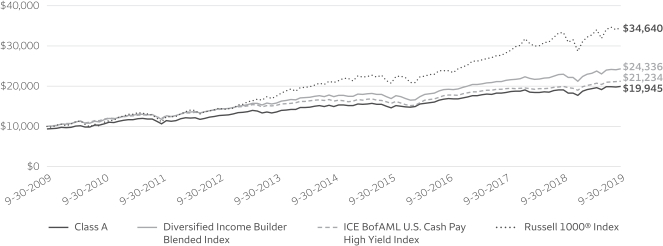
|
| ‡ | CFA® and Chartered Financial Analyst® are trademarks owned by CFA Institute. |
| 1 | Historical performance shown prior to July 12, 2010, is based on the performance of Fund’s predecessor, Evergreen Diversified Income Builder Fund. |
| 2 | Reflects the expense ratios as stated in the most recent prospectuses. The expense ratios shown are subject to change and may differ from the annualized expense ratios shown in the financial highlights of this report. |
| 3 | The manager has contractually committed through January 31, 2020, to waive fees and/or reimburse expenses to the extent necessary to cap the expenses of each class after fee waivers at the amounts shown. Brokerage commissions, stamp duty fees, interest, taxes, acquired fund fees and expenses (if any), and extraordinary expenses are excluded from the expense cap. Prior to or after the commitment expiration date, the cap may be increased or the commitment to maintain the cap may be terminated only with the approval of the Board of Trustees. Without this cap, the Fund’s returns would have been lower. The expense ratio paid by an investor is the net expense ratio (the total annual fund operating expenses after fee waivers) as stated in the prospectuses. |
| 4 | Historical performance shown for the Class R6 shares prior to their inception reflects the performance of the Institutional Class shares, and is not adjusted to reflect Class R6 expenses. If these expenses had been included, returns for Class R6 would be higher. |
| 5 | Historical performance shown for the Administrator Class shares prior to their inception reflects the performance of the Institutional Class shares, adjusted to reflect the higher expenses applicable to the Administrator Class shares. |
| 6 | Source: Wells Fargo Funds Management, LLC. The Diversified Income Builder Blended Index is composed 65% of the ICE BofAML U.S. Cash Pay High Yield Index and 35% of the Russell 1000® Index. Prior to January 2, 2018, the Diversified Income Builder Blended Index was composed 75% of the ICE BofAML U.S. Cash Pay High Yield Index and 25% of the Russell 1000® Index. You cannot invest directly in an index. |
| 7 | The ICE BofAML U.S. Cash Pay High Yield Index is an unmanaged market index that provides a broad-based performance measure of the noninvestment grade U.S. domestic bond index. You cannot invest directly in an index. Copyright 2019. ICE Data Indices, LLC. All rights reserved. |
| 8 | The Russell 1000®Index measures the performance of the 1,000 largest companies in the Russell 3000® Index, which represents approximately 92% of the total market capitalization of the Russell 3000® Index. You cannot invest directly in an index. |
| 9 | The chart compares the performance of Class A shares for the most recent ten years with the Diversified Income Builder Blended Index, ICE BofAML U.S. Cash Pay High Yield Index, and the Russell 1000® Index. The chart assumes a hypothetical investment of $10,000 in Class A shares and reflects all operating expenses and assumes the maximum initial sales charge of 5.75%. |
| 10 | The S&P 500 Index consists of 500 stocks chosen for market size, liquidity, and industry group representation. It is a market-value-weighted index with each stock’s weight in the index proportionate to its market value. You cannot invest directly in an index. |
| 11 | The ten largest holdings, excluding cash, cash equivalents and any money market funds, are calculated based on the value of the investments divided by total net assets of the Fund. Holdings are subject to change and may have changed since the date specified. |
| 12 | Amounts are calculated based on the total long-term investments of the Fund. These amounts are subject to change and may have changed since the date specified. |
Wells Fargo Diversified Income Builder Fund | 7
Performance highlights (unaudited)
MANAGER’S DISCUSSION
Fund highlights
| ∎ | | The Fund underperformed its benchmark, the Diversified Income Builder Blended Index, for the12-month period that ended September 30, 2019. |
| ∎ | | The Fund’s equity sector allocation was the main detractor from performance due to an overweight to the energy sector and allocation tonon-U.S. equities. |
| ∎ | | The Fund’s high-yield allocation outperformed the bond index on strong performance of industrials companies. |
An increase in market volatility and a decrease in rates.
Following a tumultuous fourth quarter in 2018 in which the S&P 500 Index10 nearly entered correction territory, markets rebounded in the first quarter of 2019. Over the final three months of the period, global equity prices moved up and down but produced little in the way of returns. In the U.S., equity returns ended the period slightly positive. At the same time, interest rates declined markedly, resulting in strong returns on rate-sensitive assets, particularly U.S. Treasuries.
Perhaps the disparity can be explained, in part, by concerns over future economic growth coupled with dovish sentiments from the U.S. Federal Reserve (Fed). Perhaps it is partly attributable to the strong 2019year-to-date equity returns as the markets recovered from the December 2018 shocksell-off. Perhaps the inverted yield curve contributed to the disparity, increasing financial market uncertainty. The third quarter of 2019 certainly saw its share of volatility. The powerful whipsaw effect observed would have certainly left even the best of lumberjacks impressed.
Earnings report and companies did not disappoint during the final quarter of the period. Inflation remains at bay. Looking back, we feel it is fair to say that most of 2019 has been a story of the Fed remaining patient, stocks accruing value, and eyes peering at other nations. The world’s eyes are fixed on two major geopolitical events that have significant potential to rile markets or push them higher if resolved benignly: Brexit and U.S. trade squabbles. The market needs some level of certainty for risk assets to climb over the wall of worry.
| | | | |
| |
| Ten largest holdings(%) as of September 30, 201911 | | | |
| | |
TTM Technologies Incorporated, 5.63%,10-1-2025 | | | 2.30 | |
| | |
Lamb Weston Holdings Incorporated,4.63%, 11-1-2024 | | | 1.91 | |
| | |
Koppers Incorporated, 6.00%,2-15-2025 | | | 1.84 | |
| | |
Installed Building Company, 5.75 %,2-1-2028 | | | 1.75 | |
| | |
Iron Mountain Incorporated, 4.88%,9-15-2027 | | | 1.71 | |
| | |
Valvoline Incorporated, 4.38%,8-15-2025 | | | 1.70 | |
| | |
Tronox Finance plc, 5.75%,10-1-2025 | | | 1.58 | |
| | |
Cheniere Corpus Christi Holdings LLC,5.13%, 6-30-2027 | | | 1.45 | |
| | |
HCA Incorporated, 5.38%,2-1-2025 | | | 1.45 | |
| | |
AMN Healthcare Incorporated, 5.13%,10-1-2024 | | | 1.35 | |
Diversification continued to deliver.
The Fund diversified its holdings in the second quarter of 2019 to provide more varied sources of income. Specifically, the Fund introduced dedicated allocations to dividend-focused global equities and U.S. industries, including real estate investment partnerships and master limited partnerships. The Fund also diversified its high-yield exposure to include taxable municipal high-yield bonds. The allocation changes helped increase the portfolio’s overall yield while providing greater diversification. U.S. high yield, high-yield municipal bonds, and contingent convertible bonds all had positive performance for the trailing one year. High-yield holdings were additive to performance as higher-quality companies outperformed the lower-quality firms in the portfolio.
Please see footnotes on page 7.
8 | Wells Fargo Diversified Income Builder Fund
Performance highlights (unaudited)
|
|
| Portfolio composition as of September 30, 201912 |
|
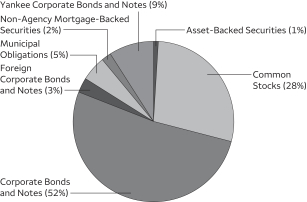 |
Within equities, the global equity allocation detracted from Fund performance as it tilted toward value stocks during a period of outperformance for growth stocks. Emerging market holdings also detracted from performance on global trade fears and a stronger dollar. We continue to believe that equity exposure tonon-U.S. dividend-focused companies with strong balance sheets should provide diversification benefits to the Fund.
Our outlook remains cautious.
We are concerned about slowing U.S. growth, continued trade disputes, and global geopolitical uncertainty. Over the past year, we have taken various actions to ensure the portfolio is defensively positioned. Based upon growth concerns in Europe, in July we established a short position in the euro. In August, amulti-leg defensive trade was initiated; we simultaneously established a short position in the S&P 500 Index and a long position in the U.S.10-year Treasury.
Please see footnotes on page 7.
Wells Fargo Diversified Income Builder Fund | 9
Fund expenses (unaudited)
As a shareholder of the Fund, you incur two types of costs: (1) transaction costs, including sales charges (loads) on purchase payments and contingent deferred sales charges (if any) on redemptions and (2) ongoing costs, including management fees, distribution(12b-1) and/or shareholder servicing fees, and other Fund expenses. This example is intended to help you understand your ongoing costs (in dollars) of investing in the Fund and to compare these costs with the ongoing costs of investing in other mutual funds.
The example is based on an investment of $1,000 invested at the beginning of thesix-month period and held for the entire period from April 1, 2019 to September 30, 2019.
Actual expenses
The “Actual” line of the table below provides information about actual account values and actual expenses. You may use the information in this line, together with the amount you invested, to estimate the expenses that you paid over the period. Simply divide your account value by $1,000 (for example, an $8,600 account value divided by $1,000 = 8.6), then multiply the result by the number in the “Actual” line under the heading entitled “Expenses paid during period” for your applicable class of shares to estimate the expenses you paid on your account during this period.
Hypothetical example for comparison purposes
The “Hypothetical” line of the table below provides information about hypothetical account values and hypothetical expenses based on the Fund’s actual expense ratio and an assumed rate of return of 5% per year before expenses, which is not the Fund’s actual return. The hypothetical account values and expenses may not be used to estimate the actual ending account balance or expenses you paid for the period. You may use this information to compare the ongoing costs of investing in the Fund and other funds. To do so, compare this 5% hypothetical example with the 5% hypothetical examples that appear in the shareholder reports of the other funds.
Please note that the expenses shown in the table are meant to highlight your ongoing costs only and do not reflect any transactional costs, such as sales charges (loads) and contingent deferred sales charges. Therefore, the “Hypothetical” line of the table is useful in comparing ongoing costs only and will not help you determine the relative total costs of owning different funds. In addition, if these transactional costs were included, your costs would have been higher.
| | | | | | | | | | | | | | | | |
| | | Beginning
account value
4-1-2019 | | | Ending
account value
9-30-2019 | | | Expenses
paid during
the period¹ | | | Annualized net
expense ratio | |
| | | | | |
Class A | | | | | | | | | | | | | | | | |
| | | | |
Actual | | $ | 1,000.00 | | | $ | 1,028.13 | | | $ | 4.34 | | | | 0.85 | % |
| | | | |
Hypothetical (5% return before expenses) | | $ | 1,000.00 | | | $ | 1,020.79 | | | $ | 4.32 | | | | 0.85 | % |
| | | | | |
Class C | | | | | | | | | | | | | | | | |
| | | | |
Actual | | $ | 1,000.00 | | | $ | 1,024.24 | | | $ | 8.14 | | | | 1.60 | % |
| | | | |
Hypothetical (5% return before expenses) | | $ | 1,000.00 | | | $ | 1,017.02 | | | $ | 8.12 | | | | 1.60 | % |
| | | | | |
Class R6 | | | | | | | | | | | | | | | | |
| | | | |
Actual | | $ | 1,000.00 | | | $ | 1,031.03 | | | $ | 2.15 | | | | 0.42 | % |
| | | | |
Hypothetical (5% return before expenses) | | $ | 1,000.00 | | | $ | 1,022.95 | | | $ | 2.15 | | | | 0.42 | % |
| | | | | |
Administrator Class | | | | | | | | | | | | | | | | |
| | | | |
Actual | | $ | 1,000.00 | | | $ | 1,027.51 | | | $ | 3.93 | | | | 0.77 | % |
| | | | |
Hypothetical (5% return before expenses) | | $ | 1,000.00 | | | $ | 1,021.19 | | | $ | 3.92 | | | | 0.77 | % |
| | | | | |
Institutional Class | | | | | | | | | | | | | | | | |
| | | | |
Actual | | $ | 1,000.00 | | | $ | 1,028.81 | | | $ | 2.66 | | | | 0.52 | % |
| | | | |
Hypothetical (5% return before expenses) | | $ | 1,000.00 | | | $ | 1,022.45 | | | $ | 2.65 | | | | 0.52 | % |
| 1 | Expenses paid is equal to the annualized net expense ratio of each class multiplied by the average account value over the period, multiplied by the number of days in the most recent fiscal half-year divided by the number of days in the fiscal year (to reflect theone-half-year period). |
10 | Wells Fargo Diversified Income Builder Fund
Portfolio of investments—September 30, 2019
| | | | | | | | | | | | | | | | |
| | | Interest
rate | | | Maturity
date | | | Principal | | | Value | |
| Asset-Backed Securities: 1.06% | |
Avis Budget Rental Car Funding Series2019-2A Class C 144A | | | 4.24 | % | | | 9-22-2025 | | | $ | 2,000,000 | | | $ | 2,099,407 | |
Chesapeake Funding II LLC Series2018-1A Class D 144A | | | 3.92 | | | | 4-15-2030 | | | | 1,980,000 | | | | 2,030,397 | |
Hertz Vehicle Financing LLC Series2019-1A Class B 144A | | | 4.10 | | | | 3-25-2023 | | | | 1,380,000 | | | | 1,421,471 | |
Santander Retail Auto Lease Trust Series2019-A Class D 144A | | | 3.66 | | | | 5-20-2024 | | | | 2,000,000 | | | | 2,029,398 | |
| |
Total Asset-Backed Securities (Cost $7,396,996) | | | | 7,580,673 | |
| | | | | | | | | | | | | | | | |
| | | | |
| | | | | | | | | | | | | | | | |
| | | | Shares | | | | |
| Common Stocks: 26.97% | |
|
Communication Services: 0.83% | |
|
| Diversified Telecommunication Services: 0.45% | |
AT&T Incorporated | | | | 43,274 | | | | 1,637,488 | |
PT Telekomunikasi Indonesia Persero Tbk | | | | 1,149,500 | | | | 349,020 | |
Verizon Communications Incorporated | | | | 20,017 | | | | 1,208,226 | |
| | | | |
| | | | | | | | | | | | | | | 3,194,734 | |
| | | | | | | | | | | | | | | | |
|
| Media: 0.13% | |
Comcast Corporation Class A | | | | 21,325 | | | | 961,331 | |
| | | | | | | | | | | | | | | | |
|
| Wireless Telecommunication Services: 0.25% | |
China Mobile Limited | | | | 27,500 | | | | 227,538 | |
KDDI Corporation | | | | 32,066 | | | | 837,794 | |
Mobile TeleSystems PJSC ADR | | | | 27,131 | | | | 219,761 | |
MTN Group Limited | | | | 31,862 | | | | 202,596 | |
SK Telecom Company Limited | | | | 1,436 | | | | 289,925 | |
| | | | |
| | | | | | | | | | | | | | | 1,777,614 | |
| | | | | | | | | | | | | | | | |
|
Consumer Discretionary: 1.39% | |
|
| Automobiles: 0.39% | |
Geely Automobile Holdings Limited | | | | 77,000 | | | | 130,663 | |
General Motors Company | | | | 28,578 | | | | 1,071,103 | |
Guangzhou Automobile Group Company Limited H Shares | | | | 156,000 | | | | 149,278 | |
Hyundai Motor Company | | | | 1,405 | | | | 157,397 | |
Peugeot SA | | | | 50,738 | | | | 1,265,307 | |
| | | | |
| | | | | | | | | | | | | | | 2,773,748 | |
| | | | | | | | | | | | | | | | |
|
| Hotels, Restaurants & Leisure: 0.41% | |
Sands China Limited | | | | 301,654 | | | | 1,366,308 | |
Starbucks Corporation | | | | 9,191 | | | | 812,668 | |
Wyndham Worldwide Corporation | | | | 16,875 | | | | 776,588 | |
| | | | |
| | | | | | | | | | | | | | | 2,955,564 | |
| | | | | | | | | | | | | | | | |
|
| Household Durables: 0.27% | |
Coway Company Limited | | | | 2,960 | | | | 209,352 | |
Haier Smart Home Company Limited Class A | | | | 123,399 | | | | 264,486 | |
Midea Group Company Limited Class A | | | | 42,999 | | | | 307,807 | |
Persimmon plc | | | | 42,426 | | | | 1,131,978 | |
| | | | |
| | | | | | | | | | | | | | | 1,913,623 | |
| | | | | | | | | | | | | | | | |
|
| Multiline Retail: 0.13% | |
Target Corporation | | | | 8,619 | | | | 921,457 | |
| | | | | | | | | | | | | | | | |
Wells Fargo Diversified Income Builder Fund | 11
Portfolio of investments—September 30, 2019
| | | | | | | | | | | | | | | | |
| | | | | | | | | Shares | | | Value | |
| Specialty Retail: 0.06% | |
Chow Tai Fook Jewellery Company Limited | | | | | | | | | | | 241,000 | | | $ | 198,945 | |
Petrobras Distribuidora SA | | | | | | | | | | | 31,600 | | | | 209,376 | |
| | | | |
| | | | | | | | | | | | | | | 408,321 | |
| | | | | | | | | | | | | | | | |
|
| Textiles, Apparel & Luxury Goods: 0.13% | |
Eclat Textile Company Limited | | | | | | | | | | | 9,000 | | | | 120,856 | |
Kering SA | | | | | | | | | | | 1,667 | | | | 849,514 | |
| | | | |
| | | | | | | | | | | | | | | 970,370 | |
| | | | | | | | | | | | | | | | |
|
Consumer Staples: 1.07% | |
|
| Food & Staples Retailing: 0.32% | |
Koninklijke Ahold Delhaize NV | | | | | | | | | | | 31,472 | | | | 787,423 | |
Wal-Mart de Mexico SAB de CV | | | | | | | | | | | 76,000 | | | | 225,258 | |
Wal-Mart Stores Incorporated | | | | | | | | | | | 10,911 | | | | 1,294,917 | |
| | | | |
| | | | | | | | | | | | | | | 2,307,598 | |
| | | | | | | | | | | | | | | | |
|
| Food Products: 0.50% | |
Inner Mongolia Yili Industrial Group Company Limited Class A | | | | | | | | | | | 68,799 | | | | 274,872 | |
Lamb Weston Holdings Incorporated | | | | | | | | | | | 20,000 | | | | 1,454,400 | |
Nestle SA | | | | | | | | | | | 11,902 | | | | 1,291,267 | |
Uni-President China Holdings Limited | | | | | | | | | | | 152,000 | | | | 164,069 | |
Uni-President Enterprises Corporation | | | | | | | | | | | 58,000 | | | | 139,962 | |
WH Group Limited 144A | | | | | | | | | | | 317,500 | | | | 284,376 | |
| | | | |
| | | | | | | | | | | | | | | 3,608,946 | |
| | | | | | | | | | | | | | | | |
|
| Household Products: 0.22% | |
The Procter & Gamble Company | | | | | | | | | | | 12,507 | | | | 1,555,621 | |
| | | | | | | | | | | | | | | | |
|
| Personal Products: 0.03% | |
Hengan International Group Company Limited | | | | | | | | | | | 28,600 | | | | 187,560 | |
| | | | | | | | | | | | | | | | |
|
Energy: 4.50% | |
|
| Energy Equipment & Services: 0.02% | |
USA Compression Partners LP | | | | | | | | | | | 6,994 | | | | 120,786 | |
| | | | | | | | | | | | | | | | |
|
| Oil, Gas & Consumable Fuels: 4.48% | |
Alliance Resource Partners LP | | | | | | | | | | | 14,570 | | | | 233,266 | |
Black Stone Minerals LP | | | | | | | | | | | 23,603 | | | | 336,107 | |
BP Midstream Partners LP | | | | | | | | | | | 6,741 | | | | 98,419 | |
Buckeye Partners LP | | | | | | | | | | | 21,748 | | | | 893,625 | |
Calumet Specialty Products LP † | | | | | | | | | | | 8,590 | | | | 31,268 | |
Capital Product Partners LP | | | | | | | | | | | 1,979 | | | | 21,175 | |
Cheniere Energy Partners LP | | | | | | | | | | | 5,892 | | | | 267,968 | |
China Petroleum & Chemical Corporation H Shares | | | | | | | | | | | 472,000 | | | | 280,633 | |
CNOOC Limited | | | | | | | | | | | 522,297 | | | | 797,003 | |
CNX Midstream Partners LP | | | | | | | | | | | 5,908 | | | | 83,303 | |
ConocoPhillips | | | | | | | | | | | 16,500 | | | | 940,170 | |
Consol Coal Resources LP | | | | | | | | | | | 728 | | | | 9,828 | |
Crestwood Equity Partners LP | | | | | | | | | | | 6,864 | | | | 250,605 | |
CrossAmerica Partners LP | | | | | | | | | | | 1,517 | | | | 25,880 | |
DCP Midstream LP | | | | | | | | | | | 12,786 | | | | 335,121 | |
Delek Logistics Partners LP | | | | | | | | | | | 1,256 | | | | 39,300 | |
Dorchester Minerals LP | | | | | | | | | | | 4,090 | | | | 76,279 | |
Enable Midstream Partners LP | | | | | | | | | | | 7,954 | | | | 95,687 | |
Energy Transfer Equity LP | | | | | | | | | | | 319,325 | | | | 4,176,771 | |
12 | Wells Fargo Diversified Income Builder Fund
Portfolio of investments—September 30, 2019
| | | | | | | | | | | | | | | | |
| | | | | | | | | Shares | | | Value | |
|
| Oil, Gas & Consumable Fuels (continued) | |
Enterprise Products Partners | | | | | | | | | | | 210,651 | | | $ | 6,020,406 | |
Enviva Partners LP | | | | | | | | | | | 2,985 | | | | 95,371 | |
EQT Midstream Partners LP | | | | | | | | | | | 11,646 | | | | 380,824 | |
Gazprom PAO ADR | | | | | | | | | | | 33,474 | | | | 231,105 | |
Genesis Energy LP | | | | | | | | | | | 15,602 | | | | 334,975 | |
Global Partners LP | | | | | | | | | | | 3,912 | | | | 76,714 | |
Golar LNG Partners LP | | | | | | | | | | | 6,788 | | | | 65,029 | |
Green Plains Partners LP | | | | | | | | | | | 1,615 | | | | 21,447 | |
Hess Midstream Partners LP | | | | | | | | | | | 2,357 | | | | 45,396 | |
Holly Energy Partners LP | | | | | | | | | | | 6,447 | | | | 162,916 | |
Kimbell Royalty Partners LP | | | | | | | | | | | 3,095 | | | | 45,527 | |
Kinder Morgan Incorporated | | | | | | | | | | | 20,000 | | | | 412,200 | |
KNOT Offshore Partners LP | | | | | | | | | | | 3,077 | | | | 58,740 | |
LUKOIL PJSC ADR | | | | | | | | | | | 3,629 | | | | 300,263 | |
Magellan Midstream Partners LP | | | | | | | | | | | 32,284 | | | | 2,139,461 | |
MPLX LP | | | | | | | | | | | 53,612 | | | | 1,501,672 | |
Natural Resource Partners LP | | | | | | | | | | | 1,158 | | | | 29,355 | |
NGL Energy Partners LP | | | | | | | | | | | 17,832 | | | | 248,043 | |
Noble Midstream Partners LP | | | | | | | | | | | 3,091 | | | | 74,555 | |
NuStar Energy LP | | | | | | | | | | | 13,924 | | | | 394,328 | |
Oasis Midstream Partners LP | | | | | | | | | | | 1,528 | | | | 24,402 | |
ONEOK Incorporated | | | | | | | | | | | 24,000 | | | | 1,768,560 | |
PBF Logistics LP | | | | | | | | | | | 3,815 | | | | 80,687 | |
Pembina Pipeline Corporation | | | | | | | | | | | 21,224 | | | | 786,739 | |
PetroChina Company Limited H Shares | | | | | | | | | | | 380,000 | | | | 195,389 | |
Phillips 66 Partners LP | | | | | | | | | | | 14,034 | | | | 794,605 | |
Plains All American Pipeline LP | | | | | | | | | | | 81,713 | | | | 1,695,545 | |
PTT Exploration & Production plc | | | | | | | | | | | 38,200 | | | | 151,126 | |
Reliance Industries Limited GDR 144A | | | | | | | | | | | 15,987 | | | | 596,315 | |
S-Oil Corporation | | | | | | | | | | | 2,308 | | | | 191,795 | |
Shell Midstream Partners LP | | | | | | | | | | | 18,043 | | | | 368,979 | |
SK Innovation Company Limited | | | | | | | | | | | 1,773 | | | | 246,054 | |
Sprague Resources LP | | | | | | | | | | | 1,428 | | | | 25,276 | |
Summit Midstream Partners LP | | | | | | | | | | | 5,880 | | | | 28,577 | |
Sunoco LP | | | | | | | | | | | 7,635 | | | | 240,121 | |
Tatneft ADR | | | | | | | | | | | 2,241 | | | | 142,304 | |
TC Pipelines LP | | | | | | | | | | | 7,648 | | | | 311,044 | |
Teekay LNG Partners LP | | | | | | | | | | | 7,523 | | | | 102,689 | |
Teekay Offshore Partners LP | | | | | | | | | | | 15,739 | | | | 18,257 | |
Tupras Turkiye Petrol Rafinerileri AS | | | | | | | | | | | 5,672 | | | | 144,135 | |
USD Partners LP | | | | | | | | | | | 1,395 | | | | 14,578 | |
Valero Energy Corporation | | | | | | | | | | | 12,571 | | | | 1,071,552 | |
Viper Energy Partners LP | | | | | | | | | | | 8,829 | | | | 244,298 | |
Western Midstream Partners LP | | | | | | | | | | | 28,118 | | | | 699,857 | |
Whitehaven Coal Limited | | | | | | | | | | | 266,673 | | | | 559,772 | |
| | | | |
| | | | | | | | | | | | | | | 32,133,391 | |
| | | | | | | | | | | | | | | | |
|
Financials: 3.99% | |
|
| Banks: 1.09% | |
Absa Group Limited | | | | | | | | | | | 13,518 | | | | 136,447 | |
Banco de Brasil SA | | | | | | | | | | | 16,700 | | | | 182,838 | |
Banco Santander Brasil SA | | | | | | | | | | | 14,000 | | | | 152,738 | |
Bancolombia SA ADR | | | | | | | | | | | 3,290 | | | | 162,691 | |
Bangkok Bank PCL | | | | | | | | | | | 25,000 | | | | 143,861 | |
Bank of the Philippine Islands | | | | | | | | | | | 89,210 | | | | 160,072 | |
China Construction Bank H Shares | | | | | | | | | | | 770,000 | | | | 587,494 | |
Wells Fargo Diversified Income Builder Fund | 13
Portfolio of investments—September 30, 2019
| | | | | | | | | | | | | | | | |
| | | | | | | | | Shares | | | Value | |
|
| Banks (continued) | |
CIMB Group Holdings Bhd | | | | | | | | | | | 146,800 | | | $ | 176,356 | |
Citigroup Incorporated | | | | | | | | | | | 13,375 | | | | 923,945 | |
Credicorp Limited | | | | | | | | | | | 695 | | | | 144,866 | |
CTBC Financial Holding Company Limited | | | | | | | | | | | 35,000 | | | | 23,233 | |
Grupo Financiero Banorte SAB de CV | | | | | | | | | | | 30,720 | | | | 165,571 | |
Hana Financial Group Incorporated | | | | | | | | | | | 6,499 | | | | 191,523 | |
HDFC Bank Limited ADR | | | | | | | | | | | 5,908 | | | | 337,051 | |
ICICI Bank Limited ADR | | | | | | | | | | | 25,227 | | | | 307,265 | |
Industrial & Commercial Bank of China Limited H Shares | | | | | | | | | | | 719,000 | | | | 481,615 | |
ING Groep NV | | | | | | | | | | | 90,800 | | | | 950,484 | |
JPMorgan Chase & Company | | | | | | | | | | | 11,947 | | | | 1,406,042 | |
KB Financial Group Incorporated | | | | | | | | | | | 6,066 | | | | 216,543 | |
PT Bank Rakyat Indonesia Tbk | | | | | | | | | | | 988,900 | | | | 287,021 | |
Qatar National Bank | | | | | | | | | | | 30,440 | | | | 161,238 | |
Sberbank of Russia ADR | | | | | | | | | | | 20,866 | | | | 295,776 | |
Standard Bank Group Limited | | | | | | | | | | | 17,634 | | | | 203,399 | |
| | | | |
| | | | | | | | | | | | | | | 7,798,069 | |
| | | | | | | | | | | | | | | | |
|
| Capital Markets: 0.62% | |
3i Group plc | | | | | | | | | | | 62,073 | | | | 890,294 | |
Ares Capital Corporation | | | | | | | | | | | 87,753 | | | | 1,635,277 | |
B3 Brasil Bolsa Balcao SA | | | | | | | | | | | 42,600 | | | | 447,331 | |
Banco BTG Pactual SA | | | | | | | | | | | 17,200 | | | | 242,376 | |
CITIC Securities Company Limited H Shares | | | | | | | | | | | 116,000 | | | | 217,268 | |
Intermediate Capital Group | | | | | | | | | | | 46,988 | | | | 840,613 | |
NH Investment & Securities Company Limited | | | | | | | | | | | 14,720 | | | | 156,288 | |
| | | | |
| | | | | | | | | | | | | | | 4,429,447 | |
| | | | | | | | | | | | | | | | |
|
| Consumer Finance: 0.21% | |
Discover Financial Services | | | | | | | | | | | 9,138 | | | | 741,000 | |
Navient Corporation | | | | | | | | | | | 61,975 | | | | 793,280 | |
| | | | |
| | | | | | | | | | | | | | | 1,534,280 | |
| | | | | | | | | | | | | | | | |
|
| Diversified Financial Services: 0.12% | |
Metro Pacific Investments Corporation | | | | | | | | | | | 1,643,000 | | | | 157,865 | |
ORIX Corporation | | | | | | | | | | | 47,800 | | | | 712,192 | |
| | | | |
| | | | | | | | | | | | | | | 870,057 | |
| | | | | | | | | | | | | | | | |
|
| Insurance: 1.38% | |
Allianz AG | | | | | | | | | | | 3,373 | | | | 786,199 | |
China Life Insurance Company H Shares | | | | | | | | | | | 61,000 | | | | 141,337 | |
Chubb Limited | | | | | | | | | | | 20,000 | | | | 3,228,800 | |
Legal & General Group plc | | | | | | | | | | | 317,284 | | | | 969,049 | |
PICC Property & Casualty Company Limited H Shares | | | | | | | | | | | 146,000 | | | | 170,445 | |
Ping An Insurance Group Company H Shares | | | | | | | | | | | 136,900 | | | | 1,572,891 | |
Powszechny Zaklad Ubezpieczen SA | | | | | | | | | | | 20,114 | | | | 187,492 | |
Sanlam Limited | | | | | | | | | | | 27,821 | | | | 137,002 | |
The Allstate Corporation | | | | | | | | | | | 25,000 | | | | 2,717,000 | |
| | | | |
| | | | | | | | | | | | | | | 9,910,215 | |
| | | | | | | | | | | | | | | | |
|
| Mortgage REITs: 0.57% | |
Ladder Capital Corporation | | | | | | | | | | | 67,560 | | | | 1,166,761 | |
MFA Financial Incorporated | | | | | | | | | | | 151,228 | | | | 1,113,038 | |
New Residential Investment Corporation | | | | | | | | | | | 55,640 | | | | 872,435 | |
Redwood Trust Incorporated | | | | | | | | | | | 55,115 | | | | 904,437 | |
| | | | |
| | | | | | | | | | | | | | | 4,056,671 | |
| | | | | | | | | | | | | | | | |
14 | Wells Fargo Diversified Income Builder Fund
Portfolio of investments—September 30, 2019
| | | | | | | | | | | | | | | | |
| | | | | | | | | Shares | | | Value | |
|
Health Care: 2.40% | |
|
| Biotechnology: 0.32% | |
Amgen Incorporated | | | | | | | | | | | 6,572 | | | $ | 1,271,748 | |
Gilead Sciences Incorporated | | | | | | | | | | | 16,760 | | | | 1,062,249 | |
| | | | |
| | | | | | | | | | | | | | | 2,333,997 | |
| | | | | | | | | | | | | | | | |
|
| Health Care Equipment & Supplies: 0.61% | |
Abbott Laboratories | | | | | | | | | | | 25,000 | | | | 2,091,750 | |
Becton Dickinson & Company | | | | | | | | | | | 5,000 | | | | 1,264,800 | |
Danaher Corporation | | | | | | | | | | | 7,000 | | | | 1,011,010 | |
| | | | |
| | | | | | | | | | | | | | | 4,367,560 | |
| | | | | | | | | | | | | | | | |
|
| Health Care Providers & Services: 0.26% | |
Anthem Incorporated | | | | | | | | | | | 2,898 | | | | 695,810 | |
Sinopharm Group Company Limited H Shares | | | | | | | | | | | 68,400 | | | | 214,249 | |
UnitedHealth Group Incorporated | | | | | | | | | | | 4,342 | | | | 943,603 | |
| | | | |
| | | | | | | | | | | | | | | 1,853,662 | |
| | | | | | | | | | | | | | | | |
|
| Life Sciences Tools & Services: 0.26% | |
Agilent Technologies Incorporated | | | | | | | | | | | 5,000 | | | | 383,150 | |
Thermo Fisher Scientific Incorporated | | | | | | | | | | | 5,000 | | | | 1,456,350 | |
| | | | |
| | | | | | | | | | | | | | | 1,839,500 | |
| | | | | | | | | | | | | | | | |
|
| Pharmaceuticals: 0.95% | |
Astellas Pharma Incorporated | | | | | | | | | | | 73,762 | | | | 1,049,552 | |
Bristol-Myers Squibb Company | | | | | | | | | | | 20,589 | | | | 1,044,068 | |
GlaxoSmithKline plc | | | | | | | | | | | 42,492 | | | | 911,484 | |
Johnson & Johnson | | | | | | | | | | | 12,125 | | | | 1,568,733 | |
Roche Holding AG | | | | | | | | | | | 3,719 | | | | 1,082,294 | |
Sanofi SA | | | | | | | | | | | 12,100 | | | | 1,121,805 | |
| | | | |
| | | | | | | | | | | | | | | 6,777,936 | |
| | | | | | | | | | | | | | | | |
|
Industrials: 2.87% | |
|
| Aerospace & Defense: 0.74% | |
Curtiss-Wright Corporation | | | | | | | | | | | 14,000 | | | | 1,811,180 | |
Huntington Ingalls Industries Incorporated | | | | | | | | | | | 8,000 | | | | 1,694,320 | |
Raytheon Company | | | | | | | | | | | 9,000 | | | | 1,765,710 | |
| | | | |
| | | | | | | | | | | | | | | 5,271,210 | |
| | | | | | | | | | | | | | | | |
|
| Airlines: 0.14% | |
Aeroflot PJSC | | | | | | | | | | | 93,360 | | | | 149,278 | |
Air China H Shares | | | | | | | | | | | 166,000 | | | | 146,140 | |
Delta Air Lines Incorporated | | | | | | | | | | | 12,047 | | | | 693,907 | |
| | | | |
| | | | | | | | | | | | | | | 989,325 | |
| | | | | | | | | | | | | | | | |
|
| Construction & Engineering: 0.11% | |
China Communications Construction Company Limited H Shares | | | | | | | | | | | 272,000 | | | | 212,736 | |
China Communications Services Corporation Limited H Shares | | | | | | | | | | | 256,000 | | | | 145,022 | |
China State Construction Engineering Corporation Limited Class A | | | | | | | | | | | 228,400 | | | | 173,738 | |
China State Construction International Holdings | | | | | | | | | | | 286,000 | | | | 268,933 | |
| | | | |
| | | | | | | | | | | | | | | 800,429 | |
| | | | | | | | | | | | | | | | |
|
| Electrical Equipment: 0.35% | |
AMETEK Incorporated | | | | | | | | | | | 15,000 | | | | 1,377,300 | |
Schneider Electric SE | | | | | | | | | | | 13,105 | | | | 1,149,846 | |
| | | | |
| | | | | | | | | | | | | | | 2,527,146 | |
| | | | | | | | | | | | | | | | |
Wells Fargo Diversified Income Builder Fund | 15
Portfolio of investments—September 30, 2019
| | | | | | | | | | | | | | | | |
| | | | | | | | | Shares | | | Value | |
| Industrial Conglomerates: 0.47% | |
Honeywell International Incorporated | | | | | | | | | | | 17,025 | | | $ | 2,880,630 | |
Sime Darby Bhd | | | | | | | | | | | 413,700 | | | | 222,313 | |
The Bidvest Group Limited | | | | | | | | | | | 21,714 | | | | 273,572 | |
| | | | |
| | | | | | | | | | | | | | | 3,376,515 | |
| | | | | | | | | | | | | | | | |
|
| Machinery: 0.83% | |
Hyundai Robotics Company Limited | | | | | | | | | | | 632 | | | | 184,662 | |
IDEX Corporation | | | | | | | | | | | 9,000 | | | | 1,474,920 | |
Ingersoll-Rand plc | | | | | | | | | | | 9,225 | | | | 1,136,612 | |
John Bean Technologies Corporation | | | | | | | | | | | 20,000 | | | | 1,988,600 | |
Sany Heavy Industry Company Limited Class A | | | | | | | | | | | 80,700 | | | | 161,436 | |
Volvo AB Class B | | | | | | | | | | | 58,974 | | | | 828,232 | |
Zhengzhou Yutong Bus Company Limited | | | | | | | | | | | 104,600 | | | | 203,679 | |
| | | | |
| | | | | | | | | | | | | | | 5,978,141 | |
| | | | | | | | | | | | | | | | |
|
| Trading Companies & Distributors: 0.15% | |
Itochu Corporation | | | | | | | | | | | 52,753 | | | | 1,088,480 | |
| | | | | | | | | | | | | | | | |
|
| Transportation Infrastructure: 0.08% | |
Beijing Capital International Airport Company Limited H Shares | | | | | | | | | | | 256,000 | | | | 218,513 | |
China Merchants Port Holdings Company Limited | | | | | | | | | | | 120,000 | | | | 180,665 | |
Grupo Aeroportuario del Pacifico SAB de CV Class B | | | | | | | | | | | 15,240 | | | | 147,087 | |
| | | | |
| | | | | | | | | | | | | | | 546,265 | |
| | | | | | | | | | | | | | | | |
|
Information Technology: 5.61% | |
|
| Communications Equipment: 0.41% | |
Accton Technology Corporation | | | | | | | | | | | 35,000 | | | | 184,361 | |
Cisco Systems Incorporated | | | | | | | | | | | 55,380 | | | | 2,736,326 | |
| | | | |
| | | | | | | | | | | | | | | 2,920,687 | |
| | | | | | | | | | | | | | | | |
|
| Electronic Equipment, Instruments & Components: 0.92% | |
Amphenol Corporation Class A | | | | | | | | | | | 25,000 | | | | 2,412,500 | |
Corning Incorporated | | | | | | | | | | | 85,000 | | | | 2,424,200 | |
Delta Electronics Incorporated | | | | | | | | | | | 53,000 | | | | 226,438 | |
FLIR Systems Incorporated | | | | | | | | | | | 22,000 | | | | 1,156,980 | |
Hon Hai Precision Industry Company Limited | | | | | | | | | | | 80,600 | | | | 190,185 | |
Largan Precision Company Limited | | | | | | | | | | | 1,200 | | | | 171,649 | |
| | | | |
| | | | | | | | | | | | | | | 6,581,952 | |
| | | | | | | | | | | | | | | | |
|
| IT Services: 0.84% | |
Infosys Limited ADR | | | | | | | | | | | 58,053 | | | | 660,063 | |
International Business Machines Corporation | | | | | | | | | | | 9,475 | | | | 1,377,855 | |
Leidos Holdings Incorporated | | | | | | | | | | | 30,000 | | | | 2,576,400 | |
Visa Incorporated Class A | | | | | | | | | | | 8,314 | | | | 1,430,091 | |
| | | | |
| | | | | | | | | | | | | | | 6,044,409 | |
| | | | | | | | | | | | | | | | |
|
| Semiconductors & Semiconductor Equipment: 1.48% | |
ASE Industrial Holding Company Limited | | | | | | | | | | | 77,000 | | | | 175,314 | |
Broadcom Incorporated | | | | | | | | | | | 10,000 | | | | 2,760,700 | |
Cypress Semiconductor Corporation | | | | | | | | | | | 100,000 | | | | 2,334,000 | |
Mediatek Incorporated | | | | | | | | | | | 45,600 | | | | 542,535 | |
Microchip Technology Incorporated | | | | | | | | | | | 9,000 | | | | 836,190 | |
SK Hynix Incorporated | | | | | | | | | | | 5,647 | | | | 388,065 | |
Taiwan Semiconductor Manufacturing Company Limited | | | | | | | | | | | 175,000 | | | | 1,554,267 | |
Texas Instruments Incorporated | | | | | | | | | | | 15,810 | | | | 2,043,284 | |
| | | | |
| | | | | | | | | | | | | | | 10,634,355 | |
| | | | | | | | | | | | | | | | |
16 | Wells Fargo Diversified Income Builder Fund
Portfolio of investments—September 30, 2019
| | | | | | | | | | | | | | | | |
| | | | | | | | | Shares | | | Value | |
| Software: 1.05% | |
Adobe Systems Incorporated † | | | | | | | | | | | 7,000 | | | $ | 1,933,750 | |
Microsoft Corporation | | | | | | | | | | | 19,166 | | | | 2,664,649 | |
SAP SE | | | | | | | | | | | 7,418 | | | | 872,237 | |
Synopsys Incorporated † | | | | | | | | | | | 15,000 | | | | 2,058,750 | |
| | | | |
| | | | | | | | | | | | | | | 7,529,386 | |
| | | | | | | | | | | | | | | | |
|
| Technology Hardware, Storage & Peripherals: 0.91% | |
Advantech Company Limited | | | | | | | | | | | 18,000 | | | | 158,331 | |
Apple Incorporated | | | | | | | | | | | 5,990 | | | | 1,341,580 | |
Ennoconn Corporation | | | | | | | | | | | 17,000 | | | | 120,185 | |
Lenovo Group Limited | | | | | | | | | | | 1,582,000 | | | | 1,055,649 | |
Samsung Electronics Company Limited | | | | | | | | | | | 37,561 | | | | 1,540,248 | |
Western Digital Corporation | | | | | | | | | | | 20,000 | | | | 1,192,800 | |
Wiwynn Corporation | | | | | | | | | | | 21,000 | | | | 298,834 | |
Xerox Holdings Corporation | | | | | | | | | | | 26,430 | | | | 790,521 | |
| | | | |
| | | | | | | | | | | | | | | 6,498,148 | |
| | | | | | | | | | | | | | | | |
|
Materials: 1.10% | |
|
| Chemicals: 0.50% | |
Celanese Corporation Series A | | | | | | | | | | | 6,000 | | | | 733,740 | |
Ciner Resources LP | | | | | | | | | | | 721 | | | | 13,310 | |
CVR Partners LP | | | | | | | | | | | 10,817 | | | | 41,970 | |
LyondellBasell Industries NV Class A | | | | | | | | | | | 29,150 | | | | 2,608,051 | |
Wanhua Chemical Group Company Limited Class A | | | | | | | | | | | 21,600 | | | | 133,593 | |
Westlake Chemical Partners LP | | | | | | | | | | | 2,773 | | | | 64,445 | |
| | | | |
| | | | | | | | | | | | | | | 3,595,109 | |
| | | | | | | | | | | | | | | | |
|
| Metals & Mining: 0.57% | |
Anglo American plc | | | | | | | | | | | 57,686 | | | | 1,327,200 | |
Barrick Gold Corporation | | | | | | | | | | | 50,357 | | | | 871,180 | |
Fortescue Metals Group Limited | | | | | | | | | | | 187,370 | | | | 1,112,896 | |
Korea Zinc Company Limited | | | | | | | | | | | 536 | | | | 200,751 | |
Polymetal International plc | | | | | | | | | | | 15,850 | | | | 222,167 | |
POSCO | | | | | | | | | | | 822 | | | | 155,995 | |
Vale SA † | | | | | | | | | | | 18,200 | | | | 209,160 | |
| | | | |
| | | | | | | | | | | | | | | 4,099,349 | |
| | | | | | | | | | | | | | | | |
|
| Paper & Forest Products: 0.03% | |
Mondi plc | | | | | | | | | | | 8,101 | | | | 155,186 | |
Pope Resources LP | | | | | | | | | | | 455 | | | | 32,087 | |
| | | | |
| | | | | | | | | | | | | | | 187,273 | |
| | | | | | | | | | | | | | | | |
|
Real Estate: 1.16% | |
|
| Equity REITs: 0.84% | |
Crown Castle International Corporation | | | | | | | | | | | 20,000 | | | | 2,780,200 | |
Growthpoint Properties Limited | | | | | | | | | | | 94,613 | | | | 144,309 | |
Saul Centers Incorporated | | | | | | | | | | | 35,000 | | | | 1,907,850 | |
VEREIT Incorporated | | | | | | | | | | | 115,709 | | | | 1,131,634 | |
| | | | |
| | | | | | | | | | | | | | | 5,963,993 | |
| | | | | | | | | | | | | | | | |
|
| Real Estate Management & Development: 0.32% | |
Ascendas India Trust | | | | | | | | | | | 211,400 | | | | 238,602 | |
China Merchants Shekou Industrial Zone Holdings Company Limited Class A | | | | | | | | | | | 68,700 | | | | 182,760 | |
China Overseas Land & Investment Limited | | | | | | | | | | | 83,400 | | | | 262,298 | |
Wells Fargo Diversified Income Builder Fund | 17
Portfolio of investments—September 30, 2019
| | | | | | | | | | | | | | | | |
| | | | | | | | | Shares | | | Value | |
|
| Real Estate Management & Development (continued) | |
China Resources Land Limited | | | | | | | | | | | 69,350 | | | $ | 290,665 | |
China Vanke Company Limited Class A | | | | | | | | | | | 50,294 | | | | 182,480 | |
Logan Property Holdings Company Limited | | | | | | | | | | | 662,442 | | | | 943,243 | |
Shimao Property Holding Limited | | | | | | | | | | | 72,000 | | | | 210,368 | |
| | | | |
| | | | | | | | | | | | | | | 2,310,416 | |
| | | | | | | | | | | | | | | | |
|
Utilities: 2.05% | |
|
| Electric Utilities: 0.62% | |
American Electric Power Company Incorporated | | | | | | | | | | | 34,000 | | | | 3,185,460 | |
Enel Americas SA ADR | | | | | | | | | | | 22,510 | | | | 205,066 | |
Neoenergia SA | | | | | | | | | | | 60,486 | | | | 299,449 | |
Red Eléctrica de Espana SA | | | | | | | | | | | 38,197 | | | | 775,828 | |
| | | | |
| | | | | | | | | | | | | | | 4,465,803 | |
| | | | | | | | | | | | | | | | |
|
| Gas Utilities: 0.37% | |
Atmos Energy Corporation | | | | | | | | | | | 20,000 | | | | 2,277,800 | |
Infraestructura Energetica Nova SAB de CV † | | | | | | | | | | | 52,200 | | | | 207,726 | |
Suburban Propane Partners LP | | | | | | | | | | | 8,739 | | | | 206,503 | |
| | | | |
| | | | | | | | | | | | | | | 2,692,029 | |
| | | | | | | | | | | | | | | | |
|
| Independent Power & Renewable Electricity Producers: 0.26% | |
Brookfield Renewable Partner LP | | | | | | | | | | | 12,449 | | | | 505,678 | |
Drax Group plc | | | | | | | | | | | 239,949 | | | | 814,871 | |
Vistra Energy Corporation | | | | | | | | | | | 20,000 | | | | 534,600 | |
| | | | |
| | | | | | | | | | | | | | | 1,855,149 | |
| | | | | | | | | | | | | | | | |
|
| Multi-Utilities: 0.77% | |
Brookfield Infrastructure Partners LP | | | | | | | | | | | 20,367 | | | | 1,010,407 | |
CMS Energy Corporation | | | | | | | | | | | 37,000 | | | | 2,366,150 | |
DTE Energy Company | | | | | | | | | | | 16,000 | | | | 2,127,360 | |
| | | | |
| | | | | | | | | | | | | | | 5,503,917 | |
| | | | | | | | | | | | | | | | |
|
| Water Utilities: 0.03% | |
Beijing Enterprises Water Group Limited | | | | | | | | | | | 380,000 | | | | 194,419 | |
| | | | | | | | | | | | | | | | |
| |
Total Common Stocks (Cost $170,714,890) | | | | 193,215,963 | |
| | | | | | | | | | | | | | | | |
| | | | |
| | | | | | | | | | | | | | | | |
| | | Interest
rate | | | Maturity
date | | | Principal | | | | |
| Corporate Bonds and Notes: 49.27% | |
|
Communication Services: 0.92% | |
|
| Media: 0.92% | |
McGraw-Hill Global Education Holdings LLC 144A | | | 7.88 | % | | | 5-15-2024 | | | $ | 7,598,000 | | | | 6,572,270 | |
| | | | | | | | | | | | | | | | |
|
Consumer Discretionary: 4.10% | |
|
| Auto Components: 1.38% | |
Dana Holding Corporation | | | 5.50 | | | | 12-15-2024 | | | | 3,925,000 | | | | 3,993,688 | |
Tenneco Incorporated | | | 5.00 | | | | 7-15-2026 | | | | 7,250,000 | | | | 5,945,000 | |
| | | | |
| | | | | | | | | | | | | | | 9,938,688 | |
| | | | | | | | | | | | | | | | |
|
| Hotels, Restaurants & Leisure: 0.34% | |
1929 Fieldhouse LLC / West Ward Street Development Corporation 144A | | | 5.25 | | | | 6-1-2020 | | | | 2,410,000 | | | | 2,428,960 | |
| | | | | | | | | | | | | | | | |
18 | Wells Fargo Diversified Income Builder Fund
Portfolio of investments—September 30, 2019
| | | | | | | | | | | | | | | | |
| | | Interest
rate | | | Maturity
date | | | Principal | | | Value | |
| Household Durables: 1.75% | |
Installed Building Company 144A | | | 5.75 | % | | | 2-1-2028 | | | $ | 12,140,000 | | | $ | 12,519,375 | |
| | | | | | | | | | | | | | | | |
|
| Specialty Retail: 0.63% | |
Group 1 Automotive Incorporated | | | 5.00 | | | | 6-1-2022 | | | | 4,453,000 | | | | 4,497,530 | |
| | | | | | | | | | | | | | | | |
|
Consumer Staples: 2.20% | |
|
| Food Products: 2.20% | |
Lamb Weston Holdings Incorporated 144A | | | 4.63 | | | | 11-1-2024 | | | | 13,000,000 | | | | 13,681,200 | |
Post Holdings Incorporated 144A | | | 5.00 | | | | 8-15-2026 | | | | 2,000,000 | | | | 2,074,200 | |
| | | | |
| | | | | | | | | | | | | | | 15,755,400 | |
| | | | | | | | | | | | | | | | |
|
Energy: 1.45% | |
|
| Oil, Gas & Consumable Fuels: 1.45% | |
Cheniere Corpus Christi Holdings LLC | | | 5.13 | | | | 6-30-2027 | | | | 9,500,000 | | | | 10,402,500 | |
| | | | | | | | | | | | | | | | |
|
Financials: 0.65% | |
|
| Banks: 0.49% | |
Allied Irish Banks plc | | | 7.38 | | | | 12-29-2049 | | | | 3,000,000 | | | | 3,469,639 | |
| | | | | | | | | | | | | | | | |
|
| Diversified Financial Services: 0.16% | |
Toll Road Investors Partnership II 144A¤ | | | 0.00 | | | | 2-15-2030 | | | | 2,000,000 | | | | 1,161,852 | |
| | | | | | | | | | | | | | | | |
|
Health Care: 9.90% | |
|
| Health Care Equipment & Supplies: 2.46% | |
Hologic Incorporated 144A | | | 4.38 | | | | 10-15-2025 | | | | 7,000,000 | | | | 7,175,000 | |
Teleflex Incorporated | | | 4.63 | | | | 11-15-2027 | | | | 1,984,000 | | | | 2,070,800 | |
Teleflex Incorporated | | | 4.88 | | | | 6-1-2026 | | | | 8,000,000 | | | | 8,340,000 | |
| | | | |
| | | | | | | | | | | | | | | 17,585,800 | |
| | | | | | | | | | | | | | | | |
|
| Health Care Providers & Services: 5.35% | |
AMN Healthcare Incorporated 144A | | | 5.13 | | | | 10-1-2024 | | | | 9,335,000 | | | | 9,685,063 | |
Davita Incorporated | | | 5.00 | | | | 5-1-2025 | | | | 9,000,000 | | | | 8,966,250 | |
HCA Incorporated | | | 5.38 | | | | 2-1-2025 | | | | 9,500,000 | | | | 10,378,750 | |
HealthSouth Corporation | | | 5.13 | | | | 3-15-2023 | | | | 2,000,000 | | | | 2,035,000 | |
St. Joseph’s Hospital & Medical Center | | | 3.93 | | | | 7-1-2022 | | | | 2,000,000 | | | | 2,052,568 | |
West Street Merger Subordinate Bond Incorporated 144A | | | 6.38 | | | | 9-1-2025 | | | | 5,700,000 | | | | 5,244,000 | |
| | | | |
| | | | | | | | | | | | | | | 38,361,631 | |
| | | | | | | | | | | | | | | | |
|
| Health Care Technology: 0.15% | |
Quintiles IMS Holdings Incorporated 144A | | | 5.00 | | | | 10-15-2026 | | | | 1,000,000 | | | | 1,047,500 | |
| | | | | | | | | | | | | | | | |
|
| Life Sciences Tools & Services: 0.75% | |
Charles River Laboratories Incorporated 144A | | | 5.50 | | | | 4-1-2026 | | | | 5,075,000 | | | | 5,398,430 | |
| | | | | | | | | | | | | | | | |
| | | | |
| Pharmaceuticals: 1.19% | | | | | | | | | | | | |
Catalent Pharma Solutions Incorporated 144A | | | 4.88 | | | | 1-15-2026 | | | | 8,300,000 | | | | 8,538,625 | |
| | | | | | | | | | | | | | | | |
| | | | |
Industrials: 9.18% | | | | | | | | | | | | | | | | |
| | | | |
| Aerospace & Defense: 2.07% | | | | | | | | | | | | |
Moog Incorporated 144A | | | 5.25 | | | | 12-1-2022 | | | | 5,500,000 | | | | 5,589,375 | |
TransDigm Group Incorporated | | | 6.38 | | | | 6-15-2026 | | | | 8,800,000 | | | | 9,251,000 | |
| | | | |
| | | | | | | | | | | | | | | 14,840,375 | |
| | | | | | | | | | | | | | | | |
Wells Fargo Diversified Income Builder Fund | 19
Portfolio of investments—September 30, 2019
| | | | | | | | | | | | | | | | |
| | | Interest
rate | | | Maturity
date | | | Principal | | | Value | |
| Commercial Services & Supplies: 1.32% | |
ACCO Brands Corporation 144A | | | 5.25 | % | | | 12-15-2024 | | | $ | 5,000,000 | | | $ | 5,175,000 | |
Northern Light Health | | | 5.02 | | | | 7-1-2036 | | | | 1,000,000 | | | | 1,039,165 | |
South Nassau Communities Hospital Incorporated | | | 4.65 | | | | 8-1-2048 | | | | 2,000,000 | | | | 2,213,562 | |
Stericycle Incorporated 144A | | | 5.38 | | | | 7-15-2024 | | | | 1,000,000 | | | | 1,027,500 | |
| | | | |
| | | | | | | | | | | | | | | 9,455,227 | |
| | | | | | | | | | | | | | | | |
|
| Construction & Engineering: 0.29% | |
Aecom Company | | | 5.13 | | | | 3-15-2027 | | | | 2,000,000 | | | | 2,100,000 | |
| | | | | | | | | | | | | | | | |
|
| Electrical Equipment: 0.89% | |
Resideo Funding Incorporated 144A | | | 6.13 | | | | 11-1-2026 | | | | 6,000,000 | | | | 6,330,000 | |
| | | | | | | | | | | | | | | | |
|
| Machinery: 3.32% | |
Actuant Corporation | | | 5.63 | | | | 6-15-2022 | | | | 1,165,000 | | | | 1,175,194 | |
HD Supply Incorporated 144A | | | 5.38 | | | | 10-15-2026 | | | | 8,100,000 | | | | 8,575,875 | |
Oshkosh Corporation | | | 5.38 | | | | 3-1-2025 | | | | 3,675,000 | | | | 3,817,406 | |
SPX FLOW Incorporated 144A | | | 5.63 | | | | 8-15-2024 | | | | 4,500,000 | | | | 4,646,250 | |
SPX FLOW Incorporated 144A | | | 5.88 | | | | 8-15-2026 | | | | 5,328,000 | | | | 5,567,760 | |
| | | | |
| | | | | | | | | | | | | | | 23,782,485 | |
| | | | | | | | | | | | | | | | |
|
| Trading Companies & Distributors: 1.29% | |
WESCO Distribution Incorporated | | | 5.38 | | | | 6-15-2024 | | | | 8,974,000 | | | | 9,265,655 | |
| | | | | | | | | | | | | | | | |
|
Information Technology: 7.96% | |
|
| Communications Equipment: 0.75% | |
CommScope Technologies Finance LLC 144A | | | 5.00 | | | | 3-15-2027 | | | | 6,500,000 | | | | 5,362,500 | |
| | | | | | | | | | | | | | | | |
|
| Electronic Equipment, Instruments & Components: 3.23% | |
Anixter International Incorporated | | | 5.13 | | | | 10-1-2021 | | | | 3,000,000 | | | | 3,120,000 | |
MTS Systems Corporation 144A | | | 5.75 | | | | 8-15-2027 | | | | 3,400,000 | | | | 3,536,000 | |
TTM Technologies Incorporated 144A | | | 5.63 | | | | 10-1-2025 | | | | 16,495,000 | | | | 16,495,000 | |
| | | | |
| | | | | | | | | | | | | | | 23,151,000 | |
| | | | | | | | | | | | | | | | |
|
| IT Services: 0.29% | |
Gartner Incorporated 144A | | | 5.13 | | | | 4-1-2025 | | | | 2,000,000 | | | | 2,092,500 | |
| | | | | | | | | | | | | | | | |
|
| Semiconductors & Semiconductor Equipment: 2.28% | |
Micron Technology Incorporated | | | 5.50 | | | | 2-1-2025 | | | | 6,750,000 | | | | 6,936,815 | |
Versum Materials Incorporated 144A | | | 5.50 | | | | 9-30-2024 | | | | 8,834,000 | | | | 9,408,210 | |
| | | | |
| | | | | | | | | | | | | | | 16,345,025 | |
| | | | | | | | | | | | | | | | |
|
| Software: 0.29% | |
Nuance Communications Company | | | 6.00 | | | | 7-1-2024 | | | | 2,000,000 | | | | 2,090,000 | |
| | | | | | | | | | | | | | | | |
|
| Technology Hardware, Storage & Peripherals: 1.12% | |
Diebold Nixdorf Incorporated | | | 8.50 | | | | 4-15-2024 | | | | 8,500,000 | | | | 7,990,000 | |
| | | | | | | | | | | | | | | | |
|
Materials: 10.23% | |
|
| Chemicals: 7.41% | |
Koppers Incorporated 144A | | | 6.00 | | | | 2-15-2025 | | | | 13,150,000 | | | | 13,158,285 | |
Olin Corporation | | | 5.13 | | | | 9-15-2027 | | | | 5,000,000 | | | | 5,112,500 | |
Olin Corporation | | | 5.50 | | | | 8-15-2022 | | | | 5,500,000 | | | | 5,802,500 | |
Rayonier Advanced Materials Products Incorporated 144A | | | 5.50 | | | | 6-1-2024 | | | | 8,000,000 | | | | 5,845,000 | |
ScottsMiracle-Gro Company | | | 5.25 | | | | 12-15-2026 | | | | 4,000,000 | | | | 4,200,000 | |
ScottsMiracle-Gro Company | | | 6.00 | | | | 10-15-2023 | | | | 6,000,000 | | | | 6,189,000 | |
20 | Wells Fargo Diversified Income Builder Fund
Portfolio of investments—September 30, 2019
| | | | | | | | | | | | | | | | |
| | | Interest
rate | | | Maturity
date | | | Principal | | | Value | |
|
| Chemicals (continued) | |
Valvoline Incorporated | | | 4.38 | % | | | 8-15-2025 | | | $ | 12,000,000 | | | $ | 12,210,000 | |
Valvoline Incorporated | | | 5.50 | | | | 7-15-2024 | | | | 500,000 | | | | 520,000 | |
| | | | |
| | | | | | | | | | | | | | | 53,037,285 | |
| | | | | |
|
| Containers & Packaging: 2.51% | |
Ball Corporation | | | 4.00 | | | | 11-15-2023 | | | | 1,000,000 | | | | 1,046,250 | |
Ball Corporation | | | 5.00 | | | | 3-15-2022 | | | | 2,500,000 | | | | 2,638,150 | |
Berry Global Incorporated | | | 5.13 | | | | 7-15-2023 | | | | 6,500,000 | | | | 6,670,625 | |
Sealed Air Corporation 144A | | | 5.25 | | | | 4-1-2023 | | | | 4,650,000 | | | | 4,952,250 | |
Sealed Air Corporation 144A | | | 5.50 | | | | 9-15-2025 | | | | 2,500,000 | | | | 2,693,750 | |
| | | | |
| | | | | | | | | | | | | | | 18,001,025 | |
| | | | | |
|
| Metals & Mining: 0.31% | |
Commercial Metals Company | | | 4.88 | | | | 5-15-2023 | | | | 2,150,000 | | | | 2,230,625 | |
| | | | | |
|
Real Estate: 2.68% | |
|
| Equity REITs: 2.68% | |
Equinix Incorporated | | | 5.38 | | | | 5-15-2027 | | | | 5,000,000 | | | | 5,390,625 | |
Equinix Incorporated | | | 5.75 | | | | 1-1-2025 | | | | 1,500,000 | | | | 1,561,950 | |
Iron Mountain Incorporated 144A | | | 4.88 | | | | 9-15-2027 | | | | 12,000,000 | | | | 12,272,160 | |
| | | | |
| | | | | | | | | | | | | | | 19,224,735 | |
| | | | | |
| |
Total Corporate Bonds and Notes (Cost $350,404,877) | | | | 352,976,637 | |
| | | | | |
| |
| | | | | |
| | | | Shares | | | | |
| Exchange-Traded Funds: 0.03% | |
iShares MSCI Saudi Arabia ETF | | | | 6,985 | | | | 212,903 | |
| | | | | |
| |
Total Exchange-Traded Funds (Cost $227,598) | | | | 212,903 | |
| | | | | |
| |
| | | | | |
| | | | Principal | | | | |
| Foreign Corporate Bonds and Notes: 2.80% | |
|
Financials: 2.80% | |
|
| Banks: 2.80% | |
ABN AMRO Bank NV | | | 4.75 | | | | 12-31-2099 | | | EUR | 3,000,000 | | | | 3,410,899 | |
Banco Bilbao Vizcaya Argentaria SA | | | 6.75 | | | | 12-29-2049 | | | EUR | 3,000,000 | | | | 3,329,689 | |
Bankia SA | | | 6.38 | | | | 12-31-2099 | | | EUR | 3,000,000 | | | | 3,456,429 | |
Cooperatieve Rabobank UA | | | 6.63 | | | | 12-29-2049 | | | EUR | 2,800,000 | | | | 3,325,741 | |
Governor & Company of The Bank of Ireland | | | 7.38 | | | | 12-29-2049 | | | EUR | 3,000,000 | | | | 3,395,479 | |
Nykredit Realkredit AS | | | 6.25 | | | | 12-29-2049 | | | EUR | 2,800,000 | | | | 3,189,195 | |
| |
Total Foreign Corporate Bonds and Notes (Cost $20,340,944) | | | | 20,107,432 | |
| | | | | |
|
Municipal Obligations: 4.29% | |
|
Colorado: 0.32% | |
|
| Health Revenue: 0.32% | |
Denver CO Health & Hospital Authority Series B | | | 4.65 | | | | 12-1-2023 | | | $ | 1,205,000 | | | | 1,275,938 | |
Denver CO Health & Hospital Authority Series B | | | 4.90 | | | | 12-1-2024 | | | | 250,000 | | | | 265,833 | |
Denver CO Health & Hospital Authority Series B | | | 5.00 | | | | 12-1-2025 | | | | 275,000 | | | | 292,047 | |
Denver CO Health & Hospital Authority Series B | | | 5.15 | | | | 12-1-2026 | | | | 445,000 | | | | 473,378 | |
| | | | |
| | | | | | | | | | | | | | | 2,307,196 | |
| | | | | | | | | | | | | | | | |
Wells Fargo Diversified Income Builder Fund | 21
Portfolio of investments—September 30, 2019
| | | | | | | | | | | | | | | | |
| | | Interest
rate | | | Maturity
date | | | Principal | | | Value | |
Florida: 0.36% | | | | | | | | | | | | | | | | |
| | | | |
| Education Revenue: 0.23% | | | | | | | | | | | | |
Capital Trust Agency Renaissance Charter School Project Series B 144A | | | 5.63 | % | | | 6-15-2023 | | | $ | 590,000 | | | $ | 591,953 | |
Florida HEFAR Jacksonville University Project Series A2 144A | | | 5.43 | | | | 6-1-2027 | | | | 1,000,000 | | | | 1,036,060 | |
| | | | |
| | | | | | | | | | | | | | | 1,628,013 | |
| | | | | | | | | | | | | | | | |
| | | | |
| Transportation Revenue: 0.13% | | | | | | | | | | | | |
Florida Development Finance Corporation Virgin Trains USA Passenger Rail Project Series A 144A | | | 6.25 | | | | 1-1-2049 | | | | 1,000,000 | | | | 931,830 | |
| | | | | | | | | | | | | | | | |
| | | | |
| | | | | | | | | | | | | | | 2,559,843 | |
| | | | | | | | | | | | | | | | |
| | | | |
Guam: 0.09% | | | | | | | | | | | | | | | | |
| | | | |
| Airport Revenue: 0.09% | | | | | | | | | | | | |
Guam Port Authority Series C | | | 3.78 | | | | 7-1-2021 | | | | 635,000 | | | | 646,303 | |
| | | | | | | | | | | | | | | | |
| | | | |
Illinois: 0.82% | | | | | | | | | | | | | | | | |
| | | | |
| GO Revenue: 0.35% | | | | | | | | | | | | |
Chicago IL Project Series C1 | | | 7.78 | | | | 1-1-2035 | | | | 2,000,000 | | | | 2,507,860 | |
| | | | | | | | | | | | | | | | |
| | | | |
| Miscellaneous Revenue: 0.47% | | | | | | | | | | | | |
Chicago IL Board of Education Taxable Build America Bonds Series E | | | 6.04 | | | | 12-1-2029 | | | | 1,255,000 | | | | 1,360,897 | |
Chicago IL Certificate of Participation River Point Plaza Redevelopment Project Series A 144A | | | 4.84 | | | | 4-15-2028 | | | | 2,000,000 | | | | 2,031,460 | |
| | | | |
| | | | | | | | | | | | | | | 3,392,357 | |
| | | | | | | | | | | | | | | | |
| | | | |
| | | | | | | | | | | | | | | 5,900,217 | |
| | | | | | | | | | | | | | | | |
| | | | |
Indiana: 0.07% | | | | | | | | | | | | | | | | |
| | | | |
| Health Revenue: 0.07% | | | | | | | | | | | | |
Knox County IN Good Samaritian Hospital Project Industry Economic Development Series B | | | 5.90 | | | | 4-1-2034 | | | | 480,000 | | | | 495,898 | |
| | | | | | | | | | | | | | | | |
| | | | |
Iowa: 0.17% | | | | | | | | | | | | | | | | |
| | | | |
| GO Revenue: 0.17% | | | | | | | | | | | | |
Coralville IA Series C | | | 5.00 | | | | 5-1-2030 | | | | 1,200,000 | | | | 1,187,784 | |
| | | | | | | | | | | | | | | | |
| | | | |
Michigan: 0.45% | | | | | | | | | | | | | | | | |
| | | | |
| Miscellaneous Revenue: 0.45% | | | | | | | | | | | | |
Wayne County MI Recovery Zone Economic Development Build America Bonds | | | 10.00 | | | | 12-1-2040 | | | | 3,000,000 | | | | 3,244,890 | |
| | | | | | | | | | | | | | | | |
| | | | |
New Jersey: 0.30% | | | | | | | | | | | | | | | | |
| | | | |
| Education Revenue: 0.14% | | | | | | | | | | | | |
New Jersey Educational Facilities Authority Georgian Court University Series H | | | 4.25 | | | | 7-1-2028 | | | | 1,000,000 | | | | 1,028,650 | |
| | | | | | | | | | | | | | | | |
| | | | |
| Utilities Revenue: 0.16% | | | | | | | | | | | | |
Newark NJ Redevelopment Area Public Service Electric & Gas Project 144A | | | 4.49 | | | | 12-1-2047 | | | | 1,000,000 | | | | 1,124,570 | |
| | | | | | | | | | | | | | | | |
| | | | |
| | | | | | | | | | | | | | | 2,153,220 | |
| | | | | | | | | | | | | | | | |
| | | | |
New York: 0.14% | | | | | | | | | | | | | | | | |
| | | | |
| Health Revenue: 0.05% | | | | | | | | | | | | |
Jefferson County NY Civic Facility Development Corporation Refunding Bond Series B Samaritan Medical Center Obligated Group | | | 4.25 | | | | 11-1-2028 | | | | 330,000 | | | | 340,725 | |
| | | | | | | | | | | | | | | | |
22 | Wells Fargo Diversified Income Builder Fund
Portfolio of investments—September 30, 2019
| | | | | | | | | | | | | | | | |
| | | Interest
rate | | | Maturity
date | | | Principal | | | Value | |
| Utilities Revenue: 0.09% | | | | | | | | | | | | |
New York Energy R&D Authority Green Bond Series A | | | 4.81 | % | | | 4-1-2034 | | | $ | 600,000 | | | $ | 670,116 | |
| | | | | | | | | | | | | | | | |
| | | | |
| | | | | | | | | | | | | | | 1,010,841 | |
| | | | | | | | | | | | | | | | |
| | | | |
Oklahoma: 0.27% | | | | | | | | | | | | | | | | |
| | | | |
| Health Revenue: 0.08% | | | | | | | | | | | | |
Oklahoma Development Finance Authority | | | 5.45 | | | | 8-15-2028 | | | | 500,000 | | | | 581,600 | |
| | | | | | | | | | | | | | | | |
| | | | |
| Miscellaneous Revenue: 0.19% | | | | | | | | | | | | |
Woodward County OK Educational Facilities Authority Mooreland Public Schools Project Series B | | | 4.63 | | | | 9-15-2025 | | | | 1,310,000 | | | | 1,359,597 | |
| | | | | | | | | | | | | | | | |
| | | | |
| | | | | | | | | | | | | | | 1,941,197 | |
| | | | | | | | | | | | | | | | |
| | | | |
Oregon: 0.08% | | | | | | | | | | | | | | | | |
| | | | |
| Health Revenue: 0.08% | | | | | | | | | | | | |
Clackamas County OR Hospital Facility Authority Series C | | | 4.00 | | | | 11-15-2022 | | | | 550,000 | | | | 550,473 | |
| | | | | | | | | | | | | | | | |
| | | | |
Pennsylvania: 0.28% | | | | | | | | | | | | | | | | |
| | | | |
| Housing Revenue: 0.28% | | | | | | | | | | | | |
Philadelphia PA IDA MFHR University Square Apartments Low Income Housing Project 144A | | | 5.00 | | | | 12-1-2020 | | | | 2,000,000 | | | | 2,003,560 | |
| | | | | | | | | | | | | | | | |
| | | | |
Tennessee: 0.29% | | | | | | | | | | | | | | | | |
| | | | |
| Tax Revenue: 0.29% | | | | | | | | | | | | |
Bristol TN Industrial Development Board The Pinnacle Project Series A 144A | | | 5.13 | | | | 12-1-2042 | | | | 2,000,000 | | | | 2,051,480 | |
| | | | | | | | | | | | | | | | |
| | | | |
Texas: 0.07% | | | | | | | | | | | | | | | | |
| | | | |
| Education Revenue: 0.07% | | | | | | | | | | | | |
Clifton TX Higher Education Finance Corporation International Leadership Texas | | | 6.13 | | | | 8-15-2023 | | | | 500,000 | | | | 509,570 | |
| | | | | | | | | | | | | | | | |
| | | | |
Virginia: 0.29% | | | | | | | | | | | | | | | | |
| | | | |
| Tax Revenue: 0.29% | | | | | | | | | | | | |
Mosaic District VA CDA SeriesA-T | | | 7.25 | | | | 3-1-2036 | | | | 2,000,000 | | | | 2,112,920 | |
| | | | | | | | | | | | | | | | |
| | | | |
Wisconsin: 0.29% | | | | | | | | | | | | | | | | |
| | | | |
| Education Revenue: 0.29% | | | | | | | | | | | | |
PFA Burrell College of Osteopathic Medicine Project 144A | | | 5.13 | | | | 6-1-2028 | | | | 1,360,000 | | | | 1,486,262 | |
Public Finance Authority WI Educational Facility Ikaho College 144A | | | 6.75 | | | | 6-1-2031 | | | | 500,000 | | | | 568,230 | |
| | | | |
| | | | | | | | | | | | | | | 2,054,492 | |
| | | | | | | | | | | | | | | | |
| |
Total Municipal Obligations (Cost $29,730,624) | | | | 30,729,884 | |
| | | | | | | | | | | | | | | | |
|
| Non-Agency Mortgage-Backed Securities: 1.94% | |
AFN LLC Series 2019-1A Class A2 144A‡ | | | 4.46 | | | | 5-20-2049 | | | | 1,000,000 | | | | 1,042,332 | |
Aqua Finance Trust Series 2019-A Class A 144A | | | 3.14 | | | | 7-16-2040 | | | | 600,000 | | | | 600,776 | |
Citigroup Commercial Mortgage Trust Series 2015-GC27 Class B | | | 3.77 | | | | 2-10-2048 | | | | 2,524,616 | | | | 2,637,537 | |
CLI Funding LLC Series 2018-1A Class A 144A | | | 4.03 | | | | 4-18-2043 | | | | 638,633 | | | | 644,729 | |
CLI Funding LLC Series 2019-1A Class A 144A | | | 3.71 | | | | 5-18-2044 | | | | 963,573 | | | | 982,270 | |
CLI Funding LLC Series 2019-1A Class B 144A | | | 4.64 | | | | 5-18-2044 | | | | 528,045 | | | | 539,668 | |
Conn Funding II LP Series A Class A 144A | | | 3.40 | | | | 10-16-2023 | | | | 1,182,339 | | | | 1,189,805 | |
Driven Brands Funding LLC Series 2019-2A Class A2 144A | | | 3.98 | | | | 10-20-2049 | | | | 800,000 | | | | 803,765 | |
JPMorgan Mortgage Trust Series 2019-2 Class A3 144A±± | | | 4.00 | | | | 8-25-2049 | | | | 1,067,630 | | | | 1,085,854 | |
Longtrain Leasing III LLC Series 2015-1A Class A2 144A | | | 4.06 | | | | 1-15-2045 | | | | 1,000,000 | | | | 1,035,769 | |
Wells Fargo Diversified Income Builder Fund | 23
Portfolio of investments—September 30, 2019
| | | | | | | | | | | | | | | | |
| | | Interest
rate | | | Maturity
date | | | Principal | | | Value | |
|
| Non-Agency Mortgage-Backed Securities(continued) | |
Sequoia Mortgage Trust Series 2018-6 Class A19 144A±± | | | 4.00 | % | | | 7-25-2048 | | | $ | 1,254,967 | | | $ | 1,279,913 | |
SoFi Consumer Loan Program Trust Series2019-2 Class C 144A | | | 3.46 | | | | 4-25-2028 | | | | 2,000,000 | | | | 2,046,548 | |
| |
TotalNon-Agency Mortgage-Backed Securities (Cost $13,622,652) | | | | 13,888,966 | |
| | | | | | | | | | | | | | | | |
| | | | |
| | | | | | | | | | | | | | | | |
| | | Dividend
yield | | | | | | Shares | | | | |
| Preferred Stocks: 0.19% | |
|
Energy: 0.04% | |
|
| Oil, Gas & Consumable Fuels: 0.04% | |
Petroleo Brasil SP ADR | | | 3.44 | | | | | | | | 20,454 | | | | 268,766 | |
| | | | | | | | | | | | | | | | |
|
Financials: 0.08% | |
|
| Banks: 0.08% | |
Banco Bradesco SA | | | 2.69 | | | | | | | | 28,340 | | | | 231,361 | |
Itaúsa Investimentos Itaú SA | | | 9.45 | | | | | | | | 122,700 | | | | 389,219 | |
| | | | |
| | | | | | | | | | | | | | | 620,580 | |
| | | | | | | | | | | | | | | | |
|
Information Technology: 0.04% | |
|
| Technology Hardware, Storage & Peripherals: 0.04% | |
Samsung Electronics Company Limited | | | 2.83 | | | | | | | | 8,851 | | | | 292,283 | |
| | | | | | | | | | | | | | | | |
|
Utilities: 0.03% | |
|
| Electric Utilities: 0.03% | |
Companhia Energetica de Minas Gerais SA | | | 4.21 | | | | | | | | 58,600 | | | | 202,105 | |
| | | | | | | | | | | | | | | | |
| |
Total Preferred Stocks (Cost $1,111,881) | | | | 1,383,734 | |
| | | | | | | | | | | | | | | | |
| | | | |
| | | | | | | | | | | | | | | | |
| | | Interest
rate | | | | | | Principal | | | | |
| Yankee Corporate Bonds and Notes: 8.74% | |
|
Financials: 7.18% | |
|
| Banks: 4.57% | |
Barclays plc | | | 7.75 | | | | 12-31-2099 | | | $ | 3,660,000 | | | | 3,808,852 | |
BNP Paribas SA | | | 7.63 | | | | 12-29-2049 | | | | 3,460,000 | | | | 3,645,975 | |
Credit Agricole SA 144A | | | 7.88 | | | | 12-29-2049 | | | | 1,750,000 | | | | 1,951,250 | |
Credit Agricole SA 144A | | | 8.13 | | | | 12-29-2049 | | | | 1,750,000 | | | | 2,058,438 | |
Danske Bank AS | | | 7.00 | | | | 12-31-2099 | | | | 2,300,000 | | | | 2,377,625 | |
DNB Bank ASA | | | 6.50 | | | | 12-29-2049 | | | | 3,690,000 | | | | 3,860,663 | |
HSBC Holdings plc | | | 6.38 | | | | 12-29-2049 | | | | 3,690,000 | | | | 3,911,400 | |
ING Groep NV | | | 6.75 | | | | 12-31-2099 | | | | 2,000,000 | | | | 2,099,508 | |
Lloyds Banking Group plc | | | 7.50 | | | | 4-30-2049 | | | | 3,665,000 | | | | 3,929,247 | |
Societe Generale SA 144A | | | 8.00 | | | | 12-29-2049 | | | | 3,535,000 | | | | 3,981,294 | |
Standard Chartered plc 144A | | | 7.75 | | | | 12-29-2049 | | | | 1,000,000 | | | | 1,080,620 | |
| | | | |
| | | | | | | | | | | | | | | 32,704,872 | |
| | | | | | | | | | | | | | | | |
|
| Capital Markets: 0.52% | |
Credit Suisse Group AG 144A | | | 7.50 | | | | 12-29-2049 | | | | 3,395,000 | | | | 3,751,471 | |
| | | | | | | | | | | | | | | | |
|
| Diversified Financial Services: 2.09% | |
Tronox Finance plc 144A | | | 5.75 | | | | 10-1-2025 | | | | 12,000,000 | | | | 11,349,000 | |
UBS Group Funding Switzerland AG | | | 7.00 | | | | 12-29-2049 | | | | 3,330,000 | | | | 3,651,745 | |
| | | | |
| | | | | | | | | | | | | | | 15,000,745 | |
| | | | | | | | | | | | | | | | |
24 | Wells Fargo Diversified Income Builder Fund
Portfolio of investments—September 30, 2019
| | | | | | | | | | | | | | | | |
| | | Interest
rate | | | Maturity
date | | | Principal | | | Value | |
|
Industrials: 1.56% | |
|
| Electrical Equipment: 1.56% | |
Sensata Technologies BV 144A | | | 4.88 | % | | | 10-15-2023 | | | $ | 6,700,000 | | | $ | 7,060,125 | |
Sensata Technologies BV 144A | | | 5.63 | | | | 11-1-2024 | | | | 3,750,000 | | | | 4,078,125 | |
| | | | |
| | | | | | | | | | | | | | | 11,138,250 | |
| | | | | | | | | | | | | | | | |
| |
Total Yankee Corporate Bonds and Notes (Cost $60,309,607) | | | | 62,595,338 | |
| | | | | | | | | | | | | | | | |
| |
| | | | | |
| | | Yield | | | | | | Shares | | | | |
| Short-Term Investments: 3.01% | |
|
| Investment Companies: 2.77% | |
Wells Fargo Government Money Market Fund Select Class (l)(u) | | | 1.88 | | | | | | | | 19,875,845 | | | | 19,875,845 | |
| | | | | | | | | | | | | | | | |
| | | |
| | | | | | | | | | | | | |
| | | | | | | | | Principal | | | | |
| U.S. Treasury Securities: 0.24% | |
U.S. Treasury Bill (z)# | | | 1.90 | | | | 11-7-2019 | | | $ | 1,685,000 | | | | 1,682,024 | |
| | | | | | | | | | | | | | | | |
| |
Total Short-Term Investments (Cost $21,557,479) | | | | 21,557,869 | |
| | | | | | | | | | | | | | | | |
| | | | | | | | |
| Total investments in securities (Cost $675,417,548) | | | 98.30 | % | | | 704,249,399 | |
| | |
Other assets and liabilities, net | | | 1.70 | | | | 12,178,292 | |
| | | | | | | | |
| Total net assets | | | 100.00 | % | | $ | 716,427,691 | |
| | | | | | | | |
| 144A | The security may be resold in transactions exempt from registration, normally to qualified institutional buyers, pursuant to Rule 144A under the Securities Act of 1933. |
| † | Non-income-earning security |
| ¤ | The security is issued in zero coupon form with no periodic interest payments. |
| ‡ | Security is valued using significant unobservable inputs. |
| ±± | The coupon of the security is adjusted based on the principal and interest payments received from the underlying pool of mortgages as well as the credit quality and the actual prepayment speed of the underlying mortgages. |
| (l) | The issuer of the security is an affiliated person of the Fund as defined in the Investment Company Act of 1940. |
| (u) | The rate represents the7-day annualized yield at period end. |
| (z) | Zero coupon security. The rate represents the current yield to maturity. |
| # | All or a portion of this security is segregated as collateral for investments in derivative instruments. |
Abbreviations:
| ADR | American depositary receipt |
| CDA | Community Development Authority |
| GDR | Global depositary receipt |
| HEFAR | Higher Education Facilities Authority Revenue |
| IDA | Industrial Development Authority |
| MFHR | Multifamily housing revenue |
| R&D | Research & development |
| REIT | Real estate investment trust |
Wells Fargo Diversified Income Builder Fund | 25
Portfolio of investments—September 30, 2019
Futures Contracts
| | | | | | | | | | | | | | | | | | | | | | | | |
| Description | | Number of
contracts | | | Expiration
date | | | Notional
cost | | | Notional
value | | | Unrealized
gains | | | Unrealized
losses | |
| | | | | | |
Long | | | | | | | | | | | | | | | | | | | | | | | | |
| | | | | | |
10-Year U.S. Treasury Notes | | | 486 | | | | 12-19-2019 | | | $ | 63,828,149 | | | $ | 63,331,875 | | | $ | 0 | | | $ | (496,274 | ) |
| | | | | | |
Short | | | | | | | | | | | | | | | | | | | | | | | | |
| | | | | | |
Euro FX Futures | | | (255 | ) | | | 12-16-2019 | | | | (35,410,505 | ) | | | (34,942,969 | ) | | | 467,536 | | | | 0 | |
| | | | | | |
S&P 500E-Mini Index | | | (72 | ) | | | 12-20-2019 | | | | (10,850,029 | ) | | | (10,722,600 | ) | | | 127,429 | | | | 0 | |
| | | | | | | | | | | | | | | | | | | | | | | | |
| | | | | | |
| | | | | | | | | | | | | | | | | | $ | 594,965 | | | $ | (496,274 | ) |
| | | | | | | | | | | | | | | | | | | | | | | | |
Forward Foreign Currency Contracts
| | | | | | | | | | | | | | |
Currency to be
received | | Currency to be
delivered | | Counterparty | | Settlement
date | | Unrealized
gains | | | Unrealized
losses | |
| | | | | |
| 26,652,324 USD | | 23,900,000 EUR | | Citibank | | 12-31-2019 | | $ | 412,984 | | | $ | 0 | |
Investments in Affiliates
An affiliated investment is an investment in which the Fund owns at least 5% of the outstanding voting shares of the issuer or as a result of other relationships, such as the Fund and the issuer having the same investment manager. Transactions with issuers that were either affiliated persons of the Fund at the beginning of the period or the end of the period were as follows:
| | | | | | | | | | | | | | | | | | | | | | | | | | | | | | | | | | | | |
| | | Shares,
beginning of
period | | | Shares
purchased | | | Shares
sold | | | Shares,
end of
period | | | Net
realized
gains
(losses) | | | Net
change in
unrealized
gains
(losses) | | | Income
from
affiliated
securities | | | Value,
end of
period | | | % of
net
assets | |
Short-Term Investments | | | | | | | | | | | | | | | | | | | | | | | | | | | | | | | | | | | | |
Investment Companies | | | | | | | | | | | | | | | | | | | | | | | | | | | | | | | | | | | | |
Wells Fargo Government Money Market Fund Select Class | | | 71,872,762 | | | | 190,365,099 | | | | 242,362,016 | | | | 19,875,845 | | | $ | 0 | | | $ | 0 | | | $ | 568,972 | | | $ | 19,875,845 | | | | 2.77 | % |
The accompanying notes are an integral part of these financial statements.
26 | Wells Fargo Diversified Income Builder Fund
Statement of assets and liabilities—September 30, 2019
| | | | |
| | | | |
| |
Assets | | | | |
Investments in unaffiliated securities, at value (cost $655,541,703) | | $ | 684,373,554 | |
Investments in affiliated securities, at value (cost $19,875,845) | | | 19,875,845 | |
Cash | | | 677,418 | |
Foreign currency, at value (cost $2,603,808) | | | 2,601,877 | |
Receivable for investments sold | | | 250,871 | |
Receivable for Fund shares sold | | | 2,938,916 | |
Receivable for dividends and interest | | | 7,479,833 | |
Receivable for daily variation margin on open futures contracts | | | 31,832 | |
Unrealized gains on forward foreign currency contracts | | | 412,984 | |
Prepaid expenses and other assets | | | 219,884 | |
| | | | |
Total assets | | | 718,863,014 | |
| | | | |
| |
Liabilities | | | | |
Payable for investments purchased | | | 207,637 | |
Payable for Fund shares redeemed | | | 1,015,453 | |
Cash collateral due to broker for forward foreign currency contracts | | | 740,000 | |
Management fee payable | | | 199,595 | |
Distribution fee payable | | | 86,198 | |
Administration fees payable | | | 101,574 | |
Trustees’ fees and expenses payable | | | 2,221 | |
Shareholder servicing fees payable | | | 82,645 | |
| | | | |
Total liabilities | | | 2,435,323 | |
| | | | |
Total net assets | | $ | 716,427,691 | |
| | | | |
| |
Net assets consist of | | | | |
Paid-in capital | | $ | 711,215,365 | |
Total distributable earnings | | | 5,212,326 | |
| | | | |
Total net assets | | $ | 716,427,691 | |
| | | | |
| |
Computation of net asset value and offering price per share | | | | |
Net assets – Class A | | $ | 251,673,334 | |
Shares outstanding – Class A1 | | | 41,552,510 | |
Net asset value per share – Class A | | | $6.06 | |
Maximum offering price per share – Class A2 | | | $6.43 | |
Net assets – Class C | | $ | 140,721,704 | |
Shares outstanding – Class C1 | | | 23,179,224 | |
Net asset value per share – Class C | | | $6.07 | |
Net assets – Class R6 | | $ | 23,928 | |
Shares outstanding – Class R61 | | | 4,052 | |
Net asset value per share – Class R6 | | | $5.91 | |
Net assets – Administrator Class | | $ | 11,916,181 | |
Shares outstanding – Administrator Class1 | | | 2,016,536 | |
Net asset value per share – Administrator Class | | | $5.91 | |
Net assets – Institutional Class | | $ | 312,092,544 | |
Shares outstanding – Institutional Class1 | | | 52,815,280 | |
Net asset value per share – Institutional Class | | | $5.91 | |
| 1 | The Fund has an unlimited number of authorized shares. |
| 2 | Maximum offering price is computed as 100/94.25 of net asset value. On investments of $50,000 or more, the offering price is reduced. |
The accompanying notes are an integral part of these financial statements.
Wells Fargo Diversified Income Builder Fund | 27
Statement of operations—year ended September 30, 2019
| | | | |
| | | | |
| |
Investment income | | | | |
Interest | | $ | 25,429,590 | |
Dividends (net of foreign withholding taxes of $296,147) | | | 5,920,108 | |
Income from affiliated securities | | | 568,972 | |
| | | | |
Total investment income | | | 31,918,670 | |
| | | | |
| |
Expenses | | | | |
Management fee | | | 3,772,623 | |
Administration fees | |
Class A | | | 492,570 | |
Class C | | | 303,359 | |
Class R6 | | | 7 | |
Administrator Class | | | 21,231 | |
Institutional Class | | | 389,241 | |
Shareholder servicing fees | |
Class A | | | 586,393 | |
Class C | | | 361,142 | |
Administrator Class | | | 40,598 | |
Distribution fee | |
Class C | | | 1,083,277 | |
Custody and accounting fees | | | 36,599 | |
Professional fees | | | 65,266 | |
Registration fees | | | 102,033 | |
Shareholder report expenses | | | 104,733 | |
Trustees’ fees and expenses | | | 22,510 | |
Other fees and expenses | | | 18,630 | |
| | | | |
Total expenses | | | 7,400,212 | |
Less: Fee waivers and/or expense reimbursements | | | | |
Fund-level | | | (1,341,342 | ) |
Class A | | | (24,385 | ) |
Class C | | | (14,955 | ) |
Administrator Class | | | (1,487 | ) |
Institutional Class | | | (30,678 | ) |
| | | | |
Net expenses | | | 5,987,365 | |
| | | | |
Net investment income | | | 25,931,305 | |
| | | | |
| |
Realized and unrealized gains (losses) on investments | | | | |
Net realized gains (losses) on | |
Unaffiliated securities | | | (22,870,873 | ) |
Futures contracts | | | (1,776,753 | ) |
Forward foreign currency contracts | | | 1,319,216 | |
| | | | |
Net realized losses on investments | | | (23,328,410 | ) |
| | | | |
| |
Net change in unrealized gains (losses) on | | | | |
Unaffiliated securities | | | 22,424,383 | |
Futures contracts | | | 73,677 | |
Forward foreign currency contracts | | | 412,984 | |
| | | | |
Net change in unrealized gains (losses) on investments | | | 22,911,044 | |
| | | | |
Net realized and unrealized gains (losses) on investments | | | (417,366 | ) |
| | | | |
Net increase in net assets resulting from operations | | $ | 25,513,939 | |
| | | | |
The accompanying notes are an integral part of these financial statements.
28 | Wells Fargo Diversified Income Builder Fund
Statement of changes in net assets
| | | | | | | | | | | | | | | | |
| | | Year ended
September 30, 2019 | | | Year ended
September 30, 2018 | |
| | | | |
Operations | | | | | | | | | | | | | | | | |
Net investment income | | | | | | $ | 25,931,305 | | | | | | | $ | 25,677,784 | |
Net realized gains (losses) on investments | | | | | | | (23,328,410 | ) | | | | | | | 31,343,912 | |
Net change in unrealized gains (losses) on investments | | | | | | | 22,911,044 | | | | | | | | (33,794,120 | ) |
| | | | |
Net increase in net assets resulting from operations | | | | | | | 25,513,939 | | | | | | | | 23,227,576 | |
| | | | |
| | | | |
Distributions to shareholders from net investment income and net realized gains | | | | | | | | | | | | | | | | |
Class A | | | | | | | (19,291,628 | ) | | | | | | | (10,518,893 | ) |
Class C | | | | | | | (11,757,683 | ) | | | | | | | (6,577,828 | ) |
Class R6 | | | | | | | (2,192 | ) | | | | | | | (138 | )1 |
Administrator Class | | | | | | | (2,015,528 | ) | | | | | | | (1,793,521 | ) |
Institutional Class | | | | | | | (26,837,985 | ) | | | | | | | (16,782,186 | ) |
| | | | |
Total distributions to shareholders | | | | | | | (59,905,016 | ) | | | | | | | (35,672,566 | ) |
| | | | |
| | | | |
Capital share transactions | | | Shares | | | | | | | | Shares | | | | | |
Proceeds from shares sold | | | | | | | | | | | | | | | | |
Class A | | | 15,741,839 | | | | 94,086,277 | | | | 11,145,149 | | | | 70,956,206 | |
Class C | | | 6,522,568 | | | | 38,947,259 | | | | 6,785,413 | | | | 43,270,788 | |
Class R6 | | | 0 | | | | 0 | | | | 4,052 | 1 | | | 25,000 | 1 |
Administrator Class | | | 729,093 | | | | 4,244,341 | | | | 1,384,053 | | | | 8,606,856 | |
Institutional Class | | | 22,831,336 | | | | 132,583,652 | | | | 22,967,858 | | | | 142,978,608 | |
| | | | |
| | | | | | | 269,861,529 | | | | | | | | 265,837,458 | |
| | | | |
Reinvestment of distributions | | | | | | | | | | | | | | | | |
Class A | | | 3,135,334 | | | | 18,209,570 | | | | 1,561,264 | | | | 9,891,159 | |
Class C | | | 1,853,575 | | | | 10,728,732 | | | | 946,882 | | | | 6,011,290 | |
Administrator Class | | | 322,489 | | | | 1,815,085 | | | | 263,760 | | | | 1,637,316 | |
Institutional Class | | | 3,849,831 | | | | 21,832,218 | | | | 2,194,831 | | | | 13,596,513 | |
| | | | |
| | | | | | | 52,585,605 | | | | | | | | 31,136,278 | |
| | | | |
Payment for shares redeemed | | | | | | | | | | | | | | | | |
Class A | | | (13,852,338 | ) | | | (82,279,885 | ) | | | (10,590,623 | ) | | | (67,150,218 | ) |
Class C | | | (11,490,423 | ) | | | (68,292,199 | ) | | | (7,154,705 | ) | | | (45,403,714 | ) |
Administrator Class | | | (4,353,482 | ) | | | (24,635,205 | ) | | | (3,003,395 | ) | | | (18,651,958 | ) |
Institutional Class | | | (28,099,288 | ) | | | (162,899,174 | ) | | | (21,127,558 | ) | | | (130,722,169 | ) |
| | | | |
| | | | | | | (338,106,463 | ) | | | | | | | (261,928,059 | ) |
| | | | |
Net increase (decrease) in net assets resulting from capital share transactions | | | | | | | (15,659,329 | ) | | | | | | | 35,045,677 | |
| | | | |
Total increase (decrease) in net assets | | | | | | | (50,050,406 | ) | | | | | | | 22,600,687 | |
| | | | |
| | | | |
Net assets | | | | | | | | | | | | | | | | |
Beginning of period | | | | | | | 766,478,097 | | | | | | | | 743,877,410 | |
| | | | |
End of period | | | | | | $ | 716,427,691 | | | | | | | $ | 766,478,097 | |
| | | | |
| 1 | For the period from July 31, 2018 (commencement of class operations) to September 30, 2018 |
The accompanying notes are an integral part of these financial statements.
Wells Fargo Diversified Income Builder Fund | 29
Financial highlights
(For a share outstanding throughout each period)
| | | | | | | | | | | | | | | | | | | | |
| | | Year ended September 30 | |
| CLASS A | | 2019 | | | 2018 | | | 2017 | | | 2016 | | | 2015 | |
Net asset value, beginning of period | | | $6.33 | | | | $6.42 | | | | $6.13 | | | | $5.71 | | | | $6.37 | |
Net investment income | | | 0.22 | | | | 0.21 | | | | 0.20 | | | | 0.20 | | | | 0.21 | |
Net realized and unrealized gains (losses) on investments | | | 0.02 | | | | (0.01 | ) | | | 0.35 | | | | 0.64 | | | | (0.31 | ) |
| | | | | | | | | | | | | | | | | | | | |
Total from investment operations | | | 0.24 | | | | 0.20 | | | | 0.55 | | | | 0.84 | | | | (0.10 | ) |
Distributions to shareholders from | | | | | | | | | | | | | | | | | | | | |
Net investment income | | | (0.23 | ) | | | (0.19 | ) | | | (0.22 | ) | | | (0.21 | ) | | | (0.21 | ) |
Net realized gains | | | (0.28 | ) | | | (0.10 | ) | | | (0.04 | ) | | | (0.21 | ) | | | (0.35 | ) |
| | | | | | | | | | | | | | | | | | | | |
Total distributions to shareholders | | | (0.51 | ) | | | (0.29 | ) | | | (0.26 | ) | | | (0.42 | ) | | | (0.56 | ) |
Net asset value, end of period | | | $6.06 | | | | $6.33 | | | | $6.42 | | | | $6.13 | | | | $5.71 | |
Total return1 | | | 4.51 | % | | | 3.23 | % | | | 9.16 | % | | | 15.39 | % | | | (1.92 | )% |
Ratios to average net assets (annualized) | | | | | | | | | | | | | | | | | | | | |
Gross expenses | | | 1.05 | % | | | 1.04 | % | | | 1.05 | % | | | 1.08 | % | | | 1.11 | % |
Net expenses | | | 0.85 | % | | | 0.90 | % | | | 1.05 | % | | | 1.08 | % | | | 1.08 | % |
Net investment income | | | 3.75 | % | | | 3.34 | % | | | 3.29 | % | | | 3.55 | % | | | 3.38 | % |
Supplemental data | | | | | | | | | | | | | | | | | | | | |
Portfolio turnover rate | | | 43 | % | | | 50 | % | | | 29 | % | | | 38 | % | | | 63 | % |
Net assets, end of period (000s omitted) | | | $251,673 | | | | $231,176 | | | | $220,977 | | | | $154,496 | | | | $127,242 | |
| 1 | Total return calculations do not include any sales charges. |
The accompanying notes are an integral part of these financial statements.
30 | Wells Fargo Diversified Income Builder Fund
Financial highlights
(For a share outstanding throughout each period)
| | | | | | | | | | | | | | | | | | | | |
| | | Year ended September 30 | |
| CLASS C | | 2019 | | | 2018 | | | 2017 | | | 2016 | | | 2015 | |
Net asset value, beginning of period | | | $6.34 | | | | $6.44 | | | | $6.14 | | | | $5.72 | | | | $6.39 | |
Net investment income | | | 0.18 | | | | 0.17 | | | | 0.16 | | | | 0.16 | 1 | | | 0.16 | 1 |
Net realized and unrealized gains (losses) on investments | | | 0.02 | | | | (0.02 | ) | | | 0.35 | | | | 0.63 | | | | (0.32 | ) |
| | | | | | | | | | | | | | | | | | | | |
Total from investment operations | | | 0.20 | | | | 0.15 | | | | 0.51 | | | | 0.79 | | | | (0.16 | ) |
Distributions to shareholders from | | | | | | | | | | | | | | | | | | | | |
Net investment income | | | (0.19 | ) | | | (0.15 | ) | | | (0.17 | ) | | | (0.16 | ) | | | (0.16 | ) |
Net realized gains | | | (0.28 | ) | | | (0.10 | ) | | | (0.04 | ) | | | (0.21 | ) | | | (0.35 | ) |
| | | | | | | | | | | | | | | | | | | | |
Total distributions to shareholders | | | (0.47 | ) | | | (0.25 | ) | | | (0.21 | ) | | | (0.37 | ) | | | (0.51 | ) |
Net asset value, end of period | | | $6.07 | | | | $6.34 | | | | $6.44 | | | | $6.14 | | | | $5.72 | |
Total return2 | | | 3.71 | % | | | 2.32 | % | | | 8.51 | % | | | 14.51 | % | | | (2.81 | )% |
Ratios to average net assets (annualized) | | | | | | | | | | | | | | | | | | | | |
Gross expenses | | | 1.80 | % | | | 1.79 | % | | | 1.80 | % | | | 1.83 | % | | | 1.86 | % |
Net expenses | | | 1.60 | % | | | 1.65 | % | | | 1.80 | % | | | 1.83 | % | | | 1.83 | % |
Net investment income | | | 2.99 | % | | | 2.59 | % | | | 2.54 | % | | | 2.80 | % | | | 2.62 | % |
Supplemental data | | | | | | | | | | | | | | | | | | | | |
Portfolio turnover rate | | | 43 | % | | | 50 | % | | | 29 | % | | | 38 | % | | | 63 | % |
Net assets, end of period (000s omitted) | | | $140,722 | | | | $166,750 | | | | $165,513 | | | | $129,856 | | | | $110,457 | |
| 1 | Calculated based upon average shares outstanding |
| 2 | Total return calculations do not include any sales charges. |
The accompanying notes are an integral part of these financial statements.
Wells Fargo Diversified Income Builder Fund | 31
Financial highlights
(For a share outstanding throughout each period)
| | | | | | | | |
| | | Year ended September 30 | |
| CLASS R6 | | 2019 | | | 20181 | |
Net asset value, beginning of period | | | $6.18 | | | | $6.17 | |
Net investment income | | | 0.24 | 2 | | | 0.02 | 2 |
Net realized and unrealized gains (losses) on investments | | | 0.03 | | | | 0.02 | |
| | | | | | | | |
Total from investment operations | | | 0.27 | | | | 0.04 | |
Distributions to shareholders from | | | | | | | | |
Net investment income | | | (0.26 | ) | | | (0.03 | ) |
Net realized gains | | | (0.28 | ) | | | 0.00 | |
| | | | | | | | |
Total distributions to shareholders | | | (0.54 | ) | | | (0.03 | ) |
Net asset value, end of period | | | $5.91 | | | | $6.18 | |
Total return3 | | | 5.07 | % | | | 0.71 | % |
Ratios to average net assets (annualized) | | | | | | | | |
Gross expenses | | | 0.61 | % | | | 0.64 | % |
Net expenses | | | 0.42 | % | | | 0.41 | % |
Net investment income | | | 4.17 | % | | | 2.31 | % |
Supplemental data | | | | | | | | |
Portfolio turnover rate | | | 43 | % | | | 50 | % |
Net assets, end of period (000s omitted) | | | $24 | | | | $25 | |
| 1 | For the period from July 31, 2018 (commencement of class operations) to September 30, 2018 |
| 2 | Calculated based upon average shares outstanding |
| 3 | Returns for periods of less than one year are not annualized. |
The accompanying notes are an integral part of these financial statements.
32 | Wells Fargo Diversified Income Builder Fund
Financial highlights
(For a share outstanding throughout each period)
| | | | | | | | | | | | | | | | | | | | |
| | | Year ended September 30 | |
| ADMINISTRATOR CLASS | | 2019 | | | 2018 | | | 2017 | | | 2016 | | | 2015 | |
Net asset value, beginning of period | | | $6.19 | | | | $6.29 | | | | $6.00 | | | | $5.60 | | | | $6.25 | |
Net investment income | | | 0.22 | 1 | | | 0.21 | 1 | | | 0.21 | 1 | | | 0.21 | 1 | | | 0.21 | 1 |
Net realized and unrealized gains (losses) on investments | | | 0.02 | | | | (0.01 | ) | | | 0.34 | | | | 0.61 | | | | (0.30 | ) |
| | | | | | | | | | | | | | | | | | | | |
Total from investment operations | | | 0.24 | | | | 0.20 | | | | 0.55 | | | | 0.82 | | | | (0.09 | ) |
Distributions to shareholders from | | | | | | | | | | | | | | | | | | | | |
Net investment income | | | (0.24 | ) | | | (0.20 | ) | | | (0.22 | ) | | | (0.21 | ) | | | (0.21 | ) |
Net realized gains | | | (0.28 | ) | | | (0.10 | ) | | | (0.04 | ) | | | (0.21 | ) | | | (0.35 | ) |
| | | | | | | | | | | | | | | | | | | | |
Total distributions to shareholders | | | (0.52 | ) | | | (0.30 | ) | | | (0.26 | ) | | | (0.42 | ) | | | (0.56 | ) |
Net asset value, end of period | | | $5.91 | | | | $6.19 | | | | $6.29 | | | | $6.00 | | | | $5.60 | |
Total return | | | 4.52 | % | | | 3.21 | % | | | 9.45 | % | | | 15.45 | % | | | (1.69 | )% |
Ratios to average net assets (annualized) | | | | | | | | | | | | | | | | | | | | |
Gross expenses | | | 0.97 | % | | | 0.96 | % | | | 0.97 | % | | | 1.00 | % | | | 0.97 | % |
Net expenses | | | 0.77 | % | | | 0.81 | % | | | 0.90 | % | | | 0.90 | % | | | 0.90 | % |
Net investment income | | | 3.77 | % | | | 3.40 | % | | | 3.51 | % | | | 3.72 | % | | | 3.56 | % |
Supplemental data | | | | | | | | | | | | | | | | | | | | |
Portfolio turnover rate | | | 43 | % | | | 50 | % | | | 29 | % | | | 38 | % | | | 63 | % |
Net assets, end of period (000s omitted) | | | $11,916 | | | | $32,938 | | | | $41,975 | | | | $70,051 | | | | $31,367 | |
| 1 | Calculated based upon average shares outstanding |
The accompanying notes are an integral part of these financial statements.
Wells Fargo Diversified Income Builder Fund | 33
Financial highlights
(For a share outstanding throughout each period)
| | | | | | | | | | | | | | | | | | | | |
| | | Year ended September 30 | |
| INSTITUTIONAL CLASS | | 2019 | | | 2018 | | | 2017 | | | 2016 | | | 2015 | |
Net asset value, beginning of period | | | $6.19 | | | | $6.28 | | | | $6.00 | | | | $5.59 | | | | $6.25 | |
Net investment income | | | 0.24 | | | | 0.23 | | | | 0.24 | | | | 0.23 | | | | 0.24 | |
Net realized and unrealized gains (losses) on investments | | | 0.01 | | | | (0.01 | ) | | | 0.31 | | | | 0.61 | | | | (0.32 | ) |
| | | | | | | | | | | | | | | | | | | | |
Total from investment operations | | | 0.25 | | | | 0.22 | | | | 0.55 | | | | 0.84 | | | | (0.08 | ) |
Distributions to shareholders from | | | | | | | | | | | | | | | | | | | | |
Net investment income | | | (0.25 | ) | | | (0.21 | ) | | | (0.23 | ) | | | (0.22 | ) | | | (0.23 | ) |
Net realized gains | | | (0.28 | ) | | | (0.10 | ) | | | (0.04 | ) | | | (0.21 | ) | | | (0.35 | ) |
| | | | | | | | | | | | | | | | | | | | |
Total distributions to shareholders | | | (0.53 | ) | | | (0.31 | ) | | | (0.27 | ) | | | (0.43 | ) | | | (0.58 | ) |
Net asset value, end of period | | | $5.91 | | | | $6.19 | | | | $6.28 | | | | $6.00 | | | | $5.59 | |
Total return | | | 4.80 | % | | | 3.62 | % | | | 9.49 | % | | | 15.88 | % | | | (1.65 | )% |
Ratios to average net assets (annualized) | | | | | | | | | | | | | | | | | | | | |
Gross expenses | | | 0.72 | % | | | 0.71 | % | | | 0.72 | % | | | 0.75 | % | | | 0.71 | % |
Net expenses | | | 0.52 | % | | | 0.57 | % | | | 0.71 | % | | | 0.71 | % | | | 0.69 | % |
Net investment income | | | 4.07 | % | | | 3.67 | % | | | 3.60 | % | | | 3.92 | % | | | 3.76 | % |
Supplemental data | | | | | | | | | | | | | | | | | | | | |
Portfolio turnover rate | | | 43 | % | | | 50 | % | | | 29 | % | | | 38 | % | | | 63 | % |
Net assets, end of period (000s omitted) | | | $312,093 | | | | $335,589 | | | | $315,413 | | | | $124,116 | | | | $77,558 | |
The accompanying notes are an integral part of these financial statements.
34 | Wells Fargo Diversified Income Builder Fund
Notes to financial statements
1. ORGANIZATION
Wells Fargo Funds Trust (the “Trust”), a Delaware statutory trust organized on March 10, 1999, is anopen-end management investment company registered under the Investment Company Act of 1940, as amended (the “1940 Act”). As an investment company, the Trust follows the accounting and reporting guidance in Financial Accounting Standards Board (“FASB”)Accounting Standards Codification Topic 946, Financial Services – Investment Companies. These financial statements report on the Wells Fargo Diversified Income Builder Fund (the “Fund”) which is a diversified series of the Trust.
2. SIGNIFICANT ACCOUNTING POLICIES
The following significant accounting policies, which are consistently followed in the preparation of the financial statements of the Fund, are in conformity with U.S. generally accepted accounting principles which require management to make estimates and assumptions that affect the reported amounts of assets and liabilities, disclosure of contingent assets and liabilities at the date of the financial statements, and the reported amounts of revenues and expenses during the reporting period. Actual results could differ from those estimates.
Securities valuation
All investments are valued each business day as of the close of regular trading on the New York Stock Exchange (generally 4 p.m. Eastern Time), although the Fund may deviate from this calculation time under unusual or unexpected circumstances.
Debt securities are valued at the evaluated bid price provided by an independent pricing service (e.g. taking into account various factors, including yields, maturities, or credit ratings) or, if a reliable price is not available, the quoted bid price from an independent broker-dealer.
Equity securities and futures contracts that are listed on a foreign or domestic exchange or market are valued at the official closing price or, if none, the last sales price. If no sale occurs on the principal exchange or market that day, a fair value price will be determined in accordance with the Fund’s Valuation Procedures.
The values of securities denominated in foreign currencies are translated into U.S. dollars at rates provided by an independent foreign currency pricing source at a time each business day specified by the Wells Fargo Asset Management Pricing Committee at Wells Fargo Funds Management, LLC (“Funds Management”).
Many securities markets and exchanges outside the U.S. close prior to the close of the New York Stock Exchange and therefore may not fully reflect trading or events that occur after the close of the principal exchange in which the foreign securities are traded, but before the close of the New York Stock Exchange. If such trading or events are expected to materially affect the value of such securities, then fair value pricing procedures approved by the Board of Trustees of the Fund are applied. These procedures take into account multiple factors including movements in U.S. securities markets after foreign exchanges close. Foreign securities that are fair valued under these procedures are categorized as Level 2 and the application of these procedures may result in transfers between Level 1 and Level 2. Depending on market activity, such fair valuations may be frequent. Such fair value pricing may result in net asset values that are higher or lower than net asset values based on the last reported sales price or latest quoted bid price. On September 30, 2019, such fair value pricing was used in pricing certain foreign securities.
Investments in registeredopen-end investment companies are valued at net asset value.
Investments which are not valued using any of the methods discussed above are valued at their fair value, as determined in good faith by the Board of Trustees. The Board of Trustees has established a Valuation Committee comprised of the Trustees and has delegated to it the authority to take any actions regarding the valuation of portfolio securities that the Valuation Committee deems necessary or appropriate, including determining the fair value of portfolio securities, unless the determination has been delegated to the Wells Fargo Asset Management Pricing Committee.The Board of Trustees retains the authority to make or ratify any valuation decisions or approve any changes to the Valuation Procedures as it deems appropriate. On a quarterly basis, the Board of Trustees receives reports on any valuation actions taken by the Valuation Committee or the Wells Fargo Asset Management Pricing Committee which may include items for ratification.
Foreign currency translation
The accounting records of the Fund are maintained in U.S. dollars. The values of other assets and liabilities denominated in foreign currencies are translated into U.S. dollars at rates provided by an independent foreign currency pricing source at a time each business day specified by the Wells Fargo Asset Management Pricing Committee. Purchases and sales of securities, and income and expenses are converted at the rate of exchange on the respective dates of such transactions. Net realized foreign exchange gains or losses arise from sales of foreign currencies, currency gains or losses realized between the trade and settlement dates on securities transactions, and the difference between the amounts of dividends, interest and foreign withholding taxes recorded and the U.S. dollar equivalent of the amounts actually paid or received. Net unrealized foreign
Wells Fargo Diversified Income Builder Fund | 35
Notes to financial statements
exchange gains and losses arise from changes in the fair value of assets and liabilities other than investments in securities resulting from changes in exchange rates. The changes in net assets arising from changes in exchange rates of securities and the changes in net assets resulting from changes in market prices of securities are not separately presented. Such changes are included in net realized and unrealized gains or losses from investments.
Forward foreign currency contracts
A forward foreign currency contract is an agreement between two parties to purchase or sell a specific currency for an agreed-upon price at a future date. The Fund enters into forward foreign currency contracts to facilitate transactions in foreign-denominated securities and to attempt to minimize the risk to the Fund from adverse changes in the relationship between currencies. Forward foreign currency contracts are recorded at the forward rate andmarked-to-market daily. When the contracts are closed, realized gains and losses arising from such transactions are recorded as realized gains or losses on forward foreign currency contracts. The Fund is subject to foreign currency risk and may be exposed to risks if the counterparties to the contracts are unable to meet the terms of their contracts or if the value of the foreign currency changes unfavorably. The Fund’s maximum risk of loss from counterparty credit risk is the unrealized gains on the contracts. This risk may be mitigated if there is a master netting arrangement between the Fund and the counterparty.
Securities lending
The Fund may lend its securities from time to time in order to earn additional income in the form of fees or interest on securities received as collateral or the investment of any cash received as collateral. When securities are on loan, the Fund receives interest or dividends on those securities. Cash collateral received in connection with its securities lending transactions is invested in Securities Lending Cash Investments, LLC (the “Securities Lending Fund”). Investments in Securities Lending Fund are valued at the evaluated bid price provided by an independent pricing service. Income earned from investment in the Securities Lending Fund (net of fees and rebates), if any, is included in income from affiliated securities on the Statement of Operations.
In a securities lending transaction, the net asset value of the Fund is affected by an increase or decrease in the value of the securities loaned and by an increase or decrease in the value of the instrument in which collateral is invested. The amount of securities lending activity undertaken by the Fund fluctuates from time to time. The Fund has the right under the lending agreement to recover the securities from the borrower on demand. In the event of default or bankruptcy by the borrower, the Fund may be prevented from recovering the loaned securities or gaining access to the collateral or may experience delays or costs in doing so. In such an event, the terms of the agreement allows the unaffiliated securities lending agent to use the collateral to purchase replacement securities on behalf of the Fund or pay the Fund the market value of the loaned securities. The Fund bears the risk of loss with respect to depreciation of its investment of the cash collateral.
When-issued transactions
The Fund may purchase securities on a forward commitment or when-issued basis. The Fund records a when-issued transaction on the trade date and will segregate assets in an amount at least equal in value to the Fund’s commitment to purchase when-issued securities. Securities purchased on a when-issued basis aremarked-to-market daily and the Fund begins earning interest on the settlement date. Losses may arise due to changes in the market value of the underlying securities or if the counterparty does not perform under the contract.
Futures contracts
Futures contracts are agreements between the Fund and a counterparty to buy or sell a specific amount of a commodity, financial instrument or currency at a specified price and on a specified date. The Fund may buy and sell futures contracts in order to gain exposure to, or protect against, changes in interest rates, security values, and foreign exchange rates and is subject to interest rate risk, equity price risk, and foreign currency risk. The primary risks associated with the use of futures contracts are the imperfect correlation between changes in market values of securities held by the Fund and the prices of futures contracts, and the possibility of an illiquid market. Futures contracts are generally entered into on a regulated futures exchange and cleared through a clearinghouse associated with the exchange. With futures contracts, there is minimal counterparty risk to the Fund since futures contracts are exchange traded and the exchange’s clearinghouse, as the counterparty to all exchange traded futures, guarantees the futures contracts against default.
Upon entering into a futures contracts, the Fund is required to deposit either cash or securities (initial margin) with the broker in an amount equal to a certain percentage of the contract value. Subsequent payments (variation margin) are paid to or from the broker each day equal to the daily changes in the contract value. Such payments are recorded as unrealized gains or losses and, if any, shown as variation margin receivable (payable) in the Statement of Assets and Liabilities. Should the Fund fail to make requested variation margin payments, the broker can gain access to the initial margin to satisfy the Fund’s payment obligations. When the contracts are closed, a realized gain or loss is recorded in the Statement of Operations.
36 | Wells Fargo Diversified Income Builder Fund
Notes to financial statements
Security transactions and income recognition
Securities transactions are recorded on a trade date basis. Realized gains or losses are recorded on the basis of identified cost.
Interest income is accrued daily and bond discounts are accreted and premiums are amortized daily. To the extent debt obligations are placed onnon-accrual status, any related interest income may be reduced by writing off interest receivables when the collection of all or a portion of interest has been determined to be doubtful based on consistently applied procedures and the fair value has decreased. If the issuer subsequently resumes interest payments or when the collectability of interest is reasonably assured, the debt obligation is removed fromnon-accrual status.
Dividend income is recognized on theex-dividend date, except for certain dividends from foreign securities, which are recorded as soon as the custodian verifies theex-dividend date. Dividend income from foreign securities is recorded net of foreign taxes withheld where recovery of such taxes is not assured.
Income dividends and capital gain distributions from investment companies are recorded on theex-dividend date. Capital gain distributions from investment companies are treated as realized gains.
Distributions to shareholders
Distributions to shareholders are recorded on theex-dividend date and paid from net investment income monthly and any net realized gains are paid at least annually. Such distributions are determined in accordance with income tax regulations and may differ from U.S. generally accepted accounting principles. Dividend sources are estimated at the time of declaration. The tax character of distributions is determined as of the Fund’s fiscal year end. Therefore, a portion of the Fund’s distributions made prior to the Fund’s fiscal year end may be categorized as a tax return of capital at year end.
Federal and other taxes
The Fund intends to continue to qualify as a regulated investment company by distributing substantially all of its investment company taxable income and any net realized capital gains (after reduction for capital loss carryforwards) sufficient to relieve it from all, or substantially all, federal income taxes. Accordingly, no provision for federal income taxes was required.
The Fund’s income and federal excise tax returns and all financial records supporting those returns for the prior three fiscal years are subject to examination by the federal and Delaware revenue authorities. Management has analyzed the Fund’s tax positions taken on federal, state, and foreign tax returns for all open tax years and does not believe that there are any uncertain tax positions that require recognition of a tax liability.
As of September 30, 2019, the aggregate cost of all investments for federal income tax purposes was $677,961,845 and the unrealized gains (losses) consisted of:
| | | | |
| |
Gross unrealized gains | | $ | 43,102,452 | |
| |
Gross unrealized losses | | | (16,303,223 | ) |
| |
Net unrealized gains | | $ | 26,799,229 | |
Reclassifications are made to the Fund’s capital accounts for permanent tax differences to reflect income and gains available for distribution (or available capital loss carryforwards) under federal income tax regulations. U.S. generally accepted accounting principles require that certain components of net assets be adjusted to reflect permanent differences between financial and tax reporting. These reclassifications have no effect on net assets or net asset values per share. At September 30, 2019, as a result of permanent book-to-tax differences, the following reclassification adjustments were made on the Statement of Assets and Liabilities:
| | |
| Paid-in capital | | Total distributable earnings |
| |
| $(14,932) | | $14,932 |
As of September 30, 2019, the Fund had capital loss carryforwards which consist of $8,937,939 in short-term capital losses and $15,236,081 in long-term capital losses.
Class allocations
The separate classes of shares offered by the Fund differ principally in applicable sales charges, distribution, shareholder servicing, and administration fees. Class specific expenses are charged directly to that share class. Investment income, common fund-level expenses, and realized and unrealized gains (losses) on investments are allocated daily to each class of shares based on the relative proportion of net assets of each class.
3. FAIR VALUATION MEASUREMENTS
Fair value measurements of investments are determined within a framework that has established a fair value hierarchy based upon the various data inputs utilized in determining the value of the Fund’s investments. The three-level hierarchy gives the
Wells Fargo Diversified Income Builder Fund | 37
Notes to financial statements
highest priority to unadjusted quoted prices in active markets for identical assets or liabilities (Level 1) and the lowest priority to unobservable inputs (Level 3). The Fund’s investments are classified within the fair value hierarchy based on the lowest level of input that is significant to the fair value measurement. The inputs are summarized into three broad levels as follows:
| ∎ | | Level 1 – quoted prices in active markets for identical securities |
| ∎ | | Level 2 – other significant observable inputs (including quoted prices for similar securities, interest rates, prepayment speeds, credit risk, etc.) |
| ∎ | | Level 3 – significant unobservable inputs (including the Fund’s own assumptions in determining the fair value of investments) |
The inputs or methodologies used for valuing investments in securities are not necessarily an indication of the risk associated with investing in those securities.
The following is a summary of the inputs used in valuing the Fund’s assets and liabilities as of September 30, 2019:
| | | | | | | | | | | | | | | | |
| | | | |
| | | Quoted prices
(Level 1) | | | Other significant
observable inputs
(Level 2) | | | Significant
unobservable inputs (Level 3) | | | Total | |
| | | | |
Assets | | | | | | | | | | | | | | | | |
Investments in: | | | | | | | | | | | | | | | | |
| | | | |
Asset-backed securities | | $ | 0 | | | $ | 7,580,673 | | | $ | 0 | | | $ | 7,580,673 | |
| | | | |
Common stocks | | | | | | | | | | | | | | | | |
| | | | |
Communication services | | | 5,933,679 | | | | 0 | | | | 0 | | | | 5,933,679 | |
| | | | |
Consumer discretionary | | | 9,822,227 | | | | 120,856 | | | | 0 | | | | 9,943,083 | |
| | | | |
Consumer staples | | | 7,519,763 | | | | 139,962 | | | | 0 | | | | 7,659,725 | |
| | | | |
Energy | | | 32,254,177 | | | | 0 | | | | 0 | | | | 32,254,177 | |
| | | | |
Financials | | | 28,575,506 | | | | 23,233 | | | | 0 | | | | 28,598,739 | |
| | | | |
Health care | | | 17,172,655 | | | | 0 | | | | 0 | | | | 17,172,655 | |
| | | | |
Industrials | | | 20,577,511 | | | | 0 | | | | 0 | | | | 20,577,511 | |
| | | | |
Information technology | | | 36,586,838 | | | | 3,622,099 | | | | 0 | | | | 40,208,937 | |
| | | | |
Materials | | | 7,881,731 | | | | 0 | | | | 0 | | | | 7,881,731 | |
| | | | |
Real estate | | | 8,274,409 | | | | 0 | | | | 0 | | | | 8,274,409 | |
| | | | |
Utilities | | | 14,711,317 | | | | 0 | | | | 0 | | | | 14,711,317 | |
| | | | |
Corporate bonds and notes | | | 0 | | | | 352,976,637 | | | | 0 | | | | 352,976,637 | |
| | | | |
Exchange-traded funds | | | 212,903 | | | | 0 | | | | 0 | | | | 212,903 | |
| | | | |
Foreign corporate bonds and notes | | | 0 | | | | 20,107,432 | | | | 0 | | | | 20,107,432 | |
| | | | |
Municipal obligations | | | 0 | | | | 30,729,884 | | | | 0 | | | | 30,729,884 | |
| | | | |
Non-agency mortgage-backed securities | | | 0 | | | | 12,846,634 | | | | 1,042,332 | | | | 13,888,966 | |
| | | | |
Preferred stocks | | | | | | | | | | | | | | | | |
| | | | |
Energy | | | 268,766 | | | | 0 | | | | 0 | | | | 268,766 | |
| | | | |
Financials | | | 620,580 | | | | 0 | | | | 0 | | | | 620,580 | |
| | | | |
Information technology | | | 292,283 | | | | 0 | | | | 0 | | | | 292,283 | |
| | | | |
Utilities | | | 202,105 | | | | 0 | | | | 0 | | | | 202,105 | |
| | | | |
Yankee corporate bonds and notes | | | 0 | | | | 62,595,338 | | | | 0 | | | | 62,595,338 | |
| | | | |
Short-term investments | | | | | | | | | | | | | | | | |
| | | | |
Investment companies | | | 19,875,845 | | | | 0 | | | | 0 | | | | 19,875,845 | |
| | | | |
U.S. Treasury securities | | | 1,682,024 | | | | 0 | | | | 0 | | | | 1,682,024 | |
| | | | |
| | | 212,464,319 | | | | 490,742,748 | | | | 1,042,332 | | | | 704,249,399 | |
Futures contracts | | | 594,965 | | | | 0 | | | | 0 | | | | 594,965 | |
| | | | |
Forward foreign currency contracts | | | 0 | | | | 412,984 | | | | 0 | | | | 412,984 | |
| | | | |
Total assets | | $ | 213,059,284 | | | $ | 491,155,732 | | | $ | 1,042,332 | | | $ | 705,257,348 | |
| | | | |
Liabilities | | | | | | | | | | | | | | | | |
| | | | |
Futures contracts | | $ | 496,274 | | | $ | 0 | | | $ | 0 | | | $ | 496,274 | |
| | | | |
Total liabilities | | $ | 496,274 | | | $ | 0 | | | $ | 0 | | | $ | 496,274 | |
38 | Wells Fargo Diversified Income Builder Fund
Notes to financial statements
Additional sector, industry or geographic detail is included in the Portfolio of Investments.
Futures contracts and forward foreign currency contracts are reported at their cumulative unrealized gains (losses) at measurement date as reported in the tables following the Portfolio of Investments. For futures contracts, the current day’s variation margin is reported on the Statement of Assets and Liabilities. All other assets and liabilities are reported at their market value at measurement date.
For the year ended September 30, 2019, the Fund did not have any transfers into/out of Level 3.
4. TRANSACTIONS WITH AFFILIATES
Management fee
Funds Management, an indirect wholly owned subsidiary of Wells Fargo & Company (“Wells Fargo”), is the manager of the Fund and provides advisory and fund-level administrative services under an investment management agreement. Under the investment management agreement, Funds Management is responsible for, among other services, implementing the investment objectives and strategies of the Fund, supervising the subadviser and providing fund-level administrative services in connection with the Fund’s operations. As compensation for its services under the investment management agreement, Funds Management is entitled to receive a management fee at the following annual rate based on the Fund’s average daily net assets:
| | |
| |
| Average daily net assets | | Management fee |
| |
First $500 million | | 0.550% |
| |
Next $500 million | | 0.525 |
| |
Next $2 billion | | 0.500 |
| |
Next $2 billion | | 0.475 |
| |
Next $5 billion | | 0.440 |
| |
Over $10 billion | | 0.430 |
For the year ended September 30, 2019, the management fee was equivalent to an annual rate of 0.54% of the Fund’s average daily net assets.
Funds Management has retained the services of a subadviser to provide daily portfolio management to the Fund. The fee for subadvisory services is borne by Funds Management. Wells Capital Management Incorporated (“WellsCap”), an affiliate of Funds Management and an indirect wholly owned subsidiary of Wells Fargo, is the subadviser to the Fund and is entitled to receive a fee from Funds Management at an annual rate starting at 0.35% and declining to 0.20% as the average daily net assets of the Fund increase.
Administration fees
Under a class-level administration agreement, Funds Management provides class-level administrative services to the Fund, which includes paying fees and expenses for services provided by the transfer agent,sub-transfer agents, omnibus account servicers and record-keepers. As compensation for its services under the class-level administration agreement, Funds Management receives an annual fee which is calculated based on the average daily net assets of each class as follows:
| | |
| |
| | | Class-level
administration fee |
| |
Class A, Class C | | 0.21% |
| |
Class R6 | | 0.03 |
| |
Administrator Class, Institutional Class | | 0.13 |
Waivers and/or expense reimbursements
Funds Management has contractually waived and/or reimbursed management and administration fees to the extent necessary to maintain certain net operating expense ratios for the Fund. When each class of the Fund has exceeded its expense cap, Funds Management has waived fees and/or reimbursed expenses from fund level expenses on a proportionate basis and then from class specific expenses. When only certain classes exceed their expense caps, waivers and/or reimbursements are applied against class specific expenses before fund level expenses. Funds Management has committed through January 31, 2020 to waive fees and/or reimburse expenses to the extent necessary to cap the Fund’s expenses at 0.85% for Class A shares, 1.60% for Class C shares, 0.42% for Class R6 shares, 0.77% for Administrator Class shares, and 0.52% for Institutional Class shares. Prior to or after the commitment expiration date, the cap may be increased or the commitment to maintain the cap may be terminated only with the approval of the Board of Trustees.
Wells Fargo Diversified Income Builder Fund | 39
Notes to financial statements
Distribution fee
The Trust has adopted a distribution plan for Class C shares of the Fund pursuant to Rule12b-1 under the 1940 Act. A distribution fee is charged to Class C shares and paid to Wells Fargo Funds Distributor, LLC (“Funds Distributor”), the principal underwriter, at an annual rate of 0.75% of the average daily net assets of Class C shares.
In addition, Funds Distributor is entitled to receive thefront-end sales charge from the purchase of Class A shares and a contingent deferred sales charge on the redemption of certain Class A shares. Funds Distributor is also entitled to receive the contingent deferred sales charges from redemptions of Class C shares. For the year ended September 30, 2019, Funds Distributor received $50,056 from the sale of Class A shares and $1,474 in contingent deferred sales charges from redemptions of Class C shares. No contingent deferred sales charges were incurred by Class A for the year ended September 30, 2019.
Shareholder servicing fees
The Trust has entered into contracts with one or more shareholder servicing agents, whereby Class A, Class C, and Administrator Class of the Fund are charged a fee at an annual rate of 0.25% of the average daily net assets of each respective class. A portion of these total shareholder servicing fees were paid to affiliates of Wells Fargo.
Interfund transactions
The Fund may purchase or sell portfolio investment securities to certain other Wells Fargo affiliates pursuant to Rule17a-7 under the 1940 Act and under procedures adopted by the Board of Trustees. The procedures have been designed to ensure that these interfund transactions, which do not incur broker commissions, are effected at current market prices. Pursuant to these procedures, the Fund had $4,185,000 and $0 in interfund purchases and sales, respectively, during the year ended September 30, 2019.
5. INVESTMENT PORTFOLIO TRANSACTIONS
Purchases and sales of investments, excluding U.S. government obligations (if any) and short-term securities, for the year ended September 30, 2019 were $287,507,028 and $282,230,174, respectively.
6. SECURITIES LENDING TRANSACTIONS
The Fund lends its securities through an unaffiliated securities lending agent and receives collateral in the form of cash or securities with a value at least equal to the value of the securities on loan. The value of the loaned securities is determined at the close of each business day and any increases or decreases in the required collateral are exchanged between the Fund and the counterparty on the next business day. Cash collateral received is invested in the Securities Lending Fund which seeks to provide a positive return compared to the daily Fed Funds Open Rate by investing in high-quality, U.S. dollar-denominated short-term money market instruments and is exempt from registration under Section 3(c)(7) of the 1940 Act. Securities Lending Fund is managed by Funds Management and is subadvised by WellsCap. Funds Management receives an advisory fee starting at 0.05% and declining to 0.01% as the average daily net assets of the Securities Lending Fund increase. All of the fees received by Funds Management are paid to WellsCap for its services as subadviser.
In the event of counterparty default or the failure of a borrower to return a loaned security, the Fund has the right to use the collateral to offset any losses incurred. As of September 30, 2019, the Fund did not have any securities on loan.
7. DERIVATIVE TRANSACTIONS
During the year ended September 30, 2019, the Fund entered into futures contracts and forward foreign currency contracts for economic hedging purposes.
The volume of the Fund’s futures contracts and forward foreign currency contracts during the year ended September 30, 2019 was as follows:
| | | | |
Futures contracts | | | | |
| |
Average notional balance on long futures | | $ | 11,913,070 | |
| |
Average notional balance on short futures | | | 14,195,171 | |
Forward foreign currency contracts | | | | |
| |
Average contract amounts to buy | | | 3,789,341 | |
| |
Average contract amounts to sell | | | 25,854,964 | |
40 | Wells Fargo Diversified Income Builder Fund
Notes to financial statements
A summary of the location of derivative instruments on the financial statements by risk is outlined in the following tables.
The fair value of derivative instruments as of September 30, 2019 by risk type was as follows for the Fund:
| | | | | | | | | | | | |
| | | Asset derivatives | | | Liability derivatives | |
| | | | |
| | | Statement of Assets and Liabilities location | | Fair value | | | Statement of Assets and Liabilities location | | Fair value | |
| | | | |
Interest rate risk | | Unrealized gains on futures contracts | | $ | 0 | * | | Unrealized losses on futures contracts | | $ | 496,274 | * |
| | | | |
Equity risk | | Unrealized gains on futures contracts | | | 127,429 | * | | Unrealized losses on futures contracts | | | 0 | * |
| | | | |
Foreign currency risk | | Unrealized gains on futures contracts | | | 467,536 | * | | Unrealized losses on futures contracts | | | 0 | * |
| | | | |
Foreign currency risk | | Unrealized gains on forward foreign currency contracts | | | 412,984 | | | Unrealized losses on forward foreign currency contracts | | | 0 | |
| | | | |
| | | | | $ | 1,007,949 | | | | | $ | 496,274 | |
| * | Amount represents cumulative unrealized gains (losses) as reported in the tables following the Portfolio of Investments. Only the current day’s variation margin as of September 30, 2019 is reported separately on the Statement of Assets and Liabilities. |
The effect of derivative instruments on the Statement of Operations for the year ended September 30, 2019 was as follows for the Fund:
| | | | | | | | | | | | |
| | | Amount of realized gains (losses) on derivatives | |
| | | |
| | | Futures
contracts | | | Forward
foreign
currency
contracts | | | Total | |
| | | |
Interest rate risk | | $ | (544,548 | ) | | $ | 0 | | | $ | (544,548 | ) |
| | | |
Equity risk | | | (1,777,244 | ) | | | 0 | | | | (1,777,244 | ) |
| | | |
Foreign currency risk | | | 545,039 | | | | 1,319,216 | | | | 1,864,255 | |
| | | |
| | | $ | (1,776,753 | ) | | $ | 1,319,216 | | | $ | (457,537 | ) |
| |
| | | Change in unrealized gains (losses) on derivatives | |
| | | |
| | | Futures
contracts | | | Forward
foreign
currency
contracts | | | Total | |
| | | |
Interest rate risk | | $ | (496,274 | ) | | $ | 0 | | | $ | (496,274 | ) |
| | | |
Equity risk | | | 102,415 | | | | 0 | | | | 102,415 | |
| | | |
Foreign currency risk | | | 467,536 | | | | 412,984 | | | | 880,520 | |
| | | |
| | | $ | 73,677 | | | $ | 412,984 | | | $ | 486,661 | |
For certain types of derivative transactions, the Fund has entered into International Swaps and Derivatives Association, Inc. master agreements (“ISDA Master Agreements”) or similar agreements with approved counterparties. The ISDA Master Agreements or similar agreements may have requirements to deliver/deposit securities or cash to/with an exchange orbroker-dealer as collateral and allows the Fund to offset, with each counterparty, certain derivative financial instrument’s assets and/or liabilities with collateral held or pledged. Collateral requirements differ by type of derivative. Collateral or margin requirements are set by the broker or exchange clearinghouse for exchange traded derivatives while collateral terms are contract specific forover-the-counter traded derivatives. Cash collateral that has been pledged to cover obligations of the Fund under ISDA Master Agreements or similar agreements, if any, are reported separately in the Statement of Assets and Liabilities. Securities pledged as collateral, if any, are noted in the Portfolio of Investments. With respect to balance sheet offsetting, absent an event of default by the counterparty or a termination of the agreement, the reported amounts of financial assets and financial liabilities in the Statement of Assets and Liabilities are not offset
Wells Fargo Diversified Income Builder Fund | 41
Notes to financial statements
across transactions between the Fund and the applicable counterparty. A reconciliation of the gross amounts on the Statement of Assets and Liabilities to the net amounts by counterparty, including any collateral exposure, is as follows:
| | | | | | | | | | | | |
| | | | |
| Counterparty | | Gross amounts
of assets in the
Statement of
Assets and
Liabilities | | Amounts
subject to
netting
agreements | | Collateral
received | | | Net amount
of assets | |
| | | | |
Citibank | | $412,984 | | $0 | | $ | 0 | | | $ | 412,984 | |
8. BANK BORROWINGS
The Trust (excluding the money market funds), Wells Fargo Master Trust and Wells Fargo Variable Trust are parties to a $280,000,000 revolving credit agreement whereby the Fund is permitted to use bank borrowings for temporary or emergency purposes, such as to fund shareholder redemption requests. Interest under the credit agreement is charged to the Fund based on a borrowing rate equal to the higher of the Federal Funds rate in effect on that day plus 1.25% or the overnight LIBOR rate in effect on that day plus 1.25%. In addition, an annual commitment fee equal to 0.25% of the unused balance is allocated to each participating fund.
For the year ended September 30, 2019, there were no borrowings by the Fund under the agreement.
9. DISTRIBUTIONS TO SHAREHOLDERS
The tax character of distributions paid during the years ended September 30, 2019 and September 30, 2018 were as follows:
| | | | | | | | |
| | | Year ended September 30 | |
| | |
| | | 2019 | | | 2018 | |
| | |
Ordinary income | | $ | 33,578,334 | | | $ | 27,884,669 | |
| | |
Long-term capital gain | | | 26,326,682 | | | | 7,787,897 | |
As of September 30, 2019, the components of distributable earnings on a tax basis were as follows:
| | | | |
Undistributed
ordinary
income | | Unrealized
gains | | Capital loss
carryforward |
| | |
| $2,608,219 | | $26,790,901 | | $(24,174,020) |
10. INDEMNIFICATION
Under the Trust’s organizational documents, the officers and Trustees have been granted certain indemnification rights against certain liabilities that may arise out of performance of their duties to the Trust. Additionally, in the normal course of business, the Trust may enter into contracts with service providers that contain a variety of indemnification clauses. The Trust’s maximum exposure under these arrangements is dependent on future claims that may be made against the Fund and, therefore, cannot be estimated.
11. NEW ACCOUNTING PRONOUNCEMENTS
In August 2018, FASB issued Accounting Standards Update (“ASU”)No. 2018-13, Fair Value Measurement (Topic 820)Disclosure Framework—Changes to the Disclosure Requirements for Fair Value Measurement. ASU2018-13 updates the disclosure requirements for fair value measurements by modifying or removing certain disclosures and adding certain new disclosures. The amendments are effective for fiscal years, and interim periods within those fiscal years, beginning after December 15, 2019. Early adoption is permitted. Management has adopted the removal and modification of disclosures early, as permitted, and will adopt the additional new disclosures at the effective date.
In March 2017, FASB issued ASUNo. 2017-08,Premium Amortization on Purchased Callable Debt Securities. ASU2017-08 shortens the amortization period for certain callable debt securities held at a premium and requires the premium to be amortized to the earliest call date. The amendments do not require an accounting change for securities held at a discount and discounts will continue to be accreted to the maturity date of the security. ASU2017-08 is effective for fiscal years beginning after December 15, 2018 and for interim periods within those fiscal years. During the current reporting period, management of the Fund adopted the change in accounting policy which did not have a material impact to the Fund’s financial statements.
42 | Wells Fargo Diversified Income Builder Fund
Report of independent registered public accounting firm
TO THE SHAREHOLDERS OF THE FUND AND BOARD OF TRUSTEES OF WELLS FARGO FUNDS TRUST:
Opinion on the Financial Statements
We have audited the accompanying statement of assets and liabilities of Wells Fargo Diversified Income Builder Fund (the Fund), one of the funds constituting Wells Fargo Funds Trust, including the portfolio of investments, as of September 30, 2019, the related statement of operations for the year then ended, the statements of changes in net assets for each of the years in the two-year period then ended, and the related notes (collectively, the financial statements) and the financial highlights for each of the years or periods in the five-year period then ended. In our opinion, the financial statements and financial highlights present fairly, in all material respects, the financial position of the Fund as of September 30, 2019, the results of its operations for the year then ended, the changes in its net assets for each of the years in the two-year period then ended, and the financial highlights for each of the years or periods in the five-year period then ended, in conformity with U.S. generally accepted accounting principles.
Basis for Opinion
These financial statements and financial highlights are the responsibility of the Fund’s management. Our responsibility is to express an opinion on these financial statements and financial highlights based on our audits. We are a public accounting firm registered with the Public Company Accounting Oversight Board (United States) (PCAOB) and are required to be independent with respect to the Fund in accordance with the U.S. federal securities laws and the applicable rules and regulations of the Securities and Exchange Commission and the PCAOB.
We conducted our audits in accordance with the standards of the PCAOB. Those standards require that we plan and perform the audit to obtain reasonable assurance about whether the financial statements and financial highlights are free of material misstatement, whether due to error or fraud. Our audits included performing procedures to assess the risks of material misstatement of the financial statements and financial highlights, whether due to error or fraud, and performing procedures that respond to those risks. Such procedures included examining, on a test basis, evidence regarding the amounts and disclosures in the financial statements and financial highlights. Such procedures also included confirmation of securities owned as of September 30, 2019, by correspondence with the custodian, transfer agent and brokers, or by other appropriate auditing procedures. Our audits also included evaluating the accounting principles used and significant estimates made by management, as well as evaluating the overall presentation of the financial statements and financial highlights. We believe that our audits provide a reasonable basis for our opinion.

We have not been able to determine the specific year that we began serving as the auditor of one or more Wells Fargo Funds investment companies; however we are aware that we have served as the auditor of one or more Wells Fargo Funds investment companies since at least 1955.
Boston, Massachusetts
November 25, 2019
Wells Fargo Diversified Income Builder Fund | 43
Other information (unaudited)
TAX INFORMATION
For corporate shareholders, pursuant to Section 854 of the Internal Revenue Code, 8.14% of ordinary income dividends qualify for the corporate dividends-received deduction for the fiscal year ended September 30, 2019.
Pursuant to Section 852 of the Internal Revenue Code, $26,326,682 was designated as a 20% rate gain distribution for the fiscal year ended September 30, 2019.
Pursuant to Section 854 of the Internal Revenue Code, $4,988,730 of income dividends paid during the fiscal year ended September 30, 2019 has been designated as qualified dividend income (QDI).
For the fiscal year ended September 30, 2019, $16,922,217 has been designated as interest-related dividends for nonresident alien shareholders pursuant to Section 871 of the Internal Revenue Code.
For the fiscal year ended September 30, 2019, $6,280,067 has been designated as short-term capital gain dividends for nonresident alien shareholders pursuant to Section 871 of the Internal Revenue Code.
PROXY VOTING INFORMATION
A description of the policies and procedures used to determine how to vote proxies relating to portfolio securities is available, upon request, by calling1-800-222-8222, visiting our website atwfam.com, or visiting the SEC website at sec.gov. Information regarding how the proxies related to portfolio securities were voted during the most recent12-month period ended June 30 is available on the website atwfam.com or by visiting the SEC website at sec.gov.
QUARTERLY PORTFOLIO HOLDINGS INFORMATION
The Fund files its complete schedule of portfolio holdings with the SEC for the first and third quarters of each fiscal year on FormN-Q or FormN-PORT, which is available by visiting the SEC website at sec.gov. Those forms may be reviewed and copied at the SEC’s Public Reference Room in Washington, DC. Information on the operation of the Public Reference Room may be obtained by calling1-800-SEC-0330
44 | Wells Fargo Diversified Income Builder Fund
Other information (unaudited)
BOARD OF TRUSTEES AND OFFICERS
Each of the Trustees and Officers1 listed in the table below acts in identical capacities for each fund in the Wells Fargo family of funds, which consists of 150 mutual funds comprising the Wells Fargo Funds Trust, Wells Fargo Variable Trust, Wells Fargo Master Trust and fourclosed-end funds (collectively the “Fund Complex”). This table should be read in conjunction with the Prospectus and the Statement of Additional Information2. The mailing address of each Trustee and Officer is 525 Market Street, 12th Floor, San Francisco, CA 94105. Each Trustee and Officer serves an indefinite term, however, each Trustee serves such term until reaching the mandatory retirement age established by the Trustees.
Independent Trustees
| | | | | | |
Name and year of birth | | Position held and
length of service* | | Principal occupations during past five years or longer | | Current other
public company or
investment
company
directorships |
| | | |
| William R. Ebsworth (Born 1957) | | Trustee,
since 2015 | | Retired. From 1984 to 2013, equities analyst, portfolio manager, research director and chief investment officer at Fidelity Management and Research Company in Boston, Tokyo, and Hong Kong, and retired in 2013 as Chief Investment Officer of Fidelity Strategic Advisers, Inc. where he led a team of investment professionals managing client assets. Prior thereto, Board member of Hong Kong Securities Clearing Co., Hong Kong Options Clearing Corp., the Thailand International Fund, Ltd., Fidelity Investments Life Insurance Company, and Empire Fidelity Investments Life Insurance Company. Audit Committee Chair and Investment Committee Chair of the Vincent Memorial Hospital Endowment(non-profit organization). Mr. Ebsworth is a CFA® charterholder. | | N/A |
| | | |
| Jane A. Freeman (Born 1953) | | Trustee,
since 2015;
Chair Liaison,
since 2018 | | Retired. From 2012 to 2014 and 1999 to 2008, Chief Financial Officer of Scientific Learning Corporation. From 2008 to 2012, Ms. Freeman provided consulting services related to strategic business projects. Prior to 1999, Portfolio Manager at Rockefeller & Co. and Scudder, Stevens & Clark. Board member of the Harding Loevner Funds from 1996 to 2014, serving as both Lead Independent Director and chair of the Audit Committee. Board member of the Russell Exchange Traded Funds Trust from 2011 to 2012 and the chair of the Audit Committee. Ms. Freeman is a Board Member of The Ruth Bancroft Garden(non-profit organization). She is also an inactive Chartered Financial Analyst. | | N/A |
| | | |
| Isaiah Harris, Jr. (Born 1952) | | Trustee,
since 2009;
Audit Committee Chairman,
since 2019 | | Retired. Chairman of the Board of CIGNA Corporation since 2009, and Director since 2005. From 2003 to 2011, Director of Deluxe Corporation. Prior thereto, President and CEO of BellSouth Advertising and Publishing Corp. from 2005 to 2007, President and CEO of BellSouth Enterprises from 2004 to 2005 and President of BellSouth Consumer Services from 2000 to 2003. Emeritus member of the Iowa State University Foundation Board of Governors. Emeritus Member of the Advisory Board of Iowa State University School of Business. Advisory Board Member, Palm Harbor Academy (private school). Advisory Board Member, Child Evangelism Fellowship(non-profit). Mr. Harris is a certified public accountant (inactive status). | | CIGNA Corporation |
| | | |
| Judith M. Johnson (Born 1949) | | Trustee,
since 2008;
Audit Committee Chairman, from 2009 to 2018 | | Retired. Prior thereto, Chief Executive Officer and Chief Investment Officer of Minneapolis Employees Retirement Fund from 1996 to 2008. Ms. Johnson is an attorney, certified public accountant and a certified managerial accountant. | | N/A |
Wells Fargo Diversified Income Builder Fund | 45
Other information (unaudited)
| | | | | | |
Name and year of birth | | Position held and
length of service* | | Principal occupations during past five years or longer | | Current other
public company or
investment
company
directorships |
| | | |
| David F. Larcker (Born 1950) | | Trustee,
since 2009 | | James Irvin Miller Professor of Accounting at the Graduate School of Business, Stanford University, Director of the Corporate Governance Research Initiative and Senior Faculty of The Rock Center for Corporate Governance since 2006. From 2005 to 2008, Professor of Accounting at the Graduate School of Business, Stanford University. Prior thereto, Ernst & Young Professor of Accounting at The Wharton School, University of Pennsylvania from 1985 to 2005. | | N/A |
| | | |
| Olivia S. Mitchell (Born 1953) | | Trustee,
since 2006; Nominating and Governance Committee Chairman,
since 2018 | | International Foundation of Employee Benefit Plans Professor, Wharton School of the University of Pennsylvania since 1993. Director of Wharton’s Pension Research Council and Boettner Center on Pensions & Retirement Research, and Research Associate at the National Bureau of Economic Research. Previously, Cornell University Professor from 1978 to 1993. | | N/A |
| | | |
| Timothy J. Penny (Born 1951) | | Trustee, since 1996; Chairman, since 2018 | | President and Chief Executive Officer of Southern Minnesota Initiative Foundation, anon-profit organization, since 2007. Member of the Board of Trustees of NorthStar Education Finance, Inc., anon-profit organization, since 2007. | | N/A |
| | | |
| James G. Polisson (Born 1959) | | Trustee,
since 2018 | | Retired. Chief Marketing Officer, Source (ETF) UK Services, Ltd, from 2015 to 2017. From 2012 to 2015, Principal of The Polisson Group, LLC, a management consulting, corporate advisory and principal investing company. Chief Executive Officer and Managing Director at Russell Investments, Global Exchange Traded Funds from 2010 to 2012. Managing Director of Barclays Global Investors from 1998 to 2010 and Global Chief Marketing Officer for iShares and Barclays Global Investors from 2000 to 2010. Trustee of the San Francisco Mechanics’ Institute, anon-profit organization, from 2013 to 2015. Board member of the Russell Exchange Traded Fund Trust from 2011 to 2012. Director of Barclays Global Investors Holdings Deutschland GmbH from 2006 to 2009. Mr. Polisson is an attorney and has a retired status with the Massachusetts and District of Columbia Bar Associations. | | N/A |
| * | Length of service dates reflect the Trustee’s commencement of service with the Trust’s predecessor entities, where applicable. |
46 | Wells Fargo Diversified Income Builder Fund
Other information (unaudited)
Officers
| | | | |
Name and
year of birth | | Position held and
length of service | | Principal occupations during past five years or longer |
| | |
| Andrew Owen (Born 1960) | | President,
since 2017 | | Executive Vice President of Wells Fargo & Company and Head of Affiliated Managers, Wells Fargo Asset Management, since 2014. In addition, Mr. Owen is currently President, Chief Executive Officer and Director of Wells Fargo Funds Management, LLC since 2017. Prior thereto, Executive Vice President responsible for marketing, investments and product development for Wells Fargo Funds Management, LLC, from 2009 to 2014. |
| | |
| Jeremy DePalma1 (Born 1974) | | Treasurer,
since 2012 | | Senior Vice President of Wells Fargo Funds Management, LLC since 2009. Senior Vice President of Evergreen Investment Management Company, LLC from 2008 to 2010 and head of the Fund Reporting and Control Team within Fund Administration from 2005 to 2010. |
| | |
| Michelle Rhee3 (Born 1966) | | Chief Legal Officer,
since 2019 | | Secretary of Wells Fargo Funds Management, LLC, Chief Legal Counsel of Wells Fargo Asset Management and Assistant General Counsel of Wells Fargo Bank, N.A. since 2018. Associate General Counsel and Managing Director of Bank of America Corporation from 2004 to 2018. |
| | |
| Catherine Kennedy4 (Born 1969) | | Secretary,
since 2019 | | Vice President of Wells Fargo Funds Management, LLC and Senior Counsel of the Wells Fargo Legal Department since 2010. Vice President and Senior Counsel of Evergreen Investment Management Company, LLC from 1998 to 2010. |
| | |
| Michael H. Whitaker(Born 1967) | | Chief Compliance Officer,
since 2016 | | Chief Compliance Officer of Wells Fargo Asset Management since 2016. Senior Vice President and Chief Compliance Officer for Fidelity Investments from 2007 to 2016. |
| | |
| David Berardi (Born 1975) | | Assistant Treasurer,
since 2009 | | Vice President of Wells Fargo Funds Management, LLC since 2009. Vice President of Evergreen Investment Management Company, LLC from 2008 to 2010. Manager of Fund Reporting and Control for Evergreen Investment Management Company, LLC from 2004 to 2010. |
| 1 | Jeremy DePalma acts as Treasurer of 86 funds and Assistant Treasurer of 64 funds in the Fund Complex. |
| 2 | The Statement of Additional Information includes additional information about the Trustees and is available, without charge, upon request, by calling1-800-222-8222 or by visiting the website atwfam.com. |
| 3 | Michelle Rhee became Chief Legal Officer effective October 22, 2019. |
| 4 | Catherine Kennedy became Secretary effective October 22, 2019. |
Wells Fargo Diversified Income Builder Fund | 47
Other information (unaudited)
BOARD CONSIDERATION OF INVESTMENT MANAGEMENT ANDSUB-ADVISORY AGREEMENTS:
Wells Fargo Diversified Income Builder Fund
Under the Investment Company Act of 1940 (the “1940 Act”), the Board of Trustees (the “Board”) of Wells Fargo Funds Trust (the “Trust”) must determine annually whether to approve the continuation of the Trust’s investment management andsub-advisory agreements. In this regard, at anin-person meeting held on May21-22, 2019 (the “Meeting”), the Board, all the members of which have no direct or indirect interest in the investment management andsub-advisory agreements and are not “interested persons” of the Trust, as defined in the 1940 Act (the “Independent Trustees”), reviewed and approved for Wells Fargo Diversified Income Builder Fund (the “Fund”): (i) an investment management agreement (the “Management Agreement”) with Wells Fargo Funds Management, LLC (“Funds Management”); and (ii) an investmentsub-advisory agreement (the“Sub-Advisory Agreement”) with Wells Capital Management Incorporated (the“Sub-Adviser”), an affiliate of Funds Management. The Management Agreement and theSub-Advisory Agreement are collectively referred to as the “Advisory Agreements.”
At the Meeting, the Board considered the factors and reached the conclusions described below relating to the selection of Funds Management and theSub-Adviser and the approval of the Advisory Agreements. Prior to the Meeting, including at anin-person meeting in April 2019, the Trustees conferred extensively among themselves and with representatives of Funds Management about these matters. Also, the Board has adopted a team-based approach, with each team consisting of asub-set of Trustees, to assist the full Board in the discharge of its duties in reviewing investment performance and other matters throughout the year. The Independent Trustees were assisted in their evaluation of the Advisory Agreements by independent legal counsel, from whom they received separate legal advice and with whom they met separately.
In providing information to the Board, Funds Management and theSub-Adviser were guided by a detailed set of requests for information submitted to them by independent legal counsel on behalf of the Independent Trustees at the start of the Board’s annual contract renewal process earlier in 2019. In considering and approving the Advisory Agreements, the Trustees considered the information they believed relevant, including but not limited to the information discussed below. The Board considered not only the specific information presented in connection with the Meeting, but also the knowledge gained over time through interaction with Funds Management and theSub-Adviser about various topics. In this regard, the Board reviewed reports of Funds Management at each of its quarterly meetings, which included, among other things, portfolio reviews and investment performance reports. In addition, the Board and the teams mentioned above confer with portfolio managers at various times throughout the year. The Board did not identify any particular information or consideration that wasall-important or controlling, and each individual Trustee may have attributed different weights to various factors.
After its deliberations, the Board unanimously approved the continuation of the Advisory Agreements for aone-year term and determined that the compensation payable to Funds Management and theSub-Adviser under each of the Advisory Agreements was reasonable. The Board considered the approval of the Advisory Agreements for the Fund as part of its consideration of agreements for funds across the complex, but its approvals were made on afund-by-fund basis. The following summarizes a number of important, but not necessarily all, factors considered by the Board in support of its approvals.
Nature, extent and quality of services
The Board received and considered various information regarding the nature, extent and quality of services provided to the Fund by Funds Management and theSub-Adviser under the Advisory Agreements. This information included a description of the investment advisory services and Fund-level administrative services covered by the Management Agreement, as well as, among other things, a summary of the background and experience of senior management of Wells Fargo Asset Management (“WFAM”), of which Funds Management and theSub-Adviser are a part, a summary of investments made in the business of WFAM, a summary of certain organizational and personnel changes involving Funds Management and theSub-Adviser, and a description of Funds Management’s and theSub-Adviser’s business continuity planning programs and of their approaches to data privacy and cybersecurity. The Board received and reviewed information about Funds Management’s role as administrator of the Fund’s liquidity risk management program. The Board also considered the qualifications, background, tenure and responsibilities of each of the portfolio managers primarily responsible for theday-to-day portfolio management of the Fund.
The Board evaluated the ability of Funds Management and theSub-Adviser to attract and retain qualified investment professionals, including research, advisory and supervisory personnel. The Board further considered the compliance programs and compliance records of Funds Management and theSub-Adviser. In addition, the Board took into account the full range of services provided to the Fund by Funds Management and its affiliates.
48 | Wells Fargo Diversified Income Builder Fund
Other information (unaudited)
Fund investment performance and expenses
The Board considered the investment performance results for the Fund over various time periods ended December 31, 2018. The Board considered these results in comparison to the investment performance of funds in a universe that was determined by Broadridge Inc. (“Broadridge”) to be similar to the Fund (the “Universe”), and in comparison to the Fund’s benchmark index and to other comparative data. Broadridge is an independent provider of investment company data. The Board received a description of the methodology used by Broadridge to select the mutual funds in the performance Universe. The Board noted that the investment performance of the Fund (Class A) was higher than the average investment performance of the Universe for the three-, five- andten-year periods under review, and lower than the average investment performance of the Universe for theone-year period under review. The Board also noted that the investment performance of the Fund was lower than its benchmark index, the Diversified Income Builder Blended Index, for all periods under review.
The Board received information concerning, and discussed factors contributing to, the underperformance of the Fund relative to the Universe and benchmark for the periods identified above. The Board took note of the explanations for the relative underperformance during these periods, including with respect to investment decisions and market factors that affected the Fund’s investment performance. The Board also took note of the Fund’s outperformance relative to the Universe and benchmark over the longer time periods under review.
The Board also received and considered information regarding the Fund’s net operating expense ratios and their various components, including actual management fees, custodian and othernon-management fees, and Rule12b-1 andnon-Rule12b-1 shareholder service fees. The Board considered these ratios in comparison to the median ratios of funds in class-specific expense groups that were determined by Broadridge to be similar to the Fund (the “Groups”). The Board received a description of the methodology used by Broadridge to select the mutual funds in the expense Groups and an explanation of how funds comprising expense groups and their expense ratios may vary fromyear-to-year. Based on the Broadridge reports, the Board noted that the net operating expense ratios of the Fund were lower than the median net operating expense ratios of the expense Groups for each share class.
The Board took into account the Fund’s investment performance and expense information provided to it among the factors considered in deciding tore-approve the Advisory Agreements.
Investment management andsub-advisory fee rates
The Board reviewed and considered the contractual fee rates payable by the Fund to Funds Management under the Management Agreement, as well as the contractual fee rates payable by the Fund to Funds Management for class-level administrative services under a Class-Level Administration Agreement, which include, among other things, class-level transfer agency andsub-transfer agency costs (collectively, the “Management Rates”). The Board also reviewed and considered the contractual investmentsub-advisory fee rates that are payable by Funds Management to theSub-Adviser for investmentsub-advisory services.
Among other information reviewed by the Board was a comparison of the Fund’s Management Rates with the average contractual investment management fee rates of funds in the expense Groups at a common asset level as well as transfer agency costs of the funds in the expense Groups. The Board noted that the Management Rates of the Fund were lower than, equal to or in range of the sum of these average rates for the Fund’s expense Groups for all share classes.
The Board also received and considered information about the portion of the total management fee that was retained by Funds Management after payment of the fee to theSub-Adviser forsub-advisory services. In assessing the reasonableness of this amount, the Board received and evaluated information about the nature and extent of responsibilities retained and risks assumed by Funds Management and not delegated to or assumed by theSub-Adviser, and about Funds Management’son-going oversight services. Given the affiliation between Funds Management and theSub-Adviser, the Board ascribed limited relevance to the allocation of fees between them.
The Board also received and considered information about the nature and extent of services offered and fee rates charged by Funds Management and theSub-Adviser to other types of clients with investment strategies similar to those of the Fund. In this regard, the Board received information about the significantly greater scope of services, and compliance, reporting and other legal burdens and risks of managing proprietary mutual funds compared with those associated with managing assets of other types of clients, including third-partysub-advised fund clients andnon-mutual fund clients such as institutional separate accounts.
Based on its consideration of the factors and information it deemed relevant, including those described here, the Board determined that the compensation payable to Funds Management under the Management Agreement and to theSub-Adviser under theSub-Advisory Agreement was reasonable.
Wells Fargo Diversified Income Builder Fund | 49
Other information (unaudited)
Profitability
The Board received and considered information concerning the profitability of Funds Management, as well as the profitability of both WFAM and Wells Fargo & Co. (“Wells Fargo”) from providing services to the fund family as a whole. The Board noted that theSub-Adviser’s profitability information with respect to providing services to the Fund and other funds in the family was subsumed in the WFAM and Wells Fargo profitability analysis.
Funds Management reported on the methodologies and estimates used in calculating profitability, including a description of the methodology used to allocate certain expenses. Among other things, the Board noted that the levels of profitability reported on afund-by-fund basis varied widely, depending on factors such as the size, type and age of fund. Based on its review, the Board did not deem the profits reported by Funds Management, WFAM or Wells Fargo from services provided to the Fund to be at a level that would prevent it from approving the continuation of the Advisory Agreements.
Economies of scale
The Board received and considered information about the potential for Funds Management to experience economies of scale in the provision of management services to the Fund, the difficulties of calculating economies of scale at an individual fund level, and the extent to which potential scale benefits are shared with shareholders. The Board noted the existence of breakpoints in the Fund’s management fee structure, which operate generally to reduce the Fund’s expense ratios as the Fund grows in size. The Board considered that in addition to management fee breakpoints, Funds Management shares potential economies of scale from its management business in a variety of ways, including through fee waiver and expense reimbursement arrangements, services that benefit shareholders, competitive management fee rates set at the outset without regard to breakpoints, and investments in the business intended to enhance services available to shareholders.
The Board concluded that Funds Management’s arrangements with respect to the Fund, including contractual breakpoints, constituted a reasonable approach to sharing potential economies of scale with the Fund and its shareholders.
Other benefits to Funds Management and theSub-Adviser
The Board received and considered information regarding potential“fall-out” or ancillary benefits received by Funds Management and its affiliates, including theSub-Adviser, as a result of their relationships with the Fund. Ancillary benefits could include, among others, benefits directly attributable to other relationships with the Fund and benefits potentially derived from an increase in Funds Management’s and theSub-Adviser’s business as a result of their relationships with the Fund. The Board noted that various affiliates of Funds Management may receive distribution-related fees, shareholder servicing payments andsub-transfer agency fees in respect of shares sold or held through them and services provided.
The Board also reviewed information about soft dollar credits earned and utilized by theSub-Adviser, fees earned by Funds Management and theSub-Adviser from managing a private investment vehicle for the fund family’s securities lending collateral, and commissions earned by an affiliated broker from portfolio transactions.
Based on its consideration of the factors and information it deemed relevant, including those described here, the Board did not find that any ancillary benefits received by Funds Management and its affiliates, including theSub-Adviser, were unreasonable.
Conclusion
At the Meeting, after considering the above-described factors and based on its deliberations and its evaluation of the information described above, the Board unanimously approved the continuation of the Advisory Agreements for aone-year term and determined that the compensation payable to Funds Management and theSub-Adviser under each of the Advisory Agreements was reasonable.
50 | Wells Fargo Diversified Income Builder Fund
This page is intentionally left blank.
This page is intentionally left blank.

For more information
More information about Wells Fargo Funds is available free upon request. To obtain literature, please write, visit the Fund’s website, or call:
Wells Fargo Funds
P.O. Box 219967
Kansas City, MO 64121-9967
Website:wfam.com
Individual investors:1-800-222-8222
Retail investment professionals:1-888-877-9275
Institutional investment professionals:1-866-765-0778

This report and the financial statements contained herein are submitted for the general information of the shareholders of the Fund. If this report is used for promotional purposes, distribution of the report must be accompanied or preceded by a current prospectus. Before investing, please consider the investment objectives, risks, charges, and expenses of the investment. For a current prospectus and, if available, a summary prospectus, containing this information, call1-800-222-8222 or visit the Fund’s website atwfam.com. Read the prospectus carefully before you invest or send money.
Wells Fargo Asset Management (WFAM) is the trade name for certain investment advisory/management firms owned by Wells Fargo & Company. These firms include but are not limited to Wells Capital Management Incorporated and Wells Fargo Funds Management, LLC. Certain products managed by WFAM entities are distributed by Wells Fargo Funds Distributor, LLC (a broker-dealer and Member FINRA).
This material is for general informational and educational purposes only and is NOT intended to provide investment advice or a recommendation of any kind—including a recommendation for any specific investment, strategy, or plan.
INVESTMENT PRODUCTS: NOT FDIC INSURED ◾ NO BANK GUARANTEE ◾ MAY LOSE VALUE
© 2019 Wells Fargo & Company. All rights reserved.
406806 11-19
A226/AR226 09-19
Annual Report
September 30, 2019
Wells Fargo
Index Asset Allocation Fund
Beginning on January 1, 2021, as permitted by new regulations adopted by the Securities and Exchange Commission, paper copies of the Wells Fargo Funds’ annual and semi-annual shareholder reports issued after this date will no longer be sent by mail, unless you specifically request paper copies of the reports. Instead, the reports will be made available on the Funds’ website, and you will be notified by mail each time a report is posted and provided with a website address to access the report.
If you already elected to receive shareholder reports electronically, you will not be affected by this change and you need not take any action. You may elect to receive shareholder reports and other communications from the Fund electronically at any time by contacting your financial intermediary (such as a broker-dealer or bank) or, if you are a direct investor, by calling1-800-222-8222 or by enrolling at wellsfargo.com/advantagedelivery.
You may elect to receive all future reports in paper free of charge. If you invest through a financial intermediary, you can contact your financial intermediary to request that you continue to receive paper copies of your shareholder reports; if you invest directly with the Fund, you can call 1-800-222-8222. Your election to receive reports in paper will apply to all Wells Fargo Funds held in your account with your financial intermediary or, if you are a direct investor, to all Wells Fargo Funds that you hold.
|
|
|
Reduce clutter. Save trees. |
Sign up for electronic delivery of prospectuses and shareholder reports atwellsfargo.com/advantagedelivery |
The views expressed and any forward-looking statements are as of September 30, 2019, unless otherwise noted, and are those of the Fund managers and/or Wells Fargo Asset Management. Discussions of individual securities, or the markets generally, or any Wells Fargo Fund are not intended as individual recommendations. Future events or results may vary significantly from those expressed in any forward-looking statements. The views expressed are subject to change at any time in response to changing circumstances in the market. Wells Fargo Asset Management and the Fund disclaim any obligation to publicly update or revise any views expressed or forward-looking statements.
INVESTMENT PRODUCTS: NOT FDIC INSURED ◾ NO BANK GUARANTEE ◾ MAY LOSE VALUE
Wells Fargo Index Asset Allocation Fund | 1
Letter to shareholders (unaudited)

Andrew Owen
President
Wells Fargo Funds
“December’s S&P 500 Index performance was the worst since 1931.”
Dear Shareholder:
We are pleased to offer you this annual report for the Wells Fargo Index Asset Allocation Fund for the 12-month period that ended September 30, 2019. After the first half of the period yielded either low-single-digit or negative investment returns, U.S. stock and global bond investors generally saw markets recover during the second half amid intensifying market volatility, global economic growth concerns, international trade stare downs, and simmering geopolitical tensions.
Overall, fixed-income investors enjoyed a distinct advantage over stock investors. For the period, U.S. stocks, based on the S&P 500 Index,1 gained 4.25% and international stocks, as measured by the MSCI ACWI ex USA Index (Net),2 fell 1.23%. The MSCI EM Index (Net)3 slipped 2.02%. Among fixed income investors, the Bloomberg Barclays U.S. Aggregate Bond Index4 added 10.30%, the Bloomberg Barclays Global Aggregateex-USD Index5 added 5.34%, the Bloomberg Barclays Municipal Bond Index6 gained 8.55%, and the ICE BofAML U.S. High Yield Index7 added 6.30%.
Investors confronted unsettling events during the fourth quarter of 2018.
During the fourth quarter of 2018, investors grew concerned about the pace and sustainability of the global economic expansion. The U.S. Bureau of Economic Analysis reported third-quarter U.S. gross domestic product (GDP) was 3.4% on an annualized basis, which was down from the second-quarter rate. A partial U.S. government shutdown occurred, which extended into January 2019. Brexit efforts stalled, causing uncertainty for the eurozone. The value of the renminbi declined even as the People’s Bank of China cut reserve requirement ratios, accelerated infrastructure spending, and cut taxes in efforts to spur economic activity.
The combination of news in the U.S. and generally weak economic indicators outside of the U.S. caused investors to seek safe havens. December’s S&P 500 Index performance was the worst since 1931. Globally, fixed-income investments fared better than stocks during the last two months of the year. Even as indicators suggested growth was restrained, the U.S. Federal Reserve (Fed) increased the federal funds rate by 25 basis points (bps; 100 bps equal 1.00%) in December 2018 to a target range of between 2.25% and 2.50%. Many observers expressed concerns that higher rates could slow the economy further.
| 1 | The S&P 500 Index consists of 500 stocks chosen for market size, liquidity, and industry group representation. It is a market-value-weighted index with each stock’s weight in the index proportionate to its market value. You cannot invest directly in an index. |
| 2 | The Morgan Stanley Capital International (MSCI) All Country World Index (ACWI) ex USA Index (Net) is a free-float-adjusted market-capitalization weighted index that is designed to measure the equity market performance of developed and emerging markets, excluding the U.S. Source: MSCI. MSCI makes no express or implied warranties or representations and shall have no liability whatsoever with respect to any MSCI data contained herein. The MSCI data may not be further redistributed or used as a basis for other indices or any securities or financial products. This report is not approved, reviewed, or produced by MSCI. You cannot invest directly in an index. |
| 3 | The MSCI Emerging Markets (EM) Index (Net) is a free-float-adjusted market-capitalization-weighted index that is designed to measure the equity market performance of emerging markets. You cannot invest directly in an index. |
| 4 | The Bloomberg Barclays U.S. Aggregate Bond Index is a broad-based benchmark that measures the investment-grade, U.S. dollar-denominated, fixed-rate taxable bond market, including Treasuries, government-related and corporate securities, mortgage-backed securities (agency fixed-rate and hybrid adjustable-rate mortgage pass-throughs), asset-backed securities, and commercial mortgage-backed securities. You cannot invest directly in an index. |
| 5 | The Bloomberg Barclays Global Aggregate ex-USD Index is an unmanaged index that provides a broad-based measure of the global investment-grade fixed-income markets excluding the U.S. dollar-denominated debt market. You cannot invest directly in an index. |
| 6 | The Bloomberg Barclays Municipal Bond Index is an unmanaged index composed of long-term tax-exempt bonds with a minimum credit rating of Baa. You cannot invest directly in an index. |
| 7 | The ICE BofAML U.S. High Yield Index is a market-capitalization-weighted index of domestic and Yankee high-yield bonds. The index tracks the performance of high-yield securities traded in the U.S. bond market. You cannot invest directly in an index. Copyright 2019. ICE Data Indices, LLC. All rights reserved. |
2 | Wells Fargo Index Asset Allocation Fund
Letter to shareholders (unaudited)
The market climbs a wall of worry.
Investment returns early in 2019 appeared to reaffirm the adage that markets climb a wall of worry as the new year began. The S&P 500 Index gained 8.01% for the month of January, the best monthly performance in 30 years. Returns for the MSCI ACWI ex USA Index (Net), the Bloomberg Barclays U.S. Aggregate Bond Index, and the Bloomberg Barclays Global Aggregate ex-USD Index also were positive.
In February 2019, signs of slowing global growth grew more ominous. The Bureau of Economic Analysis announced fourth-quarter 2018 GDP grew at an annualized 2.2% rate, a slower rate than reported for the prior two quarters. In a February report, the Bank of England forecast the slowest growth for 2019 since the financial crisis. China and the U.S. continued to wrangle over trade issues. By the end of the first quarter of 2019, more accommodative Fed sentiment and steady, if not spectacular, U.S. economic and business metrics encouraged domestic investors.
Early second-quarter 2019 enthusiasm among investors faded.
During April 2019, favorable sentiment found additional support in reports of sustained low inflation, solid employment data, and first-quarter U.S. GDP of an annualized rate of 3.2%. During May, markets tumbled on mixed investment signals. In the U.S., partisan wrangling ramped up as Democrats and Republicans set their sights on 2020 presidential politics. The U.K.’s Brexit disagreements caused Prime Minister Theresa May to resign. Boris Johnson succeeded her only to exacerbate uncertainty about Brexit’s resolution ahead of an October 2019 deadline. The European Commission downgraded the 2019 growth forecast to 1.2%. The U.S. increased tariffs on products from China, China responded, and then talks broke down. President Donald Trump threatened to turn his foreign policy tariff tool to Mexico over immigration issues.
During the third quarter of 2019, investors regrouped. Just as the investment horizon appeared to darken, sentiment turned and U.S. equity markets gained during June and July. The gains, primarily driven by geopolitical and monetary policy events, pushed equity markets to new highs. European Central Bank President Mario Draghi said that if the outlook doesn’t improve, the bank would cut rates or buy more assets to prop up inflation. President Trump backed off of tariff threats against Mexico and China. In the U.S., the Fed implemented a 0.25% federal funds rate cut in July.
Later in July 2019, the U.S. reversed course and threatened to impose higher tariffs on China’s exports after talks failed. China responded with tariff threats of its own and devalued the renminbi, a move that roiled global markets. Major U.S. stock market indices closed July with the worst weekly results of the year. Bond prices gained as Treasury yields fell to levels not seen since November 2016 and the yield curve inverted at multiple points along the 30-year arc.
In a microcosm, August 2019 encapsulated many of the unnerving events that plagued investors during the prior 11 months. The U.S.-China trade relationship swung from antagonistic to hopeful and back again with no evident compromise on the horizon. Evidence of a continued global economic slowdown mounted. Central banks in China, New Zealand, and Thailand cut interest rates. Industrial and manufacturing data declined in China, Canada, Japan, and Germany. Adding to the uncertain environment, Italy’s prime minister resigned, many feared a crackdown in Hong Kong as protesters sustained their calls for reform throughout the month, and Boris Johnson planned to suspend Parliament as Brexit’s deadline neared.
In the U.S., September saw the Fed join other central banks in cutting interest rates. Manufacturing data in the U.S., as reported by the Institute for Supply Management, disappointed investors. The U.S. Congress announced it would pursue an impeachment investigation of President Trump. Meanwhile, the Brexit impasse showed no signs of
“The S&P 500 Index gained 8.01% for the month of January, the best monthly performance in 30 years.”
Wells Fargo Index Asset Allocation Fund | 3
Letter to shareholders (unaudited)
|
|
|
For further information about your Fund, contact your investment professional, visit our website at wfam.com, or call us directly at1-800-222-8222. |
resolution. Officials in China said that hitting the country’s economic growth goals for the year would be difficult considering the weight of tariffs and trade restrictions. So while the S&P 500 Index finished the third quarter with year-to-date returns that were the best in more than 20 years, amid signs of equity investors taking money out of the stock market, concerns about future returns remained.
Don’t let short-term uncertainty derail long-term investment goals.
Periods of investment uncertainty can present challenges, but experience has taught us that maintaining long-term investment goals can be an effective way to plan for the future. To help you create a sound strategy based on your personal goals and risk tolerance, Wells Fargo Funds offers more than 100 mutual funds spanning a wide range of asset classes and investment styles. Although diversification cannot guarantee an investment profit or prevent losses, we believe it can be an effective way to manage investment risk and potentially smooth out overall portfolio performance. We encourage investors to know their investments and to understand that appropriate levels of risk-taking may potentially unlock opportunities.
Thank you for choosing to invest with Wells Fargo Funds. We appreciate your confidence in us and remain committed to helping you meet your financial needs.
Sincerely,

Andrew Owen
President
Wells Fargo Funds
4 | Wells Fargo Index Asset Allocation Fund
This page is intentionally left blank.
Performance highlights (unaudited)
Investment objective
The Fund seeks long-term total return, consisting of capital appreciation and current income.
Manager
Wells Fargo Funds Management, LLC
Subadviser
Wells Capital Management Incorporated
Portfolio managers
Kandarp R. Acharya, CFA®‡, FRM
Petros N. Bocray, CFA®‡, FRM
Christian L. Chan, CFA®‡
Average annual total returns (%) as of September 30, 2019
| | | | | | | | | | | | | | | | | | | | | | | | | | | | | | | | | | |
| | | | |
| | | | | Including sales charge | | | Excluding sales charge | | | Expense ratios1 (%) | |
| | | | | | | | | |
| | | Inception date | | 1 year | | | 5 year | | | 10 year | | | 1 year | | | 5 year | | | 10 year | | | Gross | | | Net2 | |
| | | | | | | | | | |
| Class A (SFAAX) | | 11-13-1986 | | | -0.52 | | | | 6.42 | | | | 9.71 | | | | 5.54 | | | | 7.69 | | | | 10.36 | | | | 1.08 | | | | 1.08 | |
| | | | | | | | | | |
| Class C (WFALX) | | 4-1-1998 | | | 3.75 | | | | 6.89 | | | | 9.54 | | | | 4.75 | | | | 6.89 | | | | 9.54 | | | | 1.83 | | | | 1.83 | |
| | | | | | | | | | |
| Administrator Class (WFAIX) | | 11-8-1999 | | | – | | | | – | | | | – | | | | 5.73 | | | | 7.90 | | | | 10.61 | | | | 1.00 | | | | 0.90 | |
| | | | | | | | | | |
| Institutional Class (WFATX)3 | | 10-31-2016 | | | – | | | | – | | | | – | | | | 5.89 | | | | 8.00 | | | | 10.66 | | | | 0.75 | | | | 0.75 | |
| | | | | | | | | | |
| Index Asset Allocation Blended Index4 | | – | | | – | | | | – | | | | – | | | | 7.23 | | | | 8.71 | | | | 10.79 | | | | – | | | | – | |
| | | | | | | | | | |
| Bloomberg Barclays U.S. Treasury Index5 | | – | | | – | | | | – | | | | – | | | | 10.48 | | | | 2.91 | | | | 3.08 | | | | – | | | | – | |
| | | | | | | | | | |
| S&P 500 Index6 | | – | | | – | | | | – | | | | – | | | | 4.25 | | | | 10.84 | | | | 13.24 | | | | – | | | | – | |
Figures quoted represent past performance, which is no guarantee of future results, and do not reflect taxes that a shareholder may pay on fund distributions or the redemption of fund shares. Investment return and principal value of an investment will fluctuate so that an investor’s shares, when redeemed, may be worth more or less than their original cost. Performance shown without sales charges would be lower if sales charges were reflected. Current performance may be lower or higher than the performance data quoted, which assumes the reinvestment of dividends and capital gains. Currentmonth-end performance is available on the Fund’s website,wfam.com.
Index returns do not include transaction costs associated with buying and selling securities, any mutual fund fees or expenses, or any taxes. It is not possible to invest directly in an index.
For Class A shares, the maximumfront-end sales charge is 5.75%. For Class C shares, the maximum contingent deferred sales charge is 1.00%. Performance including a contingent deferred sales charge assumes the sales charge for the corresponding time period. Administrator Class and Institutional Class shares are sold without afront-end sales charge or contingent deferred sales charge.
Balanced funds may invest in stocks and bonds. Stock values fluctuate in response to the activities of individual companies and general market and economic conditions. Bond values fluctuate in response to the financial condition of individual issuers, general market and economic conditions, and changes in interest rates. Changes in market conditions and government policies may lead to periods of heightened volatility in the bond market and reduced liquidity for certain bonds held by the Fund. In general, when interest rates rise, bond values fall and investors may lose principal value. Interest rate changes and their impact on the Fund and its share price can be sudden and unpredictable. The use of derivatives may reduce returns and/or increase volatility. Consult the Fund’s prospectus for additional information on these and other risks.
Please see footnotes on page 7.
6 | Wells Fargo Index Asset Allocation Fund
Performance highlights (unaudited)
|
|
| Growth of $10,000 investment as of September 30, 20197 |
|
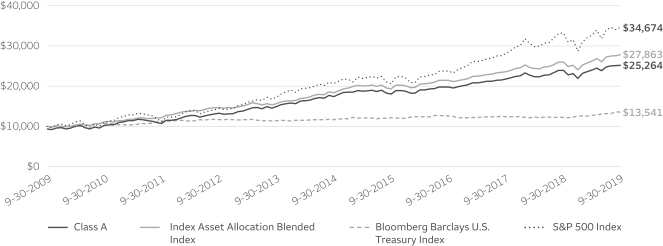
|
| ‡ | CFA® and Chartered Financial Analyst® are trademarks owned by CFA Institute. |
| 1 | Reflects the expense ratios as stated in the most recent prospectuses. The expense ratios shown are subject to change and may differ from the annualized expense ratios shown in the financial highlights of this report. |
| 2 | The manager has contractually committed through January 31, 2020, to waive fees and/or reimburse expenses to the extent necessary to cap the expenses of each class after fee waivers at the amounts shown. Brokerage commissions, stamp duty fees, interest, taxes, acquired fund fees and expenses (if any), and extraordinary expenses are excluded from the expense cap. Prior to or after the commitment expiration date, the cap may be increased or the commitment to maintain the cap may be terminated only with the approval of the Board of Trustees. Without this cap, the Fund’s returns would have been lower. The expense ratio paid by an investor is the net expense ratio (the total annual fund operating expenses after fee waivers) as stated in the prospectuses. |
| 3 | Historical performance shown for the Institutional Class shares prior to their inception reflects the performance of the Administrator Class shares, and is not adjusted to reflect the expenses of the Institutional Class shares. If these expenses had been included, returns for Institutional Class shares would be higher. |
| 4 | Source: Wells Fargo Funds Management, LLC. Index Asset Allocation Blended Index is composed 60% of the S&P 500 Index and 40% of the Bloomberg Barclays U.S. Treasury Index. Prior to April 1, 2015, the Index Asset Allocation Blended Index was composed 60% of the S&P 500 Index and 40% of the Bloomberg Barclays U.S. Treasury 20+ Year Index. You cannot invest directly in an index. |
| 5 | The Bloomberg Barclays U.S. Treasury Index is an unmanaged index of prices of U.S. Treasury bonds with maturities of 1 to 30 years. You cannot invest directly in an index. |
| 6 | The S&P 500 Index consists of 500 stocks chosen for market size, liquidity, and industry group representation. It is a market-value weighted index with each stock’s weight in the index proportionate to its market value. You cannot invest directly in an index. |
| 7 | The chart compares the performance of Class A shares for the most recent ten years with the Index Asset Allocation Blended Index, Bloomberg Barclays U.S. Treasury Index, and the S&P 500 Index. The chart assumes a hypothetical investment of $10,000 in Class A shares and reflects all operating expenses and assumes the maximum initial sales charge of 5.75%. |
| 8 | The Morgan Stanley Capital International (MSCI) Europe, Australasia, Far East (EAFE) Index (Net) is a free-float-adjusted market-capitalization-weighted index that is designed to measure the equity market performance of developed markets, excluding the United States and Canada. You cannot invest directly in an index. |
| 9 | The MSCI Emerging Markets (EM) Index (Net) is a free-float-adjusted market-capitalization-weighted index that is designed to measure the equity market performance of emerging markets. You cannot invest directly in an index. |
| 10 | The Bloomberg Barclays U.S. Treasury 20+ Year Index is an unmanaged index composed of securities in the U.S. Treasury Index with maturities of 20 years or greater. You cannot invest directly in an index. |
| 11 | The ten largest holdings, excluding cash, cash equivalents and any money market funds, are calculated based on the value of the investments divided by total net assets of the Fund. Holdings are subject to change and may have changed since the date specified. |
| 12 | Amounts are calculated based on the total long-term investments of the Fund. These amounts are subject to change and may have changed since the date specified. |
| 13 | The effective allocation includes the effect of any tactical futures overlay that may be in place. These amounts are subject to change and may have changed since the date specified. |
Wells Fargo Index Asset Allocation Fund | 7
Performance highlights (unaudited)
MANAGER’S DISCUSSION
Fund highlights
| ∎ | | The Fund underperformed its benchmark, the Index Asset Allocation Blended Index, for the12-month period that ended September 30, 2019. |
| ∎ | | The Fund’s tactical asset allocation overlay, which is implemented with liquid futures contracts, detracted from performance during the12-month period. |
| ∎ | | The Fund’s stock allocation performed in line with its respective benchmark, the S&P 500 Index, while the Fund’s bond allocation underperformed its respective benchmark, the Bloomberg Barclays U.S. Treasury Index. |
| ∎ | | Relative to its benchmark, the Fund’s slightly lower duration detracted from performance. |
Equity markets ended the12-month period in positive territory despite mounting concerns about trade and a global slowdown. It was by no means a smooth ride, however, as risk assets sold off in the final three months of 2018 only to stage a sharp rebound in the first half of 2019. Volatility—which remained quite high during the fourth quarter of 2018—hovered below historical levels during the first nine months of the year.
Negative sentiment among investors gave way to renewed optimism as the Federal Reserve (the Fed) adopted a more dovish tone in the new year and then proceeded to lower rates for the first time in a decade. U.S. equity markets rallied, while U.S. bond yields fell to historical lows. For the period, the S&P 500 Index posted a return of 4.25%, while developednon-U.S. markets, as measured by the MSCI EAFE Index (Net)8, returned-1.34%. Meanwhile, emerging market stocks, as measured by the MSCI EM Index (Net)9, posted a return of-2.02%.
Longer-duration U.S. government bond prices rose sharply amid a precipitous decline in yields. For the12-month period, the yield on30-year U.S. Treasury bonds fell by 1.10%, from 3.21% to 2.11%, while yields on10-year U.S. Treasury notes fell by 1.39%, from 3.06% to 1.67%. The Bloomberg Barclays U.S. Treasury Index, a broad measure of U.S. Treasury notes and bonds, gained 10.48% during the12-month period, while the Bloomberg Barclays U.S. Treasury 20+ Year Index10 returned 25.21%.
| | | | |
|
| Ten largest holdings(%) as of September 30, 201911 | |
| | |
Microsoft Corporation | | | 2.58 | |
| | |
Apple Incorporated | | | 2.31 | |
| | |
Amazon.com Incorporated | | | 1.75 | |
| | |
Facebook Incorporated Class A | | | 1.04 | |
| | |
Berkshire Hathaway Incorporated Class B | | | 0.99 | |
| | |
JPMorgan Chase & Company | | | 0.91 | |
| | |
Alphabet Incorporated Class C | | | 0.89 | |
| | |
Alphabet Incorporated Class A | | | 0.89 | |
| | |
Johnson & Johnson | | | 0.83 | |
| | |
The Procter & Gamble Company | | | 0.76 | |
Tactical asset allocation shifts detracted from performance during the12-month period.
The Fund’s stock holdings seek to replicate the holdings of the S&P 500 Index. Its bond holdings seek to replicate the holdings of the Bloomberg Barclays U.S. Treasury Index. The Fund’s neutral target allocation is 60% stocks and 40% bonds. As of fiscalyear-end, the Fund had an effective target allocation of 58% stocks, 53% bonds, and -11% effective cash.
Please see footnotes on page 7.
8 | Wells Fargo Index Asset Allocation Fund
Performance highlights (unaudited)
|
|
| Sector distribution as of September 30, 201912 |
|
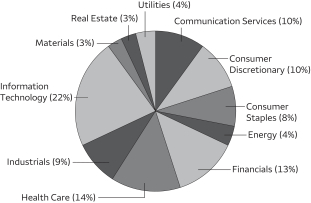 |
| | | | | | | | |
|
| Allocations (%) as of September 30, 2019 | |
| | |
| | | Effective
allocation13 | | | Neutral
allocation | |
| | | |
Bonds | | | 53 | | | | 40 | |
| | | |
Stocks | | | 58 | | | | 60 | |
| | | |
Effective Cash | | | -11 | | | | 0 | |
During the period, the portfolio management team implemented tactical shifts between stocks and bonds in order to adjust the Fund’s effective allocations based on the relative attractiveness of the two asset classes. The Fund began the period with a long position in S&P 500 futures, which we increased as markets sold off in the fourth quarter of 2018. We subsequently closed out the long position in early February after a sharp rebound in risk markets. As markets continued to climb higher during the spring of 2019, setting several record highs along the way, we established a short position in S&P 500 futures. In early June, we covered the short position after the Fed presented its modified dovish stance. Inmid-August, amid growing concerns about trade and weaker global growth, we reestablished the short position.
On the fixed-income side, the Fund started the period with a short position in U.S.10-year Treasury futures, which we covered in the first couple of days of October 2018 and then reestablished toward the end of 2018. We covered the entire position in March 2019. In early June, we initiated another short position in U.S.10-year Treasury futures on our belief that the market had too aggressively priced in future rate cuts. We closed out the short position in early July. Inmid-August and early September, we established a long position in U.S.10-year Treasury futures amid growing concerns about trade and weaker global growth.
The Fund’s effective allocation is determined by a combination of inputs from multiple quantitative and qualitative factors. As of the close of the period, relative to its benchmark, the Fund maintained an underweight to stocks and an overweight to bonds. All of the changes to the effective asset allocation were implemented with liquid futures contracts.
The portfolio management team has adopted a more cautious stance
Slowing growth, trade disputes, negative yields, Brexit,oil-field bombings, and impeachment form a firm foundation for the wall of worry that markets are forced to climb each day. We are particularly focused on Brexit and U.S. trade disputes as they both have significant potential to either rock markets or push them higher if resolved benignly. The market needs some level of certainty for risk assets to climb over the wall of worry. We take some comfort in the Fed as it appears ready to cut rates further if it sees weakness.
We continue to look across all markets to discover investment opportunities. While attractive investment options are not overabundant now, we remain dedicated and vigilant in seeking these risk and return opportunities in the Fund. We stand ready to adjust exposures as needed.
Please see footnotes on page 7.
Wells Fargo Index Asset Allocation Fund | 9
Fund expenses (unaudited)
As a shareholder of the Fund, you incur two types of costs: (1) transaction costs, including sales charges (loads) on purchase payments and contingent deferred sales charges (if any) on redemptions and (2) ongoing costs, including management fees, distribution(12b-1) and/or shareholder servicing fees, and other Fund expenses. This example is intended to help you understand your ongoing costs (in dollars) of investing in the Fund and to compare these costs with the ongoing costs of investing in other mutual funds.
The example is based on an investment of $1,000 invested at the beginning of thesix-month period and held for the entire period from April 1, 2019 to September 30, 2019.
Actual expenses
The “Actual” line of the table below provides information about actual account values and actual expenses. You may use the information in this line, together with the amount you invested, to estimate the expenses that you paid over the period. Simply divide your account value by $1,000 (for example, an $8,600 account value divided by $1,000 = 8.6), then multiply the result by the number in the “Actual” line under the heading entitled “Expenses paid during period” for your applicable class of shares to estimate the expenses you paid on your account during this period.
Hypothetical example for comparison purposes
The “Hypothetical” line of the table below provides information about hypothetical account values and hypothetical expenses based on the Fund’s actual expense ratio and an assumed rate of return of 5% per year before expenses, which is not the Fund’s actual return. The hypothetical account values and expenses may not be used to estimate the actual ending account balance or expenses you paid for the period. You may use this information to compare the ongoing costs of investing in the Fund and other funds. To do so, compare this 5% hypothetical example with the 5% hypothetical examples that appear in the shareholder reports of the other funds.
Please note that the expenses shown in the table are meant to highlight your ongoing costs only and do not reflect any transactional costs, such as sales charges (loads) and contingent deferred sales charges. Therefore, the “Hypothetical” line of the table is useful in comparing ongoing costs only and will not help you determine the relative total costs of owning different funds. In addition, if these transactional costs were included, your costs would have been higher.
| | | | | | | | | | | | | | | | |
| | | Beginning
account value
4-1-2019 | | | Ending
account value
9-30-2019 | | | Expenses
paid during
the period¹ | | | Annualized net
expense ratio | |
| | | | | |
Class A | | | | | | | | | | | | | | | | |
| | | | |
Actual | | $ | 1,000.00 | | | $ | 1,050.97 | | | $ | 5.57 | | | | 1.08 | % |
| | | | |
Hypothetical (5% return before expenses) | | $ | 1,000.00 | | | $ | 1,019.64 | | | $ | 5.48 | | | | 1.08 | % |
| | | | | |
Class C | | | | | | | | | | | | | | | | |
| | | | |
Actual | | $ | 1,000.00 | | | $ | 1,046.92 | | | $ | 9.42 | | | | 1.83 | % |
| | | | |
Hypothetical (5% return before expenses) | | $ | 1,000.00 | | | $ | 1,015.87 | | | $ | 9.27 | | | | 1.83 | % |
| | | | | |
Administrator Class | | | | | | | | | | | | | | | | |
| | | | |
Actual | | $ | 1,000.00 | | | $ | 1,051.91 | | | $ | 4.64 | | | | 0.90 | % |
| | | | |
Hypothetical (5% return before expenses) | | $ | 1,000.00 | | | $ | 1,020.54 | | | $ | 4.57 | | | | 0.90 | % |
| | | | | |
Institutional Class | | | | | | | | | | | | | | | | |
| | | | |
Actual | | $ | 1,000.00 | | | $ | 1,052.43 | | | $ | 3.87 | | | | 0.75 | % |
| | | | |
Hypothetical (5% return before expenses) | | $ | 1,000.00 | | | $ | 1,021.30 | | | $ | 3.81 | | | | 0.75 | % |
| 1 | Expenses paid is equal to the annualized net expense ratio of each class multiplied by the average account value over the period, multiplied by the number of days in the most recent fiscal half-year divided by the number of days in the fiscal year (to reflect theone-half-year period). |
10 | Wells Fargo Index Asset Allocation Fund
Portfolio of investments—September 30, 2019
| | | | | | | | | | | | | | | | |
| | | Interest
rate | | | Maturity
date | | | Principal | | | Value | |
| Agency Securities: 0.00% | | | | | | | | | | | | |
FNMA Series2002-T1 Class A4 | | | 9.50 | % | | | 11-25-2031 | | | $ | 34,946 | | | $ | 41,766 | |
| | | | | | | | | | | | | | | | |
| | | | |
Total Agency Securities (Cost $34,946) | | | | | | | | | | | | | | | 41,766 | |
| | | | | | | | | | | | | | | | |
| | | | |
| | | | | | | | | | | | | | | | |
| | | | | | | | | Shares | | | | |
| Common Stocks: 59.94% | | | | | | | | | | | | | | | | |
| | | | |
Communication Services: 6.21% | | | | | | | | | | | | | | | | |
| | | | |
| Diversified Telecommunication Services: 1.30% | | | | | | | | | | | | |
AT&T Incorporated | | | | | | | | | | | 236,041 | | | | 8,931,791 | |
CenturyLink Incorporated | | | | | | | | | | | 31,711 | | | | 395,753 | |
Verizon Communications Incorporated | | | | | | | | | | | 133,606 | | | | 8,064,458 | |
| | | | |
| | | | | | | | | | | | | | | 17,392,002 | |
| | | | | | | | | | | | | | | | |
| | | | |
| Entertainment: 1.08% | | | | | | | | | | | | |
Activision Blizzard Incorporated | | | | | | | | | | | 24,777 | | | | 1,311,199 | |
Electronic Arts Incorporated † | | | | | | | | | | | 9,519 | | | | 931,149 | |
Netflix Incorporated † | | | | | | | | | | | 14,143 | | | | 3,784,950 | |
Take-Two Interactive Software Incorporated † | | | | | | | | | | | 3,655 | | | | 458,118 | |
The Walt Disney Company | | | | | | | | | | | 58,190 | | | | 7,583,321 | |
Viacom Incorporated Class B | | | | | | | | | | | 11,434 | | | | 274,759 | |
| | | | |
| | | | | | | | | | | | | | | 14,343,496 | |
| | | | | | | | | | | | | | | | |
| | | | |
| Interactive Media & Services: 2.91% | | | | | | | | | | | | |
Alphabet Incorporated Class A † | | | | | | | | | | | 9,676 | | | | 11,815,751 | |
Alphabet Incorporated Class C † | | | | | | | | | | | 9,762 | | | | 11,899,878 | |
Facebook Incorporated Class A † | | | | | | | | | | | 77,712 | | | | 13,838,953 | |
TripAdvisor Incorporated † | | | | | | | | | | | 3,391 | | | | 131,164 | |
Twitter Incorporated † | | | | | | | | | | | 24,971 | | | | 1,028,805 | |
| | | | |
| | | | | | | | | | | | | | | 38,714,551 | |
| | | | | | | | | | | | | | | | |
| | | | |
| Media: 0.86% | | | | | | | | | | | | |
CBS Corporation Class B | | | | | | | | | | | 10,571 | | | | 426,751 | |
Charter Communications Incorporated Class A † | | | | | | | | | | | 5,222 | | | | 2,152,091 | |
Comcast Corporation Class A | | | | | | | | | | | 146,513 | | | | 6,604,806 | |
Discovery Communications Incorporated Class A † | | | | | | | | | | | 5,104 | | | | 135,920 | |
Discovery Communications Incorporated Class C † | | | | | | | | | | | 11,208 | | | | 275,941 | |
DISH Network Corporation Class A † | | | | | | | | | | | 7,771 | | | | 264,758 | |
Fox Corporation Class A | | | | | | | | | | | 11,449 | | | | 361,044 | |
Fox Corporation Class B | | | | | | | | | | | 5,244 | | | | 165,396 | |
Interpublic Group of Companies Incorporated | | | | | | | | | | | 12,509 | | | | 269,694 | |
News Corporation Class A | | | | | | | | | | | 12,458 | | | | 173,415 | |
News Corporation Class B | | | | | | | | | | | 3,933 | | | | 56,222 | |
Omnicom Group Incorporated | | | | | | | | | | | 7,026 | | | | 550,136 | |
| | | | |
| | | | | | | | | | | | | | | 11,436,174 | |
| | | | | | | | | | | | | | | | |
| | | | |
| Wireless Telecommunication Services: 0.06% | | | | | | | | | | | | |
T-Mobile US Incorporated † | | | | | | | | | | | 10,213 | | | | 804,478 | |
| | | | | | | | | | | | | | | | |
| | | | |
Consumer Discretionary: 6.06% | | | | | | | | | | | | | | | | |
| | | | |
| Auto Components: 0.07% | | | | | | | | | | | | |
Aptiv plc | | | | | | | | | | | 8,275 | | | | 723,401 | |
BorgWarner Incorporated | | | | | | | | | | | 6,670 | | | | 244,656 | |
| | | | |
| | | | | | | | | | | | | | | 968,057 | |
| | | | | | | | | | | | | | | | |
Wells Fargo Index Asset Allocation Fund | 11
Portfolio of investments—September 30, 2019
| | | | | | | | | | | | | | | | |
| | | | | | | | | Shares | | | Value | |
| Automobiles: 0.22% | | | | | | | | | | | | |
Ford Motor Company | | | | | | | | | | | 126,596 | | | $ | 1,159,619 | |
General Motors Company | | | | | | | | | | | 40,586 | | | | 1,521,163 | |
Harley-Davidson Incorporated | | | | | | | | | | | 5,062 | | | | 182,080 | |
| | | | |
| | | | | | | | | | | | | | | 2,862,862 | |
| | | | | | | | | | | | | | | | |
| | | | |
| Distributors: 0.06% | | | | | | | | | | | | |
Genuine Parts Company | | | | | | | | | | | 4,718 | | | | 469,866 | |
LKQ Corporation † | | | | | | | | | | | 9,956 | | | | 313,116 | |
| | | | |
| | | | | | | | | | | | | | | 782,982 | |
| | | | | | | | | | | | | | | | |
| | | | |
| Diversified Consumer Services: 0.01% | | | | | | | | | | | | |
H&R Block Incorporated | | | | | | | | | | | 6,483 | | | | 153,128 | |
| | | | | | | | | | | | | | | | |
| | | | |
| Hotels, Restaurants & Leisure: 1.15% | | | | | | | | | | | | |
Carnival Corporation | | | | | | | | | | | 12,934 | | | | 565,345 | |
Chipotle Mexican Grill Incorporated † | | | | | | | | | | | 823 | | | | 691,707 | |
Darden Restaurants Incorporated | | | | | | | | | | | 3,967 | | | | 468,979 | |
Hilton Worldwide Holdings Incorporated | | | | | | | | | | | 9,266 | | | | 862,757 | |
Marriott International Incorporated Class A | | | | | | | | | | | 8,830 | | | | 1,098,187 | |
McDonald’s Corporation | | | | | | | | | | | 24,532 | | | | 5,267,266 | |
MGM Resorts International | | | | | | | | | | | 16,844 | | | | 466,916 | |
Norwegian Cruise Line Holdings Limited † | | | | | | | | | | | 6,964 | | | | 360,526 | |
Royal Caribbean Cruises Limited | | | | | | | | | | | 5,550 | | | | 601,232 | |
Starbucks Corporation | | | | | | | | | | | 38,667 | | | | 3,418,936 | |
Wynn Resorts Limited | | | | | | | | | | | 3,128 | | | | 340,076 | |
Yum! Brands Incorporated | | | | | | | | | | | 9,830 | | | | 1,115,017 | |
| | | | |
| | | | | | | | | | | | | | | 15,256,944 | |
| | | | | | | | | | | | | | | | |
| | | | |
| Household Durables: 0.24% | | | | | | | | | | | | |
D.R. Horton Incorporated | | | | | | | | | | | 10,871 | | | | 573,010 | |
Garmin Limited | | | | | | | | | | | 4,666 | | | | 395,164 | |
Leggett & Platt Incorporated | | | | | | | | | | | 4,246 | | | | 173,831 | |
Lennar Corporation Class A | | | | | | | | | | | 9,186 | | | | 513,038 | |
Mohawk Industries Incorporated † | | | | | | | | | | | 1,934 | | | | 239,951 | |
Newell Rubbermaid Incorporated | | | | | | | | | | | 12,310 | | | | 230,443 | |
NVR Incorporated † | | | | | | | | | | | 110 | | | | 408,909 | |
Pulte Group Incorporated | | | | | | | | | | | 8,326 | | | | 304,315 | |
Whirlpool Corporation | | | | | | | | | | | 2,052 | | | | 324,955 | |
| | | | |
| | | | | | | | | | | | | | | 3,163,616 | |
| | | | | | | | | | | | | | | | |
| | | | |
| Internet & Direct Marketing Retail: 2.07% | | | | | | | | | | | | |
Amazon.com Incorporated † | | | | | | | | | | | 13,422 | | | | 23,299,384 | |
Booking Holdings Incorporated † | | | | | | | | | | | 1,373 | | | | 2,694,664 | |
eBay Incorporated | | | | | | | | | | | 25,469 | | | | 992,782 | |
Expedia Group Incorporated | | | | | | | | | | | 4,517 | | | | 607,130 | |
| | | | |
| | | | | | | | | | | | | | | 27,593,960 | |
| | | | | | | | | | | | | | | | |
| | | | |
| Leisure Products: 0.03% | | | | | | | | | | | | |
Hasbro Incorporated | | | | | | | | | | | 3,791 | | | | 449,954 | |
| | | | | | | | | | | | | | | | |
| | | | |
| Multiline Retail: 0.34% | | | | | | | | | | | | |
Dollar General Corporation | | | | | | | | | | | 8,303 | | | | 1,319,679 | |
Dollar Tree Incorporated † | | | | | | | | | | | 7,643 | | | | 872,525 | |
Kohl’s Corporation | | | | | | | | | | | 5,140 | | | | 255,252 | |
Macy’s Incorporated | | | | | | | | | | | 9,979 | | | | 155,074 | |
12 | Wells Fargo Index Asset Allocation Fund
Portfolio of investments—September 30, 2019
| | | | | | | | | | | | | | | | |
| | | | | | | | | Shares | | | Value | |
| | | | |
| Multiline Retail (continued) | | | | | | | | | | | | |
Nordstrom Incorporated « | | | | | | | | | | | 3,452 | | | $ | 116,229 | |
Target Corporation | | | | | | | | | | | 16,505 | | | | 1,764,550 | |
| | | | |
| | | | | | | | | | | | | | | 4,483,309 | |
| | | | | | | | | | | | | | | | |
| | | | |
| Specialty Retail: 1.43% | | | | | | | | | | | | |
Advance Auto Parts Incorporated | | | | | | | | | | | 2,305 | | | | 381,247 | |
AutoZone Incorporated † | | | | | | | | | | | 792 | | | | 859,019 | |
Best Buy Company Incorporated | | | | | | | | | | | 7,492 | | | | 516,873 | |
CarMax Incorporated † | | | | | | | | | | | 5,348 | | | | 470,624 | |
L Brands Incorporated | | | | | | | | | | | 7,499 | | | | 146,905 | |
Lowe’s Companies Incorporated | | | | | | | | | | | 24,931 | | | | 2,741,413 | |
O’Reilly Automotive Incorporated † | | | | | | | | | | | 2,471 | | | | 984,718 | |
Ross Stores Incorporated | | | | | | | | | | | 11,781 | | | | 1,294,143 | |
The Gap Incorporated | | | | | | | | | | | 6,919 | | | | 120,114 | |
The Home Depot Incorporated | | | | | | | | | | | 35,376 | | | | 8,207,940 | |
The TJX Companies Incorporated | | | | | | | | | | | 39,053 | | | | 2,176,814 | |
Tiffany & Company | | | | | | | | | | | 3,511 | | | | 325,224 | |
Tractor Supply Company | | | | | | | | | | | 3,852 | | | | 348,375 | |
ULTA Beauty Incorporated † | | | | | | | | | | | 1,900 | | | | 476,235 | |
| | | | |
| | | | | | | | | | | | | | | 19,049,644 | |
| | | | | | | | | | | | | | | | |
| | | | |
| Textiles, Apparel & Luxury Goods: 0.44% | | | | | | | | | | | | |
Capri Holdings Limited † | | | | | | | | | | | 4,896 | | | | 162,351 | |
HanesBrands Incorporated | | | | | | | | | | | 11,679 | | | | 178,922 | |
Nike Incorporated Class B | | | | | | | | | | | 40,439 | | | | 3,798,031 | |
PVH Corporation | | | | | | | | | | | 2,395 | | | | 211,311 | |
Ralph Lauren Corporation | | | | | | | | | | | 1,674 | | | | 159,817 | |
Tapestry Incorporated | | | | | | | | | | | 9,265 | | | | 241,353 | |
Under Armour Incorporated Class A † | | | | | | | | | | | 6,077 | | | | 121,175 | |
Under Armour Incorporated Class C † | | | | | | | | | | | 6,278 | | | | 113,820 | |
VF Corporation | | | | | | | | | | | 10,547 | | | | 938,578 | |
| | | | |
| | | | | | | | | | | | | | | 5,925,358 | |
| | | | | | | | | | | | | | | | |
| | | | |
Consumer Staples: 4.55% | | | | | | | | | | | | | | | | |
| | | | |
| Beverages: 1.16% | | | | | | | | | | | | |
Brown-Forman Corporation Class B | | | | | | | | | | | 5,879 | | | | 369,084 | |
Constellation Brands Incorporated Class A | | | | | | | | | | | 5,402 | | | | 1,119,727 | |
Molson Coors Brewing Company Class B | | | | | | | | | | | 6,067 | | | | 348,853 | |
Monster Beverage Corporation † | | | | | | | | | | | 12,497 | | | | 725,576 | |
PepsiCo Incorporated | | | | | | | | | | | 45,165 | | | | 6,192,122 | |
The Coca-Cola Company | | | | | | | | | | | 124,316 | | | | 6,767,763 | |
| | | | |
| | | | | | | | | | | | | | | 15,523,125 | |
| | | | | | | | | | | | | | | | |
| | | | |
| Food & Staples Retailing: 0.97% | | | | | | | | | | | | |
Costco Wholesale Corporation | | | | | | | | | | | 14,207 | | | | 4,093,179 | |
Sysco Corporation | | | | | | | | | | | 16,577 | | | | 1,316,214 | |
The Kroger Company | | | | | | | | | | | 25,803 | | | | 665,201 | |
Wal-Mart Stores Incorporated | | | | | | | | | | | 45,940 | | | | 5,452,159 | |
Walgreens Boots Alliance Incorporated | | | | | | | | | | | 24,506 | | | | 1,355,427 | |
| | | | |
| | | | | | | | | | | | | | | 12,882,180 | |
| | | | | | | | | | | | | | | | |
| | | | |
| Food Products: 0.72% | | | | | | | | | | | | |
Archer Daniels Midland Company | | | | | | | | | | | 17,992 | | | | 738,931 | |
Campbell Soup Company | | | | | | | | | | | 5,447 | | | | 255,573 | |
Wells Fargo Index Asset Allocation Fund | 13
Portfolio of investments—September 30, 2019
| | | | | | | | | | | | | | | | |
| | | | | | | | | Shares | | | Value | |
| | | | |
| Food Products (continued) | | | | | | | | | | | | |
ConAgra Foods Incorporated | | | | | | | | | | | 15,719 | | | $ | 482,259 | |
General Mills Incorporated | | | | | | | | | | | 19,494 | | | | 1,074,509 | |
Hormel Foods Corporation | | | | | | | | | | | 8,969 | | | | 392,214 | |
Kellogg Company | | | | | | | | | | | 8,032 | | | | 516,859 | |
Lamb Weston Holdings Incorporated | | | | | | | | | | | 4,705 | | | | 342,148 | |
McCormick & Company Incorporated | | | | | | | | | | | 3,974 | | | | 621,136 | |
Mondelez International Incorporated Class A | | | | | | | | | | | 46,586 | | | | 2,577,138 | |
The Hershey Company | | | | | | | | | | | 4,811 | | | | 745,657 | |
The J.M. Smucker Company | | | | | | | | | | | 3,683 | | | | 405,204 | |
The Kraft Heinz Company | | | | | | | | | | | 20,099 | | | | 561,466 | |
Tyson Foods Incorporated Class A | | | | | | | | | | | 9,518 | | | | 819,881 | |
| | | | |
| | | | | | | | | | | | | | | 9,532,975 | |
| | | | | | | | | | | | | | | | |
| | | | |
| Household Products: 1.12% | | | | | | | | | | | | |
Church & Dwight Company Incorporated | | | | | | | | | | | 7,981 | | | | 600,490 | |
Colgate-Palmolive Company | | | | | | | | | | | 27,716 | | | | 2,037,403 | |
Kimberly-Clark Corporation | | | | | | | | | | | 11,119 | | | | 1,579,454 | |
The Clorox Company | | | | | | | | | | | 4,061 | | | | 616,744 | |
The Procter & Gamble Company | | | | | | | | | | | 80,843 | | | | 10,055,252 | |
| | | | |
| | | | | | | | | | | | | | | 14,889,343 | |
| | | | | | | | | | | | | | | | |
| | | | |
| Personal Products: 0.11% | | | | | | | | | | | | |
Coty Incorporated Class A | | | | | | | | | | | 9,502 | | | | 99,866 | |
The Estee Lauder Companies Incorporated Class A | | | | | | | | | | | 7,145 | | | | 1,421,498 | |
| | | | |
| | | | | | | | | | | | | | | 1,521,364 | |
| | | | | | | | | | | | | | | | |
| | | | |
| Tobacco: 0.47% | | | | | | | | | | | | |
Altria Group Incorporated | | | | | | | | | | | 60,345 | | | | 2,468,111 | |
Philip Morris International Incorporated | | | | | | | | | | | 50,258 | | | | 3,816,090 | |
| | | | |
| | | | | | | | | | | | | | | 6,284,201 | |
| | | | | | | | | | | | | | | | |
| | | | |
Energy: 2.71% | | | | | | | | | | | | | | | | |
| | | | |
| Energy Equipment & Services: 0.24% | | | | | | | | | | | | |
Baker Hughes Incorporated | | | | | | | | | | | 16,680 | | | | 386,976 | |
Halliburton Company | | | | | | | | | | | 28,295 | | | | 533,361 | |
Helmerich & Payne Incorporated | | | | | | | | | | | 3,534 | | | | 141,607 | |
National Oilwell Varco Incorporated | | | | | | | | | | | 12,466 | | | | 264,279 | |
Schlumberger Limited | | | | | | | | | | | 44,675 | | | | 1,526,545 | |
TechnipFMC plc | | | | | | | | | | | 13,557 | | | | 327,266 | |
| | | | |
| | | | | | | | | | | | | | | 3,180,034 | |
| | | | | | | | | | | | | | | | |
| | | | |
| Oil, Gas & Consumable Fuels: 2.47% | | | | | | | | | | | | |
Apache Corporation | | | | | | | | | | | 12,145 | | | | 310,912 | |
Cabot Oil & Gas Corporation | | | | | | | | | | | 13,515 | | | | 237,459 | |
Chevron Corporation | | | | | | | | | | | 61,325 | | | | 7,273,145 | |
Cimarex Energy Company | | | | | | | | | | | 3,277 | | | | 157,099 | |
Concho Resources Incorporated | | | | | | | | | | | 6,495 | | | | 441,011 | |
ConocoPhillips | | | | | | | | | | | 35,860 | | | | 2,043,303 | |
Devon Energy Corporation | | | | | | | | | | | 13,057 | | | | 314,151 | |
Diamondback Energy Incorporated | | | | | | | | | | | 5,266 | | | | 473,466 | |
EOG Resources Incorporated | | | | | | | | | | | 18,747 | | | | 1,391,402 | |
Exxon Mobil Corporation | | | | | | | | | | | 136,679 | | | | 9,650,904 | |
Hess Corporation | | | | | | | | | | | 8,360 | | | | 505,613 | |
HollyFrontier Corporation | | | | | | | | | | | 4,890 | | | | 262,300 | |
14 | Wells Fargo Index Asset Allocation Fund
Portfolio of investments—September 30, 2019
| | | | | | | | | | | | | | | | |
| | | | | | | | | Shares | | | Value | |
| | | | |
| Oil, Gas & Consumable Fuels (continued) | | | | | | | | | | | | |
Kinder Morgan Incorporated | | | | | | | | | | | 62,890 | | | $ | 1,296,163 | |
Marathon Oil Corporation | | | | | | | | | | | 25,973 | | | | 318,689 | |
Marathon Petroleum Corporation | | | | | | | | | | | 21,266 | | | | 1,291,910 | |
Noble Energy Incorporated | | | | | | | | | | | 15,449 | | | | 346,985 | |
Occidental Petroleum Corporation | | | | | | | | | | | 28,894 | | | | 1,284,916 | |
ONEOK Incorporated | | | | | | | | | | | 13,340 | | | | 983,025 | |
Phillips 66 | | | | | | | | | | | 14,489 | | | | 1,483,674 | |
Pioneer Natural Resources Company | | | | | | | | | | | 5,399 | | | | 679,032 | |
The Williams Companies Incorporated | | | | | | | | | | | 39,152 | | | | 941,997 | |
Valero Energy Corporation | | | | | | | | | | | 13,387 | | | | 1,141,108 | |
| | | | |
| | | | | | | | | | | | | | | 32,828,264 | |
| | | | | | | | | | | | | | | | |
| | | | |
Financials: 7.76% | | | | | | | | | | | | | | | | |
| | | | |
| Banks: 3.27% | | | | | | | | | | | | |
Bank of America Corporation | | | | | | | | | | | 270,620 | | | | 7,893,985 | |
BB&T Corporation | | | | | | | | | | | 24,749 | | | | 1,320,854 | |
Citigroup Incorporated | | | | | | | | | | | 72,975 | | | | 5,041,113 | |
Citizens Financial Group Incorporated | | | | | | | | | | | 14,442 | | | | 510,814 | |
Comerica Incorporated | | | | | | | | | | | 4,824 | | | | 318,336 | |
Fifth Third Bancorp | | | | | | | | | | | 23,597 | | | | 646,086 | |
First Republic Bank | | | | | | | | | | | 5,433 | | | | 525,371 | |
Huntington Bancshares Incorporated | | | | | | | | | | | 33,525 | | | | 478,402 | |
JPMorgan Chase & Company | | | | | | | | | | | 103,289 | | | | 12,156,082 | |
KeyCorp | | | | | | | | | | | 32,408 | | | | 578,159 | |
M&T Bank Corporation | | | | | | | | | | | 4,317 | | | | 681,956 | |
People’s United Financial Incorporated | | | | | | | | | | | 12,881 | | | | 201,394 | |
PNC Financial Services Group Incorporated | | | | | | | | | | | 14,383 | | | | 2,015,921 | |
Regions Financial Corporation | | | | | | | | | | | 32,231 | | | | 509,894 | |
SunTrust Banks Incorporated | | | | | | | | | | | 14,341 | | | | 986,661 | |
SVB Financial Group † | | | | | | | | | | | 1,664 | | | | 347,693 | |
US Bancorp | | | | | | | | | | | 46,323 | | | | 2,563,515 | |
Wells Fargo & Company (l) | | | | | | | | | | | 129,521 | | | | 6,533,039 | |
Zions Bancorporation | | | | | | | | | | | 5,716 | | | | 254,476 | |
| | | | |
| | | | | | | | | | | | | | | 43,563,751 | |
| | | | | | | | | | | | | | | | |
| | | | |
| Capital Markets: 1.61% | | | | | | | | | | | | |
Affiliated Managers Group Incorporated | | | | | | | | | | | 1,635 | | | | 136,277 | |
Ameriprise Financial Incorporated | | | | | | | | | | | 4,227 | | | | 621,792 | |
Bank of New York Mellon Corporation | | | | | | | | | | | 27,710 | | | | 1,252,769 | |
BlackRock Incorporated | | | | | | | | | | | 3,794 | | | | 1,690,758 | |
CBOE Holdings Incorporated | | | | | | | | | | | 3,607 | | | | 414,480 | |
CME Group Incorporated | | | | | | | | | | | 11,568 | | | | 2,444,781 | |
E*TRADE Financial Corporation | | | | | | | | | | | 7,746 | | | | 338,423 | |
Franklin Resources Incorporated | | | | | | | | | | | 9,110 | | | | 262,915 | |
Intercontinental Exchange Incorporated | | | | | | | | | | | 18,103 | | | | 1,670,364 | |
Invesco Limited | | | | | | | | | | | 12,444 | | | | 210,801 | |
MarketAxess Holdings Incorporated | | | | | | | | | | | 1,219 | | | | 399,223 | |
Moody’s Corporation | | | | | | | | | | | 5,255 | | | | 1,076,382 | |
Morgan Stanley | | | | | | | | | | | 40,576 | | | | 1,731,378 | |
MSCI Incorporated | | | | | | | | | | | 2,735 | | | | 595,546 | |
Northern Trust Corporation | | | | | | | | | | | 6,941 | | | | 647,734 | |
Raymond James Financial Incorporated | | | | | | | | | | | 3,991 | | | | 329,098 | |
S&P Global Incorporated | | | | | | | | | | | 7,955 | | | | 1,948,816 | |
State Street Corporation | | | | | | | | | | | 12,036 | | | | 712,411 | |
T. Rowe Price Group Incorporated | | | | | | | | | | | 7,609 | | | | 869,328 | |
Wells Fargo Index Asset Allocation Fund | 15
Portfolio of investments—September 30, 2019
| | | | | | | | | | | | | | | | |
| | | | | | | | | Shares | | | Value | |
| | | | |
| Capital Markets (continued) | | | | | | | | | | | | |
The Charles Schwab Corporation | | | | | | | | | | | 37,581 | | | $ | 1,572,013 | |
The Goldman Sachs Group Incorporated | | | | | | | | | | | 10,454 | | | | 2,166,382 | |
The NASDAQ OMX Group Incorporated | | | | | | | | | | | 3,723 | | | | 369,880 | |
| | | | |
| | | | | | | | | | | | | | | 21,461,551 | |
| | | | | | | | | | | | | | | | |
| | | | |
| Consumer Finance: 0.42% | | | | | | | | | | | | |
American Express Company | | | | | | | | | | | 21,977 | | | | 2,599,440 | |
Capital One Financial Corporation | | | | | | | | | | | 15,193 | | | | 1,382,259 | |
Discover Financial Services | | | | | | | | | | | 10,280 | | | | 833,605 | |
Synchrony Financial | | | | | | | | | | | 19,717 | | | | 672,153 | |
| | | | |
| | | | | | | | | | | | | | | 5,487,457 | |
| | | | | | | | | | | | | | | | |
| | | | |
| Diversified Financial Services: 0.99% | | | | | | | | | | | | |
Berkshire Hathaway Incorporated Class B † | | | | | | | | | | | 63,342 | | | | 13,176,403 | |
| | | | | | | | | | | | | | | | |
| | | | |
| Insurance: 1.47% | | | | | | | | | | | | |
AFLAC Incorporated | | | | | | | | | | | 23,916 | | | | 1,251,285 | |
American International Group Incorporated | | | | | | | | | | | 28,100 | | | | 1,565,170 | |
Aon plc | | | | | | | | | | | 7,618 | | | | 1,474,616 | |
Arthur J. Gallagher & Company | | | | | | | | | | | 6,010 | | | | 538,316 | |
Assurant Incorporated | | | | | | | | | | | 1,974 | | | | 248,369 | |
Chubb Limited | | | | | | | | | | | 14,722 | | | | 2,376,720 | |
Cincinnati Financial Corporation | | | | | | | | | | | 4,906 | | | | 572,383 | |
Everest Reinsurance Group Limited | | | | | | | | | | | 1,315 | | | | 349,908 | |
Globe Life Incorporated | | | | | | | | | | | 3,242 | | | | 310,454 | |
Lincoln National Corporation | | | | | | | | | | | 6,466 | | | | 390,029 | |
Loews Corporation | | | | | | | | | | | 8,400 | | | | 432,432 | |
Marsh & McLennan Companies Incorporated | | | | | | | | | | | 16,355 | | | | 1,636,318 | |
MetLife Incorporated | | | | | | | | | | | 25,712 | | | | 1,212,578 | |
Principal Financial Group Incorporated | | | | | | | | | | | 8,375 | | | | 478,548 | |
Prudential Financial Incorporated | | | | | | | | | | | 12,986 | | | | 1,168,091 | |
The Allstate Corporation | | | | | | | | | | | 10,634 | | | | 1,155,703 | |
The Hartford Financial Services Group Incorporated | | | | | | | | | | | 11,680 | | | | 707,925 | |
The Progressive Corporation | | | | | | | | | | | 18,886 | | | | 1,458,944 | |
The Travelers Companies Incorporated | | | | | | | | | | | 8,410 | | | | 1,250,483 | |
Unum Group | | | | | | | | | | | 6,739 | | | | 200,283 | |
Willis Towers Watson plc | | | | | | | | | | | 4,166 | | | | 803,913 | |
| | | | |
| | | | | | | | | | | | | | | 19,582,468 | |
| | | | | | | | | | | | | | | | |
| | | | |
Health Care: 8.18% | | | | | | | | | | | | | | | | |
| | | | |
| Biotechnology: 1.27% | | | | | | | | | | | | |
AbbVie Incorporated | | | | | | | | | | | 47,760 | | | | 3,616,387 | |
Alexion Pharmaceuticals Incorporated † | | | | | | | | | | | 7,242 | | | | 709,281 | |
Amgen Incorporated | | | | | | | | | | | 19,372 | | | | 3,748,676 | |
Biogen Incorporated † | | | | | | | | | | | 5,958 | | | | 1,387,142 | |
Celgene Corporation † | | | | | | | | | | | 22,894 | | | | 2,273,374 | |
Gilead Sciences Incorporated | | | | | | | | | | | 40,911 | | | | 2,592,939 | |
Incyte Corporation † | | | | | | | | | | | 5,766 | | | | 428,010 | |
Regeneron Pharmaceuticals Incorporated † | | | | | | | | | | | 2,581 | | | | 715,969 | |
Vertex Pharmaceuticals Incorporated † | | | | | | | | | | | 8,302 | | | | 1,406,525 | |
| | | | |
| | | | | | | | | | | | | | | 16,878,303 | |
| | | | | | | | | | | | | | | | |
| | | | |
| Health Care Equipment & Supplies: 2.16% | | | | | | | | | | | | |
Abbott Laboratories | | | | | | | | | | | 57,092 | | | | 4,776,888 | |
ABIOMED Incorporated † | | | | | | | | | | | 1,465 | | | | 260,609 | |
16 | Wells Fargo Index Asset Allocation Fund
Portfolio of investments—September 30, 2019
| | | | | | | | | | | | | | | | |
| | | | | | | | | Shares | | | Value | |
| | | | |
| Health Care Equipment & Supplies (continued) | | | | | | | | | | | | |
Align Technology Incorporated † | | | | | | | | | | | 2,347 | | | $ | 424,619 | |
Baxter International Incorporated | | | | | | | | | | | 16,493 | | | | 1,442,643 | |
Becton Dickinson & Company | | | | | | | | | | | 8,720 | | | | 2,205,811 | |
Boston Scientific Corporation † | | | | | | | | | | | 44,997 | | | | 1,830,928 | |
Danaher Corporation | | | | | | | | | | | 20,624 | | | | 2,978,724 | |
Dentsply Sirona Incorporated | | | | | | | | | | | 7,241 | | | | 386,018 | |
Edwards Lifesciences Corporation † | | | | | | | | | | | 6,717 | | | | 1,477,135 | |
Hologic Incorporated † | | | | | | | | | | | 8,634 | | | | 435,931 | |
IDEXX Laboratories Incorporated † | | | | | | | | | | | 2,780 | | | | 755,965 | |
Intuitive Surgical Incorporated † | | | | | | | | | | | 3,722 | | | | 2,009,619 | |
Medtronic plc | | | | | | | | | | | 43,340 | | | | 4,707,591 | |
ResMed Incorporated | | | | | | | | | | | 4,640 | | | | 626,910 | |
Stryker Corporation | | | | | | | | | | | 10,365 | | | | 2,241,950 | |
Teleflex Incorporated | | | | | | | | | | | 1,493 | | | | 507,247 | |
The Cooper Companies Incorporated | | | | | | | | | | | 1,601 | | | | 475,497 | |
Varian Medical Systems Incorporated † | | | | | | | | | | | 2,941 | | | | 350,244 | |
Zimmer Biomet Holdings Incorporated | | | | | | | | | | | 6,632 | | | | 910,375 | |
| | | | |
| | | | | | | | | | | | | | | 28,804,704 | |
| | | | | | | | | | | | | | | | |
| | | | |
| Health Care Providers & Services: 1.49% | | | | | | | | | | | | |
AmerisourceBergen Corporation | | | | | | | | | | | 4,912 | | | | 404,405 | |
Anthem Incorporated | | | | | | | | | | | 8,263 | | | | 1,983,946 | |
Cardinal Health Incorporated | | | | | | | | | | | 9,631 | | | | 454,487 | |
Centene Corporation † | | | | | | | | | | | 13,361 | | | | 577,997 | |
Cigna Corporation | | | | | | | | | | | 12,198 | | | | 1,851,534 | |
CVS Health Corporation | | | | | | | | | | | 42,010 | | | | 2,649,571 | |
DaVita HealthCare Partners Incorporated † | | | | | | | | | | | 3,127 | | | | 178,458 | |
HCA Holdings Incorporated | | | | | | | | | | | 8,591 | | | | 1,034,528 | |
Henry Schein Incorporated | | | | | | | | | | | 4,789 | | | | 304,102 | |
Humana Incorporated | | | | | | | | | | | 4,363 | | | | 1,115,488 | |
Laboratory Corporation of America Holdings † | | | | | | | | | | | 3,155 | | | | 530,040 | |
McKesson Corporation | | | | | | | | | | | 5,972 | | | | 816,134 | |
Quest Diagnostics Incorporated | | | | | | | | | | | 4,350 | | | | 465,581 | |
UnitedHealth Group Incorporated | | | | | | | | | | | 30,613 | | | | 6,652,817 | |
Universal Health Services Incorporated Class B | | | | | | | | | | | 2,623 | | | | 390,171 | |
WellCare Health Plans Incorporated † | | | | | | | | | | | 1,625 | | | | 421,151 | |
| | | | |
| | | | | | | | | | | | | | | 19,830,410 | |
| | | | | | | | | | | | | | | | |
| | | | |
| Health Care Technology: 0.05% | | | | | | | | | | | | |
Cerner Corporation | | | | | | | | | | | 10,285 | | | | 701,128 | |
| | | | | | | | | | | | | | | | |
| | | | |
| Life Sciences Tools & Services: 0.62% | | | | | | | | | | | | |
Agilent Technologies Incorporated | | | | | | | | | | | 9,997 | | | | 766,070 | |
Illumina Incorporated † | | | | | | | | | | | 4,748 | | | | 1,444,437 | |
IQVIA Holdings Incorporated † | | | | | | | | | | | 5,884 | | | | 878,952 | |
Mettler-Toledo International Incorporated † | | | | | | | | | | | 794 | | | | 559,294 | |
PerkinElmer Incorporated | | | | | | | | | | | 3,587 | | | | 305,505 | |
Thermo Fisher Scientific Incorporated | | | | | | | | | | | 12,937 | | | | 3,768,160 | |
Waters Corporation † | | | | | | | | | | | 2,156 | | | | 481,284 | |
| | | | |
| | | | | | | | | | | | | | | 8,203,702 | |
| | | | | | | | | | | | | | | | |
| | | | |
| Pharmaceuticals: 2.59% | | | | | | | | | | | | |
Allergan plc | | | | | | | | | | | 10,597 | | | | 1,783,369 | |
Bristol-Myers Squibb Company | | | | | | | | | | | 52,840 | | | | 2,679,516 | |
Eli Lilly & Company | | | | | | | | | | | 27,444 | | | | 3,069,063 | |
Johnson & Johnson | | | | | | | | | | | 85,254 | | | | 11,030,163 | |
Wells Fargo Index Asset Allocation Fund | 17
Portfolio of investments—September 30, 2019
| | | | | | | | | | | | | | | | |
| | | | | | | | | Shares | | | Value | |
| | | | |
| Pharmaceuticals (continued) | | | | | | | | | | | | |
Merck & Company Incorporated | | | | | | | | | | | 82,708 | | | $ | 6,962,359 | |
Mylan NV † | | | | | | | | | | | 16,664 | | | | 329,614 | |
Nektar Therapeutics † | | | | | | | | | | | 5,661 | | | | 103,115 | |
Perrigo Company plc | | | | | | | | | | | 4,394 | | | | 245,581 | |
Pfizer Incorporated | | | | | | | | | | | 178,671 | | | | 6,419,649 | |
Zoetis Incorporated | | | | | | | | | | | 15,427 | | | | 1,922,050 | |
| | | | |
| | | | | | | | | | | | | | | 34,544,479 | |
| | | | | | | | | | | | | | | | |
| | | | |
Industrials: 5.60% | | | | | | | | | | | | | | | | |
| | | | |
| Aerospace & Defense: 1.63% | | | | | | | | | | | | |
Arconic Incorporated | | | | | | | | | | | 12,513 | | | | 325,338 | |
General Dynamics Corporation | | | | | | | | | | | 7,557 | | | | 1,380,891 | |
Huntington Ingalls Industries Incorporated | | | | | | | | | | | 1,335 | | | | 282,740 | |
L3Harris Technologies Incorporated | | | | | | | | | | | 7,212 | | | | 1,504,712 | |
Lockheed Martin Corporation | | | | | | | | | | | 8,027 | | | | 3,131,012 | |
Northrop Grumman Corporation | | | | | | | | | | | 5,082 | | | | 1,904,683 | |
Raytheon Company | | | | | | | | | | | 8,995 | | | | 1,764,729 | |
Textron Incorporated | | | | | | | | | | | 7,433 | | | | 363,920 | |
The Boeing Company | | | | | | | | | | | 17,268 | | | | 6,569,956 | |
TransDigm Group Incorporated | | | | | | | | | | | 1,603 | | | | 834,634 | |
United Technologies Corporation | | | | | | | | | | | 26,202 | | | | 3,577,097 | |
| | | | |
| | | | | | | | | | | | | | | 21,639,712 | |
| | | | | | | | | | | | | | | | |
| | | | |
| Air Freight & Logistics: 0.35% | | | | | | | | | | | | |
C.H. Robinson Worldwide Incorporated | | | | | | | | | | | 4,372 | | | | 370,658 | |
Expeditors International of Washington Incorporated | | | | | | | | | | | 5,514 | | | | 409,635 | |
FedEx Corporation | | | | | | | | | | | 7,752 | | | | 1,128,459 | |
United Parcel Service Incorporated Class B | | | | | | | | | | | 22,558 | | | | 2,702,900 | |
| | | | |
| | | | | | | | | | | | | | | 4,611,652 | |
| | | | | | | | | | | | | | | | |
| | | | |
| Airlines: 0.24% | | | | | | | | | | | | |
Alaska Air Group Incorporated | | | | | | | | | | | 3,981 | | | | 258,407 | |
American Airlines Group Incorporated | | | | | | | | | | | 12,802 | | | | 345,270 | |
Delta Air Lines Incorporated | | | | | | | | | | | 18,693 | | | | 1,076,717 | |
Southwest Airlines Company | | | | | | | | | | | 15,627 | | | | 844,014 | |
United Continental Holdings Incorporated † | | | | | | | | | | | 7,137 | | | | 630,982 | |
| | | | |
| | | | | | | | | | | | | | | 3,155,390 | |
| | | | | | | | | | | | | | | | |
| | | | |
| Building Products: 0.17% | | | | | | | | | | | | |
A.O. Smith Corporation | | | | | | | | | | | 4,468 | | | | 213,168 | |
Allegion plc | | | | | | | | | | | 3,016 | | | | 312,608 | |
Fortune Brands Home & Security Incorporated | | | | | | | | | | | 4,518 | | | | 247,135 | |
Johnson Controls International plc | | | | | | | | | | | 25,703 | | | | 1,128,105 | |
Masco Corporation | | | | | | | | | | | 9,350 | | | | 389,708 | |
| | | | |
| | | | | | | | | | | | | | | 2,290,724 | |
| | | | | | | | | | | | | | | | |
| | | | |
| Commercial Services & Supplies: 0.26% | | | | | | | | | | | | |
Cintas Corporation | | | | | | | | | | | 2,681 | | | | 718,776 | |
Copart Incorporated † | | | | | | | | | | | 6,512 | | | | 523,109 | |
Republic Services Incorporated | | | | | | | | | | | 6,838 | | | | 591,829 | |
Rollins Incorporated | | | | | | | | | | | 4,548 | | | | 154,950 | |
Waste Management Incorporated | | | | | | | | | | | 12,608 | | | | 1,449,920 | |
| | | | |
| | | | | | | | | | | | | | | 3,438,584 | |
| | | | | | | | | | | | | | | | |
18 | Wells Fargo Index Asset Allocation Fund
Portfolio of investments—September 30, 2019
| | | | | | | | | | | | | | | | |
| | | | | | | | | Shares | | | Value | |
| | | | |
| Construction & Engineering: 0.04% | | | | | | | | | | | | |
Jacobs Engineering Group Incorporated | | | | | | | | | | | 4,376 | | | $ | 400,404 | |
Quanta Services Incorporated | | | | | | | | | | | 4,592 | | | | 173,578 | |
| | | | |
| | | | | | | | | | | | | | | 573,982 | |
| | | | | | | | | | | | | | | | |
| | | | |
| Electrical Equipment: 0.28% | | | | | | | | | | | | |
AMETEK Incorporated | | | | | | | | | | | 7,376 | | | | 677,264 | |
Eaton Corporation plc | | | | | | | | | | | 13,567 | | | | 1,128,096 | |
Emerson Electric Company | | | | | | | | | | | 19,870 | | | | 1,328,508 | |
Rockwell Automation Incorporated | | | | | | | | | | | 3,779 | | | | 622,779 | |
| | | | |
| | | | | | | | | | | | | | | 3,756,647 | |
| | | | | | | | | | | | | | | | |
| | | | |
| Industrial Conglomerates: 0.80% | | | | | | | | | | | | |
3M Company | | | | | | | | | | | 18,583 | | | | 3,055,045 | |
General Electric Company | | | | | | | | | | | 281,914 | | | | 2,520,311 | |
Honeywell International Incorporated | | | | | | | | | | | 23,242 | | | | 3,932,546 | |
Roper Technologies Incorporated | | | | | | | | | | | 3,359 | | | | 1,197,819 | |
| | | | |
| | | | | | | | | | | | | | | 10,705,721 | |
| | | | | | | | | | | | | | | | |
| | | | |
| Machinery: 0.95% | | | | | | | | | | | | |
Caterpillar Incorporated | | | | | | | | | | | 18,173 | | | | 2,295,432 | |
Cummins Incorporated | | | | | | | | | | | 5,096 | | | | 828,966 | |
Deere & Company | | | | | | | | | | | 10,172 | | | | 1,715,813 | |
Dover Corporation | | | | | | | | | | | 4,697 | | | | 467,633 | |
Flowserve Corporation | | | | | | | | | | | 4,237 | | | | 197,910 | |
Fortive Corporation | | | | | | | | | | | 9,537 | | | | 653,857 | |
IDEX Corporation | | | | | | | | | | | 2,450 | | | | 401,506 | |
Illinois Tool Works Incorporated | | | | | | | | | | | 9,508 | | | | 1,487,907 | |
Ingersoll-Rand plc | | | | | | | | | | | 7,803 | | | | 961,408 | |
PACCAR Incorporated | | | | | | | | | | | 11,189 | | | | 783,342 | |
Parker-Hannifin Corporation | | | | | | | | | | | 4,148 | | | | 749,170 | |
Pentair plc | | | | | | | | | | | 5,428 | | | | 205,178 | |
Snap-on Incorporated | | | | | | | | | | | 1,783 | | | | 279,111 | |
Stanley Black & Decker Incorporated | | | | | | | | | | | 4,901 | | | | 707,753 | |
Wabtec Corporation | | | | | | | | | | | 5,882 | | | | 422,681 | |
Xylem Incorporated | | | | | | | | | | | 5,815 | | | | 462,990 | |
| | | | |
| | | | | | | | | | | | | | | 12,620,657 | |
| | | | | | | | | | | | | | | | |
| | | | |
| Professional Services: 0.20% | | | | | | | | | | | | |
Equifax Incorporated | | | | | | | | | | | 3,904 | | | | 549,176 | |
IHS Markit Limited † | | | | | | | | | | | 12,957 | | | | 866,564 | |
Nielsen Holdings plc | | | | | | | | | | | 11,489 | | | | 244,141 | |
Robert Half International Incorporated | | | | | | | | | | | 3,797 | | | | 211,341 | |
Verisk Analytics Incorporated | | | | | | | | | | | 5,281 | | | | 835,137 | |
| | | | |
| | | | | | | | | | | | | | | 2,706,359 | |
| | | | | | | | | | | | | | | | |
| | | | |
| Road & Rail: 0.58% | | | | | | | | | | | | |
CSX Corporation | | | | | | | | | | | 25,783 | | | | 1,785,988 | |
J.B. Hunt Transport Services Incorporated | | | | | | | | | | | 2,759 | | | | 305,283 | |
Kansas City Southern | | | | | | | | | | | 3,249 | | | | 432,149 | |
Norfolk Southern Corporation | | | | | | | | | | | 8,508 | | | | 1,528,547 | |
Union Pacific Corporation | | | | | | | | | | | 22,758 | | | | 3,686,341 | |
| | | | |
| | | | | | | | | | | | | | | 7,738,308 | |
| | | | | | | | | | | | | | | | |
Wells Fargo Index Asset Allocation Fund | 19
Portfolio of investments—September 30, 2019
| | | | | | | | | | | | | | | | |
| | | | | | | | | Shares | | | Value | |
| Trading Companies & Distributors: 0.10% | | | | | | | | | | | | |
Fastenal Company | | | | | | | | | | | 18,523 | | | $ | 605,146 | |
United Rentals Incorporated † | | | | | | | | | | | 2,492 | | | | 310,603 | |
W.W. Grainger Incorporated | | | | | | | | | | | 1,427 | | | | 424,033 | |
| | | | |
| | | | | | | | | | | | | | | 1,339,782 | |
| | | | | | | | | | | | | | | | |
| | | | |
Information Technology: 13.15% | | | | | | | | | | | | | | | | |
| | | | |
| Communications Equipment: 0.65% | | | | | | | | | | | | |
Arista Networks Incorporated † | | | | | | | | | | | 1,757 | | | | 419,782 | |
Cisco Systems Incorporated | | | | | | | | | | | 137,137 | | | | 6,775,939 | |
F5 Networks Incorporated † | | | | | | | | | | | 1,942 | | | | 272,696 | |
Juniper Networks Incorporated | | | | | | | | | | | 11,171 | | | | 276,482 | |
Motorola Solutions Incorporated | | | | | | | | | | | 5,347 | | | | 911,182 | |
| | | | |
| | | | | | | | | | | | | | | 8,656,081 | |
| | | | | | | | | | | | | | | | |
| | | | |
| Electronic Equipment, Instruments & Components: 0.32% | | | | | | | | | | | | |
Amphenol Corporation Class A | | | | | | | | | | | 9,608 | | | | 927,172 | |
CDW Corporation of Delaware | | | | | | | | | | | 4,674 | | | | 576,024 | |
Corning Incorporated | | | | | | | | | | | 25,224 | | | | 719,388 | |
FLIR Systems Incorporated | | | | | | | | | | | 4,380 | | | | 230,344 | |
IPG Photonics Corporation † | | | | | | | | | | | 1,151 | | | | 156,076 | |
Keysight Technologies Incorporated † | | | | | | | | | | | 6,059 | | | | 589,238 | |
TE Connectivity Limited | | | | | | | | | | | 10,852 | | | | 1,011,189 | |
| | | | |
| | | | | | | | | | | | | | | 4,209,431 | |
| | | | | | | | | | | | | | | | |
| | | | |
| IT Services: 3.31% | | | | | | | | | | | | |
Accenture plc Class A | | | | | | | | | | | 20,581 | | | | 3,958,755 | |
Akamai Technologies Incorporated † | | | | | | | | | | | 5,329 | | | | 486,964 | |
Alliance Data Systems Corporation | | | | | | | | | | | 1,323 | | | | 169,516 | |
Automatic Data Processing Incorporated | | | | | | | | | | | 14,018 | | | | 2,262,786 | |
Broadridge Financial Solutions Incorporated | | | | | | | | | | | 3,691 | | | | 459,271 | |
Cognizant Technology Solutions Corporation Class A | | | | | | | | | | | 17,841 | | | | 1,075,188 | |
DXC Technology Company | | | | | | | | | | | 8,461 | | | | 249,600 | |
Fidelity National Information Services Incorporated | | | | | | | | | | | 19,816 | | | | 2,630,772 | |
Fiserv Incorporated † | | | | | | | | | | | 18,439 | | | | 1,910,096 | |
FleetCor Technologies Incorporated † | | | | | | | | | | | 2,796 | | | | 801,837 | |
Gartner Incorporated † | | | | | | | | | | | 2,911 | | | | 416,244 | |
Global Payments Incorporated | | | | | | | | | | | 9,692 | | | | 1,541,028 | |
International Business Machines Corporation | | | | | | | | | | | 28,616 | | | | 4,161,339 | |
Jack Henry & Associates Incorporated | | | | | | | | | | | 2,487 | | | | 363,027 | |
Leidos Holdings Incorporated | | | | | | | | | | | 4,366 | | | | 374,952 | |
MasterCard Incorporated Class A | | | | | | | | | | | 28,839 | | | | 7,831,807 | |
Paychex Incorporated | | | | | | | | | | | 10,331 | | | | 855,097 | |
PayPal Holdings Incorporated † | | | | | | | | | | | 38,011 | | | | 3,937,559 | |
The Western Union Company | | | | | | | | | | | 13,693 | | | | 317,267 | |
VeriSign Incorporated † | | | | | | | | | | | 3,364 | | | | 634,551 | |
Visa Incorporated Class A | | | | | | | | | | | 55,786 | | | | 9,595,750 | |
| | | | |
| | | | | | | | | | | | | | | 44,033,406 | |
| | | | | | | | | | | | | | | | |
| | | | |
| Semiconductors & Semiconductor Equipment: 2.35% | | | | | | | | | | | | |
Advanced Micro Devices Incorporated † | | | | | | | | | | | 35,066 | | | | 1,016,563 | |
Analog Devices Incorporated | | | | | | | | | | | 11,933 | | | | 1,333,274 | |
Applied Materials Incorporated | | | | | | | | | | | 29,840 | | | | 1,489,016 | |
Broadcom Incorporated | | | | | | | | | | | 12,859 | | | | 3,549,984 | |
Intel Corporation | | | | | | | | | | | 143,104 | | | | 7,374,149 | |
20 | Wells Fargo Index Asset Allocation Fund
Portfolio of investments—September 30, 2019
| | | | | | | | | | | | | | | | |
| | | | | | | | | Shares | | | Value | |
| | | | |
| Semiconductors & Semiconductor Equipment (continued) | | | | | | | | | | | | |
KLA-Tencor Corporation | | | | | | | | | | | 5,144 | | | $ | 820,211 | |
Lam Research Corporation | | | | | | | | | | | 4,668 | | | | 1,078,821 | |
Maxim Integrated Products Incorporated | | | | | | | | | | | 8,762 | | | | 507,407 | |
Microchip Technology Incorporated | | | | | | | | | | | 7,689 | | | | 714,385 | |
Micron Technology Incorporated † | | | | | | | | | | | 35,656 | | | | 1,527,860 | |
NVIDIA Corporation | | | | | | | | | | | 19,672 | | | | 3,424,305 | |
Qorvo Incorporated † | | | | | | | | | | | 3,804 | | | | 282,029 | |
QUALCOMM Incorporated | | | | | | | | | | | 39,270 | | | | 2,995,516 | |
Skyworks Solutions Incorporated | | | | | | | | | | | 5,546 | | | | 439,521 | |
Texas Instruments Incorporated | | | | | | | | | | | 30,158 | | | | 3,897,620 | |
Xilinx Incorporated | | | | | | | | | | | 8,159 | | | | 782,448 | |
| | | | |
| | | | | | | | | | | | | | | 31,233,109 | |
| | | | | | | | | | | | | | | | |
| | | | |
| Software: 3.98% | | | | | | | | | | | | |
Adobe Systems Incorporated † | | | | | | | | | | | 15,681 | | | | 4,331,876 | |
Ansys Incorporated † | | | | | | | | | | | 2,716 | | | | 601,214 | |
Autodesk Incorporated † | | | | | | | | | | | 7,093 | | | | 1,047,636 | |
Cadence Design Systems Incorporated † | | | | | | | | | | | 9,049 | | | | 597,958 | |
Citrix Systems Incorporated | | | | | | | | | | | 3,974 | | | | 383,570 | |
Fortinet Incorporated † | | | | | | | | | | | 4,584 | | | | 351,868 | |
Intuit Incorporated | | | | | | | | | | | 8,400 | | | | 2,233,896 | |
Microsoft Corporation | | | | | | | | | | | 246,649 | | | | 34,291,601 | |
Oracle Corporation | | | | | | | | | | | 71,120 | | | | 3,913,734 | |
Salesforce.com Incorporated † | | | | | | | | | | | 28,329 | | | | 4,205,157 | |
Symantec Corporation | | | | | | | | | | | 18,367 | | | | 434,012 | |
Synopsys Incorporated † | | | | | | | | | | | 4,854 | | | | 666,212 | |
| | | | |
| | | | | | | | | | | | | | | 53,058,734 | |
| | | | | | | | | | | | | | | | |
| | | | |
| Technology Hardware, Storage & Peripherals: 2.54% | | | | | | | | | | | | |
Apple Incorporated | | | | | | | | | | | 137,225 | | | | 30,734,283 | |
Hewlett Packard Enterprise Company | | | | | | | | | | | 42,175 | | | | 639,795 | |
HP Incorporated | | | | | | | | | | | 47,870 | | | | 905,700 | |
NetApp Incorporated | | | | | | | | | | | 7,685 | | | | 403,539 | |
Seagate Technology plc | | | | | | | | | | | 7,647 | | | | 411,332 | |
Western Digital Corporation | | | | | | | | | | | 9,562 | | | | 570,278 | |
Xerox Holdings Corporation | | | | | | | | | | | 6,147 | | | | 183,857 | |
| | | | |
| | | | | | | | | | | | | | | 33,848,784 | |
| | | | | | | | | | | | | | | | |
| | | | |
Materials: 1.64% | | | | | | | | | | | | | | | | |
| | | | |
| Chemicals: 1.18% | | | | | | | | | | | | |
Air Products & Chemicals Incorporated | | | | | | | | | | | 7,117 | | | | 1,578,978 | |
Albemarle Corporation « | | | | | | | | | | | 3,423 | | | | 237,967 | |
Celanese Corporation Series A | | | | | | | | | | | 3,997 | | | | 488,793 | |
CF Industries Holdings Incorporated | | | | | | | | | | | 7,052 | | | | 346,958 | |
Corteva Incorporated | | | | | | | | | | | 24,191 | | | | 677,348 | |
Dow Incorporated | | | | | | | | | | | 24,008 | | | | 1,143,981 | |
Dupont de Nemours Incorporated | | | | | | | | | | | 24,081 | | | | 1,717,216 | |
Eastman Chemical Company | | | | | | | | | | | 4,425 | | | | 326,698 | |
Ecolab Incorporated | | | | | | | | | | | 8,086 | | | | 1,601,351 | |
FMC Corporation | | | | | | | | | | | 4,213 | | | | 369,396 | |
International Flavors & Fragrances Incorporated « | | | | | | | | | | | 3,449 | | | | 423,158 | |
Linde plc | | | | | | | | | | | 17,463 | | | | 3,382,932 | |
LyondellBasell Industries NV Class A | | | | | | | | | | | 8,338 | | | | 746,001 | |
PPG Industries Incorporated | | | | | | | | | | | 7,632 | | | | 904,468 | |
Wells Fargo Index Asset Allocation Fund | 21
Portfolio of investments—September 30, 2019
| | | | | | | | | | | | | | | | |
| | | | | | | | | Shares | | | Value | |
| | | | |
| Chemicals (continued) | | | | | | | | | | | | |
The Mosaic Company | | | | | | | | | | | 11,468 | | | $ | 235,094 | |
The Sherwin-Williams Company | | | | | | | | | | | 2,652 | | | | 1,458,255 | |
| | | | |
| | | | | | | | | | | | | | | 15,638,594 | |
| | | | | | | | | | | | | | | | |
| | | | |
| Construction Materials: 0.09% | | | | | | | | | | | | |
Martin Marietta Materials Incorporated | | | | | | | | | | | 2,016 | | | | 552,586 | |
Vulcan Materials Company | | | | | | | | | | | 4,273 | | | | 646,249 | |
| | | | |
| | | | | | | | | | | | | | | 1,198,835 | |
| | | | | | | | | | | | | | | | |
| | | | |
| Containers & Packaging: 0.22% | | | | | | | | | | | | |
Amcor plc | | | | | | | | | | | 52,477 | | | | 511,651 | |
Avery Dennison Corporation | | | | | | | | | | | 2,719 | | | | 308,797 | |
Ball Corporation | | | | | | | | | | | 10,725 | | | | 780,887 | |
International Paper Company | | | | | | | | | | | 12,690 | | | | 530,696 | |
Packaging Corporation of America | | | | | | | | | | | 3,057 | | | | 324,348 | |
Sealed Air Corporation | | | | | | | | | | | 4,991 | | | | 207,176 | |
WestRock Company | | | | | | | | | | | 8,312 | | | | 302,972 | |
| | | | |
| | | | | | | | | | | | | | | 2,966,527 | |
| | | | | | | | | | | | | | | | |
| | | | |
| Metals & Mining: 0.15% | | | | | | | | | | | | |
Freeport-McMoRan Incorporated | | | | | | | | | | | 46,868 | | | | 448,527 | |
Newmont Goldcorp Corporation | | | | | | | | | | | 26,485 | | | | 1,004,311 | |
Nucor Corporation | | | | | | | | | | | 9,793 | | | | 498,562 | |
| | | | |
| | | | | | | | | | | | | | | 1,951,400 | |
| | | | | | | | | | | | | | | | |
| | | | |
Real Estate: 1.93% | | | | | | | | | | | | | | | | |
| | | | |
| Equity REITs: 1.89% | | | | | | | | | | | | |
Alexandria Real Estate Equities Incorporated | | | | | | | | | | | 3,663 | | | | 564,249 | |
American Tower Corporation | | | | | | | | | | | 14,300 | | | | 3,162,159 | |
Apartment Investment & Management Company Class A | | | | | | | | | | | 4,809 | | | | 250,741 | |
AvalonBay Communities Incorporated | | | | | | | | | | | 4,511 | | | | 971,354 | |
Boston Properties Incorporated | | | | | | | | | | | 4,643 | | | | 602,011 | |
Crown Castle International Corporation | | | | | | | | | | | 13,430 | | | | 1,866,904 | |
Digital Realty Trust Incorporated | | | | | | | | | | | 6,729 | | | | 873,491 | |
Duke Realty Corporation | | | | | | | | | | | 11,676 | | | | 396,634 | |
Equinix Incorporated | | | | | | | | | | | 2,739 | | | | 1,579,855 | |
Equity Residential | | | | | | | | | | | 11,261 | | | | 971,374 | |
Essex Property Trust Incorporated | | | | | | | | | | | 2,123 | | | | 693,478 | |
Extra Space Storage Incorporated | | | | | | | | | | | 4,151 | | | | 484,920 | |
Federal Realty Investment Trust | | | | | | | | | | | 2,251 | | | | 306,451 | |
HCP Incorporated | | | | | | | | | | | 15,864 | | | | 565,234 | |
Host Hotels & Resorts Incorporated | | | | | | | | | | | 23,578 | | | | 407,664 | |
Iron Mountain Incorporated | | | | | | | | | | | 9,274 | | | | 300,385 | |
Kimco Realty Corporation | | | | | | | | | | | 13,635 | | | | 284,699 | |
Mid-America Apartment Communities Incorporated | | | | | | | | | | | 3,683 | | | | 478,827 | |
Prologis Incorporated | | | | | | | | | | | 20,387 | | | | 1,737,380 | |
Public Storage Incorporated | | | | | | | | | | | 4,850 | | | | 1,189,560 | |
Realty Income Corporation | | | | | | | | | | | 10,280 | | | | 788,270 | |
Regency Centers Corporation | | | | | | | | | | | 5,412 | | | | 376,080 | |
SBA Communications Corporation | | | | | | | | | | | 3,653 | | | | 880,921 | |
Simon Property Group Incorporated | | | | | | | | | | | 9,950 | | | | 1,548,718 | |
SL Green Realty Corporation | | | | | | | | | | | 2,662 | | | | 217,619 | |
The Macerich Company « | | | | | | | | | | | 3,559 | | | | 112,429 | |
UDR Incorporated | | | | | | | | | | | 9,459 | | | | 458,572 | |
22 | Wells Fargo Index Asset Allocation Fund
Portfolio of investments—September 30, 2019
| | | | | | | | | | | | | | | | |
| | | | | | | | | Shares | | | Value | |
| | | | |
| Equity REITs (continued) | | | | | | | | | | | | |
Ventas Incorporated | | | | | | | | | | | 12,036 | | | $ | 878,989 | |
Vornado Realty Trust | | | | | | | | | | | 5,115 | | | | 325,672 | |
Welltower Incorporated | | | | | | | | | | | 13,091 | | | | 1,186,699 | |
Weyerhaeuser Company | | | | | | | | | | | 24,063 | | | | 666,545 | |
| | | | |
| | | | | | | | | | | | | | | 25,127,884 | |
| | | | | | | | | | | | | | | | |
| | | | |
| Real Estate Management & Development: 0.04% | | | | | | | | | | | | |
CBRE Group Incorporated Class A † | | | | | | | | | | | 10,865 | | | | 575,954 | |
| | | | | | | | | | | | | | | | |
| | | | |
Utilities: 2.15% | | | | | | | | | | | | | | | | |
| | | | |
| Electric Utilities: 1.31% | | | | | | | | | | | | |
Alliant Energy Corporation | | | | | | | | | | | 7,672 | | | | 413,751 | |
American Electric Power Company Incorporated | | | | | | | | | | | 15,951 | | | | 1,494,449 | |
Duke Energy Corporation | | | | | | | | | | | 23,536 | | | | 2,256,161 | |
Edison International | | | | | | | | | | | 11,568 | | | | 872,459 | |
Entergy Corporation | | | | | | | | | | | 6,422 | | | | 753,686 | |
Evergy Incorporated | | | | | | | | | | | 7,606 | | | | 506,255 | |
Eversource Energy | | | | | | | | | | | 10,454 | | | | 893,503 | |
Exelon Corporation | | | | | | | | | | | 31,385 | | | | 1,516,209 | |
FirstEnergy Corporation | | | | | | | | | | | 17,443 | | | | 841,276 | |
NextEra Energy Incorporated | | | | | | | | | | | 15,788 | | | | 3,678,446 | |
Pinnacle West Capital Corporation | | | | | | | | | | | 3,627 | | | | 352,073 | |
PPL Corporation | | | | | | | | | | | 23,331 | | | | 734,693 | |
The Southern Company | | | | | | | | | | | 33,764 | | | | 2,085,602 | |
Xcel Energy Incorporated | | | | | | | | | | | 16,939 | | | | 1,099,172 | |
| | | | |
| | | | | | | | | | | | | | | 17,497,735 | |
| | | | | | | | | | | | | | | | |
| | | | |
| Gas Utilities: 0.03% | | | | | | | | | | | | |
Atmos Energy Corporation | | | | | | | | | | | 3,818 | | | | 434,832 | |
| | | | | | | | | | | | | | | | |
| | | | |
| Independent Power & Renewable Electricity Producers: 0.05% | | | | | | | | | | | | |
AES Corporation | | | | | | | | | | | 21,444 | | | | 350,395 | |
NRG Energy Incorporated | | | | | | | | | | | 8,172 | | | | 323,611 | |
| | | | |
| | | | | | | | | | | | | | | 674,006 | |
| | | | | | | | | | | | | | | | |
| | | | |
| Multi-Utilities: 0.70% | | | | | | | | | | | | |
Ameren Corporation | | | | | | | | | | | 7,939 | | | | 635,517 | |
CenterPoint Energy Incorporated | | | | | | | | | | | 16,223 | | | | 489,610 | |
CMS Energy Corporation | | | | | | | | | | | 9,166 | | | | 586,166 | |
Consolidated Edison Incorporated | | | | | | | | | | | 10,729 | | | | 1,013,569 | |
Dominion Energy Incorporated | | | | | | | | | | | 26,550 | | | | 2,151,612 | |
DTE Energy Company | | | | | | | | | | | 5,921 | | | | 787,256 | |
NiSource Incorporated | | | | | | | | | | | 12,060 | | | | 360,835 | |
Public Service Enterprise Group Incorporated | | | | | | | | | | | 16,334 | | | | 1,014,015 | |
Sempra Energy | | | | | | | | | | | 8,868 | | | | 1,309,005 | |
WEC Energy Group Incorporated | | | | | | | | | | | 10,190 | | | | 969,069 | |
| | | | |
| | | | | | | | | | | | | | | 9,316,654 | |
| | | | | | | | | | | | | | | | |
| | | | |
| Water Utilities: 0.06% | | | | | | | | | | | | |
American Water Works Company Incorporated | | | | | | | | | | | 5,835 | | | | 724,882 | |
| | | | | | | | | | | | | | | | |
| | | | |
Total Common Stocks (Cost $341,783,865) | | | | | | | | | | | | | | | 797,980,723 | |
| | | | | | | | | | | | | | | | |
| | | | |
| | | | | | | | | | | | | | | | |
Wells Fargo Index Asset Allocation Fund | 23
Portfolio of investments—September 30, 2019
| | | | | | | | | | | | | | | | |
| | | Interest
rate | | | Maturity
date | | | Principal | | | Value | |
| Non-Agency Mortgage-Backed Securities: 0.00% | | | | | | | | | | | | |
Citigroup Mortgage Loan Trust Incorporated Series 2004-HYB4 Class AA (1 Month LIBOR +0.33 %)± | | | 2.35 | % | | | 12-25-2034 | | | $ | 7,150 | | | $ | 6,973 | |
| | | | | | | | | | | | | | | | |
| | | | |
TotalNon-Agency Mortgage-Backed Securities (Cost $7,150) | | | | | | | | | | | | | | | 6,973 | |
| | | | | | | | | | | | | | | | |
| | | | |
| U.S. Treasury Securities: 38.67% | | | | | | | | | | | | |
U.S. Treasury Bond | | | 1.63 | | | | 8-15-2029 | | | | 2,854,000 | | | | 2,841,625 | |
U.S. Treasury Bond | | | 2.13 | | | | 9-30-2024 | | | | 1,844,000 | | | | 1,892,837 | |
U.S. Treasury Bond | | | 2.13 | | | | 11-30-2024 | | | | 1,852,000 | | | | 1,902,279 | |
U.S. Treasury Bond | | | 2.25 | | | | 8-15-2046 | | | | 2,681,000 | | | | 2,751,376 | |
U.S. Treasury Bond | | | 2.25 | | | | 8-15-2049 | | | | 1,955,000 | | | | 2,012,657 | |
U.S. Treasury Bond | | | 2.50 | | | | 2-15-2045 | | | | 2,860,000 | | | | 3,079,863 | |
U.S. Treasury Bond | | | 2.50 | | | | 2-15-2046 | | | | 2,659,000 | | | | 2,864,969 | |
U.S. Treasury Bond | | | 2.50 | | | | 5-15-2046 | | | | 2,643,000 | | | | 2,848,658 | |
U.S. Treasury Bond | | | 2.75 | | | | 8-15-2042 | | | | 1,340,000 | | | | 1,505,773 | |
U.S. Treasury Bond | | | 2.75 | | | | 11-15-2042 | | | | 1,781,000 | | | | 1,999,938 | |
U.S. Treasury Bond | | | 2.75 | | | | 8-15-2047 | | | | 2,582,000 | | | | 2,924,720 | |
U.S. Treasury Bond | | | 2.75 | | | | 11-15-2047 | | | | 2,602,000 | | | | 2,949,509 | |
U.S. Treasury Bond | | | 2.88 | | | | 5-15-2028 | | | | 4,464,000 | | | | 4,900,286 | |
U.S. Treasury Bond | | | 2.88 | | | | 5-15-2043 | | | | 2,534,000 | | | | 2,907,270 | |
U.S. Treasury Bond | | | 2.88 | | | | 8-15-2045 | | | | 2,862,000 | | | | 3,300,467 | |
U.S. Treasury Bond | | | 2.88 | | | | 11-15-2046 | | | | 2,645,000 | | | | 3,062,827 | |
U.S. Treasury Bond | | | 2.88 | | | | 5-15-2049 | | | | 2,856,000 | | | | 3,333,711 | |
U.S. Treasury Bond | | | 3.00 | | | | 5-15-2042 | | | | 904,000 | | | | 1,057,821 | |
U.S. Treasury Bond | | | 3.00 | | | | 11-15-2044 | | | | 2,772,000 | | | | 3,258,291 | |
U.S. Treasury Bond | | | 3.00 | | | | 5-15-2045 | | | | 2,864,000 | | | | 3,374,486 | |
U.S. Treasury Bond | | | 3.00 | | | | 11-15-2045 | | | | 2,835,000 | | | | 3,346,407 | |
U.S. Treasury Bond | | | 3.00 | | | | 2-15-2047 | | | | 2,651,000 | | | | 3,144,956 | |
U.S. Treasury Bond | | | 3.00 | | | | 5-15-2047 | | | | 2,626,000 | | | | 3,114,067 | |
U.S. Treasury Bond | | | 3.00 | | | | 2-15-2048 | | | | 2,812,000 | | | | 3,341,447 | |
U.S. Treasury Bond | | | 3.00 | | | | 8-15-2048 | | | | 2,099,000 | | | | 2,498,138 | |
U.S. Treasury Bond | | | 3.00 | | | | 2-15-2049 | | | | 3,006,000 | | | | 3,587,003 | |
U.S. Treasury Bond | | | 3.13 | | | | 11-15-2041 | | | | 846,000 | | | | 1,008,921 | |
U.S. Treasury Bond | | | 3.13 | | | | 2-15-2042 | | | | 1,066,000 | | | | 1,271,788 | |
U.S. Treasury Bond | | | 3.13 | | | | 2-15-2043 | | | | 1,783,000 | | | | 2,127,969 | |
U.S. Treasury Bond | | | 3.13 | | | | 8-15-2044 | | | | 2,827,000 | | | | 3,389,750 | |
U.S. Treasury Bond | | | 3.13 | | | | 5-15-2048 | | | | 2,895,000 | | | | 3,521,609 | |
U.S. Treasury Bond | | | 3.38 | | | | 5-15-2044 | | | | 2,936,000 | | | | 3,659,793 | |
U.S. Treasury Bond | | | 3.38 | | | | 11-15-2048 | | | | 3,002,000 | | | | 3,828,019 | |
U.S. Treasury Bond | | | 3.50 | | | | 2-15-2039 | | | | 731,000 | | | | 916,291 | |
U.S. Treasury Bond | | | 3.63 | | | | 8-15-2043 | | | | 2,200,000 | | | | 2,839,375 | |
U.S. Treasury Bond | | | 3.63 | | | | 2-15-2044 | | | | 2,898,000 | | | | 3,749,061 | |
U.S. Treasury Bond | | | 3.75 | | | | 8-15-2041 | | | | 929,000 | | | | 1,211,510 | |
U.S. Treasury Bond | | | 3.75 | | | | 11-15-2043 | | | | 2,870,000 | | | | 3,777,750 | |
U.S. Treasury Bond | | | 3.88 | | | | 8-15-2040 | | | | 946,000 | | | | 1,251,418 | |
U.S. Treasury Bond | | | 4.25 | | | | 5-15-2039 | | | | 681,000 | | | | 938,583 | |
U.S. Treasury Bond | | | 4.25 | | | | 11-15-2040 | | | | 977,000 | | | | 1,356,809 | |
U.S. Treasury Bond | | | 4.38 | | | | 2-15-2038 | | | | 381,000 | | | | 528,697 | |
U.S. Treasury Bond | | | 4.38 | | | | 11-15-2039 | | | | 757,000 | | | | 1,062,609 | |
U.S. Treasury Bond | | | 4.38 | | | | 5-15-2040 | | | | 1,078,000 | | | | 1,517,201 | |
U.S. Treasury Bond | | | 4.38 | | | | 5-15-2041 | | | | 842,000 | | | | 1,190,970 | |
U.S. Treasury Bond | | | 4.50 | | | | 2-15-2036 | | | | 837,000 | | | | 1,154,275 | |
U.S. Treasury Bond | | | 4.50 | | | | 5-15-2038 | | | | 428,000 | | | | 603,647 | |
U.S. Treasury Bond | | | 4.50 | | | | 8-15-2039 | | | | 721,000 | | | | 1,026,101 | |
U.S. Treasury Bond | | | 4.63 | | | | 2-15-2040 | | | | 1,276,000 | | | | 1,848,156 | |
U.S. Treasury Bond | | | 4.75 | | | | 2-15-2037 | | | | 264,000 | | | | 378,541 | |
24 | Wells Fargo Index Asset Allocation Fund
Portfolio of investments—September 30, 2019
| | | | | | | | | | | | | | | | |
| | | Interest
rate | | | Maturity
date | | | Principal | | | Value | |
| U.S. Treasury Securities (continued) | | | | | | | | | | | | |
U.S. Treasury Bond | | | 4.75 | % | | | 2-15-2041 | | | $ | 1,084,000 | | | $ | 1,603,643 | |
U.S. Treasury Bond | | | 5.00 | | | | 5-15-2037 | | | | 375,000 | | | | 553,389 | |
U.S. Treasury Bond | | | 5.25 | | | | 11-15-2028 | | | | 479,000 | | | | 624,066 | |
U.S. Treasury Bond | | | 5.25 | | | | 2-15-2029 | | | | 349,000 | | | | 457,326 | |
U.S. Treasury Bond | | | 5.38 | | | | 2-15-2031 | | | | 752,000 | | | | 1,036,908 | |
U.S. Treasury Bond | | | 5.50 | | | | 8-15-2028 | | | | 369,000 | | | | 485,898 | |
U.S. Treasury Bond | | | 6.13 | | | | 11-15-2027 | | | | 525,000 | | | | 703,808 | |
U.S. Treasury Bond | | | 6.13 | | | | 8-15-2029 | | | | 293,000 | | | | 411,242 | |
U.S. Treasury Bond | | | 6.25 | | | | 5-15-2030 | | | | 478,000 | | | | 689,608 | |
U.S. Treasury Bond | | | 6.38 | | | | 8-15-2027 | | | | 224,000 | | | | 302,330 | |
U.S. Treasury Bond | | | 6.88 | | | | 8-15-2025 | | | | 224,000 | | | | 290,080 | |
U.S. Treasury Note | | | 1.88 | | | | 6-30-2026 | | | | 1,825,000 | | | | 1,855,084 | |
U.S. Treasury Note | | | 2.38 | | | | 3-15-2022 | | | | 2,243,000 | | | | 2,285,845 | |
U.S. Treasury Note | | | 2.38 | | | | 4-30-2026 | | | | 1,812,000 | | | | 1,897,433 | |
U.S. Treasury Note | | | 2.63 | | | | 12-15-2021 | | | | 2,277,000 | | | | 2,327,076 | |
U.S. Treasury Note | | | 2.63 | | | | 12-31-2025 | | | | 1,914,000 | | | | 2,028,765 | |
U.S. Treasury Note | | | 2.88 | | | | 9-30-2023 | | | | 2,444,000 | | | | 2,567,059 | |
U.S. Treasury Note | | | 2.88 | | | | 11-30-2025 | | | | 1,880,000 | | | | 2,018,944 | |
U.S. Treasury Note | | | 1.13 | | | | 2-28-2021 | | | | 3,264,000 | | | | 3,235,185 | |
U.S. Treasury Note | | | 1.13 | | | | 6-30-2021 | | | | 3,343,000 | | | | 3,309,831 | |
U.S. Treasury Note | | | 1.13 | | | | 7-31-2021 | | | | 2,232,000 | | | | 2,209,767 | |
U.S. Treasury Note | | | 1.13 | | | | 8-31-2021 | | | | 2,233,000 | | | | 2,210,321 | |
U.S. Treasury Note | | | 1.13 | | | | 9-30-2021 | | | | 2,188,000 | | | | 2,165,351 | |
U.S. Treasury Note | | | 1.25 | | | | 3-31-2021 | | | | 3,250,000 | | | | 3,226,641 | |
U.S. Treasury Note | | | 1.25 | | | | 10-31-2021 | | | | 2,188,000 | | | | 2,170,137 | |
U.S. Treasury Note | | | 1.25 | | | | 7-31-2023 | | | | 1,829,000 | | | | 1,807,066 | |
U.S. Treasury Note | | | 1.25 | | | | 8-31-2024 | | | | 1,400,000 | | | | 1,380,586 | |
U.S. Treasury Note | | | 1.38 | | | | 9-15-2020 | | | | 1,598,000 | | | | 1,592,070 | |
U.S. Treasury Note | | | 1.38 | | | | 9-30-2020 | | | | 3,356,000 | | | | 3,341,449 | |
U.S. Treasury Note | | | 1.38 | | | | 10-31-2020 | | | | 3,178,000 | | | | 3,163,227 | |
U.S. Treasury Note | | | 1.38 | | | | 1-31-2021 | | | | 3,192,000 | | | | 3,175,292 | |
U.S. Treasury Note | | | 1.38 | | | | 4-30-2021 | | | | 3,245,000 | | | | 3,227,254 | |
U.S. Treasury Note | | | 1.38 | | | | 5-31-2021 | | | | 3,248,000 | | | | 3,229,730 | |
U.S. Treasury Note | | | 1.38 | | | | 6-30-2023 | | | | 1,733,000 | | | | 1,720,409 | |
U.S. Treasury Note | | | 1.38 | | | | 8-31-2023 | | | | 1,817,000 | | | | 1,803,940 | |
U.S. Treasury Note | | | 1.38 | | | | 9-30-2023 | | | | 1,778,000 | | | | 1,765,082 | |
U.S. Treasury Note | | | 1.38 | | | | 8-31-2026 | | | | 1,787,000 | | | | 1,758,310 | |
U.S. Treasury Note | | | 1.50 | | | | 1-31-2022 | | | | 1,625,000 | | | | 1,620,620 | |
U.S. Treasury Note | | | 1.50 | | | | 2-28-2023 | | | | 1,635,000 | | | | 1,630,849 | |
U.S. Treasury Note | | | 1.50 | | | | 3-31-2023 | | | | 1,679,000 | | | | 1,675,262 | |
U.S. Treasury Note | | | 1.50 | | | | 8-15-2026 | | | | 4,143,000 | | | | 4,109,985 | |
U.S. Treasury Note | | | 1.63 | | | | 10-15-2020 | | | | 1,591,000 | | | | 1,587,893 | |
U.S. Treasury Note | | | 1.63 | | | | 11-30-2020 | | | | 2,166,000 | | | | 2,161,431 | |
U.S. Treasury Note | | | 1.63 | | | | 8-15-2022 | | | | 1,250,000 | | | | 1,251,709 | |
U.S. Treasury Note | | | 1.63 | | | | 8-31-2022 | | | | 2,373,000 | | | | 2,375,132 | |
U.S. Treasury Note | | | 1.63 | | | | 11-15-2022 | | | | 2,108,000 | | | | 2,111,129 | |
U.S. Treasury Note | | | 1.63 | | | | 4-30-2023 | | | | 1,711,000 | | | | 1,713,473 | |
U.S. Treasury Note | | | 1.63 | | | | 5-31-2023 | | | | 1,714,000 | | | | 1,717,482 | |
U.S. Treasury Note | | | 1.63 | | | | 10-31-2023 | | | | 1,824,000 | | | | 1,828,204 | |
U.S. Treasury Note | | | 1.63 | | | | 2-15-2026 | | | | 4,269,000 | | | | 4,270,834 | |
U.S. Treasury Note | | | 1.63 | | | | 5-15-2026 | | | | 4,111,000 | | | | 4,113,088 | |
U.S. Treasury Note | | | 1.75 | | | | 10-31-2020 | | | | 1,585,000 | | | | 1,583,947 | |
U.S. Treasury Note | | | 1.75 | | | | 11-15-2020 | | | | 1,588,000 | | | | 1,586,883 | |
U.S. Treasury Note | | | 1.75 | | | | 12-31-2020 | | | | 3,353,000 | | | | 3,350,904 | |
U.S. Treasury Note | | | 1.75 | | | | 11-30-2021 | | | | 2,003,000 | | | | 2,007,460 | |
Wells Fargo Index Asset Allocation Fund | 25
Portfolio of investments—September 30, 2019
| | | | | | | | | | | | | | | | |
| | | Interest
rate | | | Maturity
date | | | Principal | | | Value | |
| U.S. Treasury Securities (continued) | | | | | | | | | | | | |
U.S. Treasury Note | | | 1.75 | % | | | 2-28-2022 | | | $ | 1,637,000 | | | $ | 1,642,180 | |
U.S. Treasury Note | | | 1.75 | | | | 3-31-2022 | | | | 1,640,000 | | | | 1,646,214 | |
U.S. Treasury Note | | | 1.75 | | | | 4-30-2022 | | | | 1,612,000 | | | | 1,618,234 | |
U.S. Treasury Note | | | 1.75 | | | | 5-15-2022 | | | | 1,448,000 | | | | 1,453,939 | |
U.S. Treasury Note | | | 1.75 | | | | 5-31-2022 | | | | 2,343,000 | | | | 2,351,969 | |
U.S. Treasury Note | | | 1.75 | | | | 6-30-2022 | | | | 2,347,000 | | | | 2,357,635 | |
U.S. Treasury Note | | | 1.75 | | | | 9-30-2022 | | | | 1,771,000 | | | | 1,779,993 | |
U.S. Treasury Note | | | 1.75 | | | | 1-31-2023 | | | | 1,684,000 | | | | 1,693,012 | |
U.S. Treasury Note | | | 1.75 | | | | 5-15-2023 | | | | 3,117,000 | | | | 3,135,385 | |
U.S. Treasury Note | | | 1.88 | | | | 12-15-2020 | | | | 1,619,000 | | | | 1,620,455 | |
U.S. Treasury Note | | | 1.88 | | | | 11-30-2021 | | | | 1,649,000 | | | | 1,657,631 | |
U.S. Treasury Note | | | 1.88 | | | | 1-31-2022 | | | | 2,358,000 | | | | 2,370,987 | |
U.S. Treasury Note | | | 1.88 | | | | 2-28-2022 | | | | 2,348,000 | | | | 2,361,758 | |
U.S. Treasury Note | | | 1.88 | | | | 3-31-2022 | | | | 2,371,000 | | | | 2,387,208 | |
U.S. Treasury Note | | | 1.88 | | | | 4-30-2022 | | | | 2,376,000 | | | | 2,392,057 | |
U.S. Treasury Note | | | 1.88 | | | | 5-31-2022 | | | | 1,795,000 | | | | 1,808,252 | |
U.S. Treasury Note | | | 1.88 | | | | 7-31-2022 | | | | 2,337,000 | | | | 2,354,710 | |
U.S. Treasury Note | | | 1.88 | | | | 8-31-2022 | | | | 1,754,000 | | | | 1,768,799 | |
U.S. Treasury Note | | | 1.88 | | | | 9-30-2022 | | | | 2,248,000 | | | | 2,268,021 | |
U.S. Treasury Note | | | 1.88 | | | | 10-31-2022 | | | | 1,650,000 | | | | 1,664,631 | |
U.S. Treasury Note | | | 1.88 | | | | 8-31-2024 | | | | 1,968,000 | | | | 1,997,213 | |
U.S. Treasury Note | | | 1.88 | | | | 7-31-2026 | | | | 1,828,000 | | | | 1,858,133 | |
U.S. Treasury Note | | | 2.00 | | | | 9-30-2020 | | | | 2,093,000 | | | | 2,096,761 | |
U.S. Treasury Note | | | 2.00 | | | | 11-30-2020 | | | | 2,266,000 | | | | 2,270,868 | |
U.S. Treasury Note | | | 2.00 | | | | 1-15-2021 | | | | 1,617,000 | | | | 1,621,358 | |
U.S. Treasury Note | | | 2.00 | | | | 2-28-2021 | | | | 2,421,000 | | | | 2,429,417 | |
U.S. Treasury Note | | | 2.00 | | | | 5-31-2021 | | | | 1,559,000 | | | | 1,566,186 | |
U.S. Treasury Note | | | 2.00 | | | | 8-31-2021 | | | | 1,641,000 | | | | 1,651,128 | |
U.S. Treasury Note | | | 2.00 | | | | 10-31-2021 | | | | 1,649,000 | | | | 1,660,530 | |
U.S. Treasury Note | | | 2.00 | | | | 11-15-2021 | | | | 2,485,000 | | | | 2,503,735 | |
U.S. Treasury Note | | | 2.00 | | | | 12-31-2021 | | | | 2,300,000 | | | | 2,318,688 | |
U.S. Treasury Note | | | 2.00 | | | | 2-15-2022 | | | | 1,679,000 | | | | 1,694,413 | |
U.S. Treasury Note | | | 2.00 | | | | 7-31-2022 | | | | 1,778,000 | | | | 1,798,697 | |
U.S. Treasury Note | | | 2.00 | | | | 10-31-2022 | | | | 2,238,000 | | | | 2,265,713 | |
U.S. Treasury Note | | | 2.00 | | | | 11-30-2022 | | | | 4,261,000 | | | | 4,315,095 | |
U.S. Treasury Note | | | 2.00 | | | | 2-15-2023 | | | | 3,077,000 | | | | 3,119,309 | |
U.S. Treasury Note | | | 2.00 | | | | 4-30-2024 | | | | 1,930,000 | | | | 1,967,017 | |
U.S. Treasury Note | | | 2.00 | | | | 5-31-2024 | | | | 1,934,000 | | | | 1,972,907 | |
U.S. Treasury Note | | | 2.00 | | | | 6-30-2024 | | | | 1,939,000 | | | | 1,976,871 | |
U.S. Treasury Note | | | 2.00 | | | | 2-15-2025 | | | | 4,486,000 | | | | 4,580,977 | |
U.S. Treasury Note | | | 2.00 | | | | 8-15-2025 | | | | 4,495,000 | | | | 4,595,084 | |
U.S. Treasury Note | | | 2.00 | | | | 11-15-2026 | | | | 4,255,000 | | | | 4,363,536 | |
U.S. Treasury Note | | | 2.13 | | | | 1-31-2021 | | | | 1,409,000 | | | | 1,415,385 | |
U.S. Treasury Note | | | 2.13 | | | | 6-30-2021 | | | | 1,516,000 | | | | 1,527,192 | |
U.S. Treasury Note | | | 2.13 | | | | 8-15-2021 | | | | 2,440,000 | | | | 2,459,634 | |
U.S. Treasury Note | | | 2.13 | | | | 9-30-2021 | | | | 1,633,000 | | | | 1,647,990 | |
U.S. Treasury Note | | | 2.13 | | | | 12-31-2021 | | | | 1,626,000 | | | | 1,643,721 | |
U.S. Treasury Note | | | 2.13 | | | | 6-30-2022 | | | | 1,615,000 | | | | 1,638,468 | |
U.S. Treasury Note | | | 2.13 | | | | 12-31-2022 | | | | 4,298,000 | | | | 4,371,872 | |
U.S. Treasury Note | | | 2.13 | | | | 11-30-2023 | | | | 1,638,000 | | | | 1,674,087 | |
U.S. Treasury Note | | | 2.13 | | | | 2-29-2024 | | | | 1,960,000 | | | | 2,006,703 | |
U.S. Treasury Note | | | 2.13 | | | | 3-31-2024 | | | | 1,961,000 | | | | 2,008,646 | |
U.S. Treasury Note | | | 2.13 | | | | 7-31-2024 | | | | 1,927,000 | | | | 1,976,680 | |
U.S. Treasury Note | | | 2.13 | | | | 5-15-2025 | | | | 4,466,000 | | | | 4,592,827 | |
U.S. Treasury Note | | | 2.13 | | | | 5-31-2026 | | | | 1,793,000 | | | | 1,850,082 | |
26 | Wells Fargo Index Asset Allocation Fund
Portfolio of investments—September 30, 2019
| | | | | | | | | | | | | | | | |
| | | Interest
rate | | | Maturity
date | | | Principal | | | Value | |
| U.S. Treasury Securities (continued) | | | | | | | | | | | | |
U.S. Treasury Note | | | 2.25 | % | | | 2-15-2021 | | | $ | 1,767,000 | | | $ | 1,778,458 | |
U.S. Treasury Note | | | 2.25 | | | | 3-31-2021 | | | | 1,440,000 | | | | 1,450,575 | |
U.S. Treasury Note | | | 2.25 | | | | 4-30-2021 | | | | 1,514,000 | | | | 1,526,124 | |
U.S. Treasury Note | | | 2.25 | | | | 7-31-2021 | | | | 2,618,000 | | | | 2,644,282 | |
U.S. Treasury Note | | | 2.25 | | | | 12-31-2023 | | | | 1,886,000 | | | | 1,938,454 | |
U.S. Treasury Note | | | 2.25 | | | | 1-31-2024 | | | | 1,914,000 | | | | 1,968,429 | |
U.S. Treasury Note | | | 2.25 | | | | 10-31-2024 | | | | 1,882,000 | | | | 1,943,974 | |
U.S. Treasury Note | | | 2.25 | | | | 11-15-2024 | | | | 4,492,000 | | | | 4,640,096 | |
U.S. Treasury Note | | | 2.25 | | | | 12-31-2024 | | | | 1,911,000 | | | | 1,975,571 | |
U.S. Treasury Note | | | 2.25 | | | | 11-15-2025 | | | | 4,512,000 | | | | 4,679,438 | |
U.S. Treasury Note | | | 2.25 | | | | 3-31-2026 | | | | 1,872,000 | | | | 1,945,198 | |
U.S. Treasury Note | | | 2.25 | | | | 2-15-2027 | | | | 4,295,000 | | | | 4,481,061 | |
U.S. Treasury Note | | | 2.25 | | | | 8-15-2027 | | | | 4,252,000 | | | | 4,445,333 | |
U.S. Treasury Note | | | 2.25 | | | | 11-15-2027 | | | | 4,284,000 | | | | 4,481,633 | |
U.S. Treasury Note | | | 2.38 | | | | 12-31-2020 | | | | 1,317,000 | | | | 1,326,363 | |
U.S. Treasury Note | | | 2.38 | | | | 1-31-2023 | | | | 2,325,000 | | | | 2,384,124 | |
U.S. Treasury Note | | | 2.38 | | | | 2-29-2024 | | | | 2,440,000 | | | | 2,524,733 | |
U.S. Treasury Note | | | 2.38 | | | | 8-15-2024 | | | | 4,465,000 | | | | 4,632,438 | |
U.S. Treasury Note | | | 2.38 | | | | 5-15-2027 | | | | 4,355,000 | | | | 4,588,911 | |
U.S. Treasury Note | | | 2.38 | | | | 5-15-2029 | | | | 4,253,000 | | | | 4,517,650 | |
U.S. Treasury Note | | | 2.50 | | | | 1-15-2022 | | | | 2,241,000 | | | | 2,284,419 | |
U.S. Treasury Note | | | 2.50 | | | | 2-15-2022 | | | | 2,245,000 | | | | 2,290,514 | |
U.S. Treasury Note | | | 2.50 | | | | 3-31-2023 | | | | 2,278,000 | | | | 2,349,899 | |
U.S. Treasury Note | | | 2.50 | | | | 8-15-2023 | | | | 2,662,000 | | | | 2,754,754 | |
U.S. Treasury Note | | | 2.50 | | | | 1-31-2024 | | | | 2,422,000 | | | | 2,515,947 | |
U.S. Treasury Note | | | 2.50 | | | | 5-15-2024 | | | | 4,360,000 | | | | 4,540,191 | |
U.S. Treasury Note | | | 2.50 | | | | 1-31-2025 | | | | 1,936,000 | | | | 2,027,053 | |
U.S. Treasury Note | | | 2.50 | | | | 2-28-2026 | | | | 1,888,000 | | | | 1,989,406 | |
U.S. Treasury Note | | | 2.63 | | | | 11-15-2020 | | | | 5,315,000 | | | | 5,362,337 | |
U.S. Treasury Note | | | 2.63 | | | | 6-15-2021 | | | | 1,885,000 | | | | 1,913,790 | |
U.S. Treasury Note | | | 2.63 | | | | 2-28-2023 | | | | 2,359,000 | | | | 2,440,644 | |
U.S. Treasury Note | | | 2.63 | | | | 6-30-2023 | | | | 2,304,000 | | | | 2,392,020 | |
U.S. Treasury Note | | | 2.63 | | | | 12-31-2023 | | | | 2,404,000 | | | | 2,507,954 | |
U.S. Treasury Note | | | 2.63 | | | | 3-31-2025 | | | | 1,884,000 | | | | 1,986,148 | |
U.S. Treasury Note | | | 2.63 | | | | 1-31-2026 | | | | 1,869,000 | | | | 1,982,308 | |
U.S. Treasury Note | | | 2.63 | | | | 2-15-2029 | | | | 4,451,000 | | | | 4,818,555 | |
U.S. Treasury Note | | | 2.75 | | | | 4-30-2023 | | | | 2,279,000 | | | | 2,371,584 | |
U.S. Treasury Note | | | 2.75 | | | | 5-31-2023 | | | | 2,334,000 | | | | 2,431,098 | |
U.S. Treasury Note | | | 2.75 | | | | 7-31-2023 | | | | 2,347,000 | | | | 2,449,131 | |
U.S. Treasury Note | | | 2.75 | | | | 8-31-2023 | | | | 2,402,000 | | | | 2,509,339 | |
U.S. Treasury Note | | | 2.75 | | | | 11-15-2023 | | | | 3,936,000 | | | | 4,120,193 | |
U.S. Treasury Note | | | 2.75 | | | | 2-15-2024 | | | | 3,410,000 | | | | 3,579,701 | |
U.S. Treasury Note | | | 2.75 | | | | 2-28-2025 | | | | 1,955,000 | | | | 2,072,911 | |
U.S. Treasury Note | | | 2.75 | | | | 6-30-2025 | | | | 1,959,000 | | | | 2,082,203 | |
U.S. Treasury Note | | | 2.75 | | | | 8-31-2025 | | | | 2,020,000 | | | | 2,150,038 | |
U.S. Treasury Note | | | 2.75 | | | | 2-15-2028 | | | | 3,068,000 | | | | 3,331,417 | |
U.S. Treasury Note | | | 2.88 | | | | 10-31-2023 | | | | 2,318,000 | | | | 2,437,160 | |
U.S. Treasury Note | | | 2.88 | | | | 11-30-2023 | | | | 2,370,000 | | | | 2,494,240 | |
U.S. Treasury Note | | | 2.88 | | | | 4-30-2025 | | | | 1,884,000 | | | | 2,012,642 | |
U.S. Treasury Note | | | 2.88 | | | | 5-31-2025 | | | | 1,939,000 | | | | 2,072,761 | |
U.S. Treasury Note | | | 2.88 | | | | 7-31-2025 | | | | 1,949,000 | | | | 2,086,800 | |
U.S. Treasury Note | | | 2.88 | | | | 8-15-2028 | | | | 3,133,000 | | | | 3,445,443 | |
U.S. Treasury Note | | | 3.00 | | | | 9-30-2025 | | | | 1,994,000 | | | | 2,152,196 | |
U.S. Treasury Note | | | 3.00 | | | | 10-31-2025 | | | | 1,814,000 | | | | 1,959,758 | |
U.S. Treasury Note | | | 3.13 | | | | 5-15-2021 | | | | 1,657,000 | | | | 1,693,506 | |
U.S. Treasury Note | | | 3.13 | | | | 11-15-2028 | | | | 4,425,000 | | | | 4,969,137 | |
Wells Fargo Index Asset Allocation Fund | 27
Portfolio of investments—September 30, 2019
| | | | | | | | | | | | | | | | |
| | | Interest
rate | | | Maturity
date | | | Principal | | | Value | |
| U.S. Treasury Securities (continued) | | | | | | | | | | | | |
U.S. Treasury Note | | | 3.63 | % | | | 2-15-2021 | | | $ | 2,765,000 | | | $ | 2,834,773 | |
U.S. Treasury Note | | | 6.00 | | | | 2-15-2026 | | | | 445,000 | | | | 563,116 | |
U.S. Treasury Note | | | 6.25 | | | | 8-15-2023 | | | | 378,000 | | | | 444,283 | |
U.S. Treasury Note | | | 6.50 | | | | 11-15-2026 | | | | 296,000 | | | | 393,033 | |
U.S. Treasury Note | | | 6.63 | | | | 2-15-2027 | | | | 215,000 | | | | 289,435 | |
U.S. Treasury Note | | | 6.75 | | | | 8-15-2026 | | | | 221,000 | | | | 294,767 | |
U.S. Treasury Note | | | 7.13 | | | | 2-15-2023 | | | | 260,000 | | | | 307,206 | |
U.S. Treasury Note | | | 7.25 | | | | 8-15-2022 | | | | 261,000 | | | | 302,250 | |
U.S. Treasury Note | | | 7.50 | | | | 11-15-2024 | | | | 240,000 | | | | 309,928 | |
U.S. Treasury Note | | | 7.63 | | | | 11-15-2022 | | | | 140,000 | | | | 165,665 | |
U.S. Treasury Note | | | 7.63 | | | | 2-15-2025 | | | | 216,000 | | | | 283,002 | |
U.S. Treasury Note | | | 7.88 | | | | 2-15-2021 | | | | 180,000 | | | | 194,822 | |
U.S. Treasury Note | | | 8.00 | | | | 11-15-2021 | | | | 511,000 | | | | 578,069 | |
U.S. Treasury Note | | | 8.13 | | | | 5-15-2021 | | | | 181,000 | | | | 199,425 | |
U.S. Treasury Note | | | 8.13 | | | | 8-15-2021 | | | | 175,000 | | | | 195,624 | |
| | | | |
Total U.S. Treasury Securities (Cost $487,865,001) | | | | | | | | | | | | | | | 514,862,094 | |
| | | | | | | | | | | | | | | | |
| | | | |
| | | | | | | | | | | | | | | | |
| | | Yield | | | | | | Shares | | | | |
Short-Term Investments: 1.28% | | | | | | | | | | | | | | | | |
| | | | |
| Investment Companies: 0.99% | | | | | | | | | | | | |
Securities Lending Cash Investments LLC (l)(r)(u) | | | 2.11 | | | | | | | | 819,291 | | | | 819,373 | |
Wells Fargo Government Money Market Fund Select Class (l)(u) | | | 1.88 | | | | | | | | 12,325,531 | | | | 12,325,531 | |
| | | | |
| | | | | | | | | | | | | | | 13,144,904 | |
| | | | | | | | | | | | | | | | |
| | | | |
| | | | | | | | | | | | | | | | |
| | | | | | | | | Principal | | | | |
| U.S. Treasury Securities: 0.29% | | | | | | | | | | | | |
U.S. Treasury Bill (z)# | | | 1.87 | | | | 11-7-2019 | | | $ | 3,937,000 | | | | 3,930,047 | |
| | | | | | | | | | | | | | | | |
| | | | |
Total Short-Term Investments (Cost $17,074,153) | | | | | | | | | | | | | | | 17,074,951 | |
| | | | | | | | | | | | | | | | |
| | | | | | | | |
| Total investments in securities (Cost $846,765,115) | | | 99.89 | % | | | 1,329,966,507 | |
| | |
Other assets and liabilities, net | | | 0.11 | | | | 1,480,612 | |
| | | | | | | | |
| Total net assets | | | 100.00 | % | | $ | 1,331,447,119 | |
| | | | | | | | |
| † | Non-income-earning security |
| « | All or a portion of this security is on loan. |
| (l) | The issuer of the security is an affiliated person of the Fund as defined in the Investment Company Act of 1940. |
| ± | Variable rate investment. The rate shown is the rate in effect at period end. |
| (r) | The investment is anon-registered investment company purchased with cash collateral received from securities on loan. |
| (u) | The rate represents the7-day annualized yield at period end. |
| (z) | Zero coupon security. The rate represents the current yield to maturity. |
| # | All or a portion of this security is segregated as collateral for investments in derivative instruments. |
Abbreviations:
| FNMA | Federal National Mortgage Association |
| LIBOR | London Interbank Offered Rate |
| REIT | Real estate investment trust |
28 | Wells Fargo Index Asset Allocation Fund
Portfolio of investments—September 30, 2019
Futures Contracts
| | | | | | | | | | | | | | | | | | | | | | | | |
| Description | | Number of
contracts | | | Expiration
date | | | Notional
cost | | | Notional
value | | | Unrealized
gains | | | Unrealized
losses | |
| | | | | | |
Long | | | | | | | | | | | | | | | | | | | | | | | | |
| | | | | | |
10-Year U.S. Treasury Notes | | | 1,370 | | | | 12-19-2019 | | | $ | 179,927,786 | | | $ | 178,528,125 | | | $ | 0 | | | $ | (1,399,661 | ) |
| | | | | | |
5-Year U.S. Treasury Notes | | | 103 | | | | 12-31-2019 | | | | 12,264,678 | | | | 12,272,289 | | | | 7,611 | | | | 0 | |
| | | | | | |
Short | | | | | | | | | | | | | | | | | | | | | | | | |
| | | | | | |
S&P 500E-Mini Index | | | (203) | | | | 12-20-2019 | | | | (30,591,055 | ) | | | (30,231,775 | ) | | | 359,280 | | | | 0 | |
| | | | | | | | | | | | | | | | | | | | | | | | |
| | | | | | |
| | | | | | | | | | | | | | | | | | $ | 366,891 | | | $ | (1,399,661 | ) |
| | | | | | | | | | | | | | | | | | | | | | | | |
Investments in Affiliates
An affiliated investment is an investment in which the Fund owns at least 5% of the outstanding voting shares of the issuer or as a result of other relationships, such as the Fund and the issuer having the same investment manager. Transactions with issuers that were either affiliated persons of the Fund at the beginning of the period or the end of the period were as follows:
| | | | | | | | | | | | | | | | | | | | | | | | | | | | | | | | | | | | |
| | | Shares,
beginning of
period | | | Shares
purchased | | | Shares
sold | | | Shares,
end of
period | | | Net
realized
gains
(losses) | | | Net
change in
unrealized
gains
(losses) | | | Income
from
affiliated
securities | | | Value,
end of
period | | | % of
net
assets | |
| | | | | | | | | |
| Common Stocks | | | | | | | | | | | | | | | | | | | | | | | | | | | |
Financials | | | | | | | | | | | | | | | | | | | | | | | | | | | | | | | | | | | | |
Banks | | | | | | | | | | | | | | | | | | | | | | | | | | | | | | | | | | | | |
Wells Fargo & Company | | | 140,237 | | | | 8,628 | | | | 19,344 | | | | 129,521 | | | $ | 17,122 | | | $ | (322,401 | ) | | $ | 248,333 | | | $ | 6,533,039 | | | | 0.49 | % |
| | | | | | | | | |
| Short-Term Investments | | | | | | | | | | | | | | | | | | | | | | | | | | | |
Investment Companies | | | | | | | | | | | | | | | | | | | | | | | | | | | | | | | | | | | | |
Securities Lending Cash Investments LLC | | | 1,344,731 | | | | 26,894,824 | | | | 27,420,264 | | | | 819,291 | | | | 265 | | | | (98 | ) | | | 30,068 | # | | | 819,373 | | | | | |
Wells Fargo Government Money Market Fund Select Class | | | 15,043,298 | | | | 170,563,792 | | | | 173,281,559 | | | | 12,325,531 | | | | 0 | | | | 0 | | | | 353,216 | | | | 12,325,531 | | | | 0.99 | |
| | | | | | | | | | | | | | | | | | | | | | | | | | | | | | | | | | | | |
| | | | | | | | | |
| | | | | | | | | | | | | | | | | | $ | 17,387 | | | $ | (322,499 | ) | | $ | 631,617 | | | $ | 19,677,943 | | | | 1.48 | % |
| | | | | | | | | | | | | | | | | | | | | | | | | | | | | | | | | | | | |
| # | Amount shown represents income before fees and rebates. |
The accompanying notes are an integral part of these financial statements.
Wells Fargo Index Asset Allocation Fund | 29
Statement of assets and liabilities—September 30, 2019
| | | | |
| | | | |
| |
Assets | | | | |
Investments in unaffiliated securities (including $811,635 of securities loaned), at value (cost $829,817,926) | | $ | 1,310,288,564 | |
Investments in affiliated securities, at value (cost $16,947,189) | | | 19,677,943 | |
Cash | | | 13,538 | |
Receivable for investments sold | | | 23,456,546 | |
Receivable for Fund shares sold | | | 621,172 | |
Receivable for dividends and interest | | | 3,426,696 | |
Receivable for securities lending income, net | | | 334 | |
Prepaid expenses and other assets | | | 497,387 | |
| | | | |
Total assets | | | 1,357,982,180 | |
| | | | |
| |
Liabilities | | | | |
Payable for investments purchased | | | 23,445,446 | |
Payable for daily variation margin on open futures contracts | | | 260,773 | |
Payable for Fund shares redeemed | | | 875,355 | |
Payable upon receipt of securities loaned | | | 818,875 | |
Management fee payable | | | 616,443 | |
Administration fees payable | | | 206,755 | |
Distribution fee payable | | | 88,851 | |
Trustees’ fees and expenses payable | | | 2,083 | |
Accrued expenses and other liabilities | | | 220,480 | |
| | | | |
Total liabilities | | | 26,535,061 | |
| | | | |
Total net assets | | $ | 1,331,447,119 | |
| | | | |
| |
Net assets consist of | | | | |
Paid-in capital | | $ | 860,142,438 | |
Total distributable earnings | | | 471,304,681 | |
| | | | |
Total net assets | | $ | 1,331,447,119 | |
| | | | |
| |
Computation of net asset value and offering price per share | | | | |
Net assets – Class A | | $ | 834,288,684 | |
Shares outstanding – Class A1 | | | 23,748,400 | |
Net asset value per share – Class A | | | $35.13 | |
Maximum offering price per share – Class A2 | | | $37.27 | |
Net assets – Class C | | $ | 144,264,086 | |
Shares outstanding – Class C1 | | | 6,754,289 | |
Net asset value per share – Class C | | | $21.36 | |
Net assets – Administrator Class | | $ | 229,390,014 | |
Shares outstanding – Administrator Class1 | | | 6,528,464 | |
Net asset value per share – Administrator Class | | | $35.14 | |
Net assets – Institutional Class | | $ | 123,504,335 | |
Shares outstanding – Institutional Class1 | | | 3,519,376 | |
Net asset value per share – Institutional Class | | | $35.09 | |
| 1 | The Fund has an unlimited number of authorized shares. |
| 2 | Maximum offering price is computed as 100/94.25 of net asset value. On investments of $50,000 or more, the offering price is reduced. |
The accompanying notes are an integral part of these financial statements.
30 | Wells Fargo Index Asset Allocation Fund
Statement of operations—year ended September 30, 2019
| | | | |
| | | | |
| |
Investment income | | | | |
Dividends | | $ | 15,280,190 | |
Interest | | | 10,607,057 | |
Income from affiliated securities | | | 633,609 | |
| | | | |
Total investment income | | | 26,520,856 | |
| | | | |
| |
Expenses | | | | |
Management fee | | | 7,795,905 | |
Administration fees | | | | |
Class A | | | 1,694,986 | |
Class C | | | 301,187 | |
Administrator Class | | | 280,555 | |
Institutional Class | | | 149,115 | |
Shareholder servicing fees | | | | |
Class A | | | 2,017,841 | |
Class C | | | 358,555 | |
Administrator Class | | | 538,762 | |
Distribution fee | | | | |
Class C | | | 1,075,565 | |
Custody and accounting fees | | | 99,999 | |
Professional fees | | | 51,001 | |
Registration fees | | | 106,533 | |
Shareholder report expenses | | | 119,365 | |
Trustees’ fees and expenses | | | 21,652 | |
Other fees and expenses | | | 141,004 | |
| | | | |
Total expenses | | | 14,752,025 | |
Less: Fee waivers and/or expense reimbursements | | | | |
Fund-level | | | (392,658 | ) |
Class C | | | (158 | ) |
Administrator Class | | | (215,206 | ) |
Institutional Class | | | (182 | ) |
| | | | |
Net expenses | | | 14,143,821 | |
| | | | |
Net investment income | | | 12,377,035 | |
| | | | |
| |
Realized and unrealized gains (losses) on investments | | | | |
Net realized gains (losses) on | | | | |
Unaffiliated securities | | | 14,769,744 | |
Affiliated securities | | | 17,387 | |
Futures contracts | | | (1,894,119 | ) |
| | | | |
Net realized gains on investments | | | 12,893,012 | |
| | | | |
| |
Net change in unrealized gains (losses) on | | | | |
Unaffiliated securities | | | 45,941,777 | |
Affiiliated securities | | | (322,499 | ) |
Futures contracts | | | (1,714,198 | ) |
| | | | |
Net change in unrealized gains (losses) on investments | | | 43,905,080 | |
| | | | |
Net realized and unrealized gains (losses) on investments | | | 56,798,092 | |
| | | | |
Net increase in net assets resulting from operations | | $ | 69,175,127 | |
| | | | |
The accompanying notes are an integral part of these financial statements.
Wells Fargo Index Asset Allocation Fund | 31
Statement of changes in net assets
| | | | | | | | | | | | | | | | |
| | | Year ended September 30, 2019 | | | Year ended September 30, 2018 | |
| | | | |
Operations | | | | | | | | | | | | | | | | |
Net investment income | | | | | | $ | 12,377,035 | | | | | | | $ | 9,894,627 | |
Net realized gains on investments | | | | | | | 12,893,012 | | | | | | | | 39,659,948 | |
Net change in unrealized gains (losses) on investments | | | | | | | 43,905,080 | | | | | | | | 71,110,422 | |
| | | | |
Net increase in net assets resulting from operations | | | | | | | 69,175,127 | | | | | | | | 120,664,997 | |
| | | | |
| | | | |
Distributions to shareholders from net investment income and net realized gains | | | | | | | | | | | | | | | | |
Class A | | | | | | | (30,578,240 | ) | | | | | | | (11,409,252 | ) |
Class C | | | | | | | (4,678,185 | ) | | | | | | | (919,168 | ) |
Administrator Class | | | | | | | (8,535,707 | ) | | | | | | | (3,520,207 | ) |
Institutional Class | | | | | | | (4,671,806 | ) | | | | | | | (1,662,226 | ) |
| | | | |
Total distributions to shareholders | | | | | | | (48,463,938 | ) | | | | | | | (17,510,853 | ) |
| | | | |
| | | | |
Capital share transactions | | | Shares | | | | | | | | Shares | | | | | |
Proceeds from shares sold | | | | | | | | | | | | | | | | |
Class A | | | 1,611,898 | | | | 53,557,954 | | | | 868,341 | | | | 29,002,760 | |
Class C | | | 1,502,173 | | | | 30,141,540 | | | | 1,103,845 | | | | 22,374,800 | |
Administrator Class | | | 1,697,812 | | | | 56,951,283 | | | | 1,794,727 | | | | 59,667,463 | |
Institutional Class | | | 1,028,853 | | | | 34,231,892 | | | | 2,309,266 | | | | 76,336,619 | |
| | | | |
| | | | | | | 174,882,669 | | | | | | | | 187,381,642 | |
| | | | |
Reinvestment of distributions | | | | | | | | | | | | | | | | |
Class A | | | 923,477 | | | | 29,806,219 | | | | 335,827 | | | | 11,110,101 | |
Class C | | | 218,202 | | | | 4,231,633 | | | | 41,176 | | | | 823,476 | |
Administrator Class | | | 262,175 | | | | 8,483,181 | | | | 105,701 | | | | 3,497,234 | |
Institutional Class | | | 94,639 | | | | 3,065,617 | | | | 33,425 | | | | 1,106,808 | |
| | | | |
| | | | | | | 45,586,650 | | | | | | | | 16,537,619 | |
| | | | |
Payment for shares redeemed | | | | | | | | | | | | | | | | |
Class A | | | (2,768,227 | ) | | | (92,564,816 | ) | | | (2,943,621 | ) | | | (97,771,815 | ) |
Class C | | | (2,243,406 | ) | | | (45,218,687 | ) | | | (1,723,765 | ) | | | (34,885,653 | ) |
Administrator Class | | | (1,685,138 | ) | | | (56,224,079 | ) | | | (4,039,923 | ) | | | (133,486,696 | ) |
Institutional Class | | | (800,255 | ) | | | (26,710,901 | ) | | | (1,057,098 | ) | | | (35,104,912 | ) |
| | | | |
| | | | | | | (220,718,483 | ) | | | | | | | (301,249,076 | ) |
| | | | |
Net decrease in net assets resulting from capital share transactions | | | | | | | (249,164 | ) | | | | | | | (97,329,815 | ) |
| | | | |
Total increase in net assets | | | | | | | 20,462,025 | | | | | | | | 5,824,329 | |
| | | | |
| | | | |
Net assets | | | | | | | | | | | | | | | | |
Beginning of period | | | | | | | 1,310,985,094 | | | | | | | | 1,305,160,765 | |
| | | | |
End of period | | | | | | $ | 1,331,447,119 | | | | | | | $ | 1,310,985,094 | |
| | | | |
The accompanying notes are an integral part of these financial statements.
32 | Wells Fargo Index Asset Allocation Fund
Financial highlights
(For a share outstanding throughout each period)
| | | | | | | | | | | | | | | | | | | | |
| | | Year ended September 30 | |
| CLASS A | | 2019 | | | 2018 | | | 2017 | | | 2016 | | | 2015 | |
Net asset value, beginning of period | | | $34.63 | | | | $31.99 | | | | $29.61 | | | | $28.72 | | | | $28.20 | |
Net investment income | | | 0.33 | | | | 0.27 | | | | 0.25 | | | | 0.22 | | | | 0.27 | |
Net realized and unrealized gains (losses) on investments | | | 1.46 | | | | 2.83 | | | | 2.67 | | | | 2.45 | | | | 0.76 | |
| | | | | | | | | | | | | | | | | | | | |
Total from investment operations | | | 1.79 | | | | 3.10 | | | | 2.92 | | | | 2.67 | | | | 1.03 | |
Distributions to shareholders from | | | | | | | | | | | | | | | | | | | | |
Net investment income | | | (0.33 | ) | | | (0.27 | ) | | | (0.27 | ) | | | (0.21 | ) | | | (0.22 | ) |
Net realized gains | | | (0.96 | ) | | | (0.19 | ) | | | (0.27 | ) | | | (1.57 | ) | | | (0.29 | ) |
| | | | | | | | | | | | | | | | | | | | |
Total distributions to shareholders | | | (1.29 | ) | | | (0.46 | ) | | | (0.54 | ) | | | (1.78 | ) | | | (0.51 | ) |
Net asset value, end of period | | | $35.13 | | | | $34.63 | | | | $31.99 | | | | $29.61 | | | | $28.72 | |
Total return1 | | | 5.54 | % | | | 9.76 | % | | | 9.99 | % | | | 9.68 | % | | | 3.62 | % |
Ratios to average net assets (annualized) | | | | | | | | | | | | | | | | | | | | |
Gross expenses | | | 1.11 | % | | | 1.08 | % | | | 1.09 | % | | | 1.10 | % | | | 1.22 | % |
Net expenses | | | 1.08 | % | | | 1.07 | % | | | 1.09 | % | | | 1.10 | % | | | 1.15 | % |
Net investment income | | | 0.99 | % | | | 0.80 | % | | | 0.79 | % | | | 0.79 | % | | | 0.90 | % |
Supplemental data | | | | | | | | | | | | | | | | | | | | |
Portfolio turnover rate | | | 14 | % | | | 9 | % | | | 9 | % | | | 8 | % | | | 43 | % |
Net assets, end of period (000s omitted) | | | $834,289 | | | | $830,487 | | | | $822,769 | | | | $828,421 | | | | $736,276 | |
| 1 | Total return calculations do not include any sales charges. |
The accompanying notes are an integral part of these financial statements.
Wells Fargo Index Asset Allocation Fund | 33
Financial highlights
(For a share outstanding throughout each period)
| | | | | | | | | | | | | | | | | | | | |
| | | Year ended September 30 | |
| CLASS C | | 2019 | | | 2018 | | | 2017 | | | 2016 | | | 2015 | |
Net asset value, beginning of period | | | $21.07 | | | | $19.45 | | | | $17.99 | | | | $17.47 | | | | $17.20 | |
Net investment income | | | 0.05 | | | | 0.01 | | | | 0.01 | | | | 0.01 | 1 | | | 0.05 | |
Net realized and unrealized gains (losses) on investments | | | 0.88 | | | | 1.73 | | | | 1.62 | | | | 1.48 | | | | 0.45 | |
| | | | | | | | | | | | | | | | | | | | |
Total from investment operations | | | 0.93 | | | | 1.74 | | | | 1.63 | | | | 1.49 | | | | 0.50 | |
Distributions to shareholders from | | | | | | | | | | | | | | | | | | | | |
Net investment income | | | (0.06 | ) | | | (0.00 | )2 | | | (0.01 | ) | | | (0.02 | ) | | | (0.05 | ) |
Net realized gains | | | (0.58 | ) | | | (0.12 | ) | | | (0.16 | ) | | | (0.95 | ) | | | (0.18 | ) |
| | | | | | | | | | | | | | | | | | | | |
Total distributions to shareholders | | | (0.64 | ) | | | (0.12 | ) | | | (0.17 | ) | | | (0.97 | ) | | | (0.23 | ) |
Net asset value, end of period | | | $21.36 | | | | $21.07 | | | | $19.45 | | | | $17.99 | | | | $17.47 | |
Total return3 | | | 4.75 | % | | | 8.97 | % | | | 9.14 | % | | | 8.86 | % | | | 2.86 | % |
Ratios to average net assets (annualized) | | | | | | | | | | | | | | | | | | | | |
Gross expenses | | | 1.86 | % | | | 1.83 | % | | | 1.84 | % | | | 1.85 | % | | | 1.98 | % |
Net expenses | | | 1.83 | % | | | 1.82 | % | | | 1.84 | % | | | 1.85 | % | | | 1.90 | % |
Net investment income | | | 0.24 | % | | | 0.05 | % | | | 0.04 | % | | | 0.03 | % | | | 0.10 | % |
Supplemental data | | | | | | | | | | | | | | | | | | | | |
Portfolio turnover rate | | | 14 | % | | | 9 | % | | | 9 | % | | | 8 | % | | | 43 | % |
Net assets, end of period (000s omitted) | | | $144,264 | | | | $153,322 | | | | $152,820 | | | | $136,881 | | | | $62,019 | |
| 1 | Calculated based upon average shares outstanding |
| 2 | Amount is less than $0.005. |
| 3 | Total return calculations do not include any sales charges. |
The accompanying notes are an integral part of these financial statements.
34 | Wells Fargo Index Asset Allocation Fund
Financial highlights
(For a share outstanding throughout each period)
| | | | | | | | | | | | | | | | | | | | |
| | | Year ended September 30 | |
| ADMINISTRATOR CLASS | | 2019 | | | 2018 | | | 2017 | | | 2016 | | | 2015 | |
Net asset value, beginning of period | | | $34.64 | | | | $31.99 | | | | $29.63 | | | | $28.75 | | | | $28.21 | |
Net investment income | | | 0.39 | | | | 0.32 | | | | 0.30 | | | | 0.28 | | | | 0.35 | |
Net realized and unrealized gains (losses) on investments | | | 1.46 | | | | 2.84 | | | | 2.68 | | | | 2.45 | | | | 0.76 | |
| | | | | | | | | | | | | | | | | | | | |
Total from investment operations | | | 1.85 | | | | 3.16 | | | | 2.98 | | | | 2.73 | | | | 1.11 | |
Distributions to shareholders from | | | | | | | | | | | | | | | | | | | | |
Net investment income | | | (0.39 | ) | | | (0.32 | ) | | | (0.35 | ) | | | (0.28 | ) | | | (0.28 | ) |
Net realized gains | | | (0.96 | ) | | | (0.19 | ) | | | (0.27 | ) | | | (1.57 | ) | | | (0.29 | ) |
| | | | | | | | | | | | | | | | | | | | |
Total distributions to shareholders | | | (1.35 | ) | | | (0.51 | ) | | | (0.62 | ) | | | (1.85 | ) | | | (0.57 | ) |
Net asset value, end of period | | | $35.14 | | | | $34.64 | | | | $31.99 | | | | $29.63 | | | | $28.75 | |
Total return | | | 5.73 | % | | | 9.94 | % | | | 10.20 | % | | | 9.91 | % | | | 3.89 | % |
Ratios to average net assets (annualized) | | | | | | | | | | | | | | | | | | | | |
Gross expenses | | | 1.03 | % | | | 1.00 | % | | | 0.99 | % | | | 1.02 | % | | | 1.09 | % |
Net expenses | | | 0.90 | % | | | 0.90 | % | | | 0.90 | % | | | 0.90 | % | | | 0.90 | % |
Net investment income | | | 1.17 | % | | | 0.97 | % | | | 0.96 | % | | | 0.98 | % | | | 1.12 | % |
Supplemental data | | | | | | | | | | | | | | | | | | | | |
Portfolio turnover rate | | | 14 | % | | | 9 | % | | | 9 | % | | | 8 | % | | | 43 | % |
Net assets, end of period (000s omitted) | | | $229,390 | | | | $216,611 | | | | $268,512 | | | | $206,908 | | | | $85,380 | |
The accompanying notes are an integral part of these financial statements.
Wells Fargo Index Asset Allocation Fund | 35
Financial highlights
(For a share outstanding throughout each period)
| | | | | | | | | | | | |
| | | Year ended September 30 | |
| INSTITUTIONAL CLASS | | 2019 | | | 2018 | | | 20171 | |
Net asset value, beginning of period | | | $34.59 | | | | $31.96 | | | | $29.27 | |
Net investment income | | | 0.44 | | | | 0.39 | | | | 0.35 | |
Net realized and unrealized gains (losses) on investments | | | 1.46 | | | | 2.81 | | | | 3.03 | |
| | | | | | | | | | | | |
Total from investment operations | | | 1.90 | | | | 3.20 | | | | 3.38 | |
Distributions to shareholders from | | | | | | | | | | | | |
Net investment income | | | (0.44 | ) | | | (0.38 | ) | | | (0.42 | ) |
Net realized gains | | | (0.96 | ) | | | (0.19 | ) | | | (0.27 | ) |
| | | | | | | | | | | | |
Total distributions to shareholders | | | (1.40 | ) | | | (0.57 | ) | | | (0.69 | ) |
Net asset value, end of period | | | $35.09 | | | | $34.59 | | | | $31.96 | |
Total return2 | | | 5.89 | % | | | 10.11 | % | | | 11.70 | % |
Ratios to average net assets (annualized) | | | | | | | | | | | | |
Gross expenses | | | 0.78 | % | | | 0.75 | % | | | 0.74 | % |
Net expenses | | | 0.75 | % | | | 0.74 | % | | | 0.74 | % |
Net investment income | | | 1.32 | % | | | 1.13 | % | | | 1.08 | % |
Supplemental data | | | | | | | | | | | | |
Portfolio turnover rate | | | 14 | % | | | 9 | % | | | 9 | % |
Net assets, end of period (000s omitted) | | | $123,504 | | | | $110,566 | | | | $61,060 | |
| 1 | For the period from October 31, 2016 (commencement of class operations) to September 30, 2017 |
| 2 | Returns for periods of less than one year are not annualized. |
The accompanying notes are an integral part of these financial statements.
36 | Wells Fargo Index Asset Allocation Fund
Notes to financial statements
1. ORGANIZATION
Wells Fargo Funds Trust (the “Trust”), a Delaware statutory trust organized on March 10, 1999, is anopen-end management investment company registered under the Investment Company Act of 1940, as amended (the “1940 Act”). As an investment company, the Trust follows the accounting and reporting guidance in Financial Accounting Standards Board (“FASB”)Accounting Standards Codification Topic 946, Financial Services – Investment Companies. These financial statements report on the Wells Fargo Index Asset Allocation Fund (the “Fund”) which is a diversified series of the Trust.
2. SIGNIFICANT ACCOUNTING POLICIES
The following significant accounting policies, which are consistently followed in the preparation of the financial statements of the Fund, are in conformity with U.S. generally accepted accounting principles which require management to make estimates and assumptions that affect the reported amounts of assets and liabilities, disclosure of contingent assets and liabilities at the date of the financial statements, and the reported amounts of revenues and expenses during the reporting period. Actual results could differ from those estimates.
Securities valuation
All investments are valued each business day as of the close of regular trading on the New York Stock Exchange (generally 4 p.m. Eastern Time), although the Fund may deviate from this calculation time under unusual or unexpected circumstances.
Equity securities and futures contracts that are listed on a foreign or domestic exchange or market are valued at the official closing price or, if none, the last sales price. If no sale occurs on the principal exchange or market that day, a fair value price will be determined in accordance with the Fund’s Valuation Procedures.
Debt securities are valued at the evaluated bid price provided by an independent pricing service (e.g. taking into account various factors, including yields, maturities, or credit ratings) or, if a reliable price is not available, the quoted bid price from an independent broker-dealer.
Investments in registeredopen-end investment companies are valued at net asset value. Interests innon-registered investment companies that are redeemable at net asset value are fair valued normally at net asset value.
Investments which are not valued using any of the methods discussed above are valued at their fair value, as determined in good faith by the Board of Trustees of the Fund. The Board of Trustees has established a Valuation Committee comprised of the Trustees and has delegated to it the authority to take any actions regarding the valuation of portfolio securities that the Valuation Committee deems necessary or appropriate, including determining the fair value of portfolio securities, unless the determination has been delegated to the Wells Fargo Asset Management Pricing Committee at Wells Fargo Funds Management, LLC (“Funds Management”). The Board of Trustees retains the authority to make or ratify any valuation decisions or approve any changes to the Valuation Procedures as it deems appropriate. On a quarterly basis, the Board of Trustees receives reports on any valuation actions taken by the Valuation Committee or the Wells Fargo Asset Management Pricing Committee which may include items for ratification.
Securities lending
The Fund may lend its securities from time to time in order to earn additional income in the form of fees or interest on securities received as collateral or the investment of any cash received as collateral. When securities are on loan, the Fund receives interest or dividends on those securities. Cash collateral received in connection with its securities lending transactions is invested in Securities Lending Cash Investments, LLC (the “Securities Lending Fund”). Investments in Securities Lending Fund are valued at the evaluated bid price provided by an independent pricing service. Income earned from investment in the Securities Lending Fund (net of fees and rebates), if any, is included in income from affiliated securities on the Statement of Operations.
In a securities lending transaction, the net asset value of the Fund is affected by an increase or decrease in the value of the securities loaned and by an increase or decrease in the value of the instrument in which collateral is invested. The amount of securities lending activity undertaken by the Fund fluctuates from time to time. The Fund has the right under the lending agreement to recover the securities from the borrower on demand. In the event of default or bankruptcy by the borrower, the Fund may be prevented from recovering the loaned securities or gaining access to the collateral or may experience delays or costs in doing so. In such an event, the terms of the agreement allows the unaffiliated securities lending agent to use the collateral to purchase replacement securities on behalf of the Fund or pay the Fund the market value of the loaned securities. The Fund bears the risk of loss with respect to depreciation of its investment of the cash collateral.
Wells Fargo Index Asset Allocation Fund | 37
Notes to financial statements
Futures contracts
Futures contracts are agreements between the Fund and a counterparty to buy or sell a specific amount of a commodity, financial instrument or currency at a specified price and on a specified date. The Fund may buy and sell futures contracts in order to gain exposure to, or protect against, changes in interest rates and security values and is subject to interest rate risk and equity price risk. The primary risks associated with the use of futures contracts are the imperfect correlation between changes in market values of securities held by the Fund and the prices of futures contracts, and the possibility of an illiquid market. Futures contracts are generally entered into on a regulated futures exchange and cleared through a clearinghouse associated with the exchange. With futures contracts, there is minimal counterparty risk to the Fund since futures contracts are exchange traded and the exchange’s clearinghouse, as the counterparty to all exchange traded futures, guarantees the futures contracts against default.
Upon entering into a futures contracts, the Fund is required to deposit either cash or securities (initial margin) with the broker in an amount equal to a certain percentage of the contract value. Subsequent payments (variation margin) are paid to or from the broker each day equal to the daily changes in the contract value. Such payments are recorded as unrealized gains or losses and, if any, shown as variation margin receivable (payable) in the Statement of Assets and Liabilities. Should the Fund fail to make requested variation margin payments, the broker can gain access to the initial margin to satisfy the Fund’s payment obligations. When the contracts are closed, a realized gain or loss is recorded in the Statement of Operations.
Security transactions and income recognition
Securities transactions are recorded on a trade date basis. Realized gains or losses are recorded on the basis of identified cost.
Dividend income is recognized on theex-dividend date.
Interest income is accrued daily and bond discounts are accreted and premiums are amortized daily. To the extent debt obligations are placed onnon-accrual status, any related interest income may be reduced by writing off interest receivables when the collection of all or a portion of interest has been determined to be doubtful based on consistently applied procedures and the fair value has decreased. If the issuer subsequently resumes interest payments or when the collectability of interest is reasonably assured, the debt obligation is removed fromnon-accrual status.
Distributions to shareholders
Distributions to shareholders are recorded on theex-dividend date and paid from net investment income quarterly and any net realized gains are paid at least annually. Such distributions are determined in accordance with income tax regulations and may differ from U.S. generally accepted accounting principles. Dividend sources are estimated at the time of declaration. The tax character of distributions is determined as of the Fund’s fiscal year end. Therefore, a portion of the Fund’s distributions made prior to the Fund’s fiscal year end may be categorized as a tax return of capital at year end.
Federal and other taxes
The Fund intends to continue to qualify as a regulated investment company by distributing substantially all of its investment company taxable income and any net realized capital gains (after reduction for capital loss carryforwards) sufficient to relieve it from all, or substantially all, federal income taxes. Accordingly, no provision for federal income taxes was required.
The Fund’s income and federal excise tax returns and all financial records supporting those returns for the prior three fiscal years are subject to examination by the federal and Delaware revenue authorities. Management has analyzed the Fund’s tax positions taken on federal, state, and foreign tax returns for all open tax years and does not believe that there are any uncertain tax positions that require recognition of a tax liability.
As of September 30, 2019, the aggregate cost of all investments for federal income tax purposes was $870,064,436 and the unrealized gains (losses) consisted of:
| | | | |
| |
Gross unrealized gains | | $ | 474,432,962 | |
| |
Gross unrealized losses | | | (15,563,661 | ) |
| |
Net unrealized gains | | $ | 458,869,301 | |
Class allocations
The separate classes of shares offered by the Fund differ principally in applicable sales charges, distribution, shareholder servicing, and administration fees. Class specific expenses are charged directly to that share class. Investment income, common fund-level expenses, and realized and unrealized gains (losses) on investments are allocated daily to each class of shares based on the relative proportion of net assets of each class.
38 | Wells Fargo Index Asset Allocation Fund
Notes to financial statements
3. FAIR VALUATION MEASUREMENTS
Fair value measurements of investments are determined within a framework that has established a fair value hierarchy based upon the various data inputs utilized in determining the value of the Fund’s investments. The three-level hierarchy gives the highest priority to unadjusted quoted prices in active markets for identical assets or liabilities (Level 1) and the lowest priority to unobservable inputs (Level 3). The Fund’s investments are classified within the fair value hierarchy based on the lowest level of input that is significant to the fair value measurement. The inputs are summarized into three broad levels as follows:
| ∎ | | Level 1 – quoted prices in active markets for identical securities |
| ∎ | | Level 2 – other significant observable inputs (including quoted prices for similar securities, interest rates, prepayment speeds, credit risk, etc.) |
| ∎ | | Level 3 – significant unobservable inputs (including the Fund’s own assumptions in determining the fair value of investments) |
The inputs or methodologies used for valuing investments in securities are not necessarily an indication of the risk associated with investing in those securities.
The following is a summary of the inputs used in valuing the Fund’s assets and liabilities as of September 30, 2019:
| | | | | | | | | | | | | | | | |
| | | | |
| | | Quoted prices
(Level 1) | | | Other significant
observable inputs
(Level 2) | | | Significant
unobservable inputs
(Level 3) | | | Total | |
| | | | |
Assets | | | | | | | | | | | | | | | | |
Investments in: | | | | | | | | | | | | | | | | |
| | | | |
Agency securities | | $ | 0 | | | $ | 41,766 | | | $ | 0 | | | $ | 41,766 | |
| | | | |
Common stocks | | | | | | | | | | | | | | | | |
| | | | |
Communication services | | | 82,690,701 | | | | 0 | | | | 0 | | | | 82,690,701 | |
| | | | |
Consumer discretionary | | | 80,689,814 | | | | 0 | | | | 0 | | | | 80,689,814 | |
| | | | |
Consumer staples | | | 60,633,188 | | | | 0 | | | | 0 | | | | 60,633,188 | |
| | | | |
Energy | | | 36,008,298 | | | | 0 | | | | 0 | | | | 36,008,298 | |
| | | | |
Financials | | | 103,271,630 | | | | 0 | | | | 0 | | | | 103,271,630 | |
| | | | |
Health care | | | 108,962,726 | | | | 0 | | | | 0 | | | | 108,962,726 | |
| | | | |
Industrials | | | 74,577,518 | | | | 0 | | | | 0 | | | | 74,577,518 | |
| | | | |
Information technology | | | 175,039,545 | | | | 0 | | | | 0 | | | | 175,039,545 | |
| | | | |
Materials | | | 21,755,356 | | | | | | | | | | | | 21,755,356 | |
| | | | |
Real estate | | | 25,703,838 | | | | 0 | | | | 0 | | | | 25,703,838 | |
| | | | |
Utilities | | | 28,648,109 | | | | 0 | | | | 0 | | | | 28,648,109 | |
| | | | |
Non-agency mortgage-backed securities | | | 0 | | | | 6,973 | | | | 0 | | | | 6,973 | |
| | | | |
U.S. Treasury securities | | | 514,862,094 | | | | 0 | | | | 0 | | | | 514,862,094 | |
| | | | |
Short-term investments | | | | | | | | | | | | | | | | |
| | | | |
Investment companies | | | 13,144,904 | | | | 0 | | | | 0 | | | | 13,144,904 | |
| | | | |
U.S. Treasury securities | | | 3,930,047 | | | | 0 | | | | | | | | 3,930,047 | |
| | | | |
| | | 1,329,917,768 | | | | 48,739 | | | | 0 | | | | 1,329,966,507 | |
| | | | |
Futures contracts | | | 366,891 | | | | 0 | | | | 0 | | | | 366,891 | |
| | | | |
Total assets | | $ | 1,330,284,659 | | | $ | 48,739 | | | $ | 0 | | | $ | 1,330,333,398 | |
| | | | |
Liabilities | | | | | | | | | | | | | | | | |
| | | | |
Futures contracts | | $ | 1,399,661 | | | $ | 0 | | | $ | 0 | | | $ | 1,399,661 | |
| | | | |
Total liabilities | | $ | 1,399,661 | | | $ | 0 | | | $ | 0 | | | $ | 1,399,661 | |
Additional sector, industry or geographic detail is included in the Portfolio of Investments.
Futures contracts are reported at their cumulative unrealized gains (losses) at measurement date as reported in the table following the Portfolio of Investments. For futures contracts, the current day’s variation margin is reported on the Statement of Assets and Liabilities. All other assets and liabilities are reported at their market value at measurement date.
For the year ended September 30, 2019, the Fund did not have any transfers into/out of Level 3.
Wells Fargo Index Asset Allocation Fund | 39
Notes to financial statements
4. TRANSACTIONS WITH AFFILIATES
Management fee
Funds Management, an indirect wholly owned subsidiary of Wells Fargo & Company (“Wells Fargo”), is the manager of the Fund and provides advisory and fund-level administrative services under an investment management agreement. Under the investment management agreement, Funds Management is responsible for, among other services, implementing the investment objectives and strategies of the Fund, supervising the subadviser and providing fund-level administrative services in connection with the Fund’s operations. As compensation for its services under the investment management agreement, Funds Management is entitled to receive a management fee at the following annual rate based on the Fund’s average daily net assets:
| | |
| |
| Average daily net assets | | Management fee |
| |
First $500 million | | 0.650% |
| |
Next $500 million | | 0.600 |
| |
Next $2 billion | | 0.550 |
| |
Next $2 billion | | 0.525 |
| |
Next $5 billion | | 0.490 |
| |
Over $10 billion | | 0.480 |
For the year ended September 30, 2019, the management fee was equivalent to an annual rate of 0.61% of the Fund’s average daily net assets.
Funds Management has retained the services of a subadviser to provide daily portfolio management to the Fund. The fee for subadvisory services is borne by Funds Management. Wells Capital Management Incorporated (“WellsCap”), an affiliate of Funds Management and an indirect wholly owned subsidiary of Wells Fargo, is the subadviser to the Fund and is entitled to receive a fee from Funds Management at an annual rate starting at 0.15% and declining to 0.10% as the average daily net assets of the Fund increase.
Administration fees
Under a class-level administration agreement, Funds Management provides class-level administrative services to the Fund, which includes paying fees and expenses for services provided by the transfer agent,sub-transfer agents, omnibus account servicers and record-keepers. As compensation for its services under the class-level administration agreement, Funds Management receives an annual fee which is calculated based on the average daily net assets of each class as follows:
| | | | |
| |
| | | Class-level
administration fee | |
| |
Class A, Class C | | | 0.21 | % |
| |
Administrator Class, Institutional Class | | | 0.13 | |
Waivers and/or expense reimbursements
Funds Management has contractually waived and/or reimbursed management and administration fees to the extent necessary to maintain certain net operating expense ratios for the Fund. When each class of the Fund has exceeded its expense cap, Funds Management has waived fees and/or reimbursed expenses from fund-level expenses on a proportionate basis and then from class specific expenses. When only certain classes exceed their expense caps, waivers and/or reimbursements are applied against class specific expenses before fund-level expenses. Funds Management has committed through January 31, 2020 to waive fees and/or reimburse expenses to the extent necessary to cap the Fund’s expenses at 1.08% for Class A shares, 1.83% for Class C shares, 0.90% for Administrator Class shares and 0.75% for Institutional Class shares. Prior to or after the commitment expiration date, the cap may be increased or the commitment to maintain the cap may be terminated only with the approval of the Board of Trustees.
Distribution fee
The Trust has adopted a distribution plan for Class C shares of the Fund pursuant to Rule12b-1 under the 1940 Act. A distribution fee is charged to Class C shares and paid to Wells Fargo Funds Distributor, LLC (“Funds Distributor”), the principal underwriter, at an annual rate of 0.75% of the average daily net assets of Class C shares.
In addition, Funds Distributor is entitled to receive thefront-end sales charge from the purchase of Class A shares and a contingent deferred sales charge on the redemption of certain Class A shares. Funds Distributor is also entitled to receive the contingent deferred sales charges from redemptions of Class C shares. For the year ended September 30, 2019, Funds
40 | Wells Fargo Index Asset Allocation Fund
Notes to financial statements
Distributor received $53,209 from the sale of Class A shares and $130 in contingent deferred sales charges from redemptions of Class C shares. No contingent deferred sales charges were incurred by Class A shares for the year ended September 30, 2019.
Shareholder servicing fees
The Trust has entered into contracts with one or more shareholder servicing agents, whereby Class A, Class C, and Administrator Class of the Fund are charged a fee at an annual rate of 0.25% of the average daily net assets of each respective class. A portion of these total shareholder servicing fees were paid to affiliates of Wells Fargo.
Interfund transactions
The Fund may purchase or sell portfolio investment securities to certain other Wells Fargo affiliates pursuant to Rule17a-7 under the 1940 Act and under procedures adopted by the Board of Trustees. The procedures have been designed to ensure that these interfund transactions, which do not incur broker commissions, are effected at current market prices.
5. INVESTMENT PORTFOLIO TRANSACTIONS
Purchases and sales of investments, excluding short-term securities, for the year ended September 30, 2019 were as follows:
| | | | | | |
Purchases at cost | | Sales proceeds |
U.S.
government | | Non-U.S.
government | | U.S.
government | | Non-U.S.
government |
| $115,117,268 | | $63,469,384 | | $131,144,931 | | $73,834,176 |
6. SECURITIES LENDING TRANSACTIONS
The Fund lends its securities through an unaffiliated securities lending agent and receives collateral in the form of cash or securities with a value at least equal to the value of the securities on loan. The value of the loaned securities is determined at the close of each business day and any increases or decreases in the required collateral are exchanged between the Fund and the counterparty on the next business day. Cash collateral received is invested in the Securities Lending Fund which seeks to provide a positive return compared to the daily Fed Funds Open Rate by investing in high-quality, U.S. dollar-denominated short-term money market instruments and is exempt from registration under Section 3(c)(7) of the 1940 Act. Securities Lending Fund is managed by Funds Management and is subadvised by WellsCap. Funds Management receives an advisory fee starting at 0.05% and declining to 0.01% as the average daily net assets of the Securities Lending Fund increase. All of the fees received by Funds Management are paid to WellsCap for its services as subadviser.
In the event of counterparty default or the failure of a borrower to return a loaned security, the Fund has the right to use the collateral to offset any losses incurred. As of September 30, 2019, the Fund had securities lending transactions with the following counterparties which are subject to offset:
| | | | | | | | | | | | |
| | | |
| Counterparty | | Value of
securities on
loan | | | Collateral
received1 | | | Net amount | |
| | | |
Credit Suisse Securities (USA) LLC | | $ | 107,744 | | | $ | (107,744 | ) | | $ | 0 | |
| | | |
JPMorgan Securities LLC | | | 602,803 | | | | (602,803 | ) | | | 0 | |
| | | |
Morgan Stanley & Co. LLC | | | 101,088 | | | | (101,088 | ) | | | 0 | |
| 1 | Collateral received within this table is limited to the collateral for the net transaction with the counterparty. |
7. DERIVATIVE TRANSACTIONS
During the year ended September 30, 2019, the Fund entered into futures contracts to manage the duration of the portfolio and to gain market exposure to certain asset classes by implementing tactical asset allocation shifts. The Fund had an average notional amount of $66,079,518 in long futures contracts and $34,813,911 in short futures contracts during the year ended September 30, 2019.
A summary of the location of derivative instruments on the financial statements by primary risk exposure is outlined following tables.
Wells Fargo Index Asset Allocation Fund | 41
Notes to financial statements
The fair value of derivative instruments as of September 30, 2019 by risk type was as follows for the Fund:
| | | | | | | | | | | | |
| | | Asset derivatives | | | Liability derivatives | |
| | | | |
| | | Statement of Assets and
Liabilities location | | Fair value | | | Statement of Assets and
Liabilities location | | Fair value | |
| | | | |
Equity risk | | Unrealized gains on futures contracts | | $ | 359,280 | * | | Unrealized losses on futures contracts | | $ | 0 | * |
| | | | |
Interest rate risk | | Unrealized gains on futures contracts | | | 7,611 | * | | Unrealized losses on futures contracts | | | 1,399,661 | * |
| | | | |
| | | | | $ | 366,891 | | | | | $ | 1,399,661 | |
| * | Amount represents cumulative unrealized gains (losses) as reported in the table following the Portfolio of Investments. Only the current day’s variation margin as of September 30, 2019 is reported separately on the Statement of Assets and Liabilities. |
The effect of derivative instruments on the Statement of Operations for the year ended September 30, 2019 was as follows for the Fund:
| | | | | | | | |
| | |
| | | Amount of realized
losses on
derivatives | | | Change in unrealized
gains (losses) on
derivatives | |
| | |
Equity risk | | $ | (303,323 | ) | | $ | 228,311 | |
| | |
Interest rate risk | | | (1,590,796 | ) | | | (1,942,509 | ) |
| | |
| | | $ | (1,894,119 | ) | | $ | (1,714,198 | ) |
8. BANK BORROWINGS
The Trust (excluding the money market funds), Wells Fargo Master Trust and Wells Fargo Variable Trust are parties to a $280,000,000 revolving credit agreement whereby the Fund is permitted to use bank borrowings for temporary or emergency purposes, such as to fund shareholder redemption requests. Interest under the credit agreement is charged to the Fund based on a borrowing rate equal to the higher of the Federal Funds rate in effect on that day plus 1.25% or the overnight LIBOR rate in effect on that day plus 1.25%. In addition, an annual commitment fee equal to 0.25% of the unused balance is allocated to each participating fund.
For the year ended September 30, 2019, there were no borrowings by the Fund under the agreement.
9. DISTRIBUTIONS TO SHAREHOLDERS
The tax character of distributions paid during the years ended September 30, 2019 and September 30, 2018 were as follows:
| | | | | | | | |
| | | Year ended September 30 | |
| | |
| | | 2019 | | | 2018 | |
| | |
Ordinary income | | $ | 16,601,787 | | | $ | 12,497,380 | |
| | |
Long-term capital gain | | | 31,862,151 | | | | 5,013,473 | |
As of September 30, 2019, the components of distributable earnings on a tax basis were as follows:
| | | | |
Undistributed
ordinary
income | | Undistributed
long-term
gain | | Unrealized
gains |
| | |
| $1,827,431 | | $13,210,979 | | $458,869,301 |
10. INDEMNIFICATION
Under the Trust’s organizational documents, the officers and Trustees have been granted certain indemnification rights against certain liabilities that may arise out of performance of their duties to the Trust. Additionally, in the normal course of business, the Trust may enter into contracts with service providers that contain a variety of indemnification clauses. The Trust’s maximum exposure under these arrangements is dependent on future claims that may be made against the Fund and, therefore, cannot be estimated.
42 | Wells Fargo Index Asset Allocation Fund
Notes to financial statements
11. NEW ACCOUNTING PRONOUNCEMENTS
In August 2018, FASB issued Accounting Standards Update (“ASU”)No. 2018-13, Fair Value Measurement (Topic 820)Disclosure Framework—Changes to the Disclosure Requirements for Fair Value Measurement. ASU2018-13 updates the disclosure requirements for fair value measurements by modifying or removing certain disclosures and adding certain new disclosures. The amendments are effective for fiscal years, and interim periods within those fiscal years, beginning after December 15, 2019. Early adoption is permitted. Management has adopted the removal and modification of disclosures early, as permitted, and will adopt the additional new disclosures at the effective date.
In March 2017, FASB issued ASUNo. 2017-08,Premium Amortization on Purchased Callable Debt Securities. ASU2017-08 shortens the amortization period for certain callable debt securities held at a premium and requires the premium to be amortized to the earliest call date. The amendments do not require an accounting change for securities held at a discount and discounts will continue to be accreted to the maturity date of the security. ASU2017-08 is effective for fiscal years beginning after December 15, 2018 and for interim periods within those fiscal years. During the current reporting period, management of the Fund adopted the change in accounting policy which did not have a material impact to the Fund’s financial statements.
Wells Fargo Index Asset Allocation Fund | 43
Report of independent registered public accounting firm
TO THE SHAREHOLDERS OF THE FUND AND BOARD OF TRUSTEES OF WELLS FARGO FUNDS TRUST:
Opinion on the Financial Statements
We have audited the accompanying statement of assets and liabilities of Wells Fargo Index Asset Allocation Fund (the Fund), one of the funds constituting Wells Fargo Funds Trust, including the portfolio of investments, as of September 30, 2019, the related statement of operations for the year then ended, the statements of changes in net assets for each of the years in the two-year period then ended, and the related notes (collectively, the financial statements) and the financial highlights for each of the years or periods in the five-year period then ended. In our opinion, the financial statements and financial highlights present fairly, in all material respects, the financial position of the Fund as of September 30, 2019, the results of its operations for the year then ended, the changes in its net assets for each of the years in the two-year period then ended, and the financial highlights for each of the years or periods in the five-year period then ended, in conformity with U.S. generally accepted accounting principles.
Basis for Opinion
These financial statements and financial highlights are the responsibility of the Fund’s management. Our responsibility is to express an opinion on these financial statements and financial highlights based on our audits. We are a public accounting firm registered with the Public Company Accounting Oversight Board (United States) (PCAOB) and are required to be independent with respect to the Fund in accordance with the U.S. federal securities laws and the applicable rules and regulations of the Securities and Exchange Commission and the PCAOB.
We conducted our audits in accordance with the standards of the PCAOB. Those standards require that we plan and perform the audit to obtain reasonable assurance about whether the financial statements and financial highlights are free of material misstatement, whether due to error or fraud. Our audits included performing procedures to assess the risks of material misstatement of the financial statements and financial highlights, whether due to error or fraud, and performing procedures that respond to those risks. Such procedures included examining, on a test basis, evidence regarding the amounts and disclosures in the financial statements and financial highlights. Such procedures also included confirmation of securities owned as of September 30, 2019, by correspondence with the custodian, transfer agent and brokers, or by other appropriate auditing procedures. Our audits also included evaluating the accounting principles used and significant estimates made by management, as well as evaluating the overall presentation of the financial statements and financial highlights. We believe that our audits provide a reasonable basis for our opinion.

We have not been able to determine the specific year that we began serving as the auditor of one or more Wells Fargo Funds investment companies; however we are aware that we have served as the auditor of one or more Wells Fargo Funds investment companies since at least 1955.
Boston, Massachusetts
November 25, 2019
44 | Wells Fargo Index Asset Allocation Fund
Other information (unaudited)
TAX INFORMATION
For corporate shareholders, pursuant to Section 854 of the Internal Revenue Code, 98.92% of ordinary income dividends qualify for the corporate dividends-received deduction for the fiscal year ended September 30, 2019.
Pursuant to Section 852 of the Internal Revenue Code, $31,862,151 was designated as a 20% rate gain distribution for the fiscal year ended September 30, 2019.
Pursuant to Section 854 of the Internal Revenue Code, $16,601,787 of income dividends paid during the fiscal year ended September 30, 2019 has been designated as qualified dividend income (QDI).
For the fiscal year ended September 30, 2019, $5,158,895 has been designated as interest-related dividends for nonresident alien shareholders pursuant to Section 871 of the Internal Revenue Code.
For the fiscal year ended September 30, 2019, $4,106,372 has been designated as short-term capital gain dividends for nonresident alien shareholders pursuant to Section 871 of the Internal Revenue Code.
For the fiscal year ended September 30, 2019, 96.85% of the ordinary income distributed was derived from interest on U.S. government securities.
PROXY VOTING INFORMATION
A description of the policies and procedures used to determine how to vote proxies relating to portfolio securities is available, upon request, by calling1-800-222-8222, visiting our website atwfam.com, or visiting the SEC website at sec.gov. Information regarding how the proxies related to portfolio securities were voted during the most recent12-month period ended June 30 is available on the website atwfam.comor by visiting the SEC website at sec.gov.
QUARTERLY PORTFOLIO HOLDINGS INFORMATION
The Fund files its complete schedule of portfolio holdings with the SEC for the first and third quarters of each fiscal year on Form N-Q or FormN-PORT, which is available by visiting the SEC website at sec.gov. Those forms may be reviewed and copied at the SEC’s Public Reference Room in Washington, DC. Information on the operation of the Public Reference Room may be obtained by calling1-800-SEC-0330.
Wells Fargo Index Asset Allocation Fund | 45
Other information (unaudited)
BOARD OF TRUSTEES AND OFFICERS
Each of the Trustees and Officers1 listed in the table below acts in identical capacities for each fund in the Wells Fargo family of funds, which consists of 150 mutual funds comprising the Wells Fargo Funds Trust, Wells Fargo Variable Trust, Wells Fargo Master Trust and fourclosed-end funds (collectively the “Fund Complex”). This table should be read in conjunction with the Prospectus and the Statement of Additional Information2. The mailing address of each Trustee and Officer is 525 Market Street, 12th Floor, San Francisco, CA 94105. Each Trustee and Officer serves an indefinite term, however, each Trustee serves such term until reaching the mandatory retirement age established by the Trustees.
Independent Trustees
| | | | | | |
Name and year of birth | | Position held and
length of service* | | Principal occupations during past five years or longer | | Current other
public company or
investment
company
directorships |
| | | |
| William R. Ebsworth (Born 1957) | | Trustee, since 2015 | | Retired. From 1984 to 2013, equities analyst, portfolio manager, research director and chief investment officer at Fidelity Management and Research Company in Boston, Tokyo, and Hong Kong, and retired in 2013 as Chief Investment Officer of Fidelity Strategic Advisers, Inc. where he led a team of investment professionals managing client assets. Prior thereto, Board member of Hong Kong Securities Clearing Co., Hong Kong Options Clearing Corp., the Thailand International Fund, Ltd., Fidelity Investments Life Insurance Company, and Empire Fidelity Investments Life Insurance Company. Audit Committee Chair and Investment Committee Chair of the Vincent Memorial Hospital Endowment(non-profit organization). Mr. Ebsworth is a CFA® charterholder. | | N/A |
| | | |
| Jane A. Freeman (Born 1953) | | Trustee, since 2015; Chair Liaison, since 2018 | | Retired. From 2012 to 2014 and 1999 to 2008, Chief Financial Officer of Scientific Learning Corporation. From 2008 to 2012, Ms. Freeman provided consulting services related to strategic business projects. Prior to 1999, Portfolio Manager at Rockefeller & Co. and Scudder, Stevens & Clark. Board member of the Harding Loevner Funds from 1996 to 2014, serving as both Lead Independent Director and chair of the Audit Committee. Board member of the Russell Exchange Traded Funds Trust from 2011 to 2012 and the chair of the Audit Committee. Ms. Freeman is a Board Member of The Ruth Bancroft Garden(non-profit organization). She is also an inactive Chartered Financial Analyst. | | N/A |
| | | |
| Isaiah Harris, Jr. (Born 1952) | | Trustee, since 2009; Audit Committee Chairman, since 2019 | | Retired. Chairman of the Board of CIGNA Corporation since 2009, and Director since 2005. From 2003 to 2011, Director of Deluxe Corporation. Prior thereto, President and CEO of BellSouth Advertising and Publishing Corp. from 2005 to 2007, President and CEO of BellSouth Enterprises from 2004 to 2005 and President of BellSouth Consumer Services from 2000 to 2003. Emeritus member of the Iowa State University Foundation Board of Governors. Emeritus Member of the Advisory Board of Iowa State University School of Business. Advisory Board Member, Palm Harbor Academy (private school). Advisory Board Member, Child Evangelism Fellowship(non-profit). Mr. Harris is a certified public accountant (inactive status). | | CIGNA Corporation |
| | | |
| Judith M. Johnson (Born 1949) | | Trustee, since 2008; Audit Committee Chairman, from 2009 to 2018 | | Retired. Prior thereto, Chief Executive Officer and Chief Investment Officer of Minneapolis Employees Retirement Fund from 1996 to 2008. Ms. Johnson is an attorney, certified public accountant and a certified managerial accountant. | | N/A |
46 | Wells Fargo Index Asset Allocation Fund
Other information (unaudited)
| | | | | | |
Name and year of birth | | Position held and
length of service* | | Principal occupations during past five years or longer | | Current other
public company or
investment
company
directorships |
| | | |
| David F. Larcker (Born 1950) | | Trustee, since 2009 | | James Irvin Miller Professor of Accounting at the Graduate School of Business, Stanford University, Director of the Corporate Governance Research Initiative and Senior Faculty of The Rock Center for Corporate Governance since 2006. From 2005 to 2008, Professor of Accounting at the Graduate School of Business, Stanford University. Prior thereto, Ernst & Young Professor of Accounting at The Wharton School, University of Pennsylvania from 1985 to 2005. | | N/A |
| | | |
| Olivia S. Mitchell (Born 1953) | | Trustee, since 2006; Nominating and Governance Committee Chairman, since 2018 | | International Foundation of Employee Benefit Plans Professor, Wharton School of the University of Pennsylvania since 1993. Director of Wharton’s Pension Research Council and Boettner Center on Pensions & Retirement Research, and Research Associate at the National Bureau of Economic Research. Previously, Cornell University Professor from 1978 to 1993. | | N/A |
| | | |
| Timothy J. Penny (Born 1951) | | Trustee, since 1996; Chairman, since 2018 | | President and Chief Executive Officer of Southern Minnesota Initiative Foundation, anon-profit organization, since 2007. Member of the Board of Trustees of NorthStar Education Finance, Inc., anon-profit organization, since 2007. | | N/A |
| | | |
| James G. Polisson (Born 1959) | | Trustee, since 2018 | | Retired. Chief Marketing Officer, Source (ETF) UK Services, Ltd, from 2015 to 2017. From 2012 to 2015, Principal of The Polisson Group, LLC, a management consulting, corporate advisory and principal investing company. Chief Executive Officer and Managing Director at Russell Investments, Global Exchange Traded Funds from 2010 to 2012. Managing Director of Barclays Global Investors from 1998 to 2010 and Global Chief Marketing Officer for iShares and Barclays Global Investors from 2000 to 2010. Trustee of the San Francisco Mechanics’ Institute, anon-profit organization, from 2013 to 2015. Board member of the Russell Exchange Traded Fund Trust from 2011 to 2012. Director of Barclays Global Investors Holdings Deutschland GmbH from 2006 to 2009. Mr. Polisson is an attorney and has a retired status with the Massachusetts and District of Columbia Bar Associations. | | N/A |
| * | Length of service dates reflect the Trustee’s commencement of service with the Trust’s predecessor entities, where applicable. |
Wells Fargo Index Asset Allocation Fund | 47
Other information (unaudited)
Officers
| | | | |
Name and year of birth | | Position held and
length of service | | Principal occupations during past five years or longer |
| | |
| Andrew Owen (Born 1960) | | President, since 2017 | | Executive Vice President of Wells Fargo & Company and Head of Affiliated Managers, Wells Fargo Asset Management, since 2014. In addition, Mr. Owen is currently President, Chief Executive Officer and Director of Wells Fargo Funds Management, LLC since 2017. Prior thereto, Executive Vice President responsible for marketing, investments and product development for Wells Fargo Funds Management, LLC, from 2009 to 2014. |
| | |
| Jeremy DePalma1 (Born 1974) | | Treasurer, since 2012 | | Senior Vice President of Wells Fargo Funds Management, LLC since 2009. Senior Vice President of Evergreen Investment Management Company, LLC from 2008 to 2010 and head of the Fund Reporting and Control Team within Fund Administration from 2005 to 2010. |
| | |
| Michelle Rhee3 (Born 1966) | | Chief Legal Officer, since 2019 | | Secretary of Wells Fargo Funds Management, LLC, Chief Legal Counsel of Wells Fargo Asset Management and Assistant General Counsel of Wells Fargo Bank, N.A. since 2018. Associate General Counsel and Managing Director of Bank of America Corporation from 2004 to 2018. |
| | |
| Catherine Kennedy4 (Born 1969) | | Secretary, since 2019 | | Vice President of Wells Fargo Funds Management, LLC and Senior Counsel of the Wells Fargo Legal Department since 2010. Vice President and Senior Counsel of Evergreen Investment Management Company, LLC from 1998 to 2010. |
| | |
| Michael H. Whitaker(Born 1967) | | Chief Compliance Officer, since 2016 | | Chief Compliance Officer of Wells Fargo Asset Management since 2016. Senior Vice President and Chief Compliance Officer for Fidelity Investments from 2007 to 2016. |
| | |
| David Berardi (Born 1975) | | Assistant Treasurer, since 2009 | | Vice President of Wells Fargo Funds Management, LLC since 2009. Vice President of Evergreen Investment Management Company, LLC from 2008 to 2010. Manager of Fund Reporting and Control for Evergreen Investment Management Company, LLC from 2004 to 2010. |
| 1 | Jeremy DePalma acts as Treasurer of 86 funds and Assistant Treasurer of 64 funds in the Fund Complex. |
| 2 | The Statement of Additional Information includes additional information about the Trustees and is available, without charge, upon request, by calling1-800-222-8222 or by visiting the website atwfam.com. |
| 3 | Michelle Rhee became Chief Legal Officer effective October 22, 2019. |
| 4 | Catherine Kennedy became Secretary effective October 22, 2019. |
48 | Wells Fargo Index Asset Allocation Fund
Other information (unaudited)
BOARD CONSIDERATION OF INVESTMENT MANAGEMENT ANDSUB-ADVISORY AGREEMENTS:
Wells Fargo Index Asset Allocation Fund
Under the Investment Company Act of 1940 (the “1940 Act”), the Board of Trustees (the “Board”) of Wells Fargo Funds Trust (the “Trust”) must determine annually whether to approve the continuation of the Trust’s investment management andsub-advisory agreements. In this regard, at anin-person meeting held on May21-22, 2019 (the “Meeting”), the Board, all the members of which have no direct or indirect interest in the investment management andsub-advisory agreements and are not “interested persons” of the Trust, as defined in the 1940 Act (the “Independent Trustees”), reviewed and approved for Wells Fargo Index Asset Allocation Fund(the “Fund”): (i) an investment management agreement (the “Management Agreement”) with Wells Fargo Funds Management, LLC (“Funds Management”); and (ii) an investmentsub-advisory agreement (the“Sub-Advisory Agreement”) with Wells Capital Management Incorporated (the“Sub-Adviser”), an affiliate of Funds Management. The Management Agreement and theSub-Advisory Agreement are collectively referred to as the “Advisory Agreements.”
At the Meeting, the Board considered the factors and reached the conclusions described below relating to the selection of Funds Management and theSub-Adviser and the approval of the Advisory Agreements. Prior to the Meeting, including at anin-person meeting in April 2019, the Trustees conferred extensively among themselves and with representatives of Funds Management about these matters. Also, the Board has adopted a team-based approach, with each team consisting of asub-set of Trustees, to assist the full Board in the discharge of its duties in reviewing investment performance and other matters throughout the year. The Independent Trustees were assisted in their evaluation of the Advisory Agreements by independent legal counsel, from whom they received separate legal advice and with whom they met separately.
In providing information to the Board, Funds Management and theSub-Adviser were guided by a detailed set of requests for information submitted to them by independent legal counsel on behalf of the Independent Trustees at the start of the Board’s annual contract renewal process earlier in 2019. In considering and approving the Advisory Agreements, the Trustees considered the information they believed relevant, including but not limited to the information discussed below. The Board considered not only the specific information presented in connection with the Meeting, but also the knowledge gained over time through interaction with Funds Management and theSub-Adviser about various topics. In this regard, the Board reviewed reports of Funds Management at each of its quarterly meetings, which included, among other things, portfolio reviews and investment performance reports. In addition, the Board and the teams mentioned above confer with portfolio managers at various times throughout the year. The Board did not identify any particular information or consideration that wasall-important or controlling, and each individual Trustee may have attributed different weights to various factors.
After its deliberations, the Board unanimously approved the continuation of the Advisory Agreements for aone-year term and determined that the compensation payable to Funds Management and theSub-Adviser under each of the Advisory Agreements was reasonable. The Board considered the approval of the Advisory Agreements for the Fund as part of its consideration of agreements for funds across the complex, but its approvals were made on afund-by-fund basis. The following summarizes a number of important, but not necessarily all, factors considered by the Board in support of its approvals.
Nature, extent and quality of services
The Board received and considered various information regarding the nature, extent and quality of services provided to the Fund by Funds Management and theSub-Adviser under the Advisory Agreements. This information included a description of the investment advisory services and Fund-level administrative services covered by the Management Agreement, as well as, among other things, a summary of the background and experience of senior management of Wells Fargo Asset Management (“WFAM”), of which Funds Management and theSub-Adviser are a part, a summary of investments made in the business of WFAM, a summary of certain organizational and personnel changes involving Funds Management and theSub-Adviser, and a description of Funds Management’s and theSub-Adviser’s business continuity planning programs and of their approaches to data privacy and cybersecurity. The Board received and reviewed information about Funds Management’s role as administrator of the Fund’s liquidity risk management program. The Board also considered the qualifications, background, tenure and responsibilities of each of the portfolio managers primarily responsible for theday-to-day portfolio management of the Fund.
The Board evaluated the ability of Funds Management and theSub-Adviser to attract and retain qualified investment professionals, including research, advisory and supervisory personnel. The Board further considered the compliance programs and compliance records of Funds Management and theSub-Adviser. In addition, the Board took into account the full range of services provided to the Fund by Funds Management and its affiliates.
Wells Fargo Index Asset Allocation Fund | 49
Other information (unaudited)
Fund investment performance and expenses
The Board considered the investment performance results for the Fund over various time periods ended December 31, 2018. The Board considered these results in comparison to the investment performance of funds in a universe that was determined by Broadridge Inc. (“Broadridge”) to be similar to the Fund (the “Universe”), and in comparison to the Fund’s benchmark index and to other comparative data. Broadridge is an independent provider of investment company data. The Board received a description of the methodology used by Broadridge to select the mutual funds in the performance Universe. The Board noted that the investment performance of the Fund (Administrator Class) was higher than the average investment performance of the Universe for all periods under review. The Board also noted that the investment performance of the Fund was lower than its benchmark index, the Index Asset Allocation Blended Index, for theone-, three- and five-year periods under review, but higher than its benchmark for theten-year period under review.
The Board also received and considered information regarding the Fund’s net operating expense ratios and their various components, including actual management fees, custodian and othernon-management fees, and Rule12b-1 andnon-Rule12b-1 shareholder service fees. The Board considered these ratios in comparison to the median ratios of funds in class-specific expense groups that were determined by Broadridge to be similar to the Fund (the “Groups”). The Board received a description of the methodology used by Broadridge to select the mutual funds in the expense Groups and an explanation of how funds comprising expense groups and their expense ratios may vary fromyear-to-year. Based on the Broadridge reports, the Board noted that the net operating expense ratios of the Fund were lower than or equal to the median net operating expense ratios of the expense Groups for each share class.
The Board took into account the Fund’s investment performance and expense information provided to it among the factors considered in deciding tore-approve the Advisory Agreements.
Investment management andsub-advisory fee rates
The Board reviewed and considered the contractual fee rates payable by the Fund to Funds Management under the Management Agreement, as well as the contractual fee rates payable by the Fund to Funds Management for class-level administrative services under a Class-Level Administration Agreement, which include, among other things, class-level transfer agency andsub-transfer agency costs (collectively, the “Management Rates”). The Board also reviewed and considered the contractual investmentsub-advisory fee rates that are payable by Funds Management to theSub-Adviser for investmentsub-advisory services.
Among other information reviewed by the Board was a comparison of the Fund’s Management Rates with the average contractual investment management fee rates of funds in the expense Groups at a common asset level as well as transfer agency costs of the funds in the expense Groups. The Board noted that the Management Rates of the Fund were lower than or in range of the sum of these average rates for the Fund’s expense Groups for all share classes.
The Board also received and considered information about the portion of the total management fee that was retained by Funds Management after payment of the fee to theSub-Adviser forsub-advisory services. In assessing the reasonableness of this amount, the Board received and evaluated information about the nature and extent of responsibilities retained and risks assumed by Funds Management and not delegated to or assumed by theSub-Adviser, and about Funds Management’son-going oversight services. Given the affiliation between Funds Management and theSub-Adviser, the Board ascribed limited relevance to the allocation of fees between them.
The Board also received and considered information about the nature and extent of services offered and fee rates charged by Funds Management and theSub-Adviser to other types of clients with investment strategies similar to those of the Fund. In this regard, the Board received information about the significantly greater scope of services, and compliance, reporting and other legal burdens and risks of managing proprietary mutual funds compared with those associated with managing assets of other types of clients, including third-partysub-advised fund clients andnon-mutual fund clients such as institutional separate accounts.
Based on its consideration of the factors and information it deemed relevant, including those described here, the Board determined that the compensation payable to Funds Management under the Management Agreement and to theSub-Adviser under theSub-Advisory Agreement was reasonable.
Profitability
The Board received and considered information concerning the profitability of Funds Management, as well as the profitability of both WFAM and Wells Fargo & Co. (“Wells Fargo”) from providing services to the fund family as a whole. The Board noted that theSub-Adviser’s profitability information with respect to providing services to the Fund and other funds in the family was subsumed in the WFAM and Wells Fargo profitability analysis.
50 | Wells Fargo Index Asset Allocation Fund
Other information (unaudited)
Funds Management reported on the methodologies and estimates used in calculating profitability, including a description of the methodology used to allocate certain expenses. Among other things, the Board noted that the levels of profitability reported on afund-by-fund basis varied widely, depending on factors such as the size, type and age of fund. Based on its review, the Board did not deem the profits reported by Funds Management, WFAM or Wells Fargo from services provided to the Fund to be at a level that would prevent it from approving the continuation of the Advisory Agreements.
Economies of scale
The Board received and considered information about the potential for Funds Management to experience economies of scale in the provision of management services to the Fund, the difficulties of calculating economies of scale at an individual fund level, and the extent to which potential scale benefits are shared with shareholders. The Board noted the existence of breakpoints in the Fund’s management fee structure, which operate generally to reduce the Fund’s expense ratios as the Fund grows in size. The Board considered that in addition to management fee breakpoints, Funds Management shares potential economies of scale from its management business in a variety of ways, including through fee waiver and expense reimbursement arrangements, services that benefit shareholders, competitive management fee rates set at the outset without regard to breakpoints, and investments in the business intended to enhance services available to shareholders.
The Board concluded that Funds Management’s arrangements with respect to the Fund, including contractual breakpoints, constituted a reasonable approach to sharing potential economies of scale with the Fund and its shareholders.
Other benefits to Funds Management and theSub-Adviser
The Board received and considered information regarding potential“fall-out” or ancillary benefits received by Funds Management and its affiliates, including theSub-Adviser, as a result of their relationships with the Fund. Ancillary benefits could include, among others, benefits directly attributable to other relationships with the Fund and benefits potentially derived from an increase in Funds Management’s and theSub-Adviser’s business as a result of their relationships with the Fund. The Board noted that various affiliates of Funds Management may receive distribution-related fees, shareholder servicing payments andsub-transfer agency fees in respect of shares sold or held through them and services provided.
The Board also reviewed information about soft dollar credits earned and utilized by theSub-Adviser, fees earned by Funds Management and theSub-Adviser from managing a private investment vehicle for the fund family’s securities lending collateral, and commissions earned by an affiliated broker from portfolio transactions.
Based on its consideration of the factors and information it deemed relevant, including those described here, the Board did not find that any ancillary benefits received by Funds Management and its affiliates, including theSub-Adviser, were unreasonable.
Conclusion
At the Meeting, after considering the above-described factors and based on its deliberations and its evaluation of the information described above, the Board unanimously approved the continuation of the Advisory Agreements for aone-year term and determined that the compensation payable to Funds Management and theSub-Adviser under each of the Advisory Agreements was reasonable.
Wells Fargo Index Asset Allocation Fund | 51
This page is intentionally left blank.

For more information
More information about Wells Fargo Funds is available free upon request. To obtain literature, please write, visit the Fund’s website, or call:
Wells Fargo Funds
P.O. Box 219967
Kansas City, MO 64121-9967
Website:wfam.com
Individual investors:1-800-222-8222
Retail investment professionals:1-888-877-9275
Institutional investment professionals:1-866-765-0778

This report and the financial statements contained herein are submitted for the general information of the shareholders of the Fund. If this report is used for promotional purposes, distribution of the report must be accompanied or preceded by a current prospectus. Before investing, please consider the investment objectives, risks, charges, and expenses of the investment. For a current prospectus and, if available, a summary prospectus, containing this information, call1-800-222-8222 or visit the Fund’s website atwfam.com. Read the prospectus carefully before you invest or send money.
Wells Fargo Asset Management (WFAM) is the trade name for certain investment advisory/management firms owned by Wells Fargo & Company. These firms include but are not limited to Wells Capital Management Incorporated and Wells Fargo Funds Management, LLC. Certain products managed by WFAM entities are distributed by Wells Fargo Funds Distributor, LLC (a broker-dealer and Member FINRA).
This material is for general informational and educational purposes only and is NOT intended to provide investment advice or a recommendation of any kind—including a recommendation for any specific investment, strategy, or plan.
INVESTMENT PRODUCTS: NOT FDIC INSURED ◾ NO BANK GUARANTEE ◾ MAY LOSE VALUE
© 2019 Wells Fargo & Company. All rights reserved.
406807 11-19
A227/AR227 09-19
Annual Report
September 30, 2019
Wells Fargo International Bond Fund
Beginning on January 1, 2021, as permitted by new regulations adopted by the Securities and Exchange Commission, paper copies of the Wells Fargo Funds’ annual and semi-annual shareholder reports issued after this date will no longer be sent by mail, unless you specifically request paper copies of the reports. Instead, the reports will be made available on the Funds’ website, and you will be notified by mail each time a report is posted and provided with a website address to access the report.
If you already elected to receive shareholder reports electronically, you will not be affected by this change and you need not take any action. You may elect to receive shareholder reports and other communications from the Fund electronically at any time by contacting your financial intermediary (such as a broker-dealer or bank) or, if you are a direct investor, by calling1-800-222-8222 or by enrolling at wellsfargo.com/advantagedelivery.
You may elect to receive all future reports in paper free of charge. If you invest through a financial intermediary, you can contact your financial intermediary to request that you continue to receive paper copies of your shareholder reports; if you invest directly with the Fund, you can call 1-800-222-8222. Your election to receive reports in paper will apply to all Wells Fargo Funds held in your account with your financial intermediary or, if you are a direct investor, to all Wells Fargo Funds that you hold.
|
|
|
Reduce clutter. Save trees. |
Sign up for electronic delivery of prospectuses and shareholder reports at wellsfargo.com/ advantagedelivery |
The views expressed and any forward-looking statements are as of September 30, 2019, unless otherwise noted, and are those of the Fund managers and/or Wells Fargo Asset Management. Discussions of individual securities, or the markets generally, or any Wells Fargo Fund are not intended as individual recommendations. Future events or results may vary significantly from those expressed in any forward-looking statements. The views expressed are subject to change at any time in response to changing circumstances in the market. Wells Fargo Asset Management and the Fund disclaim any obligation to publicly update or revise any views expressed or forward-looking statements.
INVESTMENT PRODUCTS: NOT FDIC INSURED ◾ NO BANK GUARANTEE ◾ MAY LOSE VALUE
Wells Fargo International Bond Fund | 1
Letter to shareholders (unaudited)

Andrew Owen
President
Wells Fargo Funds
“December’s S&P 500 Index performance was the worst since 1931.”
Dear Shareholder:
We are pleased to offer you this annual report for the Wells Fargo International Bond Fund for the12-month period that ended September 30, 2019. After the first half of the period yielded eitherlow-single-digit or negative investment returns, U.S. stock and global bond investors generally saw markets recover during the second half amid intensifying market volatility, global economic growth concerns, international trade stare downs, and simmering geopolitical tensions.
Overall, fixed-income investors enjoyed a distinct advantage over stock investors. For the period, U.S. stocks, based on the S&P 500 Index,1 gained 4.25% and international stocks, as measured by the MSCI ACWI ex USA Index (Net),2 fell 1.23%. The MSCI EM Index (Net)3 slipped 2.02%. Among fixed income investors, the Bloomberg Barclays U.S. Aggregate Bond Index4 added 10.30%, the Bloomberg Barclays Global Aggregateex-USD Index5 added 5.34%, the Bloomberg Barclays Municipal Bond Index6 gained 8.55%, and the ICE BofAML U.S. High Yield Index7 added 6.30%.
Investors confronted unsettling events during the fourth quarter of 2018.
During the fourth quarter of 2018, investors grew concerned about the pace and sustainability of the global economic expansion. The U.S. Bureau of Economic Analysis reported third-quarter U.S. gross domestic product (GDP) was 3.4% on an annualized basis, which was down from the second-quarter rate. A partial U.S. government shutdown occurred, which extended into January 2019. Brexit efforts stalled, causing uncertainty for the eurozone. The value of the renminbi declined even as the People’s Bank of China cut reserve requirement ratios, accelerated infrastructure spending, and cut taxes in efforts to spur economic activity.
The combination of news in the U.S. and generally weak economic indicators outside of the U.S. caused investors to seek safe havens. December’s S&P 500 Index performance was the worst since 1931. Globally, fixed-income investments fared better than stocks during the last two months of the year. Even as indicators suggested growth was restrained, the U.S. Federal Reserve (Fed) increased the federal funds rate by 25 basis points (bps; 100 bps equal 1.00%) in December 2018 to a target range of between 2.25% and 2.50%. Many observers expressed concerns that higher rates could slow the economy further.
| 1 | The S&P 500 Index consists of 500 stocks chosen for market size, liquidity, and industry group representation. It is a market-value-weighted index with each stock’s weight in the index proportionate to its market value. You cannot invest directly in an index. |
| 2 | The Morgan Stanley Capital International (MSCI) All Country World Index (ACWI) ex USA Index (Net) is a free-float-adjustedmarket-capitalization weighted index that is designed to measure the equity market performance of developed and emerging markets, excluding the U.S. Source: MSCI. MSCI makes no express or implied warranties or representations and shall have no liability whatsoever with respect to any MSCI data contained herein. The MSCI data may not be further redistributed or used as a basis for other indices or any securities or financial products. This report is not approved, reviewed, or produced by MSCI. You cannot invest directly in an index. |
| 3 | The MSCI Emerging Markets (EM) Index (Net) is a free-float-adjusted market-capitalization-weighted index that is designed to measure the equity market performance of emerging markets. You cannot invest directly in an index. |
| 4 | The Bloomberg Barclays U.S. Aggregate Bond Index is a broad-based benchmark that measures the investment-grade, U.S.dollar-denominated, fixed-rate taxable bond market, including Treasuries, government-related and corporate securities, mortgage-backed securities (agency fixed-rate and hybrid adjustable-rate mortgage pass-throughs), asset-backed securities, and commercialmortgage-backed securities. You cannot invest directly in an index. |
| 5 | The Bloomberg Barclays Global Aggregateex-USD Index is an unmanaged index that provides a broad-based measure of the global investment-grade fixed-income markets excluding the U.S. dollar-denominated debt market. You cannot invest directly in an index. |
| 6 | The Bloomberg Barclays Municipal Bond Index is an unmanaged index composed of long-termtax-exempt bonds with a minimum credit rating of Baa. You cannot invest directly in an index. |
| 7 | The ICE BofAML U.S. High Yield Index is a market-capitalization-weighted index of domestic and Yankee high-yield bonds. The index tracks the performance of high-yield securities traded in the U.S. bond market. You cannot invest directly in an index. Copyright 2019. ICE Data Indices, LLC. All rights reserved. |
2 | Wells Fargo International Bond Fund
Letter to shareholders (unaudited)
The market climbs a wall of worry.
Investment returns early in 2019 appeared to reaffirm the adage that markets climb a wall of worry as the new year began. The S&P 500 Index gained 8.01% for the month of January, the best monthly performance in 30 years. Returns for the MSCI ACWI ex USA Index (Net), the Bloomberg Barclays U.S. Aggregate Bond Index, and the Bloomberg Barclays Global Aggregateex-USD Index also were positive.
In February 2019, signs of slowing global growth grew more ominous. The Bureau of Economic Analysis announced fourth-quarter 2018 GDP grew at an annualized 2.2% rate, a slower rate than reported for the prior two quarters. In a February report, the Bank of England forecast the slowest growth for 2019 since the financial crisis. China and the U.S. continued to wrangle over trade issues. By the end of the first quarter of 2019, more accommodative Fed sentiment and steady, if not spectacular, U.S. economic and business metrics encouraged domestic investors.
Early second-quarter 2019 enthusiasm among investors faded.
During April 2019, favorable sentiment found additional support in reports of sustained low inflation, solid employment data, and first-quarter U.S. GDP of an annualized rate of 3.2%. During May, markets tumbled on mixed investment signals. In the U.S., partisan wrangling ramped up as Democrats and Republicans set their sights on 2020 presidential politics. The U.K.’s Brexit disagreements caused Prime Minister Theresa May to resign. Boris Johnson succeeded her only to exacerbate uncertainty about Brexit’s resolution ahead of an October 2019 deadline. The European Commission downgraded the 2019 growth forecast to 1.2%. The U.S. increased tariffs on products from China, China responded, and then talks broke down. President Donald Trump threatened to turn his foreign policy tariff tool to Mexico over immigration issues.
During the third quarter of 2019, investors regrouped. Just as the investment horizon appeared to darken, sentiment turned and U.S. equity markets gained during June and July. The gains, primarily driven by geopolitical and monetary policy events, pushed equity markets to new highs. European Central Bank President Mario Draghi said that if the outlook doesn’t improve, the bank would cut rates or buy more assets to prop up inflation. President Trump backed off of tariff threats against Mexico and China. In the U.S., the Fed implemented a 0.25% federal funds rate cut in July.
Later in July 2019, the U.S. reversed course and threatened to impose higher tariffs on China’s exports after talks failed. China responded with tariff threats of its own and devalued the renminbi, a move that roiled global markets. Major U.S. stock market indices closed July with the worst weekly results of the year. Bond prices gained as Treasury yields fell to levels not seen since November 2016 and the yield curve inverted at multiple points along the30-year arc.
In a microcosm, August 2019 encapsulated many of the unnerving events that plagued investors during the prior 11 months. The U.S.-China trade relationship swung from antagonistic to hopeful and back again with no evident compromise on the horizon. Evidence of a continued global economic slowdown mounted. Central banks in China, New Zealand, and Thailand cut interest rates. Industrial and manufacturing data declined in China, Canada, Japan, and Germany. Adding to the uncertain environment, Italy’s prime minister resigned, many feared a crackdown in Hong Kong as protesters sustained their calls for reform throughout the month, and Boris Johnson planned to suspend Parliament as Brexit’s deadline neared.
In the U.S., September saw the Fed join other central banks in cutting interest rates. Manufacturing data in the U.S., as reported by the Institute for Supply Management, disappointed investors. The U.S. Congress announced it would pursue an impeachment investigation of President Trump. Meanwhile, the Brexit impasse showed no signs of
“The S&P 500 Index gained 8.01% for the month of January, the best monthly performance in 30 years.”
Wells Fargo International Bond Fund | 3
Letter to shareholders (unaudited)
|
|
|
For further information about your Fund, contact your investment professional, visit our website at wfam.com, or call us directly at1-800-222-8222. |
resolution. Officials in China said that hitting the country’s economic growth goals for the year would be difficult considering the weight of tariffs and trade restrictions. So while the S&P 500 Index finished the third quarter withyear-to-date returns that were the best in more than 20 years, amid signs of equity investors taking money out of the stock market, concerns about future returns remained.
Don’t let short-term uncertainty derail long-term investment goals.
Periods of investment uncertainty can present challenges, but experience has taught us that maintaining long-term investment goals can be an effective way to plan for the future. To help you create a sound strategy based on your personal goals and risk tolerance, Wells Fargo Funds offers more than 100 mutual funds spanning a wide range of asset classes and investment styles. Although diversification cannot guarantee an investment profit or prevent losses, we believe it can be an effective way to manage investment risk and potentially smooth out overall portfolio performance. We encourage investors to know their investments and to understand that appropriate levels of risk-taking may potentially unlock opportunities.
Thank you for choosing to invest with Wells Fargo Funds. We appreciate your confidence in us and remain committed to helping you meet your financial needs.
Sincerely,

Andrew Owen
President
Wells Fargo Funds
4 | Wells Fargo International Bond Fund
This page is intentionally left blank.
Performance highlights (unaudited)
Investment objective
The Fund seeks total return, consisting of income and capital appreciation.
Manager
Wells Fargo Funds Management, LLC
Subadviser
Wells Fargo Asset Management (International) Limited
Portfolio managers
Michael Lee
Alex Perrin
Lauren van Biljon, CFA®‡
Peter Wilson
Average annual total returns (%) as of September 30, 20191
| | | | | | | | | | | | | | | | | | | | | | | | | | | | | | | | | | |
| | | | |
| | | | | Including sales charge | | | Excluding sales charge | | | Expense ratios2 (%) | |
| | | | | | | | | |
| | | Inception date | | 1 year | | | 5 year | | | 10 year | | | 1 year | | | 5 year | | | 10 year | | | Gross | | | Net3 | |
| | | | | | | | | | |
| Class A (ESIYX) | | 9-30-2003 | | | 2.96 | | | | -1.11 | | | | 0.64 | | | | 7.84 | | | | -0.20 | | | | 1.10 | | | | 1.08 | | | | 1.03 | |
| | | | | | | | | | |
| Class C (ESIVX) | | 9-30-2003 | | | 6.08 | | | | -0.95 | | | | 0.34 | | | | 7.08 | | | | -0.95 | | | | 0.34 | | | | 1.83 | | | | 1.78 | |
| | | | | | | | | | |
| Class R6 (ESIRX)4 | | 11-30-2012 | | | – | | | | – | | | | – | | | | 8.32 | | | | 0.18 | | | | 1.47 | | | | 0.70 | | | | 0.65 | |
| | | | | | | | | | |
| Administrator Class (ESIDX)5 | | 7-30-2010 | | | – | | | | – | | | | – | | | | 8.00 | | | | -0.04 | | | | 1.27 | | | | 1.02 | | | | 0.85 | |
| | | | | | | | | | |
| Institutional Class (ESICX) | | 12-15-1993 | | | – | | | | – | | | | – | | | | 8.24 | | | | 0.12 | | | | 1.43 | | | | 0.75 | | | | 0.70 | |
| | | | | | | | | | |
| Bloomberg Barclays Global Aggregateex-USD Index6 | | – | | | – | | | | – | | | | – | | | | 5.34 | | | | 0.87 | | | | 1.27 | | | | – | | | | – | |
Figures quoted represent past performance, which is no guarantee of future results, and do not reflect taxes that a shareholder may pay on fund distributions or the redemption of fund shares. Investment return and principal value of an investment will fluctuate so that an investor’s shares, when redeemed, may be worth more or less than their original cost. Performance shown without sales charges would be lower if sales charges were reflected. Current performance may be lower or higher than the performance data quoted, which assumes the reinvestment of dividends and capital gains. Currentmonth-end performance is available on the Fund’s website,wfam.com.
Index returns do not include transaction costs associated with buying and selling securities, any mutual fund fees or expenses, or any taxes. It is not possible to invest directly in an index.
For Class A shares, the maximumfront-end sales charge is 4.50%. For Class C shares, the maximum contingent deferred sales charge is 1.00%. Performance including a contingent deferred sales charge assumes the sales charge for the corresponding time period. Class R6, Administrator Class, and Institutional Class shares are sold without afront-end sales charge or contingent deferred sales charge.
Bond values fluctuate in response to the financial condition of individual issuers, general market and economic conditions, and changes in interest rates. Changes in market conditions and government policies may lead to periods of heightened volatility in the bond market and reduced liquidity for certain bonds held by the Fund. In general, when interest rates rise, bond values fall and investors may lose principal value. Interest rate changes and their impact on the fund and its share price can be sudden and unpredictable. Foreign investments are especially volatile and can rise or fall dramatically due to differences in the political and economic conditions of the host country. These risks are generally intensified in emerging markets. The use of derivatives may reduce returns and/or increase volatility. Securities issued by U.S. government agencies or government-sponsored entities may not be guaranteed by the U.S. Treasury. Certain investment strategies tend to increase the total risk of an investment (relative to the broader market). The Fund is exposed to high-yield securities risk and geographic risk. Consult the Fund’s prospectus for additional information on these and other risks.
Please see footnotes on page 7.
6 | Wells Fargo International Bond Fund
Performance highlights (unaudited)
|
|
| Growth of $10,000 investment as of September 30, 20197 |
|
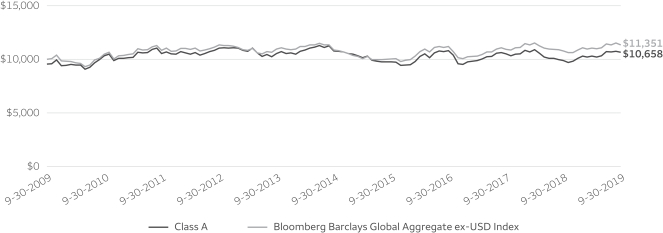
|
| ‡ | CFA® and Chartered Financial Analyst® are trademarks owned by CFA Institute. |
| 1 | Historical performance prior to July 12, 2010, is based on the performance of the Fund’s predecessor, Evergreen International Bond Fund. |
| 2 | Reflects the expense ratios as stated in the most recent prospectuses. The expense ratios shown are subject to change and may differ from the annualized expense ratios shown in the financial highlights of this report. |
| 3 | The manager has contractually committed through January 31, 2020, to waive fees and/or reimburse expenses to the extent necessary to cap the expenses of each class after fee waivers at the amounts shown. Brokerage commissions, stamp duty fees, interest, taxes, acquired fund fees and expenses (if any), and extraordinary expenses are excluded from the expense cap. Prior to or after the commitment expiration date, the cap may be increased or the commitment to maintain the cap may be terminated only with the approval of the Board of Trustees. Without this cap, the Fund’s returns would have been lower. The expense ratio paid by an investor is the net expense ratio (the total annual fund operating expenses after fee waivers) as stated in the prospectuses. |
| 4 | Historical performance shown for Class R6 shares prior to their inception reflects the performance of Institutional Class shares and includes the higher expenses applicable to Institutional Class shares. If these expenses had not been included, returns for Class R6 shares would be higher. |
| 5 | Historical performance shown for Administrator Class shares prior to their inception reflects the performance of Institutional Class shares and has been adjusted to reflect the higher expenses applicable to Administrator Class shares. |
| 6 | The Bloomberg Barclays Global Aggregateex-USD Index is an unmanaged index that provides a broad-based measure of the global investment grade fixed income markets excluding the U.S. dollar denominated debt market. You cannot invest directly in an index. |
| 7 | The chart compares the performance of Class A shares for the most recent ten years with the Bloomberg Barclays Global Aggregateex-USD Index. The chart assumes a hypothetical investment of $10,000 in Class A shares and reflects all operating expenses and assumes the maximum initial sales charge of 4.50%. |
| 8 | The ten largest holdings, excluding cash, cash equivalents and any money market funds, are calculated based on the value of the investments divided by total net assets of the Fund. Holdings are subject to change and may have changed since the date specified. |
| 9 | Amounts are calculated based on the total long-term investments of the Fund. These amounts are subject to change and may have changed since the date specified. |
Wells Fargo International Bond Fund | 7
Performance highlights (unaudited)
MANAGER’S DISCUSSION
Fund highlights
| ∎ | | The Fund outperformed its benchmark, the Bloomberg Barclays Global Aggregateex-USD Index, for the12-month period that ended September 30, 2019. |
| ∎ | | Country positioning was the mainvalue-add over the reporting period, led by an underweight to the Japanese interest rate environment and an overweight to Italy and the United States. Underweights to the euro and U.K. pound were positives. Duration positioning was a net contributor to performance. |
| ∎ | | Currency hedge costs detracted from performance, as did exposure to smaller currencies, including the Colombian peso, Norwegian krone, and Romanian leu. Underweights to the Spanish and U.K. bond markets weighed on relative results. |
What a difference a year can make.
The past 12 months spanned a pivotal time for the global economy, marking the move from cautious recovery to modest deterioration. This is reflected by the shift in U.S. monetary policy. The Federal Reserve (Fed) raised interest rates by 25 basis points (bps; 100 bps equal 1.00%) at its December 2018 meeting, and a scant seven months later, it moved to an easing bias. Concerns about global trade and supply chains have worked to keep investment spending low, and central bankers the world over are flagging downside economic risks. Manufacturing data has weakened, although services and household consumption has held up well. Bond yields have trended materially lower over the reporting period, which has worked to deliver strong returns. Core currencies have traded in tight ranges, with the Japanese yen and the U.S. dollar the best performers. For the most part, emerging market currencies have struggled.
| | | | |
|
| Ten largest holdings(%) as of September 30, 20198 | |
| | |
Italy Buoni Poliennali del Tesoro, 0.35%,2-1-2025 | | | 7.14 | |
| | |
Italy Buoni Poliennali del Tesoro, 3.00%,8-1-2029 | | | 5.80 | |
| | |
Japan, 0.10%,6-20-2029 | | | 5.41 | |
| | |
Poland, 2.50%,1-25-2023 | | | 4.84 | |
| | |
Mexico, 8.50%,5-31-2029 | | | 4.70 | |
| | |
Norway, 2.00%,4-26-2028 | | | 4.56 | |
| | |
Realkredit Danmark AS, 1.50%,10-1-2050 | | | 4.32 | |
| | |
Nykredit Realkredit AS, 1.50%,10-1-2050 | | | 3.64 | |
| | |
U.S. Treasury Note, 1.38%,8-31-2023 | | | 3.61 | |
| | |
Hungary, 1.50%,8-24-2022 | | | 2.82 | |
The Fund pared risk at a time of stress.
Global bond markets have traded with a remarkable degree of cohesion, with the general trend for lower yields boosting returns. Early in the reporting period, the Fund moved to overweight Italian government bonds. Positions in the domestic bonds of Australia, Canada, and New Zealand were trimmed after a period of strong gains in the second quarter of 2019. Exposure to Russia was added in the third quarter, while positions in Colombia, Malaysia, and India were reduced to zero. Towardperiod-end, a position in Japanese government bonds was funded by reducing core European exposure. The degree of active currency risk the Fund is running was reduced over the period. An underweight to the euro was used to fund exposure to a number of smaller currencies, but this was taken to neutral in the third quarter in response to a period of intense market stress.
|
|
| Portfolio composition as of September 30, 20199 |
|
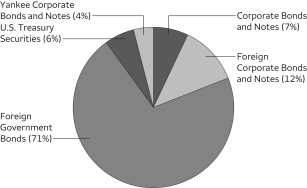 |
Country positioning was the key contributor to Fund performance. The Fund’s underweight to Japan and overweight to Italy and the U.S. added the most value, but exposure to Australia, Brazil, Mexico, and India were also good performers. Underweights to the euro and the U.K. pound were value-adds. Overweights to the New Zealand dollar, Brazilian real, and Indian rupee also added to performance. At the sector level, exposure to Danish mortgages, high-yield corporate bonds, and emerging market sovereigns all added value. Duration was a net positive, with positioning in the3- to10-year area of the curve adding the most value.
Please see footnotes on page 7.
8 | Wells Fargo International Bond Fund
Performance highlights (unaudited)
The most obvious drag on performance over the reporting period came from currency hedge costs. Underweights to the bond markets of Spain and the U.K. were modest negatives. Exposure to a number of smaller currencies was a negative, with positions in the Colombian peso, Norwegian krone, Romanian leu, and Mexican peso weighing on performance. At the sector level, positioning in investment-grade corporate bonds detracted. Positioning at the very long end of the curve—15 years and over—was also a modest negative.
Slowing growth and tepid inflation supports global fixed income.
Themes of slowing growth and tepid inflation remain firmly entrenched at the macro level, and this backdrop has proved highly beneficial for global fixed income. This is despite the lack of resolution to trade tensions between the U.S. and its trading partners, as well as the generally higher level of geopolitical risk. Increased accommodation from central banks has played a key role in the strong gains we’ve seen in fixed income and could continue to offer support in the quarters to come. Currency volatility could be on the verge of ticking higher, which suggests that higher hedge ratios could be valuable until the picture clears. The Fund benefited from its underweight to the bond markets of Japan and core Europe (particularly Germany and France) and overweight to higher-yielding developed and emerging markets. This tilt could continue to add value.
Wells Fargo International Bond Fund | 9
Fund expenses (unaudited)
As a shareholder of the Fund, you incur two types of costs: (1) transaction costs, including sales charges (loads) on purchase payments and contingent deferred sales charges (if any) on redemptions and (2) ongoing costs, including management fees, distribution(12b-1) and/or shareholder servicing fees, and other Fund expenses. This example is intended to help you understand your ongoing costs (in dollars) of investing in the Fund and to compare these costs with the ongoing costs of investing in other mutual funds.
The example is based on an investment of $1,000 invested at the beginning of thesix-month period and held for the entire period from April 1, 2019 to September 30, 2019.
Actual expenses
The “Actual” line of the table below provides information about actual account values and actual expenses. You may use the information in this line, together with the amount you invested, to estimate the expenses that you paid over the period. Simply divide your account value by $1,000 (for example, an $8,600 account value divided by $1,000 = 8.6), then multiply the result by the number in the “Actual” line under the heading entitled “Expenses paid during period” for your applicable class of shares to estimate the expenses you paid on your account during this period.
Hypothetical example for comparison purposes
The “Hypothetical” line of the table below provides information about hypothetical account values and hypothetical expenses based on the Fund’s actual expense ratio and an assumed rate of return of 5% per year before expenses, which is not the Fund’s actual return. The hypothetical account values and expenses may not be used to estimate the actual ending account balance or expenses you paid for the period. You may use this information to compare the ongoing costs of investing in the Fund and other funds. To do so, compare this 5% hypothetical example with the 5% hypothetical examples that appear in the shareholder reports of the other funds.
Please note that the expenses shown in the table are meant to highlight your ongoing costs only and do not reflect any transactional costs, such as sales charges (loads) and contingent deferred sales charges. Therefore, the “Hypothetical” line of the table is useful in comparing ongoing costs only and will not help you determine the relative total costs of owning different funds. In addition, if these transactional costs were included, your costs would have been higher.
| | | | | | | | | | | | | | | | |
| | | Beginning
account value
4-1-2019 | | | Ending
account value
9-30-2019 | | | Expenses
paid during
the period¹ | | | Annualized net
expense ratio | |
| | | | | |
Class A | | | | | | | | | | | | | | | | |
| | | | |
Actual | | $ | 1,000.00 | | | $ | 1,035.68 | | | $ | 5.27 | | | | 1.03 | % |
| | | | |
Hypothetical (5% return before expenses) | | $ | 1,000.00 | | | $ | 1,019.89 | | | $ | 5.23 | | | | 1.03 | % |
| | | | | |
Class C | | | | | | | | | | | | | | | | |
| | | | |
Actual | | $ | 1,000.00 | | | $ | 1,032.06 | | | $ | 9.09 | | | | 1.78 | % |
| | | | |
Hypothetical (5% return before expenses) | | $ | 1,000.00 | | | $ | 1,016.12 | | | $ | 9.02 | | | | 1.78 | % |
| | | | | |
Class R6 | | | | | | | | | | | | | | | | |
| | | | |
Actual | | $ | 1,000.00 | | | $ | 1,037.90 | | | $ | 3.33 | | | | 0.65 | % |
| | | | |
Hypothetical (5% return before expenses) | | $ | 1,000.00 | | | $ | 1,021.80 | | | $ | 3.30 | | | | 0.65 | % |
| | | | | |
Administrator Class | | | | | | | | | | | | | | | | |
| | | | |
Actual | | $ | 1,000.00 | | | $ | 1,036.42 | | | $ | 4.35 | | | | 0.85 | % |
| | | | |
Hypothetical (5% return before expenses) | | $ | 1,000.00 | | | $ | 1,020.80 | | | $ | 4.31 | | | | 0.85 | % |
| | | | | |
Institutional Class | | | | | | | | | | | | | | | | |
| | | | |
Actual | | $ | 1,000.00 | | | $ | 1,038.05 | | | $ | 3.58 | | | | 0.70 | % |
| | | | |
Hypothetical (5% return before expenses) | | $ | 1,000.00 | | | $ | 1,021.55 | | | $ | 3.55 | | | | 0.70 | % |
| 1 | Expenses paid is equal to the annualized net expense ratio of each class multiplied by the average account value over the period, multiplied by the number of days in the most recent fiscal half-year divided by the number of days in the fiscal year (to reflect theone-half-year period). |
10 | Wells Fargo International Bond Fund
Portfolio of investments—September 30, 2019
| | | | | | | | | | | | | | | | |
| | | Interest
rate | | | Maturity
date | | | Principal | | | Value | |
Corporate Bonds and Notes: 6.98% | | | | | | | | | | | | | | | | |
| | | | |
| United States: 6.98% | | | | | | | | | | | | |
Amazon.com Incorporated (Consumer Discretionary, Internet & Direct Marketing Retail) | | | 3.15 | % | | | 8-22-2027 | | | $ | 500,000 | | | $ | 531,398 | |
Anheuser-Busch InBev Worldwide Incorporated (Consumer Staples, Beverages) %% | | | 4.15 | | | | 1-23-2025 | | | | 400,000 | | | | 437,016 | |
Apple Incorporated (Information Technology, Technology Hardware, Storage & Peripherals) | | | 2.90 | | | | 9-12-2027 | | | | 500,000 | | | | 521,084 | |
AT&T Incorporated (Communication Services, Diversified Telecommunication Services) | | | 4.35 | | | | 3-1-2029 | | | | 250,000 | | | | 276,283 | |
Bank of America Corporation (3 Month LIBOR +1.21%) (Financials, Banks) ± | | | 3.97 | | | | 2-7-2030 | | | | 500,000 | | | | 547,377 | |
BP Capital Markets America Incorporated (Energy, Oil, Gas & Consumable Fuels) | | | 3.22 | | | | 4-14-2024 | | | | 425,000 | | | | 442,643 | |
Broadcom Incorporated (Information Technology, Semiconductors & Semiconductor Equipment) 144A | | | 4.25 | | | | 4-15-2026 | | | | 300,000 | | | | 309,935 | |
Campbell Soup Company (Consumer Staples, Food Products) | | | 3.65 | | | | 3-15-2023 | | | | 250,000 | | | | 260,088 | |
Comcast Corporation (Communication Services, Media) | | | 3.70 | | | | 4-15-2024 | | | | 400,000 | | | | 426,488 | |
CVS Health Corporation (Health Care, Health Care Providers & Services) | | | 4.10 | | | | 3-25-2025 | | | | 600,000 | | | | 640,677 | |
Discovery Communications LLC (Communication Services, Media) | | | 3.95 | | | | 3-20-2028 | | | | 300,000 | | | | 312,628 | |
Global Payments Incorporated (Information Technology, IT Services) | | | 3.20 | | | | 8-15-2029 | | | | 350,000 | | | | 354,507 | |
IBM Corporation (Information Technology, IT Services) | | | 3.30 | | | | 5-15-2026 | | | | 400,000 | | | | 422,126 | |
JPMorgan Chase & Company (Financials, Banks) | | | 3.30 | | | | 4-1-2026 | | | | 500,000 | | | | 523,764 | |
Mastercard Incorporated (Information Technology, IT Services) | | | 2.95 | | | | 6-1-2029 | | | | 400,000 | | | | 419,725 | |
Microsoft Corporation (Information Technology, Software) | | | 2.40 | | | | 8-8-2026 | | | | 500,000 | | | | 510,071 | |
Morgan Stanley (Financials, Capital Markets) | | | 3.88 | | | | 4-29-2024 | | | | 450,000 | | | | 478,773 | |
Verizon Communications Incorporated (Communication Services, Diversified Telecommunication Services) | | | 4.33 | | | | 9-21-2028 | | | | 250,000 | | | | 283,579 | |
Walmart Incorporated (Consumer Staples, Food & Staples Retailing) | | | 3.70 | | | | 6-26-2028 | | | | 500,000 | | | | 554,649 | |
| | | | |
Total Corporate Bonds and Notes (Cost $7,860,348) | | | | | | | | | | | | | | | 8,252,811 | |
| | | | | | | | | | | | | | | | |
| | | | |
Foreign Corporate Bonds and Notes: 12.20% | | | | | | | | | | | | | | | | |
| | | | |
| Denmark: 9.82% | | | | | | | | | | | | |
Nordea Kredit Realkredit AS (Financials, Thrifts & Mortgage Finance) | | | 1.50 | | | | 10-1-2050 | | | DKK | 14,704,303 | | | | 2,200,295 | |
Nykredit Realkredit AS (Financials, Thrifts & Mortgage Finance) | | | 1.50 | | | | 10-1-2050 | | | DKK | 28,786,127 | | | | 4,307,445 | |
Realkredit Danmark AS (Financials, Thrifts & Mortgage Finance) 144A | | | 1.50 | | | | 10-1-2050 | | | DKK | 34,111,690 | | | | 5,104,341 | |
| | | | |
| | | | | | | | | | | | | | | 11,612,081 | |
| | | | | | | | | | | | | | | | |
| | | | |
| Luxembourg: 0.26% | | | | | | | | | | | | |
LSF10 Wolverine Investment SCA (Financials, Diversified Financial Services) | | | 5.00 | | | | 3-15-2024 | | | EUR | 275,000 | | | | 307,158 | |
| | | | | | | | | | | | | | | | |
| | | | |
| Netherlands: 0.56% | | | | | | | | | | | | |
Selecta Group BV (Consumer Discretionary, Internet & Direct Marketing Retail) | | | 5.88 | | | | 2-1-2024 | | | EUR | 300,000 | | | | 339,299 | |
Sigma Holdco BV (Consumer Staples, Food Products) | | | 5.75 | | | | 5-15-2026 | | | EUR | 300,000 | | | | 323,257 | |
| | | | |
| | | | | | | | | | | | | | | 662,556 | |
| | | | | | | | | | | | | | | | |
| | | | |
| United Kingdom: 1.56% | | | | | | | | | | | | |
CPUK Finance Limited (Consumer Discretionary, Consumer Finance) | | | 4.25 | | | | 2-28-2047 | | | GBP | 250,000 | | | | 310,915 | |
Galaxy Bidco Limited (Financials, Insurance) 144A | | | 6.50 | | | | 7-31-2026 | | | GBP | 200,000 | | | | 246,362 | |
Ocado Group plc (Consumer Discretionary, Internet & Direct Marketing Retail) | | | 4.00 | | | | 6-15-2024 | | | GBP | 270,000 | | | | 343,116 | |
Pinewood Finance Company Limited (Financials, Diversified Financial Services) 144A | | | 3.25 | | | | 9-30-2025 | | | GBP | 100,000 | | | | 125,568 | |
Wells Fargo International Bond Fund | 11
Portfolio of investments—September 30, 2019
| | | | | | | | | | | | | | | | |
| | | Interest
rate | | | Maturity
date | | | Principal | | | Value | |
| United Kingdom (continued) | | | | | | | | | | | | |
Pinnacle Bidco plc (Consumer Discretionary, Consumer Finance) | | | 6.38 | % | | | 2-15-2025 | | | GBP | 200,000 | | | $ | 261,574 | |
RAC Bond Company plc (Consumer Discretionary, Automobiles) | | | 5.00 | | | | 11-6-2022 | | | GBP | 400,000 | | | | 442,962 | |
Victoria plc (Consumer Discretionary, Household Durables) | | | 5.25 | | | | 7-15-2024 | | | EUR | 100,000 | | | | 111,982 | |
| | | | |
| | | | | | | | | | | | | | | 1,842,479 | |
| | | | | | | | | | | | | | | | |
| | | | |
Total Foreign Corporate Bonds and Notes (Cost $14,692,897) | | | | | | | | | | | | | | | 14,424,274 | |
| | | | | | | | | | | | | | | | |
| | | | |
| Foreign Government Bonds: 70.74% | | | | | | | | | | | | |
Brazil | | | 10.00 | | | | 1-1-2021 | | | BRL | 7,775,000 | | | | 1,977,806 | |
Brazil | | | 10.00 | | | | 1-1-2023 | | | BRL | 2,675,000 | | | | 715,924 | |
Brazil | | | 10.00 | | | | 1-1-2025 | | | BRL | 3,685,000 | | | | 1,016,551 | |
Canada | | | 1.50 | | | | 3-1-2020 | | | CAD | 3,285,000 | | | | 2,477,443 | |
Canada 144A## | | | 2.65 | | | | 12-15-2028 | | | CAD | 3,300,000 | | | | 2,675,594 | |
Colombia | | | 6.00 | | | | 4-28-2028 | | | COP | 4,535,000,000 | | | | 1,318,742 | |
Czech Republic | | | 0.95 | | | | 5-15-2030 | | | CZK | 77,400,000 | | | | 3,119,753 | |
Hungary †† | | | 1.50 | | | | 8-24-2022 | | | HUF | 995,000,000 | | | | 3,336,446 | |
Indonesia | | | 7.50 | | | | 8-15-2032 | | | IDR | 37,200,000,000 | | | | 2,594,566 | |
Indonesia %% | | | 8.25 | | | | 5-15-2029 | | | IDR | 11,000,000,000 | | | | 827,096 | |
Indonesia | | | 8.38 | | | | 9-15-2026 | | | IDR | 13,550,000,000 | | | | 1,022,641 | |
Italy Buoni Poliennali del Tesoro %% | | | 0.35 | | | | 2-1-2025 | | | EUR | 7,725,000 | | | | 8,443,307 | |
Italy Buoni Poliennali del Tesoro | | | 3.00 | | | | 8-1-2029 | | | EUR | 5,225,000 | | | | 6,863,716 | |
Japan | | | 0.10 | | | | 6-20-2029 | | | JPY | 670,000,000 | | | | 6,394,759 | |
Korea Treasury Bond | | | 2.00 | | | | 3-10-2020 | | | KRW | 1,635,000,000 | | | | 1,371,267 | |
Korea Treasury Bond | | | 2.38 | | | | 3-10-2023 | | | KRW | 1,600,000,000 | | | | 1,382,027 | |
Malaysia | | | 3.90 | | | | 11-30-2026 | | | MYR | 1,100,000 | | | | 269,486 | |
Malaysia | | | 3.96 | | | | 9-15-2025 | | | MYR | 2,250,000 | | | | 554,813 | |
Mexico | | | 5.75 | | | | 3-5-2026 | | | MXN | 7,850,000 | | | | 376,497 | |
Mexico | | | 8.00 | | | | 11-7-2047 | | | MXN | 14,300,000 | | | | 779,783 | |
Mexico | | | 8.50 | | | | 5-31-2029 | | | MXN | 98,480,000 | | | | 5,555,332 | |
New South Wales | | | 5.00 | | | | 8-20-2024 | | | AUD | 750,000 | | | | 601,203 | |
Norway Government Bond Series 480 144A | | | 2.00 | | | | 4-26-2028 | | | NOK | 46,200,000 | | | | 5,392,273 | |
Poland | | | 2.50 | | | | 1-25-2023 | | | PLN | 22,350,000 | | | | 5,728,110 | |
Queensland Treasury Corporation 144A | | | 4.75 | | | | 7-21-2025 | | | AUD | 2,650,000 | | | | 2,147,498 | |
Republic of Peru | | | 5.70 | | | | 8-12-2024 | | | PEN | 850,000 | | | | 280,969 | |
Republic of South Africa | | | 8.75 | | | | 2-28-2048 | | | ZAR | 500,000 | | | | 29,202 | |
Republic of South Africa | | | 8.75 | | | | 2-28-2048 | | | ZAR | 37,800,000 | | | | 2,207,642 | |
Republic of South Africa | | | 10.50 | | | | 12-21-2026 | | | ZAR | 27,700,000 | | | | 2,040,783 | |
Romania | | | 3.40 | | | | 3-8-2022 | | | RON | 1,200,000 | | | | 275,129 | |
Romania | | | 3.25 | | | | 4-29-2024 | | | RON | 3,350,000 | | | | 750,130 | |
Romania | | | 4.85 | | | | 4-22-2026 | | | RON | 3,800,000 | | | | 911,766 | |
Romania | | | 5.00 | | | | 2-12-2029 | | | RON | 5,725,000 | | | | 1,397,058 | |
Russia | | | 6.50 | | | | 2-28-2024 | | | RUB | 56,800,000 | | | | 870,904 | |
Russia | | | 6.90 | | | | 5-23-2029 | | | RUB | 166,000,000 | | | | 2,559,582 | |
Russia | | | 7.00 | | | | 12-15-2021 | | | RUB | 26,000,000 | | | | 404,627 | |
Singapore | | | 2.63 | | | | 5-1-2028 | | | SGD | 2,350,000 | | | | 1,822,668 | |
Singapore | | | 2.00 | | | | 2-1-2024 | | | SGD | 2,065,000 | | | | 1,514,816 | |
Turkey | | | 8.50 | | | | 9-14-2022 | | | TRY | 1,800,000 | | | | 282,973 | |
Turkey | | | 13.00 | | | | 11-13-2019 | | | TRY | 2,000,000 | | | | 353,816 | |
Turkey | | | 10.70 | | | | 2-17-2021 | | | TRY | 2,000,000 | | | | 342,660 | |
Turkey | | | 11.00 | | | | 2-24-2027 | | | TRY | 900,000 | | | | 143,041 | |
United Kingdom Gilt Bonds | | | 1.25 | | | | 7-22-2027 | | | GBP | 410,000 | | | | 539,958 | |
| | | | |
Total Foreign Government Bonds (Cost $84,392,635) | | | | | | | | | | | | | | | 83,670,357 | |
| | | | | | | | | | | | | | | | |
| U.S. Treasury Securities: 5.69% | | | | | | | | | | | | |
U.S. Treasury Note ## | | | 1.38 | | | | 8-31-2023 | | | $ | 4,300,000 | | | | 4,269,094 | |
U.S. Treasury Note ## | | | 2.63 | | | | 2-15-2029 | | | | 2,275,000 | | | | 2,462,865 | |
| | | | |
Total U.S. Treasury Securities (Cost $6,591,480) | | | | | | | | | | | | | | | 6,731,959 | |
| | | | | | | | | | | | | | | | |
12 | Wells Fargo International Bond Fund
Portfolio of investments—September 30, 2019
| | | | | | | | | | | | | | | | |
| | | Interest
rate | | | Maturity
date | | | Principal | | | Value | |
Yankee Corporate Bonds and Notes: 3.53% | | | | | | | | | | | | | | | | |
| | | | |
| Cayman Islands: 0.35% | | | | | | | | | | | | |
UPCB Finance IV Limited (Financials, Diversified Financial Services) | | | 5.38 | % | | | 1-15-2025 | | | $ | 400,000 | | | $ | 411,000 | |
| | | | | | | | | | | | | | | | |
| | | | |
| China: 0.43% | | | | | | | | | | | | |
Tencent Holdings Limited (Communication Services, Interactive Media & Services) 144A | | | 3.28 | | | | 4-11-2024 | | | | 500,000 | | | | 513,564 | |
| | | | | | | | | | | | | | | | |
| | | | |
| France: 0.90% | | | | | | | | | | | | |
Danone SA (Consumer Staples, Food Products) | | | 2.95 | | | | 11-2-2026 | | | | 500,000 | | | | 511,855 | |
Electricite de France SA (Utilities, Electric Utilities) | | | 4.50 | | | | 9-21-2028 | | | | 500,000 | | | | 558,039 | |
| | | | |
| | | | | | | | | | | | | | | 1,069,894 | |
| | | | | | | | | | | | | | | | |
| | | | |
| Ireland: 0.26% | | | | | | | | | | | | |
Ardagh Packaging Finance plc (Financials, Diversified Financial Services) | | | 4.63 | | | | 5-15-2023 | | | | 300,000 | | | | 307,125 | |
| | | | | | | | | | | | | | | | |
| | | | |
| Spain: 0.25% | | | | | | | | | | | | |
Telefonica Emisiones SAU (Communication Services, Diversified Telecommunication Services) | | | 4.10 | | | | 3-8-2027 | | | | 275,000 | | | | 300,218 | |
| | | | | | | | | | | | | | | | |
| | | | |
| United Kingdom: 1.34% | | | | | | | | | | | | |
International Game Technology plc (Consumer Discretionary, Hotels, Restaurants & Leisure) | | | 6.25 | | | | 2-15-2022 | | | | 300,000 | | | | 316,580 | |
Jaguar Land Rover Automobiles plc (Consumer Discretionary, Automobiles) | | | 3.50 | | | | 3-15-2020 | | | | 400,000 | | | | 398,125 | |
State Grid Overseas Investment Limited (Utilities, Multi-Utilities) | | | 3.50 | | | | 5-4-2027 | | | | 275,000 | | | | 290,070 | |
Vodafone Group plc (Communication Services, Wireless Telecommunication Services) | | | 4.38 | | | | 5-30-2028 | | | | 525,000 | | | | 579,948 | |
| | | | |
| | | | | | | | | | | | | | | 1,584,723 | |
| | | | | | | | | | | | | | | | |
| | | | |
Total Yankee Corporate Bonds and Notes (Cost $3,980,678) | | | | | | | | | | | | | | | 4,186,524 | |
| | | | | | | | | | | | | | | | |
| | | | |
| | | | | | | | | | | | | | | | |
| | | Yield | | | | | | Shares | | | | |
| Short-Term Investments: 0.38% | | | | | | | | | | | | |
| | | | |
| Investment Companies: 0.38% | | | | | | | | | | | | |
Wells Fargo Government Money Market Fund Select Class (l)(u)## | | | 1.88 | | | | | | | | 446,052 | | | | 446,052 | |
| | | | | | | | | | | | | | | | |
| | | | |
Total Short-Term Investments (Cost $446,052) | | | | | | | | | | | | | | | 446,052 | |
| | | | | | | | | | | | | | | | |
| | | | | | | | |
| Total investments in securities (Cost $117,964,090) | | | 99.52 | % | | | 117,711,977 | |
| | |
Other assets and liabilities, net | | | 0.48 | | | | 562,529 | |
| | | | | | | | |
| Total net assets | | | 100.00 | % | | $ | 118,274,506 | |
| | | | | | | | |
| ± | Variable rate investment. The rate shown is the rate in effect at period end. |
| 144A | The security may be resold in transactions exempt from registration, normally to qualified institutional buyers, pursuant to Rule 144A under the Securities Act of 1933. |
| ## | All or a portion of this security is segregated for when-issued securities. |
| †† | On the last interest date, partial interest was paid. |
| %% | The security is purchased on a when-issued basis. |
| (l) | The issuer of the security is an affiliated person of the Fund as defined in the Investment Company Act of 1940. |
| (u) | The rate represents the7-day annualized yield at period end. |
Wells Fargo International Bond Fund | 13
Portfolio of investments—September 30, 2019
Abbreviations:
| LIBOR | London Interbank Offered Rate |
Forward Foreign Currency Contracts
| | | | | | | | | | | | | | |
Currency to be
received | | Currency to be
delivered | | Counterparty | | Settlement
date | | Unrealized
gains | | | Unrealized
losses | |
| | | | | |
| 13,035,000 ZAR | | 876,724 USD | | State Street Bank | | 10-7-2019 | | $ | 0 | | | $ | (16,611 | ) |
| | | | | |
| 900,000 ZAR | | 60,566 USD | | State Street Bank | | 10-7-2019 | | | 0 | | | | (1,180 | ) |
| | | | | |
| 1,265,000 ZAR | | 81,396 USD | | State Street Bank | | 10-7-2019 | | | 2,075 | | | | 0 | |
| | | | | |
| 950,495 USD | | 14,300,000 ZAR | | State Street Bank | | 10-7-2019 | | | 6,911 | | | | 0 | |
| | | | | |
| 2,632,139 USD | | 39,600,000 ZAR | | State Street Bank | | 10-7-2019 | | | 19,138 | | | | 0 | |
| | | | | |
| 4,352,249 GBP | | 4,850,000 EUR | | State Street Bank | | 10-9-2019 | | | 63,801 | | | | 0 | |
| | | | | |
| 2,273,334 USD | | 1,850,000 GBP | | State Street Bank | | 10-9-2019 | | | 0 | | | | (1,999 | ) |
| | | | | |
| 1,900,000 PLN | | 499,417 USD | | State Street Bank | | 10-28-2019 | | | 0 | | | | (25,462 | ) |
| | | | | |
| 675,000 PLN | | 175,779 USD | | State Street Bank | | 10-28-2019 | | | 0 | | | | (7,400 | ) |
| | | | | |
| 625,000 PLN | | 159,595 USD | | State Street Bank | | 10-28-2019 | | | 0 | | | | (3,689 | ) |
| | | | | |
| 5,678,810 USD | | 21,665,000 PLN | | State Street Bank | | 10-28-2019 | | | 274,474 | | | | 0 | |
| | | | | |
| 2,872,894 USD | | 843,275,000 HUF | | State Street Bank | | 11-6-2019 | | | 122,605 | | | | 0 | |
| | | | | |
| 900,000 EUR | | 1,013,067 USD | | State Street Bank | | 11-7-2019 | | | 0 | | | | (29,466 | ) |
| | | | | |
| 2,700,000 EUR | | 3,027,704 USD | | State Street Bank | | 11-7-2019 | | | 0 | | | | (76,901 | ) |
| | | | | |
| 230,000,000 INR | | 3,199,332 USD | | State Street Bank | | 11-7-2019 | | | 34,011 | | | | 0 | |
| | | | | |
| 28,950,000 INR | | 402,699 USD | | State Street Bank | | 11-7-2019 | | | 4,281 | | | | 0 | |
| | | | | |
| 2,915,000 EUR | | 3,275,180 USD | | State Street Bank | | 11-7-2019 | | | 0 | | | | (89,405 | ) |
| | | | | |
| 2,350,000 EUR | | 2,648,640 USD | | State Street Bank | | 11-7-2019 | | | 0 | | | | (80,348 | ) |
| | | | | |
| 4,275,000 EUR | | 4,809,422 USD | | State Street Bank | | 11-7-2019 | | | 0 | | | | (137,316 | ) |
| | | | | |
| 1,900,000 EUR | | 2,137,823 USD | | State Street Bank | | 11-7-2019 | | | 0 | | | | (61,331 | ) |
| | | | | |
| 5,685,000 MXN | | 288,857 USD | | State Street Bank | | 11-7-2019 | | | 0 | | | | (2,486 | ) |
| | | | | |
| 2,185,000 MXN | | 111,612 USD | | State Street Bank | | 11-7-2019 | | | 0 | | | | (1,547 | ) |
| | | | | |
| 350,000 EUR | | 393,246 USD | | State Street Bank | | 11-7-2019 | | | 0 | | | | (10,735 | ) |
| | | | | |
| 640,000 EUR | | 721,332 USD | | State Street Bank | | 11-7-2019 | | | 0 | | | | (21,882 | ) |
14 | Wells Fargo International Bond Fund
Portfolio of investments—September 30, 2019
Forward Foreign Currency Contracts (continued)
| | | | | | | | | | | | | | |
Currency to be
received | | Currency to be
delivered | | Counterparty | | Settlement
date | | Unrealized
gains | | | Unrealized
losses | |
| | | | | |
| 1,000,000 EUR | | 1,124,761 USD | | State Street Bank | | 11-7-2019 | | $ | 0 | | | $ | (31,871 | ) |
| | | | | |
| 2,400,000 EUR | | 2,699,426 USD | | State Street Bank | | 11-7-2019 | | | 0 | | | | (76,490 | ) |
| | | | | |
| 1,100,000 EUR | | 1,240,935 USD | | State Street Bank | | 11-7-2019 | | | 0 | | | | (38,756 | ) |
| | | | | |
| 2,375,000 EUR | | 2,679,292 USD | | State Street Bank | | 11-7-2019 | | | 0 | | | | (83,678 | ) |
| | | | | |
| 975,000 EUR | | 1,098,728 USD | | State Street Bank | | 11-7-2019 | | | 0 | | | | (33,160 | ) |
| | | | | |
| 405,065 USD | | 28,950,000 INR | | State Street Bank | | 11-7-2019 | | | 0 | | | | (1,914 | ) |
| | | | | |
| 3,218,133 USD | | 230,000,000 INR | | State Street Bank | | 11-7-2019 | | | 0 | | | | (15,210 | ) |
| | | | | |
| 664,838 USD | | 600,000 EUR | | State Street Bank | | 11-7-2019 | | | 9,104 | | | | 0 | |
| | | | | |
| 277,577 USD | | 250,000 EUR | | State Street Bank | | 11-7-2019 | | | 4,354 | | | | 0 | |
| | | | | |
| 408,517 USD | | 370,000 EUR | | State Street Bank | | 11-7-2019 | | | 4,148 | | | | 0 | |
| | | | | |
| 159,801 USD | | 3,250,000 MXN | | State Street Bank | | 11-7-2019 | | | 0 | | | | (3,911 | ) |
| | | | | |
| 4,692,528 USD | | 93,325,000 MXN | | State Street Bank | | 11-7-2019 | | | 0 | | | | (8,538 | ) |
| | | | | |
| 1,850,264 USD | | 1,650,000 EUR | | State Street Bank | | 11-7-2019 | | | 46,995 | | | | 0 | |
| | | | | |
| 3,010,962 USD | | 2,670,000 EUR | | State Street Bank | | 11-7-2019 | | | 92,945 | | | | 0 | |
| | | | | |
| 221,537 USD | | 200,000 EUR | | State Street Bank | | 11-7-2019 | | | 2,959 | | | | 0 | |
| | | | | |
| 249,536 USD | | 225,000 EUR | | State Street Bank | | 11-7-2019 | | | 3,636 | | | | 0 | |
| | | | | |
| 160,000,000 COP | | 46,270 USD | | State Street Bank | | 11-8-2019 | | | 0 | | | | (366 | ) |
| | | | | |
| 4,375,000,000 IDR | | 302,999 USD | | State Street Bank | | 11-8-2019 | | | 4,009 | | | | 0 | |
| | | | | |
| 9,100,000,000 COP | | 2,701,098 USD | | State Street Bank | | 11-8-2019 | | | 0 | | | | (90,324 | ) |
| | | | | |
| 3,330,000,000 KRW | | 2,819,644 USD | | State Street Bank | | 11-8-2019 | | | 0 | | | | (32,967 | ) |
| | | | | |
| 620,000,000 KRW | | 512,905 USD | | State Street Bank | | 11-8-2019 | | | 5,936 | | | | 0 | |
| | | | | |
| 715,656 USD | | 2,500,000,000 COP | | State Street Bank | | 11-8-2019 | | | 0 | | | | (1,590 | ) |
| | | | | |
| 2,604,987 USD | | 9,100,000,000 COP | | State Street Bank | | 11-8-2019 | | | 0 | | | | (5,787 | ) |
| | | | | |
| 2,609,621 USD | | 38,000,000,000 IDR | | State Street Bank | | 11-8-2019 | | | 0 | | | | (56,965 | ) |
| | | | | |
| 1,206,950 USD | | 17,575,000,000 IDR | | State Street Bank | | 11-8-2019 | | | 0 | | | | (26,346 | ) |
| | | | | |
| 3,260,690 USD | | 3,950,000,000 KRW | | State Street Bank | | 11-8-2019 | | | 0 | | | | (44,828 | ) |
| | | | | |
| 4,100,000 AUD | | 302,213,050 JPY | | State Street Bank | | 11-12-2019 | | | 0 | | | | (31,358 | ) |
| | | | | |
| 2,796,221 USD | | 4,100,000 AUD | | State Street Bank | | 11-12-2019 | | | 25,083 | | | | 0 | |
| | | | | |
| 11,871,193 USD | | 79,525,000 DKK | | State Street Bank | | 11-18-2019 | | | 218,691 | | | | 0 | |
| | | | | |
| 3,378,108 USD | | 4,650,000 SGD | | State Street Bank | | 11-26-2019 | | | 11,643 | | | | 0 | |
| | | | | |
| 410,000,000 JPY | | 3,902,142 USD | | State Street Bank | | 11-29-2019 | | | 0 | | | | (95,950 | ) |
| | | | | |
| 2,652,747 USD | | 285,000,000 JPY | | State Street Bank | | 11-29-2019 | | | 6,979 | | | | 0 | |
| | | | | |
| 373,874 USD | | 40,000,000 JPY | | State Street Bank | | 11-29-2019 | | | 2,539 | | | | 0 | |
| | | | | |
| 1,986,739 USD | | 8,330,000 BRL | | State Street Bank | | 12-3-2019 | | | 0 | | | | (10,304 | ) |
| | | | | |
| 229,109 USD | | 950,000 BRL | | State Street Bank | | 12-6-2019 | | | 1,390 | | | | 0 | |
| | | | | |
| 639,000,000 JPY | | 6,038,356 USD | | State Street Bank | | 12-9-2019 | | | 0 | | | | (101,263 | ) |
| | | | | |
| 635,924 USD | | 575,000 EUR | | State Street Bank | | 12-17-2019 | | | 5,530 | | | | 0 | |
| | | | | |
| 329,884 USD | | 300,000 EUR | | State Street Bank | | 12-17-2019 | | | 983 | | | | 0 | |
| | | | | |
| 12,080,000 EUR | | 13,486,027 USD | | State Street Bank | | 12-17-2019 | | | 0 | | | | (242,275 | ) |
| | | | | |
| 325,462 USD | | 35,000,000 JPY | | State Street Bank | | 12-19-2019 | | | 0 | | | | (33 | ) |
| | | | | |
| 214,008 USD | | 23,000,000 JPY | | State Street Bank | | 12-19-2019 | | | 111 | | | | 0 | |
| | | | | |
| 2,750,000,000 JPY | | 25,656,814 USD | | State Street Bank | | 12-19-2019 | | | 0 | | | | (82,187 | ) |
| | | | | |
| 3,721,616 USD | | 400,000,000 JPY | | State Street Bank | | 12-19-2019 | | | 1,670 | | | | 0 | |
| | | | | | | | | | | | | | |
| | | | | |
| | | | | | | | $ | 976,001 | | | $ | (1,683,829 | ) |
| | | | | | | | | | | | | | |
Wells Fargo International Bond Fund | 15
Portfolio of investments—September 30, 2019
Investments in Affiliates
An affiliated investment is an investment in which the Fund owns at least 5% of the outstanding voting shares of the issuer or as a result of other relationships, such as the Fund and the issuer having the same investment manager. Transactions with issuers that were either affiliated persons of the Fund at the beginning of the period or the end of the period were as follows:
| | | | | | | | | | | | | | | | | | | | | | | | | | | | | | | | | | | | |
| | | Shares,
beginning of
period | | | Shares
purchased | | | Shares
sold | | | Shares,
end of
period | | | Net
realized
gains
(losses) | | | Net
change in
unrealized
gains
(losses) | | | Income
from
affiliated
securities | | | Value,
end of
period | | | % of
net
assets | |
Short-Term Investments | | | | | | | | | | | | | | | | | | | | | | | | | | | | | | | | | | | | |
Investment Companies | | | | | | | | | | | | | | | | | | | | | | | | | | | | | | | | | | | | |
Wells Fargo Government Money Market Fund Select Class | | | 1,592,910 | | | | 119,738,718 | | | | 120,885,576 | | | | 446,052 | | | $ | 0 | | | $ | 0 | | | $ | 44,933 | | | $ | 446,052 | | | | 0.38 | % |
The accompanying notes are an integral part of these financial statements.
16 | Wells Fargo International Bond Fund
Statement of assets and liabilities—September 30, 2019
| | | | |
| | | | |
| |
Assets | | | | |
Investments in unaffiliated securities, at value (cost $117,518,038) | | $ | 117,265,925 | |
Investments in affiliated securities, at value (cost $446,052) | | | 446,052 | |
Receivable for investments sold | | | 9,844,271 | |
Receivable for Fund shares sold | | | 267,668 | |
Receivable for interest | | | 1,008,364 | |
Unrealized gains on forward foreign currency contracts | | | 976,001 | |
Prepaid expenses and other assets | | | 220,979 | |
| | | | |
Total assets | | | 130,029,260 | |
| | | | |
| |
Liabilities | | | | |
Payable for investments purchased | | | 9,730,900 | |
Payable for Fund shares redeemed | | | 254,130 | |
Unrealized losses on forward foreign currency contracts | | | 1,683,829 | |
Due to custodian bank, foreign currency, at value (cost $1,745) | | | 1,741 | |
Management fee payable | | | 15,234 | |
Distribution fee payable | | | 638 | |
Administration fees payable | | | 8,815 | |
Trustees’ fees and expenses payable | | | 2,259 | |
Accrued expenses and other liabilities | | | 57,208 | |
| | | | |
Total liabilities | | | 11,754,754 | |
| | | | |
Total net assets | | $ | 118,274,506 | |
| | | | |
| |
Net assets consist of | | | | |
Paid-in capital | | $ | 134,702,721 | |
Total distributable loss | | | (16,428,215 | ) |
| | | | |
Total net assets | | $ | 118,274,506 | |
| | | | |
| |
Computation of net asset value and offering price per share | | | | |
Net assets – Class A | | $ | 12,328,522 | |
Shares outstanding – Class A1 | | | 1,179,860 | |
Net asset value per share – Class A | | | $10.45 | |
Maximum offering price per share – Class A2 | | | $10.94 | |
Net assets – Class C | | $ | 1,026,584 | |
Shares outstanding – Class C1 | | | 102,889 | |
Net asset value per share – Class C | | | $9.98 | |
Net assets – Class R6 | | $ | 8,979,486 | |
Shares outstanding – Class R61 | | | 841,093 | |
Net asset value per share – Class R6 | | | $10.68 | |
Net assets – Administrator Class | | $ | 18,213,308 | |
Shares outstanding – Administrator Class1 | | | 1,729,400 | |
Net asset value per share – Administrator Class | | | $10.53 | |
Net assets – Institutional Class | | $ | 77,726,606 | |
Shares outstanding – Institutional Class1 | | | 7,306,998 | |
Net asset value per share – Institutional Class | | | $10.64 | |
| 1 | The Fund has an unlimited number of authorized shares. |
| 2 | Maximum offering price is computed as 100/95.50 of net asset value. On investments of $50,000 or more, the offering price is reduced. |
The accompanying notes are an integral part of these financial statements.
Wells Fargo International Bond Fund | 17
Statement of operations—year ended September 30, 2019
| | | | |
| | | | |
| |
Investment income | | | | |
Interest (net of foreign interest withholding taxes of $101,467) | | $ | 9,104,158 | |
Income from affiliated securities | | | 44,933 | |
| | | | |
Total investment income | | | 9,149,091 | |
| | | | |
| |
Expenses | | | | |
Management fee | | | 1,276,492 | |
Administration fees | |
Class A | | | 25,388 | |
Class C | | | 2,635 | |
Class R6 | | | 6,506 | |
Administrator Class | | | 20,684 | |
Institutional Class | | | 122,292 | |
Shareholder servicing fees | |
Class A | | | 39,668 | |
Class C | | | 4,117 | |
Administrator Class | | | 51,494 | |
Distribution fee | |
Class C | | | 12,351 | |
Custody and accounting fees | | | 259,001 | |
Professional fees | | | 56,605 | |
Registration fees | | | 117,519 | |
Shareholder report expenses | | | 96,782 | |
Trustees’ fees and expenses | | | 23,384 | |
Interest expense | | | 5,081 | |
Other fees and expenses | | | 16,841 | |
| | | | |
Total expenses | | | 2,136,840 | |
Less: Fee waivers and/or expense reimbursements | |
Fund-level | | | (517,736 | ) |
Class A | | | (3,571 | ) |
Class C | | | (187 | ) |
Administrator Class | | | (30,944 | ) |
Institutional Class | | | (97 | ) |
| | | | |
Net expenses | | | 1,584,305 | |
| | | | |
Net investment income | | | 7,564,786 | |
| | | | |
| |
Realized and unrealized gains (losses) on investments | | | | |
Net realized losses on | |
Unaffiliated securities | | | (14,456,906 | ) |
Forward foreign currency contracts | | | (3,170,864 | ) |
| | | | |
Net realized losses on investments | | | (17,627,770 | ) |
| | | | |
|
Net change in unrealized gains (losses) on | |
Unaffiliated securities | | | 20,251,138 | |
Forward foreign currency contracts | | | 5,600,356 | |
| | | | |
Net change in unrealized gains (losses) on investments | | | 25,851,494 | |
| | | | |
Net realized and unrealized gains (losses) on investments | | | 8,223,724 | |
| | | | |
Net increase in net assets resulting from operations | | $ | 15,788,510 | |
| | | | |
The accompanying notes are an integral part of these financial statements.
18 | Wells Fargo International Bond Fund
Statement of changes in net assets
| | | | | | | | | | | | | | | | |
| | | Year ended
September 30, 2019 | | | Year ended
September 30, 2018 | |
| |
Operations | | | | | |
Net investment income | | | | | | $ | 7,564,786 | | | | | | | $ | 14,884,133 | |
Net realized gains (losses) on investments | | | | | | | (17,627,770 | ) | | | | | | | 1,924,156 | |
Net change in unrealized gains (losses) on investments | | | | | | | 25,851,494 | | | | | | | | (41,587,049 | ) |
| | | | |
Net increase (decrease) in net assets resulting from operations | | | | | | | 15,788,510 | | | | | | | | (24,778,760 | ) |
| | | | |
| | | |
Capital share transactions | | | Shares | | | | Shares | | | | | |
Proceeds from shares sold | |
Class A | | | 382,864 | | | | 3,845,786 | | | | 1,692,946 | | | | 17,128,341 | |
Class C | | | 4,716 | | | | 45,352 | | | | 23,686 | | | | 231,626 | |
Class R6 | | | 240,845 | | | | 2,428,431 | | | | 4,470,576 | | | | 47,127,812 | |
Administrator Class | | | 326,113 | | | | 3,274,172 | | | | 1,854,064 | | | | 19,444,887 | |
Institutional Class | | | 1,734,775 | | | | 17,401,980 | | | | 7,578,500 | | | | 78,408,711 | |
| | | | |
| | | | | | | 26,995,721 | | | | | | | | 162,341,377 | |
| | | | |
Payment for shares redeemed | |
Class A | | | (3,796,911 | ) | | | (36,769,127 | ) | | | (3,876,760 | ) | | | (38,897,182 | ) |
Class C | | | (186,284 | ) | | | (1,790,879 | ) | | | (88,726 | ) | | | (868,829 | ) |
Class R6 | | | (4,444,880 | ) | | | (44,590,677 | ) | | | (2,380,029 | ) | | | (24,249,955 | ) |
Administrator Class | | | (1,459,494 | ) | | | (14,446,041 | ) | | | (2,955,066 | ) | | | (30,390,707 | ) |
Institutional Class | | | (19,409,739 | ) | | | (197,377,886 | ) | | | (25,163,647 | ) | | | (261,878,241 | ) |
| | | | |
| | | | | | | (294,974,610 | ) | | | | | | | (356,284,914 | ) |
| | | | |
Net decrease in net assets resulting from capital share transactions | | | | | | | (267,978,889 | ) | | | | | | | (193,943,537 | ) |
| | | | |
Total decrease in net assets | | | | | | | (252,190,379 | ) | | | | | | | (218,722,297 | ) |
| | | | |
| | |
Net assets | | | | | | | | |
Beginning of period | | | | | | | 370,464,885 | | | | | | | | 589,187,182 | |
| | | | |
End of period | | | | | | $ | 118,274,506 | | | | | | | $ | 370,464,885 | |
| | | | |
The accompanying notes are an integral part of these financial statements.
Wells Fargo International Bond Fund | 19
Financial highlights
(For a share outstanding throughout each period)
| | | | | | | | | | | | | | | | | | | | | | | | |
| | | Year ended September 30 | | | Year ended October 31 | |
| CLASS A | | 2019 | | | 2018 | | | 2017 | | | 20161 | | | 2015 | | | 2014 | |
Net asset value, beginning of period | | | $9.69 | | | | $10.31 | | | | $10.77 | | | | $9.74 | | | | $10.84 | | | | $11.32 | |
Net investment income | | | 0.32 | 2 | | | 0.27 | 2 | | | 0.26 | 2 | | | 0.24 | 2 | | | 0.31 | 2 | | | 0.37 | 2 |
Net realized and unrealized gains (losses) on investments | | | 0.44 | | | | (0.89 | ) | | | (0.57 | ) | | | 0.85 | | | | (1.33 | ) | | | (0.34 | ) |
| | | | | | | | | | | | | | | | | | | | | | | | |
Total from investment operations | | | 0.76 | | | | (0.62 | ) | | | (0.31 | ) | | | 1.09 | | | | (1.02 | ) | | | 0.03 | |
Distributions to shareholders from | | | | | | | | | | | | | | | | | | | | | | | | |
Net investment income | | | 0.00 | | | | 0.00 | | | | 0.00 | | | | 0.00 | | | | (0.05 | ) | | | (0.12 | ) |
Net realized gains | | | 0.00 | | | | 0.00 | | | | (0.15 | ) | | | (0.06 | ) | | | (0.03 | ) | | | (0.39 | ) |
| | | | | | | | | | | | | | | | | | | | | | | | |
Total distributions to shareholders | | | 0.00 | | | | 0.00 | | | | (0.15 | ) | | | (0.06 | ) | | | (0.08 | ) | | | (0.51 | ) |
Net asset value, end of period | | | $10.45 | | | | $9.69 | | | | $10.31 | | | | $10.77 | | | | $9.74 | | | | $10.84 | |
Total return3 | | | 7.84 | % | | | (6.01 | )% | | | (2.78 | )% | | | 11.24 | % | | | (9.50 | )% | | | 0.26 | % |
Ratios to average net assets (annualized) | | | | | | | | | | | | | | | | | | | | | | | | |
Gross expenses | | | 1.30 | % | | | 1.08 | % | | | 1.03 | % | | | 1.08 | % | | | 1.06 | % | | | 1.05 | % |
Net expenses | | | 1.03 | % | | | 1.03 | % | | | 1.03 | % | | | 1.03 | % | | | 1.03 | % | | | 1.03 | % |
Net investment income | | | 3.21 | % | | | 2.75 | % | | | 2.61 | % | | | 2.64 | % | | | 3.07 | % | | | 3.29 | % |
Supplemental data | | | | | | | | | | | | | | | | | | | | | | | | |
Portfolio turnover rate | | | 129 | % | | | 99 | % | | | 68 | % | | | 96 | % | | | 136 | % | | | 103 | % |
Net assets, end of period (000s omitted) | | | $12,329 | | | | $44,519 | | | | $69,885 | | | | $54,399 | | | | $79,727 | | | | $102,624 | |
| 1 | For the eleven months ended September 30, 2016. The Fund changed its fiscal year end from October 31 to September 30, effective September 30, 2016. |
| 2 | Calculated based upon average shares outstanding |
| 3 | Total return calculations do not include any sales charges. Returns for periods of less than one year are not annualized. |
The accompanying notes are an integral part of these financial statements.
20 | Wells Fargo International Bond Fund
Financial highlights
(For a share outstanding throughout each period)
| | | | | | | | | | | | | | | | | | | | | | | | |
| | | Year ended September 30 | | | Year ended October 31 | |
| CLASS C | | 2019 | | | 2018 | | | 2017 | | | 20161 | | | 2015 | | | 2014 | |
Net asset value, beginning of period | | | $9.32 | | | | $10.00 | | | | $10.52 | | | | $9.58 | | | | $10.70 | | | | $11.19 | |
Net investment income | | | 0.24 | 2 | | | 0.19 | 2 | | | 0.18 | 2 | | | 0.17 | 2 | | | 0.23 | 2 | | | 0.28 | 2 |
Net realized and unrealized gains (losses) on investments | | | 0.42 | | | | (0.87 | ) | | | (0.55 | ) | | | 0.83 | | | | (1.32 | ) | | | (0.34 | ) |
| | | | | | | | | | | | | | | | | | | | | | | | |
Total from investment operations | | | 0.66 | | | | (0.68 | ) | | | (0.37 | ) | | | 1.00 | | | | (1.09 | ) | | | (0.06 | ) |
Distributions to shareholders from | | | | | | | | | | | | | | | | | | | | | | | | |
Net investment income | | | 0.00 | | | | 0.00 | | | | 0.00 | | | | 0.00 | | | | 0.00 | | | | (0.04 | ) |
Net realized gains | | | 0.00 | | | | 0.00 | | | | (0.15 | ) | | | (0.06 | ) | | | (0.03 | ) | | | (0.39 | ) |
| | | | | | | | | | | | | | | | | | | | | | | | |
Total distributions to shareholders | | | 0.00 | | | | 0.00 | | | | (0.15 | ) | | | (0.06 | ) | | | (0.03 | ) | | | (0.43 | ) |
Net asset value, end of period | | | $9.98 | | | | $9.32 | | | | $10.00 | | | | $10.52 | | | | $9.58 | | | | $10.70 | |
Total return3 | | | 7.08 | % | | | (6.80 | )% | | | (3.43 | )% | | | 10.49 | % | | | (10.21 | )% | | | (0.52 | )% |
Ratios to average net assets (annualized) | | | | | | | | | | | | | | | | | | | | | | | | |
Gross expenses | | | 2.04 | % | | | 1.83 | % | | | 1.78 | % | | | 1.83 | % | | | 1.81 | % | | | 1.80 | % |
Net expenses | | | 1.78 | % | | | 1.78 | % | | | 1.78 | % | | | 1.78 | % | | | 1.78 | % | | | 1.78 | % |
Net investment income | | | 2.51 | % | | | 2.00 | % | | | 1.88 | % | | | 1.86 | % | | | 2.33 | % | | | 2.54 | % |
Supplemental data | | | | | | | | | | | | | | | | | | | | | | | | |
Portfolio turnover rate | | | 129 | % | | | 99 | % | | | 68 | % | | | 96 | % | | | 136 | % | | | 103 | % |
Net assets, end of period (000s omitted) | | | $1,027 | | | | $2,652 | | | | $3,493 | | | | $5,520 | | | | $6,895 | | | | $11,597 | |
| 1 | For the eleven months ended September 30, 2016. The Fund changed its fiscal year end from October 31 to September 30, effective September 30, 2016. |
| 2 | Calculated based upon average shares outstanding |
| 3 | Total return calculations do not include any sales charges. Returns for periods of less than one year are not annualized. |
The accompanying notes are an integral part of these financial statements.
Wells Fargo International Bond Fund | 21
Financial highlights
(For a share outstanding throughout each period)
| | | | | | | | | | | | | | | | | | | | | | | | |
| | | Year ended September 30 | | | Year ended October 31 | |
| CLASS R6 | | 2019 | | | 2018 | | | 2017 | | | 20161 | | | 2015 | | | 2014 | |
Net asset value, beginning of period | | | $9.86 | | | | $10.45 | | | | $10.88 | | | | $9.80 | | | | $10.88 | | | | $11.36 | |
Net investment income | | | 0.37 | 2 | | | 0.31 | 2 | | | 0.30 | 2 | | | 0.28 | 2 | | | 0.35 | 2 | | | 0.42 | 2 |
Net realized and unrealized gains (losses) on investments | | | 0.45 | | | | (0.90 | ) | | | (0.58 | ) | | | 0.86 | | | | (1.34 | ) | | | (0.35 | ) |
| | | | | | | | | | | | | | | | | | | | | | | | |
Total from investment operations | | | 0.82 | | | | (0.59 | ) | | | (0.28 | ) | | | 1.14 | | | | (0.99 | ) | | | 0.07 | |
Distributions to shareholders from | | | | | | | | | | | | | | | | | | | | | | | | |
Net investment income | | | 0.00 | | | | 0.00 | | | | 0.00 | | | | 0.00 | | | | (0.06 | ) | | | (0.16 | ) |
Net realized gains | | | 0.00 | | | | 0.00 | | | | (0.15 | ) | | | (0.06 | ) | | | (0.03 | ) | | | (0.39 | ) |
| | | | | | | | | | | | | | | | | | | | | | | | |
Total distributions to shareholders | | | 0.00 | | | | 0.00 | | | | (0.15 | ) | | | (0.06 | ) | | | (0.09 | ) | | | (0.55 | ) |
Net asset value, end of period | | | $10.68 | | | | $9.86 | | | | $10.45 | | | | $10.88 | | | | $9.80 | | | | $10.88 | |
Total return3 | | | 8.32 | % | | | (5.65 | )% | | | (2.48 | )% | | | 11.69 | % | | | (9.18 | )% | | | 0.60 | % |
Ratios to average net assets (annualized) | | | | | | | | | | | | | | | | | | | | | | | | |
Gross expenses | | | 0.90 | % | | | 0.72 | % | | | 0.65 | % | | | 0.70 | % | | | 0.68 | % | | | 0.67 | % |
Net expenses | | | 0.65 | % | | | 0.65 | % | | | 0.65 | % | | | 0.65 | % | | | 0.65 | % | | | 0.65 | % |
Net investment income | | | 3.68 | % | | | 3.18 | % | | | 3.01 | % | | | 3.00 | % | | | 3.46 | % | | | 3.64 | % |
Supplemental data | | | | | | | | | | | | | | | | | | | | | | | | |
Portfolio turnover rate | | | 129 | % | | | 99 | % | | | 68 | % | | | 96 | % | | | 136 | % | | | 103 | % |
Net assets, end of period (000s omitted) | | | $8,979 | | | | $49,749 | | | | $30,876 | | | | $12,501 | | | | $13,152 | | | | $5,729 | |
| 1 | For the eleven months ended September 30, 2016. The Fund changed its fiscal year end from October 31 to September 30, effective September 30, 2016. |
| 2 | Calculated based upon average shares outstanding |
| 3 | Returns for periods of less than one year are not annualized. |
The accompanying notes are an integral part of these financial statements.
22 | Wells Fargo International Bond Fund
Financial highlights
(For a share outstanding throughout each period)
| | | | | | | | | | | | | | | | | | | | | | | | |
| | | Year ended September 30 | | | Year ended October 31 | |
| ADMINISTRATOR CLASS | | 2019 | | | 2018 | | | 2017 | | | 20161 | | | 2015 | | | 2014 | |
Net asset value, beginning of period | | | $9.75 | | | | $10.36 | | | | $10.80 | | | | $9.75 | | | | $10.84 | | | | $11.32 | |
Net investment income | | | 0.34 | 2 | | | 0.29 | 2 | | | 0.28 | 2 | | | 0.26 | 2 | | | 0.33 | 2 | | | 0.39 | 2 |
Net realized and unrealized gains (losses) on investments | | | 0.44 | | | | (0.90 | ) | | | (0.57 | ) | | | 0.85 | | | | (1.34 | ) | | | (0.34 | ) |
| | | | | | | | | | | | | | | | | | | | | | | | |
Total from investment operations | | | 0.78 | | | | (0.61 | ) | | | (0.29 | ) | | | 1.11 | | | | (1.01 | ) | | | 0.05 | |
Distributions to shareholders from | | | | | | | | | | | | | | | | | | | | | | | | |
Net investment income | | | 0.00 | | | | 0.00 | | | | 0.00 | | | | 0.00 | | | | (0.05 | ) | | | (0.14 | ) |
Net realized gains | | | 0.00 | | | | 0.00 | | | | (0.15 | ) | | | (0.06 | ) | | | (0.03 | ) | | | (0.39 | ) |
| | | | | | | | | | | | | | | | | | | | | | | | |
Total distributions to shareholders | | | 0.00 | | | | 0.00 | | | | (0.15 | ) | | | (0.06 | ) | | | (0.08 | ) | | | (0.53 | ) |
Net asset value, end of period | | | $10.53 | | | | $9.75 | | | | $10.36 | | | | $10.80 | | | | $9.75 | | | | $10.84 | |
Total return3 | | | 8.00 | % | | | (5.89 | )% | | | (2.59 | )% | | | 11.44 | % | | | (9.36 | )% | | | 0.43 | % |
Ratios to average net assets (annualized) | | | | | | | | | | | | | | | | | | | | | | | | |
Gross expenses | | | 1.24 | % | | | 1.01 | % | | | 0.97 | % | | | 1.02 | % | | | 0.99 | % | | | 0.99 | % |
Net expenses | | | 0.85 | % | | | 0.85 | % | | | 0.85 | % | | | 0.85 | % | | | 0.85 | % | | | 0.85 | % |
Net investment income | | | 3.37 | % | | | 2.93 | % | | | 2.80 | % | | | 2.85 | % | | | 3.26 | % | | | 3.47 | % |
Supplemental data | | | | | | | | | | | | | | | | | | | | | | | | |
Portfolio turnover rate | | | 129 | % | | | 99 | % | | | 68 | % | | | 96 | % | | | 136 | % | | | 103 | % |
Net assets, end of period (000s omitted) | | | $18,213 | | | | $27,911 | | | | $41,045 | | | | $50,825 | | | | $266,849 | | | | $359,383 | |
| 1 | For the eleven months ended September 30, 2016. The Fund changed its fiscal year end from October 31 to September 30, effective September 30, 2016. |
| 2 | Calculated based upon average shares outstanding |
| 3 | Returns for periods of less than one year are not annualized. |
The accompanying notes are an integral part of these financial statements.
Wells Fargo International Bond Fund | 23
Financial highlights
(For a share outstanding throughout each period)
| | | | | | | | | | | | | | | | | | | | | | | | |
| | | Year ended September 30 | | | Year ended October 31 | |
| INSTITUTIONAL CLASS | | 2019 | | | 2018 | | | 2017 | | | 20161 | | | 2015 | | | 2014 | |
Net asset value, beginning of period | | | $9.83 | | | | $10.43 | | | | $10.86 | | | | $9.79 | | | | $10.87 | | | | $11.35 | |
Net investment income | | | 0.37 | 2 | | | 0.31 | 2 | | | 0.29 | 2 | | | 0.27 | 2 | | | 0.35 | 2 | | | 0.41 | 2 |
Net realized and unrealized gains (losses) on investments | | | 0.44 | | | | (0.91 | ) | | | (0.57 | ) | | | 0.86 | | | | (1.34 | ) | | | (0.35 | ) |
| | | | | | | | | | | | | | | | | | | | | | | | |
Total from investment operations | | | 0.81 | | | | (0.60 | ) | | | (0.28 | ) | | | 1.13 | | | | (0.99 | ) | | | 0.06 | |
Distributions to shareholders from | | | | | | | | | | | | | | | | | | | | | | | | |
Net investment income | | | 0.00 | | | | 0.00 | | | | 0.00 | | | | 0.00 | | | | (0.06 | ) | | | (0.15 | ) |
Net realized gains | | | 0.00 | | | | 0.00 | | | | (0.15 | ) | | | (0.06 | ) | | | (0.03 | ) | | | (0.39 | ) |
| | | | | | | | | | | | | | | | | | | | | | | | |
Total distributions to shareholders | | | 0.00 | | | | 0.00 | | | | (0.15 | ) | | | (0.06 | ) | | | (0.09 | ) | | | (0.54 | ) |
Net asset value, end of period | | | $10.64 | | | | $9.83 | | | | $10.43 | | | | $10.86 | | | | $9.79 | | | | $10.87 | |
Total return3 | | | 8.24 | % | | | (5.75 | )% | | | (2.48 | )% | | | 11.60 | % | | | (9.20 | )% | | | 0.55 | % |
Ratios to average net assets (annualized) | | | | | | | | | | | | | | | | | | | | | | | | |
Gross expenses | | | 0.95 | % | | | 0.74 | % | | | 0.70 | % | | | 0.75 | % | | | 0.73 | % | | | 0.72 | % |
Net expenses | | | 0.70 | % | | | 0.70 | % | | | 0.70 | % | | | 0.70 | % | | | 0.70 | % | | | 0.70 | % |
Net investment income | | | 3.61 | % | | | 3.06 | % | | | 2.96 | % | | | 2.95 | % | | | 3.41 | % | | | 3.62 | % |
Supplemental data | | | | | | | | | | | | | | | | | | | | | | | | |
Portfolio turnover rate | | | 129 | % | | | 99 | % | | | 68 | % | | | 96 | % | | | 136 | % | | | 103 | % |
Net assets, end of period (000s omitted) | | | $77,727 | | | | $245,633 | | | | $443,888 | | | | $553,208 | | | | $689,964 | | | | $832,072 | |
| 1 | For the eleven months ended September 30, 2016. The Fund changed its fiscal year end from October 31 to September 30, effective September 30, 2016. |
| 2 | Calculated based upon average shares outstanding |
| 3 | Returns for periods of less than one year are not annualized. |
The accompanying notes are an integral part of these financial statements.
24 | Wells Fargo International Bond Fund
Notes to financial statements
1. ORGANIZATION
Wells Fargo Funds Trust (the “Trust”), a Delaware statutory trust organized on March 10, 1999, is anopen-end management investment company registered under the Investment Company Act of 1940, as amended (the “1940 Act”). As an investment company, the Trust follows the accounting and reporting guidance in Financial Accounting Standards Board (“FASB”)Accounting Standards Codification Topic 946, Financial Services – Investment Companies. These financial statements report on the Wells Fargo International Bond Fund (the “Fund”) which is a diversified series of the Trust.
2. SIGNIFICANT ACCOUNTING POLICIES
The following significant accounting policies, which are consistently followed in the preparation of the financial statements of the Fund, are in conformity with U.S. generally accepted accounting principles which require management to make estimates and assumptions that affect the reported amounts of assets and liabilities, disclosure of contingent assets and liabilities at the date of the financial statements, and the reported amounts of revenues and expenses during the reporting period. Actual results could differ from those estimates.
Securities valuation
All investments are valued each business day as of the close of regular trading on the New York Stock Exchange (generally 4 p.m. Eastern Time), although the Fund may deviate from this calculation time under unusual or unexpected circumstances.
Debt securities are valued at the evaluated bid price provided by an independent pricing service (e.g. taking into account various factors, including yields, maturities, or credit ratings) or, if a reliable price is not available, the quoted bid price from an independent broker-dealer.
Forward foreign currency contracts are recorded at the forward rate provided by an independent foreign currency pricing source at a time each business day specified by the Wells Fargo Asset Management Pricing Committee at Wells Fargo Funds Management, LLC (“Funds Management”).
The values of securities denominated in foreign currencies are translated into U.S. dollars at rates provided by an independent foreign currency pricing source at a time each business day specified by the Wells Fargo Asset Management Pricing Committee.
Investments in registeredopen-end investment companies are valued at net asset value.
Investments which are not valued using any of the methods discussed above are valued at their fair value, as determined in good faith by the Board of Trustees of the Fund. The Board of Trustees has established a Valuation Committee comprised of the Trustees and has delegated to it the authority to take any actions regarding the valuation of portfolio securities that the Valuation Committee deems necessary or appropriate, including determining the fair value of portfolio securities, unless the determination has been delegated to the Wells Fargo Asset Management Pricing Committee.The Board of Trustees retains the authority to make or ratify any valuation decisions or approve any changes to the Valuation Procedures as it deems appropriate. On a quarterly basis, the Board of Trustees receives reports on any valuation actions taken by the Valuation Committee or the Wells Fargo Asset Management Pricing Committee which may include items for ratification.
Foreign currency translation
The accounting records of the Fund are maintained in U.S. dollars. The values of other assets and liabilities denominated in foreign currencies are translated into U.S. dollars at rates provided by an independent foreign currency pricing source at a time each business day specified by the Wells Fargo Asset Management Pricing Committee. Purchases and sales of securities, and income and expenses are converted at the rate of exchange on the respective dates of such transactions. Net realized foreign exchange gains or losses arise from sales of foreign currencies, currency gains or losses realized between the trade and settlement dates on securities transactions, and the difference between the amounts of dividends, interest and foreign withholding taxes recorded and the U.S. dollar equivalent of the amounts actually paid or received. Net unrealized foreign exchange gains and losses arise from changes in the fair value of assets and liabilities other than investments in securities resulting from changes in exchange rates. The changes in net assets arising from changes in exchange rates of securities and the changes in net assets resulting from changes in market prices of securities are not separately presented. Such changes are included in net realized and unrealized gains or losses from investments.
Forward foreign currency contracts
A forward foreign currency contract is an agreement between two parties to purchase or sell a specific currency for anagreed-upon price at a future date. The Fund enters into forward foreign currency contracts to facilitate transactions in foreign-denominated securities and to attempt to minimize the risk to the Fund from adverse changes in the relationship between currencies. Forward foreign currency contracts are recorded at the forward rate andmarked-to-market daily. When the contracts are closed, realized gains and losses arising from such transactions are recorded as realized gains or losses on forward foreign currency contracts. The Fund is subject to foreign currency risk and may be exposed to risks if the
Wells Fargo International Bond Fund | 25
Notes to financial statements
counterparties to the contracts are unable to meet the terms of their contracts or if the value of the foreign currency changes unfavorably. The Fund’s maximum risk of loss from counterparty credit risk is the unrealized gains on the contracts. This risk may be mitigated if there is a master netting arrangement between the Fund and the counterparty.
When-issued transactions
The Fund may purchase securities on a forward commitment or when-issued basis. The Fund records a when-issued transaction on the trade date and will segregate assets in an amount at least equal in value to the Fund’s commitment to purchasewhen-issued securities. Securities purchased on a when-issued basis aremarked-to-market daily and the Fund begins earning interest on the settlement date. Losses may arise due to changes in the market value of the underlying securities or if the counterparty does not perform under the contract.
Security transactions and income recognition
Securities transactions are recorded on a trade date basis. Realized gains or losses are recorded on the basis of identified cost.
Interest income is accrued daily and bond discounts are accreted and premiums are amortized daily. To the extent debt obligations are placed onnon-accrual status, any related interest income may be reduced by writing off interest receivables when the collection of all or a portion of interest has been determined to be doubtful based on consistently applied procedures and the fair value has decreased. If the issuer subsequently resumes interest payments or when the collectability of interest is reasonably assured, the debt obligation is removed fromnon-accrual status.
Income from foreign securities is recorded net of foreign taxes withheld where recovery of such taxes is not assured.
Distributions to shareholders
Distributions to shareholders are recorded on theex-dividend date and paid from net investment income quarterly and any net realized gains are paid at least annually. Such distributions are determined in accordance with income tax regulations and may differ from U.S. generally accepted accounting principles. Dividend sources are estimated at the time of declaration. The tax character of distributions is determined as of the Fund’s fiscal year end. Therefore, a portion of the Fund’s distributions made prior to the Fund’s fiscal year end may be categorized as a tax return of capital at year end.
Federal and other taxes
The Fund intends to continue to qualify as a regulated investment company by distributing substantially all of its investment company taxable income and any net realized capital gains (after reduction for capital loss carryforwards) sufficient to relieve it from all, or substantially all, federal income taxes. Accordingly, no provision for federal income taxes was required.
The Fund’s income and federal excise tax returns and all financial records supporting those returns for the prior three fiscal years are subject to examination by the federal and Delaware revenue authorities. Management has analyzed the Fund’s tax positions taken on federal, state, and foreign tax returns for all open tax years and does not believe that there are any uncertain tax positions that require recognition of a tax liability.
As of September 30, 2019, the aggregate cost of all investments for federal income tax purposes was $117,128,739 and the unrealized gains (losses) consisted of:
| | | | |
| |
Gross unrealized gains | | $ | 3,069,871 | |
| |
Gross unrealized losses | | | (3,194,461 | ) |
| |
Net unrealized losses | | $ | (124,590 | ) |
Reclassifications are made to the Fund’s capital accounts for permanent tax differences to reflect income and gains available for distribution (or available capital loss carryforwards) under federal income tax regulations. U.S. generally accepted accounting principles require that certain components of net assets be adjusted to reflect permanent differences between financial and tax reporting. These reclassifications have no effect on net assets or net asset values per share. At September 30, 2019, as a result of permanentbook-to-tax differences, the following reclassification adjustments were made on the Statement of Assets and Liabilities:
| | |
| Paid-in capital | | Total distributable loss |
| |
| $(4,029) | | $4,029 |
As of September 30, 2019, the Fund had capital loss carryforwards which consist of $2,154,566 in short-term capital losses and $2,816,693 in long-term capital losses.
26 | Wells Fargo International Bond Fund
Notes to financial statements
As of September 30, 2019, the Fund had current year net deferred post-October capital losses consisting of $1,296,764 inlong-term losses which will be recognized on the first day of the following fiscal year.
As of September 30, 2019, the Fund had a qualified late-year ordinary loss of $10,000,814 which will be recognized on the first day of the following fiscal year.
Class allocations
The separate classes of shares offered by the Fund differ principally in applicable sales charges, distribution, shareholder servicing, and administration fees. Class specific expenses are charged directly to that share class. Investment income, common fund-level expenses, and realized and unrealized gains (losses) on investments are allocated daily to each class of shares based on the relative proportion of net assets of each class.
3. FAIR VALUATION MEASUREMENTS
Fair value measurements of investments are determined within a framework that has established a fair value hierarchy based upon the various data inputs utilized in determining the value of the Fund’s investments. The three-level hierarchy gives the highest priority to unadjusted quoted prices in active markets for identical assets or liabilities (Level 1) and the lowest priority to unobservable inputs (Level 3). The Fund’s investments are classified within the fair value hierarchy based on the lowest level of input that is significant to the fair value measurement. The inputs are summarized into three broad levels as follows:
| ∎ | | Level 1 – quoted prices in active markets for identical securities |
| ∎ | | Level 2 – other significant observable inputs (including quoted prices for similar securities, interest rates, prepayment speeds, credit risk, etc.) |
| ∎ | | Level 3 – significant unobservable inputs (including the Fund’s own assumptions in determining the fair value of investments) |
The inputs or methodologies used for valuing investments in securities are not necessarily an indication of the risk associated with investing in those securities.
The following is a summary of the inputs used in valuing the Fund’s assets and liabilities as of September 30, 2019:
| | | | | | | | | | | | | | | | |
| | | | |
| | | Quoted prices
(Level 1) | | | Other significant
observable inputs
(Level 2) | | | Significant
unobservable inputs (Level 3) | | | Total | |
| | | | |
Assets | | | | | | | | | | | | | | | | |
Investments in: | | | | | | | | | | | | | | | | |
| | | | |
Corporate bonds and notes | | $ | 0 | | | $ | 8,252,811 | | | $ | 0 | | | $ | 8,252,811 | |
| | | | |
Foreign corporate bonds and notes | | | 0 | | | | 14,424,274 | | | | 0 | | | | 14,424,274 | |
| | | | |
Foreign government bonds | | | 0 | | | | 83,670,357 | | | | 0 | | | | 83,670,357 | |
| | | | |
U.S. Treasury securities | | | 6,731,959 | | | | 0 | | | | 0 | | | | 6,731,959 | |
| | | | |
Yankee corporate bonds and notes | | | 0 | | | | 4,186,524 | | | | 0 | | | | 4,186,524 | |
| | | | |
Short-term investments | | | | | | | | | | | | | | | | |
| | | | |
Investment companies | | | 446,052 | | | | 0 | | | | 0 | | | | 446,052 | |
| | | | |
| | | 7,178,011 | | | | 110,533,966 | | | | 0 | | | | 117,711,977 | |
| | | | |
Forward foreign currency contracts | | | 0 | | | | 976,001 | | | | 0 | | | | 976,001 | |
| | | | |
Total assets | | $ | 7,178,011 | | | $ | 111,509,967 | | | $ | 0 | | | $ | 118,687,978 | |
| | | | |
Liabilities | | | | | | | | | | | | | | | | |
| | | | |
Forward foreign currency contracts | | $ | 0 | | | $ | 1,683,829 | | | $ | 0 | | | $ | 1,683,829 | |
| | | | |
Total liabilities | | $ | 0 | | | $ | 1,683,829 | | | $ | 0 | | | $ | 1,683,829 | |
Additional sector, industry or geographic detail is included in the Portfolio of Investments.
Forward foreign currency contracts are reported at their cumulative unrealized gains (losses) at measurement date as reported in the table following the Portfolio of Investments. All other assets and liabilities are reported at their market value at measurement date.
During the year ended September 30, 2019, the Fund did not have any transfers into/out of Level 3.
Wells Fargo International Bond Fund | 27
Notes to financial statements
4. TRANSACTIONS WITH AFFILIATES
Management fee
Funds Management, an indirect wholly owned subsidiary of Wells Fargo & Company (“Wells Fargo”), is the manager of the Fund and provides advisory and fund-level administrative services under an investment management agreement. Under the investment management agreement, Funds Management is responsible for, among other services, implementing the investment objectives and strategies of the Fund, supervising the subadviser and providing fund-level administrative services in connection with the Fund’s operations. As compensation for its services under the investment management agreement, Funds Management is entitled to receive a management fee at the following annual rate based on the Fund’s average daily net assets:
| | | | |
| |
| Average daily net assets | | Management fee | |
| |
First $500 million | | | 0.600 | % |
| |
Next $500 million | | | 0.575 | |
| |
Next $2 billion | | | 0.550 | |
| |
Next $2 billion | | | 0.525 | |
| |
Next $5 billion | | | 0.490 | |
| |
Over $10 billion | | | 0.480 | |
For the year ended September 30, 2019, the management fee was equivalent to an annual rate of 0.60% of the Fund’s average daily net assets.
Funds Management has retained the services of a subadviser to provide daily portfolio management to the Fund. The fee for subadvisory services is borne by Funds Management. Wells Fargo Asset Management (International) Limited, an affiliate of Funds Management and an indirect wholly owned subsidiary of Wells Fargo, is the subadviser to the Fund and is entitled to receive a fee from Funds Management at an annual rate starting at 0.35% and declining to 0.20% as the average daily net assets of the Fund increase. Prior to August 1, 2019, Wells Fargo Asset Management (International), LLC was the subadviser for the Fund. Effective August 1, 2019, Wells Fargo Asset Management (International), LLC merged with Wells Fargo Asset Management (International) Limited and Wells Fargo Asset Management (International) Limited became the subadviser to the Fund. This transaction did not result in any changes to the services provided to the Fund or to the strategies or fees and expenses.
Administration fees
Under a class-level administration agreement, Funds Management provides class-level administrative services to the Fund, which includes paying fees and expenses for services provided by the transfer agent,sub-transfer agents, omnibus account servicers and record-keepers. As compensation for its services under the class-level administration agreement, Funds Management receives an annual fee which is calculated based on the average daily net assets of each class as follows:
| | | | |
| |
| | | Class-level
administration fee | |
| |
Class A, Class C | | | 0.16 | % |
| |
Class R6 | | | 0.03 | |
| |
Administrator Class | | | 0.10 | |
| |
Institutional Class | | | 0.08 | |
Waivers and/or expense reimbursements
Funds Management has contractually waived and/or reimbursed management and administration fees to the extent necessary to maintain certain net operating expense ratios for the Fund. When each class of the Fund has exceeded its expense cap, Funds Management has waived fees and/or reimbursed expenses from fund-level expenses on a proportionate basis and then from class specific expenses. When only certain classes exceed their expense caps, waivers and/or reimbursements are applied against class specific expenses before fund-level expenses. Funds Management has committed through January 31, 2020 to waive fees and/or reimburse expenses to the extent necessary to cap the Fund’s expenses at 1.03% for Class A shares, 1.78% for Class C shares, 0.65% for Class R6 shares, 0.85% for Administrator Class shares, and 0.70% for Institutional Class shares. Prior to or after the commitment expiration date, the cap may be increased or the commitment to maintain the cap may be terminated only with the approval of the Board of Trustees.
28 | Wells Fargo International Bond Fund
Notes to financial statements
Distribution fee
The Trust has adopted a distribution plan for Class C shares of the Fund pursuant to Rule12b-1 under the 1940 Act. A distribution fee is charged to Class C shares and paid to Wells Fargo Funds Distributor, LLC (“Funds Distributor”), the principal underwriter, at an annual rate of 0.75% of the average daily net assets of Class C shares.
In addition, Funds Distributor is entitled to receive thefront-end sales charge from the purchase of Class A shares and a contingent deferred sales charge on the redemption of certain Class A shares. Funds Distributor is also entitled to receive the contingent deferred sales charges from redemptions of Class C shares. For the year ended September 30, 2019, Funds Distributor received $179 from the sale of Class A shares. No contingent deferred sales charges were incurred by Class A and Class C shares for the year ended September 30, 2019.
Shareholder servicing fees
The Trust has entered into contracts with one or more shareholder servicing agents, whereby Class A, Class C, and Administrator Class of the Fund are charged a fee at an annual rate of 0.25% of the average daily net assets of each respective class. A portion of these total shareholder servicing fees were paid to affiliates of Wells Fargo.
Interfund transactions
The Fund may purchase or sell portfolio investment securities to certain other Wells Fargo affiliates pursuant to Rule17a-7 under the 1940 Act and under procedures adopted by the Board of Trustees. The procedures have been designed to ensure that these interfund transactions, which do not incur broker commissions, are effected at current market prices.
5. INVESTMENT PORTFOLIO TRANSACTIONS
Purchases and sales of investments, excluding short-term securities, for the year ended September 30, 2019 were as follows:
| | | | | | |
Purchases at cost | | Sales proceeds |
U.S.
government | | Non-U.S.
government | | U.S.
government | | Non-U.S.
government |
| $58,948,726 | | $210,539,776 | | $76,724,082 | | $455,753,013 |
6. DERIVATIVE TRANSACTIONS
During the year ended September 30, 2019, the Fund entered into forward foreign currency contracts for hedging purposes. The Fund had average contract amounts of $162,591,337 and $124,792,769 in forward foreign currency contracts to buy and forward foreign currency contracts to sell, respectively, during the year ended September 30, 2019.
The fair value, realized gains or losses and change in unrealized gains or losses, if any, on derivative instruments are reflected in the corresponding financial statement captions.
For certain types of derivative transactions, the Fund has entered into International Swaps and Derivatives Association, Inc. master agreements (“ISDA Master Agreements”) or similar agreements with approved counterparties. The ISDA Master Agreements or similar agreements may have requirements to deliver/deposit securities or cash to/with an exchange or broker-dealer as collateral and allows the Fund to offset, with each counterparty, certain derivative financial instrument’s assets and/or liabilities with collateral held or pledged. Collateral requirements differ by type of derivative. Collateral or margin requirements are set by the broker or exchange clearinghouse for exchange traded derivatives while collateral terms are contract specific forover-the-counter traded derivatives. Cash collateral that has been pledged to cover obligations of the Fund under ISDA Master Agreements or similar agreements, if any, are reported separately in the Statement of Assets and Liabilities. Securities pledged as collateral, if any, are noted in the Portfolio of Investments. With respect to balance sheet offsetting, absent an event of default by the counterparty or a termination of the agreement, the reported amounts of financial assets and financial liabilities in the Statement of Assets and Liabilities are not offset across transactions between the Fund and the applicable counterparty. A reconciliation of the gross amounts on the Statement of Assets and Liabilities to the net amounts by counterparty, including any collateral exposure, for OTC derivatives is as follows:
| | | | | | | | | | | | |
| | | | |
| Counterparty | | Gross amounts
of assets in the
Statement of
Assets and
Liabilities | | Amounts
subject to
netting
agreements | | Collateral
received | | | Net amount
of assets | |
| | | | |
State Street Bank | | $976,001 | | $(976,001) | | $ | 0 | | | $ | 0 | |
Wells Fargo International Bond Fund | 29
Notes to financial statements
| | | | | | | | | | | | |
| | | | |
| Counterparty | | Gross amounts
of liabilities in the
Statement of
Assets and
Liabilities | | Amounts
subject to
netting
agreements | | Collateral
pledged | | | Net amount
of liabilities | |
| | | | |
State Street Bank | | $1,683,829 | | $(976,001) | | $ | 0 | | | $ | 707,828 | |
7. BANK BORROWINGS
The Trust (excluding the money market funds), Wells Fargo Master Trust and Wells Fargo Variable Trust are parties to a $280,000,000 revolving credit agreement whereby the Fund is permitted to use bank borrowings for temporary or emergency purposes, such as to fund shareholder redemption requests. Interest under the credit agreement is charged to the Fund based on a borrowing rate equal to the higher of the Federal Funds rate in effect on that day plus 1.25% or the overnight LIBOR rate in effect on that day plus 1.25%. In addition, an annual commitment fee equal to 0.25% of the unused balance is allocated to each participating fund.
During the year ended September 30, 2019, the Fund had average borrowings outstanding of $137,324 at an average rate of 3.70% and paid interest in the amount of $5,081.
8. DISTRIBUTIONS TO SHAREHOLDERS
For the years ended September 30, 2019 and September 30, 2018, the Fund did not have any distributions paid to shareholders.
As of September 30, 2019, the components of distributable earnings on a tax basis were as follows:
| | | | | | |
Unrealized
losses | | Late-year
ordinary losses
deferred | | Post-October
capital losses
deferred | | Capital loss
carryforward |
| | | |
| $(145,413) | | $(10,000,814) | | $(1,296,764) | | $(4,971,259) |
9. INDEMNIFICATION
Under the Trust’s organizational documents, the officers and Trustees have been granted certain indemnification rights against certain liabilities that may arise out of performance of their duties to the Trust. Additionally, in the normal course of business, the Trust may enter into contracts with service providers that contain a variety of indemnification clauses. The Trust’s maximum exposure under these arrangements is dependent on future claims that may be made against the Fund and, therefore, cannot be estimated.
10. NEW ACCOUNTING PRONOUNCEMENTS
In August 2018, FASB issued Accounting Standards Update (“ASU”)No. 2018-13, Fair Value Measurement (Topic 820)Disclosure Framework—Changes to the Disclosure Requirements for Fair Value Measurement. ASU2018-13 updates the disclosure requirements for fair value measurements by modifying or removing certain disclosures and adding certain new disclosures. The amendments are effective for fiscal years, and interim periods within those fiscal years, beginning after December 15, 2019. Early adoption is permitted. Management has adopted the removal and modification of disclosures early, as permitted, and will adopt the additional new disclosures at the effective date.
In March 2017, FASB issued ASUNo. 2017-08,Premium Amortization on Purchased Callable Debt Securities. ASU2017-08 shortens the amortization period for certain callable debt securities held at a premium and requires the premium to be amortized to the earliest call date. The amendments do not require an accounting change for securities held at a discount and discounts will continue to be accreted to the maturity date of the security. ASU2017-08 is effective for fiscal years beginning after December 15, 2018 and for interim periods within those fiscal years. During the current reporting period, management of the Fund adopted the change in accounting policy which did not have a material impact to the Fund’s financial statements.
30 | Wells Fargo International Bond Fund
Report of independent registered public accounting firm
TO THE SHAREHOLDERS OF THE FUND AND BOARD OF TRUSTEES OF WELLS FARGO FUNDS TRUST:
Opinion on the Financial Statements
We have audited the accompanying statement of assets and liabilities of Wells Fargo International Bond Fund (the Fund), one of the funds constituting Wells Fargo Funds Trust, including the portfolio of investments, as of September 30, 2019, the related statement of operations for the year then ended, the statements of changes in net assets for each of the years in the two-year period then ended, and the related notes (collectively, the financial statements) and the financial highlights for each of the years in the three-year period ended September 30, 2019, for the period ended September 30, 2016, and for each of the years in the two-year period ended October 31, 2015. In our opinion, the financial statements and financial highlights present fairly, in all material respects, the financial position of the Fund as of September 30, 2019, the results of its operations for the year then ended, the changes in its net assets for each of the years in the two-year period then ended, and the financial highlights for each of the years in the three-year period ended September 30, 2019, for the period ended September 30, 2016, and for each of the years in the two-year period ended October 31, 2015, in conformity with U.S. generally accepted accounting principles.
Basis for Opinion
These financial statements and financial highlights are the responsibility of the Fund’s management. Our responsibility is to express an opinion on these financial statements and financial highlights based on our audits. We are a public accounting firm registered with the Public Company Accounting Oversight Board (United States) (PCAOB) and are required to be independent with respect to the Fund in accordance with the U.S. federal securities laws and the applicable rules and regulations of the Securities and Exchange Commission and the PCAOB.
We conducted our audits in accordance with the standards of the PCAOB. Those standards require that we plan and perform the audit to obtain reasonable assurance about whether the financial statements and financial highlights are free of material misstatement, whether due to error or fraud. Our audits included performing procedures to assess the risks of material misstatement of the financial statements and financial highlights, whether due to error or fraud, and performing procedures that respond to those risks. Such procedures included examining, on a test basis, evidence regarding the amounts and disclosures in the financial statements and financial highlights. Such procedures also included confirmation of securities owned as of September 30, 2019, by correspondence with the custodian, transfer agent and brokers, or by other appropriate auditing procedures. Our audits also included evaluating the accounting principles used and significant estimates made by management, as well as evaluating the overall presentation of the financial statements and financial highlights. We believe that our audits provide a reasonable basis for our opinion.

We have not been able to determine the specific year that we began serving as the auditor of one or more Wells Fargo Funds investment companies; however we are aware that we have served as the auditor of one or more Wells Fargo Funds investment companies since at least 1955.
Boston, Massachusetts
November 25, 2019
Wells Fargo International Bond Fund | 31
Other information (unaudited)
PROXY VOTING INFORMATION
A description of the policies and procedures used to determine how to vote proxies relating to portfolio securities is available, upon request, by calling1-800-222-8222, visiting our website atwfam.com, or visiting the SEC website at sec.gov. Information regarding how the proxies related to portfolio securities were voted during the most recent12-month period ended June 30 is available on the website atwfam.comor by visiting the SEC website at sec.gov.
QUARTERLY PORTFOLIO HOLDINGS INFORMATION
The Fund files its complete schedule of portfolio holdings with the SEC for the first and third quarters of each fiscal year on Form N-Q or FormN-PORT, which is available by visiting the SEC website at sec.gov. Those forms may be reviewed and copied at the SEC’s Public Reference Room in Washington, DC. Information on the operation of the Public Reference Room may be obtained by calling1-800-SEC-0330.
32 | Wells Fargo International Bond Fund
Other information (unaudited)
BOARD OF TRUSTEES AND OFFICERS
Each of the Trustees and Officers1 listed in the table below acts in identical capacities for each fund in the Wells Fargo family of funds, which consists of 150 mutual funds comprising the Wells Fargo Funds Trust, Wells Fargo Variable Trust, Wells Fargo Master Trust and fourclosed-end funds (collectively the “Fund Complex”). This table should be read in conjunction with the Prospectus and the Statement of Additional Information2. The mailing address of each Trustee and Officer is 525 Market Street, 12th Floor, San Francisco, CA 94105. Each Trustee and Officer serves an indefinite term, however, each Trustee serves such term until reaching the mandatory retirement age established by the Trustees.
Independent Trustees
| | | | | | |
Name and
year of birth | | Position held and
length of service* | | Principal occupations during past five years or longer | | Current other
public company or
investment
company
directorships |
| | | |
| William R. Ebsworth (Born 1957) | | Trustee, since 2015 | | Retired. From 1984 to 2013, equities analyst, portfolio manager, research director and chief investment officer at Fidelity Management and Research Company in Boston, Tokyo, and Hong Kong, and retired in 2013 as Chief Investment Officer of Fidelity Strategic Advisers, Inc. where he led a team of investment professionals managing client assets. Prior thereto, Board member of Hong Kong Securities Clearing Co., Hong Kong Options Clearing Corp., the Thailand International Fund, Ltd., Fidelity Investments Life Insurance Company, and Empire Fidelity Investments Life Insurance Company. Audit Committee Chair and Investment Committee Chair of the Vincent Memorial Hospital Endowment(non-profit organization). Mr. Ebsworth is a CFA® charterholder. | | N/A |
| | | |
| Jane A. Freeman (Born 1953) | | Trustee, since 2015; Chair Liaison, since 2018 | | Retired. From 2012 to 2014 and 1999 to 2008, Chief Financial Officer of Scientific Learning Corporation. From 2008 to 2012, Ms. Freeman provided consulting services related to strategic business projects. Prior to 1999, Portfolio Manager at Rockefeller & Co. and Scudder, Stevens & Clark. Board member of the Harding Loevner Funds from 1996 to 2014, serving as both Lead Independent Director and chair of the Audit Committee. Board member of the Russell Exchange Traded Funds Trust from 2011 to 2012 and the chair of the Audit Committee. Ms. Freeman is a Board Member of The Ruth Bancroft Garden(non-profit organization). She is also an inactive Chartered Financial Analyst. | | N/A |
| | | |
| Isaiah Harris, Jr. (Born 1952) | | Trustee, since 2009; Audit Committee Chairman, since 2019 | | Retired. Chairman of the Board of CIGNA Corporation since 2009, and Director since 2005. From 2003 to 2011, Director of Deluxe Corporation. Prior thereto, President and CEO of BellSouth Advertising and Publishing Corp. from 2005 to 2007, President and CEO of BellSouth Enterprises from 2004 to 2005 and President of BellSouth Consumer Services from 2000 to 2003. Emeritus member of the Iowa State University Foundation Board of Governors. Emeritus Member of the Advisory Board of Iowa State University School of Business. Advisory Board Member, Palm Harbor Academy (private school). Advisory Board Member, Child Evangelism Fellowship(non-profit). Mr. Harris is a certified public accountant (inactive status). | | CIGNA Corporation |
| | | |
| Judith M. Johnson (Born 1949) | | Trustee, since 2008; Audit Committee Chairman, from 2009 to 2018 | | Retired. Prior thereto, Chief Executive Officer and Chief Investment Officer of Minneapolis Employees Retirement Fund from 1996 to 2008. Ms. Johnson is an attorney, certified public accountant and a certified managerial accountant. | | N/A |
Wells Fargo International Bond Fund | 33
Other information (unaudited)
| | | | | | |
Name and
year of birth | | Position held and
length of service* | | Principal occupations during past five years or longer | | Current other
public company or
investment
company
directorships |
| | | |
| David F. Larcker (Born 1950) | | Trustee, since 2009 | | James Irvin Miller Professor of Accounting at the Graduate School of Business, Stanford University, Director of the Corporate Governance Research Initiative and Senior Faculty of The Rock Center for Corporate Governance since 2006. From 2005 to 2008, Professor of Accounting at the Graduate School of Business, Stanford University. Prior thereto, Ernst & Young Professor of Accounting at The Wharton School, University of Pennsylvania from 1985 to 2005. | | N/A |
| | | |
| Olivia S. Mitchell (Born 1953) | | Trustee, since 2006; Nominating and Governance Committee Chairman, since 2018 | | International Foundation of Employee Benefit Plans Professor, Wharton School of the University of Pennsylvania since 1993. Director of Wharton’s Pension Research Council and Boettner Center on Pensions & Retirement Research, and Research Associate at the National Bureau of Economic Research. Previously, Cornell University Professor from 1978 to 1993. | | N/A |
| | | |
| Timothy J. Penny (Born 1951) | | Trustee, since 1996; Chairman, since 2018 | | President and Chief Executive Officer of Southern Minnesota Initiative Foundation, anon-profit organization, since 2007. Member of the Board of Trustees of NorthStar Education Finance, Inc., anon-profit organization, since 2007. | | N/A |
| | | |
| James G. Polisson (Born 1959) | | Trustee, since 2018 | | Retired. Chief Marketing Officer, Source (ETF) UK Services, Ltd, from 2015 to 2017. From 2012 to 2015, Principal of The Polisson Group, LLC, a management consulting, corporate advisory and principal investing company. Chief Executive Officer and Managing Director at Russell Investments, Global Exchange Traded Funds from 2010 to 2012. Managing Director of Barclays Global Investors from 1998 to 2010 and Global Chief Marketing Officer for iShares and Barclays Global Investors from 2000 to 2010. Trustee of the San Francisco Mechanics’ Institute, anon-profit organization, from 2013 to 2015. Board member of the Russell Exchange Traded Fund Trust from 2011 to 2012. Director of Barclays Global Investors Holdings Deutschland GmbH from 2006 to 2009. Mr. Polisson is an attorney and has a retired status with the Massachusetts and District of Columbia Bar Associations. | | N/A |
| * | Length of service dates reflect the Trustee’s commencement of service with the Trust’s predecessor entities, where applicable. |
34 | Wells Fargo International Bond Fund
Other information (unaudited)
Officers
| | | | |
Name and
year of birth | | Position held and
length of service | | Principal occupations during past five years or longer |
| | |
| Andrew Owen (Born 1960) | | President, since 2017 | | Executive Vice President of Wells Fargo & Company and Head of Affiliated Managers, Wells Fargo Asset Management, since 2014. In addition, Mr. Owen is currently President, Chief Executive Officer and Director of Wells Fargo Funds Management, LLC since 2017. Prior thereto, Executive Vice President responsible for marketing, investments and product development for Wells Fargo Funds Management, LLC, from 2009 to 2014. |
| | |
| Nancy Wiser1(Born 1967) | | Treasurer, since 2012 | | Executive Vice President of Wells Fargo Funds Management, LLC since 2011. Chief Operating Officer and Chief Compliance Officer at LightBox Capital Management LLC, from 2008 to 2011. |
| | |
| Michelle Rhee3(Born 1966) | | Chief Legal Officer, since 2019 | | Secretary of Wells Fargo Funds Management, LLC, Chief Legal Counsel of Wells Fargo Asset Management and Assistant General Counsel of Wells Fargo Bank, N.A. since 2018. Associate General Counsel and Managing Director of Bank of America Corporation from 2004 to 2018. |
| | |
| Catherine Kennedy4(Born 1969) | | Secretary, since 2019 | | Vice President of Wells Fargo Funds Management, LLC and Senior Counsel of the Wells Fargo Legal Department since 2010. Vice President and Senior Counsel of Evergreen Investment Management Company, LLC from 1998 to 2010. |
| | |
| Michael H. Whitaker(Born 1967) | | Chief Compliance Officer, since 2016 | | Chief Compliance Officer of Wells Fargo Asset Management since 2016. Senior Vice President and Chief Compliance Officer for Fidelity Investments from 2007 to 2016. |
| | |
David Berardi (Born 1975) | | Assistant Treasurer, since 2009 | | Vice President of Wells Fargo Funds Management, LLC since 2009. Vice President of Evergreen Investment Management Company, LLC from 2008 to 2010. Manager of Fund Reporting and Control for Evergreen Investment Management Company, LLC from 2004 to 2010. |
| | |
| Jeremy DePalma1(Born 1974) | | Assistant Treasurer, since 2009 | | Senior Vice President of Wells Fargo Funds Management, LLC since 2009. Senior Vice President of Evergreen Investment Management Company, LLC from 2008 to 2010 and head of the Fund Reporting and Control Team within Fund Administration from 2005 to 2010. |
| 1 | Nancy Wiser acts as Treasurer of 64 funds in the Fund Complex. Jeremy DePalma acts as Treasurer of 86 funds and Assistant Treasurer of 64 funds in the Fund Complex. |
| 2 | The Statement of Additional Information includes additional information about the Trustees and is available, without charge, upon request, by calling1-800-222-8222 or by visiting the website atwfam.com. |
| 3 | Michelle Rhee became Chief Legal Officer effective October 22, 2019. |
| 4 | Catherine Kennedy became Secretary effective October 22, 2019. |
Wells Fargo International Bond Fund | 35
Other information (unaudited)
BOARD CONSIDERATION OF INVESTMENT MANAGEMENT ANDSUB-ADVISORY AGREEMENTS:
Wells Fargo International Bond Fund
Under the Investment Company Act of 1940 (the “1940 Act”), the Board of Trustees (the “Board”) of Wells Fargo Funds Trust (the “Trust”) must determine annually whether to approve the continuation of the Trust’s investment management andsub-advisory agreements. In this regard, at anin-person meeting held on May21-22, 2019 (the “Meeting”), the Board, all the members of which have no direct or indirect interest in the investment management andsub-advisory agreements and are not “interested persons” of the Trust, as defined in the 1940 Act (the “Independent Trustees”), reviewed and approved for Wells Fargo International Bond Fund(the “Fund”): (i) an investment management agreement (the “Management Agreement”) with Wells Fargo Funds Management, LLC (“Funds Management”); and (ii) an investmentsub-advisory agreement (the“Sub-Advisory Agreement”) with Wells Fargo Asset Management (International), LLC (the“Sub-Adviser”), an affiliate of Funds Management. The Management Agreement and theSub-Advisory Agreement are collectively referred to as the “Advisory Agreements.”
At the Meeting, the Board considered the factors and reached the conclusions described below relating to the selection of Funds Management and theSub-Adviser and the approval of the Advisory Agreements. Prior to the Meeting, including at anin-person meeting in April 2019, the Trustees conferred extensively among themselves and with representatives of Funds Management about these matters. Also, the Board has adopted a team-based approach, with each team consisting of asub-set of Trustees, to assist the full Board in the discharge of its duties in reviewing investment performance and other matters throughout the year. The Independent Trustees were assisted in their evaluation of the Advisory Agreements by independent legal counsel, from whom they received separate legal advice and with whom they met separately.
In providing information to the Board, Funds Management and theSub-Adviser were guided by a detailed set of requests for information submitted to them by independent legal counsel on behalf of the Independent Trustees at the start of the Board’s annual contract renewal process earlier in 2019. In considering and approving the Advisory Agreements, the Trustees considered the information they believed relevant, including but not limited to the information discussed below. The Board considered not only the specific information presented in connection with the Meeting, but also the knowledge gained over time through interaction with Funds Management and theSub-Adviser about various topics. In this regard, the Board reviewed reports of Funds Management at each of its quarterly meetings, which included, among other things, portfolio reviews and investment performance reports. In addition, the Board and the teams mentioned above confer with portfolio managers at various times throughout the year. The Board did not identify any particular information or consideration that wasall-important or controlling, and each individual Trustee may have attributed different weights to various factors.
After its deliberations, the Board unanimously approved the continuation of the Advisory Agreements for aone-year term and determined that the compensation payable to Funds Management and theSub-Adviser under each of the Advisory Agreements was reasonable. The Board considered the approval of the Advisory Agreements for the Fund as part of its consideration of agreements for funds across the complex, but its approvals were made on afund-by-fund basis. The following summarizes a number of important, but not necessarily all, factors considered by the Board in support of its approvals.
Nature, extent and quality of services
The Board received and considered various information regarding the nature, extent and quality of services provided to the Fund by Funds Management and theSub-Adviser under the Advisory Agreements. This information included a description of the investment advisory services and Fund-level administrative services covered by the Management Agreement, as well as, among other things, a summary of the background and experience of senior management of Wells Fargo Asset Management (“WFAM”), of which Funds Management and theSub-Adviser are a part, a summary of investments made in the business of WFAM, a summary of certain organizational and personnel changes involving Funds Management and theSub-Adviser, and a description of Funds Management’s and theSub-Adviser’s business continuity planning programs and of their approaches to data privacy and cybersecurity. The Board received and reviewed information about Funds Management’s role as administrator of the Fund’s liquidity risk management program. The Board also considered the qualifications, background, tenure and responsibilities of each of the portfolio managers primarily responsible for theday-to-day portfolio management of the Fund.
The Board evaluated the ability of Funds Management and theSub-Adviser to attract and retain qualified investment professionals, including research, advisory and supervisory personnel. The Board further considered the compliance programs and compliance records of Funds Management and theSub-Adviser. In addition, the Board took into account the full range of services provided to the Fund by Funds Management and its affiliates.
36 | Wells Fargo International Bond Fund
Other information (unaudited)
Fund investment performance and expenses
The Board considered the investment performance results for the Fund over various time periods ended December 31, 2018. The Board considered these results in comparison to the investment performance of funds in a universe that was determined by Broadridge Inc. (“Broadridge”) to be similar to the Fund (the “Universe”), and in comparison to the Fund’s benchmark index and to other comparative data. Broadridge is an independent provider of investment company data. The Board received a description of the methodology used by Broadridge to select the mutual funds in the performance Universe. The Board noted that the investment performance of the Fund (Class A) was lower than the average investment performance of the Universe for all periods under review. The Board also noted that the investment performance of the Fund was lower than its benchmark index, the Bloomberg Barclays Global Aggregateex-USD Index, for theone-, three- and five-year periods under review, but in range of its benchmark for theten-year period under review.
The Board received information concerning, and discussed factors contributing to, the underperformance of the Fund relative to the Universe and benchmark for the periods identified above. The Board took note of the explanations for the relative underperformance during these periods, including with respect to investment decisions that affected the Fund’s investment performance.
The Board also received and considered information regarding the Fund’s net operating expense ratios and their various components, including actual management fees, custodian and othernon-management fees, and Rule12b-1 andnon-Rule12b-1 shareholder service fees. The Board considered these ratios in comparison to the median ratios of funds in class-specific expense groups that were determined by Broadridge to be similar to the Fund (the “Groups”). The Board received a description of the methodology used by Broadridge to select the mutual funds in the expense Groups and an explanation of how funds comprising expense groups and their expense ratios may vary fromyear-to-year. Based on the Broadridge reports, the Board noted that the net operating expense ratios of the Fund were equal to or lower than the median net operating expense ratios of the expense Groups for each share class.
The Board took into account the Fund’s investment performance and expense information provided to it among the factors considered in deciding tore-approve the Advisory Agreements.
Investment management andsub-advisory fee rates
The Board reviewed and considered the contractual fee rates payable by the Fund to Funds Management under the Management Agreement, as well as the contractual fee rates payable by the Fund to Funds Management for class-level administrative services under a Class-Level Administration Agreement, which include, among other things, class-level transfer agency andsub-transfer agency costs (collectively, the “Management Rates”). The Board also reviewed and considered the contractual investmentsub-advisory fee rates that are payable by Funds Management to theSub-Adviser for investmentsub-advisory services.
Among other information reviewed by the Board was a comparison of the Fund’s Management Rates with the average contractual investment management fee rates of funds in the expense Groups at a common asset level as well as transfer agency costs of the funds in the expense Groups. The Board noted that the Management Rates of the Fund were equal to, in range of, or lower than the sum of these average rates for the Fund’s expense Groups for all share classes.
The Board also received and considered information about the portion of the total management fee that was retained by Funds Management after payment of the fee to theSub-Adviser forsub-advisory services. In assessing the reasonableness of this amount, the Board received and evaluated information about the nature and extent of responsibilities retained and risks assumed by Funds Management and not delegated to or assumed by theSub-Adviser, and about Funds Management’son-going oversight services. Given the affiliation between Funds Management and theSub-Adviser, the Board ascribed limited relevance to the allocation of fees between them.
The Board also received and considered information about the nature and extent of services offered and fee rates charged by Funds Management and theSub-Adviser to other types of clients with investment strategies similar to those of the Fund. In this regard, the Board received information about the significantly greater scope of services, and compliance, reporting and other legal burdens and risks of managing proprietary mutual funds compared with those associated with managing assets of other types of clients, including third-partysub-advised fund clients andnon-mutual fund clients such as institutional separate accounts.
Based on its consideration of the factors and information it deemed relevant, including those described here, the Board determined that the compensation payable to Funds Management under the Management Agreement and to theSub-Adviser under theSub-Advisory Agreement was reasonable.
Wells Fargo International Bond Fund | 37
Other information (unaudited)
Profitability
The Board received and considered information concerning the profitability of Funds Management, as well as the profitability of both WFAM and Wells Fargo & Co. (“Wells Fargo”) from providing services to the fund family as a whole. The Board noted that theSub-Adviser’s profitability information with respect to providing services to the Fund and other funds in the family was subsumed in the WFAM and Wells Fargo profitability analysis.
Funds Management reported on the methodologies and estimates used in calculating profitability, including a description of the methodology used to allocate certain expenses. Among other things, the Board noted that the levels of profitability reported on afund-by-fund basis varied widely, depending on factors such as the size, type and age of fund. Based on its review, the Board did not deem the profits reported by Funds Management, WFAM or Wells Fargo from services provided to the Fund to be at a level that would prevent it from approving the continuation of the Advisory Agreements.
Economies of scale
The Board received and considered information about the potential for Funds Management to experience economies of scale in the provision of management services to the Fund, the difficulties of calculating economies of scale at an individual fund level, and the extent to which potential scale benefits are shared with shareholders. The Board noted the existence of breakpoints in the Fund’s management fee structure, which operate generally to reduce the Fund’s expense ratios as the Fund grows in size. The Board considered that in addition to management fee breakpoints, Funds Management shares potential economies of scale from its management business in a variety of ways, including through fee waiver and expense reimbursement arrangements, services that benefit shareholders, competitive management fee rates set at the outset without regard to breakpoints, and investments in the business intended to enhance services available to shareholders.
The Board concluded that Funds Management’s arrangements with respect to the Fund, including contractual breakpoints, constituted a reasonable approach to sharing potential economies of scale with the Fund and its shareholders.
Other benefits to Funds Management and theSub-Adviser
The Board received and considered information regarding potential“fall-out” or ancillary benefits received by Funds Management and its affiliates, including theSub-Adviser, as a result of their relationships with the Fund. Ancillary benefits could include, among others, benefits directly attributable to other relationships with the Fund and benefits potentially derived from an increase in Funds Management’s and theSub-Adviser’s business as a result of their relationships with the Fund. The Board noted that various affiliates of Funds Management may receive distribution-related fees, shareholder servicing payments andsub-transfer agency fees in respect of shares sold or held through them and services provided.
The Board also reviewed information about soft dollar credits earned and utilized by theSub-Adviser, fees earned by Funds Management from managing a private investment vehicle for the fund family’s securities lending collateral, and commissions earned by an affiliated broker from portfolio transactions.
Based on its consideration of the factors and information it deemed relevant, including those described here, the Board did not find that any ancillary benefits received by Funds Management and its affiliates, including theSub-Adviser, were unreasonable.
Conclusion
At the Meeting, after considering the above-described factors and based on its deliberations and its evaluation of the information described above, the Board unanimously approved the continuation of the Advisory Agreements for aone-year term and determined that the compensation payable to Funds Management and theSub-Adviser under each of the Advisory Agreements was reasonable.
38 | Wells Fargo International Bond Fund
This page is intentionally left blank.
This page is intentionally left blank.

For more information
More information about Wells Fargo Funds is available free upon request. To obtain literature, please write, visit the Fund’s website, or call:
Wells Fargo Funds
P.O. Box 219967
Kansas City, MO 64121-9967
Website:wfam.com
Individual investors:1-800-222-8222
Retail investment professionals:1-888-877-9275
Institutional investment professionals:1-866-765-0778

This report and the financial statements contained herein are submitted for the general information of the shareholders of the Fund. If this report is used for promotional purposes, distribution of the report must be accompanied or preceded by a current prospectus. Before investing, please consider the investment objectives, risks, charges, and expenses of the investment. For a current prospectus and, if available, a summary prospectus, containing this information, call1-800-222-8222 or visit the Fund’s website atwfam.com. Read the prospectus carefully before you invest or send money.
Wells Fargo Asset Management (WFAM) is the trade name for certain investment advisory/management firms owned by Wells Fargo & Company. These firms include but are not limited to Wells Capital Management Incorporated and Wells Fargo Funds Management, LLC. Certain products managed by WFAM entities are distributed by Wells Fargo Funds Distributor, LLC (a broker-dealer and Member FINRA).
This material is for general informational and educational purposes only and is NOT intended to provide investment advice or a recommendation of any kind—including a recommendation for any specific investment, strategy, or plan.
INVESTMENT PRODUCTS: NOT FDIC INSURED ◾ NO BANK GUARANTEE ◾ MAY LOSE VALUE
© Wells Fargo & Company. All rights reserved.
406808 11-19
A235/AR235 09-19
Annual Report
September 30, 2019
Wells Fargo Strategic Income Fund
Beginning on January 1, 2021, as permitted by new regulations adopted by the Securities and Exchange Commission, paper copies of the Wells Fargo Funds’ annual and semi-annual shareholder reports issued after this date will no longer be sent by mail, unless you specifically request paper copies of the reports. Instead, the reports will be made available on the Funds’ website, and you will be notified by mail each time a report is posted and provided with a website address to access the report.
If you already elected to receive shareholder reports electronically, you will not be affected by this change and you need not take any action. You may elect to receive shareholder reports and other communications from the Fund electronically at any time by contacting your financial intermediary (such as a broker-dealer or bank) or, if you are a direct investor, by calling1-800-222-8222 or by enrolling at wellsfargo.com/advantagedelivery.
You may elect to receive all future reports in paper free of charge. If you invest through a financial intermediary, you can contact your financial intermediary to request that you continue to receive paper copies of your shareholder reports; if you invest directly with the Fund, you can call 1-800-222-8222. Your election to receive reports in paper will apply to all Wells Fargo Funds held in your account with your financial intermediary or, if you are a direct investor, to all Wells Fargo Funds that you hold.
|
|
|
Reduce clutter. Save trees. |
Sign up for electronic delivery of prospectuses and shareholder reports at wellsfargo.com/ advantagedelivery |
The views expressed and any forward-looking statements are as of September 30, 2019, unless otherwise noted, and are those of the Fund managers and/or Wells Fargo Asset Management. Discussions of individual securities, or the markets generally, or any Wells Fargo Fund are not intended as individual recommendations. Future events or results may vary significantly from those expressed in any forward-looking statements. The views expressed are subject to change at any time in response to changing circumstances in the market. Wells Fargo Asset Management and the Fund disclaim any obligation to publicly update or revise any views expressed or forward-looking statements.
INVESTMENT PRODUCTS: NOT FDIC INSURED ◾ NO BANK GUARANTEE ◾ MAY LOSE VALUE
Wells Fargo Strategic Income Fund | 1
Letter to shareholders (unaudited)

Andrew Owen
President
Wells Fargo Funds
“December’s S&P 500 Index performance was the worst since 1931.”
Dear Shareholder:
We are pleased to offer you this annual report for the Wells Fargo Strategic Income Fund for the12-month period that ended September 30, 2019. After the first half of the period yielded eitherlow-single-digit or negative investment returns, U.S. stock and global bond investors generally saw markets recover during the second half amid intensifying market volatility, global economic growth concerns, international trade stare downs, and simmering geopolitical tensions.
Overall, fixed-income investors enjoyed a distinct advantage over stock investors. For the period, U.S. stocks, based on the S&P 500 Index,1 gained 4.25% and international stocks, as measured by the MSCI ACWI ex USA Index (Net),2 fell 1.23%. The MSCI EM Index (Net)3 slipped 2.02%. Among fixed income investors, the Bloomberg Barclays U.S. Aggregate Bond Index4 added 10.30%, the Bloomberg Barclays Global Aggregateex-USD Index5 added 5.34%, the Bloomberg Barclays Municipal Bond Index6 gained 8.55%, and the ICE BofAML U.S. High Yield Index7 added 6.30%.
Investors confronted unsettling events during the fourth quarter of 2018.
During the fourth quarter of 2018, investors grew concerned about the pace and sustainability of the global economic expansion. The U.S. Bureau of Economic Analysis reported third-quarter U.S. gross domestic product (GDP) was 3.4% on an annualized basis, which was down from the second-quarter rate. A partial U.S. government shutdown occurred, which extended into January 2019. Brexit efforts stalled, causing uncertainty for the eurozone. The value of the renminbi declined even as the People’s Bank of China cut reserve requirement ratios, accelerated infrastructure spending, and cut taxes in efforts to spur economic activity.
The combination of news in the U.S. and generally weak economic indicators outside of the U.S. caused investors to seek safe havens. December’s S&P 500 Index performance was the worst since 1931. Globally, fixed-income investments fared better than stocks during the last two months of the year. Even as indicators suggested growth was restrained, the U.S. Federal Reserve (Fed) increased the federal funds rate by 25 basis points (bps; 100 bps equal 1.00%) in December 2018 to a target range of between 2.25% and 2.50%. Many observers expressed concerns that higher rates could slow the economy further.
| 1 | The S&P 500 Index consists of 500 stocks chosen for market size, liquidity, and industry group representation. It is a market-value-weighted index with each stock’s weight in the index proportionate to its market value. You cannot invest directly in an index. |
| 2 | The Morgan Stanley Capital International (MSCI) All Country World Index (ACWI) ex USA Index (Net) is a free-float-adjustedmarket-capitalization weighted index that is designed to measure the equity market performance of developed and emerging markets, excluding the U.S. Source: MSCI. MSCI makes no express or implied warranties or representations and shall have no liability whatsoever with respect to any MSCI data contained herein. The MSCI data may not be further redistributed or used as a basis for other indices or any securities or financial products. This report is not approved, reviewed, or produced by MSCI. You cannot invest directly in an index. |
| 3 | The MSCI Emerging Markets (EM) Index (Net) is a free-float-adjusted market-capitalization-weighted index that is designed to measure the equity market performance of emerging markets. You cannot invest directly in an index. |
| 4 | The Bloomberg Barclays U.S. Aggregate Bond Index is a broad-based benchmark that measures the investment-grade, U.S. dollar-denominated, fixed-rate taxable bond market, including Treasuries, government-related and corporate securities, mortgage-backed securities (agency fixed-rate and hybrid adjustable-rate mortgage pass-throughs), asset-backed securities, and commercial mortgage-backed securities. You cannot invest directly in an index. |
| 5 | The Bloomberg Barclays Global Aggregateex-USD Index is an unmanaged index that provides a broad-based measure of the global investment-grade fixed-income markets excluding the U.S. dollar-denominated debt market. You cannot invest directly in an index. |
| 6 | The Bloomberg Barclays Municipal Bond Index is an unmanaged index composed of long-termtax-exempt bonds with a minimum credit rating of Baa. You cannot invest directly in an index. |
| 7 | The ICE BofAML U.S. High Yield Index is a market-capitalization-weighted index of domestic and Yankee high-yield bonds. The index tracks the performance of high-yield securities traded in the U.S. bond market. You cannot invest directly in an index. Copyright 2019. ICE Data Indices, LLC. All rights reserved. |
2 | Wells Fargo Strategic Income Fund
Letter to shareholders (unaudited)
The market climbs a wall of worry.
Investment returns early in 2019 appeared to reaffirm the adage that markets climb a wall of worry as the new year began. The S&P 500 Index gained 8.01% for the month of January, the best monthly performance in 30 years. Returns for the MSCI ACWI ex USA Index (Net), the Bloomberg Barclays U.S. Aggregate Bond Index, and the Bloomberg Barclays Global Aggregateex-USD Index also were positive.
In February 2019, signs of slowing global growth grew more ominous. The Bureau of Economic Analysis announced fourth-quarter 2018 GDP grew at an annualized 2.2% rate, a slower rate than reported for the prior two quarters. In a February report, the Bank of England forecast the slowest growth for 2019 since the financial crisis. China and the U.S. continued to wrangle over trade issues. By the end of the first quarter of 2019, more accommodative Fed sentiment and steady, if not spectacular, U.S. economic and business metrics encouraged domestic investors.
Early second-quarter 2019 enthusiasm among investors faded.
During April 2019, favorable sentiment found additional support in reports of sustained low inflation, solid employment data, and first-quarter U.S. GDP of an annualized rate of 3.2%. During May, markets tumbled on mixed investment signals. In the U.S., partisan wrangling ramped up as Democrats and Republicans set their sights on 2020 presidential politics. The U.K.’s Brexit disagreements caused Prime Minister Theresa May to resign. Boris Johnson succeeded her only to exacerbate uncertainty about Brexit’s resolution ahead of an October 2019 deadline. The European Commission downgraded the 2019 growth forecast to 1.2%. The U.S. increased tariffs on products from China, China responded, and then talks broke down. President Donald Trump threatened to turn his foreign policy tariff tool to Mexico over immigration issues.
During the third quarter of 2019, investors regrouped. Just as the investment horizon appeared to darken, sentiment turned and U.S. equity markets gained during June and July. The gains, primarily driven by geopolitical and monetary policy events, pushed equity markets to new highs. European Central Bank President Mario Draghi said that if the outlook doesn’t improve, the bank would cut rates or buy more assets to prop up inflation. President Trump backed off of tariff threats against Mexico and China. In the U.S., the Fed implemented a 0.25% federal funds rate cut in July.
Later in July 2019, the U.S. reversed course and threatened to impose higher tariffs on China’s exports after talks failed. China responded with tariff threats of its own and devalued the renminbi, a move that roiled global markets. Major U.S. stock market indices closed July with the worst weekly results of the year. Bond prices gained as Treasury yields fell to levels not seen since November 2016 and the yield curve inverted at multiple points along the30-year arc.
In a microcosm, August 2019 encapsulated many of the unnerving events that plagued investors during the prior 11 months. The U.S.-China trade relationship swung from antagonistic to hopeful and back again with no evident compromise on the horizon. Evidence of a continued global economic slowdown mounted. Central banks in China, New Zealand, and Thailand cut interest rates. Industrial and manufacturing data declined in China, Canada, Japan, and Germany. Adding to the uncertain environment, Italy’s prime minister resigned, many feared a crackdown in Hong Kong as protesters sustained their calls for reform throughout the month, and Boris Johnson planned to suspend Parliament as Brexit’s deadline neared.
In the U.S., September saw the Fed join other central banks in cutting interest rates. Manufacturing data in the U.S., as reported by the Institute for Supply Management, disappointed investors. The U.S. Congress announced it would pursue an impeachment investigation of President Trump. Meanwhile, the Brexit impasse showed no signs of
“The S&P 500 Index gained 8.01% for the month of January, the best monthly performance in 30 years.”
Wells Fargo Strategic Income Fund | 3
Letter to shareholders (unaudited)
|
|
|
For further information about your Fund, contact your investment professional, visit our website at wfam.com, or call us directly at1-800-222-8222. |
resolution. Officials in China said that hitting the country’s economic growth goals for the year would be difficult considering the weight of tariffs and trade restrictions. So while the S&P 500 Index finished the third quarter withyear-to-date returns that were the best in more than 20 years, amid signs of equity investors taking money out of the stock market, concerns about future returns remained.
Don’t let short-term uncertainty derail long-term investment goals.
Periods of investment uncertainty can present challenges, but experience has taught us that maintaining long-term investment goals can be an effective way to plan for the future. To help you create a sound strategy based on your personal goals and risk tolerance, Wells Fargo Funds offers more than 100 mutual funds spanning a wide range of asset classes and investment styles. Although diversification cannot guarantee an investment profit or prevent losses, we believe it can be an effective way to manage investment risk and potentially smooth out overall portfolio performance. We encourage investors to know their investments and to understand that appropriate levels of risk-taking may potentially unlock opportunities.
Thank you for choosing to invest with Wells Fargo Funds. We appreciate your confidence in us and remain committed to helping you meet your financial needs.
Sincerely,

Andrew Owen
President
Wells Fargo Funds
4 | Wells Fargo Strategic Income Fund
This page is intentionally left blank.
Performance highlights (unaudited)
Investment objective
The Fund seeks total return, consisting of a high level of current income and capital appreciation.
Manager
Wells Fargo Funds Management, LLC
Subadvisers
Wells Capital Management Incorporated
Wells Fargo Asset Management (International) Limited
Portfolio managers
Niklas Nordenfelt, CFA®‡
Alex Perrin
Scott M. Smith, CFA®‡
Lauren van Biljon, CFA®‡
Noah Wise, CFA®‡
Average annual total returns (%) as of September 30, 2019
| | | | | | | | | | | | | | | | | | | | | | | | | | | | | | | | | | |
| | | | |
| | | | | Including sales charge | | | Excluding sales charge | | | Expense ratios1 (%) | |
| | | | | | | | | |
| | | Inception date | | 1 year | | | 5 year | | | Since
inception | | | 1 year | | | 5 year | | | Since
inception | | | Gross | | | Net2 | |
| | | | | | | | | | |
| Class A (WSIAX) | | 1-31-2013 | | | 0.51 | | | | 1.71 | | | | 1.49 | | | | 4.66 | | | | 2.54 | | | | 2.12 | | | | 1.47 | | | | 0.92 | |
| | | | | | | | | | |
| Class C (WSICX) | | 1-31-2013 | | | 3.00 | | | | 1.80 | | | | 1.38 | | | | 4.00 | | | | 1.80 | | | | 1.38 | | | | 2.22 | | | | 1.67 | |
| | | | | | | | | | |
| Administrator Class (WSIDX) | | 1-31-2013 | | | – | | | | – | | | | – | | | | 4.83 | | | | 2.67 | | | | 2.25 | | | | 1.41 | | | | 0.77 | |
| | | | | | | | | | |
| Institutional Class (WSINX) | | 1-31-2013 | | | – | | | | – | | | | – | | | | 5.00 | | | | 2.87 | | | | 2.44 | | | | 1.14 | | | | 0.62 | |
| | | | | | | | | | |
| Bloomberg Barclays U.S. Universal Bond Index3 | | – | | | – | | | | – | | | | – | | | | 10.07 | | | | 3.62 | | | | 3.21 | * | | | – | | | | – | |
| | | | | | | | | | |
| ICE BofAML3-Month LIBOR Constant Maturity Index4 | | – | | | – | | | | – | | | | – | | | | 2.64 | | | | 1.24 | | | | 0.99 | * | | | – | | | | – | |
| * | Return is based on Fund’s inception date. |
Figures quoted represent past performance, which is no guarantee of future results, and do not reflect taxes that a shareholder may pay on fund distributions or the redemption of fund shares. Investment return and principal value of an investment will fluctuate so that an investor’s shares, when redeemed, may be worth more or less than their original cost. Performance shown without sales charges would be lower if sales charges were reflected. Current performance may be lower or higher than the performance data quoted, which assumes the reinvestment of dividends and capital gains. Currentmonth-end performance is available on the Fund’s website,wfam.com.
Index returns do not include transaction costs associated with buying and selling securities, any mutual fund fees or expenses, or any taxes. It is not possible to invest directly in an index.
For Class A shares, the maximumfront-end sales charge is 4.00%. For Class C shares, the maximum contingent deferred sales charge is 1.00%. Performance including a contingent deferred sales charge assumes the sales charge for the corresponding time period. Administrator Class and Institutional Class shares are sold without afront-end sales charge or contingent deferred sales charge.
Bond values fluctuate in response to the financial condition of individual issuers, general market and economic conditions, and changes in interest rates. Changes in market conditions and government policies may lead to periods of heightened volatility in the bond market and reduced liquidity for certain bonds held by the Fund. In general, when interest rates rise, bond values fall and investors may lose principal value. Interest rate changes and their impact on the Fund and its share price can be sudden and unpredictable. High-yield securities have a greater risk of default and tend to be more volatile than higher-rated debt securities. Loans are subject to risks similar to those associated with other below investment- grade bond investments, such as credit risk (for example, risk of issuer default), below-investment-grade bond risk (for example, risk of greater volatility in value), and risk that the loan may become illiquid or difficult to price. Foreign investments are especially volatile and can rise or fall dramatically due to differences in the political and economic conditions of the host country. These risks are generally intensified in emerging markets. The use of derivatives may reduce returns and/or increase volatility. Certain investment strategies tend to increase the total risk of an investment (relative to the broader market). The Fund is exposed to mortgage- and asset-backed securities risk, regulatory risk, and geographic risk. Consult the Fund’s prospectus for additional information on these and other risks.
Please see footnotes on page 7.
6 | Wells Fargo Strategic Income Fund
Performance highlights (unaudited)
|
|
| Growth of $10,000 investment as of September 30, 20195 |
|
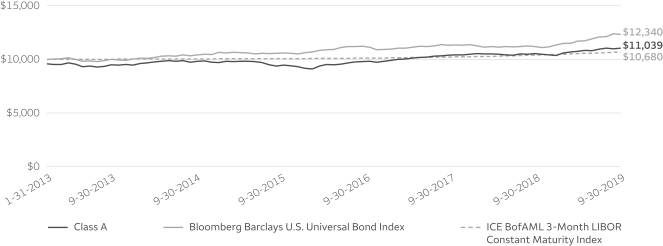
|
| ‡ | CFA® and Chartered Financial Analyst® are trademarks owned by CFA Institute. |
| 1 | Reflects the expense ratios as stated in the most recent prospectuses, which include the impact of 0.02% in acquired fund fees and expenses. The expense ratios shown are subject to change and may differ from the annualized expense ratios shown in the financial highlights of this report, which do not include acquired fund fees and expenses. |
| 2 | The manager has contractually committed through January 31, 2020, to waive fees and/or reimburse expenses to the extent necessary to cap the expenses of each class after fee waivers at 0.90% for Class A, 1.65% for Class C, 0.75% for Administrator Class, and 0.60% for Institutional Class. Brokerage commissions, stamp duty fees, interest, taxes, acquired fund fees and expenses (if any), and extraordinary expenses are excluded from the expense cap. Prior to or after the commitment expiration date, the cap may be increased or the commitment to maintain the cap may be terminated only with the approval of the Board of Trustees. Without this cap, the Fund’s returns would have been lower. The expense ratio paid by an investor is the net expense ratio (the total annual fund operating expenses after fee waivers) as stated in the prospectuses. |
| 3 | The Bloomberg Barclays U.S. Universal Bond Index is an unmanaged market-value-weighted performance benchmark for the U.S. dollar–denominated bond market, which includes investment-grade, high-yield, and emerging markets debt securities with maturities of one year or more. You cannot invest directly in an index. |
| 4 | The ICE BofAML3-Month LIBOR Constant Maturity Index is based on the assumed purchase of a synthetic instrument having 3 months to maturity and with a coupon equal to the closing quote for3-Month LIBOR. That issue is sold the following day (priced at a yield equal to the current day closing3-Month LIBOR rate) and is rolled into a new3-month instrument. The index, therefore, will always have a constant maturity equal to exactly 3 months. You cannot invest directly in an index. Copyright 2019. ICE Data Indices, LLC. All rights reserved. |
| 5 | The chart compares the performance of Class A shares since inception with the Bloomberg Barclays U.S. Universal Bond Index and the ICE BofAML3-Month LIBOR Constant Maturity Index. The chart assumes a hypothetical investment of $10,000 in Class A shares and reflects all operating expenses and assumes the maximum initial sales charge of 4.00%. |
| 6 | The Consumer Price Index (CPI) is a measure of the average change over time in the prices paid by urban consumers for a market basket of consumer goods and services. You cannot invest directly in an index. |
| 7 | The ten largest holdings, excluding cash, cash equivalents and any money market funds, are calculated based on the value of the investments divided by total net assets of the Fund. Holdings are subject to change and may have changed since the date specified. |
| 8 | Amounts are calculated based on the total long-term investments of the Fund. These amounts are subject to change and may have changed since the date specified. |
Wells Fargo Strategic Income Fund | 7
Performance highlights (unaudited)
MANAGER’S DISCUSSION
Fund highlights
| ∎ | | The Fund underperformed its index, the Bloomberg Barclays U.S. Universal Bond Index and outperformed the ICE BofAML3-Month LIBOR Constant Maturity Index for the12-month period that ended September 30, 2019. |
| ∎ | | The Fund’s shorter duration posture compared with the Bloomberg Barclays U.S. Universal Bond Index detracted from performance, while the longer duration position relative to the ICE BofAML3-Month LIBOR Constant Maturity Index contributed to performance. |
| ∎ | | The Fund’s holdings in European investment-grade and high-yield corporate bonds, asset-backed securities (ABS), collateralized loan obligations (CLOs), and emerging market bonds contributed to performance. U.S. high yield tended to underperform similar-duration Treasuries during the period and, while posting positive returns, was a detractor relative to the Bloomberg Barclays U.S. Universal Bond Index. |
Economic growth moderated and policy accommodation began.
Over the past four quarters, U.S. gross domestic product (GDP) grew by roughly 2% in real terms, which was in the range of the post-financial-crisis average, but has been trending slightly lower. Consumer spending was a contributor to growth over the period, topping business investment and government spending. Business investment, while being a contributor the prior year, started to wane and was a small detractor. Inventories and trade were also a net detractor from GDP growth, driven in part by the ongoing trade wars between the U.S. and China, among other countries.
While U.S. labor market job growth slowed towardperiod-end, it remains firm. Nonfarm payrolls expanded by an average of 179,000 jobs per month over the period, slightly lower than the prior period. The unemployment rate declined to 3.5% at the end of September 2019 from 3.7% a year earlier. Also encouraging was the increase in the employment/population ratio during the reporting period, reflecting both the fall in unemployment and a modest increase in the labor force participation rate. Wage gains of about 2.9% over the past 12 months were sufficient to support consumption growth without sparking fears of rising inflation. The CPI6 rose 1.7% over the past year, partially due to lower commodity prices from the prior year.
| | | | |
|
| Ten largest holdings(%) as of September 30, 20197 | |
| | |
SPDR Barclays High Yield Bond ETF | | | 2.92 | |
| | |
iShares JPMorgan USD Emerging Markets Bond ETF | | | 1.82 | |
| | |
Verus Securitization Trust Series2019-3 Class A2, 2.94%,7-25-2059 | | | 1.25 | |
| | |
Mexico, 6.50%,6-9-2022 | | | 1.24 | |
| | |
Russia, 6.90%,5-23-2029 | | | 1.24 | |
| | |
Indonesia, 7.00%,5-15-2022 | | | 1.19 | |
| | |
Bonos y Obligaciones del Estado, 0.25%,7-30-2024 | | | 1.12 | |
| | |
Longtrain Leasing III LLC Series2015-1A Class A2, 4.06%,1-15-2045 | | | 1.07 | |
| | |
GS Mortgage Security Trust Series 2018-LUAU Class B, 3.43%,11-15-2032 | | | 1.03 | |
| | |
Hertz Fleet Lease Funding LP Series2019-1 Class E, 4.62%,1-10-2033 | | | 1.00 | |
The U.S. Federal Reserve’s (Fed’s) rate-setting committee, the Federal Open Market Committee (FOMC), raised the federal funds rate once and cut the rate twice over the past 12 months, resulting in a net reduction in the range of 0.25%. The FOMC pivoted from normalization to accommodation at the end of 2018 following a slowdown in growth across Europe and other developed economies that resulted in weaker economic readings in the U.S. In addition, an inversion of the U.S. Treasury yield curve following more and more bonds having negative yields across Europe also led the Fed to react and cut rates in accordance with market sentiment beginning in the third quarter of 2019.
Interest rates were materially lower over the past 12 months across the yield curve. Yields on2-year Treasuries fell by 118 basis points (bps; 100 bps equal 1.00%) during the period, while10-year Treasuries were lower by 137 bps. Investment-grade credit spreads widened rapidly toward the end of 2018, as concerns of weakening global growth stoked recession fears in the U.S., but moderated as the12-month period ended, finishing slightly wider than where they started.
Please see footnotes on page 7.
8 | Wells Fargo Strategic Income Fund
Performance highlights (unaudited)
The Fund increased allocations to securitized sectors while decreasing exposures to U.S. credit.
During the period, the Fund reduced its positions in U.S. credit and leveraged loans while adding securitized and U.S. high-yield bonds. The decreased U.S. credit allocation has been a methodical decrease as spreads on most credit sectors continue to tighten in 2019 and remain inside of their five-year averages. Credit valuations continue to be less attractive than they were earlier in the year. In response, we have been adding to higher-quality securitized positions as the credit cycle continues to extend, where we’ve found more relative value and can move up in quality. As a result, our exposure to higher-quality collateralized mortgage obligations, ABS, CLOs, and commercial mortgage-backed securities increased over the period. European investment-grade and high-yield exposure was mostly unchanged during the period.
|
|
| Portfolio composition as of September 30, 20198 |
|
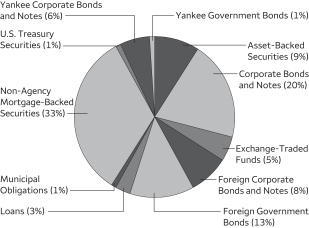 |
The Fund’s duration remained steady at around 2.0 years during the period.
While we continue to expect a moderately supportive macroeconomic environment, the credit cycle is closer to the end than the beginning and the risk of a recession has been rising. In addition, while the Fed has pivoted to an accommodative stance in 2019 and the market expects more rate cuts as the year closes, it’s not clear how trade wars and economic growth outside the U.S. will affect future decisions by the Fed.
Market volatility has ticked up and dispersion within sectors is increasing. Higher volatility and more dispersion creates opportunities to generate alpha through superior security selection, which we expect to be a key contributor to performance going forward. We remain cautious within lower-quality tiers of credit and have methodically moved the portfolio’s quality up to reflect our views as we look for opportunities.
Please see footnotes on page 7.
Wells Fargo Strategic Income Fund | 9
Fund expenses (unaudited)
As a shareholder of the Fund, you incur two types of costs: (1) transaction costs, including sales charges (loads) on purchase payments and contingent deferred sales charges (if any) on redemptions and (2) ongoing costs, including management fees, distribution(12b-1) and/or shareholder servicing fees, and other Fund expenses. This example is intended to help you understand your ongoing costs (in dollars) of investing in the Fund and to compare these costs with the ongoing costs of investing in other mutual funds.
The example is based on an investment of $1,000 invested at the beginning of thesix-month period and held for the entire period from April 1, 2019 to September 30, 2019.
Actual expenses
The “Actual” line of the table below provides information about actual account values and actual expenses. You may use the information in this line, together with the amount you invested, to estimate the expenses that you paid over the period. Simply divide your account value by $1,000 (for example, an $8,600 account value divided by $1,000 = 8.6), then multiply the result by the number in the “Actual” line under the heading entitled “Expenses paid during period” for your applicable class of shares to estimate the expenses you paid on your account during this period.
Hypothetical example for comparison purposes
The “Hypothetical” line of the table below provides information about hypothetical account values and hypothetical expenses based on the Fund’s actual expense ratio and an assumed rate of return of 5% per year before expenses, which is not the Fund’s actual return. The hypothetical account values and expenses may not be used to estimate the actual ending account balance or expenses you paid for the period. You may use this information to compare the ongoing costs of investing in the Fund and other funds. To do so, compare this 5% hypothetical example with the 5% hypothetical examples that appear in the shareholder reports of the other funds.
Please note that the expenses shown in the table are meant to highlight your ongoing costs only and do not reflect any transactional costs, such as sales charges (loads) and contingent deferred sales charges. Therefore, the “Hypothetical” line of the table is useful in comparing ongoing costs only and will not help you determine the relative total costs of owning different funds. In addition, if these transactional costs were included, your costs would have been higher.
| | | | | | | | | | | | | | | | |
| | | Beginning
account value
4-1-2019 | | | Ending
account value
9-30-2019 | | | Expenses
paid during
the period¹ | | | Annualized net
expense ratio | |
| | | | | |
Class A | | | | | | | | | | | | | | | | |
| | | | |
Actual | | $ | 1,000.00 | | | $ | 1,027.26 | | | $ | 4.58 | | | | 0.90 | % |
| | | | |
Hypothetical (5% return before expenses) | | $ | 1,000.00 | | | $ | 1,020.55 | | | $ | 4.57 | | | | 0.90 | % |
| | | | | |
Class C | | | | | | | | | | | | | | | | |
| | | | |
Actual | | $ | 1,000.00 | | | $ | 1,023.57 | | | $ | 8.39 | | | | 1.65 | % |
| | | | |
Hypothetical (5% return before expenses) | | $ | 1,000.00 | | | $ | 1,016.78 | | | $ | 8.36 | | | | 1.65 | % |
| | | | | |
Administrator Class | | | | | | | | | | | | | | | | |
| | | | |
Actual | | $ | 1,000.00 | | | $ | 1,028.22 | | | $ | 3.82 | | | | 0.75 | % |
| | | | |
Hypothetical (5% return before expenses) | | $ | 1,000.00 | | | $ | 1,021.30 | | | $ | 3.81 | | | | 0.75 | % |
| | | | | |
Institutional Class | | | | | | | | | | | | | | | | |
| | | | |
Actual | | $ | 1,000.00 | | | $ | 1,028.85 | | | $ | 3.06 | | | | 0.60 | % |
| | | | |
Hypothetical (5% return before expenses) | | $ | 1,000.00 | | | $ | 1,022.05 | | | $ | 3.05 | | | | 0.60 | % |
| 1 | Expenses paid is equal to the annualized net expense ratio of each class multiplied by the average account value over the period, multiplied by the number of days in the most recent fiscal half-year divided by the number of days in the fiscal year (to reflect theone-half-year period). |
10 | Wells Fargo Strategic Income Fund
Portfolio of investments—September 30, 2019
| | | | | | | | | | | | | | | | |
| | | Interest
rate | | | Maturity
date | | | Principal | | | Value | |
| Asset-Backed Securities: 8.07% | |
AmeriCredit Automobile Receivables Trust Series2015-4 Class D | | | 3.72 | % | | | 12-8-2021 | | | $ | 300,000 | | | $ | 302,505 | |
AmeriCredit Automobile Receivables Trust Series2018-3 Class D | | | 4.04 | | | | 11-18-2024 | | | | 1,100,000 | | | | 1,151,463 | |
Avis Budget Rental Car Funding LLC Series2016-1A Class A 144A | | | 2.99 | | | | 6-20-2022 | | | | 230,000 | | | | 232,495 | |
Avis Budget Rental Car Funding LLC Series2017-1A Class C 144A | | | 4.15 | | | | 9-20-2023 | | | | 650,000 | | | | 667,188 | |
Bank of the West Auto Trust Series2018-1 Class C 144A | | | 3.98 | | | | 5-15-2024 | | | | 1,100,000 | | | | 1,139,316 | |
Capital Auto Receivables Trust Series2018-2 Class C 144A | | | 3.69 | | | | 12-20-2023 | | | | 1,200,000 | | | | 1,217,838 | |
Chesapeake Funding II LLC Series2017-3A Class C 144A | | | 2.78 | | | | 8-15-2029 | | | | 800,000 | | | | 804,780 | |
Chesapeake Funding II LLC Series2017-3A Class D 144A | | | 3.38 | | | | 8-15-2029 | | | | 120,000 | | | | 121,278 | |
Chesapeake Funding II LLC Series2017-4A Class D 144A | | | 3.26 | | | | 11-15-2029 | | | | 400,000 | | | | 402,838 | |
Coinstar Funding LLC Series2017-1A Class A2 144A | | | 5.22 | | | | 4-25-2047 | | | | 1,089,913 | | | | 1,122,462 | |
Dell Equipment Finance Trust Series2017-2 Class D 144A | | | 3.27 | | | | 10-23-2023 | | | | 400,000 | | | | 401,634 | |
DRB Prime Student Loan Trust Series2017-C Class C 144A | | | 3.29 | | | | 11-25-2042 | | | | 416,263 | | | | 416,915 | |
Hertz Fleet Lease Funding LP Series2019-1 Class E 144A | | | 4.62 | | | | 1-10-2033 | | | | 1,550,000 | | | | 1,561,363 | |
Hertz Vehicle Financing LLC Series2015-1A Class B 144A | | | 3.52 | | | | 3-25-2021 | | | | 1,100,000 | | | | 1,104,111 | |
SMB Private Education Loan Trust Series2015-C Class C 144A | | | 4.50 | | | | 9-17-2046 | | | | 290,000 | | | | 307,687 | |
Tesla Auto Lease Trust Series2018-A Class E 144A | | | 4.94 | | | | 3-22-2021 | | | | 350,000 | | | | 353,099 | |
Tesla Auto Lease Trust Series2018-B Class D 144A | | | 5.29 | | | | 11-22-2021 | | | | 1,200,000 | | | | 1,237,138 | |
| |
Total Asset-Backed Securities (Cost $12,291,297) | | | | 12,544,110 | |
| | | | | | | | | | | | | | | | |
|
Corporate Bonds and Notes: 19.33% | |
|
Communication Services: 2.19% | |
|
| Diversified Telecommunication Services: 0.22% | |
AT&T Incorporated | | | 3.80 | | | | 2-15-2027 | | | | 265,000 | | | | 280,800 | |
Level 3 Financing Incorporated | | | 5.38 | | | | 1-15-2024 | | | | 60,000 | | | | 61,191 | |
| | | | |
| | | | | | | | | | | | | | | 341,991 | |
| | | | | | | | | | | | | | | | |
|
| Entertainment: 0.10% | |
Live Nation Entertainment Incorporated 144A | | | 4.88 | | | | 11-1-2024 | | | | 150,000 | | | | 155,406 | |
| | | | | | | | | | | | | | | | |
|
| Media: 1.63% | |
CCO Holdings LLC 144A | | | 5.38 | | | | 5-1-2025 | | | | 150,000 | | | | 155,625 | |
Charter Communications Operating LLC | | | 4.91 | | | | 7-23-2025 | | | | 700,000 | | | | 769,284 | |
Cinemark USA Incorporated | | | 5.13 | | | | 12-15-2022 | | | | 75,000 | | | | 75,938 | |
Cox Communications Incorporated 144A | | | 3.50 | | | | 8-15-2027 | | | | 200,000 | | | | 209,664 | |
CSC Holdings LLC 144A | | | 5.50 | | | | 5-15-2026 | | | | 400,000 | | | | 420,960 | |
Gray Television Incorporated 144A | | | 5.13 | | | | 10-15-2024 | | | | 100,000 | | | | 103,625 | |
Gray Television Incorporated 144A | | | 5.88 | | | | 7-15-2026 | | | | 150,000 | | | | 156,000 | |
Lamar Media Corporation | | | 5.00 | | | | 5-1-2023 | | | | 50,000 | | | | 50,938 | |
National CineMedia LLC | | | 6.00 | | | | 4-15-2022 | | | | 175,000 | | | | 176,750 | |
Nexstar Escrow Incorporated 144A | | | 5.63 | | | | 7-15-2027 | | | | 10,000 | | | | 10,475 | |
Nielsen Finance LLC 144A | | | 5.00 | | | | 4-15-2022 | | | | 75,000 | | | | 75,210 | |
Outfront Media Capital Corporation | | | 5.88 | | | | 3-15-2025 | | | | 100,000 | | | | 103,125 | |
Salem Media Group Incorporated 144A | | | 6.75 | | | | 6-1-2024 | | | | 50,000 | | | | 43,250 | |
Scripps Escrow Incorporated 144A | | | 5.88 | | | | 7-15-2027 | | | | 25,000 | | | | 25,375 | |
The E.W. Scripps Company 144A | | | 5.13 | | | | 5-15-2025 | | | | 150,000 | | | | 150,375 | |
| | | | |
| | | | | | | | | | | | | | | 2,526,594 | |
| | | | | | | | | | | | | | | | |
|
| Wireless Telecommunication Services: 0.24% | |
Sprint Communications Incorporated 144A | | | 7.00 | | | | 3-1-2020 | | | | 150,000 | | | | 152,438 | |
Sprint Spectrum Company 144A | | | 5.15 | | | | 9-20-2029 | | | | 65,000 | | | | 70,525 | |
T-Mobile USA Incorporated | | | 4.75 | | | | 2-1-2028 | | | | 25,000 | | | | 26,163 | |
T-Mobile USA Incorporated | | | 6.38 | | | | 3-1-2025 | | | | 120,000 | | | | 124,315 | |
| | | | |
| | | | | | | | | | | | | | | 373,441 | |
| | | | | | | | | | | | | | | | |
Wells Fargo Strategic Income Fund | 11
Portfolio of investments—September 30, 2019
| | | | | | | | | | | | | | | | |
| | | Interest
rate | | | Maturity
date | | | Principal | | | Value | |
Consumer Discretionary: 1.87% | |
|
| Auto Components: 0.42% | |
Adient Global Holdings 144A | | | 3.50 | % | | | 8-15-2024 | | | $ | 515,000 | | | $ | 475,947 | |
Allison Transmission Incorporated 144A | | | 4.75 | | | | 10-1-2027 | | | | 50,000 | | | | 51,500 | |
Allison Transmission Incorporated 144A | | | 5.00 | | | | 10-1-2024 | | | | 50,000 | | | | 51,094 | |
Allison Transmission Incorporated 144A | | | 5.88 | | | | 6-1-2029 | | | | 25,000 | | | | 27,125 | |
Cooper Tire & Rubber Company | | | 8.00 | | | | 12-15-2019 | | | | 50,000 | | | | 50,438 | |
| | | | |
| | | | | | | | | | | | | | | 656,104 | |
| | | | | | | | | | | | | | | | |
|
| Automobiles: 0.06% | |
Ford Motor Company | | | 7.45 | | | | 7-16-2031 | | | | 80,000 | | | | 91,783 | |
| | | | | | | | | | | | | | | | |
|
| Distributors: 0.26% | |
IAA Spinco Incorporated 144A | | | 5.50 | | | | 6-15-2027 | | | | 100,000 | | | | 105,500 | |
LKQ Corporation | | | 4.75 | | | | 5-15-2023 | | | | 300,000 | | | | 303,750 | |
| | | | |
| | | | | | | | | | | | | | | 409,250 | |
| | | | | | | | | | | | | | | | |
|
| Diversified Consumer Services: 0.15% | |
Carriage Services Incorporated 144A | | | 6.63 | | | | 6-1-2026 | | | | 75,000 | | | | 76,838 | |
Service Corporation International | | | 4.63 | | | | 12-15-2027 | | | | 150,000 | | | | 156,000 | |
| | | | |
| | | | | | | | | | | | | | | 232,838 | |
| | | | | | | | | | | | | | | | |
|
| Hotels, Restaurants & Leisure: 0.17% | |
KFC Holding Company 144A | | | 5.00 | | | | 6-1-2024 | | | | 250,000 | | | | 259,375 | |
| | | | | | | | | | | | | | | | |
|
| Specialty Retail: 0.62% | |
Asbury Automotive Group Incorporated | | | 6.00 | | | | 12-15-2024 | | | | 175,000 | | | | 181,125 | |
Group 1 Automotive Incorporated | | | 5.00 | | | | 6-1-2022 | | | | 50,000 | | | | 50,500 | |
Group 1 Automotive Incorporated 144A | | | 5.25 | | | | 12-15-2023 | | | | 100,000 | | | | 102,750 | |
Lithia Motors Incorporated 144A | | | 5.25 | | | | 8-1-2025 | | | | 175,000 | | | | 182,438 | |
Penske Auto Group Incorporated | | | 3.75 | | | | 8-15-2020 | | | | 70,000 | | | | 70,266 | |
Penske Auto Group Incorporated | | | 5.38 | | | | 12-1-2024 | | | | 150,000 | | | | 154,313 | |
Penske Auto Group Incorporated | | | 5.75 | | | | 10-1-2022 | | | | 50,000 | | | | 50,669 | |
Sonic Automotive Incorporated | | | 5.00 | | | | 5-15-2023 | | | | 175,000 | | | | 177,188 | |
| | | | |
| | | | | | | | | | | | | | | 969,249 | |
| | | | | | | | | | | | | | | | |
|
| Textiles, Apparel & Luxury Goods: 0.19% | |
Levi Strauss & Company | | | 5.00 | | | | 5-1-2025 | | | | 200,000 | | | | 207,712 | |
The William Carter Company 144A | | | 5.63 | | | | 3-15-2027 | | | | 75,000 | | | | 80,250 | |
| | | | |
| | | | | | | | | | | | | | | 287,962 | |
| | | | | | | | | | | | | | | | |
|
Consumer Staples: 0.02% | |
|
| Food Products: 0.02% | |
Darling Ingredients Incorporated 144A | | | 5.25 | | | | 4-15-2027 | | | | 25,000 | | | | 26,250 | |
| | | | | | | | | | | | | | | | |
|
Energy: 2.46% | |
|
| Energy Equipment & Services: 0.41% | |
Diamond Offshore Drilling Incorporated | | | 4.88 | | | | 11-1-2043 | | | | 125,000 | | | | 57,813 | |
Era Group Incorporated | | | 7.75 | | | | 12-15-2022 | | | | 40,000 | | | | 40,600 | |
Hilcorp Energy Company 144A | | | 5.75 | | | | 10-1-2025 | | | | 175,000 | | | | 162,750 | |
NGPL PipeCo LLC 144A | | | 7.77 | | | | 12-15-2037 | | | | 100,000 | | | | 129,586 | |
12 | Wells Fargo Strategic Income Fund
Portfolio of investments—September 30, 2019
| | | | | | | | | | | | | | | | |
| | | Interest
rate | | | Maturity
date | | | Principal | | | Value | |
| Energy Equipment & Services(continued) | |
Oceaneering International Incorporated | | | 6.00 | % | | | 2-1-2028 | | | $ | 150,000 | | | $ | 143,625 | |
USA Compression Partners LP | | | 6.88 | | | | 4-1-2026 | | | | 100,000 | | | | 103,750 | |
| | | | |
| | | | | | | | | | | | | | | 638,124 | |
| | | | | | | | | | | | | | | | |
|
| Oil, Gas & Consumable Fuels: 2.05% | |
Antero Midstream Partners LP 144A | | | 5.75 | | | | 1-15-2028 | | | | 50,000 | | | | 41,500 | |
Archrock Partners LP 144A | | | 6.88 | | | | 4-1-2027 | | | | 100,000 | | | | 106,121 | |
Carrizo Oil & Gas Incorporated | | | 8.25 | | | | 7-15-2025 | | | | 100,000 | | | | 97,960 | |
Cheniere Energy Partners LP 144A | | | 4.50 | | | | 10-1-2029 | | | | 25,000 | | | | 25,609 | |
Cheniere Energy Partners LP | | | 5.25 | | | | 10-1-2025 | | | | 100,000 | | | | 104,025 | |
Cheniere Energy Partners LP | | | 5.63 | | | | 10-1-2026 | | | | 100,000 | | | | 106,115 | |
Denbury Resources Incorporated 144A | | | 9.00 | | | | 5-15-2021 | | | | 75,000 | | | | 69,563 | |
Denbury Resources Incorporated 144A | | | 9.25 | | | | 3-31-2022 | | | | 100,000 | | | | 87,500 | |
EnLink Midstream Partners LP | | | 4.40 | | | | 4-1-2024 | | | | 50,000 | | | | 48,153 | |
EnLink Midstream Partners LP | | | 4.85 | | | | 7-15-2026 | | | | 225,000 | | | | 213,750 | |
Gulfport Energy Corporation | | | 6.00 | | | | 10-15-2024 | | | | 150,000 | | | | 108,503 | |
Indigo Natural Resources LLC 144A | | | 6.88 | | | | 2-15-2026 | | | | 125,000 | | | | 112,656 | |
Murphy Oil Corporation | | | 5.75 | | | | 8-15-2025 | | | | 155,000 | | | | 157,325 | |
Murphy Oil Corporation | | | 6.88 | | | | 8-15-2024 | | | | 50,000 | | | | 52,250 | |
Nabors Industries Incorporated | | | 5.75 | | | | 2-1-2025 | | | | 150,000 | | | | 111,000 | |
Rockies Express Pipeline LLC 144A | | | 5.63 | | | | 4-15-2020 | | | | 150,000 | | | | 152,063 | |
Rockies Express Pipeline LLC 144A | | | 6.88 | | | | 4-15-2040 | | | | 75,000 | | | | 81,623 | |
Rose Rock Midstream LP | | | 5.63 | | | | 11-15-2023 | | | | 100,000 | | | | 102,375 | |
SemGroup Corporation | | | 7.25 | | | | 3-15-2026 | | | | 125,000 | | | | 135,313 | |
Southern Star Central Corporation 144A | | | 5.13 | | | | 7-15-2022 | | | | 200,000 | | | | 201,500 | |
Sunoco Logistics Partner LP | | | 5.40 | | | | 10-1-2047 | | | | 750,000 | | | | 818,217 | |
Tallgrass Energy Partners LP 144A | | | 5.50 | | | | 9-15-2024 | | | | 250,000 | | | | 248,750 | |
Ultra Resources Incorporated 144A | | | 7.13 | | | | 4-15-2025 | | | | 75,000 | | | | 6,000 | |
| | | | |
| | | | | | | | | | | | | | | 3,187,871 | |
| | | | | | | | | | | | | | | | |
|
Financials: 5.18% | |
|
| Banks: 0.95% | |
Bank of America Corporation (3 Month LIBOR +4.55%)± | | | 6.30 | | | | 12-29-2049 | | | | 265,000 | | | | 298,125 | |
Deutsche Bank AG | | | 4.88 | | | | 12-1-2032 | | | | 500,000 | | | | 452,690 | |
JPMorgan Chase & Company (3 Month LIBOR +3.25%)± | | | 5.15 | | | | 12-29-2049 | | | | 350,000 | | | | 360,063 | |
JPMorgan Chase & Company (3 Month LIBOR +3.30%)± | | | 6.00 | | | | 12-31-2049 | | | | 100,000 | | | | 106,857 | |
PNC Financial Services (3 Month LIBOR +3.30%)± | | | 5.00 | | | | 12-29-2049 | | | | 250,000 | | | | 259,375 | |
| | | | |
| | | | | | | | | | | | | | | 1,477,110 | |
| | | | | | | | | | | | | | | | |
|
| Capital Markets: 0.27% | |
Blackstone Holdings Finance Company LLC 144A | | | 3.15 | | | | 10-2-2027 | | | | 100,000 | | | | 103,203 | |
Goldman Sachs Group Incorporated | | | 4.25 | | | | 10-21-2025 | | | | 300,000 | | | | 321,597 | |
| | | | |
| | | | | | | | | | | | | | | 424,800 | |
| | | | | | | | | | | | | | | | |
|
| Consumer Finance: 1.89% | |
FirstCash Incorporated 144A | | | 5.38 | | | | 6-1-2024 | | | | 175,000 | | | | 180,250 | |
Ford Motor Credit Company LLC | | | 3.20 | | | | 1-15-2021 | | | | 1,500,000 | | | | 1,501,968 | |
General Motors Financial Company Incorporated | | | 5.65 | | | | 1-17-2029 | | | | 170,000 | | | | 187,461 | |
Springleaf Finance Corporation | | | 6.63 | | | | 1-15-2028 | | | | 100,000 | | | | 107,530 | |
Springleaf Finance Corporation | | | 7.13 | | | | 3-15-2026 | | | | 25,000 | | | | 27,733 | |
Springleaf Finance Corporation | | | 7.75 | | | | 10-1-2021 | | | | 150,000 | | | | 163,125 | |
Synchrony Financial | | | 3.95 | | | | 12-1-2027 | | | | 750,000 | | | | 768,988 | |
| | | | |
| | | | | | | | | | | | | | | 2,937,055 | |
| | | | | | | | | | | | | | | | |
Wells Fargo Strategic Income Fund | 13
Portfolio of investments—September 30, 2019
| | | | | | | | | | | | | | | | |
| | | Interest
rate | | | Maturity
date | | | Principal | | | Value | |
| Diversified Financial Services: 0.17% | |
LPL Holdings Incorporated 144A | | | 5.75 | % | | | 9-15-2025 | | | $ | 250,000 | | | $ | 260,000 | |
| | | | | | | | | | | | | | | | |
|
| Insurance: 1.90% | |
American Equity Investment Life Insurance Company | | | 5.00 | | | | 6-15-2027 | | | | 100,000 | | | | 105,112 | |
Brighthouse Financial Incorporated | | | 4.70 | | | | 6-22-2047 | | | | 745,000 | | | | 665,017 | |
Guardian Life Insurance Company 144A | | | 4.85 | | | | 1-24-2077 | | | | 200,000 | | | | 253,255 | |
HUB International Limited 144A | | | 7.00 | | | | 5-1-2026 | | | | 175,000 | | | | 180,031 | |
Lincoln National Corporation | | | 7.00 | | | | 6-15-2040 | | | | 855,000 | | | | 1,219,405 | |
MetLife Incorporated | | | 6.40 | | | | 12-15-2066 | | | | 200,000 | | | | 237,181 | |
PartnerRe Finance LLC | | | 3.70 | | | | 7-2-2029 | | | | 180,000 | | | | 187,605 | |
USI Incorporated 144A | | | 6.88 | | | | 5-1-2025 | | | | 100,000 | | | | 101,498 | |
| | | | |
| | | | | | | | | | | | | | | 2,949,104 | |
| | | | | | | | | | | | | | | | |
|
Health Care: 1.84% | |
|
| Health Care Providers & Services: 1.73% | |
CHS Incorporated « | | | 5.13 | | | | 8-1-2021 | | | | 175,000 | | | | 174,563 | |
CVS Health Corporation | | | 5.05 | | | | 3-25-2048 | | | | 730,000 | | | | 830,180 | |
Davita Incorporated | | | 5.00 | | | | 5-1-2025 | | | | 150,000 | | | | 149,438 | |
Highmark Incorporated 144A | | | 6.13 | | | | 5-15-2041 | | | | 850,000 | | | | 1,044,666 | |
MPH Acquisition Holdings LLC 144A | | | 7.13 | | | | 6-1-2024 | | | | 25,000 | | | | 23,031 | |
MPT Operating Partnership LP | | | 5.25 | | | | 8-1-2026 | | | | 200,000 | | | | 209,550 | |
Select Medical Corporation 144A | | | 6.25 | | | | 8-15-2026 | | | | 125,000 | | | | 130,625 | |
Tenet Healthcare Corporation | | | 5.13 | | | | 5-1-2025 | | | | 125,000 | | | | 126,725 | |
| | | | |
| | | | | | | | | | | | | | | 2,688,778 | |
| | | | | | | | | | | | | | | | |
|
| Health Care Technology: 0.11% | |
Change Healthcare Holdings Incorporated 144A | | | 5.75 | | | | 3-1-2025 | | | | 175,000 | | | | 177,625 | |
| | | | | | | | | | | | | | | | |
|
Industrials: 1.23% | |
|
| Aerospace & Defense: 0.07% | |
RBS Global & Rexnord LLC 144A | | | 4.88 | | | | 12-15-2025 | | | | 100,000 | | | | 102,740 | |
| | | | | | | | | | | | | | | | |
|
| Airlines: 0.10% | |
United Airlines | | | 4.15 | | | | 2-25-2033 | | | | 150,000 | | | | 163,763 | |
| | | | | | | | | | | | | | | | |
|
| Commercial Services & Supplies: 0.32% | |
Advanced Disposal Services Incorporated 144A | | | 5.63 | | | | 11-15-2024 | | | | 50,000 | | | | 52,188 | |
Covanta Holding Corporation | | | 5.88 | | | | 3-1-2024 | | | | 75,000 | | | | 77,250 | |
Covanta Holding Corporation | | | 6.00 | | | | 1-1-2027 | | | | 75,000 | | | | 78,938 | |
KAR Auction Services Incorporated 144A | | | 5.13 | | | | 6-1-2025 | | | | 275,000 | | | | 284,625 | |
| | | | |
| | | | | | | | | | | | | | | 493,001 | |
| | | | | | | | | | | | | | | | |
|
| Electrical Equipment: 0.10% | |
Resideo Funding Incorporated 144A | | | 6.13 | | | | 11-1-2026 | | | | 150,000 | | | | 158,250 | |
| | | | | | | | | | | | | | | | |
|
| Industrial Conglomerates: 0.26% | |
General Electric Company (3 Month LIBOR +3.33%)± | | | 5.00 | | | | 12-29-2049 | | | | 430,000 | | | | 407,963 | |
| | | | | | | | | | | | | | | | |
|
| Machinery: 0.17% | |
Stevens Holding Company Incorporated 144A | | | 6.13 | | | | 10-1-2026 | | | | 150,000 | | | | 159,563 | |
Trimas Corporation 144A | | | 4.88 | | | | 10-15-2025 | | | | 100,000 | | | | 101,750 | |
| | | | |
| | | | | | | | | | | | | | | 261,313 | |
| | | | | | | | | | | | | | | | |
|
| Trading Companies & Distributors: 0.12% | |
Fortress Transportation and Infrastructure Investors LLC 144A | | | 6.50 | | | | 10-1-2025 | | | | 175,000 | | | | 179,813 | |
| | | | | | | | | | | | | | | | |
14 | Wells Fargo Strategic Income Fund
Portfolio of investments—September 30, 2019
| | | | | | | | | | | | | | | | |
| | | Interest
rate | | | Maturity
date | | | Principal | | | Value | |
| Transportation Infrastructure: 0.09% | |
Toll Road Investors Partnership II LP 144A¤ | | | 0.00 | % | | | 2-15-2027 | | | $ | 200,000 | | | $ | 138,708 | |
| | | | | | | | | | | | | | | | |
|
Information Technology: 1.95% | |
|
| Communications Equipment: 0.54% | |
CommScope Technologies Finance LLC 144A | | | 6.00 | | | | 6-15-2025 | | | | 50,000 | | | | 45,125 | |
Motorola Solutions Incorporated | | | 5.50 | | | | 9-1-2044 | | | | 750,000 | | | | 799,691 | |
| | | | |
| | | | | | | | | | | | | | | 844,816 | |
| | | | | | | | | | | | | | | | |
|
| IT Services: 0.37% | |
Cardtronics Incorporated 144A | | | 5.50 | | | | 5-1-2025 | | | | 150,000 | | | | 152,250 | |
Gartner Incorporated 144A | | | 5.13 | | | | 4-1-2025 | | | | 325,000 | | | | 340,031 | |
Zayo Group LLC | | | 6.38 | | | | 5-15-2025 | | | | 75,000 | | | | 77,235 | |
| | | | |
| | | | | | | | | | | | | | | 569,516 | |
| | | | | | | | | | | | | | | | |
|
| Semiconductors & Semiconductor Equipment: 0.45% | |
Broadcom Corporation | | | 3.88 | | | | 1-15-2027 | | | | 695,000 | | | | 698,593 | |
| | | | | | | | | | | | | | | | |
|
| Software: 0.43% | |
Citrix Systems Incorporated | | | 4.50 | | | | 12-1-2027 | | | | 250,000 | | | | 270,321 | |
Fair Isaac Corporation 144A | | | 5.25 | | | | 5-15-2026 | | | | 200,000 | | | | 213,500 | |
SS&C Technologies Incorporated 144A | | | 5.50 | | | | 9-30-2027 | | | | 25,000 | | | | 26,126 | |
Symantec Corporation 144A | | | 5.00 | | | | 4-15-2025 | | | | 150,000 | | | | 151,661 | |
| | | | |
| | | | | | | | | | | | | | | 661,608 | |
| | | | | | | | | | | | | | | | |
|
| Technology Hardware, Storage & Peripherals: 0.16% | |
NCR Corporation | | | 5.00 | | | | 7-15-2022 | | | | 50,000 | | | | 50,563 | |
NCR Corporation | | | 5.88 | | | | 12-15-2021 | | | | 100,000 | | | | 100,750 | |
NCR Corporation | | | 6.38 | | | | 12-15-2023 | | | | 100,000 | | | | 102,750 | |
| | | | |
| | | | | | | | | | | | | | | 254,063 | |
| | | | | | | | | | | | | | | | |
|
Materials: 0.60% | |
|
| Containers & Packaging: 0.53% | |
Flex Acquisition Company Incorporated 144A | | | 6.88 | | | | 1-15-2025 | | | | 100,000 | | | | 91,210 | |
Flex Acquisition Company Incorporated 144A | | | 7.88 | | | | 7-15-2026 | | | | 50,000 | | | | 45,875 | |
Owens-Illinois Incorporated 144A | | | 6.38 | | | | 8-15-2025 | | | | 125,000 | | | | 132,500 | |
Silgan Holdings Incorporated | | | 3.25 | | | | 3-15-2025 | | | | 500,000 | | | | 557,918 | |
| | | | |
| | | | | | | | | | | | | | | 827,503 | |
| | | | | | | | | | | | | | | | |
|
| Metals & Mining: 0.07% | |
Novelis Corporation 144A | | | 5.88 | | | | 9-30-2026 | | | | 75,000 | | | | 78,656 | |
Novelis Corporation 144A | | | 6.25 | | | | 8-15-2024 | | | | 25,000 | | | | 26,125 | |
| | | | |
| | | | | | | | | | | | | | | 104,781 | |
| | | | | | | | | | | | | | | | |
|
Real Estate: 1.24% | |
|
| Equity REITs: 0.99% | |
CoreCivic Incorporated | | | 4.63 | | | | 5-1-2023 | | | | 100,000 | | | | 96,889 | |
ESH Hospitality Incorporated 144A | | | 4.63 | | | | 10-1-2027 | | | | 25,000 | | | | 25,063 | |
ESH Hospitality Incorporated 144A | | | 5.25 | | | | 5-1-2025 | | | | 200,000 | | | | 206,750 | |
Sabra Health Care LP | | | 5.38 | | | | 6-1-2023 | | | | 250,000 | | | | 254,725 | |
SBA Tower Trust 144A | | | 2.84 | | | | 1-15-2025 | | | | 500,000 | | | | 500,665 | |
Tanger Properties LP | | | 3.75 | | | | 12-1-2024 | | | | 400,000 | | | | 408,801 | |
The Geo Group Incorporated | | | 5.88 | | | | 10-15-2024 | | | | 50,000 | | | | 43,000 | |
| | | | |
| | | | | | | | | | | | | | | 1,535,893 | |
| | | | | | | | | | | | | | | | |
Wells Fargo Strategic Income Fund | 15
Portfolio of investments—September 30, 2019
| | | | | | | | | | | | | | | | |
| | | Interest
rate | | | Maturity
date | | | Principal | | | Value | |
| Real Estate Management & Development: 0.25% | | | | | | | | | | | | |
Washington Prime Group Incorporated | | | 3.85 | % | | | 4-1-2020 | | | $ | 400,000 | | | $ | 397,696 | |
| | | | | | | | | | | | | | | | |
| | | | |
Utilities: 0.75% | | | | | | | | | | | | | | | | |
| | | | |
| Electric Utilities: 0.27% | | | | | | | | | | | | |
Oglethorpe Power Corporation | | | 4.25 | | | | 4-1-2046 | | | | 400,000 | | | | 415,252 | |
| | | | | | | | | | | | | | | | |
| | | | |
| Gas Utilities: 0.01% | | | | | | | | | | | | |
Suburban Propane Partners LP | | | 5.88 | | | | 3-1-2027 | | | | 25,000 | | | | 25,551 | |
| | | | | | | | | | | | | | | | |
| | | | |
| Independent Power & Renewable Electricity Producers: 0.47% | | | | | | | | | | | | |
NSG Holdings LLC 144A | | | 7.75 | | | | 12-15-2025 | | | | 79,851 | | | | 85,640 | |
Pattern Energy Group Incorporated 144A | | | 5.88 | | | | 2-1-2024 | | | | 325,000 | | | | 332,719 | |
TerraForm Global Operating LLC 144A | | | 6.13 | | | | 3-1-2026 | | | | 25,000 | | | | 25,688 | |
TerraForm Power Operating LLC 144A | | | 5.00 | | | | 1-31-2028 | | | | 275,000 | | | | 286,000 | |
| | | | |
| | | | | | | | | | | | | | | 730,047 | |
| | | | | | | | | | | | | | | | |
| | | | |
Total Corporate Bonds and Notes (Cost $28,553,122) | | | | | | | | | | | | | | | 30,041,580 | |
| | | | | | | | | | | | | | | | |
| | | | |
| | | | | | | | | | | | | | | | |
| | | | | | | | | Shares | | | | |
| Exchange-Traded Funds: 4.74% | | | | | | | | | | | | |
iShares JPMorgan USD Emerging Markets Bond ETF | | | | | | | | | | | 25,000 | | | | 2,833,750 | |
SPDR Barclays High Yield Bond ETF | | | | | | | | | | | 41,666 | | | | 4,530,761 | |
| | | | |
Total Exchange-Traded Funds (Cost $7,300,522) | | | | | | | | | | | | | | | 7,364,511 | |
| | | | | | | | | | | | | | | | |
| | | | |
| | | | | | | | | | | | | | | | |
| | | | | | | | | Principal | | | | |
| Foreign Corporate Bonds and Notes: 7.98% | | | | | | | | | | | | |
| | | | |
Communication Services: 0.38% | | | | | | | | | | | | | | | | |
| | | | |
| Diversified Telecommunication Services: 0.30% | | | | | | | | | | | | |
Global Switch Holdings Limited | | | 2.25 | | | | 5-31-2027 | | | EUR | 400,000 | | | | 474,742 | |
| | | | | | | | | | | | | | | | |
| | | | |
| Media: 0.08% | | | | | | | | | | | | |
Altice (Luxembourg) SA | | | 7.25 | | | | 5-15-2022 | | | EUR | 64,337 | | | | 71,538 | |
Altice (Luxembourg) SA 144A | | | 7.25 | | | | 5-15-2022 | | | EUR | 42,892 | | | | 47,692 | |
| | | | |
| | | | | | | | | | | | | | | 119,230 | |
| | | | | | | | | | | | | | | | |
| | | | |
Consumer Discretionary: 1.26% | | | | | | | | | | | | | | | | |
| | | | |
| Auto Components: 0.29% | | | | | | | | | | | | |
HP Pelzer Holding Gmbh 144A | | | 4.13 | | | | 4-1-2024 | | | EUR | 450,000 | | | | 456,144 | |
| | | | | | | | | | | | | | | | |
| | | | |
| Automobiles: 0.38% | | | | | | | | | | | | |
Peugeot SA Company | | | 2.00 | | | | 3-20-2025 | | | EUR | 500,000 | | | | 586,349 | |
| | | | | | | | | | | | | | | | |
| | | | |
| Diversified Consumer Services: 0.30% | | | | | | | | | | | | |
Intertrust Group BV 144A | | | 3.38 | | | | 11-15-2025 | | | EUR | 400,000 | | | | 458,324 | |
| | | | | | | | | | | | | | | | |
| | | | |
| Hotels, Restaurants & Leisure: 0.29% | | | | | | | | | | | | |
Accor SA | | | 1.25 | | | | 1-25-2024 | | | EUR | 400,000 | | | | 451,265 | |
| | | | | | | | | | | | | | | | |
|
Consumer Staples: 1.47% | |
|
| Food & Staples Retailing: 0.54% | |
Casino Guichard Perracho SA | | | 3.58 | | | | 2-7-2025 | | | EUR | 400,000 | | | | 382,386 | |
Tasty Bondco 1 SA 144A | | | 6.25 | | | | 5-15-2026 | | | EUR | 400,000 | | | | 457,788 | |
| | | | |
| | | | | | | | | | | | | | | 840,174 | |
| | | | | | | | | | | | | | | | |
16 | Wells Fargo Strategic Income Fund
Portfolio of investments—September 30, 2019
| | | | | | | | | | | | | | | | |
| | | Interest
rate | | | Maturity
date | | | Principal | | | Value | |
| Food Products: 0.63% | |
Danone SA | | | 1.75 | % | | | 12-31-2099 | | | EUR | 400,000 | | | $ | 445,247 | |
Sigma Holdings Company BV 144A | | | 5.75 | | | | 5-15-2026 | | | EUR | 500,000 | | | | 538,762 | |
| | | | |
| | | | | | | | | | | | | | | 984,009 | |
| | | | | | | | | | | | | | | | |
|
| Household Products: 0.30% | |
Energizer Gamma Acquisition BV 144A | | | 4.63 | | | | 7-15-2026 | | | EUR | 400,000 | | | | 460,177 | |
| | | | | | | | | | | | | | | | |
|
Energy: 0.67% | |
|
| Oil, Gas & Consumable Fuels: 0.67% | |
Eni SpA | | | 1.13 | | | | 9-19-2028 | | | EUR | 800,000 | | | | 927,026 | |
Total SA | | | 3.88 | | | | 12-29-2049 | | | EUR | 100,000 | | | | 118,668 | |
| | | | |
| | | | | | | | | | | | | | | 1,045,694 | |
| | | | | | | | | | | | | | | | |
|
Financials: 2.31% | |
|
| Banks: 1.08% | |
Bankia SA | | | 6.00 | | | | 12-31-2099 | | | EUR | 600,000 | | | | 675,188 | |
Caixa Geral de Depositos SA | | | 5.75 | | | | 6-28-2028 | | | EUR | 400,000 | | | | 488,123 | |
Caixa Geral de Depositos SA | | | 10.75 | | | | 12-31-2099 | | | EUR | 400,000 | | | | 506,291 | |
| | | | |
| | | | | | | | | | | | | | | 1,669,602 | |
| | | | | | | | | | | | | | | | |
| | | | |
| Consumer Finance: 0.29% | | | | | | | | | | | | |
Fiat Chrysler Automobiles Bank SpA | | | 1.00 | | | | 11-15-2021 | | | EUR | 400,000 | | | | 444,477 | |
| | | | | | | | | | | | | | | | |
|
| Diversified Financial Services: 0.66% | |
JAB Holdings BV | | | 1.75 | | | | 6-25-2026 | | | EUR | 400,000 | | | | 465,400 | |
LKQ European Holdings BV Company 144A | | | 3.63 | | | | 4-1-2026 | | | EUR | 500,000 | | | | 570,940 | |
| | | | |
| | | | | | | | | | | | | | | 1,036,340 | |
| | | | | | | | | | | | | | | | |
|
| Thrifts & Mortgage Finance: 0.28% | |
Deutsche Pfandbriefbank AG | | | 2.88 | | | | 6-28-2027 | | | EUR | 400,000 | | | | 439,535 | |
| | | | | | | | | | | | | | | | |
|
Industrials: 0.95% | |
|
| Commercial Services & Supplies: 0.59% | |
Paprec Holding SA 144A | | | 4.00 | | | | 3-31-2025 | | | EUR | 450,000 | | | | 458,322 | |
Prosegur Cash SA | | | 1.38 | | | | 2-4-2026 | | | EUR | 400,000 | | | | 447,446 | |
| | | | |
| | | | | | | | | | | | | | | 905,768 | |
| | | | | | | | | | | | | | | | |
|
| Road & Rail: 0.36% | |
Europcar Groupe SA 144A | | | 4.13 | | | | 11-15-2024 | | | EUR | 500,000 | | | | 560,044 | |
| | | | | | | | | | | | | | | | |
|
Information Technology: 0.29% | |
|
| IT Services: 0.29% | |
Capgemini SE | | | 1.00 | | | | 10-18-2024 | | | EUR | 400,000 | | | | 453,636 | |
| | | | | | | | | | | | | | | | |
|
Real Estate: 0.36% | |
|
| Equity REITs: 0.29% | |
Unibail Rodamco SE | | | 2.13 | | | | 12-31-2099 | | | EUR | 400,000 | | | | 446,499 | |
| | | | | | | | | | | | | | | | |
|
| Real Estate Management & Development: 0.07% | |
ATF Netherlands BV | | | 1.50 | | | | 7-15-2024 | | | EUR | 100,000 | | | | 114,119 | |
| | | | | | | | | | | | | | | | |
Wells Fargo Strategic Income Fund | 17
Portfolio of investments—September 30, 2019
| | | | | | | | | | | | | | | | |
| | | Interest
rate | | | Maturity
date | | | Principal | | | Value | |
Utilities: 0.29% | |
|
| Multi-Utilities: 0.29% | |
EP Infrastructure AS | | | 1.66 | % | | | 4-26-2024 | | | EUR | 400,000 | | | $ | 447,986 | |
| | | | | | | | | | | | | | | | |
| |
Total Foreign Corporate Bonds and Notes (Cost $12,553,879) | | | | 12,394,114 | |
| | | | | |
|
| Foreign Government Bonds: 12.67% | |
Argentina ¤ | | | 0.00 | | | | 5-28-2020 | | | ARS | 32,500,000 | | | | 293,398 | |
Bonos y Obligaciones del Estado 144A | | | 0.25 | | | | 7-30-2024 | | | EUR | 1,550,000 | | | | 1,734,328 | |
Bonos y Obligaciones del Estado | | | 0.75 | | | | 7-30-2021 | | | EUR | 770,000 | | | | 858,565 | |
Brazil | | | 10.00 | | | | 1-1-2021 | | | BRL | 2,440,000 | | | | 620,688 | |
Brazil | | | 10.00 | | | | 1-1-2027 | | | BRL | 2,615,000 | | | | 738,027 | |
Colombia | | | 7.00 | | | | 5-4-2022 | | | COP | 4,500,000,000 | | | | 1,360,452 | |
Indonesia | | | 7.00 | | | | 5-15-2022 | | | IDR | 26,000,000,000 | | | | 1,856,211 | |
Italy Buoni Poliennali del Tesoro | | | 0.05 | | | | 4-15-2021 | | | EUR | 750,000 | | | | 821,328 | |
Malaysia | | | 3.88 | | | | 3-10-2022 | | | MYR | 6,000,000 | | | | 1,458,471 | |
Mexico | | | 6.50 | | | | 6-9-2022 | | | MXN | 38,260,000 | | | | 1,928,530 | |
Republic of Peru | | | 5.70 | | | | 8-12-2024 | | | PEN | 4,465,000 | | | | 1,475,916 | |
Republic of South Africa | | | 6.75 | | | | 3-31-2021 | | | ZAR | 20,325,000 | | | | 1,342,966 | |
Republic of South Africa | | | 8.75 | | | | 2-28-2048 | | | ZAR | 7,975,000 | | | | 465,766 | |
Romania | | | 3.40 | | | | 3-8-2022 | | | RON | 4,000,000 | | | | 917,098 | |
Russia | | | 6.90 | | | | 5-23-2029 | | | RUB | 125,000,000 | | | | 1,927,396 | |
Turkey | | | 8.50 | | | | 9-14-2022 | | | TRY | 6,000,000 | | | | 943,244 | |
Turkey | | | 13.00 | | | | 11-13-2019 | | | TRY | 5,400,000 | | | | 955,304 | |
| |
Total Foreign Government Bonds (Cost $20,487,847) | | | | 19,697,688 | |
| | | | | |
|
Loans: 2.56% | |
|
Communication Services: 0.56% | |
|
| Media: 0.40% | |
Ancestry.com Incorporated (1 Month LIBOR +4.25%)±‡ | | | 6.30 | | | | 8-27-2026 | | | $ | 198,480 | | | | 193,766 | |
Gray Television Incorporated (3 Month LIBOR +2.50%)± | | | 4.83 | | | | 1-2-2026 | | | | 99,250 | | | | 99,512 | |
Mission Broadcasting Incorporated (1 Month LIBOR +2.25%)± | | | 4.35 | | | | 1-17-2024 | | | | 21,436 | | | | 21,447 | |
Nexstar Broadcasting Incorporated (1 Month LIBOR +2.25%)± | | | 4.29 | | | | 1-17-2024 | | | | 107,609 | | | | 107,660 | |
Nielsen Finance LLC (1 Month LIBOR +2.00%)± | | | 4.04 | | | | 10-4-2023 | | | | 198,477 | | | | 198,328 | |
| | | | |
| | | | | | | | | | | | | | | 620,713 | |
| | | | | | | | | | | | | | | | |
|
| Wireless Telecommunication Services: 0.16% | |
Sprint Communications Incorporated (1 Month LIBOR +2.50%)± | | | 4.56 | | | | 2-2-2024 | | | | 247,462 | | | | 245,529 | |
| | | | | | | | | | | | | | | | |
|
Consumer Discretionary: 0.56% | |
|
| Auto Components: 0.09% | |
Allison Transmission Incorporated (1 Month LIBOR +2.00%)± | | | 4.05 | | | | 3-29-2026 | | | | 140,734 | | | | 141,731 | |
| | | | | | | | | | | | | | | | |
|
| Distributors: 0.19% | |
Spin Holdco Incorporated (3 Month LIBOR +3.25%)± | | | 5.57 | | | | 11-14-2022 | | | | 299,471 | | | | 294,230 | |
| | | | | | | | | | | | | | | | |
|
| Hotels, Restaurants & Leisure: 0.28% | |
CCM Merger Incorporated (1 Month LIBOR +2.25%)± | | | 4.29 | | | | 8-8-2021 | | | | 241,214 | | | | 241,289 | |
Four Seasons Holdings Incorporated (1 Month LIBOR +2.00%)± | | | 4.04 | | | | 11-30-2023 | | | | 197,964 | | | | 198,818 | |
| | | | |
| | | | | | | | | | | | | | | 440,107 | |
| | | | | | | | | | | | | | | | |
|
Financials: 0.16% | |
|
| Capital Markets: 0.07% | |
Tortoise Borrower LLC (1 Month LIBOR +3.50%)±‡%%< | | | 5.54 | | | | 1-31-2025 | | | | 99,747 | | | | 98,749 | |
| | | | | | | | | | | | | | | | |
18 | Wells Fargo Strategic Income Fund
Portfolio of investments—September 30, 2019
| | | | | | | | | | | | | | | | |
| | | Interest
rate | | | Maturity
date | | | Principal | | | Value | |
| Diversified Financial Services: 0.09% | |
Intelsat Jackson Holdings SA (1 Month LIBOR +3.75%)± | | | 5.80 | % | | | 11-27-2023 | | | $ | 140,332 | | | $ | 140,639 | |
| | | | | | | | | | | | | | | | |
|
Health Care: 0.20% | |
|
| Pharmaceuticals: 0.20% | |
Valeant Pharmaceuticals International Incorporated (1 Month LIBOR +3.00%)± | | | 5.04 | | | | 6-2-2025 | | | | 313,994 | | | | 315,140 | |
| | | | | | | | | | | | | | | | |
|
Industrials: 0.44% | |
|
| Commercial Services & Supplies: 0.02% | |
KAR Auction Services Incorporated (1 Month LIBOR +2.25%)±‡ | | | 4.31 | | | | 9-19-2026 | | | | 22,771 | | | | 22,856 | |
| | | | | | | | | | | | | | | | |
|
| Communications Equipment: 0.32% | |
Charter Communications Operating LLC (3 Month LIBOR +2.00%)± | | | 4.05 | | | | 4-30-2025 | | | | 494,962 | | | | 497,684 | |
| | | | | | | | | | | | | | | | |
|
| Machinery: 0.10% | |
Columbus McKinnon Corporation (3 Month LIBOR +2.50%)±‡ | | | 4.60 | | | | 1-31-2024 | | | | 160,053 | | | | 160,453 | |
| | | | | | | | | | | | | | | | |
|
Information Technology: 0.41% | |
|
| Electronic Equipment, Instruments & Components: 0.38% | |
Dell International LLC (1 Month LIBOR +2.00%)± | | | 4.05 | | | | 9-19-2025 | | | | 586,140 | | | | 588,708 | |
| | | | | | | | | | | | | | | | |
|
| Software: 0.03% | |
Emerald Topco Incorporated (1 Month LIBOR +3.50%)± | | | 5.54 | | | | 7-24-2026 | | | | 50,000 | | | | 49,834 | |
| | | | | | | | | | | | | | | | |
|
Materials: 0.13% | |
|
| Containers & Packaging: 0.13% | |
RING Container Technologies (1 Month LIBOR +2.75%)±%%< | | | 4.79 | | | | 10-31-2024 | | | | 199,488 | | | | 197,555 | |
| | | | | | | | | | | | | | | | |
|
Real Estate: 0.10% | |
|
| Real Estate Management & Development: 0.10% | |
Capital Automotive LP (1 Month LIBOR +2.50%)± | | | 4.55 | | | | 3-24-2024 | | | | 159,526 | | | | 159,476 | |
| | | | | | | | | | | | | | | | |
| |
Total Loans (Cost $3,983,241) | | | | 3,973,404 | |
| | | | | |
|
Municipal Obligations: 0.85% | |
|
Illinois: 0.72% | |
|
| GO Revenue: 0.63% | |
Chicago IL Refunding Bonds Taxable Project Series E | | | 6.05 | | | | 1-1-2029 | | | | 155,000 | | | | 165,228 | |
Illinois Taxable Pension « | | | 5.10 | | | | 6-1-2033 | | | | 750,000 | | | | 812,355 | |
| | | | |
| | | | | | | | | | | | | | | 977,583 | |
| | | | | | | | | | | | | | | | |
|
| Tax Revenue: 0.09% | |
Chicago IL Transit Authority Taxable Pension Funding Series A | | | 6.90 | | | | 12-1-2040 | | | | 100,000 | | | | 139,980 | |
| | | | | | | | | | | | | | | | |
| | | | |
| | | | | | | | | | | | | | | 1,117,563 | |
| | | | | | | | | | | | | | | | |
|
Maryland: 0.07% | |
|
| Education Revenue: 0.07% | |
Maryland Health & HEFAR Green Street Academy Series B 144A | | | 6.75 | | | | 7-1-2023 | | | | 100,000 | | | | 100,434 | |
| | | | | | | | | | | | | | | | |
Wells Fargo Strategic Income Fund | 19
Portfolio of investments—September 30, 2019
| | | | | | | | | | | | | | | | |
| | | Interest
rate | | | Maturity
date | | | Principal | | | Value | |
Pennsylvania: 0.06% | |
|
| Health Revenue: 0.06% | |
Quakertown PA General Authority USDA Loan Anticipation Notes Series2017-B | | | 3.80 | % | | | 7-1-2021 | | | $ | 100,000 | | | $ | 100,013 | |
| | | | | | | | | | | | | | | | |
| |
Total Municipal Obligations (Cost $1,198,754) | | | | 1,318,010 | |
| | | | | | | | | | | | | | | | �� |
|
| Non-Agency Mortgage-Backed Securities: 31.42% | |
321 Henderson Receivables LLC Series2013-2A Class A 144A | | | 4.21 | | | | 3-15-2062 | | | | 1,006,082 | | | | 1,123,283 | |
321 Henderson Receivables LLC Series2015-2A Class A 144A | | | 3.87 | | | | 3-15-2058 | | | | 381,884 | | | | 424,569 | |
AFN LLC Series2019-1A Class A2 144A‡ | | | 4.46 | | | | 5-20-2049 | | | | 700,000 | | | | 729,632 | |
ALM Loan Funding Series2016-18A Class A2R (3 Month LIBOR +1.65%) 144A± | | | 3.95 | | | | 1-15-2028 | | | | 600,000 | | | | 598,610 | |
Aqua Finance Trust Series2019-A Class A 144A | | | 3.14 | | | | 7-16-2040 | | | | 550,000 | | | | 550,712 | |
Arroyo Mortgage Trust Series2019-1 Class A1 144A±± | | | 3.81 | | | | 1-25-2049 | | | | 701,063 | | | | 716,641 | |
Arroyo Mortgage Trust Series2019-2 Class A2 144A±± | | | 3.50 | | | | 4-25-2049 | | | | 1,401,092 | | | | 1,422,905 | |
Avant Loans Funding Trust Series2019-A Class A 144A | | | 3.48 | | | | 7-15-2022 | | | | 695,137 | | | | 697,707 | |
Avery Point CLO Limited Series2015-6A Class AR (3 Month LIBOR +1.05%) 144A± | | | 3.34 | | | | 8-5-2027 | | | | 750,000 | | | | 750,482 | |
BB-UBS Trust Series2012-TFT Class C 144A±± | | | 3.58 | | | | 6-5-2030 | | | | 150,000 | | | | 148,647 | |
BCC Funding Corporation Series2016-1 Class B 144A | | | 2.73 | | | | 4-20-2022 | | | | 262,093 | | | | 262,160 | |
BlueMountain CLO Limited Series2012-2A Class AR2 (3 Month LIBOR +1.05%) 144A± | | | 3.19 | | | | 11-20-2028 | | | | 1,500,000 | | | | 1,500,693 | |
BlueMountain CLO Limited Series2015-3A Class A1R (3 Month LIBOR +1.00%) 144A± | | | 3.28 | | | | 4-20-2031 | | | | 700,000 | | | | 695,694 | |
Bowman Park CLO Limited Series2014-1A Class AR (3 Month LIBOR +1.18 %) 144A± | | | 3.33 | | | | 11-23-2025 | | | | 1,260,791 | | | | 1,262,164 | |
CIFC Funding Limited Series2018-1A Class B (3 Month LIBOR +1.40%) 144A± | | | 4.18 | | | | 4-18-2031 | | | | 1,000,000 | | | | 977,662 | |
Citigroup Commercial Mortgage Trust Series2018-C6 Class AS±± | | | 4.64 | | | | 11-10-2051 | | | | 1,000,000 | | | | 1,151,640 | |
CLI Funding LLC Series2019-1A Class A 144A | | | 3.71 | | | | 5-18-2044 | | | | 1,445,360 | | | | 1,473,406 | |
CLI Funding LLC Series2019-1A Class B 144A | | | 4.64 | | | | 5-18-2044 | | | | 578,152 | | | | 590,878 | |
Cole Park CLO Limited Series2015-1A Class BR (3 Month LIBOR +1.60%) 144A± | | | 3.88 | | | | 10-20-2028 | | | | 1,000,000 | | | | 997,672 | |
CommonBond Student Loan Trust Series2018-CGS Class C 144A | | | 4.35 | | | | 2-25-2046 | | | | 1,377,624 | | | | 1,388,752 | |
Consumer Lending Receivables LLC Series2019-A Class A 144A | | | 3.52 | | | | 4-15-2026 | | | | 805,900 | | | | 810,085 | |
Consumer Loan Underlying Bond Credit Trust Series2018-P2 Class B 144A | | | 4.10 | | | | 10-15-2025 | | | | 500,000 | | | | 509,292 | |
Consumer Loan Underlying Bond Credit Trust Series2018-P3 Class A 144A | | | 3.82 | | | | 1-15-2026 | | | | 628,664 | | | | 634,321 | |
Driven Brands Funding LLC Series2019-2A Class A2 144A | | | 3.98 | | | | 10-20-2049 | | | | 350,000 | | | | 351,647 | |
Foundation Finance Trust Series2019-1A Class A 144A | | | 3.86 | | | | 11-15-2034 | | | | 836,660 | | | | 847,465 | |
FREMF Mortgage Trust Series 2017-K724 Class B 144A±± | | | 3.60 | | | | 11-25-2023 | | | | 400,000 | | | | 410,192 | |
GS Mortgage Security Trust Series 2014-GC22 Class AS | | | 4.11 | | | | 6-10-2047 | | | | 1,450,000 | | | | 1,538,225 | |
GS Mortgage Security Trust Series 2018-LUAU Class B (1 Month LIBOR +1.40%) 144A± | | | 3.43 | | | | 11-15-2032 | | | | 1,600,000 | | | | 1,597,990 | |
Harley Marine Financing LLC Barge Series2018-1A Class A2 144A | | | 5.68 | | | | 5-15-2043 | | | | 668,131 | | | | 589,192 | |
Longtrain Leasing III LLC Series2015-1A Class A2 144A | | | 4.06 | | | | 1-15-2045 | | | | 1,600,000 | | | | 1,657,231 | |
Marlette Funding Trust Series2018-3A Class A 144A | | | 3.20 | | | | 9-15-2028 | | | | 203,088 | | | | 203,610 | |
Marlette Funding Trust Series2018-4A Class B 144A | | | 4.21 | | | | 12-15-2028 | | | | 1,100,000 | | | | 1,130,086 | |
Marlette Funding Trust Series2019-1A Class A 144A | | | 3.44 | | | | 4-16-2029 | | | | 786,013 | | | | 791,669 | |
MidOcean Credit CLO Limited Series2016-5A Class B1R (3 Month LIBOR +1.60%) 144A± | | | 3.90 | | | | 7-19-2028 | | | | 500,000 | | | | 496,308 | |
MP CLO VIII Limited Series2015-2A Class AR (3 Month LIBOR +0.91%) 144A± | | | 3.17 | | | | 10-28-2027 | | | | 600,000 | | | | 599,929 | |
20 | Wells Fargo Strategic Income Fund
Portfolio of investments—September 30, 2019
| | | | | | | | | | | | | | | | |
| | | Interest
rate | | | Maturity
date | | | Principal | | | Value | |
|
| Non-Agency Mortgage-Backed Securities (continued) | |
Navistar Financial Dealer Note Series2018-1 Class D (1 Month LIBOR +1.55%) 144A± | | | 3.57 | % | | | 9-25-2023 | | | $ | 600,000 | | | $ | 600,702 | |
New Residential Mortgage Loan Trust Series 2019-NQM2 Class A1 144A±± | | | 3.60 | | | | 4-25-2049 | | | | 873,021 | | | | 884,297 | |
Onemain Financial Issuance Trust Series2019-1A Class D 144A | | | 4.22 | | | | 2-14-2031 | | | | 1,100,000 | | | | 1,145,932 | |
Oxford Finance Funding Trust Series2019-1A Class A2 144A | | | 4.46 | | | | 2-15-2027 | | | | 800,000 | | | | 820,288 | |
SoFi Consumer Loan Program Trust Series2016-3 Class A 144A | | | 3.05 | | | | 12-26-2025 | | | | 95,561 | | | | 95,928 | |
SoFi Consumer Loan Program Trust Series2017-2 Class A 144A | | | 3.28 | | | | 2-25-2026 | | | | 593,419 | | | | 598,001 | |
SoFi Consumer Loan Program Trust Series2018-1 Class C 144A | | | 3.97 | | | | 2-25-2027 | | | | 700,000 | | | | 716,441 | |
SoFi Consumer Loan Program Trust Series2018-4 Class D 144A | | | 4.76 | | | | 11-26-2027 | | | | 300,000 | | | | 311,043 | |
SoFi Professional Loan Program LLC Series 2016-A Class A2 144A | | | 2.76 | | | | 12-26-2036 | | | | 147,388 | | | | 148,305 | |
SoFi Professional Loan Program LLC Series2017-E Class B 144A | | | 3.49 | | | | 11-26-2040 | | | | 300,000 | | | | 308,375 | |
Store Master Funding LLC Series2014-1A Class A2 144A | | | 5.00 | | | | 4-20-2044 | | | | 97,333 | | | | 102,397 | |
Store Master Funding LLC Series2015-1A Class A1 144A | | | 3.75 | | | | 4-20-2045 | | | | 1,349,525 | | | | 1,377,182 | |
Taco Bell Funding LLC Series2018-1A Class A21 144A | | | 4.32 | | | | 11-25-2048 | | | | 992,500 | | | | 1,027,992 | |
TCI Symphony CLO Limited Series2016-1A Class BR (3 Month LIBOR +1.65%) 144A± | | | 3.95 | | | | 10-13-2029 | | | | 1,500,000 | | | | 1,492,232 | |
Textainer Marine Containers Limited Series2017-1A Class B 144A | | | 4.85 | | | | 5-20-2042 | | | | 132,761 | | | | 134,920 | |
Textainer Marine Containers Limited Series2017-2A Class B 144A | | | 4.75 | | | | 6-20-2042 | | | | 81,851 | | | | 83,174 | |
Venture CDO Limited Series2016-23A Class AR (3 Month LIBOR +1.07%) 144A± | | | 3.37 | | | | 7-19-2028 | | | | 700,000 | | | | 698,258 | |
Venture CDO Limited Series2017-28A Class A2 (3 Month LIBOR +1.11%) 144A± | | | 3.39 | | | | 7-20-2030 | | | | 1,180,000 | | | | 1,171,667 | |
Venture CDO Limited Series2018-35A Class AS (3 Month LIBOR +1.15%) 144A± | | | 3.43 | | | | 10-22-2031 | | | | 1,300,000 | | | | 1,299,645 | |
Verus Securitization Trust Series2019-1 Class A1 144A±± | | | 3.84 | | | | 2-25-2059 | | | | 815,625 | | | | 824,610 | |
Verus Securitization Trust Series2019-2 Class A1 144A±± | | | 3.21 | | | | 4-25-2059 | | | | 894,586 | | | | 899,489 | |
Verus Securitization Trust Series2019-3 Class A2 144A | | | 2.94 | | | | 7-25-2059 | | | | 1,946,426 | | | | 1,946,852 | |
Voya CLO Limited Series2015-1A Class A1R (3 Month LIBOR +0.90%) 144A± | | | 3.20 | | | | 1-18-2029 | | | | 1,500,000 | | | | 1,498,211 | |
Voya CLO Limited Series2019-1A Class A (3 Month LIBOR +1.17%) 144A± | | | 3.81 | | | | 4-15-2029 | | | | 1,000,000 | | | | 999,991 | |
| |
TotalNon-Agency Mortgage-Backed Securities (Cost $48,104,698) | | | | 48,817,083 | |
| | | | | | | | | | | | | | | | |
| | | | |
| | | | | | | | | | | | | | | | |
| | | | Expiration
date | | | Shares | | | | |
| Rights: 0.00% | |
|
Utilities: 0.00% | |
|
| Independent Power & Renewable Electricity Producers: 0.00% | |
Vistra Energy Corporation † | | | | 12-31-2046 | | | | 6,516 | | | | 5,539 | |
| | | | | | | | | | | | | | | | |
| |
Total Rights (Cost $6,785) | | | | 5,539 | |
| | | | | | | | | | | | | | | | |
| | | | |
| | | | | | | | | | | | | | | | |
| | | | | | | | | Principal | | | | |
| U.S. Treasury Securities: 0.66% | |
U.S. Treasury Bond | | | 2.25 | | | | 8-15-2049 | | | $ | 245,000 | | | | 252,226 | |
U.S. Treasury Bond | | | 2.88 | | | | 5-15-2049 | | | | 180,000 | | | | 210,108 | |
U.S. Treasury Note | | | 2.38 | | | | 5-15-2029 | | | | 535,000 | | | | 568,291 | |
| |
Total U.S. Treasury Securities (Cost $996,622) | | | | 1,030,625 | |
| | | | | | | | | | | | | | | | |
Wells Fargo Strategic Income Fund | 21
Portfolio of investments—September 30, 2019
| | | | | | | | | | | | | | | | |
| | | Interest
rate | | | Maturity
date | | | Principal | | | Value | |
| Yankee Corporate Bonds and Notes: 5.73% | |
|
Communication Services: 0.69% | |
|
| Wireless Telecommunication Services: 0.69% | |
British Telecommunication | | | 5.13 | % | | | 12-4-2028 | | | $ | 800,000 | | | $ | 915,180 | |
Connect Finco SARL 144A%% | | | 6.75 | | | | 10-1-2026 | | | | 150,000 | | | | 152,813 | |
| | | | |
| | | | | | | | | | | | | | | 1,067,993 | |
| | | | | | | | | | | | | | | | |
|
Energy: 0.95% | |
|
| Energy Equipment & Services: 0.05% | |
Valaris plc | | | 5.75 | | | | 10-1-2044 | | | | 175,000 | | | | 74,375 | |
| | | | | | | | | | | | | | | | |
|
| Oil, Gas & Consumable Fuels: 0.90% | |
Baytex Energy Corporation 144A | | | 5.63 | | | | 6-1-2024 | | | | 150,000 | | | | 138,000 | |
Comision Federal de Electricidad 144A | | | 4.75 | | | | 2-23-2027 | | | | 250,000 | | | | 262,503 | |
Petroleos Mexicanos Company 144A | | | 6.84 | | | | 1-23-2030 | | | | 120,000 | | | | 124,104 | |
Woodside Finance Limited 144A | | | 3.70 | | | | 3-15-2028 | | | | 850,000 | | | | 872,719 | |
| | | | |
| | | | | | | | | | | | | | | 1,397,326 | |
| | | | | | | | | | | | | | | | |
|
Financials: 3.11% | |
|
| Banks: 1.59% | |
ABN AMRO Bank NV 144A | | | 4.75 | | | | 7-28-2025 | | | | 200,000 | | | | 215,197 | |
Banco Internacional del Peru 144A«%% | | | 3.25 | | | | 10-4-2026 | | | | 525,000 | | | | 524,213 | |
BPCE SA 144A | | | 5.15 | | | | 7-21-2024 | | | | 305,000 | | | | 334,012 | |
Credit Agricole SA 144A | | | 8.13 | | | | 12-29-2049 | | | | 265,000 | | | | 311,706 | |
Intesa Sanpaolo SpA 144A | | | 5.71 | | | | 1-15-2026 | | | | 635,000 | | | | 673,914 | |
Perrigo Finance Unlimited Company | | | 4.38 | | | | 3-15-2026 | | | | 400,000 | | | | 413,511 | |
| | | | |
| | | | | | | | | | | | | | | 2,472,553 | |
| | | | | | | | | | | | | | | | |
|
| Capital Markets: 0.17% | |
Cadillac Fairview Corporation Limited 144A | | | 4.13 | | | | 2-1-2029 | | | | 240,000 | | | | 269,157 | |
| | | | | | | | | | | | | | | | |
|
| Diversified Financial Services: 0.20% | |
Intelsat Jackson Holdings SA | | | 5.50 | | | | 8-1-2023 | | | | 300,000 | | | | 279,870 | |
Trivium Packaging Finance BV 144A | | | 5.50 | | | | 8-15-2026 | | | | 25,000 | | | | 26,280 | |
| | | | |
| | | | | | | | | | | | | | | 306,150 | |
| | | | | | | | | | | | | | | | |
|
| Insurance: 0.99% | |
Allied World Assurance Company Holdings Limited | | | 4.35 | | | | 10-29-2025 | | | | 810,000 | | | | 841,432 | |
Swiss Re Finance (Luxembourg) SA (5 Year Treasury Constant Maturity +3.58 %) 144A± | | | 5.00 | | | | 4-2-2049 | | | | 400,000 | | | | 441,500 | |
Validus Holdings Limited | | | 8.88 | | | | 1-26-2040 | | | | 160,000 | | | | 262,866 | |
| | | | |
| | | | | | | | | | | | | | | 1,545,798 | |
| | | | | | | | | | | | | | | | |
|
| Thrifts & Mortgage Finance: 0.16% | |
Nationwide Building Society 144A | | | 4.13 | | | | 10-18-2032 | | | | 250,000 | | | | 249,192 | |
| | | | | | | | | | | | | | | | |
|
Health Care: 0.60% | |
|
| Pharmaceuticals: 0.60% | |
Bausch Health Companies Incorporated 144A | | | 5.50 | | | | 3-1-2023 | | | | 11,000 | | | | 11,138 | |
Bausch Health Companies Incorporated 144A | | | 5.50 | | | | 11-1-2025 | | | | 50,000 | | | | 52,318 | |
Bausch Health Companies Incorporated 144A | | | 6.13 | | | | 4-15-2025 | | | | 225,000 | | | | 233,438 | |
Bausch Health Companies Incorporated 144A | | | 7.00 | | | | 3-15-2024 | | | | 25,000 | | | | 26,274 | |
22 | Wells Fargo Strategic Income Fund
Portfolio of investments—September 30, 2019
| | | | | | | | | | | | | | | | |
| | | Interest
rate | | | Maturity
date | | | Principal | | | Value | |
|
| Pharmaceuticals (continued) | |
Teva Pharmaceutical Finance BV | | | 2.20 | % | | | 7-21-2021 | | | $ | 200,000 | | | $ | 182,750 | |
Teva Pharmaceutical Finance BV | | | 4.10 | | | | 10-1-2046 | | | | 50,000 | | | | 31,375 | |
Teva Pharmaceutical Finance Netherlands II BV | | | 4.50 | | | | 3-1-2025 | | | | 400,000 | | | | 368,912 | |
Teva Pharmaceutical Finance Netherlands III BV | | | 6.75 | | | | 3-1-2028 | | | | 25,000 | | | | 20,500 | |
| | | | |
| | | | | | | | | | | | | | | 926,705 | |
| | | | | | | | | | | | | | | | |
|
Industrials: 0.38% | |
|
| Commercial Services & Supplies: 0.13% | |
Ritchie Brothers Auctioneers Incorporated 144A | | | 5.38 | | | | 1-15-2025 | | | | 200,000 | | | | 208,750 | |
| | | | | | | | | | | | | | | | |
|
| Electrical Equipment: 0.14% | |
Sensata Technologies BV 144A | | | 6.25 | | | | 2-15-2026 | | | | 200,000 | | | | 213,000 | |
| | | | | | | | | | | | | | | | |
|
| Transportation Infrastructure: 0.11% | |
Asciano Finance Limited 144A | | | 4.63 | | | | 9-23-2020 | | | | 170,000 | | | | 173,278 | |
| | | | | | | | | | | | | | | | |
| |
Total Yankee Corporate Bonds and Notes (Cost $8,506,010) | | | | 8,904,277 | |
| | | | | | | | | | | | | | | | |
|
| Yankee Government Bonds: 1.27% | |
Commonwealth of Bahamas | | | 6.00 | | | | 11-21-2028 | | | | 200,000 | | | | 211,752 | |
Federal Democratic Republic of Ethiopia | | | 6.63 | | | | 12-11-2024 | | | | 200,000 | | | | 208,104 | |
Mongolia Government | | | 5.63 | | | | 5-1-2023 | | | | 200,000 | | | | 201,998 | |
Oman Government International Bond | | | 5.63 | | | | 1-17-2028 | | | | 400,000 | | | | 393,574 | |
Province of Cordoba 144A | | | 7.13 | | | | 8-1-2027 | | | | 550,000 | | | | 308,000 | |
Province of Santa Fe | | | 7.00 | | | | 3-23-2023 | | | | 350,000 | | | | 231,875 | |
Republic of Rwanda | | | 6.63 | | | | 5-2-2023 | | | | 200,000 | | | | 215,792 | |
Republic of Sri Lanka | | | 5.75 | | | | 1-18-2022 | | | | 200,000 | | | | 200,596 | |
| |
Total Yankee Government Bonds (Cost $2,260,005) | | | | 1,971,691 | |
| | | | | | | | | | | | | | | | |
| | | | |
| | | | | | | | | | | | | | | | |
| | | Yield | | | | | | Shares | | | | |
| Short-Term Investments: 4.50% | | | | | | | | | | | | |
| | | | |
| Investment Companies: 4.50% | | | | | | | | | | | | |
Securities Lending Cash Investments LLC (l)(r)(u) | | | 2.11 | | | | | | | | 1,264,839 | | | | 1,264,965 | |
Wells Fargo Government Money Market Fund Select Class (l)(u)## | | | 1.88 | | | | | | | | 5,727,766 | | | | 5,727,766 | |
| | | | |
Total Short-Term Investments (Cost $6,992,731) | | | | | | | | | | | | | | | 6,992,731 | |
| | | | | | | | | | | | | | | | |
| | | | | | | | |
| Total investments in securities (Cost $153,235,513) | | | 99.78 | % | | | 155,055,363 | |
| | |
Other assets and liabilities, net | | | 0.22 | | | | 347,947 | |
| | | | | | | | |
| Total net assets | | | 100.00 | % | | $ | 155,403,310 | |
| | | | | | | | |
| 144A | The security may be resold in transactions exempt from registration, normally to qualified institutional buyers, pursuant to Rule 144A under the Securities Act of 1933. |
| ± | Variable rate investment. The rate shown is the rate in effect at period end. |
| « | All or a portion of this security is on loan. |
| ¤ | The security is issued in zero coupon form with no periodic interest payments. |
| ‡ | Security is valued using significant unobservable inputs. |
| ±± | The coupon of the security is adjusted based on the principal and interest payments received from the underlying pool of mortgages as well as the credit quality and the actual prepayment speed of the underlying mortgages. |
| < | All or a portion of the position represents an unfunded loan commitment. |
| † | Non-income-earning security |
| %% | The security is purchased on a when-issued basis. |
| (l) | The issuer of the security is an affiliated person of the Fund as defined in the Investment Company Act of 1940. |
| (r) | The investment is anon-registered investment company purchased with cash collateral received from securities on loan. |
| (u) | The rate represents the7-day annualized yield at period end. |
| ## | All or a portion of this security is segregated for when-issued securities and/or unfunded loans. |
Wells Fargo Strategic Income Fund | 23
Portfolio of investments—September 30, 2019
Abbreviations:
| CDO | Collateralized debt obligation |
| CLO | Collateralized loan obligation |
| HEFAR | Higher Education Facilities Authority Revenue |
| LIBOR | London Interbank Offered Rate |
| REIT | Real estate investment trust |
Futures Contracts
| | | | | | | | | | | | | | | | | | | | | | | | |
| Description | | Number of
contracts | | | Expiration
date | | | Notional
cost | | | Notional
value | | | Unrealized
gains | | | Unrealized
losses | |
| | | | | | |
Long | | | | | | | | | | | | | | | | | | | | | | | | |
| | | | | | |
Euro-Bund Futures | | | 8 | | | | 12-6-2019 | | | $ | 1,517,921 | | | $ | 1,519,391 | | | $ | 1,470 | | | $ | 0 | |
| | | | | | |
U.S. Long Bond | | | 20 | | | | 12-19-2019 | | | | 3,269,566 | | | | 3,246,250 | | | | 0 | | | | (23,316 | ) |
| | | | | | |
2-Year U.S. Treasury Notes | | | 24 | | | | 12-31-2019 | | | | 5,182,538 | | | | 5,172,000 | | | | 0 | | | | (10,538 | ) |
| | | | | | |
Short | | | | | | | | | | | | | | | | | | | | | | | | |
| | | | | | |
Euro-BOBL Futures | | | (57) | | | | 12-6-2019 | | | | (8,464,282 | ) | | | (8,427,550 | ) | | | 36,732 | | | | 0 | |
| | | | | | |
Euro-Schatz Futures | | | (161) | | | | 12-6-2019 | | | | (19,749,436 | ) | | | (19,711,893 | ) | | | 37,543 | | | | 0 | |
| | | | | | |
10-Year Ultra Futures | | | (31) | | | | 12-19-2019 | | | | (4,497,850 | ) | | | (4,414,593 | ) | | | 83,257 | | | | 0 | |
| | | | | | |
10-Year U.S. Treasury Notes | | | (119) | | | | 12-19-2019 | | | | (15,699,798 | ) | | | (15,507,188 | ) | | | 192,610 | | | | 0 | |
| | | | | | |
U.S. Ultra Bond | | | (21) | | | | 12-19-2019 | | | | (4,197,805 | ) | | | (4,030,032 | ) | | | 167,773 | | | | 0 | |
| | | | | | |
5-Year U.S. Treasury Notes | | | (60) | | | | 12-31-2019 | | | | (7,207,762 | ) | | | (7,148,907 | ) | | | 58,855 | | | | 0 | |
| | | | | | | | | | | | | | | | | | | | | | | | |
| | | | | | |
| | | | | | | | | | | | | | | | | | $ | 578,240 | | | $ | (33,854 | ) |
| | | | | | | | | | | | | | | | | | | | | | | | |
Forward Foreign Currency Contracts
| | | | | | | | | | | | | | |
Currency to be
received | | Currency to be
delivered | | Counterparty | | Settlement
date | | Unrealized
gains | | | Unrealized
losses | |
| | | | | |
| 1,881,049 USD | | 28,300,000 ZAR | | State Street Bank | | 10-7-2019 | | $ | 13,677 | | | $ | 0 | |
| | | | | |
| 10,000 PLN | | 2,616 USD | | State Street Bank | | 10-28-2019 | | | 0 | | | | (121 | ) |
| | | | | |
| 2,026,180 USD | | 7,730,000 PLN | | State Street Bank | | 10-28-2019 | | | 97,931 | | | | 0 | |
| | | | | |
| 7,720,000 PLN | | 2,019,740 USD | | State Street Bank | | 10-28-2019 | | | 0 | | | | (93,985 | ) |
| | | | | |
| 1,952,183 USD | | 124,725,000 RUB | | State Street Bank | | 10-29-2019 | | | 35,478 | | | | 0 | |
| | | | | |
| 37,875,000 INR | | 529,424 USD | | State Street Bank | | 11-7-2019 | | | 3,023 | | | | 0 | |
| | | | | |
| 38,900,000 INR | | 544,277 USD | | State Street Bank | | 11-7-2019 | | | 2,580 | | | | 0 | |
24 | Wells Fargo Strategic Income Fund
Portfolio of investments—September 30, 2019
Forward Foreign Currency Contracts (continued)
| | | | | | | | | | | | | | |
Currency to be
received | | Currency to be
delivered | | Counterparty | | Settlement
date | | Unrealized
gains | | | Unrealized
losses | |
| | | | | |
| 47,800,000 INR | | 668,952 USD | | State Street Bank | | 11-7-2019 | | $ | 3,021 | | | $ | 0 | |
| | | | | |
| 14,150,000 INR | | 198,179 USD | | State Street Bank | | 11-7-2019 | | | 742 | | | | 0 | |
| | | | | |
| 1,941,024 USD | | 13,725,000 INR | | State Street Bank | | 11-7-2019 | | | 0 | | | | (9,174 | ) |
| | | | | |
| 1,982,969 USD | | 28,875,000,000 IDR | | State Street Bank | | 11-8-2019 | | | 0 | | | | (43,286 | ) |
| | | | | |
| 2,025,000,000 IDR | | 140,041 USD | | State Street Bank | | 11-8-2019 | | | 2,060 | | | | 0 | |
| | | | | |
| 885,000 EUR | | 822,906 GBP | | State Street Bank | | 11-13-2019 | | | 0 | | | | (45,879 | ) |
| | | | | |
| 105,000,000 JPY | | 823,361 GBP | | State Street Bank | | 11-14-2019 | | | 0 | | | | (40,276 | ) |
| | | | | |
| 1,431,933 USD | | 4,850,000,000 COP | | State Street Bank | | 11-25-2019 | | | 41,735 | | | | 0 | |
| | | | | |
| 19,891,109 USD | | 17,837,000 EUR | | Citibank | | 12-31-2019 | | | 310,257 | | | | 0 | |
| | | | | | | | | | | | | | |
| | | | | |
| | | | | | | | $ | 510,504 | | | $ | (232,721 | ) |
| | | | | | | | | | | | | | |
Centrally Cleared Credit Default Swaps
| | | | | | | | | | | | | | | | | | | | | | | | | | | | | | | | |
| Reference index | | Fixed rate
received | | | Payment
frequency | | | Maturity
date | | | Notional
amount | | | Value | | | Premium
paid | | | Unrealized
gains | | | Unrealized
losses | |
| | | | | | | | |
Sell protection | | | | | | | | | | | | | | | | | | | | | | | | | | | | | | | | |
| | | | | | | | |
Markit CDX North America Investment Grade Index | | | 5.00 | % | | | Quarterly | | | | 12-20-2023 | | | | 1,455,000 USD | | | $ | 112,404 | | | $ | 40,249 | | | $ | 72,155 | | | $ | 0 | |
Investments in Affiliates
An affiliated investment is an investment in which the Fund owns at least 5% of the outstanding voting shares of the issuer or as a result of other relationships, such as the Fund and the issuer having the same investment manager. Transactions with issuers that were either affiliated persons of the Fund at the beginning of the period or the end of the period were as follows:
| | | | | | | | | | | | | | | | | | | | | | | | | | | | | | | | | | | | |
| | | Shares,
beginning of
period | | | Shares
purchased | | | Shares
sold | | | Shares,
end of
period | | | Net
realized
gains
(losses) | | | Net
change in
unrealized
gains
(losses) | | | Income
from
affiliated
securities | | | Value,
end of
period | | | % of
net
assets | |
Short-Term Investments | | | | | | | | | | | | | | | | | | | | | | | | | | | | | | | | | | | | |
Investment Companies | | | | | | | | | | | | | | | | | | | | | | | | | | | | | | | | | | | | |
Securities Lending Cash Investments LLC | | | 0 | | | | 59,057,571 | | | | 57,792,732 | | | | 1,264,839 | | | $ | 0 | | | $ | 0 | | | $ | 40,867 | # | | $ | 1,264,965 | | | | | |
Wells Fargo Government Money Market Fund Select Class | | | 5,204,420 | | | | 241,719,829 | | | | 241,196,483 | | | | 5,727,766 | | | | 0 | | | | 0 | | | | 233,512 | | | | 5,727,766 | | | | | |
| | | | | | | | | | | | | | | | | | | | | | | | | | | | | | | | | | | | |
| | | | | | | | | | | | | | | | | | $ | 0 | | | $ | 0 | | | $ | 274,379 | | | $ | 6,992,731 | | | | 4.50 | % |
| | | | | | | | | | | | | | | | | | | | | | | | | | | | | | | | | | | | |
| # | Amount shown represents income before fees and rebates. |
The accompanying notes are an integral part of these financial statements.
Wells Fargo Strategic Income Fund | 25
Statement of assets and liabilities—September 30, 2019
| | | | |
| | | | |
| |
Assets | | | | |
Investments in unaffiliated securities (including $1,239,357 of securities loaned, at value (cost $146,242,782) | | $ | 148,062,632 | |
Investments in affiliated securities, at value (cost $6,992,731) | | | 6,992,731 | |
Cash at broker segregated for futures contracts | | | 668,477 | |
Cash at broker segregated for centrally cleared swaps | | | 133,852 | |
Foreign currency, at value (cost $80,926) | | | 79,801 | |
Receivable for investments sold | | | 914,983 | |
Receivable for Fund shares sold | | | 59,588 | |
Receivable for interest | | | 1,212,727 | |
Receivable for securities lending income, net | | | 1,243 | |
Receivable for daily variation margin on centrally cleared swaps | | | 3,395 | |
Receivable for daily variation margin on open futures contracts | | | 6,412 | |
Unrealized gains on forward foreign currency contracts | | | 510,504 | |
Prepaid expenses and other assets | | | 24,429 | |
| | | | |
Total assets | | | 158,670,774 | |
| | | | |
| |
Liabilities | | | | |
Payable upon receipt of securities loaned | | | 1,264,618 | |
Payable for investments purchased | | | 973,486 | |
Unrealized losses on forward foreign currency contracts | | | 232,721 | |
Payable for Fund shares redeemed | | | 139,407 | |
Management fee payable | | | 49,026 | |
Administration fees payable | | | 10,385 | |
Trustees’ fees and expenses payable | | | 2,240 | |
Distribution fee payable | | | 346 | |
Overdraft due to custodian bank | | | 441,666 | |
Accrued expenses and other liabilities | | | 153,569 | |
| | | | |
Total liabilities | | | 3,267,464 | |
| | | | |
Total net assets | | $ | 155,403,310 | |
| | | | |
| |
Net assets consist of | | | | |
Paid-in capital | | $ | 154,439,256 | |
Total distributable earnings | | | 964,054 | |
| | | | |
Total net assets | | $ | 155,403,310 | |
| | | | |
| |
Computation of net asset value and offering price per share | | | | |
Net assets – Class A | | $ | 1,394,195 | |
Shares outstanding – Class A1 | | | 146,683 | |
Net asset value per share – Class A | | | $9.50 | |
Maximum offering price per share – Class A2 | | | $9.90 | |
Net assets – Class C | | $ | 520,294 | |
Shares outstanding – Class C1 | | | 54,849 | |
Net asset value per share – Class C | | | $9.49 | |
Net assets – Administrator Class | | $ | 74,905 | |
Shares outstanding – Administrator Class1 | | | 7,837 | |
Net asset value per share – Administrator Class | | | $9.56 | |
Net assets – Institutional Class | | $ | 153,413,916 | |
Shares outstanding – Institutional Class1 | | | 16,157,346 | |
Net asset value per share – Institutional Class | | | $9.49 | |
| 1 | The Fund has an unlimited number of authorized shares. |
| 2 | Maximum offering price is computed as 100/96 of net asset value. On investments of $50,000 or more, the offering price is reduced. |
The accompanying notes are an integral part of these financial statements.
26 | Wells Fargo Strategic Income Fund
Statement of operations—year ended September 30, 2019
| | | | |
| | | | |
| |
Investment income | | | | |
Interest (net of foreign interest withholding taxes of $23,415) | | $ | 6,220,310 | |
Dividends | | | 374,366 | |
Income from affiliated securities | | | 246,762 | |
| | | | |
Total investment income | | | 6,841,438 | |
| | | | |
| |
Expenses | | | | |
Management fee | | | 785,926 | |
Administration fees | |
Class A | | | 2,044 | |
Class C | | | 798 | |
Administrator Class | | | 996 | |
Institutional Class | | | 117,542 | |
Shareholder servicing fees | |
Class A | | | 3,193 | |
Class C | | | 1,247 | |
Administrator Class | | | 2,491 | |
Distribution fee | |
Class C | | | 3,735 | |
Custody and accounting fees | | | 39,160 | |
Professional fees | | | 55,710 | |
Registration fees | | | 58,604 | |
Shareholder report expenses | | | 29,260 | |
Trustees’ fees and expenses | | | 21,652 | |
Other fees and expenses | | | 6,518 | |
| | | | |
Total expenses | | | 1,128,876 | |
Less: Fee waivers and/or expense reimbursements | | | | |
Fund-level | | | (217,848 | ) |
Class A | | | (544 | ) |
Class C | | | (205 | ) |
Administrator Class | | | (1,860 | ) |
| | | | |
Net expenses | | | 908,419 | |
| | | | |
Net investment income | | | 5,933,019 | |
| | | | |
| |
Realized and unrealized gains (losses) on investments | | | | |
Net realized gains (losses) on | |
Unaffiliated securities | | | 1,358,959 | |
Futures contracts | | | (3,638,829 | ) |
Forward foreign currency contracts | | | 835,315 | |
Credit default swap contracts | | | 334,927 | |
| | | | |
Net realized losses on investments | | | (1,109,628 | ) |
| | | | |
| |
Net change in unrealized gains (losses) on | | | | |
Unaffiliated securities | | | 2,799,250 | |
Futures contracts | | | 366,632 | |
Forward foreign currency contracts | | | 354,713 | |
Credit default swap contracts | | | 71,491 | |
| | | | |
Net change in unrealized gains (losses) on investments | | | 3,592,086 | |
| | | | |
Net realized and unrealized gains (losses) on investments | | | 2,482,458 | |
| | | | |
Net increase in net assets resulting from operations | | $ | 8,415,477 | |
| | | | |
The accompanying notes are an integral part of these financial statements.
Wells Fargo Strategic Income Fund | 27
Statement of changes in net assets
| | | | | | | | | | | | | | | | |
| | | Year ended
September 30, 2019 | | | Year ended
September 30, 2018 | |
| | | | |
Operations | | | | | | | | | | | | | | | | |
Net investment income | | | | | | $ | 5,933,019 | | | | | | | $ | 1,753,605 | |
Net realized gains (losses) on investments | | | | | | | (1,109,628 | ) | | | | | | | 867,473 | |
Net change in unrealized gains (losses) on investments | | | | | | | 3,592,086 | | | | | | | | (1,713,628 | ) |
| | | | |
Net increase in net assets resulting from operations | | | | | | | 8,415,477 | | | | | | | | 907,450 | |
| | | | |
| | | | |
Distributions to shareholders from net investment income and net realized gains | | | | | | | | | | | | | | | | |
Class A | | | | | | | (49,220 | ) | | | | | | | (40,704 | ) |
Class C | | | | | | | (15,657 | ) | | | | | | | (12,934 | ) |
Administrator Class | | | | | | | (32,865 | ) | | | | | | | (108,162 | ) |
Institutional Class | | | | | | | (5,853,845 | ) | | | | | | | (1,581,265 | ) |
| | | | |
Total distributions to shareholders | | | | | | | (5,951,587 | ) | | | | | | | (1,743,065 | ) |
| | | | |
| | | | |
Capital share transactions | | | Shares | | | | | | | | Shares | | | | | |
Proceeds from shares sold | | | | | | | | | | | | | | | | |
Class A | | | 348,536 | | | | 3,298,070 | | | | 215,486 | | | | 2,047,731 | |
Class C | | | 31,806 | | | | 297,418 | | | | 37,056 | | | | 354,156 | |
Administrator Class | | | 7,156 | | | | 67,124 | | | | 533,993 | | | | 5,101,091 | |
Institutional Class | | | 18,145,872 | | | | 169,524,726 | | | | 2,003,885 | | | | 19,068,416 | |
| | | | |
| | | | | | | 173,187,338 | | | | | | | | 26,571,394 | |
| | | | |
Reinvestment of distributions | | | | | | | | | | | | | | | | |
Class A | | | 5,230 | | | | 49,054 | | | | 4,259 | | | | 40,371 | |
Class C | | | 1,676 | | | | 15,657 | | | | 1,362 | | | | 12,886 | |
Administrator Class | | | 3,474 | | | | 32,494 | | | | 11,373 | | | | 107,817 | |
Institutional Class | | | 596,321 | | | | 5,581,802 | | | | 166,687 | | | | 1,581,265 | |
| | | | |
| | | | | | | 5,679,007 | | | | | | | | 1,742,339 | |
| | | | |
Payment for shares redeemed | | | | | | | | | | | | | | | | |
Class A | | | (341,311 | ) | | | (3,228,609 | ) | | | (179,015 | ) | | | (1,698,518 | ) |
Class C | | | (33,529 | ) | | | (314,988 | ) | | | (25,570 | ) | | | (242,124 | ) |
Administrator Class | | | (581,301 | ) | | | (5,483,073 | ) | | | (25,370 | ) | | | (241,452 | ) |
Institutional Class | | | (7,379,074 | ) | | | (69,328,595 | ) | | | (2,163,121 | ) | | | (20,590,368 | ) |
| | | | |
| | | | | | | (78,355,265 | ) | | | | | | | (22,772,462 | ) |
| | | | |
Net increase in net assets resulting from capital share transactions | | | | | | | 100,511,080 | | | | | | | | 5,541,271 | |
| | | | |
Total increase in net assets | | | | | | | 102,974,970 | | | | | | | | 4,705,656 | |
| | | | |
| | | | |
Net assets | | | | | | | | | | | | | | | | |
Beginning of period | | | | | | | 52,428,340 | | | | | | | | 47,722,684 | |
| | | | |
End of period | | | | | | $ | 155,403,310 | | | | | | | $ | 52,428,340 | |
| | | | |
The accompanying notes are an integral part of these financial statements.
28 | Wells Fargo Strategic Income Fund
Financial highlights
(For a share outstanding throughout each period)
| | | | | | | | | | | | | | | | | | | | | | | | |
| | | Year ended September 30 | | | Year ended October 31 | |
| CLASS A | | 2019 | | | 2018 | | | 2017 | | | 20161 | | | 2015 | | | 2014 | |
Net asset value, beginning of period | | | $9.43 | | | | $9.59 | | | | $9.25 | | | | $9.13 | | | | $9.72 | | | | $9.66 | |
Net investment income | | | 0.34 | 2 | | | 0.31 | 2 | | | 0.33 | 2 | | | 0.31 | | | | 0.34 | | | | 0.37 | |
Net realized and unrealized gains (losses) on investments | | | 0.09 | | | | (0.16 | ) | | | 0.22 | | | | (0.01 | ) | | | (0.69 | ) | | | (0.05 | ) |
| | | | | | | | | | | | | | | | | | | | | | | | |
Total from investment operations | | | 0.43 | | | | 0.15 | | | | 0.55 | | | | 0.30 | | | | (0.35 | ) | | | 0.32 | |
Distributions to shareholders from | | | | | | | | | | | | | | | | | | | | | | | | |
Net investment income | | | (0.36 | ) | | | (0.31 | ) | | | (0.21 | ) | | | (0.13 | ) | | | (0.22 | ) | | | (0.26 | ) |
Tax basis return of capital | | | 0.00 | | | | 0.00 | | | | 0.00 | | | | (0.05 | ) | | | (0.02 | ) | | | 0.00 | |
| | | | | | | | | | | | | | | | | | | | | | | | |
Total distributions to shareholders | | | (0.36 | ) | | | (0.31 | ) | | | (0.21 | ) | | | (0.18 | ) | | | (0.24 | ) | | | (0.26 | ) |
Net asset value, end of period | | | $9.50 | | | | $9.43 | | | | $9.59 | | | | $9.25 | | | | $9.13 | | | | $9.72 | |
Total return3 | | | 4.66 | % | | | 1.59 | % | | | 6.05 | % | | | 3.34 | % | | | (3.64 | )% | | | 3.36 | % |
Ratios to average net assets (annualized) | | | | | | | | | | | | | | | | | | | | | | | | |
Gross expenses | | | 1.09 | % | | | 1.45 | % | | | 1.78 | % | | | 1.80 | % | | | 1.63 | % | | | 1.51 | % |
Net expenses | | | 0.90 | % | | | 0.90 | % | | | 0.90 | % | | | 0.90 | % | | | 0.90 | % | | | 0.90 | % |
Net investment income | | | 3.65 | % | | | 3.26 | % | | | 3.47 | % | | | 3.85 | % | | | 3.77 | % | | | 4.02 | % |
Supplemental data | | | | | | | | | | | | | | | | | | | | | | | | |
Portfolio turnover rate | | | 116 | % | | | 50 | % | | | 65 | % | | | 52 | % | | | 53 | % | | | 51 | % |
Net assets, end of period (000s omitted) | | | $1,394 | | | | $1,266 | | | | $896 | | | | $1,047 | | | | $928 | | | | $714 | |
| 1 | For the eleven months ended September 30, 2016. The Fund changed its fiscal year end from October 31 to September 30, effective September 30, 2016. |
| 2 | Calculated based upon average shares outstanding |
| 3 | Total return calculations do not include any sales charges. Returns for periods of less than one year are not annualized. |
The accompanying notes are an integral part of these financial statements.
Wells Fargo Strategic Income Fund | 29
Financial highlights
(For a share outstanding throughout each period)
| | | | | | | | | | | | | | | | | | | | | | | | |
| | | Year ended September 30 | | | Year ended October 31 | |
| CLASS C | | 2019 | | | 2018 | | | 2017 | | | 20161 | | | 2015 | | | 2014 | |
Net asset value, beginning of period | | | $9.41 | | | | $9.57 | | | | $9.22 | | | | $9.10 | | | | $9.71 | | | | $9.65 | |
Net investment income | | | 0.27 | | | | 0.23 | | | | 0.29 | | | | 0.25 | | | | 0.28 | | | | 0.31 | |
Net realized and unrealized gains (losses) on investments | | | 0.10 | | | | (0.15 | ) | | | 0.18 | | | | (0.02 | ) | | | (0.68 | ) | | | (0.06 | ) |
| | | | | | | | | | | | | | | | | | | | | | | | |
Total from investment operations | | | 0.37 | | | | 0.08 | | | | 0.47 | | | | 0.23 | | | | (0.40 | ) | | | 0.25 | |
Distributions to shareholders from | | | | | | | | | | | | | | | | | | | | | | | | |
Net investment income | | | (0.29 | ) | | | (0.24 | ) | | | (0.12 | ) | | | (0.08 | ) | | | (0.19 | ) | | | (0.19 | ) |
Tax basis return of capital | | | 0.00 | | | | 0.00 | | | | 0.00 | | | | (0.03 | ) | | | (0.02 | ) | | | 0.00 | |
| | | | | | | | | | | | | | | | | | | | | | | | |
Total distributions to shareholders | | | (0.29 | ) | | | (0.24 | ) | | | (0.12 | ) | | | (0.11 | ) | | | (0.21 | ) | | | (0.19 | ) |
Net asset value, end of period | | | $9.49 | | | | $9.41 | | | | $9.57 | | | | $9.22 | | | | $9.10 | | | | $9.71 | |
Total return2 | | | 4.00 | % | | | 0.88 | % | | | 5.20 | % | | | 2.67 | % | | | (4.35 | )% | | | 2.61 | % |
Ratios to average net assets (annualized) | | | | | | | | | | | | | | | | | | | | | | | | |
Gross expenses | | | 1.84 | % | | | 2.20 | % | | | 2.59 | % | | | 2.54 | % | | | 2.37 | % | | | 2.25 | % |
Net expenses | | | 1.65 | % | | | 1.65 | % | | | 1.65 | % | | | 1.65 | % | | | 1.65 | % | | | 1.65 | % |
Net investment income | | | 2.92 | % | | | 2.52 | % | | | 2.80 | % | | | 3.10 | % | | | 3.02 | % | | | 3.25 | % |
Supplemental data | | | | | | | | | | | | | | | | | | | | | | | | |
Portfolio turnover rate | | | 116 | % | | | 50 | % | | | 65 | % | | | 52 | % | | | 53 | % | | | 51 | % |
Net assets, end of period (000s omitted) | | | $520 | | | | $517 | | | | $403 | | | | $766 | | | | $711 | | | | $835 | |
| 1 | For the eleven months ended September 30, 2016. The Fund changed its fiscal year end from October 31 to September 30, effective September 30, 2016. |
| 2 | Total return calculations do not include any sales charges. Returns for periods of less than one year are not annualized. |
The accompanying notes are an integral part of these financial statements.
30 | Wells Fargo Strategic Income Fund
Financial highlights
(For a share outstanding throughout each period)
| | | | | | | | | | | | | | | | | | | | | | | | |
| | | Year ended September 30 | | | Year ended October 31 | |
| ADMINISTRATOR CLASS | | 2019 | | | 2018 | | | 2017 | | | 20161 | | | 2015 | | | 2014 | |
Net asset value, beginning of period | | | $9.46 | | | | $9.61 | | | | $9.29 | | | | $9.16 | | | | $9.74 | | | | $9.66 | |
Net investment income | | | 0.36 | 2 | | | 0.33 | 2 | | | 0.34 | 2 | | | 0.33 | 2 | | | 0.37 | | | | 0.39 | |
Net realized and unrealized gains (losses) on investments | | | 0.09 | | | | (0.16 | ) | | | 0.20 | | | | (0.01 | ) | | | (0.70 | ) | | | (0.05 | ) |
| | | | | | | | | | | | | | | | | | | | | | | | |
Total from investment operations | | | 0.45 | | | | 0.17 | | | | 0.54 | | | | 0.32 | | | | (0.33 | ) | | | 0.34 | |
Distributions to shareholders from | | | | | | | | | | | | | | | | | | | | | | | | |
Net investment income | | | (0.35 | ) | | | (0.32 | ) | | | (0.22 | ) | | | (0.14 | ) | | | (0.22 | ) | | | (0.26 | ) |
Tax basis return of capital | | | 0.00 | | | | 0.00 | | | | 0.00 | | | | (0.05 | ) | | | (0.03 | ) | | | 0.00 | |
| | | | | | | | | | | | | | | | | | | | | | | | |
Total distributions to shareholders | | | (0.35 | ) | | | (0.32 | ) | | | (0.22 | ) | | | (0.19 | ) | | | (0.25 | ) | | | (0.26 | ) |
Net asset value, end of period | | | $9.56 | | | | $9.46 | | | | $9.61 | | | | $9.29 | | | | $9.16 | | | | $9.74 | |
Total return3 | | | 4.83 | % | | | 1.81 | % | | | 5.91 | % | | | 3.52 | % | | | (3.51 | )% | | | 3.63 | % |
Ratios to average net assets (annualized) | | | | | | | | | | | | | | | | | | | | | | | | |
Gross expenses | | | 1.08 | % | | | 1.38 | % | | | 1.72 | % | | | 1.74 | % | | | 1.56 | % | | | 1.46 | % |
Net expenses | | | 0.75 | % | | | 0.75 | % | | | 0.75 | % | | | 0.75 | % | | | 0.75 | % | | | 0.75 | % |
Net investment income | | | 3.80 | % | | | 3.48 | % | | | 3.64 | % | | | 4.00 | % | | | 3.92 | % | | | 4.18 | % |
Supplemental data | | | | | | | | | | | | | | | | | | | | | | | | |
Portfolio turnover rate | | | 116 | % | | | 50 | % | | | 65 | % | | | 52 | % | | | 53 | % | | | 51 | % |
Net assets, end of period (000s omitted) | | | $75 | | | | $5,471 | | | | $562 | | | | $597 | | | | $496 | | | | $554 | |
| 1 | For the eleven months ended September 30, 2016. The Fund changed its fiscal year end from October 31 to September 30, effective September 30, 2016. |
| 2 | Calculated based upon average shares outstanding |
| 3 | Returns for periods of less than one year are not annualized. |
The accompanying notes are an integral part of these financial statements.
Wells Fargo Strategic Income Fund | 31
Financial highlights
(For a share outstanding throughout each period)
| | | | | | | | | | | | | | | | | | | | | | | | |
| | | Year ended September 30 | | | Year ended October 31 | |
| INSTITUTIONAL CLASS | | 2019 | | | 2018 | | | 2017 | | | 20161 | | | 2015 | | | 2014 | |
Net asset value, beginning of period | | | $9.42 | | | | $9.58 | | | | $9.24 | | | | $9.14 | | | | $9.71 | | | | $9.66 | |
Net investment income | | | 0.37 | 2 | | | 0.34 | | | | 0.35 | 2 | | | 0.34 | | | | 0.40 | | | | 0.41 | 2 |
Net realized and unrealized gains (losses) on investments | | | 0.09 | | | | (0.16 | ) | | | 0.24 | | | | (0.02 | ) | | | (0.71 | ) | | | (0.07 | ) |
| | | | | | | | | | | | | | | | | | | | | | | | |
Total from investment operations | | | 0.46 | | | | 0.18 | | | | 0.59 | | | | 0.32 | | | | (0.31 | ) | | | 0.34 | |
Distributions to shareholders from | | | | | | | | | | | | | | | | | | | | | | | | |
Net investment income | | | (0.39 | ) | | | (0.34 | ) | | | (0.25 | ) | | | (0.16 | ) | | | (0.23 | ) | | | (0.29 | ) |
Tax basis return of capital | | | 0.00 | | | | 0.00 | | | | 0.00 | | | | (0.06 | ) | | | (0.03 | ) | | | 0.00 | |
| | | | | | | | | | | | | | | | | | | | | | | | |
Total distributions to shareholders | | | (0.39 | ) | | | (0.34 | ) | | | (0.25 | ) | | | (0.22 | ) | | | (0.26 | ) | | | (0.29 | ) |
Net asset value, end of period | | | $9.49 | | | | $9.42 | | | | $9.58 | | | | $9.24 | | | | $9.14 | | | | $9.71 | |
Total return3 | | | 5.00 | % | | | 1.93 | % | | | 6.43 | % | | | 3.55 | % | | | (3.28 | )% | | | 3.60 | % |
Ratios to average net assets (annualized) | | | | | | | | | | | | | | | | | | | | | | | | |
Gross expenses | | | 0.75 | % | | | 1.12 | % | | | 1.40 | % | | | 1.46 | % | | | 1.19 | % | | | 1.14 | % |
Net expenses | | | 0.60 | % | | | 0.60 | % | | | 0.60 | % | | | 0.60 | % | | | 0.60 | % | | | 0.60 | % |
Net investment income | | | 3.97 | % | | | 3.54 | % | | | 3.71 | % | | | 4.16 | % | | | 4.04 | % | | | 4.25 | % |
Supplemental data | | | | | | | | | | | | | | | | | | | | | | | | |
Portfolio turnover rate | | | 116 | % | | | 50 | % | | | 65 | % | | | 52 | % | | | 53 | % | | | 51 | % |
Net assets, end of period (000s omitted) | | | $153,414 | | | | $45,175 | | | | $45,862 | | | | $23,190 | | | | $17,564 | | | | $38,664 | |
| 1 | For the eleven months ended September 30, 2016. The Fund changed its fiscal year end from October 31 to September 30, effective September 30, 2016. |
| 2 | Calculated based upon average shares outstanding |
| 3 | Returns for periods of less than one year are not annualized. |
The accompanying notes are an integral part of these financial statements.
32 | Wells Fargo Strategic Income Fund
Notes to financial statements
1. ORGANIZATION
Wells Fargo Funds Trust (the “Trust”), a Delaware statutory trust organized on March 10, 1999, is anopen-end management investment company registered under the Investment Company Act of 1940, as amended (the “1940 Act”). As an investment company, the Trust follows the accounting and reporting guidance in Financial Accounting Standards Board (“FASB”)Accounting Standards Codification Topic 946, Financial Services – Investment Companies. These financial statements report on the Wells Fargo Strategic Income Fund (the “Fund”) which is a diversified series of the Trust.
2. SIGNIFICANT ACCOUNTING POLICIES
The following significant accounting policies, which are consistently followed in the preparation of the financial statements of the Fund, are in conformity with U.S. generally accepted accounting principles which require management to make estimates and assumptions that affect the reported amounts of assets and liabilities, disclosure of contingent assets and liabilities at the date of the financial statements, and the reported amounts of revenues and expenses during the reporting period. Actual results could differ from those estimates.
Securities valuation
All investments are valued each business day as of the close of regular trading on the New York Stock Exchange (generally 4 p.m. Eastern Time), although the Fund may deviate from this calculation time under unusual or unexpected circumstances.
Debt securities are valued at the evaluated bid price provided by an independent pricing service (e.g. taking into account various factors, including yields, maturities, or credit ratings) or, if a reliable price is not available, the quoted bid price from an independent broker-dealer.
Equity securities and futures contracts that are listed on a foreign or domestic exchange or market are valued at the official closing price or, if none, the last sales price. If no sale occurs on the principal exchange or market that day, a fair value price will be determined in accordance with the Fund’s Valuation Procedures.
Swap contracts are valued at the evaluated price provided by an independent pricing service or, if a reliable price is not available, the quoted bid price from an independent broker-dealer.
Forward foreign currency contracts are recorded at the forward rate provided by an independent foreign currency pricing source at a time each business day specified by the Wells Fargo Asset Management Pricing Committee at Wells Fargo Funds Management, LLC (“Funds Management”).
The values of securities denominated in foreign currencies are translated into U.S. dollars at rates provided by an independent foreign currency pricing source at a time each business day specified by the Wells Fargo Asset Management Pricing Committee.
Investments in registeredopen-end investment companies are valued at net asset value. Interests innon-registered investment companies that are redeemable at net asset value are fair valued normally at net asset value.
Investments which are not valued using the methods discussed above are valued at their fair value, as determined in good faith by the Board of Trustees of the Fund. The Board of Trustees has established a Valuation Committee comprised of the Trustees and has delegated to it the authority to take any actions regarding the valuation of portfolio securities that the Valuation Committee deems necessary or appropriate, including determining the fair value of portfolio securities, unless the determination has been delegated to the Wells Fargo Asset Management Pricing Committee. The Board of Trustees retains the authority to make or ratify any valuation decisions or approve any changes to the Valuation Procedures as it deems appropriate. On a quarterly basis, the Board of Trustees receives reports on any valuation actions taken by the Valuation Committee or the Wells Fargo Asset Management Pricing Committee which may include items for ratification.
Foreign currency translation
The accounting records of the Fund are maintained in U.S. dollars. The values of other assets and liabilities denominated in foreign currencies are translated into U.S. dollars at rates provided by an independent foreign currency pricing source at a time each business day specified by the Wells Fargo Asset Management Pricing Committee. Purchases and sales of securities, and income and expenses are converted at the rate of exchange on the respective dates of such transactions. Net realized foreign exchange gains or losses arise from sales of foreign currencies, currency gains or losses realized between the trade and settlement dates on securities transactions, and the difference between the amounts of dividends, interest and foreign withholding taxes recorded and the U.S. dollar equivalent of the amounts actually paid or received. Net unrealized foreign exchange gains and losses arise from changes in the fair value of assets and liabilities other than investments in securities resulting from changes in exchange rates. The changes in net assets arising from changes in exchange rates of securities and the changes in net assets resulting from changes in market prices of securities are not separately presented. Such changes are included in net realized and unrealized gains or losses from investments.
Wells Fargo Strategic Income Fund | 33
Notes to financial statements
Forward foreign currency contracts
A forward foreign currency contract is an agreement between two parties to purchase or sell a specific currency for an agreed-upon price at a future date. The Fund enters into forward foreign currency contracts to facilitate transactions in foreign-denominated securities and to attempt to minimize the risk to the Fund from adverse changes in the relationship between currencies. Forward foreign currency contracts are recorded at the forward rate andmarked-to-market daily. When the contracts are closed, realized gains and losses arising from such transactions are recorded as realized gains or losses on forward foreign currency contracts. The Fund is subject to foreign currency risk and may be exposed to risks if the counterparties to the contracts are unable to meet the terms of their contracts or if the value of the foreign currency changes unfavorably. The Fund’s maximum risk of loss from counterparty credit risk is the unrealized gains on the contracts. This risk may be mitigated if there is a master netting arrangement between the Fund and the counterparty.
Securities lending
The Fund may lend its securities from time to time in order to earn additional income in the form of fees or interest on securities received as collateral or the investment of any cash received as collateral. When securities are on loan, the Fund receives interest or dividends on those securities. Cash collateral received in connection with its securities lending transactions is invested in Securities Lending Cash Investments, LLC (the “Securities Lending Fund”). Investments in Securities Lending Fund are valued at the evaluated bid price provided by an independent pricing service. Income earned from investment in the Securities Lending Fund (net of fees and rebates), if any, is included in income from affiliated securities on the Statement of Operations.
In a securities lending transaction, the net asset value of the Fund is affected by an increase or decrease in the value of the securities loaned and by an increase or decrease in the value of the instrument in which collateral is invested. The amount of securities lending activity undertaken by the Fund fluctuates from time to time. The Fund has the right under the lending agreement to recover the securities from the borrower on demand. In the event of default or bankruptcy by the borrower, the Fund may be prevented from recovering the loaned securities or gaining access to the collateral or may experience delays or costs in doing so. In such an event, the terms of the agreement allows the unaffiliated securities lending agent to use the collateral to purchase replacement securities on behalf of the Fund or pay the Fund the market value of the loaned securities. The Fund bears the risk of loss with respect to depreciation of its investment of the cash collateral.
When-issued transactions
The Fund may purchase securities on a forward commitment or when-issued basis. The Fund records a when-issued transaction on the trade date and will segregate assets in an amount at least equal in value to the Fund’s commitment to purchase when-issued securities. Securities purchased on a when-issued basis aremarked-to-market daily and the Fund begins earning interest on the settlement date. Losses may arise due to changes in the market value of the underlying securities or if the counterparty does not perform under the contract.
Loans
The Fund may invest in direct debt instruments which are interests in amounts owed to lenders by corporate or other borrowers. The loans pay interest at rates which are periodically reset by reference to a base lending rate plus a spread. Investments in loans may be in the form of participations in loans or assignments of all or a portion of loans from third parties. When the Fund purchases participations, it generally has no rights to enforce compliance with the terms of the loan agreement with the borrower. As a result, the Fund assumes the credit risk of both the borrower and the lender that is selling the participation. When the Fund purchases assignments from lenders, it acquires direct rights against the borrower on the loan and may enforce compliance by the borrower with the terms of the loan agreement. Loans may include fully funded term loans or unfunded loan commitments, which are contractual obligations for future funding.
Futures contracts
Futures contracts are agreements between the Fund and a counterparty to buy or sell a specific amount of a commodity, financial instrument or currency at a specified price and on a specified date. The Fund may buy and sell futures contracts in order to gain exposure to, or protect against, changes in interest rates and foreign exchange rates and is subject to interest rate risk and/or foreign currency risk. The primary risks associated with the use of futures contracts are the imperfect correlation between changes in market values of securities held by the Fund and the prices of futures contracts, and the possibility of an illiquid market. Futures contracts are generally entered into on a regulated futures exchange and cleared through a clearinghouse associated with the exchange. With futures contracts, there is minimal counterparty risk to the Fund since futures contracts are exchange traded and the exchange’s clearinghouse, as the counterparty to all exchange traded futures, guarantees the futures contracts against default.
34 | Wells Fargo Strategic Income Fund
Notes to financial statements
Upon entering into a futures contracts, the Fund is required to deposit either cash or securities (initial margin) with the broker in an amount equal to a certain percentage of the contract value. Subsequent payments (variation margin) are paid to or from the broker each day equal to the daily changes in the contract value. Such payments are recorded as unrealized gains or losses and, if any, shown as variation margin receivable (payable) in the Statement of Assets and Liabilities. Should the Fund fail to make requested variation margin payments, the broker can gain access to the initial margin to satisfy the Fund’s payment obligations. When the contracts are closed, a realized gain or loss is recorded in the Statement of Operations.
Swap contracts
Swap contracts are agreements between the Fund and a counterparty to exchange a series of cash flows over a specified period. Swap agreements are privately negotiated contracts between the Fund that are entered into as bilateral contracts in the OTC market (“OTC swaps”) or centrally cleared (“centrally cleared swaps”) with a central clearinghouse.
The Fund entered into centrally cleared swaps. In a centrally cleared swap, immediately following execution of the swap contract, the swap contract is novated to a central counterparty (the “CCP”) and the Fund’s counterparty on the swap agreement becomes the CCP. Upon entering into a centrally cleared swap, the Fund is required to deposit an initial margin with the broker in the form of cash or securities. Securities deposited as initial margin are designated in the Portfolio of Investments and cash deposited is shown as cash segregated for centrally cleared swaps in the Statement of Assets and Liabilities. Pursuant to the contract, the Fund agrees to receive from or pay to the broker an amount of cash equal to the daily fluctuation in market value of the contract (“variation margin”). The variation margin is recorded as an unrealized gain (or loss) and shown as variation margin receivable (or payable) on centrally cleared swaps in the Statement of Assets and Liabilities. Payments received from (paid to) the counterparty, including at termination, are recorded as realized gains (losses) in the Statement of Operations.
Credit default swaps
The Fund may enter into credit default swaps for hedging or speculative purposes to provide or receive a measure of protection against default on a referenced entity, obligation or index or a basket of single-name issuers or traded indexes. An index credit default swap references all the names in the index, and if a credit event is triggered, the credit event is settled based on that name’s weight in the index. Credit default swaps are agreements in which the protection buyer pays fixed periodic payments to the protection seller in consideration for a promise from the protection seller to make a specific payment should a negative credit event take place with respect to the referenced entity (e.g., bankruptcy, failure to pay, obligation acceleration, repudiation, moratorium or restructuring).
The Fund may enter into credit default swaps as either the seller of protection or the buyer of protection. If the Fund is the buyer of protection and a credit event occurs, the Fund will either receive from the seller an amount equal to the notional amount of the swap and deliver the referenced security or underlying securities comprising the index, or receive a net settlement of cash equal to the notional amount of the swap less the recovery value of the security or underlying securities comprising the index. If the Fund is the seller of protection and a credit event occurs, the Fund will either pay the buyer an amount equal to the notional amount of the swap and take delivery of the referenced security or underlying securities comprising the index or pay a net settlement of cash equal to the notional amount of the swap less the recovery value of the security or underlying securities comprising the index.
As the seller of protection, the Fund is subject to investment exposure on the notional amount of the swap and has assumed the risk of default of the underlying security or index. As the buyer of protection, the Fund could be exposed to risks if the seller of the protection defaults on its obligation to perform, or if there are unfavorable changes in the fluctuation of interest rates.
By entering into credit default swap contracts, the Fund is exposed to credit risk. In addition, certain credit default swap contracts entered into by the Fund provide for conditions that result in events of default or termination that enable the counterparty to the agreement to cause an early termination of the transactions under those agreements.
Security transactions and income recognition
Securities transactions are recorded on a trade date basis. Realized gains or losses are recorded on the basis of identified cost.
Interest income is accrued daily and bond discounts are accreted and premiums are amortized daily. To the extent debt obligations are placed onnon-accrual status, any related interest income may be reduced by writing off interest receivables when the collection of all or a portion of interest has been determined to be doubtful based on consistently applied procedures and the fair value has decreased. If the issuer subsequently resumes interest payments or when the collectability of interest is reasonably assured, the debt obligation is removed fromnon-accrual status.
Income from foreign securities is recorded net of foreign taxes withheld where recovery of such taxes is not assured.
Wells Fargo Strategic Income Fund | 35
Notes to financial statements
Income dividends and capital gain distributions from investment companies are recorded on theex-dividend date. Capital gain distributions from investment companies are treated as realized gains.
Distributions to shareholders
Distributions to shareholders are recorded on theex-dividend date and paid from net investment income monthly and any net realized gains are paid at least annually. Such distributions are determined in accordance with income tax regulations and may differ from U.S. generally accepted accounting principles. Dividend sources are estimated at the time of declaration. The tax character of distributions is determined as of the Fund’s fiscal year end. Therefore, a portion of the Fund’s distributions made prior to the Fund’s fiscal year end may be categorized as a tax return of capital at year end.
Federal and other taxes
The Fund intends to continue to qualify as a regulated investment company by distributing substantially all of its investment company taxable income and any net realized capital gains (after reduction for capital loss carryforwards) sufficient to relieve it from all, or substantially all, federal income taxes. Accordingly, no provision for federal income taxes was required.
The Fund’s income and federal excise tax returns and all financial records supporting those returns for the prior three fiscal years are subject to examination by the federal and Delaware revenue authorities. Management has analyzed the Fund’s tax positions taken on federal, state, and foreign tax returns for all open tax years and does not believe that there are any uncertain tax positions that require recognition of a tax liability.
As of September 30, 2019, the aggregate cost of all investments for federal income tax purposes was $152,697,840 and the unrealized gains (losses) consisted of:
| | | | |
| |
Gross unrealized gains | | $ | 5,759,019 | |
| |
Gross unrealized losses | | | (2,507,172 | ) |
| |
Net unrealized gains | | $ | 3,251,847 | |
As of September 30, 2019, the Fund had capital loss carryforwards which consist of $178,628 in short-term capital losses and $2,228,956 in long-term capital losses.
Class allocations
The separate classes of shares offered by the Fund differ principally in applicable sales charges, distribution, shareholder servicing, and administration fees. Class specific expenses are charged directly to that share class. Investment income, common fund-level expenses, and realized and unrealized gains (losses) on investments are allocated daily to each class of shares based on the relative proportion of net assets of each class.
3. FAIR VALUATION MEASUREMENTS
Fair value measurements of investments are determined within a framework that has established a fair value hierarchy based upon the various data inputs utilized in determining the value of the Fund’s investments. The three-level hierarchy gives the highest priority to unadjusted quoted prices in active markets for identical assets or liabilities (Level 1) and the lowest priority to unobservable inputs (Level 3). The Fund’s investments are classified within the fair value hierarchy based on the lowest level of input that is significant to the fair value measurement. The inputs are summarized into three broad levels as follows:
| ∎ | | Level 1 – quoted prices in active markets for identical securities |
| ∎ | | Level 2 – other significant observable inputs (including quoted prices for similar securities, interest rates, prepayment speeds, credit risk, etc.) |
| ∎ | | Level 3 – significant unobservable inputs (including the Fund’s own assumptions in determining the fair value of investments) |
The inputs or methodologies used for valuing investments in securities are not necessarily an indication of the risk associated with investing in those securities.
36 | Wells Fargo Strategic Income Fund
Notes to financial statements
The following is a summary of the inputs used in valuing the Fund’s assets and liabilities as of September 30, 2019:
| | | | | | | | | | | | | | | | |
| | | | |
| | | Quoted prices
(Level 1) | | | Other significant
observable inputs
(Level 2) | | | Significant
unobservable inputs (Level 3) | | | Total | |
| | | | |
Assets | | | | | | | | | | | | | | | | |
Investments in: | | | | | | | | | | | | | | | | |
| | | | |
Asset-backed securities | | $ | 0 | | | $ | 12,544,110 | | | $ | 0 | | | $ | 12,544,110 | |
| | | | |
Corporate bonds and notes | | | 0 | | | | 30,041,580 | | | | 0 | | | | 30,041,580 | |
| | | | |
Exchange-traded funds | | | 7,364,511 | | | | 0 | | | | 0 | | | | 7,364,511 | |
| | | | |
Foreign corporate bonds and notes | | | 0 | | | | 12,394,114 | | | | 0 | | | | 12,394,114 | |
| | | | |
Foreign government bonds | | | 0 | | | | 19,697,688 | | | | 0 | | | | 19,697,688 | |
| | | | |
Loans | | | 0 | | | | 3,497,580 | | | | 475,824 | | | | 3,973,404 | |
| | | | |
Municipal obligations | | | 0 | | | | 1,318,010 | | | | 0 | | | | 1,318,010 | |
| | | | |
Non-agency mortgage-backed securities | | | 0 | | | | 48,087,451 | | | | 729,632 | | | | 48,817,083 | |
| | | | |
Rights | | | | | | | | | | | | | | | | |
| | | | |
Utilities | | | 0 | | | | 5,539 | | | | 0 | | | | 5,539 | |
| | | | |
U.S. Treasury securities | | | 1,030,625 | | | | 0 | | | | 0 | | | | 1,030,625 | |
| | | | |
Yankee corporate bonds and notes | | | 0 | | | | 8,904,277 | | | | 0 | | | | 8,904,277 | |
| | | | |
Yankee government bonds and notes | | | 0 | | | | 1,971,691 | | | | 0 | | | | 1,971,691 | |
| | | | |
Short-term investments | | | | | | | | | | | | | | | | |
| | | | |
Investment companies | | | 6,992,731 | | | | 0 | | | | 0 | | | | 6,992,731 | |
| | | | |
| | | 15,387,867 | | | | 138,462,040 | | | | 1,205,456 | | | | 155,055,363 | |
| | | | |
Futures contracts | | | 578,240 | | | | 0 | | | | 0 | | | | 578,240 | |
| | | | |
Forward foreign currency contracts | | | 0 | | | | 510,504 | | | | 0 | | | | 510,504 | |
| | | | |
Credit default swap contracts | | | 0 | | | | 72,155 | | | | 0 | | | | 72,155 | |
| | | | |
Total assets | | $ | 15,966,107 | | | $ | 139,044,699 | | | $ | 1,205,456 | | | $ | 156,216,262 | |
| | | | |
Liabilities | | | | | | | | | | | | | | | | |
| | | | |
Futures contracts | | $ | 33,854 | | | $ | 0 | | | $ | 0 | | | $ | 33,854 | |
| | | | |
Forward foreign currency contracts | | | 0 | | | | 232,721 | | | | 0 | | | | 232,721 | |
| | | | |
Total liabilities | | $ | 33,854 | | | $ | 232,721 | | | $ | 0 | | | $ | 266,575 | |
Additional sector, industry or geographic detail is included in the Portfolio of Investments.
Futures contracts, forward foreign currency contracts and swap contracts are reported at their cumulative unrealized gains (losses) at measurement date as reported in the tables following the Portfolio of Investments. For futures contracts and centrally cleared swaps, the current day’s variation margin is reported on the Statement of Assets and Liabilities. All other assets and liabilities are reported at their market value at measurement date.
For the year ended September 30, 2019, the Fund did not have any transfers into/out of Level 3.
4. TRANSACTIONS WITH AFFILIATES
Management fee
Funds Management, an indirect wholly owned subsidiary of Wells Fargo & Company (“Wells Fargo”), is the manager of the Fund and provides advisory and fund-level administrative services under an investment management agreement. Under the investment management agreement, Funds Management is responsible for, among other services, implementing the investment objectives and strategies of the Fund, supervising the subadvisers and providing fund-level administrative services in connection
Wells Fargo Strategic Income Fund | 37
Notes to financial statements
with the Fund’s operations. As compensation for its services under the investment management agreement, Funds Management is entitled to receive a management fee at the following annual rate based on the Fund’s average daily net assets:
| | |
| |
| Average daily net assets | | Management fee |
| |
First $500 million | | 0.525% |
| |
Next $500 million | | 0.500 |
| |
Next $2 billion | | 0.475 |
| |
Next $2 billion | | 0.450 |
| |
Next $5 billion | | 0.415 |
| |
Over $10 billion | | 0.405 |
For the year ended September 30, 2019, the management fee was equivalent to an annual rate of 0.525% of the Fund’s average daily net assets.
Funds Management has retained the services of certain subadvisers to provide daily portfolio management to the Fund. The fee for subadvisory services is borne by Funds Management. Wells Capital Management Incorporated (“WellsCap”) is a subadviser to the Fund and is entitled to receive a fee from Funds Management at an annual rate starting at 0.30% and declining to 0.15% as the average daily net assets of the Fund increase. Wells Fargo Asset Management (International) Limited, an affiliate of Funds Management and an indirect wholly owned subsidiary of Wells Fargo, is also a subadviser to the Fund and is entitled to receive a fee from Funds Management at an annual rate starting at 0.35% and declining to 0.20% as the average daily net assets of the Fund increase. Prior to August 1, 2019, Wells Fargo Asset Management (International), LLC was the subadviser for the Fund. Effective August 1, 2019, Wells Fargo Asset Management (International), LLC merged with Wells Fargo Asset Management (International) Limited and Wells Fargo Asset Management (International) Limited became the subadviser to the Fund. This transaction did not result in any changes to the services provided to the Fund or to the strategies or fees and expenses.
Administration fees
Under a class-level administration agreement, Funds Management provides class-level administrative services to the Fund, which includes paying fees and expenses for services provided by the transfer agent,sub-transfer agents, omnibus account servicers and record-keepers. As compensation for its services under the class-level administration agreement, Funds Management receives an annual fee which is calculated based on the average daily net assets of each class as follows:
| | |
| |
| | | Class-level
administration fee |
| |
Class A, Class C | | 0.16% |
| |
Administrator Class | | 0.10 |
| |
Institutional Class | | 0.08 |
Waivers and/or expense reimbursements
Funds Management has contractually waived and/or reimbursed management and administration fees to the extent necessary to maintain certain net operating expense ratios for the Fund. When each class of the Fund has exceeded its expense cap, Funds Management has waived fees and/or reimbursed expenses from fund-level expenses on a proportionate basis and then from class specific expenses. When only certain classes exceed their expense caps, waivers and/or reimbursements are applied against class specific expenses before fund-level expenses. Funds Management has committed through January 31, 2020 to waive fees and/or reimburse expenses to the extent necessary to cap the Fund’s expenses at 0.90% for Class A shares, 1.65% for Class C shares, 0.75% for Administrator Class shares, and 0.60% for Institutional Class shares. Prior to or after the commitment expiration date, the cap may be increased or the commitment to maintain the cap may be terminated only with the approval of the Board of Trustees.
Distribution fee
The Trust has adopted a distribution plan for Class C shares of the Fund pursuant to Rule12b-1 under the 1940 Act. A distribution fee is charged to Class C shares and paid to Wells Fargo Funds Distributor, LLC (“Funds Distributor”), the principal underwriter, at an annual rate of 0.75% of the average daily net assets of Class C shares.
38 | Wells Fargo Strategic Income Fund
Notes to financial statements
In addition, Funds Distributor is entitled to receive thefront-end sales charge from the purchase of Class A shares and a contingent deferred sales charge on the redemption of certain Class A shares. Funds Distributor is also entitled to receive the contingent deferred sales charges from redemptions of Class C shares. For the year ended September 30, 2019, Funds Distributor received $308 from the sale of Class A. No contingent deferred sales charges were incurred by Class A and Class C shares for the year ended September 30, 2019.
Shareholder servicing fees
The Trust has entered into contracts with one or more shareholder servicing agents, whereby Class A, Class C, and Administrator Class of the Fund are charged a fee at an annual rate of 0.25% of the average daily net assets of each respective class.
Interfund transactions
The Fund may purchase or sell portfolio investment securities to certain other Wells Fargo affiliates pursuant to Rule17a-7 under the 1940 Act and under procedures adopted by the Board of Trustees. The procedures have been designed to ensure that these interfund transactions, which do not incur broker commissions, are effected at current market prices.
5. INVESTMENT PORTFOLIO TRANSACTIONS
Purchases and sales of investments, excluding short-term securities, for the year ended September 30, 2019 were as follows:
| | | | | | |
Purchases at cost | | Sales proceeds |
U.S.
government | | Non-U.S.
government | | U.S.
government | | Non-U.S.
government |
| $81,530,236 | | $186,239,775 | | $80,732,441 | | $79,447,185 |
As of September 30, 2019, the Fund had unfunded term loan commitments of $297,614.
6. SECURITIES LENDING TRANSACTIONS
The Fund lends its securities through an unaffiliated securities lending agent and receives collateral in the form of cash or securities with a value at least equal to the value of the securities on loan. The value of the loaned securities is determined at the close of each business day and any increases or decreases in the required collateral are exchanged between the Fund and the counterparty on the next business day. Cash collateral received is invested in the Securities Lending Fund which seeks to provide a positive return compared to the daily Fed Funds Open Rate by investing in high-quality, U.S. dollar-denominated short-term money market instruments and is exempt from registration under Section 3(c)(7) of the 1940 Act. Securities Lending Fund is managed by Funds Management and is subadvised by WellsCap. Funds Management receives an advisory fee starting at 0.05% and declining to 0.01% as the average daily net assets of the Securities Lending Fund increase. All of the fees received by Funds Management are paid to WellsCap for its services as subadviser.
In the event of counterparty default or the failure of a borrower to return a loaned security, the Fund has the right to use the collateral to offset any losses incurred. As of September 30, 2019, the Fund had securities lending transactions with the following counterparties which are subject to offset:
| | | | | | | | | | | | |
| | | |
| Counterparty | | Value of
securities on
loan | | | Collateral
received1 | | | Net amount | |
| | | |
Barclays Capital Inc. | | $ | 1,072,354 | | | $ | (1,072,354 | ) | | $ | 0 | |
| | | |
JPMorgan Securities LLC | | | 167,003 | | | | (167,003 | ) | | | 0 | |
| 1 | Collateral received within this table is limited to the collateral for the net transaction with the counterparty. |
7. DERIVATIVE TRANSACTIONS
During the year ended September 30, 2019, the Fund entered into futures contracts and forward foreign currency contracts for economic hedging purposes and credit default swap contracts as a substitute for taking a position in the underlying security or index to potentially enhance the Fund’s total return.
Wells Fargo Strategic Income Fund | 39
Notes to financial statements
The volume of the Fund’s derivative activity during the year ended September 30, 2019 was as follows:
| | | | |
Futures contracts | | | | |
| |
Average notional balance on long futures | | $ | 2,380,240 | |
| |
Average notional balance on short futures | | | 56,029,843 | |
Forward foreign currency contracts | | | | |
| |
Average contract amounts to buy | | $ | 8,253,400 | |
| |
Average contract amounts to sell | | | 31,773,924 | |
Credit default swap contracts | | | | |
| |
Average notional balance | | $ | 8,887,994 | |
The Fund’s credit default swap may contain provisions for early termination in the event the net assets of the Fund declines below specific levels identified by the counterparty. If these levels are triggered, the counterparty may terminate the transaction and seek payment or request full collateralization of the derivative transactions in net liability positions.
A summary of the location of derivative instruments on the financial statements by risk is outlined in the following tables.
The fair value of derivative instruments as of September 30, 2019 by risk type was as follows for the Fund:
| | | | | | | | | | | | |
| | | Asset derivatives | | | Liability derivatives | |
| | | | |
| | | Statement of Assets and
Liabilities location | | Fair value | | | Statement of Assets and
Liabilities location | | Fair value | |
| | | | |
Interest rate risk | | Unrealized gains on futures contracts | | $ | 502,495 | * | | Unrealized losses on futures contracts | | $ | 33,854 | * |
| | | | |
Foreign currency risk | | Unrealized gains on futures contracts | | | 75,745 | * | | Unrealized losses on futures contracts | | | 0 | * |
| | | | |
| | Unrealized gains on forward foreign currency contracts | | | 510,504 | | | Unrealized losses on forward foreign currency contracts | | | 232,721 | |
| | | | |
Credit risk | | Net unrealized gains on swap contracts | | | 72,155 | * | | Net unrealized losses on swap contracts | | | 0 | * |
| | | | |
| | | | | $ | 1,160,899 | | | | | $ | 266,575 | |
| * | Amount represents cumulative unrealized gains (losses) as reported in the tables following the Portfolio of Investments. Only the current day’s variation margin as of September 30, 2019 is reported separately on the Statement of Assets and Liabilities. |
The effect of derivative instruments on the Statement of Operations for the year ended September 30, 2019 was as follows for the Fund:
| | | | | | | | | | | | | | | | |
| | | Amount of realized gains(losses) on derivatives | |
| | | | |
| | | Futures
contracts | | | Forward
foreign
currency
contracts | | | Swap
contracts | | | Total | |
| | | | |
Interest rate risk | | $ | (3,655,326 | ) | | $ | 0 | | | $ | 0 | | | $ | (3,655,326 | ) |
| | | | |
Foreign currency risk | | | 16,497 | | | | 835,315 | | | | 0 | | | | 851,812 | |
| | | | |
Credit risk | | | 0 | | | | 0 | | | | 334,927 | | | | 334,927 | |
| | | | |
| | | $ | (3,638,829 | ) | | $ | 835,315 | | | $ | 334,927 | | | $ | (2,468,587 | ) |
| |
| | | Change in unrealized gains (losses) on derivatives | |
| | | | |
| | | Futures
contracts | | | Forward
foreign
currency
contracts | | | Swap
contracts | | | Total | |
| | | | |
Interest rate risk | | $ | 345,208 | | | $ | 0 | | | $ | 0 | | | $ | 345,208 | |
| | | | |
Foreign currency risk | | | 21,424 | | | | 354,713 | | | | 0 | | | | 376,137 | |
| | | | |
Credit risk | | | 0 | | | | 0 | | | | 71,491 | | | | 71,491 | |
| | | | |
| | | $ | 366,632 | | | $ | 354,713 | | | $ | 71,491 | | | $ | 792,836 | |
40 | Wells Fargo Strategic Income Fund
Notes to financial statements
For certain types of derivative transactions, the Fund has entered into International Swaps and Derivatives Association, Inc. master agreements (“ISDA Master Agreements”) or similar agreements with approved counterparties. The ISDA Master Agreements or similar agreements may have requirements to deliver/deposit securities or cash to/with an exchange orbroker-dealer as collateral and allows the Fund to offset, with each counterparty, certain derivative financial instrument’s assets and/or liabilities with collateral held or pledged. Collateral requirements differ by type of derivative. Collateral or margin requirements are set by the broker or exchange clearinghouse for exchange traded derivatives while collateral terms are contract specific forover-the-counter traded derivatives. Cash collateral that has been pledged to cover obligations of the Fund under ISDA Master Agreements or similar agreements, if any, are reported separately in the Statement of Assets and Liabilities. Securities pledged as collateral, if any, are noted in the Portfolio of Investments. With respect to balance sheet offsetting, absent an event of default by the counterparty or a termination of the agreement, the reported amounts of financial assets and financial liabilities in the Statement of Assets and Liabilities are not offset across transactions between the Fund and the applicable counterparty. A reconciliation of the gross amounts on the Statement of Assets and Liabilities to the net amounts by counterparty, including any collateral exposure, for OTC derivatives is as follows:
| | | | | | | | | | | | |
| | | | |
| Counterparty | | Gross amounts
of assets in the
Statement of
Assets and
Liabilities | | Amounts
subject to
netting
agreements | | Collateral
received | | | Net amount
of assets | |
| | | | |
State Street | | $200,247 | | $(200,247) | | $ | 0 | | | $ | 0 | |
| | | | |
Citibank | | 310,257 | | 0 | | | 0 | | | | 310,257 | |
| | | | |
| Counterparty | | Gross amounts
of liabilities in the
Statement of
Assets and
Liabilities | | Amounts
subject to
netting
agreements | | Collateral
pledged | | | Net amount
of liabilities | |
| | | | |
State Street | | $232,721 | | $(200,247) | | $ | 0 | | | $ | 32,474 | |
8. BANK BORROWINGS
The Trust (excluding the money market funds), Wells Fargo Master Trust and Wells Fargo Variable Trust are parties to a $280,000,000 revolving credit agreement whereby the Fund is permitted to use bank borrowings for temporary or emergency purposes, such as to fund shareholder redemption requests. Interest under the credit agreement is charged to the Fund based on a borrowing rate equal to the higher of the Federal Funds rate in effect on that day plus 1.25% or the overnight LIBOR rate in effect on that day plus 1.25%. In addition, an annual commitment fee equal to 0.25% of the unused balance is allocated to each participating fund.
For the year ended September 30, 2019, there were no borrowings by the Fund under the agreement.
9. DISTRIBUTIONS TO SHAREHOLDERS
The tax character of distributions paid was $5,951,587 and $1,743,065 of ordinary income for the years ended September 30, 2019 and September 30, 2018, respectively.
As of September 30, 2019, the components of distributable earnings on a tax basis were as follows:
| | | | |
Undistributed
ordinary
income | | Unrealized
gains | | Capital loss
carryforward |
| | |
| $122,119 | | $3,251,847 | | $(2,407,584) |
Wells Fargo Strategic Income Fund | 41
Notes to financial statements
10. INDEMNIFICATION
Under the Trust’s organizational documents, the officers and Trustees have been granted certain indemnification rights against certain liabilities that may arise out of performance of their duties to the Trust. Additionally, in the normal course of business, the Trust may enter into contracts with service providers that contain a variety of indemnification clauses. The Trust’s maximum exposure under these arrangements is dependent on future claims that may be made against the Fund and, therefore, cannot be estimated.
11. NEW ACCOUNTING PRONOUNCEMENTS
In August 2018, FASB issued Accounting Standards Update (“ASU”)No. 2018-13, Fair Value Measurement (Topic 820)Disclosure Framework—Changes to the Disclosure Requirements for Fair Value Measurement. ASU2018-13 updates the disclosure requirements for fair value measurements by modifying or removing certain disclosures and adding certain new disclosures. The amendments are effective for fiscal years, and interim periods within those fiscal years, beginning after December 15, 2019. Early adoption is permitted. Management has adopted the removal and modification of disclosures early, as permitted, and will adopt the additional new disclosures at the effective date.
In March 2017, FASB issued ASUNo. 2017-08,Premium Amortization on Purchased Callable Debt Securities. ASU2017-08 shortens the amortization period for certain callable debt securities held at a premium and requires the premium to be amortized to the earliest call date. The amendments do not require an accounting change for securities held at a discount and discounts will continue to be accreted to the maturity date of the security. ASU2017-08 is effective for fiscal years beginning after December 15, 2018 and for interim periods within those fiscal years. During the current reporting period, management of the Fund adopted the change in accounting policy which did not have a material impact to the Fund’s financial statements.
42 | Wells Fargo Strategic Income Fund
Report of independent registered public accounting firm
TO THE SHAREHOLDERS OF THE FUND AND BOARD OF TRUSTEES OF WELLS FARGO FUNDS TRUST:
Opinion on the Financial Statements
We have audited the accompanying statement of assets and liabilities of Wells Fargo Strategic Income Fund (the Fund), one of the funds constituting Wells Fargo Funds Trust, including the portfolio of investments, as of September 30, 2019, the related statement of operations for the year then ended, the statements of changes in net assets for each of the years in the two-year period then ended, and the related notes (collectively, the financial statements) and the financial highlights for each of the years in the three-year period ended September 30, 2019, for the period ended September 30, 2016, and for each of the years in the two-year period ended October 31, 2015. In our opinion, the financial statements and financial highlights present fairly, in all material respects, the financial position of the Fund as of September 30, 2019, the results of its operations for the year then ended, the changes in its net assets for each of the years in the two-year period then ended, and the financial highlights for each of the years in the three-year period ended September 30, 2019, for the period ended September 30, 2016, and for each of the years in the two-year period ended October 31, 2015, in conformity with U.S. generally accepted accounting principles.
Basis for Opinion
These financial statements and financial highlights are the responsibility of the Fund’s management. Our responsibility is to express an opinion on these financial statements and financial highlights based on our audits. We are a public accounting firm registered with the Public Company Accounting Oversight Board (United States) (PCAOB) and are required to be independent with respect to the Fund in accordance with the U.S. federal securities laws and the applicable rules and regulations of the Securities and Exchange Commission and the PCAOB.
We conducted our audits in accordance with the standards of the PCAOB. Those standards require that we plan and perform the audit to obtain reasonable assurance about whether the financial statements and financial highlights are free of material misstatement, whether due to error or fraud. Our audits included performing procedures to assess the risks of material misstatement of the financial statements and financial highlights, whether due to error or fraud, and performing procedures that respond to those risks. Such procedures included examining, on a test basis, evidence regarding the amounts and disclosures in the financial statements and financial highlights. Such procedures also included confirmation of securities owned as of September 30, 2019, by correspondence with the custodian, transfer agent and brokers, or by other appropriate auditing procedures. Our audits also included evaluating the accounting principles used and significant estimates made by management, as well as evaluating the overall presentation of the financial statements and financial highlights. We believe that our audits provide a reasonable basis for our opinion.

We have not been able to determine the specific year that we began serving as the auditor of one or more Wells Fargo Funds investment companies; however we are aware that we have served as the auditor of one or more Wells Fargo Funds investment companies since at least 1955.
Boston, Massachusetts
November 25, 2019
Wells Fargo Strategic Income Fund | 43
Other information (unaudited)
TAX INFORMATION
For the fiscal year ended September 30, 2019, $3,062,673 has been designated as interest-related dividends for nonresident alien shareholders pursuant to Section 871 of the Internal Revenue Code.
For the fiscal year ended September 30, 2019, 1.68% of the ordinary income distributed was derived from interest on U.S. government securities.
PROXY VOTING INFORMATION
A description of the policies and procedures used to determine how to vote proxies relating to portfolio securities is available, upon request, by calling1-800-222-8222, visiting our website atwfam.com, or visiting the SEC website at sec.gov. Information regarding how the proxies related to portfolio securities were voted during the most recent12-month period ended June 30 is available on the website atwfam.comor by visiting the SEC website at sec.gov.
QUARTERLY PORTFOLIO HOLDINGS INFORMATION
The Fund files its complete schedule of portfolio holdings with the SEC for the first and third quarters of each fiscal year on Form N-Q or FormN-PORT, which is available by visiting the SEC website at sec.gov. Those forms may be reviewed and copied at the SEC’s Public Reference Room in Washington, DC. Information on the operation of the Public Reference Room may be obtained by calling1-800-SEC-0330.
44 | Wells Fargo Strategic Income Fund
Other information (unaudited)
BOARD OF TRUSTEES AND OFFICERS
Each of the Trustees and Officers1 listed in the table below acts in identical capacities for each fund in the Wells Fargo family of funds, which consists of 150 mutual funds comprising the Wells Fargo Funds Trust, Wells Fargo Variable Trust, Wells Fargo Master Trust and fourclosed-end funds (collectively the “Fund Complex”). This table should be read in conjunction with the Prospectus and the Statement of Additional Information2. The mailing address of each Trustee and Officer is 525 Market Street, 12th Floor, San Francisco, CA 94105. Each Trustee and Officer serves an indefinite term, however, each Trustee serves such term until reaching the mandatory retirement age established by the Trustees.
Independent Trustees
| | | | | | |
Name and
year of birth | | Position held and
length of service* | | Principal occupations during past five years or longer | | Current other
public company or
investment
company
directorships |
| | | |
| William R. Ebsworth (Born 1957) | | Trustee, since 2015 | | Retired. From 1984 to 2013, equities analyst, portfolio manager, research director and chief investment officer at Fidelity Management and Research Company in Boston, Tokyo, and Hong Kong, and retired in 2013 as Chief Investment Officer of Fidelity Strategic Advisers, Inc. where he led a team of investment professionals managing client assets. Prior thereto, Board member of Hong Kong Securities Clearing Co., Hong Kong Options Clearing Corp., the Thailand International Fund, Ltd., Fidelity Investments Life Insurance Company, and Empire Fidelity Investments Life Insurance Company. Audit Committee Chair and Investment Committee Chair of the Vincent Memorial Hospital Endowment(non-profit organization). Mr. Ebsworth is a CFA® charterholder. | | N/A |
| | | |
| Jane A. Freeman (Born 1953) | | Trustee, since 2015; Chair Liaison, since 2018 | | Retired. From 2012 to 2014 and 1999 to 2008, Chief Financial Officer of Scientific Learning Corporation. From 2008 to 2012, Ms. Freeman provided consulting services related to strategic business projects. Prior to 1999, Portfolio Manager at Rockefeller & Co. and Scudder, Stevens & Clark. Board member of the Harding Loevner Funds from 1996 to 2014, serving as both Lead Independent Director and chair of the Audit Committee. Board member of the Russell Exchange Traded Funds Trust from 2011 to 2012 and the chair of the Audit Committee. Ms. Freeman is a Board Member of The Ruth Bancroft Garden(non-profit organization). She is also an inactive Chartered Financial Analyst. | | N/A |
| | | |
| Isaiah Harris, Jr. (Born 1952) | | Trustee, since 2009; Audit Committee Chairman, since 2019 | | Retired. Chairman of the Board of CIGNA Corporation since 2009, and Director since 2005. From 2003 to 2011, Director of Deluxe Corporation. Prior thereto, President and CEO of BellSouth Advertising and Publishing Corp. from 2005 to 2007, President and CEO of BellSouth Enterprises from 2004 to 2005 and President of BellSouth Consumer Services from 2000 to 2003. Emeritus member of the Iowa State University Foundation Board of Governors. Emeritus Member of the Advisory Board of Iowa State University School of Business. Advisory Board Member, Palm Harbor Academy (private school). Advisory Board Member, Child Evangelism Fellowship(non-profit). Mr. Harris is a certified public accountant (inactive status). | | CIGNA Corporation |
| | | |
| Judith M. Johnson (Born 1949) | | Trustee, since 2008; Audit Committee Chairman, from 2009 to 2018 | | Retired. Prior thereto, Chief Executive Officer and Chief Investment Officer of Minneapolis Employees Retirement Fund from 1996 to 2008. Ms. Johnson is an attorney, certified public accountant and a certified managerial accountant. | | N/A |
Wells Fargo Strategic Income Fund | 45
Other information (unaudited)
| | | | | | |
Name and
year of birth | | Position held and
length of service* | | Principal occupations during past five years or longer | | Current other
public company or
investment
company
directorships |
| | | |
David F. Larcker
(Born 1950) | | Trustee, since 2009 | | James Irvin Miller Professor of Accounting at the Graduate School of Business, Stanford University, Director of the Corporate Governance Research Initiative and Senior Faculty of The Rock Center for Corporate Governance since 2006. From 2005 to 2008, Professor of Accounting at the Graduate School of Business, Stanford University. Prior thereto, Ernst & Young Professor of Accounting at The Wharton School, University of Pennsylvania from 1985 to 2005. | | N/A |
| | | |
Olivia S. Mitchell
(Born 1953) | | Trustee, since 2006; Nominating and Governance Committee Chairman, since 2018 | | International Foundation of Employee Benefit Plans Professor, Wharton School of the University of Pennsylvania since 1993. Director of Wharton’s Pension Research Council and Boettner Center on Pensions & Retirement Research, and Research Associate at the National Bureau of Economic Research. Previously, Cornell University Professor from 1978 to 1993. | | N/A |
| | | |
Timothy J. Penny
(Born 1951) | | Trustee, since 1996; Chairman, since 2018 | | President and Chief Executive Officer of Southern Minnesota Initiative Foundation, anon-profit organization, since 2007. Member of the Board of Trustees of NorthStar Education Finance, Inc., anon-profit organization, since 2007. | | N/A |
| | | |
James G. Polisson
(Born 1959) | | Trustee, since 2018 | | Retired. Chief Marketing Officer, Source (ETF) UK Services, Ltd, from 2015 to 2017. From 2012 to 2015, Principal of The Polisson Group, LLC, a management consulting, corporate advisory and principal investing company. Chief Executive Officer and Managing Director at Russell Investments, Global Exchange Traded Funds from 2010 to 2012. Managing Director of Barclays Global Investors from 1998 to 2010 and Global Chief Marketing Officer for iShares and Barclays Global Investors from 2000 to 2010. Trustee of the San Francisco Mechanics’ Institute, anon-profit organization, from 2013 to 2015. Board member of the Russell Exchange Traded Fund Trust from 2011 to 2012. Director of Barclays Global Investors Holdings Deutschland GmbH from 2006 to 2009. Mr. Polisson is an attorney and has a retired status with the Massachusetts and District of Columbia Bar Associations. | | N/A |
| * | Length of service dates reflect the Trustee’s commencement of service with the Trust’s predecessor entities, where applicable. |
46 | Wells Fargo Strategic Income Fund
Other information (unaudited)
Officers
| | | | |
Name and
year of birth | | Position held and
length of service | | Principal occupations during past five years or longer |
| | |
| Andrew Owen (Born 1960) | | President, since 2017 | | Executive Vice President of Wells Fargo & Company and Head of Affiliated Managers, Wells Fargo Asset Management, since 2014. In addition, Mr. Owen is currently President, Chief Executive Officer and Director of Wells Fargo Funds Management, LLC since 2017. Prior thereto, Executive Vice President responsible for marketing, investments and product development for Wells Fargo Funds Management, LLC, from 2009 to 2014. |
| | |
| Nancy Wiser1 (Born 1967) | | Treasurer, since 2012 | | Executive Vice President of Wells Fargo Funds Management, LLC since 2011. Chief Operating Officer and Chief Compliance Officer at LightBox Capital Management LLC, from 2008 to 2011. |
| | |
| Michelle Rhee3 (Born 1966) | | Chief Legal Officer, since 2019 | | Secretary of Wells Fargo Funds Management, LLC, Chief Legal Counsel of Wells Fargo Asset Management and Assistant General Counsel of Wells Fargo Bank, N.A. since 2018. Associate General Counsel and Managing Director of Bank of America Corporation from 2004 to 2018. |
| | |
| Catherine Kennedy4 (Born 1969) | | Secretary, since 2019 | | Vice President of Wells Fargo Funds Management, LLC and Senior Counsel of the Wells Fargo Legal Department since 2010. Vice President and Senior Counsel of Evergreen Investment Management Company, LLC from 1998 to 2010. |
| | |
| Michael H. Whitaker(Born 1967) | | Chief Compliance Officer, since 2016 | | Chief Compliance Officer of Wells Fargo Asset Management since 2016. Senior Vice President and Chief Compliance Officer for Fidelity Investments from 2007 to 2016. |
| | |
| David Berardi (Born 1975) | | Assistant Treasurer, since 2009 | | Vice President of Wells Fargo Funds Management, LLC since 2009. Vice President of Evergreen Investment Management Company, LLC from 2008 to 2010. Manager of Fund Reporting and Control for Evergreen Investment Management Company, LLC from 2004 to 2010. |
| | |
| Jeremy DePalma1 (Born 1974) | | Assistant Treasurer, since 2009 | | Senior Vice President of Wells Fargo Funds Management, LLC since 2009. Senior Vice President of Evergreen Investment Management Company, LLC from 2008 to 2010 and head of the Fund Reporting and Control Team within Fund Administration from 2005 to 2010. |
| 1 | Nancy Wiser acts as Treasurer of 64 funds in the Fund Complex. Jeremy DePalma acts as Treasurer of 86 funds and Assistant Treasurer of 64 funds in the Fund Complex. |
| 2 | The Statement of Additional Information includes additional information about the Trustees and is available, without charge, upon request, by calling1-800-222-8222 or by visiting the website atwfam.com. |
| 3 | Michelle Rhee became Chief Legal Officer effective October 22, 2019. |
| 4 | Catherine Kennedy became Secretary effective October 22, 2019. |
Wells Fargo Strategic Income Fund | 47
Other information (unaudited)
BOARD CONSIDERATION OF INVESTMENT MANAGEMENT ANDSUB-ADVISORY AGREEMENTS:
Wells Fargo Strategic Income Fund
Under the Investment Company Act of 1940 (the “1940 Act”), the Board of Trustees (the “Board”) of Wells Fargo Funds Trust (the “Trust”) must determine annually whether to approve the continuation of the Trust’s investment management andsub-advisory agreements. In this regard, at anin-person meeting held on May21-22, 2019 (the “Meeting”), the Board, all the members of which have no direct or indirect interest in the investment management andsub-advisory agreements and are not “interested persons” of the Trust, as defined in the 1940 Act (the “Independent Trustees”), reviewed and approved for the Wells Fargo Strategic Income Fund(the “Fund”): (i) an investment management agreement (the “Management Agreement”) with Wells Fargo Funds Management, LLC (“Funds Management”); (ii) an investmentsub-advisory agreement with Wells Capital Management Incorporated (“WellsCap”), an affiliate of Funds Management; and (iii) an investmentsub-advisory agreement with Wells Fargo Asset Management (International), LLC (“WFAM International”), an affiliate of Funds Management. Thesub-advisory agreements with WellsCap and WFAM International (the“Sub-Advisers”) are collectively referred to as theSub-Advisory Agreements, and the Management Agreement andSub-Advisory Agreements are collectively referred to as the “Advisory Agreements.”
At the Meeting, the Board considered the factors and reached the conclusions described below relating to the selection of Funds Management and theSub-Advisers and the approval of the Advisory Agreements. Prior to the Meeting, including at anin-person meeting in April 2019, the Trustees conferred extensively among themselves and with representatives of Funds Management about these matters. Also, the Board has adopted a team-based approach, with each team consisting of asub-set of Trustees, to assist the full Board in the discharge of its duties in reviewing investment performance and other matters throughout the year. The Independent Trustees were assisted in their evaluation of the Advisory Agreements by independent legal counsel, from whom they received separate legal advice and with whom they met separately.
In providing information to the Board, Funds Management and theSub-Advisers were guided by a detailed set of requests for information submitted to them by independent legal counsel on behalf of the Independent Trustees at the start of the Board’s annual contract renewal process earlier in 2019. In considering and approving the Advisory Agreements, the Trustees considered the information they believed relevant, including but not limited to the information discussed below. The Board considered not only the specific information presented in connection with the Meeting, but also the knowledge gained over time through interaction with Funds Management and theSub-Advisers about various topics. In this regard, the Board reviewed reports of Funds Management at each of its quarterly meetings, which included, among other things, portfolio reviews and investment performance reports. In addition, the Board and the teams mentioned above confer with portfolio managers at various times throughout the year. The Board did not identify any particular information or consideration that wasall-important or controlling, and each individual Trustee may have attributed different weights to various factors.
After its deliberations, the Board unanimously approved the continuation of the Advisory Agreements for aone-year term and determined that the compensation payable to Funds Management and theSub-Advisers under each of the Advisory Agreements was reasonable. The Board considered the approval of the Advisory Agreements for the Fund as part of its consideration of agreements for funds across the complex, but its approvals were made on afund-by-fund basis. The following summarizes a number of important, but not necessarily all, factors considered by the Board in support of its approvals.
Nature, extent and quality of services
The Board received and considered various information regarding the nature, extent and quality of services provided to the Fund by Funds Management and theSub-Advisers under the Advisory Agreements. This information included a description of the investment advisory services and Fund-level administrative services covered by the Management Agreement, as well as, among other things, a summary of the background and experience of senior management of Wells Fargo Asset Management (“WFAM”), of which Funds Management and theSub-Advisers are a part, a summary of investments made in the business of WFAM, a summary of certain organizational and personnel changes involving Funds Management and theSub-Advisers, and a description of Funds Management’s and theSub-Advisers’ business continuity planning programs and of their approaches to data privacy and cybersecurity. The Board received and reviewed information about Funds Management’s role as administrator of the Fund’s liquidity risk management program. The Board also considered the qualifications, background, tenure and responsibilities of each of the portfolio managers primarily responsible for theday-to-day portfolio management of the Fund.
The Board evaluated the ability of Funds Management and theSub-Advisers to attract and retain qualified investment professionals, including research, advisory and supervisory personnel. The Board further considered the compliance programs and compliance records of Funds Management and theSub-Advisers. In addition, the Board took into account the full range of services provided to the Fund by Funds Management and its affiliates.
48 | Wells Fargo Strategic Income Fund
Other information (unaudited)
Fund investment performance and expenses
The Board considered the investment performance results for the Fund over various time periods ended December 31, 2018. The Board considered these results in comparison to the investment performance of funds in a universe that was determined by Broadridge Inc. (“Broadridge”) to be similar to the Fund (the “Universe”), and in comparison to the Fund’s benchmark index and to other comparative data. Broadridge is an independent provider of investment company data. The Board received a description of the methodology used by Broadridge to select the mutual funds in the performance Universe. The Board noted that the investment performance of the Fund (Administrator Class) was higher than or in range of the average investment performance of the Universe for theone- and three-year periods under review, and lower than the average investment performance of the Universe for the five-year period under review. The Board also noted that the investment performance of the Fund was lower than its benchmark index, the Bloomberg Barclays U.S. Universal Bond Index, for theone- and five-year periods under review, but higher than its benchmark for the three-year period under review.
The Board also received and considered information regarding the Fund’s net operating expense ratios and their various components, including actual management fees, custodian and othernon-management fees, and Rule12b-1 andnon-Rule12b-1 shareholder service fees. The Board considered these ratios in comparison to the median ratios of funds in class-specific expense groups that were determined by Broadridge to be similar to the Fund (the “Groups”). The Board received a description of the methodology used by Broadridge to select the mutual funds in the expense Groups and an explanation of how funds comprising expense groups and their expense ratios may vary fromyear-to-year. Based on the Broadridge reports, the Board noted that the net operating expense ratios of the Fund were lower than the median net operating expense ratios of the expense Groups for each share class.
The Board took into account the Fund’s investment performance and expense information provided to it among the factors considered in deciding tore-approve the Advisory Agreements.
Investment management and sub-advisory fee rates
The Board reviewed and considered the contractual fee rates payable by the Fund to Funds Management under the Management Agreement, as well as the contractual fee rates payable by the Fund to Funds Management for class-level administrative services under a Class-Level Administration Agreement, which include, among other things, class-level transfer agency andsub-transfer agency costs (collectively, the “Management Rates”). The Board also reviewed and considered the contractual investmentsub-advisory fee rates that are payable by Funds Management to theSub-Advisers for investmentsub-advisory services.
Among other information reviewed by the Board was a comparison of the Fund’s Management Rates with the average contractual investment management fee rates of funds in the expense Groups at a common asset level as well as transfer agency costs of the funds in the expense Groups. The Board noted that the Management Rates of the Fund were lower than or in range of the sum of these average rates for the Fund’s expense Groups for all share classes.
The Board also received and considered information about the portion of the total management fee that was retained by Funds Management after payment of the fee to theSub-Advisers forsub-advisory services. In assessing the reasonableness of this amount, the Board received and evaluated information about the nature and extent of responsibilities retained and risks assumed by Funds Management and not delegated to or assumed by theSub-Advisers, and about Funds Management’son-going oversight services. Given the affiliation between Funds Management and theSub-Advisers, the Board ascribed limited relevance to the allocation of fees between them.
Based on its consideration of the factors and information it deemed relevant, including those described here, the Board determined that the compensation payable to Funds Management under the Management Agreement and to theSub-Advisers under theSub-Advisory Agreements was reasonable.
Profitability
The Board received and considered information concerning the profitability of Funds Management, as well as the profitability of both WFAM and Wells Fargo & Co. (“Wells Fargo”) from providing services to the fund family as a whole. The Board noted that theSub-Advisers’ profitability information with respect to providing services to the Fund and other funds in the family was subsumed in the WFAM and Wells Fargo profitability analysis.
Funds Management reported on the methodologies and estimates used in calculating profitability, including a description of the methodology used to allocate certain expenses. Among other things, the Board noted that the levels of profitability reported on afund-by-fund basis varied widely, depending on factors such as the size, type and age of fund. Based on its review, the Board did not deem the profits reported by Funds Management, WFAM or Wells Fargo from services provided to the Fund to be at a level that would prevent it from approving the continuation of the Advisory Agreements.
Wells Fargo Strategic Income Fund | 49
Other information (unaudited)
Economies of scale
The Board received and considered information about the potential for Funds Management to experience economies of scale in the provision of management services to the Fund, the difficulties of calculating economies of scale at an individual fund level, and the extent to which potential scale benefits are shared with shareholders. The Board noted the existence of breakpoints in the Fund’s management fee structure, which operate generally to reduce the Fund’s expense ratios as the Fund grows in size. The Board considered that in addition to management fee breakpoints, Funds Management shares potential economies of scale from its management business in a variety of ways, including through fee waiver and expense reimbursement arrangements, services that benefit shareholders, competitive management fee rates set at the outset without regard to breakpoints, and investments in the business intended to enhance services available to shareholders.
The Board concluded that the Fund’s fee and expense arrangements, including contractual breakpoints, constituted a reasonable approach to sharing potential economies of scale with the Fund and its shareholders.
Other benefits to Funds Management and theSub-Advisers
The Board received and considered information regarding potential“fall-out” or ancillary benefits received by Funds Management and its affiliates, including theSub-Advisers, as a result of their relationships with the Fund. Ancillary benefits could include, among others, benefits directly attributable to other relationships with the Fund and benefits potentially derived from an increase in Funds Management’s and theSub-Advisers’ businesses as a result of their relationships with the Fund. The Board noted that various affiliates of Funds Management may receive distribution-related fees, shareholder servicing payments andsub-transfer agency fees in respect of shares sold or held through them and services provided.
The Board also reviewed information about soft dollar credits earned and utilized by theSub-Advisers, fees earned by Funds Management and WellsCap from managing a private investment vehicle for the fund family’s securities lending collateral, and commissions earned by an affiliated broker from portfolio transactions.
Based on its consideration of the factors and information it deemed relevant, including those described here, the Board did not find that any ancillary benefits received by Funds Management and its affiliates, including theSub-Advisers, were unreasonable.
Conclusion
At the Meeting, after considering the above-described factors and based on its deliberations and its evaluation of the information described above, the Board unanimously approved the continuation of the Advisory Agreements for aone-year term and determined that the compensation payable to Funds Management and theSub-Advisers under each of the Advisory Agreements was reasonable.
50 | Wells Fargo Strategic Income Fund
This page is intentionally left blank.
This page is intentionally left blank.

For more information
More information about Wells Fargo Funds is available free upon request. To obtain literature, please write, visit the Fund’s website, or call:
Wells Fargo Funds
P.O. Box 219967
Kansas City, MO 64121-9967
Website:wfam.com
Individual investors:1-800-222-8222
Retail investment professionals:1-888-877-9275
Institutional investment professionals:1-866-765-0778

This report and the financial statements contained herein are submitted for the general information of the shareholders of the Fund. If this report is used for promotional purposes, distribution of the report must be accompanied or preceded by a current prospectus. Before investing, please consider the investment objectives, risks, charges, and expenses of the investment. For a current prospectus and, if available, a summary prospectus, containing this information, call1-800-222-8222 or visit the Fund’s website atwfam.com. Read the prospectus carefully before you invest or send money.
Wells Fargo Asset Management (WFAM) is the trade name for certain investment advisory/management firms owned by Wells Fargo & Company. These firms include but are not limited to Wells Capital Management Incorporated and Wells Fargo Funds Management, LLC. Certain products managed by WFAM entities are distributed by Wells Fargo Funds Distributor, LLC (a broker-dealer and Member FINRA).
This material is for general informational and educational purposes only and is NOT intended to provide investment advice or a recommendation of any kind—including a recommendation for any specific investment, strategy, or plan.
INVESTMENT PRODUCTS: NOT FDIC INSURED ◾ NO BANK GUARANTEE ◾ MAY LOSE VALUE
© 2019 Wells Fargo & Company. All rights reserved.
406809 11-19
A263/AR263 09-19
Annual Report
September 30, 2019
Wells Fargo C&B Mid Cap Value Fund
Beginning on January 1, 2021, as permitted by new regulations adopted by the Securities and Exchange Commission, paper copies of the Wells Fargo Funds’ annual and semi-annual shareholder reports issued after this date will no longer be sent by mail, unless you specifically request paper copies of the reports. Instead, the reports will be made available on the Funds’ website, and you will be notified by mail each time a report is posted and provided with a website address to access the report.
If you already elected to receive shareholder reports electronically, you will not be affected by this change and you need not take any action. You may elect to receive shareholder reports and other communications from the Fund electronically at any time by contacting your financial intermediary (such as a broker-dealer or bank) or, if you are a direct investor, by calling1-800-222-8222 or by enrolling at wellsfargo.com/advantagedelivery.
You may elect to receive all future reports in paper free of charge. If you invest through a financial intermediary, you can contact your financial intermediary to request that you continue to receive paper copies of your shareholder reports; if you invest directly with the Fund, you can call 1-800-222-8222. Your election to receive reports in paper will apply to all Wells Fargo Funds held in your account with your financial intermediary or, if you are a direct investor, to all Wells Fargo Funds that you hold.
|
|
|
Reduce clutter. Save trees. |
Sign up for electronic delivery of prospectuses and shareholder reports atwellsfargo.com/advantagedelivery |
The views expressed and any forward-looking statements are as of September 30, 2019, unless otherwise noted, and are those of the Fund managers and/or Wells Fargo Asset Management. Discussions of individual securities, or the markets generally, or any Wells Fargo Fund are not intended as individual recommendations. Future events or results may vary significantly from those expressed in any forward-looking statements. The views expressed are subject to change at any time in response to changing circumstances in the market. Wells Fargo Asset Management and the Fund disclaim any obligation to publicly update or revise any views expressed or forward-looking statements.
INVESTMENT PRODUCTS: NOT FDIC INSURED ◾ NO BANK GUARANTEE ◾ MAY LOSE VALUE
Wells Fargo C&B Mid Cap Value Fund | 1
Letter to shareholders (unaudited)

Andrew Owen
President
Wells Fargo Funds
“December’s S&P 500 Index performance was the worst since 1931.”
Dear Shareholder:
We are pleased to offer you this annual report for the Wells Fargo C&B Mid Cap Value Fund for the 12-month period that ended September 30, 2019. After the first half of the period yielded either low-single-digit or negative investment returns, U.S. stock and global bond investors generally saw markets recover during the second half amid intensifying market volatility, global economic growth concerns, international trade stare downs, and simmering geopolitical tensions.
Overall, fixed-income investors enjoyed a distinct advantage over stock investors. For the period, U.S. stocks, based on the S&P 500 Index,1 gained 4.25% and international stocks, as measured by the MSCI ACWI ex USA Index (Net),2 fell 1.23%. The MSCI EM Index (Net)3 slipped 2.02%. Among fixed income investors, the Bloomberg Barclays U.S. Aggregate Bond Index4 added 10.30%, the Bloomberg Barclays Global Aggregateex-USD Index5 added 5.34%, the Bloomberg Barclays Municipal Bond Index6 gained 8.55%, and the ICE BofAML U.S. High Yield Index7 added 6.30%.
Investors confronted unsettling events during the fourth quarter of 2018.
During the fourth quarter of 2018, investors grew concerned about the pace and sustainability of the global economic expansion. The U.S. Bureau of Economic Analysis reported third-quarter U.S. gross domestic product (GDP) was 3.4% on an annualized basis, which was down from the second-quarter rate. A partial U.S. government shutdown occurred, which extended into January 2019. Brexit efforts stalled, causing uncertainty for the eurozone. The value of the renminbi declined even as the People’s Bank of China cut reserve requirement ratios, accelerated infrastructure spending, and cut taxes in efforts to spur economic activity.
The combination of news in the U.S. and generally weak economic indicators outside of the U.S. caused investors to seek safe havens. December’s S&P 500 Index performance was the worst since 1931. Globally, fixed-income investments fared better than stocks during the last two months of the year. Even as indicators suggested growth was restrained, the U.S. Federal Reserve (Fed) increased the federal funds rate by 25 basis points (bps; 100 bps equal 1.00%) in December 2018 to a target range of between 2.25% and 2.50%. Many observers expressed concerns that higher rates could slow the economy further.
| 1 | The S&P 500 Index consists of 500 stocks chosen for market size, liquidity, and industry group representation. It is a market-value-weighted index with each stock’s weight in the index proportionate to its market value. You cannot invest directly in an index. |
| 2 | The Morgan Stanley Capital International (MSCI) All Country World Index (ACWI) ex USA Index (Net) is a free-float-adjusted market-capitalization weighted index that is designed to measure the equity market performance of developed and emerging markets, excluding the U.S. Source: MSCI. MSCI makes no express or implied warranties or representations and shall have no liability whatsoever with respect to any MSCI data contained herein. The MSCI data may not be further redistributed or used as a basis for other indices or any securities or financial products. This report is not approved, reviewed, or produced by MSCI. You cannot invest directly in an index. |
| 3 | The MSCI Emerging Markets (EM) Index (Net) is a free-float-adjusted market-capitalization-weighted index that is designed to measure the equity market performance of emerging markets. You cannot invest directly in an index. |
| 4 | The Bloomberg Barclays U.S. Aggregate Bond Index is a broad-based benchmark that measures the investment-grade, U.S. dollar-denominated, fixed-rate taxable bond market, including Treasuries, government-related and corporate securities, mortgage-backed securities (agency fixed-rate and hybrid adjustable-rate mortgage pass-throughs), asset-backed securities, and commercial mortgage-backed securities. You cannot invest directly in an index. |
| 5 | The Bloomberg Barclays Global Aggregate ex-USD Index is an unmanaged index that provides a broad-based measure of the global investment-grade fixed-income markets excluding the U.S. dollar-denominated debt market. You cannot invest directly in an index. |
| 6 | The Bloomberg Barclays Municipal Bond Index is an unmanaged index composed of long-term tax-exempt bonds with a minimum credit rating of Baa. You cannot invest directly in an index. |
| 7 | The ICE BofAML U.S. High Yield Index is a market-capitalization-weighted index of domestic and Yankee high-yield bonds. The index tracks the performance of high-yield securities traded in the U.S. bond market. You cannot invest directly in an index. Copyright 2019. ICE Data Indices, LLC. All rights reserved. |
2 | Wells Fargo C&B Mid Cap Value Fund
Letter to shareholders (unaudited)
The market climbs a wall of worry.
Investment returns early in 2019 appeared to reaffirm the adage that markets climb a wall of worry as the new year began. The S&P 500 Index gained 8.01% for the month of January, the best monthly performance in 30 years. Returns for the MSCI ACWI ex USA Index (Net), the Bloomberg Barclays U.S. Aggregate Bond Index, and the Bloomberg Barclays Global Aggregate ex-USD Index also were positive.
In February 2019, signs of slowing global growth grew more ominous. The Bureau of Economic Analysis announced fourth-quarter 2018 GDP grew at an annualized 2.2% rate, a slower rate than reported for the prior two quarters. In a February report, the Bank of England forecast the slowest growth for 2019 since the financial crisis. China and the U.S. continued to wrangle over trade issues. By the end of the first quarter of 2019, more accommodative Fed sentiment and steady, if not spectacular, U.S. economic and business metrics encouraged domestic investors.
Early second-quarter 2019 enthusiasm among investors faded.
During April 2019, favorable sentiment found additional support in reports of sustained low inflation, solid employment data, and first-quarter U.S. GDP of an annualized rate of 3.2%. During May, markets tumbled on mixed investment signals. In the U.S., partisan wrangling ramped up as Democrats and Republicans set their sights on 2020 presidential politics. The U.K.’s Brexit disagreements caused Prime Minister Theresa May to resign. Boris Johnson succeeded her only to exacerbate uncertainty about Brexit’s resolution ahead of an October 2019 deadline. The European Commission downgraded the 2019 growth forecast to 1.2%. The U.S. increased tariffs on products from China, China responded, and then talks broke down. President Donald Trump threatened to turn his foreign policy tariff tool to Mexico over immigration issues.
During the third quarter of 2019, investors regrouped. Just as the investment horizon appeared to darken, sentiment turned and U.S. equity markets gained during June and July. The gains, primarily driven by geopolitical and monetary policy events, pushed equity markets to new highs. European Central Bank President Mario Draghi said that if the outlook doesn’t improve, the bank would cut rates or buy more assets to prop up inflation. President Trump backed off of tariff threats against Mexico and China. In the U.S., the Fed implemented a 0.25% federal funds rate cut in July.
Later in July 2019, the U.S. reversed course and threatened to impose higher tariffs on China’s exports after talks failed. China responded with tariff threats of its own and devalued the renminbi, a move that roiled global markets. Major U.S. stock market indices closed July with the worst weekly results of the year. Bond prices gained as Treasury yields fell to levels not seen since November 2016 and the yield curve inverted at multiple points along the 30-year arc.
In a microcosm, August 2019 encapsulated many of the unnerving events that plagued investors during the prior 11 months. The U.S.-China trade relationship swung from antagonistic to hopeful and back again with no evident compromise on the horizon. Evidence of a continued global economic slowdown mounted. Central banks in China, New Zealand, and Thailand cut interest rates. Industrial and manufacturing data declined in China, Canada, Japan, and Germany. Adding to the uncertain environment, Italy’s prime minister resigned, many feared a crackdown in Hong Kong as protesters sustained their calls for reform throughout the month, and Boris Johnson planned to suspend Parliament as Brexit’s deadline neared.
In the U.S., September saw the Fed join other central banks in cutting interest rates. Manufacturing data in the U.S., as reported by the Institute for Supply Management, disappointed investors. The U.S. Congress announced it would pursue an impeachment investigation of President Trump. Meanwhile, the Brexit impasse showed no signs of
“The S&P 500 Index gained 8.01% for the month of January, the best monthly performance in 30 years.”
Wells Fargo C&B Mid Cap Value Fund | 3
Letter to shareholders (unaudited)
|
|
|
For further information about your Fund, contact your investment professional, visit our website at wfam.com, or call us directly at1-800-222-8222. |
resolution. Officials in China said that hitting the country’s economic growth goals for the year would be difficult considering the weight of tariffs and trade restrictions. So while the S&P 500 Index finished the third quarter with year-to-date returns that were the best in more than 20 years, amid signs of equity investors taking money out of the stock market, concerns about future returns remained.
Don’t let short-term uncertainty derail long-term investment goals.
Periods of investment uncertainty can present challenges, but experience has taught us that maintaining long-term investment goals can be an effective way to plan for the future. To help you create a sound strategy based on your personal goals and risk tolerance, Wells Fargo Funds offers more than 100 mutual funds spanning a wide range of asset classes and investment styles. Although diversification cannot guarantee an investment profit or prevent losses, we believe it can be an effective way to manage investment risk and potentially smooth out overall portfolio performance. We encourage investors to know their investments and to understand that appropriate levels of risk-taking may potentially unlock opportunities.
Thank you for choosing to invest with Wells Fargo Funds. We appreciate your confidence in us and remain committed to helping you meet your financial needs.
Sincerely,

Andrew Owen
President
Wells Fargo Funds
4 | Wells Fargo C&B Mid Cap Value Fund
This page is intentionally left blank.
Performance highlights (unaudited)
Investment objective
The Fund seeks maximum long-term return (current income and capital appreciation), consistent with minimizing risk to principal.
Manager
Wells Fargo Funds Management, LLC
Subadviser
Cooke and Bieler, L.P.
Portfolio managers
Andrew B. Armstrong, CFA®‡
Wesley Lim, CFA®‡*
Steve Lyons, CFA®‡
Michael M. Meyer, CFA®‡
Edward W. O’Connor, CFA®‡
R. James O’Neil, CFA®‡
Mehul Trivedi, CFA®‡
William Weber, CFA®‡
Average annual total returns (%) as of September 30, 2019
| | | | | | | | | | | | | | | | | | | | | | | | | | | | | | | | | | |
| | | | |
| | | | | Including sales charge | | | Excluding sales charge | | | Expense ratios1 (%) | |
| | | | | | | | | |
| | | Inception date | | 1 year | | | 5 year | | | 10 year | | | 1 year | | | 5 year | | | 10 year | | | Gross | | | Net2 | |
| | | | | | | | | | |
| Class A (CBMAX) | | 7-26-2004 | | | -1.12 | | | | 8.29 | | | | 11.60 | | | | 4.91 | | | | 9.58 | | | | 12.26 | | | | 1.30 | | | | 1.26 | |
| | | | | | | | | | |
| Class C (CBMCX) | | 7-26-2004 | | | 3.14 | | | | 8.77 | | | | 11.42 | | | | 4.14 | | | | 8.77 | | | | 11.42 | | | | 2.05 | | | | 2.01 | |
| | | | | | | | | | |
| Class R6 (CBMYX)3 | | 7-31-2018 | | | – | | | | – | | | | – | | | | 5.39 | | | | 9.98 | | | | 12.64 | | | | 0.87 | | | | 0.81 | |
| | | | | | | | | | |
| Administrator Class (CBMIX) | | 7-26-2004 | | | – | | | | – | | | | – | | | | 5.03 | | | | 9.68 | | | | 12.34 | | | | 1.22 | | | | 1.16 | |
| | | | | | | | | | |
| Institutional Class (CBMSX) | | 7-26-2004 | | | – | | | | – | | | | – | | | | 5.29 | | | | 9.96 | | | | 12.63 | | | | 0.97 | | | | 0.91 | |
| | | | | | | | | | |
| Russell Midcap® Value Index4 | | – | | | – | | | | – | | | | – | | | | 1.60 | | | | 7.55 | | | | 12.29 | | | | – | | | | – | |
Figures quoted represent past performance, which is no guarantee of future results, and do not reflect taxes that a shareholder may pay on fund distributions or the redemption of fund shares. Investment return and principal value of an investment will fluctuate so that an investor’s shares, when redeemed, may be worth more or less than their original cost. Performance shown without sales charges would be lower if sales charges were reflected. Current performance may be lower or higher than the performance data quoted, which assumes the reinvestment of dividends and capital gains. Current month-end performance is available on the Fund’s website,wfam.com.
Index returns do not include transaction costs associated with buying and selling securities, any mutual fund fees or expenses, or any taxes. It is not possible to invest directly in an index.
For Class A shares, the maximum front-end sales charge is 5.75%. For Class C shares, the maximum contingent deferred sales charge is 1.00%. Performance including a contingent deferred sales charge assumes the sales charge for the corresponding time period. Class R6, Administrator Class, and Institutional Class shares are sold without a front-end sales charge or contingent deferred sales charge.
Stock values fluctuate in response to the activities of individual companies and general market and economic conditions. Smaller-company stocks tend to be more volatile and less liquid than those of larger companies. Consult the Fund’s prospectus for additional information on these and other risks.
Please see footnotes on page 7.
6 | Wells Fargo C&B Mid Cap Value Fund
Performance highlights (unaudited)
|
|
| Growth of $10,000 investment as of September 30, 20195 |
|

|
| ‡ | CFA® and Chartered Financial Analyst® are trademarks owned by CFA Institute. |
| * | Mr. Lim became a portfolio manager of the Fund on August 1, 2019. |
| 1 | Reflects the expense ratios as stated in the most recent prospectuses, which include the impact of 0.01% in acquired fund fees and expenses. The expense ratios shown are subject to change and may differ from the annualized expense ratios shown in the financial highlights of this report, which do not include acquired fund fees and expenses. |
| 2 | The manager has contractually committed through January 31, 2020, to waive fees and/or reimburse expenses to the extent necessary to cap the expenses of each class after fee waivers at 1.25% for Class A, 2.00% for Class C, 0.80% for Class R6, 1.15% for Administrator Class, and 0.90% for Institutional Class. Brokerage commissions, stamp duty fees, interest, taxes, acquired fund fees and expenses (if any), and extraordinary expenses are excluded from the expense cap. Prior to or after the commitment expiration date, the cap may be increased or the commitment to maintain the cap may be terminated only with the approval of the Board of Trustees. Without this cap, the Fund’s returns would have been lower. The expense ratio paid by an investor is the net expense ratio (the total annual fund operating expenses after fee waivers) as stated in the prospectuses. |
| 3 | Historical performance shown for the Class R6 shares prior to their inception reflects the performance of the Institutional Class shares, and includes the higher expenses applicable to Institutional Class shares. If these expenses had not been included, returns for Class R6 shares would be higher. |
| 4 | The Russell Midcap® Value Index measures the performance of those Russell Midcap companies with lower price/book ratios and lower forecasted growth values. The stocks are also members of the Russell 1000® Value Index. You cannot invest directly in an index. |
| 5 | The chart compares the performance of Class A shares for the most recent ten years with the Russell Midcap® Value Index. The chart assumes a hypothetical investment of $10,000 in Class A shares and reflects all operating expenses and assumes the maximum initial sales charge of 5.75%. |
| 6 | The ten largest holdings, excluding cash, cash equivalents and any money market funds, are calculated based on the value of the investments divided by total net assets of the Fund. Holdings are subject to change and may have changed since the date specified. |
| 7 | Amounts are calculated based on the total long-term investments of the Fund. These amounts are subject to change and may have changed since the date specified. |
Wells Fargo C&B Mid Cap Value Fund | 7
Performance highlights (unaudited)
MANAGER’S DISCUSSION
Fund highlights
| ∎ | | The Fund outperformed its benchmark, the Russell Midcap® Value Index, for the 12-month period that ended September 30, 2019. |
| ∎ | | Stock selection accounted for most of the Fund’s outperformance. Top contributors to performance were Crown Holdings, Incorporated; Arch Capital Group Limited; and Hexcel Corporation. The Fund’s underweight to energy was also a significant contributor. |
| ∎ | | MEDNAX, Incorporated; Alliance Data Systems Corporation; and PRA Group, Incorporated, were the largest detractors from performance. The Fund’s underweights to the high-yielding utilities and real estate sectors also caused a significant drag on returns. |
Overview
The past year has been a bumpy ride for markets, though general sentiment seemed more tempestuous than its point-to-point return would indicate. Continuous geopolitical events including prolonged trade wars, a disrupted global oil supply, renewed and amplified appeals for U.S. presidential impeachment, and multiple U.S. Federal Reserve (Fed) rate cuts caused short-term market disruptions despite underlying fundamentals remaining mostly positive. This choppiness was punctuated by September’s significant rotation toward value and away from growth and momentum. We are confident that our long-term approach and disciplined focus on fundamentals, balance sheets, and valuations are well suited to profit both from the opportunities created by short-term volatility as well as the long-term compounding ability of high-quality businesses.
| | | | |
| |
| Ten largest holdings (%) as of September 30, 20196 | | | |
| | |
Helen of Troy Limited | | | 3.23 | |
| | |
Arrow Electronics Incorporated | | | 3.21 | |
| | |
Fidelity National Financial Incorporated | | | 3.04 | |
| | |
American Eagle Outfitters Incorporated | | | 3.01 | |
| | |
Colfax Corporation | | | 3.01 | |
| | |
AerCap Holdings NV | | | 2.90 | |
| | |
TCF Financial Corporation | | | 2.86 | |
| | |
Reliance Steel & Aluminum Company | | | 2.68 | |
| | |
State Street Corporation | | | 2.66 | |
| | |
Syneos Health Incorporated | | | 2.52 | |
Fund updates
We continue to find compelling opportunities for the Fund as market disruptions create pockets of valuation weakness despite strong fundamentals. We initiated positions across multiple industries, including video game developer Activision Blizzard, Incorporated; young-adult retailer American Eagle Outfitters, Incorporated; four industrial companies—Acuity Brands, Incorporated; BWX Technologies, Incorporated; Gates Industrial Corporation plc; and Hexcel Corporation—hospital bed provider Hill-Rom Holdings, Incorporated; and three information technology (IT) companies—Leidos Holdings, Incorporated; Applied Materials, Incorporated; and MKS Instruments, Incorporated.
In order to make room for these holdings, we eliminated three financial companies—Markel Corporation; PRA Group, Incorporated; and RenaissanceRe Holdings Limited—two IT companies—Analog Devices, Incorporated, and Genpact Limited—materials company Ball Corporation; health care firm Cardinal Health, Incorporated; industrials company Quanex Building Products Corporation; consumer staples firm United Natural Foods, Incorporated; and energy company World Fuel Services Corporation.
Please see footnotes on page 7.
8 | Wells Fargo C&B Mid Cap Value Fund
Performance highlights (unaudited)
|
|
| Sector distribution as of September 30, 20197 |
|
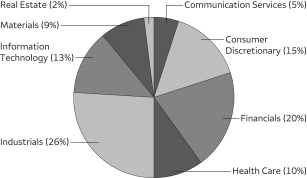 |
The five largest contributors to the Fund’s return were balanced across four sectors, led by manufacturer Crown Holdings.
Crown Holdings, the leading manufacturer of beverage, food, and aerosol cans, recovered from weak results in 2018 by reporting strong free cash flow generation in the beginning of 2019, bolstering positive investor sentiment, and contributing the most to the Fund. Insurer Arch Capital has seen improved investor sentiment, which has led to a re-rating over the past year, and industrials company Hexcel has benefited from solid earnings and growing end markets. Consumer discretionary companies Whirlpool Corporation and Gildan Activewear Incorporated were the fourth- and
fifth-largest contributors, respectively. From a positioning standpoint, the Fund benefited significantly from its underweight to energy, which had a staggering -36.99% return for the trailing 12 months, and gained from overweights to industrials and IT.
The Fund’s five largest detractors were also from four sectors, with health care company MEDNAX having the most negative impact.
MEDNAX, operator of neonatology, anesthesiology, and radiology physician practices, was the largest detractor over the trailing 12 months. The company has continued to face wages and benefits inflation that has outpaced its revenue growth. MEDNAX management’s increasingly comprehensive approach to stabilizing profitability will take time to play out. Marketing solutions company Alliance Data Systems disappointed investors with its inability to properly monetize the sale of its Epsilon business unit. Financials company PRA Group struggled to leverage its additional investments in collections capabilities and was ultimately eliminated from the Fund. State Street Corporation and Gates Industrial Corporation were the fourth- and fifth-largest detractors, respectively. From a positioning standpoint, the Fund’s underweights to utilities and real estate were significant headwinds.
Outlook
The stock market entered the fourth quarter with major indices up double digits for the year but facing a clearly slowing economy and a well-known, though concerning, list of geopolitical risks. The Fed has signaled its intent to cushion any shocks, but low global interest rates and years of quantitative easing raise questions as to how helpful it can be. With valuations less supportive than they were entering the year, conditions seem likely to get bumpy, although we would not underestimate the market’s ability to climb the wall of worry. Regardless of the exact path the markets take, we have learned we can rely on them to be more volatile than their underlying fundamentals—a backdrop conducive to idea generation. As always, our focus is on identifying businesses at compelling valuations that generate attractive fundamental returns for our shareholders, often by taking advantage of others’ impatience.
Please see footnotes on page 7.
Wells Fargo C&B Mid Cap Value Fund | 9
Fund expenses (unaudited)
As a shareholder of the Fund, you incur two types of costs: (1) transaction costs, including sales charges (loads) on purchase payments and contingent deferred sales charges (if any) on redemptions and (2) ongoing costs, including management fees, distribution (12b-1) and/or shareholder servicing fees, and other Fund expenses. This example is intended to help you understand your ongoing costs (in dollars) of investing in the Fund and to compare these costs with the ongoing costs of investing in other mutual funds.
The example is based on an investment of $1,000 invested at the beginning of the six-month period and held for the entire period from April 1, 2019 to September 30, 2019.
Actual expenses
The “Actual” line of the table below provides information about actual account values and actual expenses. You may use the information in this line, together with the amount you invested, to estimate the expenses that you paid over the period. Simply divide your account value by $1,000 (for example, an $8,600 account value divided by $1,000 = 8.6), then multiply the result by the number in the “Actual” line under the heading entitled “Expenses paid during period” for your applicable class of shares to estimate the expenses you paid on your account during this period.
Hypothetical example for comparison purposes
The “Hypothetical” line of the table below provides information about hypothetical account values and hypothetical expenses based on the Fund’s actual expense ratio and an assumed rate of return of 5% per year before expenses, which is not the Fund’s actual return. The hypothetical account values and expenses may not be used to estimate the actual ending account balance or expenses you paid for the period. You may use this information to compare the ongoing costs of investing in the Fund and other funds. To do so, compare this 5% hypothetical example with the 5% hypothetical examples that appear in the shareholder reports of the other funds.
Please note that the expenses shown in the table are meant to highlight your ongoing costs only and do not reflect any transactional costs, such as sales charges (loads) and contingent deferred sales charges. Therefore, the “Hypothetical” line of the table is useful in comparing ongoing costs only and will not help you determine the relative total costs of owning different funds. In addition, if these transactional costs were included, your costs would have been higher.
| | | | | | | | | | | | | | | | |
| | | Beginning
account value
4-1-2019 | | | Ending
account value
9-30-2019 | | | Expenses
paid during
the period¹ | | | Annualized net
expense ratio | |
| | | | | |
Class A | | | | | | | | | | | | | | | | |
| | | | |
Actual | | $ | 1,000.00 | | | $ | 1,088.04 | | | $ | 6.56 | | | | 1.25 | % |
| | | | |
Hypothetical (5% return before expenses) | | $ | 1,000.00 | | | $ | 1,018.79 | | | $ | 6.34 | | | | 1.25 | % |
| | | | | |
Class C | | | | | | | | | | | | | | | | |
| | | | |
Actual | | $ | 1,000.00 | | | $ | 1,084.14 | | | $ | 10.47 | | | | 2.00 | % |
| | | | |
Hypothetical (5% return before expenses) | | $ | 1,000.00 | | | $ | 1,015.02 | | | $ | 10.12 | | | | 2.00 | % |
| | | | | |
Class R6 | | | | | | | | | | | | | | | | |
| | | | |
Actual | | $ | 1,000.00 | | | $ | 1,090.66 | | | $ | 4.20 | | | | 0.80 | % |
| | | | |
Hypothetical (5% return before expenses) | | $ | 1,000.00 | | | $ | 1,021.05 | | | $ | 4.06 | | | | 0.80 | % |
| | | | | |
Administrator Class | | | | | | | | | | | | | | | | |
| | | | |
Actual | | $ | 1,000.00 | | | $ | 1,088.69 | | | $ | 6.04 | | | | 1.15 | % |
| | | | |
Hypothetical (5% return before expenses) | | $ | 1,000.00 | | | $ | 1,019.29 | | | $ | 5.84 | | | | 1.15 | % |
| | | | | |
Institutional Class | | | | | | | | | | | | | | | | |
| | | | |
Actual | | $ | 1,000.00 | | | $ | 1,090.12 | | | $ | 4.73 | | | | 0.90 | % |
| | | | |
Hypothetical (5% return before expenses) | | $ | 1,000.00 | | | $ | 1,020.54 | | | $ | 4.57 | | | | 0.90 | % |
| 1 | Expenses paid is equal to the annualized net expense ratio of each class multiplied by the average account value over the period, multiplied by the number of days in the most recent fiscal half-year divided by the number of days in the fiscal year (to reflect the one-half-year period). |
10 | Wells Fargo C&B Mid Cap Value Fund
Portfolio of investments—September 30, 2019
| | | | | | | | | | | | | | | | |
| | | | | | | | | Shares | | | Value | |
Common Stocks: 95.87% | | | | | | | | | | | | | | | | |
| | | | |
Communication Services: 4.30% | | | | | | | | | | | | | | | | |
| | | | |
| Entertainment: 1.95% | | | | | | | | | | | | |
Activision Blizzard Incorporated | | | | | | | | | | | 146,900 | | | $ | 7,773,948 | |
| | | | | | | | | | | | | | | | |
| | | | |
| Media: 2.35% | | | | | | | | | | | | |
Omnicom Group Incorporated | | | | | | | | | | | 119,100 | | | | 9,325,530 | |
| | | | | | | | | | | | | | | | |
| | | | |
Consumer Discretionary: 14.57% | | | | | | | | | | | | | | | | |
| | | | |
| Hotels, Restaurants & Leisure: 0.71% | | | | | | | | | | | | |
Extended Stay America Incorporated | | | | | | | | | | | 191,100 | | | | 2,797,704 | |
| | | | | | | | | | | | | | | | |
| | | | |
| Household Durables: 5.03% | | | | | | | | | | | | |
Helen of Troy Limited † | | | | | | | | | | | 81,300 | | | | 12,817,757 | |
Whirlpool Corporation | | | | | | | | | | | 45,300 | | | | 7,173,708 | |
| |
| | | | 19,991,465 | |
| | | | | | | | | | | | | | | | |
| | | | |
| Specialty Retail: 4.70% | | | | | | | | | | | | |
American Eagle Outfitters Incorporated | | | | | | | | | | | 738,670 | | | | 11,981,227 | |
Williams-Sonoma Incorporated « | | | | | | | | | | | 98,600 | | | | 6,702,828 | |
| |
| | | | 18,684,055 | |
| | | | | | | | | | | | | | | | |
| | | | |
| Textiles, Apparel & Luxury Goods: 4.13% | | | | | | | | | | | | |
Gildan Activewear Incorporated | | | | | | | | | | | 271,100 | | | | 9,624,050 | |
HanesBrands Incorporated | | | | | | | | | | | 443,500 | | | | 6,794,420 | |
| |
| | | | 16,418,470 | |
| | | | | | | | | | | | | | | | |
| | | | |
Financials: 19.26% | | | | | | | | | | | | | | | | |
| | | | |
| Banks: 4.77% | | | | | | | | | | | | |
Commerce Bancshares Incorporated | | | | | | | | | | | 125,605 | | | | 7,617,943 | |
TCF Financial Corporation | | | | | | | | | | | 298,313 | | | | 11,356,776 | |
| |
| | | | 18,974,719 | |
| | | | | | | | | | | | | | | | |
| | | | |
| Capital Markets: 2.66% | | | | | | | | | | | | |
State Street Corporation | | | | | | | | | | | 178,500 | | | | 10,565,415 | |
| | | | | | | | | | | | | | | | |
| | | | |
| Consumer Finance: 3.76% | | | | | | | | | | | | |
FirstCash Financial Services Incorporated | | | | | | | | | | | 56,140 | | | | 5,146,354 | |
Synchrony Financial | | | | | | | | | | | 287,000 | | | | 9,783,830 | |
| |
| | | | 14,930,184 | |
| | | | | | | | | | | | | | | | |
| | | | |
| Insurance: 8.07% | | | | | | | | | | | | |
Arch Capital Group Limited † | | | | | | | | | | | 194,300 | | | | 8,156,714 | |
Fidelity National Financial Incorporated | | | | | | | | | | | 272,400 | | | | 12,097,284 | |
Globe Life Incorporated | | | | | | | | | | | 87,200 | | | | 8,350,272 | |
The Progressive Corporation | | | | | | | | | | | 44,600 | | | | 3,445,350 | |
| |
| | | | 32,049,620 | |
| | | | | | | | | | | | | | | | |
| | | | |
Health Care: 9.95% | | | | | | | | | | | | | | | | |
| | | | |
| Health Care Equipment & Supplies: 1.60% | | | | | | | | | | | | |
Hill-Rom Holdings Incorporated | | | | | | | | | | | 60,400 | | | | 6,355,892 | |
| | | | | | | | | | | | | | | | |
Wells Fargo C&B Mid Cap Value Fund | 11
Portfolio of investments—September 30, 2019
| | | | | | | | | | | | | | | | |
| | | | | | | | | Shares | | | Value | |
| Health Care Providers & Services: 3.80% | | | | | | | | | | | | |
Laboratory Corporation of America Holdings † | | | | | | | | | | | 55,100 | | | $ | 9,256,800 | |
MEDNAX Incorporated † | | | | | | | | | | | 257,800 | | | | 5,831,436 | |
| |
| | | | 15,088,236 | |
| | | | | | | | | | | | | | | | |
| | | | |
| Life Sciences Tools & Services: 2.52% | | | | | | | | | | | | |
Syneos Health Incorporated † | | | | | | | | | | | 188,200 | | | | 10,014,122 | |
| | | | | | | | | | | | | | | | |
| | | | |
| Pharmaceuticals: 2.03% | | | | | | | | | | | | |
Perrigo Company plc | | | | | | | | | | | 144,700 | | | | 8,087,283 | |
| | | | | | | | | | | | | | | | |
| | | | |
Industrials: 25.08% | | | | | | | | | | | | | | | | |
| | | | |
| Aerospace & Defense: 3.98% | | | | | | | | | | | | |
BWX Technologies Incorporated | | | | | | | | | | | 139,500 | | | | 7,980,795 | |
Hexcel Corporation | | | | | | | | | | | 95,400 | | | | 7,835,202 | |
| |
| | | | 15,815,997 | |
| | | | | | | | | | | | | | | | |
| | | | |
| Building Products: 1.25% | | | | | | | | | | | | |
Johnson Controls International plc | | | | | | | | | | | 113,300 | | | | 4,972,737 | |
| | | | | | | | | | | | | | | | |
| | | | |
| Commercial Services & Supplies: 1.83% | | | | | | | | | | | | |
Steelcase Incorporated Class A | | | | | | | | | | | 396,200 | | | | 7,290,080 | |
| | | | | | | | | | | | | | | | |
| | | | |
| Electrical Equipment: 5.33% | | | | | | | | | | | | |
Acuity Brands Incorporated | | | | | | | | | | | 30,450 | | | | 4,104,356 | |
AMETEK Incorporated | | | | | | | | | | | 87,600 | | | | 8,043,432 | |
Eaton Corporation plc | | | | | | | | | | | 108,400 | | | | 9,013,460 | |
| |
| | | | 21,161,248 | |
| | | | | | | | | | | | | | | | |
| | | | |
| Machinery: 9.79% | | | | | | | | | | | | |
Colfax Corporation † | | | | | | | | | | | 411,300 | | | | 11,952,378 | |
Donaldson Company Incorporated | | | | | | | | | | | 127,900 | | | | 6,661,032 | |
Gates Industrial Corporation plc † | | | | | | | | | | | 538,300 | | | | 5,420,681 | |
Snap-on Incorporated | | | | | | | | | | | 52,500 | | | | 8,218,350 | |
Woodward Governor Company | | | | | | | | | | | 61,700 | | | | 6,653,111 | |
| |
| | | | 38,905,552 | |
| | | | | | | | | | | | | | | | |
| | | | |
| Trading Companies & Distributors: 2.90% | | | | | | | | | | | | |
AerCap Holdings NV † | | | | | | | | | | | 210,600 | | | | 11,530,350 | |
| | | | | | | | | | | | | | | | |
| | | | |
Information Technology: 12.09% | | | | | | | | | | | | | | | | |
| | | | |
| Electronic Equipment, Instruments & Components: 5.18% | | | | | | | | | | | | |
Arrow Electronics Incorporated † | | | | | | | | | | | 170,800 | | | | 12,738,264 | |
TE Connectivity Limited | | | | | | | | | | | 84,400 | | | | 7,864,392 | |
| |
| | | | 20,602,656 | |
| | | | | | | | | | | | | | | | |
| | | | |
| IT Services: 4.22% | | | | | | | | | | | | |
Alliance Data Systems Corporation | | | | | | | | | | | 25,100 | | | | 3,216,063 | |
Amdocs Limited | | | | | | | | | | | 147,900 | | | | 9,777,669 | |
Leidos Holdings Incorporated | | | | | | | | | | | 44,000 | | | | 3,778,720 | |
| |
| | | | 16,772,452 | |
| | | | | | | | | | | | | | | | |
| | | | |
| Semiconductors & Semiconductor Equipment: 2.69% | | | | | | | | | | | | |
Applied Materials Incorporated | | | | | | | | | | | 74,800 | | | | 3,732,520 | |
MKS Instruments Incorporated | | | | 75,200 | | | | 6,939,456 | |
| |
| | | | 10,671,976 | |
| | | | | | | | | | | | | | | | |
12 | Wells Fargo C&B Mid Cap Value Fund
Portfolio of investments—September 30, 2019
| | | | | | | | | | | | | | | | |
| | | | | | | | | Shares | | | Value | |
Materials: 8.70% | | | | | | | | | | | | | | | | |
| | | | |
| Chemicals: 1.55% | | | | | | | | | | | | |
Axalta Coating Systems Limited † | | | | 204,400 | | | $ | 6,162,660 | |
| | | | | | | | | | | | | | | | |
| | | | |
| Containers & Packaging: 2.45% | | | | | | | | | | | | |
Crown Holdings Incorporated † | | | | 147,700 | | | | 9,757,062 | |
| | | | | | | | | | | | | | | | |
| | | | |
| Metals & Mining: 2.68% | | | | | | | | | | | | |
Reliance Steel & Aluminum Company | | | | 106,800 | | | | 10,643,688 | |
| | | | | | | | | | | | | | | | |
| | | | |
| Paper & Forest Products: 2.02% | | | | | | | | | | | | |
Schweitzer-Mauduit International Incorporated | | | | 214,415 | | | | 8,027,698 | |
| | | | | | | | | | | | | | | | |
| | | | |
Real Estate: 1.92% | | | | | | | | | | | | | | | | |
| | | | |
| Real Estate Management & Development: 1.92% | | | | | | | | | | | | |
CBRE Group Incorporated Class A † | | | | 143,800 | | | | 7,622,838 | |
| | | | | | | | | | | | | | | | |
| |
Total Common Stocks (Cost $322,873,286) | | | | 380,993,637 | |
| | | | | | | | | | | | | | | | |
| | | | |
| | | | | | | | | | | | | | | | |
| | | Yield | | | | | | | | | | |
| | | | |
Short-Term Investments: 5.83% | | | | | | | | | | | | | | | | |
| | | | |
| Investment Companies: 5.83% | | | | | | | | | | | | |
Securities Lending Cash Investments LLC (l)(r)(u) | | | 2.11 | % | | | | | | | 5,733,177 | | | | 5,733,750 | |
Wells Fargo Government Money Market Fund Select Class (l)(u) | | | 1.88 | | | | | | | | 17,446,499 | | | | 17,446,499 | |
| |
Total Short-Term Investments (Cost $23,180,249) | | | | 23,180,249 | |
| | | | | | | | | | | | | | | | |
| | | | | | | | |
| Total investments in securities (Cost $346,053,535) | | | 101.70 | % | | | 404,173,886 | |
| | |
Other assets and liabilities, net | | | (1.70 | ) | | | (6,756,750 | ) |
| | | | | | | | |
| Total net assets | | | 100.00 | % | | $ | 397,417,136 | |
| | | | | | | | |
| † | Non-income-earning security |
| « | All or a portion of this security is on loan. |
| (l) | The issuer of the security is an affiliated person of the Fund as defined in the Investment Company Act of 1940. |
| (r) | The investment is a non-registered investment company purchased with cash collateral received from securities on loan. |
| (u) | The rate represents the 7-day annualized yield at period end. |
Wells Fargo C&B Mid Cap Value Fund | 13
Portfolio of investments—September 30, 2019
Investments in Affiliates
An affiliated investment is an investment in which the Fund owns at least 5% of the outstanding voting shares of the issuer or as a result of other relationships, such as the Fund and the issuer having the same investment manager. Transactions with issuers that were either affiliated persons of the Fund at the beginning of the period or the end of the period were as follows:
| | | | | | | | | | | | | | | | | | | | | | | | | | | | | | | | | | | | |
| | | Shares,
beginning of
period | | | Shares
purchased | | | Shares
sold | | | Shares,
end of
period | | | Net
realized
gains
(losses) | | | Net
change in
unrealized
gains
(losses) | | | Income
from
affiliated
securities | | | Value,
end of
period | | | % of
net
assets | |
| | | | | | | | | |
| Short-Term Investments | | | | | | | | | | | | | | | | | | | | | | | | | | | |
Investment Companies | | | | | | | | | | | | | | | | | | | | | | | | | | | | | | | | | | | | |
Securities Lending Cash Investments LLC | | | 14,621,190 | | | | 65,880,768 | | | | 74,768,781 | | | | 5,733,177 | | | $ | 588 | | | $ | (239 | ) | | $ | 119,161 | # | | $ | 5,733,750 | | | | | |
Wells Fargo Government Money Market Fund Select Class | | | 21,485,564 | | | | 138,029,964 | | | | 142,069,029 | | | | 17,446,499 | | | | 0 | | | | 0 | | | | 353,976 | | | | 17,446,499 | | | | | |
| | | | | | | | | | | | | | | | | | | | | | | | | | | | | | | | | | | | |
| | | | | | | | | |
| | | | | | | | | | | | | | | | | | $ | 588 | | | $ | (239 | ) | | $ | 473,137 | | | $ | 23,180,249 | | | | 5.83 | % |
| | | | | | | | | | | | | | | | | | | | | | | | | | | | | | | | | | | | |
| # | Amount shown represents income before fees and rebates. |
The accompanying notes are an integral part of these financial statements.
14 | Wells Fargo C&B Mid Cap Value Fund
Statement of assets and liabilities—September 30, 2019
| | | | |
| | | | |
| |
Assets | | | | |
Investments in unaffiliated securities (including $5,608,350 of securities loaned), at value (cost $322,873,286) | | $ | 380,993,637 | |
Investments in affiliated securities, at value (cost $23,180,249) | | | 23,180,249 | |
Receivable for Fund shares sold | | | 2,413,393 | |
Receivable for dividends | | | 343,137 | |
Receivable for securities lending income, net | | | 1,688 | |
Prepaid expenses and other assets | | | 69,966 | |
| | | | |
Total assets | | | 407,002,070 | |
| | | | |
| |
Liabilities | | | | |
Payable upon receipt of securities loaned | | | 5,732,549 | |
Payable for investments purchased | | | 3,174,666 | |
Payable for Fund shares redeemed | | | 323,644 | |
Management fee payable | | | 226,804 | |
Administration fees payable | | | 47,650 | |
Distribution fee payable | | | 2,827 | |
Trustees’ fees and expenses payable | | | 2,215 | |
Accrued expenses and other liabilities | | | 74,579 | |
| | | | |
Total liabilities | | | 9,584,934 | |
| | | | |
Total net assets | | $ | 397,417,136 | |
| | | | |
| |
Net assets consist of | | | | |
Paid-in capital | | $ | 329,023,870 | |
Total distributable earnings | | | 68,393,266 | |
| | | | |
Total net assets | | $ | 397,417,136 | |
| | | | |
| |
Computation of net asset value and offering price per share | | | | |
Net assets – Class A | | $ | 106,975,155 | |
Shares outstanding – Class A1 | | | 2,696,381 | |
Net asset value per share – Class A | | | $39.67 | |
Maximum offering price per share – Class A2 | | | $42.09 | |
Net assets – Class C | | $ | 4,591,721 | |
Shares outstanding – Class C1 | | | 124,179 | |
Net asset value per share – Class C | | | $36.98 | |
Net assets – Class R6 | | $ | 15,112,037 | |
Shares outstanding – Class R61 | | | 377,253 | |
Net asset value per share – Class R6 | | | $40.06 | |
Net assets – Administrator Class | | $ | 24,036,486 | |
Shares outstanding – Administrator Class1 | | | 598,786 | |
Net asset value per share – Administrator Class | | | $40.14 | |
Net assets – Institutional Class | | $ | 246,701,737 | |
Shares outstanding – Institutional Class1 | | | 6,161,966 | |
Net asset value per share – Institutional Class | | | $40.04 | |
| 1 | The Fund has an unlimited number of authorized shares. |
| 2 | Maximum offering price is computed as 100/94.25 of net asset value. On investments of $50,000 or more, the offering price is reduced. |
The accompanying notes are an integral part of these financial statements.
Wells Fargo C&B Mid Cap Value Fund | 15
Statement of operations—year ended September 30, 2019
| | | | |
| | | | |
| |
Investment income | | | | |
Dividends (net of foreign withholding taxes of $20,833) | | $ | 5,318,108 | |
Income from affiliated securities | | | 368,239 | |
| | | | |
Total investment income | | | 5,686,347 | |
| | | | |
| |
Expenses | | | | |
Management fee | | | 2,522,013 | |
Administration fees | | | | |
Class A | | | 212,032 | |
Class C | | | 12,097 | |
Class R6 | | | 3,308 | |
Administrator Class | | | 25,761 | |
Institutional Class | | | 258,308 | |
Shareholder servicing fees | | | | |
Class A | | | 252,419 | |
Class C | | | 14,401 | |
Administrator Class | | | 49,540 | |
Distribution fee | | | | |
Class C | | | 43,085 | |
Custody and accounting fees | | | 21,535 | |
Professional fees | | | 39,942 | |
Registration fees | | | 100,233 | |
Shareholder report expenses | | | 61,669 | |
Trustees’ fees and expenses | | | 21,652 | |
Other fees and expenses | | | 17,024 | |
| | | | |
Total expenses | | | 3,655,019 | |
Less: Fee waivers and/or expense reimbursements | | | | |
Fund-level | | | (127,489 | ) |
Class C | | | (1 | ) |
Class R6 | | | (2,083 | ) |
Administrator Class | | | (3,965 | ) |
Institutional Class | | | (40,183 | ) |
| | | | |
Net expenses | | | 3,481,298 | |
| | | | |
Net investment income | | | 2,205,049 | |
| | | | |
| |
Realized and unrealized gains (losses) on investments | | | | |
Net realized gains on | | | | |
Unaffiliated securities | | | 10,275,310 | |
Affiliated securities | | | 588 | |
| | | | |
Net realized gains on investments | | | 10,275,898 | |
| | | | |
| |
Net change in unrealized gains (losses) on | | | | |
Unaffiliated securities | | | 6,365,972 | |
Affiliated securities | | | (239 | ) |
| | | | |
Net change in unrealized gains (losses) on investments | | | 6,365,733 | |
| | | | |
Net realized and unrealized gains (losses) on investments | | | 16,641,631 | |
| | | | |
Net increase in net assets resulting from operations | | $ | 18,846,680 | |
| | | | |
The accompanying notes are an integral part of these financial statements.
16 | Wells Fargo C&B Mid Cap Value Fund
Statement of changes in net assets
| | | | | | | | | | | | | | | | |
| | | Year ended
September 30, 2019 | | | Year ended
September 30, 2018 | |
| | | | |
Operations | | | | | | | | | | | | | | | | |
Net investment income | | | | | | $ | 2,205,049 | | | | | | | $ | 972,703 | |
Net realized gains on investments | | | | | | | 10,275,898 | | | | | | | | 15,512,927 | |
Net change in unrealized gains (losses) on investments | | | | | | | 6,365,733 | | | | | | | | 7,326,810 | |
| | | | |
Net increase in net assets resulting from operations | | | | | | | 18,846,680 | | | | | | | | 23,812,440 | |
| | | | |
| | | |
Distributions to shareholders from net investment income and net realized gains | | | | | | | | | | | | | |
Class A | | | | | | | (159,086 | ) | | | | | | | (10,376 | ) |
Class R6 | | | | | | | (76,727 | ) | | | | | | | 0 | 1 |
Administrator Class | | | | | | | (60,977 | ) | | | | | | | (21,699 | ) |
Institutional Class | | | | | | | (1,010,122 | ) | | | | | | | (345,183 | ) |
| | | | |
Total distributions to shareholders | | | | | | | (1,306,912 | ) | | | | | | | (377,258 | ) |
| | | | |
| | | | |
Capital share transactions | | | Shares | | | | | | | | Shares | | | | | |
Proceeds from shares sold | | | | | | | | | | | | | | | | |
Class A | | | 316,284 | | | | 11,568,529 | | | | 304,664 | | | | 11,072,438 | |
Class C | | | 28,128 | | | | 897,999 | | | | 35,196 | | | | 1,207,072 | |
Class R6 | | | 475,263 | | | | 17,075,950 | | | | 669 | 1 | | | 25,000 | 1 |
Administrator Class | | | 200,859 | | | | 7,561,359 | | | | 398,153 | | | | 14,622,451 | |
Institutional Class | | | 3,096,014 | | | | 113,109,321 | | | | 4,171,649 | | | | 152,624,942 | |
| | | | |
| | | | | | | 150,213,158 | | | | | | | | 179,551,903 | |
| | | | |
Reinvestment of distributions | | | | | | | | | | | | | | | | |
Class A | | | 4,720 | | | | 154,816 | | | | 278 | | | | 10,143 | |
Class R6 | | | 995 | | | | 32,841 | | | | 0 | 1 | | | 0 | 1 |
Administrator Class | | | 1,590 | | | | 52,718 | | | | 473 | | | | 17,442 | |
Institutional Class | | | 30,350 | | | | 1,001,844 | | | | 8,408 | | | | 308,732 | |
| | | | |
| | | | | | | 1,242,219 | | | | | | | | 336,317 | |
| | | | |
Payment for shares redeemed | | | | | | | | | | | | | | | | |
Class A | | | (564,439 | ) | | | (20,529,618 | ) | | | (651,887 | ) | | | (23,945,939 | ) |
Class C | | | (139,702 | ) | | | (4,695,256 | ) | | | (58,143 | ) | | | (2,005,684 | ) |
Class R6 | | | (99,674 | ) | | | (3,641,646 | ) | | | 0 | 1 | | | 0 | 1 |
Administrator Class | | | (150,211 | ) | | | (5,462,836 | ) | | | (450,885 | ) | | | (16,245,676 | ) |
Institutional Class | | | (2,201,065 | ) | | | (78,294,383 | ) | | | (1,924,282 | ) | | | (70,722,538 | ) |
| | | | |
| | | | | | | (112,623,739 | ) | | | | | | | (112,919,837 | ) |
| | | | |
Net increase in net assets resulting from capital share transactions | | | | | | | 38,831,638 | | | | | | | | 66,968,383 | |
| | | | |
Total increase in net assets | | | | | | | 56,371,406 | | | | | | | | 90,403,565 | |
| | | | |
| | | | |
Net assets | | | | | | | | | | | | | | | | |
Beginning of period | | | | | | | 341,045,730 | | | | | | | | 250,642,165 | |
| | | | |
End of period | | | | | | $ | 397,417,136 | | | | | | | $ | 341,045,730 | |
| | | | |
| 1 | For the period from July 31, 2018 (commencement of class operations) to September 30, 2018 |
The accompanying notes are an integral part of these financial statements.
Wells Fargo C&B Mid Cap Value Fund | 17
Financial highlights
(For a share outstanding throughout each period)
| | | | | | | | | | | | | | | | | | | | |
| | | Year ended September 30 | |
| CLASS A | | 2019 | | | 2018 | | | 2017 | | | 2016 | | | 2015 | |
Net asset value, beginning of period | | | $37.88 | | | | $35.07 | | | | $29.27 | | | | $25.12 | | | | $25.26 | |
Net investment income (loss) | | | 0.16 | | | | 0.06 | | | | (0.00 | )1,2 | | | 0.07 | 1 | | | 0.05 | 1 |
Net realized and unrealized gains (losses) on investments | | | 1.69 | | | | 2.75 | | | | 5.82 | | | | 4.13 | | | | (0.14 | ) |
| | | | | | | | | | | | | | | | | | | | |
Total from investment operations | | | 1.85 | | | | 2.81 | | | | 5.82 | | | | 4.20 | | | | (0.09 | ) |
Distributions to shareholders from | | | | | | | | | | | | | | | | | | | | |
Net investment income | | | (0.06 | ) | | | (0.00 | )3 | | | (0.02 | ) | | | (0.05 | ) | | | (0.05 | ) |
Net asset value, end of period | | | $39.67 | | | | $37.88 | | | | $35.07 | | | | $29.27 | | | | $25.12 | |
Total return4 | | | 4.91 | % | | | 8.02 | % | | | 19.89 | % | | | 16.73 | % | | | (0.36 | )% |
Ratios to average net assets (annualized) | | | | | | | | | | | | | | | | | | | | |
Gross expenses | | | 1.29 | % | | | 1.29 | % | | | 1.30 | % | | | 1.33 | % | | | 1.35 | % |
Net expenses | | | 1.25 | % | | | 1.25 | % | | | 1.25 | % | | | 1.24 | % | | | 1.20 | % |
Net investment income (loss) | | | 0.43 | % | | | 0.16 | % | | | (0.00 | )% | | | 0.27 | % | | | 0.18 | % |
Supplemental data | | | | | | | | | | | | | | | | | | | | |
Portfolio turnover rate | | | 42 | % | | | 39 | % | | | 54 | % | | | 35 | % | | | 41 | % |
Net assets, end of period (000s omitted) | | | $106,975 | | | | $111,354 | | | | $115,258 | | | | $120,020 | | | | $19,862 | |
| 1 | Calculated based upon average shares outstanding |
| 2 | Amount is more than $(0.005). |
| 3 | Amount is less than $0.005. |
| 4 | Total return calculations do not include any sales charges. |
The accompanying notes are an integral part of these financial statements.
18 | Wells Fargo C&B Mid Cap Value Fund
Financial highlights
(For a share outstanding throughout each period)
| | | | | | | | | | | | | | | | | | | | |
| | | Year ended September 30 | |
| CLASS C | | 2019 | | | 2018 | | | 2017 | | | 2016 | | | 2015 | |
Net asset value, beginning of period | | | $35.51 | | | | $33.12 | | | | $27.83 | | | | $24.02 | | | | $24.29 | |
Net investment loss | | | (0.12 | )1 | | | (0.20 | )1 | | | (0.26 | ) | | | (0.14 | )1 | | | (0.15 | )1 |
Net realized and unrealized gains (losses) on investments | | | 1.59 | | | | 2.59 | | | | 5.55 | | | | 3.95 | | | | (0.12 | ) |
| | | | | | | | | | | | | | | | | | | | |
Total from investment operations | | | 1.47 | | | | 2.39 | | | | 5.29 | | | | 3.81 | | | | (0.27 | ) |
Net asset value, end of period | | | $36.98 | | | | $35.51 | | | | $33.12 | | | | $27.83 | | | | $24.02 | |
Total return2 | | | 4.14 | % | | | 7.22 | % | | | 19.01 | % | | | 15.86 | % | | | (1.11 | )% |
Ratios to average net assets (annualized) | | | | | | | | | | | | | | | | | | | | |
Gross expenses | | | 2.04 | % | | | 2.04 | % | | | 2.05 | % | | | 2.08 | % | | | 2.10 | % |
Net expenses | | | 2.00 | % | | | 2.00 | % | | | 2.00 | % | | | 1.98 | % | | | 1.95 | % |
Net investment loss | | | (0.36 | )% | | | (0.59 | )% | | | (0.74 | )% | | | (0.55 | )% | | | (0.57 | )% |
Supplemental data | | | | | | | | | | | | | | | | | | | | |
Portfolio turnover rate | | | 42 | % | | | 39 | % | | | 54 | % | | | 35 | % | | | 41 | % |
Net assets, end of period (000s omitted) | | | $4,592 | | | | $8,371 | | | | $8,567 | | | | $7,314 | | | | $6,737 | |
| 1 | Calculated based upon average shares outstanding |
| 2 | Total return calculations do not include any sales charges. |
The accompanying notes are an integral part of these financial statements.
Wells Fargo C&B Mid Cap Value Fund | 19
Financial highlights
(For a share outstanding throughout each period)
| | | | | | | | |
| | | Year ended September 30 | |
| CLASS R6 | | 2019 | | | 20181 | |
Net asset value, beginning of period | | | $38.27 | | | | $37.39 | |
Net investment income | | | 0.35 | 2 | | | 0.08 | 2 |
Net realized and unrealized gains (losses) on investments | | | 1.67 | | | | 0.80 | |
| | | | | | | | |
Total from investment operations | | | 2.02 | | | | 0.88 | |
Distributions to shareholders from | | | | | | | | |
Net investment income | | | (0.23 | ) | | | 0.00 | |
Net asset value, end of period | | | $40.06 | | | | $38.27 | |
Total return3 | | | 5.39 | % | | | 2.35 | % |
Ratios to average net assets (annualized) | | | | | | | | |
Gross expenses | | | 0.86 | % | | | 0.86 | % |
Net expenses | | | 0.80 | % | | | 0.80 | % |
Net investment income | | | 0.95 | % | | | 1.24 | % |
Supplemental data | | | | | | | | |
Portfolio turnover rate | | | 42 | % | | | 39 | % |
Net assets, end of period (000s omitted) | | | $15,112 | | | | $26 | |
| 1 | For the period from July 31, 2018 (commencement of class operations) to September 30, 2018 |
| 2 | Calculated based upon average shares outstanding |
| 3 | Returns for periods of less than one year are not annualized. |
The accompanying notes are an integral part of these financial statements.
20 | Wells Fargo C&B Mid Cap Value Fund
Financial highlights
(For a share outstanding throughout each period)
| | | | | | | | | | | | | | | | | | | | |
| | | Year ended September 30 | |
| ADMINISTRATOR CLASS | | 2019 | | | 2018 | | | 2017 | | | 2016 | | | 2015 | |
Net asset value, beginning of period | | | $38.35 | | | | $35.52 | | | | $29.63 | | | | $25.42 | | | | $25.54 | |
Net investment income | | | 0.20 | 1 | | | 0.10 | 1 | | | 0.04 | 1 | | | 0.08 | 1 | | | 0.06 | 1 |
Net realized and unrealized gains (losses) on investments | | | 1.70 | | | | 2.78 | | | | 5.89 | | | | 4.19 | | | | (0.13 | ) |
| | | | | | | | | | | | | | | | | | | | |
Total from investment operations | | | 1.90 | | | | 2.88 | | | | 5.93 | | | | 4.27 | | | | (0.07 | ) |
Distributions to shareholders from | | | | | | | | | | | | | | | | | | | | |
Net investment income | | | (0.11 | ) | | | (0.05 | ) | | | (0.04 | ) | | | (0.06 | ) | | | (0.05 | ) |
Net asset value, end of period | | | $40.14 | | | | $38.35 | | | | $35.52 | | | | $29.63 | | | | $25.42 | |
Total return | | | 5.03 | % | | | 8.13 | % | | | 20.02 | % | | | 16.82 | % | | | (0.30 | )% |
Ratios to average net assets (annualized) | | | | | | | | | | | | | | | | | | | | |
Gross expenses | | | 1.21 | % | | | 1.21 | % | | | 1.22 | % | | | 1.25 | % | | | 1.21 | % |
Net expenses | | | 1.15 | % | | | 1.15 | % | | | 1.15 | % | | | 1.15 | % | | | 1.15 | % |
Net investment income | | | 0.53 | % | | | 0.26 | % | | | 0.12 | % | | | 0.28 | % | | | 0.22 | % |
Supplemental data | | | | | | | | | | | | | | | | | | | | |
Portfolio turnover rate | | | 42 | % | | | 39 | % | | | 54 | % | | | 35 | % | | | 41 | % |
Net assets, end of period (000s omitted) | | | $24,036 | | | | $20,960 | | | | $21,267 | | | | $8,302 | | | | $9,725 | |
| 1 | Calculated based upon average shares outstanding |
The accompanying notes are an integral part of these financial statements.
Wells Fargo C&B Mid Cap Value Fund | 21
Financial highlights
(For a share outstanding throughout each period)
| | | | | | | | | | | | | | | | | | | | |
| | | Year ended September 30 | |
| INSTITUTIONAL CLASS | | 2019 | | | 2018 | | | 2017 | | | 2016 | | | 2015 | |
Net asset value, beginning of period | | | $38.26 | | | | $35.41 | | | | $29.53 | | | | $25.34 | | | | $25.49 | |
Net investment income | | | 0.28 | | | | 0.19 | | | | 0.16 | | | | 0.16 | | | | 0.10 | |
Net realized and unrealized gains (losses) on investments | | | 1.70 | | | | 2.78 | | | | 5.82 | | | | 4.17 | | | | (0.12 | ) |
| | | | | | | | | | | | | | | | | | | | |
Total from investment operations | | | 1.98 | | | | 2.97 | | | | 5.98 | | | | 4.33 | | | | (0.02 | ) |
Distributions to shareholders from | | | | | | | | | | | | | | | | | | | | |
Net investment income | | | (0.20 | ) | | | (0.12 | ) | | | (0.10 | ) | | | (0.14 | ) | | | (0.13 | ) |
Net asset value, end of period | | | $40.04 | | | | $38.26 | | | | $35.41 | | | | $29.53 | | | | $25.34 | |
Total return | | | 5.29 | % | | | 8.41 | % | | | 20.30 | % | | | 17.11 | % | | | (0.09 | )%1 |
Ratios to average net assets (annualized) | | | | | | | | | | | | | | | | | | | | |
Gross expenses | | | 0.96 | % | | | 0.96 | % | | | 0.97 | % | | | 1.00 | % | | | 0.94 | % |
Net expenses | | | 0.90 | % | | | 0.90 | % | | | 0.90 | % | | | 0.90 | % | | | 0.90 | % |
Net investment income | | | 0.79 | % | | | 0.56 | % | | | 0.37 | % | | | 0.54 | % | | | 0.47 | % |
Supplemental data | | | | | | | | | | | | | | | | | | | | |
Portfolio turnover rate | | | 42 | % | | | 39 | % | | | 54 | % | | | 35 | % | | | 41 | % |
Net assets, end of period (000s omitted) | | | $246,702 | | | | $200,335 | | | | $105,550 | | | | $38,161 | | | | $18,229 | |
| 1 | Total return reflects adjustments to conform with generally accepted accounting principles. |
The accompanying notes are an integral part of these financial statements.
22 | Wells Fargo C&B Mid Cap Value Fund
Notes to financial statements
1. ORGANIZATION
Wells Fargo Funds Trust (the “Trust”), a Delaware statutory trust organized on March 10, 1999, is an open-end management investment company registered under the Investment Company Act of 1940, as amended (the “1940 Act”). As an investment company, the Trust follows the accounting and reporting guidance in Financial Accounting Standards Board (“FASB”) Accounting Standards Codification Topic 946, Financial Services – Investment Companies. These financial statements report on the Wells Fargo C&B Mid Cap Value Fund (the “Fund”) which is a diversified series of the Trust.
2. SIGNIFICANT ACCOUNTING POLICIES
The following significant accounting policies, which are consistently followed in the preparation of the financial statements of the Fund, are in conformity with U.S. generally accepted accounting principles which require management to make estimates and assumptions that affect the reported amounts of assets and liabilities, disclosure of contingent assets and liabilities at the date of the financial statements, and the reported amounts of revenues and expenses during the reporting period. Actual results could differ from those estimates.
Securities valuation
All investments are valued each business day as of the close of regular trading on the New York Stock Exchange (generally 4 p.m. Eastern Time), although the Fund may deviate from this calculation time under unusual or unexpected circumstances.
Equity securities that are listed on a foreign or domestic exchange or market are valued at the official closing price or, if none, the last sales price. If no sale occurs on the principal exchange or market that day, a fair value price will be determined in accordance with the Fund’s Valuation Procedures.
Investments in registered open-end investment companies are valued at net asset value. Interests in non-registered investment companies that are redeemable at net asset value are fair valued normally at net asset value.
Investments which are not valued using any of the methods discussed above are valued at their fair value, as determined in good faith by the Board of Trustees of the Fund. The Board of Trustees has established a Valuation Committee comprised of the Trustees and has delegated to it the authority to take any actions regarding the valuation of portfolio securities that the Valuation Committee deems necessary or appropriate, including determining the fair value of portfolio securities, unless the determination has been delegated to the Wells Fargo Asset Management Pricing Committee at Wells Fargo Funds Management, LLC (“Funds Management”). The Board of Trustees retains the authority to make or ratify any valuation decisions or approve any changes to the Valuation Procedures as it deems appropriate. On a quarterly basis, the Board of Trustees receives reports on any valuation actions taken by the Valuation Committee or the Wells Fargo Asset Management Pricing Committee which may include items for ratification.
Securities lending
The Fund may lend its securities from time to time in order to earn additional income in the form of fees or interest on securities received as collateral or the investment of any cash received as collateral. When securities are on loan, the Fund receives interest or dividends on those securities. Cash collateral received in connection with its securities lending transactions is invested in Securities Lending Cash Investments, LLC (the “Securities Lending Fund”). Investments in Securities Lending Fund are valued at the evaluated bid price provided by an independent pricing service. Income earned from investment in the Securities Lending Fund (net of fees and rebates), if any, is included in income from affiliated securities on the Statement of Operations.
In a securities lending transaction, the net asset value of the Fund is affected by an increase or decrease in the value of the securities loaned and by an increase or decrease in the value of the instrument in which collateral is invested. The amount of securities lending activity undertaken by the Fund fluctuates from time to time. The Fund has the right under the lending agreement to recover the securities from the borrower on demand. In the event of default or bankruptcy by the borrower, the Fund may be prevented from recovering the loaned securities or gaining access to the collateral or may experience delays or costs in doing so. In such an event, the terms of the agreement allows the unaffiliated securities lending agent to use the collateral to purchase replacement securities on behalf of the Fund or pay the Fund the market value of the loaned securities. The Fund bears the risk of loss with respect to depreciation of its investment of the cash collateral.
Security transactions and income recognition
Securities transactions are recorded on a trade date basis. Realized gains or losses are recorded on the basis of identified cost.
Dividend income is recognized on the ex-dividend date. Dividend income is recorded net of foreign taxes withheld where recovery of such taxes is not assured.
Wells Fargo C&B Mid Cap Value Fund | 23
Notes to financial statements
Distributions to shareholders
Distributions to shareholders from net investment income and any net realized gains are recorded on the ex-dividend date and paid at least annually. Such distributions are determined in accordance with income tax regulations and may differ from U.S. generally accepted accounting principles. Dividend sources are estimated at the time of declaration. The tax character of distributions is determined as of the Fund’s fiscal year end. Therefore, a portion of the Fund’s distributions made prior to the Fund’s fiscal year end may be categorized as a tax return of capital at year end.
Federal and other taxes
The Fund intends to continue to qualify as a regulated investment company by distributing substantially all of its investment company taxable income and any net realized capital gains (after reduction for capital loss carryforwards) sufficient to relieve it from all, or substantially all, federal income taxes. Accordingly, no provision for federal income taxes was required.
The Fund’s income and federal excise tax returns and all financial records supporting those returns for the prior three fiscal years are subject to examination by the federal and Delaware revenue authorities. Management has analyzed the Fund’s tax positions taken on federal, state, and foreign tax returns for all open tax years and does not believe that there are any uncertain tax positions that require recognition of a tax liability.
As of September 30, 2019, the aggregate cost of all investments for federal income tax purposes was $348,545,266 and the unrealized gains (losses) consisted of:
| | | | |
| |
Gross unrealized gains | | $ | 69,092,602 | |
| |
Gross unrealized losses | | | (13,463,982 | ) |
| |
Net unrealized gains | | $ | 55,628,620 | |
Class allocations
The separate classes of shares offered by the Fund differ principally in applicable sales charges, distribution, shareholder servicing, and administration fees. Class specific expenses are charged directly to that share class. Investment income, common fund-level expenses, and realized and unrealized gains (losses) on investments are allocated daily to each class of shares based on the relative proportion of net assets of each class.
3. FAIR VALUATION MEASUREMENTS
Fair value measurements of investments are determined within a framework that has established a fair value hierarchy based upon the various data inputs utilized in determining the value of the Fund’s investments. The three-level hierarchy gives the highest priority to unadjusted quoted prices in active markets for identical assets or liabilities (Level 1) and the lowest priority to unobservable inputs (Level 3). The Fund’s investments are classified within the fair value hierarchy based on the lowest level of input that is significant to the fair value measurement. The inputs are summarized into three broad levels as follows:
| ∎ | | Level 1 – quoted prices in active markets for identical securities |
| ∎ | | Level 2 – other significant observable inputs (including quoted prices for similar securities, interest rates, prepayment speeds, credit risk, etc.) |
| ∎ | | Level 3 – significant unobservable inputs (including the Fund’s own assumptions in determining the fair value of investments) |
The inputs or methodologies used for valuing investments in securities are not necessarily an indication of the risk associated with investing in those securities.
24 | Wells Fargo C&B Mid Cap Value Fund
Notes to financial statements
The following is a summary of the inputs used in valuing the Fund’s assets and liabilities as of September 30, 2019:
| | | | | | | | | | | | | | | | |
| | | | |
| | | Quoted prices (Level 1) | | | Other significant observable inputs (Level 2) | | | Significant unobservable inputs (Level 3) | | | Total | |
| | | | |
Assets | | | | | | | | | | | | | | | | |
Investments in: | | | | | | | | | | | | | | | | |
| | | | |
Common stocks | | | | | | | | | | | | | | | | |
| | | | |
Communication services | | $ | 17,099,478 | | | $ | 0 | | | $ | 0 | | | $ | 17,099,478 | |
| | | | |
Consumer discretionary | | | 57,891,694 | | | | 0 | | | | 0 | | | | 57,891,694 | |
| | | | |
Financials | | | 76,519,938 | | | | 0 | | | | 0 | | | | 76,519,938 | |
| | | | |
Health care | | | 39,545,533 | | | | 0 | | | | 0 | | | | 39,545,533 | |
| | | | |
Industrials | | | 99,675,964 | | | | 0 | | | | 0 | | | | 99,675,964 | |
| | | | |
Information Technology | | | 48,047,084 | | | | 0 | | | | 0 | | | | 48,047,084 | |
| | | | |
Materials | | | 34,591,108 | | | | 0 | | | | 0 | | | | 34,591,108 | |
| | | | |
Real estate | | | 7,622,838 | | | | 0 | | | | 0 | | | | 7,622,838 | |
| | | | |
Short-term investments | | | | | | | | | | | | | | | | |
| | | | |
Investment companies | | | 23,180,249 | | | | 0 | | | | 0 | | | | 23,180,249 | |
| | | | |
Total assets | | $ | 404,173,886 | | | $ | 0 | | | $ | 0 | | | $ | 404,173,886 | |
Additional sector, industry or geographic detail is included in the Portfolio of Investments.
For the year ended September 30, 2019, the Fund did not have any transfers into/out of Level 3.
4. TRANSACTIONS WITH AFFILIATES AND OTHER EXPENSES
Management fee
Funds Management, an indirect wholly owned subsidiary of Wells Fargo & Company (“Wells Fargo”), is the manager of the Fund and provides advisory and fund-level administrative services under an investment management agreement. Under the investment management agreement, Funds Management is responsible for, among other services, implementing the investment objectives and strategies of the Fund, supervising the subadviser and providing fund-level administrative services in connection with the Fund’s operations. As compensation for its services under the investment management agreement, Funds Management is entitled to receive a management fee at the following annual rate based on the Fund’s average daily net assets:
| | | | |
| |
| Average daily net assets | | Management fee | |
| |
First $500 million | | | 0.750 | % |
| |
Next $500 million | | | 0.725 | |
| |
Next $1 billion | | | 0.700 | |
| |
Next $2 billion | | | 0.675 | |
| |
Next $1 billion | | | 0.650 | |
| |
Next $5 billion | | | 0.640 | |
| |
Next $2 billion | | | 0.630 | |
| |
Next $4 billion | | | 0.620 | |
| |
Over $16 billion | | | 0.610 | |
Wells Fargo C&B Mid Cap Value Fund | 25
Notes to financial statements
Prior to February 1, 2019, Funds Management received a management fee at the following annual rate based on the Fund’s average daily net assets:
| | | | |
| |
| Average daily net assets | | Management fee | |
| |
First $500 million | | | 0.750 | % |
| |
Next $500 million | | | 0.725 | |
| |
Next $1 billion | | | 0.700 | |
| |
Next $2 billion | | | 0.675 | |
| |
Next $1 billion | | | 0.650 | |
| |
Next $5 billion | | | 0.640 | |
| |
Over $10 billion | | | 0.630 | |
For the year ended September 30, 2019, the management fee was equivalent to an annual rate of 0.75% of the Fund’s average daily net assets.
Funds Management has retained the services of a subadviser to provide daily portfolio management to the Fund. The fee for subadvisory services is borne by Funds Management. Cooke & Bieler, L.P., which is not an affiliate of Funds Management, is the subadviser to the Fund and is entitled to receive a fee from Funds Management at an annual rate starting at 0.45% and declining to 0.35% as the average daily net assets of the Fund increase.
Administration fees
Under a class-level administration agreement, Funds Management provides class-level administrative services to the Fund, which includes paying fees and expenses for services provided by the transfer agent, sub-transfer agents, omnibus account servicers and record-keepers. As compensation for its services under the class-level administration agreement, Funds Management receives an annual fee which is calculated based on the average daily net assets of each class as follows:
| | | | |
| |
| | | Class-level administration fee | |
| |
Class A, Class C | | | 0.21 | % |
| |
Class R6 | | | 0.03 | |
| |
Administrator Class, Institutional Class | | | 0.13 | |
Waivers and/or expense reimbursements
Funds Management has contractually waived and/or reimbursed management and administration fees to the extent necessary to maintain certain net operating expense ratios for the Fund. When each class of the Fund has exceeded its expense cap, Funds Management has waived fees and/or reimbursed expenses from fund-level expenses on a proportionate basis and then from class specific expenses. When only certain classes exceed their expense caps, waivers and/or reimbursements are applied against class specific expenses before fund-level expenses. Funds Management has committed through January 31, 2020 to waive fees and/or reimburse expenses to the extent necessary to cap the Fund’s expenses at 1.25% for Class A shares, 2.00% for Class C shares, 0.80% for Class R6 shares, 1.15% for Administrator Class shares, and 0.90% for Institutional Class shares. Prior to or after the commitment expiration date, the cap may be increased or the commitment to maintain the cap may be terminated only with the approval of the Board of Trustees.
Distribution fee
The Trust has adopted a distribution plan for Class C shares of the Fund pursuant to Rule 12b-1 under the 1940 Act. A distribution fee is charged to Class C shares and paid to Wells Fargo Funds Distributor, LLC (“Funds Distributor”), the principal underwriter, at an annual rate of 0.75% of the average daily net assets of Class C shares.
In addition, Funds Distributor is entitled to receive the front-end sales charge from the purchase of Class A shares and a contingent deferred sales charge on the redemption of certain Class A shares. Funds Distributor is also entitled to receive the contingent deferred sales charges from redemptions of Class C shares. For the year ended September 30, 2019, Funds Distributor received $4,380 from the sale of Class A shares. No contingent deferred sales charges were incurred by Class A and Class C shares for the year ended September 30, 2019.
26 | Wells Fargo C&B Mid Cap Value Fund
Notes to financial statements
Shareholder servicing fees
The Trust has entered into contracts with one or more shareholder servicing agents, whereby Class A, Class C, and Administrator Class of the Fund are charged a fee at an annual rate of 0.25% of the average daily net assets of each respective class. A portion of these total shareholder servicing fees were paid to affiliates of Wells Fargo.
Interfund transactions
The Fund may purchase or sell portfolio investment securities to certain other Wells Fargo affiliates pursuant to Rule 17a-7 under the 1940 Act and under procedures adopted by the Board of Trustees. The procedures have been designed to ensure that these interfund transactions, which do not incur broker commissions, are effected at current market prices.
5. INVESTMENT PORTFOLIO TRANSACTIONS
Purchases and sales of investments, excluding U.S. government obligations (if any) and short-term securities, for the year ended September 30, 2019 were $179,827,379 and $136,042,449, respectively.
6. SECURITIES LENDING TRANSACTIONS
The Fund lends its securities through an unaffiliated securities lending agent and receives collateral in the form of cash or securities with a value at least equal to the value of the securities on loan. The value of the loaned securities is determined at the close of each business day and any increases or decreases in the required collateral are exchanged between the Fund and the counterparty on the next business day. Cash collateral received is invested in the Securities Lending Fund which seeks to provide a positive return compared to the daily Fed Funds Open Rate by investing in high-quality, U.S. dollar-denominated short-term money market instruments and is exempt from registration under Section 3(c)(7) of the 1940 Act. Securities Lending Fund is managed by Funds Management and is subadvised by Wells Capital Management Incorporated (“WellsCap”), an affiliate of Funds Management and an indirect wholly owned subsidiary of Wells Fargo. Funds Management receives an advisory fee starting at 0.05% and declining to 0.01% as the average daily net assets of the Securities Lending Fund increase. All of the fees received by Funds Management are paid to WellsCap for its services as subadviser.
In the event of counterparty default or the failure of a borrower to return a loaned security, the Fund has the right to use the collateral to offset any losses incurred. As of September 30, 2019, the Fund had securities lending transactions with the following counterparties which are subject to offset:
| | | | | | | | |
| | | |
| Counterparty | | Value of
securities
on loan | | Collateral
received1 | | Net amount | |
| | | |
Bank of America Securities Inc. | | $5,608,350 | | $(5,608,350) | | $ | 0 | |
| 1 | Collateral received within this table is limited to the collateral for the net transaction with the counterparty. |
7. BANK BORROWINGS
The Trust (excluding the money market funds), Wells Fargo Master Trust and Wells Fargo Variable Trust are parties to a $280,000,000 revolving credit agreement whereby the Fund is permitted to use bank borrowings for temporary or emergency purposes, such as to fund shareholder redemption requests. Interest under the credit agreement is charged to the Fund based on a borrowing rate equal to the higher of the Federal Funds rate in effect on that day plus 1.25% or the overnight LIBOR rate in effect on that day plus 1.25%. In addition, an annual commitment fee equal to 0.25% of the unused balance is allocated to each participating fund.
For the year ended September 30, 2019, there were no borrowings by the Fund under the agreement.
8. DISTRIBUTIONS TO SHAREHOLDERS
The tax character of distributions paid was $1,306,912 and $377,258 of ordinary income for the years ended September 30, 2019 and September 30, 2018, respectively.
As of September 30, 2019, the components of distributable earnings on a tax basis were as follows:
| | | | |
Undistributed ordinary income | | Undistributed long-term gain | | Unrealized gains |
| | |
| $4,579,110 | | $8,185,536 | | $55,628,620 |
Wells Fargo C&B Mid Cap Value Fund | 27
Notes to financial statements
9. CONCENTRATION RISK
Concentration risks result from exposure to a limited number of sectors. As of the end of the period, the Fund invests a concentration of its portfolio in the industrials sector. A fund that invests a substantial portion of its assets in any sector may be more affected by changes in that sector than would be a fund whose investments are not heavily weighted in any sector.
10. INDEMNIFICATION
Under the Trust’s organizational documents, the officers and Trustees have been granted certain indemnification rights against certain liabilities that may arise out of performance of their duties to the Trust. Additionally, in the normal course of business, the Trust may enter into contracts with service providers that contain a variety of indemnification clauses. The Trust’s maximum exposure under these arrangements is dependent on future claims that may be made against the Fund and, therefore, cannot be estimated.
11. NEW ACCOUNTING PRONOUNCEMENT
In August 2018, FASB issued Accounting Standards Update (“ASU”) No. 2018-13, Fair Value Measurement (Topic 820)Disclosure Framework—Changes to the Disclosure Requirements for Fair Value Measurement. ASU 2018-13 updates the disclosure requirements for fair value measurements by modifying or removing certain disclosures and adding certain new disclosures. The amendments are effective for fiscal years, and interim periods within those fiscal years, beginning after December 15, 2019. Early adoption is permitted. Management has adopted the removal and modification of disclosures early, as permitted, and will adopt the additional new disclosures at the effective date.
28 | Wells Fargo C&B Mid Cap Value Fund
Report of independent registered public accounting firm
TO THE SHAREHOLDERS OF THE FUND AND BOARD OF TRUSTEES OF WELLS FARGO FUNDS TRUST:
Opinion on the Financial Statements
We have audited the accompanying statement of assets and liabilities of Wells Fargo C&B Mid Cap Value Fund (the Fund), one of the funds constituting Wells Fargo Funds Trust, including the portfolio of investments, as of September 30, 2019, the related statement of operations for the year then ended, the statements of changes in net assets for each of the years in the two-year period then ended, and the related notes (collectively, the financial statements) and the financial highlights for each of the years or periods in the five-year period then ended. In our opinion, the financial statements and financial highlights present fairly, in all material respects, the financial position of the Fund as of September 30, 2019, the results of its operations for the year then ended, the changes in its net assets for each of the years in the two-year period then ended, and the financial highlights for each of the years or periods in the five-year period then ended, in conformity with U.S. generally accepted accounting principles.
Basis for Opinion
These financial statements and financial highlights are the responsibility of the Fund’s management. Our responsibility is to express an opinion on these financial statements and financial highlights based on our audits. We are a public accounting firm registered with the Public Company Accounting Oversight Board (United States) (PCAOB) and are required to be independent with respect to the Fund in accordance with the U.S. federal securities laws and the applicable rules and regulations of the Securities and Exchange Commission and the PCAOB.
We conducted our audits in accordance with the standards of the PCAOB. Those standards require that we plan and perform the audit to obtain reasonable assurance about whether the financial statements and financial highlights are free of material misstatement, whether due to error or fraud. Our audits included performing procedures to assess the risks of material misstatement of the financial statements and financial highlights, whether due to error or fraud, and performing procedures that respond to those risks. Such procedures included examining, on a test basis, evidence regarding the amounts and disclosures in the financial statements and financial highlights. Such procedures also included confirmation of securities owned as of September 30, 2019, by correspondence with the custodian, transfer agent and brokers, or by other appropriate auditing procedures. Our audits also included evaluating the accounting principles used and significant estimates made by management, as well as evaluating the overall presentation of the financial statements and financial highlights. We believe that our audits provide a reasonable basis for our opinion.

We have not been able to determine the specific year that we began serving as the auditor of one or more Wells Fargo Funds investment companies; however we are aware that we have served as the auditor of one or more Wells Fargo Funds investment companies since at least 1955.
Boston, Massachusetts
November 25, 2019
Wells Fargo C&B Mid Cap Value Fund | 29
Other information (unaudited)
TAX INFORMATION
For corporate shareholders, pursuant to Section 854 of the Internal Revenue Code, 92.62% of ordinary income dividends qualify for the corporate dividends-received deduction for the fiscal year ended September 30, 2019.
Pursuant to Section 854 of the Internal Revenue Code, $1,304,509 of income dividends paid during the fiscal year ended September 30, 2019 has been designated as qualified dividend income (QDI).
For the fiscal year ended September 30, 2019, $72,187 has been designated as interest-related dividends for nonresident alien shareholders pursuant to Section 871 of the Internal Revenue Code.
PROXY VOTING INFORMATION
A description of the policies and procedures used to determine how to vote proxies relating to portfolio securities is available, upon request, by calling1-800-222-8222, visiting our website atwfam.com, or visiting the SEC website at sec.gov. Information regarding how the proxies related to portfolio securities were voted during the most recent 12-month period ended June 30 is available on the website atwfam.comor by visiting the SEC website at sec.gov.
QUARTERLY PORTFOLIO HOLDINGS INFORMATION
The Fund files its complete schedule of portfolio holdings with the SEC for the first and third quarters of each fiscal year on Form N-Q or Form N-PORT, which is available by visiting the SEC website at sec.gov. Those forms may be reviewed and copied at the SEC’s Public Reference Room in Washington, DC. Information on the operation of the Public Reference Room may be obtained by calling 1-800-SEC-0330.
30 | Wells Fargo C&B Mid Cap Value Fund
Other information (unaudited)
BOARD OF TRUSTEES AND OFFICERS
Each of the Trustees and Officers1 listed in the table below acts in identical capacities for each fund in the Wells Fargo family of funds, which consists of 150 mutual funds comprising the Wells Fargo Funds Trust, Wells Fargo Variable Trust, Wells Fargo Master Trust and four closed-end funds (collectively the “Fund Complex”). This table should be read in conjunction with the Prospectus and the Statement of Additional Information2. The mailing address of each Trustee and Officer is 525 Market Street, 12th Floor, San Francisco, CA 94105. Each Trustee and Officer serves an indefinite term, however, each Trustee serves such term until reaching the mandatory retirement age established by the Trustees.
Independent Trustees
| | | | | | |
Name and year of birth | | Position held and length of service* | | Principal occupations during past five years or longer | | Current other
public company or
investment
company
directorships |
| | | |
William R. Ebsworth (Born 1957) | | Trustee, since 2015 | | Retired. From 1984 to 2013, equities analyst, portfolio manager, research director and chief investment officer at Fidelity Management and Research Company in Boston, Tokyo, and Hong Kong, and retired in 2013 as Chief Investment Officer of Fidelity Strategic Advisers, Inc. where he led a team of investment professionals managing client assets. Prior thereto, Board member of Hong Kong Securities Clearing Co., Hong Kong Options Clearing Corp., the Thailand International Fund, Ltd., Fidelity Investments Life Insurance Company, and Empire Fidelity Investments Life Insurance Company. Audit Committee Chair and Investment Committee Chair of the Vincent Memorial Hospital Endowment (non-profit organization). Mr. Ebsworth is a CFA® charterholder. | | N/A |
| | | |
Jane A. Freeman (Born 1953) | | Trustee, since 2015; Chair Liaison, since 2018 | | Retired. From 2012 to 2014 and 1999 to 2008, Chief Financial Officer of Scientific Learning Corporation. From 2008 to 2012, Ms. Freeman provided consulting services related to strategic business projects. Prior to 1999, Portfolio Manager at Rockefeller & Co. and Scudder, Stevens & Clark. Board member of the Harding Loevner Funds from 1996 to 2014, serving as both Lead Independent Director and chair of the Audit Committee. Board member of the Russell Exchange Traded Funds Trust from 2011 to 2012 and the chair of the Audit Committee. Ms. Freeman is a Board Member of The Ruth Bancroft Garden (non-profit organization). She is also an inactive Chartered Financial Analyst. | | N/A |
| | | |
Isaiah Harris, Jr. (Born 1952) | | Trustee, since 2009; Audit Committee Chairman, since 2019 | | Retired. Chairman of the Board of CIGNA Corporation since 2009, and Director since 2005. From 2003 to 2011, Director of Deluxe Corporation. Prior thereto, President and CEO of BellSouth Advertising and Publishing Corp. from 2005 to 2007, President and CEO of BellSouth Enterprises from 2004 to 2005 and President of BellSouth Consumer Services from 2000 to 2003. Emeritus member of the Iowa State University Foundation Board of Governors. Emeritus Member of the Advisory Board of Iowa State University School of Business. Advisory Board Member, Palm Harbor Academy (private school). Advisory Board Member, Child Evangelism Fellowship (non-profit). Mr. Harris is a certified public accountant (inactive status). | | CIGNA Corporation |
| | | |
Judith M. Johnson (Born 1949) | | Trustee, since 2008; Audit Committee Chairman, from 2009 to 2018 | | Retired. Prior thereto, Chief Executive Officer and Chief Investment Officer of Minneapolis Employees Retirement Fund from 1996 to 2008. Ms. Johnson is an attorney, certified public accountant and a certified managerial accountant. | | N/A |
Wells Fargo C&B Mid Cap Value Fund | 31
Other information (unaudited)
| | | | | | |
Name and year of birth | | Position held and length of service* | | Principal occupations during past five years or longer | | Current other
public company or
investment
company
directorships |
| | | |
David F. Larcker (Born 1950) | | Trustee, since 2009 | | James Irvin Miller Professor of Accounting at the Graduate School of Business, Stanford University, Director of the Corporate Governance Research Initiative and Senior Faculty of The Rock Center for Corporate Governance since 2006. From 2005 to 2008, Professor of Accounting at the Graduate School of Business, Stanford University. Prior thereto, Ernst & Young Professor of Accounting at The Wharton School, University of Pennsylvania from 1985 to 2005. | | N/A |
| | | |
Olivia S. Mitchell (Born 1953) | | Trustee, since 2006; Nominating and Governance Committee Chairman, since 2018 | | International Foundation of Employee Benefit Plans Professor, Wharton School of the University of Pennsylvania since 1993. Director of Wharton’s Pension Research Council and Boettner Center on Pensions & Retirement Research, and Research Associate at the National Bureau of Economic Research. Previously, Cornell University Professor from 1978 to 1993. | | N/A |
| | | |
Timothy J. Penny (Born 1951) | | Trustee, since 1996; Chairman, since 2018 | | President and Chief Executive Officer of Southern Minnesota Initiative Foundation, a non-profit organization, since 2007. Member of the Board of Trustees of NorthStar Education Finance, Inc., a non-profit organization, since 2007. | | N/A |
| | | |
James G. Polisson (Born 1959) | | Trustee, since 2018 | | Retired. Chief Marketing Officer, Source (ETF) UK Services, Ltd, from 2015 to 2017. From 2012 to 2015, Principal of The Polisson Group, LLC, a management consulting, corporate advisory and principal investing company. Chief Executive Officer and Managing Director at Russell Investments, Global Exchange Traded Funds from 2010 to 2012. Managing Director of Barclays Global Investors from 1998 to 2010 and Global Chief Marketing Officer for iShares and Barclays Global Investors from 2000 to 2010. Trustee of the San Francisco Mechanics’ Institute, a non-profit organization, from 2013 to 2015. Board member of the Russell Exchange Traded Fund Trust from 2011 to 2012. Director of Barclays Global Investors Holdings Deutschland GmbH from 2006 to 2009. Mr. Polisson is an attorney and has a retired status with the Massachusetts and District of Columbia Bar Associations. | | N/A |
| * | Length of service dates reflect the Trustee’s commencement of service with the Trust’s predecessor entities, where applicable. |
32 | Wells Fargo C&B Mid Cap Value Fund
Other information (unaudited)
Officers
| | | | |
Name and year of birth | | Position held and
length of service | | Principal occupations during past five years or longer |
| | |
Andrew Owen (Born 1960) | | President, since 2017 | | Executive Vice President of Wells Fargo & Company and Head of Affiliated Managers, Wells Fargo Asset Management, since 2014. In addition, Mr. Owen is currently President, Chief Executive Officer and Director of Wells Fargo Funds Management, LLC since 2017. Prior thereto, Executive Vice President responsible for marketing, investments and product development for Wells Fargo Funds Management, LLC, from 2009 to 2014. |
| | |
Nancy Wiser1 (Born 1967) | | Treasurer, since 2012 | | Executive Vice President of Wells Fargo Funds Management, LLC since 2011. Chief Operating Officer and Chief Compliance Officer at LightBox Capital Management LLC, from 2008 to 2011. |
| | |
Michelle Rhee3 (Born 1966) | | Chief Legal Officer, since 2019 | | Secretary of Wells Fargo Funds Management, LLC, Chief Legal Counsel of Wells Fargo Asset Management and Assistant General Counsel of Wells Fargo Bank, N.A. since 2018. Associate General Counsel and Managing Director of Bank of America Corporation from 2004 to 2018. |
| | |
Catherine Kennedy4 (Born 1969) | | Secretary, since 2019 | | Vice President of Wells Fargo Funds Management, LLC and Senior Counsel of the Wells Fargo Legal Department since 2010. Vice President and Senior Counsel of Evergreen Investment Management Company, LLC from 1998 to 2010. |
| | |
Michael H. Whitaker (Born 1967) | | Chief Compliance Officer, since 2016 | | Chief Compliance Officer of Wells Fargo Asset Management since 2016. Senior Vice President and Chief Compliance Officer for Fidelity Investments from 2007 to 2016. |
| | |
David Berardi (Born 1975) | | Assistant Treasurer, since 2009 | | Vice President of Wells Fargo Funds Management, LLC since 2009. Vice President of Evergreen Investment Management Company, LLC from 2008 to 2010. Manager of Fund Reporting and Control for Evergreen Investment Management Company, LLC from 2004 to 2010. |
| | |
Jeremy DePalma1 (Born 1974) | | Assistant Treasurer, since 2009 | | Senior Vice President of Wells Fargo Funds Management, LLC since 2009. Senior Vice President of Evergreen Investment Management Company, LLC from 2008 to 2010 and head of the Fund Reporting and Control Team within Fund Administration from 2005 to 2010. |
| 1 | Nancy Wiser acts as Treasurer of 64 funds in the Fund Complex. Jeremy DePalma acts as Treasurer of 86 funds and Assistant Treasurer of 64 funds in the Fund Complex. |
| 2 | The Statement of Additional Information includes additional information about the Trustees and is available, without charge, upon request, by calling1-800-222-8222 or by visiting the website atwfam.com. |
| 3 | Michelle Rhee became Chief Legal Officer effective October 22, 2019. |
| 4 | Catherine Kennedy became Secretary effective October 22, 2019. |
Wells Fargo C&B Mid Cap Value Fund | 33
Other information (unaudited)
BOARD CONSIDERATION OF INVESTMENT MANAGEMENT AND SUB-ADVISORY AGREEMENTS:
Wells Fargo C&B Mid Cap Value Fund
Under the Investment Company Act of 1940 (the “1940 Act”), the Board of Trustees (the “Board”) of Wells Fargo Funds Trust (the “Trust”) must determine annually whether to approve the continuation of the Trust’s investment management and sub-advisory agreements. In this regard, at an in-person meeting held on May 21-22, 2019 (the “Meeting”), the Board, all the members of which have no direct or indirect interest in the investment management and sub-advisory agreements and are not “interested persons” of the Trust, as defined in the 1940 Act (the “Independent Trustees”), reviewed and approved for Wells Fargo C&B Mid Cap Value Fund (the “Fund”): (i) an investment management agreement (the “Management Agreement”) with Wells Fargo Funds Management, LLC (“Funds Management”); and (ii) an investment sub-advisory agreement (the “Sub-Advisory Agreement”) with Cooke & Bieler, L.P. (the “Sub-Adviser”). The Management Agreement and the Sub-Advisory Agreement are collectively referred to as the “Advisory Agreements.”
At the Meeting, the Board considered the factors and reached the conclusions described below relating to the selection of Funds Management and the Sub-Adviser and the approval of the Advisory Agreements. Prior to the Meeting, including at an in-person meeting in April 2019, the Trustees conferred extensively among themselves and with representatives of Funds Management about these matters. Also, the Board has adopted a team-based approach, with each team consisting of a sub-set of Trustees, to assist the full Board in the discharge of its duties in reviewing investment performance and other matters throughout the year. The Independent Trustees were assisted in their evaluation of the Advisory Agreements by independent legal counsel, from whom they received separate legal advice and with whom they met separately.
In providing information to the Board, Funds Management and the Sub-Adviser were guided by a detailed set of requests for information submitted to them by independent legal counsel on behalf of the Independent Trustees at the start of the Board’s annual contract renewal process earlier in 2019. In considering and approving the Advisory Agreements, the Trustees considered the information they believed relevant, including but not limited to the information discussed below. The Board considered not only the specific information presented in connection with the Meeting, but also the knowledge gained over time through interaction with Funds Management and the Sub-Adviser about various topics. In this regard, the Board reviewed reports of Funds Management at each of its quarterly meetings, which included, among other things, portfolio reviews and investment performance reports. In addition, the Board and the teams mentioned above confer with portfolio managers at various times throughout the year. The Board did not identify any particular information or consideration that was all-important or controlling, and each individual Trustee may have attributed different weights to various factors.
After its deliberations, the Board unanimously approved the continuation of the Advisory Agreements for a one-year term and determined that the compensation payable to Funds Management and the Sub-Adviser under each of the Advisory Agreements was reasonable. The Board considered the approval of the Advisory Agreements for the Fund as part of its consideration of agreements for funds across the complex, but its approvals were made on a fund-by-fund basis. The following summarizes a number of important, but not necessarily all, factors considered by the Board in support of its approvals.
Nature, extent and quality of services
The Board received and considered various information regarding the nature, extent and quality of services provided to the Fund by Funds Management and the Sub-Adviser under the Advisory Agreements. This information included a description of the investment advisory services and Fund-level administrative services covered by the Management Agreement, as well as, among other things, a summary of the background and experience of senior management of Wells Fargo Asset Management (“WFAM”), of which Funds Management is a part, a summary of investments made in the business of WFAM, a summary of certain organizational and personnel changes involving Funds Management, and a description of Funds Management’s and the Sub-Adviser’s business continuity planning programs and of their approaches to data privacy and cybersecurity. The Board received and reviewed information about Funds Management’s role as administrator of the Fund’s liquidity risk management program. The Board also considered the qualifications, background, tenure and responsibilities of each of the portfolio managers primarily responsible for the day-to-day portfolio management of the Fund.
The Board evaluated the ability of Funds Management and the Sub-Adviser to attract and retain qualified investment professionals, including research, advisory and supervisory personnel. The Board further considered the compliance programs and compliance records of Funds Management and the Sub-Adviser. In addition, the Board took into account the full range of services provided to the Fund by Funds Management and its affiliates.
Fund investment performance and expenses
The Board considered the investment performance results for the Fund over various time periods ended December 31, 2018. The Board considered these results in comparison to the investment performance of funds in a universe that was determined by
34 | Wells Fargo C&B Mid Cap Value Fund
Other information (unaudited)
Broadridge Inc. (“Broadridge”) to be similar to the Fund (the “Universe”), and in comparison to the Fund’s benchmark index and to other comparative data. Broadridge is an independent provider of investment company data. The Board received a description of the methodology used by Broadridge to select the mutual funds in the performance Universe. The Board noted that the investment performance of the Fund (Administrator Class) was lower than the average performance of the Universe for the one-year period under review, but higher than the average performance of the Universe for the three-, five- and ten-year periods under review. The Board also noted that the investment performance of the Fund was lower than its benchmark index, the Russell Midcap® Value Index, for the one-, five- and ten-year periods under review, but higher than its benchmark index for the three-year period under review.
The Board also received and considered information regarding the Fund’s net operating expense ratios and their various components, including actual management fees, custodian and other non-management fees, and Rule 12b-1 and non-Rule 12b-1 shareholder service fees. The Board considered these ratios in comparison to the median ratios of funds in class-specific expense groups that were determined by Broadridge to be similar to the Fund (the “Groups”). The Board received a description of the methodology used by Broadridge to select the mutual funds in the expense Groups and an explanation of how funds comprising expense groups and their expense ratios may vary from year-to-year. Based on the Broadridge reports, the Board noted that the net operating expense ratios of the Fund were equal to, lower than, or in range of, the median net operating expense ratios of the expense Groups for all share classes.
The Board took into account the Fund’s investment performance and expense information provided to it among the factors considered in deciding to re-approve the Advisory Agreements.
Investment management and sub-advisory fee rates
The Board reviewed and considered the contractual fee rates payable by the Fund to Funds Management under the Management Agreement, as well as the contractual fee rates payable by the Fund to Funds Management for class-level administrative services under a Class-Level Administration Agreement, which include, among other things, class-level transfer agency and sub-transfer agency costs (collectively, the “Management Rates”). The Board also reviewed and considered the contractual investment sub-advisory fee rates that are payable by Funds Management to the Sub-Adviser for investment sub-advisory services.
Among other information reviewed by the Board was a comparison of the Fund’s Management Rates with the average contractual investment management fee rates of funds in the expense Groups at a common asset level as well as transfer agency costs of the other funds in the expense Groups. The Board noted that the Management Rates of the Fund were lower than or equal to the sum of these average rates for the Fund’s expense Groups for all share classes.
The Board also received and considered information about the portion of the total management fee that was retained by Funds Management after payment of the fee to the Sub-Adviser for sub-advisory services. The Board considered this amount in comparison to the median amount retained by advisers to funds in a sub-advised expense universe that was determined by Broadridge to be similar to the Fund. In assessing the reasonableness of this amount, the Board received and evaluated information about the nature and extent of responsibilities retained and risks assumed by Funds Management and not delegated to or assumed by the Sub-Adviser, and about Funds Management’s on-going oversight services. The Board also considered that the sub-advisory fees paid to the Sub-Adviser had been negotiated by Funds Management on an arm’s length basis.
The Board also received and considered information about the nature and extent of services offered and fee rates charged by Funds Management and the Sub-Adviser to other types of clients with investment strategies similar to those of the Fund. In this regard, the Board received information about the significantly greater scope of services, and compliance, reporting and other legal burdens and risks of managing proprietary mutual funds compared with those associated with managing assets of other types of clients, including third-party sub-advised fund clients and non-mutual fund clients such as institutional separate accounts.
Based on its consideration of the factors and information it deemed relevant, including those described here, the Board determined that the compensation payable to Funds Management under the Management Agreement and to the Sub-Adviser under the Sub-Advisory Agreement was reasonable.
Profitability
The Board received and considered information concerning the profitability of Funds Management, as well as the profitability of both WFAM and Wells Fargo & Co. (“Wells Fargo”) from providing services to the fund family as a whole. Funds Management reported on the methodologies and estimates used in calculating profitability, including a description of the methodology used to allocate certain expenses. Among other things, the Board noted that the levels of profitability reported on a fund-by-fund
Wells Fargo C&B Mid Cap Value Fund | 35
Other information (unaudited)
basis varied widely, depending on factors such as the size, type and age of fund. The Board did not consider profitability with respect to the Sub-Adviser, as the sub-advisory fees paid to the Sub-Adviser had been negotiated by Funds Management on an arm’s-length basis.
Based on its review, the Board did not deem the profits reported by Funds Management, WFAM or Wells Fargo from services provided to the Fund to be at a level that would prevent it from approving the continuation of the Advisory Agreements.
Economies of scale
The Board received and considered information about the potential for Funds Management to experience economies of scale in the provision of management services to the Fund, the difficulties of calculating economies of scale at an individual fund level, and the extent to which potential scale benefits are shared with shareholders. The Board noted the existence of breakpoints in the Fund’s management fee structure, which operate generally to reduce the Fund’s expense ratios as the Fund grows in size. The Board considered that in addition to management fee breakpoints, Funds Management shares potential economies of scale from its management business in a variety of ways, including through fee waiver and expense reimbursement arrangements, services that benefit shareholders, competitive management fee rates set at the outset without regard to breakpoints, and investments in the business intended to enhance services available to shareholders.
The Board concluded that Funds Management’s arrangements with respect to the Fund, including contractual breakpoints, constituted a reasonable approach to sharing potential economies of scale with the Fund and its shareholders.
Other benefits to Funds Management and the Sub-Adviser
The Board received and considered information regarding potential “fall-out” or ancillary benefits received by Funds Management, the Sub-Adviser, and their affiliates as a result of their relationships with the Fund. Ancillary benefits could include, among others, benefits directly attributable to other relationships with the Fund and benefits potentially derived from an increase in Funds Management’s and the Sub-Adviser’s business as a result of their relationships with the Fund. The Board noted that various affiliates of Funds Management may receive distribution-related fees, shareholder servicing payments and sub-transfer agency fees in respect of shares sold or held through them and services provided.
The Board also reviewed information about soft dollar credits earned and utilized by the Sub-Adviser, fees earned by Funds Management and its affiliate from managing a private investment vehicle for the fund family’s securities lending collateral, and commissions earned by an affiliated broker from portfolio transactions.
Based on its consideration of the factors and information it deemed relevant, including those described here, the Board did not find that any ancillary benefits received by Funds Management, the Sub-Adviser, and their affiliates were unreasonable.
Conclusion
At the Meeting, after considering the above-described factors and based on its deliberations and its evaluation of the information described above, the Board unanimously approved the continuation of the Advisory Agreements for a one-year term and determined that the compensation payable to Funds Management and the Sub-Adviser under each of the Advisory Agreements was reasonable.
36 | Wells Fargo C&B Mid Cap Value Fund

For more information
More information about Wells Fargo Funds is available free upon request. To obtain literature, please write, visit the Fund’s website, or call:
Wells Fargo Funds
P.O. Box 219967
Kansas City, MO 64121-9967
Website:wfam.com
Individual investors:1-800-222-8222
Retail investment professionals:1-888-877-9275
Institutional investment professionals:1-866-765-0778

This report and the financial statements contained herein are submitted for the general information of the shareholders of the Fund. If this report is used for promotional purposes, distribution of the report must be accompanied or preceded by a current prospectus. Before investing, please consider the investment objectives, risks, charges, and expenses of the investment. For a current prospectus and, if available, a summary prospectus, containing this information, call1-800-222-8222or visit the Fund’s website atwfam.com. Read the prospectus carefully before you invest or send money.
Wells Fargo Asset Management (WFAM) is the trade name for certain investment advisory/management firms owned by Wells Fargo & Company. These firms include but are not limited to Wells Capital Management Incorporated and Wells Fargo Funds Management, LLC. Certain products managed by WFAM entities are distributed by Wells Fargo Funds Distributor, LLC (a broker-dealer and Member FINRA).
This material is for general informational and educational purposes only and is NOT intended to provide investment advice or a recommendation of any kind—including a recommendation for any specific investment, strategy, or plan.
INVESTMENT PRODUCTS: NOT FDIC INSURED ◾ NO BANK GUARANTEE ◾ MAY LOSE VALUE
© 2019 Wells Fargo & Company. All rights reserved.
406812 11-19
A228/AR228 09-19
Annual Report
September 30, 2019
Wells Fargo Common Stock Fund
Beginning on January 1, 2021, as permitted by new regulations adopted by the Securities and Exchange Commission, paper copies of the Wells Fargo Funds’ annual and semi-annual shareholder reports issued after this date will no longer be sent by mail, unless you specifically request paper copies of the reports. Instead, the reports will be made available on the Funds’ website, and you will be notified by mail each time a report is posted and provided with a website address to access the report.
If you already elected to receive shareholder reports electronically, you will not be affected by this change and you need not take any action. You may elect to receive shareholder reports and other communications from the Fund electronically at any time by contacting your financial intermediary (such as a broker-dealer or bank) or, if you are a direct investor, by calling1-800-222-8222 or by enrolling at wellsfargo.com/advantagedelivery.
You may elect to receive all future reports in paper free of charge. If you invest through a financial intermediary, you can contact your financial intermediary to request that you continue to receive paper copies of your shareholder reports; if you invest directly with the Fund, you can call 1-800-222-8222. Your election to receive reports in paper will apply to all Wells Fargo Funds held in your account with your financial intermediary or, if you are a direct investor, to all Wells Fargo Funds that you hold.
|
|
|
Reduce clutter. Save trees. |
Sign up for electronic delivery of prospectuses and shareholder reports atwellsfargo.com/advantagedelivery |
The views expressed and any forward-looking statements are as of September 30, 2019, unless otherwise noted, and are those of the Fund managers and/or Wells Fargo Asset Management. Discussions of individual securities, or the markets generally, or any Wells Fargo Fund are not intended as individual recommendations. Future events or results may vary significantly from those expressed in any forward-looking statements. The views expressed are subject to change at any time in response to changing circumstances in the market. Wells Fargo Asset Management and the Fund disclaim any obligation to publicly update or revise any views expressed or forward-looking statements.
INVESTMENT PRODUCTS: NOT FDIC INSURED ◾ NO BANK GUARANTEE ◾ MAY LOSE VALUE
Wells Fargo Common Stock Fund | 1
Letter to shareholders (unaudited)

Andrew Owen
President
Wells Fargo Funds
“December’s S&P 500 Index performance was the worst since 1931.”
Dear Shareholder:
We are pleased to offer you this annual report for the Wells Fargo Common Stock Fund for the 12-month period that ended September 30, 2019. After the first half of the period yielded either low-single-digit or negative investment returns, U.S. stock and global bond investors generally saw markets recover during the second half amid intensifying market volatility, global economic growth concerns, international trade stare downs, and simmering geopolitical tensions.
Overall, fixed-income investors enjoyed a distinct advantage over stock investors. For the period, U.S. stocks, based on the S&P 500 Index,1 gained 4.25% and international stocks, as measured by the MSCI ACWI ex USA Index (Net),2 fell 1.23%. The MSCI EM Index (Net)3 slipped 2.02%. Among fixed income investors, the Bloomberg Barclays U.S. Aggregate Bond Index4 added 10.30%, the Bloomberg Barclays Global Aggregateex-USD Index5 added 5.34%, the Bloomberg Barclays Municipal Bond Index6 gained 8.55%, and the ICE BofAML U.S. High Yield Index7 added 6.30%.
Investors confronted unsettling events during the fourth quarter of 2018.
During the fourth quarter of 2018, investors grew concerned about the pace and sustainability of the global economic expansion. The U.S. Bureau of Economic Analysis reported third-quarter U.S. gross domestic product (GDP) was 3.4% on an annualized basis, which was down from the second-quarter rate. A partial U.S. government shutdown occurred, which extended into January 2019. Brexit efforts stalled, causing uncertainty for the eurozone. The value of the renminbi declined even as the People’s Bank of China cut reserve requirement ratios, accelerated infrastructure spending, and cut taxes in efforts to spur economic activity.
The combination of news in the U.S. and generally weak economic indicators outside of the U.S. caused investors to seek safe havens. December’s S&P 500 Index performance was the worst since 1931. Globally, fixed-income investments fared better than stocks during the last two months of the year. Even as indicators suggested growth was restrained, the U.S. Federal Reserve (Fed) increased the federal funds rate by 25 basis points (bps; 100 bps equal 1.00%) in December 2018 to a target range of between 2.25% and 2.50%. Many observers expressed concerns that higher rates could slow the economy further.
| 1 | The S&P 500 Index consists of 500 stocks chosen for market size, liquidity, and industry group representation. It is a market-value-weighted index with each stock’s weight in the index proportionate to its market value. You cannot invest directly in an index. |
| 2 | The Morgan Stanley Capital International (MSCI) All Country World Index (ACWI) ex USA Index (Net) is a free-float-adjusted market-capitalization weighted index that is designed to measure the equity market performance of developed and emerging markets, excluding the U.S. Source: MSCI. MSCI makes no express or implied warranties or representations and shall have no liability whatsoever with respect to any MSCI data contained herein. The MSCI data may not be further redistributed or used as a basis for other indices or any securities or financial products. This report is not approved, reviewed, or produced by MSCI. You cannot invest directly in an index. |
| 3 | The MSCI Emerging Markets (EM) Index (Net) is a free-float-adjusted market-capitalization-weighted index that is designed to measure the equity market performance of emerging markets. You cannot invest directly in an index. |
| 4 | The Bloomberg Barclays U.S. Aggregate Bond Index is a broad-based benchmark that measures the investment-grade, U.S. dollar-denominated, fixed-rate taxable bond market, including Treasuries, government-related and corporate securities, mortgage-backed securities (agency fixed-rate and hybrid adjustable-rate mortgage pass-throughs), asset-backed securities, and commercial mortgage-backed securities. You cannot invest directly in an index. |
| 5 | The Bloomberg Barclays Global Aggregate ex-USD Index is an unmanaged index that provides a broad-based measure of the global investment-grade fixed-income markets excluding the U.S. dollar-denominated debt market. You cannot invest directly in an index. |
| 6 | The Bloomberg Barclays Municipal Bond Index is an unmanaged index composed of long-term tax-exempt bonds with a minimum credit rating of Baa. You cannot invest directly in an index. |
| 7 | The ICE BofAML U.S. High Yield Index is a market-capitalization-weighted index of domestic and Yankee high-yield bonds. The index tracks the performance of high-yield securities traded in the U.S. bond market. You cannot invest directly in an index. Copyright 2019. ICE Data Indices, LLC. All rights reserved. |
2 | Wells Fargo Common Stock Fund
Letter to shareholders (unaudited)
The market climbs a wall of worry.
Investment returns early in 2019 appeared to reaffirm the adage that markets climb a wall of worry as the new year began. The S&P 500 Index gained 8.01% for the month of January, the best monthly performance in 30 years. Returns for the MSCI ACWI ex USA Index (Net), the Bloomberg Barclays U.S. Aggregate Bond Index, and the Bloomberg Barclays Global Aggregate ex-USD Index also were positive.
In February 2019, signs of slowing global growth grew more ominous. The Bureau of Economic Analysis announced fourth-quarter 2018 GDP grew at an annualized 2.2% rate, a slower rate than reported for the prior two quarters. In a February report, the Bank of England forecast the slowest growth for 2019 since the financial crisis. China and the U.S. continued to wrangle over trade issues. By the end of the first quarter of 2019, more accommodative Fed sentiment and steady, if not spectacular, U.S. economic and business metrics encouraged domestic investors.
Early second-quarter 2019 enthusiasm among investors faded.
During April 2019, favorable sentiment found additional support in reports of sustained low inflation, solid employment data, and first-quarter U.S. GDP of an annualized rate of 3.2%. During May, markets tumbled on mixed investment signals. In the U.S., partisan wrangling ramped up as Democrats and Republicans set their sights on 2020 presidential politics. The U.K.’s Brexit disagreements caused Prime Minister Theresa May to resign. Boris Johnson succeeded her only to exacerbate uncertainty about Brexit’s resolution ahead of an October 2019 deadline. The European Commission downgraded the 2019 growth forecast to 1.2%. The U.S. increased tariffs on products from China, China responded, and then talks broke down. President Donald Trump threatened to turn his foreign policy tariff tool to Mexico over immigration issues.
During the third quarter of 2019, investors regrouped. Just as the investment horizon appeared to darken, sentiment turned and U.S. equity markets gained during June and July. The gains, primarily driven by geopolitical and monetary policy events, pushed equity markets to new highs. European Central Bank President Mario Draghi said that if the outlook doesn’t improve, the bank would cut rates or buy more assets to prop up inflation. President Trump backed off of tariff threats against Mexico and China. In the U.S., the Fed implemented a 0.25% federal funds rate cut in July.
Later in July 2019, the U.S. reversed course and threatened to impose higher tariffs on China’s exports after talks failed. China responded with tariff threats of its own and devalued the renminbi, a move that roiled global markets. Major U.S. stock market indices closed July with the worst weekly results of the year. Bond prices gained as Treasury yields fell to levels not seen since November 2016 and the yield curve inverted at multiple points along the 30-year arc.
In a microcosm, August 2019 encapsulated many of the unnerving events that plagued investors during the prior 11 months. The U.S.-China trade relationship swung from antagonistic to hopeful and back again with no evident compromise on the horizon. Evidence of a continued global economic slowdown mounted. Central banks in China, New Zealand, and Thailand cut interest rates. Industrial and manufacturing data declined in China, Canada, Japan, and Germany. Adding to the uncertain environment, Italy’s prime minister resigned, many feared a crackdown in Hong Kong as protesters sustained their calls for reform throughout the month, and Boris Johnson planned to suspend Parliament as Brexit’s deadline neared.
In the U.S., September saw the Fed join other central banks in cutting interest rates. Manufacturing data in the U.S., as reported by the Institute for Supply Management, disappointed investors. The U.S. Congress announced it would pursue an impeachment investigation of President Trump. Meanwhile, the Brexit impasse showed no signs of
“The S&P 500 Index gained 8.01% for the month of January, the best monthly performance in 30 years.”
Wells Fargo Common Stock Fund | 3
Letter to shareholders (unaudited)
|
|
|
For further information about your Fund, contact your investment professional, visit our website at wfam.com, or call us directly at1-800-222-8222. |
resolution. Officials in China said that hitting the country’s economic growth goals for the year would be difficult considering the weight of tariffs and trade restrictions. So while the S&P 500 Index finished the third quarter with year-to-date returns that were the best in more than 20 years, amid signs of equity investors taking money out of the stock market, concerns about future returns remained.
Don’t let short-term uncertainty derail long-term investment goals.
Periods of investment uncertainty can present challenges, but experience has taught us that maintaining long-term investment goals can be an effective way to plan for the future. To help you create a sound strategy based on your personal goals and risk tolerance, Wells Fargo Funds offers more than 100 mutual funds spanning a wide range of asset classes and investment styles. Although diversification cannot guarantee an investment profit or prevent losses, we believe it can be an effective way to manage investment risk and potentially smooth out overall portfolio performance. We encourage investors to know their investments and to understand that appropriate levels of risk-taking may potentially unlock opportunities.
Thank you for choosing to invest with Wells Fargo Funds. We appreciate your confidence in us and remain committed to helping you meet your financial needs.
Sincerely,

Andrew Owen
President
Wells Fargo Funds
4 | Wells Fargo Common Stock Fund
This page is intentionally left blank.
Performance highlights (unaudited)
Investment objective
The Fund seeks long-term capital appreciation.
Manager
Wells Fargo Funds Management, LLC
Subadviser
Wells Capital Management Incorporated
Portfolio managers
Ann M. Miletti
Christopher G. Miller, CFA®‡
Average annual total returns (%) as of September 30, 2019
| | | | | | | | | | | | | | | | | | | | | | | | | | | | | | | | | | |
| | | | |
| | | | | Including sales charge | | | Excluding sales charge | | | Expense ratios1 (%) | |
| | | | | | | | | |
| | | Inception date | | 1 year | | | 5 year | | | 10 year | | | 1 year | | | 5 year | | | 10 year | | | Gross | | | Net2 | |
| | | | | | | | | | |
| Class A (SCSAX) | | 11-30-2000 | | | -4.90 | | | | 6.74 | | | | 10.62 | | | | 0.91 | | | | 8.01 | | | | 11.28 | | | | 1.26 | | | | 1.26 | |
| | | | | | | | | | |
| Class C (STSAX) | | 11-30-2000 | | | -0.83 | | | | 7.20 | | | | 10.44 | | | | 0.17 | | | | 7.20 | | | | 10.44 | | | | 2.01 | | | | 2.01 | |
| | | | | | | | | | |
| Class R6 (SCSRX)3 | | 6-28-2013 | | | – | | | | – | | | | – | | | | 1.31 | | | | 8.47 | | | | 11.70 | | | | 0.83 | | | | 0.83 | |
| | | | | | | | | | |
| Administrator Class (SCSDX)4 | | 7-30-2010 | | | – | | | | – | | | | – | | | | 1.03 | | | | 8.17 | | | | 11.43 | | | | 1.18 | | | | 1.11 | |
| | | | | | | | | | |
| Institutional Class (SCNSX)5 | | 7-30-2010 | | | – | | | | – | | | | – | | | | 1.31 | | | | 8.45 | | | | 11.68 | | | | 0.93 | | | | 0.86 | |
| | | | | | | | | | |
| Russell 2500TM Index6 | | – | | | – | | | | – | | | | – | | | | -4.04 | | | | 8.57 | | | | 12.22 | | | | – | | | | – | |
Figures quoted represent past performance, which is no guarantee of future results, and do not reflect taxes that a shareholder may pay on fund distributions or the redemption of fund shares. Investment return and principal value of an investment will fluctuate so that an investor’s shares, when redeemed, may be worth more or less than their original cost. Performance shown without sales charges would be lower if sales charges were reflected. Current performance may be lower or higher than the performance data quoted, which assumes the reinvestment of dividends and capital gains. Currentmonth-end performance is available on the Fund’s website,wfam.com.
Index returns do not include transaction costs associated with buying and selling securities, any mutual fund fees or expenses, or any taxes. It is not possible to invest directly in an index.
For Class A shares, the maximumfront-end sales charge is 5.75%. For Class C shares, the maximum contingent deferred sales charge is 1.00%. Performance including a contingent deferred sales charge assumes the sales charge for the corresponding time period. Class R6, Administrator Class, and Institutional Class shares are sold without afront-end sales charge or contingent deferred sales charge.
Stock values fluctuate in response to the activities of individual companies and general market and economic conditions. Smaller-company stocks tend to be more volatile and less liquid than those of larger companies. Certain investment strategies tend to increase the total risk of an investment (relative to the broader market). The Fund is exposed to foreign investment risk. Consult the Fund’s prospectus for additional information on these and other risks.
Please see footnotes on page 7.
6 | Wells Fargo Common Stock Fund
Performance highlights (unaudited)
|
|
| Growth of $10,000 investment as of September 30, 20197 |
|
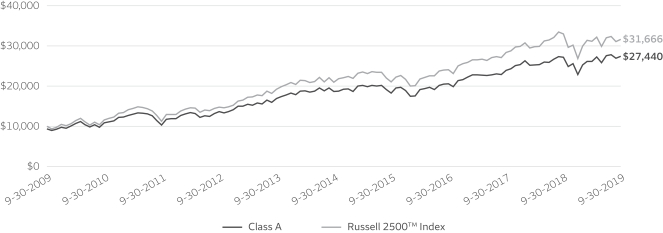
|
| ‡ | CFA® and Chartered Financial Analyst® are trademarks owned by CFA Institute. |
| 1 | Reflects the expense ratios as stated in the most recent prospectuses, which include the impact of 0.01% in acquired fund fees and expenses. The expense ratios shown are subject to change and may differ from the annualized expense ratios shown in the financial highlights of this report, which do not include acquired fund fees and expenses. |
| 2 | The manager has contractually committed through January 31, 2020, to waive fees and/or reimburse expenses to the extent necessary to cap the expenses of each class after fee waivers at 1.26% for Class A, 2.01% for Class C, 0.85% for Class R6, 1.10% for Administrator Class, and 0.85% for Institutional Class. Brokerage commissions, stamp duty fees, interest, taxes, acquired fund fees and expenses (if any), and extraordinary expenses are excluded from the expense cap. Prior to or after the commitment expiration date, the cap may be increased or the commitment to maintain the cap may be terminated only with the approval of the Board of Trustees. Without this cap, the Fund’s returns would have been lower. The expense ratio paid by an investor is the net expense ratio (the total annual fund operating expenses after fee waivers) as stated in the prospectuses. |
| 3 | Historical performance shown for Class R6 shares prior to their inception reflects the performance of Institutional Class shares, and includes the higher expenses applicable to Institutional Class shares. If these expenses had not been included, the returns for Class R6 shares would be higher. |
| 4 | Historical performance shown for Administrator Class shares prior to their inception reflects the performance of Class A shares, and includes the higher expenses applicable to Class A shares. If these expenses had not been included, the returns for Administrator Class shares would be higher. |
| 5 | Historical performance shown for Institutional Class shares prior to their inception reflects the performance of Class A shares, and includes the higher expenses applicable to Class A shares. If these expenses had not been included, the returns for Institutional Class shares would be higher. |
| 6 | The Russell 2500TM Index measures the performance of the 2,500 smallest companies in the Russell 3000® Index, which represents approximately 16% of the total market capitalization of the Russell 3000® Index. You cannot invest directly in an index. |
| 7 | The chart compares the performance of Class A shares for the most recent ten years with the Russell 2500TM Index. The chart assumes a hypothetical investment of $10,000 in Class A shares and reflects all operating expenses and assumes the maximum initial sales charge of 5.75%. |
| 8 | The ten largest holdings, excluding cash, cash equivalents and any money market funds, are calculated based on the value of the investments divided by total net assets of the Fund. Holdings are subject to change and may have changed since the date specified. |
| 9 | Amounts are calculated based on the total long-term investments of the Fund. These amounts are subject to change and may have changed since the date specified. |
Wells Fargo Common Stock Fund | 7
Performance highlights (unaudited)
MANAGER’S DISCUSSION
Fund highlights
| ∎ | | The Fund outperformed its benchmark, the Russell 2500TM Index, for the12-month period that ended September 30, 2019. |
| ∎ | | Favorable stock selection in the information technology (IT), real estate, and industrials sectors drove performance. |
| ∎ | | A lack of exposure to utilities, and holdings in the energy and health care sectors detracted from performance. |
In the fourth quarter of 2018, the U.S. stock market suffered a sharp decline but steadily recovered over the next three quarters. However, the Fund’s benchmark did not fully recover, declining 4.04% for the period. Utilities, real estate, and IT were the best-performing sectors in the benchmark, while energy, health care, and materials declined the most.Large-cap stocks generally outperformedsmall-cap stocks.
A number of factors have been influencing the U.S. stock market. Going into the period, lower corporate taxes, less regulation, and otherpro-growth government policies had fueled optimism in U.S. businesses. The U.S. equity markets also benefited from the repatriation of cash held overseas, a significantramp-up in share buybacks, increased capital spending, and high-profile merger and acquisition activity. Byperiod-end, U.S. gross domestic product had increased for the 21st quarter in a row, the longest expansion in history. However, the period began with an equity market decline, exacerbated by the U.S. Federal Reserve (Fed) raising rates. After its December 2018 rate increase, the Fed shifted to a more dovish posture and reduced rates twice to the range of 1.75% to 2.00% by September 2019. An unprecedented level of negative-yielding bonds globally and the potential impact of U.S. trade negotiations are key market concerns. Slowing U.S. corporate earnings growth also weighed on investor sentiment. However, consumer confidence remains positive with low unemployment and rising household net worth.
Through the reporting period, we continued to seek companies with solid business models, strong management teams, and healthy cash flow prospects.
| | | | |
|
| Ten largest holdings(%) as of September 30, 20198 | |
| | |
LivaNova plc | | | 2.43 | |
| | |
E*TRADE Financial Corporation | | | 2.17 | |
| | |
Raymond James Financial Incorporated | | | 1.86 | |
| | |
Laboratory Corporation of America Holdings | | | 1.74 | |
| | |
Carlisle Companies Incorporated | | | 1.70 | |
| | |
Stericycle Incorporated | | | 1.70 | |
| | |
Hologic Incorporated | | | 1.69 | |
| | |
Sun Communities Incorporated | | | 1.67 | |
| | |
Healthcare Realty Trust Incorporated | | | 1.63 | |
| | |
Reinsurance Group of America Incorporated | | | 1.58 | |
Stock selection in IT, real estate, and industrials were the largest contributors.
The Fund was overweight in IT, and our holdings outperformed the benchmark. IT services, software, and semiconductor holdings provided most of the outperformance. The real estate sector benefited from lower interest rates, and our holdings outperformed their peers. Among industrials, holdings in road and rail, electrical equipment, and industrial conglomerates were the biggest positives. The largest individual contributor was Royal Gold, Incorporated (RGLD), a precious-metals company focused on gold and silver. RGLD’s diversified royalty streaming business brought more stability and lower risk than many gold companies. RGLD rose almost 62% for the period,
gaining from the attractiveness of gold as a commodity. SBA Communications Corporation (SBAC) and Sun Communities Incorporated (SUI), U.S. real estate investment trusts, also contributed. SBAC, which rose just over 50%, owns and operates wireless communications infrastructure and towers in the Americas. Its cell towers are in great demand, with the growth of mobile data traffic. SUI rose almost 50%. It provides real estate management services and manufactured housing for U.S. recreational vehicle communities. It had strong financial results, and its manufactured housing portfolio has continued to demonstrate strong pricing power and organic cash flow growth.
Please see footnotes on page 7.
8 | Wells Fargo Common Stock Fund
Performance highlights (unaudited)
|
|
| Sector distribution as of September 30, 20199 |
|
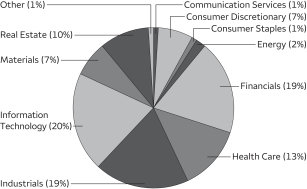 |
Utilities, energy, and health care detracted from performance.
Utilities were the benchmark’s best-performing sector, and a lack of exposure to it detracted from relative returns. As a defensive sector, utilities have been driven by interest rate trends and the economic cycle. Conversely, energy was the worst-performing sector. The West Texas Intermediate crude oil price declined from $75 to $55 a barrel, despite brief spikes related to supply concerns from Venezuela and Iran and the attack on Saudi oil fields. While we own higher-quality exploration and production companies, these firms remained sensitive to crude oil prices. Individual detractors included Concho Resources Incorporated and Cimarex Energy Company. The largest overall individual detractor
was LivaNova PLC (LIVN), a medical technology company that specializes in neuromodulation, cardiac surgery, and cardiac rhythm management. LIVN was formed through the merger of Sorin SpA and Cyberonics. The stock fell 40% for the fiscal year as investors worried about regulatory setbacks and weak financial performance.
Our focus is constant: To add value by investing in attractively priced holdings.
We seek to buy stocks at a discount to their estimated private market values (PMVs) and sell them as they reach the top of their PMV range. Our disciplined,bottom-up investment process leads us to be overweight or underweight certain sectors. This positioning changes over time based on macroeconomic and industry-specific factors. During the period, we were overweight the industrials, IT, and financials sectors and underweight utilities, consumer discretionary, and communication services. We remain keenly aware of both price and enterprise values on acompany-by-company basis.
Looking ahead, global trade agreements, U.S. government policies, and interest rates may drive the overall market and the portfolio’s performance. Lower taxes and reduced regulations have already had an impact on the U.S. economy, but a divided U.S. Congress may slow down any such reform. U.S.-China trade talks areon-againoff-again. Reaching an agreement could be positive for bilateral and global trade. Future rate cuts are expected by the Fed, seen as a positive for the stock market. The prospect of a potential U.S. recession is a factor in investor sentiment along with the possible impact of a slowdown in other major global economies.
Please see footnotes on page 7.
Wells Fargo Common Stock Fund | 9
Fund expenses (unaudited)
As a shareholder of the Fund, you incur two types of costs: (1) transaction costs, including sales charges (loads) on purchase payments and contingent deferred sales charges (if any) on redemptions and (2) ongoing costs, including management fees, distribution(12b-1) and/or shareholder servicing fees, and other Fund expenses. This example is intended to help you understand your ongoing costs (in dollars) of investing in the Fund and to compare these costs with the ongoing costs of investing in other mutual funds.
The example is based on an investment of $1,000 invested at the beginning of thesix-month period and held for the entire period from April 1, 2019 to September 30, 2019.
Actual expenses
The “Actual” line of the table below provides information about actual account values and actual expenses. You may use the information in this line, together with the amount you invested, to estimate the expenses that you paid over the period. Simply divide your account value by $1,000 (for example, an $8,600 account value divided by $1,000 = 8.6), then multiply the result by the number in the “Actual” line under the heading entitled “Expenses paid during period” for your applicable class of shares to estimate the expenses you paid on your account during this period.
Hypothetical example for comparison purposes
The “Hypothetical” line of the table below provides information about hypothetical account values and hypothetical expenses based on the Fund’s actual expense ratio and an assumed rate of return of 5% per year before expenses, which is not the Fund’s actual return. The hypothetical account values and expenses may not be used to estimate the actual ending account balance or expenses you paid for the period. You may use this information to compare the ongoing costs of investing in the Fund and other funds. To do so, compare this 5% hypothetical example with the 5% hypothetical examples that appear in the shareholder reports of the other funds.
Please note that the expenses shown in the table are meant to highlight your ongoing costs only and do not reflect any transactional costs, such as sales charges (loads) and contingent deferred sales charges. Therefore, the “Hypothetical” line of the table is useful in comparing ongoing costs only and will not help you determine the relative total costs of owning different funds. In addition, if these transactional costs were included, your costs would have been higher.
| | | | | | | | | | | | | | | | |
| | | Beginning
account value
4-1-2019 | | | Ending
account value
9-30-2019 | | | Expenses
paid during
the period¹ | | | Annualized net
expense ratio | |
| | | | | |
Class A | | | | | | | | | | | | | | | | |
| | | | |
Actual | | $ | 1,000.00 | | | $ | 1,048.78 | | | $ | 6.48 | | | | 1.26 | % |
| | | | |
Hypothetical (5% return before expenses) | | $ | 1,000.00 | | | $ | 1,018.74 | | | $ | 6.39 | | | | 1.26 | % |
| | | | | |
Class C | | | | | | | | | | | | | | | | |
| | | | |
Actual | | $ | 1,000.00 | | | $ | 1,044.71 | | | $ | 10.32 | | | | 2.01 | % |
| | | | |
Hypothetical (5% return before expenses) | | $ | 1,000.00 | | | $ | 1,014.97 | | | $ | 10.17 | | | | 2.01 | % |
| | | | | |
Class R6 | | | | | | | | | | | | | | | | |
| | | | |
Actual | | $ | 1,000.00 | | | $ | 1,051.17 | | | $ | 4.28 | | | | 0.83 | % |
| | | | |
Hypothetical (5% return before expenses) | | $ | 1,000.00 | | | $ | 1,020.90 | | | $ | 4.21 | | | | 0.83 | % |
| | | | | |
Administrator Class | | | | | | | | | | | | | | | | |
| | | | |
Actual | | $ | 1,000.00 | | | $ | 1,049.66 | | | $ | 5.67 | | | | 1.10 | % |
| | | | |
Hypothetical (5% return before expenses) | | $ | 1,000.00 | | | $ | 1,019.54 | | | $ | 5.58 | | | | 1.10 | % |
| | | | | |
Institutional Class | | | | | | | | | | | | | | | | |
| | | | |
Actual | | $ | 1,000.00 | | | $ | 1,050.85 | | | $ | 4.38 | | | | 0.85 | % |
| | | | |
Hypothetical (5% return before expenses) | | $ | 1,000.00 | | | $ | 1,020.80 | | | $ | 4.32 | | | | 0.85 | % |
| 1 | Expenses paid is equal to the annualized net expense ratio of each class multiplied by the average account value over the period, multiplied by the number of days in the most recent fiscal half-year divided by the number of days in the fiscal year (to reflect theone-half-year period). |
10 | Wells Fargo Common Stock Fund
Portfolio of investments—September 30, 2019
| | | | | | | | | | | | | | | | |
| | | | | | | | | Shares | | | Value | |
| Common Stocks: 98.35% | | | | | | | | | | | | | | | | |
| | | | |
Communication Services: 0.99% | | | | | | | | | | | | | | | | |
| | | | |
| Media: 0.99% | | | | | | | | | | | | |
Interpublic Group of Companies Incorporated | | | | | | | | | | | 494,927 | | | $ | 10,670,626 | |
| | | | | | | | | | | | | | | | |
| | | | |
Consumer Discretionary: 7.46% | | | | | | | | | | | | | | | | |
| | | | |
| Auto Components: 1.37% | | | | | | | | | | | | |
Dana Incorporated | | | | | | | | | | | 1,025,765 | | | | 14,812,047 | |
| | | | | | | | | | | | | | | | |
| | | | |
| Diversified Consumer Services: 0.49% | | | | | | | | | | | | |
Houghton Mifflin Harcourt Company † | | | | | | | | | | | 995,800 | | | | 5,307,614 | |
| | | | | | | | | | | | | | | | |
| | | | |
| Hotels, Restaurants & Leisure: 1.37% | | | | | | | | | | | | |
Jack in the Box Incorporated | | | | | | | | | | | 161,726 | | | | 14,736,473 | |
| | | | | | | | | | | | | | | | |
| | | | |
| Household Durables: 2.03% | | | | | | | | | | | | |
Mohawk Industries Incorporated † | | | | | | | | | | | 76,831 | | | | 9,532,422 | |
Whirlpool Corporation | | | | | | | | | | | 78,149 | | | | 12,375,676 | |
| | | | |
| | | | | | | | | | | | | | | 21,908,098 | |
| | | | | | | | | | | | | | | | |
| | | | |
| Internet & Direct Marketing Retail: 1.34% | | | | | | | | | | | | |
Expedia Group Incorporated | | | | | | | | | | | 107,286 | | | | 14,420,311 | |
| | | | | | | | | | | | | | | | |
| | | | |
| Specialty Retail: 0.86% | | | | | | | | | | | | |
Tractor Supply Company | | | | | | | | | | | 101,951 | | | | 9,220,448 | |
| | | | | | | | | | | | | | | | |
| | | | |
Consumer Staples: 1.11% | | | | | | | | | | | | | | | | |
| | | | |
| Household Products: 1.11% | | | | | | | | | | | | |
Church & Dwight Company Incorporated | | | | | | | | | | | 158,967 | | | | 11,960,677 | |
| | | | | | | | | | | | | | | | |
| | | | |
Energy: 2.48% | | | | | | | | | | | | | | | | |
| | | | |
| Oil, Gas & Consumable Fuels: 2.48% | | | | | | | | | | | | |
Cimarex Energy Company | | | | | | | | | | | 186,507 | | | | 8,941,146 | |
Concho Resources Incorporated | | | | | | | | | | | 91,095 | | | | 6,185,351 | |
Targa Resources Corporation | | | | | | | | | | | 287,513 | | | | 11,549,397 | |
| | | | |
| | | | | | | | | | | | | | | 26,675,894 | |
| | | | | | | | | | | | | | | | |
| | | | |
Financials: 18.42% | | | | | | | | | | | | | | | | |
| | | | |
| Banks: 5.29% | | | | | | | | | | | | |
Pinnacle Financial Partners Incorporated | | | | | | | | | | | 228,561 | | | | 12,970,837 | |
Sterling Bancorp | | | | | | | | | | | 779,161 | | | | 15,629,970 | |
Webster Financial Corporation | | | | | | | | | | | 283,014 | | | | 13,264,866 | |
Wintrust Financial Corporation | | | | | | | | | | | 234,236 | | | | 15,138,673 | |
| | | | |
| | | | | | | | | | | | | | | 57,004,346 | |
| | | | | | | | | | | | | | | | |
| | | | |
| Capital Markets: 5.32% | | | | | | | | | | | | |
CBOE Holdings Incorporated | | | | | | | | | | | 121,055 | | | | 13,910,430 | |
E*TRADE Financial Corporation | | | | | | | | | | | 535,858 | | | | 23,411,636 | |
Raymond James Financial Incorporated | | | | | | | | | | | 242,468 | | | | 19,993,911 | |
| | | | |
| | | | | | | | | | | | | | | 57,315,977 | |
| | | | | | | | | | | | | | | | |
| | | | |
| Insurance: 7.81% | | | | | | | | | | | | |
Arch Capital Group Limited † | | | | | | | | | | | 259,014 | | | | 10,873,408 | |
Axis Capital Holdings Limited | | | | | | | | | | | 147,113 | | | | 9,815,379 | |
CNO Financial Group Incorporated | | | | | | | | | | | 966,069 | | | | 15,292,872 | |
Wells Fargo Common Stock Fund | 11
Portfolio of investments—September 30, 2019
| | | | | | | | | | | | | | | | |
| | | | | | | | | Shares | | | Value | |
| | | | |
| Insurance (continued) | | | | | | | | | | | | |
First American Financial Corporation | | | | | | | | | | | 198,025 | | | $ | 11,685,455 | |
Reinsurance Group of America Incorporated | | | | | | | | | | | 106,238 | | | | 16,985,331 | |
RenaissanceRe Holdings Limited | | | | | | | | | | | 27,627 | | | | 5,344,443 | |
Willis Towers Watson plc | | | | | | | | | | | 73,510 | | | | 14,185,225 | |
| | | | |
| | | | | | | | | | | | | | | 84,182,113 | |
| | | | | | | | | | | | | | | | |
|
Health Care: 12.67% | |
|
| Biotechnology: 1.65% | |
Agios Pharmaceuticals Incorporated †« | | | | | | | | | | | 42,822 | | | | 1,387,433 | |
BioMarin Pharmaceutical Incorporated † | | | | | | | | | | | 60,924 | | | | 4,106,278 | |
Neurocrine Biosciences Incorporated † | | | | | | | | | | | 88,892 | | | | 8,010,058 | |
Sage Therapeutics Incorporated † | | | | | | | | | | | 30,819 | | | | 4,323,598 | |
| | | | |
| | | | | | | | | | | | | | | 17,827,367 | |
| | | | | | | | | | | | | | | | |
|
| Health Care Equipment & Supplies: 5.68% | |
Haemonetics Corporation † | | | | | | | | | | | 132,742 | | | | 16,744,076 | |
Hologic Incorporated † | | | | | | | | | | | 361,072 | | | | 18,230,525 | |
LivaNova plc † | | | | | | | | | | | 354,870 | | | | 26,185,857 | |
| | | | |
| | | | | | | | | | | | | | | 61,160,458 | |
| | | | | | | | | | | | | | | | |
|
| Health Care Providers & Services: 4.04% | |
Humana Incorporated | | | | | | | | | | | 37,591 | | | | 9,610,891 | |
Laboratory Corporation of America Holdings † | | | | | | | | | | | 111,625 | | | | 18,753,000 | |
Universal Health Services Incorporated Class B | | | | | | | | | | | 101,560 | | | | 15,107,050 | |
| | | | |
| | | | | | | | | | | | | | | 43,470,941 | |
| | | | | | | | | | | | | | | | |
|
| Life Sciences Tools & Services: 1.30% | |
Bio-Rad Laboratories Incorporated Class A † | | | | | | | | | | | 42,191 | | | | 14,038,633 | |
| | | | | | | | | | | | | | | | |
|
Industrials: 18.47% | |
|
| Aerospace & Defense: 1.11% | |
Hexcel Corporation | | | | | | | | | | | 145,935 | | | | 11,985,642 | |
| | | | | | | | | | | | | | | | |
|
| Airlines: 1.68% | |
Alaska Air Group Incorporated | | | | | | | | | | | 154,562 | | | | 10,032,619 | |
Spirit Airlines Incorporated † | | | | | | | | | | | 220,600 | | | | 8,007,780 | |
| | | | |
| | | | | | | | | | | | | | | 18,040,399 | |
| | | | | | | | | | | | | | | | |
|
| Building Products: 2.58% | |
Armstrong World Industries Incorporated | | | | | | | | | | | 154,114 | | | | 14,902,824 | |
Fortune Brands Home & Security Incorporated | | | | | | | | | | | 234,706 | | | | 12,838,418 | |
| | | | |
| | | | | | | | | | | | | | | 27,741,242 | |
| | | | | | | | | | | | | | | | |
|
| Commercial Services & Supplies: 2.89% | |
Republic Services Incorporated | | | | | | | | | | | 147,779 | | | | 12,790,272 | |
Stericycle Incorporated †« | | | | | | | | | | | 359,627 | | | | 18,315,803 | |
| | | | |
| | | | | | | | | | | | | | | 31,106,075 | |
| | | | | | | | | | | | | | | | |
|
| Electrical Equipment: 2.60% | |
AMETEK Incorporated | | | | | | | | | | | 153,370 | | | | 14,082,433 | |
Sensata Technologies Holding plc † | | | | | | | | | | | 278,762 | | | | 13,954,826 | |
| | | | |
| | | | | | | | | | | | | | | 28,037,259 | |
| | | | | | | | | | | | | | | | |
|
| Industrial Conglomerates: 1.70% | |
Carlisle Companies Incorporated | | | | | | | | | | | 125,879 | | | | 18,320,430 | |
| | | | | | | | | | | | | | | | |
12 | Wells Fargo Common Stock Fund
Portfolio of investments—September 30, 2019
| | | | | | | | | | | | | | | | |
| | | | | | | | | Shares | | | Value | |
| Machinery: 3.58% | |
Altra Industrial Motion Corporation | | | | | | | | | | | 372,117 | | | $ | 10,305,780 | |
Gardner Denver Holdings Incorporated † | | | | | | | | | | | 430,163 | | | | 12,169,311 | |
Rexnord Corporation † | | | | | | | | | | | 596,029 | | | | 16,122,584 | |
| | | | |
| | | | | | | | | | | | | | | 38,597,675 | |
| | | | | | | | | | | | | | | | |
|
| Road & Rail: 1.31% | |
Saia Incorporated † | | | | | | | | | | | 150,765 | | | | 14,126,681 | |
| | | | | | | | | | | | | | | | |
|
| Trading Companies & Distributors: 1.02% | |
Air Lease Corporation | | | | | | | | | | | 263,460 | | | | 11,017,897 | |
| | | | | | | | | | | | | | | | |
|
| Information Technology: 19.66% | |
|
| Electronic Equipment, Instruments & Components: 0.99% | |
Avnet Incorporated | | | | | | | | | | | 239,430 | | | | 10,651,044 | |
| | | | | | | | | | | | | | | | |
|
| IT Services: 6.37% | |
Amdocs Limited | | | | | | | | | | | 253,851 | | | | 16,782,090 | |
Black Knight Incorporated † | | | | | | | | | | | 225,718 | | | | 13,782,341 | |
Genpact Limited | | | | | | | | | | | 401,268 | | | | 15,549,135 | |
InterXion Holding NV † | | | | | | | | | | | 135,497 | | | | 11,037,586 | |
WEX Incorporated † | | | | | | | | | | | 57,087 | | | | 11,535,570 | |
| | | | |
| | | | | | | | | | | | | | | 68,686,722 | |
| | | | | | | | | | | | | | | | |
|
| Semiconductors & Semiconductor Equipment: 4.60% | |
Brooks Automation Incorporated | | | | | | | | | | | 404,009 | | | | 14,960,453 | |
Marvell Technology Group Limited | | | | | | | | | | | 617,884 | | | | 15,428,563 | |
Maxim Integrated Products Incorporated | | | | | | | | | | | 183,187 | | | | 10,608,359 | |
ON Semiconductor Corporation † | | | | | | | | | | | 445,074 | | | | 8,549,872 | |
| | | | |
| | | | | | | | | | | | | | | 49,547,247 | |
| | | | | | | | | | | | | | | | |
| | | | |
| Software: 7.70% | | | | | | | | | | | | |
8x8 Incorporated † | | | | | | | | | | | 606,651 | | | | 12,569,809 | |
Cornerstone OnDemand Incorporated † | | | | | | | | | | | 264,774 | | | | 14,514,911 | |
Nuance Communications Incorporated | | | | | | | | | | | 873,808 | | | | 14,251,808 | |
Proofpoint Incorporated † | | | | | | | | | | | 111,980 | | | | 14,451,019 | |
RealPage Incorporated † | | | | | | | | | | | 231,339 | | | | 14,541,970 | |
Zendesk Incorporated † | | | | | | | | | | | 172,803 | | | | 12,593,883 | |
| | | | |
| | | | | | | | | | | | | | | 82,923,400 | |
| | | | | | | | | | | | | | | | |
|
Materials: 7.13% | |
|
| Chemicals: 2.77% | |
Axalta Coating Systems Limited † | | | | | | | | | | | 498,990 | | | | 15,044,549 | |
Westlake Chemical Corporation | | | | | | | | | | | 226,534 | | | | 14,842,508 | |
| | | | |
| | | | | | | | | | | | | | | 29,887,057 | |
| | | | | | | | | | | | | | | | |
| | | | |
| Containers & Packaging: 1.46% | | | | | | | | | | | | |
Crown Holdings Incorporated † | | | | | | | | | | | 237,991 | | | | 15,721,685 | |
| | | | | | | | | | | | | | | | |
| | | | |
| Metals & Mining: 2.90% | | | | | | | | | | | | |
Royal Gold Incorporated | | | | | | | | | | | 128,147 | | | | 15,788,992 | |
Steel Dynamics Incorporated | | | | | | | | | | | 516,857 | | | | 15,402,339 | |
| | | | |
| | | | | | | | | | | | | | | 31,191,331 | |
| | | | | | | | | | | | | | | | |
| | | | |
Real Estate: 9.96% | | | | | | | | | | | | | | | | |
| | | | |
| Equity REITs: 9.96% | | | | | | | | | | | | |
Camden Property Trust | | | | | | | | | | | 131,467 | | | | 14,594,152 | |
CoreSite Realty Corporation | | | | | | | | | | | 120,948 | | | | 14,737,514 | |
Wells Fargo Common Stock Fund | 13
Portfolio of investments—September 30, 2019
| | | | | | | | | | | | | | | | |
| | | | | | | | | Shares | | | Value | |
| | | | |
| Equity REITs (continued) | | | | | | | | | | | | |
Four Corners Property Trust Incorporated | | | | | | | | | | | 378,313 | | | $ | 10,698,692 | |
Healthcare Realty Trust Incorporated | | | | | | | | | | | 525,439 | | | | 17,602,203 | |
SBA Communications Corporation | | | | | | | | | | | 62,723 | | | | 15,125,651 | |
Sun Communities Incorporated | | | | | | | | | | | 121,075 | | | | 17,973,584 | |
VICI Properties Incorporated | | | | | | | | | | | 731,967 | | | | 16,579,053 | |
| | | | |
| | | | | | | | | | | | | | | 107,310,849 | |
| | | | | | | | | | | | | | | | |
| | | | |
Total Common Stocks (Cost $798,521,961) | | | | | | | | | | | | | | | 1,059,604,658 | |
| | | | | | | | | | | | | | | | |
| | | | |
| Exchange-Traded Funds: 0.51% | | | | | | | | | | | | |
SPDR S&P Biotech ETF « | | | | | | | | | | | 72,775 | | | | 5,549,094 | |
| | | | | | | | | | | | | | | | |
| | | | |
Total Exchange-Traded Funds (Cost $3,264,222) | | | | | | | | | | | | | | | 5,549,094 | |
| | | | | | | | | | | | | | | | |
| | | | |
| | | | | | | | | | | | | | | | |
| | | Yield | | | | | | | | | | |
| Short-Term Investments: 2.29% | | | | | | | | | | | | | | | | |
| | | | |
| Investment Companies: 2.29% | | | | | | | | | | | | |
Securities Lending Cash Investments LLC (l)(r)(u) | | | 2.11 | % | | | | | | | 9,518,064 | | | | 9,519,016 | |
Wells Fargo Government Money Market Fund Select Class (l)(u) | | | 1.88 | | | | | | | | 15,119,436 | | | | 15,119,436 | |
| | | | |
Total Short-Term Investments (Cost $24,638,216) | | | | | | | | | | | | | | | 24,638,452 | |
| | | | | | | | | | | | | | | | |
| | | | | | | | |
| Total investments in securities (Cost $826,424,399) | | | 101.15 | % | | | 1,089,792,204 | |
| | |
Other assets and liabilities, net | | | (1.15 | ) | | | (12,430,615 | ) |
| | | | | | | | |
| Total net assets | | | 100.00 | % | | $ | 1,077,361,589 | |
| | | | | | | | |
| † | Non-income-earning security |
| « | All or a portion of this security is on loan. |
| (l) | The issuer of the security is an affiliated person of the Fund as defined in the Investment Company Act of 1940. |
| (r) | The investment is anon-registered investment company purchased with cash collateral received from securities on loan. |
| (u) | The rate represents the7-day annualized yield at period end. |
Abbreviations:
| REIT | Real estate investment trust |
Investments in Affiliates
An affiliated investment is an investment in which the Fund owns at least 5% of the outstanding voting shares of the issuer or as a result of other relationships, such as the Fund and the issuer having the same investment manager. Transactions with issuers that were either affiliated persons of the Fund at the beginning of the period or the end of the period were as follows:
| | | | | | | | | | | | | | | | | | | | | | | | | | | | | | | | | | | | |
| | | Shares,
beginning of
period | | | Shares
purchased | | | Shares sold | | | Shares, end of
period | | | Net
realized
gains
(losses) | | | Net
change in
unrealized
gains
(losses) | | | Income
from
affiliated
securities | | | Value, end of period | | | % of
net
assets | |
| | | | | | | | | |
| Short-Term Investments | | | | | | | | | | | | | | | | | | | | | | | | | | | |
Investment Companies | | | | | | | | | | | | | | | | | | | | | | | | | | | | | | | | | | | | |
Securities Lending Cash Investments LLC | | | 13,692,114 | | | | 153,878,525 | | | | 158,052,575 | | | | 9,518,064 | | | $ | 366 | | | $ | (1,134 | ) | | $ | 202,393 | # | | $ | 9,519,016 | | | | | |
Wells Fargo Government Money Market Fund Select Class | | | 35,775,121 | | | | 230,886,049 | | | | 251,541,734 | | | | 15,119,436 | | | | 0 | | | | 0 | | | | 407,203 | | | | 15,119,436 | | | | | |
| | | | | | | | | | | | | | | | | | | | | | | | | | | | | | | | | | | | |
| | | | | | | | | | | | | | | | | | $ | 366 | | | $ | (1,134 | ) | | $ | 609,596 | | | $ | 24,638,452 | | | | 2.29 | % |
| | | | | | | | | | | | | | | | | | | | | | | | | | | | | | | | | | | | |
| # | Amount shown represents income before fees and rebates. |
The accompanying notes are an integral part of these financial statements.
14 | Wells Fargo Common Stock Fund
Statement of assets and liabilities—September 30, 2019
| | | | |
| | | | |
| |
Assets | | | | |
Investments in unaffiliated securities (including $9,319,372 of securities loaned), at value (cost $801,786,183) | | $ | 1,065,153,752 | |
Investments in affiliated securities, at value (cost $24,638,216) | | | 24,638,452 | |
Receivable for investments sold | | | 867,632 | |
Receivable for Fund shares sold | | | 290,733 | |
Receivable for dividends | | | 1,207,752 | |
Receivable for securities lending income, net | | | 4,025 | |
| | | | |
Total assets | | | 1,092,162,346 | |
| | | | |
| |
Liabilities | | | | |
Payable upon receipt of securities loaned | | | 9,517,275 | |
Payable for investments purchased | | | 3,011,577 | |
Payable for Fund shares redeemed | | | 907,409 | |
Management fee payable | | | 675,900 | |
Administration fees payable | | | 171,051 | |
Distribution fee payable | | | 4,946 | |
Trustees’ fees and expenses payable | | | 2,278 | |
Accrued expenses and other liabilities | | | 510,321 | |
| | | | |
Total liabilities | | | 14,800,757 | |
| | | | |
Total net assets | | $ | 1,077,361,589 | |
| | | | |
| |
Net assets consist of | | | | |
Paid-in capital | | $ | 706,896,007 | |
Total distributable earnings | | | 370,465,582 | |
| | | | |
Total net assets | | $ | 1,077,361,589 | |
| | | | |
| |
Computation of net asset value and offering price per share | | | | |
Net assets – Class A | | $ | 870,369,206 | |
Shares outstanding – Class A1 | | | 41,305,205 | |
Net asset value per share – Class A | | | $21.07 | |
Maximum offering price per share – Class A2 | | | $22.36 | |
Net assets – Class C | | $ | 7,924,998 | |
Shares outstanding – Class C1 | | | 538,453 | |
Net asset value per share – Class C | | | $14.72 | |
Net assets – Class R6 | | $ | 36,069,355 | |
Shares outstanding – Class R61 | | | 1,610,888 | |
Net asset value per share – Class R6 | | | $22.39 | |
Net assets – Administrator Class | | $ | 3,572,456 | |
Shares outstanding – Administrator Class1 | | | 165,677 | |
Net asset value per share – Administrator Class | | | $21.56 | |
Net assets – Institutional Class | | $ | 159,425,574 | |
Shares outstanding – Institutional Class1 | | | 7,143,121 | |
Net asset value per share – Institutional Class | | | $22.32 | |
| 1 | The Fund has an unlimited number of authorized shares. |
| 2 | Maximum offering price is computed as 100/94.25 of net asset value. On investments of $50,000 or more, the offering price is reduced. |
The accompanying notes are an integral part of these financial statements.
Wells Fargo Common Stock Fund | 15
Statement of operations—year ended September 30, 2019
| | | | |
| | | | |
| |
Investment income | | | | |
Dividends | | $ | 12,823,208 | |
Income from affiliated securities | | | 446,042 | |
| | | | |
Total investment income | | | 13,269,250 | |
| | | | |
| |
Expenses | | | | |
Management fee | | | 8,303,090 | |
Administration fees | |
Class A | | | 1,836,254 | |
Class C | | | 22,618 | |
Class R6 | | | 10,888 | |
Administrator Class | | | 5,250 | |
Institutional Class | | | 199,802 | |
Shareholder servicing fees | |
Class A | | | 2,186,016 | |
Class C | | | 26,927 | |
Administrator Class | | | 10,096 | |
Distribution fee | |
Class C | | | 80,771 | |
Custody and accounting fees | | | 68,274 | |
Professional fees | | | 51,794 | |
Registration fees | | | 78,025 | |
Shareholder report expenses | | | 68,274 | |
Trustees’ fees and expenses | | | 24,623 | |
Other fees and expenses | | | 35,974 | |
| | | | |
Total expenses | | | 13,008,676 | |
Less: Fee waivers and/or expense reimbursements | |
Fund-level | | | (512 | ) |
Class A | | | (12,217 | ) |
Class C | | | (172 | ) |
Administrator Class | | | (3,166 | ) |
Institutional Class | | | (122,650 | ) |
| | | | |
Net expenses | | | 12,869,959 | |
| | | | |
Net investment income | | | 399,291 | |
| | | | |
| |
Realized and unrealized gains (losses) on investments | | | | |
Net realized gains on | | | | |
Unaffiliated securities | | | 120,517,167 | |
Affiliated securities | | | 366 | |
| | | | |
Net realized gains on investments | | | 120,517,533 | |
| | | | |
|
Net change in unrealized gains (losses) on | |
Unaffiliated securities | | | (119,777,927 | ) |
Affiliated securities | | | (1,134 | ) |
| | | | |
Net change in unrealized gains (losses) on investments | | | (119,779,061 | ) |
| | | | |
Net realized and unrealized gains (losses) on investments | | | 738,472 | |
| | | | |
Net increase in net assets resulting from operations | | $ | 1,137,763 | |
| | | | |
The accompanying notes are an integral part of these financial statements.
16 | Wells Fargo Common Stock Fund
Statement of changes in net assets
| | | | | | | | | | | | | | | | |
| | | Year ended
September 30, 2019 | | | Year ended
September 30, 2018 | |
| | | | |
Operations | | | | | | | | | | | | | | | | |
Net investment income (loss) | | | | | | $ | 399,291 | | | | | | | $ | (1,480,238 | ) |
Net realized gains on investments | | | | | | | 120,517,533 | | | | | | | | 168,782,075 | |
Net change in unrealized gains (losses) on investments | | | | | | | (119,779,061 | ) | | | | | | | (10,618,967 | ) |
| | | | |
Net increase in net assets resulting from operations | | | | | | | 1,137,763 | | | | | | | | 156,682,870 | |
| | | | |
| | | |
Distributions to shareholders from net investment income and net realized gains | | | | | | | | | | | | | |
Class A | | | | | | | (128,198,379 | ) | | | | | | | (97,640,556 | ) |
Class C | | | | | | | (2,840,840 | ) | | | | | | | (2,494,352 | ) |
Class R6 | | | | | | | (4,757,555 | ) | | | | | | | (11,401,103 | ) |
Administrator Class | | | | | | | (749,896 | ) | | | | | | | (613,023 | ) |
Institutional Class | | | | | | | (20,825,630 | ) | | | | | | | (16,747,502 | ) |
| | | | |
Total distributions to shareholders | | | | | | | (157,372,300 | ) | | | | | | | (128,896,536 | ) |
| | | | |
| | | | |
Capital share transactions | | | Shares | | | | | | | | Shares | | | | | |
Proceeds from shares sold | | | | | | | | | | | | | | | | |
Class A | | | 957,344 | | | | 19,146,985 | | | | 651,357 | | | | 15,351,401 | |
Class C | | | 120,120 | | | | 1,584,422 | | | | 43,484 | | | | 772,480 | |
Class R6 | | | 410,149 | | | | 9,044,599 | | | | 278,881 | | | | 6,924,814 | |
Administrator Class | | | 7,616 | | | | 156,460 | | | | 37,039 | | | | 896,077 | |
Institutional Class | | | 958,488 | | | | 21,044,807 | | | | 894,739 | | | | 22,089,498 | |
| | | | |
| | | | | | | 50,977,273 | | | | | | | | 46,034,270 | |
| | | | |
Reinvestment of distributions | | | | | | | | | | | | | | | | |
Class A | | | 6,577,466 | | | | 122,340,875 | | | | 4,106,240 | | | | 92,965,271 | |
Class C | | | 202,645 | | | | 2,648,573 | | | | 137,871 | | | | 2,350,702 | |
Class R6 | | | 240,179 | | | | 4,729,116 | | | | 481,095 | | | | 11,397,143 | |
Administrator Class | | | 36,844 | | | | 700,411 | | | | 24,808 | | | | 571,322 | |
Institutional Class | | | 1,038,739 | | | | 20,390,438 | | | | 696,871 | | | | 16,460,103 | |
| | | | |
| | | | | | | 150,809,413 | | | | | | | | 123,744,541 | |
| | | | |
Payment for shares redeemed | | | | | | | | | | | | | | | | |
Class A | | | (5,755,346 | ) | | | (115,611,722 | ) | | | (4,413,777 | ) | | | (104,881,783 | ) |
Class C | | | (683,062 | ) | | | (9,629,160 | ) | | | (295,049 | ) | | | (5,313,557 | ) |
Class R6 | | | (453,488 | ) | | | (10,013,010 | ) | | | (3,965,442 | ) | | | (93,857,873 | ) |
Administrator Class | | | (124,075 | ) | | | (2,358,961 | ) | | | (76,020 | ) | | | (1,845,632 | ) |
Institutional Class | | | (1,546,702 | ) | | | (33,665,647 | ) | | | (1,608,638 | ) | | | (39,681,646 | ) |
| | | | |
| | | | | | | (171,278,500 | ) | | | | | | | (245,580,491 | ) |
| | | | |
Net increase (decrease) in net assets resulting from capital share transactions | | | | | | | 30,508,186 | | | | | | | | (75,801,680 | ) |
| | | | |
Total decrease in net assets | | | | | | | (125,726,351 | ) | | | | | | | (48,015,346 | ) |
| | | | |
| | | | |
Net assets | | | | | | | | | | | | | | | | |
Beginning of period | | | | | | | 1,203,087,940 | | | | | | | | 1,251,103,286 | |
| | | | |
End of period | | | | | | $ | 1,077,361,589 | | | | | | | $ | 1,203,087,940 | |
| | | | |
The accompanying notes are an integral part of these financial statements.
Wells Fargo Common Stock Fund | 17
Financial highlights
(For a share outstanding throughout each period)
| | | | | | | | | | | | | | | | | | | | |
| | | Year ended September 30 | |
| CLASS A | | 2019 | | | 2018 | | | 2017 | | | 2016 | | | 2015 | |
Net asset value, beginning of period | | | $24.58 | | | | $24.06 | | | | $21.50 | | | | $21.62 | | | | $24.79 | |
Net investment loss | | | (0.01 | ) | | | (0.04 | ) | | | (0.09 | ) | | | (0.01 | )1 | | | (0.04 | )1 |
Net realized and unrealized gains (losses) on investments | | | (0.20 | ) | | | 3.10 | | | | 3.48 | | | | 2.45 | | | | (0.32 | ) |
| | | | | | | | | | | | | | | | | | | | |
Total from investment operations | | | (0.21 | ) | | | 3.06 | | | | 3.39 | | | | 2.44 | | | | (0.36 | ) |
Distributions to shareholders from | | | | | | | | | | | | | | | | | | | | |
Net realized gains | | | (3.30 | ) | | | (2.54 | ) | | | (0.83 | ) | | | (2.56 | ) | | | (2.81 | ) |
Net asset value, end of period | | | $21.07 | | | | $24.58 | | | | $24.06 | | | | $21.50 | | | | $21.62 | |
Total return2 | | | 0.91 | % | | | 13.62 | % | | | 16.10 | % | | | 12.43 | % | | | (1.76 | )% |
Ratios to average net assets (annualized) | | | | | | | | | | | | | | | | | | | | |
Gross expenses | | | 1.26 | % | | | 1.25 | % | | | 1.25 | % | | | 1.25 | % | | | 1.27 | % |
Net expenses | | | 1.26 | % | | | 1.25 | % | | | 1.25 | % | | | 1.25 | % | | | 1.26 | % |
Net investment loss | | | (0.03 | )% | | | (0.18 | )% | | | (0.38 | )% | | | (0.05 | )% | | | (0.19 | )% |
Supplemental data | | | | | | | | | | | | | | | | | | | | |
Portfolio turnover rate | | | 40 | % | | | 33 | % | | | 35 | % | | | 32 | % | | | 51 | % |
Net assets, end of period (000s omitted) | | | $870,369 | | | | $971,731 | | | | $942,596 | | | | $924,864 | | | | $127,732 | |
| 1 | Calculated based upon average shares outstanding |
| 2 | Total return calculations do not include any sales charges. |
The accompanying notes are an integral part of these financial statements.
18 | Wells Fargo Common Stock Fund
Financial highlights
(For a share outstanding throughout each period)
| | | | | | | | | | | | | | | | | | | | |
| | | Year ended September 30 | |
| CLASS C | | 2019 | | | 2018 | | | 2017 | | | 2016 | | | 2015 | |
Net asset value, beginning of period | | | $18.40 | | | | $18.75 | | | | $17.04 | | | | $17.77 | | | | $21.02 | |
Net investment loss | | | (0.11 | )1 | | | (0.17 | )1 | | | (0.20 | )1 | | | (0.14 | )1 | | | (0.18 | ) |
Net realized and unrealized gains (losses) on investments | | | (0.27 | ) | | | 2.36 | | | | 2.74 | | | | 1.97 | | | | (0.26 | ) |
| | | | | | | | | | | | | | | | | | | | |
Total from investment operations | | | (0.38 | ) | | | 2.19 | | | | 2.54 | | | | 1.83 | | | | (0.44 | ) |
Distributions to shareholders from | | | | | | | | | | | | | | | | | | | | |
Net realized gains | | | (3.30 | ) | | | (2.54 | ) | | | (0.83 | ) | | | (2.56 | ) | | | (2.81 | ) |
Net asset value, end of period | | | $14.72 | | | | $18.40 | | | | $18.75 | | | | $17.04 | | | | $17.77 | |
Total return2 | | | 0.17 | % | | | 12.74 | % | | | 15.29 | % | | | 11.52 | % | | | (2.49 | )% |
Ratios to average net assets (annualized) | | | | | | | | | | | | | | | | | | | | |
Gross expenses | | | 2.01 | % | | | 2.00 | % | | | 2.00 | % | | | 2.00 | % | | | 2.02 | % |
Net expenses | | | 2.01 | % | | | 2.00 | % | | | 2.00 | % | | | 2.00 | % | | | 2.00 | % |
Net investment loss | | | (0.78 | )% | | | (0.94 | )% | | | (1.14 | )% | | | (0.87 | )% | | | (0.93 | )% |
Supplemental data | | | | | | | | | | | | | | | | | | | | |
Portfolio turnover rate | | | 40 | % | | | 33 | % | | | 35 | % | | | 32 | % | | | 51 | % |
Net assets, end of period (000s omitted) | | | $7,925 | | | | $16,541 | | | | $18,978 | | | | $22,902 | | | | $25,668 | |
| 1 | Calculated based upon average shares outstanding |
| 2 | Total return calculations do not include any sales charges. |
The accompanying notes are an integral part of these financial statements.
Wells Fargo Common Stock Fund | 19
Financial highlights
(For a share outstanding throughout each period)
| | | | | | | | | | | | | | | | | | | | |
| | | Year ended September 30 | |
| CLASS R6 | | 2019 | | | 2018 | | | 2017 | | | 2016 | | | 2015 | |
Net asset value, beginning of period | | | $25.80 | | | | $25.03 | | | | $22.25 | | | | $22.20 | | | | $25.27 | |
Net investment income | | | 0.09 | 1 | | | 0.05 | 1 | | | 0.01 | | | | 0.07 | 1 | | | 0.05 | |
Net realized and unrealized gains (losses) on investments | | | (0.20 | ) | | | 3.26 | | | | 3.60 | | | | 2.54 | | | | (0.31 | ) |
| | | | | | | | | | | | | | | | | | | | |
Total from investment operations | | | (0.11 | ) | | | 3.31 | | | | 3.61 | | | | 2.61 | | | | (0.26 | ) |
Distributions to shareholders from | | | | | | | | | | | | | | | | | | | | |
Net realized gains | | | (3.30 | ) | | | (2.54 | ) | | | (0.83 | ) | | | (2.56 | ) | | | (2.81 | ) |
Net asset value, end of period | | | $22.39 | | | | $25.80 | | | | $25.03 | | | | $22.25 | | | | $22.20 | |
Total return | | | 1.31 | % | | | 14.12 | % | | | 16.56 | % | | | 12.91 | % | | | (1.29 | )% |
Ratios to average net assets (annualized) | | | | | | | | | | | | | | | | | | | | |
Gross expenses | | | 0.83 | % | | | 0.82 | % | | | 0.82 | % | | | 0.82 | % | | | 0.80 | % |
Net expenses | | | 0.83 | % | | | 0.82 | % | | | 0.82 | % | | | 0.82 | % | | | 0.80 | % |
Net investment income | | | 0.40 | % | | | 0.20 | % | | | 0.05 | % | | | 0.32 | % | | | 0.28 | % |
Supplemental data | | | | | | | | | | | | | | | | | | | | |
Portfolio turnover rate | | | 40 | % | | | 33 | % | | | 35 | % | | | 32 | % | | | 51 | % |
Net assets, end of period (000s omitted) | | | $36,069 | | | | $36,477 | | | | $115,641 | | | | $101,436 | | | | $95,037 | |
| 1 | Calculated based upon average shares outstanding |
The accompanying notes are an integral part of these financial statements.
20 | Wells Fargo Common Stock Fund
Financial highlights
(For a share outstanding throughout each period)
| | | | | | | | | | | | | | | | | | | | |
| | | Year ended September 30 | |
| ADMINISTRATOR CLASS | | 2019 | | | 2018 | | | 2017 | | | 2016 | | | 2015 | |
Net asset value, beginning of period | | | $25.04 | | | | $24.42 | | | | $21.78 | | | | $21.84 | | | | $24.98 | |
Net investment income (loss) | | | 0.03 | | | | (0.01 | )1 | | | (0.06 | )1 | | | 0.02 | | | | (0.01 | )1 |
Net realized and unrealized gains (losses) on investments | | | (0.21 | ) | | | 3.17 | | | | 3.53 | | | | 2.48 | | | | (0.32 | ) |
| | | | | | | | | | | | | | | | | | | | |
Total from investment operations | | | (0.18 | ) | | | 3.16 | | | | 3.47 | | | | 2.50 | | | | (0.33 | ) |
Distributions to shareholders from | | | | | | | | | | | | | | | | | | | | |
Net realized gains | | | (3.30 | ) | | | (2.54 | ) | | | (0.83 | ) | | | (2.56 | ) | | | (2.81 | ) |
Net asset value, end of period | | | $21.56 | | | | $25.04 | | | | $24.42 | | | | $21.78 | | | | $21.84 | |
Total return | | | 1.03 | % | | | 13.84 | % | | | 16.26 | % | | | 12.59 | % | | | (1.62 | )% |
Ratios to average net assets (annualized) | | | | | | | | | | | | | | | | | | | | |
Gross expenses | | | 1.18 | % | | | 1.17 | % | | | 1.17 | % | | | 1.17 | % | | | 1.12 | % |
Net expenses | | | 1.10 | % | | | 1.10 | % | | | 1.10 | % | | | 1.10 | % | | | 1.10 | % |
Net investment income (loss) | | | 0.14 | % | | | (0.04 | )% | | | (0.27 | )% | | | 0.03 | % | | | (0.03 | )% |
Supplemental data | | | | | | | | | | | | | | | | | | | | |
Portfolio turnover rate | | | 40 | % | | | 33 | % | | | 35 | % | | | 32 | % | | | 51 | % |
Net assets, end of period (000s omitted) | | | $3,572 | | | | $6,141 | | | | $6,336 | | | | $16,720 | | | | $18,050 | |
| 1 | Calculated based upon average shares outstanding |
The accompanying notes are an integral part of these financial statements.
Wells Fargo Common Stock Fund | 21
Financial highlights
(For a share outstanding throughout each period)
| | | | | | | | | | | | | | | | | | | | |
| | | Year ended September 30 | |
| INSTITUTIONAL CLASS | | 2019 | | | 2018 | | | 2017 | | | 2016 | | | 2015 | |
Net asset value, beginning of period | | | $25.73 | | | | $24.97 | | | | $22.20 | | | | $22.16 | | | | $25.25 | |
Net investment income | | | 0.08 | 1 | | | 0.05 | 1 | | | 0.00 | 1,2 | | | 0.06 | 1 | | | 0.03 | |
Net realized and unrealized gains (losses) on investments | | | (0.19 | ) | | | 3.25 | | | | 3.60 | | | | 2.54 | | | | (0.31 | ) |
| | | | | | | | | | | | | | | | | | | | |
Total from investment operations | | | (0.11 | ) | | | 3.30 | | | | 3.60 | | | | 2.60 | | | | (0.28 | ) |
Distributions to shareholders from | | | | | | | | | | | | | | | | | | | | |
Net realized gains | | | (3.30 | ) | | | (2.54 | ) | | | (0.83 | ) | | | (2.56 | ) | | | (2.81 | ) |
Net asset value, end of period | | | $22.32 | | | | $25.73 | | | | $24.97 | | | | $22.20 | | | | $22.16 | |
Total return | | | 1.31 | % | | | 14.12 | % | | | 16.55 | % | | | 12.88 | % | | | (1.38 | )% |
Ratios to average net assets (annualized) | | | | | | | | | | | | | | | | | | | | |
Gross expenses | | | 0.93 | % | | | 0.92 | % | | | 0.92 | % | | | 0.92 | % | | | 0.86 | % |
Net expenses | | | 0.85 | % | | | 0.85 | % | | | 0.85 | % | | | 0.85 | % | | | 0.85 | % |
Net investment income | | | 0.37 | % | | | 0.21 | % | | | 0.02 | % | | | 0.28 | % | | | 0.24 | % |
Supplemental data | | | | | | | | | | | | | | | | | | | | |
Portfolio turnover rate | | | 40 | % | | | 33 | % | | | 35 | % | | | 32 | % | | | 51 | % |
Net assets, end of period (000s omitted) | | | $159,426 | | | | $172,197 | | | | $167,552 | | | | $173,175 | | | | $226,729 | |
| 1 | Calculated based upon average shares outstanding |
| 2 | Amount is less than $0.005. |
The accompanying notes are an integral part of these financial statements.
22 | Wells Fargo Common Stock Fund
Notes to financial statements
1. ORGANIZATION
Wells Fargo Funds Trust (the “Trust”), a Delaware statutory trust organized on March 10, 1999, is anopen-end management investment company registered under the Investment Company Act of 1940, as amended (the “1940 Act”). As an investment company, the Trust follows the accounting and reporting guidance in Financial Accounting Standards Board (“FASB”)Accounting Standards Codification Topic 946, Financial Services – Investment Companies. These financial statements report on the Wells Fargo Common Stock Fund (the “Fund”) which is a diversified series of the Trust.
2. SIGNIFICANT ACCOUNTING POLICIES
The following significant accounting policies, which are consistently followed in the preparation of the financial statements of the Fund, are in conformity with U.S. generally accepted accounting principles which require management to make estimates and assumptions that affect the reported amounts of assets and liabilities, disclosure of contingent assets and liabilities at the date of the financial statements, and the reported amounts of revenues and expenses during the reporting period. Actual results could differ from those estimates.
Securities valuation
All investments are valued each business day as of the close of regular trading on the New York Stock Exchange (generally 4 p.m. Eastern Time), although the Fund may deviate from this calculation time under unusual or unexpected circumstances.
Equity securities that are listed on a foreign or domestic exchange or market are valued at the official closing price or, if none, the last sales price. If no sale occurs on the principal exchange or market that day, a fair value price will be determined in accordance with the Fund’s Valuation Procedures.
Investments in registeredopen-end investment companies are valued at net asset value. Interests innon-registered investment companies that are redeemable at net asset value are fair valued normally at net asset value.
Investments which are not valued using any of the methods discussed above are valued at their fair value, as determined in good faith by the Board of Trustees of the Fund. The Board of Trustees has established a Valuation Committee comprised of the Trustees and has delegated to it the authority to take any actions regarding the valuation of portfolio securities that the Valuation Committee deems necessary or appropriate, including determining the fair value of portfolio securities, unless the determination has been delegated to the Wells Fargo Asset Management Pricing Committee at Wells Fargo Funds Management, LLC (“Funds Management”). The Board of Trustees retains the authority to make or ratify any valuation decisions or approve any changes to the Valuation Procedures as it deems appropriate. On a quarterly basis, the Board of Trustees receives reports on any valuation actions taken by the Valuation Committee or the Wells Fargo Asset Management Pricing Committee which may include items for ratification.
Securities lending
The Fund may lend its securities from time to time in order to earn additional income in the form of fees or interest on securities received as collateral or the investment of any cash received as collateral. When securities are on loan, the Fund receives interest or dividends on those securities. Cash collateral received in connection with its securities lending transactions is invested in Securities Lending Cash Investments, LLC (the “Securities Lending Fund”). Investments in Securities Lending Fund are valued at the evaluated bid price provided by an independent pricing service. Income earned from investment in the Securities Lending Fund (net of fees and rebates), if any, is included in income from affiliated securities on the Statement of Operations.
In a securities lending transaction, the net asset value of the Fund is affected by an increase or decrease in the value of the securities loaned and by an increase or decrease in the value of the instrument in which collateral is invested. The amount of securities lending activity undertaken by the Fund fluctuates from time to time. The Fund has the right under the lending agreement to recover the securities from the borrower on demand. In the event of default or bankruptcy by the borrower, the Fund may be prevented from recovering the loaned securities or gaining access to the collateral or may experience delays or costs in doing so. In such an event, the terms of the agreement allows the unaffiliated securities lending agent to use the collateral to purchase replacement securities on behalf of the Fund or pay the Fund the market value of the loaned securities. The Fund bears the risk of loss with respect to depreciation of its investment of the cash collateral.
Security transactions and income recognition
Securities transactions are recorded on a trade date basis. Realized gains or losses are recorded on the basis of identified cost.
Dividend income is recognized on theex-dividend date.
Income dividends and capital gain distributions from investment companies are recorded on theex-dividend date. Capital gain distributions from investment companies are treated as realized gains.
Wells Fargo Common Stock Fund | 23
Notes to financial statements
Distributions to shareholders
Distributions to shareholders from net investment income and any net realized gains are recorded on theex-dividend date and paid at least annually. Such distributions are determined in accordance with income tax regulations and may differ from U.S. generally accepted accounting principles. Dividend sources are estimated at the time of declaration. The tax character of distributions is determined as of the Fund’s fiscal year end. Therefore, a portion of the Fund’s distributions made prior to the Fund’s fiscal year end may be categorized as a tax return of capital at year end.
Federal and other taxes
The Fund intends to continue to qualify as a regulated investment company by distributing substantially all of its investment company taxable income and any net realized capital gains (after reduction for capital loss carryforwards) sufficient to relieve it from all, or substantially all, federal income taxes. Accordingly, no provision for federal income taxes was required.
The Fund’s income and federal excise tax returns and all financial records supporting those returns for the prior three fiscal years are subject to examination by the federal and Delaware revenue authorities. Management has analyzed the Fund’s tax positions taken on federal, state, and foreign tax returns for all open tax years and does not believe that there are any uncertain tax positions that require recognition of a tax liability.
As of September 30, 2019, the aggregate cost of all investments for federal income tax purposes was $834,294,936 and the unrealized gains (losses) consisted of:
| | | | |
| |
Gross unrealized gains | | $ | 297,516,690 | |
| |
Gross unrealized losses | | | (42,019,422 | ) |
| |
Net unrealized gains | | $ | 255,497,268 | |
Class allocations
The separate classes of shares offered by the Fund differ principally in applicable sales charges, distribution, shareholder servicing, and administration fees. Class specific expenses are charged directly to that share class. Investment income, common fund-level expenses, and realized and unrealized gains (losses) on investments are allocated daily to each class of shares based on the relative proportion of net assets of each class.
3. FAIR VALUATION MEASUREMENTS
Fair value measurements of investments are determined within a framework that has established a fair value hierarchy based upon the various data inputs utilized in determining the value of the Fund’s investments. The three-level hierarchy gives the highest priority to unadjusted quoted prices in active markets for identical assets or liabilities (Level 1) and the lowest priority to unobservable inputs (Level 3). The Fund’s investments are classified within the fair value hierarchy based on the lowest level of input that is significant to the fair value measurement. The inputs are summarized into three broad levels as follows:
| ∎ | | Level 1 – quoted prices in active markets for identical securities |
| ∎ | | Level 2 – other significant observable inputs (including quoted prices for similar securities, interest rates, prepayment speeds, credit risk, etc.) |
| ∎ | | Level 3 – significant unobservable inputs (including the Fund’s own assumptions in determining the fair value of investments) |
The inputs or methodologies used for valuing investments in securities are not necessarily an indication of the risk associated with investing in those securities.
24 | Wells Fargo Common Stock Fund
Notes to financial statements
The following is a summary of the inputs used in valuing the Fund’s assets and liabilities as of September 30, 2019:
| | | | | | | | | | | | | | | | |
| | | | |
| | | Quoted prices (Level 1) | | | Other significant
observable inputs (Level 2) | | | Significant
unobservable inputs (Level 3) | | | Total | |
| | | | |
Assets | | | | | | | | | | | | | | | | |
Investments in: | | | | | | | | | | | | | | | | |
| | | | |
Common stocks | | | | | | | | | | | | | | | | |
| | | | |
Communication services | | $ | 10,670,626 | | | $ | 0 | | | $ | 0 | | | $ | 10,670,626 | |
| | | | |
Consumer discretionary | | | 80,404,991 | | | | 0 | | | | 0 | | | | 80,404,991 | |
| | | | |
Consumer staples | | | 11,960,677 | | | | 0 | | | | 0 | | | | 11,960,677 | |
| | | | |
Energy | | | 26,675,894 | | | | 0 | | | | 0 | | | | 26,675,894 | |
| | | | |
Financials | | | 198,502,436 | | | | 0 | | | | 0 | | | | 198,502,436 | |
| | | | |
Health care | | | 136,497,399 | | | | 0 | | | | 0 | | | | 136,497,399 | |
| | | | |
Industrials | | | 198,973,300 | | | | 0 | | | | 0 | | | | 198,973,300 | |
| | | | |
Information technology | | | 211,808,413 | | | | 0 | | | | 0 | | | | 211,808,413 | |
| | | | |
Materials | | | 76,800,073 | | | | 0 | | | | 0 | | | | 76,800,073 | |
| | | | |
Real estate | | | 107,310,849 | | | | 0 | | | | 0 | | | | 107,310,849 | |
| | | | |
Exchange-traded funds | | | 5,549,094 | | | | 0 | | | | 0 | | | | 5,549,094 | |
| | | | |
Short-term investments | | | | | | | | | | | | | | | | |
| | | | |
Investment companies | | | 24,638,452 | | | | 0 | | | | 0 | | | | 24,638,452 | |
| | | | |
Total assets | | $ | 1,089,792,204 | | | $ | 0 | | | $ | 0 | | | $ | 1,089,792,204 | |
Additional sector, industry or geographic detail is included in the Portfolio of Investments.
For the year ended September 30, 2019, the Fund did not have any transfers into/out of Level 3.
4. TRANSACTIONS WITH AFFILIATES
Management fee
Funds Management, an indirect wholly owned subsidiary of Wells Fargo & Company (“Wells Fargo”), is the manager of the Fund and provides advisory and fund-level administrative services under an investment management agreement. Under the investment management agreement, Funds Management is responsible for, among other services, implementing the investment objectives and strategies of the Fund, supervising the subadviser and providing fund-level administrative services in connection with the Fund’s operations. As compensation for its services under the investment management agreement, Funds Management is entitled to receive a management fee at the following annual rate based on the Fund’s average daily net assets:
| | | | |
| |
| Average daily net assets | | Management fee | |
| |
First $500 million | | | 0.800 | % |
| |
Next $500 million | | | 0.750 | |
| |
Next $1 billion | | | 0.700 | |
| |
Next $2 billion | | | 0.675 | |
| |
Next $1 billion | | | 0.650 | |
| |
Next $5 billion | | | 0.640 | |
| |
Over $10 billion | | | 0.630 | |
For the year ended September 30, 2019, the management fee was equivalent to an annual rate of 0.77% of the Fund’s average daily net assets.
Funds Management has retained the services of a subadviser to provide daily portfolio management to the Fund. The fee for subadvisory services is borne by Funds Management. Wells Capital Management Incorporated (“WellsCap”), an affiliate of Funds Management and an indirect wholly owned subsidiary of Wells Fargo, is the subadviser to the Fund and is entitled to receive a fee from Funds Management at an annual rate starting at 0.45% and declining to 0.30% as the average daily net assets of the Fund increase.
Wells Fargo Common Stock Fund | 25
Notes to financial statements
Administration fees
Under a class-level administration agreement, Funds Management provides class-level administrative services to the Fund, which includes paying fees and expenses for services provided by the transfer agent,sub-transfer agents, omnibus account servicers and record-keepers. As compensation for its services under the class-level administration agreement, Funds Management receives an annual fee which is calculated based on the average daily net assets of each class as follows:
| | | | |
| |
| | | Class-level
administration fee | |
| |
Class A, Class C | | | 0.21 | % |
| |
Class R6 | | | 0.03 | |
| |
Administrator Class, Institutional Class | | | 0.13 | |
Waivers and/or expense reimbursements
Funds Management has contractually waived and/or reimbursed management and administration fees to the extent necessary to maintain certain net operating expense ratios for the Fund. When each class of the Fund has exceeded its expense cap, Funds Management has waived fees and/or reimbursed expenses from fund-level expenses on a proportionate basis and then from class specific expenses. When only certain classes exceed their expense caps, waivers and/or reimbursements are applied against class specific expenses before fund-level expenses. Funds Management has committed through January 31, 2020 to waive fees and/or reimburse expenses to the extent necessary to cap the Fund’s expenses at 1.26% for Class A shares, 2.01% for Class C shares, 0.85% for Class R6 shares, 1.10% for Administrator Class shares, and 0.85% for Institutional Class shares. Prior to or after the commitment expiration date, the cap may be increased or the commitment to maintain the cap may be terminated only with the approval of the Board of Trustees.
Distribution fee
The Trust has adopted a distribution plan for Class C shares of the Fund pursuant to Rule12b-1 under the 1940 Act. A distribution fee is charged to Class C shares and paid to Wells Fargo Funds Distributor, LLC (“Funds Distributor”), the principal underwriter, at an annual rate of 0.75% of the average daily net assets of Class C shares.
In addition, Funds Distributor is entitled to receive thefront-end sales charge from the purchase of Class A shares and a contingent deferred sales charge on the redemption of certain Class A shares. Funds Distributor is also entitled to receive the contingent deferred sales charges from redemptions of Class C shares. For the year ended September 30, 2019, Funds Distributor received $1,557 from the sale of Class A shares and $16 in contingent deferred sales charges from redemptions of Class C shares. No contingent deferred sales charges were incurred by Class A for the year ended September 30, 2019.
Shareholder servicing fees
The Trust has entered into contracts with one or more shareholder servicing agents, whereby Class A, Class C, and Administrator Class of the Fund are charged a fee at an annual rate of 0.25% of the average daily net assets of each respective class. A portion of these total shareholder servicing fees were paid to affiliates of Wells Fargo.
Interfund transactions
The Fund may purchase or sell portfolio investment securities to certain other Wells Fargo affiliates pursuant to Rule17a-7 under the 1940 Act and under procedures adopted by the Board of Trustees. The procedures have been designed to ensure that these interfund transactions, which do not incur broker commissions, are effected at current market prices.
5. INVESTMENT PORTFOLIO TRANSACTIONS
Purchases and sales of investments, excluding U.S. government obligations (if any) and short-term securities, for the year ended September 30, 2019 were $422,715,828 and $524,955,163, respectively.
6. SECURITIES LENDING TRANSACTIONS
The Fund lends its securities through an unaffiliated securities lending agent and receives collateral in the form of cash or securities with a value at least equal to the value of the securities on loan. The value of the loaned securities is determined at the close of each business day and any increases or decreases in the required collateral are exchanged between the Fund and the counterparty on the next business day. Cash collateral received is invested in the Securities Lending Fund which seeks to provide a positive return compared to the daily Fed Funds Open Rate by investing in high-quality, U.S. dollar-denominated short-term money market instruments and is exempt from registration under Section 3(c)(7) of the 1940 Act. Securities Lending Fund is managed by Funds Management and is subadvised by WellsCap. Funds Management receives an advisory fee
26 | Wells Fargo Common Stock Fund
Notes to financial statements
starting at 0.05% and declining to 0.01% as the average daily net assets of the Securities Lending Fund increase. All of the fees received by Funds Management are paid to WellsCap for its services as subadviser.
In the event of counterparty default or the failure of a borrower to return a loaned security, the Fund has the right to use the collateral to offset any losses incurred. As of September 30, 2019, the Fund had securities lending transactions with the following counterparties which are subject to offset:
| | | | | | | | | | | | |
| | | |
| Counterparty | | Value of
securities
on loan | | | Collateral
received1 | | | Net amount | |
| | | |
Bank of America Securities Inc. | | $ | 1,315,440 | | | $ | (1,315,440 | ) | | $ | 0 | |
| | | |
JPMorgan Securities LLC | | | 5,207,875 | | | | (5,207,875 | ) | | | 0 | |
| | | |
UBS Securities LLC | | | 2,796,057 | | | | (2,796,057 | ) | | | 0 | |
| 1 | Collateral received within this table is limited to the collateral for the net transaction with the counterparty. |
7. BANK BORROWINGS
The Trust (excluding the money market funds), Wells Fargo Master Trust and Wells Fargo Variable Trust are parties to a $280,000,000 revolving credit agreement whereby the Fund is permitted to use bank borrowings for temporary or emergency purposes, such as to fund shareholder redemption requests. Interest under the credit agreement is charged to the Fund based on a borrowing rate equal to the higher of the Federal Funds rate in effect on that day plus 1.25% or the overnight LIBOR rate in effect on that day plus 1.25%. In addition, an annual commitment fee equal to 0.25% of the unused balance is allocated to each participating fund.
For the year ended September 30, 2019, there were no borrowings by the Fund under the agreement.
8. DISTRIBUTIONS TO SHAREHOLDERS
The tax character of distributions paid during the years ended September 30, 2019 and September 30, 2018 were as follows:
| | | | | | | | |
| | | Year ended September 30 | |
| | |
| | | 2019 | | | 2018 | |
| | |
Ordinary income | | $ | 16,373,230 | | | $ | 17,715,099 | |
| | |
Long-term capital gain | | | 140,999,070 | | | | 111,181,437 | |
As of September 30, 2019, the components of distributable earnings on a tax basis were as follows:
| | | | |
Undistributed ordinary income | | Undistributed long-term gain | | Unrealized gains |
| | |
| $6,151,984 | | $108,820,123 | | $255,497,268 |
9. INDEMNIFICATION
Under the Trust’s organizational documents, the officers and Trustees have been granted certain indemnification rights against certain liabilities that may arise out of performance of their duties to the Trust. Additionally, in the normal course of business, the Trust may enter into contracts with service providers that contain a variety of indemnification clauses. The Trust’s maximum exposure under these arrangements is dependent on future claims that may be made against the Fund and, therefore, cannot be estimated.
10. NEW ACCOUNTING PRONOUNCEMENT
In August 2018, FASB issued Accounting Standards Update (“ASU”)No. 2018-13, Fair Value Measurement (Topic 820)Disclosure Framework—Changes to the Disclosure Requirements for Fair Value Measurement. ASU2018-13 updates the disclosure requirements for fair value measurements by modifying or removing certain disclosures and adding certain new disclosures. The amendments are effective for fiscal years, and interim periods within those fiscal years, beginning after December 15, 2019. Early adoption is permitted. Management has adopted the removal and modification of disclosures early, as permitted, and will adopt the additional new disclosures at the effective date.
Wells Fargo Common Stock Fund | 27
Report of independent registered public accounting firm
TO THE SHAREHOLDERS OF THE FUND AND BOARD OF TRUSTEES OF WELLS FARGO FUNDS TRUST:
Opinion on the Financial Statements
We have audited the accompanying statement of assets and liabilities of Wells Fargo Common Stock Fund (the Fund), one of the funds constituting Wells Fargo Funds Trust, including the portfolio of investments, as of September 30, 2019, the related statement of operations for the year then ended, the statements of changes in net assets for each of the years in the two-year period then ended, and the related notes (collectively, the financial statements) and the financial highlights for each of the years in the five-year period then ended. In our opinion, the financial statements and financial highlights present fairly, in all material respects, the financial position of the Fund as of September 30, 2019, the results of its operations for the year then ended, the changes in its net assets for each of the years in the two-year period then ended, and the financial highlights for each of the years in the five-year period then ended, in conformity with U.S. generally accepted accounting principles.
Basis for Opinion
These financial statements and financial highlights are the responsibility of the Fund’s management. Our responsibility is to express an opinion on these financial statements and financial highlights based on our audits. We are a public accounting firm registered with the Public Company Accounting Oversight Board (United States) (PCAOB) and are required to be independent with respect to the Fund in accordance with the U.S. federal securities laws and the applicable rules and regulations of the Securities and Exchange Commission and the PCAOB.
We conducted our audits in accordance with the standards of the PCAOB. Those standards require that we plan and perform the audit to obtain reasonable assurance about whether the financial statements and financial highlights are free of material misstatement, whether due to error or fraud. Our audits included performing procedures to assess the risks of material misstatement of the financial statements and financial highlights, whether due to error or fraud, and performing procedures that respond to those risks. Such procedures included examining, on a test basis, evidence regarding the amounts and disclosures in the financial statements and financial highlights. Such procedures also included confirmation of securities owned as of September 30, 2019, by correspondence with the custodian, transfer agent and brokers, or by other appropriate auditing procedures. Our audits also included evaluating the accounting principles used and significant estimates made by management, as well as evaluating the overall presentation of the financial statements and financial highlights. We believe that our audits provide a reasonable basis for our opinion.

We have not been able to determine the specific year that we began serving as the auditor of one or more Wells Fargo Funds investment companies; however we are aware that we have served as the auditor of one or more Wells Fargo Funds investment companies since at least 1955.
Boston, Massachusetts
November 25, 2019
28 | Wells Fargo Common Stock Fund
Other information (unaudited)
TAX INFORMATION
For corporate shareholders, pursuant to Section 854 of the Internal Revenue Code, 52.95% of ordinary income dividends qualify for the corporate dividends-received deduction for the fiscal year ended September 30, 2019.
Pursuant to Section 852 of the Internal Revenue Code, $140,999,070 was designated as a 20% rate gain distribution for the fiscal year ended September 30, 2019.
Pursuant to Section 854 of the Internal Revenue Code, $9,267,382 of income dividends paid during the fiscal year ended September 30, 2019 has been designated as qualified dividend income (QDI).
For the fiscal year ended September 30, 2019 $16,373,230 has been designated as short-term capital gain dividends for nonresident alien shareholders pursuant to Section 871 of the Internal Revenue Code.
PROXY VOTING INFORMATION
A description of the policies and procedures used to determine how to vote proxies relating to portfolio securities is available, upon request, by calling1-800-222-8222, visiting our website atwfam.com, or visiting the SEC website at sec.gov. Information regarding how the proxies related to portfolio securities were voted during the most recent12-month period ended June 30 is available on the website atwfam.com or by visiting the SEC website at sec.gov.
QUARTERLY PORTFOLIO HOLDINGS INFORMATION
The Fund files its complete schedule of portfolio holdings with the SEC for the first and third quarters of each fiscal year on Form N-Q or FormN-PORT, which is available by visiting the SEC website at sec.gov. Those forms may be reviewed and copied at the SEC’s Public Reference Room in Washington, DC. Information on the operation of the Public Reference Room may be obtained by calling1-800-SEC-0330.
Wells Fargo Common Stock Fund | 29
Other information (unaudited)
BOARD OF TRUSTEES AND OFFICERS
Each of the Trustees and Officers1 listed in the table below acts in identical capacities for each fund in the Wells Fargo family of funds, which consists of 150 mutual funds comprising the Wells Fargo Funds Trust, Wells Fargo Variable Trust, Wells Fargo Master Trust and fourclosed-end funds (collectively the “Fund Complex”). This table should be read in conjunction with the Prospectus and the Statement of Additional Information2. The mailing address of each Trustee and Officer is 525 Market Street, 12th Floor, San Francisco, CA 94105. Each Trustee and Officer serves an indefinite term, however, each Trustee serves such term until reaching the mandatory retirement age established by the Trustees.
Independent Trustees
| | | | | | |
Name and year of birth | | Position held and
length of service* | | Principal occupations during past five years or longer | | Current other
public company or
investment
company
directorships |
| | | |
William R. Ebsworth (Born 1957) | | Trustee, since 2015 | | Retired. From 1984 to 2013, equities analyst, portfolio manager, research director and chief investment officer at Fidelity Management and Research Company in Boston, Tokyo, and Hong Kong, and retired in 2013 as Chief Investment Officer of Fidelity Strategic Advisers, Inc. where he led a team of investment professionals managing client assets. Prior thereto, Board member of Hong Kong Securities Clearing Co., Hong Kong Options Clearing Corp., the Thailand International Fund, Ltd., Fidelity Investments Life Insurance Company, and Empire Fidelity Investments Life Insurance Company. Audit Committee Chair and Investment Committee Chair of the Vincent Memorial Hospital Endowment(non-profit organization). Mr. Ebsworth is a CFA® charterholder. | | N/A |
| | | |
Jane A. Freeman (Born 1953) | | Trustee, since 2015; Chair Liaison, since 2018 | | Retired. From 2012 to 2014 and 1999 to 2008, Chief Financial Officer of Scientific Learning Corporation. From 2008 to 2012, Ms. Freeman provided consulting services related to strategic business projects. Prior to 1999, Portfolio Manager at Rockefeller & Co. and Scudder, Stevens & Clark. Board member of the Harding Loevner Funds from 1996 to 2014, serving as both Lead Independent Director and chair of the Audit Committee. Board member of the Russell Exchange Traded Funds Trust from 2011 to 2012 and the chair of the Audit Committee. Ms. Freeman is a Board Member of The Ruth Bancroft Garden(non-profit organization). She is also an inactive Chartered Financial Analyst. | | N/A |
| | | |
Isaiah Harris, Jr. (Born 1952) | | Trustee, since 2009; Audit Committee Chairman, since 2019 | | Retired. Chairman of the Board of CIGNA Corporation since 2009, and Director since 2005. From 2003 to 2011, Director of Deluxe Corporation. Prior thereto, President and CEO of BellSouth Advertising and Publishing Corp. from 2005 to 2007, President and CEO of BellSouth Enterprises from 2004 to 2005 and President of BellSouth Consumer Services from 2000 to 2003. Emeritus member of the Iowa State University Foundation Board of Governors. Emeritus Member of the Advisory Board of Iowa State University School of Business. Advisory Board Member, Palm Harbor Academy (private school). Advisory Board Member, Child Evangelism Fellowship(non-profit). Mr. Harris is a certified public accountant (inactive status). | | CIGNA Corporation |
| | | |
Judith M. Johnson (Born 1949) | | Trustee, since 2008; Audit Committee Chairman, from 2009 to 2018 | | Retired. Prior thereto, Chief Executive Officer and Chief Investment Officer of Minneapolis Employees Retirement Fund from 1996 to 2008. Ms. Johnson is an attorney, certified public accountant and a certified managerial accountant. | | N/A |
30 | Wells Fargo Common Stock Fund
Other information (unaudited)
| | | | | | |
Name and year of birth | | Position held and
length of service* | | Principal occupations during past five years or longer | | Current other
public company or
investment
company
directorships |
| | | |
David F. Larcker (Born 1950) | | Trustee, since 2009 | | James Irvin Miller Professor of Accounting at the Graduate School of Business, Stanford University, Director of the Corporate Governance Research Initiative and Senior Faculty of The Rock Center for Corporate Governance since 2006. From 2005 to 2008, Professor of Accounting at the Graduate School of Business, Stanford University. Prior thereto, Ernst & Young Professor of Accounting at The Wharton School, University of Pennsylvania from 1985 to 2005. | | N/A |
| | | |
Olivia S. Mitchell (Born 1953) | | Trustee, since 2006; Nominating and Governance Committee Chairman, since 2018 | | International Foundation of Employee Benefit Plans Professor, Wharton School of the University of Pennsylvania since 1993. Director of Wharton’s Pension Research Council and Boettner Center on Pensions & Retirement Research, and Research Associate at the National Bureau of Economic Research. Previously, Cornell University Professor from 1978 to 1993. | | N/A |
| | | |
Timothy J. Penny (Born 1951) | | Trustee, since 1996; Chairman, since 2018 | | President and Chief Executive Officer of Southern Minnesota Initiative Foundation, anon-profit organization, since 2007. Member of the Board of Trustees of NorthStar Education Finance, Inc., anon-profit organization, since 2007. | | N/A |
| | | |
James G. Polisson (Born 1959) | | Trustee, since 2018 | | Retired. Chief Marketing Officer, Source (ETF) UK Services, Ltd, from 2015 to 2017. From 2012 to 2015, Principal of The Polisson Group, LLC, a management consulting, corporate advisory and principal investing company. Chief Executive Officer and Managing Director at Russell Investments, Global Exchange Traded Funds from 2010 to 2012. Managing Director of Barclays Global Investors from 1998 to 2010 and Global Chief Marketing Officer for iShares and Barclays Global Investors from 2000 to 2010. Trustee of the San Francisco Mechanics’ Institute,a non-profit organization, from 2013 to 2015. Board member of the Russell Exchange Traded Fund Trust from 2011 to 2012. Director of Barclays Global Investors Holdings Deutschland GmbH from 2006 to 2009. Mr. Polisson is an attorney and has a retired status with the Massachusetts and District of Columbia Bar Associations. | | N/A |
| * | Length of service dates reflect the Trustee’s commencement of service with the Trust’s predecessor entities, where applicable. |
Wells Fargo Common Stock Fund | 31
Other information (unaudited)
Officers
| | | | |
Name and year of birth | | Position held and
length of service | | Principal occupations during past five years or longer |
| | |
Andrew Owen (Born 1960) | | President, since 2017 | | Executive Vice President of Wells Fargo & Company and Head of Affiliated Managers, Wells Fargo Asset Management, since 2014. In addition, Mr. Owen is currently President, Chief Executive Officer and Director of Wells Fargo Funds Management, LLC since 2017. Prior thereto, Executive Vice President responsible for marketing, investments and product development for Wells Fargo Funds Management, LLC, from 2009 to 2014. |
| | |
Nancy Wiser1 (Born 1967) | | Treasurer, since 2012 | | Executive Vice President of Wells Fargo Funds Management, LLC since 2011. Chief Operating Officer and Chief Compliance Officer at LightBox Capital Management LLC, from 2008 to 2011. |
| | |
Michelle Rhee3 (Born 1966) | | Chief Legal Officer, since 2019 | | Secretary of Wells Fargo Funds Management, LLC, Chief Legal Counsel of Wells Fargo Asset Management and Assistant General Counsel of Wells Fargo Bank, N.A. since 2018. Associate General Counsel and Managing Director of Bank of America Corporation from 2004 to 2018. |
| | |
Catherine Kennedy4 (Born 1969) | | Secretary, since 2019 | | Vice President of Wells Fargo Funds Management, LLC and Senior Counsel of the Wells Fargo Legal Department since 2010. Vice President and Senior Counsel of Evergreen Investment Management Company, LLC from 1998 to 2010. |
| | |
Michael H. Whitaker (Born 1967) | | Chief Compliance Officer, since 2016 | | Chief Compliance Officer of Wells Fargo Asset Management since 2016. Senior Vice President and Chief Compliance Officer for Fidelity Investments from 2007 to 2016. |
| | |
David Berardi (Born 1975) | | Assistant Treasurer, since 2009 | | Vice President of Wells Fargo Funds Management, LLC since 2009. Vice President of Evergreen Investment Management Company, LLC from 2008 to 2010. Manager of Fund Reporting and Control for Evergreen Investment Management Company, LLC from 2004 to 2010. |
| | |
Jeremy DePalma1 (Born 1974) | | Assistant Treasurer, since 2009 | | Senior Vice President of Wells Fargo Funds Management, LLC since 2009. Senior Vice President of Evergreen Investment Management Company, LLC from 2008 to 2010 and head of the Fund Reporting and Control Team within Fund Administration from 2005 to 2010. |
| 1 | Nancy Wiser acts as Treasurer of 64 funds in the Fund Complex. Jeremy DePalma acts as Treasurer of 86 funds and Assistant Treasurer of 64 funds in the Fund Complex. |
| 2 | The Statement of Additional Information includes additional information about the Trustees and is available, without charge, upon request, by calling1-800-222-8222 or by visiting the website atwfam.com. |
| 3 | Michelle Rhee became Chief Legal Officer effective October 22, 2019. |
| 4 | Catherine Kennedy became Secretary effective October 22, 2019. |
32 | Wells Fargo Common Stock Fund
Other information (unaudited)
BOARD CONSIDERATION OF INVESTMENT MANAGEMENT AND SUB-ADVISORY AGREEMENTS:
Wells Fargo Common Stock Fund
Under the Investment Company Act of 1940 (the “1940 Act”), the Board of Trustees (the “Board”) of Wells Fargo Funds Trust (the “Trust”) must determine annually whether to approve the continuation of the Trust’s investment management andsub-advisory agreements. In this regard, at an in-person meeting held on May 21-22, 2019 (the “Meeting”), the Board, all the members of which have no direct or indirect interest in the investment management and sub-advisory agreements and are not “interested persons” of the Trust, as defined in the 1940 Act (the “Independent Trustees”), reviewed and approved for Wells Fargo Common Stock Fund (the “Fund”): (i) an investment management agreement (the “Management Agreement”) with Wells Fargo Funds Management, LLC (“Funds Management”); and (ii) an investment sub-advisory agreement (the“Sub-Advisory Agreement”) with Wells Capital Management Incorporated (the “Sub-Adviser”), an affiliate of Funds Management. The Management Agreement and the Sub-Advisory Agreement are collectively referred to as the “Advisory Agreements.”
At the Meeting, the Board considered the factors and reached the conclusions described below relating to the selection of Funds Management and the Sub-Adviser and the approval of the Advisory Agreements. Prior to the Meeting, including at anin-person meeting in April 2019, the Trustees conferred extensively among themselves and with representatives of Funds Management about these matters. Also, the Board has adopted a team-based approach, with each team consisting of a sub-set of Trustees, to assist the full Board in the discharge of its duties in reviewing investment performance and other matters throughout the year. The Independent Trustees were assisted in their evaluation of the Advisory Agreements by independent legal counsel, from whom they received separate legal advice and with whom they met separately.
In providing information to the Board, Funds Management and the Sub-Adviser were guided by a detailed set of requests for information submitted to them by independent legal counsel on behalf of the Independent Trustees at the start of the Board’s annual contract renewal process earlier in 2019. In considering and approving the Advisory Agreements, the Trustees considered the information they believed relevant, including but not limited to the information discussed below. The Board considered not only the specific information presented in connection with the Meeting, but also the knowledge gained over time through interaction with Funds Management and the Sub-Adviser about various topics. In this regard, the Board reviewed reports of Funds Management at each of its quarterly meetings, which included, among other things, portfolio reviews and investment performance reports. In addition, the Board and the teams mentioned above confer with portfolio managers at various times throughout the year. The Board did not identify any particular information or consideration that wasall-important or controlling, and each individual Trustee may have attributed different weights to various factors.
After its deliberations, the Board unanimously approved the continuation of the Advisory Agreements for a one-year term and determined that the compensation payable to Funds Management and the Sub-Adviser under each of the Advisory Agreements was reasonable. The Board considered the approval of the Advisory Agreements for the Fund as part of its consideration of agreements for funds across the complex, but its approvals were made on a fund-by-fund basis. The following summarizes a number of important, but not necessarily all, factors considered by the Board in support of its approvals.
Nature, extent and quality of services
The Board received and considered various information regarding the nature, extent and quality of services provided to the Fund by Funds Management and the Sub-Adviser under the Advisory Agreements. This information included a description of the investment advisory services and Fund-level administrative services covered by the Management Agreement, as well as, among other things, a summary of the background and experience of senior management of Wells Fargo Asset Management (“WFAM”), of which Funds Management and the Sub-Adviser are a part, a summary of investments made in the business of WFAM, a summary of certain organizational and personnel changes involving Funds Management and the Sub-Adviser, and a description of Funds Management’s and the Sub-Adviser’s business continuity planning programs and of their approaches to data privacy and cybersecurity. The Board received and reviewed information about Funds Management’s role as administrator of the Fund’s liquidity risk management program. The Board also considered the qualifications, background, tenure and responsibilities of each of the portfolio managers primarily responsible for the day-to-day portfolio management of the Fund.
The Board evaluated the ability of Funds Management and the Sub-Adviser to attract and retain qualified investment professionals, including research, advisory and supervisory personnel. The Board further considered the compliance programs and compliance records of Funds Management and the Sub-Adviser. In addition, the Board took into account the full range of services provided to the Fund by Funds Management and its affiliates.
Wells Fargo Common Stock Fund | 33
Other information (unaudited)
Fund investment performance and expenses
The Board considered the investment performance results for the Fund over various time periods ended December 31, 2018. The Board considered these results in comparison to the investment performance of funds in a universe that was determined by Broadridge Inc. (“Broadridge”) to be similar to the Fund (the “Universe”), and in comparison to the Fund’s benchmark index and to other comparative data. Broadridge is an independent provider of investment company data. The Board received a description of the methodology used by Broadridge to select the mutual funds in the performance Universe. The Board noted that the investment performance of the Fund (Class A) was higher than the average investment performance of the Universe for all periods under review. The Board also noted that the investment performance of the Fund was lower than its benchmark index, the Russell 2500™ Index, for the three- and five-year periods under review, but in range of or higher than its benchmark for the one- and ten-year periods under review.
The Board received information concerning, and discussed factors contributing to, the underperformance of the Fund relative to the Universe and benchmark for the periods identified above. The Board took note of the explanations for the relative underperformance during these periods, including with respect to investment decisions that affected the Fund’s investment performance.
The Board also received and considered information regarding the Fund’s net operating expense ratios and their various components, including actual management fees, custodian and other non-management fees, and Rule 12b-1 and non-Rule 12b-1 shareholder service fees. The Board considered these ratios in comparison to the median ratios of funds in class-specific expense groups that were determined by Broadridge to be similar to the Fund (the “Groups”). The Board received a description of the methodology used by Broadridge to select the mutual funds in the expense Groups and an explanation of how funds comprising expense groups and their expense ratios may vary from year-to-year. Based on the Broadridge reports, the Board noted that the net operating expense ratios of the Fund were in range of, lower than, or equal to the median net operating expense ratios of the expense Groups for each share class.
The Board took into account the Fund’s investment performance and expense information provided to it among the factors considered in deciding to re-approve the Advisory Agreements.
Investment management and sub-advisory fee rates
The Board reviewed and considered the contractual fee rates payable by the Fund to Funds Management under the Management Agreement, as well as the contractual fee rates payable by the Fund to Funds Management for class-level administrative services under a Class-Level Administration Agreement, which include, among other things, class-level transfer agency and sub-transfer agency costs (collectively, the “Management Rates”). The Board also reviewed and considered the contractual investment sub-advisory fee rates that are payable by Funds Management to the Sub-Adviser for investmentsub-advisory services.
Among other information reviewed by the Board was a comparison of the Fund’s Management Rates with the average contractual investment management fee rates of funds in the expense Groups at a common asset level as well as transfer agency costs of the funds in the expense Groups. The Board noted that the Management Rates of the Fund were in range of the sum of these average rates for the Fund’s expense Groups for all share classes. The Board also noted that the net operating expense ratio cap for Class R6 would be reduced.
The Board also received and considered information about the portion of the total management fee that was retained by Funds Management after payment of the fee to the Sub-Adviser for sub-advisory services. In assessing the reasonableness of this amount, the Board received and evaluated information about the nature and extent of responsibilities retained and risks assumed by Funds Management and not delegated to or assumed by the Sub-Adviser, and about Funds Management’s on-going oversight services. Given the affiliation between Funds Management and the Sub-Adviser, the Board ascribed limited relevance to the allocation of fees between them.
The Board also received and considered information about the nature and extent of services offered and fee rates charged by Funds Management and the Sub-Adviser to other types of clients with investment strategies similar to those of the Fund. In this regard, the Board received information about the significantly greater scope of services, and compliance, reporting and other legal burdens and risks of managing proprietary mutual funds compared with those associated with managing assets of other types of clients, including third-party sub-advised fund clients and non-mutual fund clients such as institutional separate accounts.
Based on its consideration of the factors and information it deemed relevant, including those described here, the Board determined that the compensation payable to Funds Management under the Management Agreement and to the Sub-Adviser under the Sub-Advisory Agreement was reasonable.
34 | Wells Fargo Common Stock Fund
Other information (unaudited)
Profitability
The Board received and considered information concerning the profitability of Funds Management, as well as the profitability of both WFAM and Wells Fargo & Co. (“Wells Fargo”) from providing services to the fund family as a whole. The Board noted that the Sub-Adviser’s profitability information with respect to providing services to the Fund and other funds in the family was subsumed in the WFAM and Wells Fargo profitability analysis.
Funds Management reported on the methodologies and estimates used in calculating profitability, including a description of the methodology used to allocate certain expenses. Among other things, the Board noted that the levels of profitability reported on a fund-by-fund basis varied widely, depending on factors such as the size, type and age of fund. Based on its review, the Board did not deem the profits reported by Funds Management, WFAM or Wells Fargo from services provided to the Fund to be at a level that would prevent it from approving the continuation of the Advisory Agreements.
Economies of scale
The Board received and considered information about the potential for Funds Management to experience economies of scale in the provision of management services to the Fund, the difficulties of calculating economies of scale at an individual fund level, and the extent to which potential scale benefits are shared with shareholders. The Board noted the existence of breakpoints in the Fund’s management fee structure, which operate generally to reduce the Fund’s expense ratios as the Fund grows in size. The Board considered that in addition to management fee breakpoints, Funds Management shares potential economies of scale from its management business in a variety of ways, including through fee waiver and expense reimbursement arrangements, services that benefit shareholders, competitive management fee rates set at the outset without regard to breakpoints, and investments in the business intended to enhance services available to shareholders.
The Board concluded that Funds Management’s arrangements with respect to the Fund, including contractual breakpoints, constituted a reasonable approach to sharing potential economies of scale with the Fund and its shareholders.
Other benefits to Funds Management and the Sub-Adviser
The Board received and considered information regarding potential “fall-out” or ancillary benefits received by Funds Management and its affiliates, including the Sub-Adviser, as a result of their relationships with the Fund. Ancillary benefits could include, among others, benefits directly attributable to other relationships with the Fund and benefits potentially derived from an increase in Funds Management’s and the Sub-Adviser’s business as a result of their relationships with the Fund. The Board noted that various affiliates of Funds Management may receive distribution-related fees, shareholder servicing payments and sub-transfer agency fees in respect of shares sold or held through them and services provided.
The Board also reviewed information about soft dollar credits earned and utilized by the Sub-Adviser, fees earned by Funds Management and the Sub-Adviser from managing a private investment vehicle for the fund family’s securities lending collateral, and commissions earned by an affiliated broker from portfolio transactions.
Based on its consideration of the factors and information it deemed relevant, including those described here, the Board did not find that any ancillary benefits received by Funds Management and its affiliates, including the Sub-Adviser, were unreasonable.
Conclusion
At the Meeting, after considering the above-described factors and based on its deliberations and its evaluation of the information described above, the Board unanimously approved the continuation of the Advisory Agreements for a one-year term and determined that the compensation payable to Funds Management and the Sub-Adviser under each of the Advisory Agreements was reasonable.
Wells Fargo Common Stock Fund | 35
This page is intentionally left blank.

For more information
More information about Wells Fargo Funds is available free upon request. To obtain literature, please write, visit the Fund’s website, or call:
Wells Fargo Funds
P.O. Box 219967
Kansas City, MO 64121-9967
Website:wfam.com
Individual investors:1-800-222-8222
Retail investment professionals:1-888-877-9275
Institutional investment professionals:1-866-765-0778

This report and the financial statements contained herein are submitted for the general information of the shareholders of the Fund. If this report is used for promotional purposes, distribution of the report must be accompanied or preceded by a current prospectus. Before investing, please consider the investment objectives, risks, charges, and expenses of the investment. For a current prospectus and, if available, a summary prospectus, containing this information, call1-800-222-8222 or visit the Fund’s website atwfam.com. Read the prospectus carefully before you invest or send money.
Wells Fargo Asset Management (WFAM) is the trade name for certain investment advisory/management firms owned by Wells Fargo & Company. These firms include but are not limited to Wells Capital Management Incorporated and Wells Fargo Funds Management, LLC. Certain products managed by WFAM entities are distributed by Wells Fargo Funds Distributor, LLC (a broker-dealer and Member FINRA).
This material is for general informational and educational purposes only and is NOT intended to provide investment advice or a recommendation of any kind—including a recommendation for any specific investment, strategy, or plan.
INVESTMENT PRODUCTS: NOT FDIC INSURED ◾ NO BANK GUARANTEE ◾ MAY LOSE VALUE
© 2019 Wells Fargo & Company. All rights reserved.
406813 11-19
A229/AR229 09-19
Annual Report
September 30, 2019
Wells Fargo Discovery Fund
Beginning on January 1, 2021, as permitted by new regulations adopted by the Securities and Exchange Commission, paper copies of the Wells Fargo Funds’ annual and semi-annual shareholder reports issued after this date will no longer be sent by mail, unless you specifically request paper copies of the reports. Instead, the reports will be made available on the Funds’ website, and you will be notified by mail each time a report is posted and provided with a website address to access the report.
If you already elected to receive shareholder reports electronically, you will not be affected by this change and you need not take any action. You may elect to receive shareholder reports and other communications from the Fund electronically at any time by contacting your financial intermediary (such as a broker-dealer or bank) or, if you are a direct investor, by calling1-800-222-8222 or by enrolling at wellsfargo.com/advantagedelivery.
You may elect to receive all future reports in paper free of charge. If you invest through a financial intermediary, you can contact your financial intermediary to request that you continue to receive paper copies of your shareholder reports; if you invest directly with the Fund, you can call 1-800-222-8222. Your election to receive reports in paper will apply to all Wells Fargo Funds held in your account with your financial intermediary or, if you are a direct investor, to all Wells Fargo Funds that you hold.
|
|
|
Reduce clutter. Save trees. |
Sign up for electronic delivery of prospectuses and shareholder reports atwellsfargo.com/advantagedelivery |
The views expressed and any forward-looking statements are as of September 30, 2019, unless otherwise noted, and are those of the Fund managers and/or Wells Fargo Asset Management. Discussions of individual securities, or the markets generally, or any Wells Fargo Fund are not intended as individual recommendations. Future events or results may vary significantly from those expressed in any forward-looking statements. The views expressed are subject to change at any time in response to changing circumstances in the market. Wells Fargo Asset Management and the Fund disclaim any obligation to publicly update or revise any views expressed or forward-looking statements.
INVESTMENT PRODUCTS: NOT FDIC INSURED ◾ NO BANK GUARANTEE ◾ MAY LOSE VALUE
Wells Fargo Discovery Fund | 1
Letter to shareholders (unaudited)

Andrew Owen
President
Wells Fargo Funds
“December’s S&P 500 Index performance was the worst since 1931.”
Dear Shareholder:
We are pleased to offer you this annual report for the Wells Fargo Discovery Fund for the 12-month period that ended September 30, 2019. After the first half of the period yielded either low-single-digit or negative investment returns, U.S. stock and global bond investors generally saw markets recover during the second half amid intensifying market volatility, global economic growth concerns, international trade stare downs, and simmering geopolitical tensions.
Overall, fixed-income investors enjoyed a distinct advantage over stock investors. For the period, U.S. stocks, based on the S&P 500 Index,1 gained 4.25% and international stocks, as measured by the MSCI ACWI ex USA Index (Net),2 fell 1.23%. The MSCI EM Index (Net)3 slipped 2.02%. Among fixed income investors, the Bloomberg Barclays U.S. Aggregate Bond Index4 added 10.30%, the Bloomberg Barclays Global Aggregateex-USD Index5 added 5.34%, the Bloomberg Barclays Municipal Bond Index6 gained 8.55%, and the ICE BofAML U.S. High Yield Index7 added 6.30%.
Investors confronted unsettling events during the fourth quarter of 2018.
During the fourth quarter of 2018, investors grew concerned about the pace and sustainability of the global economic expansion. The U.S. Bureau of Economic Analysis reported third-quarter U.S. gross domestic product (GDP) was 3.4% on an annualized basis, which was down from the second-quarter rate. A partial U.S. government shutdown occurred, which extended into January 2019. Brexit efforts stalled, causing uncertainty for the eurozone. The value of the renminbi declined even as the People’s Bank of China cut reserve requirement ratios, accelerated infrastructure spending, and cut taxes in efforts to spur economic activity.
The combination of news in the U.S. and generally weak economic indicators outside of the U.S. caused investors to seek safe havens. December’s S&P 500 Index performance was the worst since 1931. Globally, fixed-income investments fared better than stocks during the last two months of the year. Even as indicators suggested growth was restrained, the U.S. Federal Reserve (Fed) increased the federal funds rate by 25 basis points (bps; 100 bps equal 1.00%) in December 2018 to a target range of between 2.25% and 2.50%. Many observers expressed concerns that higher rates could slow the economy further.
| 1 | The S&P 500 Index consists of 500 stocks chosen for market size, liquidity, and industry group representation. It is a market-value-weighted index with each stock’s weight in the index proportionate to its market value. You cannot invest directly in an index. |
| 2 | The Morgan Stanley Capital International (MSCI) All Country World Index (ACWI) ex USA Index (Net) is a free-float-adjusted market-capitalization weighted index that is designed to measure the equity market performance of developed and emerging markets, excluding the U.S. Source: MSCI. MSCI makes no express or implied warranties or representations and shall have no liability whatsoever with respect to any MSCI data contained herein. The MSCI data may not be further redistributed or used as a basis for other indices or any securities or financial products. This report is not approved, reviewed, or produced by MSCI. You cannot invest directly in an index. |
| 3 | The MSCI Emerging Markets (EM) Index (Net) is a free-float-adjusted market-capitalization-weighted index that is designed to measure the equity market performance of emerging markets. You cannot invest directly in an index. |
| 4 | The Bloomberg Barclays U.S. Aggregate Bond Index is a broad-based benchmark that measures the investment-grade, U.S. dollar-denominated, fixed-rate taxable bond market, including Treasuries, government-related and corporate securities, mortgage-backed securities (agency fixed-rate and hybrid adjustable-rate mortgage pass-throughs), asset-backed securities, and commercial mortgage-backed securities. You cannot invest directly in an index. |
| 5 | The Bloomberg Barclays Global Aggregate ex-USD Index is an unmanaged index that provides a broad-based measure of the global investment-grade fixed-income markets excluding the U.S. dollar-denominated debt market. You cannot invest directly in an index. |
| 6 | The Bloomberg Barclays Municipal Bond Index is an unmanaged index composed of long-term tax-exempt bonds with a minimum credit rating of Baa. You cannot invest directly in an index. |
| 7 | The ICE BofAML U.S. High Yield Index is a market-capitalization-weighted index of domestic and Yankee high-yield bonds. The index tracks the performance of high-yield securities traded in the U.S. bond market. You cannot invest directly in an index. Copyright 2019. ICE Data Indices, LLC. All rights reserved. |
2 | Wells Fargo Discovery Fund
Letter to shareholders (unaudited)
The market climbs a wall of worry.
Investment returns early in 2019 appeared to reaffirm the adage that markets climb a wall of worry as the new year began. The S&P 500 Index gained 8.01% for the month of January, the best monthly performance in 30 years. Returns for the MSCI ACWI ex USA Index (Net), the Bloomberg Barclays U.S. Aggregate Bond Index, and the Bloomberg Barclays Global Aggregate ex-USD Index also were positive.
In February 2019, signs of slowing global growth grew more ominous. The Bureau of Economic Analysis announced fourth-quarter 2018 GDP grew at an annualized 2.2% rate, a slower rate than reported for the prior two quarters. In a February report, the Bank of England forecast the slowest growth for 2019 since the financial crisis. China and the U.S. continued to wrangle over trade issues. By the end of the first quarter of 2019, more accommodative Fed sentiment and steady, if not spectacular, U.S. economic and business metrics encouraged domestic investors.
Early second-quarter 2019 enthusiasm among investors faded.
During April 2019, favorable sentiment found additional support in reports of sustained low inflation, solid employment data, and first-quarter U.S. GDP of an annualized rate of 3.2%. During May, markets tumbled on mixed investment signals. In the U.S., partisan wrangling ramped up as Democrats and Republicans set their sights on 2020 presidential politics. The U.K.’s Brexit disagreements caused Prime Minister Theresa May to resign. Boris Johnson succeeded her only to exacerbate uncertainty about Brexit’s resolution ahead of an October 2019 deadline. The European Commission downgraded the 2019 growth forecast to 1.2%. The U.S. increased tariffs on products from China, China responded, and then talks broke down. President Donald Trump threatened to turn his foreign policy tariff tool to Mexico over immigration issues.
During the third quarter of 2019, investors regrouped. Just as the investment horizon appeared to darken, sentiment turned and U.S. equity markets gained during June and July. The gains, primarily driven by geopolitical and monetary policy events, pushed equity markets to new highs. European Central Bank President Mario Draghi said that if the outlook doesn’t improve, the bank would cut rates or buy more assets to prop up inflation. President Trump backed off of tariff threats against Mexico and China. In the U.S., the Fed implemented a 0.25% federal funds rate cut in July.
Later in July 2019, the U.S. reversed course and threatened to impose higher tariffs on China’s exports after talks failed. China responded with tariff threats of its own and devalued the renminbi, a move that roiled global markets. Major U.S. stock market indices closed July with the worst weekly results of the year. Bond prices gained as Treasury yields fell to levels not seen since November 2016 and the yield curve inverted at multiple points along the 30-year arc.
In a microcosm, August 2019 encapsulated many of the unnerving events that plagued investors during the prior 11 months. The U.S.-China trade relationship swung from antagonistic to hopeful and back again with no evident compromise on the horizon. Evidence of a continued global economic slowdown mounted. Central banks in China, New Zealand, and Thailand cut interest rates. Industrial and manufacturing data declined in China, Canada, Japan, and Germany. Adding to the uncertain environment, Italy’s prime minister resigned, many feared a crackdown in Hong Kong as protesters sustained their calls for reform throughout the month, and Boris Johnson planned to suspend Parliament as Brexit’s deadline neared.
In the U.S., September saw the Fed join other central banks in cutting interest rates. Manufacturing data in the U.S., as reported by the Institute for Supply Management, disappointed investors. The U.S. Congress announced it would pursue an impeachment investigation of President Trump. Meanwhile, the Brexit impasse showed no signs of
“The S&P 500 Index gained 8.01% for the month of January, the best monthly performance in 30 years.”
Wells Fargo Discovery Fund | 3
Letter to shareholders (unaudited)
|
|
|
For further information about your Fund, contact your investment professional, visit our website at wfam.com, or call us directly at1-800-222-8222. |
resolution. Officials in China said that hitting the country’s economic growth goals for the year would be difficult considering the weight of tariffs and trade restrictions. So while the S&P 500 Index finished the third quarter with year-to-date returns that were the best in more than 20 years, amid signs of equity investors taking money out of the stock market, concerns about future returns remained.
Don’t let short-term uncertainty derail long-term investment goals.
Periods of investment uncertainty can present challenges, but experience has taught us that maintaining long-term investment goals can be an effective way to plan for the future. To help you create a sound strategy based on your personal goals and risk tolerance, Wells Fargo Funds offers more than 100 mutual funds spanning a wide range of asset classes and investment styles. Although diversification cannot guarantee an investment profit or prevent losses, we believe it can be an effective way to manage investment risk and potentially smooth out overall portfolio performance. We encourage investors to know their investments and to understand that appropriate levels of risk-taking may potentially unlock opportunities.
Thank you for choosing to invest with Wells Fargo Funds. We appreciate your confidence in us and remain committed to helping you meet your financial needs.
Sincerely,

Andrew Owen
President
Wells Fargo Funds
4 | Wells Fargo Discovery Fund
This page is intentionally left blank.
Performance highlights (unaudited)
Investment objective
The Fund seeks long-term capital appreciation.
Manager
Wells Fargo Funds Management, LLC
Subadviser
Wells Capital Management Incorporated
Portfolio managers
Michael T. Smith, CFA®‡
Christopher J. Warner, CFA®‡
Average annual total returns (%) as of September 30, 2019
| | | | | | | | | | | | | | | | | | | | | | | | | | | | | | | | | | |
| | | | |
| | | | | Including sales charge | | | Excluding sales charge | | | Expense ratios1 (%) | |
| | | | | | | | | |
| | | Inception date | | 1 year | | | 5 year | | | 10 year | | | 1 year | | | 5 year | | | 10 year | | | Gross | | | Net2 | |
| | | | | | | | | | |
| Class A (WFDAX) | | 7-31-2007 | | | -2.16 | | | | 10.39 | | | | 14.10 | | | | 3.81 | | | | 11.70 | | | | 14.78 | | | | 1.21 | | | | 1.21 | |
| | | | | | | | | | |
| Class C (WDSCX) | | 7-31-2007 | | | 2.01 | | | | 10.87 | | | | 13.92 | | | | 3.01 | | | | 10.87 | | | | 13.92 | | | | 1.96 | | | | 1.96 | |
| | | | | | | | | | |
| Class R6 (WFDRX)3 | | 6-28-2013 | | | – | | | | – | | | | – | | | | 4.26 | | | | 12.18 | | | | 15.26 | | | | 0.78 | | | | 0.78 | |
| | | | | | | | | | |
| Administrator Class (WFDDX) | | 4-8-2005 | | | – | | | | – | | | | – | | | | 3.88 | | | | 11.80 | | | | 14.91 | | | | 1.13 | | | | 1.13 | |
| | | | | | | | | | |
| Institutional Class (WFDSX) | | 8-31-2006 | | | – | | | | – | | | | – | | | | 4.15 | | | | 12.09 | | | | 15.20 | | | | 0.88 | | | | 0.88 | |
| | | | | | | | | | |
| Russell 2500TM Growth Index4 | | – | | | – | | | | – | | | | – | | | | -4.11 | | | | 10.22 | | | | 13.48 | | | | – | | | | – | |
Figures quoted represent past performance, which is no guarantee of future results, and do not reflect taxes that a shareholder may pay on fund distributions or the redemption of fund shares. Investment return and principal value of an investment will fluctuate so that an investor’s shares, when redeemed, may be worth more or less than their original cost. Performance shown without sales charges would be lower if sales charges were reflected. Current performance may be lower or higher than the performance data quoted, which assumes the reinvestment of dividends and capital gains. Current month-end performance is available on the Fund’s website,wfam.com.
Index returns do not include transaction costs associated with buying and selling securities, any mutual fund fees or expenses, or any taxes. It is not possible to invest directly in an index.
For Class A shares, the maximum front-end sales charge is 5.75%. For Class C shares, the maximum contingent deferred sales charge is 1.00%. Performance including a contingent deferred sales charge assumes the sales charge for the corresponding time period. Class R6, Administrator Class, and Institutional Class shares are sold without a front-end sales charge or contingent deferred sales charge.
Stock values fluctuate in response to the activities of individual companies and general market and economic conditions. Smaller-company stocks tend to be more volatile and less liquid than those of larger companies. Certain investment strategies tend to increase the total risk of an investment (relative to the broader market). The Fund is exposed to foreign investment risk. Consult the Fund’s prospectus for additional information on these and other risks.
Please see footnotes on page 7.
6 | Wells Fargo Discovery Fund
Performance highlights (unaudited)
|
|
| Growth of $10,000 investment as of September 30, 20195 |
|
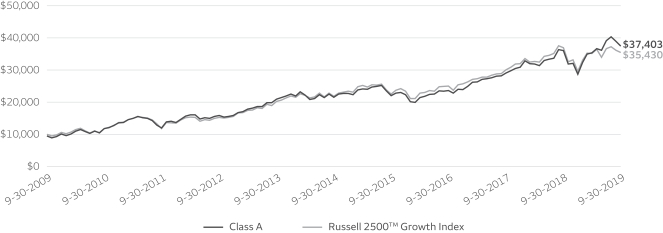
|
| ‡ | CFA® and Chartered Financial Analyst® are trademarks owned by CFA Institute. |
| 1 | Reflects the expense ratios as stated in the most recent prospectuses, which include the impact of 0.01% in acquired fund fees and expenses. The expense ratios shown are subject to change and may differ from the annualized expense ratios shown in the financial highlights of this report, which do not include acquired fund fees and expenses. |
| 2 | The manager has contractually committed through January 31, 2020, to waive fees and/or reimburse expenses to the extent necessary to cap the expenses of each class after fee waivers at 1.22% for Class A, 1.97% for Class C, 0.84% for Class R6, 1.15% for Administrator Class, and 0.89% for Institutional Class. Brokerage commissions, stamp duty fees, interest, taxes, acquired fund fees and expenses (if any), and extraordinary expenses are excluded from the expense cap. Prior to or after the commitment expiration date, the cap may be increased or the commitment to maintain the cap may be terminated only with the approval of the Board of Trustees. Without this cap, the Fund’s returns would have been lower. The expense ratio paid by an investor is the net expense ratio (the total annual fund operating expenses after fee waivers) as stated in the prospectuses. |
| 3 | Historical performance shown for Class R6 shares prior to their inception reflects the performance of Institutional Class shares, and includes the higher expenses applicable to Institutional Class shares. If these expenses had not been included, the returns for Class R6 shares would be higher. |
| 4 | The Russell 2500™Growth Index measures the performance of those Russell 2500 companies with higher price/book ratios and higher forecasted growth values. You cannot invest directly in an index. |
| 5 | The chart compares the performance of Class A shares for the most recent ten years with the Russell 2500™ Growth Index. The chart assumes a hypothetical investment of $10,000 in Class A shares and reflects all operating expenses and assumes the maximum initial sales charge of 5.75%. |
| 6 | The ten largest holdings, excluding cash, cash equivalents and any money market funds, are calculated based on the value of the investments divided by total net assets of the Fund. Holdings are subject to change and may have changed since the date specified. |
| 7 | Amounts are calculated based on the total long-term investments of the Fund. These amounts are subject to change and may have changed since the date specified. |
| * | This security was no longer held at the end of the reporting period. |
Wells Fargo Discovery Fund | 7
Performance highlights (unaudited)
MANAGER’S DISCUSSION
Fund highlights
| ∎ | | The Fund outperformed its benchmark, the Russell 2500TM Growth Index, for the 12-month period that ended September 30, 2019. |
| ∎ | | Stock selection in the consumer discretionary and information technology (IT) sectors contributed to performance. |
| ∎ | | Stock selection in the health care sector and specific names within IT hurt the Fund’s performance. |
A number of macro factors influenced investor sentiment over the past 12 months. These included the ongoing U.S.-China trade war, a change in monetary policy by the U.S. Federal Reserve, tepid U.S. economic data, and increased geopolitical risks. For much of the past year, however, the U.S. equity market remained quite resilient. The market rewarded companies with the ability to grow earnings regardless of the economic backdrop—firms with disruptive technology and significant competitive advantages. We refer to these firms as being on the right side of change, and we populated the portfolio with companies meeting those criteria. Market volatility, however, was not entirely macro-driven. Corporate earnings have recently become choppier. Given the increased uncertainty, investors had little patience for fundamental disappointments, particularly for stocks carrying premium valuations. We continue to believe that taking the valuation risk associated with secular growth stocks is a superior strategy compared with building a portfolio high in cyclical exposure.
| | | | |
| |
| Ten largest holdings (%) as of September 30, 20196 | | | �� |
| | |
Waste Connections Incorporated | | | 2.23 | |
| | |
WEX Incorporated | | | 2.21 | |
| | |
Black Knight Incorporated | | | 2.12 | |
| | |
DexCom Incorporated | | | 2.03 | |
| | |
Booz Allen Hamilton Holding Corporation | | | 1.98 | |
| | |
Bright Horizons Family Solutions Incorporated | | | 1.94 | |
| | |
Insulet Corporation | | | 1.81 | |
| | |
Euronet Worldwide Incorporated | | | 1.80 | |
| | |
Chipotle Mexican Grill Incorporated | | | 1.78 | |
| | |
Burlington Stores Incorporated | | | 1.73 | |
Stock selection benefited the Fund’s relative performance, especially within consumer discretionary and IT.
Within the IT sector, the Fund’s position in Shopify Incorporated* contributed to returns. Shopify, a provider of e-commerce solutions for direct-to-consumer brands, traditionally focused on small and medium-size businesses but is currently penetrating larger businesses via its Shopify Plus offering. Shopify benefits from its customers’ growth by processing payments for smaller customers and charging a fee on each transaction for larger customers. The company’s two vectors of growth—new customers and revenue expansion of existing customers—drove higher-than-expected financial results.
Within consumer discretionary, MercadoLibre, Incorporated, was additive to returns. MercadoLibre is the dominant Latin American e-commerce provider and owns MercadoPago, the leading online payment solution in Latin America. Increasede-commerce penetration in the firm’s key markets, such as Brazil and Argentina, drove higher sales growth. Customers’ use of MercadoPago both on and off its e-commerce marketplace was a key driver of outperformance for the stock.
|
|
| Sector distribution as of September 30, 20197 |
|
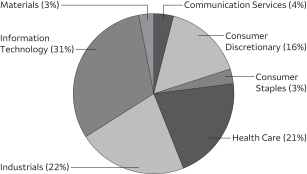 |
Stock selection in health care and specific names within IT detracted from Fund performance.
Within IT, Pluralsight, Incorporated*, a provider of training tools for software developers via software as a service, negatively affected the Fund’s results. The company’s learning platform provides a lower-cost way for employers to train their tech workers, which has become critical due to a shortage of skilled developers. However, the company did not sufficiently invest behind its sales organization to support the rapid growth of the business. This underinvestment resulted in lower-than-expected sales growth and disappointing sales guidance.
Please see footnotes on page 7.
8 | Wells Fargo Discovery Fund
Performance highlights (unaudited)
Within health care, ICU Medical, Incorporated, had a negative impact on results. ICU Medical manufactures infusion pumps and the relating consumables used in hospitals to deliver intravenous (IV) drugs and therapies. An oversupply of IV solution in the marketplace caused a competitor to undertake an irrational pricing strategy. ICU Medical stopped selling the product as the prices no longer made it profitable. As a result, the company’s results missed expectations and it had to lower guidance.
Caution ahead
As we close out 2019, we believe caution is warranted. While the U.S. consumer and labor markets appear resilient, the global economic slowdown and U.S.-China trade war have clearly taken a toll on business confidence. This has generated a concerning trend of weakness in capital spending and business investment. Recent manufacturing data indicate the U.S. may be on the verge of an industrial recession. Plummeting interest rates and recent market volatility are indicators of rising uncertainty. While policymakers may respond with additional stimulus, we believe investors should brace themselves for heightened volatility and scrutinize the fundamentals embedded in their portfolios.
Despite this caution, there are still exciting opportunities to pursue. We don’t believe this is the end of the cycle; we think the market is simply experiencing increased narrowness. We intend to use that to the advantage of our shareholders. We expect that businesses with resilient fundamentals and secular growth companies will continue to be rewarded with premium valuations. Our goal is to construct a portfolio with a balance of these businesses in pursuit of a winning formula. Despite all the rising uncertainty, we feel this remains a great time to invest in businesses on the right side of change.
Wells Fargo Discovery Fund | 9
Fund expenses (unaudited)
As a shareholder of the Fund, you incur two types of costs: (1) transaction costs, including sales charges (loads) on purchase payments and contingent deferred sales charges (if any) on redemptions and (2) ongoing costs, including management fees, distribution (12b-1) and/or shareholder servicing fees, and other Fund expenses. This example is intended to help you understand your ongoing costs (in dollars) of investing in the Fund and to compare these costs with the ongoing costs of investing in other mutual funds.
The example is based on an investment of $1,000 invested at the beginning of the six-month period and held for the entire period from April 1, 2019 to September 30, 2019.
Actual expenses
The “Actual” line of the table below provides information about actual account values and actual expenses. You may use the information in this line, together with the amount you invested, to estimate the expenses that you paid over the period. Simply divide your account value by $1,000 (for example, an $8,600 account value divided by $1,000 = 8.6), then multiply the result by the number in the “Actual” line under the heading entitled “Expenses paid during period” for your applicable class of shares to estimate the expenses you paid on your account during this period.
Hypothetical example for comparison purposes
The “Hypothetical” line of the table below provides information about hypothetical account values and hypothetical expenses based on the Fund’s actual expense ratio and an assumed rate of return of 5% per year before expenses, which is not the Fund’s actual return. The hypothetical account values and expenses may not be used to estimate the actual ending account balance or expenses you paid for the period. You may use this information to compare the ongoing costs of investing in the Fund and other funds. To do so, compare this 5% hypothetical example with the 5% hypothetical examples that appear in the shareholder reports of the other funds.
Please note that the expenses shown in the table are meant to highlight your ongoing costs only and do not reflect any transactional costs, such as sales charges (loads) and contingent deferred sales charges. Therefore, the “Hypothetical” line of the table is useful in comparing ongoing costs only and will not help you determine the relative total costs of owning different funds. In addition, if these transactional costs were included, your costs would have been higher.
| | | | | | | | | | | | | | | | |
| | | Beginning
account value
4-1-2019 | | | Ending
account value
9-30-2019 | | | Expenses
paid during
the period¹ | | | Annualized net
expense ratio | |
| | | | | |
Class A | | | | | | | | | | | | | | | | |
| | | | |
Actual | | $ | 1,000.00 | | | $ | 1,059.61 | | | $ | 6.24 | | | | 1.21 | % |
| | | | |
Hypothetical (5% return before expenses) | | $ | 1,000.00 | | | $ | 1,019.01 | | | $ | 6.11 | | | | 1.21 | % |
| | | | | |
Class C | | | | | | | | | | | | | | | | |
| | | | |
Actual | | $ | 1,000.00 | | | $ | 1,055.64 | | | $ | 10.10 | | | | 1.96 | % |
| | | | |
Hypothetical (5% return before expenses) | | $ | 1,000.00 | | | $ | 1,015.24 | | | $ | 9.90 | | | | 1.96 | % |
| | | | | |
Class R6 | | | | | | | | | | | | | | | | |
| | | | |
Actual | | $ | 1,000.00 | | | $ | 1,062.12 | | | $ | 4.01 | | | | 0.78 | % |
| | | | |
Hypothetical (5% return before expenses) | | $ | 1,000.00 | | | $ | 1,021.17 | | | $ | 3.93 | | | | 0.78 | % |
| | | | | |
Administrator Class | | | | | | | | | | | | | | | | |
| | | | |
Actual | | $ | 1,000.00 | | | $ | 1,059.82 | | | $ | 5.82 | | | | 1.13 | % |
| | | | |
Hypothetical (5% return before expenses) | | $ | 1,000.00 | | | $ | 1,019.41 | | | $ | 5.71 | | | | 1.13 | % |
| | | | | |
Institutional Class | | | | | | | | | | | | | | | | |
| | | | |
Actual | | $ | 1,000.00 | | | $ | 1,061.36 | | | $ | 4.53 | | | | 0.88 | % |
| | | | |
Hypothetical (5% return before expenses) | | $ | 1,000.00 | | | $ | 1,020.67 | | | $ | 4.44 | | | | 0.88 | % |
| 1 | Expenses paid is equal to the annualized net expense ratio of each class multiplied by the average account value over the period, multiplied by the number of days in the most recent fiscal half-year divided by the number of days in the fiscal year (to reflect the one-half-year period). |
10 | Wells Fargo Discovery Fund
Portfolio of investments—September 30, 2019
| | | | | | | | | | | | | | | | |
| | | | | | | | | Shares | | | Value | |
| Common Stocks: 97.78% | | | | | | | | | | | | | | | | |
| | | | |
Communication Services: 4.29% | | | | | | | | | | | | | | | | |
| | | | |
| Entertainment: 3.11% | | | | | | | | | | | | |
Take-Two Interactive Software Incorporated † | | | | | | | | | | | 341,200 | | | $ | 42,766,008 | |
World Wrestling Entertainment Incorporated Class A « | | | | | | | | | | | 489,800 | | | | 34,849,270 | |
| |
| | | | 77,615,278 | |
| | | | | | | | | | | | | | | | |
| | | | |
| Interactive Media & Services: 1.18% | | | | | | | | | | | | |
Match Group Incorporated « | | | | | | | | | | | 410,400 | | | | 29,318,976 | |
| | | | | | | | | | | | | | | | |
| | | | |
Consumer Discretionary: 15.41% | | | | | | | | | | | | | | | | |
| | | | |
| Diversified Consumer Services: 1.94% | | | | | | | | | | | | |
Bright Horizons Family Solutions Incorporated † | | | | | | | | | | | 318,040 | | | | 48,501,100 | |
| | | | | | | | | | | | | | | | |
| | | | |
| Hotels, Restaurants & Leisure: 4.84% | | | | | | | | | | | | |
Chipotle Mexican Grill Incorporated † | | | | | | | | | | | 52,800 | | | | 44,376,816 | |
Domino’s Pizza Incorporated | | | | | | | | | | | 145,200 | | | | 35,514,468 | |
Vail Resorts Incorporated | | | | | | | | | | | 179,314 | | | | 40,804,694 | |
| |
| | | | 120,695,978 | |
| | | | | | | | | | | | | | | | |
| | | | |
| Internet & Direct Marketing Retail: 3.42% | | | | | | | | | | | | |
Etsy Incorporated † | | | | | | | | | | | 759,500 | | | | 42,911,750 | |
MercadoLibre Incorporated † | | | | | | | | | | | 77,211 | | | | 42,561,020 | |
| |
| | | | 85,472,770 | |
| | | | | | | | | | | | | | | | |
| | | | |
| Specialty Retail: 4.16% | | | | | | | | | | | | |
Burlington Stores Incorporated † | | | | | | | | | | | 215,365 | | | | 43,034,234 | |
Carvana Corporation †« | | | | | | | | | | | 296,400 | | | | 19,562,400 | |
Five Below Incorporated † | | | | | | | | | | | 326,200 | | | | 41,133,820 | |
| |
| | | | 103,730,454 | |
| | | | | | | | | | | | | | | | |
| | | | |
| Textiles, Apparel & Luxury Goods: 1.05% | | | | | | | | | | | | |
Under Armour Incorporated Class C † | | | | | | | | | | | 1,442,500 | | | | 26,152,525 | |
| | | | | | | | | | | | | | | | |
| | | | |
Consumer Staples: 2.66% | | | | | | | | | | | | | | | | |
| | | | |
| Food & Staples Retailing: 1.32% | | | | | | | | | | | | |
US Foods Holding Corporation † | | | | | | | | | | | 801,400 | | | | 32,937,540 | |
| | | | | | | | | | | | | | | | |
| | | | |
| Food Products: 1.34% | | | | | | | | | | | | |
Lamb Weston Holdings Incorporated | | | | | | | | | | | 458,900 | | | | 33,371,208 | |
| | | | | | | | | | | | | | | | |
| | | | |
Health Care: 21.06% | | | | | | | | | | | | | | | | |
| | | | |
| Biotechnology: 5.88% | | | | | | | | | | | | |
CRISPR Therapeutics AG †« | | | | | | | | | | | 253,571 | | | | 10,393,875 | |
Deciphera Pharmaceuticals Incorporated † | | | | | | | | | | | 255,579 | | | | 8,674,351 | |
Exact Sciences Corporation † | | | | | | | | | | | 441,800 | | | | 39,925,466 | |
Immunomedics Incorporated † | | | | | | | | | | | 980,700 | | | | 13,004,082 | |
Invitae Corporation † | | | | | | | | | | | 704,298 | | | | 13,571,822 | |
Mirati Therapeutics Incorporated † | | | | | | | | | | | 133,200 | | | | 10,377,612 | |
Precision BioSciences Incorporated †« | | | | | | | | | | | 362,620 | | | | 3,042,382 | |
Sarepta Therapeutics Incorporated † | | | | | | | | | | | 171,035 | | | | 12,882,356 | |
Turning Point Therapeutics Incorporated † | | | | | | | | | | | 308,364 | | | | 11,594,486 | |
Twist Bioscience Corporation † | | | | | | | | | | | 459,900 | | | | 10,982,412 | |
Zai Lab Limited ADR † | | | | | | | | | | | 381,419 | | | | 12,338,905 | |
| |
| | | | 146,787,749 | |
| | | | | | | | | | | | | | | | |
Wells Fargo Discovery Fund | 11
Portfolio of investments—September 30, 2019
| | | | | | | | | | | | | | | | |
| | | | | | | | | Shares | | | Value | |
| Health Care Equipment & Supplies: 8.52% | | | | | | | | | | | | |
DexCom Incorporated † | | | | | | | | | | | 339,200 | | | $ | 50,622,208 | |
Haemonetics Corporation † | | | | | | | | | | | 326,600 | | | | 41,197,324 | |
ICU Medical Incorporated † | | | | | | | | | | | 157,861 | | | | 25,194,616 | |
Insulet Corporation † | | | | | | | | | | | 273,695 | | | | 45,140,516 | |
iRhythm Technologies Incorporated † | | | | | | | | | | | 428,300 | | | | 31,741,313 | |
Silk Road Medical Incorporated †« | | | | | | | | | | | 571,344 | | | | 18,585,820 | |
| |
| | | | 212,481,797 | |
| | | | | | | | | | | | | | | | |
| | | | |
| Health Care Providers & Services: 1.44% | | | | | | | | | | | | |
HealthEquity Incorporated † | | | | | | | | | | | 627,300 | | | | 35,847,059 | |
| | | | | | | | | | | | | | | | |
| | | | |
| Health Care Technology: 1.62% | | | | | | | | | | | | |
Veeva Systems Incorporated Class A † | | | | | | | | | | | 265,600 | | | | 40,554,464 | |
| | | | | | | | | | | | | | | | |
| | | | |
| Life Sciences Tools & Services: 1.40% | | | | | | | | | | | | |
Bio-Rad Laboratories Incorporated Class A † | | | | | | | | | | | 104,800 | | | | 34,871,152 | |
| | | | | | | | | | | | | | | | |
| | | | |
| Pharmaceuticals: 2.20% | | | | | | | | | | | | |
Catalent Incorporated † | | | | | | | | | | | 642,500 | | | | 30,621,550 | |
Elanco Animal Health Incorporated † | | | | | | | | | | | 912,818 | | | | 24,271,831 | |
| |
| | | | 54,893,381 | |
| | | | | | | | | | | | | | | | |
| | | | |
Industrials: 21.34% | | | | | | | | | | | | | | | | |
| | | | |
| Aerospace & Defense: 2.94% | | | | | | | | | | | | |
Mercury Computer Systems Incorporated † | | | | | | | | | | | 440,819 | | | | 35,781,278 | |
Teledyne Technologies Incorporated † | | | | | | | | | | | 116,600 | | | | 37,544,034 | |
| |
| | | | 73,325,312 | |
| | | | | | | | | | | | | | | | |
| | | | |
| Building Products: 0.54% | | | | | | | | | | | | |
Trex Company Incorporated † | | | | | | | | | | | 147,700 | | | | 13,430,361 | |
| | | | | | | | | | | | | | | | |
| | | | |
| Commercial Services & Supplies: 9.48% | | | | | | | | | | | | |
Casella Waste Systems Incorporated Class A † | | | | | | | | | | | 867,374 | | | | 37,245,040 | |
IAA Incorporated † | | | | | | | | | | | 923,700 | | | | 38,546,001 | |
MSA Safety Incorporated | | | | | | | | | | | 317,800 | | | | 34,675,158 | |
Tetra Tech Incorporated | | | | | | | | | | | 478,100 | | | | 41,479,956 | |
The Brink’s Company | | | | | | | | | | | 347,000 | | | | 28,783,650 | |
Waste Connections Incorporated | | | | | | | | | | | 605,729 | | | | 55,727,068 | |
| |
| | | | 236,456,873 | |
| | | | | | | | | | | | | | | | |
| | | | |
| Construction & Engineering: 1.24% | | | | | | | | | | | | |
WillScot Corporation † | | | | | | | | | | | 1,985,750 | | | | 30,937,985 | |
| | | | | | | | | | | | | | | | |
| | | | |
| Industrial Conglomerates: 1.60% | | | | | | | | | | | | |
Carlisle Companies Incorporated | | | | | | | | | | | 275,000 | | | | 40,023,500 | |
| | | | | | | | | | | | | | | | |
| | | | |
| Machinery: 2.90% | | | | | | | | | | | | |
The Middleby Corporation † | | | | | | | | | | | 280,800 | | | | 32,825,520 | |
Woodward Governor Company | | | | | | | | | | | 365,800 | | | | 39,444,214 | |
| |
| | | | 72,269,734 | |
| | | | | | | | | | | | | | | | |
| | | | |
| Road & Rail: 1.71% | | | | | | | | | | | | |
Saia Incorporated † | | | | | | | | | | | 456,800 | | | | 42,802,160 | |
| | | | | | | | | | | | | | | | |
| | | | |
| Trading Companies & Distributors: 0.93% | | | | | | | | | | | | |
SiteOne Landscape Supply Incorporated † | | | | | | | | | | | 314,143 | | | | 23,252,865 | |
| | | | | | | | | | | | | | | | |
12 | Wells Fargo Discovery Fund
Portfolio of investments—September 30, 2019
| | | | | | | | | | | | | | | | |
| | | | | | | | | Shares | | | Value | |
Information Technology: 30.39% | | | | | | | | | | | | | | | | |
| | | | |
| Communications Equipment: 1.11% | | | | | | | | | | | | |
Motorola Solutions Incorporated | | | | | | | | | | | 162,300 | | | $ | 27,657,543 | |
| | | | | | | | | | | | | | | | |
| | | | |
| Electronic Equipment, Instruments & Components: 3.95% | | | | | | | | | | | | |
Novanta Incorporated † | | | | | | | | | | | 402,540 | | | | 32,895,569 | |
Rogers Corporation † | | | | | | | | | | | 222,599 | | | | 30,431,509 | |
Zebra Technologies Corporation Class A † | | | | | | | | | | | 170,700 | | | | 35,227,359 | |
| |
| | | | 98,554,437 | |
| | | | | | | | | | | | | | | | |
| | | | |
| IT Services: 16.50% | | | | | | | | | | | | |
Black Knight Incorporated † | | | | | | | | | | | 866,719 | | | | 52,921,862 | |
Booz Allen Hamilton Holding Corporation | | | | | | | | | | | 694,400 | | | | 49,316,288 | |
EPAM Systems Incorporated † | | | | | | | | | | | 235,079 | | | | 42,859,603 | |
Euronet Worldwide Incorporated † | | | | | | | | | | | 306,472 | | | | 44,836,854 | |
InterXion Holding NV † | | | | | | | | | | | 499,300 | | | | 40,672,978 | |
Okta Incorporated † | | | | | | | | | | | 331,300 | | | | 32,619,798 | |
PagSeguro Digital Limited Class A † | | | | | | | | | | | 686,200 | | | | 31,777,922 | |
Twilio Incorporated Class A † | | | | | | | | | | | 268,800 | | | | 29,557,248 | |
WEX Incorporated † | | | | | | | | | | | 273,200 | | | | 55,205,524 | |
WNS Holdings Limited ADR † | | | | | | | | | | | 543,400 | | | | 31,924,750 | |
| |
| | | | 411,692,827 | |
| | | | | | | | | | | | | | | | |
| | | | |
| Semiconductors & Semiconductor Equipment: 1.20% | | | | | | | | | | | | |
Lattice Semiconductor Corporation † | | | | | | | | | | | 1,636,100 | | | | 29,916,089 | |
| | | | | | | | | | | | | | | | |
| | | | |
| Software: 6.56% | | | | | | | | | | | | |
Avalara Incorporated † | | | | | | | | | | | 315,800 | | | | 21,250,182 | |
Elastic NV †« | | | | | | | | | | | 402,500 | | | | 33,141,850 | |
Envestnet Incorporated † | | | | | | | | | | | 403,025 | | | | 22,851,518 | |
Globant SA † | | | | | | | | | | | 326,800 | | | | 29,928,344 | |
Pagerduty Incorporated †« | | | | | | | | | | | 539,400 | | | | 15,238,050 | |
Zendesk Incorporated † | | | | | | | | | | | 565,500 | | | | 41,213,640 | |
| |
| | | | 163,623,584 | |
| | | | | | | | | | | | | | | | |
| | | | |
| Technology Hardware, Storage & Peripherals: 1.07% | | | | | | | | | | | | |
NCR Corporation † | | | | | | | | | | | 844,900 | | | | 26,665,044 | |
| | | | | | | | | | | | | | | | |
| | | | |
Materials: 2.63% | | | | | | | | | | | | | | | | |
| | | | |
| Chemicals: 1.17% | | | | | | | | | | | | |
Ingevity Corporation † | | | | | | | | | | | 342,900 | | | | 29,091,636 | |
| | | | | | | | | | | | | | | | |
| | | | |
| Containers & Packaging: 1.46% | | | | | | | | | | | | |
AptarGroup Incorporated | | | | | | | | | | | 307,500 | | | | 36,423,374 | |
| | | | | | | | | | | | | | | | |
| |
Total Common Stocks (Cost $1,893,195,718) | | | | 2,439,354,755 | |
| | | | | | | | | | | | | | | | |
| | | | |
| | | | | | | | | | | | | | | | |
| | | Yield | | | | | | | | | | |
| Short-Term Investments: 6.43% | | | | | | | | | | | | | | | | |
| | | | |
| Investment Companies: 6.43% | | | | | | | | | | | | |
Securities Lending Cash Investments LLC (l)(r)(u) | | | 2.11 | % | | | | | | | 125,444,271 | | | | 125,456,815 | |
Wells Fargo Government Money Market Fund Select Class (l)(u) | | | 1.88 | | | | | | | | 34,896,690 | | | | 34,896,690 | |
| | | | |
Total Short-Term Investments (Cost $160,353,209) | | | | | | | | | | | | | | | 160,353,505 | |
| | | | | | | | | | | | | | | | |
| | | | | | | | |
| Total investments in securities (Cost $2,053,548,927) | | | 104.21 | % | | | 2,599,708,260 | |
| | |
Other assets and liabilities, net | | | (4.21 | ) | | | (105,078,320 | ) |
| | | | | | | | |
| Total net assets | | | 100.00 | % | | $ | 2,494,629,940 | |
| | | | | | | | |
Wells Fargo Discovery Fund | 13
Portfolio of investments—September 30, 2019
| † | Non-income-earning security |
| « | All or a portion of this security is on loan. |
| (l) | The issuer of the security is an affiliated person of the Fund as defined in the Investment Company Act of 1940. |
| (r) | The investment is a non-registered investment company purchased with cash collateral received from securities on loan. |
| (u) | The rate represents the 7-day annualized yield at period end. |
Abbreviations:
| ADR | American depositary receipt |
Investments in Affiliates
An affiliated investment is an investment in which the Fund owns at least 5% of the outstanding voting shares of the issuer or as a result of other relationships, such as the Fund and the issuer having the same investment manager. Transactions with issuers that were either affiliated persons of the Fund at the beginning of the period or the end of the period were as follows:
| | | | | | | | | | | | | | | | | | | | | | | | | | | | | | | | | | | | |
| | | Shares,
beginning of
period | | | Shares
purchased | | | Shares
sold | | | Shares,
end of
period | | | Net
realized gains
(losses) | | | Net
change in
unrealized gains
(losses) | | | Income
from
affiliated
securities | | | Value,
end of period | | | % of
net
assets | |
| | | | | | | | | |
| Short-Term Investments | | | | | | | | | | | | | | | | | | | | | | | | | | | |
Investment Companies | | | | | | | | | | | | | | | | | | | | | | | | | | | | | | | | | | | | |
Securities Lending Cash Investments LLC | | | 224,067,768 | | | | 1,149,036,854 | | | | 1,247,660,351 | | | | 125,444,271 | | | $ | 12,337 | | | $ | (2,692 | ) | | $ | 3,059,212 | # | | $ | 125,456,815 | | | | | |
Wells Fargo Government Money Market Fund Select Class | | | 32,383,204 | | | | 852,087,000 | | | | 849,573,514 | | | | 34,896,690 | | | | 0 | | | | 0 | | | | 953,839 | | | | 34,896,690 | | | | | |
| | | | | | | | | | | | | | | | | | | | | | | | | | | | | | | | | | | | |
| | | | | | | | | | | | | | | | | | $ | 12,337 | | | $ | (2,692 | ) | | $ | 4,013,051 | | | $ | 160,353,505 | | | | 6.43 | % |
| | | | | | | | | | | | | | | | | | | | | | | | | | | | | | | | | | | | |
| # | Amount shown represents income before fees and rebates. |
The accompanying notes are an integral part of these financial statements.
14 | Wells Fargo Discovery Fund
Statement of assets and liabilities—September 30, 2019
| | | | |
| | | | |
| |
Assets | | | | |
Investments in unaffiliated securities (including $122,008,025 of securities loaned), at value (cost $1,893,195,718) | | $ | 2,439,354,755 | |
Investments in affiliated securities, at value (cost $160,353,209) | | | 160,353,505 | |
Receivable for Fund shares sold | | | 33,210,308 | |
Receivable for dividends | | | 129,995 | |
Receivable for securities lending income, net | | | 345,164 | |
| | | | |
Total assets | | | 2,633,393,727 | |
| | | | |
| |
Liabilities | | | | |
Payable upon receipt of securities loaned | | | 125,458,644 | |
Payable for Fund shares redeemed | | | 10,672,999 | |
Management fee payable | | | 1,509,937 | |
Administration fees payable | | | 281,583 | |
Distribution fee payable | | | 19,742 | |
Trustees’ fees and expenses payable | | | 2,471 | |
Accrued expenses and other liabilities | | | 818,411 | |
| | | | |
Total liabilities | | | 138,763,787 | |
| | | | |
Total net assets | | $ | 2,494,629,940 | |
| | | | |
| |
Net assets consist of | | | | |
Paid-in capital | | $ | 1,719,015,571 | |
Total distributable earnings | | | 775,614,369 | |
| | | | |
Total net assets | | $ | 2,494,629,940 | |
| | | | |
| |
Computation of net asset value and offering price per share | | | | |
Net assets – Class A | | $ | 627,335,752 | |
Shares outstanding – Class A1 | | | 18,872,535 | |
Net asset value per share – Class A | | | $33.24 | |
Maximum offering price per share – Class A2 | | | $35.27 | |
Net assets – Class C | | $ | 30,982,067 | |
Shares outstanding – Class C1 | | | 1,095,790 | |
Net asset value per share – Class C | | | $28.27 | |
Net assets – Class R6 | | $ | 405,609,873 | |
Shares outstanding – Class R61 | | | 11,034,313 | |
Net asset value per share – Class R6 | | | $36.76 | |
Net assets – Administrator Class | | $ | 333,814,437 | |
Shares outstanding – Administrator Class1 | | | 9,660,797 | |
Net asset value per share – Administrator Class | | | $34.55 | |
Net assets – Institutional Class | | $ | 1,096,887,811 | |
Shares outstanding – Institutional Class1 | | | 30,054,210 | |
Net asset value per share – Institutional Class | | | $36.50 | |
| 1 | The Fund has an unlimited number of authorized shares. |
| 2 | Maximum offering price is computed as 100/94.25 of net asset value. On investments of $50,000 or more, the offering price is reduced. |
The accompanying notes are an integral part of these financial statements.
Wells Fargo Discovery Fund | 15
Statement of operations—year ended September 30, 2019
| | | | |
| | | | |
| |
Investment income | | | | |
Dividends (net of foreign withholding taxes of $77,404) | | $ | 9,150,023 | |
Securities lending income from affiliates, net | | | 1,088,169 | |
Income from affiliated securities | | | 953,839 | |
| | | | |
Total investment income | | | 11,192,031 | |
| | | | |
| |
Expenses | | | | |
Management fee | | | 18,340,587 | |
Administration fees | | | | |
Class A | | | 1,299,290 | |
Class C | | | 68,726 | |
Class R6 | | | 133,885 | |
Administrator Class | | | 425,000 | |
Institutional Class | | | 1,439,485 | |
Shareholder servicing fees | | | | |
Class A | | | 1,546,774 | |
Class C | | | 81,817 | |
Administrator Class | | | 817,308 | |
Distribution fee | | | | |
Class C | | | 245,451 | |
Custody and accounting fees | | | 150,204 | |
Professional fees | | | 44,917 | |
Registration fees | | | 58,519 | |
Shareholder report expenses | | | 193,815 | |
Trustees’ fees and expenses | | | 21,652 | |
Other fees and expenses | | | 52,339 | |
| | | | |
Total expenses | | | 24,919,769 | |
Less: Fee waivers and/or expense reimbursements | | | | |
Class A | | | (1,232 | ) |
Class C | | | (66 | ) |
Administrator Class | | | (1,024 | ) |
| | | | |
Net expenses | | | 24,917,447 | |
| | | | |
Net investment loss | | | (13,725,416 | ) |
| | | | |
| |
Realized and unrealized gains (losses) on investments | | | | |
Net realized gains on | | | | |
Unaffiliated securities | | | 288,845,219 | |
Affiliated securities | | | 12,337 | |
| | | | |
Net realized gains on investments | | | 288,857,556 | |
| | | | |
| |
Net change in unrealized gains (losses) on | | | | |
Unaffiliated securities | | | (222,173,660 | ) |
Affiliated securities | | | (2,692 | ) |
| | | | |
Net change in unrealized gains (losses) on investments | | | (222,176,352 | ) |
| | | | |
Net realized and unrealized gains (losses) on investments | | | 66,681,204 | |
| | | | |
Net increase in net assets resulting from operations | | $ | 52,955,788 | |
| | | | |
The accompanying notes are an integral part of these financial statements.
16 | Wells Fargo Discovery Fund
Statement of changes in net assets
| | | | | | | | | | | | | | | | |
| | | Year ended
September 30, 2019 | | | Year ended
September 30, 2018 | |
| | | | |
Operations | | | | | | | | | | | | | | | | |
Net investment loss | | | | | | $ | (13,725,416 | ) | | | | | | $ | (12,786,673 | ) |
Net realized gains on investments | | | | | | | 288,857,556 | | | | | | | | 373,064,864 | |
Net change in unrealized gains (losses) on investments | | | | | | | (222,176,352 | ) | | | | | | | 224,747,286 | |
| | | | |
Net increase in net assets resulting from operations | | | | | | | 52,955,788 | | | | | | | | 585,025,477 | |
| | | | |
|
Distributions to shareholders from net investment income and net realized gains | |
Class A | | | | | | | (88,695,435 | ) | | | | | | | (99,511,453 | ) |
Class C | | | | | | | (5,933,378 | ) | | | | | | | (7,025,882 | ) |
Class R6 | | | | | | | (63,357,174 | ) | | | | | | | (54,328,520 | ) |
Administrator Class | | | | | | | (44,501,716 | ) | | | | | | | (51,960,260 | ) |
Institutional Class | | | | | | | (163,733,298 | ) | | | | | | | (179,090,110 | ) |
| | | | |
Total distributions to shareholders | | | | | | | (366,221,001 | ) | | | | | | | (391,916,225 | ) |
| | | | |
| | | | |
Capital share transactions | | | Shares | | | | | | | | Shares | | | | | |
Proceeds from shares sold | | | | | | | | | | | | | | | | |
Class A | | | 1,673,589 | | | | 53,100,356 | | | | 1,452,010 | | | | 51,353,312 | |
Class C | | | 124,395 | | | | 3,331,641 | | | | 112,021 | | | | 3,424,044 | |
Class R6 | | | 3,358,382 | | | | 119,049,338 | | | | 4,113,741 | | | | 158,001,613 | |
Administrator Class | | | 1,093,053 | | | | 36,588,024 | | | | 918,595 | | | | 33,383,569 | |
Institutional Class | | | 7,459,402 | | | | 263,872,998 | | | | 6,492,817 | | | | 245,683,308 | |
| | | | |
| | | | | | | 475,942,357 | | | | | | | | 491,845,846 | |
| | | | |
Reinvestment of distributions | | | | | | | | | | | | | | | | |
Class A | | | 3,194,495 | | | | 86,155,536 | | | | 3,004,879 | | | | 96,516,712 | |
Class C | | | 234,117 | | | | 5,403,420 | | | | 221,675 | | | | 6,302,232 | |
Class R6 | | | 2,119,233 | | | | 62,983,596 | | | | 1,557,379 | | | | 54,087,762 | |
Administrator Class | | | 1,575,742 | | | | 44,136,530 | | | | 1,557,195 | | | | 51,621,001 | |
Institutional Class | | | 5,074,483 | | | | 149,849,493 | | | | 4,841,719 | | | | 167,426,637 | |
| | | | |
| | | | | | | 348,528,575 | | | | | | | | 375,954,344 | |
| | | | |
Payment for shares redeemed | | | | | | | | | | | | | | | | |
Class A | | | (3,794,967 | ) | | | (119,681,413 | ) | | | (3,309,751 | ) | | | (116,123,418 | ) |
Class C | | | (483,874 | ) | | | (12,595,548 | ) | | | (327,097 | ) | | | (10,270,806 | ) |
Class R6 | | | (7,308,955 | ) | | | (259,235,727 | ) | | | (1,827,978 | ) | | | (69,640,517 | ) |
Administrator Class | | | (1,998,197 | ) | | | (66,501,847 | ) | | | (2,456,379 | ) | | | (87,966,732 | ) |
Institutional Class | | | (15,416,303 | ) | | | (512,299,731 | ) | | | (8,225,567 | ) | | | (314,872,170 | ) |
| | | | |
| | | | | | | (970,314,266 | ) | | | | | | | (598,873,643 | ) |
| | | | |
Net increase (decrease) in net assets resulting from capital share transactions | | | | | | | (145,843,334 | ) | | | | | | | 268,926,547 | |
| | | | |
Total increase (decrease) in net assets | | | | | | | (459,108,547 | ) | | | | | | | 462,035,799 | |
| | | | |
| | | | |
Net assets | | | | | | | | | | | | | | | | |
Beginning of period | | | | | | | 2,953,738,487 | | | | | | | | 2,491,702,688 | |
| | | | |
End of period | | | | | | $ | 2,494,629,940 | | | | | | | $ | 2,953,738,487 | |
| | | | |
The accompanying notes are an integral part of these financial statements.
Wells Fargo Discovery Fund | 17
Financial highlights
(For a share outstanding throughout each period)
| | | | | | | | | | | | | | | | | | | | |
| | | Year ended September 30 | |
| CLASS A | | 2019 | | | 2018 | | | 2017 | | | 2016 | | | 2015 | |
Net asset value, beginning of period | | | $38.03 | | | | $36.47 | | | | $29.94 | | | | $30.48 | | | | $32.35 | |
Net investment loss | | | (0.26 | ) | | | (0.26 | ) | | | (0.23 | ) | | | (0.18 | )1 | | | (0.24 | ) |
Net realized and unrealized gains (losses) on investments | | | 0.53 | | | | 7.85 | | | | 7.17 | | | | 2.23 | | | | 0.96 | |
| | | | | | | | | | | | | | | | | | | | |
Total from investment operations | | | 0.27 | | | | 7.59 | | | | 6.94 | | | | 2.05 | | | | 0.72 | |
Distributions to shareholders from | | | | | | | | | | | | | | | | | | | | |
Net realized gains | | | (5.06 | ) | | | (6.03 | ) | | | (0.41 | ) | | | (2.59 | ) | | | (2.59 | ) |
Net asset value, end of period | | | $33.24 | | | | $38.03 | | | | $36.47 | | | | $29.94 | | | | $30.48 | |
Total return2 | | | 3.81 | % | | | 23.86 | % | | | 23.42 | % | | | 7.33 | % | | | 2.09 | % |
Ratios to average net assets (annualized) | | | | | | | | | | | | | | | | | | | | |
Gross expenses | | | 1.21 | % | | | 1.20 | % | | | 1.21 | % | | | 1.20 | % | | | 1.23 | % |
Net expenses | | | 1.20 | % | | | 1.20 | % | | | 1.21 | % | | | 1.20 | % | | | 1.21 | % |
Net investment loss | | | (0.77 | )% | | | (0.69 | )% | | | (0.70 | )% | | | (0.64 | )% | | | (0.64 | )% |
Supplemental data | | | | | | | | | | | | | | | | | | | | |
Portfolio turnover rate | | | 71 | % | | | 67 | % | | | 73 | % | | | 78 | % | | | 87 | % |
Net assets, end of period (000s omitted) | | | $627,336 | | | | $676,930 | | | | $607,318 | | | | $641,786 | | | | $294,661 | |
| 1 | Calculated based upon average shares outstanding |
| 2 | Total return calculations do not include any sales charges. |
The accompanying notes are an integral part of these financial statements.
18 | Wells Fargo Discovery Fund
Financial highlights
(For a share outstanding throughout each period)
| | | | | | | | | | | | | | | | | | | | |
| | | Year ended September 30 | |
| CLASS C | | 2019 | | | 2018 | | | 2017 | | | 2016 | | | 2015 | |
Net asset value, beginning of period | | | $33.46 | | | | $32.99 | | | | $27.32 | | | | $28.24 | | | | $30.37 | |
Net investment loss | | | (0.41 | )1 | | | (0.46 | ) | | | (0.42 | )1 | | | (0.37 | )1 | | | (0.43 | )1 |
Net realized and unrealized gains (losses) on investments | | | 0.28 | | | | 6.96 | | | | 6.50 | | | | 2.04 | | | | 0.89 | |
| | | | | | | | | | | | | | | | | | | | |
Total from investment operations | | | (0.13 | ) | | | 6.50 | | | | 6.08 | | | | 1.67 | | | | 0.46 | |
Distributions to shareholders from | | | | | | | | | | | | | | | | | | | | |
Net realized gains | | | (5.06 | ) | | | (6.03 | ) | | | (0.41 | ) | | | (2.59 | ) | | | (2.59 | ) |
Net asset value, end of period | | | $28.27 | | | | $33.46 | | | | $32.99 | | | | $27.32 | | | | $28.24 | |
Total return2 | | | 3.01 | % | | | 22.94 | % | | | 22.51 | % | | | 6.51 | % | | | 1.35 | % |
Ratios to average net assets (annualized) | | | | | | | | | | | | | | | | | | | | |
Gross expenses | | | 1.95 | % | | | 1.95 | % | | | 1.96 | % | | | 1.95 | % | | | 1.98 | % |
Net expenses | | | 1.95 | % | | | 1.95 | % | | | 1.96 | % | | | 1.95 | % | | | 1.96 | % |
Net investment loss | | | (1.51 | )% | | | (1.45 | )% | | | (1.45 | )% | | | (1.41 | )% | | | (1.39 | )% |
Supplemental data | | | | | | | | | | | | | | | | | | | | |
Portfolio turnover rate | | | 71 | % | | | 67 | % | | | 73 | % | | | 78 | % | | | 87 | % |
Net assets, end of period (000s omitted) | | | $30,982 | | | | $40,860 | | | | $40,070 | | | | $49,538 | | | | $66,772 | |
| 1 | Calculated based upon average shares outstanding |
| 2 | Total return calculations do not include any sales charges. |
The accompanying notes are an integral part of these financial statements.
Wells Fargo Discovery Fund | 19
Financial highlights
(For a share outstanding throughout each period)
| | | | | | | | | | | | | | | | | | | | |
| | | Year ended September 30 | |
| CLASS R6 | | 2019 | | | 2018 | | | 2017 | | | 2016 | | | 2015 | |
Net asset value, beginning of period | | | $41.26 | | | | $38.93 | | | | $31.80 | | | | $32.08 | | | | $33.78 | |
Net investment loss | | | (0.12 | )1 | | | (0.10 | )1 | | | (0.08 | ) | | | (0.07 | ) | | | (0.07 | ) |
Net realized and unrealized gains (losses) on investments | | | 0.68 | | | | 8.46 | | | | 7.62 | | | | 2.38 | | | | 0.96 | |
| | | | | | | | | | | | | | | | | | | | |
Total from investment operations | | | 0.56 | | | | 8.36 | | | | 7.54 | | | | 2.31 | | | | 0.89 | |
Distributions to shareholders from | | | | | | | | | | | | | | | | | | | | |
Net realized gains | | | (5.06 | ) | | | (6.03 | ) | | | (0.41 | ) | | | (2.59 | ) | | | (2.59 | ) |
Net asset value, end of period | | | $36.76 | | | | $41.26 | | | | $38.93 | | | | $31.80 | | | | $32.08 | |
Total return | | | 4.26 | % | | | 24.39 | % | | | 23.98 | % | | | 7.77 | % | | | 2.53 | % |
Ratios to average net assets (annualized) | | | | | | | | | | | | | | | | | | | | |
Gross expenses | | | 0.77 | % | | | 0.78 | % | | | 0.78 | % | | | 0.77 | % | | | 0.76 | % |
Net expenses | | | 0.77 | % | | | 0.78 | % | | | 0.78 | % | | | 0.77 | % | | | 0.76 | % |
Net investment loss | | | (0.33 | )% | | | (0.26 | )% | | | (0.27 | )% | | | (0.22 | )% | | | (0.21 | )% |
Supplemental data | | | | | | | | | | | | | | | | | | | | |
Portfolio turnover rate | | | 71 | % | | | 67 | % | | | 73 | % | | | 78 | % | | | 87 | % |
Net assets, end of period (000s omitted) | | | $405,610 | | | | $530,879 | | | | $351,268 | | | | $300,118 | | | | $273,941 | |
| 1 | Calculated based upon average shares outstanding |
The accompanying notes are an integral part of these financial statements.
20 | Wells Fargo Discovery Fund
Financial highlights
(For a share outstanding throughout each period)
| | | | | | | | | | | | | | | | | | | | |
| | | Year ended September 30 | |
| ADMINISTRATOR CLASS | | 2019 | | | 2018 | | | 2017 | | | 2016 | | | 2015 | |
Net asset value, beginning of period | | | $39.27 | | | | $37.44 | | | | $30.70 | | | | $31.17 | | | | $32.99 | |
Net investment loss | | | (0.23 | )1 | | | (0.23 | ) | | | (0.20 | )1 | | | (0.17 | )1 | | | (0.20 | ) |
Net realized and unrealized gains (losses) on investments | | | 0.57 | | | | 8.09 | | | | 7.35 | | | | 2.29 | | | | 0.97 | |
| | | | | | | | | | | | | | | | | | | | |
Total from investment operations | | | 0.34 | | | | 7.86 | | | | 7.15 | | | | 2.12 | | | | 0.77 | |
Distributions to shareholders from | | | | | | | | | | | | | | | | | | | | |
Net realized gains | | | (5.06 | ) | | | (6.03 | ) | | | (0.41 | ) | | | (2.59 | ) | | | (2.59 | ) |
Net asset value, end of period | | | $34.55 | | | | $39.27 | | | | $37.44 | | | | $30.70 | | | | $31.17 | |
Total return | | | 3.88 | % | | | 23.97 | % | | | 23.52 | % | | | 7.40 | % | | | 2.24 | % |
Ratios to average net assets (annualized) | | | | | | | | | | | | | | | | | | | | |
Gross expenses | | | 1.13 | % | | | 1.12 | % | | | 1.13 | % | | | 1.12 | % | | | 1.09 | % |
Net expenses | | | 1.13 | % | | | 1.12 | % | | | 1.13 | % | | | 1.12 | % | | | 1.09 | % |
Net investment loss | | | (0.70 | )% | | | (0.62 | )% | | | (0.62 | )% | | | (0.58 | )% | | | (0.52 | )% |
Supplemental data | | | | | | | | | | | | | | | | | | | | |
Portfolio turnover rate | | | 71 | % | | | 67 | % | | | 73 | % | | | 78 | % | | | 87 | % |
Net assets, end of period (000s omitted) | | | $333,814 | | | | $353,042 | | | | $335,898 | | | | $400,997 | | | | $575,568 | |
| 1 | Calculated based upon average shares outstanding |
The accompanying notes are an integral part of these financial statements.
Wells Fargo Discovery Fund | 21
Financial highlights
(For a share outstanding throughout each period)
| | | | | | | | | | | | | | | | | | | | |
| | | Year ended September 30 | |
| INSTITUTIONAL CLASS | | 2019 | | | 2018 | | | 2017 | | | 2016 | | | 2015 | |
Net asset value, beginning of period | | | $41.05 | | | | $38.79 | | | | $31.72 | | | | $32.04 | | | | $33.76 | |
Net investment loss | | | (0.15 | )1 | | | (0.18 | ) | | | (0.13 | )1 | | | (0.10 | ) | | | (0.09 | ) |
Net realized and unrealized gains (losses) on investments | | | 0.66 | | | | 8.47 | | | | 7.61 | | | | 2.37 | | | | 0.96 | |
| | | | | | | | | | | | | | | | | | | | |
Total from investment operations | | | 0.51 | | | | 8.29 | | | | 7.48 | | | | 2.27 | | | | 0.87 | |
Distributions to shareholders from | | | | | | | | | | | | | | | | | | | | |
Net realized gains | | | (5.06 | ) | | | (6.03 | ) | | | (0.41 | ) | | | (2.59 | ) | | | (2.59 | ) |
Net asset value, end of period | | | $36.50 | | | | $41.05 | | | | $38.79 | | | | $31.72 | | | | $32.04 | |
Total return | | | 4.15 | % | | | 24.25 | % | | | 23.88 | % | | | 7.68 | % | | | 2.47 | % |
Ratios to average net assets (annualized) | | | | | | | | | | | | | | | | | | | | |
Gross expenses | | | 0.87 | % | | | 0.87 | % | | | 0.88 | % | | | 0.87 | % | | | 0.82 | % |
Net expenses | | | 0.87 | % | | | 0.87 | % | | | 0.88 | % | | | 0.87 | % | | | 0.82 | % |
Net investment loss | | | (0.42 | )% | | | (0.36 | )% | | | (0.37 | )% | | | (0.32 | )% | | | (0.26 | )% |
Supplemental data | | | | | | | | | | | | | | | | | | | | |
Portfolio turnover rate | | | 71 | % | | | 67 | % | | | 73 | % | | | 78 | % | | | 87 | % |
Net assets, end of period (000s omitted) | | | $1,096,888 | | | | $1,352,027 | | | | $1,157,148 | | | | $1,316,107 | | | | $1,436,125 | |
| 1 | Calculated based upon average shares outstanding |
The accompanying notes are an integral part of these financial statements.
22 | Wells Fargo Discovery Fund
Notes to financial statements
1. ORGANIZATION
Wells Fargo Funds Trust (the “Trust”), a Delaware statutory trust organized on March 10, 1999, is an open-end management investment company registered under the Investment Company Act of 1940, as amended (the “1940 Act”). As an investment company, the Trust follows the accounting and reporting guidance in Financial Accounting Standards Board (“FASB”) Accounting Standards Codification Topic 946, Financial Services – Investment Companies. These financial statements report on the Wells Fargo Discovery Fund (the “Fund”) which is a diversified series of the Trust.
2. SIGNIFICANT ACCOUNTING POLICIES
The following significant accounting policies, which are consistently followed in the preparation of the financial statements of the Fund, are in conformity with U.S. generally accepted accounting principles which require management to make estimates and assumptions that affect the reported amounts of assets and liabilities, disclosure of contingent assets and liabilities at the date of the financial statements, and the reported amounts of revenues and expenses during the reporting period. Actual results could differ from those estimates.
Securities valuation
All investments are valued each business day as of the close of regular trading on the New York Stock Exchange (generally 4 p.m. Eastern Time), although the Fund may deviate from this calculation time under unusual or unexpected circumstances.
Equity securities that are listed on a foreign or domestic exchange or market are valued at the official closing price or, if none, the last sales price. If no sale occurs on the principal exchange or market that day, a fair value price will be determined in accordance with the Fund’s Valuation Procedures.
Investments in registered open-end investment companies are valued at net asset value. Interests in non-registered investment companies that are redeemable at net asset value are fair valued normally at net asset value.
Investments which are not valued using any of the methods discussed above are valued at their fair value, as determined in good faith by the Board of Trustees of the Fund. The Board of Trustees has established a Valuation Committee comprised of the Trustees and has delegated to it the authority to take any actions regarding the valuation of portfolio securities that the Valuation Committee deems necessary or appropriate, including determining the fair value of portfolio securities, unless the determination has been delegated to the Wells Fargo Asset Management Pricing Committee at Wells Fargo Funds Management, LLC (“Funds Management”). The Board of Trustees retains the authority to make or ratify any valuation decisions or approve any changes to the Valuation Procedures as it deems appropriate. On a quarterly basis, the Board of Trustees receives reports on any valuation actions taken by the Valuation Committee or the Wells Fargo Asset Management Pricing Committee which may include items for ratification.
Foreign currency translation
The accounting records of the Fund are maintained in U.S. dollars. The values of other assets and liabilities denominated in foreign currencies are translated into U.S. dollars at rates provided by an independent foreign currency pricing source at a time each business day specified by the Wells Fargo Asset Management Pricing Committee. Purchases and sales of securities, and income and expenses are converted at the rate of exchange on the respective dates of such transactions. Net realized foreign exchange gains or losses arise from sales of foreign currencies, currency gains or losses realized between the trade and settlement dates on securities transactions, and the difference between the amounts of dividends, interest and foreign withholding taxes recorded and the U.S. dollar equivalent of the amounts actually paid or received. Net unrealized foreign exchange gains and losses arise from changes in the fair value of assets and liabilities other than investments in securities resulting from changes in exchange rates. The changes in net assets arising from changes in exchange rates of securities and the changes in net assets resulting from changes in market prices of securities are not separately presented. Such changes are included in net realized and unrealized gains or losses from investments.
Securities lending
The Fund may lend its securities from time to time in order to earn additional income in the form of fees or interest on securities received as collateral or the investment of any cash received as collateral. When securities are on loan, the Fund receives interest or dividends on those securities. Cash collateral received in connection with its securities lending transactions is invested in Securities Lending Cash Investments, LLC (the “Securities Lending Fund”). Investments in Securities Lending Fund are valued at the evaluated bid price provided by an independent pricing service. Income earned from investment in the Securities Lending Fund, if any, is included in securities lending income from affiliates (net of fees and rebates) on the Statement of Operations.
Wells Fargo Discovery Fund | 23
Notes to financial statements
In a securities lending transaction, the net asset value of the Fund is affected by an increase or decrease in the value of the securities loaned and by an increase or decrease in the value of the instrument in which collateral is invested. The amount of securities lending activity undertaken by the Fund fluctuates from time to time. The Fund has the right under the lending agreement to recover the securities from the borrower on demand. In the event of default or bankruptcy by the borrower, the Fund may be prevented from recovering the loaned securities or gaining access to the collateral or may experience delays or costs in doing so. In such an event, the terms of the agreement allows the unaffiliated securities lending agent to use the collateral to purchase replacement securities on behalf of the Fund or pay the Fund the market value of the loaned securities. The Fund bears the risk of loss with respect to depreciation of its investment of the cash collateral.
Security transactions and income recognition
Securities transactions are recorded on a trade date basis. Realized gains or losses are recorded on the basis of identified cost.
Dividend income is recognized on the ex-dividend date. Dividend income is recorded net of foreign taxes withheld where recovery of such taxes is not assured.
Distributions to shareholders
Distributions to shareholders from net investment income and any net realized gains are recorded on the ex-dividend date and paid at least annually. Such distributions are determined in accordance with income tax regulations and may differ from U.S. generally accepted accounting principles. Dividend sources are estimated at the time of declaration. The tax character of distributions is determined as of the Fund’s fiscal year end. Therefore, a portion of the Fund’s distributions made prior to the Fund’s fiscal year end may be categorized as a tax return of capital at year end.
Federal and other taxes
The Fund intends to continue to qualify as a regulated investment company by distributing substantially all of its investment company taxable income and any net realized capital gains (after reduction for capital loss carryforwards) sufficient to relieve it from all, or substantially all, federal income taxes. Accordingly, no provision for federal income taxes was required.
The Fund’s income and federal excise tax returns and all financial records supporting those returns for the prior three fiscal years are subject to examination by the federal and Delaware revenue authorities. Management has analyzed the Fund’s tax positions taken on federal, state, and foreign tax returns for all open tax years and does not believe that there are any uncertain tax positions that require recognition of a tax liability.
As of September 30, 2019, the aggregate cost of all investments for federal income tax purposes was $2,063,537,002 and the unrealized gains (losses) consisted of:
| | | | |
| |
Gross unrealized gains | | $ | 616,774,695 | |
| |
Gross unrealized losses | | | (80,603,437 | ) |
| |
Net unrealized gains | | $ | 536,171,258 | |
Reclassifications are made to the Fund’s capital accounts for permanent tax differences to reflect income and gains available for distribution (or available capital loss carryforwards) under federal income tax regulations. U.S. generally accepted accounting principles require that certain components of net assets be adjusted to reflect permanent differences between financial and tax reporting. These reclassifications have no effect on net assets or net asset values per share. The primary permanent difference causing such reclassification is due to redemptions in-kind. At September 30, 2019, as a result of permanent book-to-tax differences, the following reclassification adjustments were made on the Statement of Assets and Liabilities:
| | |
| Paid-in capital | | Total distributable earnings |
| |
| $22,515,989 | | $(22,515,989) |
Class allocations
The separate classes of shares offered by the Fund differ principally in applicable sales charges, distribution, shareholder servicing, and administration fees. Class specific expenses are charged directly to that share class. Investment income, common fund-level expenses, and realized and unrealized gains (losses) on investments are allocated daily to each class of shares based on the relative proportion of net assets of each class.
24 | Wells Fargo Discovery Fund
Notes to financial statements
3. FAIR VALUATION MEASUREMENTS
Fair value measurements of investments are determined within a framework that has established a fair value hierarchy based upon the various data inputs utilized in determining the value of the Fund’s investments. The three-level hierarchy gives the highest priority to unadjusted quoted prices in active markets for identical assets or liabilities (Level 1) and the lowest priority to unobservable inputs (Level 3). The Fund’s investments are classified within the fair value hierarchy based on the lowest level of input that is significant to the fair value measurement. The inputs are summarized into three broad levels as follows:
| ∎ | | Level 1 – quoted prices in active markets for identical securities |
| ∎ | | Level 2 – other significant observable inputs (including quoted prices for similar securities, interest rates, prepayment speeds, credit risk, etc.) |
| ∎ | | Level 3 – significant unobservable inputs (including the Fund’s own assumptions in determining the fair value of investments) |
The inputs or methodologies used for valuing investments in securities are not necessarily an indication of the risk associated with investing in those securities.
The following is a summary of the inputs used in valuing the Fund’s assets and liabilities as of September 30, 2019:
| | | | | | | | | | | | | | | | |
| | | | |
| | | Quoted prices (Level 1) | | | Other significant
observable inputs (Level 2) | | | Significant
unobservable inputs (Level 3) | | | Total | |
| | | | |
Assets | | | | | | | | | | | | | | | | |
Investments in: | | | | | | | | | | | | | | | | |
| | | | |
Common stocks | | | | | | | | | | | | | | | | |
| | | | |
Communication services | | $ | 106,934,254 | | | $ | 0 | | | $ | 0 | | | $ | 106,934,254 | |
| | | | |
Consumer discretionary | | | 384,552,827 | | | | 0 | | | | 0 | | | | 384,552,827 | |
| | | | |
Consumer staples | | | 66,308,748 | | | | 0 | | | | 0 | | | | 66,308,748 | |
| | | | |
Health care | | | 525,435,602 | | | | 0 | | | | 0 | | | | 525,435,602 | |
| | | | |
Industrials | | | 532,498,790 | | | | 0 | | | | 0 | | | | 532,498,790 | |
| | | | |
Information technology | | | 758,109,524 | | | | 0 | | | | 0 | | | | 758,109,524 | |
| | | | |
Materials | | | 65,515,010 | | | | 0 | | | | 0 | | | | 65,515,010 | |
| | | | |
Short-term investments | | | | | | | | | | | | | | | | |
| | | | |
Investment companies | | | 160,353,505 | | | | 0 | | | | 0 | | | | 160,353,505 | |
| | | | |
Total assets | | $ | 2,599,708,260 | | | $ | 0 | | | $ | 0 | | | $ | 2,599,708,260 | |
Additional sector, industry or geographic detail is included in the Portfolio of Investments.
For the year ended September 30, 2019, the Fund did not have any transfers into/out of Level 3.
4. TRANSACTIONS WITH AFFILIATES
Management fee
Funds Management, an indirect wholly owned subsidiary of Wells Fargo & Company (“Wells Fargo”), is the manager of the Fund and provides advisory and fund-level administrative services under an investment management agreement. Under the investment management agreement, Funds Management is responsible for, among other services, implementing the investment objectives and strategies of the Fund, supervising the subadviser and providing fund-level administrative services in connection with the Fund’s operations. As compensation for its services under the investment management agreement, Funds Management is entitled to receive a management fee at the following annual rate based on the Fund’s average daily net assets:
| | | | |
| |
| Average daily net assets | | Management fee | |
| |
First $500 million | | | 0.800 | % |
| |
Next $500 million | | | 0.750 | |
| |
Next $1 billion | | | 0.700 | |
| |
Next $2 billion | | | 0.675 | |
| |
Next $1 billion | | | 0.650 | |
| |
Next $5 billion | | | 0.640 | |
| |
Over $10 billion | | | 0.630 | |
Wells Fargo Discovery Fund | 25
Notes to financial statements
For the year ended September 30, 2019, the management fee was equivalent to an annual rate of 0.72% of the Fund’s average daily net assets.
Funds Management has retained the services of a subadviser to provide daily portfolio management to the Fund. The fee for subadvisory services is borne by Funds Management. Wells Capital Management Incorporated (“WellsCap”), an affiliate of Funds Management and an indirect wholly owned subsidiary of Wells Fargo, is the subadviser to the Fund and is entitled to receive a fee from Funds Management at an annual rate starting at 0.45% and declining to 0.35% as the average daily net assets of the Fund increase.
Administration fees
Under a class-level administration agreement, Funds Management provides class-level administrative services to the Fund, which includes paying fees and expenses for services provided by the transfer agent, sub-transfer agents, omnibus account servicers and record-keepers. As compensation for its services under the class-level administration agreement, Funds Management receives an annual fee which is calculated based on the average daily net assets of each class as follows:
| | | | |
| |
| | | Class-level
administration fee | |
| |
Class A, Class C | | | 0.21 | % |
| |
Class R6 | | | 0.03 | |
| |
Administrator Class, Institutional Class | | | 0.13 | |
Waivers and/or expense reimbursements
Funds Management has contractually waived and/or reimbursed management and administration fees to the extent necessary to maintain certain net operating expense ratios for the Fund. When each class of the Fund has exceeded its expense cap, Funds Management has waived fees and/or reimbursed expenses from fund-level expenses on a proportionate basis and then from class specific expenses. When only certain classes exceed their expense caps, waivers and/or reimbursements are applied against class specific expenses before fund-level expenses. Funds Management has committed through January 31, 2020 to waive fees and/or reimburse expenses to the extent necessary to cap the Fund’s expenses at 1.22% for Class A shares, 1.97% for Class C shares, 0.84% for Class R6 shares, 1.15% for Administrator Class shares, and 0.89% for Institutional Class shares. Prior to or after the commitment expiration date, the cap may be increased or the commitment to maintain the cap may be terminated only with the approval of the Board of Trustees.
Distribution fee
The Trust has adopted a distribution plan for Class C shares of the Fund pursuant to Rule 12b-1 under the 1940 Act. A distribution fee is charged to Class C shares and paid to Wells Fargo Funds Distributor, LLC (“Funds Distributor”), the principal underwriter, at an annual rate of 0.75% of the average daily net assets of Class C shares.
In addition, Funds Distributor is entitled to receive the front-end sales charge from the purchase of Class A shares and a contingent deferred sales charge on the redemption of certain Class A shares. Funds Distributor is also entitled to receive the contingent deferred sales charges from redemptions of Class C shares. For the year ended September 30, 2019, Funds Distributor received $13,159 from the sale of Class A shares. No contingent deferred sales charges were incurred by Class A and Class C shares for the year ended September 30, 2019.
Shareholder servicing fees
The Trust has entered into contracts with one or more shareholder servicing agents, whereby Class A, Class C, and Administrator Class of the Fund are charged a fee at an annual rate of 0.25% of the average daily net assets of each respective class. A portion of these total shareholder servicing fees were paid to affiliates of Wells Fargo.
Interfund transactions
The Fund may purchase or sell portfolio investment securities to certain other Wells Fargo affiliates pursuant to Rule 17a-7 under the 1940 Act and under procedures adopted by the Board of Trustees. The procedures have been designed to ensure that these interfund transactions, which do not incur broker commissions, are effected at current market prices.
5. INVESTMENT PORTFOLIO TRANSACTIONS
Purchases and sales of investments, excluding U.S. government obligations (if any) and short-term securities, for the year ended September 30, 2019 were $1,774,414,656 and $2,162,216,593, respectively.
26 | Wells Fargo Discovery Fund
Notes to financial statements
6. SECURITIES LENDING TRANSACTIONS
The Fund lends its securities through an unaffiliated securities lending agent and receives collateral in the form of cash or securities with a value at least equal to the value of the securities on loan. The value of the loaned securities is determined at the close of each business day and any increases or decreases in the required collateral are exchanged between the Fund and the counterparty on the next business day. Cash collateral received is invested in the Securities Lending Fund which seeks to provide a positive return compared to the daily Fed Funds Open Rate by investing in high-quality, U.S. dollar-denominated short-term money market instruments and is exempt from registration under Section 3(c)(7) of the 1940 Act. Securities Lending Fund is managed by Funds Management and is subadvised by WellsCap. Funds Management receives an advisory fee starting at 0.05% and declining to 0.01% as the average daily net assets of the Securities Lending Fund increase. All of the fees received by Funds Management are paid to WellsCap for its services as subadviser.
In the event of counterparty default or the failure of a borrower to return a loaned security, the Fund has the right to use the collateral to offset any losses incurred. As of September 30, 2019, the Fund had securities lending transactions with the following counterparties which are subject to offset:
| | | | | | | | | | | | |
| | | |
| Counterparty | | Value of securities on loan | | | Collateral received1 | | | Net amount | |
| | | |
Bank of America Securities Inc. | | $ | 5,325,048 | | | $ | (5,325,048 | ) | | $ | 0 | |
| | | |
Barclays Capital Inc. | | | 27,208,545 | | | | (27,208,545 | ) | | | 0 | |
| | | |
BMO Capital Markets Corp. | | | 4,169,417 | | | | (4,169,417 | ) | | | 0 | |
| | | |
BNP Paribas Securities Corp. | | | 3,606,492 | | | | (3,606,492 | ) | | | 0 | |
| | | |
Citigroup Global Markets Inc. | | | 3,423,900 | | | | (3,423,900 | ) | | | 0 | |
| | | |
Credit Suisse Securities (USA) LLC | | | 1,716,350 | | | | (1,716,350 | ) | | | 0 | |
| | | |
Deutsche Bank Securities Inc. | | | 1,086,400 | | | | (1,086,400 | ) | | | 0 | |
| | | |
JPMorgan Securities LLC | | | 51,885,981 | | | | (51,885,981 | ) | | | 0 | |
| | | |
Morgan Stanley & Co. LLC | | | 21,538,442 | | | | (21,538,442 | ) | | | 0 | |
| | | |
Scotia Capital (USA) Inc. | | | 211,200 | | | | (211,200 | ) | | | 0 | |
| | | |
UBS Securities LLC | | | 1,836,250 | | | | (1,836,250 | ) | | | 0 | |
| 1 | Collateral received within this table is limited to the collateral for the net transaction with the counterparty. |
7. BANK BORROWINGS
The Trust (excluding the money market funds), Wells Fargo Master Trust and Wells Fargo Variable Trust are parties to a $280,000,000 revolving credit agreement whereby the Fund is permitted to use bank borrowings for temporary or emergency purposes, such as to fund shareholder redemption requests. Interest under the credit agreement is charged to the Fund based on a borrowing rate equal to the higher of the Federal Funds rate in effect on that day plus 1.25% or the overnight LIBOR rate in effect on that day plus 1.25%. In addition, an annual commitment fee equal to 0.25% of the unused balance is allocated to each participating fund.
For the year ended September 30, 2019, there were no borrowings by the Fund under the agreement.
8. DISTRIBUTIONS TO SHAREHOLDERS
The tax character of distributions paid during the years ended September 30, 2019 and September 30, 2018 were as follows:
| | | | | | | | |
| | | Year ended September 30 | |
| | |
| | | 2019 | | | 2018 | |
| | |
Ordinary income | | $ | 51,161,930 | | | $ | 60,679,267 | |
| | |
Long-term capital gain | | | 315,059,071 | | | | 331,236,958 | |
Wells Fargo Discovery Fund | 27
Notes to financial statements
As of September 30, 2019, the components of distributable earnings on a tax basis were as follows:
| | | | |
Undistributed ordinary income | | Undistributed long-term gain | | Unrealized gains |
| | |
| $18,015,375 | | $221,428,125 | | $536,171,258 |
9. CONCENTRATION RISK
Concentration risks result from exposure to a limited number of sectors. As of the end of the period, the Fund invests a concentration of its portfolio in the information technology sector. A fund that invests a substantial portion of its assets in any sector may be more affected by changes in that sector than would be a fund whose investments are not heavily weighted in any sector.
10. INDEMNIFICATION
Under the Trust’s organizational documents, the officers and Trustees have been granted certain indemnification rights against certain liabilities that may arise out of performance of their duties to the Trust. Additionally, in the normal course of business, the Trust may enter into contracts with service providers that contain a variety of indemnification clauses. The Trust’s maximum exposure under these arrangements is dependent on future claims that may be made against the Fund and, therefore, cannot be estimated.
11. REDEMPTIONS IN-KIND
During the year ended September 30, 2019, the Fund redeemed assets through in-kind redemptions for shareholders in Class R6 and Institutional Class. The realized gains (losses) recognized by the Fund are reflected on the Statement of Operations and these redemption transactions are reflected on the Statement of Changes in Net Assets. The date of each redemption transaction, value of securities issued from the redemption, cash paid, realized gains (losses), the shareholder class and the percentage of the Fund redeemed by the shareholder was as follows:
| | | | | | | | | | | | | | | | |
| Date | | Value of
securities issued | | | Cash | | | Realized gains | | | Share class
redeemed | | % of the Fund |
| | | | | |
| 4-8-2019 | | $ | 81,290,811 | | | $ | 1,768,678 | | | $ | 12,646,482 | | | Institutional Class | | 3.19% |
| | | | | |
| 5-15-2019 | | | 21,382,373 | | | | 184,137 | | | | 3,649,046 | | | Class R6 | | 0.87 |
| | | | | |
| 6-3-2019 | | | 19,899,391 | | | | 219,788 | | | | 3,059,345 | | | Institutional Class | | 0.84 |
| | | | | |
| 6-26-2019 | | | 19,541,539 | | | | 726,452 | | | | 3,638,613 | | | Institutional Class | | 0.80 |
12. NEW ACCOUNTING PRONOUNCEMENT
In August 2018, FASB issued Accounting Standards Update (“ASU”) No. 2018-13, Fair Value Measurement (Topic 820)Disclosure Framework—Changes to the Disclosure Requirements for Fair Value Measurement. ASU 2018-13 updates the disclosure requirements for fair value measurements by modifying or removing certain disclosures and adding certain new disclosures. The amendments are effective for fiscal years, and interim periods within those fiscal years, beginning after December 15, 2019. Early adoption is permitted. Management has adopted the removal and modification of disclosures early, as permitted, and will adopt the additional new disclosures at the effective date.
28 | Wells Fargo Discovery Fund
Report of independent registered public accounting firm
TO THE SHAREHOLDERS OF THE FUND AND BOARD OF TRUSTEES OF WELLS FARGO FUNDS TRUST:
Opinion on the Financial Statements
We have audited the accompanying statement of assets and liabilities of Wells Fargo Discovery Fund (the Fund), one of the funds constituting Wells Fargo Funds Trust, including the portfolio of investments, as of September 30, 2019, the related statement of operations for the year then ended, the statements of changes in net assets for each of the years in the two-year period then ended, and the related notes (collectively, the financial statements) and the financial highlights for each of the years in the five-year period then ended. In our opinion, the financial statements and financial highlights present fairly, in all material respects, the financial position of the Fund as of September 30, 2019, the results of its operations for the year then ended, the changes in its net assets for each of the years in the two-year period then ended, and the financial highlights for each of the years in the five-year period then ended, in conformity with U.S. generally accepted accounting principles.
Basis for Opinion
These financial statements and financial highlights are the responsibility of the Fund’s management. Our responsibility is to express an opinion on these financial statements and financial highlights based on our audits. We are a public accounting firm registered with the Public Company Accounting Oversight Board (United States) (PCAOB) and are required to be independent with respect to the Fund in accordance with the U.S. federal securities laws and the applicable rules and regulations of the Securities and Exchange Commission and the PCAOB.
We conducted our audits in accordance with the standards of the PCAOB. Those standards require that we plan and perform the audit to obtain reasonable assurance about whether the financial statements and financial highlights are free of material misstatement, whether due to error or fraud. Our audits included performing procedures to assess the risks of material misstatement of the financial statements and financial highlights, whether due to error or fraud, and performing procedures that respond to those risks. Such procedures included examining, on a test basis, evidence regarding the amounts and disclosures in the financial statements and financial highlights. Such procedures also included confirmation of securities owned as of September 30, 2019, by correspondence with the custodian and transfer agent. Our audits also included evaluating the accounting principles used and significant estimates made by management, as well as evaluating the overall presentation of the financial statements and financial highlights. We believe that our audits provide a reasonable basis for our opinion.

We have not been able to determine the specific year that we began serving as the auditor of one or more Wells Fargo Funds investment companies; however we are aware that we have served as the auditor of one or more Wells Fargo Funds investment companies since at least 1955.
Boston, Massachusetts
November 25, 2019
Wells Fargo Discovery Fund | 29
Other information (unaudited)
TAX INFORMATION
Pursuant to Section 852 of the Internal Revenue Code, $315,059,071 was designated as a 20% rate gain distribution for the fiscal year ended September 30, 2019.
For corporate shareholders, pursuant to Section 854 of the Internal Revenue Code, 12.81% of ordinary income dividends qualify for the corporate dividends-received deduction for the fiscal year ended September 30, 2019.
Pursuant to Section 854 of the Internal Revenue Code, $7,381,695 of income dividends paid during the fiscal year ended September 30, 2019 has been designated as qualified dividend income (QDI).
For the fiscal year ended September 30, 2019, $51,161,930 has been designated as short-term capital gain dividends for nonresident alien shareholders pursuant to Section 871 of the Internal Revenue Code.
PROXY VOTING INFORMATION
A description of the policies and procedures used to determine how to vote proxies relating to portfolio securities is available, upon request, by calling1-800-222-8222, visiting our website atwfam.com, or visiting the SEC website at sec.gov. Information regarding how the proxies related to portfolio securities were voted during the most recent 12-month period ended June 30 is available on the website atwfam.comor by visiting the SEC website at sec.gov.
QUARTERLY PORTFOLIO HOLDINGS INFORMATION
The Fund files its complete schedule of portfolio holdings with the SEC for the first and third quarters of each fiscal year on Form N-Q or Form N-PORT, which is available by visiting the SEC website at sec.gov. Those forms may be reviewed and copied at the SEC’s Public Reference Room in Washington, DC. Information on the operation of the Public Reference Room may be obtained by calling 1-800-SEC-0330.
30 | Wells Fargo Discovery Fund
Other information (unaudited)
BOARD OF TRUSTEES AND OFFICERS
Each of the Trustees and Officers1 listed in the table below acts in identical capacities for each fund in the Wells Fargo family of funds, which consists of 150 mutual funds comprising the Wells Fargo Funds Trust, Wells Fargo Variable Trust, Wells Fargo Master Trust and four closed-end funds (collectively the “Fund Complex”). This table should be read in conjunction with the Prospectus and the Statement of Additional Information2. The mailing address of each Trustee and Officer is 525 Market Street, 12th Floor, San Francisco, CA 94105. Each Trustee and Officer serves an indefinite term, however, each Trustee serves such term until reaching the mandatory retirement age established by the Trustees.
Independent Trustees
| | | | | | |
Name and year of birth | | Position held and
length of service* | | Principal occupations during past five years or longer | | Current other
public company or
investment
company
directorships |
| | | |
William R. Ebsworth (Born 1957) | | Trustee, since 2015 | | Retired. From 1984 to 2013, equities analyst, portfolio manager, research director and chief investment officer at Fidelity Management and Research Company in Boston, Tokyo, and Hong Kong, and retired in 2013 as Chief Investment Officer of Fidelity Strategic Advisers, Inc. where he led a team of investment professionals managing client assets. Prior thereto, Board member of Hong Kong Securities Clearing Co., Hong Kong Options Clearing Corp., the Thailand International Fund, Ltd., Fidelity Investments Life Insurance Company, and Empire Fidelity Investments Life Insurance Company. Audit Committee Chair and Investment Committee Chair of the Vincent Memorial Hospital Endowment (non-profit organization). Mr. Ebsworth is a CFA® charterholder. | | N/A |
| | | |
Jane A. Freeman (Born 1953) | | Trustee, since 2015; Chair Liaison, since 2018 | | Retired. From 2012 to 2014 and 1999 to 2008, Chief Financial Officer of Scientific Learning Corporation. From 2008 to 2012, Ms. Freeman provided consulting services related to strategic business projects. Prior to 1999, Portfolio Manager at Rockefeller & Co. and Scudder, Stevens & Clark. Board member of the Harding Loevner Funds from 1996 to 2014, serving as both Lead Independent Director and chair of the Audit Committee. Board member of the Russell Exchange Traded Funds Trust from 2011 to 2012 and the chair of the Audit Committee. Ms. Freeman is a Board Member of The Ruth Bancroft Garden (non-profit organization). She is also an inactive Chartered Financial Analyst. | | N/A |
| | | |
Isaiah Harris, Jr. (Born 1952) | | Trustee, since 2009; Audit Committee Chairman, since 2019 | | Retired. Chairman of the Board of CIGNA Corporation since 2009, and Director since 2005. From 2003 to 2011, Director of Deluxe Corporation. Prior thereto, President and CEO of BellSouth Advertising and Publishing Corp. from 2005 to 2007, President and CEO of BellSouth Enterprises from 2004 to 2005 and President of BellSouth Consumer Services from 2000 to 2003. Emeritus member of the Iowa State University Foundation Board of Governors. Emeritus Member of the Advisory Board of Iowa State University School of Business. Advisory Board Member, Palm Harbor Academy (private school). Advisory Board Member, Child Evangelism Fellowship (non-profit). Mr. Harris is a certified public accountant (inactive status). | | CIGNA Corporation |
| | | |
Judith M. Johnson (Born 1949) | | Trustee, since 2008; Audit Committee Chairman, from 2009 to 2018 | | Retired. Prior thereto, Chief Executive Officer and Chief Investment Officer of Minneapolis Employees Retirement Fund from 1996 to 2008. Ms. Johnson is an attorney, certified public accountant and a certified managerial accountant. | | N/A |
Wells Fargo Discovery Fund | 31
Other information (unaudited)
| | | | | | |
Name and year of birth | | Position held and
length of service* | | Principal occupations during past five years or longer | | Current other
public company or
investment
company
directorships |
| | | |
David F. Larcker (Born 1950) | | Trustee, since 2009 | | James Irvin Miller Professor of Accounting at the Graduate School of Business, Stanford University, Director of the Corporate Governance Research Initiative and Senior Faculty of The Rock Center for Corporate Governance since 2006. From 2005 to 2008, Professor of Accounting at the Graduate School of Business, Stanford University. Prior thereto, Ernst & Young Professor of Accounting at The Wharton School, University of Pennsylvania from 1985 to 2005. | | N/A |
| | | |
Olivia S. Mitchell (Born 1953) | | Trustee, since 2006; Nominating and Governance Committee Chairman, since 2018 | | International Foundation of Employee Benefit Plans Professor, Wharton School of the University of Pennsylvania since 1993. Director of Wharton’s Pension Research Council and Boettner Center on Pensions & Retirement Research, and Research Associate at the National Bureau of Economic Research. Previously, Cornell University Professor from 1978 to 1993. | | N/A |
| | | |
Timothy J. Penny (Born 1951) | | Trustee, since 1996; Chairman, since 2018 | | President and Chief Executive Officer of Southern Minnesota Initiative Foundation, a non-profit organization, since 2007. Member of the Board of Trustees of NorthStar Education Finance, Inc., a non-profit organization, since 2007. | | N/A |
| | | |
James G. Polisson (Born 1959) | | Trustee, since 2018 | | Retired. Chief Marketing Officer, Source (ETF) UK Services, Ltd, from 2015 to 2017. From 2012 to 2015, Principal of The Polisson Group, LLC, a management consulting, corporate advisory and principal investing company. Chief Executive Officer and Managing Director at Russell Investments, Global Exchange Traded Funds from 2010 to 2012. Managing Director of Barclays Global Investors from 1998 to 2010 and Global Chief Marketing Officer for iShares and Barclays Global Investors from 2000 to 2010. Trustee of the San Francisco Mechanics’ Institute, a non-profit organization, from 2013 to 2015. Board member of the Russell Exchange Traded Fund Trust from 2011 to 2012. Director of Barclays Global Investors Holdings Deutschland GmbH from 2006 to 2009. Mr. Polisson is an attorney and has a retired status with the Massachusetts and District of Columbia Bar Associations. | | N/A |
| * | Length of service dates reflect the Trustee’s commencement of service with the Trust’s predecessor entities, where applicable. |
32 | Wells Fargo Discovery Fund
Other information (unaudited)
Officers
| | | | |
Name and year of birth | | Position held and
length of service | | Principal occupations during past five years or longer |
| | |
Andrew Owen (Born 1960) | | President, since 2017 | | Executive Vice President of Wells Fargo & Company and Head of Affiliated Managers, Wells Fargo Asset Management, since 2014. In addition, Mr. Owen is currently President, Chief Executive Officer and Director of Wells Fargo Funds Management, LLC since 2017. Prior thereto, Executive Vice President responsible for marketing, investments and product development for Wells Fargo Funds Management, LLC, from 2009 to 2014. |
| | |
Nancy Wiser1 (Born 1967) | | Treasurer, since 2012 | | Executive Vice President of Wells Fargo Funds Management, LLC since 2011. Chief Operating Officer and Chief Compliance Officer at LightBox Capital Management LLC, from 2008 to 2011. |
| | |
Michelle Rhee3 (Born 1966) | | Chief Legal Officer, since 2019 | | Secretary of Wells Fargo Funds Management, LLC, Chief Legal Counsel of Wells Fargo Asset Management and Assistant General Counsel of Wells Fargo Bank, N.A. since 2018. Associate General Counsel and Managing Director of Bank of America Corporation from 2004 to 2018. |
| | |
Catherine Kennedy4 (Born 1969) | | Secretary, since 2019 | | Vice President of Wells Fargo Funds Management, LLC and Senior Counsel of the Wells Fargo Legal Department since 2010. Vice President and Senior Counsel of Evergreen Investment Management Company, LLC from 1998 to 2010. |
| | |
Michael H. Whitaker (Born 1967) | | Chief Compliance Officer, since 2016 | | Chief Compliance Officer of Wells Fargo Asset Management since 2016. Senior Vice President and Chief Compliance Officer for Fidelity Investments from 2007 to 2016. |
| | |
David Berardi (Born 1975) | | Assistant Treasurer, since 2009 | | Vice President of Wells Fargo Funds Management, LLC since 2009. Vice President of Evergreen Investment Management Company, LLC from 2008 to 2010. Manager of Fund Reporting and Control for Evergreen Investment Management Company, LLC from 2004 to 2010. |
| | |
Jeremy DePalma1 (Born 1974) | | Assistant Treasurer, since 2009 | | Senior Vice President of Wells Fargo Funds Management, LLC since 2009. Senior Vice President of Evergreen Investment Management Company, LLC from 2008 to 2010 and head of the Fund Reporting and Control Team within Fund Administration from 2005 to 2010. |
| 1 | Nancy Wiser acts as Treasurer of 64 funds in the Fund Complex. Jeremy DePalma acts as Treasurer of 86 funds and Assistant Treasurer of 64 funds in the Fund Complex. |
| 2 | The Statement of Additional Information includes additional information about the Trustees and is available, without charge, upon request, by calling1-800-222-8222 or by visiting the website atwfam.com. |
| 3 | Michelle Rhee became Chief Legal Officer effective October 22, 2019. |
| 4 | Catherine Kennedy became Secretary effective October 22, 2019. |
Wells Fargo Discovery Fund | 33
Other information (unaudited)
BOARD CONSIDERATION OF INVESTMENT MANAGEMENT AND SUB-ADVISORY AGREEMENTS:
Wells Fargo Discovery Fund
Under the Investment Company Act of 1940 (the “1940 Act”), the Board of Trustees (the “Board”) of Wells Fargo Funds Trust (the “Trust”) must determine annually whether to approve the continuation of the Trust’s investment management and sub-advisory agreements. In this regard, at an in-person meeting held on May 21-22, 2019 (the “Meeting”), the Board, all the members of which have no direct or indirect interest in the investment management and sub-advisory agreements and are not “interested persons” of the Trust, as defined in the 1940 Act (the “Independent Trustees”), reviewed and approved for Wells Fargo Discovery Fund (the “Fund”): (i) an investment management agreement (the “Management Agreement”) with Wells Fargo Funds Management, LLC (“Funds Management”); and (ii) an investment sub-advisory agreement (the “Sub-Advisory Agreement”) with Wells Capital Management Incorporated (the “Sub-Adviser”), an affiliate of Funds Management. The Management Agreement and the Sub-Advisory Agreement are collectively referred to as the “Advisory Agreements.”
At the Meeting, the Board considered the factors and reached the conclusions described below relating to the selection of Funds Management and the Sub-Adviser and the approval of the Advisory Agreements. Prior to the Meeting, including at an in-person meeting in April 2019, the Trustees conferred extensively among themselves and with representatives of Funds Management about these matters. Also, the Board has adopted a team-based approach, with each team consisting of a sub-set of Trustees, to assist the full Board in the discharge of its duties in reviewing investment performance and other matters throughout the year. The Independent Trustees were assisted in their evaluation of the Advisory Agreements by independent legal counsel, from whom they received separate legal advice and with whom they met separately.
In providing information to the Board, Funds Management and the Sub-Adviser were guided by a detailed set of requests for information submitted to them by independent legal counsel on behalf of the Independent Trustees at the start of the Board’s annual contract renewal process earlier in 2019. In considering and approving the Advisory Agreements, the Trustees considered the information they believed relevant, including but not limited to the information discussed below. The Board considered not only the specific information presented in connection with the Meeting, but also the knowledge gained over time through interaction with Funds Management and the Sub-Adviser about various topics. In this regard, the Board reviewed reports of Funds Management at each of its quarterly meetings, which included, among other things, portfolio reviews and investment performance reports. In addition, the Board and the teams mentioned above confer with portfolio managers at various times throughout the year. The Board did not identify any particular information or consideration that was all-important or controlling, and each individual Trustee may have attributed different weights to various factors.
After its deliberations, the Board unanimously approved the continuation of the Advisory Agreements for a one-year term and determined that the compensation payable to Funds Management and the Sub-Adviser under each of the Advisory Agreements was reasonable. The Board considered the approval of the Advisory Agreements for the Fund as part of its consideration of agreements for funds across the complex, but its approvals were made on a fund-by-fund basis. The following summarizes a number of important, but not necessarily all, factors considered by the Board in support of its approvals.
Nature, extent and quality of services
The Board received and considered various information regarding the nature, extent and quality of services provided to the Fund by Funds Management and the Sub-Adviser under the Advisory Agreements. This information included a description of the investment advisory services and Fund-level administrative services covered by the Management Agreement, as well as, among other things, a summary of the background and experience of senior management of Wells Fargo Asset Management (“WFAM”), of which Funds Management and the Sub-Adviser are a part, a summary of investments made in the business of WFAM, a summary of certain organizational and personnel changes involving Funds Management and the Sub-Adviser, and a description of Funds Management’s and the Sub-Adviser’s business continuity planning programs and of their approaches to data privacy and cybersecurity. The Board received and reviewed information about Funds Management’s role as administrator of the Fund’s liquidity risk management program. The Board also considered the qualifications, background, tenure and responsibilities of each of the portfolio managers primarily responsible for the day-to-day portfolio management of the Fund.
The Board evaluated the ability of Funds Management and the Sub-Adviser to attract and retain qualified investment professionals, including research, advisory and supervisory personnel. The Board further considered the compliance programs and compliance records of Funds Management and the Sub-Adviser. In addition, the Board took into account the full range of services provided to the Fund by Funds Management and its affiliates.
34 | Wells Fargo Discovery Fund
Other information (unaudited)
Fund investment performance and expenses
The Board considered the investment performance results for the Fund over various time periods ended December 31, 2018. The Board considered these results in comparison to the investment performance of funds in a universe that was determined by Broadridge Inc. (“Broadridge”) to be similar to the Fund (the “Universe”), and in comparison to the Fund’s benchmark index and to other comparative data. Broadridge is an independent provider of investment company data. The Board received a description of the methodology used by Broadridge to select the mutual funds in the performance Universe. The Board noted that the investment performance of the Fund (Administrator Class) was higher than the average investment performance of the Universe for the three- and ten-year periods under review, but lower than the average investment performance of the Universe for the one- and five-year periods under review. The Board also noted that the investment performance of the Fund was higher than its benchmark index, the Russell 2500™ Growth Index, for the one-, three- and ten-year periods under review, but lower than its benchmark for the five-year period under review.
The Board received information concerning, and discussed factors contributing to, the underperformance of the Fund relative to the Universe and benchmark for the periods identified above. The Board took note of the explanations for the relative underperformance during these periods, including with respect to investment strategies and market factors that affected the Fund’s investment performance.
The Board also received and considered information regarding the Fund’s net operating expense ratios and their various components, including actual management fees, custodian and other non-management fees, and Rule 12b-1 and non-Rule 12b-1 shareholder service fees. The Board considered these ratios in comparison to the median ratios of funds in class-specific expense groups that were determined by Broadridge to be similar to the Fund (the “Groups”). The Board received a description of the methodology used by Broadridge to select the mutual funds in the expense Groups and an explanation of how funds comprising expense groups and their expense ratios may vary from year-to-year. Based on the Broadridge reports, the Board noted that the net operating expense ratios of the Fund were in range of, lower than, or equal to the median net operating expense ratios of the expense Groups for each share class. The Board also noted that the net operating expense ratio cap for Class R6 and the Administrator Class would be reduced.
The Board took into account the Fund’s investment performance and expense information provided to it among the factors considered in deciding to re-approve the Advisory Agreements.
Investment management and sub-advisory fee rates
The Board reviewed and considered the contractual fee rates payable by the Fund to Funds Management under the Management Agreement, as well as the contractual fee rates payable by the Fund to Funds Management for class-level administrative services under a Class-Level Administration Agreement, which include, among other things, class-level transfer agency and sub-transfer agency costs (collectively, the “Management Rates”). The Board also reviewed and considered the contractual investment sub-advisory fee rates that are payable by Funds Management to the Sub-Adviser for investment sub-advisory services.
Among other information reviewed by the Board was a comparison of the Fund’s Management Rates with the average contractual investment management fee rates of funds in the expense Groups at a common asset level as well as transfer agency costs of the funds in the expense Groups. The Board noted that the Management Rates of the Fund were in range of, lower than, or equal to the sum of these average rates for the Fund’s expense Groups for all share classes.
The Board also received and considered information about the portion of the total management fee that was retained by Funds Management after payment of the fee to the Sub-Adviser for sub-advisory services. In assessing the reasonableness of this amount, the Board received and evaluated information about the nature and extent of responsibilities retained and risks assumed by Funds Management and not delegated to or assumed by the Sub-Adviser, and about Funds Management’s on-going oversight services. Given the affiliation between Funds Management and the Sub-Adviser, the Board ascribed limited relevance to the allocation of fees between them.
The Board also received and considered information about the nature and extent of services offered and fee rates charged by Funds Management and the Sub-Adviser to other types of clients with investment strategies similar to those of the Fund. In this regard, the Board received information about the significantly greater scope of services, and compliance, reporting and other legal burdens and risks of managing proprietary mutual funds compared with those associated with managing assets of other types of clients, including third-party sub-advised fund clients and non-mutual fund clients such as institutional separate accounts.
Based on its consideration of the factors and information it deemed relevant, including those described here, the Board determined that the compensation payable to Funds Management under the Management Agreement and to the Sub-Adviser under the Sub-Advisory Agreement was reasonable.
Wells Fargo Discovery Fund | 35
Other information (unaudited)
Profitability
The Board received and considered information concerning the profitability of Funds Management, as well as the profitability of both WFAM and Wells Fargo & Co. (“Wells Fargo”) from providing services to the fund family as a whole. The Board noted that the Sub-Adviser’s profitability information with respect to providing services to the Fund and other funds in the family was subsumed in the WFAM and Wells Fargo profitability analysis.
Funds Management reported on the methodologies and estimates used in calculating profitability, including a description of the methodology used to allocate certain expenses. Among other things, the Board noted that the levels of profitability reported on a fund-by-fund basis varied widely, depending on factors such as the size, type and age of fund. Based on its review, the Board did not deem the profits reported by Funds Management, WFAM or Wells Fargo from services provided to the Fund to be at a level that would prevent it from approving the continuation of the Advisory Agreements.
Economies of scale
The Board received and considered information about the potential for Funds Management to experience economies of scale in the provision of management services to the Fund, the difficulties of calculating economies of scale at an individual fund level, and the extent to which potential scale benefits are shared with shareholders. The Board noted the existence of breakpoints in the Fund’s management fee structure, which operate generally to reduce the Fund’s expense ratios as the Fund grows in size. The Board considered that in addition to management fee breakpoints, Funds Management shares potential economies of scale from its management business in a variety of ways, including through fee waiver and expense reimbursement arrangements, services that benefit shareholders, competitive management fee rates set at the outset without regard to breakpoints, and investments in the business intended to enhance services available to shareholders.
The Board concluded that Funds Management’s arrangements with respect to the Fund, including contractual breakpoints, constituted a reasonable approach to sharing potential economies of scale with the Fund and its shareholders.
Other benefits to Funds Management and the Sub-Adviser
The Board received and considered information regarding potential “fall-out” or ancillary benefits received by Funds Management and its affiliates, including the Sub-Adviser, as a result of their relationships with the Fund. Ancillary benefits could include, among others, benefits directly attributable to other relationships with the Fund and benefits potentially derived from an increase in Funds Management’s and the Sub-Adviser’s business as a result of their relationships with the Fund. The Board noted that various affiliates of Funds Management may receive distribution-related fees, shareholder servicing payments and sub-transfer agency fees in respect of shares sold or held through them and services provided.
The Board also reviewed information about soft dollar credits earned and utilized by the Sub-Adviser, fees earned by Funds Management and the Sub-Adviser from managing a private investment vehicle for the fund family’s securities lending collateral, and commissions earned by an affiliated broker from portfolio transactions.
Based on its consideration of the factors and information it deemed relevant, including those described here, the Board did not find that any ancillary benefits received by Funds Management and its affiliates, including the Sub-Adviser, were unreasonable.
Conclusion
At the Meeting, after considering the above-described factors and based on its deliberations and its evaluation of the information described above, the Board unanimously approved the continuation of the Advisory Agreements for a one-year term and determined that the compensation payable to Funds Management and the Sub-Adviser under each of the Advisory Agreements was reasonable.
36 | Wells Fargo Discovery Fund

For more information
More information about Wells Fargo Funds is available free upon request. To obtain literature, please write, visit the Fund’s website, or call:
Wells Fargo Funds
P.O. Box 219967
Kansas City, MO 64121-9967
Website:wfam.com
Individual investors:1-800-222-8222
Retail investment professionals:1-888-877-9275
Institutional investment professionals:1-866-765-0778

This report and the financial statements contained herein are submitted for the general information of the shareholders of the Fund. If this report is used for promotional purposes, distribution of the report must be accompanied or preceded by a current prospectus. Before investing, please consider the investment objectives, risks, charges, and expenses of the investment. For a current prospectus and, if available, a summary prospectus, containing this information, call1-800-222-8222 or visit the Fund’s website atwfam.com. Read the prospectus carefully before you invest or send money.
Wells Fargo Asset Management (WFAM) is the trade name for certain investment advisory/management firms owned by Wells Fargo & Company. These firms include but are not limited to Wells Capital Management Incorporated and Wells Fargo Funds Management, LLC. Certain products managed by WFAM entities are distributed by Wells Fargo Funds Distributor, LLC (a broker-dealer and Member FINRA).
This material is for general informational and educational purposes only and is NOT intended to provide investment advice or a recommendation of any kind—including a recommendation for any specific investment, strategy, or plan.
INVESTMENT PRODUCTS: NOT FDIC INSURED ◾ NO BANK GUARANTEE ◾ MAY LOSE VALUE
© 2019 Wells Fargo & Company. All rights reserved.
406814 11-19
A230/AR230 09-19
Annual Report
September 30, 2019
Wells Fargo Enterprise Fund
Beginning on January 1, 2021, as permitted by new regulations adopted by the Securities and Exchange Commission, paper copies of the Wells Fargo Funds’ annual and semi-annual shareholder reports issued after this date will no longer be sent by mail, unless you specifically request paper copies of the reports. Instead, the reports will be made available on the Funds’ website, and you will be notified by mail each time a report is posted and provided with a website address to access the report.
If you already elected to receive shareholder reports electronically, you will not be affected by this change and you need not take any action. You may elect to receive shareholder reports and other communications from the Fund electronically at any time by contacting your financial intermediary (such as a broker-dealer or bank) or, if you are a direct investor, by calling1-800-222-8222 or by enrolling at wellsfargo.com/advantagedelivery.
You may elect to receive all future reports in paper free of charge. If you invest through a financial intermediary, you can contact your financial intermediary to request that you continue to receive paper copies of your shareholder reports; if you invest directly with the Fund, you can call 1-800-222-8222. Your election to receive reports in paper will apply to all Wells Fargo Funds held in your account with your financial intermediary or, if you are a direct investor, to all Wells Fargo Funds that you hold.
|
|
|
Reduce clutter. Save trees. |
Sign up for electronic delivery of prospectuses and shareholder reports atwellsfargo.com/advantagedelivery |
The views expressed and any forward-looking statements are as of September 30, 2019, unless otherwise noted, and are those of the Fund managers and/or Wells Fargo Asset Management. Discussions of individual securities, or the markets generally, or any Wells Fargo Fund are not intended as individual recommendations. Future events or results may vary significantly from those expressed in any forward-looking statements. The views expressed are subject to change at any time in response to changing circumstances in the market. Wells Fargo Asset Management and the Fund disclaim any obligation to publicly update or revise any views expressed or forward-looking statements.
INVESTMENT PRODUCTS: NOT FDIC INSURED ◾ NO BANK GUARANTEE ◾ MAY LOSE VALUE
Wells Fargo Enterprise Fund | 1
Letter to shareholders (unaudited)

Andrew Owen
President
Wells Fargo Funds
“December’s S&P 500 Index performance was the worst since 1931.”
Dear Shareholder:
We are pleased to offer you this annual report for the Wells Fargo Enterprise Fund for the 12-month period that ended September 30, 2019. After the first half of the period yielded either low-single-digit or negative investment returns, U.S. stock and global bond investors generally saw markets recover during the second half amid intensifying market volatility, global economic growth concerns, international trade stare downs, and simmering geopolitical tensions.
Overall, fixed-income investors enjoyed a distinct advantage over stock investors. For the period, U.S. stocks, based on the S&P 500 Index,1 gained 4.25% and international stocks, as measured by the MSCI ACWI ex USA Index (Net),2 fell 1.23%. The MSCI EM Index (Net)3 slipped 2.02%. Among fixed income investors, the Bloomberg Barclays U.S. Aggregate Bond Index4 added 10.30%, the Bloomberg Barclays Global Aggregateex-USD Index5 added 5.34%, the Bloomberg Barclays Municipal Bond Index6 gained 8.55%, and the ICE BofAML U.S. High Yield Index7 added 6.30%.
Investors confronted unsettling events during the fourth quarter of 2018.
During the fourth quarter of 2018, investors grew concerned about the pace and sustainability of the global economic expansion. The U.S. Bureau of Economic Analysis reported third-quarter U.S. gross domestic product (GDP) was 3.4% on an annualized basis, which was down from the second-quarter rate. A partial U.S. government shutdown occurred, which extended into January 2019. Brexit efforts stalled, causing uncertainty for the eurozone. The value of the renminbi declined even as the People’s Bank of China cut reserve requirement ratios, accelerated infrastructure spending, and cut taxes in efforts to spur economic activity.
The combination of news in the U.S. and generally weak economic indicators outside of the U.S. caused investors to seek safe havens. December’s S&P 500 Index performance was the worst since 1931. Globally, fixed-income investments fared better than stocks during the last two months of the year. Even as indicators suggested growth was restrained, the U.S. Federal Reserve (Fed) increased the federal funds rate by 25 basis points (bps; 100 bps equal 1.00%) in December 2018 to a target range of between 2.25% and 2.50%. Many observers expressed concerns that higher rates could slow the economy further.
| 1 | The S&P 500 Index consists of 500 stocks chosen for market size, liquidity, and industry group representation. It is a market-value-weighted index with each stock’s weight in the index proportionate to its market value. You cannot invest directly in an index. |
| 2 | The Morgan Stanley Capital International (MSCI) All Country World Index (ACWI) ex USA Index (Net) is a free-float-adjusted market-capitalization weighted index that is designed to measure the equity market performance of developed and emerging markets, excluding the U.S. Source: MSCI. MSCI makes no express or implied warranties or representations and shall have no liability whatsoever with respect to any MSCI data contained herein. The MSCI data may not be further redistributed or used as a basis for other indices or any securities or financial products. This report is not approved, reviewed, or produced by MSCI. You cannot invest directly in an index. |
| 3 | The MSCI Emerging Markets (EM) Index (Net) is a free-float-adjusted market-capitalization-weighted index that is designed to measure the equity market performance of emerging markets. You cannot invest directly in an index. |
| 4 | The Bloomberg Barclays U.S. Aggregate Bond Index is a broad-based benchmark that measures the investment-grade, U.S. dollar-denominated, fixed-rate taxable bond market, including Treasuries, government-related and corporate securities, mortgage-backed securities (agency fixed-rate and hybrid adjustable-rate mortgage pass-throughs), asset-backed securities, and commercial mortgage-backed securities. You cannot invest directly in an index. |
| 5 | The Bloomberg Barclays Global Aggregate ex-USD Index is an unmanaged index that provides a broad-based measure of the global investment-grade fixed-income markets excluding the U.S. dollar-denominated debt market. You cannot invest directly in an index. |
| 6 | The Bloomberg Barclays Municipal Bond Index is an unmanaged index composed of long-term tax-exempt bonds with a minimum credit rating of Baa. You cannot invest directly in an index. |
| 7 | The ICE BofAML U.S. High Yield Index is a market-capitalization-weighted index of domestic and Yankee high-yield bonds. The index tracks the performance of high-yield securities traded in the U.S. bond market. You cannot invest directly in an index. Copyright 2019. ICE Data Indices, LLC. All rights reserved. |
2 | Wells Fargo Enterprise Fund
Letter to shareholders (unaudited)
The market climbs a wall of worry.
Investment returns early in 2019 appeared to reaffirm the adage that markets climb a wall of worry as the new year began. The S&P 500 Index gained 8.01% for the month of January, the best monthly performance in 30 years. Returns for the MSCI ACWI ex USA Index (Net), the Bloomberg Barclays U.S. Aggregate Bond Index, and the Bloomberg Barclays Global Aggregate ex-USD Index also were positive.
In February 2019, signs of slowing global growth grew more ominous. The Bureau of Economic Analysis announced fourth-quarter 2018 GDP grew at an annualized 2.2% rate, a slower rate than reported for the prior two quarters. In a February report, the Bank of England forecast the slowest growth for 2019 since the financial crisis. China and the U.S. continued to wrangle over trade issues. By the end of the first quarter of 2019, more accommodative Fed sentiment and steady, if not spectacular, U.S. economic and business metrics encouraged domestic investors.
Early second-quarter 2019 enthusiasm among investors faded.
During April 2019, favorable sentiment found additional support in reports of sustained low inflation, solid employment data, and first-quarter U.S. GDP of an annualized rate of 3.2%. During May, markets tumbled on mixed investment signals. In the U.S., partisan wrangling ramped up as Democrats and Republicans set their sights on 2020 presidential politics. The U.K.’s Brexit disagreements caused Prime Minister Theresa May to resign. Boris Johnson succeeded her only to exacerbate uncertainty about Brexit’s resolution ahead of an October 2019 deadline. The European Commission downgraded the 2019 growth forecast to 1.2%. The U.S. increased tariffs on products from China, China responded, and then talks broke down. President Donald Trump threatened to turn his foreign policy tariff tool to Mexico over immigration issues.
During the third quarter of 2019, investors regrouped. Just as the investment horizon appeared to darken, sentiment turned and U.S. equity markets gained during June and July. The gains, primarily driven by geopolitical and monetary policy events, pushed equity markets to new highs. European Central Bank President Mario Draghi said that if the outlook doesn’t improve, the bank would cut rates or buy more assets to prop up inflation. President Trump backed off of tariff threats against Mexico and China. In the U.S., the Fed implemented a 0.25% federal funds rate cut in July.
Later in July 2019, the U.S. reversed course and threatened to impose higher tariffs on China’s exports after talks failed. China responded with tariff threats of its own and devalued the renminbi, a move that roiled global markets. Major U.S. stock market indices closed July with the worst weekly results of the year. Bond prices gained as Treasury yields fell to levels not seen since November 2016 and the yield curve inverted at multiple points along the 30-year arc.
In a microcosm, August 2019 encapsulated many of the unnerving events that plagued investors during the prior 11 months. The U.S.-China trade relationship swung from antagonistic to hopeful and back again with no evident compromise on the horizon. Evidence of a continued global economic slowdown mounted. Central banks in China, New Zealand, and Thailand cut interest rates. Industrial and manufacturing data declined in China, Canada, Japan, and Germany. Adding to the uncertain environment, Italy’s prime minister resigned, many feared a crackdown in Hong Kong as protesters sustained their calls for reform throughout the month, and Boris Johnson planned to suspend Parliament as Brexit’s deadline neared.
In the U.S., September saw the Fed join other central banks in cutting interest rates. Manufacturing data in the U.S., as reported by the Institute for Supply Management, disappointed investors. The U.S. Congress announced it would pursue an impeachment investigation of President Trump. Meanwhile, the Brexit impasse showed no signs of
“The S&P 500 Index gained 8.01% for the month of January, the best monthly performance in 30 years.”
Wells Fargo Enterprise Fund | 3
Letter to shareholders (unaudited)
|
|
|
For further information about your Fund, contact your investment professional, visit our website at wfam.com, or call us directly at1-800-222-8222. |
resolution. Officials in China said that hitting the country’s economic growth goals for the year would be difficult considering the weight of tariffs and trade restrictions. So while the S&P 500 Index finished the third quarter with year-to-date returns that were the best in more than 20 years, amid signs of equity investors taking money out of the stock market, concerns about future returns remained.
Don’t let short-term uncertainty derail long-term investment goals.
Periods of investment uncertainty can present challenges, but experience has taught us that maintaining long-term investment goals can be an effective way to plan for the future. To help you create a sound strategy based on your personal goals and risk tolerance, Wells Fargo Funds offers more than 100 mutual funds spanning a wide range of asset classes and investment styles. Although diversification cannot guarantee an investment profit or prevent losses, we believe it can be an effective way to manage investment risk and potentially smooth out overall portfolio performance. We encourage investors to know their investments and to understand that appropriate levels of risk-taking may potentially unlock opportunities.
Thank you for choosing to invest with Wells Fargo Funds. We appreciate your confidence in us and remain committed to helping you meet your financial needs.
Sincerely,

Andrew Owen
President
Wells Fargo Funds
4 | Wells Fargo Enterprise Fund
This page is intentionally left blank.
Performance highlights (unaudited)
Investment objective
The Fund seeks long-term capital appreciation.
Manager
Wells Fargo Funds Management, LLC
Subadviser
Wells Capital Management Incorporated
Portfolio managers
Michael T. Smith, CFA®‡
Christopher J. Warner, CFA®‡
Average annual total returns (%) as of September 30, 2019
| | | | | | | | | | | | | | | | | | | | | | | | | | | | | | | | | | |
| | | | |
| | | | | Including sales charge | | | Excluding sales charge | | | Expense ratios1 (%) | |
| | | | | | | | | |
| | | Inception date | | 1 year | | | 5 year | | | 10 year | | | 1 year | | | 5 year | | | 10 year | | | Gross | | | Net2 | |
| | | | | | | | | | |
| Class A (SENAX) | | 2-24-2000 | | | 1.79 | | | | 10.04 | | | | 12.71 | | | | 8.00 | | | | 11.35 | | | | 13.37 | | | | 1.25 | | | | 1.18 | |
| | | | | | | | | | |
| Class C (WENCX) | | 3-31-2008 | | | 6.20 | | | | 10.52 | | | | 12.53 | | | | 7.20 | | | | 10.52 | | | | 12.53 | | | | 2.00 | | | | 1.93 | |
| | | | | | | | | | |
| Class R6 (WENRX)3 | | 10-31-2014 | | | – | | | | – | | | | – | | | | 8.41 | | | | 11.78 | | | | 13.80 | | | | 0.82 | | | | 0.80 | |
| | | | | | | | | | |
| Administrator Class (SEPKX) | | 8-30-2002 | | | – | | | | – | | | | – | | | | 8.06 | | | | 11.47 | | | | 13.50 | | | | 1.17 | | | | 1.10 | |
| | | | | | | | | | |
| Institutional Class (WFEIX) | | 6-30-2003 | | | – | | | | – | | | | – | | | | 8.36 | | | | 11.72 | | | | 13.77 | | | | 0.92 | | | | 0.85 | |
| | | | | | | | | | |
| Russell Midcap® Growth Index4 | | – | | | – | | | | – | | | | – | | | | 5.20 | | | | 11.12 | | | | 14.08 | | | | – | | | | – | |
Figures quoted represent past performance, which is no guarantee of future results, and do not reflect taxes that a shareholder may pay on fund distributions or the redemption of fund shares. Investment return and principal value of an investment will fluctuate so that an investor’s shares, when redeemed, may be worth more or less than their original cost. Performance shown without sales charges would be lower if sales charges were reflected. Current performance may be lower or higher than the performance data quoted, which assumes the reinvestment of dividends and capital gains. Current month-end performance is available on the Fund’s website,wfam.com.
Index returns do not include transaction costs associated with buying and selling securities, any mutual fund fees or expenses, or any taxes. It is not possible to invest directly in an index.
For Class A shares, the maximum front-end sales charge is 5.75%. For Class C shares, the maximum contingent deferred sales charge is 1.00%. Performance including a contingent deferred sales charge assumes the sales charge for the corresponding time period. Class R6, Administrator Class, and Institutional Class shares are sold without a front-end sales charge or contingent deferred sales charge.
Stock values fluctuate in response to the activities of individual companies and general market and economic conditions. Smaller-company stocks tend to be more volatile and less liquid than those of larger companies. Certain investment strategies tend to increase the total risk of an investment (relative to the broader market). The Fund is exposed to foreign investment risk. Consult the Fund’s prospectus for additional information on these and other risks.
Please see footnotes on page 7.
6 | Wells Fargo Enterprise Fund
Performance highlights (unaudited)
|
|
| Growth of $10,000 investment as of September 30, 20195 |
|
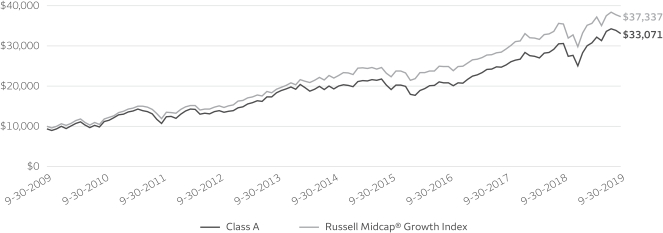
|
| ‡ | CFA® and Chartered Financial Analyst® are trademarks owned by CFA Institute. |
| 1 | Reflects the expense ratios as stated in the most recent prospectuses. The expense ratios shown are subject to change and may differ from the annualized expense ratios shown in the financial highlights of this report. |
| 2 | The manager has contractually committed through January 31, 2020, to waive fees and/or reimburse expenses to the extent necessary to cap the expenses of each class after fee waivers at the amounts shown. Brokerage commissions, stamp duty fees, interest, taxes, acquired fund fees and expenses (if any), and extraordinary expenses are excluded from the expense cap. Prior to or after the commitment expiration date, the cap may be increased or the commitment to maintain the cap may be terminated only with the approval of the Board of Trustees. Without this cap, the Fund’s returns would have been lower. The expense ratio paid by an investor is the net expense ratio (the total annual fund operating expenses after fee waivers) as stated in the prospectuses. |
| 3 | Historical performance shown for Class R6 shares prior to their inception reflects the performance of the Institutional Class shares, and includes the higher expenses applicable to Institutional Class shares. If these expenses had been included, returns for Class R6 shares would be higher. |
| 4 | The Russell Midcap® Growth Index measures the performance of those Russell Midcap companies with higher price/book ratios and higher forecasted growth values. The stocks are also members of the Russell 1000® Growth index. You cannot invest directly in an index. |
| 5 | The chart compares the performance of Class A shares for the most recent ten years with the Russell Midcap® Growth Index. The chart assumes a hypothetical investment of $10,000 in Class A shares and reflects all operating expenses and assumes the maximum initial sales charge of 5.75%. |
| 6 | The ten largest holdings, excluding cash, cash equivalents and any money market funds, are calculated based on the value of the investments divided by total net assets of the Fund. Holdings are subject to change and may have changed since the date specified. |
| 7 | Amounts are calculated based on the total long-term investments of the Fund. These amounts are subject to change and may have changed since the date specified. |
| * | This security was no longer held at the end of the reporting period. |
Wells Fargo Enterprise Fund | 7
Performance highlights (unaudited)
MANAGER’S DISCUSSION
Fund highlights
| ∎ | | The Fund outperformed its benchmark, the Russell Midcap® Growth Index, for the 12-month period that ended September 30, 2019. |
| ∎ | | Stock selection within the information technology (IT) and consumer discretionary sectors contributed to performance. |
| ∎ | | Stock selection in the industrials sector negatively affected performance. |
A number of macro factors influenced investor sentiment over the past 12 months. These included the ongoing U.S.-China trade war, a change in monetary policy by the U.S. Federal Reserve, tepid U.S. economic data, and increased geopolitical risks. For much of the past year, however, the U.S. equity market remained quite resilient. The market rewarded companies with the ability to grow earnings regardless of the economic backdrop—firms with disruptive technology and significant competitive advantages. We refer to these firms as being on the right side of change, and we populated the portfolio with companies meeting those criteria. Market volatility, however, was not entirely macro-driven. Corporate earnings recently have become choppier. Given the increased uncertainty, investors had little patience for fundamental disappointments, particularly for stocks carrying premium valuations. We continue to believe that taking the valuation risk associated with secular growth stocks is a superior strategy compared with building a portfolio high in cyclical exposure.
| | | | |
|
| Ten largest holdings (%) as of September 30, 20196 | |
| | |
Fiserv Incorporated | | | 3.37 | |
| | |
Waste Connections Incorporated | | | 2.85 | |
| | |
Chipotle Mexican Grill Incorporated | | | 2.41 | |
| | |
Cintas Corporation | | | 2.27 | |
| | |
Motorola Solutions Incorporated | | | 2.23 | |
| | |
WEX Incorporated | | | 2.11 | |
| | |
FleetCor Technologies Incorporated | | | 2.02 | |
| | |
Black Knight Incorporated | | | 2.01 | |
| | |
Veeva Systems Incorporated Class A | | | 2.01 | |
| | |
Global Payments Incorporated | | | 1.98 | |
Stock selection benefited the Fund’s relative performance, especially within the IT and consumer discretionary sectors.
Within the IT sector, the Fund’s position in Shopify Incorporated contributed to returns. Shopify, a provider of e-commerce solutions for direct-to-consumer brands, traditionally focused on small and medium-size businesses but is currently penetrating larger businesses via its Shopify Plus offering. Shopify benefits from its customers’ growth by processing payments for smaller customers and charging a fee on each transaction for larger customers. The company’s two vectors of growth—new customers and revenue expansion of existing customers—drove higher-than-expected financial results.
Within the consumer discretionary sector, Chipotle Mexican Grill, Incorporated, continues to improve operations following the appointment of a new chief executive officer. Online ordering in particular has been a key driver of sales growth. The company’s loyalty program continues to grow nicely, providing an additional catalyst for sales growth. Chipotle also maintains the ability to add more restaurants throughout the U.S. These efforts have begun to gain traction as same restaurant sales grew meaningfully, beating expectations. The improved sales performance leveraged the company’s costs and drove restaurant profitability higher as well.
|
|
| Sector distribution as of September 30, 20197 |
|
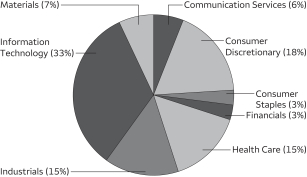 |
Security selection in the industrials sector detracted from the Fund’s performance.
Among the Fund’s industrial holdings, Evoqua Water Technologies Corporation* detracted from performance. The water treatment and technology company saw its shares decline sharply after reporting disappointing results, reducing guidance, and announcing a restructuring plan. Evoqua unexpectedly has undertaken longer, capital-intensive projects that have affected the stable revenue stream we expected. Rising raw material costs hurt profitability as well.
Please see footnotes on page 7.
8 | Wells Fargo Enterprise Fund
Performance highlights (unaudited)
Also within industrials, Univar Solutions Incorporated weighed on the Fund’s returns. Univar, a chemical distribution company, faced a combination of macro concerns and company-specific issues. Concerns over slowing global economic growth and the ongoing trade war resulted in sluggish order trends throughout the industrials sector. Specific to Univar, inclement weather in Canada affected the company’s agricultural business in that key market. Transportation costs also proved to be an unexpected headwind. Univar sells its products on a freight-delivered basis, so it must absorb higher-than-expected transportation costs.
Caution ahead
As we close out 2019, we believe caution is warranted. While the U.S. consumer and labor markets appear resilient, the global economic slowdown and U.S.-China trade war have clearly taken a toll on business confidence. This has generated a concerning trend of weakness in capital spending and business investment. Recent manufacturing data indicate the U.S. may be on the verge of an industrial recession. Plummeting interest rates and recent market volatility are indicators of rising uncertainty. While policymakers may respond with additional stimulus, we believe investors should brace themselves for heightened volatility and scrutinize the fundamentals embedded in their portfolios.
Despite this caution, there are still exciting opportunities to pursue. We don’t believe this is the end of the cycle; we think the market is simply experiencing increased narrowness. We intend to use that to the advantage of our shareholders. We expect that businesses with resilient fundamentals and secular growth companies will continue to be rewarded with premium valuations. Our goal is to construct a portfolio with a balance of these businesses in pursuit of a winning formula. Despite all the rising uncertainty, we feel this remains a great time to invest in businesses on the right side of change.
Wells Fargo Enterprise Fund | 9
Fund expenses (unaudited)
As a shareholder of the Fund, you incur two types of costs: (1) transaction costs, including sales charges (loads) on purchase payments and contingent deferred sales charges (if any) on redemptions and (2) ongoing costs, including management fees, distribution (12b-1) and/or shareholder servicing fees, and other Fund expenses. This example is intended to help you understand your ongoing costs (in dollars) of investing in the Fund and to compare these costs with the ongoing costs of investing in other mutual funds.
The example is based on an investment of $1,000 invested at the beginning of the six-month period and held for the entire period from April 1, 2019 to September 30, 2019.
Actual expenses
The “Actual” line of the table below provides information about actual account values and actual expenses. You may use the information in this line, together with the amount you invested, to estimate the expenses that you paid over the period. Simply divide your account value by $1,000 (for example, an $8,600 account value divided by $1,000 = 8.6), then multiply the result by the number in the “Actual” line under the heading entitled “Expenses paid during period” for your applicable class of shares to estimate the expenses you paid on your account during this period.
Hypothetical example for comparison purposes
The “Hypothetical” line of the table below provides information about hypothetical account values and hypothetical expenses based on the Fund’s actual expense ratio and an assumed rate of return of 5% per year before expenses, which is not the Fund’s actual return. The hypothetical account values and expenses may not be used to estimate the actual ending account balance or expenses you paid for the period. You may use this information to compare the ongoing costs of investing in the Fund and other funds. To do so, compare this 5% hypothetical example with the 5% hypothetical examples that appear in the shareholder reports of the other funds.
Please note that the expenses shown in the table are meant to highlight your ongoing costs only and do not reflect any transactional costs, such as sales charges (loads) and contingent deferred sales charges. Therefore, the “Hypothetical” line of the table is useful in comparing ongoing costs only and will not help you determine the relative total costs of owning different funds. In addition, if these transactional costs were included, your costs would have been higher.
| | | | | | | | | | | | | | | | |
| | | Beginning
account value
4-1-2019 | | | Ending
account value
9-30-2019 | | | Expenses
paid during
the period¹ | | | Annualized net
expense ratio | |
| | | | | |
Class A | | | | | | | | | | | | | | | | |
| | | | |
Actual | | $ | 1,000.00 | | | $ | 1,074.84 | | | $ | 6.15 | | | | 1.18 | % |
| | | | |
Hypothetical (5% return before expenses) | | $ | 1,000.00 | | | $ | 1,019.14 | | | $ | 5.99 | | | | 1.18 | % |
| | | | | |
Class C | | | | | | | | | | | | | | | | |
| | | | |
Actual | | $ | 1,000.00 | | | $ | 1,070.84 | | | $ | 10.05 | | | | 1.93 | % |
| | | | |
Hypothetical (5% return before expenses) | | $ | 1,000.00 | | | $ | 1,015.37 | | | $ | 9.78 | | | | 1.93 | % |
| | | | | |
Class R6 | | | | | | | | | | | | | | | | |
| | | | |
Actual | | $ | 1,000.00 | | | $ | 1,076.91 | | | $ | 4.18 | | | | 0.80 | % |
| | | | |
Hypothetical (5% return before expenses) | | $ | 1,000.00 | | | $ | 1,021.05 | | | $ | 4.06 | | | | 0.80 | % |
| | | | | |
Administrator Class | | | | | | | | | | | | | | | | |
| | | | |
Actual | | $ | 1,000.00 | | | $ | 1,075.12 | | | $ | 5.72 | | | | 1.10 | % |
| | | | |
Hypothetical (5% return before expenses) | | $ | 1,000.00 | | | $ | 1,019.55 | | | $ | 5.57 | | | | 1.10 | % |
| | | | | |
Institutional Class | | | | | | | | | | | | | | | | |
| | | | |
Actual | | $ | 1,000.00 | | | $ | 1,076.55 | | | $ | 4.44 | | | | 0.85 | % |
| | | | |
Hypothetical (5% return before expenses) | | $ | 1,000.00 | | | $ | 1,020.80 | | | $ | 4.32 | | | | 0.85 | % |
| 1 | Expenses paid is equal to the annualized net expense ratio of each class multiplied by the average account value over the period, multiplied by the number of days in the most recent fiscal half-year divided by the number of days in the fiscal year (to reflect the one-half-year period). |
10 | Wells Fargo Enterprise Fund
Portfolio of investments—September 30, 2019
| | | | | | | | | | | | | | | | |
| | | | | | | | | Shares | | | Value | |
| Common Stocks: 99.24% | | | | | | | | | | | | | | | | |
| | | | |
Communication Services: 5.90% | | | | | | | | | | | | | | | | |
| | | | |
| Entertainment: 4.51% | | | | | | | | | | | | |
Nintendo Company Limited ADR | | | | | | | | | | | 220,300 | | | $ | 10,265,980 | |
Take-Two Interactive Software Incorporated † | | | | | | | | | | | 117,700 | | | | 14,752,518 | |
World Wrestling Entertainment Incorporated Class A « | | | | | | | | | | | 130,800 | | | | 9,306,420 | |
| | | | |
| | | | | | | | | | | | | | | 34,324,918 | |
| | | | | | | | | | | | | | | | |
| | | | |
| Interactive Media & Services: 1.39% | | | | | | | | | | | | |
Match Group Incorporated « | | | | | | | | | | | 148,000 | | | | 10,573,120 | |
| | | | | | | | | | | | | | | | |
| | | | |
Consumer Discretionary: 18.37% | | | | | | | | | | | | | | | | |
| | | | |
| Auto Components: 1.21% | | | | | | | | | | | | |
Aptiv plc | | | | | | | | | | | 105,285 | | | | 9,204,015 | |
| | | | | | | | | | | | | | | | |
| | | | |
| Automobiles: 1.34% | | | | | | | | | | | | |
Ferrari NV | | | | | | | | | | | 66,000 | | | | 10,169,940 | |
| | | | | | | | | | | | | | | | |
| | | | |
| Diversified Consumer Services: 1.84% | | | | | | | | | | | | |
Bright Horizons Family Solutions Incorporated † | | | | | | | | | | | 91,500 | | | | 13,953,750 | |
| | | | | | | | | | | | | | | | |
| | | | |
| Hotels, Restaurants & Leisure: 6.19% | | | | | | | | | | | | |
Chipotle Mexican Grill Incorporated † | | | | | | | | | | | 21,800 | | | | 18,322,246 | |
Domino’s Pizza Incorporated | | | | | | | | | | | 40,800 | | | | 9,979,272 | |
Royal Caribbean Cruises Limited | | | | | | | | | | | 57,200 | | | | 6,196,476 | |
Vail Resorts Incorporated | | | | | | | | | | | 55,217 | | | | 12,565,181 | |
| | | | |
| | | | | | | | | | | | | | | 47,063,175 | |
| | | | | | | | | | | | | | | | |
| | | | |
| Internet & Direct Marketing Retail: 2.57% | | | | | | | | | | | | |
MercadoLibre Incorporated † | | | | | | | | | | | 24,400 | | | | 13,450,012 | |
Wayfair Incorporated Class A Ǡ | | | | | | | | | | | 54,569 | | | | 6,118,276 | |
| | | | |
| | | | | | | | | | | | | | | 19,568,288 | |
| | | | | | | | | | | | | | | | |
| | | | |
| Specialty Retail: 2.90% | | | | | | | | | | | | |
Burlington Stores Incorporated † | | | | | | | | | | | 67,400 | | | | 13,467,868 | |
Five Below Incorporated † | | | | | | | | | | | 68,100 | | | | 8,587,410 | |
| | | | |
| | | | | | | | | | | | | | | 22,055,278 | |
| | | | | | | | | | | | | | | | |
| | | | |
| Textiles, Apparel & Luxury Goods: 2.32% | | | | | | | | | | | | |
Lululemon Athletica Incorporated † | | | | | | | | | | | 48,100 | | | | 9,260,693 | |
Under Armour Incorporated Class C † | | | | | | | | | | | 463,400 | | | | 8,401,442 | |
| | | | |
| | | | | | | | | | | | | | | 17,662,135 | |
| | | | | | | | | | | | | | | | |
| | | | |
Consumer Staples: 2.51% | | | | | | | | | | | | | | | | |
| | | | |
| Food & Staples Retailing: 1.31% | | | | | | | | | | | | |
US Foods Holding Corporation † | | | | | | | | | | | 241,200 | | | | 9,913,320 | |
| | | | | | | | | | | | | | | | |
| | | | |
| Food Products: 1.20% | | | | | | | | | | | | |
Lamb Weston Holdings Incorporated | | | | | | | | | | | 125,600 | | | | 9,133,632 | |
| | | | | | | | | | | | | | | | |
| | | | |
Financials: 2.58% | | | | | | | | | | | | | | | | |
| | | | |
| Capital Markets: 2.58% | | | | | | | | | | | | |
Intercontinental Exchange Incorporated | | | | | | | | | | | 127,625 | | | | 11,775,959 | |
Raymond James Financial Incorporated | | | | | | | | | | | 94,900 | | | | 7,825,454 | |
| | | | |
| | | | | | | | | | | | | | | 19,601,413 | |
| | | | | | | | | | | | | | | | |
Wells Fargo Enterprise Fund | 11
Portfolio of investments—September 30, 2019
| | | | | | | | | | | | | | | | |
| | | | | | | | | Shares | | | Value | |
Health Care: 15.36% | | | | | | | | | | | | | | | | |
| | | | |
| Biotechnology: 1.91% | | | | | | | | | | | | |
Exact Sciences Corporation † | | | | | | | | | | | 117,100 | | | $ | 10,582,327 | |
Sarepta Therapeutics Incorporated † | | | | | | | | | | | 51,700 | | | | 3,894,044 | |
| | | | |
| | | | | | | | | | | | | | | 14,476,371 | |
| | | | | | | | | | | | | | | | |
| | | | |
| Health Care Equipment & Supplies: 5.90% | | | | | | | | | | | | |
Align Technology Incorporated † | | | | | | | | | | | 50,400 | | | | 9,118,368 | |
DexCom Incorporated † | | | | | | | | | | | 88,600 | | | | 13,222,664 | |
Edwards Lifesciences Corporation † | | | | | | | | | | | 44,900 | | | | 9,873,959 | |
Insulet Corporation † | | | | | | | | | | | 76,800 | | | | 12,666,624 | |
| | | | |
| | | | | | | | | | | | | | | 44,881,615 | |
| | | | | | | | | | | | | | | | |
| | | | |
| Health Care Providers & Services: 1.49% | | | | | | | | | | | | |
WellCare Health Plans Incorporated † | | | | | | | | | | | 43,700 | | | | 11,325,729 | |
| | | | | | | | | | | | | | | | |
| | | | |
| Health Care Technology: 3.64% | | | | | | | | | | | | |
Cerner Corporation | | | | | | | | | | | 182,400 | | | | 12,434,208 | |
Veeva Systems Incorporated Class A † | | | | | | | | | | | 100,000 | | | | 15,269,000 | |
| | | | |
| | | | | | | | | | | | | | | 27,703,208 | |
| | | | | | | | | | | | | | | | |
| | | | |
| Life Sciences Tools & Services: 1.43% | | | | | | | | | | | | |
Bio-Rad Laboratories Incorporated Class A † | | | | | | | | | | | 32,700 | | | | 10,880,598 | |
| | | | | | | | | | | | | | | | |
| | | | |
| Pharmaceuticals: 0.99% | | | | | | | | | | | | |
Elanco Animal Health Incorporated † | | | | | | | | | | | 281,787 | | | | 7,492,716 | |
| | | | | | | | | | | | | | | | |
| | | | |
Industrials: 15.06% | | | | | | | | | | | | | | | | |
| | | | |
| Aerospace & Defense: 1.60% | | | | | | | | | | | | |
Teledyne Technologies Incorporated † | | | | | | | | | | | 37,900 | | | | 12,203,421 | |
| | | | | | | | | | | | | | | | |
| | | | |
| Commercial Services & Supplies: 6.11% | | | | | | | | | | | | |
Cintas Corporation | | | | | | | | | | | 64,500 | | | | 17,292,450 | |
IAA Incorporated † | | | | | | | | | | | 180,400 | | | | 7,528,092 | |
Waste Connections Incorporated | | | | | | | | | | | 235,339 | | | | 21,651,188 | |
| | | | |
| | | | | | | | | | | | | | | 46,471,730 | |
| | | | | | | | | | | | | | | | |
| | | | |
| Construction & Engineering: 0.80% | | | | | | | | | | | | |
Jacobs Engineering Group Incorporated | | | | | | | | | | | 66,200 | | | | 6,057,300 | |
| | | | | | | | | | | | | | | | |
| | | | |
| Electrical Equipment: 1.42% | | | | | | | | | | | | |
Rockwell Automation Incorporated | | | | | | | | | | | 65,300 | | | | 10,761,440 | |
| | | | | | | | | | | | | | | | |
| | | | |
| Machinery: 2.59% | | | | | | | | | | | | |
The Middleby Corporation † | | | | | | | | | | | 77,800 | | | | 9,094,820 | |
Woodward Governor Company | | | | | | | | | | | 98,100 | | | | 10,578,123 | |
| | | | |
| | | | | | | | | | | | | | | 19,672,943 | |
| | | | | | | | | | | | | | | | |
| | | | |
| Road & Rail: 1.51% | | | | | | | | | | | | |
Saia Incorporated † | | | | | | | | | | | 122,500 | | | | 11,478,250 | |
| | | | | | | | | | | | | | | | |
| | | | |
| Trading Companies & Distributors: 1.03% | | | | | | | | | | | | |
Univar Incorporated † | | | | | | | | | | | 379,046 | | | | 7,868,995 | |
| | | | | | | | | | | | | | | | |
| | | | |
Information Technology: 32.59% | | | | | | | | | | | | | | | | |
| | | | |
| Communications Equipment: 2.23% | | | | | | | | | | | | |
Motorola Solutions Incorporated | | | | | | | | | | | 99,300 | | | | 16,921,713 | |
| | | | | | | | | | | | | | | | |
12 | Wells Fargo Enterprise Fund
Portfolio of investments—September 30, 2019
| | | | | | | | | | | | | | | | |
| | | | | | | | | Shares | | | Value | |
| Electronic Equipment, Instruments & Components: 1.23% | | | | | | | | | | | | |
Zebra Technologies Corporation Class A † | | | | | | | | | | | 45,300 | | | $ | 9,348,561 | |
| | | | | | | | | | | | | | | | |
| | | | |
| IT Services: 21.30% | | | | | | | | | | | | |
Adyen NV 144A† | | | | | | | | | | | 6,978 | | | | 4,535,700 | |
Black Knight Incorporated † | | | | | | | | | | | 250,700 | | | | 15,307,742 | |
Booz Allen Hamilton Holding Corporation | | | | | | | | | | | 211,200 | | | | 14,999,424 | |
EPAM Systems Incorporated † | | | | | | | | | | | 70,154 | | | | 12,790,477 | |
Fiserv Incorporated † | | | | | | | | | | | 247,313 | | | | 25,619,154 | |
FleetCor Technologies Incorporated † | | | | | | | | | | | 53,500 | | | | 15,342,730 | |
Global Payments Incorporated | | | | | | | | | | | 94,781 | | | | 15,070,179 | |
PagSeguro Digital Limited Class A † | | | | | | | | | | | 224,600 | | | | 10,401,226 | |
Shopify Incorporated Class A † | | | | | | | | | | | 31,900 | | | | 9,941,954 | |
Square Incorporated Class A † | | | | | | | | | | | 196,000 | | | | 12,142,200 | |
Twilio Incorporated Class A † | | | | | | | | | | | 89,100 | | | | 9,797,436 | |
WEX Incorporated † | | | | | | | | | | | 79,400 | | | | 16,044,358 | |
| | | | |
| | | | | | | | | | | | | | | 161,992,580 | |
| | | | | | | | | | | | | | | | |
| | | | |
| Semiconductors & Semiconductor Equipment: 4.57% | | | | | | | | | | | | |
Advanced Micro Devices Incorporated † | | | | | | | | | | | 504,000 | | | | 14,610,960 | |
Micron Technology Incorporated † | | | | | | | | | | | 206,300 | | | | 8,839,955 | |
Xilinx Incorporated | | | | | | | | | | | 118,000 | | | | 11,316,200 | |
| | | | |
| | | | | | | | | | | | | | | 34,767,115 | |
| | | | | | | | | | | | | | | | |
| | | | |
| Software: 3.26% | | | | | | | | | | | | |
Autodesk Incorporated † | | | | | | | | | | | 68,000 | | | | 10,043,600 | |
ServiceNow Incorporated † | | | | | | | | | | | 58,150 | | | | 14,761,378 | |
| | | | |
| | | | | | | | | | | | | | | 24,804,978 | |
| | | | | | | | | | | | | | | | |
| | | | |
Materials: 6.87% | | | | | | | | | | | | | | | | |
| | | | |
| Chemicals: 3.80% | | | | | | | | | | | | |
Air Products & Chemicals Incorporated | | | | | | | | | | | 42,700 | | | | 9,473,422 | |
Ingevity Corporation † | | | | | | | | | | | 89,500 | | | | 7,593,180 | |
The Sherwin-Williams Company | | | | | | | | | | | 21,500 | | | | 11,822,205 | |
| | | | |
| | | | | | | | | | | | | | | 28,888,807 | |
| | | | | | | | | | | | | | | | |
| | | | |
| Construction Materials: 1.72% | | | | | | | | | | | | |
Vulcan Materials Company | | | | | | | | | | | 86,800 | | | | 13,127,631 | |
| | | | | | | | | | | | | | | | |
| | | | |
| Containers & Packaging: 1.35% | | | | | | | | | | | | |
AptarGroup Incorporated | | | | | | | | | | | 86,600 | | | | 10,257,770 | |
| | | | | | | | | | | | | | | | |
| | | | |
Total Common Stocks (Cost $541,223,106) | | | | | | | | | | | | | | | 754,606,455 | |
| | | | | | | | | | | | | | | | |
| | | | |
| | | | | | | | | | | | | | | | |
| | | Yield | | | | | | | | | | |
| | | | |
Short-Term Investments: 3.71% | | | | | | | | | | | | | | | | |
| | | | |
| Investment Companies: 3.71% | | | | | | | | | | | | |
Securities Lending Cash Investments LLC (I)(r)(u) | | | 2.11 | % | | | | | | | 25,578,810 | | | | 25,581,368 | |
Wells Fargo Government Money Market Fund Select Class (I)(u) | | | 1.88 | | | | | | | | 2,635,132 | | | | 2,635,132 | |
| |
Total Short-Term Investments (Cost $28,216,500) | | | | 28,216,500 | |
| | | | | | | | | | | | | | | | |
| | | | | | | | |
| Total investments in securities (Cost $569,439,606) | | | 102.95 | % | | | 782,822,955 | |
| | |
Other assets and liabilities, net | | | (2.95 | ) | | | (22,438,107 | ) |
| | | | | | | | |
| Total net assets | | | 100.00 | % | | $ | 760,384,848 | |
| | | | | | | | |
Wells Fargo Enterprise Fund | 13
Portfolio of investments—September 30, 2019
| † | Non-income-earning security |
| « | All or a portion of this security is on loan. |
| 144A | The security may be resold in transactions exempt from registration, normally to qualified institutional buyers, pursuant to Rule 144A under the Securities Act of 1933. |
| (l) | The issuer of the security is an affiliated person of the Fund as defined in the Investment Company Act of 1940. |
| (r) | The investment is a non-registered investment company purchased with cash collateral received from securities on loan. |
| (u) | The rate represents the 7-day annualized yield at period end. |
Abbreviations:
| ADR | American depositary receipt |
Investments in Affiliates
An affiliated investment is an investment in which the Fund owns at least 5% of the outstanding voting shares of the issuer or as a result of other relationships, such as the Fund and the issuer having the same investment manager. Transactions with issuers that were either affiliated persons of the Fund at the beginning of the period or the end of the period were as follows:
| | | | | | | | | | | | | | | | | | | | | | | | | | | | | | | | | | | | |
| | | Shares,
beginning of
period | | | Shares
purchased | | | Shares
sold | | | Shares,
end of
period | | | Net
realized
gains | | | Net
change in
unrealized
gains
(losses) | | | Income
from
affiliated
securities | | | Value,
end of period | | | % of
net
assets | |
| | | | | | | | | |
| Short-Term Investments | | | | | | | | | | | | | | | | | | | | | | | | | | | |
Investment Companies | | | | | | | | | | | | | | | | | | | | | | | | | | | | | | | | | | | | |
Securities Lending Cash Investments LLC | | | 33,993,921 | | | | 389,033,184 | | | | 397,448,295 | | | | 25,578,810 | | | $ | 3,171 | | | $ | 0 | | | $ | 768,862 | # | | $ | 25,581,368 | | | | | |
Wells Fargo Government Money Market Fund Select Class | | | 4,785,042 | | | | 162,507,757 | | | | 164,657,667 | | | | 2,635,132 | | | | 0 | | | | 0 | | | | 135,560 | | | | 2,635,132 | | | | | |
| | | | | | | | | | | | | | | | | | | | | | | | | | | | | | | | | | | | |
| | | | | | | | | |
| | | | | | | | | | | | | | | | | | $ | 3,171 | | | $ | 0 | | | $ | 904,422 | | | $ | 28,216,500 | | | | 3.71 | % |
| | | | | | | | | | | | | | | | | | | | | | | | | | | | | | | | | | | | |
| # | Amount shown represents income before fees and rebates. |
The accompanying notes are an integral part of these financial statements.
14 | Wells Fargo Enterprise Fund
Statement of assets and liabilities—September 30, 2019
| | | | |
| | | | |
| |
Assets | | | | |
Investments in unaffiliated securities (including $24,689,110 of securities loaned), at value (cost $541,223,106) | | $ | 754,606,455 | |
Investment in affiliated securities, at value (cost $28,216,500) | | | 28,216,500 | |
Receivable for investments sold | | | 4,425,568 | |
Receivable for Fund shares sold | | | 87,939 | |
Receivable for dividends | | | 236,092 | |
Receivable for securities lending income, net | | | 19,338 | |
Prepaid expenses and other assets | | | 55,299 | |
| | | | |
Total assets | | | 787,647,191 | |
| | | | |
| |
Liabilities | | | | |
Payable upon receipt of securities loaned | | | 25,580,565 | |
Payable for Fund shares redeemed | | | 712,127 | |
Management fee payable | | | 434,302 | |
Administration fees payable | | | 122,177 | |
Trustees’ fees and expenses payable | | | 2,007 | |
Distribution fee payable | | | 1,583 | |
Accrued expenses and other liabilities | | | 409,582 | |
| | | | |
Total liabilities | | | 27,262,343 | |
| | | | |
Total net assets | | $ | 760,384,848 | |
| | | | |
| |
Net assets consist of | | | | |
Paid-in capital | | $ | 510,619,393 | |
Total distributable earnings | | | 249,765,455 | |
| | | | |
Total net assets | | $ | 760,384,848 | |
| | | | |
| |
Computation of net asset value and offering price per share | | | | |
Net assets – Class A | | $ | 649,105,683 | |
Shares outstanding – Class A1 | | | 12,988,008 | |
Net asset value per share – Class A | | | $49.98 | |
Maximum offering price per share – Class A2 | | | $53.03 | |
Net assets – Class C | | $ | 2,512,963 | |
Shares outstanding – Class C1 | | | 58,543 | |
Net asset value per share – Class C | | | $42.93 | |
Net assets – Class R6 | | $ | 52,782,949 | |
Shares outstanding – Class R61 | | | 940,110 | |
Net asset value per share – Class R6 | | | $56.15 | |
Net assets – Administrator Class | | $ | 3,687,419 | |
Shares outstanding – Administrator Class1 | | | 69,437 | |
Net asset value per share – Administrator Class | | | $53.10 | |
Net assets – Institutional Class | | $ | 52,295,834 | |
Shares outstanding – Institutional Class1 | | | 934,435 | |
Net asset value per share – Institutional Class | | | $55.97 | |
| 1 | The Fund has an unlimited number of authorized shares. |
| 2 | Maximum offering price is computed as 100/94.25 of net asset value. On investments of $50,000 or more, the offering price is reduced. |
The accompanying notes are an integral part of these financial statements.
Wells Fargo Enterprise Fund | 15
Statement of operations—year ended September 30, 2019
| | | | |
| | | | |
| |
Investment income | | | | |
Dividends (net of foreign withholding taxes of $72,944) | | $ | 3,928,839 | |
Securities lending income from affiliates, net | | | 214,990 | |
Income from affiliated securities | | | 135,560 | |
| | | | |
Total investment income | | | 4,279,389 | |
| | | | |
| |
Expenses | | | | |
Management fee | | | 5,356,889 | |
Administration fees | | | | |
Class A | | | 1,301,068 | |
Class C | | | 8,191 | |
Class R6 | | | 14,509 | |
Administrator Class | | | 4,335 | |
Institutional Class | | | 60,432 | |
Shareholder servicing fees | | | | |
Class A | | | 1,548,890 | |
Class C | | | 9,752 | |
Administrator Class | | | 7,923 | |
Distribution fee | | | | |
Class C | | | 29,240 | |
Custody and accounting fees | | | 62,681 | |
Professional fees | | | 42,271 | |
Registration fees | | | 107,277 | |
Shareholder report expenses | | | 78,028 | |
Trustees’ fees and expenses | | | 21,652 | |
Other fees and expenses | | | 14,185 | |
| | | | |
Total expenses | | | 8,667,323 | |
Less: Fee waivers and/or expense reimbursements | | | | |
Fund-level | | | (128,326 | ) |
Class A | | | (308,068 | ) |
Class C | | | (1,909 | ) |
Administrator Class | | | (1,351 | ) |
Institutional Class | | | (23,363 | ) |
| | | | |
Net expenses | | | 8,204,306 | |
| | | | |
Net investment loss | | | (3,924,917 | ) |
| | | | |
| |
Realized and unrealized gains (losses) on investments | | | | |
Net realized gains on | | | | |
Unaffiliated securities | | | 40,827,708 | |
Affiliated securities | | | 3,171 | |
| | | | |
Net realized gains on investments | | | 40,830,879 | |
Net change in unrealized gains (losses) on investments | | | 16,452,262 | |
| | | | |
Net realized and unrealized gains (losses) on investments | | | 57,283,141 | |
| | | | |
Net increase in net assets resulting from operations | | $ | 53,358,224 | |
| | | | |
The accompanying notes are an integral part of these financial statements.
16 | Wells Fargo Enterprise Fund
Statement of changes in net assets
| | | | | | | | | | | | | | | | |
| | | Year ended
September 30, 2019 | | | Year ended
September 30, 2018 | |
| | | |
Operations | | | | | | | | | | | | |
Net investment loss | | | | | | $ | (3,924,917 | ) | | | | | | $ | (4,200,615 | ) |
Net realized gains on investments | | | | | | | 40,830,879 | | | | | | | | 90,687,674 | |
Net change in unrealized gains (losses) on investments | | | | | | | 16,452,262 | | | | | | | | 51,811,573 | |
| | | | |
Net increase in net assets resulting from operations | | | | | | | 53,358,224 | | | | | | | | 138,298,632 | |
| | | | |
| | | |
Distributions to shareholders from net investment income and net realized gains | | | | | | | | | | | | | |
Class A | | | | | | | (70,134,961 | ) | | | | | | | (61,896,652 | ) |
Class C | | | | | | | (816,461 | ) | | | | | | | (1,047,354 | ) |
Class R6 | | | | | | | (4,758,790 | ) | | | | | | | (4,095,973 | ) |
Administrator Class | | | | | | | (354,535 | ) | | | | | | | (378,790 | ) |
Institutional Class | | | | | | | (4,789,875 | ) | | | | | | | (4,654,368 | ) |
| | | | |
Total distributions to shareholders | | | | | | | (80,854,622 | ) | | | | | | | (72,073,137 | ) |
| | | | |
| | | | |
Capital share transactions | | | Shares | | | | | | | | Shares | | | | | |
Proceeds from shares sold | | | | | | | | | | | | | | | | |
Class A | | | 314,721 | | | | 14,539,690 | | | | 185,378 | | | | 9,099,671 | |
Class C | | | 6,455 | | | | 248,651 | | | | 4,536 | | | | 198,917 | |
Class R6 | | | 95,098 | | | | 5,042,506 | | | | 178,922 | | | | 9,819,356 | |
Administrator Class | | | 7,854 | | | | 408,606 | | | | 12,688 | | | | 658,208 | |
Institutional Class | | | 329,158 | | | | 17,257,242 | | | | 132,493 | | | | 7,163,466 | |
| | | | |
| | | | | | | 37,496,695 | | | | | | | | 26,939,618 | |
| | | | | | | | | | | | | | | | |
Reinvestment of distributions | | | | | | | | | | | | | | | | |
Class A | | | 1,674,293 | | | | 66,553,135 | | | | 1,280,198 | | | | 58,530,640 | |
Class C | | | 23,541 | | | | 808,616 | | | | 25,557 | | | | 1,037,343 | |
Class R6 | | | 106,814 | | | | 4,755,337 | | | | 81,337 | | | | 4,092,854 | |
Administrator Class | | | 8,166 | | | | 344,706 | | | | 7,722 | | | | 371,790 | |
Institutional Class | | | 102,726 | | | | 4,559,989 | | | | 89,154 | | | | 4,477,339 | |
| | | | |
| | | | | | | 77,021,783 | | | | | | | | 68,509,966 | |
| | | | |
Payment for shares redeemed | | | | | | | | | | | | | | | | |
Class A | | | (1,374,541 | ) | | | (63,202,802 | ) | | | (1,203,590 | ) | | | (59,203,661 | ) |
Class C | | | (134,665 | ) | | | (5,157,166 | ) | | | (69,340 | ) | | | (3,062,717 | ) |
Class R6 | | | (88,918 | ) | | | (4,650,355 | ) | | | (108,785 | ) | | | (6,087,430 | ) |
Administrator Class | | | (12,643 | ) | | | (610,976 | ) | | | (26,820 | ) | | | (1,379,035 | ) |
Institutional Class | | | (327,960 | ) | | | (16,479,135 | ) | | | (425,040 | ) | | | (22,883,844 | ) |
| | | | |
| | | | | | | (90,100,434 | ) | | | | | | | (92,616,687 | ) |
| | | | |
Net increase in net assets resulting from capital share transactions | | | | | | | 24,418,044 | | | | | | | | 2,832,897 | |
| | | | |
Total increase (decrease) in net assets | | | | | | | (3,078,354 | ) | | | | | | | 69,058,392 | |
| | | | |
| | |
Net assets | | | | | | | | |
Beginning of period | | | | | | | 763,463,202 | | | | | | | | 694,404,810 | |
| | | | |
End of period | | | | | | $ | 760,384,848 | | | | | | | $ | 763,463,202 | |
| | | | |
The accompanying notes are an integral part of these financial statements.
Wells Fargo Enterprise Fund | 17
Financial highlights
(For a share outstanding throughout each period)
| | | | | | | | | | | | | | | | | | | | |
| | | Year ended September 30 | |
| CLASS A | | 2019 | | | 2018 | | | 2017 | | | 2016 | | | 2015 | |
Net asset value, beginning of period | | | $52.96 | | | | $48.80 | | | | $41.94 | | | | $41.90 | | | | $47.93 | |
Net investment loss | | | (0.29 | ) | | | (0.31 | ) | | | (0.25 | ) | | | (0.21 | )1 | | | (0.29 | ) |
Net realized and unrealized gains (losses) on investments | | | 3.05 | | | | 9.66 | | | | 8.94 | | | | 3.61 | | | | 0.18 | |
| | | | | | | | | | | | | | | | | | | | |
Total from investment operations | | | 2.76 | | | | 9.35 | | | | 8.69 | | | | 3.40 | | | | (0.11 | ) |
Distributions to shareholders from | | | | | | | | | | | | | | | | | | | | |
Net realized gains | | | (5.74 | ) | | | (5.19 | ) | | | (1.83 | ) | | | (3.36 | ) | | | (5.92 | ) |
Net asset value, end of period | | | $49.98 | | | | $52.96 | | | | $48.80 | | | | $41.94 | | | | $41.90 | |
Total return2 | | | 8.00 | % | | | 20.83 | % | | | 21.55 | % | | | 8.63 | % | | | (0.67 | )% |
Ratios to average net assets (annualized) | | | | | | | | | | | | | | | | | | | | |
Gross expenses | | | 1.25 | % | | | 1.25 | % | | | 1.26 | % | | | 1.26 | % | | | 1.29 | % |
Net expenses | | | 1.18 | % | | | 1.18 | % | | | 1.18 | % | | | 1.18 | % | | | 1.18 | % |
Net investment loss | | | (0.59 | )% | | | (0.61 | )% | | | (0.55 | )% | | | (0.52 | )% | | | (0.60 | )% |
Supplemental data | | | | | | | | | | | | | | | | | | | | |
Portfolio turnover rate | | | 50 | % | | | 62 | % | | | 75 | % | | | 99 | % | | | 101 | % |
Net assets, end of period (000s omitted) | | | $649,106 | | | | $655,338 | | | | $591,002 | | | | $542,077 | | | | $370,743 | |
| 1 | Calculated based upon average shares outstanding |
| 2 | Total return calculations do not include any sales charges. |
The accompanying notes are an integral part of these financial statements.
18 | Wells Fargo Enterprise Fund
Financial highlights
(For a share outstanding throughout each period)
| | | | | | | | | | | | | | | | | | | | |
| | | Year ended September 30 | |
| CLASS C | | 2019 | | | 2018 | | | 2017 | | | 2016 | | | 2015 | |
Net asset value, beginning of period | | | $46.74 | | | | $43.95 | | | | $38.23 | | | | $38.75 | | | | $45.07 | |
Net investment loss | | | (0.52 | )1 | | | (0.60 | )1 | | | (0.85 | ) | | | (0.47 | )1 | | | (0.59 | )1 |
Net realized and unrealized gains (losses) on investments | | | 2.45 | | | | 8.58 | | | | 8.40 | | | | 3.31 | | | | 0.19 | |
| | | | | | | | | | | | | | | | | | | | |
Total from investment operations | | | 1.93 | | | | 7.98 | | | | 7.55 | | | | 2.84 | | | | (0.40 | ) |
Distributions to shareholders from | | | | | | | | | | | | | | | | | | | | |
Net realized gains | | | (5.74 | ) | | | (5.19 | ) | | | (1.83 | ) | | | (3.36 | ) | | | (5.92 | ) |
Net asset value, end of period | | | $42.93 | | | | $46.74 | | | | $43.95 | | | | $38.23 | | | | $38.75 | |
Total return2 | | | 7.20 | % | | | 19.93 | % | | | 20.66 | % | | | 7.80 | % | | | (1.41 | )% |
Ratios to average net assets (annualized) | | | | | | | | | | | | | | | | | | | | |
Gross expenses | | | 2.00 | % | | | 2.00 | % | | | 2.01 | % | | | 2.01 | % | | | 2.04 | % |
Net expenses | | | 1.93 | % | | | 1.93 | % | | | 1.93 | % | | | 1.93 | % | | | 1.93 | % |
Net investment loss | | | (1.29 | )% | | | (1.37 | )% | | | (1.13 | )% | | | (1.28 | )% | | | (1.36 | )% |
Supplemental data | | | | | | | | | | | | | | | | | | | | |
Portfolio turnover rate | | | 50 | % | | | 62 | % | | | 75 | % | | | 99 | % | | | 101 | % |
Net assets, end of period (000s omitted) | | | $2,513 | | | | $7,629 | | | | $8,898 | | | | $9,181 | | | | $9,399 | |
| 1 | Calculated based upon average shares outstanding |
| 2 | Total return calculations do not include any sales charges. |
The accompanying notes are an integral part of these financial statements.
Wells Fargo Enterprise Fund | 19
Financial highlights
(For a share outstanding throughout each period)
| | | | | | | | | | | | | | | | | | | | |
| | | Year ended September 30 | |
| CLASS R6 | | 2019 | | | 2018 | | | 2017 | | | 2016 | | | 20151 | |
Net asset value, beginning of period | | | $58.47 | | | | $53.17 | | | | $45.37 | | | | $44.89 | | | | $52.65 | |
Net investment loss | | | (0.11 | )2 | | | (0.13 | )2 | | | (0.08 | ) | | | (0.06 | )2 | | | (0.08 | ) |
Net realized and unrealized gains (losses) on investments | | | 3.53 | | | | 10.62 | | | | 9.71 | | | | 3.90 | | | | (1.76 | ) |
| | | | | | | | | | | | | | | | | | | | |
Total from investment operations | | | 3.42 | | | | 10.49 | | | | 9.63 | | | | 3.84 | | | | (1.84 | ) |
Distributions to shareholders from | | | | | | | | | | | | | | | | | | | | |
Net realized gains | | | (5.74 | ) | | | (5.19 | ) | | | (1.83 | ) | | | (3.36 | ) | | | (5.92 | ) |
Net asset value, end of period | | | $56.15 | | | | $58.47 | | | | $53.17 | | | | $45.37 | | | | $44.89 | |
Total return3 | | | 8.41 | % | | | 21.30 | % | | | 22.01 | % | | | 9.06 | % | | | (3.84 | )% |
Ratios to average net assets (annualized) | | | | | | | | | | | | | | | | | | | | |
Gross expenses | | | 0.82 | % | | | 0.82 | % | | | 0.82 | % | | | 0.83 | % | | | 0.81 | % |
Net expenses | | | 0.80 | % | | | 0.80 | % | | | 0.80 | % | | | 0.80 | % | | | 0.80 | % |
Net investment loss | | | (0.21 | )% | | | (0.23 | )% | | | (0.17 | )% | | | (0.14 | )% | | | (0.19 | )% |
Supplemental data | | | | | | | | | | | | | | | | | | | | |
Portfolio turnover rate | | | 50 | % | | | 62 | % | | | 75 | % | | | 99 | % | | | 101 | % |
Net assets, end of period (000s omitted) | | | $52,783 | | | | $48,363 | | | | $35,923 | | | | $29,861 | | | | $24 | |
| 1 | For the period from October 31, 2014 (commencement of class operations) to September 30, 2015 |
| 2 | Calculated based upon average shares outstanding |
| 3 | Returns for periods of less than one year are not annualized. |
The accompanying notes are an integral part of these financial statements.
20 | Wells Fargo Enterprise Fund
Financial highlights
(For a share outstanding throughout each period)
| | | | | | | | | | | | | | | | | | | | |
| | | Year ended September 30 | |
| ADMINISTRATOR CLASS | | 2019 | | | 2018 | | | 2017 | | | 2016 | | | 2015 | |
Net asset value, beginning of period | | | $55.82 | | | | $51.12 | | | | $43.81 | | | | $43.58 | | | | $49.54 | |
Net investment loss | | | (0.25 | )1 | | | (0.28 | )1 | | | (0.20 | )1 | | | (0.18 | )1 | | | (0.23 | )1 |
Net realized and unrealized gains (losses) on investments | | | 3.27 | | | | 10.17 | | | | 9.34 | | | | 3.77 | | | | 0.19 | |
| | | | | | | | | | | | | | | | | | | | |
Total from investment operations | | | 3.02 | | | | 9.89 | | | | 9.14 | | | | 3.59 | | | | (0.04 | ) |
Distributions to shareholders from | | | | | | | | | | | | | | | | | | | | |
Net realized gains | | | (5.74 | ) | | | (5.19 | ) | | | (1.83 | ) | | | (3.36 | ) | | | (5.92 | ) |
Net asset value, end of period | | | $53.10 | | | | $55.82 | | | | $51.12 | | | | $43.81 | | | | $43.58 | |
Total return | | | 8.06 | % | | | 20.95 | % | | | 21.66 | % | | | 8.74 | % | | | (0.46 | )% |
Ratios to average net assets (annualized) | | | | | | | | | | | | | | | | | | | | |
Gross expenses | | | 1.16 | % | | | 1.16 | % | | | 1.18 | % | | | 1.15 | % | | | 1.09 | % |
Net expenses | | | 1.10 | % | | | 1.10 | % | | | 1.10 | % | | | 1.07 | % | | | 1.07 | % |
Net investment loss | | | (0.51 | )% | | | (0.53 | )% | | | (0.44 | )% | | | (0.41 | )% | | | (0.47 | )% |
Supplemental data | | | | | | | | | | | | | | | | | | | | |
Portfolio turnover rate | | | 50 | % | | | 62 | % | | | 75 | % | | | 99 | % | | | 101 | % |
Net assets, end of period (000s omitted) | | | $3,687 | | | | $3,687 | | | | $3,705 | | | | $4,693 | | | | $3,542 | |
| 1 | Calculated based upon average shares outstanding |
The accompanying notes are an integral part of these financial statements.
Wells Fargo Enterprise Fund | 21
Financial highlights
(For a share outstanding throughout each period)
| | | | | | | | | | | | | | | | | | | | |
| | | Year ended September 30 | |
| INSTITUTIONAL CLASS | | 2019 | | | 2018 | | | 2017 | | | 2016 | | | 2015 | |
Net asset value, beginning of period | | | $58.33 | | | | $53.08 | | | | $45.32 | | | | $44.87 | | | | $50.77 | |
Net investment loss | | | (0.14 | )1 | | | (0.15 | )1 | | | (0.09 | )1 | | | (0.09 | )1 | | | (0.13 | )1 |
Net realized and unrealized gains (losses) on investments | | | 3.52 | | | | 10.59 | | | | 9.68 | | | | 3.90 | | | | 0.15 | |
| | | | | | | | | | | | | | | | | | | | |
Total from investment operations | | | 3.38 | | | | 10.44 | | | | 9.59 | | | | 3.81 | | | | 0.02 | |
Distributions to shareholders from | | | | | | | | | | | | | | | | | | | | |
Net realized gains | | | (5.74 | ) | | | (5.19 | ) | | | (1.83 | ) | | | (3.36 | ) | | | (5.92 | ) |
Net asset value, end of period | | | $55.97 | | | | $58.33 | | | | $53.08 | | | | $45.32 | | | | $44.87 | |
Total return | | | 8.36 | % | | | 21.24 | % | | | 21.97 | % | | | 8.97 | % | | | (0.32 | )% |
Ratios to average net assets (annualized) | | | | | | | | | | | | | | | | | | | | |
Gross expenses | | | 0.92 | % | | | 0.92 | % | | | 0.93 | % | | | 0.93 | % | | | 0.88 | % |
Net expenses | | | 0.85 | % | | | 0.85 | % | | | 0.85 | % | | | 0.85 | % | | | 0.85 | % |
Net investment loss | | | (0.26 | )% | | | (0.29 | )% | | | (0.19 | )% | | | (0.21 | )% | | | (0.27 | )% |
Supplemental data | | | | | | | | | | | | | | | | | | | | |
Portfolio turnover rate | | | 50 | % | | | 62 | % | | | 75 | % | | | 99 | % | | | 101 | % |
Net assets, end of period (000s omitted) | | | $52,296 | | | | $48,446 | | | | $54,877 | | | | $61,563 | | | | $87,279 | |
| 1 | Calculated based upon average shares outstanding |
The accompanying notes are an integral part of these financial statements.
22 | Wells Fargo Enterprise Fund
Notes to financial statements
1. ORGANIZATION
Wells Fargo Funds Trust (the “Trust”), a Delaware statutory trust organized on March 10, 1999, is an open-end management investment company registered under the Investment Company Act of 1940, as amended (the “1940 Act”). As an investment company, the Trust follows the accounting and reporting guidance in Financial Accounting Standards Board (“FASB”) Accounting Standards Codification Topic 946, Financial Services – Investment Companies. These financial statements report on the Wells Fargo Enterprise Fund (the “Fund”) which is a diversified series of the Trust.
2. SIGNIFICANT ACCOUNTING POLICIES
The following significant accounting policies, which are consistently followed in the preparation of the financial statements of the Fund, are in conformity with U.S. generally accepted accounting principles which require management to make estimates and assumptions that affect the reported amounts of assets and liabilities, disclosure of contingent assets and liabilities at the date of the financial statements, and the reported amounts of revenues and expenses during the reporting period. Actual results could differ from those estimates.
Securities valuation
All investments are valued each business day as of the close of regular trading on the New York Stock Exchange (generally 4 p.m. Eastern Time), although the Fund may deviate from this calculation time under unusual or unexpected circumstances.
Equity securities that are listed on a foreign or domestic exchange or market are valued at the official closing price or, if none, the last sales price. If no sale occurs on the principal exchange or market that day, a fair value price will be determined in accordance with the Fund’s Valuation Procedures.
Investments in registered open-end investment companies are valued at net asset value. Interests in non-registered investment companies that are redeemable at net asset value are fair valued normally at net asset value.
Investments which are not valued using any of the methods discussed above are valued at their fair value, as determined in good faith by the Board of Trustees of the Fund. The Board of Trustees has established a Valuation Committee comprised of the Trustees and has delegated to it the authority to take any actions regarding the valuation of portfolio securities that the Valuation Committee deems necessary or appropriate, including determining the fair value of portfolio securities, unless the determination has been delegated to the Wells Fargo Asset Management Pricing Committee at Wells Fargo Funds Management, LLC (“Funds Management”). The Board of Trustees retains the authority to make or ratify any valuation decisions or approve any changes to the Valuation Procedures as it deems appropriate. On a quarterly basis, the Board of Trustees receives reports on any valuation actions taken by the Valuation Committee or the Wells Fargo Asset Management Pricing Committee which may include items for ratification.
Securities lending
The Fund may lend its securities from time to time in order to earn additional income in the form of fees or interest on securities received as collateral or the investment of any cash received as collateral. When securities are on loan, the Fund receives interest or dividends on those securities. Cash collateral received in connection with its securities lending transactions is invested in Securities Lending Cash Investments, LLC (the “Securities Lending Fund”). Investments in Securities Lending Fund are valued at the evaluated bid price provided by an independent pricing service. Income earned from investment in the Securities Lending Fund, if any, is included in securities lending income from affiliates (net of fees and rebates) on the Statement of Operations.
In a securities lending transaction, the net asset value of the Fund is affected by an increase or decrease in the value of the securities loaned and by an increase or decrease in the value of the instrument in which collateral is invested. The amount of securities lending activity undertaken by the Fund fluctuates from time to time. The Fund has the right under the lending agreement to recover the securities from the borrower on demand. In the event of default or bankruptcy by the borrower, the Fund may be prevented from recovering the loaned securities or gaining access to the collateral or may experience delays or costs in doing so. In such an event, the terms of the agreement allows the unaffiliated securities lending agent to use the collateral to purchase replacement securities on behalf of the Fund or pay the Fund the market value of the loaned securities. The Fund bears the risk of loss with respect to depreciation of its investment of the cash collateral.
Security transactions and income recognition
Securities transactions are recorded on a trade date basis. Realized gains or losses are recorded on the basis of identified cost.
Dividend income is recognized on the ex-dividend date. Dividend income is recorded net of foreign taxes withheld where recovery of such taxes is not assured.
Wells Fargo Enterprise Fund | 23
Notes to financial statements
Distributions to shareholders
Distributions to shareholders from net investment income and any net realized gains are recorded on the ex-dividend date and paid at least annually. Such distributions are determined in accordance with income tax regulations and may differ from U.S. generally accepted accounting principles. Dividend sources are estimated at the time of declaration. The tax character of distributions is determined as of the Fund’s fiscal year end. Therefore, a portion of the Fund’s distributions made prior to the Fund’s fiscal year end may be categorized as a tax return of capital at year end.
Federal and other taxes
The Fund intends to continue to qualify as a regulated investment company by distributing substantially all of its investment company taxable income and any net realized capital gains (after reduction for capital loss carryforwards) sufficient to relieve it from all, or substantially all, federal income taxes. Accordingly, no provision for federal income taxes was required.
The Fund’s income and federal excise tax returns and all financial records supporting those returns for the prior three fiscal years are subject to examination by the federal and Delaware revenue authorities. Management has analyzed the Fund’s tax positions taken on federal, state, and foreign tax returns for all open tax years and does not believe that there are any uncertain tax positions that require recognition of a tax liability.
As of September 30, 2019, the aggregate cost of all investments for federal income tax purposes was $570,361,428 and the unrealized gains (losses) consisted of:
| | | | |
| |
Gross unrealized gains | | $ | 233,996,587 | |
| |
Gross unrealized losses | | | (21,535,060 | ) |
| |
Net unrealized gains | | $ | 212,461,527 | |
Reclassifications are made to the Fund’s capital accounts for permanent tax differences to reflect income and gains available for distribution (or available capital loss carryforwards) under federal income tax regulations. U.S. generally accepted accounting principles require that certain components of net assets be adjusted to reflect permanent differences between financial and tax reporting. These reclassifications have no effect on net assets or net asset values per share. The primary permanent difference causing such reclassification is due to net operating losses. At September 30, 2019, as a result of permanent book-to-tax differences, the following reclassification adjustments were made on the Statement of Assets and Liabilities:
| | |
| Paid-in capital | | Total distributable earnings |
| |
| $(443,798) | | $443,798 |
As of September 30, 2019, the Fund had a qualified late-year ordinary loss of $3,481,054 which will be recognized on the first day of the following fiscal year.
Class allocations
The separate classes of shares offered by the Fund differ principally in applicable sales charges, distribution, shareholder servicing, and administration fees. Class specific expenses are charged directly to that share class. Investment income, common fund-level expenses, and realized and unrealized gains (losses) on investments are allocated daily to each class of shares based on the relative proportion of net assets of each class.
3. FAIR VALUATION MEASUREMENTS
Fair value measurements of investments are determined within a framework that has established a fair value hierarchy based upon the various data inputs utilized in determining the value of the Fund’s investments. The three-level hierarchy gives the highest priority to unadjusted quoted prices in active markets for identical assets or liabilities (Level 1) and the lowest priority to unobservable inputs (Level 3). The Fund’s investments are classified within the fair value hierarchy based on the lowest level of input that is significant to the fair value measurement. The inputs are summarized into three broad levels as follows:
| ∎ | | Level 1 – quoted prices in active markets for identical securities |
| ∎ | | Level 2 – other significant observable inputs (including quoted prices for similar securities, interest rates, prepayment speeds, credit risk, etc.) |
| ∎ | | Level 3 – significant unobservable inputs (including the Fund’s own assumptions in determining the fair value of investments) |
The inputs or methodologies used for valuing investments in securities are not necessarily an indication of the risk associated with investing in those securities.
24 | Wells Fargo Enterprise Fund
Notes to financial statements
The following is a summary of the inputs used in valuing the Fund’s assets and liabilities as of September 30, 2019:
| | | | | | | | | | | | | | | | |
| | | | |
| | | Quoted prices (Level 1) | | | Other significant observable inputs (Level 2) | | | Significant unobservable inputs (Level 3) | | | Total | |
| | | | |
Assets | | | | | | | | | | | | | | | | |
Investments in: | | | | | | | | | | | | | | | | |
| | | | |
Common stocks | | | | | | | | | | | | | | | | |
| | | | |
Communication services | | $ | 44,898,038 | | | $ | 0 | | | $ | 0 | | | $ | 44,898,038 | |
| | | | |
Consumer discretionary | | | 139,676,581 | | | | 0 | | | | 0 | | | | 139,676,581 | |
| | | | |
Consumer staple | | | 19,046,952 | | | | 0 | | | | 0 | | | | 19,046,952 | |
| | | | |
Financials | | | 19,601,413 | | | | 0 | | | | 0 | | | | 19,601,413 | |
| | | | |
Health care | | | 116,760,237 | | | | 0 | | | | 0 | | | | 116,760,237 | |
| | | | |
Industrials | | | 114,514,079 | | | | 0 | | | | 0 | | | | 114,514,079 | |
| | | | |
Information technology | | | 247,834,947 | | | | 0 | | | | 0 | | | | 247,834,947 | |
| | | | |
Materials | | | 52,274,208 | | | | 0 | | | | 0 | | | | 52,274,208 | |
| | | | |
Short-term investments | | | | | | | | | | | | | | | | |
| | | | |
Investment companies | | | 28,216,500 | | | | 0 | | | | 0 | | | | 28,216,500 | |
| | | | |
Total assets | | $ | 782,822,955 | | | $ | 0 | | | $ | 0 | | | $ | 782,822,955 | |
Additional sector, industry or geographic detail is included in the Portfolio of Investments.
For the year ended September 30, 2019, the Fund did not have any transfers into/out of Level 3.
4. TRANSACTIONS WITH AFFILIATES
Management fee
Funds Management, an indirect wholly owned subsidiary of Wells Fargo & Company (“Wells Fargo”), is the manager of the Fund and provides advisory and fund-level administrative services under an investment management agreement. Under the investment management agreement, Funds Management is responsible for, among other services, implementing the investment objectives and strategies of the Fund, supervising the subadviser and providing fund-level administrative services in connection with the Fund’s operations. As compensation for its services under the investment management agreement, Funds Management is entitled to receive a management fee at the following annual rate based on the Fund’s average daily net assets:
| | | | |
| |
| Average daily net assets | | Management fee | |
| |
First $500 million | | | 0.750 | % |
| |
Next $500 million | | | 0.725 | |
| |
Next $1 billion | | | 0.700 | |
| |
Next $2 billion | | | 0.675 | |
| |
Next $1 billion | | | 0.650 | |
| |
Next $5 billion | | | 0.640 | |
| |
Next $2 billion | | | 0.630 | |
| |
Next $4 billion | | | 0.620 | |
| |
Over $16 billion | | | 0.610 | |
Wells Fargo Enterprise Fund | 25
Notes to financial statements
Prior to February 1, 2019, Funds Management received a management fee at the following annual rate based on the Fund’s average daily net assets:
| | | | |
| |
| Average daily net assets | | Management fee | |
| |
First $500 million | | | 0.750 | % |
| |
Next $500 million | | | 0.725 | |
| |
Next $1 billion | | | 0.700 | |
| |
Next $2 billion | | | 0.675 | |
| |
Next $1 billion | | | 0.650 | |
| |
Next $5 billion | | | 0.640 | |
| |
Over $10 billion | | | 0.630 | |
For the year ended September 30, 2019, the management fee was equivalent to an annual rate of 0.74% of the Fund’s average daily net assets.
Funds Management has retained the services of a subadviser to provide daily portfolio management to the Fund. The fee for subadvisory services is borne by Funds Management. Wells Capital Management Incorporated (“WellsCap”), an affiliate of Funds Management and an indirect wholly owned subsidiary of Wells Fargo, is the subadviser to the Fund and is entitled to receive a fee from Funds Management at an annual rate starting at 0.45% and declining to 0.30% as the average daily net assets of the Fund increase.
Administration fees
Under a class-level administration agreement, Funds Management provides class-level administrative services to the Fund, which includes paying fees and expenses for services provided by the transfer agent, sub-transfer agents, omnibus account servicers and record-keepers. As compensation for its services under the class-level administration agreement, Funds Management receives an annual fee which is calculated based on the average daily net assets of each class as follows:
| | | | |
| |
| | | Class-level administration fee | |
| |
Class A, Class C | | | 0.21 | % |
| |
Class R6 | | | 0.03 | |
| |
Administrator Class, Institutional Class | | | 0.13 | |
Waivers and/or expense reimbursements
Funds Management has contractually waived and/or reimbursed management and administration fees to the extent necessary to maintain certain net operating expense ratios for the Fund. When each class of the Fund has exceeded its expense cap, Funds Management has waived fees and/or reimbursed expenses from fund-level expenses on a proportionate basis and then from class specific expenses. When only certain classes exceed their expense caps, waivers and/or reimbursements are applied against class specific expenses before fund-level expenses. Funds Management has committed through January 31, 2020 to waive fees and/or reimburse expenses to the extent necessary to cap the Fund’s expenses at 1.18% for Class A shares, 1.93% for Class C shares, 0.80% for Class R6 shares, 1.10% for Administrator Class shares, and 0.85% for Institutional Class shares. Prior to or after the commitment expiration date, the cap may be increased or the commitment to maintain the cap may be terminated only with the approval of the Board of Trustees.
Distribution fee
The Trust has adopted a distribution plan for Class C shares of the Fund pursuant to Rule 12b-1 under the 1940 Act. A distribution fee is charged to Class C shares and paid to Wells Fargo Funds Distributor, LLC (“Funds Distributor”), the principal underwriter, at an annual rate of 0.75% of the average daily net assets of Class C shares.
In addition, Funds Distributor is entitled to receive the front-end sales charge from the purchase of Class A shares and a contingent deferred sales charge on the redemption of certain Class A shares. Funds Distributor is also entitled to receive the contingent deferred sales charges from redemptions of Class C shares. For the year ended September 30, 2019, Funds Distributor received $4,173 from the sale of Class A shares. No contingent deferred sales charges were incurred by Class A and Class C shares for the year ended September 30, 2019.
26 | Wells Fargo Enterprise Fund
Notes to financial statements
Shareholder servicing fees
The Trust has entered into contracts with one or more shareholder servicing agents, whereby Class A, Class C, and Administrator Class of the Fund are charged a fee at an annual rate of 0.25% of the average daily net assets of each respective class. A portion of these total shareholder servicing fees were paid to affiliates of Wells Fargo.
Interfund transactions
The Fund may purchase or sell portfolio investment securities to certain other Wells Fargo affiliates pursuant to Rule 17a-7 under the 1940 Act and under procedures adopted by the Board of Trustees. The procedures have been designed to ensure that these interfund transactions, which do not incur broker commissions, are effected at current market prices.
5. INVESTMENT PORTFOLIO TRANSACTIONS
Purchases and sales of investments, excluding U.S. government obligations (if any) and short-term securities, for the year ended September 30, 2019 were $360,553,106 and $424,473,571, respectively.
6. SECURITIES LENDING TRANSACTIONS
The Fund lends its securities through an unaffiliated securities lending agent and receives collateral in the form of cash or securities with a value at least equal to the value of the securities on loan. The value of the loaned securities is determined at the close of each business day and any increases or decreases in the required collateral are exchanged between the Fund and the counterparty on the next business day. Cash collateral received is invested in the Securities Lending Fund which seeks to provide a positive return compared to the daily Fed Funds Open Rate by investing in high-quality, U.S. dollar-denominated short-term money market instruments and is exempt from registration under Section 3(c)(7) of the 1940 Act. Securities Lending Fund is managed by Funds Management and is subadvised by WellsCap. Funds Management receives an advisory fee starting at 0.05% and declining to 0.01% as the average daily net assets of the Securities Lending Fund increase. All of the fees received by Funds Management are paid to WellsCap for its services as subadviser.
In the event of counterparty default or the failure of a borrower to return a loaned security, the Fund has the right to use the collateral to offset any losses incurred. As of September 30, 2019, the Fund had securities lending transactions with the following counterparties which are subject to offset:
| | | | | | | | | | | | |
| | | |
| Counterparty | | Value of securities on loan | | | Collateral received1 | | | Net amount | |
| | | |
Barclays Capital Inc. | | $ | 8,374,312 | | | $ | (8,374,312 | ) | | $ | 0 | |
| | | |
BNP Paribas Securities Corp. | | | 1,816,344 | | | | (1,816,344 | ) | | | 0 | |
| | | |
Citigroup Global Markets Inc. | | | 2,212,765 | | | | (2,212,765 | ) | | | 0 | |
| | | |
JPMorgan Securities LLC | | | 10,044,464 | | | | (10,044,464 | ) | | | 0 | |
| | | |
Morgan Stanley & Co. LLC | | | 2,241,225 | | | | (2,241,225 | ) | | | 0 | |
| 1 | Collateral received within this table is limited to the collateral for the net transaction with the counterparty. |
7. BANK BORROWINGS
The Trust (excluding the money market funds), Wells Fargo Master Trust and Wells Fargo Variable Trust are parties to a $280,000,000 revolving credit agreement whereby the Fund is permitted to use bank borrowings for temporary or emergency purposes, such as to fund shareholder redemption requests. Interest under the credit agreement is charged to the Fund based on a borrowing rate equal to the higher of the Federal Funds rate in effect on that day plus 1.25% or the overnight LIBOR rate in effect on that day plus 1.25%. In addition, an annual commitment fee equal to 0.25% of the unused balance is allocated to each participating fund.
For the year ended September 30, 2019, there were no borrowings by the Fund under the agreement.
Wells Fargo Enterprise Fund | 27
Notes to financial statements
8. DISTRIBUTIONS TO SHAREHOLDERS
The tax character of distributions paid during the years ended September 30, 2019 and September 30, 2018 were as follows:
| | | | | | | | |
| | | Year ended September 30 | |
| | |
| | | 2019 | | | 2018 | |
| | |
Ordinary income | | $ | 14,372,015 | | | $ | 10,391,651 | |
| | |
Long-term capital gain | | | 66,482,607 | | | | 61,681,486 | |
As of September 30, 2019, the components of distributable earnings on a tax basis were as follows:
| | | | |
Undistributed long-term gain | | Late-year
ordinary losses
deferred | | Unrealized gains |
| | |
| $40,806,927 | | $(3,481,054) | | $212,461,527 |
9. CONCENTRATION RISK
Concentration risks result from exposure to a limited number of sectors. As of the end of the period, the Fund invests a concentration of its portfolio in the information technology sector. A fund that invests a substantial portion of its assets in any sector may be more affected by changes in that sector than would be a fund whose investments are not heavily weighted in any sector.
10. INDEMNIFICATION
Under the Trust’s organizational documents, the officers and Trustees have been granted certain indemnification rights against certain liabilities that may arise out of performance of their duties to the Trust. Additionally, in the normal course of business, the Trust may enter into contracts with service providers that contain a variety of indemnification clauses. The Trust’s maximum exposure under these arrangements is dependent on future claims that may be made against the Fund and, therefore, cannot be estimated.
11. NEW ACCOUNTING PRONOUNCEMENT
In August 2018, FASB issued Accounting Standards Update (“ASU”) No. 2018-13, Fair Value Measurement (Topic 820)Disclosure Framework—Changes to the Disclosure Requirements for Fair Value Measurement. ASU 2018-13 updates the disclosure requirements for fair value measurements by modifying or removing certain disclosures and adding certain new disclosures. The amendments are effective for fiscal years, and interim periods within those fiscal years, beginning after December 15, 2019. Early adoption is permitted. Management has adopted the removal and modification of disclosures early, as permitted, and will adopt the additional new disclosures at the effective date.
28 | Wells Fargo Enterprise Fund
Report of independent registered public accounting firm
TO THE SHAREHOLDERS OF THE FUND AND BOARD OF TRUSTEES OF WELLS FARGO FUNDS TRUST:
Opinion on the Financial Statements
We have audited the accompanying statement of assets and liabilities of Wells Fargo Enterprise Fund (the Fund), one of the funds constituting Wells Fargo Funds Trust, including the portfolio of investments, as of September 30, 2019, the related statement of operations for the year then ended, the statements of changes in net assets for each of the years in the two-year period then ended, and the related notes (collectively, the financial statements) and the financial highlights for each of the years or periods in the five-year period then ended. In our opinion, the financial statements and financial highlights present fairly, in all material respects, the financial position of the Fund as of September 30, 2019, the results of its operations for the year then ended, the changes in its net assets for each of the years in the two-year period then ended, and the financial highlights for each of the years or periods in the five-year period then ended, in conformity with U.S. generally accepted accounting principles.
Basis for Opinion
These financial statements and financial highlights are the responsibility of the Fund’s management. Our responsibility is to express an opinion on these financial statements and financial highlights based on our audits. We are a public accounting firm registered with the Public Company Accounting Oversight Board (United States) (PCAOB) and are required to be independent with respect to the Fund in accordance with the U.S. federal securities laws and the applicable rules and regulations of the Securities and Exchange Commission and the PCAOB.
We conducted our audits in accordance with the standards of the PCAOB. Those standards require that we plan and perform the audit to obtain reasonable assurance about whether the financial statements and financial highlights are free of material misstatement, whether due to error or fraud. Our audits included performing procedures to assess the risks of material misstatement of the financial statements and financial highlights, whether due to error or fraud, and performing procedures that respond to those risks. Such procedures included examining, on a test basis, evidence regarding the amounts and disclosures in the financial statements and financial highlights. Such procedures also included confirmation of securities owned as of September 30, 2019, by correspondence with the custodian and transfer agent. Our audits also included evaluating the accounting principles used and significant estimates made by management, as well as evaluating the overall presentation of the financial statements and financial highlights. We believe that our audits provide a reasonable basis for our opinion.

We have not been able to determine the specific year that we began serving as the auditor of one or more Wells Fargo Funds investment companies; however we are aware that we have served as the auditor of one or more Wells Fargo Funds investment companies since at least 1955.
Boston, Massachusetts
November 25, 2019
Wells Fargo Enterprise Fund | 29
Other information (unaudited)
TAX INFORMATION
For corporate shareholders, pursuant to Section 854 of the Internal Revenue Code, 17.90% of ordinary income dividends qualify for the corporate dividends-received deduction for the fiscal year ended September 30, 2019.
Pursuant to Section 852 of the Internal Revenue Code, $66,482,607 was designated as a 20% rate gain distribution for the fiscal year ended September 30, 2019.
Pursuant to Section 854 of the Internal Revenue Code, $3,144,597 of income dividends paid during the fiscal year ended September 30, 2019 has been designated as qualified dividend income (QDI).
For the fiscal year ended September 30, 2019, $14,372,015 has been designated as short-term capital gain dividends for nonresident alien shareholders pursuant to Section 871 of the Internal Revenue Code.
PROXY VOTING INFORMATION
A description of the policies and procedures used to determine how to vote proxies relating to portfolio securities is available, upon request, by calling1-800-222-8222, visiting our website atwfam.com, or visiting the SEC website at sec.gov. Information regarding how the proxies related to portfolio securities were voted during the most recent 12-month period ended June 30 is available on the website atwfam.comor by visiting the SEC website at sec.gov.
QUARTERLY PORTFOLIO HOLDINGS INFORMATION
The Fund files its complete schedule of portfolio holdings with the SEC for the first and third quarters of each fiscal year on Form N-Q or Form N-PORT, which is available by visiting the SEC website at sec.gov. Those forms may be reviewed and copied at the SEC’s Public Reference Room in Washington, DC. Information on the operation of the Public Reference Room may be obtained bycalling 1-800-SEC-0330.
30 | Wells Fargo Enterprise Fund
Other information (unaudited)
BOARD OF TRUSTEES AND OFFICERS
Each of the Trustees and Officers1 listed in the table below acts in identical capacities for each fund in the Wells Fargo family of funds, which consists of 150 mutual funds comprising the Wells Fargo Funds Trust, Wells Fargo Variable Trust, Wells Fargo Master Trust and four closed-end funds (collectively the “Fund Complex”). This table should be read in conjunction with the Prospectus and the Statement of Additional Information2. The mailing address of each Trustee and Officer is 525 Market Street, 12th Floor, San Francisco, CA 94105. Each Trustee and Officer serves an indefinite term, however, each Trustee serves such term until reaching the mandatory retirement age established by the Trustees.
Independent Trustees
| | | | | | |
Name and year of birth | | Position held and length of service* | | Principal occupations during past five years or longer | | Current other public company or investment company directorships |
| | | |
William R. Ebsworth (Born 1957) | | Trustee, since 2015 | | Retired. From 1984 to 2013, equities analyst, portfolio manager, research director and chief investment officer at Fidelity Management and Research Company in Boston, Tokyo, and Hong Kong, and retired in 2013 as Chief Investment Officer of Fidelity Strategic Advisers, Inc. where he led a team of investment professionals managing client assets. Prior thereto, Board member of Hong Kong Securities Clearing Co., Hong Kong Options Clearing Corp., the Thailand International Fund, Ltd., Fidelity Investments Life Insurance Company, and Empire Fidelity Investments Life Insurance Company. Audit Committee Chair and Investment Committee Chair of the Vincent Memorial Hospital Endowment (non-profit organization). Mr. Ebsworth is a CFA® charterholder. | | N/A |
| | | |
Jane A. Freeman (Born 1953) | | Trustee, since 2015; Chair Liaison, since 2018 | | Retired. From 2012 to 2014 and 1999 to 2008, Chief Financial Officer of Scientific Learning Corporation. From 2008 to 2012, Ms. Freeman provided consulting services related to strategic business projects. Prior to 1999, Portfolio Manager at Rockefeller & Co. and Scudder, Stevens & Clark. Board member of the Harding Loevner Funds from 1996 to 2014, serving as both Lead Independent Director and chair of the Audit Committee. Board member of the Russell Exchange Traded Funds Trust from 2011 to 2012 and the chair of the Audit Committee. Ms. Freeman is a Board Member of The Ruth Bancroft Garden (non-profit organization). She is also an inactive Chartered Financial Analyst. | | N/A |
| | | |
Isaiah Harris, Jr. (Born 1952) | | Trustee, since 2009; Audit Committee Chairman, since 2019 | | Retired. Chairman of the Board of CIGNA Corporation since 2009, and Director since 2005. From 2003 to 2011, Director of Deluxe Corporation. Prior thereto, President and CEO of BellSouth Advertising and Publishing Corp. from 2005 to 2007, President and CEO of BellSouth Enterprises from 2004 to 2005 and President of BellSouth Consumer Services from 2000 to 2003. Emeritus member of the Iowa State University Foundation Board of Governors. Emeritus Member of the Advisory Board of Iowa State University School of Business. Advisory Board Member, Palm Harbor Academy (private school). Advisory Board Member, Child Evangelism Fellowship (non-profit). Mr. Harris is a certified public accountant (inactive status). | | CIGNA Corporation |
| | | |
Judith M. Johnson (Born 1949) | | Trustee, since 2008; Audit Committee Chairman, from 2009 to 2018 | | Retired. Prior thereto, Chief Executive Officer and Chief Investment Officer of Minneapolis Employees Retirement Fund from 1996 to 2008. Ms. Johnson is an attorney, certified public accountant and a certified managerial accountant. | | N/A |
Wells Fargo Enterprise Fund | 31
Other information (unaudited)
| | | | | | |
Name and year of birth | | Position held and length of service* | | Principal occupations during past five years or longer | | Current other public company or investment company directorships |
| | | |
David F. Larcker (Born 1950) | | Trustee, since 2009 | | James Irvin Miller Professor of Accounting at the Graduate School of Business, Stanford University, Director of the Corporate Governance Research Initiative and Senior Faculty of The Rock Center for Corporate Governance since 2006. From 2005 to 2008, Professor of Accounting at the Graduate School of Business, Stanford University. Prior thereto, Ernst & Young Professor of Accounting at The Wharton School, University of Pennsylvania from 1985 to 2005. | | N/A |
| | | |
Olivia S. Mitchell (Born 1953) | | Trustee, since 2006; Nominating and Governance Committee Chairman, since 2018 | | International Foundation of Employee Benefit Plans Professor, Wharton School of the University of Pennsylvania since 1993. Director of Wharton’s Pension Research Council and Boettner Center on Pensions & Retirement Research, and Research Associate at the National Bureau of Economic Research. Previously, Cornell University Professor from 1978 to 1993. | | N/A |
| | | |
Timothy J. Penny (Born 1951) | | Trustee, since 1996; Chairman, since 2018 | | President and Chief Executive Officer of Southern Minnesota Initiative Foundation, a non-profit organization, since 2007. Member of the Board of Trustees of NorthStar Education Finance, Inc., a non-profit organization, since 2007. | | N/A |
| | | |
James G. Polisson (Born 1959) | | Trustee, since 2018 | | Retired. Chief Marketing Officer, Source (ETF) UK Services, Ltd, from 2015 to 2017. From 2012 to 2015, Principal of The Polisson Group, LLC, a management consulting, corporate advisory and principal investing company. Chief Executive Officer and Managing Director at Russell Investments, Global Exchange Traded Funds from 2010 to 2012. Managing Director of Barclays Global Investors from 1998 to 2010 and Global Chief Marketing Officer for iShares and Barclays Global Investors from 2000 to 2010. Trustee of the San Francisco Mechanics’ Institute, a non-profit organization, from 2013 to 2015. Board member of the Russell Exchange Traded Fund Trust from 2011 to 2012. Director of Barclays Global Investors Holdings Deutschland GmbH from 2006 to 2009. Mr. Polisson is an attorney and has a retired status with the Massachusetts and District of Columbia Bar Associations. | | N/A |
| * | Length of service dates reflect the Trustee’s commencement of service with the Trust’s predecessor entities, where applicable. |
32 | Wells Fargo Enterprise Fund
Other information (unaudited)
Officers
| | | | |
Name and year of birth | | Position held and length of service | | Principal occupations during past five years or longer |
| | |
Andrew Owen (Born 1960) | | President, since 2017 | | Executive Vice President of Wells Fargo & Company and Head of Affiliated Managers, Wells Fargo Asset Management, since 2014. In addition, Mr. Owen is currently President, Chief Executive Officer and Director of Wells Fargo Funds Management, LLC since 2017. Prior thereto, Executive Vice President responsible for marketing, investments and product development for Wells Fargo Funds Management, LLC, from 2009 to 2014. |
| | |
Nancy Wiser1 (Born 1967) | | Treasurer, since 2012 | | Executive Vice President of Wells Fargo Funds Management, LLC since 2011. Chief Operating Officer and Chief Compliance Officer at LightBox Capital Management LLC, from 2008 to 2011. |
| | |
Michelle Rhee3 (Born 1966) | | Chief Legal Officer, since 2019 | | Secretary of Wells Fargo Funds Management, LLC, Chief Legal Counsel of Wells Fargo Asset Management and Assistant General Counsel of Wells Fargo Bank, N.A. since 2018. Associate General Counsel and Managing Director of Bank of America Corporation from 2004 to 2018. |
| | |
Catherine Kennedy4 (Born 1969) | | Secretary, since 2019 | | Vice President of Wells Fargo Funds Management, LLC and Senior Counsel of the Wells Fargo Legal Department since 2010. Vice President and Senior Counsel of Evergreen Investment Management Company, LLC from 1998 to 2010. |
| | |
Michael H. Whitaker (Born 1967) | | Chief Compliance Officer, since 2016 | | Chief Compliance Officer of Wells Fargo Asset Management since 2016. Senior Vice President and Chief Compliance Officer for Fidelity Investments from 2007 to 2016. |
| | |
David Berardi (Born 1975) | | Assistant Treasurer, since 2009 | | Vice President of Wells Fargo Funds Management, LLC since 2009. Vice President of Evergreen Investment Management Company, LLC from 2008 to 2010. Manager of Fund Reporting and Control for Evergreen Investment Management Company, LLC from 2004 to 2010. |
| | |
Jeremy DePalma1 (Born 1974) | | Assistant Treasurer, since 2009 | | Senior Vice President of Wells Fargo Funds Management, LLC since 2009. Senior Vice President of Evergreen Investment Management Company, LLC from 2008 to 2010 and head of the Fund Reporting and Control Team within Fund Administration from 2005 to 2010. |
| 1 | Nancy Wiser acts as Treasurer of 64 funds in the Fund Complex. Jeremy DePalma acts as Treasurer of 86 funds and Assistant Treasurer of 64 funds in the Fund Complex. |
| 2 | The Statement of Additional Information includes additional information about the Trustees and is available, without charge, upon request, by calling 1-800-222-8222 or by visiting the website atwfam.com. |
| 3 | Michelle Rhee became Chief Legal Officer effective October 22, 2019. |
| 4 | Catherine Kennedy became Secretary effective October 22, 2019. |
Wells Fargo Enterprise Fund | 33
Other information (unaudited)
BOARD CONSIDERATION OF INVESTMENT MANAGEMENT AND SUB-ADVISORY AGREEMENTS:
Wells Fargo Enterprise Fund
Under the Investment Company Act of 1940 (the “1940 Act”), the Board of Trustees (the “Board”) of Wells Fargo Funds Trust (the “Trust”) must determine annually whether to approve the continuation of the Trust’s investment management andsub-advisory agreements. In this regard, at an in-person meeting held on May 21-22, 2019 (the “Meeting”), the Board, all the members of which have no direct or indirect interest in the investment management and sub-advisory agreements and are not “interested persons” of the Trust, as defined in the 1940 Act (the “Independent Trustees”), reviewed and approved for Wells Fargo Enterprise Fund (the “Fund”): (i) an investment management agreement (the “Management Agreement”) with Wells Fargo Funds Management, LLC (“Funds Management”); and (ii) an investment sub-advisory agreement (the“Sub-Advisory Agreement”) with Wells Capital Management Incorporated (the “Sub-Adviser”), an affiliate of Funds Management. The Management Agreement and the Sub-Advisory Agreement are collectively referred to as the “Advisory Agreements.”
At the Meeting, the Board considered the factors and reached the conclusions described below relating to the selection of Funds Management and the Sub-Adviser and the approval of the Advisory Agreements. Prior to the Meeting, including at anin-person meeting in April 2019, the Trustees conferred extensively among themselves and with representatives of Funds Management about these matters. Also, the Board has adopted a team-based approach, with each team consisting of a sub-set of Trustees, to assist the full Board in the discharge of its duties in reviewing investment performance and other matters throughout the year. The Independent Trustees were assisted in their evaluation of the Advisory Agreements by independent legal counsel, from whom they received separate legal advice and with whom they met separately.
In providing information to the Board, Funds Management and the Sub-Adviser were guided by a detailed set of requests for information submitted to them by independent legal counsel on behalf of the Independent Trustees at the start of the Board’s annual contract renewal process earlier in 2019. In considering and approving the Advisory Agreements, the Trustees considered the information they believed relevant, including but not limited to the information discussed below. The Board considered not only the specific information presented in connection with the Meeting, but also the knowledge gained over time through interaction with Funds Management and the Sub-Adviser about various topics. In this regard, the Board reviewed reports of Funds Management at each of its quarterly meetings, which included, among other things, portfolio reviews and investment performance reports. In addition, the Board and the teams mentioned above confer with portfolio managers at various times throughout the year. The Board did not identify any particular information or consideration that was all-important or controlling, and each individual Trustee may have attributed different weights to various factors.
After its deliberations, the Board unanimously approved the continuation of the Advisory Agreements for a one-year term and determined that the compensation payable to Funds Management and the Sub-Adviser under each of the Advisory Agreements was reasonable. The Board considered the approval of the Advisory Agreements for the Fund as part of its consideration of agreements for funds across the complex, but its approvals were made on a fund-by-fund basis. The following summarizes a number of important, but not necessarily all, factors considered by the Board in support of its approvals.
Nature, extent and quality of services
The Board received and considered various information regarding the nature, extent and quality of services provided to the Fund by Funds Management and the Sub-Adviser under the Advisory Agreements. This information included a description of the investment advisory services and Fund-level administrative services covered by the Management Agreement, as well as, among other things, a summary of the background and experience of senior management of Wells Fargo Asset Management (“WFAM”), of which Funds Management and the Sub-Adviser are a part, a summary of investments made in the business of WFAM, a summary of certain organizational and personnel changes involving Funds Management and the Sub-Adviser, and a description of Funds Management’s and the Sub-Adviser’s business continuity planning programs and of their approaches to data privacy and cybersecurity. The Board received and reviewed information about Funds Management’s role as administrator of the Fund’s liquidity risk management program. The Board also considered the qualifications, background, tenure and responsibilities of each of the portfolio managers primarily responsible for the day-to-day portfolio management of the Fund.
The Board evaluated the ability of Funds Management and the Sub-Adviser to attract and retain qualified investment professionals, including research, advisory and supervisory personnel. The Board further considered the compliance programs and compliance records of Funds Management and the Sub-Adviser. In addition, the Board took into account the full range of services provided to the Fund by Funds Management and its affiliates.
34 | Wells Fargo Enterprise Fund
Other information (unaudited)
Fund investment performance and expenses
The Board considered the investment performance results for the Fund over various time periods ended December 31, 2018. The Board considered these results in comparison to the investment performance of funds in a universe that was determined by Broadridge Inc. (“Broadridge”) to be similar to the Fund (the “Universe”), and in comparison to the Fund’s benchmark index and to other comparative data. Broadridge is an independent provider of investment company data. The Board received a description of the methodology used by Broadridge to select the mutual funds in the performance Universe. The Board noted that the investment performance of the Fund (Administrator Class) was in range of the average investment performance of the Universe for the three- and ten-year periods under review, but lower than the average investment performance of the Universe for the one- and five-year periods under review. The Board also noted that the investment performance of the Fund was lower than its benchmark index, the Russell Midcap® Growth Index, for all periods under review.
The Board received information concerning, and discussed factors contributing to, the underperformance of the Fund relative to the Universe and benchmark for the periods identified above. The Board took note of the explanations for the relative underperformance during these periods, including with respect to investment decisions and market factors that affected the Fund’s investment performance.
The Board also received and considered information regarding the Fund’s net operating expense ratios and their various components, including actual management fees, custodian and other non-management fees, and Rule 12b-1 and non-Rule 12b-1 shareholder service fees. The Board considered these ratios in comparison to the median ratios of funds in class-specific expense groups that were determined by Broadridge to be similar to the Fund (the “Groups”). The Board received a description of the methodology used by Broadridge to select the mutual funds in the expense Groups and an explanation of how funds comprising expense groups and their expense ratios may vary from year-to-year. Based on the Broadridge reports, the Board noted that the net operating expense ratios of the Fund were equal to or in range of the median net operating expense ratios of the expense Groups for each share class.
The Board took into account the Fund’s investment performance and expense information provided to it among the factors considered in deciding to re-approve the Advisory Agreements.
Investment management and sub-advisory fee rates
The Board reviewed and considered the contractual fee rates payable by the Fund to Funds Management under the Management Agreement, as well as the contractual fee rates payable by the Fund to Funds Management for class-level administrative services under a Class-Level Administration Agreement, which include, among other things, class-level transfer agency and sub-transfer agency costs (collectively, the “Management Rates”). The Board also reviewed and considered the contractual investmentsub-advisory fee rates that are payable by Funds Management to the Sub-Adviser for investment sub-advisory services.
Among other information reviewed by the Board was a comparison of the Fund’s Management Rates with the average contractual investment management fee rates of funds in the expense Groups at a common asset level as well as transfer agency costs of the funds in the expense Groups. The Board noted that the Management Rates of the Fund were in range of the sum of these average rates for the Fund’s expense Groups for all share classes.
The Board also received and considered information about the portion of the total management fee that was retained by Funds Management after payment of the fee to the Sub-Adviser for sub-advisory services. In assessing the reasonableness of this amount, the Board received and evaluated information about the nature and extent of responsibilities retained and risks assumed by Funds Management and not delegated to or assumed by the Sub-Adviser, and about Funds Management’son-going oversight services. Given the affiliation between Funds Management and the Sub-Adviser, the Board ascribed limited relevance to the allocation of fees between them.
The Board also received and considered information about the nature and extent of services offered and fee rates charged by Funds Management and the Sub-Adviser to other types of clients with investment strategies similar to those of the Fund. In this regard, the Board received information about the significantly greater scope of services, and compliance, reporting and other legal burdens and risks of managing proprietary mutual funds compared with those associated with managing assets of other types of clients, including third-party sub-advised fund clients and non-mutual fund clients such as institutional separate accounts.
Based on its consideration of the factors and information it deemed relevant, including those described here, the Board determined that the compensation payable to Funds Management under the Management Agreement and to the Sub-Adviser under the Sub-Advisory Agreement was reasonable.
Wells Fargo Enterprise Fund | 35
Other information (unaudited)
Profitability
The Board received and considered information concerning the profitability of Funds Management, as well as the profitability of both WFAM and Wells Fargo & Co. (“Wells Fargo”) from providing services to the fund family as a whole. The Board noted that the Sub-Adviser’s profitability information with respect to providing services to the Fund and other funds in the family was subsumed in the WFAM and Wells Fargo profitability analysis.
Funds Management reported on the methodologies and estimates used in calculating profitability, including a description of the methodology used to allocate certain expenses. Among other things, the Board noted that the levels of profitability reported on a fund-by-fund basis varied widely, depending on factors such as the size, type and age of fund. Based on its review, the Board did not deem the profits reported by Funds Management, WFAM or Wells Fargo from services provided to the Fund to be at a level that would prevent it from approving the continuation of the Advisory Agreements.
Economies of scale
The Board received and considered information about the potential for Funds Management to experience economies of scale in the provision of management services to the Fund, the difficulties of calculating economies of scale at an individual fund level, and the extent to which potential scale benefits are shared with shareholders. The Board noted the existence of breakpoints in the Fund’s management fee structure, which operate generally to reduce the Fund’s expense ratios as the Fund grows in size. The Board considered that in addition to management fee breakpoints, Funds Management shares potential economies of scale from its management business in a variety of ways, including through fee waiver and expense reimbursement arrangements, services that benefit shareholders, competitive management fee rates set at the outset without regard to breakpoints, and investments in the business intended to enhance services available to shareholders.
The Board concluded that Funds Management’s arrangements with respect to the Fund, including contractual breakpoints, constituted a reasonable approach to sharing potential economies of scale with the Fund and its shareholders.
Other benefits to Funds Management and the Sub-Adviser
The Board received and considered information regarding potential “fall-out” or ancillary benefits received by Funds Management and its affiliates, including the Sub-Adviser, as a result of their relationships with the Fund. Ancillary benefits could include, among others, benefits directly attributable to other relationships with the Fund and benefits potentially derived from an increase in Funds Management’s and the Sub-Adviser’s business as a result of their relationships with the Fund. The Board noted that various affiliates of Funds Management may receive distribution-related fees, shareholder servicing payments and sub-transfer agency fees in respect of shares sold or held through them and services provided.
The Board also reviewed information about soft dollar credits earned and utilized by the Sub-Adviser, fees earned by Funds Management and the Sub-Adviser from managing a private investment vehicle for the fund family’s securities lending collateral, and commissions earned by an affiliated broker from portfolio transactions.
Based on its consideration of the factors and information it deemed relevant, including those described here, the Board did not find that any ancillary benefits received by Funds Management and its affiliates, including the Sub-Adviser, were unreasonable.
Conclusion
At the Meeting, after considering the above-described factors and based on its deliberations and its evaluation of the information described above, the Board unanimously approved the continuation of the Advisory Agreements for a one-year term and determined that the compensation payable to Funds Management and the Sub-Adviser under each of the Advisory Agreements was reasonable.
36 | Wells Fargo Enterprise Fund

For more information
More information about Wells Fargo Funds is available free upon request. To obtain literature, please write, visit the Fund’s website, or call:
Wells Fargo Funds
P.O. Box 219967
Kansas City, MO 64121-9967
Website:wfam.com
Individual investors:1-800-222-8222
Retail investment professionals:1-888-877-9275
Institutional investment professionals:1-866-765-0778

This report and the financial statements contained herein are submitted for the general information of the shareholders of the Fund. If this report is used for promotional purposes, distribution of the report must be accompanied or preceded by a current prospectus. Before investing, please consider the investment objectives, risks, charges, and expenses of the investment. For a current prospectus and, if available, a summary prospectus, containing this information, call1-800-222-8222 or visit the Fund’s website atwfam.com. Read the prospectus carefully before you invest or send money.
Wells Fargo Asset Management (WFAM) is the trade name for certain investment advisory/management firms owned by Wells Fargo & Company. These firms include but are not limited to Wells Capital Management Incorporated and Wells Fargo Funds Management, LLC. Certain products managed by WFAM entities are distributed by Wells Fargo Funds Distributor, LLC (a broker-dealer and Member FINRA).
This material is for general informational and educational purposes only and is NOT intended to provide investment advice or a recommendation of any kind—including a recommendation for any specific investment, strategy, or plan.
INVESTMENT PRODUCTS: NOT FDIC INSURED ◾ NO BANK GUARANTEE ◾ MAY LOSE VALUE
© 2019 Wells Fargo & Company. All rights reserved.
406815 11-19
A231/AR231 09-19
Annual Report
September 30, 2019
Wells Fargo Opportunity Fund
Beginning on January 1, 2021, as permitted by new regulations adopted by the Securities and Exchange Commission, paper copies of the Wells Fargo Funds’ annual and semi-annual shareholder reports issued after this date will no longer be sent by mail, unless you specifically request paper copies of the reports. Instead, the reports will be made available on the Funds’ website, and you will be notified by mail each time a report is posted and provided with a website address to access the report.
If you already elected to receive shareholder reports electronically, you will not be affected by this change and you need not take any action. You may elect to receive shareholder reports and other communications from the Fund electronically at any time by contacting your financial intermediary (such as a broker-dealer or bank) or, if you are a direct investor, by calling1-800-222-8222 or by enrolling at wellsfargo.com/advantagedelivery.
You may elect to receive all future reports in paper free of charge. If you invest through a financial intermediary, you can contact your financial intermediary to request that you continue to receive paper copies of your shareholder reports; if you invest directly with the Fund, you can call 1-800-222-8222. Your election to receive reports in paper will apply to all Wells Fargo Funds held in your account with your financial intermediary or, if you are a direct investor, to all Wells Fargo Funds that you hold.
|
|
|
Reduce clutter. Save trees. |
Sign up for electronic delivery of prospectuses and shareholder reports atwellsfargo.com/advantagedelivery |
The views expressed and any forward-looking statements are as of September 30, 2019, unless otherwise noted, and are those of the Fund managers and/or Wells Fargo Asset Management. Discussions of individual securities, or the markets generally, or any Wells Fargo Fund are not intended as individual recommendations. Future events or results may vary significantly from those expressed in any forward-looking statements. The views expressed are subject to change at any time in response to changing circumstances in the market. Wells Fargo Asset Management and the Fund disclaim any obligation to publicly update or revise any views expressed or forward-looking statements.
INVESTMENT PRODUCTS: NOT FDIC INSURED ◾ NO BANK GUARANTEE ◾ MAY LOSE VALUE
Wells Fargo Opportunity Fund | 1
Letter to shareholders (unaudited)

Andrew Owen
President
Wells Fargo Funds
“December’s S&P 500 Index performance was the worst since 1931.”
Dear Shareholder:
We are pleased to offer you this annual report for the Wells Fargo Opportunity Fund for the 12-month period that ended September 30, 2019. After the first half of the period yielded either low-single-digit or negative investment returns, U.S. stock and global bond investors generally saw markets recover during the second half amid intensifying market volatility, global economic growth concerns, international trade stare downs, and simmering geopolitical tensions.
Overall, fixed-income investors enjoyed a distinct advantage over stock investors. For the period, U.S. stocks, based on the S&P 500 Index,1 gained 4.25% and international stocks, as measured by the MSCI ACWI ex USA Index (Net),2 fell 1.23%. The MSCI EM Index (Net)3 slipped 2.02%. Among fixed income investors, the Bloomberg Barclays U.S. Aggregate Bond Index4 added 10.30%, the Bloomberg Barclays Global Aggregateex-USD Index5 added 5.34%, the Bloomberg Barclays Municipal Bond Index6 gained 8.55%, and the ICE BofAML U.S. High Yield Index7 added 6.30%.
Investors confronted unsettling events during the fourth quarter of 2018.
During the fourth quarter of 2018, investors grew concerned about the pace and sustainability of the global economic expansion. The U.S. Bureau of Economic Analysis reported third-quarter U.S. gross domestic product (GDP) was 3.4% on an annualized basis, which was down from the second-quarter rate. A partial U.S. government shutdown occurred, which extended into January 2019. Brexit efforts stalled, causing uncertainty for the eurozone. The value of the renminbi declined even as the People’s Bank of China cut reserve requirement ratios, accelerated infrastructure spending, and cut taxes in efforts to spur economic activity.
The combination of news in the U.S. and generally weak economic indicators outside of the U.S. caused investors to seek safe havens. December’s S&P 500 Index performance was the worst since 1931. Globally, fixed-income investments fared better than stocks during the last two months of the year. Even as indicators suggested growth was restrained, the U.S. Federal Reserve (Fed) increased the federal funds rate by 25 basis points (bps; 100 bps equal 1.00%) in December 2018 to a target range of between 2.25% and 2.50%. Many observers expressed concerns that higher rates could slow the economy further.
| 1 | The S&P 500 Index consists of 500 stocks chosen for market size, liquidity, and industry group representation. It is a market-value-weighted index with each stock’s weight in the index proportionate to its market value. You cannot invest directly in an index. |
| 2 | The Morgan Stanley Capital International (MSCI) All Country World Index (ACWI) ex USA Index (Net) is a free-float-adjusted market-capitalization weighted index that is designed to measure the equity market performance of developed and emerging markets, excluding the U.S. Source: MSCI. MSCI makes no express or implied warranties or representations and shall have no liability whatsoever with respect to any MSCI data contained herein. The MSCI data may not be further redistributed or used as a basis for other indices or any securities or financial products. This report is not approved, reviewed, or produced by MSCI. You cannot invest directly in an index. |
| 3 | The MSCI Emerging Markets (EM) Index (Net) is a free-float-adjusted market-capitalization-weighted index that is designed to measure the equity market performance of emerging markets. You cannot invest directly in an index. |
| 4 | The Bloomberg Barclays U.S. Aggregate Bond Index is a broad-based benchmark that measures the investment-grade, U.S. dollar-denominated, fixed-rate taxable bond market, including Treasuries, government-related and corporate securities, mortgage-backed securities (agency fixed-rate and hybrid adjustable-rate mortgage pass-throughs), asset-backed securities, and commercial mortgage-backed securities. You cannot invest directly in an index. |
| 5 | The Bloomberg Barclays Global Aggregate ex-USD Index is an unmanaged index that provides a broad-based measure of the global investment-grade fixed-income markets excluding the U.S. dollar-denominated debt market. You cannot invest directly in an index. |
| 6 | The Bloomberg Barclays Municipal Bond Index is an unmanaged index composed of long-term tax-exempt bonds with a minimum credit rating of Baa. You cannot invest directly in an index. |
| 7 | The ICE BofAML U.S. High Yield Index is a market-capitalization-weighted index of domestic and Yankee high-yield bonds. The index tracks the performance of high-yield securities traded in the U.S. bond market. You cannot invest directly in an index. Copyright 2019. ICE Data Indices, LLC. All rights reserved. |
2 | Wells Fargo Opportunity Fund
Letter to shareholders (unaudited)
The market climbs a wall of worry.
Investment returns early in 2019 appeared to reaffirm the adage that markets climb a wall of worry as the new year began. The S&P 500 Index gained 8.01% for the month of January, the best monthly performance in 30 years. Returns for the MSCI ACWI ex USA Index (Net), the Bloomberg Barclays U.S. Aggregate Bond Index, and the Bloomberg Barclays Global Aggregate ex-USD Index also were positive.
In February 2019, signs of slowing global growth grew more ominous. The Bureau of Economic Analysis announced fourth-quarter 2018 GDP grew at an annualized 2.2% rate, a slower rate than reported for the prior two quarters. In a February report, the Bank of England forecast the slowest growth for 2019 since the financial crisis. China and the U.S. continued to wrangle over trade issues. By the end of the first quarter of 2019, more accommodative Fed sentiment and steady, if not spectacular, U.S. economic and business metrics encouraged domestic investors.
Early second-quarter 2019 enthusiasm among investors faded.
During April 2019, favorable sentiment found additional support in reports of sustained low inflation, solid employment data, and first-quarter U.S. GDP of an annualized rate of 3.2%. During May, markets tumbled on mixed investment signals. In the U.S., partisan wrangling ramped up as Democrats and Republicans set their sights on 2020 presidential politics. The U.K.’s Brexit disagreements caused Prime Minister Theresa May to resign. Boris Johnson succeeded her only to exacerbate uncertainty about Brexit’s resolution ahead of an October 2019 deadline. The European Commission downgraded the 2019 growth forecast to 1.2%. The U.S. increased tariffs on products from China, China responded, and then talks broke down. President Donald Trump threatened to turn his foreign policy tariff tool to Mexico over immigration issues.
During the third quarter of 2019, investors regrouped. Just as the investment horizon appeared to darken, sentiment turned and U.S. equity markets gained during June and July. The gains, primarily driven by geopolitical and monetary policy events, pushed equity markets to new highs. European Central Bank President Mario Draghi said that if the outlook doesn’t improve, the bank would cut rates or buy more assets to prop up inflation. President Trump backed off of tariff threats against Mexico and China. In the U.S., the Fed implemented a 0.25% federal funds rate cut in July.
Later in July 2019, the U.S. reversed course and threatened to impose higher tariffs on China’s exports after talks failed. China responded with tariff threats of its own and devalued the renminbi, a move that roiled global markets. Major U.S. stock market indices closed July with the worst weekly results of the year. Bond prices gained as Treasury yields fell to levels not seen since November 2016 and the yield curve inverted at multiple points along the 30-year arc.
In a microcosm, August 2019 encapsulated many of the unnerving events that plagued investors during the prior 11 months. The U.S.-China trade relationship swung from antagonistic to hopeful and back again with no evident compromise on the horizon. Evidence of a continued global economic slowdown mounted. Central banks in China, New Zealand, and Thailand cut interest rates. Industrial and manufacturing data declined in China, Canada, Japan, and Germany. Adding to the uncertain environment, Italy’s prime minister resigned, many feared a crackdown in Hong Kong as protesters sustained their calls for reform throughout the month, and Boris Johnson planned to suspend Parliament as Brexit’s deadline neared.
In the U.S., September saw the Fed join other central banks in cutting interest rates. Manufacturing data in the U.S., as reported by the Institute for Supply Management, disappointed investors. The U.S. Congress announced it would pursue an impeachment investigation of President Trump. Meanwhile, the Brexit impasse showed no signs of
“The S&P 500 Index gained 8.01% for the month of January, the best monthly performance in 30 years.”
Wells Fargo Opportunity Fund | 3
Letter to shareholders (unaudited)
|
|
|
For further information about your Fund, contact your investment professional, visit our website at wfam.com, or call us directly at1-800-222-8222. |
resolution. Officials in China said that hitting the country’s economic growth goals for the year would be difficult considering the weight of tariffs and trade restrictions. So while the S&P 500 Index finished the third quarter with year-to-date returns that were the best in more than 20 years, amid signs of equity investors taking money out of the stock market, concerns about future returns remained.
Don’t let short-term uncertainty derail long-term investment goals.
Periods of investment uncertainty can present challenges, but experience has taught us that maintaining long-term investment goals can be an effective way to plan for the future. To help you create a sound strategy based on your personal goals and risk tolerance, Wells Fargo Funds offers more than 100 mutual funds spanning a wide range of asset classes and investment styles. Although diversification cannot guarantee an investment profit or prevent losses, we believe it can be an effective way to manage investment risk and potentially smooth out overall portfolio performance. We encourage investors to know their investments and to understand that appropriate levels of risk-taking may potentially unlock opportunities.
Thank you for choosing to invest with Wells Fargo Funds. We appreciate your confidence in us and remain committed to helping you meet your financial needs.
Sincerely,

Andrew Owen
President
Wells Fargo Funds
4 | Wells Fargo Opportunity Fund
This page is intentionally left blank.
Performance highlights (unaudited)
Investment objective
The Fund seeks long-term capital appreciation.
Manager
Wells Fargo Funds Management, LLC
Subadviser
Wells Capital Management Incorporated
Portfolio managers
Ann M. Miletti
Christopher G. Miller, CFA®‡
Average annual total returns (%) as of September 30, 2019
| | | | | | | | | | | | | | | | | | | | | | | | | | | | | | | | | | |
| | | | |
| | | | | Including sales charge | | | Excluding sales charge | | | Expense ratios1 (%) | |
| | | | | | | | | |
| | | Inception date | | 1 year | | | 5 year | | | 10 year | | | 1 year | | | 5 year | | | 10 year | | | Gross | | | Net2 | |
| | | | | | | | | | |
| Class A (SOPVX) | | 2-24-2000 | | | -0.87 | | | | 7.89 | | | | 10.46 | | | | 5.18 | | | | 9.17 | | | | 11.12 | | | | 1.20 | | | | 1.18 | |
| | | | | | | | | | |
| Class C (WFOPX) | | 3-31-2008 | | | 3.37 | | | | 8.35 | | | | 10.29 | | | | 4.37 | | | | 8.35 | | | | 10.29 | | | | 1.95 | | | | 1.93 | |
| | | | | | | | | | |
| Administrator Class (WOFDX) | | 8-30-2002 | | | – | | | | – | | | | – | | | | 5.37 | | | | 9.39 | | | | 11.37 | | | | 1.12 | | | | 1.00 | |
| | | | | | | | | | |
| Institutional Class (WOFNX)3 | | 7-30-2010 | | | – | | | | – | | | | – | | | | 5.63 | | | | 9.67 | | | | 11.61 | | | | 0.87 | | | | 0.75 | |
| | | | | | | | | | |
| Russell 3000® Index4 | | – | | | – | | | | – | | | | – | | | | 2.92 | | | | 10.44 | | | | 13.08 | | | | – | | | | – | |
Figures quoted represent past performance, which is no guarantee of future results,and do not reflect taxes that a shareholder may pay on fund distributions or the redemption of fund shares. Investment return and principal value of an investment will fluctuate so that an investor’s shares, when redeemed, may be worth more or less than their original cost. Performance shown without sales charges would be lower if sales charges were reflected. Current performance may be lower or higher than the performance data quoted, which assumes the reinvestment of dividends and capital gains. Currentmonth-end performance is available on the Fund’s website,wfam.com.
Index returns do not include transaction costs associated with buying and selling securities, any mutual fund fees or expenses, or any taxes. It is not possible to invest directly in an index.
For Class A shares, the maximumfront-end sales charge is 5.75%. For Class C shares, the maximum contingent deferred sales charge is 1.00%. Performance including a contingent deferred sales charge assumes the sales charge for the corresponding time period. Administrator Class and Institutional Class shares are sold without afront-end sales charge or contingent deferred sales charge.
Stock values fluctuate in response to the activities of individual companies and general market and economic conditions. Smaller-company stocks tend to be more volatile and less liquid than those of larger companies. Certain investment strategies tend to increase the total risk of an investment (relative to the broader market). The Fund is exposed to foreign investment risk. Consult the Fund’s prospectus for additional information on these and other risks.
Please see footnotes on page 7.
6 | Wells Fargo Opportunity Fund
Performance highlights (unaudited)
|
|
| Growth of $10,000 investment as of September 30, 20195 |
|
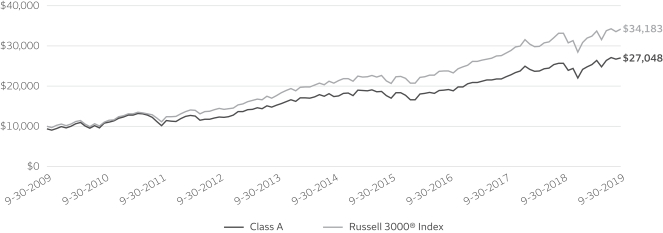
|
| ‡ | CFA® and Chartered Financial Analyst® are trademarks owned by CFA Institute. |
| 1 | Reflects the expense ratios as stated in the most recent prospectuses. The expense ratios shown are subject to change and may differ from the annualized expense ratios shown in the financial highlights of this report. |
| 2 | The manager has contractually committed through January 31, 2020, to waive fees and/or reimburse expenses to the extent necessary to cap the expenses of each class after fee waivers at the amounts shown. Brokerage commissions, stamp duty fees, interest, taxes, acquired fund fees and expenses (if any), and extraordinary expenses are excluded from the expense cap. Prior to or after the commitment expiration date, the cap may be increased or the commitment to maintain the cap may be terminated only with the approval of the Board of Trustees. Without this cap, the Fund’s returns would have been lower. The expense ratio paid by an investor is the net expense ratio (the total annual fund operating expenses after fee waivers) as stated in the prospectuses. |
| 3 | Historical performance shown for Institutional Class shares prior to their inception reflects the performance of Administrator Class shares, and includes the higher expenses applicable to Administrator Class shares. If these expenses had not been included, returns for Institutional Class shares would be higher. |
| 4 | The Russell 3000® Index measures the performance of the 3,000 largest U.S. companies based on total market capitalization, which represents approximately 98% of the investable U.S. equity market. You cannot invest directly in an index. |
| 5 | The chart compares the performance of Class A shares for the most recent ten years with the Russell 3000® Index. The chart assumes a hypothetical investment of $10,000 in Class A shares and reflects all operating expenses and assumes the maximum initial sales charge of 5.75%. |
| 6 | The ten largest holdings, excluding cash, cash equivalents and money market funds, are calculated based on the value of the investments divided by total net assets of the Fund. Holdings are subject to change and may have changed since the date specified. |
| 7 | Amounts are calculated based on the total long-term investments of the Fund. These amounts are subject to change and may have changed since the date specified. |
| * | This security was no longer held at the end of the reporting period. |
Wells Fargo Opportunity Fund | 7
Performance highlights (unaudited)
MANAGER’S DISCUSSION
Fund highlights
| ∎ | | The Fund outperformed its benchmark, the Russell 3000® Index, for the12-month period that ended September 30, 2019. |
| ∎ | | Stock selection in the information technology (IT), consumer discretionary, and financials sectors contributed the most to performance. |
| ∎ | | Positioning and stock selection in the energy, health care, and utilities sectors detracted from performance. |
In the fourth quarter of 2018, the U.S. stock market suffered a sharp decline but steadily recovered over the next three quarters. The Fund’s benchmark followed a similar pattern and gained 2.92% for the period. Utilities, real estate, and consumer staples were the best-performing sectors in the benchmark, while energy, health care, and materials declined.Large-cap stocks generally outperformed small caps.
A number of factors have been influencing the U.S. stock market. Going into the period, lower corporate taxes, less regulation, and otherpro-growth government policies had fueled optimism in U.S. businesses. The U.S. equity markets also benefited from the repatriation of cash held overseas, a significantramp-up in share buybacks, increased capital spending, and high-profile merger and acquisition activity. Byperiod-end, U.S. gross domestic product had increased for the 21st quarter in a row, the longest expansion in history. However, the period began with an equity market decline, exacerbated by the U.S. Federal Reserve (Fed) raising rates. After its December 2018 rate increase, the Fed became more dovish and reduced rates twice to the range of 1.75% to 2.00% by September 2019. An unprecedented level of negative-yielding bonds globally and the potential impact of U.S. trade negotiations are key market concerns. Slowing U.S. corporate earnings growth also weighed on investor sentiment. However, consumer confidence remains positive, supported by low unemployment. Through the period, we continued to seek companies with solid business models, strong management teams, and healthy cash flow prospects.
Fund performance benefited from stock selection in IT, consumer discretionary, and financials.
The Fund’s holdings in IT contributed the most to performance; companies in the software, semiconductor, and IT services industries produced the greatest returns. Within consumer discretionary, holdings in the restaurant, multiline retail, and automobile industries rose the most. Within financials, insurance holdings rose the most as they benefited from improved margins and overall financial performance. The largest individual contributor to performance was Starbucks Corporation (SBUX), the roaster, marketer, and retailer of specialty coffee. SBUX rose 58% during the period, producing more stable results than other consumer discretionary stocks. Other large individual contributors included American Tower Corporation (AMT) and Royal Gold, Incorporated (RGLD). AMT is a real estate investment trust that operates wireless and broadcast communication towers in the U.S., Europe, Asia, and Latin America. AMT rose 55% as the owner of the leading domestic cell tower portfolio, an industry with limited supply risk and growing demand from mobile data usage. RGLD is a precious-metals company focused on gold and silver, with a diversified royalty streaming business. RGLD rose 65%, toadied by the attractiveness of gold as a commodity.
| | | | |
| |
| Ten largest holdings(%) as of September 30, 20196 | | | |
| | |
Alphabet Incorporated Class C | | | 4.17 | |
| | |
Salesforce.com Incorporated | | | 3.11 | |
| | |
MasterCard Incorporated Class A | | | 2.67 | |
| | |
Texas Instruments Incorporated | | | 2.65 | |
| | |
Airbus SE | | | 2.55 | |
| | |
LivaNova plc | | | 2.49 | |
| | |
Equinix Incorporated | | | 2.43 | |
| | |
Intercontinental Exchange Incorporated | | | 2.35 | |
| | |
Apple Incorporated | | | 2.35 | |
| | |
Novartis AG ADR | | | 2.28 | |
The energy, health care, and utilities sectors detracted the most.
Energy was the worst-performing sector in the benchmark, declining 23%. The West Texas Intermediate (WTI) crude oil price declined from $75 to $55 a barrel despite brief spikes related to supply concerns from Venezuela and Iran and the attack on Saudi oil fields. While we own higher-quality exploration and production companies, these firms are still sensitive to crude oil prices. Individual detractors included EOG Resources Incorporated and Concho Resources Incorporated*. In the health care sector, the largest detractor was LivaNova PLC (LIVN), a medical technology company that specializes in neuromodulation, cardiac surgery, and cardiac rhythm management. LIVN was formed
through the merger of Sorin SpA and Cyberonics. The stock fell 40% for the fiscal year as investors worried about regulatory setbacks and weak financial performance. Utilities was the best-performing sector in the benchmark, rising 26%, driven by interest rate trends and the economic cycle. A lack of exposure to this sector detracted from performance.
Please see footnotes on page 7.
8 | Wells Fargo Opportunity Fund
Performance highlights (unaudited)
|
|
| Sector distribution as of September 30, 20197 |
|
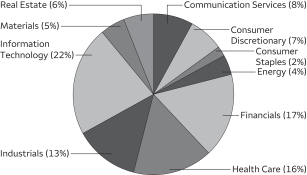 |
Our focus is constant: To add value by investing in attractively priced holdings.
We seek to buy stocks at a discount to their estimated private market values (PMVs) and sell them as they reach the top of their PMV range. Our disciplined,bottom-up investment process leads us to be overweight or underweight certain sectors. This positioning changes over time based on macroeconomic and industry-specific factors. During the reporting period, we were overweight the financials, health care, and industrials sectors and underweight consumer staples, utilities, and consumer discretionary. Through our disciplined investment process, we remain keenly aware of both price and enterprise values on acompany-by-company basis.
Looking ahead, global trade agreements, U.S. government policies, and interest rates may drive the overall market and the portfolio’s performance. Lower taxes and reduced regulations have already had an impact on the U.S. economy, but a divided U.S. Congress may slow down any such reform. U.S.-China trade talks areon-againoff-again. Reaching an agreement could be positive for bilateral and global trade. Future rate cuts expected by the Fed are seen as a positive for the stock market. The prospect of a potential U.S. recession is a factor in investor sentiment along with the possible impact of a slowdown in other major global economies.
Please see footnotes on page 7.
Wells Fargo Opportunity Fund | 9
Fund expenses (unaudited)
As a shareholder of the Fund, you incur two types of costs: (1) transaction costs, including sales charges (loads) on purchase payments and contingent deferred sales charges (if any) on redemptions and (2) ongoing costs, including management fees, distribution(12b-1) and/or shareholder servicing fees, and other Fund expenses. This example is intended to help you understand your ongoing costs (in dollars) of investing in the Fund and to compare these costs with the ongoing costs of investing in other mutual funds.
The example is based on an investment of $1,000 invested at the beginning of thesix-month period and held for the entire period from April 1, 2019 to September 30, 2019.
Actual expenses
The “Actual” line of the table below provides information about actual account values and actual expenses. You may use the information in this line, together with the amount you invested, to estimate the expenses that you paid over the period. Simply divide your account value by $1,000 (for example, an $8,600 account value divided by $1,000 = 8.6), then multiply the result by the number in the “Actual” line under the heading entitled “Expenses paid during period” for your applicable class of shares to estimate the expenses you paid on your account during this period.
Hypothetical example for comparison purposes
The “Hypothetical” line of the table below provides information about hypothetical account values and hypothetical expenses based on the Fund’s actual expense ratio and an assumed rate of return of 5% per year before expenses, which is not the Fund’s actual return. The hypothetical account values and expenses may not be used to estimate the actual ending account balance or expenses you paid for the period. You may use this information to compare the ongoing costs of investing in the Fund and other funds. To do so, compare this 5% hypothetical example with the 5% hypothetical examples that appear in the shareholder reports of the other funds.
Please note that the expenses shown in the table are meant to highlight your ongoing costs only and do not reflect any transactional costs, such as sales charges (loads) and contingent deferred sales charges. Therefore, the “Hypothetical” line of the table is useful in comparing ongoing costs only and will not help you determine the relative total costs of owning different funds. In addition, if these transactional costs were included, your costs would have been higher.
| | | | | | | | | | | | | | | | |
| | | Beginning
account value
4-1-2019 | | | Ending
account value
9-30-2019 | | | Expenses
paid during
the period¹ | | | Annualized net
expense ratio | |
| | | | | |
Class A | | | | | | | | | | | | | | | | |
| | | | |
Actual | | $ | 1,000.00 | | | $ | 1,065.86 | | | $ | 6.13 | | | | 1.18 | % |
| | | | |
Hypothetical (5% return before expenses) | | $ | 1,000.00 | | | $ | 1,019.14 | | | $ | 5.99 | | | | 1.18 | % |
| | | | | |
Class C | | | | | | | | | | | | | | | | |
| | | | |
Actual | | $ | 1,000.00 | | | $ | 1,061.54 | | | $ | 10.00 | | | | 1.93 | % |
| | | | |
Hypothetical (5% return before expenses) | | $ | 1,000.00 | | | $ | 1,015.37 | | | $ | 9.78 | | | | 1.93 | % |
| | | | | |
Administrator Class | | | | | | | | | | | | | | | | |
| | | | |
Actual | | $ | 1,000.00 | | | $ | 1,066.65 | | | $ | 5.19 | | | | 1.00 | % |
| | | | |
Hypothetical (5% return before expenses) | | $ | 1,000.00 | | | $ | 1,020.04 | | | $ | 5.08 | | | | 1.00 | % |
| | | | | |
Institutional Class | | | | | | | | | | | | | | | | |
| | | | |
Actual | | $ | 1,000.00 | | | $ | 1,067.93 | | | $ | 3.90 | | | | 0.75 | % |
| | | | |
Hypothetical (5% return before expenses) | | $ | 1,000.00 | | | $ | 1,021.30 | | | $ | 3.81 | | | | 0.75 | % |
| 1 | Expenses paid is equal to the annualized net expense ratio of each class multiplied by the average account value over the period, multiplied by the number of days in the most recent fiscal half-year divided by the number of days in the fiscal year (to reflect theone-half-year period). |
10 | Wells Fargo Opportunity Fund
Portfolio of investments—September 30, 2019
| | | | | | | | | | | | | | | | |
| | | | | | | | | Shares | | | Value | |
| Common Stocks: 99.06% | |
|
Communication Services: 8.28% | |
|
| Interactive Media & Services: 6.32% | |
Alphabet Incorporated Class C † | | | | | | | | | | | 58,935 | | | $ | 71,841,761 | |
Facebook Incorporated Class A † | | | | | | | | | | | 206,349 | | | | 36,746,630 | |
| |
| | | | 108,588,391 | |
| | | | | |
|
| Media: 1.96% | |
Comcast Corporation Class A | | | | | | | | | | | 749,522 | | | | 33,788,452 | |
| | | | | | | | | | | | | | | | |
|
Consumer Discretionary: 6.77% | |
|
| Automobiles: 2.18% | |
General Motors Company | | | | | | | | | | | 1,001,075 | | | | 37,520,291 | |
| | | | | | | | | | | | | | | | |
|
| Hotels, Restaurants & Leisure: 1.33% | |
Starbucks Corporation | | | | | | | | | | | 257,468 | | | | 22,765,321 | |
| | | | | | | | | | | | | | | | |
|
| Internet & Direct Marketing Retail: 2.06% | |
Amazon.com Incorporated † | | | | | | | | | | | 20,419 | | | | 35,445,546 | |
| | | | | | | | | | | | | | | | |
|
| Multiline Retail: 1.20% | |
Dollar General Corporation | | | | | | | | | | | 129,856 | | | | 20,639,313 | |
| | | | | | | | | | | | | | | | |
|
Consumer Staples: 2.32% | |
|
| Beverages: 1.28% | |
Molson Coors Brewing Company Class B | | | | | | | | | | | 384,435 | | | | 22,105,013 | |
| | | | | | | | | | | | | | | | |
|
| Household Products: 1.04% | |
Church & Dwight Company Incorporated | | | | | | | | | | | 236,879 | | | | 17,822,776 | |
| | | | | | | | | | | | | | | | |
|
Energy: 4.02% | |
|
| Oil, Gas & Consumable Fuels: 4.02% | |
BP plc †† | | | | | | | | | | | 876,028 | | | | 33,280,304 | |
EOG Resources Incorporated | | | | | | | | | | | 286,337 | | | | 21,251,932 | |
Noble Energy Incorporated | | | | | | | | | | | 650,477 | | | | 14,609,713 | |
| |
| | | | 69,141,949 | |
| | | | | |
|
Financials: 16.92% | |
|
| Banks: 5.51% | |
Pinnacle Financial Partners Incorporated | | | | | | | | | | | 521,497 | | | | 29,594,955 | |
PNC Financial Services Group Incorporated | | | | | | | | | | | 266,464 | | | | 37,347,594 | |
Webster Financial Corporation | | | | | | | | | | | 592,939 | | | | 27,791,051 | |
| |
| | | | 94,733,600 | |
| | | | | |
|
| Capital Markets: 6.35% | |
E*TRADE Financial Corporation | | | | | | | | | | | 777,496 | | | | 33,968,800 | |
Intercontinental Exchange Incorporated | | | | | | | | | | | 438,250 | | | | 40,437,328 | |
S&P Global Incorporated | | | | | | | | | | | 141,808 | | | | 34,740,124 | |
| |
| | | | 109,146,252 | |
| | | | | |
|
| Insurance: 5.06% | |
Chubb Limited | | | | | | | | | | | 229,882 | | | | 37,112,150 | |
Marsh & McLennan Companies Incorporated | | | | | | | | | | | 284,950 | | | | 28,509,248 | |
Willis Towers Watson plc | | | | | | | | | | | 111,122 | | | | 21,443,212 | |
| |
| | | | 87,064,610 | |
| | | | | |
Wells Fargo Opportunity Fund | 11
Portfolio of investments—September 30, 2019
| | | | | | | | | | | | | | | | |
| | | | | | | | | Shares | | | Value | |
Health Care: 16.22% | |
|
| Biotechnology: 0.70% | |
Alexion Pharmaceuticals Incorporated † | | | | | | | | | | | 122,672 | | | $ | 12,014,496 | |
| | | | | | | | | | | | | | | | |
|
| Health Care Equipment & Supplies: 5.93% | |
LivaNova plc † | | | | | | | | | | | 581,083 | | | | 42,878,115 | |
Medtronic plc | | | | | | | | | | | 334,034 | | | | 36,282,773 | |
Zimmer Biomet Holdings Incorporated | | | | | | | | | | | 166,197 | | | | 22,813,862 | |
| |
| | | | 101,974,750 | |
| | | | | |
|
| Health Care Providers & Services: 1.05% | |
Cigna Corporation | | | | | | | | | | | 118,924 | | | | 18,051,474 | |
| | | | | | | | | | | | | | | | |
|
| Life Sciences Tools & Services: 5.49% | |
Agilent Technologies Incorporated | | | | | | | | | | | 323,587 | | | | 24,796,472 | |
Bio-Rad Laboratories Incorporated Class A † | | | | | | | | | | | 113,054 | | | | 37,617,588 | |
Thermo Fisher Scientific Incorporated | | | | | | | | | | | 109,732 | | | | 31,961,640 | |
| |
| | | | 94,375,700 | |
| | | | | |
|
| Pharmaceuticals: 3.05% | |
Mylan NV † | | | | | | | | | | | 667,313 | | | | 13,199,451 | |
Novartis AG ADR | | | | | | | | | | | 451,782 | | | | 39,259,856 | |
| |
| | | | 52,459,307 | |
| | | | | |
|
Industrials: 12.63% | |
|
| Aerospace & Defense: 4.36% | |
Airbus SE | | | | | | | | | | | 337,450 | | | | 43,842,206 | |
Safran SA | | | | | | | | | | | 197,950 | | | | 31,165,906 | |
| |
| | | | 75,008,112 | |
| | | | | |
|
| Airlines: 1.10% | |
Delta Air Lines Incorporated | | | | | | | | | | | 327,236 | | | | 18,848,794 | |
| | | | | | | | | | | | | | | | |
|
| Building Products: 2.42% | |
Armstrong World Industries Incorporated | | | | | | | | | | | 246,440 | | | | 23,830,748 | |
Fortune Brands Home & Security Incorporated | | | | | | | | | | | 324,481 | | | | 17,749,111 | |
| |
| | | | 41,579,859 | |
| | | | | |
|
| Commercial Services & Supplies: 1.19% | |
Republic Services Incorporated | | | | | | | | | | | 236,290 | | | | 20,450,900 | |
| | | | | | | | | | | | | | | | |
|
| Machinery: 3.56% | |
Fortive Corporation | | | | | | | | | | | 364,748 | | | | 25,007,123 | |
ITT Incorporated | | | | | | | | | | | 378,314 | | | | 23,149,034 | |
SPX Corporation † | | | | | | | | | | | 328,235 | | | | 13,132,682 | |
| |
| | | | 61,288,839 | |
| | | | | |
|
Information Technology: 21.63% | |
|
| Communications Equipment: 0.98% | |
Palo Alto Networks Incorporated † | | | | | | | | | | | 82,985 | | | | 16,914,833 | |
| | | | | | | | | | | | | | | | |
|
| Electronic Equipment, Instruments & Components: 1.72% | |
Amphenol Corporation Class A | | | | | | | | | | | 306,113 | | | | 29,539,905 | |
| | | | | | | | | | | | | | | | |
12 | Wells Fargo Opportunity Fund
Portfolio of investments—September 30, 2019
| | | | | | | | | | | | | | | | |
| | | | | | | | | Shares | | | Value | |
| IT Services: 4.25% | | | | | | | | | | | | |
Fidelity National Information Services Incorporated | | | | | | | | | | | 204,205 | | | $ | 27,110,256 | |
MasterCard Incorporated Class A | | | | | | | | | | | 169,147 | | | | 45,935,251 | |
| | | | |
| | | | | | | | | | | | | | | 73,045,507 | |
| | | | | | | | | | | | | | | | |
| | | | |
| Semiconductors & Semiconductor Equipment: 4.27% | | | | | | | | | | | | |
Marvell Technology Group Limited | | | | | | | | | | | 1,114,827 | | | | 27,837,230 | |
Texas Instruments Incorporated | | | | | | | | | | | 352,752 | | | | 45,589,668 | |
| | | | |
| | | | | | | | | | | | | | | 73,426,898 | |
| | | | | | | | | | | | | | | | |
| | | | |
| Software: 8.06% | | | | | | | | | | | | |
Oracle Corporation | | | | | | | | | | | 432,557 | | | | 23,803,612 | |
Proofpoint Incorporated † | | | | | | | | | | | 173,910 | | | | 22,443,086 | |
RealPage Incorporated † | | | | | | | | | | | 340,836 | | | | 21,424,951 | |
Salesforce.com Incorporated † | | | | | | | | | | | 359,942 | | | | 53,429,790 | |
Workday Incorporated Class A † | | | | | | | | | | | 103,315 | | | | 17,559,417 | |
| | | | |
| | | | | | | | | | | | | | | 138,660,856 | |
| | | | | | | | | | | | | | | | |
| | | | |
| Technology Hardware, Storage & Peripherals: 2.35% | | | | | | | | | | | | |
Apple Incorporated | | | | | | | | | | | 180,238 | | | | 40,367,905 | |
| | | | | | | | | | | | | | | | |
| | | | |
Materials: 4.85% | | | | | | | | | | | | | | | | |
| | | | |
| Chemicals: 2.65% | | | | | | | | | | | | |
Dow Incorporated | | | | | | | | | | | 468,559 | | | | 22,326,836 | |
The Sherwin-Williams Company | | | | | | | | | | | 42,186 | | | | 23,196,816 | |
| | | | |
| | | | | | | | | | | | | | | 45,523,652 | |
| | | | | | | | | | | | | | | | |
| | | | |
| Metals & Mining: 2.20% | | | | | | | | | | | | |
Royal Gold Incorporated | | | | | | | | | | | 142,073 | | | | 17,504,814 | |
Steel Dynamics Incorporated | | | | | | | | | | | 684,998 | | | | 20,412,940 | |
| | | | |
| | | | | | | | | | | | | | | 37,917,754 | |
| | | | | | | | | | | | | | | | |
| | | | |
Real Estate: 5.42% | | | | | | | | | | | | | | | | |
| | | | |
| Equity REITs: 5.42% | | | | | | | | | | | | |
American Tower Corporation | | | | | | | | | | | 105,857 | | | | 23,408,158 | |
Equinix Incorporated | | | | | | | | | | | 72,531 | | | | 41,835,881 | |
VICI Properties Incorporated « | | | | | | | | | | | 1,229,940 | | | | 27,858,141 | |
| | | | |
| | | | | | | | | | | | | | | 93,102,180 | |
| | | | | | | | | | | | | | | | |
| | | | |
Total Common Stocks (Cost $1,172,859,995) | | | | | | | | | | | | | | | 1,703,313,235 | |
| | | | | | | | | | | | | | | | |
| | | | |
| | | | | | | | | | | | | | | | |
| | | Yield | | | | | | | | | | |
| Short-Term Investments: 2.54% | | | | | | | | | | | | |
| | | | |
| Investment Companies: 2.54% | | | | | | | | | | | | |
Securities Lending Cash Investments LLC (l)(r)(u) | | | 2.11 | % | | | | | | | 25,481,452 | | | | 25,484,000 | |
Wells Fargo Government Money Market Fund Select Class (l)(u) | | | 1.88 | | | | | | | | 18,124,846 | | | | 18,124,846 | |
| |
Total Short-Term Investments (Cost $43,608,846) | | | | 43,608,846 | |
| | | | | | | | | | | | | | | | |
| | | | | | | | |
| Total investments in securities (Cost $1,216,468,841) | | | 101.60 | % | | | 1,746,922,081 | |
| | |
Other assets and liabilities, net | | | (1.60 | ) | | | (27,427,528 | ) |
| | | | | | | | |
| Total net assets | | | 100.00 | % | | $ | 1,719,494,553 | |
| | | | | | | | |
Wells Fargo Opportunity Fund | 13
Portfolio of investments—September 30, 2019
| † | Non-income-earning security |
| †† | On the last dividend date, partial dividends were declared. |
| « | All or a portion of this security is on loan. |
| (l) | The issuer of the security is an affiliated person of the Fund as defined in the Investment Company Act of 1940. |
| (r) | The investment is anon-registered investment company purchased with cash collateral received from securities on loan. |
| (u) | The rate represents the7-day annualized yield at period end. |
Abbreviations:
| ADR | American depositary receipt |
| REIT | Real estate investment trust |
Investments in Affiliates
An affiliated investment is an investment in which the Fund owns at least 5% of the outstanding voting shares of the issuer or as a result of other relationships, such as the Fund and the issuer having the same investment manager. Transactions with issuers that were either affiliated persons of the Fund at the beginning of the period or the end of the period were as follows:
| | | | | | | | | | | | | | | | | | | | | | | | | | | | | | | | | | | | |
| | | Shares,
beginning of
period | | | Shares
purchased | | | Shares
sold | | | Shares,
end of
period | | | Net
realized
gains
(losses) | | | Net
change in
unrealized
gains
(losses) | | | Income
from
affiliated
securities | | | Value,
end of
period | | | % of
net
assets | |
| | | | | | | | | |
| Short-Term Investments | | | | | | | | | | | | | | | | | | | | | | | | | | | |
Investment Companies | | | | | | | | | | | | | | | | | | | | | | | | | | | | | | | | | | | | |
Securities Lending Cash Investments LLC | | | 0 | | | | 154,504,297 | | | | 129,022,845 | | | | 25,481,452 | | | $ | 517 | | | $ | 0 | | | $ | 39,420 | # | | $ | 25,484,000 | | | | | |
Wells Fargo Government Money Market Fund Select Class | | | 15,041,392 | | | | 351,109,598 | | | | 348,026,144 | | | | 18,124,846 | | | | 0 | | | | 0 | | | | 646,282 | | | | 18,124,846 | | | | | |
| | | | | | | | | | | | | | | | | | | | | | | | | | | | | | | | | | | | |
| | | | | | | | | | | | | | | | | | $ | 517 | | | $ | 0 | | | $ | 685,702 | | | $ | 43,608,846 | | | | 2.54 | % |
| | | | | | | | | | | | | | | | | | | | | | | | | | | | | | | | | | | | |
| # | Amount shown represents income before fees and rebates. |
The accompanying notes are an integral part of these financial statements.
14 | Wells Fargo Opportunity Fund
Statement of assets and liabilities—September 30, 2019
| | | | |
| | | | |
| |
Assets | | | | |
Investments in unaffiliated securities (including $25,096,200 of securities loaned), at value (cost $1,172,859,995) | | $ | 1,703,313,235 | |
Investments in affiliated securities, at value (cost $43,608,846) | | | 43,608,846 | |
Receivable for Fund shares sold | | | 54,777 | |
Receivable for dividends | | | 2,678,828 | |
Receivable for securities lending income, net | | | 953 | |
Prepaid expenses and other assets | | | 26,024 | |
| | | | |
Total assets | | | 1,749,682,663 | |
| | | | |
| |
Liabilities | | | | |
Payable upon receipt of securities loaned | | | 25,480,351 | |
Payable for investments purchased | | | 2,051,343 | |
Management fee payable | | | 969,082 | |
Payable for Fund shares redeemed | | | 570,865 | |
Administration fees payable | | | 282,860 | |
Distribution fee payable | | | 2,337 | |
Trustees’ fees and expenses payable | | | 2,048 | |
Accrued expenses and other liabilities | | | 829,224 | |
| | | | |
Total liabilities | | | 30,188,110 | |
| | | | |
Total net assets | | $ | 1,719,494,553 | |
| | | | |
| |
Net assets consist of | | | | |
Paid-in capital | | $ | 1,093,125,646 | |
Total distributable earnings | | | 626,368,907 | |
| | | | |
Total net assets | | $ | 1,719,494,553 | |
| | | | |
| |
Computation of net asset value and offering price per share | | | | |
Net assets – Class A | | $ | 1,461,345,395 | |
Shares outstanding – Class A1 | | | 33,698,160 | |
Net asset value per share – Class A | | | $43.37 | |
Maximum offering price per share – Class A2 | | | $46.02 | |
Net assets – Class C | | $ | 3,739,336 | |
Shares outstanding – Class C1 | | | 93,439 | |
Net asset value per share – Class C | | | $40.02 | |
Net assets – Administrator Class | | $ | 227,962,989 | |
Shares outstanding – Administrator Class1 | | | 4,764,029 | |
Net asset value per share – Administrator Class | | | $47.85 | |
Net assets – Institutional Class | | $ | 26,446,833 | |
Shares outstanding – Institutional Class1 | | | 540,959 | |
Net asset value per share – Institutional Class | | | $48.89 | |
| 1 | The Fund has an unlimited number of authorized shares. |
| 2 | Maximum offering price is computed as 100/94.25 of net asset value. On investments of $50,000 or more, the offering price is reduced. |
The accompanying notes are an integral part of these financial statements.
Wells Fargo Opportunity Fund | 15
Statement of operations—year ended September 30, 2019
| | | | |
| | | | |
| |
Investment income | | | | |
Dividends (net of foreign withholding taxes of $349,959) | | $ | 23,259,148 | |
Income from affiliated securities | | | 653,652 | |
| | | | |
Total investment income | | | 23,912,800 | |
| | | | |
| |
Expenses | | | | |
Management fee | | | 12,192,651 | |
Administration fees | |
Class A | | | 2,994,668 | |
Class C | | | 26,160 | |
Administrator Class | | | 290,951 | |
Institutional Class | | | 33,719 | |
Shareholder servicing fees | |
Class A | | | 3,565,080 | |
Class C | | | 31,143 | |
Administrator Class | | | 558,090 | |
Distribution fee | |
Class C | | | 93,368 | |
Custody and accounting fees | | | 95,101 | |
Professional fees | | | 51,819 | |
Registration fees | | | 89,699 | |
Shareholder report expenses | | | 157,279 | |
Trustees’ fees and expenses | | | 21,652 | |
Other fees and expenses | | | 39,699 | |
| | | | |
Total expenses | | | 20,241,079 | |
Less: Fee waivers and/or expense reimbursements | |
Fund-level | | | (124,413 | ) |
Class A | | | (176,877 | ) |
Administrator Class | | | (271,483 | ) |
Institutional Class | | | (31,693 | ) |
| | | | |
Net expenses | | | 19,636,613 | |
| | | | |
Net investment income | | | 4,276,187 | |
| | | | |
| |
Realized and unrealized gains (losses) on investments | | | | |
Net realized gains on | |
Unaffiliated securities | | | 94,542,693 | |
Affiliated securities | | | 517 | |
| | | | |
Net realized gains on investments | | | 94,543,210 | |
Net change in unrealized gains (losses) on investments | | | (20,640,995 | ) |
| | | | |
Net realized and unrealized gains (losses) on investments | | | 73,902,215 | |
| | | | |
Net increase in net assets resulting from operations | | $ | 78,178,402 | |
| | | | |
The accompanying notes are an integral part of these financial statements.
16 | Wells Fargo Opportunity Fund
Statement of changes in net assets
| | | | | | | | | | | | | | | | |
| | | Year ended
September 30, 2019 | | | Year ended
September 30, 2018 | |
| |
Operations | | | | | |
Net investment income | | | | | | $ | 4,276,187 | | | | | | | $ | 167,228 | |
Net realized gains on investments | | | | | | | 94,543,210 | | | | | | | | 178,981,131 | |
Net change in unrealized gains (losses) on investments | | | | | | | (20,640,995 | ) | | | | | | | 78,123,312 | |
| | | | |
Net increase in net assets resulting from operations | | | | | | | 78,178,402 | | | | | | | | 257,271,671 | |
| | | | |
| | | |
Distributions to shareholders from net investment income and net realized gains | | | | | | | | | | | | |
Class A | | | | | | | (148,689,321 | ) | | | | | | | (187,514,177 | ) |
Class C | | | | | | | (3,194,912 | ) | | | | | | | (4,256,830 | ) |
Administrator Class | | | | | | | (21,792,735 | ) | | | | | | | (27,907,658 | ) |
Institutional Class | | | | | | | (2,724,775 | ) | | | | | | | (3,553,387 | ) |
| | | | |
Total distributions to shareholders | | | | | | | (176,401,743 | ) | | | | | | | (223,232,052 | ) |
| | | | |
| | | | |
Capital share transactions | | | Shares | | | | | | | | Shares | | | | | |
Proceeds from shares sold | |
Class A | | | 930,098 | | | | 37,142,175 | | | | 321,107 | | | | 14,237,392 | |
Class C | | | 12,229 | | | | 460,797 | | | | 7,752 | | | | 322,067 | |
Administrator Class | | | 46,303 | | | | 2,094,423 | | | | 81,574 | | | | 3,929,312 | |
Institutional Class | | | 228,906 | | | | 10,662,670 | | | | 160,930 | | | | 7,973,373 | |
| | | | |
| | | | | | | 50,360,065 | | | | | | | | 26,462,144 | |
| | | | |
Reinvestment of distributions | |
Class A | | | 3,891,150 | | | | 144,750,768 | | | | 4,280,718 | | | | 182,109,847 | |
Class C | | | 91,007 | | | | 3,143,382 | | | | 104,852 | | | | 4,191,994 | |
Administrator Class | | | 504,265 | | | | 20,669,150 | | | | 566,744 | | | | 26,279,904 | |
Institutional Class | | | 58,962 | | | | 2,469,867 | | | | 69,002 | | | | 3,263,351 | |
| | | | |
| | | | | | | 171,033,167 | | | | | | | | 215,845,096 | |
| | | | |
Payment for shares redeemed | |
Class A | | | (4,134,053 | ) | | | (168,457,293 | ) | | | (3,871,565 | ) | | | (173,423,798 | ) |
Class C | | | (732,350 | ) | | | (26,708,914 | ) | | | (150,655 | ) | | | (6,331,672 | ) |
Administrator Class | | | (620,318 | ) | | | (27,798,000 | ) | | | (614,100 | ) | | | (29,945,551 | ) |
Institutional Class | | | (320,957 | ) | | | (14,616,198 | ) | | | (246,531 | ) | | | (12,279,582 | ) |
| | | | |
| | | | | | | (237,580,405 | ) | | | | | | | (221,980,603 | ) |
| | | | |
Net increase (decrease) in net assets resulting from capital share transactions | | | | | | | (16,187,173 | ) | | | | | | | 20,326,637 | |
| | | | |
Total increase (decrease) in net assets | | | | | | | (114,410,514 | ) | | | | | | | 54,366,256 | |
| | | | |
| | |
Net assets | | | | | | | | |
Beginning of period | | | | | | | 1,833,905,067 | | | | | | | | 1,779,538,811 | |
| | | | |
End of period | | | | | | $ | 1,719,494,553 | | | | | | | $ | 1,833,905,067 | |
| | | | |
The accompanying notes are an integral part of these financial statements.
Wells Fargo Opportunity Fund | 17
Financial highlights
(For a share outstanding throughout each period)
| | | | | | | | | | | | | | | | | | | | |
| | | Year ended September 30 | |
| CLASS A | | 2019 | | | 2018 | | | 2017 | | | 2016 | | | 2015 | |
Net asset value, beginning of period | | | $46.31 | | | | $45.83 | | | | $41.86 | | | | $43.35 | | | | $49.56 | |
Net investment income (loss) | | | 0.10 | | | | (0.01 | )1 | | | 0.04 | | | | 0.13 | 1 | | | 0.64 | |
Net realized and unrealized gains (losses) on investments | | | 1.54 | | | | 6.41 | | | | 6.60 | | | | 4.72 | | | | (1.52 | ) |
| | | | | | | | | | | | | | | | | | | | |
Total from investment operations | | | 1.64 | | | | 6.40 | | | | 6.64 | | | | 4.85 | | | | (0.88 | ) |
Distributions to shareholders from | | | | | | | | | | | | | | | | | | | | |
Net investment income | | | 0.00 | | | | (0.17 | ) | | | (0.13 | ) | | | (0.57 | ) | | | 0.00 | |
Net realized gains | | | (4.58 | ) | | | (5.75 | ) | | | (2.54 | ) | | | (5.77 | ) | | | (5.33 | ) |
| | | | | | | | | | | | | | | | | | | | |
Total distributions to shareholders | | | (4.58 | ) | | | (5.92 | ) | | | (2.67 | ) | | | (6.34 | ) | | | (5.33 | ) |
Net asset value, end of period | | | $43.37 | | | | $46.31 | | | | $45.83 | | | | $41.86 | | | | $43.35 | |
Total return2 | | | 5.18 | % | | | 15.16 | % | | | 16.49 | % | | | 12.46 | % | | | (2.27 | )% |
Ratios to average net assets (annualized) | | | | | | | | | | | | | | | | | | | | |
Gross expenses | | | 1.21 | % | | | 1.20 | % | | | 1.21 | % | | | 1.21 | % | | | 1.24 | % |
Net expenses | | | 1.19 | % | | | 1.20 | % | | | 1.21 | % | | | 1.21 | % | | | 1.22 | % |
Net investment income (loss) | | | 0.23 | % | | | (0.01 | )% | | | 0.11 | % | | | 0.33 | % | | | 1.30 | % |
Supplemental data | | | | | | | | | | | | | | | | | | | | |
Portfolio turnover rate | | | 28 | % | | | 30 | % | | | 43 | % | | | 34 | % | | | 42 | % |
Net assets, end of period (000s omitted) | | | $1,461,345 | | | | $1,528,852 | | | | $1,479,457 | | | | $1,418,614 | | | | $390,154 | |
| 1 | Calculated based upon average shares outstanding |
| 2 | Total return calculations do not include any sales charges. |
The accompanying notes are an integral part of these financial statements.
18 | Wells Fargo Opportunity Fund
Financial highlights
(For a share outstanding throughout each period)
| | | | | | | | | | | | | | | | | | | | |
| | | Year ended September 30 | |
| CLASS C | | 2019 | | | 2018 | | | 2017 | | | 2016 | | | 2015 | |
Net asset value, beginning of period | | | $43.43 | | | | $43.46 | | | | $39.99 | | | | $41.60 | | | | $48.10 | |
Net investment income (loss) | | | (0.26 | )1 | | | (0.43 | ) | | | (0.26 | )1 | | | (0.16 | )1 | | | 0.26 | |
Net realized and unrealized gains (losses) on investments | | | 1.43 | | | | 6.15 | | | | 6.27 | | | | 4.51 | | | | (1.43 | ) |
| | | | | | | | | | | | | | | | | | | | |
Total from investment operations | | | 1.17 | | | | 5.72 | | | | 6.01 | | | | 4.35 | | | | (1.17 | ) |
Distributions to shareholders from | | | | | | | | | | | | | | | | | | | | |
Net investment income | | | 0.00 | | | | 0.00 | | | | 0.00 | | | | (0.19 | ) | | | 0.00 | |
Net realized gains | | | (4.58 | ) | | | (5.75 | ) | | | (2.54 | ) | | | (5.77 | ) | | | (5.33 | ) |
| | | | | | | | | | | | | | | | | | | | |
Total distributions to shareholders | | | (4.58 | ) | | | (5.75 | ) | | | (2.54 | ) | | | (5.96 | ) | | | (5.33 | ) |
Net asset value, end of period | | | $40.02 | | | | $43.43 | | | | $43.46 | | | | $39.99 | | | | $41.60 | |
Total return2 | | | 4.37 | % | | | 14.31 | % | | | 15.62 | % | | | 11.62 | % | | | (3.01 | )% |
Ratios to average net assets (annualized) | | | | | | | | | | | | | | | | | | | | |
Gross expenses | | | 1.96 | % | | | 1.95 | % | | | 1.96 | % | | | 1.96 | % | | | 1.99 | % |
Net expenses | | | 1.95 | % | | | 1.95 | % | | | 1.96 | % | | | 1.96 | % | | | 1.97 | % |
Net investment income (loss) | | | (0.69 | )% | | | (0.76 | )% | | | (0.64 | )% | | | (0.40 | )% | | | 0.55 | % |
Supplemental data | | | | | | | | | | | | | | | | | | | | |
Portfolio turnover rate | | | 28 | % | | | 30 | % | | | 43 | % | | | 34 | % | | | 42 | % |
Net assets, end of period (000s omitted) | | | $3,739 | | | | $31,381 | | | | $33,057 | | | | $34,721 | | | | $37,196 | |
| 1 | Calculated based upon average shares outstanding |
| 2 | Total return calculations do not include any sales charges. |
The accompanying notes are an integral part of these financial statements.
Wells Fargo Opportunity Fund | 19
Financial highlights
(For a share outstanding throughout each period)
| | | | | | | | | | | | | | | | | | | | |
| | | Year ended September 30 | |
| ADMINISTRATOR CLASS | | 2019 | | | 2018 | | | 2017 | | | 2016 | | | 2015 | |
Net asset value, beginning of period | | | $50.50 | | | | $49.45 | | | | $44.93 | | | | $46.11 | | | | $52.27 | |
Net investment income | | | 0.21 | | | | 0.07 | | | | 0.15 | 1 | | | 0.24 | 1 | | | 0.79 | |
Net realized and unrealized gains (losses) on investments | | | 1.73 | | | | 6.97 | | | | 7.09 | | | | 5.04 | | | | (1.62 | ) |
| | | | | | | | | | | | | | | | | | | | |
Total from investment operations | | | 1.94 | | | | 7.04 | | | | 7.24 | | | | 5.28 | | | | (0.83 | ) |
Distributions to shareholders from | | | | | | | | | | | | | | | | | | | | |
Net investment income | | | (0.01 | ) | | | (0.24 | ) | | | (0.18 | ) | | | (0.69 | ) | | | 0.00 | |
Net realized gains | | | (4.58 | ) | | | (5.75 | ) | | | (2.54 | ) | | | (5.77 | ) | | | (5.33 | ) |
| | | | | | | | | | | | | | | | | | | | |
Total distributions to shareholders | | | (4.59 | ) | | | (5.99 | ) | | | (2.72 | ) | | | (6.46 | ) | | | (5.33 | ) |
Net asset value, end of period | | | $47.85 | | | | $50.50 | | | | $49.45 | | | | $44.93 | | | | $46.11 | |
Total return | | | 5.37 | % | | | 15.38 | % | | | 16.74 | % | | | 12.68 | % | | | (2.04 | )% |
Ratios to average net assets (annualized) | | | | | | | | | | | | | | | | | | | | |
Gross expenses | | | 1.13 | % | | | 1.12 | % | | | 1.13 | % | | | 1.13 | % | | | 1.10 | % |
Net expenses | | | 1.00 | % | | | 1.00 | % | | | 1.00 | % | | | 1.00 | % | | | 1.00 | % |
Net investment income | | | 0.42 | % | | | 0.19 | % | | | 0.31 | % | | | 0.56 | % | | | 1.52 | % |
Supplemental data | | | | | | | | | | | | | | | | | | | | |
Portfolio turnover rate | | | 28 | % | | | 30 | % | | | 43 | % | | | 34 | % | | | 42 | % |
Net assets, end of period (000s omitted) | | | $227,963 | | | | $244,110 | | | | $237,315 | | | | $226,140 | | | | $223,281 | |
| 1 | Calculated based upon average shares outstanding |
The accompanying notes are an integral part of these financial statements.
20 | Wells Fargo Opportunity Fund
Financial highlights
(For a share outstanding throughout each period)
| | | | | | | | | | | | | | | | | | | | |
| | | Year ended September 30 | |
| INSTITUTIONAL CLASS | | 2019 | | | 2018 | | | 2017 | | | 2016 | | | 2015 | |
Net asset value, beginning of period | | | $51.50 | | | | $50.30 | | | | $45.63 | | | | $46.76 | | | | $52.82 | |
Net investment income | | | 0.35 | | | | 0.22 | | | | 0.22 | 1 | | | 0.35 | 1 | | | 0.92 | 1 |
Net realized and unrealized gains (losses) on investments | | | 1.74 | | | | 7.08 | | | | 7.25 | | | | 5.12 | | | | (1.65 | ) |
| | | | | | | | | | | | | | | | | | | | |
Total from investment operations | | | 2.09 | | | | 7.30 | | | | 7.47 | | | | 5.47 | | | | (0.73 | ) |
Distributions to shareholders from | | | | | | | | | | | | | | | | | | | | |
Net investment income | | | (0.12 | ) | | | (0.35 | ) | | | (0.26 | ) | | | (0.83 | ) | | | 0.00 | |
Net realized gains | | | (4.58 | ) | | | (5.75 | ) | | | (2.54 | ) | | | (5.77 | ) | | | (5.33 | ) |
| | | | | | | | | | | | | | | | | | | | |
Total distributions to shareholders | | | (4.70 | ) | | | (6.10 | ) | | | (2.80 | ) | | | (6.60 | ) | | | (5.33 | ) |
Net asset value, end of period | | | $48.89 | | | | $51.50 | | | | $50.30 | | | | $45.63 | | | | $46.76 | |
Total return | | | 5.63 | % | | | 15.69 | % | | | 17.02 | % | | | 12.97 | % | | | (1.81 | )% |
Ratios to average net assets (annualized) | | | | | | | | | | | | | | | | | | | | |
Gross expenses | | | 0.88 | % | | | 0.87 | % | | | 0.88 | % | | | 0.88 | % | | | 0.83 | % |
Net expenses | | | 0.75 | % | | | 0.75 | % | | | 0.75 | % | | | 0.75 | % | | | 0.75 | % |
Net investment income | | | 0.66 | % | | | 0.44 | % | | | 0.47 | % | | | 0.79 | % | | | 1.79 | % |
Supplemental data | | | | | | | | | | | | | | | | | | | | |
Portfolio turnover rate | | | 28 | % | | | 30 | % | | | 43 | % | | | 34 | % | | | 42 | % |
Net assets, end of period (000s omitted) | | | $26,447 | | | | $29,562 | | | | $29,709 | | | | $17,222 | | | | $11,906 | |
| 1 | Calculated based upon average shares outstanding |
The accompanying notes are an integral part of these financial statements.
Wells Fargo Opportunity Fund | 21
Notes to financial statements
1. ORGANIZATION
Wells Fargo Funds Trust (the “Trust”), a Delaware statutory trust organized on March 10, 1999, is anopen-end management investment company registered under the Investment Company Act of 1940, as amended (the “1940 Act”). As an investment company, the Trust follows the accounting and reporting guidance in Financial Accounting Standards Board (“FASB”)Accounting Standards Codification Topic 946, Financial Services – Investment Companies. These financial statements report on the Wells Fargo Opportunity Fund (the “Fund”) which is a diversified series of the Trust.
2. SIGNIFICANT ACCOUNTING POLICIES
The following significant accounting policies, which are consistently followed in the preparation of the financial statements of the Fund, are in conformity with U.S. generally accepted accounting principles which require management to make estimates and assumptions that affect the reported amounts of assets and liabilities, disclosure of contingent assets and liabilities at the date of the financial statements, and the reported amounts of revenues and expenses during the reporting period. Actual results could differ from those estimates.
Securities valuation
All investments are valued each business day as of the close of regular trading on the New York Stock Exchange (generally 4 p.m. Eastern Time), although the Fund may deviate from this calculation time under unusual or unexpected circumstances.
Equity securities that are listed on a foreign or domestic exchange or market are valued at the official closing price or, if none, the last sales price. If no sale occurs on the principal exchange or market that day, a fair value price will be determined in accordance with the Fund’s Valuation Procedures.
The values of securities denominated in foreign currencies are translated into U.S. dollars at rates provided by an independent foreign currency pricing source at a time each business day specified by the Wells Fargo Asset Management Pricing Committee at Wells Fargo Funds Management, LLC (“Funds Management”).
Many securities markets and exchanges outside the U.S. close prior to the close of the New York Stock Exchange and therefore may not fully reflect trading or events that occur after the close of the principal exchange in which the foreign securities are traded, but before the close of the New York Stock Exchange. If such trading or events are expected to materially affect the value of such securities, then fair value pricing procedures approved by the Board of Trustees of the Fund are applied. These procedures take into account multiple factors including movements in U.S. securities markets after foreign exchanges close. Foreign securities that are fair valued under these procedures are categorized as Level 2 and the application of these procedures may result in transfers between Level 1 and Level 2. Depending on market activity, such fair valuations may be frequent. Such fair value pricing may result in net asset values that are higher or lower than net asset values based on the last reported sales price or latest quoted bid price. On September 30, 2019, such fair value pricing was not used in pricing foreign securities.
Investments in registeredopen-end investment companies are valued at net asset value. Interests innon-registered investment companies that are redeemable at net asset value are fair valued normally at net asset value.
Investments which are not valued using any of the methods discussed above are valued at their fair value, as determined in good faith by the Board of Trustees. The Board of Trustees has established a Valuation Committee comprised of the Trustees and has delegated to it the authority to take any actions regarding the valuation of portfolio securities that the Valuation Committee deems necessary or appropriate, including determining the fair value of portfolio securities, unless the determination has been delegated to the Wells Fargo Asset Management Pricing Committee.The Board of Trustees retains the authority to make or ratify any valuation decisions or approve any changes to the Valuation Procedures as it deems appropriate. On a quarterly basis, the Board of Trustees receives reports on any valuation actions taken by the Valuation Committee or the Wells Fargo Asset Management Pricing Committee which may include items for ratification.
Foreign currency translation
The accounting records of the Fund are maintained in U.S. dollars. The values of other assets and liabilities denominated in foreign currencies are translated into U.S. dollars at rates provided by an independent foreign currency pricing source at a time each business day specified by the Wells Fargo Asset Management Pricing Committee. Purchases and sales of securities, and income and expenses are converted at the rate of exchange on the respective dates of such transactions. Net realized foreign exchange gains or losses arise from sales of foreign currencies, currency gains or losses realized between the trade and settlement dates on securities transactions, and the difference between the amounts of dividends, interest and foreign withholding taxes recorded and the U.S. dollar equivalent of the amounts actually paid or received. Net unrealized foreign exchange gains and losses arise from changes in the fair value of assets and liabilities other than investments in securities resulting from changes in exchange rates. The changes in net assets arising from changes in exchange rates of securities and the changes in net assets resulting from changes in market prices of securities are not separately presented. Such changes are included in net realized and unrealized gains or losses from investments.
22 | Wells Fargo Opportunity Fund
Notes to financial statements
Securities lending
The Fund may lend its securities from time to time in order to earn additional income in the form of fees or interest on securities received as collateral or the investment of any cash received as collateral. When securities are on loan, the Fund receives interest or dividends on those securities. Cash collateral received in connection with its securities lending transactions is invested in Securities Lending Cash Investments, LLC (the “Securities Lending Fund”). Investments in Securities Lending Fund are valued at the evaluated bid price provided by an independent pricing service. Income earned from investment in the Securities Lending Fund (net of fees and rebates), if any, is included in income from affiliated securities on the Statement of Operations.
In a securities lending transaction, the net asset value of the Fund is affected by an increase or decrease in the value of the securities loaned and by an increase or decrease in the value of the instrument in which collateral is invested. The amount of securities lending activity undertaken by the Fund fluctuates from time to time. The Fund has the right under the lending agreement to recover the securities from the borrower on demand. In the event of default or bankruptcy by the borrower, the Fund may be prevented from recovering the loaned securities or gaining access to the collateral or may experience delays or costs in doing so. In such an event, the terms of the agreement allows the unaffiliated securities lending agent to use the collateral to purchase replacement securities on behalf of the Fund or pay the Fund the market value of the loaned securities. The Fund bears the risk of loss with respect to depreciation of its investment of the cash collateral.
Security transactions and income recognition
Securities transactions are recorded on a trade date basis. Realized gains or losses are recorded on the basis of identified cost.
Dividend income is recognized on theex-dividend date, except for certain dividends from foreign securities, which are recorded as soon as the custodian verifies theex-dividend date. Dividend income from foreign securities is recorded net of foreign taxes withheld where recovery of such taxes is not assured.
Distributions to shareholders
Distributions to shareholders from net investment income and any net realized gains are recorded on theex-dividend date and paid at least annually. Such distributions are determined in accordance with income tax regulations and may differ from U.S. generally accepted accounting principles. Dividend sources are estimated at the time of declaration. The tax character of distributions is determined as of the Fund’s fiscal year end. Therefore, a portion of the Fund’s distributions made prior to the Fund’s fiscal year end may be categorized as a tax return of capital at year end.
Federal and other taxes
The Fund intends to continue to qualify as a regulated investment company by distributing substantially all of its investment company taxable income and any net realized capital gains (after reduction for capital loss carryforwards) sufficient to relieve it from all, or substantially all, federal income taxes. Accordingly, no provision for federal income taxes was required.
The Fund’s income and federal excise tax returns and all financial records supporting those returns for the prior three fiscal years are subject to examination by the federal and Delaware revenue authorities. Management has analyzed the Fund’s tax positions taken on federal, state, and foreign tax returns for all open tax years and does not believe that there are any uncertain tax positions that require recognition of a tax liability.
As of September 30, 2019, the aggregate cost of all investments for federal income tax purposes was $1,220,095,012 and the unrealized gains (losses) consisted of:
| | | | |
| |
Gross unrealized gains | | $ | 568,930,518 | |
| |
Gross unrealized losses | | | (42,103,449 | ) |
| |
Net unrealized gains | | $ | 526,827,069 | |
Class allocations
The separate classes of shares offered by the Fund differ principally in applicable sales charges, distribution, shareholder servicing, and administration fees. Class specific expenses are charged directly to that share class. Investment income, common fund-level expenses, and realized and unrealized gains (losses) on investments are allocated daily to each class of shares based on the relative proportion of net assets of each class.
3. FAIR VALUATION MEASUREMENTS
Fair value measurements of investments are determined within a framework that has established a fair value hierarchy based upon the various data inputs utilized in determining the value of the Fund’s investments. The three-level hierarchy gives the highest priority to unadjusted quoted prices in active markets for identical assets or liabilities (Level 1) and the lowest priority to unobservable inputs (Level 3). The Fund’s investments are classified within the fair value hierarchy based on the lowest level of input that is significant to the fair value measurement. The inputs are summarized into three broad levels as follows:
Wells Fargo Opportunity Fund | 23
Notes to financial statements
| ∎ | | Level 1 – quoted prices in active markets for identical securities |
| ∎ | | Level 2 – other significant observable inputs (including quoted prices for similar securities, interest rates, prepayment speeds, credit risk, etc.) |
| ∎ | | Level 3 – significant unobservable inputs (including the Fund’s own assumptions in determining the fair value of investments) |
The inputs or methodologies used for valuing investments in securities are not necessarily an indication of the risk associated with investing in those securities.
The following is a summary of the inputs used in valuing the Fund’s assets and liabilities as of September 30, 2019:
| | | | | | | | | | | | | | | | |
| | | | |
| | | Quoted prices (Level 1) | | | Other significant
observable inputs
(Level 2) | | | Significant
unobservable inputs (Level 3) | | | Total | |
| | | | |
Assets | | | | | | | | | | | | | | | | |
Investments in: | | | | | | | | | | | | | | | | |
| | | | |
Common stocks | | | | | | | | | | | | | | | | |
| | | | |
Communication services | | $ | 142,376,843 | | | $ | 0 | | | $ | 0 | | | $ | 142,376,843 | |
| | | | |
Consumer discretionary | | | 116,370,471 | | | | 0 | | | | 0 | | | | 116,370,471 | |
| | | | |
Consumer staples | | | 39,927,789 | | | | 0 | | | | 0 | | | | 39,927,789 | |
| | | | |
Energy | | | 69,141,949 | | | | 0 | | | | 0 | | | | 69,141,949 | |
| | | | |
Financials | | | 290,944,462 | | | | 0 | | | | 0 | | | | 290,944,462 | |
| | | | |
Health care | | | 278,875,727 | | | | 0 | | | | 0 | | | | 278,875,727 | |
| | | | |
Industrials | | | 217,176,504 | | | | 0 | | | | 0 | | | | 217,176,504 | |
| | | | |
Information technology | | | 371,955,904 | | | | 0 | | | | 0 | | | | 371,955,904 | |
| | | | |
Materials | | | 83,441,406 | | | | 0 | | | | 0 | | | | 83,441,406 | |
| | | | |
Real estate | | | 93,102,180 | | | | 0 | | | | 0 | | | | 93,102,180 | |
| | | | |
Short-term investments | | | | | | | | | | | | | | | | |
| | | | |
Investment companies | | | 43,608,846 | | | | 0 | | | | 0 | | | | 43,608,846 | |
| | | | |
Total assets | | $ | 1,746,922,081 | | | $ | 0 | | | $ | 0 | | | $ | 1,746,922,081 | |
Additional sector, industry or geographic detail is included in the Portfolio of Investments.
For the year ended September 30, 2019, the Fund had no material transfers into/out of Level 3.
4. TRANSACTIONS WITH AFFILIATES
Management fee
Funds Management, an indirect wholly owned subsidiary of Wells Fargo & Company (“Wells Fargo”), is the manager of the Fund and provides advisory and fund-level administrative services under an investment management agreement. Under the investment management agreement, Funds Management is responsible for, among other services, implementing the investment objectives and strategies of the Fund, supervising the subadviser and providing fund-level administrative services in connection with the Fund’s operations. As compensation for its services under the investment management agreement, Funds Management is entitled to receive a management fee at the following annual rate based on the Fund’s average daily net assets:
| | | | |
| |
| Average daily net assets | | Management fee | |
| |
First $500 million | | | 0.750 | % |
| |
Next $500 million | | | 0.725 | |
| |
Next $1 billion | | | 0.700 | |
| |
Next $2 billion | | | 0.675 | |
| |
Next $1 billion | | | 0.650 | |
| |
Next $5 billion | | | 0.640 | |
| |
Next $2 billion | | | 0.630 | |
| |
Next $4 billion | | | 0.620 | |
| |
Over $16 billion | | | 0.610 | |
24 | Wells Fargo Opportunity Fund
Notes to financial statements
Prior to February 1, 2019, Funds Management received a management fee at the following annual rate based on the Fund’s average daily net assets:
| | | | |
| |
| Average daily net assets | | Management fee | |
| |
First $500 million | | | 0.750 | % |
| |
Next $500 million | | | 0.725 | |
| |
Next $1 billion | | | 0.700 | |
| |
Next $2 billion | | | 0.675 | |
| |
Next $1 billion | | | 0.650 | |
| |
Next $5 billion | | | 0.640 | |
| |
Over $10 billion | | | 0.630 | |
For the year ended September 30, 2019, the management fee was equivalent to an annual rate of 0.72% of the Fund’s average daily net assets.
Funds Management has retained the services of a subadviser to provide daily portfolio management to the Fund. The fee for subadvisory services is borne by Funds Management. Wells Capital Management Incorporated (“WellsCap”), an affiliate of Funds Management and an indirect wholly owned subsidiary of Wells Fargo, is the subadviser to the Fund and is entitled to receive a fee from Funds Management at an annual rate starting at 0.45% and declining to 0.30% as the average daily net assets of the Fund increase.
Administration fees
Under a class-level administration agreement, Funds Management provides class-level administrative services to the Fund, which includes paying fees and expenses for services provided by the transfer agent,sub-transfer agents, omnibus account servicers and record-keepers. As compensation for its services under the class-level administration agreement, Funds Management receives an annual fee which is calculated based on the average daily net assets of each class as follows:
| | | | |
| |
| | | Class-level
administration fee | |
| |
Class A, Class C | | | 0.21 | % |
| |
Administrator Class, Institutional Class | | | 0.13 | |
Waivers and/or expense reimbursements
Funds Management has contractually waived and/or reimbursed management and administration fees to the extent necessary to maintain certain net operating expense ratios for the Fund. When each class of the Fund has exceeded its expense cap, Funds Management has waived fees and/or reimbursed expenses from fund-level expenses on a proportionate basis and then from class specific expenses. When only certain classes exceed their expense caps, waivers and/or reimbursements are applied against class specific expenses before fund-level expenses. Funds Management has committed through January 31, 2020 to waive fees and/or reimburse expenses to the extent necessary to cap the Fund’s expenses at 1.18% for Class A shares, 1.93% for Class C shares, 1.00% for Administrator Class shares, and 0.75% for Institutional Class shares. Prior to or after the commitment expiration date, the cap may be increased or the commitment to maintain the cap may be terminated only with the approval of the Board of Trustees. Prior to February 1, 2019, the Fund’s expenses were capped at 1.21% for Class A shares and 1.96% for Class C shares.
Distribution fee
The Trust has adopted a distribution plan for Class C shares of the Fund pursuant to Rule12b-1 under the 1940 Act. A distribution fee is charged to Class C shares and paid to Wells Fargo Funds Distributor, LLC (“Funds Distributor”), the principal underwriter, at an annual rate of 0.75% of the average daily net assets of Class C shares.
In addition, Funds Distributor is entitled to receive thefront-end sales charge from the purchase of Class A shares and a contingent deferred sales charge on the redemption of certain Class A shares. Funds Distributor is also entitled to receive the contingent deferred sales charges from redemptions of Class C shares. For the year ended September 30, 2019, Funds Distributor received $4,930 from the sale of Class A shares and $25 in contingent deferred sales charges from redemptions of Class C shares. No contingent deferred sales charges were incurred by Class A shares for the year ended September 30, 2019.
Shareholder servicing fees
The Trust has entered into contracts with one or more shareholder servicing agents, whereby Class A, Class C, and Administrator Class of the Fund are charged a fee at an annual rate of 0.25% of the average daily net assets of each respective class. A portion of these total shareholder servicing fees were paid to affiliates of Wells Fargo.
Wells Fargo Opportunity Fund | 25
Notes to financial statements
Interfund transactions
The Fund may purchase or sell portfolio investment securities to certain other Wells Fargo affiliates pursuant to Rule17a-7 under the 1940 Act and under procedures adopted by the Board of Trustees. The procedures have been designed to ensure that these interfund transactions, which do not incur broker commissions, are effected at current market prices.
5. INVESTMENT PORTFOLIO TRANSACTIONS
Purchases and sales of investments, excluding U.S. government obligations (if any) and short-term securities, for the year ended September 30, 2019 were $467,793,090 and $659,304,024, respectively.
6. SECURITIES LENDING TRANSACTIONS
The Fund lends its securities through an unaffiliated securities lending agent and receives collateral in the form of cash or securities with a value at least equal to the value of the securities on loan. The value of the loaned securities is determined at the close of each business day and any increases or decreases in the required collateral are exchanged between the Fund and the counterparty on the next business day. Cash collateral received is invested in the Securities Lending Fund which seeks to provide a positive return compared to the daily Fed Funds Open Rate by investing in high-quality, U.S. dollar-denominated short-term money market instruments and is exempt from registration under Section 3(c)(7) of the 1940 Act. Securities Lending Fund is managed by Funds Management and is subadvised by WellsCap. Funds Management receives an advisory fee starting at 0.05% and declining to 0.01% as the average daily net assets of the Securities Lending Fund increase. All of the fees received by Funds Management are paid to WellsCap for its services as subadviser.
In the event of counterparty default or the failure of a borrower to return a loaned security, the Fund has the right to use the collateral to offset any losses incurred. As of September 30, 2019, the Fund had securities lending transactions with the following counterparties which are subject to offset:
| | | | | | | | |
| | | |
| Counterparty | | Value of
securities on
loan | | Collateral
received1 | | Net amount | |
| | | |
Morgan Stanley & Co. LLC | | $25,096,200 | | ($25,096,200) | | $ | 0 | |
| 1 | Collateral received within this table is limited to the collateral for the net transaction with the counterparty. |
7. BANK BORROWINGS
The Trust (excluding the money market funds), Wells Fargo Master Trust and Wells Fargo Variable Trust are parties to a $280,000,000 revolving credit agreement whereby the Fund is permitted to use bank borrowings for temporary or emergency purposes, such as to fund shareholder redemption requests. Interest under the credit agreement is charged to the Fund based on a borrowing rate equal to the higher of the Federal Funds rate in effect on that day plus 1.25% or the overnight LIBOR rate in effect on that day plus 1.25%. In addition, an annual commitment fee equal to 0.25% of the unused balance is allocated to each participating fund.
For the year ended September 30, 2019, there were no borrowings by the Fund under the agreement.
8. DISTRIBUTIONS TO SHAREHOLDERS
The tax character of distributions paid during the years ended September 30, 2019 and September 30, 2018 were as follows:
| | | | | | | | |
| | | Year ended September 30 | |
| | |
| | | 2019 | | | 2018 | |
| | |
Ordinary income | | $ | 20,040,871 | | | $ | 32,866,802 | |
| | |
Long-term capital gain | | | 156,360,872 | | | | 190,365,250 | |
As of September 30, 2019, the components of distributable earnings on a tax basis were as follows:
| | | | |
Undistributed
ordinary
income | | Undistributed
long-term
gains | | Unrealized gains |
| | |
| $11,352,163 | | $88,290,527 | | $526,827,069 |
26 | Wells Fargo Opportunity Fund
Notes to financial statements
9. INDEMNIFICATION
Under the Trust’s organizational documents, the officers and Trustees have been granted certain indemnification rights against certain liabilities that may arise out of performance of their duties to the Trust. Additionally, in the normal course of business, the Trust may enter into contracts with service providers that contain a variety of indemnification clauses. The Trust’s maximum exposure under these arrangements is dependent on future claims that may be made against the Fund and, therefore, cannot be estimated.
10. NEW ACCOUNTING PRONOUNCEMENT
In August 2018, FASB issued Accounting Standards Update (“ASU”)No. 2018-13, Fair Value Measurement (Topic 820)Disclosure Framework—Changes to the Disclosure Requirements for Fair Value Measurement. ASU2018-13 updates the disclosure requirements for fair value measurements by modifying or removing certain disclosures and adding certain new disclosures. The amendments are effective for fiscal years, and interim periods within those fiscal years, beginning after December 15, 2019. Early adoption is permitted. Management has adopted the removal and modification of disclosures early, as permitted, and will adopt the additional new disclosures at the effective date.
Wells Fargo Opportunity Fund | 27
Report of independent registered public accounting firm
TO THE SHAREHOLDERS OF THE FUND AND BOARD OF TRUSTEES OF WELLS FARGO FUNDS TRUST:
Opinion on the Financial Statements
We have audited the accompanying statement of assets and liabilities of Wells Fargo Opportunity Fund (the Fund), one of the funds constituting Wells Fargo Funds Trust, including the portfolio of investments, as of September 30, 2019, the related statement of operations for the year then ended, the statements of changes in net assets for each of the years in the two-year period then ended, and the related notes (collectively, the financial statements) and the financial highlights for each of the years in the five-year period then ended. In our opinion, the financial statements and financial highlights present fairly, in all material respects, the financial position of the Fund as of September 30, 2019, the results of its operations for the year then ended, the changes in its net assets for each of the years in the two-year period then ended, and the financial highlights for each of the years in the five-year period then ended, in conformity with U.S. generally accepted accounting principles.
Basis for Opinion
These financial statements and financial highlights are the responsibility of the Fund’s management. Our responsibility is to express an opinion on these financial statements and financial highlights based on our audits. We are a public accounting firm registered with the Public Company Accounting Oversight Board (United States) (PCAOB) and are required to be independent with respect to the Fund in accordance with the U.S. federal securities laws and the applicable rules and regulations of the Securities and Exchange Commission and the PCAOB.
We conducted our audits in accordance with the standards of the PCAOB. Those standards require that we plan and perform the audit to obtain reasonable assurance about whether the financial statements and financial highlights are free of material misstatement, whether due to error or fraud. Our audits included performing procedures to assess the risks of material misstatement of the financial statements and financial highlights, whether due to error or fraud, and performing procedures that respond to those risks. Such procedures included examining, on a test basis, evidence regarding the amounts and disclosures in the financial statements and financial highlights. Such procedures also included confirmation of securities owned as of September 30, 2019, by correspondence with the custodian, transfer agent and brokers, or by other appropriate auditing procedures. Our audits also included evaluating the accounting principles used and significant estimates made by management, as well as evaluating the overall presentation of the financial statements and financial highlights. We believe that our audits provide a reasonable basis for our opinion.

We have not been able to determine the specific year that we began serving as the auditor of one or more Wells Fargo Funds investment companies; however we are aware that we have served as the auditor of one or more Wells Fargo Funds investment companies since at least 1955.
Boston, Massachusetts
November 25, 2019
28 | Wells Fargo Opportunity Fund
Other information (unaudited)
TAX INFORMATION
For corporate shareholders, pursuant to Section 854 of the Internal Revenue Code, 76.93% of ordinary income dividends qualify for the corporate dividends-received deduction for the fiscal year ended September 30, 2019.
Pursuant to Section 852 of the Internal Revenue Code, $156,360,872 was designated as a 20% rate gain distribution for the fiscal year ended September 30, 2019.
Pursuant to Section 854 of the Internal Revenue Code, $20,040,871 of income dividends paid during the fiscal year ended September 30, 2019 has been designated as qualified dividend income (QDI).
For the fiscal year ended September 30, 2019, $19,914,543 has been designated as short-term capital gain dividends for nonresident alien shareholders pursuant to Section 871 of the Internal Revenue Code.
PROXY VOTING INFORMATION
A description of the policies and procedures used to determine how to vote proxies relating to portfolio securities is available, upon request, by calling1-800-222-8222, visiting our website atwfam.com, or visiting the SEC website at sec.gov. Information regarding how the proxies related to portfolio securities were voted during the most recent12-month period ended June 30 is available on the website atwfam.comor by visiting the SEC website at sec.gov.
QUARTERLY PORTFOLIO HOLDINGS INFORMATION
The Fund files its complete schedule of portfolio holdings with the SEC for the first and third quarters of each fiscal year on Form N-Q or FormN-PORT, which is available by visiting the SEC website at sec.gov. Those forms may be reviewed and copied at the SEC’s Public Reference Room in Washington, DC. Information on the operation of the Public Reference Room may be obtained by calling1-800-SEC-0330.
Wells Fargo Opportunity Fund | 29
Other information (unaudited)
BOARD OF TRUSTEES AND OFFICERS
Each of the Trustees and Officers1 listed in the table below acts in identical capacities for each fund in the Wells Fargo family of funds, which consists of 150 mutual funds comprising the Wells Fargo Funds Trust, Wells Fargo Variable Trust, Wells Fargo Master Trust and fourclosed-end funds (collectively the “Fund Complex”). This table should be read in conjunction with the Prospectus and the Statement of Additional Information2. The mailing address of each Trustee and Officer is 525 Market Street, 12th Floor, San Francisco, CA 94105. Each Trustee and Officer serves an indefinite term, however, each Trustee serves such term until reaching the mandatory retirement age established by the Trustees.
Independent Trustees
| | | | | | |
Name and year of birth | | Position held and
length of service* | | Principal occupations during past five years or longer | | Current other
public company or
investment
company
directorships |
| | | |
| William R. Ebsworth (Born 1957) | | Trustee, since 2015 | | Retired. From 1984 to 2013, equities analyst, portfolio manager, research director and chief investment officer at Fidelity Management and Research Company in Boston, Tokyo, and Hong Kong, and retired in 2013 as Chief Investment Officer of Fidelity Strategic Advisers, Inc. where he led a team of investment professionals managing client assets. Prior thereto, Board member of Hong Kong Securities Clearing Co., Hong Kong Options Clearing Corp., the Thailand International Fund, Ltd., Fidelity Investments Life Insurance Company, and Empire Fidelity Investments Life Insurance Company. Audit Committee Chair and Investment Committee Chair of the Vincent Memorial Hospital Endowment(non-profit organization). Mr. Ebsworth is a CFA® charterholder. | | N/A |
| | | |
| Jane A. Freeman (Born 1953) | | Trustee, since 2015; Chair Liaison, since 2018 | | Retired. From 2012 to 2014 and 1999 to 2008, Chief Financial Officer of Scientific Learning Corporation. From 2008 to 2012, Ms. Freeman provided consulting services related to strategic business projects. Prior to 1999, Portfolio Manager at Rockefeller & Co. and Scudder, Stevens & Clark. Board member of the Harding Loevner Funds from 1996 to 2014, serving as both Lead Independent Director and chair of the Audit Committee. Board member of the Russell Exchange Traded Funds Trust from 2011 to 2012 and the chair of the Audit Committee. Ms. Freeman is a Board Member of The Ruth Bancroft Garden(non-profit organization). She is also an inactive Chartered Financial Analyst. | | N/A |
| | | |
| Isaiah Harris, Jr. (Born 1952) | | Trustee, since 2009; Audit Committee Chairman, since 2019 | | Retired. Chairman of the Board of CIGNA Corporation since 2009, and Director since 2005. From 2003 to 2011, Director of Deluxe Corporation. Prior thereto, President and CEO of BellSouth Advertising and Publishing Corp. from 2005 to 2007, President and CEO of BellSouth Enterprises from 2004 to 2005 and President of BellSouth Consumer Services from 2000 to 2003. Emeritus member of the Iowa State University Foundation Board of Governors. Emeritus Member of the Advisory Board of Iowa State University School of Business. Advisory Board Member, Palm Harbor Academy (private school). Advisory Board Member, Child Evangelism Fellowship(non-profit). Mr. Harris is a certified public accountant (inactive status). | | CIGNA Corporation |
| | | |
| Judith M. Johnson (Born 1949) | | Trustee, since 2008; Audit Committee Chairman, from 2009 to 2018 | | Retired. Prior thereto, Chief Executive Officer and Chief Investment Officer of Minneapolis Employees Retirement Fund from 1996 to 2008. Ms. Johnson is an attorney, certified public accountant and a certified managerial accountant. | | N/A |
30 | Wells Fargo Opportunity Fund
Other information (unaudited)
| | | | | | |
Name and year of birth | | Position held and
length of service* | | Principal occupations during past five years or longer | | Current other
public company or
investment
company
directorships |
| | | |
| David F. Larcker (Born 1950) | | Trustee, since 2009 | | James Irvin Miller Professor of Accounting at the Graduate School of Business, Stanford University, Director of the Corporate Governance Research Initiative and Senior Faculty of The Rock Center for Corporate Governance since 2006. From 2005 to 2008, Professor of Accounting at the Graduate School of Business, Stanford University. Prior thereto, Ernst & Young Professor of Accounting at The Wharton School, University of Pennsylvania from 1985 to 2005. | | N/A |
| | | |
| Olivia S. Mitchell (Born 1953) | | Trustee, since 2006; Nominating and Governance Committee Chairman, since 2018 | | International Foundation of Employee Benefit Plans Professor, Wharton School of the University of Pennsylvania since 1993. Director of Wharton’s Pension Research Council and Boettner Center on Pensions & Retirement Research, and Research Associate at the National Bureau of Economic Research. Previously, Cornell University Professor from 1978 to 1993. | | N/A |
| | | |
| Timothy J. Penny (Born 1951) | | Trustee, since 1996; Chairman, since 2018 | | President and Chief Executive Officer of Southern Minnesota Initiative Foundation, anon-profit organization, since 2007. Member of the Board of Trustees of NorthStar Education Finance, Inc., anon-profit organization, since 2007. | | N/A |
| | | |
| James G. Polisson (Born 1959) | | Trustee, since 2018 | | Retired. Chief Marketing Officer, Source (ETF) UK Services, Ltd, from 2015 to 2017. From 2012 to 2015, Principal of The Polisson Group, LLC, a management consulting, corporate advisory and principal investing company. Chief Executive Officer and Managing Director at Russell Investments, Global Exchange Traded Funds from 2010 to 2012. Managing Director of Barclays Global Investors from 1998 to 2010 and Global Chief Marketing Officer for iShares and Barclays Global Investors from 2000 to 2010. Trustee of the San Francisco Mechanics’ Institute, anon-profit organization, from 2013 to 2015. Board member of the Russell Exchange Traded Fund Trust from 2011 to 2012. Director of Barclays Global Investors Holdings Deutschland GmbH from 2006 to 2009. Mr. Polisson is an attorney and has a retired status with the Massachusetts and District of Columbia Bar Associations. | | N/A |
| * | Length of service dates reflect the Trustee’s commencement of service with the Trust’s predecessor entities, where applicable. |
Wells Fargo Opportunity Fund | 31
Other information (unaudited)
Officers
| | | | |
Name and year of birth | | Position held and
length of service | | Principal occupations during past five years or longer |
| | |
| Andrew Owen (Born 1960) | | President, since 2017 | | Executive Vice President of Wells Fargo & Company and Head of Affiliated Managers, Wells Fargo Asset Management, since 2014. In addition, Mr. Owen is currently President, Chief Executive Officer and Director of Wells Fargo Funds Management, LLC since 2017. Prior thereto, Executive Vice President responsible for marketing, investments and product development for Wells Fargo Funds Management, LLC, from 2009 to 2014. |
| | |
| Nancy Wiser1 (Born 1967) | | Treasurer, since 2012 | | Executive Vice President of Wells Fargo Funds Management, LLC since 2011. Chief Operating Officer and Chief Compliance Officer at LightBox Capital Management LLC, from 2008 to 2011. |
| | |
| Michelle Rhee3 (Born 1966) | | Chief Legal Officer, since 2019 | | Secretary of Wells Fargo Funds Management, LLC, Chief Legal Counsel of Wells Fargo Asset Management and Assistant General Counsel of Wells Fargo Bank, N.A. since 2018. Associate General Counsel and Managing Director of Bank of America Corporation from 2004 to 2018. |
| | |
| Catherine Kennedy4 (Born 1969) | | Secretary, since 2019 | | Vice President of Wells Fargo Funds Management, LLC and Senior Counsel of the Wells Fargo Legal Department since 2010. Vice President and Senior Counsel of Evergreen Investment Management Company, LLC from 1998 to 2010. |
| | |
| Michael H. Whitaker(Born 1967) | | Chief Compliance Officer, since 2016 | | Chief Compliance Officer of Wells Fargo Asset Management since 2016. Senior Vice President and Chief Compliance Officer for Fidelity Investments from 2007 to 2016. |
| | |
| David Berardi (Born 1975) | | Assistant Treasurer, since 2009 | | Vice President of Wells Fargo Funds Management, LLC since 2009. Vice President of Evergreen Investment Management Company, LLC from 2008 to 2010. Manager of Fund Reporting and Control for Evergreen Investment Management Company, LLC from 2004 to 2010. |
| | |
| Jeremy DePalma1 (Born 1974) | | Assistant Treasurer, since 2009 | | Senior Vice President of Wells Fargo Funds Management, LLC since 2009. Senior Vice President of Evergreen Investment Management Company, LLC from 2008 to 2010 and head of the Fund Reporting and Control Team within Fund Administration from 2005 to 2010. |
| 1 | Nancy Wiser acts as Treasurer of 64 funds in the Fund Complex. Jeremy DePalma acts as Treasurer of 86 funds and Assistant Treasurer of 64 funds in the Fund Complex. |
| 2 | The Statement of Additional Information includes additional information about the Trustees and is available, without charge, upon request, by calling1-800-222-8222 or by visiting the website atwfam.com. |
| 3 | Michelle Rhee became Chief Legal Officer effective October 22, 2019. |
| 4 | Catherine Kennedy became Secretary effective October 22, 2019. |
32 | Wells Fargo Opportunity Fund
Other information (unaudited)
BOARD CONSIDERATION OF INVESTMENT MANAGEMENT ANDSUB-ADVISORY AGREEMENTS:
Wells Fargo Opportunity Fund
Under the Investment Company Act of 1940 (the “1940 Act”), the Board of Trustees (the “Board”) of Wells Fargo Funds Trust (the “Trust”) must determine annually whether to approve the continuation of the Trust’s investment management andsub-advisory agreements. In this regard, at anin-person meeting held on May21-22, 2019 (the “Meeting”), the Board, all the members of which have no direct or indirect interest in the investment management andsub-advisory agreements and are not “interested persons” of the Trust, as defined in the 1940 Act (the “Independent Trustees”), reviewed and approved for Wells Fargo Opportunity Fund(the “Fund”): (i) an investment management agreement (the “Management Agreement”) with Wells Fargo Funds Management, LLC (“Funds Management”); and (ii) an investmentsub-advisory agreement (the“Sub-Advisory Agreement”) with Wells Capital Management Incorporated (the“Sub-Adviser”), an affiliate of Funds Management. The Management Agreement and theSub-Advisory Agreement are collectively referred to as the “Advisory Agreements.”
At the Meeting, the Board considered the factors and reached the conclusions described below relating to the selection of Funds Management and theSub-Adviser and the approval of the Advisory Agreements. Prior to the Meeting, including at anin-person meeting in April 2019, the Trustees conferred extensively among themselves and with representatives of Funds Management about these matters. Also, the Board has adopted a team-based approach, with each team consisting of asub-set of Trustees, to assist the full Board in the discharge of its duties in reviewing investment performance and other matters throughout the year. The Independent Trustees were assisted in their evaluation of the Advisory Agreements by independent legal counsel, from whom they received separate legal advice and with whom they met separately.
In providing information to the Board, Funds Management and theSub-Adviser were guided by a detailed set of requests for information submitted to them by independent legal counsel on behalf of the Independent Trustees at the start of the Board’s annual contract renewal process earlier in 2019. In considering and approving the Advisory Agreements, the Trustees considered the information they believed relevant, including but not limited to the information discussed below. The Board considered not only the specific information presented in connection with the Meeting, but also the knowledge gained over time through interaction with Funds Management and theSub-Adviser about various topics. In this regard, the Board reviewed reports of Funds Management at each of its quarterly meetings, which included, among other things, portfolio reviews and investment performance reports. In addition, the Board and the teams mentioned above confer with portfolio managers at various times throughout the year. The Board did not identify any particular information or consideration that wasall-important or controlling, and each individual Trustee may have attributed different weights to various factors.
After its deliberations, the Board unanimously approved the continuation of the Advisory Agreements for aone-year term and determined that the compensation payable to Funds Management and theSub-Adviser under each of the Advisory Agreements was reasonable. The Board considered the approval of the Advisory Agreements for the Fund as part of its consideration of agreements for funds across the complex, but its approvals were made on afund-by-fund basis. The following summarizes a number of important, but not necessarily all, factors considered by the Board in support of its approvals.
Nature, extent and quality of services
The Board received and considered various information regarding the nature, extent and quality of services provided to the Fund by Funds Management and theSub-Adviser under the Advisory Agreements. This information included a description of the investment advisory services and Fund-level administrative services covered by the Management Agreement, as well as, among other things, a summary of the background and experience of senior management of Wells Fargo Asset Management (“WFAM”), of which Funds Management and theSub-Adviser are a part, a summary of investments made in the business of WFAM, a summary of certain organizational and personnel changes involving Funds Management and theSub-Adviser, and a description of Funds Management’s and theSub-Adviser’s business continuity planning programs and of their approaches to data privacy and cybersecurity. The Board received and reviewed information about Funds Management’s role as administrator of the Fund’s liquidity risk management program. The Board also considered the qualifications, background, tenure and responsibilities of each of the portfolio managers primarily responsible for theday-to-day portfolio management of the Fund.
The Board evaluated the ability of Funds Management and theSub-Adviser to attract and retain qualified investment professionals, including research, advisory and supervisory personnel. The Board further considered the compliance programs and compliance records of Funds Management and theSub-Adviser. In addition, the Board took into account the full range of services provided to the Fund by Funds Management and its affiliates.
Wells Fargo Opportunity Fund | 33
Other information (unaudited)
Fund investment performance and expenses
The Board considered the investment performance results for the Fund over various time periods ended December 31, 2018. The Board considered these results in comparison to the investment performance of funds in a universe that was determined by Broadridge Inc. (“Broadridge”) to be similar to the Fund (the “Universe”), and in comparison to the Fund’s benchmark index and to other comparative data. Broadridge is an independent provider of investment company data. The Board received a description of the methodology used by Broadridge to select the mutual funds in the performance Universe. The Board noted that the investment performance of the Fund (Administrator Class) was higher than the average investment performance of the Universe for all periods under review. The Board also noted that the investment performance of the Fund was lower than its benchmark index, the Russell 3000® Index, for theone-, three- and five-year periods under review, but in range of its benchmark for theten-year period under review.
The Board received information concerning, and discussed factors contributing to, the underperformance of the Fund relative to its benchmark for the periods identified above. The Board took note of the explanations for the relative underperformance during these periods, including with respect to investment decisions and market factors that affected the Fund’s investment performance. The Board also took note of the Fund’s outperformance relative to the Universe over each period under review.
The Board also received and considered information regarding the Fund’s net operating expense ratios and their various components, including actual management fees, custodian and othernon-management fees, and Rule12b-1 andnon-Rule12b-1 shareholder service fees. The Board considered these ratios in comparison to the median ratios of funds in class-specific expense groups that were determined by Broadridge to be similar to the Fund (the “Groups”). The Board received a description of the methodology used by Broadridge to select the mutual funds in the expense Groups and an explanation of how funds comprising expense groups and their expense ratios may vary fromyear-to-year. Based on the Broadridge reports, the Board noted that the net operating expense ratios of the Fund were in range of, equal to, or lower than the median net operating expense ratios of the expense Groups for each share class.
The Board took into account the Fund’s investment performance and expense information provided to it among the factors considered in deciding tore-approve the Advisory Agreements.
Investment management andsub-advisory fee rates
The Board reviewed and considered the contractual fee rates payable by the Fund to Funds Management under the Management Agreement, as well as the contractual fee rates payable by the Fund to Funds Management for class-level administrative services under a Class-Level Administration Agreement, which include, among other things, class-level transfer agency andsub-transfer agency costs (collectively, the “Management Rates”). The Board also reviewed and considered the contractual investmentsub-advisory fee rates that are payable by Funds Management to theSub-Adviser for investmentsub-advisory services.
Among other information reviewed by the Board was a comparison of the Fund’s Management Rates with the average contractual investment management fee rates of funds in the expense Groups at a common asset level as well as transfer agency costs of the funds in the expense Groups. The Board noted that the Management Rates of the Fund were in range of the sum of the average rates for the Fund��s expense Groups for the Institutional Class, but higher than the average rates for the Fund’s expense Groups for Class A and the Administrator Class. However, the Board noted that the net operating expense ratios of the Fund were in range of, equal to, or lower than the median net operating expense ratios of the expense Groups for each share class.
The Board also received and considered information about the portion of the total management fee that was retained by Funds Management after payment of the fee to theSub-Adviser forsub-advisory services. In assessing the reasonableness of this amount, the Board received and evaluated information about the nature and extent of responsibilities retained and risks assumed by Funds Management and not delegated to or assumed by theSub-Adviser, and about Funds Management’son-going oversight services. Given the affiliation between Funds Management and theSub-Adviser, the Board ascribed limited relevance to the allocation of fees between them.
The Board also received and considered information about the nature and extent of services offered and fee rates charged by Funds Management and theSub-Adviser to other types of clients with investment strategies similar to those of the Fund. In this regard, the Board received information about the significantly greater scope of services, and compliance, reporting and other legal burdens and risks of managing proprietary mutual funds compared with those associated with managing assets of other types of clients, including third-partysub-advised fund clients andnon-mutual fund clients such as institutional separate accounts.
Based on its consideration of the factors and information it deemed relevant, including those described here, the Board determined that the compensation payable to Funds Management under the Management Agreement and to theSub-Adviser under theSub-Advisory Agreement was reasonable.
34 | Wells Fargo Opportunity Fund
Other information (unaudited)
Profitability
The Board received and considered information concerning the profitability of Funds Management, as well as the profitability of both WFAM and Wells Fargo & Co. (“Wells Fargo”) from providing services to the fund family as a whole. The Board noted that theSub-Adviser’s profitability information with respect to providing services to the Fund and other funds in the family was subsumed in the WFAM and Wells Fargo profitability analysis.
Funds Management reported on the methodologies and estimates used in calculating profitability, including a description of the methodology used to allocate certain expenses. Among other things, the Board noted that the levels of profitability reported on afund-by-fund basis varied widely, depending on factors such as the size, type and age of fund. Based on its review, the Board did not deem the profits reported by Funds Management, WFAM or Wells Fargo from services provided to the Fund to be at a level that would prevent it from approving the continuation of the Advisory Agreements.
Economies of scale
The Board received and considered information about the potential for Funds Management to experience economies of scale in the provision of management services to the Fund, the difficulties of calculating economies of scale at an individual fund level, and the extent to which potential scale benefits are shared with shareholders. The Board noted the existence of breakpoints in the Fund’s management fee structure, which operate generally to reduce the Fund’s expense ratios as the Fund grows in size. The Board considered that in addition to management fee breakpoints, Funds Management shares potential economies of scale from its management business in a variety of ways, including through fee waiver and expense reimbursement arrangements, services that benefit shareholders, competitive management fee rates set at the outset without regard to breakpoints, and investments in the business intended to enhance services available to shareholders.
The Board concluded that Funds Management’s arrangements with respect to the Fund, including contractual breakpoints, constituted a reasonable approach to sharing potential economies of scale with the Fund and its shareholders.
Other benefits to Funds Management and theSub-Adviser
The Board received and considered information regarding potential“fall-out” or ancillary benefits received by Funds Management and its affiliates, including theSub-Adviser, as a result of their relationships with the Fund. Ancillary benefits could include, among others, benefits directly attributable to other relationships with the Fund and benefits potentially derived from an increase in Funds Management’s and theSub-Adviser’s business as a result of their relationships with the Fund. The Board noted that various affiliates of Funds Management may receive distribution-related fees, shareholder servicing payments andsub-transfer agency fees in respect of shares sold or held through them and services provided.
The Board also reviewed information about soft dollar credits earned and utilized by theSub-Adviser, fees earned by Funds Management and theSub-Adviser from managing a private investment vehicle for the fund family’s securities lending collateral, and commissions earned by an affiliated broker from portfolio transactions.
Based on its consideration of the factors and information it deemed relevant, including those described here, the Board did not find that any ancillary benefits received by Funds Management and its affiliates, including theSub-Adviser, were unreasonable.
Conclusion
At the Meeting, after considering the above-described factors and based on its deliberations and its evaluation of the information described above, the Board unanimously approved the continuation of the Advisory Agreements for aone-year term and determined that the compensation payable to Funds Management and theSub-Adviser under each of the Advisory Agreements was reasonable.
Wells Fargo Opportunity Fund | 35
This page is intentionally left blank.

For more information
More information about Wells Fargo Funds is available free upon request. To obtain literature, please write, visit the Fund’s website, or call:
Wells Fargo Funds
P.O. Box 219967
Kansas City, MO 64121-9967
Website:wfam.com
Individual investors:1-800-222-8222
Retail investment professionals:1-888-877-9275
Institutional investment professionals:1-866-765-0778

This report and the financial statements contained herein are submitted for the general information of the shareholders of the Fund. If this report is used for promotional purposes, distribution of the report must be accompanied or preceded by a current prospectus. Before investing, please consider the investment objectives, risks, charges, and expenses of the investment. For a current prospectus and, if available, a summary prospectus, containing this information, call1-800-222-8222 or visit the Fund’s website atwfam.com. Read the prospectus carefully before you invest or send money.
Wells Fargo Asset Management (WFAM) is the trade name for certain investment advisory/management firms owned by Wells Fargo & Company. These firms include but are not limited to Wells Capital Management Incorporated and Wells Fargo Funds Management, LLC. Certain products managed by WFAM entities are distributed by Wells Fargo Funds Distributor, LLC (a broker-dealer and Member FINRA).
This material is for general informational and educational purposes only and is NOT intended to provide investment advice or a recommendation of any kind—including a recommendation for any specific investment, strategy, or plan.
INVESTMENT PRODUCTS: NOT FDIC INSURED ◾ NO BANK GUARANTEE ◾ MAY LOSE VALUE
© 2019 Wells Fargo & Company. All rights reserved.
406816 11-19
A232/AR232 09-19
Annual Report
September 30, 2019
Wells Fargo
Special Mid Cap Value Fund
Beginning on January 1, 2021, as permitted by new regulations adopted by the Securities and Exchange Commission, paper copies of the Wells Fargo Funds’ annual and semi-annual shareholder reports issued after this date will no longer be sent by mail, unless you specifically request paper copies of the reports. Instead, the reports will be made available on the Funds’ website, and you will be notified by mail each time a report is posted and provided with a website address to access the report.
If you already elected to receive shareholder reports electronically, you will not be affected by this change and you need not take any action. You may elect to receive shareholder reports and other communications from the Fund electronically at any time by contacting your financial intermediary (such as a broker-dealer or bank) or, if you are a direct investor, by calling1-800-222-8222 or by enrolling at wellsfargo.com/advantagedelivery.
You may elect to receive all future reports in paper free of charge. If you invest through a financial intermediary, you can contact your financial intermediary to request that you continue to receive paper copies of your shareholder reports; if you invest directly with the Fund, you can call 1-800-222-8222. Your election to receive reports in paper will apply to all Wells Fargo Funds held in your account with your financial intermediary or, if you are a direct investor, to all Wells Fargo Funds that you hold.
|
|
|
Reduce clutter. Save trees. |
Sign up for electronic delivery of prospectuses and shareholder reports atwellsfargo.com/advantagedelivery |
The views expressed and any forward-looking statements are as of September 30, 2019, unless otherwise noted, and are those of the Fund managers and/or Wells Fargo Asset Management. Discussions of individual securities, or the markets generally, or any Wells Fargo Fund are not intended as individual recommendations. Future events or results may vary significantly from those expressed in any forward-looking statements. The views expressed are subject to change at any time in response to changing circumstances in the market. Wells Fargo Asset Management and the Fund disclaim any obligation to publicly update or revise any views expressed or forward-looking statements.
INVESTMENT PRODUCTS: NOT FDIC INSURED ◾ NO BANK GUARANTEE ◾ MAY LOSE VALUE
Wells Fargo Special Mid Cap Value Fund | 1
Letter to shareholders (unaudited)

Andrew Owen
President
Wells Fargo Funds
“December’s S&P 500 Index performance was the worst since 1931.”
Dear Shareholder:
We are pleased to offer you this annual report for the Wells Fargo Special Mid Cap Value Fund for the 12-month period that ended September 30, 2019. After the first half of the period yielded either low-single-digit or negative investment returns, U.S. stock and global bond investors generally saw markets recover during the second half amid intensifying market volatility, global economic growth concerns, international trade stare downs, and simmering geopolitical tensions.
Overall, fixed-income investors enjoyed a distinct advantage over stock investors. For the period, U.S. stocks, based on the S&P 500 Index,1 gained 4.25% and international stocks, as measured by the MSCI ACWI ex USA Index (Net),2 fell 1.23%. The MSCI EM Index (Net)3 slipped 2.02%. Among fixed income investors, the Bloomberg Barclays U.S. Aggregate Bond Index4 added 10.30%, the Bloomberg Barclays Global Aggregateex-USD Index5 added 5.34%, the Bloomberg Barclays Municipal Bond Index6 gained 8.55%, and the ICE BofAML U.S. High Yield Index7 added 6.30%.
Investors confronted unsettling events during the fourth quarter of 2018.
During the fourth quarter of 2018, investors grew concerned about the pace and sustainability of the global economic expansion. The U.S. Bureau of Economic Analysis reported third-quarter U.S. gross domestic product (GDP) was 3.4% on an annualized basis, which was down from the second-quarter rate. A partial U.S. government shutdown occurred, which extended into January 2019. Brexit efforts stalled, causing uncertainty for the eurozone. The value of the renminbi declined even as the People’s Bank of China cut reserve requirement ratios, accelerated infrastructure spending, and cut taxes in efforts to spur economic activity.
The combination of news in the U.S. and generally weak economic indicators outside of the U.S. caused investors to seek safe havens. December’s S&P 500 Index performance was the worst since 1931. Globally, fixed-income investments fared better than stocks during the last two months of the year. Even as indicators suggested growth was restrained, the U.S. Federal Reserve (Fed) increased the federal funds rate by 25 basis points (bps; 100 bps equal 1.00%) in December 2018 to a target range of between 2.25% and 2.50%. Many observers expressed concerns that higher rates could slow the economy further.
| 1 | The S&P 500 Index consists of 500 stocks chosen for market size, liquidity, and industry group representation. It is a market-value-weighted index with each stock’s weight in the index proportionate to its market value. You cannot invest directly in an index. |
| 2 | The Morgan Stanley Capital International (MSCI) All Country World Index (ACWI) ex USA Index (Net) is a free-float-adjusted market-capitalization weighted index that is designed to measure the equity market performance of developed and emerging markets, excluding the U.S. Source: MSCI. MSCI makes no express or implied warranties or representations and shall have no liability whatsoever with respect to any MSCI data contained herein. The MSCI data may not be further redistributed or used as a basis for other indices or any securities or financial products. This report is not approved, reviewed, or produced by MSCI. You cannot invest directly in an index. |
| 3 | The MSCI Emerging Markets (EM) Index (Net) is a free-float-adjusted market-capitalization-weighted index that is designed to measure the equity market performance of emerging markets. You cannot invest directly in an index. |
| 4 | The Bloomberg Barclays U.S. Aggregate Bond Index is a broad-based benchmark that measures the investment-grade, U.S. dollar-denominated, fixed-rate taxable bond market, including Treasuries, government-related and corporate securities, mortgage-backed securities (agency fixed-rate and hybrid adjustable-rate mortgage pass-throughs), asset-backed securities, and commercial mortgage-backed securities. You cannot invest directly in an index. |
| 5 | The Bloomberg Barclays Global Aggregate ex-USD Index is an unmanaged index that provides a broad-based measure of the global investment-grade fixed-income markets excluding the U.S. dollar-denominated debt market. You cannot invest directly in an index. |
| 6 | The Bloomberg Barclays Municipal Bond Index is an unmanaged index composed of long-term tax-exempt bonds with a minimum credit rating of Baa. You cannot invest directly in an index. |
| 7 | The ICE BofAML U.S. High Yield Index is a market-capitalization-weighted index of domestic and Yankee high-yield bonds. The index tracks the performance of high-yield securities traded in the U.S. bond market. You cannot invest directly in an index. Copyright 2019. ICE Data Indices, LLC. All rights reserved. |
2 | Wells Fargo Special Mid Cap Value Fund
Letter to shareholders (unaudited)
The market climbs a wall of worry.
Investment returns early in 2019 appeared to reaffirm the adage that markets climb a wall of worry as the new year began. The S&P 500 Index gained 8.01% for the month of January, the best monthly performance in 30 years. Returns for the MSCI ACWI ex USA Index (Net), the Bloomberg Barclays U.S. Aggregate Bond Index, and the Bloomberg Barclays Global Aggregate ex-USD Index also were positive.
In February 2019, signs of slowing global growth grew more ominous. The Bureau of Economic Analysis announced fourth-quarter 2018 GDP grew at an annualized 2.2% rate, a slower rate than reported for the prior two quarters. In a February report, the Bank of England forecast the slowest growth for 2019 since the financial crisis. China and the U.S. continued to wrangle over trade issues. By the end of the first quarter of 2019, more accommodative Fed sentiment and steady, if not spectacular, U.S. economic and business metrics encouraged domestic investors.
Early second-quarter 2019 enthusiasm among investors faded.
During April 2019, favorable sentiment found additional support in reports of sustained low inflation, solid employment data, and first-quarter U.S. GDP of an annualized rate of 3.2%. During May, markets tumbled on mixed investment signals. In the U.S., partisan wrangling ramped up as Democrats and Republicans set their sights on 2020 presidential politics. The U.K.’s Brexit disagreements caused Prime Minister Theresa May to resign. Boris Johnson succeeded her only to exacerbate uncertainty about Brexit’s resolution ahead of an October 2019 deadline. The European Commission downgraded the 2019 growth forecast to 1.2%. The U.S. increased tariffs on products from China, China responded, and then talks broke down. President Donald Trump threatened to turn his foreign policy tariff tool to Mexico over immigration issues.
During the third quarter of 2019, investors regrouped. Just as the investment horizon appeared to darken, sentiment turned and U.S. equity markets gained during June and July. The gains, primarily driven by geopolitical and monetary policy events, pushed equity markets to new highs. European Central Bank President Mario Draghi said that if the outlook doesn’t improve, the bank would cut rates or buy more assets to prop up inflation. President Trump backed off of tariff threats against Mexico and China. In the U.S., the Fed implemented a 0.25% federal funds rate cut in July.
Later in July 2019, the U.S. reversed course and threatened to impose higher tariffs on China’s exports after talks failed. China responded with tariff threats of its own and devalued the renminbi, a move that roiled global markets. Major U.S. stock market indices closed July with the worst weekly results of the year. Bond prices gained as Treasury yields fell to levels not seen since November 2016 and the yield curve inverted at multiple points along the 30-year arc.
In a microcosm, August 2019 encapsulated many of the unnerving events that plagued investors during the prior 11 months. The U.S.-China trade relationship swung from antagonistic to hopeful and back again with no evident compromise on the horizon. Evidence of a continued global economic slowdown mounted. Central banks in China, New Zealand, and Thailand cut interest rates. Industrial and manufacturing data declined in China, Canada, Japan, and Germany. Adding to the uncertain environment, Italy’s prime minister resigned, many feared a crackdown in Hong Kong as protesters sustained their calls for reform throughout the month, and Boris Johnson planned to suspend Parliament as Brexit’s deadline neared.
In the U.S., September saw the Fed join other central banks in cutting interest rates. Manufacturing data in the U.S., as reported by the Institute for Supply Management, disappointed investors. The U.S. Congress announced it would pursue an impeachment investigation of President Trump. Meanwhile, the Brexit impasse showed no signs of
“The S&P 500 Index gained 8.01% for the month of January, the best monthly performance in 30 years.”
Wells Fargo Special Mid Cap Value Fund | 3
Letter to shareholders (unaudited)
|
|
|
For further information about your Fund, contact your investment professional, visit our website at wfam.com, or call us directly at1-800-222-8222. |
resolution. Officials in China said that hitting the country’s economic growth goals for the year would be difficult considering the weight of tariffs and trade restrictions. So while the S&P 500 Index finished the third quarter with year-to-date returns that were the best in more than 20 years, amid signs of equity investors taking money out of the stock market, concerns about future returns remained.
Don’t let short-term uncertainty derail long-term investment goals.
Periods of investment uncertainty can present challenges, but experience has taught us that maintaining long-term investment goals can be an effective way to plan for the future. To help you create a sound strategy based on your personal goals and risk tolerance, Wells Fargo Funds offers more than 100 mutual funds spanning a wide range of asset classes and investment styles. Although diversification cannot guarantee an investment profit or prevent losses, we believe it can be an effective way to manage investment risk and potentially smooth out overall portfolio performance. We encourage investors to know their investments and to understand that appropriate levels of risk-taking may potentially unlock opportunities.
Thank you for choosing to invest with Wells Fargo Funds. We appreciate your confidence in us and remain committed to helping you meet your financial needs.
Sincerely,

Andrew Owen
President
Wells Fargo Funds
4 | Wells Fargo Special Mid Cap Value Fund
This page is intentionally left blank.
Performance highlights (unaudited)
Investment objective
The Fund seeks long-term capital appreciation.
Manager
Wells Fargo Funds Management, LLC
Subadviser
Wells Capital Management Incorporated
Portfolio managers
James M. Tringas, CFA®‡
Bryant VanCronkhite, CFA®‡, CPA
Shane Zweck, CFA®‡*
Average annual total returns (%) as of September 30, 2019
| | | | | | | | | | | | | | | | | | | | | | | | | | | | | | | | | | |
| | | | |
| | | | | Including sales charge | | | Excluding sales charge | | | Expense ratios1 (%) | |
| | | | | | | | | |
| | | Inception date | | 1 year | | | 5 year | | | 10 year | | | 1 year | | | 5 year | | | 10 year | | | Gross | | | Net2 | |
| | | | | | | | | | |
| Class A (WFPAX) | | 7-31-2007 | | | 1.62 | | | | 7.13 | | | | 11.95 | | | | 7.81 | | | | 8.40 | | | | 12.62 | | | | 1.16 | | | | 1.16 | |
| | | | | | | | | | |
| Class C (WFPCX) | | 7-31-2007 | | | 6.00 | | | | 7.59 | | | | 11.77 | | | | 7.00 | | | | 7.59 | | | | 11.77 | | | | 1.91 | | | | 1.91 | |
| | | | | | | | | | |
| Class R (WFHHX)3 | | 9-30-2015 | | | – | | | | – | | | | – | | | | 7.52 | | | | 8.13 | | | | 12.35 | | | | 1.41 | | | | 1.41 | |
| | | | | | | | | | |
| Class R6 (WFPRX)4 | | 6-28-2013 | | | – | | | | – | | | | – | | | | 8.28 | | | | 8.87 | | | | 13.10 | | | | 0.73 | | | | 0.73 | |
| | | | | | | | | | |
| Administrator Class (WFMDX) | | 4-8-2005 | | | – | | | | – | | | | – | | | | 7.88 | | | | 8.50 | | | | 12.73 | | | | 1.08 | | | | 1.08 | |
| | | | | | | | | | |
| Institutional Class (WFMIX) | | 4-8-2005 | | | – | | | | – | | | | – | | | | 8.17 | | | | 8.77 | | | | 13.04 | | | | 0.83 | | | | 0.83 | |
| | | | | | | | | | |
| Russell Midcap® Value Index5 | | – | | | – | | | | – | | | | – | | | | 1.60 | | | | 7.55 | | | | 12.29 | | | | – | | | | – | |
Figures quoted represent past performance, which is no guarantee of future results, and do not reflect taxes that a shareholder may pay on fund distributions or the redemption of fund shares. Investment return and principal value of an investment will fluctuate so that an investor’s shares, when redeemed, may be worth more or less than their original cost. Performance shown without sales charges would be lower if sales charges were reflected. Current performance may be lower or higher than the performance data quoted, which assumes the reinvestment of dividends and capital gains. Currentmonth-end performance is available on the Fund’s website,wfam.com.
Index returns do not include transaction costs associated with buying and selling securities, any mutual fund fees or expenses, or any taxes. It is not possible to invest directly in an index.
For Class A shares, the maximumfront-end sales charge is 5.75%. For Class C shares, the maximum contingent deferred sales charge is 1.00%. Performance including a contingent deferred sales charge assumes the sales charge for the corresponding time period. Class R, Class R6, Administrator Class, and Institutional Class shares are sold without afront-end sales charge or contingent deferred sales charge.
Stock values fluctuate in response to the activities of individual companies and general market and economic conditions. Smaller-company stocks tend to be more volatile and less liquid than those of larger companies. Consult the Fund’s prospectus for additional information on these and other risks.
Please see footnotes on page 7.
6 | Wells Fargo Special Mid Cap Value Fund
Performance highlights (unaudited)
|
|
| Growth of $10,000 investment as of September 30, 20196 |
|
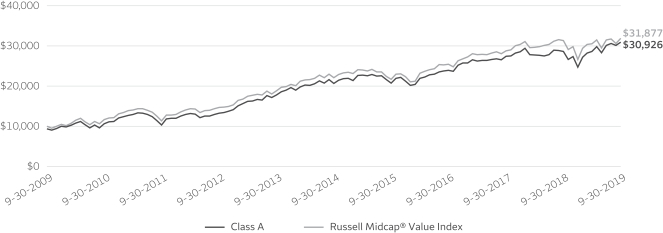
|
| ‡ | CFA® and Chartered Financial Analyst® are trademarks owned by CFA Institute. |
| * | Mr. Zweck became a portfolio manager of the Fund on February 1, 2019. |
| 1 | Reflects the expense ratios as stated in the most recent prospectuses, which include the impact of 0.01% in acquired fund fees and expenses. The expense ratios shown are subject to change and may differ from the annualized expense ratios shown in the financial highlights of this report, which do not include acquired fund fees and expenses. |
| 2 | The manager has contractually committed through January 31, 2020, to waive fees and/or reimburse expenses to the extent necessary to cap the expenses of each class after fee waivers at the amounts shown. Brokerage commissions, stamp duty fees, interest, taxes, acquired fund fees and expenses (if any), and extraordinary expenses are excluded from the expense cap. Prior to or after the commitment expiration date, the cap may be increased or the commitment to maintain the cap may be terminated only with the approval of the Board of Trustees. Without this cap, the Fund’s returns would have been lower. The expense ratio paid by an investor is the net expense ratio (the total annual fund operating expenses after fee waivers) as stated in the prospectuses. |
| 3 | Historical performance shown for Class R shares prior to their inception reflects the performance of the Institutional Class shares, adjusted to reflect the higher expenses applicable to Class R shares. |
| 4 | Historical performance shown for Class R6 shares prior to their inception reflects the performance of Institutional Class shares, and includes the higher expenses applicable to Institutional Class shares. If these expenses had not been included, the returns for Class R6 shares would be higher. |
| 5 | The Russell Midcap® Value Index measures the performance of those Russell Midcap companies with lower price/book ratios and lower forecasted growth values. The stocks are also members of the Russell 1000® Value Index. You cannot invest directly in an index. |
| 6 | The chart compares the performance of Class A shares for the most recent ten years with the Russell Midcap®Value Index. The chart assumes a hypothetical investment of $10,000 in Class A shares and reflects all operating expenses and assumes the maximum initial sales charge of 5.75%. |
| 7 | The ten largest holdings, excluding cash, cash equivalents and any money market funds, are calculated based on the value of the investments divided by total net assets of the Fund. Holdings are subject to change and may have changed since the date specified. |
| 8 | Amounts are calculated based on the total long-term investments of the Fund. These amounts are subject to change and may have changed since the date specified. |
Wells Fargo Special Mid Cap Value Fund | 7
Performance highlights (unaudited)
MANAGER’S DISCUSSION
Fund highlights
| ∎ | | The Fund outperformed its benchmark, the Russell Midcap® Value Index, for the 12-month period that ended September 30, 2019. |
| ∎ | | Contributors to performance included stock selection in the industrials and information technology (IT) sectors. |
| ∎ | | Detractors from performance included an underweight to the real estate sector and stock selection in the consumer staples sector. |
Investors remained optimistic, but volatility increased significantly.
Over the 12-month period, mid-cap value stocks produced moderately positive returns but experienced some significant volatility. The last three months of 2018 saw a sizable correction as investors expressed concerns surrounding tightening monetary policy, continued trade disputes, and slowing global economic growth. The Fund’s focus on flexible balance sheets and sustainable free cash flow provided strong relative returns versus its benchmark during this volatile period. The first nine months of 2019 saw stocks recapture much of the returns that were lost during the previous three months as the prospect for more accommodative monetary policy began to emerge. The Fund outperformed during this period due to strong stock selection across multiple sectors, as our bottom-up process is designed to find companies that can control their own destinies via their clear competitive advantages, sustainable free cash flows, and flexible balance sheets that can be used to grow shareholder value.
We made modest changes to sector weightings.
Our stock-selection process is predominantly driven by our bottom-up stock analysis; this process led to modest changes to the Fund’s sector weightings during the period. We maintained overweights to the industrials and materials sectors but reduced the size of the overweights based on the strong price appreciation of our names affecting reward/risk valuations. In the consumer discretionary sector, the Fund added a few new positions that presented attractive entry points and long-term prospects. The Fund went from a slight overweight to a slight underweight to the IT sector as we trimmed positions after valuations moved higher and individual reward/risk ratios decreased.
Stock selection in the industrials and IT sectors benefited the Fund’s performance.
In the industrials sector, Jacobs Engineering Group Incorporated, a global engineering, consulting, and construction firm, contributed to performance. We were attracted to a transformation that’s unfolding at Jacobs, where management is divesting cyclical and low-margin cash flow streams and replacing them with higher-margin, more stable end markets. This transformation brings with it greater capital deployment optionality and higher returns on capital that are beginning to be recognized by the market and driving the share price higher.
Security selection in the IT sector contributed to relative performance. Euronet Worldwide, Incorporated, provides payment and transaction processing and distribution solutions to financial institutions, retailers, service providers, and individual consumers worldwide. We have been attracted to Euronet’s net cash balance sheet, low capital intensity, and strong free cash flow generation. We believe Euronet will continue to use its balance sheet to pursue attractive organic and acquisitive growth opportunities in the future.
| | | | |
|
| Ten largest holdings(%) as of September 30, 20197 | |
| | |
Kansas City Southern | | | 2.89 | |
| | |
Brown & Brown Incorporated | | | 2.86 | |
| | |
Amdocs Limited | | | 2.77 | |
| | |
Jacobs Engineering Group Incorporated | | | 2.73 | |
| | |
Ameren Corporation | | | 2.71 | |
| | |
American Electric Power Company Incorporated | | | 2.56 | |
| | |
Arch Capital Group Limited | | | 2.36 | |
| | |
Republic Services Incorporated | | | 2.36 | |
| | |
American Water Works Company Incorporated | | | 2.19 | |
| | |
CBRE Group Incorporated Class A | | | 2.18 | |
An underweight to the real estate sector and stock selection in the consumer staples sector detracted from performance.
The Fund’s underweight to the real estate sector detracted from relative performance as the sector outperformed the broader index. The sector benefited from the pullback in10-year Treasury yields as investors fled toward dividend-oriented stocks. We remain underweight the sector as we are finding better reward/risk opportunities elsewhere and believe there are more attractive stocks that could provide support to the Fund if Treasury yields were to continue to fall.
Please see footnotes on page 7.
8 | Wells Fargo Special Mid Cap Value Fund
Performance highlights (unaudited)
|
|
| Sector distribution as of September 30, 20198 |
|
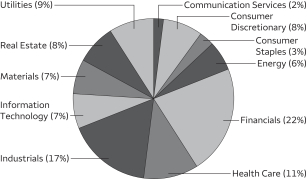 |
Consumer staples holding Molson Coors Brewing Company detracted from performance. The company has generated significant economies of scale and cost synergies with its purchase of the MillerCoors joint venture and has developed a growing free cash flow stream. Slowing North American beer volumes have pressured the industry and expectations for Molson. However, we believe that with an improving balance sheet and cost reduction efforts, free cash flow will remain strong and the long-term reward/risk potential is attractive.
Our outlook for the Fund and our process remain positive.
As we look out over the next 6 to 12 months, we see numerous forces at play that could bring increased volatility. Equity investors continue to balance ongoing trade tensions, slowing global economic growth, and the direction of interest rates. Therun-up to the 2020 presidential election will be watched closely and could have significant influences on the markets. We are not experts in forecasting macro events or the direction of the market; however, it is commonly the sources of macro-driven volatility, such as political events, interest rates, input-cost pressure, regulatory changes, and investing style factors, that create inefficiencies in individual stock prices. We believe it is prudent to manage downside risks, and we will continue to invest in companies that we believe have taken steps to control their own destinies.
We believe our team’s fundamental analysis, risk management, and active investment process are well suited to take advantage of new opportunities as the stock market evolves. While volatility may increase, we look to the strong balance sheets and stable cash flows of the companies within the Fund to support consistent long-term performance. We maintain a favorable outlook for the Fund.
Please see footnotes on page 7.
Wells Fargo Special Mid Cap Value Fund | 9
Fund expenses (unaudited)
As a shareholder of the Fund, you incur two types of costs: (1) transaction costs, including sales charges (loads) on purchase payments and contingent deferred sales charges (if any) on redemptions and (2) ongoing costs, including management fees, distribution(12b-1) and/or shareholder servicing fees, and other Fund expenses. This example is intended to help you understand your ongoing costs (in dollars) of investing in the Fund and to compare these costs with the ongoing costs of investing in other mutual funds.
The example is based on an investment of $1,000 invested at the beginning of thesix-month period and held for the entire period from April 1, 2019 to September 30, 2019.
Actual expenses
The “Actual” line of the table below provides information about actual account values and actual expenses. You may use the information in this line, together with the amount you invested, to estimate the expenses that you paid over the period. Simply divide your account value by $1,000 (for example, an $8,600 account value divided by $1,000 = 8.6), then multiply the result by the number in the “Actual” line under the heading entitled “Expenses paid during period” for your applicable class of shares to estimate the expenses you paid on your account during this period.
Hypothetical example for comparison purposes
The “Hypothetical” line of the table below provides information about hypothetical account values and hypothetical expenses based on the Fund’s actual expense ratio and an assumed rate of return of 5% per year before expenses, which is not the Fund’s actual return. The hypothetical account values and expenses may not be used to estimate the actual ending account balance or expenses you paid for the period. You may use this information to compare the ongoing costs of investing in the Fund and other funds. To do so, compare this 5% hypothetical example with the 5% hypothetical examples that appear in the shareholder reports of the other funds.
Please note that the expenses shown in the table are meant to highlight your ongoing costs only and do not reflect any transactional costs, such as sales charges (loads) and contingent deferred sales charges. Therefore, the “Hypothetical” line of the table is useful in comparing ongoing costs only and will not help you determine the relative total costs of owning different funds. In addition, if these transactional costs were included, your costs would have been higher.
| | | | | | | | | | | | | | | | |
| | | Beginning
account value
4-1-2019 | | | Ending
account value
9-30-2019 | | | Expenses
paid during
the period¹ | | | Annualized net
expense ratio | |
| | | | | |
Class A | | | | | | | | | | | | | | | | |
| | | | |
Actual | | $ | 1,000.00 | | | $ | 1,079.25 | | | $ | 6.01 | | | | 1.15 | % |
| | | | |
Hypothetical (5% return before expenses) | | $ | 1,000.00 | | | $ | 1,019.29 | | | $ | 5.84 | | | | 1.15 | % |
| | | | | |
Class C | | | | | | | | | | | | | | | | |
| | | | |
Actual | | $ | 1,000.00 | | | $ | 1,075.28 | | | $ | 9.91 | | | | 1.90 | % |
| | | | |
Hypothetical (5% return before expenses) | | $ | 1,000.00 | | | $ | 1,015.52 | | | $ | 9.62 | | | | 1.90 | % |
| | | | | |
Class R | | | | | | | | | | | | | | | | |
| | | | |
Actual | | $ | 1,000.00 | | | $ | 1,077.69 | | | $ | 7.31 | | | | 1.40 | % |
| | | | |
Hypothetical (5% return before expenses) | | $ | 1,000.00 | | | $ | 1,018.03 | | | $ | 7.10 | | | | 1.40 | % |
| | | | | |
Class R6 | | | | | | | | | | | | | | | | |
| | | | |
Actual | | $ | 1,000.00 | | | $ | 1,081.74 | | | $ | 3.77 | | | | 0.72 | % |
| | | | |
Hypothetical (5% return before expenses) | | $ | 1,000.00 | | | $ | 1,021.45 | | | $ | 3.66 | | | | 0.72 | % |
| | | | | |
Administrator Class | | | | | | | | | | | | | | | | |
| | | | |
Actual | | $ | 1,000.00 | | | $ | 1,079.74 | | | $ | 5.59 | | | | 1.07 | % |
| | | | |
Hypothetical (5% return before expenses) | | $ | 1,000.00 | | | $ | 1,019.69 | | | $ | 5.43 | | | | 1.07 | % |
| | | | | |
Institutional Class | | | | | | | | | | | | | | | | |
| | | | |
Actual | | $ | 1,000.00 | | | $ | 1,081.01 | | | $ | 4.29 | | | | 0.82 | % |
| | | | |
Hypothetical (5% return before expenses) | | $ | 1,000.00 | | | $ | 1,020.95 | | | $ | 4.17 | | | | 0.82 | % |
| 1 | Expenses paid is equal to the annualized net expense ratio of each class multiplied by the average account value over the period, multiplied by the number of days in the most recent fiscal half-year divided by the number of days in the fiscal year (to reflect theone-half-year period). |
10 | Wells Fargo Special Mid Cap Value Fund
Portfolio of investments—September 30, 2019
| | | | | | | | | | | | | | | | |
| | | | | | | | | Shares | | | Value | |
| Common Stocks: 94.03% | |
|
Communication Services: 1.67% | |
|
| Media: 1.67% | |
Discovery Communications Incorporated Class C † | | | | | | | | | | | 6,254,500 | | | $ | 153,985,790 | |
| | | | | | | | | | | | | | | | |
|
Consumer Discretionary: 7.52% | |
|
| Auto Components: 1.10% | |
Aptiv plc | | | | | | | | | | | 1,165,200 | | | | 101,861,784 | |
| | | | | | | | | | | | | | | | |
|
| Hotels, Restaurants & Leisure: 1.79% | |
Vail Resorts Incorporated | | | | | | | | | | | 394,900 | | | | 89,863,444 | |
Yum China Holdings Incorporated | | | | | | | | | | | 1,665,200 | | | | 75,650,036 | |
| | | | |
| | | | | | | | | | | | | | | 165,513,480 | |
| | | | | | | | | | | | | | | | |
|
| Household Durables: 2.56% | |
D.R. Horton Incorporated | | | | | | | | | | | 2,238,700 | | | | 118,001,877 | |
Mohawk Industries Incorporated † | | | | | | | | | | | 956,200 | | | | 118,635,734 | |
| | | | |
| | | | | | | | | | | | | | | 236,637,611 | |
| | | | | | | | | | | | | | | | |
|
| Multiline Retail: 1.17% | |
Kohl’s Corporation | | | | | | | | | | | 2,167,100 | | | | 107,618,186 | |
| | | | | | | | | | | | | | | | |
|
| Textiles, Apparel & Luxury Goods: 0.90% | |
PVH Corporation | | | | | | | | | | | 939,400 | | | | 82,883,262 | |
| | | | | | | | | | | | | | | | |
|
Consumer Staples: 3.01% | |
|
| Beverages: 2.03% | |
Molson Coors Brewing Company Class B | | | | | | | | | | | 3,248,776 | | | | 186,804,620 | |
| | | | | | | | | | | | | | | | |
|
| Food Products: 0.98% | |
Lamb Weston Holdings Incorporated | | | | | | | | | | | 1,245,900 | | | | 90,601,848 | |
| | | | | | | | | | | | | | | | |
|
Energy: 5.60% | |
|
| Energy Equipment & Services: 1.97% | |
Baker Hughes Incorporated | | | | | | | | | | | 3,208,034 | | | | 74,426,389 | |
National Oilwell Varco Incorporated | | | | | | | | | | | 4,051,400 | | | | 85,889,680 | |
Patterson-UTI Energy Incorporated | | | | | | | | | | | 2,549,700 | | | | 21,799,935 | |
| | | | |
| | | | | | | | | | | | | | | 182,116,004 | |
| | | | | | | | | | | | | | | | |
|
| Oil, Gas & Consumable Fuels: 3.63% | |
Cimarex Energy Company | | | | | | | | | | | 1,579,700 | | | | 75,730,818 | |
Devon Energy Corporation | | | | | | | | | | | 2,242,600 | | | | 53,956,956 | |
Hess Corporation | | | | | | | | | | | 1,335,200 | | | | 80,752,896 | |
Valero Energy Corporation | | | | | | | | | | | 807,300 | | | | 68,814,252 | |
WPX Energy Incorporated † | | | | | | | | | | | 5,217,200 | | | | 55,250,148 | |
| | | | |
| | | | | | | | | | | | | | | 334,505,070 | |
| | | | | | | | | | | | | | | | |
|
Financials: 20.63% | |
|
| Banks: 5.85% | |
Fifth Third Bancorp | | | | | | | | | | | 5,693,200 | | | | 155,879,816 | |
PacWest Bancorp | | | | | | | | | | | 3,216,807 | | | | 116,898,766 | |
Regions Financial Corporation | | | | | | | | | | | 10,252,000 | | | | 162,186,640 | |
Zions Bancorporation | | | | | | | | | | | 2,354,300 | | | | 104,813,436 | |
| | | | |
| | | | | | | | | | | | | | | 539,778,658 | |
| | | | | | | | | | | | | | | | |
Wells Fargo Special Mid Cap Value Fund | 11
Portfolio of investments—September 30, 2019
| | | | | | | | | | | | | | | | |
| | | | | | | | | Shares | | | Value | |
| Capital Markets: 1.01% | |
Northern Trust Corporation | | | | | | | | | | | 1,001,300 | | | $ | 93,441,316 | |
| | | | | | | | | | | | | | | | |
|
| Insurance: 12.20% | |
Arch Capital Group Limited † | | | | | | | | | | | 5,191,908 | | | | 217,956,298 | |
Brown & Brown Incorporated | | | | | | | | | | | 7,317,000 | | | | 263,851,020 | |
Fidelity National Financial Incorporated | | | | | | | | | | | 3,962,214 | | | | 175,961,924 | |
Loews Corporation | | | | | | | | | | | 3,531,100 | | | | 181,781,028 | |
The Allstate Corporation | | | | | | | | | | | 1,831,100 | | | | 199,003,948 | |
Willis Towers Watson plc | | | | | | | | | | | 457,100 | | | | 88,206,587 | |
| | | | |
| | | | | | | | | | | | | | | 1,126,760,805 | |
| | | | | | | | | | | | | | | | |
|
| Mortgage REITs: 1.57% | |
Annaly Capital Management Incorporated | | | | | | | | | | | 16,422,800 | | | | 144,520,640 | |
| | | | | | | | | | | | | | | | |
|
Health Care: 10.35% | |
|
| Health Care Equipment & Supplies: 6.21% | |
Alcon Incorporated † | | | | | | | | | | | 2,550,100 | | | | 148,645,329 | |
Steris plc | | | | | | | | | | | 641,900 | | | | 92,748,131 | |
Varian Medical Systems Incorporated † | | | | | | | | | | | 1,502,000 | | | | 178,873,180 | |
Zimmer Biomet Holdings Incorporated | | | | | | | | | | | 1,112,200 | | | | 152,671,694 | |
| | | | |
| | | | | | | | | | | | | | | 572,938,334 | |
| | | | | | | | | | | | | | | | |
|
| Health Care Providers & Services: 2.97% | |
Humana Incorporated | | | | | | | | | | | 690,300 | | | | 176,489,001 | |
Universal Health Services Incorporated Class B | | | | | | | | | | | 658,200 | | | | 97,907,250 | |
| | | | |
| | | | | | | | | | | | | | | 274,396,251 | |
| | | | | | | | | | | | | | | | |
|
| Life Sciences Tools & Services: 1.17% | |
Charles River Laboratories International Incorporated † | | | | | | | | | | | 820,100 | | | | 108,556,637 | |
| | | | | | | | | | | | | | | | |
|
Industrials: 15.49% | |
|
| Building Products: 1.55% | |
A.O. Smith Corporation | | | | | | | | | | | 1,050,500 | | | | 50,119,355 | |
Masco Corporation | | | | | | | | | | | 453,800 | | | | 18,914,384 | |
Owens Corning Incorporated | | | | | | | | | | | 1,166,830 | | | | 73,743,657 | |
| | | | |
| | | | | | | | | | | | | | | 142,777,396 | |
| | | | | | | | | | | | | | | | |
|
| Commercial Services & Supplies: 2.36% | |
Republic Services Incorporated | | | | | | | | | | | 2,518,175 | | | | 217,948,046 | |
| | | | | | | | | | | | | | | | |
|
| Construction & Engineering: 2.73% | |
Jacobs Engineering Group Incorporated | | | | | | | | | | | 2,754,843 | | | | 252,068,135 | |
| | | | | | | | | | | | | | | | |
|
| Industrial Conglomerates: 1.80% | |
Carlisle Companies Incorporated | | | | | | | | | | | 1,139,137 | | | | 165,789,999 | |
| | | | | | | | | | | | | | | | |
|
| Machinery: 2.87% | |
Cummins Incorporated | | | | | | | | | | | 732,309 | | | | 119,124,705 | |
Stanley Black & Decker Incorporated | | | | | | | | | | | 1,012,700 | | | | 146,244,007 | |
| | | | |
| | | | | | | | | | | | | | | 265,368,712 | |
| | | | | | | | | | | | | | | | |
|
| Road & Rail: 2.89% | |
Kansas City Southern | | | | | | | | | | | 2,006,500 | | | | 266,884,565 | |
| | | | | | | | | | | | | | | | |
12 | Wells Fargo Special Mid Cap Value Fund
Portfolio of investments—September 30, 2019
| | | | | | | | | | | | | | | | |
| | | | | | | | | Shares | | | Value | |
| Trading Companies & Distributors: 1.29% | |
AerCap Holdings NV † | | | | | | | | | | | 2,178,700 | | | $ | 119,283,825 | |
| | | | | | | | | | | | | | | | |
|
Information Technology: 6.74% | |
|
| IT Services: 3.94% | |
Amdocs Limited | | | | | | | | | | | 3,866,300 | | | | 255,601,093 | |
Euronet Worldwide Incorporated † | | | | | | | | | | | 738,000 | | | | 107,969,400 | |
| | | | |
| | | | | | | | | | | | | | | 363,570,493 | |
| | | | | | | | | | | | | | | | |
|
| Semiconductors & Semiconductor Equipment: 0.73% | |
Analog Devices Incorporated | | | | | | | | | | | 603,800 | | | | 67,462,574 | |
| | | | | | | | | | | | | | | | |
|
| Software: 0.54% | |
Check Point Software Technologies Limited † | | | | | | | | | | | 456,400 | | | | 49,975,800 | |
| | | | | | | | | | | | | | | | |
|
| Technology Hardware, Storage & Peripherals: 1.53% | |
NCR Corporation † | | | | | | | | | | | 4,483,720 | | | | 141,506,203 | |
| | | | | | | | | | | | | | | | |
|
Materials: 6.63% | |
|
| Chemicals: 1.94% | |
PPG Industries Incorporated | | | | | | | | | | | 1,510,500 | | | | 179,009,355 | |
| | | | | | | | | | | | | | | | |
|
| Containers & Packaging: 3.74% | |
International Paper Company | | | | | | | | | | | 2,243,200 | | | | 93,810,624 | |
Packaging Corporation of America | | | | | | | | | | | 1,191,013 | | | | 126,366,479 | |
Sealed Air Corporation | | | | | | | | | | | 3,005,100 | | | | 124,741,701 | |
| | | | |
| | | | | | | | | | | | | | | 344,918,804 | |
| | | | | | | | | | | | | | | | |
|
| Metals & Mining: 0.95% | |
Barrick Gold Corporation | | | | | | | | | | | 5,077,700 | | | | 87,996,541 | |
| | | | | | | | | | | | | | | | |
|
Real Estate: 7.68% | |
|
| Equity REITs: 5.50% | |
American Campus Communities Incorporated | | | | | | | | | | | 2,989,805 | | | | 143,749,824 | |
Invitation Homes Incorporated | | | | | | | | | | | 5,885,328 | | | | 174,264,562 | |
Mid-America Apartment Communities Incorporated | | | | | | | | | | | 1,015,700 | | | | 132,051,157 | |
Park Hotels & Resorts Incorporated | | | | | | | | | | | 2,315,200 | | | | 57,810,544 | |
| | | | |
| | | | | | | | | | | | | | | 507,876,087 | |
| | | | | | | | | | | | | | | | |
|
| Real Estate Management & Development: 2.18% | |
CBRE Group Incorporated Class A † | | | | | | | | | | | 3,787,800 | | | | 200,791,278 | |
| | | | | | | | | | | | | | | | |
|
Utilities: 8.71% | |
|
| Electric Utilities: 3.80% | |
American Electric Power Company Incorporated | | | | | | | | | | | 2,525,860 | | | | 236,647,823 | |
FirstEnergy Corporation | | | | | | | | | | | 2,372,900 | | | | 114,444,967 | |
| | | | |
| | | | | | | | | | | | | | | 351,092,790 | |
| | | | | | | | | | | | | | | | |
|
| Multi-Utilities: 2.71% | |
Ameren Corporation | | | | | | | | | | | 3,129,550 | | | | 250,520,478 | |
| | | | | | | | | | | | | | | | |
| | | | |
| Water Utilities: 2.20% | | | | | | | | | | | | |
American Water Works Company Incorporated | | | | | | | | | | | 1,630,400 | | | | 202,544,592 | |
| | | | | | | | | | | | | | | | |
| | | | |
Total Common Stocks (Cost $7,239,835,453) | | | | | | | | | | | | | | | 8,680,305,969 | |
| | | | | | | | | | | | | | | | |
Wells Fargo Special Mid Cap Value Fund | 13
Portfolio of investments—September 30, 2019
| | | | | | | | | | | | | | | | |
| | | Yield | | | | | | Shares | | | Value | |
| Short-Term Investments: 5.72% | | | | | | | | | | | | |
| | | | |
| Investment Companies: 5.72% | | | | | | | | | | | | |
Wells Fargo Government Money Market Fund Select Class (l)(u) | | | 1.88 | % | | | | | | | 528,149,536 | | | $ | 528,149,536 | |
| | | | | | | | | | | | | | | | |
| | | | |
Total Short-Term Investments (Cost $528,149,536) | | | | | | | | | | | | | | | 528,149,536 | |
| | | | | | | | | | | | | | | | |
| | | | | | | | |
| Total investments in securities (Cost $7,767,984,989) | | | 99.75 | % | | | 9,208,455,505 | |
| | |
Other assets and liabilities, net | | | 0.25 | | | | 23,091,475 | |
| | | | | | | | |
| Total net assets | | | 100.00 | % | | $ | 9,231,546,980 | |
| | | | | | | | |
| † | Non-income-earning security |
| (l) | The issuer of the security is an affiliated person of the Fund as defined in the Investment Company Act of 1940. |
| (u) | The rate represents the7-day annualized yield at period end. |
Abbreviations:
| REIT | Real estate investment trust |
Investments in Affiliates
An affiliated investment is an investment in which the Fund owns at least 5% of the outstanding voting shares of the issuer or as a result of other relationships, such as the Fund and the issuer having the same investment manager. Transactions with issuers that were either affiliates of the Fund at the beginning of the period or the end of the period were as follows:
| | | | | | | | | | | | | | | | | | | | | | | | | | | | | | | | | | | | |
| | | Shares,
beginning of
period | | | Shares
purchased | | | Shares
sold | | | Shares,
end of
period | | | Net
realized
gains
(losses) | | | Net
change in
unrealized
gains
(losses) | | | Income
from
affiliated
securities | | | Value,
end of period | | | % of net assets | |
| | | | | | | | | |
| Short-Term Investments | | | | | | | | | | | | | | | | | | | | | | | | | | | |
Investment Companies | | | | | | | | | | | | | | | | | | | | | | | | | | | | | | | | | | | | |
Securities Lending Cash Investments LLC* | | | 0 | | | | 136,660,214 | | | | 136,660,214 | | | | 0 | | | $ | 1,283 | | | $ | 0 | | | $ | 73,452 | # | | $ | 0 | | | | | |
Wells Fargo Government Money Market Fund Select Class | | | 183,466,427 | | | | 2,194,744,793 | | | | 1,850,061,684 | | | | 528,149,536 | | | | 0 | | | | 0 | | | | 7,007,966 | | | | 528,149,536 | | | | | |
| | | | | | | | | | | | | | | | | | | | | | | | | | | | | | | | | | | | |
| | | | | | | | | |
| | | | | | | | | | | | | | | | | | $ | 1,283 | | | $ | 0 | | | $ | 7,081,418 | | | $ | 528,149,536 | | | | 5.72 | % |
| | | | | | | | | | | | | | | | | | | | | | | | | | | | | | | | | | | | |
| * | No longer held at the end of the period |
| # | Amount shown represents income before fees and rebates. |
The accompanying notes are an integral part of these financial statements.
14 | Wells Fargo Special Mid Cap Value Fund
Statement of assets and liabilities—September 30, 2019
| | | | |
| | | | |
| |
Assets | | | | |
Investments in unaffiliated securities, at value (cost $7,239,835,453) | | $ | 8,680,305,969 | |
Investments in affiliated securities, at value (cost $528,149,536) | | | 528,149,536 | |
Receivable for Fund shares sold | | | 29,644,101 | |
Receivable for dividends | | | 15,251,660 | |
| | | | |
Total assets | | | 9,253,351,266 | |
| | | | |
| |
Liabilities | | | | |
Payable for Fund shares redeemed | | | 11,087,198 | |
Management fee payable | | | 5,006,817 | |
Payable for investments purchased | | | 2,925,014 | |
Administration fees payable | | | 886,192 | |
Distribution fees payable | | | 97,292 | |
Trustees’ fees and expenses payable | | | 1,941 | |
Accrued expenses and other liabilities | | | 1,799,832 | |
| | | | |
Total liabilities | | | 21,804,286 | |
| | | | |
Total net assets | | $ | 9,231,546,980 | |
| | | | |
| |
Net assets consist of | | | | |
Paid-in capital | | $ | 7,444,739,102 | |
Total distributable earnings | | | 1,786,807,878 | |
| | | | |
Total net assets | | $ | 9,231,546,980 | |
| | | | |
| |
Computation of net asset value and offering price per share | | | | |
Net assets – Class A | | $ | 1,003,560,044 | |
Shares outstanding – Class A1 | | | 25,325,846 | |
Net asset value per share – Class A | | | $39.63 | |
Maximum offering price per share – Class A2 | | | $42.05 | |
Net assets – Class C | | $ | 147,085,852 | |
Shares outstanding – Class C1 | | | 3,886,099 | |
Net asset value per share – Class C | | | $37.85 | |
Net assets – Class R | | $ | 31,961,269 | |
Shares outstanding – Class R1 | | | 797,138 | |
Net asset value per share – Class R | | | $40.10 | |
Net assets – Class R6 | | $ | 2,094,860,168 | |
Shares outstanding – Class R61 | | | 51,400,729 | |
Net asset value per share – Class R6 | | | $40.76 | |
Net assets – Administrator Class | | $ | 604,126,472 | |
Shares outstanding – Administrator Class1 | | | 14,971,537 | |
Net asset value per share – Administrator Class | | | $40.35 | |
Net assets – Institutional Class | | $ | 5,349,953,175 | |
Shares outstanding – Institutional Class1 | | | 131,453,098 | |
Net asset value per share – Institutional Class | | | $40.70 | |
| 1 | The Fund has an unlimited number of authorized shares. |
| 2 | Maximum offering price is computed as 100/94.25 of net asset value. On investments of $50,000 or more, the offering price is reduced. |
The accompanying notes are an integral part of these financial statements.
Wells Fargo Special Mid Cap Value Fund | 15
Statement of operations—year ended September 30, 2019
| | | | |
| | | | |
| |
Investment income | | | | |
Dividends | | $ | 143,012,471 | |
Income from affiliated securities | | | 7,018,034 | |
| | | | |
Total investment income | | | 150,030,505 | |
| | | | |
| |
Expenses | | | | |
Management fee | | | 55,014,863 | |
Administration fees | | | | |
Class A | | | 2,021,560 | |
Class C | | | 313,327 | |
Class R | | | 59,535 | |
Class R6 | | | 492,287 | |
Administrator Class | | | 917,106 | |
Institutional Class | | | 6,159,860 | |
Shareholder servicing fees | | | | |
Class A | | | 2,406,619 | |
Class C | | | 373,009 | |
Class R | | | 70,874 | |
Administrator Class | | | 1,761,907 | |
Distribution fees | | | | |
Class C | | | 1,119,020 | |
Class R | | | 70,854 | |
Custody and accounting fees | | | 266,107 | |
Professional fees | | | 44,990 | |
Registration fees | | | 487,670 | |
Shareholder report expenses | | | 961,200 | |
Trustees’ fees and expenses | | | 21,652 | |
Other fees and expenses | | | 90,004 | |
| | | | |
Total expenses | | | 72,652,444 | |
Less: Fee waivers and/or expense reimbursements | | | | |
Class A | | | (64 | ) |
Class C | | | (8 | ) |
Class R | | | (18 | ) |
Class R6 | | | (1,973 | ) |
Administrator Class | | | (10 | ) |
| | | | |
Net expenses | | | 72,650,371 | |
| | | | |
Net investment income | | | 77,380,134 | |
| | | | |
| |
Realized and unrealized gains (losses) on investments | | | | |
Net realized gains on | | | | |
Unaffiliated securities | | | 303,690,278 | |
Affiliated securities | | | 1,283 | |
| | | | |
Net realized gains on investments | | | 303,691,561 | |
Net change in unrealized gains (losses) on investments | | | 233,760,522 | |
| | | | |
Net realized and unrealized gains (losses) on investments | | | 537,452,083 | |
| | | | |
Net increase in net assets resulting from operations | | $ | 614,832,217 | |
| | | | |
The accompanying notes are an integral part of these financial statements.
16 | Wells Fargo Special Mid Cap Value Fund
Statement of changes in net assets
| | | | | | | | | | | | | | | | |
| | | Year ended
September 30, 2019 | | | Year ended
September 30, 2018 | |
| | | | |
Operations | | | | | | | | | | | | | | | | |
Net investment income | | | | | | $ | 77,380,134 | | | | | | | $ | 55,406,539 | |
Net realized gains on investments | | | | | | | 303,691,561 | | | | | | | | 170,032,209 | |
Net change in unrealized gains (losses) on investments | | | | | | | 233,760,522 | | | | | | | | 160,007,260 | |
| | | | |
Net increase in net assets resulting from operations | | | | | | | 614,832,217 | | | | | | | | 385,446,008 | |
| | | | |
| | | | |
Distributions to shareholders from net investment income and net realized gains | | | | | | | | | | | | | | | | |
Class A | | | | | | | (20,592,515 | ) | | | | | | | (44,792,710 | ) |
Class C | | | | | | | (2,703,167 | ) | | | | | | | (7,147,489 | ) |
Class R | | | | | | | (562,316 | ) | | | | | | | (758,370 | ) |
Class R6 | | | | | | | (36,838,837 | ) | | | | | | | (46,138,407 | ) |
Administrator Class | | | | | | | (17,454,931 | ) | | | | | | | (48,230,988 | ) |
Institutional Class | | | | | | | (114,026,310 | ) | | | | | | | (209,509,970 | ) |
| | | | |
Total distributions to shareholders | | | | | | | (192,178,076 | ) | | | | | | | (356,577,934 | ) |
| | | | |
| | | | |
Capital share transactions | | | Shares | | | | | | | | Shares | | | | | |
Proceeds from shares sold | | | | | | | | | | | | | | | | |
Class A | | | 5,327,538 | | | | 192,757,937 | | | | 8,052,054 | | | | 299,880,019 | |
Class C | | | 395,515 | | | | 13,743,148 | | | | 955,547 | | | | 34,325,290 | |
Class R | | | 312,326 | | | | 11,470,210 | | | | 449,380 | | | | 17,074,096 | |
Class R6 | | | 19,811,243 | | | | 753,877,254 | | | | 21,764,043 | | | | 834,124,233 | |
Administrator Class | | | 2,524,441 | | | | 92,078,365 | | | | 9,533,075 | | | | 364,176,209 | |
Institutional Class | | | 49,318,478 | | | | 1,865,932,723 | | | | 44,252,567 | | | | 1,696,256,312 | |
| | | | |
| | | | | | | 2,929,859,637 | | | | | | | | 3,245,836,159 | |
| | | | |
Reinvestment of distributions | | | | | | | | | | | | | | | | |
Class A | | | 578,559 | | | | 19,307,072 | | | | 1,134,296 | | | | 42,153,674 | |
Class C | | | 79,940 | | | | 2,563,693 | | | | 190,448 | | | | 6,787,622 | |
Class R | | | 16,602 | | | | 561,690 | | | | 20,056 | | | | 757,010 | |
Class R6 | | | 1,023,710 | | | | 35,011,870 | | | | 1,188,583 | | | | 45,410,964 | |
Administrator Class | | | 512,565 | | | | 17,408,508 | | | | 1,273,292 | | | | 48,143,405 | |
Institutional Class | | | 3,085,272 | | | | 105,464,480 | | | | 5,050,159 | | | | 192,715,031 | |
| | | | |
| | | | | | | 180,317,313 | | | | | | | | 335,967,706 | |
| | | | |
Payment for shares redeemed | | | | | | | | | | | | | | | | |
Class A | | | (8,214,077 | ) | | | (295,833,462 | ) | | | (10,111,787 | ) | | | (376,581,084 | ) |
Class C | | | (1,443,715 | ) | | | (49,286,556 | ) | | | (1,618,894 | ) | | | (57,851,833 | ) |
Class R | | | (177,050 | ) | | | (6,492,936 | ) | | | (205,099 | ) | | | (7,778,102 | ) |
Class R6 | | | (8,066,799 | ) | | | (299,782,094 | ) | | | (7,858,969 | ) | | | (300,909,538 | ) |
Administrator Class | | | (13,653,775 | ) | | | (493,668,005 | ) | | | (15,565,814 | ) | | | (589,131,375 | ) |
Institutional Class | | | (48,844,550 | ) | | | (1,804,574,146 | ) | | | (40,848,909 | ) | | | (1,566,068,850 | ) |
| | | | |
| | | | | | | (2,949,637,199 | ) | | | | | | | (2,898,320,782 | ) |
| | | | |
Net increase in net assets resulting from capital share transactions | | | | | | | 160,539,751 | | | | | | | | 683,483,083 | |
| | | | |
Total increase in net assets | | | | | | | 583,193,892 | | | | | | | | 712,351,157 | |
| | | | |
| | | | |
Net assets | | | | | | | | | | | | | | | | |
Beginning of period | | | | | | | 8,648,353,088 | | | | | | | | 7,936,001,931 | |
| | | | |
End of period | | | | | | $ | 9,231,546,980 | | | | | | | $ | 8,648,353,088 | |
| | | | |
The accompanying notes are an integral part of these financial statements.
Wells Fargo Special Mid Cap Value Fund | 17
Financial highlights
(For a share outstanding throughout each period)
| | | | | | | | | | | | | | | | | | | | |
| | | Year ended September 30 | |
| CLASS A | | 2019 | | | 2018 | | | 2017 | | | 2016 | | | 2015 | |
Net asset value, beginning of period | | | $37.59 | | | | $37.49 | | | | $33.12 | | | | $29.91 | | | | $32.68 | |
Net investment income | | | 0.26 | | | | 0.15 | | | | 0.33 | | | | 0.19 | | | | 0.25 | |
Net realized and unrealized gains (losses) on investments | | | 2.54 | | | | 1.50 | | | | 4.42 | | | | 4.23 | | | | 0.07 | |
| | | | | | | | | | | | | | | | | | | | |
Total from investment operations | | | 2.80 | | | | 1.65 | | | | 4.75 | | | | 4.42 | | | | 0.32 | |
Distributions to shareholders from | | | | | | | | | | | | | | | | | | | | |
Net investment income | | | (0.17 | ) | | | (0.23 | ) | | | (0.19 | ) | | | (0.08 | ) | | | (0.18 | ) |
Net realized gains | | | (0.59 | ) | | | (1.32 | ) | | | (0.19 | ) | | | (1.13 | ) | | | (2.91 | ) |
| | | | | | | | | | | | | | | | | | | | |
Total distributions to shareholders | | | (0.76 | ) | | | (1.55 | ) | | | (0.38 | ) | | | (1.21 | ) | | | (3.09 | ) |
Net asset value, end of period | | | $39.63 | | | | $37.59 | | | | $37.49 | | | | $33.12 | | | | $29.91 | |
Total return1 | | | 7.81 | % | | | 4.50 | % | | | 14.41 | % | | | 15.34 | % | | | 0.69 | % |
Ratios to average net assets (annualized) | | | | | | | | | | | | | | | | | | | | |
Gross expenses | | | 1.15 | % | | | 1.15 | % | | | 1.18 | % | | | 1.19 | % | | | 1.25 | % |
Net expenses | | | 1.15 | % | | | 1.15 | % | | | 1.18 | % | | | 1.19 | % | | | 1.24 | % |
Net investment income | | | 0.67 | % | | | 0.40 | % | | | 0.78 | % | | | 0.82 | % | | | 0.85 | % |
Supplemental data | | | | | | | | | | | | | | | | | | | | |
Portfolio turnover rate | | | 37 | % | | | 37 | % | | | 46 | % | | | 30 | % | | | 58 | % |
Net assets, end of period (000s omitted) | | | $1,003,560 | | | | $1,038,883 | | | | $1,070,690 | | | | $1,363,213 | | | | $509,386 | |
| 1 | Total return calculations do not include any sales charges. |
The accompanying notes are an integral part of these financial statements.
18 | Wells Fargo Special Mid Cap Value Fund
Financial highlights
(For a share outstanding throughout each period)
| | | | | | | | | | | | | | | | | | | | |
| | | Year ended September 30 | |
| CLASS C | | 2019 | | | 2018 | | | 2017 | | | 2016 | | | 2015 | |
Net asset value, beginning of period | | | $36.02 | | | | $36.03 | | | | $31.91 | | | | $29.00 | | | | $31.82 | |
Net investment income (loss) | | | (0.07 | ) | | | (0.14 | ) | | | 0.06 | | | | 0.03 | | | | 0.02 | 1 |
Net realized and unrealized gains (losses) on investments | | | 2.49 | | | | 1.46 | | | | 4.26 | | | | 4.02 | | | | 0.07 | |
| | | | | | | | | | | | | | | | | | | | |
Total from investment operations | | | 2.42 | | | | 1.32 | | | | 4.32 | | | | 4.05 | | | | 0.09 | |
Distributions to shareholders from | | | | | | | | | | | | | | | | | | | | |
Net investment income | | | 0.00 | | | | (0.01 | ) | | | (0.01 | ) | | | (0.01 | ) | | | 0.00 | |
Net realized gains | | | (0.59 | ) | | | (1.32 | ) | | | (0.19 | ) | | | (1.13 | ) | | | (2.91 | ) |
| | | | | | | | | | | | | | | | | | | | |
Total distributions to shareholders | | | (0.59 | ) | | | (1.33 | ) | | | (0.20 | ) | | | (1.14 | ) | | | (2.91 | ) |
Net asset value, end of period | | | $37.85 | | | | $36.02 | | | | $36.03 | | | | $31.91 | | | | $29.00 | |
Total return2 | | | 7.00 | % | | | 3.72 | % | | | 13.56 | % | | | 14.47 | % | | | (0.05 | )% |
Ratios to average net assets (annualized) | | | | | | | | | | | | | | | | | | | | |
Gross expenses | | | 1.90 | % | | | 1.90 | % | | | 1.92 | % | | | 1.94 | % | | | 2.00 | % |
Net expenses | | | 1.90 | % | | | 1.90 | % | | | 1.92 | % | | | 1.94 | % | | | 1.99 | % |
Net investment income (loss) | | | (0.09 | )% | | | (0.35 | )% | | | 0.14 | % | | | 0.03 | % | | | 0.08 | % |
Supplemental data | | | | | | | | | | | | | | | | | | | | |
Portfolio turnover rate | | | 37 | % | | | 37 | % | | | 46 | % | | | 30 | % | | | 58 | % |
Net assets, end of period (000s omitted) | | | $147,086 | | | | $174,839 | | | | $191,954 | | | | $116,022 | | | | $63,431 | |
| 1 | Calculated based upon average shares outstanding |
| 2 | Total return calculations do not include any sales charges. |
The accompanying notes are an integral part of these financial statements.
Wells Fargo Special Mid Cap Value Fund | 19
Financial highlights
(For a share outstanding throughout each period)
| | | | | | | | | | | | | | | | | | | | |
| | | Year ended September 30 | |
| CLASS R | | 2019 | | | 2018 | | | 2017 | | | 2016 | | | 20151 | |
Net asset value, beginning of period | | | $38.09 | | | | $38.08 | | | | $33.78 | | | | $30.70 | | | | $30.70 | |
Net investment income | | | 0.17 | | | | 0.09 | | | | 0.32 | | | | 0.12 | 2 | | | 0.00 | |
Net realized and unrealized gains (losses) on investments | | | 2.57 | | | | 1.49 | | | | 4.43 | | | | 4.32 | | | | 0.00 | |
| | | | | | | | | | | | | | | | | | | | |
Total from investment operations | | | 2.74 | | | | 1.58 | | | | 4.75 | | | | 4.44 | | | | 0.00 | |
Distributions to shareholders from | | | | | | | | | | | | | | | | | | | | |
Net investment income | | | (0.14 | ) | | | (0.25 | ) | | | (0.26 | ) | | | (0.23 | ) | | | 0.00 | |
Net realized gains | | | (0.59 | ) | | | (1.32 | ) | | | (0.19 | ) | | | (1.13 | ) | | | 0.00 | |
| | | | | | | | | | | | | | | | | | | | |
Total distributions to shareholders | | | (0.73 | ) | | | (1.57 | ) | | | (0.45 | ) | | | (1.36 | ) | | | 0.00 | |
Net asset value, end of period | | | $40.10 | | | | $38.09 | | | | $38.08 | | | | $33.78 | | | | $30.70 | |
Total return3 | | | 7.52 | % | | | 4.23 | % | | | 14.13 | % | | | 15.05 | % | | | 0.00 | % |
Ratios to average net assets (annualized) | | | | | | | | | | | | | | | | | | | | |
Gross expenses | | | 1.40 | % | | | 1.40 | % | | | 1.42 | % | | | 1.44 | % | | | 0.00 | % |
Net expenses | | | 1.40 | % | | | 1.40 | % | | | 1.42 | % | | | 1.44 | % | | | 0.00 | % |
Net investment income | | | 0.43 | % | | | 0.18 | % | | | 0.77 | % | | | 0.37 | % | | | 0.00 | % |
Supplemental data | | | | | | | | | | | | | | | | | | | | |
Portfolio turnover rate | | | 37 | % | | | 37 | % | | | 46 | % | | | 30 | % | | | 58 | % |
Net assets, end of period (000s omitted) | | | $31,961 | | | | $24,575 | | | | $14,505 | | | | $1,778 | | | | $25 | |
| 1 | The class commenced operations on September 30, 2015. Information represents activity for the one day of operation. |
| 2 | Calculated based upon average shares outstanding |
| 3 | Returns for periods of less than one year are not annualized. |
The accompanying notes are an integral part of these financial statements.
20 | Wells Fargo Special Mid Cap Value Fund
Financial highlights
(For a share outstanding throughout each period)
| | | | | | | | | | | | | | | | | | | | |
| | | Year ended September 30 | |
| CLASS R6 | | 2019 | | | 2018 | | | 2017 | | | 2016 | | | 2015 | |
Net asset value, beginning of period | | | $38.67 | | | | $38.52 | | | | $34.03 | | | | $30.71 | | | | $33.39 | |
Net investment income | | | 0.40 | | | | 0.32 | 1 | | | 0.50 | 1 | | | 0.38 | 1 | | | 0.41 | 1 |
Net realized and unrealized gains (losses) on investments | | | 2.62 | | | | 1.55 | | | | 4.53 | | | | 4.30 | | | | 0.05 | |
| | | | | | | | | | | | | | | | | | | | |
Total from investment operations | | | 3.02 | | | | 1.87 | | | | 5.03 | | | | 4.68 | | | | 0.46 | |
Distributions to shareholders from | | | | | | | | | | | | | | | | | | | | |
Net investment income | | | (0.34 | ) | | | (0.40 | ) | | | (0.35 | ) | | | (0.23 | ) | | | (0.23 | ) |
Net realized gains | | | (0.59 | ) | | | (1.32 | ) | | | (0.19 | ) | | | (1.13 | ) | | | (2.91 | ) |
| | | | | | | | | | | | | | | | | | | | |
Total distributions to shareholders | | | (0.93 | ) | | | (1.72 | ) | | | (0.54 | ) | | | (1.36 | ) | | | (3.14 | ) |
Net asset value, end of period | | | $40.76 | | | | $38.67 | | | | $38.52 | | | | $34.03 | | | | $30.71 | |
Total return | | | 8.28 | % | | | 4.95 | % | | | 14.88 | % | | | 15.84 | % | | | 1.14 | % |
Ratios to average net assets (annualized) | | | | | | | | | | | | | | | | | | | | |
Gross expenses | | | 0.72 | % | | | 0.72 | % | | | 0.74 | % | | | 0.76 | % | | | 0.79 | % |
Net expenses | | | 0.72 | % | | | 0.72 | % | | | 0.74 | % | | | 0.76 | % | | | 0.79 | % |
Net investment income | | | 1.12 | % | | | 0.85 | % | | | 1.37 | % | | | 1.21 | % | | | 1.26 | % |
Supplemental data | | | | | | | | | | | | | | | | | | | | |
Portfolio turnover rate | | | 37 | % | | | 37 | % | | | 46 | % | | | 30 | % | | | 58 | % |
Net assets, end of period (000s omitted) | | | $2,094,860 | | | | $1,493,787 | | | | $906,784 | | | | $374,557 | | | | $105,973 | |
| 1 | Calculated based upon average shares outstanding |
The accompanying notes are an integral part of these financial statements.
Wells Fargo Special Mid Cap Value Fund | 21
Financial highlights
(For a share outstanding throughout each period)
| | | | | | | | | | | | | | | | | | | | |
| | | Year ended September 30 | |
| ADMINISTRATOR CLASS | | 2019 | | | 2018 | | | 2017 | | | 2016 | | | 2015 | |
Net asset value, beginning of period | | | $38.23 | | | | $38.12 | | | | $33.67 | | | | $30.45 | | | | $33.14 | |
Net investment income | | | 0.27 | 1 | | | 0.18 | 1 | | | 0.34 | 1 | | | 0.26 | | | | 0.31 | 1 |
Net realized and unrealized gains (losses) on investments | | | 2.61 | | | | 1.52 | | | | 4.52 | | | | 4.26 | | | | 0.05 | |
| | | | | | | | | | | | | | | | | | | | |
Total from investment operations | | | 2.88 | | | | 1.70 | | | | 4.86 | | | | 4.52 | | | | 0.36 | |
Distributions to shareholders from | | | | | | | | | | | | | | | | | | | | |
Net investment income | | | (0.17 | ) | | | (0.27 | ) | | | (0.22 | ) | | | (0.17 | ) | | | (0.14 | ) |
Net realized gains | | | (0.59 | ) | | | (1.32 | ) | | | (0.19 | ) | | | (1.13 | ) | | | (2.91 | ) |
| | | | | | | | | | | | | | | | | | | | |
Total distributions to shareholders | | | (0.76 | ) | | | (1.59 | ) | | | (0.41 | ) | | | (1.30 | ) | | | (3.05 | ) |
Net asset value, end of period | | | $40.35 | | | | $38.23 | | | | $38.12 | | | | $33.67 | | | | $30.45 | |
Total return | | | 7.88 | % | | | 4.58 | % | | | 14.50 | % | | | 15.42 | % | | | 0.84 | % |
Ratios to average net assets (annualized) | | | | | | | | | | | | | | | | | | | | |
Gross expenses | | | 1.07 | % | | | 1.07 | % | | | 1.09 | % | | | 1.10 | % | | | 1.12 | % |
Net expenses | | | 1.07 | % | | | 1.07 | % | | | 1.09 | % | | | 1.10 | % | | | 1.11 | % |
Net investment income | | | 0.72 | % | | | 0.47 | % | | | 0.95 | % | | | 0.88 | % | | | 0.95 | % |
Supplemental data | | | | | | | | | | | | | | | | | | | | |
Portfolio turnover rate | | | 37 | % | | | 37 | % | | | 46 | % | | | 30 | % | | | 58 | % |
Net assets, end of period (000s omitted) | | | $604,126 | | | | $978,368 | | | | $1,156,796 | | | | $834,134 | | | | $394,188 | |
| 1 | Calculated based upon average shares outstanding |
The accompanying notes are an integral part of these financial statements.
22 | Wells Fargo Special Mid Cap Value Fund
Financial highlights
(For a share outstanding throughout each period)
| | | | | | | | | | | | | | | | | | | | |
| | | Year ended September 30 | |
| INSTITUTIONAL CLASS | | 2019 | | | 2018 | | | 2017 | | | 2016 | | | 2015 | |
Net asset value, beginning of period | | | $38.61 | | | | $38.47 | | | | $34.00 | | | | $30.70 | | | | $33.38 | |
Net investment income | | | 0.38 | 1 | | | 0.26 | | | | 0.41 | | | | 0.35 | 1 | | | 0.41 | 1 |
Net realized and unrealized gains (losses) on investments | | | 2.60 | | | | 1.56 | | | | 4.58 | | | | 4.29 | | | | 0.04 | |
| | | | | | | | | | | | | | | | | | | | |
Total from investment operations | | | 2.98 | | | | 1.82 | | | | 4.99 | | | | 4.64 | | | | 0.45 | |
Distributions to shareholders from | | | | | | | | | | | | | | | | | | | | |
Net investment income | | | (0.30 | ) | | | (0.36 | ) | | | (0.33 | ) | | | (0.21 | ) | | | (0.22 | ) |
Net realized gains | | | (0.59 | ) | | | (1.32 | ) | | | (0.19 | ) | | | (1.13 | ) | | | (2.91 | ) |
| | | | | | | | | | | | | | | | | | | | |
Total distributions to shareholders | | | (0.89 | ) | | | (1.68 | ) | | | (0.52 | ) | | | (1.34 | ) | | | (3.13 | ) |
Net asset value, end of period | | | $40.70 | | | | $38.61 | | | | $38.47 | | | | $34.00 | | | | $30.70 | |
Total return | | | 8.17 | % | | | 4.84 | % | | | 14.76 | % | | | 15.73 | % | | | 1.10 | % |
Ratios to average net assets (annualized) | | | | | | | | | | | | | | | | | | | | |
Gross expenses | | | 0.82 | % | | | 0.82 | % | | | 0.84 | % | | | 0.86 | % | | | 0.85 | % |
Net expenses | | | 0.82 | % | | | 0.82 | % | | | 0.84 | % | | | 0.86 | % | | | 0.85 | % |
Net investment income | | | 1.00 | % | | | 0.73 | % | | | 1.24 | % | | | 1.07 | % | | | 1.23 | % |
Supplemental data | | | | | | | | | | | | | | | | | | | | |
Portfolio turnover rate | | | 37 | % | | | 37 | % | | | 46 | % | | | 30 | % | | | 58 | % |
Net assets, end of period (000s omitted) | | | $5,349,953 | | | | $4,937,901 | | | | $4,595,274 | | | | $2,325,777 | | | | $411,919 | |
| 1 | Calculated based upon average shares outstanding |
The accompanying notes are an integral part of these financial statements.
Wells Fargo Special Mid Cap Value Fund | 23
Notes to financial statements
1. ORGANIZATION
Wells Fargo Funds Trust (the “Trust”), a Delaware statutory trust organized on March 10, 1999, is anopen-end management investment company registered under the Investment Company Act of 1940, as amended (the “1940 Act”). As an investment company, the Trust follows the accounting and reporting guidance in Financial Accounting Standards Board (“FASB”)Accounting Standards Codification Topic 946, Financial Services – Investment Companies. These financial statements report on the Wells Fargo Special Mid Cap Value Fund (the “Fund”) which is a diversified series of the Trust.
2. SIGNIFICANT ACCOUNTING POLICIES
The following significant accounting policies, which are consistently followed in the preparation of the financial statements of the Fund, are in conformity with U.S. generally accepted accounting principles which require management to make estimates and assumptions that affect the reported amounts of assets and liabilities, disclosure of contingent assets and liabilities at the date of the financial statements, and the reported amounts of revenues and expenses during the reporting period. Actual results could differ from those estimates.
Securities valuation
All investments are valued each business day as of the close of regular trading on the New York Stock Exchange (generally 4 p.m. Eastern Time), although the Fund may deviate from this calculation time under unusual or unexpected circumstances.
Equity securities that are listed on a foreign or domestic exchange or market are valued at the official closing price or, if none, the last sales price. If no sale occurs on the principal exchange or market that day, a fair value price will be determined in accordance with the Fund’s Valuation Procedures.
Investments in registeredopen-end investment companies are valued at net asset value. Interests innon-registered investment companies that are redeemable at net asset value are fair valued normally at net asset value.
Investments which are not valued using any of the methods discussed above are valued at their fair value, as determined in good faith by the Board of Trustees of the Fund. The Board of Trustees has established a Valuation Committee comprised of the Trustees and has delegated to it the authority to take any actions regarding the valuation of portfolio securities that the Valuation Committee deems necessary or appropriate, including determining the fair value of portfolio securities, unless the determination has been delegated to the Wells Fargo Asset Management Pricing Committee at Wells Fargo Funds Management, LLC (“Funds Management”). The Board of Trustees retains the authority to make or ratify any valuation decisions or approve any changes to the Valuation Procedures as it deems appropriate. On a quarterly basis, the Board of Trustees receives reports on any valuation actions taken by the Valuation Committee or the Wells Fargo Asset Management Pricing Committee which may include items for ratification.
Securities lending
The Fund may lend its securities from time to time in order to earn additional income in the form of fees or interest on securities received as collateral or the investment of any cash received as collateral. When securities are on loan, the Fund receives interest or dividends on those securities. Cash collateral received in connection with its securities lending transactions is invested in Securities Lending Cash Investments, LLC (the “Securities Lending Fund”). Investments in Securities Lending Fund are valued at the evaluated bid price provided by an independent pricing service. Income earned from investment in the Securities Lending Fund (net of fees and rebates), if any, is included in income from affiliated securities on the Statement of Operations.
In a securities lending transaction, the net asset value of the Fund is affected by an increase or decrease in the value of the securities loaned and by an increase or decrease in the value of the instrument in which collateral is invested. The amount of securities lending activity undertaken by the Fund fluctuates from time to time. The Fund has the right under the lending agreement to recover the securities from the borrower on demand. In the event of default or bankruptcy by the borrower, the Fund may be prevented from recovering the loaned securities or gaining access to the collateral or may experience delays or costs in doing so. In such an event, the terms of the agreement allows the unaffiliated securities lending agent to use the collateral to purchase replacement securities on behalf of the Fund or pay the Fund the market value of the loaned securities. The Fund bears the risk of loss with respect to depreciation of its investment of the cash collateral.
Security transactions and income recognition
Securities transactions are recorded on a trade date basis. Realized gains or losses are recorded on the basis of identified cost.
Dividend income is recognized on theex-dividend date.
24 | Wells Fargo Special Mid Cap Value Fund
Notes to financial statements
Distributions to shareholders
Distributions to shareholders from net investment income and any net realized gains are recorded on theex-dividend date and paid at least annually. Such distributions are determined in accordance with income tax regulations and may differ from U.S. generally accepted accounting principles. Dividend sources are estimated at the time of declaration. The tax character of distributions is determined as of the Fund’s fiscal year end. Therefore, a portion of the Fund’s distributions made prior to the Fund’s fiscal year end may be categorized as a tax return of capital at year end.
Federal and other taxes
The Fund intends to continue to qualify as a regulated investment company by distributing substantially all of its investment company taxable income and any net realized capital gains (after reduction for capital loss carryforwards) sufficient to relieve it from all, or substantially all, federal income taxes. Accordingly, no provision for federal income taxes was required.
The Fund’s income and federal excise tax returns and all financial records supporting those returns for the prior three fiscal years are subject to examination by the federal and Delaware revenue authorities. Management has analyzed the Fund’s tax positions taken on federal, state, and foreign tax returns for all open tax years and does not believe that there are any uncertain tax positions that require recognition of a tax liability.
As of September 30, 2019, the aggregate cost of all investments for federal income tax purposes was $7,782,106,944 and the unrealized gains (losses) consisted of:
| | | | |
| |
Gross unrealized gains | | $ | 1,815,816,717 | |
| |
Gross unrealized losses | | | (389,468,156 | ) |
| |
Net unrealized gains | | $ | 1,426,348,561 | |
Class allocations
The separate classes of shares offered by the Fund differ principally in applicable sales charges, distribution, shareholder servicing, and administration fees. Class specific expenses are charged directly to that share class. Investment income, common fund-level expenses, and realized and unrealized gains (losses) on investments are allocated daily to each class of shares based on the relative proportion of net assets of each class.
3. FAIR VALUATION MEASUREMENTS
Fair value measurements of investments are determined within a framework that has established a fair value hierarchy based upon the various data inputs utilized in determining the value of the Fund’s investments. The three-level hierarchy gives the highest priority to unadjusted quoted prices in active markets for identical assets or liabilities (Level 1) and the lowest priority to unobservable inputs (Level 3). The Fund’s investments are classified within the fair value hierarchy based on the lowest level of input that is significant to the fair value measurement. The inputs are summarized into three broad levels as follows:
| ∎ | | Level 1 – quoted prices in active markets for identical securities |
| ∎ | | Level 2 – other significant observable inputs (including quoted prices for similar securities, interest rates, prepayment speeds, credit risk, etc.) |
| ∎ | | Level 3 – significant unobservable inputs (including the Fund’s own assumptions in determining the fair value of investments) |
The inputs or methodologies used for valuing investments in securities are not necessarily an indication of the risk associated with investing in those securities.
Wells Fargo Special Mid Cap Value Fund | 25
Notes to financial statements
The following is a summary of the inputs used in valuing the Fund’s assets and liabilities as of September 30, 2019:
| | | | | | | | | | | | | | | | |
| | | | |
| | | Quoted prices
(Level 1) | | | Other significant
observable inputs
(Level 2) | | | Significant
unobservable inputs (Level 3) | | | Total | |
| | | | |
Assets | | | | | | | | | | | | | | | | |
Investments in: | | | | | | | | | | | | | | | | |
| | | | |
Common stocks | | | | | | | | | | | | | | | | |
| | | | |
Communication services | | $ | 153,985,790 | | | $ | 0 | | | $ | 0 | | | $ | 153,985,790 | |
| | | | |
Consumer discretionary | | | 694,514,323 | | | | 0 | | | | 0 | | | | 694,514,323 | |
| | | | |
Consumer staples | | | 277,406,468 | | | | 0 | | | | 0 | | | | 277,406,468 | |
| | | | |
Energy | | | 516,621,074 | | | | 0 | | | | 0 | | | | 516,621,074 | |
| | | | |
Financials | | | 1,904,501,419 | | | | 0 | | | | 0 | | | | 1,904,501,419 | |
| | | | |
Health care | | | 955,891,222 | | | | 0 | | | | 0 | | | | 955,891,222 | |
| | | | |
Industrials | | | 1,430,120,678 | | | | 0 | | | | 0 | | | | 1,430,120,678 | |
| | | | |
Information technology | | | 622,515,070 | | | | 0 | | | | 0 | | | | 622,515,070 | |
| | | | |
Materials | | | 611,924,700 | | | | 0 | | | | 0 | | | | 611,924,700 | |
| | | | |
Real estate | | | 708,667,365 | | | | 0 | | | | 0 | | | | 708,667,365 | |
| | | | |
Utilities | | | 804,157,860 | | | | 0 | | | | 0 | | | | 804,157,860 | |
| | | | |
Short-term investments | | | | | | | | | | | | | | | | |
| | | | |
Investment companies | | | 528,149,536 | | | | 0 | | | | 0 | | | | 528,149,536 | |
| | | | |
Total assets | | $ | 9,208,455,505 | | | $ | 0 | | | $ | 0 | | | $ | 9,208,455,505 | |
Additional sector, industry or geographic detail is included in the Portfolio of Investments.
For the year ended September 30, 2019, the Fund did not have any transfers into/out of Level 3.
4. TRANSACTIONS WITH AFFILIATES
Management fee
Funds Management, an indirect wholly owned subsidiary of Wells Fargo & Company (“Wells Fargo”), is the manager of the Fund and provides advisory and fund-level administrative services under an investment management agreement. Under the investment management agreement, Funds Management is responsible for, among other services, implementing the investment objectives and strategies of the Fund, supervising the subadviser and providing fund-level administrative services in connection with the Fund’s operations. As compensation for its services under the investment management agreement, Funds Management is entitled to receive a management fee at the following annual rate based on the Fund’s average daily net assets:
| | | | |
| |
| Average daily net assets | | Management fee | |
| |
| First $500 million | | | 0.750 | % |
| |
| Next $500 million | | | 0.725 | |
| |
| Next $1 billion | | | 0.700 | |
| |
| Next $2 billion | | | 0.675 | |
| |
| Next $1 billion | | | 0.650 | |
| |
| Next $5 billion | | | 0.640 | |
| |
| Next $2 billion | | | 0.630 | |
| |
| Next $4 billion | | | 0.620 | |
| |
| Over $16 billion | | | 0.610 | |
26 | Wells Fargo Special Mid Cap Value Fund
Notes to financial statements
Prior to February 1, 2019, Funds Management received a management fee at the following annual rate based on the Fund’s average daily net assets:
| | |
| |
| Average daily net assets | | Management fee |
| |
First $500 million | | 0.750% |
| |
Next $500 million | | 0.725 |
| |
Next $1 billion | | 0.700 |
| |
Next $2 billion | | 0.675 |
| |
Next $1 billion | | 0.650 |
| |
Next $5 billion | | 0.640 |
| |
Over $10 billion | | 0.630 |
For the year ended September 30, 2019, the management fee was equivalent to an annual rate of 0.67% of the Fund’s average daily net assets.
Funds Management has retained the services of a subadviser to provide daily portfolio management to the Fund. The fee for subadvisory services is borne by Funds Management. Wells Capital Management Incorporated (“WellsCap”), an affiliate of Funds Management and an indirect wholly owned subsidiary of Wells Fargo, is the subadviser to the Fund and is entitled to receive a fee from Funds Management at an annual rate starting at 0.45% and declining to 0.30% as the average daily net assets of the Fund increase.
Administration fees
Under a class-level administration agreement, Funds Management provides class-level administrative services to the Fund, which includes paying fees and expenses for services provided by the transfer agent,sub-transfer agents, omnibus account servicers and record-keepers. As compensation for its services under the class-level administration agreement, Funds Management receives an annual fee which is calculated based on the average daily net assets of each class as follows:
| | | | |
| |
| | | Class-level
administration fee | |
| |
Class A, Class C, Class R | | | 0.21 | % |
| |
Class R6 | | | 0.03 | |
| |
Administrator Class, Institutional Class | | | 0.13 | |
Waivers and/or expense reimbursements
Funds Management has contractually waived and/or reimbursed management and administration fees to the extent necessary to maintain certain net operating expense ratios for the Fund. When each class of the Fund has exceeded its expense cap, Funds Management has waived fees and/or reimbursed expenses from fund-level expenses on a proportionate basis and then from class specific expenses. When only certain classes exceed their expense caps, waivers and/or reimbursements are applied against class specific expenses before fund-level expenses. Funds Management has committed through January 31, 2020 to waive fees and/or reimburse expenses to the extent necessary to cap the Fund’s expenses at 1.16% for Class A shares, 1.91% for Class C shares, 1.41% for Class R shares, 0.73% for Class R6 shares, 1.08% for Administrator Class shares and 0.83% for Institutional Class shares. Prior to or after the commitment expiration date, the cap may be increased or the commitment to maintain the cap may be terminated only with the approval of the Board of Trustees. Prior to February 1, 2019, the Fund’s expenses were capped at 1.19% for Class A shares, 1.94% for Class C shares, 1.44% for Class R shares, 0.76% for Class R6 shares, 1.11% for Administrator Class shares, and 0.85% for Institutional Class shares.
Distribution fees
The Trust has adopted a distribution plan for Class C and Class R shares of the Fund pursuant to Rule12b-1 under the 1940 Act. Distribution fees are charged to Class C and Class R shares and paid to Wells Fargo Funds Distributor, LLC (“Funds Distributor”), the principal underwriter, at an annual rate of 0.75% of the average daily net assets of Class C shares and 0.25% of the average daily net assets of Class R shares.
In addition, Funds Distributor is entitled to receive thefront-end sales charge from the purchase of Class A shares and a contingent deferred sales charge on the redemption of certain Class A shares. Funds Distributor is also entitled to receive the
Wells Fargo Special Mid Cap Value Fund | 27
Notes to financial statements
contingent deferred sales charges from redemptions of Class C shares. For the year ended September 30, 2019, Funds Distributor received $53,166 from the sale of Class A shares and $171 in contingent deferred sales charges from redemptions of Class C shares. No contingent deferred sales charges were incurred by Class A shares for the year ended September 30, 2019.
Shareholder servicing fees
The Trust has entered into contracts with one or more shareholder servicing agents, whereby Class A, Class C, Class R, and Administrator Class of the Fund are charged a fee at an annual rate of 0.25% of the average daily net assets of each respective class. A portion of these total shareholder servicing fees were paid to affiliates of Wells Fargo.
Interfund transactions
The Fund may purchase or sell portfolio investment securities to certain other Wells Fargo affiliates pursuant to Rule17a-7 under the 1940 Act and under procedures adopted by the Board of Trustees. The procedures have been designed to ensure that these interfund transactions, which do not incur broker commissions, are effected at current market prices.
5. INVESTMENT PORTFOLIO TRANSACTIONS
Purchases and sales of investments, excluding U.S. government obligations (if any) and short-term securities, for the year ended September 30, 2019 were $2,969,004,394 and $3,236,594,125, respectively.
6. SECURITIES LENDING TRANSACTIONS
The Fund lends its securities through an unaffiliated securities lending agent and receives collateral in the form of cash or securities with a value at least equal to the value of the securities on loan. The value of the loaned securities is determined at the close of each business day and any increases or decreases in the required collateral are exchanged between the Fund and the counterparty on the next business day. Cash collateral received is invested in the Securities Lending Fund which seeks to provide a positive return compared to the daily Fed Funds Open Rate by investing in high-quality, U.S. dollar-denominated short-term money market instruments and is exempt from registration under Section 3(c)(7) of the 1940 Act. Securities Lending Fund is managed by Funds Management and is subadvised by WellsCap. Funds Management receives an advisory fee starting at 0.05% and declining to 0.01% as the average daily net assets of the Securities Lending Fund increase. All of the fees received by Funds Management are paid to WellsCap for its services as subadviser.
In the event of counterparty default or the failure of a borrower to return a loaned security, the Fund has the right to use the collateral to offset any losses incurred. As of September 30, 2019, the Fund did not have any securities on loan.
7. BANK BORROWINGS
The Trust (excluding the money market funds), Wells Fargo Master Trust and Wells Fargo Variable Trust are parties to a $280,000,000 revolving credit agreement whereby the Fund is permitted to use bank borrowings for temporary or emergency purposes, such as to fund shareholder redemption requests. Interest under the credit agreement is charged to the Fund based on a borrowing rate equal to the higher of the Federal Funds rate in effect on that day plus 1.25% or the overnight LIBOR rate in effect on that day plus 1.25%. In addition, an annual commitment fee equal to 0.25% of the unused balance is allocated to each participating fund.
For the year ended September 30, 2019, there were no borrowings by the Fund under the agreement.
8. DISTRIBUTIONS TO SHAREHOLDERS
The tax character of distributions paid during the years ended September 30, 2019 and September 30, 2018 were as follows:
| | | | | | | | |
| | | Year ended September 30 | |
| | |
| | | 2019 | | | 2018 | |
| | |
Ordinary income | | $ | 61,719,949 | | | $ | 175,777,950 | |
| | |
Long-term capital gain | | | 130,458,127 | | | | 180,799,984 | |
As of September 30, 2019, the components of distributable earnings on a tax basis were as follows:
| | | | |
Undistributed
ordinary
income | | Undistributed
long-term
gain | | Unrealized
gains |
| | |
| $123,976,485 | | $236,482,816 | | $1,426,348,561 |
28 | Wells Fargo Special Mid Cap Value Fund
Notes to financial statements
9. INDEMNIFICATION
Under the Trust’s organizational documents, the officers and Trustees have been granted certain indemnification rights against certain liabilities that may arise out of performance of their duties to the Trust. Additionally, in the normal course of business, the Trust may enter into contracts with service providers that contain a variety of indemnification clauses. The Trust’s maximum exposure under these arrangements is dependent on future claims that may be made against the Fund and, therefore, cannot be estimated.
10. NEW ACCOUNTING PRONOUNCEMENT
In August 2018, FASB issued Accounting Standards Update (“ASU”)No. 2018-13, Fair Value Measurement (Topic 820)Disclosure Framework—Changes to the Disclosure Requirements for Fair Value Measurement.ASU2018-13 updates the disclosure requirements for fair value measurements by modifying or removing certain disclosures and adding certain new disclosures. The amendments are effective for fiscal years, and interim periods within those fiscal years, beginning after December 15, 2019. Early adoption is permitted. Management has adopted the removal and modification of disclosures early, as permitted, and will adopt the additional new disclosures at the effective date.
Wells Fargo Special Mid Cap Value Fund | 29
Report of independent registered public accounting firm
TO THE SHAREHOLDERS OF THE FUND AND BOARD OF TRUSTEES OF WELLS FARGO FUNDS TRUST:
Opinion on the Financial Statements
We have audited the accompanying statement of assets and liabilities of Wells Fargo Special Mid Cap Value Fund (the Fund), one of the funds constituting Wells Fargo Funds Trust, including the portfolio of investments, as of September 30, 2019, the related statement of operations for the year then ended, the statements of changes in net assets for each of the years in the two-year period then ended, and the related notes (collectively, the financial statements) and the financial highlights for each of the years or periods in the five-year period then ended. In our opinion, the financial statements and financial highlights present fairly, in all material respects, the financial position of the Fund as of September 30, 2019, the results of its operations for the year then ended, the changes in its net assets for each of the years in the two-year period then ended, and the financial highlights for each of the years or periods in the five-year period then ended, in conformity with U.S. generally accepted accounting principles.
Basis for Opinion
These financial statements and financial highlights are the responsibility of the Fund’s management. Our responsibility is to express an opinion on these financial statements and financial highlights based on our audits. We are a public accounting firm registered with the Public Company Accounting Oversight Board (United States) (PCAOB) and are required to be independent with respect to the Fund in accordance with the U.S. federal securities laws and the applicable rules and regulations of the Securities and Exchange Commission and the PCAOB.
We conducted our audits in accordance with the standards of the PCAOB. Those standards require that we plan and perform the audit to obtain reasonable assurance about whether the financial statements and financial highlights are free of material misstatement, whether due to error or fraud. Our audits included performing procedures to assess the risks of material misstatement of the financial statements and financial highlights, whether due to error or fraud, and performing procedures that respond to those risks. Such procedures included examining, on a test basis, evidence regarding the amounts and disclosures in the financial statements and financial highlights. Such procedures also included confirmation of securities owned as of September 30, 2019, by correspondence with the custodian, transfer agent and brokers, or by other appropriate auditing procedures. Our audits also included evaluating the accounting principles used and significant estimates made by management, as well as evaluating the overall presentation of the financial statements and financial highlights. We believe that our audits provide a reasonable basis for our opinion.

We have not been able to determine the specific year that we began serving as the auditor of one or more Wells Fargo Funds investment companies; however we are aware that we have served as the auditor of one or more Wells Fargo Funds investment companies since at least 1955.
Boston, Massachusetts
November 25, 2019
30 | Wells Fargo Special Mid Cap Value Fund
Other information (unaudited)
TAX INFORMATION
For corporate shareholders, pursuant to Section 854 of the Internal Revenue Code, 93.13% of ordinary income dividends qualify for the corporate dividends-received deduction for the fiscal year ended September 30, 2019.
Pursuant to Section 852 of the Internal Revenue Code, $130,458,127 was designated as a 20% rate gain distribution for the fiscal year ended September 30, 2019.
Pursuant to Section 854 of the Internal Revenue Code, $58,446,739 of income dividends paid during the fiscal year ended September 30, 2019 has been designated as qualified dividend income (QDI).
For the fiscal year ended September 30, 2019, $2,668,745 has been designated as interest-related dividends for nonresident alien shareholders pursuant to Section 871 of the Internal Revenue Code.
PROXY VOTING INFORMATION
A description of the policies and procedures used to determine how to vote proxies relating to portfolio securities is available, upon request, by calling1-800-222-8222, visiting our website atwfam.com, or visiting the SEC website at sec.gov. Information regarding how the proxies related to portfolio securities were voted during the most recent12-month period ended June 30 is available on the website atwfam.comor by visiting the SEC website at sec.gov.
QUARTERLY PORTFOLIO HOLDINGS INFORMATION
The Fund files its complete schedule of portfolio holdings with the SEC for the first and third quarters of each fiscal year on Form N-Q or FormN-PORT, which is available by visiting the SEC website at sec.gov. Those forms may be reviewed and copied at the SEC’s Public Reference Room in Washington, DC. Information on the operation of the Public Reference Room may be obtained by calling1-800-SEC-0330.
Wells Fargo Special Mid Cap Value Fund | 31
Other information (unaudited)
BOARD OF TRUSTEES AND OFFICERS
Each of the Trustees and Officers1 listed in the table below acts in identical capacities for each fund in the Wells Fargo family of funds, which consists of 150 mutual funds comprising the Wells Fargo Funds Trust, Wells Fargo Variable Trust, Wells Fargo Master Trust and fourclosed-end funds (collectively the “Fund Complex”). This table should be read in conjunction with the Prospectus and the Statement of Additional Information2. The mailing address of each Trustee and Officer is 525 Market Street, 12th Floor, San Francisco, CA 94105. Each Trustee and Officer serves an indefinite term, however, each Trustee serves such term until reaching the mandatory retirement age established by the Trustees.
Independent Trustees
| | | | | | |
Name and
year of birth | | Position held and
length of service* | | Principal occupations during past five years or longer | | Current other
public company or
investment
company
directorships |
| | | |
William R. Ebsworth (Born 1957) | | Trustee, since 2015 | | Retired. From 1984 to 2013, equities analyst, portfolio manager, research director and chief investment officer at Fidelity Management and Research Company in Boston, Tokyo, and Hong Kong, and retired in 2013 as Chief Investment Officer of Fidelity Strategic Advisers, Inc. where he led a team of investment professionals managing client assets. Prior thereto, Board member of Hong Kong Securities Clearing Co., Hong Kong Options Clearing Corp., the Thailand International Fund, Ltd., Fidelity Investments Life Insurance Company, and Empire Fidelity Investments Life Insurance Company. Audit Committee Chair and Investment Committee Chair of the Vincent Memorial Hospital Endowment(non-profit organization). Mr. Ebsworth is a CFA® charterholder. | | N/A |
| | | |
Jane A. Freeman
(Born 1953) | | Trustee, since 2015; Chair Liaison, since 2018 | | Retired. From 2012 to 2014 and 1999 to 2008, Chief Financial Officer of Scientific Learning Corporation. From 2008 to 2012, Ms. Freeman provided consulting services related to strategic business projects. Prior to 1999, Portfolio Manager at Rockefeller & Co. and Scudder, Stevens & Clark. Board member of the Harding Loevner Funds from 1996 to 2014, serving as both Lead Independent Director and chair of the Audit Committee. Board member of the Russell Exchange Traded Funds Trust from 2011 to 2012 and the chair of the Audit Committee. Ms. Freeman is a Board Member of The Ruth Bancroft Garden(non-profit organization). She is also an inactive Chartered Financial Analyst. | | N/A |
| | | |
Isaiah Harris, Jr.
(Born 1952) | | Trustee, since 2009; Audit Committee Chairman, since 2019 | | Retired. Chairman of the Board of CIGNA Corporation since 2009, and Director since 2005. From 2003 to 2011, Director of Deluxe Corporation. Prior thereto, President and CEO of BellSouth Advertising and Publishing Corp. from 2005 to 2007, President and CEO of BellSouth Enterprises from 2004 to 2005 and President of BellSouth Consumer Services from 2000 to 2003. Emeritus member of the Iowa State University Foundation Board of Governors. Emeritus Member of the Advisory Board of Iowa State University School of Business. Advisory Board Member, Palm Harbor Academy (private school). Advisory Board Member, Child Evangelism Fellowship(non-profit). Mr. Harris is a certified public accountant (inactive status). | | CIGNA Corporation |
| | | |
Judith M. Johnson
(Born 1949) | | Trustee, since 2008; Audit Committee Chairman, from 2009 to 2018 | | Retired. Prior thereto, Chief Executive Officer and Chief Investment Officer of Minneapolis Employees Retirement Fund from 1996 to 2008. Ms. Johnson is an attorney, certified public accountant and a certified managerial accountant. | | N/A |
32 | Wells Fargo Special Mid Cap Value Fund
Other information (unaudited)
| | | | | | |
Name and
year of birth | | Position held and
length of service* | | Principal occupations during past five years or longer | | Current other
public company or
investment
company
directorships |
| | | |
David F. Larcker
(Born 1950) | | Trustee, since 2009 | | James Irvin Miller Professor of Accounting at the Graduate School of Business, Stanford University, Director of the Corporate Governance Research Initiative and Senior Faculty of The Rock Center for Corporate Governance since 2006. From 2005 to 2008, Professor of Accounting at the Graduate School of Business, Stanford University. Prior thereto, Ernst & Young Professor of Accounting at The Wharton School, University of Pennsylvania from 1985 to 2005. | | N/A |
| | | |
Olivia S. Mitchell
(Born 1953) | | Trustee, since 2006; Nominating and Governance Committee Chairman, since 2018 | | International Foundation of Employee Benefit Plans Professor, Wharton School of the University of Pennsylvania since 1993. Director of Wharton’s Pension Research Council and Boettner Center on Pensions & Retirement Research, and Research Associate at the National Bureau of Economic Research. Previously, Cornell University Professor from 1978 to 1993. | | N/A |
| | | |
Timothy J. Penny
(Born 1951) | | Trustee, since 1996; Chairman, since 2018 | | President and Chief Executive Officer of Southern Minnesota Initiative Foundation, anon-profit organization, since 2007. Member of the Board of Trustees of NorthStar Education Finance, Inc., anon-profit organization, since 2007. | | N/A |
| | | |
James G. Polisson
(Born 1959) | | Trustee, since 2018 | | Retired. Chief Marketing Officer, Source (ETF) UK Services, Ltd, from 2015 to 2017. From 2012 to 2015, Principal of The Polisson Group, LLC, a management consulting, corporate advisory and principal investing company. Chief Executive Officer and Managing Director at Russell Investments, Global Exchange Traded Funds from 2010 to 2012. Managing Director of Barclays Global Investors from 1998 to 2010 and Global Chief Marketing Officer for iShares and Barclays Global Investors from 2000 to 2010. Trustee of the San Francisco Mechanics’ Institute, anon-profit organization, from 2013 to 2015. Board member of the Russell Exchange Traded Fund Trust from 2011 to 2012. Director of Barclays Global Investors Holdings Deutschland GmbH from 2006 to 2009. Mr. Polisson is an attorney and has a retired status with the Massachusetts and District of Columbia Bar Associations. | | N/A |
| * | Length of service dates reflect the Trustee’s commencement of service with the Trust’s predecessor entities, where applicable. |
Wells Fargo Special Mid Cap Value Fund | 33
Other information (unaudited)
Officers
| | | | |
Name and
year of birth | | Position held and
length of service | | Principal occupations during past five years or longer |
| | |
Andrew Owen
(Born 1960) | | President, since 2017 | | Executive Vice President of Wells Fargo & Company and Head of Affiliated Managers, Wells Fargo Asset Management, since 2014. In addition, Mr. Owen is currently President, Chief Executive Officer and Director of Wells Fargo Funds Management, LLC since 2017. Prior thereto, Executive Vice President responsible for marketing, investments and product development for Wells Fargo Funds Management, LLC, from 2009 to 2014. |
| | |
| Nancy Wiser1 (Born 1967) | | Treasurer, since 2012 | | Executive Vice President of Wells Fargo Funds Management, LLC since 2011. Chief Operating Officer and Chief Compliance Officer at LightBox Capital Management LLC, from 2008 to 2011. |
| | |
| Michelle Rhee3 (Born 1966) | | Chief Legal Officer, since 2019 | | Secretary of Wells Fargo Funds Management, LLC, Chief Legal Counsel of Wells Fargo Asset Management and Assistant General Counsel of Wells Fargo Bank, N.A. since 2018. Associate General Counsel and Managing Director of Bank of America Corporation from 2004 to 2018. |
| | |
Catherine Kennedy4
(Born 1969) | | Secretary, since 2019 | | Vice President of Wells Fargo Funds Management, LLC and Senior Counsel of the Wells Fargo Legal Department since 2010. Vice President and Senior Counsel of Evergreen Investment Management Company, LLC from 1998 to 2010. |
| | |
Michael H. Whitaker
(Born 1967) | | Chief Compliance Officer, since 2016 | | Chief Compliance Officer of Wells Fargo Asset Management since 2016. Senior Vice President and Chief Compliance Officer for Fidelity Investments from 2007 to 2016. |
| | |
| David Berardi (Born 1975) | | Assistant Treasurer, since 2009 | | Vice President of Wells Fargo Funds Management, LLC since 2009. Vice President of Evergreen Investment Management Company, LLC from 2008 to 2010. Manager of Fund Reporting and Control for Evergreen Investment Management Company, LLC from 2004 to 2010. |
| | |
Jeremy DePalma1 (Born 1974) | | Assistant Treasurer, since 2009 | | Senior Vice President of Wells Fargo Funds Management, LLC since 2009. Senior Vice President of Evergreen Investment Management Company, LLC from 2008 to 2010 and head of the Fund Reporting and Control Team within Fund Administration from 2005 to 2010. |
| 1 | Nancy Wiser acts as Treasurer of 64 funds in the Fund Complex. Jeremy DePalma acts as Treasurer of 86 funds and Assistant Treasurer of 64 funds in the Fund Complex. |
| 2 | The Statement of Additional Information includes additional information about the Trustees and is available, without charge, upon request, by calling1-800-222-8222 or by visiting the website atwfam.com. |
| 3 | Michelle Rhee became Chief Legal Officer effective October 22, 2019. |
| 4 | Catherine Kennedy became Secretary effective October 22, 2019. |
34 | Wells Fargo Special Mid Cap Value Fund
Other information (unaudited)
BOARD CONSIDERATION OF INVESTMENT MANAGEMENT ANDSUB-ADVISORY AGREEMENTS:
Wells Fargo Special Mid Cap Value Fund
Under the Investment Company Act of 1940 (the “1940 Act”), the Board of Trustees (the “Board”) of Wells Fargo Funds Trust (the “Trust”) must determine annually whether to approve the continuation of the Trust’s investment management andsub-advisory agreements. In this regard, at anin-person meeting held on May21-22, 2019 (the “Meeting”), the Board, all the members of which have no direct or indirect interest in the investment management andsub-advisory agreements and are not “interested persons” of the Trust, as defined in the 1940 Act (the “Independent Trustees”), reviewed and approved for Wells Fargo Special Mid Cap Value Fund(the “Fund”): (i) an investment management agreement (the “Management Agreement”) with Wells Fargo Funds Management, LLC (“Funds Management”); and (ii) an investmentsub-advisory agreement (the“Sub-Advisory Agreement”) with Wells Capital Management Incorporated (the“Sub-Adviser”), an affiliate of Funds Management. The Management Agreement and theSub-Advisory Agreement are collectively referred to as the “Advisory Agreements.”
At the Meeting, the Board considered the factors and reached the conclusions described below relating to the selection of Funds Management and theSub-Adviser and the approval of the Advisory Agreements. Prior to the Meeting, including at anin-person meeting in April 2019, the Trustees conferred extensively among themselves and with representatives of Funds Management about these matters. Also, the Board has adopted a team-based approach, with each team consisting of asub-set of Trustees, to assist the full Board in the discharge of its duties in reviewing investment performance and other matters throughout the year. The Independent Trustees were assisted in their evaluation of the Advisory Agreements by independent legal counsel, from whom they received separate legal advice and with whom they met separately.
In providing information to the Board, Funds Management and theSub-Adviser were guided by a detailed set of requests for information submitted to them by independent legal counsel on behalf of the Independent Trustees at the start of the Board’s annual contract renewal process earlier in 2019. In considering and approving the Advisory Agreements, the Trustees considered the information they believed relevant, including but not limited to the information discussed below. The Board considered not only the specific information presented in connection with the Meeting, but also the knowledge gained over time through interaction with Funds Management and theSub-Adviser about various topics. In this regard, the Board reviewed reports of Funds Management at each of its quarterly meetings, which included, among other things, portfolio reviews and investment performance reports. In addition, the Board and the teams mentioned above confer with portfolio managers at various times throughout the year. The Board did not identify any particular information or consideration that wasall-important or controlling, and each individual Trustee may have attributed different weights to various factors.
After its deliberations, the Board unanimously approved the continuation of the Advisory Agreements for aone-year term and determined that the compensation payable to Funds Management and theSub-Adviser under each of the Advisory Agreements was reasonable. The Board considered the approval of the Advisory Agreements for the Fund as part of its consideration of agreements for funds across the complex, but its approvals were made on afund-by-fund basis. The following summarizes a number of important, but not necessarily all, factors considered by the Board in support of its approvals.
Nature, extent and quality of services
The Board received and considered various information regarding the nature, extent and quality of services provided to the Fund by Funds Management and theSub-Adviser under the Advisory Agreements. This information included a description of the investment advisory services and Fund-level administrative services covered by the Management Agreement, as well as, among other things, a summary of the background and experience of senior management of Wells Fargo Asset Management (“WFAM”), of which Funds Management and theSub-Adviser are a part, a summary of investments made in the business of WFAM, a summary of certain organizational and personnel changes involving Funds Management and theSub-Adviser, and a description of Funds Management’s and theSub-Adviser’s business continuity planning programs and of their approaches to data privacy and cybersecurity. The Board received and reviewed information about Funds Management’s role as administrator of the Fund’s liquidity risk management program. The Board also considered the qualifications, background, tenure and responsibilities of each of the portfolio managers primarily responsible for theday-to-day portfolio management of the Fund.
The Board evaluated the ability of Funds Management and theSub-Adviser to attract and retain qualified investment professionals, including research, advisory and supervisory personnel. The Board further considered the compliance programs and compliance records of Funds Management and theSub-Adviser. In addition, the Board took into account the full range of services provided to the Fund by Funds Management and its affiliates.
Wells Fargo Special Mid Cap Value Fund | 35
Other information (unaudited)
Fund investment performance and expenses
The Board considered the investment performance results for the Fund over various time periods ended December 31, 2018. The Board considered these results in comparison to the investment performance of funds in a universe that was determined by Broadridge Inc. (“Broadridge”) to be similar to the Fund (the “Universe”), and in comparison to the Fund’s benchmark index and to other comparative data. Broadridge is an independent provider of investment company data. The Board received a description of the methodology used by Broadridge to select the mutual funds in the performance Universe. The Board noted that the investment performance of the Fund (Administrator Class) was higher than the average investment performance of the Universe for all periods under review. The Board also noted that the investment performance of the Fund was lower than its benchmark index, the Russell Midcap® Value Index, for all periods under review.
The Board also received and considered information regarding the Fund’s net operating expense ratios and their various components, including actual management fees, custodian and othernon-management fees, and Rule12b-1 andnon-Rule12b-1 shareholder service fees. The Board considered these ratios in comparison to the median ratios of funds in class-specific expense groups that were determined by Broadridge to be similar to the Fund (the “Groups”). The Board received a description of the methodology used by Broadridge to select the mutual funds in the expense Groups and an explanation of how funds comprising expense groups and their expense ratios may vary fromyear-to-year. Based on the Broadridge reports, the Board noted that the net operating expense ratios of the Fund were equal to or in range of the median net operating expense ratios of the expense Groups for each share class.
The Board took into account the Fund’s investment performance and expense information provided to it among the factors considered in deciding tore-approve the Advisory Agreements.
Investment management andsub-advisory fee rates
The Board reviewed and considered the contractual fee rates payable by the Fund to Funds Management under the Management Agreement, as well as the contractual fee rates payable by the Fund to Funds Management for class-level administrative services under a Class-Level Administration Agreement, which include, among other things, class-level transfer agency andsub-transfer agency costs (collectively, the “Management Rates”). The Board also reviewed and considered the contractual investmentsub-advisory fee rates that are payable by Funds Management to theSub-Adviser for investmentsub-advisory services.
Among other information reviewed by the Board was a comparison of the Fund’s Management Rates with the average contractual investment management fee rates of funds in the expense Groups at a common asset level as well as transfer agency costs of the funds in the expense Groups. The Board noted that the Management Rates of the Fund were equal to or in range of the sum of these average rates for the Fund’s expense Groups for all share classes.
The Board also received and considered information about the portion of the total management fee that was retained by Funds Management after payment of the fee to theSub-Adviser forsub-advisory services. In assessing the reasonableness of this amount, the Board received and evaluated information about the nature and extent of responsibilities retained and risks assumed by Funds Management and not delegated to or assumed by theSub-Adviser, and about Funds Management’son-going oversight services. Given the affiliation between Funds Management and theSub-Adviser, the Board ascribed limited relevance to the allocation of fees between them.
The Board also received and considered information about the nature and extent of services offered and fee rates charged by Funds Management and theSub-Adviser to other types of clients with investment strategies similar to those of the Fund. In this regard, the Board received information about the significantly greater scope of services, and compliance, reporting and other legal burdens and risks of managing proprietary mutual funds compared with those associated with managing assets of other types of clients, including third-partysub-advised fund clients andnon-mutual fund clients such as institutional separate accounts.
Based on its consideration of the factors and information it deemed relevant, including those described here, the Board determined that the compensation payable to Funds Management under the Management Agreement and to theSub-Adviser under theSub-Advisory Agreement was reasonable.
Profitability
The Board received and considered information concerning the profitability of Funds Management, as well as the profitability of both WFAM and Wells Fargo & Co. (“Wells Fargo”) from providing services to the fund family as a whole. The Board noted that theSub-Adviser’s profitability information with respect to providing services to the Fund and other funds in the family was subsumed in the WFAM and Wells Fargo profitability analysis.
36 | Wells Fargo Special Mid Cap Value Fund
Other information (unaudited)
Funds Management reported on the methodologies and estimates used in calculating profitability, including a description of the methodology used to allocate certain expenses. Among other things, the Board noted that the levels of profitability reported on afund-by-fund basis varied widely, depending on factors such as the size, type and age of fund. Based on its review, the Board did not deem the profits reported by Funds Management, WFAM or Wells Fargo from services provided to the Fund to be at a level that would prevent it from approving the continuation of the Advisory Agreements.
Economies of scale
The Board received and considered information about the potential for Funds Management to experience economies of scale in the provision of management services to the Fund, the difficulties of calculating economies of scale at an individual fund level, and the extent to which potential scale benefits are shared with shareholders. The Board noted the existence of breakpoints in the Fund’s management fee structure, which operate generally to reduce the Fund’s expense ratios as the Fund grows in size. The Board considered that in addition to management fee breakpoints, Funds Management shares potential economies of scale from its management business in a variety of ways, including through fee waiver and expense reimbursement arrangements, services that benefit shareholders, competitive management fee rates set at the outset without regard to breakpoints, and investments in the business intended to enhance services available to shareholders.
The Board concluded that Funds Management’s arrangements with respect to the Fund, including contractual breakpoints, constituted a reasonable approach to sharing potential economies of scale with the Fund and its shareholders.
Other benefits to Funds Management and theSub-Adviser
The Board received and considered information regarding potential“fall-out” or ancillary benefits received by Funds Management and its affiliates, including theSub-Adviser, as a result of their relationships with the Fund. Ancillary benefits could include, among others, benefits directly attributable to other relationships with the Fund and benefits potentially derived from an increase in Funds Management’s and theSub-Adviser’s business as a result of their relationships with the Fund. The Board noted that various affiliates of Funds Management may receive distribution-related fees, shareholder servicing payments andsub-transfer agency fees in respect of shares sold or held through them and services provided.
The Board also reviewed information about soft dollar credits earned and utilized by theSub-Adviser, fees earned by Funds Management and theSub-Adviser from managing a private investment vehicle for the fund family’s securities lending collateral, and commissions earned by an affiliated broker from portfolio transactions.
Based on its consideration of the factors and information it deemed relevant, including those described here, the Board did not find that any ancillary benefits received by Funds Management and its affiliates, including theSub-Adviser, were unreasonable.
Conclusion
At the Meeting, after considering the above-described factors and based on its deliberations and its evaluation of the information described above, the Board unanimously approved the continuation of the Advisory Agreements for aone-year term and determined that the compensation payable to Funds Management and theSub-Adviser under each of the Advisory Agreements was reasonable.
Wells Fargo Special Mid Cap Value Fund | 37
This page is intentionally left blank.
This page is intentionally left blank.
This page is intentionally left blank.

For more information
More information about Wells Fargo Funds is available free upon request. To obtain literature, please write, visit the Fund’s website, or call:
Wells Fargo Funds
P.O. Box 219967
Kansas City, MO 64121-9967
Website:wfam.com
Individual investors:1-800-222-8222
Retail investment professionals:1-888-877-9275
Institutional investment professionals:1-866-765-0778

This report and the financial statements contained herein are submitted for the general information of the shareholders of the Fund. If this report is used for promotional purposes, distribution of the report must be accompanied or preceded by a current prospectus. Before investing, please consider the investment objectives, risks, charges, and expenses of the investment. For a current prospectus and, if available, a summary prospectus, containing this information, call1-800-222-8222 or visit the Fund’s website atwfam.com. Read the prospectus carefully before you invest or send money.
Wells Fargo Asset Management (WFAM) is the trade name for certain investment advisory/management firms owned by Wells Fargo & Company. These firms include but are not limited to Wells Capital Management Incorporated and Wells Fargo Funds Management, LLC. Certain products managed by WFAM entities are distributed by Wells Fargo Funds Distributor, LLC (a broker-dealer and Member FINRA).
This material is for general informational and educational purposes only and is NOT intended to provide investment advice or a recommendation of any kind—including a recommendation for any specific investment, strategy, or plan.
INVESTMENT PRODUCTS: NOT FDIC INSURED ◾ NO BANK GUARANTEE ◾ MAY LOSE VALUE
© 2019 Wells Fargo & Company. All rights reserved.
406817 11-19
A234/AR234 09-19
Annual Report
September 30, 2019
Wells Fargo
Global Investment Grade Credit Fund
Beginning on January 1, 2021, as permitted by new regulations adopted by the Securities and Exchange Commission, paper copies of the Wells Fargo Funds’ annual and semi-annual shareholder reports issued after this date will no longer be sent by mail, unless you specifically request paper copies of the reports. Instead, the reports will be made available on the Funds’ website, and you will be notified by mail each time a report is posted and provided with a website address to access the report.
If you already elected to receive shareholder reports electronically, you will not be affected by this change and you need not take any action. You may elect to receive shareholder reports and other communications from the Fund electronically at any time by contacting your financial intermediary (such as a broker-dealer or bank) or, if you are a direct investor, by calling1-800-222-8222 or by enrolling at wellsfargo.com/advantagedelivery.
You may elect to receive all future reports in paper free of charge. If you invest through a financial intermediary, you can contact your financial intermediary to request that you continue to receive paper copies of your shareholder reports; if you invest directly with the Fund, you can call 1-800-222-8222. Your election to receive reports in paper will apply to all Wells Fargo Funds held in your account with your financial intermediary or, if you are a direct investor, to all Wells Fargo Funds that you hold.
|
|
|
Reduce clutter. Save trees. |
Sign up for electronic delivery of prospectuses and shareholder reports atwellsfargo.com/advantagedelivery |
The views expressed and any forward-looking statements are as of September 30, 2019, unless otherwise noted, and are those of the Fund managers and/or Wells Fargo Asset Management. Discussions of individual securities, or the markets generally, or any Wells Fargo Fund are not intended as individual recommendations. Future events or results may vary significantly from those expressed in any forward-looking statements. The views expressed are subject to change at any time in response to changing circumstances in the market. Wells Fargo Asset Management and the Fund disclaim any obligation to publicly update or revise any views expressed or forward-looking statements.
INVESTMENT PRODUCTS: NOT FDIC INSURED ◾ NO BANK GUARANTEE ◾ MAY LOSE VALUE
Wells Fargo Global Investment Grade Credit Fund | 1
Letter to shareholders (unaudited)

Andrew Owen
President
Wells Fargo Funds
“The U.S. increased tariffs on products from China, China responded, and then talks broke down.”
Dear Shareholder:
We are pleased to offer you this first shareholder report for the Wells Fargo Global Investment Grade Credit Fund from the Fund’s inception on February 28, 2019 through September 30, 2019. U.S. stock and global bond investors generally saw volatile global investment markets as intensifying economic growth concerns, international trade stare downs, and simmering geopolitical tensions discouraged investors.
Overall, fixed income kept pace with domestic stocks and outperformed foreign equities. For the period, U.S. stocks, based on the S&P 500 Index,1 gained 8.14% and international stocks, as measured by the MSCI ACWI ex USA Index (Net),2 added 1.73%. The MSCI EM Index (Net)3 fell by 2.86%. Among fixed income investors, the Bloomberg Barclays U.S. Aggregate Bond Index4 added 7.44%, the Bloomberg Barclays Global Aggregate ex-USD Index5 added 3.55%, the Bloomberg Barclays Municipal Bond Index6 gained 5.38%, and the ICE BofAML U.S. High Yield Index7 added 4.84%.
Early second-quarter 2019 investor enthusiasm faded as the quarter wore on.
As the first quarter of 2019 ended, a more accommodative monetary policy stance by the U.S. Federal Reserve (Fed) and steady, if not spectacular, U.S. economic and business metrics encouraged domestic investors. During April 2019, favorable sentiment found additional support in reports of sustained low inflation, solid employment data, and first-quarter U.S. gross domestic product (GDP) growth at an annualized rate of 3.2%.
During May, markets tumbled on mixed investment signals. In the U.S., partisan wrangling ramped up as Democrats and Republicans set their sights on 2020 presidential politics. The U.K.’s Brexit disagreements caused Prime Minister Theresa May to resign. Boris Johnson succeeded her only to exacerbate uncertainty about Brexit’s resolution ahead of an October 2019 deadline. The European Commission downgraded the 2019 growth forecast to 1.2%. The U.S. increased tariffs on products from China, China responded, and then talks broke down. President Donald Trump threatened to turn his foreign policy tariff tool to Mexico over immigration issues.
During the third quarter of 2019, investors regrouped. Just as the investment horizon appeared to darken, sentiment turned and U.S. equity markets gained during June and July. The gains, primarily driven by geopolitical and monetary policy events, pushed equity markets to new highs. European Central Bank President Mario Draghi said that if
| 1 | The S&P 500 Index consists of 500 stocks chosen for market size, liquidity, and industry group representation. It is a market-value-weighted index with each stock’s weight in the index proportionate to its market value. You cannot invest directly in an index. |
| 2 | The Morgan Stanley Capital International (MSCI) All Country World Index (ACWI) ex USA Index (Net) is a free-float-adjusted market-capitalization weighted index that is designed to measure the equity market performance of developed and emerging markets, excluding the U.S. Source: MSCI. MSCI makes no express or implied warranties or representations and shall have no liability whatsoever with respect to any MSCI data contained herein. The MSCI data may not be further redistributed or used as a basis for other indices or any securities or financial products. This report is not approved, reviewed, or produced by MSCI. You cannot invest directly in an index. |
| 3 | The MSCI Emerging Markets (EM) Index (Net) is a free-float-adjusted market-capitalization-weighted index that is designed to measure the equity market performance of emerging markets. You cannot invest directly in an index. |
| 4 | The Bloomberg Barclays U.S. Aggregate Bond Index is a broad-based benchmark that measures the investment-grade, U.S. dollar-denominated, fixed-rate taxable bond market, including Treasuries, government-related and corporate securities, mortgage-backed securities (agency fixed-rate and hybrid adjustable-rate mortgage pass-throughs), asset-backed securities, and commercial mortgage-backed securities. You cannot invest directly in an index. |
| 5 | The Bloomberg Barclays Global Aggregate ex-USD Index is an unmanaged index that provides a broad-based measure of the global investment-grade fixed-income markets excluding the U.S. dollar-denominated debt market. You cannot invest directly in an index. |
| 6 | The Bloomberg Barclays Municipal Bond Index is an unmanaged index composed of long-term tax-exempt bonds with a minimum credit rating of Baa. You cannot invest directly in an index. |
| 7 | The ICE BofAML U.S. High Yield Index is a market-capitalization-weighted index of domestic and Yankee high-yield bonds. The index tracks the performance of high-yield securities traded in the U.S. bond market. You cannot invest directly in an index. Copyright 2019. ICE Data Indices, LLC. All rights reserved. |
2 | Wells Fargo Global Investment Grade Credit Fund
Letter to shareholders (unaudited)
the outlook doesn’t improve, the bank would cut rates or buy more assets to prop up inflation. President Trump backed off of tariff threats against Mexico and China. In the U.S., the Fed implemented a 0.25% federal funds rate cut in July.
Later in July 2019, the U.S. reversed course and threatened to impose higher tariffs on China’s exports after talks failed. China responded with tariff threats of its own and devalued the renminbi, a move that roiled global markets. Major U.S. stock market indices closed July with the worst weekly results of the year. Bond prices gained as Treasury yields fell to levels not seen since November 2016 and the yield curve inverted at multiple points along the 30-year arc.
In a microcosm, August encapsulated many of the unnerving events that plagued investors during the prior 11 months. The U.S.-China trade relationship swung from antagonistic to hopeful and back again with no evident compromise on the horizon. Evidence of a continued global economic slowdown mounted. Central banks in China, New Zealand, and Thailand cut interest rates. Industrial and manufacturing data declined in China, Canada, Japan, and Germany. Adding to the uncertain environment, Italy’s prime minister resigned, many feared a crackdown in Hong Kong as protesters sustained their calls for reform throughout the month, and Boris Johnson planned to suspend Parliament as Brexit’s deadline neared.
In the U.S., September saw the Fed join other central banks in cutting interest rates. Manufacturing data in the U.S., as reported by the Institute for Supply Management, disappointed investors. The U.S. Congress announced it would pursue an impeachment investigation of President Trump. Meanwhile, the Brexit impasse showed no signs of resolution. Officials in China said that hitting the country’s economic growth goals for the year would be difficult considering the weight of tariffs and trade restrictions. So while the S&P 500 Index finished the third quarter with year-to-date returns that were the best in more than 20 years, amid signs of equity investors taking money out of the stock market, concerns about future returns remained.
Don’t let short-term uncertainty derail long-term investment goals.
Periods of investment uncertainty can present challenges, but experience has taught us that maintaining long-term investment goals can be an effective way to plan for the future. To help you create a sound strategy based on your personal goals and risk tolerance, Wells Fargo Funds offers more than 100 mutual funds spanning a wide range of asset classes and investment styles. Although diversification cannot guarantee an investment profit or prevent losses, we believe it can be an effective way to manage investment risk and potentially smooth out overall portfolio performance. We encourage investors to know their investments and to understand that appropriate levels of risk-taking may unlock opportunities.
Thank you for choosing to invest with Wells Fargo Funds. We appreciate your confidence in us and remain committed to helping you meet your financial needs.
Sincerely,

Andrew Owen
President
Wells Fargo Funds
“In a microcosm, August encapsulated many of the unnerving events that plagued investors during the prior 11 months.”
|
|
|
For further information about your Fund, contact your investment professional, visit our website atwfam.com, or call us directly at1-800-222-8222. |
Wells Fargo Global Investment Grade Credit Fund | 3
Performance highlights (unaudited)
Investment objective
The Fund seeks total return, consisting of income and capital appreciation.
Manager
Wells Fargo Funds Management, LLC
Subadvisers
Wells Capital Management Incorporated
Wells Fargo Asset Management (International) Limited
Portfolio managers
Henrietta Paquement, CFA®‡
Scott M. Smith, CFA®‡
Alex Temple
Jonathan Terry, CFA®‡
Average annual total returns (%) as of September 30, 2019
| | | | | | | | | | | | | | |
| | | |
| | | | | | | | Expense ratios1 (%) | |
| | | | |
| | | Inception date | | Since inception | | | Gross | | | Net2 | |
| | | | | |
| Class R6 (WGCRX) | | 2-28-2019 | | | 8.64 | | | | 0.63 | | | | 0.45 | |
| | | | | |
| Institutional Class (WGCIX) | | 2-28-2019 | | | 8.64 | | | | 0.68 | | | | 0.50 | |
| | | | | |
| Bloomberg Barclays Global Aggregate Credit Index Hedged (USD)3 | | – | | | 8.81 | * | | | – | | | | – | |
| * | Return is based on Fund’s inception date. |
Figures quoted represent past performance, which is no guarantee of future results, and do not reflect taxes that a shareholder may pay on fund distributions or the redemption of fund shares. Investment return and principal value of an investment will fluctuate so that an investor’s shares, when redeemed, may be worth more or less than their original cost. Current performance may be lower or higher than the performance data quoted, which assumes the reinvestment of dividends and capital gains. Current month-end performance is available on the Fund’s website,wfam.com.
Index returns do not include transaction costs associated with buying and selling securities, any mutual fund fees or expenses, or any taxes. It is not possible to invest directly in an index.
Class R6 and Institutional Class shares are sold without a front-end sales charge or contingent deferred sales charge.
Bond values fluctuate in response to the financial condition of individual issuers, general market and economic conditions, and changes in interest rates. Changes in market conditions and government policies may lead to periods of heightened volatility in the bond market and reduced liquidity for certain bonds held by the Fund. In general, when interest rates rise, bond values fall and investors may lose principal value. Interest rate changes and their impact on the fund and its share price can be sudden and unpredictable. Foreign investments are especially volatile and can rise or fall dramatically due to differences in the political and economic conditions of the host country. These risks are generally intensified in emerging markets. The use of derivatives may reduce returns and/or increase volatility. Securities issued by U.S. government agencies or government-sponsored entities may not be guaranteed by the U.S. Treasury. Certain investment strategies tend to increase the total risk of an investment (relative to the broader market). The Fund is exposed to municipal securities risk, high-yield securities risk, and mortgage- and asset-backed securities risk. Consult the Fund’s prospectus for additional information on these and other risks.
Please see footnotes on page 5.
4 | Wells Fargo Global Investment Grade Credit Fund
Performance highlights (unaudited)
|
|
| Growth of $1,000,000 investment as of September 30, 20194 |
|
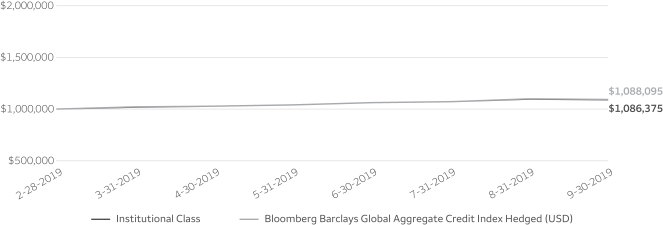
|
| ‡ | CFA® and Chartered Financial Analyst® are trademarks owned by CFA Institute. |
| 1 | Reflects the expense ratios as stated in the most recent prospectuses. The expense ratios shown are subject to change and may differ from the annualized expense ratios shown in the financial highlights of this report. |
| 2 | The manager has contractually committed through March 31, 2020 to waive fees and/or reimburse expenses to the extent necessary to cap the expenses of each class after fee waivers at the amounts shown. Brokerage commissions, stamp duty fees, interest, taxes, acquired fund fees and expenses (if any), and extraordinary expenses are excluded from the expense cap. Prior to or after the commitment expiration date, the cap may be increased or the commitment to maintain the cap may be terminated only with the approval of the Board of Trustees. Without this cap, the Fund’s returns would have been lower. The expense ratio paid by an investor is the net expense ratio (the total annual fund operating expenses after fee waivers) as stated in the prospectuses. |
| 3 | Bloomberg Barclays Global Aggregate Credit Index Hedged (USD) measures the credit sector of the global investment grade fixed-rate bond market, including corporate, government and agency securities, hedged in USD. You cannot invest directly in an index. |
| 4 | The chart compares the performance of the Institutional Class shares since inception with the Bloomberg Barclays Global Aggregate Credit Index Hedged (USD). The chart assumes a hypothetical investment of $1,000,000 in Institutional Class shares shares and reflects all operating expenses. |
| 5 | The ten largest holdings, excluding cash, cash equivalents and any money market funds, are calculated based on the value of the investments divided by total net assets of the Fund. Holdings are subject to change and may have changed since the date specified. |
| 6 | Amounts are calculated based on the total long-term investments of the Fund. These amounts are subject to change and may have changed since the date specified. |
| 7 | The credit quality distribution of portfolio holdings reflected in the chart is based on ratings from Standard & Poor’s, Moody’s Investors Service, and/or Fitch Ratings Ltd. Credit quality ratings apply to the underlying holdings of the Fund and not to the Fund itself. The percentages of the Fund’s portfolio with the ratings depicted in the chart are calculated based on the total market value of fixed income securities held by the Fund. If a security was rated by all three rating agencies, the middle rating was utilized. If rated by two of three rating agencies, the lower rating was utilized, and if rated by one of the rating agencies, that rating was utilized. Standard & Poor’s rates the creditworthiness of bonds, ranging from AAA (highest) to D (lowest). Ratings from A to CCC may be modified by the addition of a plus (+) or minus (-) sign to show relative standing within the rating categories. Standard & Poor’s rates the creditworthiness of short-term notes from SP-1 (highest) to SP-3 (lowest). Moody’s rates the creditworthiness of bonds, ranging from Aaa (highest) to C (lowest). Ratings Aa to B may be modified by the addition of a number 1 (highest) to 3 (lowest) to show relative standing within the ratings categories. Moody’s rates the creditworthiness of short-term U.S. tax-exempt municipal securities from MIG 1/VMIG 1 (highest) to SG (lowest). Fitch rates the creditworthiness of bonds, ranging from AAA (highest) to D (lowest). Credit quality distribution is subject to change and may have changed since the date specified. |
| * | This security was no longer held at the end of the reporting period. |
Wells Fargo Global Investment Grade Credit Fund | 5
Performance highlights (unaudited)
MANAGERS’ DISCUSSION
Fund highlights
| ∎ | | The Fund underperformed its benchmark, the Bloomberg Barclays Global Aggregate Credit Index Hedged (USD), for the seven-month period from the Fund’s inception to September 30, 2019. |
| ∎ | | Transaction costs to launch the Fund took away from the Fund’s initial performance along with a small underweight inU.S.-dollar duration. |
| ∎ | | Security selection within financial institutions and industrials bonds were the main contributors to relative performance. |
Weak global economy drove lower rates.
The macroeconomic climate for the seven months to September 30, 2019 was a continuation of the themes that drove markets since the beginning of 2019, namely loose monetary policy alongside heightened political risks, such as U.S.-China trade war tensions and Brexit. Toward period-end, a slew of weak economic data from both the U.S. and Europe reminded investors that so far there have been few winners in the trade war.
The U.S. Federal Reserve (Fed) cut the federal funds rate twice over the period totaling 50 basis points (bps; 100 bps equal 1.00%), taking the range to 1.75%-2.00%. The European Central Bank restarted its Quantitative Easing (QE) program at EUR 20 billion per month. This was a lower amount than the market had expected, but the open-ended nature of the purchases coupled with generous deposit-tiering and targeted long-term refinancing operations (TLTRO) arrangements were well received by the market.
The U.S. 10-year government bond yield declined by 1% over the period and the resulting flattening of the Treasury curve caused the 2-year to 10-year yield-differential to drop into negative territory during the third quarter before re-inverting.
The option-adjusted spread for the benchmark fell during the period, from 116 bps to 108 bps, although it reached as high as 122 bps in early June and as low as 101 bps in late July as the counterforces of political risks and expansionary central bank policy played out.
| | | | |
|
| Ten largest holdings (%) as of September 30, 20195 | |
| | |
Morgan Stanley, 3.70%, 10-23-2024 | | | 1.93 | |
| | |
Goldman Sachs Group Incorporated,3.63%, 1-22-2023 | | | 1.64 | |
| | |
Fox Corporation, 4.71%, 1-25-2029 | | | 1.51 | |
| | |
JPMorgan Chase & Company, 2.30%, 8-15-2021 | | | 1.43 | |
| | |
Citigroup Incorporated, 3.30%, 4-27-2025 | | | 1.42 | |
| | |
Raymond James Financial Services Incorporated, 4.95%, 7-15-2046 | | | 1.38 | |
| | |
Bank of America Corporation, 4.13%, 1-22-2024 | | | 1.31 | |
| | |
Morgan Stanley, 3.13%, 7-27-2026 | | | 1.28 | |
| | |
CVS Health Corporation, 3.70%, 3-9-2023 | | | 1.25 | |
| | |
Intercontinental Exchange Incorporated,3.75%, 12-1-2025 | | | 1.18 | |
|
|
| Portfolio composition as of September 30, 20196 |
|
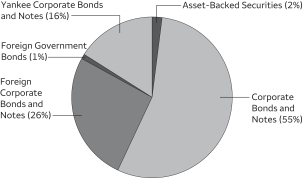
|
Please see footnotes on page 5.
6 | Wells Fargo Global Investment Grade Credit Fund
Performance highlights (unaudited)
|
|
| Effective maturity distribution as of September 30, 20196 |
|
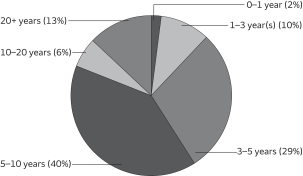 |
|
|
| Credit quality as of September 30, 20197 |
|
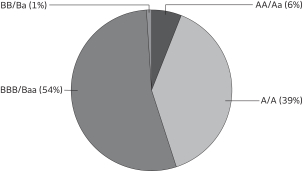
|
Tactical overweight to U.S. bonds pays off.
In early August, we felt that European rates had fallen too far and switched roughly 2% of the Fund into U.S.-dollar-denominated bonds. European rates have subsequently rebounded relative to U.S. rates and therefore this move contributed to returns.
Since June 2019, we have reduced some risk in the Fund by increasing our allocation to government bonds and increasing our underweight position in consumer cyclicals and basic materials.
Financials and industrials contributed to returns.
Security selection, in particular in financial institutions (+33 bps) and industrials (+52 bps) were the top contributors to performance. Positions in peripheral European banks contributed to Fund performance. We bought a position in General Electric* at the inception of the Fund and topped up in mid-July before taking profits at period-end.
Underweight to U.S. dollar duration detracted along with start-up costs.
Transaction costs to launch the Fund detracted from performance for the initial period.
A small underweight in U.S.-dollar duration detracted over the third quarter.
Ongoing economic weakness could lead to looser monetary policy.
Given the late-phase of the economic cycle, we expect growth to continue to slow across the major developed market regions as we move into the final quarter of 2019 and beyond. Although this deterioration in macroeconomic strength could reduce the sentiment of global investors, we expect central banks to continue to underpin demand for risk assets through further loosening of monetary policy and potentially fiscal stimulus.
After a heavy amount of issuance in the third quarter, we expect issuance to slow and supply to remain low in the fourth quarter given the ample amount of overall redemptions from issuers. We continue to be selective on the names added to the portfolio.
We expect rising global trade tensions to continue to spur bouts of volatility within the market and we remain relatively light on risk assets to provide us with dry powder in an effort to take advantage of any dispersion in relative credit valuations.
Please see footnotes on page 5.
Wells Fargo Global Investment Grade Credit Fund | 7
Fund expenses (unaudited)
As a shareholder of the Fund, you incur ongoing costs, including management fees and other Fund expenses. This example is intended to help you understand your ongoing costs (in dollars) of investing in the Fund and to compare these costs with the ongoing costs of investing in other mutual funds.
The example is based on an investment of $1,000 invested at the beginning of the six-month period and held for the entire period from April 1, 2019 to September 30, 2019.
Actual expenses
The “Actual” line of the table below provides information about actual account values and actual expenses. You may use the information in this line, together with the amount you invested, to estimate the expenses that you paid over the period. Simply divide your account value by $1,000 (for example, an $8,600 account value divided by $1,000 = 8.6), then multiply the result by the number in the “Actual” line under the heading entitled “Expenses paid during period” for your applicable class of shares to estimate the expenses you paid on your account during this period.
Hypothetical example for comparison purposes
The “Hypothetical” line of the table below provides information about hypothetical account values and hypothetical expenses based on the Fund’s actual expense ratio and an assumed rate of return of 5% per year before expenses, which is not the Fund’s actual return. The hypothetical account values and expenses may not be used to estimate the actual ending account balance or expenses you paid for the period. You may use this information to compare the ongoing costs of investing in the Fund and other funds. To do so, compare this 5% hypothetical example with the 5% hypothetical examples that appear in the shareholder reports of the other funds.
Please note that the expenses shown in the table are meant to highlight your ongoing costs. Therefore, the “Hypothetical” line of the table is useful in comparing ongoing costs only and will not help you determine the relative total costs of owning different funds.
| | | | | | | | | | | | | | | | |
| | | Beginning
account value
4-1-2019 | | | Ending
account value
9-30-2019 | | | Expenses
paid during
the period¹ | | | Annualized net
expense ratio | |
| | | | | |
Class R6 | | | | | | | | | | | | | | | | |
| | | | |
Actual | | $ | 1,000.00 | | | $ | 1,066.18 | | | $ | 2.33 | | | | 0.45 | % |
| | | | |
Hypothetical (5% return before expenses) | | $ | 1,000.00 | | | $ | 1,022.81 | | | $ | 2.28 | | | | 0.45 | % |
| | | | | |
Institutional Class | | | | | | | | | | | | | | | | |
| | | | |
Actual | | $ | 1,000.00 | | | $ | 1,066.12 | | | $ | 2.59 | | | | 0.50 | % |
| | | | |
Hypothetical (5% return before expenses) | | $ | 1,000.00 | | | $ | 1,022.56 | | | $ | 2.53 | | | | 0.50 | % |
| 1 | Expenses paid is equal to the annualized net expense ratio of each class multiplied by the average account value over the period, multiplied by the number of days in the most recent fiscal half-year divided by the number of days in the fiscal year (to reflect the one-half-year period). |
8 | Wells Fargo Global Investment Grade Credit Fund
Portfolio of investments—September 30, 2019
| | | | | | | | | | | | | | | | |
| | | Interest
rate | | | Maturity
date | | | Principal | | | Value | |
| Asset-Backed Securities: 1.94% | | | | | | | | | | | | |
American Airlines Series 2014-1 Class A Pass-Through Trust | | | 3.70 | % | | | 4-1-2028 | | | $ | 300,768 | | | $ | 315,446 | |
British Airways Series 2019-1 Class AA Pass-Through Certificates 144A | | | 3.30 | | | | 6-15-2034 | | | | 1,000,000 | | | | 1,042,518 | |
Delta Air Lines Series 2019-1 Class AA Pass-Through Trust | | | 3.20 | | | | 10-25-2025 | | | | 500,000 | | | | 522,358 | |
| |
Total Asset-Backed Securities (Cost $1,799,425) | | | | 1,880,322 | |
| | | | | | | | | | | | | | | | |
| | | | |
Corporate Bonds and Notes: 52.85% | | | | | | | | | | | | | | | | |
| | | | |
Communication Services: 7.57% | | | | | | | | | | | | | | | | |
| | | | |
| Diversified Telecommunication Services: 2.65% | | | | | | | | | | | | |
AT&T Incorporated | | | 4.25 | | | | 3-1-2027 | | | | 705,000 | | | | 767,193 | |
AT&T Incorporated | | | 4.50 | | | | 3-9-2048 | | | | 700,000 | | | | 752,476 | |
Verizon Communications Incorporated | | | 2.88 | | | | 1-15-2038 | | | | 200,000 | | | | 269,924 | |
Verizon Communications Incorporated | | | 4.13 | | | | 8-15-2046 | | | | 690,000 | | | | 769,258 | |
| |
| | | | 2,558,851 | |
| | | | | | | | | | | | | | | | |
| | | | |
| Media: 4.92% | | | | | | | | | | | | |
Charter Communications Operating LLC | | | 4.91 | | | | 7-23-2025 | | | | 630,000 | | | | 692,355 | |
Comcast Corporation | | | 3.38 | | | | 8-15-2025 | | | | 845,000 | | | | 893,584 | |
Cox Communications Incorporated 144A | | | 4.60 | | | | 8-15-2047 | | | | 430,000 | | | | 472,212 | |
Discovery Incorporated | | | 2.50 | | | | 9-20-2024 | | | | 100,000 | | | | 126,650 | |
Discovery Incorporated | | | 5.30 | | | | 5-15-2049 | | | | 215,000 | | | | 238,232 | |
Fox Corporation 144A | | | 4.71 | | | | 1-25-2029 | | | | 1,285,000 | | | | 1,466,764 | |
Interpublic Group of Companies | | | 5.40 | | | | 10-1-2048 | | | | 350,000 | | | | 416,845 | |
MMS USA Financing Incorporated | | | 1.75 | | | | 6-13-2031 | | | | 400,000 | | | | 459,737 | |
| |
| | | | 4,766,379 | |
| | | | | | | | | | | | | | | | |
| | | | |
Consumer Discretionary: 1.25% | | | | | | | | | | | | | | | | |
| | | | |
| Hotels, Restaurants & Leisure: 1.12% | | | | | | | | | | | | |
Darden Restaurants Incorporated | | | 4.55 | | | | 2-15-2048 | | | | 860,000 | | | | 908,815 | |
Las Vegas Sands Corporation | | | 3.20 | | | | 8-8-2024 | | | | 175,000 | | | | 178,281 | |
| |
| | | | 1,087,096 | |
| | | | | | | | | | | | | | | | |
| | | | |
| Internet & Direct Marketing Retail: 0.13% | | | | | | | | | | | | |
Booking Holdings Incorporated | | | 1.80 | | | | 3-3-2027 | | | | 100,000 | | | | 120,449 | |
| | | | | | | | | | | | | | | | |
| | | | |
Consumer Staples: 3.52% | | | | | | | | | | | | | | | | |
| | | | |
| Beverages: 1.61% | | | | | | | | | | | | |
Anheuser-Busch InBev Finance Incorporated | | | 3.65 | | | | 2-1-2026 | | | | 905,000 | | | | 968,254 | |
Keurig Dr Pepper Incorporated | | | 4.60 | | | | 5-25-2028 | | | | 530,000 | | | | 595,262 | |
| |
| | | | 1,563,516 | |
| | | | | | | | | | | | | | | | |
| | | | |
| Food & Staples Retailing: 0.76% | | | | | | | | | | | | |
Walmart Incorporated | | | 3.70 | | | | 6-26-2028 | | | | 660,000 | | | | 732,137 | |
| | | | | | | | | | | | | | | | |
| | | | |
Food Products: 0.60% | | | | | | | | | | | | | | | | |
Mars Incorporated 144A | | | 3.95 | | | | 4-1-2049 | | | | 510,000 | | | | 581,759 | |
| | | | | | | | | | | | | | | | |
| | | | |
| Tobacco: 0.55% | | | | | | | | | | | | |
BAT Capital Corporation | | | 4.54 | | | | 8-15-2047 | | | | 555,000 | | | | 532,839 | |
| | | | | | | | | | | | | | | | |
| | | | |
Energy: 6.69% | | | | | | | | | | | | | | | | |
| | | | |
| Energy Equipment & Services: 0.85% | | | | | | | | | | | | |
Baker Hughes LLC | | | 3.34 | | | | 12-15-2027 | | | | 800,000 | | | | 820,727 | |
| | | | | | | | | | | | | | | | |
Wells Fargo Global Investment Grade Credit Fund | 9
Portfolio of investments—September 30, 2019
| | | | | | | | | | | | | | | | |
| | | Interest
rate | | | Maturity
date | | | Principal | | | Value | |
| Oil, Gas & Consumable Fuels: 5.84% | | | | | | | | | | | | |
BP Capital Markets America Incorporated | | | 2.75 | % | | | 5-10-2023 | | | $ | 415,000 | | | $ | 423,931 | |
Energy Transfer Operating Partners LP | | | 6.25 | | | | 4-15-2049 | | | | 820,000 | | | | 995,610 | |
Kinder Morgan Energy Partners LP | | | 5.40 | | | | 9-1-2044 | | | | 530,000 | | | | 607,559 | |
Marathon Petroleum Corporation | | | 3.80 | | | | 4-1-2028 | | | | 415,000 | | | | 432,633 | |
Midwest Connector Capital Company 144A | | | 3.90 | | | | 4-1-2024 | | | | 850,000 | | | | 895,394 | |
MPLX LP | | | 4.00 | | | | 3-15-2028 | | | | 670,000 | | | | 698,612 | |
Occidental Petroleum Corporation | | | 4.30 | | | | 8-15-2039 | | | | 650,000 | | | | 667,199 | |
Sabine Pass Liquefaction LLC | | | 5.75 | | | | 5-15-2024 | | | | 840,000 | | | | 936,363 | |
| |
| | | | 5,657,301 | |
| | | | | | | | | | | | | | | | |
| | | | |
Financials: 18.56% | | | | | | | | | | | | | | | | |
| | | | |
| Banks: 6.03% | | | | | | | | | | | | |
Bank of America Corporation | | | 4.13 | | | | 1-22-2024 | | | | 1,180,000 | | | | 1,271,192 | |
Citigroup Incorporated (3 Month EURIBOR +1.07%)± | | | 1.50 | | | | 7-24-2026 | | | | 200,000 | | | | 231,372 | |
Citigroup Incorporated | | | 3.30 | | | | 4-27-2025 | | | | 1,320,000 | | | | 1,378,982 | |
JPMorgan Chase & Company | | | 0.63 | | | | 1-25-2024 | | | | 200,000 | | | | 222,840 | |
JPMorgan Chase & Company | | | 2.30 | | | | 8-15-2021 | | | | 1,385,000 | | | | 1,388,675 | |
JPMorgan Chase & Company (3 Month LIBOR +0.70%)± | | | 3.21 | | | | 4-1-2023 | | | | 425,000 | | | | 435,109 | |
JPMorgan Chase & Company (3 Month LIBOR +1.34%)± | | | 3.78 | | | | 2-1-2028 | | | | 425,000 | | | | 455,260 | |
Santander Holdings USA Incorporated | | | 4.40 | | | | 7-13-2027 | | | | 425,000 | | | | 454,686 | |
| |
| | | | 5,838,116 | |
| | | | | | | | | | | | | | | | |
| | | | |
| Capital Markets: 8.47% | | | | | | | | | | | | |
Cantor Fitzgerald LP 144A | | | 4.88 | | | | 5-1-2024 | | | | 1,065,000 | | | | 1,124,353 | |
Five Corners Funding Trust 144A | | | 4.42 | | | | 11-15-2023 | | | | 110,000 | | | | 118,926 | |
Goldman Sachs Group Incorporated | | | 3.63 | | | | 1-22-2023 | | | | 1,530,000 | | | | 1,591,789 | |
Goldman Sachs Group Incorporated | | | 4.25 | | | | 1-29-2026 | | | | 200,000 | | | | 280,433 | |
Morgan Stanley | | | 3.13 | | | | 7-27-2026 | | | | 1,200,000 | | | | 1,235,858 | |
Morgan Stanley | | | 3.70 | | | | 10-23-2024 | | | | 1,765,000 | | | | 1,869,822 | |
Nuveen LLC 144A | | | 4.00 | | | | 11-1-2028 | | | | 585,000 | | | | 653,475 | |
Raymond James Financial Services Incorporated | | | 4.95 | | | | 7-15-2046 | | | | 1,115,000 | | | | 1,333,063 | |
| |
| | | | 8,207,719 | |
| | | | | | | | | | | | | | | | |
| | | | |
| Consumer Finance: 0.89% | | | | | | | | | | | | |
American Express Credit Corporation | | | 3.30 | | | | 5-3-2027 | | | | 595,000 | | | | 635,111 | |
Capital One Financial Company | | | 0.80 | | | | 6-12-2024 | | | | 200,000 | | | | 222,086 | |
| |
| | | | 857,197 | |
| | | | | | | | | | | | | | | | |
| | | | |
| Diversified Financial Services: 1.18% | | | | | | | | | | | | |
Intercontinental Exchange Incorporated | | | 3.75 | | | | 12-1-2025 | | | | 1,065,000 | | | | 1,146,608 | |
| | | | | | | | | | | | | | | | |
| | | | |
| Insurance: 1.99% | | | | | | | | | | | | |
American International Group Incorporated | | | 4.75 | | | | 4-1-2048 | | | | 945,000 | | | | 1,104,355 | |
Berkshire Hathaway Incorporated | | | 2.38 | | | | 6-19-2039 | | | | 200,000 | | | | 264,693 | |
Brighthouse Financial Incorporated | | | 4.70 | | | | 6-22-2047 | | | | 630,000 | | | | 562,363 | |
| |
| | | | 1,931,411 | |
| | | | | | | | | | | | | | | | |
| | | | |
Health Care: 2.33% | | | | | | | | | | | | | | | | |
| | | | |
| Health Care Equipment & Supplies: 0.24% | | | | | | | | | | | | |
Baxter International Incorporated | | | 1.30 | | | | 5-30-2025 | | | | 200,000 | | | | 230,171 | |
| | | | | | | | | | | | | | | | |
| Health Care Providers & Services: 1.87% | | | | | | | | | | | | |
CVS Health Corporation | | | 3.25 | | | | 8-15-2029 | | | | 245,000 | | | | 246,341 | |
CVS Health Corporation | | | 3.70 | | | | 3-9-2023 | | | | 1,160,000 | | | | 1,207,359 | |
10 | Wells Fargo Global Investment Grade Credit Fund
Portfolio of investments—September 30, 2019
| | | | | | | | | | | | | | | | |
| | | Interest
rate | | | Maturity
date | | | Principal | | | Value | |
| Health Care Providers & Services (continued) | | | | | | | | | | | | |
CVS Health Corporation | | | 4.30 | % | | | 3-25-2028 | | | $ | 330,000 | | | $ | 356,932 | |
| |
| | | | 1,810,632 | |
| | | | | | | | | | | | | | | | |
| | | | |
| Life Sciences Tools & Services: 0.22% | | | | | | | | | | | | |
Thermo Fisher Scientific Incorporated | | | 1.50 | | | | 10-1-2039 | | | | 200,000 | | | | 219,858 | |
| | | | | | | | | | | | | | | | |
| | | | |
Industrials: 3.70% | | | | | | | | | | | | | | | | |
| | | | |
| Aerospace & Defense: 1.27% | | | | | | | | | | | | |
General Dynamics Corporation | | | 3.38 | | | | 5-15-2023 | | | | 555,000 | | | | 580,761 | |
United Technologies Corporation | | | 4.13 | | | | 11-16-2028 | | | | 575,000 | | | | 650,695 | |
| |
| | | | 1,231,456 | |
| | | | | | | | | | | | | | | | |
| | | | |
| Air Freight & Logistics: 0.37% | | | | | | | | | | | | |
FedEx Corporation | | | 4.95 | | | | 10-17-2048 | | | | 325,000 | | | | 360,718 | |
| | | | | | | | | | | | | | | | |
| | | | |
| Airlines: 0.68% | | | | | | | | | | | | |
Aviation Capital Group Corporation 144A | | | 2.88 | | | | 1-20-2022 | | | | 490,000 | | | | 491,997 | |
US Airways Group Incorporated | | | 4.63 | | | | 12-3-2026 | | | | 158,617 | | | | 171,389 | |
| |
| | | | 663,386 | |
| | | | | | | | | | | | | | | | |
| | | | |
| Industrial Conglomerates: 0.69% | | | | | | | | | | | | |
3M Company | | | 2.00 | | | | 2-14-2025 | | | | 670,000 | | | | 665,892 | |
| | | | | | | | | | | | | | | | |
| | | | |
| Road & Rail: 0.69% | | | | | | | | | | | | |
Penske Truck Leasing Company LP 144A | | | 3.45 | | | | 7-1-2024 | | | | 640,000 | | | | 665,507 | |
| | | | | | | | | | | | | | | | |
| | | | |
Information Technology: 6.25% | | | | | | | | | | | | | | | | |
| | | | |
| Communications Equipment: 0.83% | | | | | | | | | | | | |
Motorola Solutions Incorporated | | | 4.60 | | | | 2-23-2028 | | | | 745,000 | | | | 804,531 | |
| | | | | | | | | | | | | | | | |
| | | | |
| IT Services: 1.41% | | | | | | | | | | | | |
Fiserv Incorporated | | | 2.25 | | | | 7-1-2025 | | | | 200,000 | | | | 254,109 | |
Fiserv Incorporated | | | 3.50 | | | | 7-1-2029 | | | | 470,000 | | | | 494,592 | |
Western Union Company | | | 4.25 | | | | 6-9-2023 | | | | 585,000 | | | | 614,977 | |
| |
| | | | 1,363,678 | |
| | | | | | | | | | | | | | | | |
| | | | |
| Semiconductors & Semiconductor Equipment: 2.11% | | | | | | | | | | | | |
Broadcom Corporation | | | 3.88 | | | | 1-15-2027 | | | | 660,000 | | | | 663,412 | |
Broadcom Incorporated 144A | | | 4.75 | | | | 4-15-2029 | | | | 640,000 | | | | 676,472 | |
Qualcomm Incorporated | | | 3.25 | | | | 5-20-2027 | | | | 670,000 | | | | 700,846 | |
| |
| | | | 2,040,730 | |
| | | | | | | | | | | | | | | | |
| | | | |
| Technology Hardware, Storage & Peripherals: 1.90% | | | | | | | | | | | | |
Apple Incorporated | | | 2.95 | | | | 9-11-2049 | | | | 340,000 | | | | 332,845 | |
Apple Incorporated | | | 3.20 | | | | 5-11-2027 | | | | 290,000 | | | | 307,595 | |
Apple Incorporated | | | 3.60 | | | | 7-31-2042 | | | | 200,000 | | | | 327,931 | |
Dell International LLC / EMC Corporation 144A | | | 5.45 | | | | 6-15-2023 | | | | 800,000 | | | | 871,138 | |
| |
| | | | 1,839,509 | |
| | | | | | | | | | | | | | | | |
| | | | |
Materials: 0.81% | | | | | | | | | | | | | | | | |
| | | | |
| Chemicals: 0.81% | | | | | | | | | | | | |
Celanese US Holdings LLC | | | 1.13 | | | | 9-26-2023 | | | | 200,000 | | | | 224,854 | |
Ecolab Incorporated | | | 1.00 | | | | 1-15-2024 | | | | 200,000 | | | | 226,267 | |
Westlake Chemical Corporation | | | 1.63 | | | | 7-17-2029 | | | | 300,000 | | | | 335,277 | |
| |
| | | | 786,398 | |
| | | | | | | | | | | | | | | | |
Wells Fargo Global Investment Grade Credit Fund | 11
Portfolio of investments—September 30, 2019
| | | | | | | | | | | | | | | | |
| | | Interest
rate | | | Maturity
date | | | Principal | | | Value | |
Real Estate: 1.14% | | | | | | | | | | | | | | | | |
| | | | |
| Equity REITs: 0.44% | | | | | | | | | | | | |
American Tower Corporation | | | 1.95 | % | | | 5-22-2026 | | | $ | 200,000 | | | $ | 237,517 | |
Sabra Health Care LP / Sabra Capital Corporation | | | 4.80 | | | | 6-1-2024 | | | | 180,000 | | | | 189,938 | |
| |
| | | | 427,455 | |
| | | | | | | | | | | | | | | | |
| | | | |
| Real Estate Management & Development: 0.70% | | | | | | | | | | | | |
Simon Property Group LP | | | 3.25 | | | | 9-13-2049 | | | | 695,000 | | | | 678,103 | |
| | | | | | | | | | | | | | | | |
| | | | |
Utilities: 1.03% | | | | | | | | | | | | | | | | |
| | | | |
| Electric Utilities: 1.03% | | | | | | | | | | | | |
New York State Electric & Gas Corporation 144A | | | 3.25 | | | | 12-1-2026 | | | | 300,000 | | | | 311,903 | |
Pacificorp | | | 3.50 | | | | 6-15-2029 | | | | 630,000 | | | | 687,010 | |
| |
| | | | 998,913 | |
| | | | | | | | | | | | | | | | |
| |
Total Corporate Bonds and Notes (Cost $49,016,627) | | | | 51,189,042 | |
| | | | | | | | | | | | | | | | |
| | | | |
Foreign Corporate Bonds and Notes: 25.23% | | | | | | | | | | | | | | | | |
| | | | |
Communication Services: 1.73% | | | | | | | | | | | | | | | | |
| | | | |
| Diversified Telecommunication Services: 0.92% | | | | | | | | | | | | |
British Telecommunication plc | | | 3.63 | | | | 11-21-2047 | | | GBP | 200,000 | | | | 272,845 | |
Deutsche Telekom International Finance BV | | | 2.25 | | | | 4-13-2029 | | | GBP | 200,000 | | | | 254,766 | |
Orange SA (EURIBOR ICE Swap +2.18%)± | | | 1.75 | | | | 12-31-2099 | | | EUR | 200,000 | | | | 217,165 | |
Telefonica Emisiones SAU | | | 5.38 | | | | 2-2-2026 | | | GBP | 100,000 | | | | 149,125 | |
| |
| | | | 893,901 | |
| | | | | | | | | | | | | | | | |
| | | | |
| Wireless Telecommunication Services: 0.81% | | | | | | | | | | | | |
Rogers Communications Incorporated | | | 5.34 | | | | 3-22-2021 | | | CAD | 400,000 | | | | 315,233 | |
Tele2 AB | | | 1.13 | | | | 5-15-2024 | | | EUR | 200,000 | | | | 226,667 | |
Tele2 AB | | | 2.13 | | | | 5-15-2028 | | | EUR | 200,000 | | | | 241,872 | |
| |
| | | | 783,772 | |
| | | | | | | | | | | | | | | | |
| | | | |
Consumer Discretionary: 0.33% | | | | | | | | | | | | | | | | |
| | | | |
| Health Care Equipment & Supplies: 0.33% | | | | | | | | | | | | |
Motability Operations Limited | | | 2.38 | | | | 7-3-2039 | | | GBP | 250,000 | | | | 322,124 | |
| | | | | | | | | | | | | | | | |
| | | | |
Consumer Staples: 0.82% | | | | | | | | | | | | | | | | |
| | | | |
| Beverages: 0.25% | | | | | | | | | | | | |
Coca-Cola European Partners plc | | | 1.50 | | | | 11-8-2027 | | | EUR | 200,000 | | | | 236,752 | |
| | | | | | | | | | | | | | | | |
| | | | |
| Food Products: 0.11% | | | | | | | | | | | | |
Kerry Group Financial Services | | | 0.63 | | | | 9-20-2029 | | | EUR | 100,000 | | | | 109,053 | |
| | | | | | | | | | | | | | | | |
| | | | |
| Tobacco: 0.46% | | | | | | | | | | | | |
Swedish Match AB | | | 0.88 | | | | 9-23-2024 | | | EUR | 400,000 | | | | 444,905 | |
| | | | | | | | | | | | | | | | |
| | | | |
Financials: 15.10% | | | | | | | | | | | | | | | | |
| | | | |
| Banks: 9.16% | | | | | | | | | | | | |
Achmea Bank NV | | | 1.13 | | | | 4-25-2022 | | | EUR | 200,000 | | | | 224,316 | |
Achmea Bank NV | | | 2.75 | | | | 2-18-2021 | | | EUR | 100,000 | | | | 113,390 | |
Argenta Spaarbank NV (5 Year EUR Swap +3.95%)± | | | 3.88 | | | | 5-24-2026 | | | EUR | 200,000 | | | | 228,404 | |
Banco BPM SpA | | | 2.50 | | | | 6-21-2024 | | | EUR | 200,000 | | | | 225,802 | |
Banco de Sabadell SA | | | 1.13 | | | | 3-27-2025 | | | EUR | 100,000 | | | | 109,028 | |
12 | Wells Fargo Global Investment Grade Credit Fund
Portfolio of investments—September 30, 2019
| | | | | | | | | | | | | | | | |
| | | Interest
rate | | | Maturity
date | | | Principal | | | Value | |
| | | | |
| Banks (continued) | | | | | | | | | | | | |
Bankinter SA | | | 0.88 | % | | | 3-5-2024 | | | EUR | 200,000 | | | $ | 225,241 | |
Banque Federative du Credit Mutuel | | | 3.00 | | | | 5-21-2024 | | | EUR | 200,000 | | | | 243,392 | |
Barclays plc (British Pound Swap Curve +1.32%)± | | | 2.38 | | | | 10-6-2023 | | | GBP | 200,000 | | | | 247,966 | |
Bawag Group AG (5 Year EUR Swap +2.30%)± | | | 2.38 | | | | 3-26-2029 | | | EUR | 200,000 | | | | 225,259 | |
BNP Paribas | | | 1.25 | | | | 3-19-2025 | | | EUR | 200,000 | | | | 229,211 | |
Caixabank SA | | | 0.63 | | | | 10-1-2024 | | | EUR | 200,000 | | | | 218,029 | |
Commerzbank AG | | | 0.50 | | | | 8-28-2023 | | | EUR | 200,000 | | | | 220,720 | |
Cooperatieve Rabobank UA | | | 0.63 | | | | 2-27-2024 | | | EUR | 200,000 | | | | 223,320 | |
Credit Agricole London | | | 1.38 | | | | 3-13-2025 | | | EUR | 200,000 | | | | 230,819 | |
Credit Suisse (5 Year EUR Swap +4.00%)± | | | 5.75 | | | | 9-18-2025 | | | EUR | 200,000 | | | | 229,624 | |
DBS Group Holdings Limited (5 Year EUR Swap +1.20%)± | | | 1.50 | | | | 4-11-2028 | | | EUR | 200,000 | | | | 222,394 | |
De Volksbank NV | | | 0.75 | | | | 6-25-2023 | | | EUR | 200,000 | | | | 224,060 | |
FCA Bank SpA | | | 1.63 | | | | 9-29-2021 | | | GBP | 100,000 | | | | 123,028 | |
Hamburg Commercial Bank | | | 0.50 | | | | 5-23-2022 | | | EUR | 200,000 | | | | 219,668 | |
Intesa Sanpaolo SpA | | | 1.13 | | | | 3-4-2022 | | | EUR | 200,000 | | | | 223,235 | |
Jyske Bank AS (5 Year EUR Swap +1.90%)± | | | 2.25 | | | | 4-5-2029 | | | EUR | 200,000 | | | | 229,414 | |
KBC Group NV | | | 0.75 | | | | 3-1-2022 | | | EUR | 200,000 | | | | 222,200 | |
Kutxabank SA | | | 0.50 | | | | 9-25-2024 | | | EUR | 100,000 | | | | 109,196 | |
Landesbank Baden-Wurttemberg (5 Year EUR Swap +1.77%)± | | | 2.88 | | | | 5-27-2026 | | | EUR | 200,000 | | | | 226,079 | |
Landsbankinn HF | | | 1.38 | | | | 3-14-2022 | | | EUR | 200,000 | | | | 222,780 | |
Lloyds Banking Group plc | | | 2.25 | | | | 10-16-2024 | | | GBP | 200,000 | | | | 250,804 | |
NIBC Bank NV | | | 1.13 | | | | 4-19-2023 | | | EUR | 200,000 | | | | 224,834 | |
NIBC Bank NV | | | 1.50 | | | | 1-31-2022 | | | EUR | 200,000 | | | | 225,117 | |
NIBC Bank NV | | | 2.00 | | | | 4-9-2024 | | | EUR | 200,000 | | | | 228,182 | |
Nordea Bank Abp | | | 0.88 | | | | 6-26-2023 | | | EUR | 200,000 | | | | 224,120 | |
Omnicom Finance Holdings plc | | | 1.40 | | | | 7-8-2031 | | | EUR | 200,000 | | | | 224,710 | |
Royal Bank of Canada | | | 1.97 | | | | 3-2-2022 | | | CAD | 400,000 | | | | 300,813 | |
Royal Bank of Canada | | | 2.00 | | | | 3-21-2022 | | | CAD | 400,000 | | | | 301,124 | |
Royal Bank of Scotland Group plc (British Pound Swap Curve +1.49%)± | | | 2.88 | | | | 9-19-2026 | | | GBP | 200,000 | | | | 253,404 | |
Tesco Personal Finance Group plc | | | 3.50 | | | | 7-25-2025 | | | GBP | 100,000 | | | | 125,004 | |
Toronto Dominion Bank | | | 3.23 | | | | 7-24-2024 | | | CAD | 1,000,000 | | | | 790,663 | |
Unione di Banche Italiane SpA | | | 2.63 | | | | 6-20-2024 | | | EUR | 250,000 | | | | 287,085 | |
Volkswagen Bank GmbH | | | 0.63 | | | | 9-8-2021 | | | EUR | 200,000 | | | | 220,306 | |
| |
| | | | 8,872,741 | |
| | | | | | | | | | | | | | | | |
| | | | |
| Capital Markets: 0.22% | | | | | | | | | | | | |
Deutsche Bank AG | | | 0.38 | | | | 1-18-2021 | | | EUR | 200,000 | | | | 216,840 | |
| | | | | | | | | | | | | | | | |
| | | | |
| Consumer Finance: 1.11% | | | | | | | | | | | | |
CPUK Finance Limited | | | 7.24 | | | | 2-28-2024 | | | GBP | 100,000 | | | | 149,929 | |
LeasePlan Corporation NV | | | 1.38 | | | | 3-7-2024 | | | EUR | 200,000 | | | | 226,614 | |
PSA Banque France | | | 0.63 | | | | 6-21-2024 | | | EUR | 200,000 | | | | 220,853 | |
Transurban Finance Company | | | 1.75 | | | | 3-29-2028 | | | EUR | 400,000 | | | | 477,184 | |
| |
| | | | 1,074,580 | |
| | | | | | | | | | | | | | | | |
| | | | |
| Diversified Financial Services: 1.17% | | | | | | | | | | | | |
Bevco Lux Sarl | | | 1.75 | | | | 2-9-2023 | | | EUR | 200,000 | | | | 227,611 | |
EDP Finance BV | | | 1.63 | | | | 1-26-2026 | | | EUR | 100,000 | | | | 117,298 | |
FCE Bank plc | | | 1.88 | | | | 6-24-2021 | | | EUR | 300,000 | | | | 333,875 | |
Nykredit Realkredit AS | | | 0.88 | | | | 1-17-2024 | | | EUR | 200,000 | | | | 223,378 | |
Selp Finance Sarl | | | 1.50 | | | | 11-20-2025 | | | EUR | 200,000 | | | | 228,291 | |
| |
| | | | 1,130,453 | |
| | | | | | | | | | | | | | | | |
| Insurance: 2.95% | | | | | | | | | | | | |
Aon plc | | | 2.88 | | | | 5-14-2026 | | | EUR | 300,000 | | | | 370,777 | |
Aviva plc (5 Year EUR Swap +5.13%)± | | | 6.13 | | | | 7-5-2043 | | | EUR | 200,000 | | | | 254,839 | |
Wells Fargo Global Investment Grade Credit Fund | 13
Portfolio of investments—September 30, 2019
| | | | | | | | | | | | | | | | |
| | | Interest
rate | | | Maturity
date | | | Principal | | | Value | |
| Insurance (continued) | | | | | | | | | | | | |
Aviva plc (ICE LIBOR GBP 6 Month +4.14%)± | | | 6.63 | % | | | 6-3-2041 | | | GBP | 200,000 | | | $ | 265,144 | |
Legal & General Group plc (3 Month U.S. Treasury Bill +9.33%)± | | | 10.00 | | | | 7-23-2041 | | | GBP | 200,000 | | | | 282,316 | |
Liberty Mutual Finance Europe Designated Activity Company | | | 1.75 | | | | 3-27-2024 | | | EUR | 100,000 | | | | 115,659 | |
Mandatum Life Insurance Company Limited (3 Month EURIBOR +2.30%) %%± | | | 1.00 | | | | 10-4-2049 | | | EUR | 200,000 | | | | 219,407 | |
Munich Re Group (ICE LIBOR GBP 3 Month +4.95%)± | | | 6.63 | | | | 5-26-2042 | | | GBP | 200,000 | | | | 278,245 | |
Sampo Oyj | | | 1.63 | | | | 2-21-2028 | | | EUR | 200,000 | | | | 239,397 | |
Sampo Oyj (3 Month EURIBOR +4.05%)± | | | 3.38 | | | | 5-23-2049 | | | EUR | 200,000 | | | | 245,744 | |
Swiss Re Finance (Luxembourg) SA (EURIBOR ICE Swap rate 11:00am +2.85%) ± | | | 2.53 | | | | 4-30-2050 | | | EUR | 200,000 | | | | 245,391 | |
UMG Groupe VYV | | | 1.63 | | | | 7-2-2029 | | | EUR | 300,000 | | | | 345,666 | |
| |
| | | | 2,862,585 | |
| | | | | | | | | | | | | | | | |
| | | | |
| Mortgage REITs: 0.25% | | | | | | | | | | | | |
Digital Euro Finco LLC | | | 2.63 | | | | 4-15-2024 | | | EUR | 200,000 | | | | 239,394 | |
| | | | | | | | | | | | | | | | |
| | | | |
| Thrifts & Mortgage Finance: 0.24% | | | | | | | | | | | | |
Aareal Bank AG (5 Year EUR Swap +2.90%)± | | | 4.25 | | | | 3-18-2026 | | | EUR | 200,000 | | | | 228,249 | |
| | | | | | | | | | | | | | | | |
| | | | |
Health Care: 1.06% | | | | | | | | | | | | | | | | |
| | | | |
| Life Sciences Tools & Services: 0.24% | | | | | | | | | | | | |
Thermo Fisher Scientific Company | | | 1.40 | | | | 1-23-2026 | | | EUR | 200,000 | | | | 231,894 | |
| | | | | | | | | | | | | | | | |
| | | | |
| Pharmaceuticals: 0.82% | | | | | | | | | | | | |
Bayer AG (5 Year EUR Swap +2.18%)± | | | 3.00 | | | | 7-1-2075 | | | EUR | 100,000 | | | | 110,205 | |
Merck KGaA (5 Year EUR Swap +1.95%)± | | | 1.63 | | | | 6-25-2079 | | | EUR | 200,000 | | | | 223,276 | |
Sanofi SA | | | 1.25 | | | | 3-21-2034 | | | EUR | 200,000 | | | | 240,072 | |
Takeda Pharmaceutical Company | | | 1.13 | | | | 11-21-2022 | | | EUR | 200,000 | | | | 224,741 | |
| |
| | | | 798,294 | |
| | | | | | | | | | | | | | | | |
| | | | |
Industrials: 1.47% | | | | | | | | | | | | | | | | |
| | | | |
| Commercial Services & Supplies: 0.25% | | | | | | | | | | | | |
Edenred | | | 1.88 | | | | 3-6-2026 | | | EUR | 200,000 | | | | 238,580 | |
| | | | | | | | | | | | | | | | |
| | | | |
| Containers & Packaging: 0.24% | | | | | | | | | | | | |
Brambles Finance plc | | | 1.50 | | | | 10-4-2027 | | | EUR | 200,000 | | | | 237,581 | |
| | | | | | | | | | | | | | | | |
| | | | |
| Industrial Conglomerates: 0.51% | | | | | | | | | | | | |
DH Europe Finance SA | | | 0.20 | | | | 3-18-2026 | | | EUR | 150,000 | | | | 162,992 | |
DH Europe Finance SA | | | 0.45 | | | | 3-18-2028 | | | EUR | 100,000 | | | | 109,152 | |
Koninklijke Philips NV | | | 0.50 | | | | 5-22-2026 | | | EUR | 200,000 | | | | 223,049 | |
| |
| | | | 495,193 | |
| | | | | | | | | | | | | | | | |
| | | | |
| Machinery: 0.24% | | | | | | | | | | | | |
CNH Industrial Finance Europe SA | | | 1.88 | | | | 1-19-2026 | | | EUR | 200,000 | | | | 230,244 | |
| | | | | | | | | | | | | | | | |
| | | | |
| Road & Rail: 0.23% | | | | | | | | | | | | |
ALD SA | | | 1.25 | | | | 10-11-2022 | | | EUR | 200,000 | | | | 225,033 | |
| | | | | | | | | | | | | | | | |
| | | | |
Information Technology: 0.46% | | | | | | | | | | | | | | | | |
| | | | |
| IT Services: 0.46% | | | | | | | | | | | | |
Capgemini SE | | | 1.00 | | | | 10-18-2024 | | | EUR | 200,000 | | | | 226,818 | |
Worldline SA | | | 0.25 | | | | 9-18-2024 | | | EUR | 200,000 | | | | 217,141 | |
| |
| | | | 443,959 | |
| | | | | | | | | | | | | | | | |
14 | Wells Fargo Global Investment Grade Credit Fund
Portfolio of investments—September 30, 2019
| | | | | | | | | | | | | | | | |
| | | Interest
rate | | | Maturity
date | | | Principal | | | Value | |
Materials: 1.31% | | | | | | | | | | | | | | | | |
| | | | |
| Chemicals: 0.84% | | | | | | | | | | | | |
Arkema Company (5 Year EUR Swap +2.87%)± | | | 2.75 | % | | | 12-31-2099 | | | EUR | 200,000 | | | $ | 226,165 | |
Sika Capital BV | | | 0.88 | | | | 4-29-2027 | | | EUR | 200,000 | | | | 227,451 | |
Sika Capital BV | | | 1.50 | | | | 4-29-2031 | | | EUR | 200,000 | | | | 237,374 | |
Solvay SA (5 Year EUR Swap +3.92%)± | | | 4.25 | | | | 12-31-2099 | | | EUR | 100,000 | | | | 120,038 | |
| |
| | | | 811,028 | |
| | | | | | | | | | | | | | | | |
| | | | |
| Containers & Packaging: 0.23% | | | | | | | | | | | | |
DS Smith plc | | | 2.25 | | | | 9-16-2022 | | | EUR | 200,000 | | | | 229,443 | |
| | | | | | | | | | | | | | | | |
| | | | |
| Paper & Forest Products: 0.24% | | | | | | | | | | | | |
Mondi Finance plc | | | 1.63 | | | | 4-27-2026 | | | EUR | 200,000 | | | | 231,706 | |
| | | | | | | | | | | | | | | | |
| | | | |
Real Estate: 0.48% | | | | | | | | | | | | | | | | |
| | | | |
| Equity REITs: 0.48% | | | | | | | | | | | | |
Inmobiliaria Colonial SA | | | 1.45 | | | | 10-28-2024 | | | EUR | 400,000 | | | | 459,492 | |
| | | | | | | | | | | | | | | | |
| | | | |
Utilities: 2.47% | | | | | | | | | | | | | | | | |
| | | | |
| Electric Utilities: 2.24% | | | | | | | | | | | | |
Electricite de France SA (12 Year EUR Swap +3.79%)± | | | 5.38 | | | | 1-29-2049 | | | EUR | 200,000 | | | | 249,054 | |
Electricite de France SA | | | 5.50 | | | | 10-17-2041 | | | GBP | 200,000 | | | | 361,866 | |
ESB Finance Designated Activity Company | | | 1.13 | | | | 6-11-2030 | | | EUR | 300,000 | | | | 350,365 | |
Eurogrid GmbH | | | 1.88 | | | | 6-10-2025 | | | EUR | 200,000 | | | | 238,720 | |
Fortum Oyj | | | 0.88 | | | | 2-27-2023 | | | EUR | 400,000 | | | | 446,312 | |
Reseau de Transport d’Electricite | | | 1.88 | | | | 10-23-2037 | | | EUR | 400,000 | | | | 520,791 | |
| |
| | | | 2,167,108 | |
| | | | | | | | | | | | | | | | |
| | | | |
| Water Utilities: 0.23% | | | | | | | | | | | | |
FCC Aqualia SA | | | 1.41 | | | | 6-8-2022 | | | EUR | 200,000 | | | | 224,729 | |
| | | | | | | | | | | | | | | | |
| |
Total Foreign Corporate Bonds and Notes (Cost $24,640,614) | | | | 24,439,633 | |
| | | | | | | | | | | | | | | | |
| | | | |
| Foreign Government Bonds: 1.43% | | | | | | | | | | | | |
Bonos y Obligaciones del Estado 144A | | | 0.25 | | | | 7-30-2024 | | | EUR | 500,000 | | | | 559,461 | |
France Government Bonds | | | 0.50 | | | | 5-25-2029 | | | EUR | 700,000 | | | | 820,960 | |
| |
Total Foreign Government Bonds (Cost $1,415,466) | | | | 1,380,421 | |
| | | | | | | | | | | | | | | | |
| | | | |
| U.S. Treasury Securities: 0.17% | | | | | | | | | | | | |
U.S. Treasury Bond | | | 2.88 | | | | 5-15-2049 | | | $ | 140,000 | | | | 163,417 | |
| | | | | | | | | | | | | | | | |
| |
Total U.S. Treasury Securities (Cost $162,589) | | | | 163,417 | |
| | | | | | | | | | | | | | | | |
| | | | |
| Yankee Corporate Bonds and Notes: 15.00% | | | | | | | | | | | | |
| | | | |
Communication Services: 2.43% | | | | | | | | | | | | | | | | |
| | | | |
| Diversified Telecommunication Services: 0.68% | | | | | | | | | | | | |
Telefonica Emisiones SAU | | | 4.10 | | | | 3-8-2027 | | | | 600,000 | | | | 655,021 | |
| | | | | | | | | | | | | | | | |
| | | | |
| Interactive Media & Services: 0.96% | | | | | | | | | | | | |
Tencent Holdings Limited 144A | | | 3.60 | | | | 1-19-2028 | | | | 895,000 | | | | 935,309 | |
| | | | | | | | | | | | | | | | |
| | | | |
| Wireless Telecommunication Services: 0.79% | | | | | | | | | | | | |
Vodafone Group plc | | | 4.38 | | | | 5-30-2028 | | | | 690,000 | | | | 762,219 | |
| | | | | | | | | | | | | | | | |
| | | | |
Consumer Staples: 1.10% | | | | | | | | | | | | | | | | |
| | | | |
| Household Products: 0.79% | | | | | | | | | | | | |
Reckitt Benckiser Treasury Services plc 144A | | | 2.75 | | | | 6-26-2024 | | | | 755,000 | | | | 769,044 | |
| | | | | | | | | | | | | | | | |
Wells Fargo Global Investment Grade Credit Fund | 15
Portfolio of investments—September 30, 2019
| | | | | | | | | | | | | | | | |
| | | Interest
rate | | | Maturity
date | | | Principal | | | Value | |
| Tobacco: 0.31% | | | | | | | | | | | | |
Imperial Brands Finance plc 144A | | | 3.50 | % | | | 7-26-2026 | | | $ | 300,000 | | | $ | 299,844 | |
| | | | | | | | | | | | | | | | |
| | | | |
Energy: 0.85% | | | | | | | | | | | | | | | | |
| | | | |
| Oil, Gas & Consumable Fuels: 0.85% | | | | | | | | | | | | |
Petroleos Mexicanos Company 144A | | | 7.69 | | | | 1-23-2050 | | | | 500,000 | | | | 521,400 | |
Saudi Arabian Oil Company 144A | | | 4.38 | | | | 4-16-2049 | | | | 275,000 | | | | 300,601 | |
| |
| | | | 822,001 | |
| | | | | | | | | | | | | | | | |
| | | | |
Financials: 9.90% | | | | | | | | | | | | | | | | |
| | | | |
| Banks: 6.03% | | | | | | | | | | | | |
Banco Santander SA (3 Month LIBOR +1.56%)± | | | 3.90 | | | | 4-11-2022 | | | | 800,000 | | | | 812,051 | |
Bank of Tokyo-Mitsubishi UFJ Limited 144A | | | 2.30 | | | | 3-5-2020 | | | | 690,000 | | | | 690,501 | |
Credit Suisse New York | | | 3.63 | | | | 9-9-2024 | | | | 830,000 | | | | 878,236 | |
HSBC Holdings plc | | | 4.30 | | | | 3-8-2026 | | | | 630,000 | | | | 682,215 | |
ING Groep NV (3 Month LIBOR +1.15%)± | | | 3.25 | | | | 3-29-2022 | | | | 490,000 | | | | 496,238 | |
Royal Bank of Scotland Group plc | | | 3.88 | | | | 9-12-2023 | | | | 690,000 | | | | 712,081 | |
Sumitomo Mitsui Financial Group | | | 2.06 | | | | 7-14-2021 | | | | 425,000 | | | | 423,714 | |
Sumitomo Mitsui Financial Group (3 Month LIBOR +0.74%)± | | | 3.04 | | | | 10-18-2022 | | | | 510,000 | | | | 511,325 | |
Westpac Banking Corporation | | | 3.65 | | | | 5-15-2023 | | | | 600,000 | | | | 631,674 | |
| |
| | | | 5,838,035 | |
| | | | | | | | | | | | | | | | |
| | | | |
| Capital Markets: 1.11% | | | | | | | | | | | | |
Macquarie Group Limited (3 Month LIBOR +1.02%) 144A± | | | 3.19 | | | | 11-28-2023 | | | | 300,000 | | | | 305,767 | |
Macquarie Group Limited 144A | | | 6.00 | | | | 1-14-2020 | | | | 765,000 | | | | 773,056 | |
| |
| | | | 1,078,823 | |
| | | | | | | | | | | | | | | | |
| | | | |
| Diversified Financial Services: 2.21% | | | | | | | | | | | | |
GE Capital International Funding Company | | | 4.42 | | | | 11-15-2035 | | | | 480,000 | | | | 503,477 | |
Invesco Finance plc | | | 3.13 | | | | 11-30-2022 | | | | 660,000 | | | | 676,133 | |
Siemens Financieringsmaatschappij NV 144A | | | 2.35 | | | | 10-15-2026 | | | | 630,000 | | | | 627,898 | |
WPP Finance Limited 2010 | | | 3.75 | | | | 9-19-2024 | | | | 320,000 | | | | 332,912 | |
| |
| | | | 2,140,420 | |
| | | | | | | | | | | | | | | | |
| | | | |
| Insurance: 0.55% | | | | | | | | | | | | |
Allied World Assurance Company Holdings Limited | | | 4.35 | | | | 10-29-2025 | | | | 216,000 | | | | 224,382 | |
AXIS Specialty Finance plc | | | 4.00 | | | | 12-6-2027 | | | | 295,000 | | | | 310,927 | |
| |
| | | | 535,309 | |
| | | | | | | | | | | | | | | | |
| | | | |
Information Technology: 0.72% | | | | | | | | | | | | | | | | |
| | | | |
| Semiconductors & Semiconductor Equipment: 0.72% | | | | | | | | | | | | |
NXP BV 144A | | | 3.88 | | | | 6-18-2026 | | | | 660,000 | | | | 694,034 | |
| | | | | | | | | | | | | | | | |
| |
Total Yankee Corporate Bonds and Notes (Cost $14,141,742) | | | | 14,530,059 | |
| | | | | | | | | | | | | | | | |
| | | | |
| | | | | | | | | | | | | | | | |
| | | Yield | | | | | | Shares | | | | |
| Short-Term Investments: 1.89% | | | | | | | | | | | | |
| | | | |
| Investment Companies: 1.89% | | | | | | | | | | | | |
Wells Fargo Government Money Market Fund Select Class (l)(u)## | | | 1.88 | | | | | | | | 1,834,198 | | | | 1,834,198 | |
| | | | | | | | | | | | | | | | |
| |
Total Short-Term Investments (Cost $1,834,198) | | | | 1,834,198 | |
| | | | | | | | | | | | | | | | |
| | | | | | | | |
| Total investments in securities (Cost $93,010,661) | | | 98.51 | % | | | 95,417,092 | |
| | |
Other assets and liabilities, net | | | 1.49 | | | | 1,445,174 | |
| | | | | | | | |
| Total net assets | | | 100.00 | % | | $ | 96,862,266 | |
| | | | | | | | |
16 | Wells Fargo Global Investment Grade Credit Fund
Portfolio of investments—September 30, 2019
| 144A | The security may be resold in transactions exempt from registration, normally to qualified institutional buyers, pursuant to Rule 144A under the Securities Act of 1933. |
| ± | Variable rate investment. The rate shown is the rate in effect at period end. |
| %% | The security is purchased on a when-issued basis. |
| (l) | The issuer of the security is an affiliated person of the Fund as defined in the Investment Company Act of 1940. |
| (u) | The rate represents the 7-day annualized yield at period end. |
| ## | All or a portion of this security is segregated for when-issued securities. |
Abbreviations:
| EURIBOR | Euro Interbank Offered Rate |
| LIBOR | London Interbank Offered Rate |
| REIT | Real estate investment trust |
Forward Foreign Currency Contracts
| | | | | | | | | | | | | | |
Currency to be
received | | Currency to be
delivered | | Counterparty | | Settlement
date | | Unrealized
gains | | | Unrealized
losses | |
| | | | | |
| 1,728,663 USD | | 2,300,000 CAD | | State Street Bank | | 10-24-2019 | | $ | 0 | | | $ | (8,039 | ) |
| | | | | |
| 4,649,235 USD | | 3,800,000 GBP | | State Street Bank | | 10-24-2019 | | | 0 | | | | (27,248 | ) |
| | | | | |
| 24,574,707 USD | | 22,100,000 EUR | | State Street Bank | | 10-24-2019 | | | 446,852 | | | | 0 | |
| | | | | | | | | | | | | | |
| | | | | |
| | | | | | | | $ | 446,852 | | | $ | (35,287 | ) |
| | | | | | | | | | | | | | |
Investments in Affiliates
An affiliated investment is an investment in which the Fund owns at least 5% of the outstanding voting shares of the issuer or as a result of other relationships, such as the Fund and the issuer having the same investment manager. Transactions with issuers that were either affiliated persons of the Fund at the beginning of the period or the end of the period were as follows:
| | | | | | | | | | | | | | | | | | | | | | | | | | | | | | | | | | | | |
| | | Shares, beginning of period | | | Shares purchased | | | Shares sold | | | Shares, end of period | | | Net
realized
gains
(losses) | | | Net
change in
unrealized
gains
(losses) | | | Income
from
affiliated
securities | | | Value, end of period | | | % of net
assets | |
| | | | | | | | | |
| Short-Term Investments | | | | | | | | | | | | | | | | | | | | | | | | | | | |
Investment Companies | | | | | | | | | | | | | | | | | | | | | | | | | | | | | | | | | | | | |
Wells Fargo Government Money Market Fund Select Class | | | 0 | | | | 108,098,469 | | | | 106,264,271 | | | | 1,834,198 | | | $ | 0 | | | $ | 0 | | | $ | 31,460 | | | $ | 1,834,198 | | | | 1.89 | % |
The accompanying notes are an integral part of these financial statements.
Wells Fargo Global Investment Grade Credit Fund | 17
Statement of assets and liabilities—September 30, 2019
| | | | |
| | | | |
| |
Assets | | | | |
Investments in unaffiliated securities, at value (cost $91,176,463) | | $ | 93,582,894 | |
Investments in affiliated securities, at value (cost $1,834,198) | | | 1,834,198 | |
Foreign currency, at value (cost $516,042) | | | 515,311 | |
Receivable for Fund shares sold | | | 2,742 | |
Receivable for interest | | | 836,978 | |
Unrealized gains on forward foreign currency contracts | | | 446,852 | |
Prepaid expenses and other assets | | | 6,627 | |
| | | | |
Total assets | | | 97,225,602 | |
| | | | |
| |
Liabilities | | | | |
Payable for investments purchased | | | 217,793 | |
Unrealized losses on forward foreign currency contracts | | | 35,287 | |
Payable for Fund shares redeemed | | | 13,947 | |
Management fee payable | | | 10,487 | |
Trustees’ fees and expenses payable | | | 2,431 | |
Administration fees payable | | | 2,400 | |
Custodian and accounting fees payable | | | 21,107 | |
Professional fees payable | | | 37,452 | |
Accrued expenses and other liabilities | | | 22,432 | |
| | | | |
Total liabilities | | | 363,336 | |
| | | | |
Total net assets | | $ | 96,862,266 | |
| | | | |
| |
Net assets consist of | | | | |
Paid-in capital | | $ | 92,406,826 | |
Total distributable earnings | | | 4,455,440 | |
| | | | |
Total net assets | | $ | 96,862,266 | |
| | | | |
| |
Computation of net asset value per share | | | | |
Net assets – Class R6 | | $ | 96,835,389 | |
Shares outstanding – Class R61 | | | 9,005,922 | |
Net asset value per share – Class R6 | | | $10.75 | |
Net assets – Institutional Class | | $ | 26,877 | |
Shares outstanding – Institutional Class1 | | | 2,500 | |
Net asset value per share – Institutional Class | | | $10.75 | |
| 1 | The Fund has an unlimited number of authorized shares. |
The accompanying notes are an integral part of these financial statements.
18 | Wells Fargo Global Investment Grade Credit Fund
Statement of operations—year ended September 30, 20191
| | | | |
| | | | |
| |
Investment income | | | | |
Interest | | $ | 1,031,228 | |
Income from affiliated securities | | | 31,460 | |
| | | | |
Total investment income | | | 1,062,688 | |
| | | | |
| |
Expenses | | | | |
Management fee | | | 152,550 | |
Administration fees | | | | |
Class R6 | | | 11,437 | |
Institutional Class | | | 13 | |
Custody and accounting fees | | | 21,107 | |
Professional fees | | | 50,551 | |
Registration fees | | | 37,054 | |
Shareholder report expenses | | | 26,097 | |
Trustees’ fees and expenses | | | 11,965 | |
Other fees and expenses | | | 17,589 | |
| | | | |
Total expenses | | | 328,363 | |
Less: Fee waivers and/or expense reimbursements | | | | |
Fund-level | | | (152,550 | ) |
Class R6 | | | (4,522 | ) |
Institutional Class | | | (10 | ) |
| | | | |
Net expenses | | | 171,281 | |
| | | | |
Net investment income | | | 891,407 | |
| | | | |
| |
Realized and unrealized gains (losses) on investments | | | | |
Net realized gains on | | | | |
Unaffiliated securities | | | 381,370 | |
Forward foreign currency contracts | | | 1,097,949 | |
| | | | |
Net realized gains on investments | | | 1,479,319 | |
| | | | |
| |
Net change in unrealized gains (losses) on | | | | |
Unaffiliated securities | | | 2,401,151 | |
Forward foreign currency contracts | | | 411,565 | |
| | | | |
Net change in unrealized gains (losses) on investments | | | 2,812,716 | |
| | | | |
Net realized and unrealized gains (losses) on investments | | | 4,292,035 | |
| | | | |
Net increase in net assets resulting from operations | | $ | 5,183,442 | |
| | | | |
| 1 | For the period from February 28, 2019 (commencement of operations) to September 30, 2019 |
The accompanying notes are an integral part of these financial statements.
Wells Fargo Global Investment Grade Credit Fund | 19
Statement of changes in net assets
| | | | | | | | |
| | | Year ended
September 30, 20191 | |
| | |
Operations | | | | | | | | |
Net investment income | | | | | | $ | 891,407 | |
Net realized gains on investments | | | | | | | 1,479,319 | |
Net change in unrealized gains (losses) on investments | | | | | | | 2,812,716 | |
| | | | |
Net increase in net assets resulting from operations | | | | | | | 5,183,442 | |
| | | | |
| | |
Distributions to shareholders from net investment income and net realized gains | | | | | | | | |
Class R6 | | | | | | | (727,723 | ) |
Institutional Class | | | | | | | (279 | ) |
| | | | |
Total distributions to shareholders | | | | | | | (728,002 | ) |
| | | | |
| | |
Capital share transactions | | | Shares | | | | | |
Proceeds from shares sold | | | | | | | | |
Class R6 | | | 9,630,811 | | | | 99,080,247 | |
Institutional Class | | | 2,500 | | | | 25,000 | |
| | | | |
| | | | | | | 99,105,247 | |
| | | | |
Reinvestment of distributions | | | | | | | | |
Class R6 | | | 20,783 | | | | 222,474 | |
| | | | |
Payment for shares redeemed | | | | | | | | |
Class R6 | | | (645,672 | ) | | | (6,920,895 | ) |
| | | | |
Net increase in net assets resulting from capital share transactions | | | | | | | 92,406,826 | |
| | | | |
Total increase in net assets | | | | | | | 96,862,266 | |
| | | | |
| |
Net assets | | | | |
Beginning of period | | | | | | | 0 | |
| | | | |
End of period | | | | | | $ | 96,862,266 | |
| | | | |
| 1 | For the period from February 28, 2019 (commencement of operations) to September 30, 2019 |
The accompanying notes are an integral part of these financial statements.
20 | Wells Fargo Global Investment Grade Credit Fund
Financial highlights
(For a share outstanding throughout the period)
| | | | |
| CLASS R6 | | Year ended
September 30, 20191 | |
Net asset value, beginning of period | | | $10.00 | |
Net investment income | | | 0.13 | |
Net realized and unrealized gains (losses) on investments | | | 0.73 | |
| | | | |
Total from investment operations | | | 0.86 | |
Distributions to shareholders from | | | | |
Net investment income | | | (0.11 | ) |
Net asset value, end of period | | | $10.75 | |
Total return2 | | | 8.64 | % |
Ratios to average net assets (annualized) | | | | |
Gross expenses | | | 0.86 | % |
Net expenses | | | 0.45 | % |
Net investment income | | | 2.34 | % |
Supplemental data | | | | |
Portfolio turnover rate | | | 36 | % |
Net assets, end of period (000s omitted) | | | $96,835 | |
| 1 | For the period from February 28, 2019 (commencement of class operations) to September 30, 2019 |
| 2 | Returns for periods of less than one year are not annualized. |
The accompanying notes are an integral part of these financial statements.
Wells Fargo Global Investment Grade Credit Fund | 21
Financial highlights
(For a share outstanding throughout the period)
| | | | |
| INSTITUTIONAL CLASS | | Year ended September 30, 20191 | |
Net asset value, beginning of period | | | $10.00 | |
Net investment income | | | 0.14 | |
Net realized and unrealized gains (losses) on investments | | | 0.72 | |
| | | | |
Total from investment operations | | | 0.86 | |
Distributions to shareholders from | | | | |
Net investment income | | | (0.11 | ) |
Net asset value, end of period | | | $10.75 | |
Total return2 | | | 8.64 | % |
Ratios to average net assets (annualized) | | | | |
Gross expenses | | | 0.97 | % |
Net expenses | | | 0.50 | % |
Net investment income | | | 2.34 | % |
Supplemental data | | | | |
Portfolio turnover rate | | | 36 | % |
Net assets, end of period (000s omitted) | | | $27 | |
| 1 | For the period from February 28, 2019 (commencement of class operations) to September 30, 2019 |
| 2 | Returns for periods of less than one year are not annualized. |
The accompanying notes are an integral part of these financial statements.
22 | Wells Fargo Global Investment Grade Credit Fund
Notes to financial statements
1. ORGANIZATION
Wells Fargo Funds Trust (the “Trust”), a Delaware statutory trust organized on March 10, 1999, is an open-end management investment company registered under the Investment Company Act of 1940, as amended (the “1940 Act”). As an investment company, the Trust follows the accounting and reporting guidance in Financial Accounting Standards Board (“FASB”) Accounting Standards Codification Topic 946, Financial Services – Investment Companies. These financial statements report on the Wells Fargo Global Investment Grade Credit Fund (the “Fund”) which is a diversified series of the Trust.
2. SIGNIFICANT ACCOUNTING POLICIES
The following significant accounting policies, which are consistently followed in the preparation of the financial statements of the Fund, are in conformity with U.S. generally accepted accounting principles which require management to make estimates and assumptions that affect the reported amounts of assets and liabilities, disclosure of contingent assets and liabilities at the date of the financial statements, and the reported amounts of revenues and expenses during the reporting period. Actual results could differ from those estimates.
Securities valuation
All investments are valued each business day as of the close of regular trading on the New York Stock Exchange (generally 4 p.m. Eastern Time), although the Fund may deviate from this calculation time under unusual or unexpected circumstances.
Debt securities are valued at the evaluated bid price provided by an independent pricing service (e.g. taking into account various factors, including yields, maturities, or credit ratings) or, if a reliable price is not available, the quoted bid price from an independent broker-dealer.
Forward foreign currency contracts are recorded at the forward rate provided by an independent foreign currency pricing source at a time each business day specified by the Wells Fargo Asset Management Pricing Committee at Wells Fargo Funds Management, LLC (“Funds Management”).
The values of securities denominated in foreign currencies are translated into U.S. dollars at rates provided by an independent foreign currency pricing source at a time each business day specified by the Wells Fargo Asset Management Pricing Committee.
Investments in registered open-end investment companies are valued at net asset value.
Investments which are not valued using any of the methods discussed above are valued at their fair value, as determined in good faith by the Board of Trustees of the Fund. The Board of Trustees has established a Valuation Committee comprised of the Trustees and has delegated to it the authority to take any actions regarding the valuation of portfolio securities that the Valuation Committee deems necessary or appropriate, including determining the fair value of portfolio securities, unless the determination has been delegated to the Wells Fargo Asset Management Pricing Committee. The Board of Trustees retains the authority to make or ratify any valuation decisions or approve any changes to the Valuation Procedures as it deems appropriate. On a quarterly basis, the Board of Trustees receives reports on any valuation actions taken by the Valuation Committee or the Wells Fargo Asset Management Pricing Committee which may include items for ratification.
Foreign currency translation
The accounting records of the Fund are maintained in U.S. dollars. The values of other assets and liabilities denominated in foreign currencies are translated into U.S. dollars at rates provided by an independent foreign currency pricing source at a time each business day specified by the Wells Fargo Asset Management Pricing Committee. Purchases and sales of securities, and income and expenses are converted at the rate of exchange on the respective dates of such transactions. Net realized foreign exchange gains or losses arise from sales of foreign currencies, currency gains or losses realized between the trade and settlement dates on securities transactions, and the difference between the amounts of dividends, interest and foreign withholding taxes recorded and the U.S. dollar equivalent of the amounts actually paid or received. Net unrealized foreign exchange gains and losses arise from changes in the fair value of assets and liabilities other than investments in securities resulting from changes in exchange rates. The changes in net assets arising from changes in exchange rates of securities and the changes in net assets resulting from changes in market prices of securities are not separately presented. Such changes are included in net realized and unrealized gains or losses from investments.
Forward foreign currency contracts
A forward foreign currency contract is an agreement between two parties to purchase or sell a specific currency for an agreed-upon price at a future date. The Fund enters into forward foreign currency contracts to facilitate transactions in foreign-denominated securities and to attempt to minimize the risk to the Fund from adverse changes in the relationship between currencies. Forward foreign currency contracts are recorded at the forward rate and marked-to-market daily. When the contracts are closed, realized gains and losses arising from such transactions are recorded as realized gains or losses on forward foreign
Wells Fargo Global Investment Grade Credit Fund | 23
Notes to financial statements
currency contracts. The Fund is subject to foreign currency risk and may be exposed to risks if the counterparties to the contracts are unable to meet the terms of their contracts or if the value of the foreign currency changes unfavorably. The Fund’s maximum risk of loss from counterparty credit risk is the unrealized gains on the contracts. This risk may be mitigated if there is a master netting arrangement between the Fund and the counterparty.
Security transactions and income recognition
Securities transactions are recorded on a trade date basis. Realized gains or losses are recorded on the basis of identified cost.
Interest income is accrued daily and bond discounts are accreted and premiums are amortized daily. To the extent debt obligations are placed on non-accrual status, any related interest income may be reduced by writing off interest receivables when the collection of all or a portion of interest has been determined to be doubtful based on consistently applied procedures and the fair value has decreased. If the issuer subsequently resumes interest payments or when the collectability of interest is reasonably assured, the debt obligation is removed from non-accrual status.
Distributions to shareholders
Distributions to shareholders are recorded on the ex-dividend date and paid from net investment income monthly and any net realized gains are paid at least annually. Such distributions are determined in accordance with income tax regulations and may differ from U.S. generally accepted accounting principles. Dividend sources are estimated at the time of declaration. The tax character of distributions is determined as of the Fund’s fiscal year end. Therefore, a portion of the Fund’s distributions made prior to the Fund’s fiscal year end may be categorized as a tax return of capital at year end.
Federal and other taxes
The Fund intends to qualify as a regulated investment company by distributing substantially all of its investment company taxable income and any net realized capital gains (after reduction for capital loss carryforwards) sufficient to relieve it from all, or substantially all, federal income taxes. Accordingly, no provision for federal income taxes was required.
The Fund’s income and federal excise tax returns and all financial records supporting those returns for the fiscal year since commencement of operations will be subject to examination by the federal and Delaware revenue authorities.
As of September 30, 2019, the aggregate cost of all investments for federal income tax purposes was $92,559,265 and the unrealized gains (losses) consisted of:
| | | | |
| |
Gross unrealized gains | | $ | 3,740,108 | |
| |
Gross unrealized losses | | | (470,716 | ) |
| |
Net unrealized gains | | $ | 3,269,392 | |
Class allocations
The separate classes of shares offered by the Fund differ principally in administration fees. Class specific expenses are charged directly to that share class. Investment income, common fund-level expenses, and realized and unrealized gains (losses) on investments are allocated daily to each class of shares based on the relative proportion of net assets of each class.
3. FAIR VALUATION MEASUREMENTS
Fair value measurements of investments are determined within a framework that has established a fair value hierarchy based upon the various data inputs utilized in determining the value of the Fund’s investments. The three-level hierarchy gives the highest priority to unadjusted quoted prices in active markets for identical assets or liabilities (Level 1) and the lowest priority to unobservable inputs (Level 3). The Fund’s investments are classified within the fair value hierarchy based on the lowest level of input that is significant to the fair value measurement. The inputs are summarized into three broad levels as follows:
| ∎ | | Level 1 – quoted prices in active markets for identical securities |
| ∎ | | Level 2 – other significant observable inputs (including quoted prices for similar securities, interest rates, prepayment speeds, credit risk, etc.) |
| ∎ | | Level 3 – significant unobservable inputs (including the Fund’s own assumptions in determining the fair value of investments) |
The inputs or methodologies used for valuing investments in securities are not necessarily an indication of the risk associated with investing in those securities.
24 | Wells Fargo Global Investment Grade Credit Fund
Notes to financial statements
The following is a summary of the inputs used in valuing the Fund’s assets and liabilities as of September 30, 2019:
| | | | | | | | | | | | | | | | |
| | | | |
| | | Quoted prices
(Level 1) | | | Other significant
observable inputs
(Level 2) | | | Significant
unobservable inputs
(Level 3) | | | Total | |
| | | | |
Assets | | | | | | | | | | | | | | | | |
Investments in: | | | | | | | | | | | | | | | | |
| | | | |
Asset-backed securities | | $ | 0 | | | $ | 1,880,322 | | | $ | 0 | | | $ | 1,880,322 | |
| | | | |
Corporate bonds and notes | | | 0 | | | | 51,189,042 | | | | 0 | | | | 51,189,042 | |
| | | | |
Foreign corporate bonds and notes | | | 0 | | | | 24,439,633 | | | | 0 | | | | 24,439,633 | |
| | | | |
Foreign government bonds | | | 0 | | | | 1,380,421 | | | | 0 | | | | 1,380,421 | |
| | | | |
U.S. Treasury securities | | | 163,417 | | | | 0 | | | | 0 | | | | 163,417 | |
| | | | |
Yankee corporate bonds and notes | | | 0 | | | | 14,530,059 | | | | 0 | | | | 14,530,059 | |
| | | | |
Short-term investments | | | | | | | | | | | | | | | | |
| | | | |
Investment companies | | | 1,834,198 | | | | 0 | | | | 0 | | | | 1,834,198 | |
| | | | |
| | | 1,997,615 | | | | 93,419,477 | | | | 0 | | | | 95,417,092 | |
| | | | |
Forward foreign currency contracts | | | 0 | | | | 446,852 | | | | 0 | | | | 446,852 | |
| | | | |
Total assets | | $ | 1,997,615 | | | $ | 93,866,329 | | | $ | 0 | | | $ | 95,863,944 | |
| | | | |
Liabilities | | | | | | | | | | | | | | | | |
| | | | |
Forward foreign currency contracts | | $ | 0 | | | $ | 35,287 | | | $ | 0 | | | $ | 35,287 | |
| | | | |
Total liabilities | | $ | 0 | | | $ | 35,287 | | | $ | 0 | | | $ | 35,287 | |
Additional sector, industry or geographic detail is included in the Portfolio of Investments.
Forward foreign currency contracts are reported at their cumulative unrealized gains (losses) at measurement date as reported in the table following the Portfolio of Investments. All other assets and liabilities are reported at their market value at measurement date.
For the period from February 28, 2019 (commencement of operations) to September 30, 2019, the Fund did not have any transfers into/out of Level 3.
4. TRANSACTIONS WITH AFFILIATES
Management fee
Funds Management, an indirect wholly owned subsidiary of Wells Fargo & Company (“Wells Fargo”), is the manager of the Fund and provides advisory and fund-level administrative services under an investment management agreement. Under the investment management agreement, Funds Management is responsible for, among other services, implementing the investment objectives and strategies of the Fund, supervising the subadviser and providing fund-level administrative services in connection with the Fund’s operations. As compensation for its services under the investment management agreement, Funds Management is entitled to receive a management fee at the following annual rate based on the Fund’s average daily net assets:
| | | | |
| |
| Average daily net assets | | Management fee | |
| |
First $500 million | | | 0.400 | % |
| |
Next $500 million | | | 0.375 | |
| |
Next $2 billion | | | 0.350 | |
| |
Next $2 billion | | | 0.325 | |
| |
Next $5 billion | | | 0.290 | |
| |
Over $10 billion | | | 0.280 | |
For the period from February 28, 2019 (commencement of operations) to September 30, 2019, the management fee was equivalent to an annual rate of 0.40% of the Fund’s average daily net assets.
Wells Fargo Global Investment Grade Credit Fund | 25
Notes to financial statements
Funds Management has retained the services of subadvisers to provide daily portfolio management to the Fund. The fee for subadvisory services is borne by Funds Management. Wells Capital Management Incorporated and Wells Fargo Asset Management (International) Limited, each an affiliate of Funds Management and an indirect wholly owned subsidiary of Wells Fargo, serve as subadvisers to the Fund and are each entitled to receive a fee from Funds Management at an annual rate starting at 0.10% and declining to 0.05% as the average daily net assets of the Fund increase.
Administration fees
Under a class-level administration agreement, Funds Management provides class-level administrative services to the Fund, which includes paying fees and expenses for services provided by the transfer agent, sub-transfer agents, omnibus account servicers and record-keepers. As compensation for its services under the class-level administration agreement, Funds Management receives an annual fee which is calculated based on the average daily net assets of each class as follows:
| | | | |
| |
| | | Class-level
administration fee | |
| |
Class R6 | | | 0.03 | % |
| |
Institutional Class | | | 0.08 | |
Waivers and/or expense reimbursements
Funds Management has contractually waived and/or reimbursed management and administration fees to the extent necessary to maintain certain net operating expense ratios for the Fund. When each class of the Fund has exceeded its expense cap, Funds Management has waived fees and/or reimbursed expenses from fund-level expenses on a proportionate basis and then from class specific expenses. When only certain classes exceed their expense caps, waivers and/or reimbursements are applied against class specific expenses before fund-level expenses. Funds Management has committed through March 31, 2020 to waive fees and/or reimburse expenses to the extent necessary to cap the Fund’s expenses at 0.45% for Class R6 shares and 0.50% for Institutional Class shares. Prior to or after the commitment expiration date, the cap may be increased or the commitment to maintain the cap may be terminated only with the approval of the Board of Trustees.
Interfund transactions
The Fund may purchase or sell portfolio investment securities to certain other Wells Fargo affiliates pursuant to Rule 17a-7 under the 1940 Act and under procedures adopted by the Board of Trustees. The procedures have been designed to ensure that these interfund transactions, which do not incur broker commissions, are effected at current market prices.
5. INVESTMENT PORTFOLIO TRANSACTIONS
Purchases and sales of investments, excluding short-term securities, for the period from February 28, 2019 (commencement of operations) to September 30, 2019 were as follows:
| | | | | | |
Purchases at cost | | Sales proceeds |
U.S.
government | | Non-U.S.
government | | U.S.
government | | Non-U.S.
government |
| $4,641,469 | | $109,332,289 | | $4,531,423 | | $18,300,825 |
6. DERIVATIVE TRANSACTIONS
For the period from February 28, 2019 (commencement of operations) to September 30, 2019, the Fund entered into forward foreign currency contracts for hedging purposes. The Fund had average contract amounts of $63,747 and $13,020,218 in forward foreign currency contracts to buy and forward foreign currency contracts to sell, respectively, during the period from February 28, 2019 (commencement of operations) to September 30, 2019.
The fair value, realized gains or losses and change in unrealized gains or losses, if any, on derivative instruments are reflected in the corresponding financial statement captions.
For certain types of derivative transactions, the Fund has entered into International Swaps and Derivatives Association, Inc. master agreements (“ISDA Master Agreements”) or similar agreements with approved counterparties. The ISDA Master Agreements or similar agreements may have requirements to deliver/deposit securities or cash to/with an exchange or broker-dealer as collateral and allows the Fund to offset, with each counterparty, certain derivative financial instrument’s assets and/or liabilities with collateral held or pledged. Collateral requirements differ by type of derivative. Collateral or margin requirements are set by the broker or exchange clearinghouse for exchange traded derivatives while collateral terms are contract specific for
26 | Wells Fargo Global Investment Grade Credit Fund
Notes to financial statements
over-the-counter traded derivatives. Cash collateral that has been pledged to cover obligations of the Fund under ISDA Master Agreements or similar agreements, if any, are reported separately in the Statement of Assets and Liabilities. Securities pledged as collateral, if any, are noted in the Portfolio of Investments. With respect to balance sheet offsetting, absent an event of default by the counterparty or a termination of the agreement, the reported amounts of financial assets and financial liabilities in the Statement of Assets and Liabilities are not offset across transactions between the Fund and the applicable counterparty. A reconciliation of the gross amounts on the Statement of Assets and Liabilities to the net amounts by counterparty, including any collateral exposure, for OTC derivatives is as follows:
| | | | | | | | | | | | |
| | | | |
| Counterparty | | Gross amounts
of assets in the
Statement of
Assets and
Liabilities | | Amounts
subject to
netting
agreements | | Collateral
received | | | Net amount
of assets | |
| | | | |
State Street Bank | | $446,852 | | $(35,287) | | $ | 0 | | | $ | 411,565 | |
| | | | | | | | | | | | |
| | | | |
| Counterparty | | Gross amounts
of liabilities in the
Statement of
Assets and
Liabilities | | Amounts
subject to
netting
agreements | | Collateral
pledged | | | Net amount
of liabilities | |
| | | | |
State Street Bank | | $35,287 | | $(35,287) | | $ | 0 | | | $ | 0 | |
7. BANK BORROWINGS
The Trust (excluding the money market funds), Wells Fargo Master Trust and Wells Fargo Variable Trust are parties to a $280,000,000 revolving credit agreement whereby the Fund is permitted to use bank borrowings for temporary or emergency purposes, such as to fund shareholder redemption requests. Interest under the credit agreement is charged to the Fund based on a borrowing rate equal to the higher of the Federal Funds rate in effect on that day plus 1.25% or the overnight LIBOR rate in effect on that day plus 1.25%. In addition, an annual commitment fee equal to 0.25% of the unused balance is allocated to each participating fund.
For the period from February 28, 2019 (commencement of operations) to September 30, 2019, there were no borrowings by the Fund under the agreement.
8. DISTRIBUTIONS TO SHAREHOLDERS
The tax character of distributions paid was $728,002 of ordinary income for the period from February 28, 2019 (commencement of operations) to September 30, 2019.
As of September 30, 2019, the components of distributable earnings on a tax basis were as follows:
| | |
Undistributed
ordinary
income | | Unrealized
gains |
| |
| $1,186,048 | | $3,269,392 |
9. INDEMNIFICATION
Under the Trust’s organizational documents, the officers and Trustees have been granted certain indemnification rights against certain liabilities that may arise out of performance of their duties to the Trust. Additionally, in the normal course of business, the Trust may enter into contracts with service providers that contain a variety of indemnification clauses. The Trust’s maximum exposure under these arrangements is dependent on future claims that may be made against the Fund and, therefore, cannot be estimated.
10. NEW ACCOUNTING PRONOUNCEMENTS
In August 2018, FASB issued Accounting Standards Update (“ASU”) No. 2018-13, Fair Value Measurement (Topic 820)Disclosure Framework—Changes to the Disclosure Requirements for Fair Value Measurement. ASU 2018-13 updates the disclosure requirements for fair value measurements by modifying or removing certain disclosures and adding certain new disclosures. The amendments are effective for fiscal years, and interim periods within those fiscal years, beginning after December 15, 2019. Early adoption is permitted. Management has adopted the removal and modification of disclosures early, as permitted, and will adopt the additional new disclosures at the effective date.
Wells Fargo Global Investment Grade Credit Fund | 27
Notes to financial statements
In March 2017, FASB issued ASU No. 2017-08,Premium Amortization on Purchased Callable Debt Securities. ASU 2017-08 shortens the amortization period for certain callable debt securities held at a premium and requires the premium to be amortized to the earliest call date. The amendments do not require an accounting change for securities held at a discount and discounts will continue to be accreted to the maturity date of the security. ASU 2017-08 is effective for fiscal years beginning after December 15, 2018 and for interim periods within those fiscal years. During the current reporting period, management of the Fund adopted the change in accounting policy which did not have a material impact to the Fund’s financial statements.
28 | Wells Fargo Global Investment Grade Credit Fund
Report of independent registered public accounting firm
TO THE SHAREHOLDERS OF THE FUND AND BOARD OF TRUSTEES OF WELLS FARGO FUNDS TRUST:
Opinion on the Financial Statements
We have audited the accompanying statement of assets and liabilities of Wells Fargo Global Investment Grade Credit Fund (the Fund), one of the funds constituting Wells Fargo Funds Trust, including the portfolio of investments, as of September 30, 2019, the related statements of operations and changes in net assets for the period from February 28, 2019 (commencement of operations) to September 30, 2019, and the related notes (collectively, the financial statements) and the financial highlights for the period from the commencement of operations to September 30, 2019. In our opinion, the financial statements and financial highlights present fairly, in all material respects, the financial position of the Fund as of September 30, 2019, the results of its operations, the changes in its net assets, and the financial highlights for the period from the commencement of operations to September 30, 2019, in conformity with U.S. generally accepted accounting principles.
Basis for Opinion
These financial statements and financial highlights are the responsibility of the Fund’s management. Our responsibility is to express an opinion on these financial statements and financial highlights based on our audits. We are a public accounting firm registered with the Public Company Accounting Oversight Board (United States) (PCAOB) and are required to be independent with respect to the Fund in accordance with the U.S. federal securities laws and the applicable rules and regulations of the Securities and Exchange Commission and the PCAOB.
We conducted our audits in accordance with the standards of the PCAOB. Those standards require that we plan and perform the audit to obtain reasonable assurance about whether the financial statements and financial highlights are free of material misstatement, whether due to error or fraud. Our audits included performing procedures to assess the risks of material misstatement of the financial statements and financial highlights, whether due to error or fraud, and performing procedures that respond to those risks. Such procedures included examining, on a test basis, evidence regarding the amounts and disclosures in the financial statements and financial highlights. Such procedures also included confirmation of securities owned as of September 30, 2019, by correspondence with the custodian, transfer agent and brokers, or by other appropriate auditing procedures. Our audits also included evaluating the accounting principles used and significant estimates made by management, as well as evaluating the overall presentation of the financial statements and financial highlights. We believe that our audits provide a reasonable basis for our opinion.

We have not been able to determine the specific year that we began serving as the auditor of one or more Wells Fargo Funds investment companies; however we are aware that we have served as the auditor of one or more Wells Fargo Funds investment companies since at least 1955.
Boston, Massachusetts
November 25, 2019
Wells Fargo Global Investment Grade Credit Fund | 29
Other information (unaudited)
TAX INFORMATION
For the fiscal year ended September 30, 2019, $361,235 has been designated as interest-related dividends for nonresident alien shareholders pursuant to Section 871 of the Internal Revenue Code.
PROXY VOTING INFORMATION
A description of the policies and procedures used to determine how to vote proxies relating to portfolio securities is available, upon request, by calling1-800-222-8222, visiting our website atwfam.com, or visiting the SEC website at sec.gov. Information regarding how the proxies related to portfolio securities were voted during the most recent 12-month period ended June 30 is available on the website atwfam.comor by visiting the SEC website at sec.gov.
QUARTERLY PORTFOLIO HOLDINGS INFORMATION
The Fund files its complete schedule of portfolio holdings with the SEC for the first and third quarters of each fiscal year on Form N-Q or Form N-PORT, which is available by visiting the SEC website at sec.gov. Those forms may be reviewed and copied at the SEC’s Public Reference Room in Washington, DC. Information on the operation of the Public Reference Room may be obtained by calling 1-800-SEC-0330.
30 | Wells Fargo Global Investment Grade Credit Fund
Other information (unaudited)
BOARD OF TRUSTEES AND OFFICERS
Each of the Trustees and Officers1 listed in the table below acts in identical capacities for each fund in the Wells Fargo family of funds, which consists of 150 mutual funds comprising the Wells Fargo Funds Trust, Wells Fargo Variable Trust, Wells Fargo Master Trust and four closed-end funds (collectively the “Fund Complex”). This table should be read in conjunction with the Prospectus and the Statement of Additional Information2. The mailing address of each Trustee and Officer is 525 Market Street, 12th Floor, San Francisco, CA 94105. Each Trustee and Officer serves an indefinite term, however, each Trustee serves such term until reaching the mandatory retirement age established by the Trustees.
Independent Trustees
| | | | | | |
Name and year of birth | | Position held and
length of service* | | Principal occupations during past five years or longer | | Current other
public company or
investment
company
directorships |
| | | |
William R. Ebsworth (Born 1957) | | Trustee, since 2015 | | Retired. From 1984 to 2013, equities analyst, portfolio manager, research director and chief investment officer at Fidelity Management and Research Company in Boston, Tokyo, and Hong Kong, and retired in 2013 as Chief Investment Officer of Fidelity Strategic Advisers, Inc. where he led a team of investment professionals managing client assets. Prior thereto, Board member of Hong Kong Securities Clearing Co., Hong Kong Options Clearing Corp., the Thailand International Fund, Ltd., Fidelity Investments Life Insurance Company, and Empire Fidelity Investments Life Insurance Company. Audit Committee Chair and Investment Committee Chair of the Vincent Memorial Hospital Endowment (non-profit organization). Mr. Ebsworth is a CFA® charterholder. | | N/A |
| | | |
Jane A. Freeman (Born 1953) | | Trustee, since 2015; Chair Liaison, since 2018 | | Retired. From 2012 to 2014 and 1999 to 2008, Chief Financial Officer of Scientific Learning Corporation. From 2008 to 2012, Ms. Freeman provided consulting services related to strategic business projects. Prior to 1999, Portfolio Manager at Rockefeller & Co. and Scudder, Stevens & Clark. Board member of the Harding Loevner Funds from 1996 to 2014, serving as both Lead Independent Director and chair of the Audit Committee. Board member of the Russell Exchange Traded Funds Trust from 2011 to 2012 and the chair of the Audit Committee. Ms. Freeman is a Board Member of The Ruth Bancroft Garden (non-profit organization). She is also an inactive Chartered Financial Analyst. | | N/A |
| | | |
Isaiah Harris, Jr. (Born 1952) | | Trustee, since 2009; Audit Committee Chairman, since 2019 | | Retired. Chairman of the Board of CIGNA Corporation since 2009, and Director since 2005. From 2003 to 2011, Director of Deluxe Corporation. Prior thereto, President and CEO of BellSouth Advertising and Publishing Corp. from 2005 to 2007, President and CEO of BellSouth Enterprises from 2004 to 2005 and President of BellSouth Consumer Services from 2000 to 2003. Emeritus member of the Iowa State University Foundation Board of Governors. Emeritus Member of the Advisory Board of Iowa State University School of Business. Advisory Board Member, Palm Harbor Academy (private school). Advisory Board Member, Child Evangelism Fellowship (non-profit). Mr. Harris is a certified public accountant (inactive status). | | CIGNA Corporation |
| | | |
Judith M. Johnson (Born 1949) | | Trustee, since 2008; Audit Committee Chairman, from 2009 to 2018 | | Retired. Prior thereto, Chief Executive Officer and Chief Investment Officer of Minneapolis Employees Retirement Fund from 1996 to 2008. Ms. Johnson is an attorney, certified public accountant and a certified managerial accountant. | | N/A |
Wells Fargo Global Investment Grade Credit Fund | 31
Other information (unaudited)
| | | | | | |
Name and year of birth | | Position held and
length of service* | | Principal occupations during past five years or longer | | Current other
public company or
investment
company
directorships |
| | | |
David F. Larcker (Born 1950) | | Trustee, since 2009 | | James Irvin Miller Professor of Accounting at the Graduate School of Business, Stanford University, Director of the Corporate Governance Research Initiative and Senior Faculty of The Rock Center for Corporate Governance since 2006. From 2005 to 2008, Professor of Accounting at the Graduate School of Business, Stanford University. Prior thereto, Ernst & Young Professor of Accounting at The Wharton School, University of Pennsylvania from 1985 to 2005. | | N/A |
| | | |
Olivia S. Mitchell (Born 1953) | | Trustee, since 2006; Nominating and Governance Committee Chairman, since 2018 | | International Foundation of Employee Benefit Plans Professor, Wharton School of the University of Pennsylvania since 1993. Director of Wharton’s Pension Research Council and Boettner Center on Pensions & Retirement Research, and Research Associate at the National Bureau of Economic Research. Previously, Cornell University Professor from 1978 to 1993. | | N/A |
| | | |
Timothy J. Penny (Born 1951) | | Trustee, since 1996; Chairman, since 2018 | | President and Chief Executive Officer of Southern Minnesota Initiative Foundation, a non-profit organization, since 2007. Member of the Board of Trustees of NorthStar Education Finance, Inc., a non-profit organization, since 2007. | | N/A |
| | | |
James G. Polisson (Born 1959) | | Trustee, since 2018 | | Retired. Chief Marketing Officer, Source (ETF) UK Services, Ltd, from 2015 to 2017. From 2012 to 2015, Principal of The Polisson Group, LLC, a management consulting, corporate advisory and principal investing company. Chief Executive Officer and Managing Director at Russell Investments, Global Exchange Traded Funds from 2010 to 2012. Managing Director of Barclays Global Investors from 1998 to 2010 and Global Chief Marketing Officer for iShares and Barclays Global Investors from 2000 to 2010. Trustee of the San Francisco Mechanics’ Institute, a non-profit organization, from 2013 to 2015. Board member of the Russell Exchange Traded Fund Trust from 2011 to 2012. Director of Barclays Global Investors Holdings Deutschland GmbH from 2006 to 2009. Mr. Polisson is an attorney and has a retired status with the Massachusetts and District of Columbia Bar Associations. | | N/A |
| * | Length of service dates reflect the Trustee’s commencement of service with the Trust’s predecessor entities, where applicable. |
32 | Wells Fargo Global Investment Grade Credit Fund
Other information (unaudited)
Officers
| | | | |
Name and year of birth | | Position held and
length of service | | Principal occupations during past five years or longer |
| | |
Andrew Owen (Born 1960) | | President, since 2017 | | Executive Vice President of Wells Fargo & Company and Head of Affiliated Managers, Wells Fargo Asset Management, since 2014. In addition, Mr. Owen is currently President, Chief Executive Officer and Director of Wells Fargo Funds Management, LLC since 2017. Prior thereto, Executive Vice President responsible for marketing, investments and product development for Wells Fargo Funds Management, LLC, from 2009 to 2014. |
| | |
Jeremy DePalma1 (Born 1974) | | Treasurer, since 2012 | | Senior Vice President of Wells Fargo Funds Management, LLC since 2009. Senior Vice President of Evergreen Investment Management Company, LLC from 2008 to 2010 and head of the Fund Reporting and Control Team within Fund Administration from 2005 to 2010. |
| | |
Michelle Rhee3 (Born 1966) | | Chief Legal Officer, since 2019 | | Secretary of Wells Fargo Funds Management, LLC, Chief Legal Counsel of Wells Fargo Asset Management and Assistant General Counsel of Wells Fargo Bank, N.A. since 2018. Associate General Counsel and Managing Director of Bank of America Corporation from 2004 to 2018. |
| | |
Catherine Kennedy4 (Born 1969) | | Secretary, since 2019 | | Vice President of Wells Fargo Funds Management, LLC and Senior Counsel of the Wells Fargo Legal Department since 2010. Vice President and Senior Counsel of Evergreen Investment Management Company, LLC from 1998 to 2010. |
| | |
Michael H. Whitaker (Born 1967) | | Chief Compliance Officer, since 2016 | | Chief Compliance Officer of Wells Fargo Asset Management since 2016. Senior Vice President and Chief Compliance Officer for Fidelity Investments from 2007 to 2016. |
| | |
David Berardi (Born 1975) | | Assistant Treasurer, since 2009 | | Vice President of Wells Fargo Funds Management, LLC since 2009. Vice President of Evergreen Investment Management Company, LLC from 2008 to 2010. Manager of Fund Reporting and Control for Evergreen Investment Management Company, LLC from 2004 to 2010. |
| 1 | Jeremy DePalma acts as Treasurer of 86 funds and Assistant Treasurer of 64 funds in the Fund Complex. |
| 2 | The Statement of Additional Information includes additional information about the Trustees and is available, without charge, upon request, by calling1-800-222-8222 or by visiting the website atwfam.com. |
| 3 | Michelle Rhee became Chief Legal Officer effective October 22, 2019. |
| 4 | Catherine Kennedy became Secretary effective October 22, 2019. |
Wells Fargo Global Investment Grade Credit Fund | 33
Other information (unaudited)
BOARD CONSIDERATION OF INVESTMENT MANAGEMENT AND SUB-ADVISORY AGREEMENTS:
Wells Fargo Global Investment Grade Credit Fund
Under the Investment Company Act of 1940 (the “1940 Act”), the Board of Trustees (the “Board”) of Wells Fargo Funds Trust (the “Trust”) must determine annually whether to approve the continuation of the Trust’s investment management and sub-advisory agreements. In this regard, at an in-person meeting held on May 21-22, 2019 (the “Meeting”), the Board, all the members of which have no direct or indirect interest in the investment management and sub-advisory agreements and are not “interested persons” of the Trust, as defined in the 1940 Act (the “Independent Trustees”), reviewed and approved for Wells Fargo Global Investment Grade Credit Fund (the “Fund”): (i) an investment management agreement (the “Management Agreement”) with Wells Fargo Funds Management, LLC (“Funds Management”); (ii) an investment sub-advisory agreement with Wells Capital Management Incorporated (“WellsCap”), an affiliate of Funds Management; and (iii) an investment sub-advisory agreement with Wells Fargo Asset Management (International), LLC (“WFAM International”), an affiliate of Funds Management. The sub-advisory agreements with WellsCap and WFAM International (the “Sub-Advisers”) are collectively referred to as the Sub-Advisory Agreements, and the Management Agreement and Sub-Advisory Agreements are collectively referred to as the “Advisory Agreements.”
At the Meeting, the Board considered the factors and reached the conclusions described below relating to the selection of Funds Management and the Sub-Advisers and the approval of the Advisory Agreements. Prior to the Meeting, including at an in-person meeting in April 2019, the Trustees conferred extensively among themselves and with representatives of Funds Management about these matters. Also, the Board has adopted a team-based approach, with each team consisting of a sub-set of Trustees, to assist the full Board in the discharge of its duties in reviewing investment performance and other matters throughout the year. The Independent Trustees were assisted in their evaluation of the Advisory Agreements by independent legal counsel, from whom they received separate legal advice and with whom they met separately.
In providing information to the Board, Funds Management and the Sub-Advisers were guided by a detailed set of requests for information submitted to them by independent legal counsel on behalf of the Independent Trustees at the start of the Board’s annual contract renewal process earlier in 2019. In considering and approving the Advisory Agreements, the Trustees considered the information they believed relevant, including but not limited to the information discussed below. The Board considered not only the specific information presented in connection with the Meeting, but also the knowledge gained over time through interaction with Funds Management and the Sub-Advisers about various topics. In this regard, the Board reviewed reports of Funds Management at each of its quarterly meetings, which included, among other things, portfolio reviews and investment performance reports. In addition, the Board and the teams mentioned above confer with portfolio managers at various times throughout the year. The Board did not identify any particular information or consideration that was all-important or controlling, and each individual Trustee may have attributed different weights to various factors.
After its deliberations, the Board unanimously approved the continuation of the Advisory Agreements for a one-year term and determined that the compensation payable to Funds Management and the Sub-Advisers under each of the Advisory Agreements was reasonable. The Board considered the approval of the Advisory Agreements for the Fund as part of its consideration of agreements for funds across the complex, but its approvals were made on a fund-by-fund basis. The following summarizes a number of important, but not necessarily all, factors considered by the Board in support of its approvals.
Nature, extent and quality of services
The Board received and considered various information regarding the nature, extent and quality of services provided to the Fund by Funds Management and the Sub-Advisers under the Advisory Agreements. This information included a description of the investment advisory services and Fund-level administrative services covered by the Management Agreement, as well as, among other things, a summary of the background and experience of senior management of Wells Fargo Asset Management (“WFAM”), of which Funds Management and the Sub-Advisers are a part, a summary of investments made in the business of WFAM, a summary of certain organizational and personnel changes involving Funds Management and the Sub-Advisers, and a description of Funds Management’s and the Sub-Advisers’ business continuity planning programs and of their approaches to data privacy and cybersecurity. The Board received and reviewed information about Funds Management’s role as administrator of the Fund’s liquidity risk management program. The Board also considered the qualifications, background, tenure and responsibilities of each of the portfolio managers primarily responsible for the day-to-day portfolio management of the Fund.
The Board evaluated the ability of Funds Management and the Sub-Advisers to attract and retain qualified investment professionals, including research, advisory and supervisory personnel. The Board further considered the compliance programs and compliance records of Funds Management and the Sub-Advisers. In addition, the Board took into account the full range of services provided to the Fund by Funds Management and its affiliates.
34 | Wells Fargo Global Investment Grade Credit Fund
Other information (unaudited)
Fund investment performance and expenses
The Board noted that the Fund had recently commenced operations and had no performance history to review. The Board noted that it would have the opportunity to review the Fund’s performance history in connection with the Board’s future review and approval of the Fund’s Advisory Agreements.
The Board, however, received and considered information from Broadridge Inc. (“Broadridge”) regarding the Fund’s net operating expense ratios and their various components, including actual management fees, custodian and other non-management fees, and Rule 12b-1 and non-Rule 12b-1 shareholder service fees. The Board considered these ratios in comparison to the median ratios of funds in class-specific expense groups that were determined by Broadridge to be similar to the Fund (the “Groups”). The Board received a description of the methodology used by Broadridge to select the mutual funds in the expense Groups and an explanation of how funds comprising expense groups and their expense ratios may vary from year-to-year. Based on the Broadridge reports, the Board noted that the net operating expense ratios of the Fund were lower than the median net operating expense ratios of the expense Groups for each share class.
The Board took into account the Fund’s expense information provided to it among the factors considered in deciding to re-approve the Advisory Agreements.
Investment management and sub-advisory fee rates
The Board reviewed and considered the contractual fee rates payable by the Fund to Funds Management under the Management Agreement, as well as the contractual fee rates payable by the Fund to Funds Management for class-level administrative services under a Class-Level Administration Agreement, which include, among other things, class-level transfer agency and sub-transfer agency costs (collectively, the “Management Rates”). The Board also reviewed and considered the contractual investment sub-advisory fee rates that are payable by Funds Management to the Sub-Advisers for investment sub-advisory services.
Among other information reviewed by the Board was a comparison of the Fund’s Management Rates with the average contractual investment management fee rates of funds in the expense Groups at a common asset level as well as transfer agency costs of the funds in the expense Groups. The Board noted that the Management Rates of the Fund were lower than the sum of these average rates for the Fund’s expense Groups for all share classes.
The Board also received and considered information about the portion of the total management fee that was retained by Funds Management after the payment of fees to each of the Sub-Advisers for sub-advisory services. In assessing the reasonableness of this amount, the Board received and evaluated information about the nature and extent of responsibilities retained and risks assumed by Funds Management and not delegated to or assumed by the Sub-Advisers, and about Funds Management’s on-going oversight services. Given the affiliation between Funds Management and the Sub-Advisers, the Board ascribed limited relevance to the allocation of fees between them.
The Board also received and considered information about the nature and extent of services offered and fee rates charged by Funds Management and the Sub-Advisers to other types of clients with investment strategies similar to those of the Fund. In this regard, the Board received information about the significantly greater scope of services, and compliance, reporting and other legal burdens and risks of managing proprietary mutual funds compared with those associated with managing assets of other types of clients, including third-party sub-advised fund clients and non-mutual fund clients such as institutional separate accounts.
Based on its consideration of the factors and information it deemed relevant, including those described here, the Board determined that the compensation payable to Funds Management under the Management Agreement and to the Sub-Advisers under the Sub-Advisory Agreements was reasonable.
Profitability
The Board received and considered information concerning the profitability of Funds Management, as well as the profitability of both WFAM and Wells Fargo & Co. (“Wells Fargo”) from providing services to the fund family as a whole. The Board noted that the Sub-Advisers’ profitability information with respect to providing services to the Fund and other funds in the family was subsumed in the WFAM and Wells Fargo profitability analysis.
Funds Management reported on the methodologies and estimates used in calculating profitability, including a description of the methodology used to allocate certain expenses. Among other things, the Board noted that the levels of profitability reported on a fund-by-fund basis varied widely, depending on factors such as the size, type and age of fund. Based on its review, the Board did not deem the profits reported by Funds Management, WFAM or Wells Fargo from services provided to the Fund to be at a level that would prevent it from approving the continuation of the Advisory Agreements.
Wells Fargo Global Investment Grade Credit Fund | 35
Other information (unaudited)
Economies of scale
The Board received and considered information about the potential for Funds Management to experience economies of scale in the provision of management services to the Fund, the difficulties of calculating economies of scale at an individual fund level, and the extent to which potential scale benefits are shared with shareholders. The Board noted the existence of breakpoints in the Fund’s management fee structure, which operate generally to reduce the Fund’s expense ratios as the Fund grows in size. The Board considered that in addition to management fee breakpoints, Funds Management shares potential economies of scale from its management business in a variety of ways, including through fee waiver and expense reimbursement arrangements, services that benefit shareholders, competitive management fee rates set at the outset without regard to breakpoints, and investments in the business intended to enhance services available to shareholders.
The Board concluded that Funds Management’s arrangements with respect to the Fund, including contractual breakpoints, constituted a reasonable approach to sharing potential economies of scale with the Fund and its shareholders.
Other benefits to Funds Management and the Sub-Advisers
The Board received and considered information regarding potential “fall-out” or ancillary benefits received by Funds Management and its affiliates, including the Sub-Advisers, as a result of their relationships with the Fund. Ancillary benefits could include, among others, benefits directly attributable to other relationships with the Fund and benefits potentially derived from an increase in Funds Management’s and the Sub-Advisers’ businesses as a result of their relationships with the Fund. The Board noted that various affiliates of Funds Management may receive distribution-related fees, shareholder servicing payments and sub-transfer agency fees in respect of shares sold or held through them and services provided.
The Board also reviewed information about soft dollar credits earned and utilized by the Sub-Advisers, fees earned by Funds Management and WellsCap from managing a private investment vehicle for the fund family’s securities lending collateral, and commissions earned by an affiliated broker from portfolio transactions.
Based on its consideration of the factors and information it deemed relevant, including those described here, the Board did not find that any ancillary benefits received by Funds Management and its affiliates, including the Sub-Advisers, were unreasonable.
Conclusion
At the Meeting, after considering the above-described factors and based on its deliberations and its evaluation of the information described above, the Board unanimously approved the continuation of the Advisory Agreements for a one-year term and determined that the compensation payable to Funds Management and the Sub-Advisers under each of the Advisory Agreements was reasonable.
36 | Wells Fargo Global Investment Grade Credit Fund

For more information
More information about Wells Fargo Funds is available free upon request. To obtain literature, please write, visit the Fund’s website, or call:
Wells Fargo Funds
P.O. Box 219967
Kansas City, MO 64121-9967
Website:wfam.com
Individual investors:1-800-222-8222
Retail investment professionals:1-888-877-9275
Institutional investment professionals:1-866-765-0778

This report and the financial statements contained herein are submitted for the general information of the shareholders of the Fund. If this report is used for promotional purposes, distribution of the report must be accompanied or preceded by a current prospectus. Before investing, please consider the investment objectives, risks, charges, and expenses of the investment. For a current prospectus and, if available, a summary prospectus, containing this information, call1-800-222-8222 or visit the Fund’s website atwfam.com. Read the prospectus carefully before you invest or send money.
Wells Fargo Asset Management (WFAM) is the trade name for certain investment advisory/management firms owned by Wells Fargo & Company. These firms include but are not limited to Wells Capital Management Incorporated and Wells Fargo Funds Management, LLC. Certain products managed by WFAM entities are distributed by Wells Fargo Funds Distributor, LLC (a broker-dealer and Member FINRA).
This material is for general informational and educational purposes only and is NOT intended to provide investment advice or a recommendation of any kind—including a recommendation for any specific investment, strategy, or plan.
INVESTMENT PRODUCTS: NOT FDIC INSURED ◾ NO BANK GUARANTEE ◾ MAY LOSE VALUE
© 2019 Wells Fargo & Company. All rights reserved.
406811 11-19
A294/AR294 09-19
ITEM 2. CODE OF ETHICS
(a) As of the end of the period covered by the report, Wells Fargo Funds Trust has adopted a code of ethics that applies to its President and Treasurer. A copy of the code of ethics is filed as an exhibit to this FormN-CSR.
(c) During the period covered by this report, there were no amendments to the provisions of the code of ethics adopted in Item 2(a) above.
(d) During the period covered by this report, there were no implicit or explicit waivers to the provisions of the code of ethics adopted in Item 2(a) above.
ITEM 3. AUDIT COMMITTEE FINANCIAL EXPERT
The Board of Trustees of Wells Fargo Funds Trust has determined that Judith Johnson is an audit committee financial expert, as defined in Item 3 of FormN-CSR. Mrs. Johnson is independent for purposes of Item 3 of FormN-CSR.
ITEM 4. PRINCIPAL ACCOUNTANT FEES AND SERVICES
(a), (b), (c), (d) The following table presents aggregate fees billed in each of the last two fiscal years for services rendered to the Registrant by the Registrant’s principal accountant. These fees were billed to the registrant and were approved by the Registrant’s audit committee.
| | | | | | | | |
| | | Fiscal
year ended
September 30,
2019 | | | Fiscal
year ended
September 30,
2018 | |
Audit fees | | $ | 377,410 | | | $ | 372,201 | |
| | |
Audit-related fees | | | — | | | | — | |
| | |
Tax fees (1) | | | 48,800 | | | | 48,060 | |
All other fees | | | — | | | | — | |
| | | | | | | | |
| | $ | 426,210 | | | $ | 420,261 | |
| | | | | | | | |
| (1) | Tax fees consist of fees for tax compliance, tax advice, tax planning and excise tax. |
(e) The Chairman of the Audit Committees is authorized topre-approve: (1) audit services for the mutual funds of Wells Fargo Funds Trust;(2) non-audit tax or compliance consulting or training services provided to the Funds by the independent auditors (“Auditors”) if the fees for any particular engagement are not anticipated to exceed $50,000; and(3) non-audit tax or compliance consulting or training services provided by the Auditors to a Fund’s investment adviser and its controlling entities (wherepre-approval is required because the engagement relates directly to the operations and financial reporting of the Fund) if the fee to the Auditors for any particular engagement is not anticipated to exceed $50,000. For any suchpre-approval sought from the Chairman, Management shall prepare a brief description of the proposed services.
If the Chairman approves of such service, he or she shall sign the statement prepared by Management.
Such written statement shall be presented to the full Committees at their next regularly scheduled meetings.
(f) Not applicable
(g) Not applicable
(h) Not applicable
ITEM 5. AUDIT COMMITTEE OF LISTED REGISTRANTS
Not applicable.
ITEM 6. INVESTMENTS
A Portfolio of Investments for each series of Wells Fargo Funds Trust is included as part of the report to shareholders filed under Item 1 of this Form.
ITEM 7. DISCLOSURE OF PROXY VOTING POLICIES AND PROCEDURES FORCLOSED-END MANAGEMENT INVESTMENT COMPANIES
Not applicable.
ITEM 8. PORTFOLIO MANAGERS OFCLOSED-END MANAGEMENT INVESTMENT COMPANIES
Not applicable.
ITEM 9. PURCHASES OF EQUITY SECURITIES BYCLOSED-END MANAGEMENT INVESTMENT COMPANY AND AFFILIATED PURCHASERS
Not applicable.
ITEM 10. SUBMISSION OF MATTERS TO A VOTE OF SECURITY HOLDERS
There have been no material changes to the procedures by which shareholders may recommend nominees to the registrant’s Board of Trustees that have been implemented since the registrant’s last provided disclosure in response to the requirements of this Item.
ITEM 11. CONTROLS AND PROCEDURES
(a) The President and Treasurer have concluded that the Wells Fargo Funds Trust disclosure controls and procedures (as defined in Rule30a-3(c) under the Investment Company Act of 1940) provide reasonable assurances that material information relating to the registrant is made known to them by the appropriate persons based on their evaluation of these controls and procedures as of a date within 90 days of the filing of this report.
(b) There were no significant changes in the registrant’s internal controls over financial reporting (as defined in Rule30a-3(d) under the Investment Company Act of 1940) that occurred during the most recent fiscal half-year of the period covered by this report that materially affected, or is reasonably likely to materially affect, the registrant’s internal control over financial reporting.
ITEM 12. DISCLOSURES OF SECURITIES LENDING ACTIVITIES FORCLOSED-END MANAGEMENT INVESTMENT COMPANIES
Not applicable.
ITEM 13. EXHIBITS
(a)(1) Code of Ethics pursuant to Item 2 of FormN-CSR is filed and attached hereto as Exhibit COE.
(a)(2) Certification pursuant to Rule30a-2(a) under the Investment Company Act of 1940 (17 CFR270.30a-2(a)) is filed and attached hereto as Exhibit 99.CERT.
(b) Certification pursuant to Rule30a-2(b) under the Investment Company Act of 1940 (17 CFR270.30a-2(b)) is filed and attached hereto as Exhibit 99.906CERT.
SIGNATURES
Pursuant to the requirements of the Securities Exchange Act of 1934 and the Investment Company Act of 1940, the registrant has duly caused this report to be signed on its behalf by the undersigned, thereunto duly authorized.
| | |
| Wells Fargo Funds Trust |
| |
| By: | | |
| |
| | /s/ Andrew Owen |
| |
| | Andrew Owen |
| | President |
| |
| Date: | | November 25, 2019 |
Pursuant to the requirements of the Securities Exchange Act of 1934 and the Investment Company Act of 1940, this report has been signed below by the following persons on behalf of the registrant and in the capacities and on the date indicated.
| | |
| Wells Fargo Funds Trust |
| |
| By: | | |
| |
| | /s/ Andrew Owen |
| |
| | Andrew Owen |
| | President |
| |
| Date: | | November 25, 2019 |
| | |
| By: | | |
| |
| | /s/ Nancy Wiser |
| |
| | Nancy Wiser |
| | Treasurer |
| |
| Date: | | November 25, 2019 |
| |
| By: | | |
| |
| | /s/ Jeremy DePalma |
| |
| | Jeremy DePalma |
| | Treasurer |
| |
| Date: | | November 25, 2019 |