
UNITED STATES
SECURITIES AND EXCHANGE COMMISSION
Washington, D.C. 20549
FORMN-CSR
CERTIFIED SHAREHOLDER REPORT OF REGISTERED
MANAGEMENT INVESTMENT COMPANIES
Investment Company Act file number:811-09253
Wells Fargo Funds Trust
(Exact name of registrant as specified in charter)
525 Market St., San Francisco, CA 94105
(Address of principal executive offices) (Zip code)
Catherine Kennedy
Wells Fargo Funds Management, LLC
525 Market St., San Francisco, CA 94105
(Name and address of agent for service)
Registrant’s telephone number, including area code:800-222-8222
Date of fiscal year end: August 31
Registrant is making a filing for 9 of its series:
Wells Fargo Adjustable Rate Government Fund, Wells Fargo Conservative Income Fund, Wells Fargo Government Securities Fund, Wells Fargo High Yield Bond Fund, Wells Fargo Core Plus Bond Fund, Wells Fargo Short Duration Government Bond Fund, Wells Fargo Short-Term Bond Fund, Wells Fargo Short-Term High Yield Bond Fund, and Wells Fargo Ultra Short-Term Income Fund.
Date of reporting period: August 31, 2019
ITEM 1. REPORT TO STOCKHOLDERS
Annual Report
August 31, 2019
Wells Fargo Core Plus Bond Fund
Beginning on January 1, 2021, as permitted by new regulations adopted by the Securities and Exchange Commission, paper copies of the Wells Fargo Funds’ annual and semi-annual shareholder reports issued after this date will no longer be sent by mail, unless you specifically request paper copies of the reports. Instead, the reports will be made available on the Funds’ website, and you will be notified by mail each time a report is posted and provided with a website address to access the report.
If you already elected to receive shareholder reports electronically, you will not be affected by this change and you need not take any action. You may elect to receive shareholder reports and other communications from the Fund electronically at any time by contacting your financial intermediary (such as a broker-dealer or bank) or, if you are a direct investor, by calling1-800-222-8222 or by enrolling at wellsfargo.com/advantagedelivery.
You may elect to receive all future reports in paper free of charge. If you invest through a financial intermediary, you can contact your financial intermediary to request that you continue to receive paper copies of your shareholder reports; if you invest directly with the Fund, you can call 1-800-222-8222. Your election to receive reports in paper will apply to all Wells Fargo Funds held in your account with your financial intermediary or, if you are a direct investor, to all Wells Fargo Funds that you hold.
|
|
|
Reduce clutter. Save trees. |
Sign up for electronic delivery of prospectuses and shareholder reports at wellsfargo.com/ advantagedelivery |
The views expressed and any forward-looking statements are as of August 31, 2019, unless otherwise noted, and are those of the Fund managers and/or Wells Fargo Asset Management. Discussions of individual securities, or the markets generally, or any Wells Fargo Fund are not intended as individual recommendations. Future events or results may vary significantly from those expressed in any forward-looking statements. The views expressed are subject to change at any time in response to changing circumstances in the market. Wells Fargo Asset Management and the Fund disclaim any obligation to publicly update or revise any views expressed or forward-looking statements.
INVESTMENT PRODUCTS: NOT FDIC INSURED ◾ NO BANK GUARANTEE ◾ MAY LOSE VALUE
Wells Fargo Core Plus Bond Fund | 1
Letter to shareholders (unaudited)

Andrew Owen
President
Wells Fargo Funds
Dear Shareholder:
We are pleased to offer you this annual report for the Wells Fargo Core Plus Bond Fund for the12-month period that ended August 31, 2019. After the first half of the period yielded eitherlow-single-digit or negative investment returns, U.S. stock and global bond investors generally saw markets recover during the second half amid intensifying market volatility, global economic growth concerns, international trade staredowns, and simmering geopolitical tensions.
Overall, fixed-income investors enjoyed a distinct advantage over stock investors. For the period, U.S. stocks, based on the S&P 500 Index,1 gained 2.92% and international stocks, as measured by the MSCI ACWI ex USA Index (Net),2 fell 3.27%. The MSCI EM Index (Net)3 slipped 4.36%. Among fixed income investors, the Bloomberg Barclays U.S. Aggregate Bond Index4 added 10.17%, the Bloomberg Barclays Global Aggregateex-USD Index5 added 5.71%, the Bloomberg Barclays Municipal Bond Index6 gained 8.72%, and the ICE BofAML U.S. High Yield Index7 added 6.58%.
Entering the fourth quarter of 2018, economic data was encouraging.
Entering the fourth quarter of 2018, there were reasons for investors to be optimistic. The U.S. Bureau of Economic Analysis reported U.S. gross domestic product (GDP) grew 4.2% on an annualized basis during the second quarter. Hiring improved. Unemployment declined. Consumer spending gained. Third-quarter corporate earnings reports were generally positive. U.S. trade negotiations with Mexico and Canada advanced. In September 2018, the U.S. Federal Reserve (Fed) raised the federal funds rate by 25 basis points (bps; 100 bps equal 1.00%) to a target range of between 2.00% and 2.25% in an indication of its confidence that U.S. economic growth was sustainable.
International markets presented numerous challenges. U.S.-China trade tensions increased. The U.S. imposed $200 billion in tariffs on Chinese goods. China reacted with $60 billion in tariffs on U.S. goods. Economic growth in China caused concern. In September 2018, international investors began to factor in a number of disconcerting economic and business data points: lower July manufacturing and industrial orders in Germany; declining purchasing managers’ index numbers for August from the United Kingdom, China, and India; and declining household spending for August in Japan. Taken together, the data fed growing concerns that global economic growth was slowing.
| 1 | The S&P 500 Index consists of 500 stocks chosen for market size, liquidity, and industry group representation. It is a market-value-weighted index with each stock’s weight in the index proportionate to its market value. You cannot invest directly in an index. |
| 2 | The Morgan Stanley Capital International (MSCI) All Country World Index (ACWI) ex USA Index (Net) is a free-float-adjusted market-capitalization weighted index that is designed to measure the equity market performance of developed and emerging markets, excluding the U.S. Source: MSCI. MSCI makes no express or implied warranties or representations and shall have no liability whatsoever with respect to any MSCI data contained herein. The MSCI data may not be further redistributed or used as a basis for other indices or any securities or financial products. This report is not approved, reviewed, or produced by MSCI. You cannot invest directly in an index. |
| 3 | The MSCI Emerging Markets (EM) Index (Net) is a free-float-adjusted market-capitalization-weighted index that is designed to measure the equity market performance of emerging markets. You cannot invest directly in an index. |
| 4 | The Bloomberg Barclays U.S. Aggregate Bond Index is a broad-based benchmark that measures the investment-grade, U.S. dollar-denominated, fixed-rate taxable bond market, including Treasuries, government-related and corporate securities, mortgage-backed securities (agency fixed-rate and hybrid adjustable-rate mortgage pass-throughs), asset-backed securities, and commercial mortgage-backed securities. You cannot invest directly in an index. |
| 5 | The Bloomberg Barclays Global Aggregateex-USD Index is an unmanaged index that provides a broad-based measure of the global investment-grade fixed-income markets excluding the U.S. dollar-denominated debt market. You cannot invest directly in an index. |
| 6 | The Bloomberg Barclays Municipal Bond Index is an unmanaged index composed of long-termtax-exempt bonds with a minimum credit rating of Baa. You cannot invest directly in an index. |
| 7 | The ICE BofAML U.S. High Yield Index is a market-capitalization-weighted index of domestic and Yankee high-yield bonds. The index tracks the performance of high-yield securities traded in the U.S. bond market. You cannot invest directly in an index. Copyright 2019. ICE Data Indices, LLC. All rights reserved. |
2 | Wells Fargo Core Plus Bond Fund
Letter to shareholders (unaudited)
Investors had to digest unsettling events during the fourth quarter of 2018.
November’s U.S. midterm elections shifted control of the House of Representatives from Republicans to Democrats, presaging partisan clashes that followed and caused uncertainty among investors. A partial U.S. government shutdown driven by partisan policy disputes extended into January 2019. Third-quarter U.S. GDP was announced at an annualized 3.4% rate, lower than the second-quarter rate. Brexit efforts stalled. The value of the renminbi declined even as the People’s Bank of China cut reserve requirement ratios, accelerated infrastructure spending, and cut taxes in efforts to spur economic activity.
The combination of news in the U.S. and generally weak economic indicators outside of the U.S. caused investors to seek safe havens. December’s S&P 500 Index performance was the worst since 1931. Globally, fixed-income investments fared better than stocks during the last two months of the year. The Fed increased the federal funds rate by 25 bps in December 2018 to a target range of between 2.25% and 2.50% even as observers expressed concerns that higher rates could slow the economy.
The market climbs a wall of worry.
Investment returns appeared to reaffirm the adage that markets climb a wall of worry as 2019 opened. Following its December decline, the S&P 500 Index gained 8.01% for the month of January, the best monthly performance in 30 years. Returns for the MSCI ACWI ex USA Index (Net), the Bloomberg Barclays U.S. Aggregate Bond Index, and the Bloomberg Barclays Global Aggregateex-USD Index also were positive.
In February 2019, signs of slowing global growth grew more ominous. The Bureau of Economic Analysis announced fourth-quarter 2018 GDP grew at an annualized 2.2% rate, down from the levels of the prior two quarters. In a February report, the Bank of England forecast the slowest growth for 2019 since the financial crisis. China and the U.S. continued to wrangle over trade issues. By the end of the first quarter of 2019, more accommodative Fed sentiment and steady, if not spectacular, U.S. economic and business metrics encouraged domestic investors.
Early second-quarter 2019 enthusiasm among investors faded.
During April 2019, favorable sentiment found additional support in reports of sustained low inflation, solid employment data, and first-quarter U.S. GDP of an annualized rate of 3.2%. During May, markets tumbled on mixed investment signals. In the U.S., partisan wrangling ramped up as Democrats and Republicans set their sights on 2020 presidential politics. The U.K.’s Brexit contretemps caused Prime Minister Theresa May to resign. Boris Johnson succeeded her only to exacerbate uncertainty about Brexit’s resolution ahead of an October 2019 deadline. The European Commission downgraded the 2019 growth forecast to 1.2%. The U.S. increased tariffs on products from China, China responded, and then talks broke down. President Donald Trump threatened to turn his foreign policy tariff tool to Mexico over immigration issues.
During the third quarter of 2019, investors regrouped. Just as the investment horizon appeared to darken, sentiment turned and U.S. equity markets gained during June and July. The gains, primarily driven by geopolitical and monetary policy events, pushed equity markets to new highs. European Central Bank President Mario Draghi said that if the outlook doesn’t improve, the bank would cut rates or buy more assets to prop up inflation. President Trump backed off of tariff threats against Mexico and China. In the U.S., the Fed implemented a 0.25% federal funds rate cut in July.
Later in July, the U.S. reversed course and threatened to impose higher tariffs on China’s exports after talks failed. China responded with tariff threats of its own and
“December’s S&P 500 Index performance was the worst since 1931.”
“Following its December decline, the S&P 500 Index gained 8.01% for the month of January, the best monthly performance in 30 years.”
Wells Fargo Core Plus Bond Fund | 3
Letter to shareholders (unaudited)
|
|
|
For further information about your Fund, contact your investment professional, visit our website at wfam.com, or call us directly at1-800-222-8222. |
devalued the renminbi, a move that roiled global markets. Major U.S. stock market indices closed July 2019 with the worst weekly results of the year. Bond prices gained as Treasury yields fell to levels not seen since November 2016 and the yield curve inverted at multiple points along the30-year arc.
In a microcosm, August 2019 encapsulated many of the unnerving events that plagued investors during the prior 11 months. The U.S.-China trade relationship swung from discouraging to hopeful and back again with no evident compromise on the horizon. Evidence of a continued global economic slowdown continued to mount as central banks in China, New Zealand, and Thailand cut interest rates. Industrial and manufacturing data declined in China, Canada, Japan, and Germany. Adding to the uncertain environment, Italy’s prime minister resigned, many feared a crackdown in Hong Kong as protesters sustained their calls for reform throughout the month, and Boris Johnson planned to suspend Parliament as Brexit’s deadline neared.
Don’t let short-term uncertainty derail long-term investment goals.
Periods of investment uncertainty can present challenges, but experience has taught us that maintaining long-term investment goals can be an effective way to plan for the future. To help you create a sound strategy based on your personal goals and risk tolerance, Wells Fargo Funds offers more than 100 mutual funds spanning a wide range of asset classes and investment styles. Although diversification cannot guarantee an investment profit or prevent losses, we believe it can be an effective way to manage investment risk and potentially smooth out overall portfolio performance. We encourage investors to know their investments and to understand that appropriate levels of risk-taking may unlock opportunities.
Thank you for choosing to invest with Wells Fargo Funds. We appreciate your confidence in us and remain committed to helping you meet your financial needs.
Sincerely,

Andrew Owen
President
Wells Fargo Funds
4 | Wells Fargo Core Plus Bond Fund
This page is intentionally left blank.
Performance highlights (unaudited)
Investment objective
The Fund seeks total return, consisting of current income and capital appreciation.
Manager
Wells Fargo Funds Management, LLC
Subadviser
Wells Capital Management Incorporated
Portfolio managers
Christopher Y. Kauffman, CFA®‡
Jay N. Mueller, CFA®‡
Thomas M. Price, CFA®‡
Janet S. Rilling, CFA®‡, CPA
Michael J. Schueller, CFA®‡
Noah M. Wise, CFA®‡
Average annual total returns (%) as of August 31, 2019
| | | | | | | | | | | | | | | | | | | | | | | | | | | | | | | | | | |
| | | | |
| | | | | Including sales charge | | | Excluding sales charge | | | Expense ratios1 (%) | |
| | | | | | | | | |
| | | Inception date | | 1 year | | | 5 year | | | 10 year | | | 1 year | | | 5 year | | | 10 year | | | Gross | | | Net2 | |
| | | | | | | | | | |
| Class A (STYAX) | | 7-13-1998 | | | 4.79 | | | | 3.06 | | | | 4.33 | | | | 9.74 | | | | 4.02 | | | | 4.81 | | | | 0.93 | | | | 0.74 | |
| | | | | | | | | | |
| Class C (WFIPX) | | 7-13-1998 | | | 7.91 | | | | 3.26 | | | | 4.03 | | | | 8.91 | | | | 3.26 | | | | 4.03 | | | | 1.68 | | | | 1.49 | |
| | | | | | | | | | |
| Class R6 (STYJX)3 | | 10-31-2016 | | | – | | | | – | | | | – | | | | 10.14 | | | | 4.38 | | | | 5.15 | | | | 0.55 | | | | 0.36 | |
| | | | | | | | | | |
| Administrator Class (WIPDX)4 | | 7-30-2010 | | | – | | | | – | | | | – | | | | 9.88 | | | | 4.14 | | | | 4.94 | | | | 0.87 | | | | 0.63 | |
| | | | | | | | | | |
| Institutional Class (WIPIX) | | 7-18-2008 | | | – | | | | – | | | | – | | | | 10.17 | | | | 4.36 | | | | 5.14 | | | | 0.60 | | | | 0.41 | |
| | | | | | | | | | |
| Bloomberg Barclays U.S. Aggregate Bond Index5 | | – | | | – | | | | – | | | | – | | | | 10.17 | | | | 3.35 | | | | 3.91 | | | | – | | | | – | |
Figures quoted represent past performance, which is no guarantee of future results, and do not reflect taxes that a shareholder may pay on fund distributions or the redemption of fund shares. Investment return and principal value of an investment will fluctuate so that an investor’s shares, when redeemed, may be worth more or less than their original cost. Performance shown without sales charges would be lower if sales charges were reflected. Current performance may be lower or higher than the performance data quoted, which assumes the reinvestment of dividends and capital gains. Currentmonth-end performance is available on the Fund’s website,wfam.com.
Index returns do not include transaction costs associated with buying and selling securities, any mutual fund fees or expenses, or any taxes. It is not possible to invest directly in an index.
For Class A shares, the maximumfront-end sales charge is 4.50%. For Class C shares, the maximum contingent deferred sales charge is 1.00%. Performance including a contingent deferred sales charge assumes the sales charge for the corresponding time period. Class R6, Administrator Class, and Institutional Class shares are sold without afront-end sales charge or contingent deferred sales charge.
Bond values fluctuate in response to the financial condition of individual issuers, general market and economic conditions, and changes in interest rates. Changes in market conditions and government policies may lead to periods of heightened volatility in the bond market and reduced liquidity for certain bonds held by the Fund. In general, when interest rates rise, bond values fall and investors may lose principal value. Interest-rate changes and their impact on the Fund and its share price can be sudden and unpredictable. Loans are subject to risks similar to those associated with other below-investment-grade bond investments, such as risk of greater volatility in value, credit risk (for example, risk of issuer default), and risk that the loan may become illiquid or difficult to price. The use of derivatives may reduce returns and/or increase volatility. Certain investment strategies tend to increase the total risk of an investment (relative to the broader market). The Fund is exposed to foreign investment risk, high-yield securities risk, and mortgage and asset-backed securities risk. High-yield securities have a greater risk of default and tend to be more volatile than higher rated debt securities. Consult the Fund’s prospectus for additional information on these and other risks.
Please see footnotes on page 7.
6 | Wells Fargo Core Plus Bond Fund
Performance highlights (unaudited)
|
|
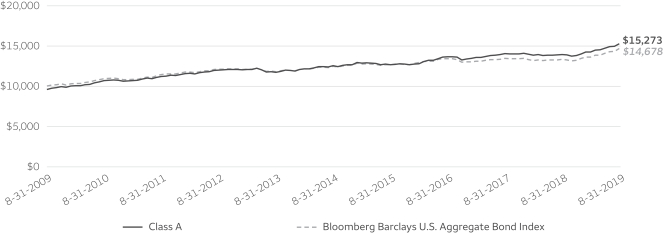
| Growth of $10,000 investment as of August 31, 20196 |
|
|
| ‡ | CFA® and Chartered Financial Analyst® are trademarks owned by CFA Institute. |
| 1 | Reflects the expense ratios as stated in the most recent prospectuses, which include the impact of 0.01% in acquired fund fees and expenses. The expense ratios shown are subject to change and may differ from the annualized expense ratios shown in the financial highlights of this report, which do not include acquired fund fees and expenses. |
| 2 | The manager has contractually committed through December 31, 2019, to waive fees and/or reimburse expenses to the extent necessary to cap the expenses of each class after fee waivers at 0.73% for Class A, 1.48% for Class C, 0.35% for Class R6, 0.62% for Administrator Class, and 0.40% for Institutional Class. Brokerage commissions, stamp duty fees, interest, taxes, acquired fund fees and expenses (if any), and extraordinary expenses are excluded from the expense cap. Prior to or after the commitment expiration date, the cap may be increased or the commitment to maintain the cap may be terminated only with the approval of the Board of Trustees. Without this cap, the Fund’s returns would have been lower. The expense ratio paid by an investor is the net expense ratio (the total annual fund operating expenses after fee waivers) as stated in the prospectuses. |
| 3 | Historical performance shown for Class R6 shares prior to their inception reflects the performance of the Institutional Class shares, and includes the higher expenses applicable to the Institutional Class shares. If these expenses had not been included, returns for Class R6 shares would be higher. |
| 4 | Historical performance shown for Administrator Class shares prior to their inception reflects the performance of Institutional Class shares and has been adjusted to include the higher expenses applicable to Administrator Class shares. |
| 5 | The Bloomberg Barclays U.S. Aggregate Bond Index is a broad-based benchmark that measures the investment-grade, U.S. dollar–denominated, fixed-rate taxable bond market, including Treasuries, government-related and corporate securities, mortgage-backed securities (agency fixed-rate and hybrid adjustable-rate mortgage pass-throughs), asset-backed securities, and commercial mortgage-backed securities. You cannot invest directly in an index. |
| 6 | The chart compares the performance of Class A shares for the most recent ten years with the performance of the Bloomberg Barclays U.S. Aggregate Bond Index. The chart assumes a hypothetical investment of $10,000 in Class A shares and reflects all operating expenses and assumes the maximum initial sales charge of 4.50%. |
| 7 | The ten largest holdings, excluding cash, cash equivalents and any money market funds, are calculated based on the value of the investments divided by total net assets of the Fund. Holdings are subject to change and may have changed since the date specified. |
| 8 | The Personal Consumption Expenditures Index is the primary measure of consumer spending on goods and services in the U.S. economy. It accounts for abouttwo-thirds of domestic final spending and is part of the personal income report issued by the Bureau of Economic Analysis of the Department of Commerce. You cannot invest directly in an index. |
| 9 | Amounts are calculated based on the total long-term investments of the Fund. These amounts are subject to change and may have changed since the date specified. |
Wells Fargo Core Plus Bond Fund | 7
Performance highlights (unaudited)
MANAGER’S DISCUSSION
Fund highlights
| ∎ | | The Fund (Class A shares, excluding sales charges) underperformed its benchmark, the Bloomberg Barclays U.S. Aggregate Bond Index, for the12-month period that ended August 31, 2019. |
| ∎ | | The Fund’s shorter duration relative to the index and exposure to a flatter U.S. Treasury yield curve detracted from performance during the period. |
| ∎ | | The Fund’snon-U.S. holdings, especially European investment grade and high yield, contributed to performance, as did overweight allocations to U.S. high-yield andBBB-rated corporate bonds. |
| | | | |
|
| Ten largest holdings(%) as of August 31, 20197 | |
| | |
FNMA, 3.50%,8-1-2049 | | | 2.40 | |
| | |
FNMA, 3.50%,3-1-2048 | | | 1.48 | |
| | |
U.S. Treasury Bond, 1.63%,8-15-2029 | | | 1.30 | |
| | |
TVA, 5.88%,4-1-2036 | | | 1.04 | |
| | |
U.S. Treasury Bond, 2.88%,5-15-2049 | | | 1.03 | |
| | |
GNMA, 3.00%,9-19-2049 | | | 0.96 | |
| | |
U.S. Treasury Note, 2.00%,10-31-2022 | | | 0.92 | |
| | |
U.S. Treasury Bond, 3.00%,8-15-2048 | | | 0.91 | |
| | |
FNMA, 3.00%,11-1-2047 | | | 0.91 | |
| | |
U.S. Treasury Bond, 3.38%,5-15-2044 | | | 0.83 | |
An economic slowdown
The pace of gross domestic product growth decelerated over the past 12 months as business investment, inventory effects, and trade restrained overall economic activity. For the four quarters that ended June 30, 2019, the U.S. economy expanded by 2.3% in inflation-adjusted terms, compared with a 3.2% trailing12-month growth rate at the midway point in 2018. Rising anxiety over the contentious U.S.-China trade relationship appeared to discourage capital investment over the12-month period that ended August 31, 2019. Housing investment also was a modest drag despite low mortgage rates. Consumer spending held up fairly well, however, with the Personal Consumption Expenditures Index8 rising at a 2.7% year-over-year rate though the end of July.
Consumption was supported by a relatively firm labor market. While job growth slowed modestly over the period, wages grew by 3.2% in real terms and the unemployment rate remained below 4%. Measures of labor force participation also generally showed improvement.
In response to slower growth and lower-than-targeted inflation, the Federal Open Market Committee (FOMC) voted to reduce its policy rate target for overnight funds by 0.25% at its July 31 meeting. This was the first interest rate reduction engineered by the FOMC in the decade since the financial crisis. While the monetary authorities suggested that their decision should be seen as a “midcourse correction” rather than the beginning of an extended easing cycle, markets have priced multiple additional rate cuts into the term structure. Indeed, interest rates fell across the board over the past 12 months, with intermediate-term Treasury yields dropping by about 1.35%.
|
|
| Portfolio allocation as of August 31, 20199 |
|
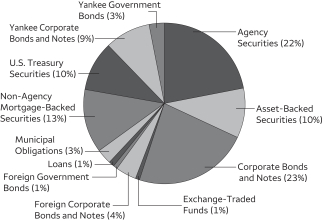 |
The Fund reduced its overall allocation to plus sectors outside the benchmark throughout the period while increasing allocations to sectors with better valuations, namely securitized assets.
During the period, the Fund decreased holdings in European high-yield bonds and U.S. floating-rate loans while increasing the allocation to securitized debt, namely higher-quality collateralized loan obligations and asset-backed securities. Given strong performance and tight valuations in many plus sectors during the period, we gradually reduced allocations there in favor of higher-quality securitized sectors with strong fundamentals. The Fund started the period with a short duration profile relative to the index given the likelihood of the FOMC continuing to gradually reduce its accommodative monetary policy as we entered 2019. This positioning changed as the period ended, however, and the Fund ended closer to neutral due to the rising risk of a recession and growing downward pressure from negatively yielding bonds globally.
Please see footnotes on page 7.
8 | Wells Fargo Core Plus Bond Fund
Performance highlights (unaudited)
Tighter U.S. high-yield spreads and selection within U.S. investment-grade credit benefited results.Non-U.S. holdings, especially European investment grade and high yield materially outperformed, while emerging markets and exposure tonon-U.S. currency produced mixed results. The Fund’s shorter duration position in an environment where interest rates moved lower than the market anticipated was a detractor from relative performance during the reporting period.
We expect trend economic growth to continue in the U.S. with a more challenging outlook across the globe.
U.S.-China trade disputes, a global economic slowdown, and dovish tilts from central banks across the world have depressed rates in all developed markets, including the U.S. Even with a continued tight labor market and rather loose financial conditions, the U.S. market is pricing in several more rate cuts in 2019 and it looks more likely that further stimulus could be coming from the European Central Bank. We plan to trade our duration position more tactically and not fight the market’s sentiment despite the stable economic outlook.
The spreads on most credit sectors tightened back inside of their five-year averages near the end of the period, and U.S. Treasury yields have inverted across a number of important points along the curve. This tells us that valuations are less attractive than they were earlier in the year and that we should expect further bouts of volatility sooner rather than later. Against this backdrop, we have reduced credit risk thoughtfully throughout the period but will look to become more aggressive if opportunities present themselves later this year.
Wells Fargo Core Plus Bond Fund | 9
Fund expenses (unaudited)
As a shareholder of the Fund, you incur two types of costs: (1) transaction costs, including sales charges (loads) on purchase payments and contingent deferred sales charges (if any) on redemptions and (2) ongoing costs, including management fees, distribution(12b-1) and/or shareholder servicing fees, and other Fund expenses. This example is intended to help you understand your ongoing costs (in dollars) of investing in the Fund and to compare these costs with the ongoing costs of investing in other mutual funds.
The example is based on an investment of $1,000 invested at the beginning of thesix-month period and held for the entire period from March 1, 2019 to August 31, 2019.
Actual expenses
The “Actual” line of the table below provides information about actual account values and actual expenses. You may use the information in this line, together with the amount you invested, to estimate the expenses that you paid over the period. Simply divide your account value by $1,000 (for example, an $8,600 account value divided by $1,000 = 8.6), then multiply the result by the number in the “Actual” line under the heading entitled “Expenses paid during period” for your applicable class of shares to estimate the expenses you paid on your account during this period.
Hypothetical example for comparison purposes
The “Hypothetical” line of the table below provides information about hypothetical account values and hypothetical expenses based on the Fund’s actual expense ratio and an assumed rate of return of 5% per year before expenses, which is not the Fund’s actual return. The hypothetical account values and expenses may not be used to estimate the actual ending account balance or expenses you paid for the period. You may use this information to compare the ongoing costs of investing in the Fund and other funds. To do so, compare this 5% hypothetical example with the 5% hypothetical examples that appear in the shareholder reports of the other funds.
Please note that the expenses shown in the table are meant to highlight your ongoing costs only and do not reflect any transactional costs, such as sales charges (loads) and contingent deferred sales charges. Therefore, the “Hypothetical” line of the table is useful in comparing ongoing costs only and will not help you determine the relative total costs of owning different funds. In addition, if these transactional costs were included, your costs would have been higher.
| | | | | | | | | | | | | | | | |
| | | Beginning
account value
3-1-2019 | | | Ending
account value
8-31-2019 | | | Expenses
paid during
the period¹ | | | Annualized net
expense ratio | |
| | | | | |
Class A | | | | | | | | | | | | | | | | |
| | | | |
Actual | | $ | 1,000.00 | | | $ | 1,072.79 | | | $ | 3.81 | | | | 0.73 | % |
| | | | |
Hypothetical (5% return before expenses) | | $ | 1,000.00 | | | $ | 1,021.53 | | | $ | 3.72 | | | | 0.73 | % |
| | | | | |
Class C | | | | | | | | | | | | | | | | |
| | | | |
Actual | | $ | 1,000.00 | | | $ | 1,068.80 | | | $ | 7.72 | | | | 1.48 | % |
| | | | |
Hypothetical (5% return before expenses) | | $ | 1,000.00 | | | $ | 1,017.75 | | | $ | 7.53 | | | | 1.48 | % |
| | | | | |
Class R6 | | | | | | | | | | | | | | | | |
| | | | |
Actual | | $ | 1,000.00 | | | $ | 1,074.71 | | | $ | 1.83 | | | | 0.35 | % |
| | | | |
Hypothetical (5% return before expenses) | | $ | 1,000.00 | | | $ | 1,023.44 | | | $ | 1.78 | | | | 0.35 | % |
| | | | | |
Administrator Class | | | | | | | | | | | | | | | | |
| | | | |
Actual | | $ | 1,000.00 | | | $ | 1,073.53 | | | $ | 3.24 | | | | 0.62 | % |
| | | | |
Hypothetical (5% return before expenses) | | $ | 1,000.00 | | | $ | 1,022.08 | | | $ | 3.16 | | | | 0.62 | % |
| | | | | |
Institutional Class | | | | | | | | | | | | | | | | |
| | | | |
Actual | | $ | 1,000.00 | | | $ | 1,075.30 | | | $ | 2.09 | | | | 0.40 | % |
| | | | |
Hypothetical (5% return before expenses) | | $ | 1,000.00 | | | $ | 1,023.19 | | | $ | 2.04 | | | | 0.40 | % |
| 1 | Expenses paid is equal to the annualized net expense ratio of each class multiplied by the average account value over the period, multiplied by the number of days in the most recent fiscal half-year divided by the number of days in the fiscal year (to reflect theone-half-year period). |
10 | Wells Fargo Core Plus Bond Fund
Portfolio of investments—August 31, 2019
| | | | | | | | | | | | | | | | |
| | | Interest
rate | | | Maturity
date | | | Principal | | | Value | |
| Agency Securities: 19.28% | |
| | | | |
FHLMC %% | | | 3.00 | % | | | 9-1-2034 | | | $ | 1,651,175 | | | $ | 1,693,580 | |
| | | | |
FHLMC | | | 3.50 | | | | 6-15-2042 | | | | 3,492,951 | | | | 3,593,509 | |
| | | | |
FHLMC | | | 3.50 | | | | 12-1-2045 | | | | 3,209,998 | | | | 3,353,857 | |
| | | | |
FHLMC | | | 3.50 | | | | 12-1-2045 | | | | 1,070,373 | | | | 1,117,667 | |
| | | | |
FHLMC | | | 4.00 | | | | 6-1-2044 | | | | 2,376,624 | | | | 2,513,799 | |
| | | | |
FHLMC (12 Month LIBOR +1.33%)± | | | 4.26 | | | | 1-1-2036 | | | | 19,106 | | | | 19,758 | |
| | | | |
FHLMC | | | 5.00 | | | | 6-1-2036 | | | | 214,868 | | | | 239,183 | |
| | | | |
FHLMC | | | 5.00 | | | | 8-1-2040 | | | | 219,703 | | | | 242,155 | |
| | | | |
FHLMC | | | 5.50 | | | | 8-1-2038 | | | | 52,397 | | | | 58,989 | |
| | | | |
FHLMC | | | 5.50 | | | | 12-1-2038 | | | | 464,555 | | | | 522,836 | |
| | | | |
FHLMC | | | 5.50 | | | | 6-1-2040 | | | | 703,052 | | | | 782,414 | |
| | | | |
FHLMC | | | 8.00 | | | | 2-1-2030 | | | | 185 | | | | 215 | |
| | | | |
FHLMC Series 2015-SC01 Class 1A | | | 3.50 | | | | 5-25-2045 | | | | 803,816 | | | | 820,109 | |
| | | | |
FHLMC Series 3774 Class AB | | | 3.50 | | | | 12-15-2020 | | | | 35,050 | | | | 35,251 | |
| | | | |
FHLMC Series K020 Class X1±±(c) | | | 1.53 | | | | 5-25-2022 | | | | 13,036,496 | | | | 416,112 | |
| | | | |
FHLMC SeriesT-42 Class A5 | | | 7.50 | | | | 2-25-2042 | | | | 1,369,707 | | | | 1,653,754 | |
| | | | |
FHLMC SeriesT-57 Class 2A1±± | | | 4.16 | | | | 7-25-2043 | | | | 41,092 | | | | 44,674 | |
| | | | |
FHLMC SeriesT-59 Class 2A1±± | | | 4.03 | | | | 10-25-2043 | | | | 211,108 | | | | 224,109 | |
| | | | |
FNMA | | | 3.50 | | | | 3-1-2048 | | | | 13,003,784 | | | | 13,468,482 | |
| | | | |
FNMA ¤ | | | 0.00 | | | | 10-9-2019 | | | | 5,000,000 | | | | 4,989,422 | |
| | | | |
FNMA (12 Month LIBOR +1.61%)± | | | 2.49 | | | | 5-1-2046 | | | | 1,299,353 | | | | 1,316,425 | |
| | | | |
FNMA (12 Month LIBOR +1.61%)± | | | 2.52 | | | | 3-1-2046 | | | | 1,132,757 | | | | 1,148,726 | |
| | | | |
FNMA | | | 3.00 | | | | 2-1-2034 | | | | 66,456 | | | | 68,048 | |
| | | | |
FNMA | | | 3.00 | | | | 11-1-2045 | | | | 1,946,837 | | | | 2,005,998 | |
| | | | |
FNMA | | | 3.00 | | | | 12-1-2045 | | | | 4,927,617 | | | | 5,077,517 | |
| | | | |
FNMA | | | 3.00 | | | | 12-1-2046 | | | | 2,268,147 | | | | 2,330,218 | |
| | | | |
FNMA | | | 3.00 | | | | 11-1-2047 | | | | 8,066,713 | | | | 8,278,740 | |
| | | | |
FNMA | | | 3.00 | | | | 4-1-2048 | | | | 5,660,511 | | | | 5,795,506 | |
| | | | |
FNMA | | | 3.02 | | | | 2-1-2026 | | | | 3,151,837 | | | | 3,339,484 | |
| | | | |
FNMA | | | 3.27 | | | | 7-1-2022 | | | | 1,187,318 | | | | 1,233,278 | |
| | | | |
FNMA | | | 3.48 | | | | 3-1-2029 | | | | 994,180 | | | | 1,104,270 | |
| | | | |
FNMA | | | 3.50 | | | | 10-1-2043 | | | | 983,462 | | | | 1,028,615 | |
| | | | |
FNMA | | | 3.50 | | | | 4-1-2045 | | | | 256,545 | | | | 267,941 | |
| | | | |
FNMA | | | 3.50 | | | | 8-1-2045 | | | | 5,726,064 | | | | 5,975,833 | |
| | | | |
FNMA | | | 3.50 | | | | 8-1-2049 | | | | 21,185,637 | | | | 21,818,736 | |
| | | | |
FNMA | | | 3.62 | | | | 3-1-2029 | | | | 443,000 | | | | 499,548 | |
| | | | |
FNMA | | | 3.63 | | | | 3-1-2029 | | | | 1,250,000 | | | | 1,397,531 | |
| | | | |
FNMA | | | 3.77 | | | | 3-1-2029 | | | | 994,826 | | | | 1,122,144 | |
| | | | |
FNMA | | | 3.77 | | | | 3-1-2029 | | | | 1,085,591 | | | | 1,223,579 | |
| | | | |
FNMA | | | 3.95 | | | | 9-1-2021 | | | | 397,193 | | | | 410,457 | |
| | | | |
FNMA | | | 4.00 | | | | 2-1-2046 | | | | 468,949 | | | | 493,837 | |
| | | | |
FNMA | | | 4.00 | | | | 4-1-2046 | | | | 2,479,870 | | | | 2,613,426 | |
| | | | |
FNMA | | | 4.00 | | | | 6-1-2048 | | | | 6,673,517 | | | | 6,930,353 | |
| | | | |
FNMA | | | 4.00 | | | | 9-1-2048 | | | | 4,281,499 | | | | 4,444,989 | |
| | | | |
FNMA | | | 4.00 | | | | 9-1-2048 | | | | 3,565,054 | | | | 3,716,160 | |
| | | | |
FNMA | | | 4.00 | | | | 10-1-2048 | | | | 549,922 | | | | 571,063 | |
| | | | |
FNMA | | | 4.50 | | | | 11-1-2048 | | | | 6,381,963 | | | | 6,726,359 | |
| | | | |
FNMA (12 Month LIBOR +1.78%)± | | | 4.50 | | | | 8-1-2036 | | | | 20,438 | | | | 21,550 | |
| | | | |
FNMA (12 Month LIBOR +1.73%)± | | | 4.61 | | | | 9-1-2036 | | | | 13,201 | | | | 13,742 | |
| | | | |
FNMA (1 Year Treasury Constant Maturity +2.26%)± | | | 4.72 | | | | 8-1-2036 | | | | 690,202 | | | | 729,129 | |
| | | | |
FNMA (1 Year Treasury Constant Maturity +2.27%)± | | | 4.90 | | | | 1-1-2036 | | | | 49,313 | | | | 51,934 | |
The accompanying notes are an integral part of these financial statements.
Wells Fargo Core Plus Bond Fund | 11
Portfolio of investments—August 31, 2019
| | | | | | | | | | | | | | | | |
| | | Interest
rate | | | Maturity
date | | | Principal | | | Value | |
| Agency Securities (continued) | |
| | | | |
FNMA | | | 5.00 | % | | | 1-1-2024 | | | $ | 47,672 | | | $ | 49,444 | |
| | | | |
FNMA | | | 5.00 | | | | 2-1-2036 | | | | 23,616 | | | | 26,293 | |
| | | | |
FNMA | | | 5.00 | | | | 6-1-2040 | | | | 82,415 | | | | 90,689 | |
| | | | |
FNMA | | | 5.00 | | | | 8-1-2040 | | | | 1,373,989 | | | | 1,509,710 | |
| | | | |
FNMA | | | 5.50 | | | | 11-1-2023 | | | | 34,469 | | | | 36,129 | |
| | | | |
FNMA | | | 5.50 | | | | 8-1-2034 | | | | 82,376 | | | | 93,191 | |
| | | | |
FNMA | | | 5.50 | | | | 2-1-2035 | | | | 25,157 | | | | 28,450 | |
| | | | |
FNMA | | | 5.50 | | | | 8-1-2038 | | | | 101,612 | | | | 109,667 | |
| | | | |
FNMA | | | 5.50 | | | | 8-1-2038 | | | | 183,031 | | | | 197,541 | |
| | | | |
FNMA | | | 6.00 | | | | 10-1-2037 | | | | 438,435 | | | | 500,851 | |
| | | | |
FNMA | | | 6.00 | | | | 11-1-2037 | | | | 31,725 | | | | 36,202 | |
| | | | |
FNMA | | | 6.50 | | | | 7-1-2036 | | | | 20,914 | | | | 24,999 | |
| | | | |
FNMA | | | 6.50 | | | | 7-1-2036 | | | | 10,471 | | | | 12,130 | |
| | | | |
FNMA | | | 6.50 | | | | 11-1-2036 | | | | 4,559 | | | | 5,193 | |
| | | | |
FNMA | | | 7.00 | | | | 12-1-2022 | | | | 95,952 | | | | 98,373 | |
| | | | |
FNMA | | | 7.00 | | | | 7-1-2036 | | | | 10,549 | | | | 11,393 | |
| | | | |
FNMA | | | 7.00 | | | | 11-1-2037 | | | | 5,953 | | | | 6,675 | |
| | | | |
FNMA | | | 7.50 | | | | 5-1-2038 | | | | 1,904 | | | | 1,920 | |
| | | | |
FNMA Series2002-T12 Class A3 | | | 7.50 | | | | 5-25-2042 | | | | 5,871 | | | | 7,082 | |
| | | | |
FNMA Series2003-W08 Class 4A±± | | | 4.54 | | | | 11-25-2042 | | | | 122,839 | | | | 127,369 | |
| | | | |
FNMA Series2003-W14 Class 2A±± | | | 4.42 | | | | 6-25-2045 | | | | 94,120 | | | | 99,828 | |
| | | | |
FNMA Series2003-W14 Class 2A±± | | | 4.62 | | | | 1-25-2043 | | | | 214,628 | | | | 224,563 | |
| | | | |
FNMA Series2004-W11 Class 1A3 | | | 7.00 | | | | 5-25-2044 | | | | 1,009,219 | | | | 1,130,379 | |
| | | | |
FNMA Series2004-W15 Class 1A3 | | | 7.00 | | | | 8-25-2044 | | | | 529,667 | | | | 625,068 | |
| | | | |
GNMA | | | 3.00 | | | | 11-20-2045 | | | | 3,945,155 | | | | 4,086,514 | |
| | | | |
GNMA %% | | | 3.00 | | | | 9-19-2049 | | | | 8,420,000 | | | | 8,681,152 | |
| | | | |
GNMA | | | 3.50 | | | | 9-20-2047 | | | | 3,256,646 | | | | 3,397,728 | |
| | | | |
GNMA | | | 3.50 | | | | 12-20-2047 | | | | 6,862,215 | | | | 7,156,797 | |
| | | | |
GNMA | | | 4.00 | | | | 12-20-2047 | | | | 3,964,905 | | | | 4,154,377 | |
| | | | |
GNMA | | | 4.50 | | | | 10-20-2048 | | | | 94,646 | | | | 98,855 | |
| | | | |
GNMA %% | | | 4.50 | | | | 8-20-2049 | | | | 1,624,707 | | | | 1,717,504 | |
| | | | |
GNMA | | | 5.00 | | | | 7-20-2040 | | | | 559,981 | | | | 617,532 | |
| | | | |
GNMA | | | 7.50 | | | | 12-15-2029 | | | | 631 | | | | 704 | |
| | | | |
GNMA Series2008-22 Class XM±±(c) | | | 1.01 | | | | 2-16-2050 | | | | 990,973 | | | | 23,606 | |
| | | | |
STRIPS ¤ | | | 0.00 | | | | 5-15-2039 | | | | 4,670,000 | | | | 3,185,153 | |
| | | | |
TVA | | | 5.88 | | | | 4-1-2036 | | | | 6,400,000 | | | | 9,447,427 | |
| | | | |
Total Agency Securities (Cost $169,268,897) | | | | | | | | | | | | | | | 175,165,499 | |
| | | | | | | | | | | | | | | | |
| | | | |
| Asset-Backed Securities: 9.01% | | | | | | | | | | | | |
| | | | |
Ally Auto Receivables Trust Series2019-1 Class A3 | | | 2.91 | | | | 9-15-2023 | | | | 4,945,000 | | | | 5,039,614 | |
| | | | |
AmeriCredit Automobile Receivables Trust Series2015-2 Class D | | | 3.00 | | | | 6-8-2021 | | | | 2,462,000 | | | | 2,464,203 | |
| | | | |
California Republic Auto Receivables Trust Series2017-1 Class A4 | | | 2.28 | | | | 6-15-2022 | | | | 4,792,996 | | | | 4,793,651 | |
| | | | |
Carmax Auto Owner Trust Series2015-4 Class C | | | 2.50 | | | | 10-15-2021 | | | | 1,885,000 | | | | 1,885,228 | |
| | | | |
Chesapeake Funding LLC Series2016-2A Class A1 144A | | | 1.88 | | | | 6-15-2028 | | | | 1,110,067 | | | | 1,109,410 | |
| | | | |
Citibank Credit Card Issuance Trust Series2016-A1 Class A1 | | | 1.75 | | | | 11-19-2021 | | | | 370,000 | | | | 369,665 | |
| | | | |
Dell Equipment Finance Trust Series2018-1 Class A2A 144A | | | 2.97 | | | | 10-22-2020 | | | | 3,234,851 | | | | 3,241,669 | |
| | | | |
Drive Auto Receivables Trust Series2018-3 Class B | | | 3.37 | | | | 9-15-2022 | | | | 5,590,000 | | | | 5,603,050 | |
| | | | |
DT Auto Owner Trust Series2016-1A Class D 144A | | | 4.66 | | | | 12-15-2022 | | | | 3,056,040 | | | | 3,075,936 | |
| | | | |
Educational Services of America Series2015-1 Class A (1 Month LIBOR +0.80%) 144A± | | | 2.95 | | | | 10-25-2056 | | | | 991,510 | | | | 985,236 | |
| | | | |
Enterprise Fleet Financing Trust Series2017-2 Class A2 144A | | | 1.97 | | | | 1-20-2023 | | | | 4,146,102 | | | | 4,141,257 | |
The accompanying notes are an integral part of these financial statements.
12 | Wells Fargo Core Plus Bond Fund
Portfolio of investments—August 31, 2019
| | | | | | | | | | | | | | | | |
| | | Interest
rate | | | Maturity
date | | | Principal | | | Value | |
| | | | |
| Asset-Backed Securities (continued) | | | | | | | | | | | | |
| | | | |
Five Guys Funding LLC Series17-1A Class A2 144A | | | 4.60 | % | | | 7-25-2047 | | | $ | 1,597,925 | | | $ | 1,694,011 | |
| | | | |
GM Financial Consumer Automobile Receivables Trust Series2017-2A Class A3 144A | | | 1.86 | | | | 12-16-2021 | | | | 4,678,963 | | | | 4,671,702 | |
| | | | |
Hertz Vehicle Financing LLC Series2018-2A Class A 144A | | | 3.65 | | | | 6-27-2022 | | | | 1,800,000 | | | | 1,842,028 | |
| | | | |
Hertz Vehicle Financing LLC Series2019-1A Class A 144A | | | 3.71 | | | | 3-25-2023 | | | | 3,308,000 | | | | 3,419,167 | |
| | | | |
Honda Auto Receivables Owner Trust Series2016-2 Class A4 | | | 1.62 | | | | 8-15-2022 | | | | 781,689 | | | | 781,484 | |
| | | | |
Honda Auto Receivables Owner Trust Series2016-4 Class A4 | | | 1.36 | | | | 1-18-2023 | | | | 4,998,000 | | | | 4,974,692 | |
| | | | |
MMAF Equipment Finance LLC Series2017-AA Class A4 144A | | | 2.41 | | | | 8-16-2024 | | | | 1,975,000 | | | | 1,989,807 | |
| | | | |
MMAF Equipment Finance LLC Series2019-A Class A2 144A | | | 2.84 | | | | 1-10-2022 | | | | 2,000,000 | | | | 2,015,768 | |
| | | | |
Navient Student Loan Trust Series2017-A Class A1 (1 Month LIBOR +0.40%) 144A± | | | 2.60 | | | | 12-16-2058 | | | | 354,938 | | | | 354,837 | |
| | | | |
Nissan Auto Lease Trust Series2017-B Class A3 | | | 2.05 | | | | 9-15-2020 | | | | 1,097,170 | | | | 1,096,844 | |
| | | | |
Oscar US Funding Trust Series2016-2A Class A4 144A | | | 2.99 | | | | 12-15-2023 | | | | 5,400,000 | | | | 5,433,878 | |
| | | | |
SLM Student Loan Trust Series2004-1 Class A4 (3 Month LIBOR +0.26%) ± | | | 2.54 | | | | 10-27-2025 | | | | 1,341,087 | | | | 1,332,723 | |
| | | | |
South Carolina Student Loan Corporation Series2014-1 Class A1 (1 Month LIBOR +0.75%)± | | | 2.98 | | | | 5-1-2030 | | | | 1,810,496 | | | | 1,799,609 | |
| | | | |
Student Loan Consolidation Center Series2011-1 Class A (1 Month LIBOR +1.22%) 144A± | | | 3.37 | | | | 10-25-2027 | | | | 1,474,214 | | | | 1,478,568 | |
| | | | |
TCF Auto Receivables Owner Trust Series2016-1A Class A4 144A | | | 2.03 | | | | 2-15-2022 | | | | 1,730,026 | | | | 1,727,085 | |
| | | | |
Towd Point Asset Trust Series2018-SL1 Class A (1 Month LIBOR +0.60%) 144A± | | | 2.75 | | | | 1-25-2046 | | | | 2,821,514 | | | | 2,778,786 | |
| | | | |
Toyota Auto Receivables Owner Trust Series2018-D Class A3 | | | 3.18 | | | | 3-15-2023 | | | | 5,995,000 | | | | 6,124,250 | |
| | | | |
Volvo Financial Equipment LLC Series2018-AA Class A (1 Month LIBOR +0.52%) 144A± | | | 2.72 | | | | 7-17-2023 | | | | 2,590,000 | | | | 2,593,810 | |
| | | | |
Westlake Automobile Receivable Series2019-2A Class A1 144A | | | 2.53 | | | | 6-15-2020 | | | | 1,680,420 | | | | 1,680,829 | |
| | | | |
Wheels SPV LLC Series2018-1A Class A2 144A | | | 3.06 | | | | 4-20-2027 | | | | 1,290,559 | | | | 1,297,671 | |
| | | | |
Total Asset-Backed Securities (Cost $81,421,332) | | | | | | | | | | | | | | | 81,796,468 | |
| | | | | | | | | | | | | | | | |
| | | | |
Corporate Bonds and Notes: 20.35% | | | | | | | | | | | | | | | | |
| | | | |
Communication Services: 1.75% | | | | | | | | | | | | | | | | |
| | | | |
| Diversified Telecommunication Services: 0.61% | | | | | | | | | | | | |
| | | | |
AT&T Incorporated | | | 4.75 | | | | 5-15-2046 | | | | 1,975,000 | | | | 2,208,343 | |
| | | | |
AT&T Incorporated | | | 5.65 | | | | 2-15-2047 | | | | 1,050,000 | | | | 1,316,092 | |
| | | | |
Verizon Communications Incorporated | | | 5.01 | | | | 4-15-2049 | | | | 882,000 | | | | 1,127,494 | |
| | | | |
Verizon Communications Incorporated | | | 5.50 | | | | 3-16-2047 | | | | 675,000 | | | | 906,050 | |
| | | | |
| | | | | | | | | | | | | | | 5,557,979 | |
| | | | | | | | | | | | | | | | |
| | | | |
| Media: 0.56% | | | | | | | | | | | | |
| | | | |
CCO Holdings LLC 144A | | | 5.13 | | | | 5-1-2027 | | | | 1,300,000 | | | | 1,374,737 | |
| | | | |
Charter Communications Operating LLC | | | 5.38 | | | | 4-1-2038 | | | | 705,000 | | | | 795,182 | |
| | | | |
Charter Communications Operating LLC | | | 6.48 | | | | 10-23-2045 | | | | 655,000 | | | | 809,934 | |
| | | | |
Diamond Sports Group LLC 144A | | | 5.38 | | | | 8-15-2026 | | | | 70,000 | | | | 73,500 | |
| | | | |
Diamond Sports Group LLC 144A | | | 6.63 | | | | 8-15-2027 | | | | 70,000 | | | | 73,325 | |
| | | | |
Discovery Communications LLC | | | 6.35 | | | | 6-1-2040 | | | | 1,550,000 | | | | 1,921,272 | |
| | | | |
Nexstar Escrow Incorporated 144A | | | 5.63 | | | | 7-15-2027 | | | | 45,000 | | | | 46,913 | |
| | | | |
| | | | | | | | | | | | | | | 5,094,863 | |
| | | | | | | | | | | | | | | | |
| | | | |
| Wireless Telecommunication Services: 0.58% | | | | | | | | | | | | |
| | | | |
Crown Castle Towers LLC 144A | | | 3.22 | | | | 5-15-2042 | | | | 2,600,000 | | | | 2,636,703 | |
| | | | |
SBA Tower Trust 144A | | | 3.72 | | | | 4-9-2048 | | | | 1,968,000 | | | | 2,045,572 | |
| | | | |
Sprint Spectrum Company 144A | | | 5.15 | | | | 9-20-2029 | | | | 530,000 | | | | 571,075 | |
| | | | |
| | | | | | | | | | | | | | | 5,253,350 | |
| | | | | | | | | | | | | | | | |
The accompanying notes are an integral part of these financial statements.
Wells Fargo Core Plus Bond Fund | 13
Portfolio of investments—August 31, 2019
| | | | | | | | | | | | | | | | |
| | | Interest
rate | | | Maturity
date | | | Principal | | | Value | |
Consumer Discretionary: 0.44% | | | | | | | | | | | | | | | | |
| | | | |
| Hotels, Restaurants & Leisure: 0.34% | | | | | | | | | | | | |
| | | | |
Las Vegas Sands Corporation | | | 3.90 | % | | | 8-8-2029 | | | $ | 3,000,000 | | | $ | 3,090,899 | |
| | | | | | | | | | | | | | | | |
| | | | |
| Multiline Retail: 0.10% | | | | | | | | | | | | |
| | | | |
Macy’s Retail Holdings Incorporated | | | 3.45 | | | | 1-15-2021 | | | | 940,000 | | | | 947,622 | |
| | | | | | | | | | | | | | | | |
| | | | |
Consumer Staples: 0.49% | | | | | | | | | | | | | | | | |
| | | | |
| Beverages: 0.23% | | | | | | | | | | | | |
| | | | |
Anheuser-Busch InBev Worldwide Incorporated | | | 4.60 | | | | 4-15-2048 | | | | 1,810,000 | | | | 2,104,077 | |
| | | | | | | | | | | | | | | | |
| | | | |
| Tobacco: 0.26% | | | | | | | | | | | | |
| | | | |
Altria Group Incorporated | | | 4.40 | | | | 2-14-2026 | | | | 1,620,000 | | | | 1,776,391 | |
| | | | |
Reynolds American Incorporated | | | 7.00 | | | | 8-4-2041 | | | | 450,000 | | | | 568,209 | |
| | | | |
| | | | | | | | | | | | | | | 2,344,600 | |
| | | | | | | | | | | | | | | | |
| | | | |
Energy: 2.90% | | | | | | | | | | | | | | | | |
| | | | |
| Energy Equipment & Services: 0.07% | | | | | | | | | | | | |
| | | | |
Oceaneering International Incorporated | | | 6.00 | | | | 2-1-2028 | | | | 680,000 | | | | 654,500 | |
| | | | | | | | | | | | | | | | |
|
| Oil, Gas & Consumable Fuels: 2.83% | |
| | | | |
Antero Resources Corporation | | | 5.38 | | | | 11-1-2021 | | | | 1,900,000 | | | | 1,845,375 | |
| | | | |
Apache Corporation | | | 5.35 | | | | 7-1-2049 | | | | 1,250,000 | | | | 1,303,056 | |
| | | | |
Baker Hughes LLC | | | 2.77 | | | | 12-15-2022 | | | | 1,870,000 | | | | 1,903,951 | |
| | | | |
Boardwalk Pipelines LP | | | 4.80 | | | | 5-3-2029 | | | | 1,620,000 | | | | 1,710,175 | |
| | | | |
Energy Transfer Operating Partners LP | | | 5.25 | | | | 4-15-2029 | | | | 905,000 | | | | 1,036,680 | |
| | | | |
Energy Transfer Operating Partners LP | | | 6.13 | | | | 12-15-2045 | | | | 1,330,000 | | | | 1,581,837 | |
| | | | |
EQT Corporation | | | 3.90 | | | | 10-1-2027 | | | | 4,955,000 | | | | 4,315,802 | |
| | | | |
Indigo Natural Resources LLC 144A | | | 6.88 | | | | 2-15-2026 | | | | 1,000,000 | | | | 825,000 | |
| | | | |
Midcontinent Express Pipeline LLC 144A | | | 6.70 | | | | 9-15-2019 | | | | 4,234,000 | | | | 4,237,176 | |
| | | | |
Occidental Petroleum Corporation | | | 4.40 | | | | 8-15-2049 | | | | 1,570,000 | | | | 1,637,549 | |
| | | | |
Rockies Express Pipeline LLC 144A | | | 5.63 | | | | 4-15-2020 | | | | 2,250,000 | | | | 2,300,074 | |
| | | | |
SemGroup Corporation | | | 7.25 | | | | 3-15-2026 | | | | 875,000 | | | | 835,625 | |
| | | | |
Southern Star Central Corporation 144A | | | 5.13 | | | | 7-15-2022 | | | | 1,189,000 | | | | 1,202,685 | |
| | | | |
Whiting Petroleum Corporation | | | 1.25 | | | | 4-1-2020 | | | | 975,000 | | | | 955,916 | |
| | | | |
| | | | | | | | | | | | | | | 25,690,901 | |
| | | | | | | | | | | | | | | | |
|
Financials: 6.47% | |
|
| Banks: 1.90% | |
| | | | |
Bank of America Corporation (3 Month LIBOR +0.94%)± | | | 3.86 | | | | 7-23-2024 | | | | 1,310,000 | | | | 1,390,972 | |
| | | | |
Bank of America Corporation | | | 3.95 | | | | 4-21-2025 | | | | 1,170,000 | | | | 1,249,215 | |
| | | | |
Bank of America Corporation (3 Month LIBOR +3.90%)± | | | 6.10 | | | | 12-29-2049 | | | | 2,590,000 | | | | 2,823,100 | |
| | | | |
BBVA Bancomer SA 144A | | | 7.25 | | | | 4-22-2020 | | | | 1,000,000 | | | | 1,025,010 | |
| | | | |
Citigroup Incorporated (3 Month LIBOR +4.52%)± | | | 6.25 | | | | 12-29-2049 | | | | 1,030,000 | | | | 1,153,600 | |
| | | | |
Deutsche Bank AG | | | 4.88 | | | | 12-1-2032 | | | | 1,750,000 | | | | 1,564,255 | |
| | | | |
JPMorgan Chase & Company | | | 2.97 | | | | 1-15-2023 | | | | 2,550,000 | | | | 2,602,144 | |
| | | | |
JPMorgan Chase & Company (3 Month LIBOR +3.25%)± | | | 5.15 | | | | 12-29-2049 | | | | 3,625,000 | | | | 3,715,625 | |
| | | | |
PNC Financial Services (3 Month LIBOR +3.30%)± | | | 5.00 | | | | 12-29-2049 | | | | 565,000 | | | | 580,538 | |
| | | | |
Santander Holdings USA Incorporated | | | 3.70 | | | | 3-28-2022 | | | | 1,125,000 | | | | 1,154,387 | |
| | | | |
| | | | | | | | | | | | | | | 17,258,846 | |
| | | | | | | | | | | | | | | | |
The accompanying notes are an integral part of these financial statements.
14 | Wells Fargo Core Plus Bond Fund
Portfolio of investments—August 31, 2019
| | | | | | | | | | | | | | | | |
| | | Interest
rate | | | Maturity
date | | | Principal | | | Value | |
| Capital Markets: 0.73% | |
| | | | |
Blackstone Holdings Finance Company LLC 144A | | | 5.00 | % | | | 6-15-2044 | | | $ | 1,015,000 | | | $ | 1,263,863 | |
| | | | |
Goldman Sachs Group Incorporated (3 Month LIBOR +0.82%)± | | | 2.88 | | | | 10-31-2022 | | | | 1,910,000 | | | | 1,936,314 | |
| | | | |
Morgan Stanley | | | 3.70 | | | | 10-23-2024 | | | | 3,235,000 | | | | 3,455,645 | |
| | | | |
| | | | | | | | | | | | | | | 6,655,822 | |
| | | | | | | | | | | | | | | | |
|
| Consumer Finance: 1.82% | |
| | | | |
Daimler Finance NA LLC 144A | | | 1.75 | | | | 10-30-2019 | | | | 2,215,000 | | | | 2,213,029 | |
| | | | |
ERAC USA Finance LLC 144A | | | 4.50 | | | | 2-15-2045 | | | | 1,695,000 | | | | 1,930,645 | |
| | | | |
Ford Motor Credit Company LLC | | | 3.20 | | | | 1-15-2021 | | | | 2,890,000 | | | | 2,904,304 | |
| | | | |
General Motors Financial Company Incorporated | | | 5.65 | | | | 1-17-2029 | | | | 1,330,000 | | | | 1,488,071 | |
| | | | |
PACCAR Financial Corporation | | | 2.30 | | | | 8-10-2022 | | | | 3,000,000 | | | | 3,032,092 | |
| | | | |
Synchrony Financial | | | 2.85 | | | | 7-25-2022 | | | | 2,000,000 | | | | 2,026,987 | |
| | | | |
Synchrony Financial | | | 3.95 | | | | 12-1-2027 | | | | 2,800,000 | | | | 2,902,720 | |
| | | | |
| | | | | | | | | | | | | | | 16,497,848 | |
| | | | | | | | | | | | | | | | |
|
| Diversified Financial Services: 0.36% | |
| | | | |
Brookfield Finance LLC | | | 4.00 | | | | 4-1-2024 | | | | 2,005,000 | | | | 2,138,851 | |
| | | | |
LPL Holdings Incorporated 144A | | | 5.75 | | | | 9-15-2025 | | | | 1,100,000 | | | | 1,157,750 | |
| | | | |
| | | | | | | | | | | | | | | 3,296,601 | |
| | | | | | | | | | | | | | | | |
|
| Insurance: 1.66% | |
| | | | |
Assurant Incorporated | | | 3.70 | | | | 2-22-2030 | | | | 4,250,000 | | | | 4,273,771 | |
| | | | |
Athene Holding Limited | | | 4.13 | | | | 1-12-2028 | | | | 3,000,000 | | | | 3,069,271 | |
| | | | |
Brighthouse Financial Incorporated | | | 4.70 | | | | 6-22-2047 | | | | 1,955,000 | | | | 1,761,028 | |
| | | | |
Guardian Life Insurance Company 144A | | | 4.85 | | | | 1-24-2077 | | | | 1,045,000 | | | | 1,354,375 | |
| | | | |
National Life Insurance Company (3 Month LIBOR +3.31%) 144A± | | | 5.25 | | | | 7-19-2068 | | | | 1,668,000 | | | | 1,977,307 | |
| | | | |
PartnerRe Finance II Incorporated (3 Month LIBOR +2.33%)± | | | 4.85 | | | | 12-1-2066 | | | | 1,345,000 | | | | 979,389 | |
| | | | |
Transatlantic Holdings Incorporated | | | 8.00 | | | | 11-30-2039 | | | | 1,100,000 | | | | 1,658,042 | |
| | | | |
| | | | | | | | | | | | | | | 15,073,183 | |
| | | | | | | | | | | | | | | | |
|
Health Care: 1.90% | |
|
| Health Care Providers & Services: 1.90% | |
| | | | |
CHS Incorporated « | | | 5.13 | | | | 8-1-2021 | | | | 1,000,000 | | | | 1,000,000 | |
| | | | |
CommonSpirit Health | | | 2.95 | | | | 11-1-2022 | | | | 1,250,000 | | | | 1,272,853 | |
| | | | |
CommonSpirit Health | | | 3.82 | | | | 10-1-2049 | | | | 1,810,000 | | | | 1,877,294 | |
| | | | |
CVS Health Corporation | | | 4.78 | | | | 3-25-2038 | | | | 3,100,000 | | | | 3,476,223 | |
| | | | |
Dignity Health | | | 3.81 | | | | 11-1-2024 | | | | 2,000,000 | | | | 2,140,160 | |
| | | | |
Highmark Incorporated 144A | | | 6.13 | | | | 5-15-2041 | | | | 710,000 | | | | 884,312 | |
| | | | |
Magellan Health Incorporated | | | 4.90 | | | | 9-22-2024 | | | | 2,710,000 | | | | 2,712,710 | |
| | | | |
WellPoint Incorporated | | | 3.13 | | | | 5-15-2022 | | | | 3,804,000 | | | | 3,896,615 | |
| | | | |
| | | | | | | | | | | | | | | 17,260,167 | |
| | | | | | | | | | | | | | | | |
|
Industrials: 1.31% | |
|
| Airlines: 0.22% | |
| | | | |
American Airlines Group Company 144A | | | 5.50 | | | | 10-1-2019 | | | | 2,000,000 | | | | 2,003,000 | |
| | | | | | | | | | | | | | | | |
|
| Industrial Conglomerates: 0.27% | |
| | | | |
General Electric Company | | | 4.63 | | | | 1-7-2021 | | | | 1,060,000 | | | | 1,083,965 | |
| | | | |
General Electric Company (3 Month LIBOR +3.33%)± | | | 5.00 | | | | 12-29-2049 | | | | 1,495,000 | | | | 1,356,713 | |
| | | | |
| | | | | | | | | | | | | | | 2,440,678 | |
| | | | | | | | | | | | | | | | |
The accompanying notes are an integral part of these financial statements.
Wells Fargo Core Plus Bond Fund | 15
Portfolio of investments—August 31, 2019
| | | | | | | | | | | | | | | | |
| | | Interest
rate | | | Maturity
date | | | Principal | | | Value | |
| Machinery: 0.00% | |
| | | | |
Harsco Corporation 144A | | | 5.75 | % | | | 7-31-2027 | | | $ | 20,000 | | | $ | 20,725 | |
| | | | | | | | | | | | | | | | |
|
| Trading Companies & Distributors: 0.20% | |
| | | | |
Air Lease Corporation | | | 3.63 | | | | 12-1-2027 | | | | 1,690,000 | | | | 1,761,080 | |
| | | | | | | | | | | | | | | | |
|
| Transportation Infrastructure: 0.62% | |
| | | | |
Toll Road Investors Partnership II LP 144A¤ | | | 0.00 | | | | 2-15-2027 | | | | 1,050,000 | | | | 734,492 | |
| | | | |
Toll Road Investors Partnership II LP 144A¤ | | | 0.00 | | | | 2-15-2026 | | | | 5,630,000 | | | | 4,163,513 | |
| | | | |
Toll Road Investors Partnership II LP 144A¤ | | | 0.00 | | | | 2-15-2028 | | | | 1,150,000 | | | | 763,038 | |
| | | | |
| | | | | | | | | | | | | | | 5,661,043 | |
| | | | | | | | | | | | | | | | |
|
Information Technology: 2.25% | |
|
| Communications Equipment: 0.24% | |
| | | | |
Motorola Solutions Incorporated | | | 4.60 | | | | 2-23-2028 | | | | 2,000,000 | | | | 2,168,379 | |
| | | | | | | | | | | | | | | | |
|
| Electronic Equipment, Instruments & Components: 0.11% | |
| | | | |
Arrow Electronics Incorporated | | | 3.88 | | | | 1-12-2028 | | | | 1,000,000 | | | | 1,033,145 | |
| | | | | | | | | | | | | | | | |
|
| IT Services: 0.24% | |
| | | | |
Global Payments Incorporated | | | 4.15 | | | | 8-15-2049 | | | | 2,030,000 | | | | 2,147,599 | |
| | | | | | | | | | | | | | | | |
|
| Semiconductors & Semiconductor Equipment: 0.76% | |
| | | | |
Broadcom Corporation | | | 3.88 | | | | 1-15-2027 | | | | 3,140,000 | | | | 3,142,141 | |
| | | | |
Qualcomm Incorporated | | | 3.00 | | | | 5-20-2022 | | | | 3,700,000 | | | | 3,805,291 | |
| | | | |
| | | | | | | | | | | | | | | 6,947,432 | |
| | | | | | | | | | | | | | | | |
|
| Software: 0.48% | |
| | | | |
Citrix Systems Incorporated | | | 4.50 | | | | 12-1-2027 | | | | 2,045,000 | | | | 2,204,126 | |
| | | | |
Symantec Corporation | | | 4.20 | | | | 9-15-2020 | | | | 2,145,000 | | | | 2,176,122 | |
| | | | |
| | | | | | | | | | | | | | | 4,380,248 | |
| | | | | | | | | | | | | | | | |
| | | | |
| Technology Hardware, Storage & Peripherals: 0.42% | | | | | | | | | | | | |
| | | | |
Apple Incorporated | | | 4.65 | | | | 2-23-2046 | | | | 990,000 | | | | 1,266,149 | |
| | | | |
Diamond 1 Finance Corporation 144A | | | 8.35 | | | | 7-15-2046 | | | | 1,175,000 | | | | 1,543,784 | |
| | | | |
NCR Corporation | | | 4.63 | | | | 2-15-2021 | | | | 1,000,000 | | | | 1,000,100 | |
| | | | |
| | | | | | | | | | | | | | | 3,810,033 | |
| | | | | | | | | | | | | | | | |
| | | | |
Materials: 0.58% | | | | | | | | | | | | | | | | |
| | | | |
| Containers & Packaging: 0.58% | | | | | | | | | | | | |
| | | | |
Silgan Holdings Incorporated | | | 3.25 | | | | 3-15-2025 | | | | 1,800,000 | | | | 2,040,111 | |
| | | | |
WRKCo Incorporated | | | 3.90 | | | | 6-1-2028 | | | | 3,000,000 | | | | 3,184,419 | |
| | | | |
| | | | | | | | | | | | | | | 5,224,530 | |
| | | | | | | | | | | | | | | | |
| | | | |
Real Estate: 1.76% | | | | | | | | | | | | | | | | |
| | | | |
| Equity REITs: 1.51% | | | | | | | | | | | | |
| | | | |
Federal Realty Investment Trust | | | 3.63 | | | | 8-1-2046 | | | | 915,000 | | | | 971,948 | |
| | | | |
Omega Healthcare Investors Incorporated | | | 4.50 | | | | 1-15-2025 | | | | 2,130,000 | | | | 2,251,906 | |
| | | | |
Omega Healthcare Investors Incorporated | | | 5.25 | | | | 1-15-2026 | | | | 1,700,000 | | | | 1,881,250 | |
| | | | |
Sabra Health Care LP / Sabra Capital Corporation | | | 4.80 | | | | 6-1-2024 | | | | 2,000,000 | | | | 2,096,860 | |
| | | | |
Tanger Properties LP | | | 3.75 | | | | 12-1-2024 | | | | 1,600,000 | | | | 1,645,848 | |
| | | | |
Welltower Incorporated | | | 4.25 | | | | 4-1-2026 | | | | 4,465,000 | | | | 4,875,425 | |
| | | | |
| | | | | | | | | | | | | | | 13,723,237 | |
| | | | | | | | | | | | | | | | |
The accompanying notes are an integral part of these financial statements.
16 | Wells Fargo Core Plus Bond Fund
Portfolio of investments—August 31, 2019
| | | | | | | | | | | | | | | | |
| | | Interest
rate | | | Maturity
date | | | Principal | | | Value | |
| Real Estate Management & Development: 0.25% | | | | | | | | | | | | |
| | | | |
Washington Prime Group Incorporated | | | 3.85 | % | | | 4-1-2020 | | | $ | 2,275,000 | | | $ | 2,260,281 | |
| | | | | | | | | | | | | | | | |
| | | | |
Utilities: 0.50% | | | | | | | | | | | | | | | | |
| | | | |
| Electric Utilities: 0.39% | | | | | | | | | | | | |
| | | | |
Basin Electric Power Cooperative 144A | | | 4.75 | | | | 4-26-2047 | | | | 1,315,000 | | | | 1,580,385 | |
| | | | |
ITC Holdings Corporation | | | 2.70 | | | | 11-15-2022 | | | | 673,000 | | | | 683,122 | |
| | | | |
Oglethorpe Power Corporation | | | 5.05 | | | | 10-1-2048 | | | | 1,060,000 | | | | 1,327,882 | |
| | | | |
| | | | | | | | | | | | | | | 3,591,389 | |
| | | | | | | | | | | | | | | | |
| | | | |
| Independent Power & Renewable Electricity Producers: 0.11% | | | | | | | | | | | | |
| | | | |
Tri-State Generation and Transmission Association Incorporated | | | 4.25 | | | | 6-1-2046 | | | | 850,000 | | | | 955,641 | |
| | | | | | | | | | | | | | | | |
| | | | |
Total Corporate Bonds and Notes (Cost $175,602,934) | | | | | | | | | | | | | | | 184,909,698 | |
| | | | | | | | | | | | | | | | |
| | | | |
| | | | | | | | | | | | | | | | |
| | | | | | | | | Shares | | | | |
| Exchange-Traded Funds: 0.88% | | | | | | | | | | | | |
| | | | |
SPDR Barclays High Yield Bond ETF | | | | | | | | | | | 24,666 | | | | 2,683,907 | |
| | | | |
Vaneck Vectors JPMorgan Emerging Markets Local Currency Bond ETF | �� | | | | | | | | | | 161,000 | | | | 5,308,170 | |
| | | | |
Total Exchange-Traded Funds (Cost $7,965,231) | | | | | | | | | | | | | | | 7,992,077 | |
| | | | | | | | | | | | | | | | |
| | | | |
| | | | | | | | | | | | | | | | |
| | | | | | | | | Principal | | | | |
| Foreign Corporate Bonds and Notes: 3.20% | | | | | | | | | | | | | | | | |
| | | | |
Communication Services: 0.05% | | | | | | | | | | | | | | | | |
| | | | |
| Media: 0.05% | | | | | | | | | | | | |
| | | | |
Altice SA 144A | | | 7.25 | | | | 5-15-2022 | | | EUR | 386,024 | | | | 434,088 | |
| | | | | | | | | | | | | | | | |
|
Consumer Discretionary: 0.37% | |
|
| Auto Components: 0.13% | |
| | | | |
HP Pelzer Holding GmbH 144A | | | 4.13 | | | | 4-1-2024 | | | EUR | 1,200,000 | | | | 1,199,898 | |
| | | | | | | | | | | | | | | | |
|
| Automobiles: 0.24% | |
| | | | |
Peugeot SA Company | | | 2.00 | | | | 3-20-2025 | | | EUR | 1,800,000 | | | | 2,146,594 | |
| | | | | | | | | | | | | | | | |
|
Consumer Staples: 0.91% | |
|
| Food & Staples Retailing: 0.21% | |
| | | | |
Tasty Bondco 1 SA 144A | | | 6.25 | | | | 5-15-2026 | | | EUR | 1,600,000 | | | | 1,871,458 | |
| | | | | | | | | | | | | | | | |
|
| Food Products: 0.50% | |
| | | | |
Danone SA | | | 1.75 | | | | 12-31-2099 | | | EUR | 2,600,000 | | | | 2,936,111 | |
| | | | |
Sigma Holdings Company BV 144A | | | 5.75 | | | | 5-15-2026 | | | EUR | 1,500,000 | | | | 1,629,616 | |
| | | | |
| | | | | | | | | | | | | | | 4,565,727 | |
| | | | | | | | | | | | | | | | |
|
| Household Products: 0.20% | |
| | | | |
Energizer Gamma Acquisition BV 144A | | | 4.63 | | | | 7-15-2026 | | | EUR | 1,600,000 | | | | 1,842,359 | |
| | | | | | | | | | | | | | | | |
|
Energy: 0.81% | |
|
| Oil, Gas & Consumable Fuels: 0.81% | |
| | | | |
Eni SpA | | | 1.13 | | | | 9-19-2028 | | | EUR | 3,200,000 | | | | 3,798,548 | |
| | | | |
Petroleos Mexicanos | | | 3.75 | | | | 2-21-2024 | | | EUR | 1,000,000 | | | | 1,110,590 | |
| | | | |
Total SA | | | 3.88 | | | | 12-29-2049 | | | EUR | 2,000,000 | | | | 2,406,919 | |
| | | | |
| | | | | | | | | | | | | | | 7,316,057 | |
| | | | | | | | | | | | | | | | |
The accompanying notes are an integral part of these financial statements.
Wells Fargo Core Plus Bond Fund | 17
Portfolio of investments—August 31, 2019
| | | | | | | | | | | | | | | | |
| | | Interest
rate | | | Maturity
date | | | Principal | | | Value | |
Financials: 0.63% | |
|
| Banks: 0.40% | |
| | | | |
Bankia SA | | | 6.00 | % | | | 12-31-2099 | | | EUR | 1,200,000 | | | $ | 1,336,994 | |
| | | | |
Caixa Geral de Depositos SA | | | 10.75 | | | | 12-31-2099 | | | EUR | 1,800,000 | | | | 2,277,308 | |
| | | | |
| | | | | | | | | | | | | | | 3,614,302 | |
| | | | | | | | | | | | | | | | |
|
| Diversified Financial Services: 0.23% | |
| | | | |
LKQ European Holdings BV Company 144A | | | 3.63 | | | | 4-1-2026 | | | EUR | 1,800,000 | | | | 2,095,008 | |
| | | | | | | | | | | | | | | | |
|
Industrials: 0.37% | |
|
| Commercial Services & Supplies: 0.14% | |
| | | | |
Paprec Holding SA 144A | | | 4.00 | | | | 3-31-2025 | | | EUR | 1,200,000 | | | | 1,311,746 | |
| | | | | | | | | | | | | | | | |
|
| Road & Rail: 0.23% | |
| | | | |
Europcar Groupe SA 144A | | | 4.13 | | | | 11-15-2024 | | | EUR | 1,800,000 | | | | 2,077,718 | |
| | | | | | | | | | | | | | | | |
|
Real Estate: 0.06% | |
|
| Real Estate Management & Development: 0.06% | |
| | | | |
ATF Netherlands BV | | | 1.50 | | | | 7-15-2024 | | | EUR | 500,000 | | | | 581,309 | |
| | | | | | | | | | | | | | | | |
| |
Total Foreign Corporate Bonds and Notes (Cost $29,629,594) | | | | 29,056,264 | |
| | | | | | | | | | | | | | | | |
|
| Foreign Government Bonds: 0.68% | |
| | | | |
Brazil | | | 10.00 | | | | 1-1-2025 | | | BRL | 8,600,000 | | | | 2,334,836 | |
| | | | |
Italy Buoni Poliennali del Tesoro | | | 0.05 | | | | 4-15-2021 | | | EUR | 3,500,000 | | | | 3,860,531 | |
| |
Total Foreign Government Bonds (Cost $6,613,239) | | | | 6,195,367 | |
| | | | | | | | | | | | | | | | |
|
Loans: 0.84% | |
|
Communication Services: 0.45% | |
|
| Entertainment: 0.19% | |
| | | | |
Diamond Sports Group LLC (3 Month LIBOR +3.25%)±%%< | | | 5.39 | | | | 8-24-2026 | | | $ | 1,700,000 | | | | 1,700,000 | |
| | | | | | | | | | | | | | | | |
|
| Media: 0.13% | |
| | | | |
Ancestry.com Incorporated (1 Month LIBOR +3.25%)± | | | 5.34 | | | | 10-19-2023 | | | | 1,215,625 | | | | 1,208,027 | |
| | | | | | | | | | | | | | | | |
|
| Wireless Telecommunication Services: 0.13% | |
| | | | |
Sprint Communications Incorporated (1 Month LIBOR +2.50%)± | | | 4.63 | | | | 2-2-2024 | | | | 1,221,875 | | | | 1,213,090 | |
| | | | | | | | | | | | | | | | |
|
Energy: 0.12% | |
|
| Oil, Gas & Consumable Fuels: 0.12% | |
| | | | |
Lucid Energy Group II Borrower LLC (1 Month LIBOR +3.00%)± | | | 5.11 | | | | 2-17-2025 | | | | 1,234,375 | | | | 1,137,168 | |
| | | | | | | | | | | | | | | | |
|
Health Care: 0.13% | |
|
| Health Care Providers & Services: 0.13% | |
| | | | |
Surgery Center Holdings Incorporated (1 Month LIBOR +3.25%)± | | | 5.37 | | | | 9-2-2024 | | | | 1,228,125 | | | | 1,166,719 | |
| | | | | | | | | | | | | | | | |
|
Industrials: 0.14% | |
|
| Communications Equipment: 0.14% | |
| | | | |
Virgin Media Bristol LLC (1 Month LIBOR +2.50%)± | | | 4.70 | | | | 1-15-2026 | | | | 1,250,000 | | | | 1,249,038 | |
| | | | | | | | | | | | | | | | |
| |
Total Loans (Cost $7,859,337) | | | | 7,674,042 | |
| | | | | | | | | | | | | | | | |
The accompanying notes are an integral part of these financial statements.
18 | Wells Fargo Core Plus Bond Fund
Portfolio of investments—August 31, 2019
| | | | | | | | | | | | | | | | |
| | | Interest
rate | | | Maturity
date | | | Principal | | | Value | |
Municipal Obligations: 2.56% | |
|
California: 0.41% | |
|
| Airport Revenue: 0.23% | |
| | | | |
San Jose CA Series B (AGM Insured) | | | 6.60 | % | | | 3-1-2041 | | | $ | 2,000,000 | | | $ | 2,136,180 | |
| | | | | | | | | | | | | | | | |
|
| Transportation Revenue: 0.18% | |
| | | | |
Alameda CA Corridor Transportation Authority CAB Refunding Bond Subordinated Series B (Ambac Insured) ¤ | | | 0.00 | | | | 10-1-2028 | | | | 2,115,000 | | | | 1,619,709 | |
| | | | | | | | | | | | | | | | |
| | | | |
| | | | | | | | | | | | | | | 3,755,889 | |
| | | | | | | | | | | | | | | | |
|
Illinois: 1.31% | |
|
| GO Revenue: 0.93% | |
| | | | |
Chicago IL Series B | | | 5.43 | | | | 1-1-2042 | | | | 1,000,000 | | | | 1,039,170 | |
| | | | |
Cook County IL Series B (Build America Mutual Assurance Company Insured) | | | 6.36 | | | | 11-15-2033 | | | | 1,745,000 | | | | 2,447,712 | |
| | | | |
Illinois Taxable Pension « | | | 5.10 | | | | 6-1-2033 | | | | 3,040,000 | | | | 3,308,250 | |
| | | | |
Will County ILLincoln-Way Community High School District #210 Unrefunded CAB (AGM Insured) ¤ | | | 0.00 | | | | 1-1-2025 | | | | 1,820,000 | | | | 1,620,291 | |
| | | | |
| | | | | | | | | | | | | | | 8,415,423 | |
| | | | | | | | | | | | | | | | |
|
| Tax Revenue: 0.38% | |
| | | | |
Chicago IL Transit Authority Taxable Pension Funding Series A | | | 6.90 | | | | 12-1-2040 | | | | 1,075,000 | | | | 1,553,407 | |
| | | | |
Metropolitan Pier & Exposition Authority Illinois CAB McCormick Place Expansion Project Series2010-B1 (AGM Insured) ¤ | | | 0.00 | | | | 6-15-2026 | | | | 1,975,000 | | | | 1,713,866 | |
| | | | |
Metropolitan Pier & Exposition Authority Illinois CAB McCormick Place Expansion Project Series2012-B ¤ | | | 0.00 | | | | 12-15-2051 | | | | 765,000 | | | | 233,960 | |
| | | | |
| | | | | | | | | | | | | | | 3,501,233 | |
| | | | | | | | | | | | | | | | |
| | | | |
| | | | | | | | | | | | | | | 11,916,656 | |
| | | | | | | | | | | | | | | | |
|
Maryland: 0.11% | |
|
| Education Revenue: 0.11% | |
| | | | |
Maryland Health & HEFAR Green Street Academy Series B 144A | | | 6.75 | | | | 7-1-2023 | | | | 975,000 | | | | 982,118 | |
| | | | | | | | | | | | | | | | |
|
Michigan: 0.19% | |
|
| Miscellaneous Revenue: 0.19% | |
| | | | |
Michigan Finance Authority Local Government Loan Program Project Series E | | | 7.19 | | | | 11-1-2022 | | | | 1,585,000 | | | | 1,713,575 | |
| | | | | | | | | | | | | | | | |
|
Pennsylvania: 0.36% | |
|
| Health Revenue: 0.10% | |
| | | | |
Quakertown PA General Authority USDA Loan Anticipation NotesSeries 2017-B | | | 3.80 | | | | 7-1-2021 | | | | 900,000 | | | | 900,135 | |
| | | | | | | | | | | | | | | | |
|
| Miscellaneous Revenue: 0.26% | |
| | | | |
Commonwealth of Pennsylvania Financing Authority Series A | | | 4.14 | | | | 6-1-2038 | | | | 1,995,000 | | | | 2,353,681 | |
| | | | | | | | | | | | | | | | |
| | | | |
| | | | | | | | | | | | | | | 3,253,816 | |
| | | | | | | | | | | | | | | | |
|
Texas: 0.18% | |
|
| Transportation Revenue: 0.18% | |
| | | | |
North Texas Tollway Authority Build America Bonds Subordinate LienSeries B-2 | | | 8.91 | | | | 2-1-2030 | | | | 1,595,000 | | | | 1,640,075 | |
| | | | | | | | | | | | | | | | |
| |
Total Municipal Obligations (Cost $20,580,389) | | | | 23,262,129 | |
| | | | | | | | | | | | | | | | |
The accompanying notes are an integral part of these financial statements.
Wells Fargo Core Plus Bond Fund | 19
Portfolio of investments—August 31, 2019
| | | | | | | | | | | | | | | | |
| | | Interest
rate | | | Maturity
date | | | Principal | | | Value | |
| Non-Agency Mortgage-Backed Securities: 11.51% | |
| | | | |
American Money Management Corporation Series2015-16A Class AR (3 Month LIBOR +1.26%) 144A± | | | 3.56 | % | | | 4-14-2029 | | | $ | 3,000,000 | | | $ | 3,000,051 | |
| | | | |
Banc of America Commercial Mortgage Securities Incorporated Series2007-1 Class AMFX±± | | | 5.48 | | | | 1-15-2049 | | | | 661,125 | | | | 662,013 | |
| | | | |
Banc of America Funding Corporation Series2016-R1 Class A1 144A±± | | | 2.50 | | | | 3-25-2040 | | | | 645,703 | | | | 644,460 | |
| | | | |
BDS Limited Series2018-FL2 Class A (1 Month LIBOR +0.95%) 144A± | | | 3.15 | | | | 8-15-2035 | | | | 1,728,582 | | | | 1,728,581 | |
| | | | |
Benefit Street Partners CLO Limited Series2014-IVA Class A1RR (3 Month LIBOR +1.25%) 144A± | | | 3.53 | | | | 1-20-2029 | | | | 1,000,000 | | | | 1,000,173 | |
| | | | |
Benefit Street Partners CLO Limited Series2016-10A Class A1R (3 Month LIBOR +1.14%) 144A± | | | 3.44 | | | | 1-15-2029 | | | | 3,500,000 | | | | 3,499,948 | |
| | | | |
Bluemountain CLO Limited Series2012-2A Class AR2 (3 Month LIBOR +1.05%) 144A± | | | 3.19 | | | | 11-20-2028 | | | | 935,000 | | | | 935,006 | |
| | | | |
Bluemountain CLO Limited Series2013-1A Class A1R2 (3 Month LIBOR +1.23%) 144A± | | | 3.51 | | | | 1-20-2029 | | | | 1,935,000 | | | | 1,936,080 | |
| | | | |
Bunker Hill Loan Depositary Trust Series2019-1 Class A1 144A | | | 3.61 | | | | 10-26-2048 | | | | 1,265,577 | | | | 1,278,588 | |
| | | | |
Cascade Funding Mortgage Trust Series 2018- RM2 Class A 144A±± | | | 4.00 | | | | 10-25-2068 | | | | 570,497 | | | | 590,738 | |
| | | | |
CD Commercial Mortgage Trust Series2017-6 Class A5 | | | 3.46 | | | | 11-13-2050 | | | | 1,035,000 | | | | 1,125,741 | |
| | | | |
CIFC Funding Limited Series2012-2RA Class A1 (3 Month LIBOR +0.80%) 144A± | | | 3.08 | | | | 1-20-2028 | | | | 2,525,000 | | | | 2,516,208 | |
| | | | |
CIFC Funding Limited Series2016-1A Class A (3 Month LIBOR +1.48%) 144A± | | | 3.76 | | | | 10-21-2028 | | | | 3,350,000 | | | | 3,353,601 | |
| | | | |
Citigroup Commercial Mortgage Trust 2017-MDRA Class A 144A | | | 3.66 | | | | 7-10-2030 | | | | 2,000,000 | | | | 2,062,779 | |
| | | | |
Colt Funding LLC Series2018-3 Class A1 144A±± | | | 3.69 | | | | 10-26-2048 | | | | 2,018,625 | | | | 2,035,288 | |
| | | | |
Commercial Mortgage Trust Series 2014-CR15 Class A2 | | | 2.93 | | | | 2-10-2047 | | | | 295,009 | | | | 294,898 | |
| | | | |
Credit Suisse First Boston Commercial Mortgage Trust Series1998-C2 Class AX ±±(c) | | | 1.23 | | | | 11-15-2030 | | | | 11,794 | | | | 4 | |
| | | | |
Crown Point Limited Series2015-3A Class A1AR (3 Month LIBOR +0.91%) 144A± | | | 3.21 | | | | 12-31-2027 | | | | 2,500,000 | | | | 2,500,328 | |
| | | | |
Crown Point Limited Series2018-6A Class A1 (3 Month LIBOR +1.17%) 144A± | | | 3.45 | | | | 10-20-2028 | | | | 3,500,000 | | | | 3,499,962 | |
| | | | |
CSAIL Commercial Mortgage Trust Series2015-C4 Class A1 | | | 2.01 | | | | 11-15-2048 | | | | 1,095,789 | | | | 1,092,380 | |
| | | | |
Deephaven Residential Mortgage Series2019-2A Class A1 144A±± | | | 3.56 | | | | 4-25-2059 | | | | 2,661,783 | | | | 2,685,254 | |
| | | | |
Financial Asset Securitization Incorporated Series 1997-NAM2 Class B2 † | | | 8.00 | | | | 7-25-2027 | | | | 20,098 | | | | 1,089 | |
| | | | |
FirstKey Mortgage Trust Series2014-1 Class A2 144A±± | | | 3.00 | | | | 11-25-2044 | | | | 897,064 | | | | 895,233 | |
| | | | |
GCAT Series 2019-NQM1 Class A1 144A | | | 2.99 | | | | 2-25-2059 | | | | 3,971,333 | | | | 3,987,982 | |
| | | | |
Great Wolf Trust Series 2017 Class A (1 Month LIBOR +0.85%) 144A± | | | 3.05 | | | | 9-15-2034 | | | | 2,350,000 | | | | 2,349,226 | |
| | | | |
GS Mortgage Securities Trust Series 2013-KING Class A 144A | | | 2.71 | | | | 12-10-2027 | | | | 4,228,079 | | | | 4,225,707 | |
| | | | |
GS Mortgage Securities Trust Series 2019- PJ1 Class A6 144A±± | | | 4.00 | | | | 8-25-2049 | | | | 1,409,976 | | | | 1,424,276 | |
| | | | |
Homeward Opportunities Fund I Trust Series2019-1 Class A1 144A±± | | | 3.45 | | | | 1-25-2059 | | | | 2,417,812 | | | | 2,441,126 | |
| | | | |
Hospitality Mortgage Trust Series 2019 Class A (1 Month LIBOR +1.00%) 144A± | | | 3.20 | | | | 11-15-2036 | | | | 2,970,000 | | | | 2,967,205 | |
| | | | |
JPMorgan Chase Commercial Mortgage Securities Trust Series 2007-LDPX Class AM±± | | | 5.46 | | | | 1-15-2049 | | | | 143,162 | | | | 142,670 | |
| | | | |
JPMorgan Chase Commercial Mortgage Securities Trust Series2012-C8 Class ASB | | | 2.38 | | | | 10-15-2045 | | | | 2,381,705 | | | | 2,391,745 | |
| | | | |
Lendmark Funding Trust Series2018-1A Class A 144A | | | 3.81 | | | | 12-21-2026 | | | | 2,685,000 | | | | 2,752,601 | |
| | | | |
Lendmark Funding Trust Series2018-2A Class A 144A | | | 4.23 | | | | 4-20-2027 | | | | 600,000 | | | | 625,322 | |
| | | | |
LoanCore Limited Series 2018-CRE1 Class A (1 Month LIBOR +1.13%) 144A± | | | 3.33 | | | | 5-15-2028 | | | | 3,000,000 | | | | 3,002,802 | |
| | | | |
Mach One Trust Commercial Mortgage Backed Series2004-1 Class X 144A±±(c) | | | 0.78 | | | | 5-28-2040 | | | | 69,187 | | | | 0 | |
| | | | |
Mello Warehouse Securitization Series2019-1 Class A (1 Month LIBOR +0.80%) 144A± | | | 2.95 | | | | 6-25-2052 | | | | 3,115,000 | | | | 3,112,242 | |
| | | | |
Metlife Securitization Trust2019-1A Class A1A 144A±± | | | 3.75 | | | | 4-25-2058 | | | | 2,683,414 | | | | 2,796,994 | |
| | | | |
Morgan Stanley Capital I Series2004-RR2 Class X 144A±±(c) | | | 0.35 | | | | 10-28-2033 | | | | 4,769 | | | | 19 | |
| | | | |
Neuberger Berman Limited Series2015-20A Class AR (3 Month LIBOR +0.80%) 144A± | | | 3.10 | | | | 1-15-2028 | | | | 1,575,000 | | | | 1,566,336 | |
The accompanying notes are an integral part of these financial statements.
20 | Wells Fargo Core Plus Bond Fund
Portfolio of investments—August 31, 2019
| | | | | | | | | | | | | | | | |
| | | Interest
rate | | | Maturity
date | | | Principal | | | Value | |
| Non-Agency Mortgage-Backed Securities (continued) | |
| | | | |
New Residential Mortgage Loan Trust Series 2018-NQM1 Class A1 144A±± | | | 3.99 | % | | | 11-25-2048 | | | $ | 2,505,581 | | | $ | 2,551,365 | |
| | | | |
Octagon Investment Partners Series2017-1A Class B1 (3 Month LIBOR +1.70%) 144A± | | | 3.98 | | | | 7-20-2030 | | | | 1,000,000 | | | | 993,176 | |
| | | | |
Palmer Square Loan Funding Limited Series2019-2A Class A1 (3 Month LIBOR +0.97%) 144A± | | | 3.49 | | | | 4-20-2027 | | | | 3,140,000 | | | | 3,139,846 | |
| | | | |
Sound Point CLO Limited Series2013-2RA Class A1 (3 Month LIBOR +0.95%) 144A± | | | 3.25 | | | | 4-15-2029 | | | | 2,825,000 | | | | 2,807,067 | |
| | | | |
Starwood Mortgage Residential Trust Series2019-1 Class A1 144A±± | | | 2.94 | | | | 6-25-2049 | | | | 3,377,825 | | | | 3,385,491 | |
| | | | |
Stonemont Portfolio Trust Series 2017 Class A (1 Month LIBOR +0.85%) 144A± | | | 3.02 | | | | 8-20-2030 | | | | 2,473,715 | | | | 2,472,904 | |
| | | | |
UBS Commercial Mortgage Trust Series2017-C5 Class A5 | | | 3.47 | | | | 11-15-2050 | | | | 1,140,000 | | | | 1,242,868 | |
| | | | |
UBS Commercial Mortgage Trust Series 2018-NYCH Class A (1 Month LIBOR +0.85%) 144A± | | | 3.05 | | | | 2-15-2032 | | | | 2,930,000 | | | | 2,923,603 | |
| | | | |
Verus Securitization Trust Series2019-1 Class A1 144A±± | | | 3.40 | | | | 12-25-2059 | | | | 2,274,234 | | | | 2,295,260 | |
| | | | |
Verus Securitization Trust Series2019-2 Class A1 144A±± | | | 3.21 | | | | 4-25-2059 | | | | 4,634,747 | | | | 4,674,833 | |
| | | | |
Voya CLO Limited Series2015-2A Class AR (3 Month LIBOR +0.97%) 144A± | | | 3.23 | | | | 7-23-2027 | | | | 2,900,000 | | | | 2,897,025 | |
| | | | |
West CLO Limited Series2014-2A Class A1 (3 Month LIBOR +0.87%) 144A± | | | 3.19 | | | | 1-16-2027 | | | | 2,209,448 | | | | 2,204,850 | |
| | | | |
Whitehorse Limited Series2014-1A Class AR (3 Month LIBOR +0.90%) 144A± | | | 3.15 | | | | 5-1-2026 | | | | 1,897,708 | | | | 1,896,306 | |
| |
TotalNon-Agency Mortgage-Backed Securities (Cost $104,235,637) | | | | 104,609,250 | |
| | | | | | | | | | | | | | | | |
|
U.S. Treasury Securities: 8.82% | |
| | | | |
TIPS | | | 1.38 | | | | 2-15-2044 | | | | 3,088,499 | | | | 3,828,810 | |
| | | | |
U.S. Treasury Bond ¤ | | | 0.00 | | | | 11-15-2027 | | | | 1,795,000 | | | | 1,581,893 | |
| | | | |
U.S. Treasury Bond ¤ | | | 0.00 | | | | 5-15-2044 | | | | 9,125,000 | | | | 5,590,899 | |
| | | | |
U.S. Treasury Bond | | | 1.63 | | | | 8-15-2029 | | | | 11,695,000 | | | | 11,827,939 | |
| | | | |
U.S. Treasury Bond | | | 2.25 | | | | 8-15-2049 | | | | 1,050,000 | | | | 1,116,650 | |
| | | | |
U.S. Treasury Bond | | | 2.75 | | | | 11-15-2042 | | | | 4,850,000 | | | | 5,601,182 | |
| | | | |
U.S. Treasury Bond | | | 2.88 | | | | 8-15-2045 | | | | 2,495,000 | | | | 2,962,910 | |
| | | | |
U.S. Treasury Bond | | | 2.88 | | | | 5-15-2049 | | | | 7,745,000 | | | | 9,332,422 | |
| | | | |
U.S. Treasury Bond | | | 3.00 | | | | 8-15-2048 | | | | 6,755,000 | | | | 8,297,831 | |
| | | | |
U.S. Treasury Bond | | | 3.38 | | | | 5-15-2044 | | | | 5,895,000 | | | | 7,558,265 | |
| | | | |
U.S. Treasury Bond | | | 3.75 | | | | 8-15-2041 | | | | 3,965,000 | | | | 5,299,470 | |
| | | | |
U.S. Treasury Bond | | | 4.25 | | | | 11-15-2040 | | | | 4,560,000 | | | | 6,483,928 | |
| | | | |
U.S. Treasury Bond | | | 6.13 | | | | 11-15-2027 | | | | 1,375,000 | | | | 1,868,979 | |
| | | | |
U.S. Treasury Note | | | 1.63 | | | | 8-31-2022 | | | | 465,000 | | | | 467,525 | |
| | | | |
U.S. Treasury Note | | | 2.00 | | | | 10-31-2022 | | | | 8,210,000 | | | | 8,353,034 | |
| |
Total U.S. Treasury Securities (Cost $71,207,716) | | | | 80,171,737 | |
| | | | | | | | | | | | | | | | |
|
Yankee Corporate Bonds and Notes: 8.14% | |
|
Communication Services: 0.90% | |
|
| Diversified Telecommunication Services: 0.19% | |
| | | | |
Telefonica Emisiones SAU | | | 5.21 | | | | 3-8-2047 | | | | 1,485,000 | | | | 1,729,714 | |
| | | | | | | | | | | | | | | | |
|
Interactive Media & Services: 0.36% | |
| | | | |
Tencent Holdings Limited 144A | | | 3.98 | | | | 4-11-2029 | | | | 3,000,000 | | | | 3,257,420 | |
| | | | | | | | | | | | | | | | |
|
Wireless Telecommunication Services: 0.35% | |
| | | | |
British Telecommunication | | | 5.13 | | | | 12-4-2028 | | | | 2,740,000 | | | | 3,172,849 | |
| | | | | | | | | | | | | | | | |
|
Consumer Staples: 0.44% | |
|
| Beverages: 0.21% | |
| | | | |
Coca-Cola Femsa SAB de CV | | | 3.88 | | | | 11-26-2023 | | | | 1,810,000 | | | | 1,925,357 | |
| | | | | | | | | | | | | | | | |
The accompanying notes are an integral part of these financial statements.
Wells Fargo Core Plus Bond Fund | 21
Portfolio of investments—August 31, 2019
| | | | | | | | | | | | | | | | |
| | | Interest
rate | | | Maturity
date | | | Principal | | | Value | |
Tobacco: 0.23% | |
| | | | |
Imperial Brands Finance plc 144A | | | 3.50 | % | | | 7-26-2026 | | | $ | 2,055,000 | | | $ | 2,089,130 | |
| | | | | | | | | | | | | | | | |
Energy: 0.41% | |
|
| Energy Equipment & Services: 0.08% | |
| | | | |
Valaris plc | | | 5.75 | | | | 10-1-2044 | | | | 1,500,000 | | | | 750,000 | |
| | | | | | | | | | | | | | | | |
|
Oil, Gas & Consumable Fuels: 0.33% | |
| | | | |
Comision Federal de Electricidad 144A | | | 4.75 | | | | 2-23-2027 | | | | 1,140,000 | | | | 1,187,036 | |
| | | | |
Encana Corporation | | | 6.50 | | | | 2-1-2038 | | | | 836,000 | | | | 1,018,505 | |
| | | | |
Petroleos Mexicanos | | | 6.50 | | | | 1-23-2029 | | | | 765,000 | | | | 776,475 | |
| | | | |
| | | | | | | | | | | | | | | 2,982,016 | |
| | | | | | | | | | | | | | | | |
|
Financials: 5.57% | |
|
| Banks: 2.93% | |
| | | | |
ABN AMRO Bank NV 144A | | | 4.75 | | | | 7-28-2025 | | | | 1,800,000 | | | | 1,962,572 | |
| | | | |
Banco de Bogota SA 144A | | | 4.38 | | | | 8-3-2027 | | | | 1,110,000 | | | | 1,172,449 | |
| | | | |
Banco do Brasil SA 144A | | | 4.63 | | | | 1-15-2025 | | | | 1,615,000 | | | | 1,685,899 | |
| | | | |
Banco General SA 144A | | | 4.13 | | | | 8-7-2027 | | | | 1,035,000 | | | | 1,077,704 | |
| | | | |
Banco Internacional del Peru SAA Interbank 144A« | | | 3.38 | | | | 1-18-2023 | | | | 1,526,000 | | | | 1,541,260 | |
| | | | |
Banco Mercantil del Norte SA (5 Year Treasury Constant Maturity +4.97%) 144A± | | | 6.75 | | | | 12-31-2099 | | | | 1,565,000 | | | | 1,542,934 | |
| | | | |
Banco Safra SA 144A | | | 4.13 | | | | 2-8-2023 | | | | 1,695,000 | | | | 1,722,544 | |
| | | | |
Banco Santander Mexico (5 Year Treasury Constant Maturity +3.00%) 144A± | | | 5.95 | | | | 10-1-2028 | | | | 1,700,000 | | | | 1,808,392 | |
| | | | |
Banco Santander SA | | | 4.25 | | | | 4-11-2027 | | | | 1,600,000 | | | | 1,733,715 | |
| | | | |
Banistmo SA 144A | | | 3.65 | | | | 9-19-2022 | | | | 1,160,000 | | | | 1,160,012 | |
| | | | |
Banque Ouest Africaine de Developpement 144A | | | 5.00 | | | | 7-27-2027 | | | | 2,520,000 | | | | 2,667,672 | |
| | | | |
BPCE SA 144A | | | 5.15 | | | | 7-21-2024 | | | | 1,725,000 | | | | 1,894,113 | |
| | | | |
Danske Bank 144A | | | 5.38 | | | | 1-12-2024 | | | | 1,705,000 | | | | 1,885,843 | |
| | | | |
Perrigo Finance plc | | | 4.90 | | | | 12-15-2044 | | | | 1,500,000 | | | | 1,476,231 | |
| | | | |
Perrigo Finance Unlimited Company | | | 3.50 | | | | 3-15-2021 | | | | 1,305,000 | | | | 1,311,978 | |
| | | | |
Perrigo Finance Unlimited Company | | | 4.38 | | | | 3-15-2026 | | | | 1,365,000 | | | | 1,405,069 | |
| | | | |
Sumitomo Mitsui Financial Group Incorporated | | | 2.44 | | | | 10-19-2021 | | | | 500,000 | | | | 503,032 | |
| | | | |
| | | | | | | | | | | | | | | 26,551,419 | |
| | | | | | | | | | | | | | | | |
|
| Capital Markets: 0.38% | |
| | | | |
Cadillac Fairview Corporation Limited 144A | | | 4.13 | | | | 2-1-2029 | | | | 1,760,000 | | | | 1,992,008 | |
| | | | |
Credit Suisse Group Funding Limited (3 Month LIBOR +1.20%) 144A± | | | 3.00 | | | | 12-14-2023 | | | | 1,485,000 | | | | 1,505,426 | |
| | | | |
| | | | | | | | | | | | | | | 3,497,434 | |
| | | | | | | | | | | | | | | | |
|
| Diversified Financial Services: 1.38% | |
| | | | |
AerCap Ireland Limited | | | 2.88 | | | | 8-14-2024 | | | | 3,655,000 | | | | 3,666,987 | |
| | | | |
Banco Nacional de Comercio Exterior SNC 144A | | | 4.38 | | | | 10-14-2025 | | | | 2,350,000 | | | | 2,446,938 | |
| | | | |
Corporacion Financiera de Desarrollo SA (3 Month LIBOR +5.61%) 144A± | | | 5.25 | | | | 7-15-2029 | | | | 1,185,000 | | | | 1,275,368 | |
| | | | |
UBS Group Funding Switzerland 144A | | | 3.49 | | | | 5-23-2023 | | | | 1,165,000 | | | | 1,200,389 | |
| | | | |
UBS Group Funding Switzerland AG (5 Year USD Swap +4.87%)± | | | 7.00 | | | | 12-29-2049 | | | | 1,650,000 | | | | 1,806,047 | |
| | | | |
WPP Finance Limited 2010 | | | 3.75 | | | | 9-19-2024 | | | | 2,054,000 | | | | 2,147,284 | |
| | | | |
| | | | | | | | | | | | | | | 12,543,013 | |
| | | | | | | | | | | | | | | | |
|
| Insurance: 0.61% | |
| | | | |
Sompo International Holdings Limited | | | 7.00 | | | | 7-15-2034 | | | | 1,330,000 | | | | 1,811,742 | |
| | | | |
Swiss Re Finance (Luxembourg) SA (5 Year Treasury Constant Maturity +3.58%) 144A± | | | 5.00 | | | | 4-2-2049 | | | | 1,600,000 | | | | 1,764,000 | |
The accompanying notes are an integral part of these financial statements.
22 | Wells Fargo Core Plus Bond Fund
Portfolio of investments—August 31, 2019
| | | | | | | | | | | | | | | | |
| | | Interest
rate | | | Maturity
date | | | Principal | | | Value | |
|
| Insurance (continued) | |
| | | | |
Validus Holdings Limited | | | 8.88 | % | | | 1-26-2040 | | | $ | 1,210,000 | | | $ | 2,001,986 | |
| | | | |
| | | | | | | | | | | | | | | 5,577,728 | |
| | | | | | | | | | | | | | | | |
|
| Thrifts & Mortgage Finance: 0.27% | |
| | | | |
Nationwide Building Society 144A | | | 4.13 | | | | 10-18-2032 | | | | 2,500,000 | | | | 2,484,669 | |
| | | | | | | | | | | | | | | | |
|
Health Care: 0.44% | |
|
| Pharmaceuticals: 0.44% | |
| | | | |
Shire Acquisitions Investment Ireland Limited | | | 2.40 | | | | 9-23-2021 | | | | 2,550,000 | | | | 2,557,905 | |
| | | | |
Teva Pharmaceutical Finance BV | | | 2.20 | | | | 7-21-2021 | | | | 600,000 | | | | 561,750 | |
| | | | |
Teva Pharmaceutical Finance Netherlands III BV « | | | 6.75 | | | | 3-1-2028 | | | | 1,000,000 | | | | 841,650 | |
| | | | |
| | | | | | | | | | | | | | | 3,961,305 | |
| | | | | | | | | | | | | | | | |
| | | | |
Industrials: 0.06% | | | | | | | | | | | | | | | | |
| | | | |
| Transportation Infrastructure: 0.06% | | | | | | | | | | | | |
| | | | |
Mexico City Airport Trust 144A | | | 5.50 | | | | 7-31-2047 | | | | 570,000 | | | | 569,293 | |
| | | | | | | | | | | | | | | | |
| | | | |
Utilities: 0.32% | | | | | | | | | | | | | | | | |
| | | | |
| Electric Utilities: 0.32% | | | | | | | | | | | | |
| | | | |
Western Power Distributions Holdings Limited 144A | | | 7.38 | | | | 12-15-2028 | | | | 2,265,000 | | | | 2,912,609 | |
| | | | | | | | | | | | | | | | |
| | | | |
Total Yankee Corporate Bonds and Notes (Cost $69,531,399) | | | | | | | | | | | | | | | 74,003,956 | |
| | | | | | | | | | | | | | | | |
| | | | |
| Yankee Government Bonds: 3.00% | | | | | | | | | | | | |
| | | | |
Bermuda 144A | | | 3.72 | | | | 1-25-2027 | | | | 995,000 | | | | 1,064,650 | |
| | | | |
Bermuda 144A | | | 4.14 | | | | 1-3-2023 | | | | 1,210,000 | | | | 1,276,562 | |
| | | | |
Federative Republic of Brazil | | | 4.50 | | | | 5-30-2029 | | | | 1,495,000 | | | | 1,579,094 | |
| | | | |
Federative Republic of Brazil | | | 4.63 | | | | 1-13-2028 | | | | 1,795,000 | | | | 1,929,643 | |
| | | | |
Hashemite Kingdom of Jordan | | | 3.00 | | | | 6-30-2025 | | | | 3,000,000 | | | | 3,206,468 | |
| | | | |
Kingdom of Spain 144A | | | 1.45 | | | | 4-30-2029 | | | | 3,350,000 | | | | 4,170,158 | |
| | | | |
Province of Santa Fe 144A | | | 7.00 | | | | 3-23-2023 | | | | 2,000,000 | | | | 1,140,000 | |
| | | | |
Republic of Argentina | | | 6.88 | | | | 4-22-2021 | | | | 1,280,000 | | | | 537,613 | |
| | | | |
Republic of Argentina | | | 6.88 | | | | 1-11-2048 | | | | 1,000,000 | | | | 379,010 | |
| | | | |
Republic of Argentina | | | 7.50 | | | | 4-22-2026 | | | | 1,350,000 | | | | 519,750 | |
| | | | |
Republic of Chile | | | 3.50 | | | | 1-25-2050 | | | | 1,069,000 | | | | 1,219,735 | |
| | | | |
Republic of Kenya 144A | | | 8.25 | | | | 2-28-2048 | | | | 750,000 | | | | 774,269 | |
| | | | |
Republic of Paraguay 144A | | | 5.40 | | | | 3-30-2050 | | | | 1,000,000 | | | | 1,175,000 | |
| | | | |
Republic of Senegal 144A | | | 6.25 | | | | 5-23-2033 | | | | 750,000 | | | | 741,897 | |
| | | | |
Saudi Arabia 144A | | | 4.38 | | | | 4-16-2029 | | | | 2,840,000 | | | | 3,273,884 | |
| | | | |
Ukraine | | | 1.47 | | | | 9-29-2021 | | | | 3,000,000 | | | | 2,994,817 | |
| | | | |
Ukraine 144A | | | 7.38 | | | | 9-25-2032 | | | | 1,200,000 | | | | 1,233,290 | |
| | | | |
Total Yankee Government Bonds (Cost $28,665,002) | | | | | | | | | | | | | | | 27,215,840 | |
| | | | | | | | | | | | | | | | |
| | | | |
| | | | | | | | | | | | | | | | |
| | | Yield | | | | | | Shares | | | | |
| Short-Term Investments: 10.29% | | | | | | | | | | | | |
| | | | |
| Investment Companies: 10.08% | | | | | | | | | | | | |
| | | | |
Securities Lending Cash Investments LLC (l)(r)(u) | | | 2.24 | | | | | | | | 5,226,857 | | | | 5,227,379 | |
| | | | |
Wells Fargo Government Money Market Fund Select Class (l)(u)## | | | 2.04 | | | | | | | | 86,371,118 | | | | 86,371,118 | |
| | | | |
| | | | | | | | | | | | | | | 91,598,497 | |
| | | | | | | | | | | | | | | | |
The accompanying notes are an integral part of these financial statements.
Wells Fargo Core Plus Bond Fund | 23
Portfolio of investments—August 31, 2019
| | | | | | | | | | | | | | | | |
| | | Yield | | | Maturity
date | | | Principal | | | Value | |
| U.S. Treasury Securities: 0.21% | | | | | | | | | | | | |
| | | | |
U.S. Treasury Bill (z)# | | | 1.65 | % | | | 9-12-2019 | | | $ | 1,900,000 | | | $ | 1,899,115 | |
| | | | | | | | | | | | | | | | |
| | | | |
Total Short-Term Investments (Cost $93,497,388) | | | | | | | | | | | | | | | 93,497,612 | |
| | | | | | | | | | | | | | | | |
| | | | | | | | |
| Total investments in securities (Cost $866,078,095) | | | 98.56 | % | | | 895,549,939 | |
| | |
Other assets and liabilities, net | | | 1.44 | | | | 13,104,999 | |
| | | | | | | | |
| Total net assets | | | 100.00 | % | | $ | 908,654,938 | |
| | | | | | | | |
| %% | The security is purchased on a when-issued basis. |
| ± | Variable rate investment. The rate shown is the rate in effect at period end. |
| ±± | The coupon of the security is adjusted based on the principal and interest payments received from the underlying pool of mortgages as well as the credit quality and the actual prepayment speed of the underlying mortgages. |
| (c) | Investment in an interest-only security entitles holders to receive only the interest payments on the underlying mortgages. The principal amount shown is the notional amount of the underlying mortgages. The rate represents the coupon rate. |
| ¤ | The security is issued in zero coupon form with no periodic interest payments. |
| 144A | The security may be resold in transactions exempt from registration, normally to qualified institutional buyers, pursuant to Rule 144A under the Securities Act of 1933. |
| « | All or a portion of this security is on loan. |
| < | All or a portion of the position represents an unfunded loan commitment. |
| † | Non-income-earning security |
| (l) | The issuer of the security is an affiliated person of the Fund as defined in the Investment Company Act of 1940. |
| (r) | The investment is anon-registered investment company purchased with cash collateral received from securities on loan. |
| (u) | The rate represents the7-day annualized yield at period end. |
| ## | All or a portion of this security is segregated for when-issued securities and/or unfunded loans. |
| (z) | Zero coupon security. The rate represents the current yield to maturity. |
| # | All or a portion of this security is segregated as collateral for investments in derivative instruments. |
Abbreviations:
| AGM | Assured Guaranty Municipal |
| CAB | Capital appreciation bond |
| FHLMC | Federal Home Loan Mortgage Corporation |
| FNMA | Federal National Mortgage Association |
| GNMA | Government National Mortgage Association |
| HEFAR | Higher Education Facilities Authority Revenue |
| LIBOR | London Interbank Offered Rate |
| REIT | Real estate investment trust |
| STRIPS | Separate trading of registered interest and principal securities |
| TIPS | Treasury inflation-protected securities |
| TVA | Tennessee Valley Authority |
The accompanying notes are an integral part of these financial statements.
24 | Wells Fargo Core Plus Bond Fund
Portfolio of investments—August 31, 2019
Futures Contracts
| | | | | | | | | | | | | | | | | | | | | | | | |
| Description | | Number of
contracts | | | Expiration
date | | | Notional
cost | | | Notional
value | | | Unrealized
gains | | | Unrealized
losses | |
| | | | | | |
Long | | | | | | | | | | | | | | | | | | | | | | | | |
| | | | | | |
U.S. Ultra Bond | | | 44 | | | | 12-19-2019 | | | $ | 8,570,549 | | | $ | 8,687,250 | | | $ | 116,701 | | | $ | 0 | |
| | | | | | |
U.S. Long Term Bond | | | 50 | | | | 12-19-2019 | | | | 8,173,916 | | | | 8,262,500 | | | | 88,584 | | | | 0 | |
| | | | | | |
10-Year U.S. Treasury Notes | | | 206 | | | | 12-19-2019 | | | | 26,991,366 | | | | 27,134,063 | | | | 142,697 | | | | 0 | |
| | | | | | |
2-Year U.S. Treasury Notes | | | 560 | | | | 12-31-2019 | | | | 120,899,645 | | | | 121,025,625 | | | | 125,980 | | | | 0 | |
| | | | | | |
5-Year U.S. Treasury Notes | | | 943 | | | | 12-31-2019 | | | | 112,725,165 | | | | 113,137,899 | | | | 412,734 | | | | 0 | |
| | | | | | |
Short | | | | | | | | | | | | | | | | | | | | | | | | |
| | | | | | |
Euro-Schatz Futures | | | (45) | | | | 9-6-2019 | | | | (5,551,258 | ) | | | (5,568,390 | ) | | | 0 | | | | (17,132 | ) |
| | | | | | |
Euro-Bund Futures | | | (45) | | | | 9-6-2019 | | | | (8,453,656 | ) | | | (8,857,791 | ) | | | 0 | | | | (404,135 | ) |
| | | | | | |
Euro-BOBL Futures | | | (85) | | | | 9-6-2019 | | | | (12,501,229 | ) | | | (12,726,500 | ) | | | 0 | | | | (225,271 | ) |
| | | | | | | | | | | | | | | | | | | | | | | | |
| | | | | | |
| | | | | | | | | | | | | | | | | | $ | 886,696 | | | $ | (646,538 | ) |
| | | | | | | | | | | | | | | | | | | | | | | | |
Forward Foreign Currency Contracts
| | | | | | | | | | | | | | |
Currency to be
received | | Currency to be
delivered | | Counterparty | | Settlement
date | | Unrealized
gains | | | Unrealized
losses | |
| | | | | |
| 2,799,140 USD | | 4,000,000 AUD | | Citibank | | 9-30-2019 | | $ | 103,147 | | | $ | 0 | |
| | | | | |
| 1,418,272 USD | | 1,900,000 CAD | | Citibank | | 9-30-2019 | | | 0 | | | | (9,424 | ) |
| | | | | |
| 36,297,847 USD | | 32,000,500 EUR | | Citibank | | 9-30-2019 | | | 1,055,502 | | | | 0 | |
| | | | | |
| 5,467,750 PLN | | 1,250,000 EUR | | Citibank | | 9-30-2019 | | | 0 | | | | (2,509 | ) |
| | | | | |
| 16,443,973 USD | | 14,520,000 EUR | | Citibank | | 9-30-2019 | | | 453,008 | | | | 0 | |
| | | | | |
| 11,012,720 EUR | | 12,319,743 USD | | Citibank | | 9-30-2019 | | | 0 | | | | (191,367 | ) |
| | | | | |
| 314,000,000 JPY | | 2,928,749 USD | | Citibank | | 9-30-2019 | | | 32,694 | | | | 0 | |
| | | | | |
| 1,250,000 EUR | | 5,388,125 PLN | | Citibank | | 9-30-2019 | | | 22,519 | | | | 0 | |
| | | | | | | | | | | | | | |
| | | | | |
| | | | | | | | $ | 1,666,870 | | | $ | (203,300 | ) |
| | | | | | | | | | | | | | |
Centrally Cleared Credit Default Swaps
| | | | | | | | | | | | | | | | | | | | | | | | | | | | | | | | |
| Reference index | | Fixed rate
received | | | Payment
frequency | | | Maturity
date | | | Notional
amount | | | Value | | | Premiums
paid | | | Unrealized
gains | | | Unrealized
losses | |
| | | | | | | | |
Sell protection | | | | | | | | | | | | | | | | | | | | | | | | | | | | | | | | |
| | | | | | | | |
Markit iTraxx Europe Index | | | 1.00 | % | | | Quarterly | | | | 12-20-2023 | | | | 4,000,000 EUR | | | $ | 107,432 | | | $ | 63,471 | | | $ | 43,961 | | | $ | 0 | |
The accompanying notes are an integral part of these financial statements.
Wells Fargo Core Plus Bond Fund | 25
Portfolio of investments—August 31, 2019
Investments in Affiliates
An affiliated investment is an investment in which the Fund owns at least 5% of the outstanding voting shares of the issuer or as a result of other relationships, such as the Fund and the issuer having the same investment manager. Transactions with issuers that were either affiliated persons of the Fund at the beginning of the period or the end of the period were as follows:
| | | | | | | | | | | | | | | | | | | | | | | | | | | | | | | | | | | | |
| | | Shares,
beginning of
period | | | Shares
purchased | | | Shares
sold | | | Shares,
end of
period | | | Net
realized
gains
(losses) | | | Net
change in
unrealized
gains
(losses) | | | Income
from
affiliated
securities | | | Value,
end
of period | | | % of
net
assets | |
Short-Term Investments | | | | | | | | | | | | | | | | | | | | | | | | | | | | | | | | | | | | |
Investment Companies | | | | | | | | | | | | | | | | | | | | | | | | | | | | | | | | | | | | |
Securities Lending Cash Investments LLC | | | 892,078 | | | | 68,561,536 | | | | 64,226,757 | | | | 5,226,857 | | | $ | 785 | | | $ | 2 | | | $ | 83,731 | # | | $ | 5,227,379 | | | | | |
Wells Fargo Government Money Market Fund Select Class | | | 25,332,190 | | | | 458,472,662 | | | | 397,433,734 | | | | 86,371,118 | | | | 0 | | | | 0 | | | | 988,148 | | | | 86,371,118 | | | | | |
| | | | | | | | | | | | | | | | | | | | | | | | | | | | | | | | | | | | |
| | | | | | | | | | | | | | | | | | $ | 785 | | | $ | 2 | | | $ | 1,071,879 | | | $ | 91,598,497 | | | | 10.08 | % |
| | | | | | | | | | | | | | | | | | | | | | | | | | | | | | | | | | | | |
| # | Amount shown represents income before fees and rebates. |
The accompanying notes are an integral part of these financial statements.
26 | Wells Fargo Core Plus Bond Fund
Statement of assets and liabilities—August 31, 2019
| | | | |
| | | | |
| |
Assets | | | | |
Investments in unaffiliated securities (including $5,085,539 of securities loaned), at value (cost $774,479,660) | | $ | 803,951,442 | |
Investments in affiliated securities, at value (cost $91,598,435) | | | 91,598,497 | |
Cash | | | 2,784,697 | |
Cash at broker segregated for centrally cleared swaps | | | 33,581 | |
Principal paydown receivable | | | 60 | |
Receivable for investments sold | | | 3,231,473 | |
Receivable for interest | | | 5,429,044 | |
Receivable for Fund shares sold | | | 23,556,948 | |
Receivable for daily variation margin on open futures contracts | | | 166,182 | |
Receivable for securities lending income, net | | | 5,304 | |
Unrealized gains on forward foreign currency contracts | | | 1,666,870 | |
Prepaid expenses and other assets | | | 281,862 | |
| | | | |
Total assets | | | 932,705,960 | |
| | | | |
| |
Liabilities | | | | |
Payable for investments purchased | | | 16,463,533 | |
Payable for Fund shares redeemed | | | 702,084 | |
Unrealized losses on forward foreign currency contracts | | | 203,300 | |
Payable upon receipt of securities loaned | | | 5,225,665 | |
Cash collateral due to broker for forward foreign currency contracts | | | 990,000 | |
Payable for daily variation margin on centrally cleared swaps | | | 1,224 | |
Management fee payable | | | 214,852 | |
Distribution fee payable | | | 12,058 | |
Administration fees payable | | | 79,016 | |
Trustees’ fees and expenses payable | | | 4,221 | |
Accrued expenses and other liabilities | | | 155,069 | |
| | | | |
Total liabilities | | | 24,051,022 | |
| | | | |
Total net assets | | $ | 908,654,938 | |
| | | | |
| |
Net assets consist of | | | | |
Paid-in capital | | $ | 868,864,345 | |
Total distributable earnings | | | 39,790,593 | |
| | | | |
Total net assets | | $ | 908,654,938 | |
| | | | |
| |
Computation of net asset value and offering price per share | | | | |
Net assets – Class A | | $ | 245,879,154 | |
Shares outstanding – Class A1 | | | 18,777,779 | |
Net asset value per share – Class A | | | $13.09 | |
Maximum offering price per share – Class A2 | | | $13.71 | |
Net assets – Class C | | $ | 18,194,512 | |
Shares outstanding – Class C1 | | | 1,389,890 | |
Net asset value per share – Class C | | | $13.09 | |
Net assets – Class R6 | | $ | 62,521,940 | |
Shares outstanding – Class R61 | | | 4,767,488 | |
Net asset value per share – Class R6 | | | $13.11 | |
Net assets – Administrator Class | | $ | 57,316,117 | |
Shares outstanding – Administrator Class1 | | | 4,384,283 | |
Net asset value per share – Administrator Class | | | $13.07 | |
Net assets – Institutional Class | | $ | 524,743,215 | |
Shares outstanding – Institutional Class1 | | | 40,028,553 | |
Net asset value per share – Institutional Class | | | $13.11 | |
| 1 | The Fund has an unlimited number of authorized shares. |
| 2 | Maximum offering price is computed as 100/95.50 of net asset value. On investments of $50,000 or more, the offering price is reduced. |
The accompanying notes are an integral part of these financial statements.
Wells Fargo Core Plus Bond Fund | 27
Statement of operations—year ended August 31, 2019
| | | | |
| | | | |
| |
Investment income | | | | |
Interest (net of foreign interest withholding taxes of $20,071) | | $ | 22,699,350 | |
Income from affiliated securities | | | 1,018,552 | |
Dividends | | | 416,207 | |
| | | | |
Total investment income | | | 24,134,109 | |
| | | | |
| |
Expenses | | | | |
Management fee | | | 2,893,135 | |
Administration fees | |
Class A | | | 370,862 | |
Class C | | | 28,667 | |
Class R6 | | | 16,025 | |
Administrator Class | | | 26,854 | |
Institutional Class | | | 257,145 | |
Shareholder servicing fees | |
Class A | | | 579,472 | |
Class C | | | 44,792 | |
Administrator Class | | | 67,136 | |
Distribution fee | |
Class C | | | 134,357 | |
Custody and accounting fees | | | 59,834 | |
Professional fees | | | 67,962 | |
Registration fees | | | 99,725 | |
Shareholder report expenses | | | 90,749 | |
Trustees’ fees and expenses | | | 21,592 | |
Other fees and expenses | | | 13,951 | |
| | | | |
Total expenses | | | 4,772,258 | |
Less: Fee waivers and/or expense reimbursements | | | | |
Fund-level | | | (1,157,708 | ) |
Class A | | | (3,963 | ) |
Class C | | | (403 | ) |
Class R6 | | | (545 | ) |
Administrator Class | | | (13,584 | ) |
| | | | |
Net expenses | | | 3,596,055 | |
| | | | |
Net investment income | | | 20,538,054 | |
| | | | |
| |
Realized and unrealized gains (losses) on investments | | | | |
Net realized gains (losses) on | |
Unaffiliated securities | | | (645,162 | ) |
Affiliated securities | | | 785 | |
Futures contracts | | | 6,932,831 | |
Forward foreign currency contracts | | | 1,897,442 | |
Credit default swap contracts | | | 401,568 | |
| | | | |
Net realized gains on investments | | | 8,587,464 | |
| | | | |
| |
Net change in unrealized gains (losses) on | | | | |
Unaffiliated securities | | | 35,477,343 | |
Affiliated securities | | | 2 | |
Futures contracts | | | 338,049 | |
Forward foreign currency contracts | | | 1,378,735 | |
Credit default swap contracts | | | 76,197 | |
| | | | |
Net change in unrealized gains (losses) on investments | | | 37,270,326 | |
| | | | |
Net realized and unrealized gains (losses) on investments | | | 45,857,790 | |
| | | | |
Net increase in net assets resulting from operations | | $ | 66,395,844 | |
| | | | |
The accompanying notes are an integral part of these financial statements.
28 | Wells Fargo Core Plus Bond Fund
Statement of changes in net assets
| | | | | | | | | | | | | | | | |
| | | Year ended
August 31, 2019 | | | Year ended
August 31, 20181 | |
| | | | |
Operations | | | | | | | | | | | | | | | | |
Net investment income | | | | | | $ | 20,538,054 | | | | | | | $ | 16,082,992 | |
Net realized gains (losses) on investments | | | | | | | 8,587,464 | | | | | | | | (2,470,659 | ) |
Net change in unrealized gains (losses) on investments | | | | | | | 37,270,326 | | | | | | | | (17,907,347 | ) |
| | | | |
Net increase (decrease) in net assets resulting from operations | | | | | | | 66,395,844 | | | | | | | | (4,295,014 | ) |
| | | | |
| | | | |
Distributions to shareholders from net investment income and net realized gains | | | | | | | | | | | | | | | | |
Class A | | | | | | | (6,574,947 | ) | | | | | | | (6,592,901 | ) |
Class C | | | | | | | (370,804 | ) | | | | | | | (396,945 | ) |
Class R6 | | | | | | | (1,715,047 | ) | | | | | | | (1,205,963 | ) |
Administrator Class | | | | | | | (771,693 | ) | | | | | | | (1,057,877 | ) |
Institutional Class | | | | | | | (10,270,164 | ) | | | | | | | (7,080,934 | ) |
| | | | |
Total distributions to shareholders | | | | | | | (19,702,655 | ) | | | | | | | (16,334,620 | ) |
| | | | |
| | | | |
Capital share transactions | | | Shares | | | | | | | | Shares | | | | | |
Proceeds from shares sold | | | | | | | | | | | | | | | | |
Class A | | | 2,680,470 | | | | 33,438,451 | | | | 3,153,880 | | | | 39,493,506 | |
Class C | | | 481,331 | | | | 6,064,332 | | | | 574,528 | | | | 7,177,070 | |
Class R6 | | | 1,501,220 | | | | 18,804,815 | | | | 1,231,456 | | | | 15,394,192 | |
Administrator Class | | | 3,315,239 | | | | 42,606,846 | | | | 1,331,903 | | | | 16,514,724 | |
Institutional Class | | | 29,266,462 | | | | 369,237,004 | | | | 15,277,371 | | | | 190,922,160 | |
| | | | |
| | | | | | | 470,151,448 | | | | | | | | 269,501,652 | |
| | | | |
Reinvestment of distributions | | | | | | | | | | | | | | | | |
Class A | | | 489,790 | | | | 6,110,716 | | | | 490,954 | | | | 6,097,803 | |
Class C | | | 27,365 | | | | 340,533 | | | | 29,298 | | | | 363,379 | |
Class R6 | | | 108,554 | | | | 1,359,721 | | | | 81,463 | | | | 1,012,889 | |
Administrator Class | | | 61,503 | | | | 767,914 | | | | 84,932 | | | | 1,053,385 | |
Institutional Class | | | 744,184 | | | | 9,339,392 | | | | 530,646 | | | | 6,583,306 | |
| | | | |
| | | | | | | 17,918,276 | | | | | | | | 15,110,762 | |
| | | | |
Payment for shares redeemed | | | | | | | | | | | | | | | | |
Class A | | | (3,117,801 | ) | | | (38,772,694 | ) | | | (5,034,990 | ) | | | (62,673,141 | ) |
Class C | | | (794,733 | ) | | | (9,880,274 | ) | | | (426,093 | ) | | | (5,284,028 | ) |
Class R6 | | | (518,426 | ) | | | (6,649,954 | ) | | | (107,920 | ) | | | (1,336,675 | ) |
Administrator Class | | | (1,625,234 | ) | | | (20,018,219 | ) | | | (2,078,726 | ) | | | (25,750,208 | ) |
Institutional Class | | | (11,506,592 | ) | | | (142,716,810 | ) | | | (7,127,474 | ) | | | (88,356,112 | ) |
| | | | |
| | | | | | | (218,037,951 | ) | | | | | | | (183,400,164 | ) |
| | | | |
Net increase in net assets resulting from capital share transactions | | | | | | | 270,031,773 | | | | | | | | 101,212,250 | |
| | | | |
Total increase in net assets | | | | | | | 316,724,962 | | | | | | | | 80,582,616 | |
| | | | |
| | | | |
Net assets | | | | | | | | | | | | | | | | |
Beginning of period | | | | | | | 591,929,976 | | | | | | | | 511,347,360 | |
| | | | |
End of period | | | | | | $ | 908,654,938 | | | | | | | $ | 591,929,976 | |
| | | | |
| 1 | Effective for all filings after November 4, 2018, the SEC prospectively eliminated the requirement to parenthetically disclose undistributed net investment income at the end of the period and permitted the aggregation of distributions, with the exception of tax basis returns of capital. Undistributed net investment income at August 31, 2018 was $2,094,155. The disaggregated distributions information for the year ended August 31, 2018 is included in Note9, Distributions to Shareholders, in the notes to the financial statements. |
The accompanying notes are an integral part of these financial statements.
Wells Fargo Core Plus Bond Fund | 29
Financial highlights
(For a share outstanding throughout each period)
| | | | | | | | | | | | | | | | | | | | |
| | | Year ended August 31 | |
| CLASS A | | 2019 | | | 2018 | | | 2017 | | | 2016 | | | 2015 | |
Net asset value, beginning of period | | | $12.27 | | | | $12.71 | | | | $12.70 | | | | $12.14 | | | | $12.24 | |
Net investment income | | | 0.37 | | | | 0.34 | | | | 0.36 | 1 | | | 0.33 | | | | 0.21 | 1 |
Net realized and unrealized gains (losses) on investments | | | 0.80 | | | | (0.45 | ) | | | (0.01 | ) | | | 0.60 | | | | (0.08 | ) |
| | | | | | | | | | | | | | | | | | | | |
Total from investment operations | | | 1.17 | | | | (0.11 | ) | | | 0.35 | | | | 0.93 | | | | 0.13 | |
Distributions to shareholders from | | | | | | | | | | | | | | | | | | | | |
Net investment income | | | (0.35 | ) | | | (0.33 | ) | | | (0.33 | ) | | | (0.33 | ) | | | (0.21 | ) |
Net realized gains | | | 0.00 | | | | 0.00 | | | | (0.01 | ) | | | (0.04 | ) | | | (0.02 | ) |
| | | | | | | | | | | | | | | | | | | | |
Total distributions to shareholders | | | (0.35 | ) | | | (0.33 | ) | | | (0.34 | ) | | | (0.37 | ) | | | (0.23 | ) |
Net asset value, end of period | | | $13.09 | | | | $12.27 | | | | $12.71 | | | | $12.70 | | | | $12.14 | |
Total return2 | | | 9.74 | % | | | (0.84 | )% | | | 2.78 | % | | | 7.78 | % | | | 1.04 | % |
Ratios to average net assets (annualized) | | | | | | | | | | | | | | | | | | | | |
Gross expenses | | | 0.91 | % | | | 0.92 | % | | | 0.93 | % | | | 0.93 | % | | | 0.91 | % |
Net expenses | | | 0.73 | % | | | 0.73 | % | | | 0.76 | % | | | 0.84 | % | | | 0.84 | % |
Net investment income | | | 2.99 | % | | | 2.63 | % | | | 2.88 | % | | | 2.76 | % | | | 1.69 | % |
Supplemental data | | | | | | | | | | | | | | | | | | | | |
Portfolio turnover rate | | | 89 | % | | | 148 | % | | | 199 | % | | | 288 | % | | | 322 | % |
Net assets, end of period (000s omitted) | | | $245,879 | | | | $229,688 | | | | $255,668 | | | | $349,852 | | | | $223,755 | |
| 1 | Calculated based upon average shares outstanding |
| 2 | Total return calculations do not include any sales charges. |
The accompanying notes are an integral part of these financial statements.
30 | Wells Fargo Core Plus Bond Fund
Financial highlights
(For a share outstanding throughout each period)
| | | | | | | | | | | | | | | | | | | | |
| | | Year ended August 31 | |
| CLASS C | | 2019 | | | 2018 | | | 2017 | | | 2016 | | | 2015 | |
Net asset value, beginning of period | | | $12.26 | | | | $12.71 | | | | $12.70 | | | | $12.14 | | | | $12.23 | |
Net investment income | | | 0.28 | | | | 0.23 | | | | 0.26 | | | | 0.24 | 1 | | | 0.12 | 1 |
Net realized and unrealized gains (losses) on investments | | | 0.81 | | | | (0.44 | ) | | | (0.01 | ) | | | 0.59 | | | | (0.08 | ) |
| | | | | | | | | | | | | | | | | | | | |
Total from investment operations | | | 1.09 | | | | (0.21 | ) | | | 0.25 | | | | 0.83 | | | | 0.04 | |
Distributions to shareholders from | | | | | | | | | | | | | | | | | | | | |
Net investment income | | | (0.26 | ) | | | (0.24 | ) | | | (0.23 | ) | | | (0.23 | ) | | | (0.11 | ) |
Net realized gains | | | 0.00 | | | | 0.00 | | | | (0.01 | ) | | | (0.04 | ) | | | (0.02 | ) |
| | | | | | | | | | | | | | | | | | | | |
Total distributions to shareholders | | | (0.26 | ) | | | (0.24 | ) | | | (0.24 | ) | | | (0.27 | ) | | | (0.13 | ) |
Net asset value, end of period | | | $13.09 | | | | $12.26 | | | | $12.71 | | | | $12.70 | | | | $12.14 | |
Total return2 | | | 8.91 | % | | | (1.66 | )% | | | 2.01 | % | | | 6.99 | % | | | 0.35 | % |
Ratios to average net assets (annualized) | | | | | | | | | | | | | | | | | | | | |
Gross expenses | | | 1.66 | % | | | 1.67 | % | | | 1.68 | % | | | 1.68 | % | | | 1.66 | % |
Net expenses | | | 1.48 | % | | | 1.48 | % | | | 1.51 | % | | | 1.59 | % | | | 1.59 | % |
Net investment income | | | 2.25 | % | | | 1.89 | % | | | 2.12 | % | | | 2.00 | % | | | 0.95 | % |
Supplemental data | | | | | | | | | | | | | | | | | | | | |
Portfolio turnover rate | | | 89 | % | | | 148 | % | | | 199 | % | | | 288 | % | | | 322 | % |
Net assets, end of period (000s omitted) | | | $18,195 | | | | $20,550 | | | | $19,036 | | | | $21,216 | | | | $20,381 | |
| 1 | Calculated based upon average shares outstanding |
| 2 | Total return calculations do not include any sales charges. |
The accompanying notes are an integral part of these financial statements.
Wells Fargo Core Plus Bond Fund | 31
Financial highlights
(For a share outstanding throughout each period)
| | | | | | | | | | | | |
| | | Year ended August 31 | |
| CLASS R6 | | 2019 | | | 2018 | | | 20171 | |
Net asset value, beginning of period | | | $12.28 | | | | $12.73 | | | | $12.59 | |
Net investment income | | | 0.41 | | | | 0.39 | | | | 0.33 | 2 |
Net realized and unrealized gains (losses) on investments | | | 0.82 | | | | (0.46 | ) | | | 0.12 | |
| | | | | | | | | | | | |
Total from investment operations | | | 1.23 | | | | (0.07 | ) | | | 0.45 | |
Distributions to shareholders from | | | | | | | | | | | | |
Net investment income | | | (0.40 | ) | | | (0.38 | ) | | | (0.30 | ) |
Net realized gains | | | 0.00 | | | | 0.00 | | | | (0.01 | ) |
| | | | | | | | | | | | |
Total distributions to shareholders | | | (0.40 | ) | | | (0.38 | ) | | | (0.31 | ) |
Net asset value, end of period | | | $13.11 | | | | $12.28 | | | | $12.73 | |
Total return3 | | | 10.14 | % | | | (0.55 | )% | | | 3.64 | % |
Ratios to average net assets (annualized) | | | | | | | | | | | | |
Gross expenses | | | 0.53 | % | | | 0.54 | % | | | 0.55 | % |
Net expenses | | | 0.35 | % | | | 0.35 | % | | | 0.35 | % |
Net investment income | | | 3.36 | % | | | 3.05 | % | | | 3.12 | % |
Supplemental data | | | | | | | | | | | | |
Portfolio turnover rate | | | 89 | % | | | 148 | % | | | 199 | % |
Net assets, end of period (000s omitted) | | | $62,522 | | | | $45,159 | | | | $31,451 | |
| 1 | For the period from October 31, 2016 (commencement of class operations) to August 31, 2017 |
| 2 | Calculated based upon average shares outstanding |
| 3 | Returns for periods of less than one year are not annualized. |
The accompanying notes are an integral part of these financial statements.
32 | Wells Fargo Core Plus Bond Fund
Financial highlights
(For a share outstanding throughout each period)
| | | | | | | | | | | | | | | | | | | | |
| | | Year ended August 31 | |
| ADMINISTRATOR CLASS | | 2019 | | | 2018 | | | 2017 | | | 2016 | | | 2015 | |
Net asset value, beginning of period | | | $12.25 | | | | $12.69 | | | | $12.68 | | | | $12.12 | | | | $12.22 | |
Net investment income | | | 0.38 | | | | 0.35 | | | | 0.37 | | | | 0.34 | | | | 0.22 | |
Net realized and unrealized gains (losses) on investments | | | 0.81 | | | | (0.44 | ) | | | (0.01 | ) | | | 0.60 | | | | (0.08 | ) |
| | | | | | | | | | | | | | | | | | | | |
Total from investment operations | | | 1.19 | | | | (0.09 | ) | | | 0.36 | | | | 0.94 | | | | 0.14 | |
Distributions to shareholders from | | | | | | | | | | | | | | | | | | | | |
Net investment income | | | (0.37 | ) | | | (0.35 | ) | | | (0.34 | ) | | | (0.34 | ) | | | (0.22 | ) |
Net realized gains | | | 0.00 | | | | 0.00 | | | | (0.01 | ) | | | (0.04 | ) | | | (0.02 | ) |
| | | | | | | | | | | | | | | | | | | | |
Total distributions to shareholders | | | (0.37 | ) | | | (0.35 | ) | | | (0.35 | ) | | | (0.38 | ) | | | (0.24 | ) |
Net asset value, end of period | | | $13.07 | | | | $12.25 | | | | $12.69 | | | | $12.68 | | | | $12.12 | |
Total return | | | 9.88 | % | | | (0.74 | )% | | | 2.90 | % | | | 7.92 | % | | | 1.15 | % |
Ratios to average net assets (annualized) | | | | | | | | | | | | | | | | | | | | |
Gross expenses | | | 0.85 | % | | | 0.86 | % | | | 0.87 | % | | | 0.87 | % | | | 0.85 | % |
Net expenses | | | 0.62 | % | | | 0.62 | % | | | 0.66 | % | | | 0.72 | % | | | 0.72 | % |
Net investment income | | | 3.07 | % | | | 2.74 | % | | | 2.97 | % | | | 2.84 | % | | | 1.82 | % |
Supplemental data | | | | | | | | | | | | | | | | | | | | |
Portfolio turnover rate | | | 89 | % | | | 148 | % | | | 199 | % | | | 288 | % | | | 322 | % |
Net assets, end of period (000s omitted) | | | $57,316 | | | | $32,241 | | | | $41,806 | | | | $71,133 | | | | $85,431 | |
The accompanying notes are an integral part of these financial statements.
Wells Fargo Core Plus Bond Fund | 33
Financial highlights
(For a share outstanding throughout each period)
| | | | | | | | | | | | | | | | | | | | |
| | | Year ended August 31 | |
| INSTITUTIONAL CLASS | | 2019 | | | 2018 | | | 2017 | | | 2016 | | | 2015 | |
Net asset value, beginning of period | | | $12.28 | | | | $12.72 | | | | $12.71 | | | | $12.15 | | | | $12.24 | |
Net investment income | | | 0.39 | | | | 0.37 | 1 | | | 0.38 | | | | 0.36 | | | | 0.24 | 1 |
Net realized and unrealized gains (losses) on investments | | | 0.83 | | | | (0.44 | ) | | | 0.01 | | | | 0.60 | | | | (0.07 | ) |
| | | | | | | | | | | | | | | | | | | | |
Total from investment operations | | | 1.22 | | | | (0.07 | ) | | | 0.39 | | | | 0.96 | | | | 0.17 | |
Distributions to shareholders from | | | | | | | | | | | | | | | | | | | | |
Net investment income | | | (0.39 | ) | | | (0.37 | ) | | | (0.37 | ) | | | (0.36 | ) | | | (0.24 | ) |
Net realized gains | | | 0.00 | | | | 0.00 | | | | (0.01 | ) | | | (0.04 | ) | | | (0.02 | ) |
| | | | | | | | | | | | | | | | | | | | |
Total distributions to shareholders | | | (0.39 | ) | | | (0.37 | ) | | | (0.38 | ) | | | (0.40 | ) | | | (0.26 | ) |
Net asset value, end of period | | | $13.11 | | | | $12.28 | | | | $12.72 | | | | $12.71 | | | | $12.15 | |
Total return | | | 10.17 | % | | | (0.52 | )% | | | 3.10 | % | | | 8.05 | % | | | 1.37 | % |
Ratios to average net assets (annualized) | | | | | | | | | | | | | | | | | | | | |
Gross expenses | | | 0.58 | % | | | 0.59 | % | | | 0.60 | % | | | 0.60 | % | | | 0.58 | % |
Net expenses | | | 0.40 | % | | | 0.40 | % | | | 0.44 | % | | | 0.58 | % | | | 0.58 | % |
Net investment income | | | 3.29 | % | | | 3.00 | % | | | 3.17 | % | | | 3.04 | % | | | 1.95 | % |
Supplemental data | | | | | | | | | | | | | | | | | | | | |
Portfolio turnover rate | | | 89 | % | | | 148 | % | | | 199 | % | | | 288 | % | | | 322 | % |
Net assets, end of period (000s omitted) | | | $524,743 | | | | $264,292 | | | | $163,387 | | | | $79,687 | | | | $54,419 | |
| 1 | Calculated based upon average shares outstanding |
The accompanying notes are an integral part of these financial statements.
34 | Wells Fargo Core Plus Bond Fund
Notes to financial statements
1. ORGANIZATION
Wells Fargo Funds Trust (the “Trust”), a Delaware statutory trust organized on March 10, 1999, is anopen-end management investment company registered under the Investment Company Act of 1940, as amended (the “1940 Act”). As an investment company, the Trust follows the accounting and reporting guidance in Financial Accounting Standards Board (“FASB”)Accounting Standards Codification Topic 946, Financial Services – Investment Companies. These financial statements report on the Wells Fargo Core Plus Bond Fund (the “Fund”) which is a diversified series of the Trust.
2. SIGNIFICANT ACCOUNTING POLICIES
The following significant accounting policies, which are consistently followed in the preparation of the financial statements of the Fund, are in conformity with U.S. generally accepted accounting principles which require management to make estimates and assumptions that affect the reported amounts of assets and liabilities, disclosure of contingent assets and liabilities at the date of the financial statements, and the reported amounts of revenues and expenses during the reporting period. Actual results could differ from those estimates.
Securities valuation
All investments are valued each business day as of the close of regular trading on the New York Stock Exchange (generally 4 p.m. Eastern Time), although the Fund may deviate from this calculation time under unusual or unexpected circumstances.
Debt securities are valued at the evaluated bid price provided by an independent pricing service (e.g. taking into account various factors, including yields, maturities, or credit ratings) or, if a reliable price is not available, the quoted bid price from an independent broker-dealer.
Equity securities and futures contracts that are listed on a foreign or domestic exchange or market are valued at the official closing price or, if none, the last sales price. If no sale occurs on the principal exchange or market that day, a fair value price will be determined in accordance with the Fund’s Valuation Procedures.
Swap contracts are valued at the evaluated price provided by an independent pricing service or, if a reliable price is not available, the quoted bid price from an independent broker-dealer.
Forward foreign currency contracts are recorded at the forward rate provided by an independent foreign currency pricing source at a time each business day specified by the Wells Fargo Asset Management Pricing Committee at Wells Fargo Funds Management, LLC (“Funds Management”).
The values of securities denominated in foreign currencies are translated into U.S. dollars at rates provided by an independent foreign currency pricing source at a time each business day specified by the Wells Fargo Asset Management Pricing Committee.
Investments in registeredopen-end investment companies are valued at net asset value. Interests innon-registered investment companies that are redeemable at net asset value are fair valued normally at net asset value.
Investments which are not valued using any of the methods discussed above are valued at their fair value, as determined in good faith by the Board of Trustees of the Fund. The Board of Trustees has established a Valuation Committee comprised of the Trustees and has delegated to it the authority to take any actions regarding the valuation of portfolio securities that the Valuation Committee deems necessary or appropriate, including determining the fair value of portfolio securities, unless the determination has been delegated to the Wells Fargo Asset Management Pricing Committee.The Board of Trustees retains the authority to make or ratify any valuation decisions or approve any changes to the Valuation Procedures as it deems appropriate. On a quarterly basis, the Board of Trustees receives reports on any valuation actions taken by the Valuation Committee or the Wells Fargo Asset Management Pricing Committee which may include items for ratification.
Foreign currency translation
The accounting records of the Fund are maintained in U.S. dollars. The values of other assets and liabilities denominated in foreign currencies are translated into U.S. dollars at rates provided by an independent foreign currency pricing source at a time each business day specified by the Wells Fargo Asset Management Pricing Committee. Purchases and sales of securities, and income and expenses are converted at the rate of exchange on the respective dates of such transactions. Net realized foreign exchange gains or losses arise from sales of foreign currencies, currency gains or losses realized between the trade and settlement dates on securities transactions, and the difference between the amounts of dividends, interest and foreign withholding taxes recorded and the U.S. dollar equivalent of the amounts actually paid or received. Net unrealized foreign exchange gains and losses arise from changes in the fair value of assets and liabilities other than investments in securities resulting from changes in exchange rates. The changes in net assets arising from changes in exchange rates of securities and the changes in net assets resulting from changes in market prices of securities are not separately presented. Such changes are included in net realized and unrealized gains or losses from investments.
Wells Fargo Core Plus Bond Fund | 35
Notes to financial statements
Forward foreign currency contracts
A forward foreign currency contract is an agreement between two parties to purchase or sell a specific currency for anagreed-upon price at a future date. The Fund enters into forward foreign currency contracts to facilitate transactions in foreign-denominated securities and to attempt to minimize the risk to the Fund from adverse changes in the relationship between currencies. Forward foreign currency contracts are recorded at the forward rate andmarked-to-market daily. When the contracts are closed, realized gains and losses arising from such transactions are recorded as realized gains or losses on forward foreign currency contracts. The Fund is subject to foreign currency risk and may be exposed to risks if the counterparties to the contracts are unable to meet the terms of their contracts or if the value of the foreign currency changes unfavorably. The Fund’s maximum risk of loss from counterparty credit risk is the unrealized gains on the contracts. This risk may be mitigated if there is a master netting arrangement between the Fund and the counterparty.
Securities lending
The Fund may lend its securities from time to time in order to earn additional income in the form of fees or interest on securities received as collateral or the investment of any cash received as collateral. When securities are on loan, the Fund receives interest or dividends on those securities. Cash collateral received in connection with its securities lending transactions is invested in Securities Lending Cash Investments, LLC (the “Securities Lending Fund”). Investments in Securities Lending Fund are valued at the evaluated bid price provided by an independent pricing service. Income earned from investment in the Securities Lending Fund (net of fees and rebates), if any, is included in income from affiliated securities on the Statement of Operations.
In a securities lending transaction, the net asset value of the Fund will be affected by an increase or decrease in the value of the securities loaned and by an increase or decrease in the value of the instrument in which collateral is invested. The amount of securities lending activity undertaken by the Fund fluctuates from time to time. The Fund has the right under the lending agreement to recover the securities from the borrower on demand. In the event of default or bankruptcy by the borrower, the Fund may be prevented from recovering the loaned securities or gaining access to the collateral or may experience delays or costs in doing so. In such an event, the terms of the agreement allows the unaffiliated securities lending agent to use the collateral to purchase replacement securities on behalf of the Fund or pay the Fund the market value of the loaned securities. The Fund will bear the risk of loss with respect to depreciation of its investment of the cash collateral.
When-issued transactions
The Fund may purchase securities on a forward commitment or when-issued basis. The Fund records a when-issued transaction on the trade date and will segregate assets in an amount at least equal in value to the Fund’s commitment to purchasewhen-issued securities. Securities purchased on a when-issued basis aremarked-to-market daily and the Fund begins earning interest on the settlement date. Losses may arise due to changes in the market value of the underlying securities or if the counterparty does not perform under the contract.
Loans
The Fund may invest in direct debt instruments which are interests in amounts owed to lenders by corporate or other borrowers. The loans pay interest at rates which are periodically reset by reference to a base lending rate plus a spread. Investments in loans may be in the form of participations in loans or assignments of all or a portion of loans from third parties. When the Fund purchases participations, it generally has no rights to enforce compliance with the terms of the loan agreement with the borrower. As a result, the Fund assumes the credit risk of both the borrower and the lender that is selling the participation. When the Fund purchases assignments from lenders, it acquires direct rights against the borrower on the loan and may enforce compliance by the borrower with the terms of the loan agreement. Loans may include fully funded term loans or unfunded loan commitments, which are contractual obligations for future funding.
Futures contracts
Futures contracts are agreements between the Fund and a counterparty to buy or sell a specific amount of a commodity, financial instrument or currency at a specified price and on a specified date. The Fund may buy and sell futures contracts in order to gain exposure to, or protect against, changes in interest rates and foreign exchange rates and is subject to interest rate risk and foreign currency risk. The primary risks associated with the use of futures contracts are the imperfect correlation between changes in market values of securities held by the Fund and the prices of futures contracts, and the possibility of an illiquid market. Futures contracts are generally entered into on a regulated futures exchange and cleared through a clearinghouse associated with the exchange. With futures contracts, there is minimal counterparty risk to the Fund since futures contracts are exchange traded and the exchange’s clearinghouse, as the counterparty to all exchange traded futures, guarantees the futures contracts against default.
36 | Wells Fargo Core Plus Bond Fund
Notes to financial statements
Upon entering into a futures contracts, the Fund is required to deposit either cash or securities (initial margin) with the broker in an amount equal to a certain percentage of the contract value. Subsequent payments (variation margin) are paid to or from the broker each day equal to the daily changes in the contract value. Such payments are recorded as unrealized gains or losses and, if any, shown as variation margin receivable (payable) in the Statement of Assets and Liabilities. Should the Fund fail to make requested variation margin payments, the broker can gain access to the initial margin to satisfy the Fund’s payment obligations. When the contracts are closed, a realized gain or loss is recorded in the Statement of Operations.
Swap contracts
Swap contracts are agreements between the Fund and a counterparty to exchange a series of cash flows over a specified period. Swap agreements are privately negotiated contracts between the Fund that are entered into as bilateral contracts in the OTC market (“OTC swaps”) or centrally cleared (“centrally cleared swaps”) with a central clearinghouse.
The Fund entered into centrally cleared swaps. In a centrally cleared swap, immediately following execution of the swap contract, the swap contract is novated to a central counterparty (the “CCP”) and the Fund’s counterparty on the swap agreement becomes the CCP. Upon entering into a centrally cleared swap, the Fund is required to deposit an initial margin with the broker in the form of cash or securities. Securities deposited as initial margin are designated in the Portfolio of Investments and cash deposited is shown as cash segregated for centrally cleared swaps in the Statement of Assets and Liabilities. Pursuant to the contract, the Fund agrees to receive from or pay to the broker an amount of cash equal to the daily fluctuation in market value of the contract (“variation margin”). The variation margin is recorded as an unrealized gain (or loss) and shown as variation margin receivable (or payable) on centrally cleared swaps in the Statement of Assets and Liabilities. Payments received from (paid to) the counterparty, including at termination, are recorded as realized gains (losses) in the Statement of Operations.
Credit default swaps
The Fund may enter into credit default swaps for hedging or speculative purposes to provide or receive a measure of protection against default on a referenced entity, obligation or index or a basket of single-name issuers or traded indexes. An index credit default swap references all the names in the index, and if a credit event is triggered, the credit event is settled based on that name’s weight in the index. Credit default swaps are agreements in which the protection buyer pays fixed periodic payments to the protection seller in consideration for a promise from the protection seller to make a specific payment should a negative credit event take place with respect to the referenced entity (e.g., bankruptcy, failure to pay, obligation acceleration, repudiation, moratorium or restructuring).
The Fund may enter into credit default swaps as either the seller of protection or the buyer of protection. If the Fund is the buyer of protection and a credit event occurs, the Fund will either receive from the seller an amount equal to the notional amount of the swap and deliver the referenced security or underlying securities comprising the index, or receive a net settlement of cash equal to the notional amount of the swap less the recovery value of the security or underlying securities comprising the index. If the Fund is the seller of protection and a credit event occurs, the Fund will either pay the buyer an amount equal to the notional amount of the swap and take delivery of the referenced security or underlying securities comprising the index or pay a net settlement of cash equal to the notional amount of the swap less the recovery value of the security or underlying securities comprising the index.
As the seller of protection, the Fund is subject to investment exposure on the notional amount of the swap and has assumed the risk of default of the underlying security or index. As the buyer of protection, the Fund could be exposed to risks if the seller of the protection defaults on its obligation to perform, or if there are unfavorable changes in the fluctuation of interest rates.
By entering into credit default swap contracts, the Fund is exposed to credit risk. In addition, certain credit default swap contracts entered into by the Fund provide for conditions that result in events of default or termination that enable the counterparty to the agreement to cause an early termination of the transactions under those agreements.
Security transactions and income recognition
Securities transactions are recorded on a trade date basis. Realized gains or losses are recorded on the basis of identified cost.
Interest income is accrued daily and bond discounts are accreted and premiums are amortized daily. To the extent debt obligations are placed onnon-accrual status, any related interest income may be reduced by writing off interest receivables when the collection of all or a portion of interest has been determined to be doubtful based on consistently applied procedures and the fair value has decreased. If the issuer subsequently resumes interest payments or when the collectability of interest is reasonably assured, the debt obligation is removed fromnon-accrual status.
Income dividends and capital gain distributions from investment companies are recorded on theex-dividend date. Capital gain distributions from investment companies are treated as realized gains.
Wells Fargo Core Plus Bond Fund | 37
Notes to financial statements
Income from foreign securities is recorded net of foreign taxes withheld where recovery of such taxes is not assured.
Distributions to shareholders
Distributions to shareholders are recorded on theex-dividend date and paid from net investment income monthly and any net realized gains are paid at least annually. Such distributions are determined in accordance with income tax regulations and may differ from U.S. generally accepted accounting principles. Dividend sources are estimated at the time of declaration. The tax character of distributions is determined as of the Fund’s fiscal year end. Therefore, a portion of the Fund’s distributions made prior to the Fund’s fiscal year end may be categorized as a tax return of capital at year end.
Federal and other taxes
The Fund intends to continue to qualify as a regulated investment company by distributing substantially all of its investment company taxable income and any net realized capital gains (after reduction for capital loss carryforwards) sufficient to relieve it from all, or substantially all, federal income taxes. Accordingly, no provision for federal income taxes was required.
The Fund’s income and federal excise tax returns and all financial records supporting those returns for the prior three fiscal years are subject to examination by the federal and Delaware revenue authorities. Management has analyzed the Fund’s tax positions taken on federal, state, and foreign tax returns for all open tax years and does not believe that there are any uncertain tax positions that require recognition of a tax liability.
As of August 31, 2019, the aggregate cost of all investments for federal income tax purposes was $865,772,524 and the unrealized gains (losses) consisted of:
| | | | |
| |
Gross unrealized gains | | $ | 40,434,454 | |
| |
Gross unrealized losses | | | (8,909,350 | ) |
| |
Net unrealized gains | | $ | 31,525,104 | |
Class allocations
The separate classes of shares offered by the Fund differ principally in applicable sales charges, distribution, shareholder servicing, and administration fees. Class specific expenses are charged directly to that share class. Investment income, common fund-level expenses, and realized and unrealized gains (losses) on investments are allocated daily to each class of shares based on the relative proportion of net assets of each class.
3. FAIR VALUATION MEASUREMENTS
Fair value measurements of investments are determined within a framework that has established a fair value hierarchy based upon the various data inputs utilized in determining the value of the Fund’s investments. The three-level hierarchy gives the highest priority to unadjusted quoted prices in active markets for identical assets or liabilities (Level 1) and the lowest priority to unobservable inputs (Level 3). The Fund’s investments are classified within the fair value hierarchy based on the lowest level of input that is significant to the fair value measurement. The inputs are summarized into three broad levels as follows:
| ∎ | | Level 1 – quoted prices in active markets for identical securities |
| ∎ | | Level 2 – other significant observable inputs (including quoted prices for similar securities, interest rates, prepayment speeds, credit risk, etc.) |
| ∎ | | Level 3 – significant unobservable inputs (including the Fund’s own assumptions in determining the fair value of investments) |
The inputs or methodologies used for valuing investments in securities are not necessarily an indication of the risk associated with investing in those securities.
38 | Wells Fargo Core Plus Bond Fund
Notes to financial statements
The following is a summary of the inputs used in valuing the Fund’s assets and liabilities as of August 31, 2019:
| | | | | | | | | | | | | | | | |
| | | | |
| | | Quoted prices
(Level 1) | | | Other significant
observable inputs
(Level 2) | | | Significant
unobservable inputs (Level 3) | | | Total | |
| | | | |
Assets | | | | | | | | | | | | | | | | |
| | | | |
Investments in: | | | | | | | | | | | | | | | | |
| | | | |
Agency securities | | $ | 0 | | | $ | 175,165,499 | | | $ | 0 | | | $ | 175,165,499 | |
| | | | |
Asset-backed securities | | | 0 | | | | 81,796,468 | | | | 0 | | | | 81,796,468 | |
| | | | |
Corporate bonds and notes | | | 0 | | | | 184,909,698 | | | | 0 | | | | 184,909,698 | |
| | | | |
Exchange-traded funds | | | 7,992,077 | | | | 0 | | | | 0 | | | | 7,992,077 | |
| | | | |
Foreign corporate bonds and notes | | | 0 | | | | 29,056,264 | | | | 0 | | | | 29,056,264 | |
| | | | |
Foreign government bonds | | | 0 | | | | 6,195,367 | | | | 0 | | | | 6,195,367 | |
| | | | |
Loans | | | 0 | | | | 7,674,042 | | | | 0 | | | | 7,674,042 | |
| | | | |
Municipal obligations | | | 0 | | | | 23,262,129 | | | | 0 | | | | 23,262,129 | |
| | | | |
Non-agency mortgage-backed securities | | | 0 | | | | 104,609,250 | | | | 0 | | | | 104,609,250 | |
| | | | |
U.S. Treasury securities | | | 72,998,945 | | | | 7,172,792 | | | | 0 | | | | 80,171,737 | |
| | | | |
Yankee corporate bonds and notes | | | 0 | | | | 74,003,956 | | | | 0 | | | | 74,003,956 | |
| | | | |
Yankee government bonds | | | 0 | | | | 27,215,840 | | | | 0 | | | | 27,215,840 | |
| | | | |
Short-term investments | | | | | | | | | | | | | | | | |
| | | | |
Investment companies | | | 91,598,497 | | | | 0 | | | | 0 | | | | 91,598,497 | |
| | | | |
U.S. Treasury securities | | | 1,899,115 | | | | 0 | | | | 0 | | | | 1,899,115 | |
| | | | |
| | | 174,488,634 | | | | 721,061,305 | | | | 0 | | | | 895,549,939 | |
| | | | |
Futures contracts | | | 886,696 | | | | 0 | | | | 0 | | | | 886,696 | |
| | | | |
Forward foreign currency contracts | | | 0 | | | | 1,666,870 | | | | 0 | | | | 1,666,870 | |
| | | | |
Credit default swap contracts | | | 0 | | | | 43,961 | | | | 0 | | | | 43,961 | |
| | | | |
Total assets | | $ | 175,375,330 | | | $ | 722,772,136 | | | $ | 0 | | | $ | 898,147,466 | |
| | | | |
Liabilities | | | | | | | | | | | | | | | | |
| | | | |
Futures contracts | | $ | 646,538 | | | $ | 0 | | | $ | 0 | | | $ | 646,538 | |
| | | | |
Forward foreign currency contracts | | | 0 | | | | 203,300 | | | | 0 | | | | 203,300 | |
| | | | |
Total liabilities | | $ | 646,538 | | | $ | 203,300 | | | $ | 0 | | | $ | 849,838 | |
Additional sector, industry or geographic detail is included in the Portfolio of Investments.
Futures contracts, forward foreign currency contracts and swap contracts are reported at their cumulative unrealized gains (losses) at measurement date as reported in the tables following the Portfolio of Investments. For futures contracts and centrally cleared swaps, the current day’s variation margin is reported on the Statement of Assets and Liabilities. All other assets and liabilities are reported at their market value at measurement date.
For the year ended August 31, 2019, the Fund did not have any transfers into/out of Level 3.
4. TRANSACTIONS WITH AFFILIATES
Management fee
Funds Management, an indirect wholly owned subsidiary of Wells Fargo & Company (“Wells Fargo”), is the manager of the Fund and provides advisory and fund-level administrative services under an investment management agreement. Under the investment management agreement, Funds Management is responsible for, among other services, implementing the investment objectives and strategies of the Fund, supervising the subadviser and providing fund-level administrative services in
Wells Fargo Core Plus Bond Fund | 39
Notes to financial statements
connection with the Fund’s operations. As compensation for its services under the investment management agreement, Funds Management is entitled to receive a management fee at the following annual rate based on the Fund’s average daily net assets:
| | | | |
| |
| Average daily net assets | | Management fee | |
| |
First $500 million | | | 0.450 | % |
| |
Next $500 million | | | 0.425 | |
| |
Next $2 billion | | | 0.400 | |
| |
Next $2 billion | | | 0.375 | |
| |
Next $5 billion | | | 0.340 | |
| |
Over $10 billion | | | 0.320 | |
For the year ended August 31, 2019, the management fee was equivalent to an annual rate of 0.44% of the Fund’s average daily net assets.
Funds Management has retained the services of a subadviser to provide daily portfolio management to the Fund. The fee for subadvisory services is borne by Funds Management. Wells Capital Management Incorporated (“WellsCap”), an affiliate of Funds Management and an indirect wholly owned subsidiary of Wells Fargo, is the subadviser to the Fund and is entitled to receive a fee from Funds Management at an annual rate starting at 0.20% and declining to 0.10% as the average daily net assets of the Fund increase.
Administration fees
Under a class-level administration agreement, Funds Management provides class-level administrative services to the Fund, which includes paying fees and expenses for services provided by the transfer agent,sub-transfer agents, omnibus account servicers and record-keepers. As compensation for its services under the class-level administration agreement, Funds Management receives an annual fee which is calculated based on the average daily net assets of each class as follows:
| | | | |
| |
| | | Class-level
administration fee | |
| |
Class A, Class C | | | 0.16 | % |
| |
Class R6 | | | 0.03 | |
| |
Administrator Class | | | 0.10 | |
| |
Institutional Class | | | 0.08 | |
Waivers and/or expense reimbursements
Funds Management has contractually waived and/or reimbursed management and administration fees to the extent necessary to maintain certain net operating expense ratios for the Fund. When each class of the Fund has exceeded its expense cap, Funds Management has waived fees and/or reimbursed expenses from fund-level expenses on a proportionate basis and then from class specific expenses. When only certain classes exceed their expense caps, waivers and/or reimbursements are applied against class specific expenses before fund-level expenses. Funds Management has committed through December 31, 2019 to waive fees and/or reimburse expenses to the extent necessary to cap the Fund’s expenses at 0.73% for Class A shares, 1.48% for Class C shares, 0.35% for Class R6 shares, 0.62% for Administrator Class shares, and 0.40% for Institutional Class shares. Prior to or after the commitment expiration date, the cap may be increased or the commitment to maintain the cap may be terminated only with the approval of the Board of Trustees.
Distribution fee
The Trust has adopted a distribution plan for Class C shares of the Fund pursuant to Rule12b-1 under the 1940 Act. A distribution fee is charged to Class C shares and paid to Wells Fargo Funds Distributor, LLC (“Funds Distributor”), the principal underwriter, at an annual rate of 0.75% of the average daily net assets of Class C shares.
In addition, Funds Distributor is entitled to receive thefront-end sales charge from the purchase of Class A shares and a contingent deferred sales charge on the redemption of certain Class A shares. Funds Distributor is also entitled to receive the contingent deferred sales charges from redemptions of Class C shares. For the year ended August 31, 2019, Funds Distributor received $9,211 from the sale of Class A shares. No contingent deferred sales charges were incurred by Class A and Class C shares for the year ended August 31, 2019.
40 | Wells Fargo Core Plus Bond Fund
Notes to financial statements
Shareholder servicing fees
The Trust has entered into contracts with one or more shareholder servicing agents, whereby Class A, Class C, and Administrator Class of the Fund are charged a fee at an annual rate of 0.25% of the average daily net assets of each respective class. A portion of these total shareholder servicing fees were paid to affiliates of Wells Fargo.
Interfund transactions
The Fund may purchase or sell portfolio investment securities to certain other Wells Fargo affiliates pursuant to Rule17a-7 under the 1940 Act and under procedures adopted by the Board of Trustees. The procedures have been designed to ensure that these interfund transactions, which do not incur broker commissions, are effected at current market prices.
5. INVESTMENT PORTFOLIO TRANSACTIONS
Purchases and sales of investments, excluding short-term securities, for the year ended August 31, 2019 were as follows:
| | | | | | |
Purchases at cost | | Sales proceeds |
U.S.
government | | Non-U.S.
government | | U.S.
government | | Non-U.S.
government |
| $293,196,506 | | $507,806,020 | | $255,094,137 | | $289,161,707 |
As of August 31, 2019, the Fund had unfunded term loan commitments of $1,707,813.
6. SECURITIES LENDING TRANSACTIONS
The Fund lends its securities through an unaffiliated securities lending agent and receives collateral in the form of cash or securities with a value at least equal to the value of the securities on loan. The value of the loaned securities is determined at the close of each business day and any increases or decreases in the required collateral are exchanged between the Fund and the counterparty on the next business day. Cash collateral received is invested in the Securities Lending Fund which seeks to provide a positive return compared to the daily Fed Funds Open Rate by investing in high-quality, U.S. dollar-denominated short-term money market instruments and is exempt from registration under Section 3(c)(7) of the 1940 Act. Securities Lending Fund is managed by Funds Management and is subadvised by WellsCap. Funds Management receives an advisory fee starting at 0.05% and declining to 0.01% as the average daily net assets of the Securities Lending Fund increase. All of the fees received by Funds Management are paid to WellsCap for its services as subadviser.
In the event of counterparty default or the failure of a borrower to return a loaned security, the Fund has the right to use the collateral to offset any losses incurred. As of August 31, 2019, the Fund had securities lending transactions with the following counterparties which are subject to offset:
| | | | | | | | | | | | |
| | | |
| Counterparty | | Value of
securities on
loan | | | Collateral
received1 | | | Net amount | |
| | | |
Barclays Capital Inc. | | $ | 3,509,976 | | | $ | (3,509,976 | ) | | $ | 0 | |
| | | |
Citigroup Global Markets Inc. | | | 903,972 | | | | (903,972 | ) | | | 0 | |
| | | |
JPMorgan Securities LLC | | | 671,591 | | | | (671,591 | ) | | | 0 | |
| 1 | Collateral received within this table is limited to the collateral for the net transaction with the counterparty. |
7. DERIVATIVE TRANSACTIONS
During the year ended August 31, 2019, the Fund entered into futures contracts to speculate on interest rates and to help manage the duration of the portfolio. The Fund also entered into forward foreign currency contracts for economic hedging purposes and entered into credit default swap contracts to hedge risks and/or enhance total returns.
The volume of the Fund’s derivative activity during the year ended August 31, 2019 was as follows:
| | | | |
Futures contracts | | | | |
| |
Average notional balance on long futures | | $ | 138,626,021 | |
| |
Average notional balance on short futures | | | 26,948,673 | |
| |
Forward foreign currency contracts | | | | |
| |
Average contract amounts to buy | | | 14,501,668 | |
| |
Average contract amounts to sell | | | 47,400,591 | |
| |
Credit default swap contracts | | | | |
| |
Average notional balance | | | 11,741,231 | |
Wells Fargo Core Plus Bond Fund | 41
Notes to financial statements
The Fund’s credit default swap may contain provisions for early termination in the event the net assets of the Fund declines below specific levels identified by the counterparty. If these levels are triggered, the counterparty may terminate the transaction and seek payment or request full collateralization of the derivative transactions in net liability positions.
A summary of the location of derivative instruments on the financial statements by risk is outlined in the following tables.
The fair value of derivative instruments as of August 31, 2019 by risk type was as follows for the Fund:
| | | | | | | | | | | | |
| | | Asset derivatives | | | Liability derivatives | |
| | | | |
| | | Statement of Assets and
Liabilities location | | Fair value | | | Statement of Assets and
Liabilities location | | Fair value | |
| | | | |
Interest rate risk | | Unrealized gains on futures contracts | | $ | 886,696 | * | | Unrealized losses on futures contracts | | $ | 0 | * |
| | | | |
Foreign currency risk | | Unrealized gains on futures contracts | | | 0 | * | | Unrealized losses on futures contracts | | | 646,538 | * |
| | | | |
Foreign currency risk | | Unrealized gains on forward foreign currency contracts | | | 1,666,870 | | | Unrealized losses on forward foreign currency contracts | | | 203,300 | |
| | | | |
Credit risk | | Net unrealized gains on swap contracts | | | 43,961 | * | | Net unrealized losses on swap contracts | | | 0 | * |
| | | | |
| | | | | $ | 2,597,527 | | | | | $ | 849,838 | |
| * | Amount represents cumulative unrealized gains (losses) as reported in the tables following the Portfolio of Investments. Only the current day’s variation margin as of August 31, 2019 is reported separately on the Statement of Assets and Liabilities. |
The effect of derivative instruments on the Statement of Operations for the year ended August 31, 2019 was as follows for the Fund:
| | | | | | | | | | | | | | | | |
| | | Amount of realized gains (losses) on derivatives | |
| | | | |
| | | Futures
contracts | | | Forward
foreign
currency
contracts | | | Swap
contracts | | | Total | |
| | | | |
Interest rate risk | | $ | 7,480,788 | | | $ | 0 | | | $ | 0 | | | $ | 7,480,788 | |
| | | | |
Foreign currency risk | | | (547,957 | ) | | | 1,897,442 | | | | 0 | | | | 1,349,485 | |
| | | | |
Credit risk | | | 0 | | | | 0 | | | | 401,568 | | | | 401,568 | |
| | | | |
| | | $ | 6,932,831 | | | $ | 1,897,442 | | | $ | 401,568 | | | $ | 9,231,841 | |
| |
| | | Change in unrealized gains (losses) on derivatives | |
| | | | |
| | | Futures
contracts | | | Forward
foreign
currency
contracts | | | Swap
contracts | | | Total | |
| | | | |
Interest rate risk | | $ | 936,473 | | | $ | 0 | | | $ | 0 | | | $ | 936,473 | |
| | | | |
Foreign currency risk | | | (598,424 | ) | | | 1,378,735 | | | | 0 | | | | 780,311 | |
| | | | |
Credit risk | | | 0 | | | | 0 | | | | 76,197 | | | | 76,197 | |
| | | | |
| | | $ | 338,049 | | | $ | 1,378,735 | | | $ | 76,197 | | | $ | 1,792,981 | |
For certain types of derivative transactions, the Fund has entered into International Swaps and Derivatives Association, Inc. master agreements (“ISDA Master Agreements”) or similar agreements with approved counterparties. The ISDA Master Agreements or similar agreements may have requirements to deliver/deposit securities or cash to/with an exchange or broker-dealer as collateral and allows the Fund to offset, with each counterparty, certain derivative financial instrument’s assets and/or liabilities with collateral held or pledged. Collateral requirements differ by type of derivative. Collateral or margin requirements are set by the broker or exchange clearinghouse for exchange traded derivatives while collateral terms are contract specific forover-the-counter traded derivatives. Cash collateral that has been pledged to cover obligations of the Fund under ISDA Master Agreements or similar agreements, if any, are reported separately in the Statement of Assets and Liabilities. Securities pledged as collateral, if any, are noted in the Portfolio of Investments. With respect to balance sheet offsetting, absent an event of default by the counterparty or a termination of the agreement, the reported amounts of financial assets and financial liabilities
42 | Wells Fargo Core Plus Bond Fund
Notes to financial statements
in the Statement of Assets and Liabilities are not offset across transactions between the Fund and the applicable counterparty. A reconciliation of the gross amounts on the Statement of Assets and Liabilities to the net amounts by counterparty, including any collateral exposure, is as follows:
| | | | | | | | | | | | |
| | | | |
| Counterparty | | Gross amounts
of assets in the
Statement of
Assets and
Liabilities | | Amounts
subject to
netting
agreements | | Collateral
received | | | Net amount
of assets | |
| | | | |
Citibank | | $1,666,870 | | $(203,300) | | $ | 0 | | | $ | 1,463,570 | |
| | | | |
| Counterparty | | Gross amounts
of liabilities in the
Statement of
Assets and
Liabilities | | Amounts
subject to
netting
agreements | | Collateral
pledged | | | Net amount
of liabilities | |
| | | | |
Citibank | | $203,300 | | $(203,300) | | $ | 0 | | | $ | 0 | |
8. BANK BORROWINGS
The Trust (excluding the money market funds), Wells Fargo Master Trust and Wells Fargo Variable Trust are parties to a $280,000,000 revolving credit agreement whereby the Fund is permitted to use bank borrowings for temporary or emergency purposes, such as to fund shareholder redemption requests. Interest under the credit agreement is charged to the Fund based on a borrowing rate equal to the higher of the Federal Funds rate in effect on that day plus 1.25% or the overnight LIBOR rate in effect on that day plus 1.25%. In addition, an annual commitment fee equal to 0.25% of the unused balance is allocated to each participating fund.
For the year ended August 31, 2019, there were no borrowings by the Fund under the agreement.
9. DISTRIBUTIONS TO SHAREHOLDERS
The tax character of distributions paid was $19,702,655 and $16,334,620 of ordinary income for the years ended August 31, 2019 and August 31, 2018, respectively.
As of August 31, 2019, the components of distributable earnings on a tax basis were as follows:
| | | | |
Undistributed
ordinary
income | | Undistributed
long-term
gain | | Unrealized gains |
| | |
| $4,499,822 | | $3,784,799 | | $31,525,104 |
Effective for all filings after November 4, 2018, the Securities and Exchange Commission eliminated the requirement to separately state the components of distributions to shareholders under U.S. generally accepted accounting principles. The amounts of distributions to shareholders for the year ended August 31, 2018 were as follows:
| | | | |
| |
| | | Net investment
income | |
| |
Class A | | $ | 6,592,901 | |
| |
Class C | | | 396,945 | |
| |
Class R6 | | | 1,205,963 | |
| |
Administrator Class | | | 1,057,877 | |
| |
Institutional Class | | | 7,080,934 | |
10. INDEMNIFICATION
Under the Trust’s organizational documents, the officers and Trustees have been granted certain indemnification rights against certain liabilities that may arise out of performance of their duties to the Trust. Additionally, in the normal course of business, the Trust may enter into contracts with service providers that contain a variety of indemnification clauses. The Trust’s maximum exposure under these arrangements is dependent on future claims that may be made against the Fund and, therefore, cannot be estimated.
Wells Fargo Core Plus Bond Fund | 43
Notes to financial statements
11. NEW ACCOUNTING PRONOUNCEMENTS
In August 2018, FASB issued Accounting Standards Update (“ASU”)No. 2018-13, Fair Value Measurement (Topic 820)Disclosure Framework—Changes to the Disclosure Requirements for Fair Value Measurement. ASU2018-13 updates the disclosure requirements for fair value measurements by modifying or removing certain disclosures and adding certain new disclosures. The amendments are effective for fiscal years, and interim periods within those fiscal years, beginning after December 15, 2019. Early adoption is permitted. Management has adopted the removal and modification of disclosures early, as permitted, and will adopt the additional new disclosures at the effective date.
In March 2017, FASB issued ASUNo. 2017-08,Premium Amortization on Purchased Callable Debt Securities. ASU2017-08 shortens the amortization period for certain callable debt securities held at a premium and requires the premium to be amortized to the earliest call date. The amendments do not require an accounting change for securities held at a discount and discounts will continue to be accreted to the maturity date of the security. ASU2017-08 is effective for fiscal years beginning after December 15, 2018 and for interim periods within those fiscal years. During the current reporting period, management of the Fund adopted the change in accounting policy which did not have a material impact to the Fund’s financial statements.
44 | Wells Fargo Core Plus Bond Fund
Report of independent registered public accounting firm
TO THE SHAREHOLDERS OF THE FUND AND BOARD OF TRUSTEES OF WELLS FARGO FUNDS TRUST:
Opinion on the Financial Statements
We have audited the accompanying statement of assets and liabilities of Wells Fargo Core Plus Bond Fund (the Fund), one of the funds constituting Wells Fargo Funds Trust, including the portfolio of investments, as of August 31, 2019, the related statement of operations for the year then ended, the statements of changes in net assets for each of the years in the two-year period then ended, and the related notes (collectively, the financial statements) and the financial highlights for each of the years or periods in the five-year period then ended. In our opinion, the financial statements and financial highlights present fairly, in all material respects, the financial position of the Fund as of August 31, 2019, the results of its operations for the year then ended, the changes in its net assets for each of the years in the two-year period then ended, and the financial highlights for each of the years or periods in the five-year period then ended, in conformity with U.S. generally accepted accounting principles.
Basis for Opinion
These financial statements and financial highlights are the responsibility of the Fund’s management. Our responsibility is to express an opinion on these financial statements and financial highlights based on our audits. We are a public accounting firm registered with the Public Company Accounting Oversight Board (United States) (PCAOB) and are required to be independent with respect to the Fund in accordance with the U.S. federal securities laws and the applicable rules and regulations of the Securities and Exchange Commission and the PCAOB.
We conducted our audits in accordance with the standards of the PCAOB. Those standards require that we plan and perform the audit to obtain reasonable assurance about whether the financial statements and financial highlights are free of material misstatement, whether due to error or fraud. Our audits included performing procedures to assess the risks of material misstatement of the financial statements and financial highlights, whether due to error or fraud, and performing procedures that respond to those risks. Such procedures included examining, on a test basis, evidence regarding the amounts and disclosures in the financial statements and financial highlights. Such procedures also included confirmation of securities owned as of August 31, 2019, by correspondence with the custodian, transfer agent and brokers, or by other appropriate auditing procedures. Our audits also included evaluating the accounting principles used and significant estimates made by management, as well as evaluating the overall presentation of the financial statements and financial highlights. We believe that our audits provide a reasonable basis for our opinion.

We have not been able to determine the specific year that we began serving as the auditor of one or more Wells Fargo Funds investment companies; however we are aware that we have served as the auditor of one or more Wells Fargo Funds investment companies since at least 1955.
Boston, Massachusetts
October 28, 2019
Wells Fargo Core Plus Bond Fund | 45
Other information (unaudited)
TAX INFORMATION
For corporate shareholders, pursuant to Section 854 of the Internal Revenue Code, 1.50% of ordinary income dividends qualify for the corporate dividends-received deduction for the fiscal year ended August 31, 2019.
Pursuant to Section 854 of the Internal Revenue Code, $295,034 of income dividends paid during the fiscal year ended August 31, 2019 has been designated as qualified dividend income (QDI).
For the fiscal year ended August 31, 2019, $12,477,919 has been designated as interest-related dividends for nonresident alien shareholders pursuant to Section 871 of the Internal Revenue Code.
For the fiscal year ended August 31, 2019, 7.18% of the ordinary income distributed was derived from interest on U.S. government securities.
PROXY VOTING INFORMATION
A description of the policies and procedures used to determine how to vote proxies relating to portfolio securities is available, upon request, by calling1-800-222-8222, visiting our website atwfam.com, or visiting the SEC website at sec.gov. Information regarding how the proxies related to portfolio securities were voted during the most recent12-month period ended June 30 is available on the website atwfam.comor by visiting the SEC website at sec.gov.
QUARTERLY PORTFOLIO HOLDINGS INFORMATION
The Fund files its complete schedule of portfolio holdings with the SEC for the first and third quarters of each fiscal year on Form N-Q or FormN-PORT, which is available by visiting the SEC website at sec.gov. Those forms may be reviewed and copied at the SEC’s Public Reference Room in Washington, DC. Information on the operation of the Public Reference Room may be obtained by calling1-800-SEC-0330.
46 | Wells Fargo Core Plus Bond Fund
Other information (unaudited)
BOARD OF TRUSTEES AND OFFICERS
Each of the Trustees and Officers1 listed in the table below acts in identical capacities for each fund in the Wells Fargo family of funds, which consists of 152 mutual funds comprising the Wells Fargo Funds Trust, Wells Fargo Variable Trust, Wells Fargo Master Trust and fourclosed-end funds (collectively the “Fund Complex”). This table should be read in conjunction with the Prospectus and the Statement of Additional Information2. The mailing address of each Trustee and Officer is 525 Market Street, 12th Floor, San Francisco, CA 94105. Each Trustee and Officer serves an indefinite term, however, each Trustee serves such term until reaching the mandatory retirement age established by the Trustees.
Independent Trustees
| | | | | | |
Name and
year of birth | | Position held and
length of service* | | Principal occupations during past five years or longer | | Current other
public company or
investment
company
directorships |
| | | |
| William R. Ebsworth (Born 1957) | | Trustee,
since 2015 | | Retired. From 1984 to 2013, equities analyst, portfolio manager, research director and chief investment officer at Fidelity Management and Research Company in Boston, Tokyo, and Hong Kong, and retired in 2013 as Chief Investment Officer of Fidelity Strategic Advisers, Inc. where he led a team of investment professionals managing client assets. Prior thereto, Board member of Hong Kong Securities Clearing Co., Hong Kong Options Clearing Corp., the Thailand International Fund, Ltd., Fidelity Investments Life Insurance Company, and Empire Fidelity Investments Life Insurance Company. Audit Committee Chair and Investment Committee Chair of the Vincent Memorial Hospital Endowment(non-profit organization). Mr. Ebsworth is a CFA® charterholder. | | N/A |
| | | |
| Jane A. Freeman (Born 1953) | | Trustee,
since 2015;
Chair Liaison,
since 2018 | | Retired. From 2012 to 2014 and 1999 to 2008, Chief Financial Officer of Scientific Learning Corporation. From 2008 to 2012, Ms. Freeman provided consulting services related to strategic business projects. Prior to 1999, Portfolio Manager at Rockefeller & Co. and Scudder, Stevens & Clark. Board member of the Harding Loevner Funds from 1996 to 2014, serving as both Lead Independent Director and chair of the Audit Committee. Board member of the Russell Exchange Traded Funds Trust from 2011 to 2012 and the chair of the Audit Committee. Ms. Freeman is a Board Member of The Ruth Bancroft Garden(non-profit organization). She is also an inactive Chartered Financial Analyst. | | N/A |
| | | |
| Isaiah Harris, Jr. (Born 1952) | | Trustee,
since 2009;
Audit Committee Chairman,
since 2019 | | Retired. Chairman of the Board of CIGNA Corporation since 2009, and Director since 2005. From 2003 to 2011, Director of Deluxe Corporation. Prior thereto, President and CEO of BellSouth Advertising and Publishing Corp. from 2005 to 2007, President and CEO of BellSouth Enterprises from 2004 to 2005 and President of BellSouth Consumer Services from 2000 to 2003. Emeritus member of the Iowa State University Foundation Board of Governors. Emeritus Member of the Advisory Board of Iowa State University School of Business. Advisory Board Member, Palm Harbor Academy (private school). Advisory Board Member, Child Evangelism Fellowship(non-profit). Mr. Harris is a certified public accountant (inactive status). | | CIGNA Corporation |
| | | |
| Judith M. Johnson (Born 1949) | | Trustee,
since 2008;
Audit Committee Chairman, from 2009 to 2018 | | Retired. Prior thereto, Chief Executive Officer and Chief Investment Officer of Minneapolis Employees Retirement Fund from 1996 to 2008. Ms. Johnson is an attorney, certified public accountant and a certified managerial accountant. | | N/A |
Wells Fargo Core Plus Bond Fund | 47
Other information (unaudited)
| | | | | | |
Name and
year of birth | | Position held and
length of service* | | Principal occupations during past five years or longer | | Current other
public company or
investment
company
directorships |
| | | |
| David F. Larcker (Born 1950) | | Trustee,
since 2009 | | James Irvin Miller Professor of Accounting at the Graduate School of Business, Stanford University, Director of the Corporate Governance Research Initiative and Senior Faculty of The Rock Center for Corporate Governance since 2006. From 2005 to 2008, Professor of Accounting at the Graduate School of Business, Stanford University. Prior thereto, Ernst & Young Professor of Accounting at The Wharton School, University of Pennsylvania from 1985 to 2005. | | N/A |
| | | |
| Olivia S. Mitchell (Born 1953) | | Trustee,
since 2006; Nominating and Governance Committee Chairman,
since 2018 | | International Foundation of Employee Benefit Plans Professor, Wharton School of the University of Pennsylvania since 1993. Director of Wharton’s Pension Research Council and Boettner Center on Pensions & Retirement Research, and Research Associate at the National Bureau of Economic Research. Previously, Cornell University Professor from 1978 to 1993. | | N/A |
| | | |
| Timothy J. Penny (Born 1951) | | Trustee,
since 1996; Chairman,
since 2018 | | President and Chief Executive Officer of Southern Minnesota Initiative Foundation, anon-profit organization, since 2007. Member of the Board of Trustees of NorthStar Education Finance, Inc., anon-profit organization, since 2007. | | N/A |
| | | |
| James G. Polisson (Born 1959) | | Trustee,
since 2018 | | Retired. Chief Marketing Officer, Source (ETF) UK Services, Ltd, from 2015 to 2017. From 2012 to 2015, Principal of The Polisson Group, LLC, a management consulting, corporate advisory and principal investing company. Chief Executive Officer and Managing Director at Russell Investments, Global Exchange Traded Funds from 2010 to 2012. Managing Director of Barclays Global Investors from 1998 to 2010 and Global Chief Marketing Officer for iShares and Barclays Global Investors from 2000 to 2010. Trustee of the San Francisco Mechanics’ Institute, anon-profit organization, from 2013 to 2015. Board member of the Russell Exchange Traded Fund Trust from 2011 to 2012. Director of Barclays Global Investors Holdings Deutschland GmbH from 2006 to 2009. Mr. Polisson is an attorney and has a retired status with the Massachusetts and District of Columbia Bar Associations. | | N/A |
| * | Length of service dates reflect the Trustee’s commencement of service with the Trust’s predecessor entities, where applicable. |
48 | Wells Fargo Core Plus Bond Fund
Other information (unaudited)
Officers
| | | | |
Name and
year of birth | | Position held and
length of service | | Principal occupations during past five years or longer |
| | |
Andrew Owen (Born 1960) | | President,
since 2017 | | Executive Vice President of Wells Fargo & Company and Head of Affiliated Managers, Wells Fargo Asset Management, since 2014. In addition, Mr. Owen is currently President, Chief Executive Officer and Director of Wells Fargo Funds Management, LLC since 2017. Prior thereto, Executive Vice President responsible for marketing, investments and product development for Wells Fargo Funds Management, LLC, from 2009 to 2014. |
| | |
Nancy Wiser1 (Born 1967) | | Treasurer,
since 2012 | | Executive Vice President of Wells Fargo Funds Management, LLC since 2011. Chief Operating Officer and Chief Compliance Officer at LightBox Capital Management LLC, from 2008 to 2011. |
| | |
Michelle Rhee3 (Born 1966) | | Chief Legal Officer, since 2019 | | Secretary of Wells Fargo Funds Management, LLC, Chief Legal Counsel of Wells Fargo Asset Management and Assistant General Counsel of Wells Fargo Bank, N.A. since 2018. Associate General Counsel and Managing Director of Bank of America Corporation from 2004 to 2018. |
| | |
Catherine Kennedy4 (Born 1969) | | Secretary, since 2019 | | Vice President of Wells Fargo Funds Management, LLC and Senior Counsel of the Wells Fargo Legal Department since 2010. Vice President and Senior Counsel of Evergreen Investment Management Company, LLC from 1998 to 2010. |
| | |
| Michael H. Whitaker(Born 1967) | | Chief Compliance Officer,
since 2016 | | Chief Compliance Officer of Wells Fargo Asset Management since 2016. Senior Vice President and Chief Compliance Officer for Fidelity Investments from 2007 to 2016. |
| | |
David Berardi (Born 1975) | | Assistant Treasurer,
since 2009 | | Vice President of Wells Fargo Funds Management, LLC since 2009. Vice President of Evergreen Investment Management Company, LLC from 2008 to 2010. Manager of Fund Reporting and Control for Evergreen Investment Management Company, LLC from 2004 to 2010. |
| | |
| Jeremy DePalma1 (Born 1974) | | Assistant Treasurer, since 2009 | | Senior Vice President of Wells Fargo Funds Management, LLC since 2009. Senior Vice President of Evergreen Investment Management Company, LLC from 2008 to 2010 and head of the Fund Reporting and Control Team within Fund Administration from 2005 to 2010. |
| 1 | Nancy Wiser acts as Treasurer of 65 funds in the Fund Complex. Jeremy DePalma acts as Treasurer of 87 funds and Assistant Treasurer of 65 funds in the Fund Complex. |
| 2 | The Statement of Additional Information includes additional information about the Trustees and is available, without charge, upon request, by calling1-800-222-8222 or by visiting the website atwfam.com. |
| 3 | Michelle Rhee became Chief Legal Officer effective October 22, 2019. |
| 4 | Catherine Kennedy became Secretary effective October 22, 2019. |
Wells Fargo Core Plus Bond Fund | 49
Other information (unaudited)
BOARD CONSIDERATION OF INVESTMENT MANAGEMENT ANDSUB-ADVISORY AGREEMENTS:
Wells Fargo Core Plus Bond Fund
Under the Investment Company Act of 1940 (the “1940 Act”), the Board of Trustees (the “Board”) of Wells Fargo Funds Trust (the “Trust”) must determine annually whether to approve the continuation of the Trust’s investment management andsub-advisory agreements. In this regard, at anin-person meeting held on May21-22, 2019 (the “Meeting”), the Board, all the members of which have no direct or indirect interest in the investment management andsub-advisory agreements and are not “interested persons” of the Trust, as defined in the 1940 Act (the “Independent Trustees”), reviewed and approved for Wells Fargo Core Plus Bond Fund(the “Fund”): (i) an investment management agreement (the “Management Agreement”) with Wells Fargo Funds Management, LLC (“Funds Management”); and (ii) an investmentsub-advisory agreement (the“Sub-Advisory Agreement”) with Wells Capital Management Incorporated (the“Sub-Adviser”), an affiliate of Funds Management. The Management Agreement and theSub-Advisory Agreement are collectively referred to as the “Advisory Agreements.”
At the Meeting, the Board considered the factors and reached the conclusions described below relating to the selection of Funds Management and theSub-Adviser and the approval of the Advisory Agreements. Prior to the Meeting, including at anin-person meeting in April 2019, the Trustees conferred extensively among themselves and with representatives of Funds Management about these matters. Also, the Board has adopted a team-based approach, with each team consisting of asub-set of Trustees, to assist the full Board in the discharge of its duties in reviewing investment performance and other matters throughout the year. The Independent Trustees were assisted in their evaluation of the Advisory Agreements by independent legal counsel, from whom they received separate legal advice and with whom they met separately.
In providing information to the Board, Funds Management and theSub-Adviser were guided by a detailed set of requests for information submitted to them by independent legal counsel on behalf of the Independent Trustees at the start of the Board’s annual contract renewal process earlier in 2019. In considering and approving the Advisory Agreements, the Trustees considered the information they believed relevant, including but not limited to the information discussed below. The Board considered not only the specific information presented in connection with the Meeting, but also the knowledge gained over time through interaction with Funds Management and theSub-Adviser about various topics. In this regard, the Board reviewed reports of Funds Management at each of its quarterly meetings, which included, among other things, portfolio reviews and investment performance reports. In addition, the Board and the teams mentioned above confer with portfolio managers at various times throughout the year. The Board did not identify any particular information or consideration that wasall-important or controlling, and each individual Trustee may have attributed different weights to various factors.
After its deliberations, the Board unanimously approved the continuation of the Advisory Agreements for aone-year term and determined that the compensation payable to Funds Management and theSub-Adviser under each of the Advisory Agreements was reasonable. The Board considered the approval of the Advisory Agreements for the Fund as part of its consideration of agreements for funds across the complex, but its approvals were made on afund-by-fund basis. The following summarizes a number of important, but not necessarily all, factors considered by the Board in support of its approvals.
Nature, extent and quality of services
The Board received and considered various information regarding the nature, extent and quality of services provided to the Fund by Funds Management and theSub-Adviser under the Advisory Agreements. This information included a description of the investment advisory services and Fund-level administrative services covered by the Management Agreement, as well as, among other things, a summary of the background and experience of senior management of Wells Fargo Asset Management (“WFAM”), of which Funds Management and theSub-Adviser are a part, a summary of investments made in the business of WFAM, a summary of certain organizational and personnel changes involving Funds Management and theSub-Adviser, and a description of Funds Management’s and theSub-Adviser’s business continuity planning programs and of their approaches to data privacy and cybersecurity. The Board received and reviewed information about Funds Management’s role as administrator of the Fund’s liquidity risk management program. The Board also considered the qualifications, background, tenure and responsibilities of each of the portfolio managers primarily responsible for theday-to-day portfolio management of the Fund.
The Board evaluated the ability of Funds Management and theSub-Adviser to attract and retain qualified investment professionals, including research, advisory and supervisory personnel. The Board further considered the compliance programs and compliance records of Funds Management and theSub-Adviser. In addition, the Board took into account the full range of services provided to the Fund by Funds Management and its affiliates.
Fund investment performance and expenses
The Board considered the investment performance results for the Fund over various time periods ended December 31, 2018. The Board considered these results in comparison to the investment performance of funds in a universe that was determined by
50 | Wells Fargo Core Plus Bond Fund
Other information (unaudited)
Broadridge Inc. (“Broadridge”) to be similar to the Fund (the “Universe”), and in comparison to the Fund’s benchmark index and to other comparative data. Broadridge is an independent provider of investment company data. The Board received a description of the methodology used by Broadridge to select the mutual funds in the performance Universe. The Board noted that the investment performance of the Fund (Class A) was higher than the average investment performance of the Universe for theone-, three- and five-year periods under review, but lower than the average investment performance of the Universe for theten-year period under review. The Board also noted that the investment performance of the Fund was lower than its benchmark index, the Bloomberg Barclays U.S. Aggregate Bond Index, for theone-year period under review, but higher than its benchmark for the three-, five- andten-year periods under review.
The Board also received and considered information regarding the Fund’s net operating expense ratios and their various components, including actual management fees, custodian and othernon-management fees, and Rule12b-1 andnon-Rule12b-1 shareholder service fees. The Board considered these ratios in comparison to the median ratios of funds in class-specific expense groups that were determined by Broadridge to be similar to the Fund (the “Groups”). The Board received a description of the methodology used by Broadridge to select the mutual funds in the expense Groups and an explanation of how funds comprising expense groups and their expense ratios may vary fromyear-to-year. Based on the Broadridge reports, the Board noted that the net operating expense ratios of the Fund were lower than the median net operating expense ratios of the expense Groups for each share class.
The Board took into account the Fund’s investment performance and expense information provided to it among the factors considered in deciding tore-approve the Advisory Agreements.
Investment management andsub-advisory fee rates
The Board reviewed and considered the contractual fee rates payable by the Fund to Funds Management under the Management Agreement, as well as the contractual fee rates payable by the Fund to Funds Management for class-level administrative services under a Class-Level Administration Agreement, which include, among other things, class-level transfer agency andsub-transfer agency costs (collectively, the “Management Rates”). The Board also reviewed and considered the contractual investmentsub-advisory fee rates that are payable by Funds Management to theSub-Adviser for investmentsub-advisory services.
Among other information reviewed by the Board was a comparison of the Fund’s Management Rates with the average contractual investment management fee rates of funds in the expense Groups at a common asset level as well as transfer agency costs of the funds in the expense Groups. The Board noted that the Management Rates of the Fund were in range of the sum of these average rates for the Fund’s expense Groups for all share classes.
The Board also received and considered information about the portion of the total management fee that was retained by Funds Management after payment of the fee to theSub-Adviser forsub-advisory services. In assessing the reasonableness of this amount, the Board received and evaluated information about the nature and extent of responsibilities retained and risks assumed by Funds Management and not delegated to or assumed by theSub-Adviser, and about Funds Management’son-going oversight services. Given the affiliation between Funds Management and theSub-Adviser, the Board ascribed limited relevance to the allocation of fees between them.
The Board also received and considered information about the nature and extent of services offered and fee rates charged by Funds Management and theSub-Adviser to other types of clients with investment strategies similar to those of the Fund. In this regard, the Board received information about the significantly greater scope of services, and compliance, reporting and other legal burdens and risks of managing proprietary mutual funds compared with those associated with managing assets of other types of clients, including third-partysub-advised fund clients andnon-mutual fund clients such as institutional separate accounts.
Based on its consideration of the factors and information it deemed relevant, including those described here, the Board determined that the compensation payable to Funds Management under the Management Agreement and to theSub-Adviser under theSub-Advisory Agreement was reasonable.
Profitability
The Board received and considered information concerning the profitability of Funds Management, as well as the profitability of both WFAM and Wells Fargo & Co. (“Wells Fargo”) from providing services to the fund family as a whole. The Board noted that theSub-Adviser’s profitability information with respect to providing services to the Fund and other funds in the family was subsumed in the WFAM and Wells Fargo profitability analysis.
Funds Management reported on the methodologies and estimates used in calculating profitability, including a description of the methodology used to allocate certain expenses. Among other things, the Board noted that the levels of profitability
Wells Fargo Core Plus Bond Fund | 51
Other information (unaudited)
reported on afund-by-fund basis varied widely, depending on factors such as the size, type and age of fund. Based on its review, the Board did not deem the profits reported by Funds Management, WFAM or Wells Fargo from services provided to the Fund to be at a level that would prevent it from approving the continuation of the Advisory Agreements.
Economies of scale
The Board received and considered information about the potential for Funds Management to experience economies of scale in the provision of management services to the Fund, the difficulties of calculating economies of scale at an individual fund level, and the extent to which potential scale benefits are shared with shareholders. The Board noted the existence of breakpoints in the Fund’s management fee structure, which operate generally to reduce the Fund’s expense ratios as the Fund grows in size. The Board considered that in addition to management fee breakpoints, Funds Management shares potential economies of scale from its management business in a variety of ways, including through fee waiver and expense reimbursement arrangements, services that benefit shareholders, competitive management fee rates set at the outset without regard to breakpoints, and investments in the business intended to enhance services available to shareholders.
The Board concluded that Funds Management’s arrangements with respect to the Fund, including contractual breakpoints, constituted a reasonable approach to sharing potential economies of scale with the Fund and its shareholders.
Other Benefits to Funds Management and theSub-Adviser
The Board received and considered information regarding potential“fall-out” or ancillary benefits received by Funds Management and its affiliates, including theSub-Adviser, as a result of their relationships with the Fund. Ancillary benefits could include, among others, benefits directly attributable to other relationships with the Fund and benefits potentially derived from an increase in Funds Management’s and theSub-Adviser’s business as a result of their relationships with the Fund. The Board noted that various affiliates of Funds Management may receive distribution-related fees, shareholder servicing payments andsub-transfer agency fees in respect of shares sold or held through them and services provided.
The Board also reviewed information about soft dollar credits earned and utilized by theSub-Adviser, fees earned by Funds Management and theSub-Adviser from managing a private investment vehicle for the fund family’s securities lending collateral, and commissions earned by an affiliated broker from portfolio transactions.
Based on its consideration of the factors and information it deemed relevant, including those described here, the Board did not find that any ancillary benefits received by Funds Management and its affiliates, including theSub-Adviser, were unreasonable.
Conclusion
At the Meeting, after considering the above-described factors and based on its deliberations and its evaluation of the information described above, the Board unanimously approved the continuation of the Advisory Agreements for aone-year term and determined that the compensation payable to Funds Management and theSub-Adviser under each of the Advisory Agreements was reasonable.
52 | Wells Fargo Core Plus Bond Fund

For more information
More information about Wells Fargo Funds is available free upon request. To obtain literature, please write, visit the Fund’s website, or call:
Wells Fargo Funds
P.O. Box 219967
Kansas City, MO 64121-9967
Website:wfam.com
Individual investors:1-800-222-8222
Retail investment professionals:1-888-877-9275
Institutional investment professionals:1-866-765-0778

This report and the financial statements contained herein are submitted for the general information of the shareholders of the Fund. If this report is used for promotional purposes, distribution of the report must be accompanied or preceded by a current prospectus. Before investing, please consider the investment objectives, risks, charges, and expenses of the investment. For a current prospectus and, if available, a summary prospectus, containing this information, call1-800-222-8222 or visit the Fund’s website atwfam.com. Read the prospectus carefully before you invest or send money.
Wells Fargo Asset Management (WFAM) is the trade name for certain investment advisory/management firms owned by Wells Fargo & Company. These firms include but are not limited to Wells Capital Management Incorporated and Wells Fargo Funds Management, LLC. Certain products managed by WFAM entities are distributed by Wells Fargo Funds Distributor, LLC (a broker-dealer and Member FINRA).
This material is for general informational and educational purposes only and is NOT intended to provide investment advice or a recommendation of any kind—including a recommendation for any specific investment, strategy, or plan.
INVESTMENT PRODUCTS: NOT FDIC INSURED ◾ NO BANK GUARANTEE ◾ MAY LOSE VALUE
© 2019 Wells Fargo Funds Management, LLC. All rights reserved.
405805 10-19
A219/AR219 08-19
Annual Report
August 31, 2019
Wells Fargo
Short Duration Government Bond Fund
Beginning on January 1, 2021, as permitted by new regulations adopted by the Securities and Exchange Commission, paper copies of the Wells Fargo Funds’ annual and semi-annual shareholder reports issued after this date will no longer be sent by mail, unless you specifically request paper copies of the reports. Instead, the reports will be made available on the Funds’ website, and you will be notified by mail each time a report is posted and provided with a website address to access the report.
If you already elected to receive shareholder reports electronically, you will not be affected by this change and you need not take any action. You may elect to receive shareholder reports and other communications from the Fund electronically at any time by contacting your financial intermediary (such as a broker-dealer or bank) or, if you are a direct investor, by calling1-800-222-8222 or by enrolling at wellsfargo.com/advantagedelivery.
You may elect to receive all future reports in paper free of charge. If you invest through a financial intermediary, you can contact your financial intermediary to request that you continue to receive paper copies of your shareholder reports; if you invest directly with the Fund, you can call 1-800-222-8222. Your election to receive reports in paper will apply to all Wells Fargo Funds held in your account with your financial intermediary or, if you are a direct investor, to all Wells Fargo Funds that you hold.
|
|
|
Reduce clutter. Save trees. |
Sign up for electronic delivery of prospectuses and shareholder reports atwellsfargo.com/advantagedelivery |
The views expressed and any forward-looking statements are as of August 31, 2019, unless otherwise noted, and are those of the Fund managers and/or Wells Fargo Asset Management. Discussions of individual securities, or the markets generally, or any Wells Fargo Fund are not intended as individual recommendations. Future events or results may vary significantly from those expressed in any forward-looking statements. The views expressed are subject to change at any time in response to changing circumstances in the market. Wells Fargo Asset Management and the Fund disclaim any obligation to publicly update or revise any views expressed or forward-looking statements.
INVESTMENT PRODUCTS: NOT FDIC INSURED ◾ NO BANK GUARANTEE ◾ MAY LOSE VALUE
Wells Fargo Short Duration Government Bond Fund | 1
Letter to shareholders (unaudited)

Andrew Owen
President
Wells Fargo Funds
Dear Shareholder:
We are pleased to offer you this annual report for the Wells Fargo Short Duration Government Bond Fund for the 12-month period that ended August 31, 2019. After the first half of the period yielded either low-single-digit or negative investment returns, U.S. stock and global bond investors generally saw markets recover during the second half amid intensifying market volatility, global economic growth concerns, international trade staredowns, and simmering geopolitical tensions.
Overall, fixed-income investors enjoyed a distinct advantage over stock investors. For the period, U.S. stocks, based on the S&P 500 Index,1 gained 2.92% and international stocks, as measured by the MSCI ACWI ex USA Index (Net),2 fell 3.27%. The MSCI EM Index (Net)3 slipped 4.36%. Among fixed income investors, the Bloomberg Barclays U.S. Aggregate Bond Index4 added 10.17%, the Bloomberg Barclays Global Aggregate ex-USD Index5 added 5.71%, the Bloomberg Barclays Municipal Bond Index6 gained 8.72%, and the ICE BofAML U.S. High Yield Index7 added 6.58%.
Entering the fourth quarter of 2018, economic data was encouraging.
Entering the fourth quarter of 2018, there were reasons for investors to be optimistic. The U.S. Bureau of Economic Analysis reported U.S. gross domestic product (GDP) grew 4.2% on an annualized basis during the second quarter. Hiring improved. Unemployment declined. Consumer spending gained. Third-quarter corporate earnings reports were generally positive. U.S. trade negotiations with Mexico and Canada advanced. In September 2018, the U.S. Federal Reserve (Fed) raised the federal funds rate by 25 basis points (bps; 100 bps equal 1.00%) to a target range of between 2.00% and 2.25% in an indication of its confidence that U.S. economic growth was sustainable.
International markets presented numerous challenges. U.S.-China trade tensions increased. The U.S. imposed $200 billion in tariffs on Chinese goods. China reacted with $60 billion in tariffs on U.S. goods. Economic growth in China caused concern. In September 2018, international investors began to factor in a number of disconcerting economic and business data points: lower July manufacturing and industrial orders in Germany; declining purchasing managers’ index numbers for August from the United Kingdom, China, and India; and declining household spending for August in Japan. Taken together, the data fed growing concerns that global economic growth was slowing.
| 1 | The S&P 500 Index consists of 500 stocks chosen for market size, liquidity, and industry group representation. It is a market-value-weighted index with each stock’s weight in the index proportionate to its market value. You cannot invest directly in an index. |
| 2 | The Morgan Stanley Capital International (MSCI) All Country World Index (ACWI) ex USA Index (Net) is a free-float-adjusted market-capitalization weighted index that is designed to measure the equity market performance of developed and emerging markets, excluding the U.S. Source: MSCI. MSCI makes no express or implied warranties or representations and shall have no liability whatsoever with respect to any MSCI data contained herein. The MSCI data may not be further redistributed or used as a basis for other indices or any securities or financial products. This report is not approved, reviewed, or produced by MSCI. You cannot invest directly in an index. |
| 3 | The MSCI Emerging Markets (EM) Index (Net) is a free-float-adjusted market-capitalization-weighted index that is designed to measure the equity market performance of emerging markets. You cannot invest directly in an index. |
| 4 | The Bloomberg Barclays U.S. Aggregate Bond Index is a broad-based benchmark that measures the investment-grade, U.S. dollar-denominated, fixed-rate taxable bond market, including Treasuries, government-related and corporate securities, mortgage-backed securities (agency fixed-rate and hybrid adjustable-rate mortgage pass-throughs), asset-backed securities, and commercial mortgage-backed securities. You cannot invest directly in an index. |
| 5 | The Bloomberg Barclays Global Aggregate ex-USD Index is an unmanaged index that provides a broad-based measure of the global investment-grade fixed-income markets excluding the U.S. dollar-denominated debt market. You cannot invest directly in an index. |
| 6 | The Bloomberg Barclays Municipal Bond Index is an unmanaged index composed of long-term tax-exempt bonds with a minimum credit rating of Baa. You cannot invest directly in an index. |
| 7 | The ICE BofAML U.S. High Yield Index is a market-capitalization-weighted index of domestic and Yankee high-yield bonds. The index tracks the performance of high-yield securities traded in the U.S. bond market. You cannot invest directly in an index. Copyright 2019. ICE Data Indices, LLC. All rights reserved. |
2 | Wells Fargo Short Duration Government Bond Fund
Letter to shareholders (unaudited)
Investors had to digest unsettling events during the fourth quarter of 2018.
November’s U.S. midterm elections shifted control of the House of Representatives from Republicans to Democrats, presaging partisan clashes that followed and caused uncertainty among investors. A partial U.S. government shutdown driven by partisan policy disputes extended into January 2019. Third-quarter U.S. GDP was announced at an annualized 3.4% rate, lower than the second-quarter rate. Brexit efforts stalled. The value of the renminbi declined even as the People’s Bank of China cut reserve requirement ratios, accelerated infrastructure spending, and cut taxes in efforts to spur economic activity.
The combination of news in the U.S. and generally weak economic indicators outside of the U.S. caused investors to seek safe havens. December’s S&P 500 Index performance was the worst since 1931. Globally, fixed-income investments fared better than stocks during the last two months of the year. The Fed increased the federal funds rate by 25 bps in December 2018 to a target range of between 2.25% and 2.50% even as observers expressed concerns that higher rates could slow the economy.
The market climbs a wall of worry.
Investment returns appeared to reaffirm the adage that markets climb a wall of worry as 2019 opened. Following its December decline, the S&P 500 Index gained 8.01% for the month of January, the best monthly performance in 30 years. Returns for the MSCI ACWI ex USA Index (Net), the Bloomberg Barclays U.S. Aggregate Bond Index, and the Bloomberg Barclays Global Aggregate ex-USD Index also were positive.
In February 2019, signs of slowing global growth grew more ominous. The Bureau of Economic Analysis announced fourth-quarter 2018 GDP grew at an annualized 2.2% rate, down from the levels of the prior two quarters. In a February report, the Bank of England forecast the slowest growth for 2019 since the financial crisis. China and the U.S. continued to wrangle over trade issues. By the end of the first quarter of 2019, more accommodative Fed sentiment and steady, if not spectacular, U.S. economic and business metrics encouraged domestic investors.
Early second-quarter 2019 enthusiasm among investors faded.
During April 2019, favorable sentiment found additional support in reports of sustained low inflation, solid employment data, and first-quarter U.S. GDP of an annualized rate of 3.2%. During May, markets tumbled on mixed investment signals. In the U.S., partisan wrangling ramped up as Democrats and Republicans set their sights on 2020 presidential politics. The U.K.’s Brexit contretemps caused Prime Minister Theresa May to resign. Boris Johnson succeeded her only to exacerbate uncertainty about Brexit’s resolution ahead of an October 2019 deadline. The European Commission downgraded the 2019 growth forecast to 1.2%. The U.S. increased tariffs on products from China, China responded, and then talks broke down. President Donald Trump threatened to turn his foreign policy tariff tool to Mexico over immigration issues.
During the third quarter of 2019, investors regrouped. Just as the investment horizon appeared to darken, sentiment turned and U.S. equity markets gained during June and July. The gains, primarily driven by geopolitical and monetary policy events, pushed equity markets to new highs. European Central Bank President Mario Draghi said that if the outlook doesn’t improve, the bank would cut rates or buy more assets to prop up inflation. President Trump backed off of tariff threats against Mexico and China. In the U.S., the Fed implemented a 0.25% federal funds rate cut in July.
Later in July, the U.S. reversed course and threatened to impose higher tariffs on China’s exports after talks failed. China responded with tariff threats of its own and
“December’s S&P 500 Index performance was the worst since 1931.”
“Following its December decline, the S&P 500 Index gained 8.01% for the month of January, the best monthly performance in 30 years.”
Wells Fargo Short Duration Government Bond Fund | 3
Letter to shareholders (unaudited)
|
|
|
For further information about your Fund, contact your investment professional, visit our website at wfam.com, or call us directly at1-800-222-8222. |
devalued the renminbi, a move that roiled global markets. Major U.S. stock market indices closed July 2019 with the worst weekly results of the year. Bond prices gained as Treasury yields fell to levels not seen since November 2016 and the yield curve inverted at multiple points along the 30-year arc.
In a microcosm, August 2019 encapsulated many of the unnerving events that plagued investors during the prior 11 months. The U.S.-China trade relationship swung from discouraging to hopeful and back again with no evident compromise on the horizon. Evidence of a continued global economic slowdown continued to mount as central banks in China, New Zealand, and Thailand cut interest rates. Industrial and manufacturing data declined in China, Canada, Japan, and Germany. Adding to the uncertain environment, Italy’s prime minister resigned, many feared a crackdown in Hong Kong as protesters sustained their calls for reform throughout the month, and Boris Johnson planned to suspend Parliament as Brexit’s deadline neared.
Don’t let short-term uncertainty derail long-term investment goals.
Periods of investment uncertainty can present challenges, but experience has taught us that maintaining long-term investment goals can be an effective way to plan for the future. To help you create a sound strategy based on your personal goals and risk tolerance, Wells Fargo Funds offers more than 100 mutual funds spanning a wide range of asset classes and investment styles. Although diversification cannot guarantee an investment profit or prevent losses, we believe it can be an effective way to manage investment risk and potentially smooth out overall portfolio performance. We encourage investors to know their investments and to understand that appropriate levels of risk-taking may unlock opportunities.
Thank you for choosing to invest with Wells Fargo Funds. We appreciate your confidence in us and remain committed to helping you meet your financial needs.
Sincerely,

Andrew Owen
President
Wells Fargo Funds
4 | Wells Fargo Short Duration Government Bond Fund
This page is intentionally left blank.
Performance highlights (unaudited)
Investment objective
The Fund seeks to provide current income consistent with capital preservation.
Manager
Wells Fargo Funds Management, LLC
Subadviser
Wells Capital Management Incorporated
Portfolio managers
Maulik Bhansali, CFA®‡
Thomas O’Connor, CFA®‡
Jarad Vasquez
Average annual total returns (%) as of August 31, 2019
| | | | | | | | | | | | | | | | | | | | | | | | | | | | | | | | | | |
| | | | |
| | | | | Including sales charge | | | Excluding sales charge | | | Expense ratios1 (%) | |
| | | | | | | | | |
| | | Inception date | | 1 year | | | 5 year | | | 10 year | | | 1 year | | | 5 year | | | 10 year | | | Gross | | | Net2 | |
| | | | | | | | | | |
| Class A (MSDAX) | | 3-11-1996 | | | 1.84 | | | | 0.63 | | | | 1.11 | | | | 3.92 | | | | 1.04 | | | | 1.31 | | | | 0.80 | | | | 0.78 | |
| | | | | | | | | | |
| Class C (MSDCX) | | 5-31-2002 | | | 2.14 | | | | 0.29 | | | | 0.56 | | | | 3.14 | | | | 0.29 | | | | 0.56 | | | | 1.55 | | | | 1.53 | |
| | | | | | | | | | |
| Class R6 (MSDRX)3 | | 11-30-2012 | | | – | | | | – | | | | – | | | | 4.34 | | | | 1.48 | | | | 1.75 | | | | 0.42 | | | | 0.37 | |
| | | | | | | | | | |
| Administrator Class (MNSGX) | | 12-18-1992 | | | – | | | | – | | | | – | | | | 4.10 | | | | 1.22 | | | | 1.52 | | | | 0.74 | | | | 0.60 | |
| | | | | | | | | | |
| Institutional Class (WSGIX) | | 4-8-2005 | | | – | | | | – | | | | – | | | | 4.29 | | | | 1.41 | | | | 1.70 | | | | 0.47 | | | | 0.42 | |
| | | | | | | | | | |
| Bloomberg Barclays U.S. 1-3 Year Government Bond Index4 | | – | | | – | | | | – | | | | – | | | �� | 4.41 | | | | 1.35 | | | | 1.24 | | | | – | | | | – | |
Figures quoted represent past performance, which is no guarantee of future results, and do not reflect taxes that a shareholder may pay on fund distributions or the redemption of fund shares. Investment return and principal value of an investment will fluctuate so that an investor’s shares, when redeemed, may be worth more or less than their original cost. Performance shown without sales charges would be lower if sales charges were reflected. Current performance may be lower or higher than the performance data quoted, which assumes the reinvestment of dividends and capital gains. Current month-end performance is available on the Fund’s website,wfam.com.
Index returns do not include transaction costs associated with buying and selling securities, any mutual fund fees or expenses, or any taxes. It is not possible to invest directly in an index.
For Class A shares, the maximum front-end sales charge is 2.00%. For Class C shares, the maximum contingent deferred sales charge is 1.00%. Performance including a contingent deferred sales charge assumes the sales charge for the corresponding time period. Class R6, Administrator Class, and Institutional Class shares are sold without a front-end sales charge or contingent deferred sales charge.
Bond values fluctuate in response to the financial condition of individual issuers, general market and economic conditions, and changes in interest rates. Changes in market conditions and government policies may lead to periods of heightened volatility in the bond market and reduced liquidity for certain bonds held by the Fund. In general, when interest rates rise, bond values fall and investors may lose principal value. Interest-rate changes and their impact on the Fund and its share price can be sudden and unpredictable. Securities issued by U.S. government agencies or government sponsored entities may not be guaranteed by the U.S. Treasury. Certain investment strategies tend to increase the total risk of an investment (relative to the broader market). The Fund is exposed to mortgage- and asset-backed securities risk. The U.S. government guarantee applies to certain underlying securities and not to shares of the Fund. Consult the Fund’s prospectus for additional information on these and other risks.
Please see footnotes on page 7.
6 | Wells Fargo Short Duration Government Bond Fund
Performance highlights (unaudited)
|
|
| Growth of $10,000 investment as of August 31, 20195 |
|
|
| ‡ | CFA® and Chartered Financial Analyst® are trademarks owned by CFA Institute. |
| 1 | Reflects the expense ratios as stated in the most recent prospectuses. The expense ratios shown are subject to change and may differ from the annualized expense ratios shown in the financial highlights of this report. |
| 2 | The manager has contractually committed through December 31, 2019, to waive fees and/or reimburse expenses to the extent necessary to cap the expenses of each class after fee waivers at the amounts shown. Brokerage commissions, stamp duty fees, interest, taxes, acquired fund fees and expenses (if any), and extraordinary expenses are excluded from the expense cap. Prior to or after the commitment expiration date, the cap may be increased or the commitment to maintain the cap may be terminated only with the approval of the Board of Trustees. Without this cap, the Fund’s returns would have been lower. The expense ratio paid by an investor is the net expense ratio (the total annual fund operating expenses after fee waivers) as stated in the prospectuses. |
| 3 | Historical performance shown for Class R6 shares prior to their inception reflects the performance of Institutional Class shares and includes the higher expenses applicable to Institutional Class shares. If these expenses had not been included, returns for Class R6 shares would be higher. |
| 4 | The Bloomberg Barclays U.S. 1–3 Year Government Bond Index is composed of all publicly issued, nonconvertible domestic debt of the U.S. government and its agencies. The index also includes corporate debt guaranteed by the U.S. government. Only notes and bonds with a minimum maturity of one year up to a maximum maturity of 2.9 years are included. You cannot invest directly in an index. |
| 5 | The chart compares the performance of Class A shares for the most recent ten years with the performance of the Bloomberg Barclays U.S. 1–3 Year Government Bond Index. The chart assumes a hypothetical investment of $10,000 in Class A shares and reflects all operating expenses and assumes the maximum initial sales charge of 2.00%. |
| 6 | The ten largest holdings, excluding cash, cash equivalents and any money market funds, are calculated based on the value of the investments divided by total net assets of the Fund. Holdings are subject to change and may have changed since the date specified. |
| 7 | The S&P 500 Index consists of 500 stocks chosen for market size, liquidity, and industry group representation. It is a market-value-weighted index with each stock’s weight in the index proportionate to its market value. You cannot invest directly in an index. |
| 8 | Amounts are calculated based on the total long-term investments of the Fund. These amounts are subject to change and may have changed since the date specified. |
Wells Fargo Short Duration Government Bond Fund | 7
Performance highlights (unaudited)
MANAGER’S DISCUSSION
Fund highlights
| ∎ | | The Fund underperformed its benchmark, the Bloomberg Barclays U.S. 1–3 Year Government Bond Index, for the 12-month period that ended August 31, 2019. |
| ∎ | | Positioning and security selection within agency mortgage-backed pass-through securities detracted from performance as the interest rate sensitivity associated with these positions weighed on performance. |
| ∎ | | The Fund has out-of-benchmark allocations to high-quality asset-backed securities (ABS) and commercial mortgage-backed securities (CMBS), which detracted from performance toward the end of 2018. |
| ∎ | | Security selection and positioning in agency mortgage-backed securities (MBS), specifically within high-coupon specified pools, adjustable-rate mortgages (ARMs), and collateralized mortgage obligations (CMOs), contributed to performance. |
| | | | |
| |
| Ten largest holdings (%) as of August 31, 20196 | | | |
| | |
U.S. Treasury Note, 2.75%, 4-30-2023 | | | 5.37 | |
| | |
U.S. Treasury Note, 2.13%, 8-15-2021 | | | 4.73 | |
| | |
U.S. Treasury Note, 2.13%, 5-31-2021 | | | 4.53 | |
| | |
U.S. Treasury Note, 1.50%, 8-15-2022 | | | 4.20 | |
| | |
GNMA, 5.00%, 4-20-2049 | | | 3.61 | |
| | |
U.S. Treasury Note, 1.75%, 7-15-2022 | | | 3.33 | |
| | |
U.S. Treasury Note, 2.13%, 5-15-2022 | | | 3.19 | |
| | |
FNMA, 2.50%, 6-1-2029 | | | 3.12 | |
| | |
FNMA, 5.00%, 1-1-2049 | | | 2.33 | |
| | |
U.S. Treasury Note, 1.88%, 8-31-2022 | | | 2.25 | |
The economy and markets were favorable.
Early during the period, the U.S. economy began to cool amid signals of a synchronized deceleration of global growth and weakness in China and parts of Europe. Despite this, and with trade and political risks mounting, stocks rose to new highs and market participants were keenly focused on a growing economy and monetary policy, including forecasts for rate hikes to extend through 2020. Fixed-income markets also performed well, while rates trended somewhat higher despite inflationary pressures remaining nonexistent.
Across the Pacific, President Donald Trump met with North Korean leader Kim Jong Un in Singapore as planned in the first-ever summit meeting between leaders of the
contending nations. Meanwhile, The Bank of Japan tweaked its long-running monetary stimulus program in potentially a step toward normalization. On the trade front, as previously signaled and with the looming deadline for implementation, the Trump administration slapped tariffs on $200 billion in Chinese goods while China responded with duties of its own on $60 billion in U.S. goods.
In Europe, political risks were averted as Italy finalized its budget with the European Commission, although Brexit negotiations stalled in Parliament despite the travails of Theresa May. The Turkish financial system and the Turkish lira fell under significant pressure during the summer months, exacerbating a broader slide in emerging markets. Parts of Europe are in recession, with the major centers of economic activity registering anemic growth.
Toward year-end, credit spreads began to widen despite solid reports of gross domestic product and with the unemployment rate touching a 45-year low. Following the U.S. elections in November that drew a record number of voters to the polls, Democrats seized control of the House of Representatives while Republicans held onto the Senate in what was seen by many as a national referendum on President Trump. As anticipated, the U.S. Federal Reserve (Fed) unanimously decided to raise its key federal funds rate in December, the third hike of the year and, as it turns out, perhaps the last one for quite a while. Stocks plunged in December amid a ferocious flight to quality. Following a refusal by President Trump to sign the Senate’s version of a short-term spending bill, the federal government partially shut down just prior to the Christmas holiday and remained shuttered for over a month.
As we moved into 2019, a more tepid Fed completely reversed course, sounding off a more dovish tone. Stock and credit markets rebounded in spectacular fashion, with the S&P 500 Index7 posting its best January since 1987. The yield curve inverted somewhat during the first weeks of the year, perhaps a harbinger of the slowdown emerging as a result of trade tensions between the U.S. and China, among other influences. Futures markets indicated a rate cut in the intermediate term, an astounding reversal of conditions heading into year-end.
The return of interest rate and spread volatility set the stage for strong security selection opportunities early during 2019. Despite the reversal of stock prices and credit amid the actions of Fed Chairman Jay Powell and the Federal Open Market Committee, we believe that volatile conditions remain firmly in place, with doubts surrounding resolution of trade and political risks, while the global economy continues to sputter. The Fed seems intent on lowering rates in a preemptive move, giving rise to dissention among investors who are concerned about impacts on the consumer and prepayment activity, notably in the mortgage-backed securities (MBS) sector of the fixed-income market. We look forward to employing our risk-constrained investment process in what could be very disorderly markets laden with inefficiently priced securities.
Please see footnotes on page 7.
8 | Wells Fargo Short Duration Government Bond Fund
Performance highlights (unaudited)
|
|
| Portfolio allocation as of August 31, 20198 |
|
 |
Portfolio positioning continues to be driven by our bottom-up research and selection.
We ended the year with approximately 13% of the portfolio in agency collateralized mortgage obligations (CMOs), 11% in high-quality ABS and CMBS, 33% in agency mortgage-backed pass-through securities, 10% in mortgage hybrid adjustable-rate mortgages (ARMs), 6% in non-agency MBS, and the remainder in U.S. Treasury and agency debt. We remain overweight the MBS, ABS, and CMBS sectors and underweight the agency and U.S. Treasury sectors. Throughout the month and driven by bottom-up security selection opportunities, we maintained an overweight to longer-duration risk and an underweight to two-year risk versus the benchmark.
We decreased agency MBS exposure, offset by purchasing floating-rate CMOs as we looked to defend the MBS portfolio from prepayment risks. We ramped up agency hybrid ARM exposure as well because ARM spreads held in well relative to fixed-rate MBS and offered value. Within agency pass-through securities, we’ve favored higher-coupon, specified pools, including pools focused on low loan balance mortgages and loans originated in New York state. Our nongovernment exposure remained constant during the year despite active rotation between sectors.
Our outlook is cautious.
The U.S. economy appeared to further decelerate in August, sustaining a trend beginning early in the second quarter. Manufacturing slowed noticeably amid trade tensions and concerns with The Boeing Company’s production, and nonresidential construction pulled back sharply. A softer picture for consumption also began to emerge early in the third quarter, with housing showing signs of a continued slowdown. Beginning in August, however, there were early indications that the recent plunge in interest rates may support consumer durables sectors like autos, while a pickup in mortgage refinancing could improve discretionary income and somewhat stabilize fragile housing markets. Job growth also was sustained, albeit at slower run rates. International growth indicators, while remaining on the soft side, appeared to be stabilizing after weakening noticeably in the second quarter and early in the third. Signs of renewed trade tensions also reemerged in August, although there is some possibility that a pain point has been reached that could help bring parties back to the table in October. The most recent round of tariffs is expected to be implemented in early October, with an uncertain effect on the economy.
As the global economy showed signs of slowing, U.S. and global inflation continued to be on the soft side. Measures of U.S. consumer prices firmed somewhat during the closing months of the period after a particularly weak start to the year, with hourly earnings picking up although producer prices softened anew in light of the persistent strength of the dollar and, to a lesser extent, other developed market currencies relative to emerging markets. In international markets such as Europe and Japan, inflation remains well below central banks’ targets.
Given these developments, monetary policymakers began to respond. The Fed pivoted to a more accommodative stance at its June 2019 meeting and delivered a 25 basis-point (bp; 100 bps equal 1.00%) rate cut in July, the first in over 10 years, and market participants expect another cut in September. The European Central Bank is expected to announce further policy measures at its September meeting, which could entail more negative rates and possibly a restart of quantitative easing programs along with implementation of a tiered rate system to relieve pressure on banks’ net interest margins. One particular risk for market participants is calibration of mixed messaging from policy officials. While there is a sense that easing could occur should data continue to weaken, with more aggressive policy changes than seen in past economic cycles, calibration versus expectations is also key. Policymakers, particularly in the U.S., seem keen to make mid-cycle calibrations rather than larger moves unless further economic weakness is seen. On the other hand, the recent Jackson Hole conference of global monetary policy officials revealed broad dissatisfaction with the status quo, which could portend some possibility of paradigm shifts in the form of new and innovative policy proposals over the coming quarters.
For the balance of the third quarter, market participants may be closely calibrating incoming data versus likely policy reactions as well as event risks emerging from trade talks and political topics like Brexit. Government bond markets, following a sharp rally in the third quarter, could be overpricing the risks to the global economy, although some premium paid for bonds’ portfolio insurance value could be warranted. High valuations in the equity markets, while looking perhaps more stable in the near term, could alternatively be vulnerable should economic data continue to weaken.
Consistent with our bottom-up process, we maintain a neutral duration. We remain nimble and agile, and we stand ready to take advantage of security selection opportunities as they arise.
Please see footnotes on page 7.
Wells Fargo Short Duration Government Bond Fund | 9
Fund expenses (unaudited)
As a shareholder of the Fund, you incur two types of costs: (1) transaction costs, including sales charges (loads) on purchase payments and contingent deferred sales charges (if any) on redemptions and (2) ongoing costs, including management fees, distribution (12b-1) and/or shareholder servicing fees, and other Fund expenses. This example is intended to help you understand your ongoing costs (in dollars) of investing in the Fund and to compare these costs with the ongoing costs of investing in other mutual funds.
The example is based on an investment of $1,000 invested at the beginning of the six-month period and held for the entire period from March 1, 2019 to August 31, 2019.
Actual expenses
The “Actual” line of the table below provides information about actual account values and actual expenses. You may use the information in this line, together with the amount you invested, to estimate the expenses that you paid over the period. Simply divide your account value by $1,000 (for example, an $8,600 account value divided by $1,000 = 8.6), then multiply the result by the number in the “Actual” line under the heading entitled “Expenses paid during period” for your applicable class of shares to estimate the expenses you paid on your account during this period.
Hypothetical example for comparison purposes
The “Hypothetical” line of the table below provides information about hypothetical account values and hypothetical expenses based on the Fund’s actual expense ratio and an assumed rate of return of 5% per year before expenses, which is not the Fund’s actual return. The hypothetical account values and expenses may not be used to estimate the actual ending account balance or expenses you paid for the period. You may use this information to compare the ongoing costs of investing in the Fund and other funds. To do so, compare this 5% hypothetical example with the 5% hypothetical examples that appear in the shareholder reports of the other funds.
Please note that the expenses shown in the table are meant to highlight your ongoing costs only and do not reflect any transactional costs, such as sales charges (loads) and contingent deferred sales charges. Therefore, the “Hypothetical” line of the table is useful in comparing ongoing costs only and will not help you determine the relative total costs of owning different funds. In addition, if these transactional costs were included, your costs would have been higher.
| | | | | | | | | | | | | | | | |
| | | Beginning
account value
3-1-2019 | | | Ending
account value
8-31-2019 | | | Expenses
paid during
the period¹ | | | Annualized net
expense ratio | |
| | | | | |
Class A | | | | | | | | | | | | | | | | |
| | | | |
Actual | | $ | 1,000.00 | | | $ | 1,026.99 | | | $ | 3.98 | | | | 0.78 | % |
| | | | |
Hypothetical (5% return before expenses) | | $ | 1,000.00 | | | $ | 1,021.27 | | | $ | 3.97 | | | | 0.78 | % |
| | | | | |
Class C | | | | | | | | | | | | | | | | |
| | | | |
Actual | | $ | 1,000.00 | | | $ | 1,023.09 | | | $ | 7.80 | | | | 1.53 | % |
| | | | |
Hypothetical (5% return before expenses) | | $ | 1,000.00 | | | $ | 1,017.49 | | | $ | 7.78 | | | | 1.53 | % |
| | | | | |
Class R6 | | | | | | | | | | | | | | | | |
| | | | |
Actual | | $ | 1,000.00 | | | $ | 1,029.04 | | | $ | 1.89 | | | | 0.37 | % |
| | | | |
Hypothetical (5% return before expenses) | | $ | 1,000.00 | | | $ | 1,023.34 | | | $ | 1.89 | | | | 0.37 | % |
| | | | | |
Administrator Class | | | | | | | | | | | | | | | | |
| | | | |
Actual | | $ | 1,000.00 | | | $ | 1,027.90 | | | $ | 3.07 | | | | 0.60 | % |
| | | | |
Hypothetical (5% return before expenses) | | $ | 1,000.00 | | | $ | 1,022.18 | | | $ | 3.06 | | | | 0.60 | % |
| | | | | |
Institutional Class | | | | | | | | | | | | | | | | |
| | | | |
Actual | | $ | 1,000.00 | | | $ | 1,028.82 | | | $ | 2.15 | | | | 0.42 | % |
| | | | |
Hypothetical (5% return before expenses) | | $ | 1,000.00 | | | $ | 1,023.09 | | | $ | 2.14 | | | | 0.42 | % |
| 1 | Expenses paid is equal to the annualized net expense ratio of each class multiplied by the average account value over the period, multiplied by the number of days in the most recent fiscal half-year divided by the number of days in the fiscal year (to reflect the one-half-year period). |
10 | Wells Fargo Short Duration Government Bond Fund
Portfolio of investments—August 31, 2019
| | | | | | | | | | | | | | | | |
| | | Interest
rate | | | Maturity date | | | Principal | | | Value | |
| Agency Securities: 54.96% | | | | | | | | | | | | |
| | | | |
FHLMC (12 Month LIBOR +1.65%)± | | | 2.34 | % | | | 3-1-2043 | | | $ | 1,697,818 | | | $ | 1,713,346 | |
| | | | |
FHLMC (12 Month LIBOR +1.84%)± | | | 3.40 | | | | 5-1-2042 | | | | 2,050,827 | | | | 2,105,897 | |
| | | | |
FHLMC (12 Month LIBOR +1.64%)± | | | 3.59 | | | | 2-1-2049 | | | | 556,079 | | | | 575,928 | |
| | | | |
FHLMC | | | 4.00 | | | | 10-1-2033 | | | | 674,849 | | | | 724,714 | |
| | | | |
FHLMC | | | 4.00 | | | | 1-1-2034 | | | | 618,364 | | | | 664,035 | |
| | | | |
FHLMC | | | 4.00 | | | | 5-15-2039 | | | | 1,228,971 | | | | 1,246,965 | |
| | | | |
FHLMC | | | 4.00 | | | | 10-1-2048 | | | | 538,917 | | | | 559,539 | |
| | | | |
FHLMC | | | 4.00 | | | | 11-1-2048 | | | | 1,681,467 | | | | 1,744,849 | |
| | | | |
FHLMC | | | 4.50 | | | | 4-1-2031 | | | | 1,346,205 | | | | 1,442,293 | |
| | | | |
FHLMC Multifamily Structured Pass-Through Certificates Series KI02 Class A (1 Month LIBOR +0.20%)± | | | 2.42 | | | | 2-25-2023 | | | | 2,116,610 | | | | 2,113,568 | |
| | | | |
FHLMC Series 3632 Class PK | | | 5.00 | | | | 2-15-2040 | | | | 3,795,791 | | | | 4,153,194 | |
| | | | |
FHLMC Series 3653 Class AU | | | 4.00 | | | | 4-15-2040 | | | | 1,341,705 | | | | 1,452,235 | |
| | | | |
FHLMC Series 3738 Class BP | | | 4.00 | | | | 12-15-2038 | | | | 1,539,679 | | | | 1,567,625 | |
| | | | |
FHLMC Series 4239 Class AB | | | 4.00 | | | | 12-15-2039 | | | | 1,096,010 | | | | 1,122,231 | |
| | | | |
FHLMC Series 4891 Class PA | | | 3.50 | | | | 7-15-2048 | | | | 4,306,567 | | | | 4,416,731 | |
| | | | |
FHLMC Series 4897 Class F (1 Month LIBOR +0.40%)± | | | 2.60 | | | | 7-15-2049 | | | | 1,461,583 | | | | 1,461,384 | |
| | | | |
FNMA | | | 2.00 | | | | 3-25-2028 | | | | 1,895,892 | | | | 1,900,859 | |
| | | | |
FNMA (12 Month LIBOR +1.69%)± | | | 2.42 | | | | 11-1-2042 | | | | 3,282,451 | | | | 3,315,743 | |
| | | | |
FNMA | | | 2.50 | | | | 5-1-2028 | | | | 4,908,947 | | | | 4,992,389 | |
| | | | |
FNMA | | | 2.50 | | | | 6-1-2029 | | | | 17,392,512 | | | | 17,625,788 | |
| | | | |
FNMA | | | 2.50 | | | | 11-1-2031 | | | | 6,928,242 | | | | 7,036,083 | |
| | | | |
FNMA (12 Month LIBOR +1.60%)± | | | 2.55 | | | | 10-1-2046 | | | | 4,863,213 | | | | 4,932,789 | |
| | | | |
FNMA (12 Month LIBOR +1.59%)± | | | 2.66 | | | | 1-1-2046 | | | | 3,383,865 | | | | 3,442,492 | |
| | | | |
FNMA (12 Month LIBOR +1.58%)± | | | 2.68 | | | | 2-1-2046 | | | | 4,657,144 | | | | 4,728,775 | |
| | | | |
FNMA (12 Month LIBOR +1.57%)± | | | 2.69 | | | | 3-1-2045 | | | | 2,903,256 | | | | 2,956,670 | |
| | | | |
FNMA (12 Month LIBOR +1.60%)± | | | 2.73 | | | | 1-1-2045 | | | | 1,203,044 | | | | 1,223,732 | |
| | | | |
FNMA (12 Month LIBOR +1.61%)± | | | 2.74 | | | | 3-1-2047 | | | | 6,584,713 | | | | 6,709,683 | |
| | | | |
FNMA (12 Month LIBOR +1.58%)± | | | 2.75 | | | | 6-1-2045 | | | | 2,927,072 | | | | 2,986,677 | |
| | | | |
FNMA (12 Month LIBOR +1.57%)± | | | 2.75 | | | | 3-1-2045 | | | | 1,795,406 | | | | 1,831,119 | |
| | | | |
FNMA (12 Month LIBOR +1.60%)± | | | 2.90 | | | | 7-1-2046 | | | | 10,070,841 | | | | 10,263,491 | |
| | | | |
FNMA (12 Month LIBOR +1.60%)± | | | 2.95 | | | | 8-1-2047 | | | | 4,045,365 | | | | 4,131,207 | |
| | | | |
FNMA (12 Month LIBOR +1.61%)± | | | 3.07 | | | | 6-1-2047 | | | | 4,052,590 | | | | 4,142,333 | |
| | | | |
FNMA %% | | | 3.50 | | | | 9-12-2049 | | | | 11,900,000 | | | | 12,230,969 | |
| | | | |
FNMA (12 Month LIBOR +1.61%)± | | | 3.53 | | | | 5-1-2049 | | | | 91,866 | | | | 95,029 | |
| | | | |
FNMA (12 Month LIBOR +1.62%)± | | | 3.82 | | | | 9-1-2048 | | | | 77,795 | | | | 81,425 | |
| | | | |
FNMA (12 Month LIBOR +1.61%)± | | | 3.85 | | | | 12-1-2048 | | | | 22,756 | | | | 23,883 | |
| | | | |
FNMA | | | 4.00 | | | | 4-1-2032 | | | | 598,612 | | | | 642,463 | |
| | | | |
FNMA | | | 4.00 | | | | 10-1-2033 | | | | 963,410 | | | | 1,027,020 | |
| | | | |
FNMA | | | 4.00 | | | | 1-1-2034 | | | | 5,386,132 | | | | 5,742,645 | |
| | | | |
FNMA | | | 4.00 | | | | 1-1-2034 | | | | 4,714,142 | | | | 5,019,261 | |
| | | | |
FNMA | | | 4.00 | | | | 2-1-2034 | | | | 5,440,630 | | | | 5,760,504 | |
| | | | |
FNMA | | | 4.00 | | | | 7-1-2034 | | | | 1,242,132 | | | | 1,316,855 | |
| | | | |
FNMA | | | 4.00 | | | | 1-1-2049 | | | | 12,056,813 | | | | 12,504,770 | |
| | | | |
FNMA | | | 4.50 | | | | 2-1-2034 | | | | 1,368,238 | | | | 1,457,330 | |
| | | | |
FNMA | | | 4.50 | | | | 9-1-2037 | | | | 639,368 | | | | 696,914 | |
| | | | |
FNMA | | | 4.50 | | | | 3-1-2049 | | | | 4,232,941 | | | | 4,529,616 | |
| | | | |
FNMA | | | 5.00 | | | | 10-1-2040 | | | | 1,202,762 | | | | 1,339,294 | |
| | | | |
FNMA | | | 5.00 | | | | 5-1-2046 | | | | 468,960 | | | | 521,412 | |
| | | | |
FNMA | | | 5.00 | | | | 8-1-2048 | | | | 3,254,577 | | | | 3,563,680 | |
| | | | |
FNMA | | | 5.00 | | | | 1-1-2049 | | | | 12,052,022 | | | | 13,165,390 | |
The accompanying notes are an integral part of these financial statements.
Wells Fargo Short Duration Government Bond Fund | 11
Portfolio of investments—August 31, 2019
| | | | | | | | | | | | | | | | |
| | | Interest
rate | | | Maturity date | | | Principal | | | Value | |
| Agency Securities (continued) | | | | | | | | | | | | |
| | | | |
FNMA | | | 5.00 | % | | | 1-1-2049 | | | $ | 5,687,688 | | | $ | 6,246,114 | |
| | | | |
FNMA | | | 5.00 | | | | 2-1-2049 | | | | 265,567 | | | | 290,103 | |
| | | | |
FNMA | | | 5.00 | | | | 3-1-2049 | | | | 535,503 | | | | 586,367 | |
| | | | |
FNMA | | | 5.00 | | | | 3-1-2049 | | | | 2,028,595 | | | | 2,207,423 | |
| | | | |
FNMA | | | 5.00 | | | | 8-1-2049 | | | | 7,519,459 | | | | 8,278,405 | |
| | | | |
FNMA | | | 5.50 | | | | 6-1-2049 | | | | 7,601,186 | | | | 8,568,189 | |
| | | | |
FNMA Series2009-20 Class DT | | | 4.50 | | | | 4-25-2039 | | | | 1,887,075 | | | | 2,096,085 | |
| | | | |
FNMA Series2011-14 Class GD | | | 4.00 | | | | 4-25-2040 | | | | 2,799,776 | | | | 2,892,153 | |
| | | | |
FNMA Series2013-103 Class H | | | 4.50 | | | | 3-25-2038 | | | | 1,967,467 | | | | 2,023,422 | |
| | | | |
FNMA Series2013-90 Class A | | | 4.00 | | | | 11-25-2038 | | | | 2,746,124 | | | | 2,779,135 | |
| | | | |
FNMA Series2015-57 Class AB | | | 3.00 | | | | 8-25-2045 | | | | 3,066,505 | | | | 3,184,342 | |
| | | | |
FNMA Series2018-86 Class MF (1 Month LIBOR +0.30%)± | | | 2.45 | | | | 12-25-2048 | | | | 7,081,839 | | | | 7,042,112 | |
| | | | |
FNMA Series2019-13 Class FG (1 Month LIBOR +0.40%)± | | | 2.55 | | | | 4-25-2049 | | | | 2,997,358 | | | | 3,001,734 | |
| | | | |
FNMA Series2019-18 Class FA (1 Month LIBOR +0.45%)± | | | 2.60 | | | | 5-25-2049 | | | | 2,339,773 | | | | 2,343,572 | |
| | | | |
FNMA Series2019-18 Class FB (1 Month LIBOR +0.45%)± | | | 2.60 | | | | 5-25-2049 | | | | 2,745,013 | | | | 2,749,644 | |
| | | | |
FNMA Series2019-18 Class FE (1 Month LIBOR +0.35%)± | | | 2.50 | | | | 5-25-2049 | | | | 5,468,135 | | | | 5,460,139 | |
| | | | |
FNMA Series2019-6 Class FA (1 Month LIBOR +0.40%)± | | | 2.55 | | | | 3-25-2049 | | | | 4,828,495 | | | | 4,826,435 | |
| | | | |
FNMA Series 4853 Class FG (1 Month LIBOR +0.40%)± | | | 2.60 | | | | 4-15-2038 | | | | 1,879,249 | | | | 1,878,246 | |
| | | | |
GNMA | | | 4.50 | | | | 2-20-2049 | | | | 4,704,116 | | | | 5,012,071 | |
| | | | |
GNMA | | | 4.50 | | | | 4-20-2049 | | | | 1,081,610 | | | | 1,152,942 | |
| | | | |
GNMA | | | 5.00 | | | | 10-15-2039 | | | | 1,148,592 | | | | 1,286,195 | |
| | | | |
GNMA | | | 5.00 | | | | 3-20-2048 | | | | 2,745,200 | | | | 2,920,356 | |
| | | | |
GNMA | | | 5.00 | | | | 6-20-2048 | | | | 355,601 | | | | 389,148 | |
| | | | |
GNMA | | | 5.00 | | | | 6-20-2048 | | | | 225,472 | | | | 244,539 | |
| | | | |
GNMA | | | 5.00 | | | | 7-20-2048 | | | | 268,329 | | | | 289,894 | |
| | | | |
GNMA | | | 5.00 | | | | 9-20-2048 | | | | 1,899,300 | | | | 2,049,977 | |
| | | | |
GNMA | | | 5.00 | | | | 3-20-2049 | | | | 555,549 | | | | 602,382 | |
| | | | |
GNMA | | | 5.00 | | | | 3-20-2049 | | | | 2,633,135 | | | | 2,833,310 | |
| | | | |
GNMA | | | 5.00 | | | | 4-20-2049 | | | | 19,409,692 | | | | 20,445,533 | |
| | | | |
GNMA | | | 5.00 | | | | 4-20-2049 | | | | 3,841,569 | | | | 4,167,391 | |
| | | | |
GNMA | | | 5.00 | | | | 5-20-2049 | | | | 95,145 | | | | 100,586 | |
| | | | |
GNMA | | | 5.00 | | | | 5-20-2049 | | | | 3,177,387 | | | | 3,444,551 | |
| | | | |
GNMA | | | 5.50 | | | | 8-20-2049 | | | | 6,461,000 | | | | 6,888,589 | |
| | | | |
GNMA Series2011-137 Class WA±± | | | 5.56 | | | | 7-20-2040 | | | | 2,710,764 | | �� | | 3,120,125 | |
| | | | |
GNMA Series2012-141 Class WD±± | | | 4.97 | | | | 7-20-2040 | | | | 2,437,426 | | | | 2,726,050 | |
| | | | |
GNMA Series2017-99 Class DE | | | 2.50 | | | | 7-20-2045 | | | | 3,781,738 | | | | 3,811,737 | |
| | | | |
GNMA Series2018-153 Class FQ (1 Month LIBOR +0.30%)± | | | 2.47 | | | | 11-20-2048 | | | | 1,209,784 | | | | 1,205,090 | |
| | | | |
GNMA Series2018-36 Class KC | | | 3.00 | | | | 2-20-2046 | | | | 2,713,059 | | | | 2,774,695 | |
| | | | |
Total Agency Securities (Cost $308,347,976) | | | | | | | | | | | | | | | 310,921,605 | |
| | | | | | | | | | | | | | | | |
| | | | |
| Asset-Backed Securities: 12.84% | | | | | | | | | | | | |
| | | | |
Bank of The West Auto Trust Series2019-1 Class A4 144A | | | 2.51 | | | | 10-15-2024 | | | | 1,316,000 | | | | 1,338,390 | |
| | | | |
Ford Credit Auto Owner Trust Series2017-1 Class A 144A | | | 2.62 | | | | 8-15-2028 | | | | 6,085,000 | | | | 6,190,448 | |
| | | | |
Ford Credit Auto Owner Trust Series2017-2 Class A 144A | | | 2.36 | | | | 3-15-2029 | | | | 2,368,000 | | | | 2,399,337 | |
| | | | |
Hertz Vehicle Financing LLC Series2015-3A Class A 144A | | | 2.67 | | | | 9-25-2021 | | | | 2,652,000 | | | | 2,663,845 | |
| | | | |
Hertz Vehicle Financing LLC Series2016-4A Class A 144A | | | 2.65 | | | | 7-25-2022 | | | | 2,651,000 | | | | 2,665,551 | |
| | | | |
Hertz Vehicle Financing LLC Series2019-1A Class A 144A | | | 3.71 | | | | 3-25-2023 | | | | 5,889,000 | | | | 6,086,903 | |
| | | | |
Navient Student Loan Trust Series2014-CTA Class A (1 Month LIBOR +0.70%) 144A± | | | 2.90 | | | | 9-16-2024 | | | | 1,362,298 | | | | 1,363,120 | |
| | | | |
Nelnet Student Loan Trust Series2004-4 Class A5 (3 Month LIBOR +0.16%)± | | | 2.44 | | | | 1-25-2037 | | | | 3,900,750 | | | | 3,807,773 | |
The accompanying notes are an integral part of these financial statements.
12 | Wells Fargo Short Duration Government Bond Fund
Portfolio of investments—August 31, 2019
| | | | | | | | | | | | | | | | |
| | | Interest
rate | | | Maturity date | | | Principal | | | Value | |
| | | | |
| Asset-Backed Securities (continued) | | | | | | | | | | | | |
| | | | |
Nelnet Student Loan Trust Series2012-1A Class A (1 Month LIBOR +0.80%) 144A± | | | 2.95 | % | | | 12-27-2039 | | | $ | 2,406,507 | | | $ | 2,399,593 | |
| | | | |
Nelnet Student Loan Trust Series2016-1A Class A (1 Month LIBOR +0.80%) 144A± | | | 2.95 | | | | 9-25-2065 | | | | 5,384,598 | | | | 5,410,911 | |
| | | | |
Nelnet Student Loan Trust Series2018-3A Class A2 (1 Month LIBOR +0.44%) 144A± | | | 2.93 | | | | 9-27-2066 | | | | 3,773,000 | | | | 3,766,078 | |
| | | | |
SLC Student Loan Trust Series2010-1 Class A (3 Month LIBOR +0.88%)± | | | 3.01 | | | | 11-25-2042 | | | | 1,230,041 | | | | 1,239,556 | |
| | | | |
SLM Student Loan Trust Series2004-10 Class A7A (3 Month LIBOR +0.60%) 144A± | | | 2.88 | | | | 10-25-2029 | | | | 3,874,000 | | | | 3,846,491 | |
| | | | |
SLM Student Loan Trust Series2004-10 Class A7B (3 Month LIBOR +0.60%) 144A± | | | 2.88 | | | | 10-25-2029 | | | | 6,174,000 | | | | 6,136,786 | |
| | | | |
SLM Student Loan Trust Series2005-6 Class A6 (3 Month LIBOR +0.14%)± | | | 2.42 | | | | 10-27-2031 | | | | 2,859,192 | | | | 2,821,960 | |
| | | | |
SLM Student Loan Trust Series2010-A Class 1A (PRIME-0.05%) 144A± | | | 5.20 | | | | 5-16-2044 | | | | 87,443 | | | | 87,588 | |
| | | | |
SLM Student Loan Trust Series2012-3 Class A (1 Month LIBOR +0.65%)± | | | 2.80 | | | | 12-27-2038 | | | | 5,580,638 | | | | 5,571,159 | |
| | | | |
SMB Private Education Loan Trust Series2015-A Class A2A 144A | | | 2.49 | | | | 6-15-2027 | | | | 2,432,306 | | | | 2,440,341 | |
| | | | |
SMB Private Education Loan Trust Series2015-C Class A2A 144A | | | 2.75 | | | | 7-15-2027 | | | | 2,562,350 | | | | 2,581,349 | |
| | | | |
SMB Private Education Loan Trust Series2016-B Class A2B (1 Month LIBOR +1.45%) 144A± | | | 3.65 | | | | 2-17-2032 | | | | 2,005,266 | | | | 2,037,037 | |
| | | | |
SoFi Professional Loan Program LLC Series2016-C Class A1 (1 Month LIBOR +1.10%) 144A± | | | 3.25 | | | | 10-27-2036 | | | | 1,012,066 | | | | 1,022,786 | |
| | | | |
SoFi Professional Loan Program LLC Series2016-D Class A1 (1 Month LIBOR +0.95%) 144A± | | | 3.10 | | | | 1-25-2039 | | | | 2,177,799 | | | | 2,186,277 | |
| | | | |
SoFi Professional Loan Program LLC Series2016-E Class A1 (1 Month LIBOR +0.85%) 144A± | | | 3.00 | | | | 7-25-2039 | | | | 923,697 | | | | 928,757 | |
| | | | |
SoFi Professional Loan Program LLC Series2017-A Class A1 (1 Month LIBOR +0.70%) 144A± | | | 2.85 | | | | 3-26-2040 | | | | 1,219,396 | | | | 1,222,940 | |
| | | | |
SoFi Professional Loan Program LLC Series2017-C Class A1 (1 Month LIBOR +0.60%) 144A± | | | 2.75 | | | | 7-25-2040 | | | | 1,195,427 | | | | 1,196,987 | |
| | | | |
SoFi Professional Loan Program LLC Series2017-E Class A2B 144A | | | 2.72 | | | | 11-26-2040 | | | | 1,183,000 | | | | 1,204,988 | |
| | | | |
Total Asset-Backed Securities (Cost $72,247,328) | | | | | | | | | | | | | | | 72,616,951 | |
| | | | | | | | | | | | | | | | |
| | | | |
| Non-Agency Mortgage-Backed Securities: 6.11% | | | | | | | | | | | | |
| | | | |
Angel Oak Mortgage Trust Series2019-2 Class A1 144A±± | | | 3.63 | | | | 3-25-2049 | | | | 1,946,413 | | | | 1,974,199 | |
| | | | |
Bunker Hill Loan Depositary Trust Series2019-1 Class A1 144A | | | 3.61 | | | | 10-26-2048 | | | | 1,952,984 | | | | 1,973,063 | |
| | | | |
Bunker Hill Loan Depositary Trust Series2019-2 Class A1 144A | | | 2.88 | | | | 7-25-2049 | | | | 2,106,890 | | | | 2,116,220 | |
| | | | |
Colt Funding LLC Series2018-4 Class A1 144A±± | | | 4.01 | | | | 12-28-2048 | | | | 1,332,675 | | | | 1,351,957 | |
| | | | |
Colt Funding LLC Series2019-1 Class A1 144A±± | | | 3.71 | | | | 3-25-2049 | | | | 879,736 | | | | 892,488 | |
| | | | |
Commercial Mortgage Trust Series 2013-LC6 Class A3 | | | 2.67 | | | | 1-10-2046 | | | | 1,243,735 | | | | 1,266,352 | |
| | | | |
DBUBS Mortgage Trust Series 2011-LC2A Class A1 144A | | | 3.53 | | | | 7-10-2044 | | | | 202,642 | | | | 203,912 | |
| | | | |
GCAT Series 2019-NQM1 Class A1 144A | | | 2.99 | | | | 2-25-2059 | | | | 2,082,423 | | | | 2,091,153 | |
| | | | |
GS Mortgage Securities Trust Series2010-C1 Class A1 144A | | | 3.68 | | | | 8-10-2043 | | | | 219,799 | | | | 219,989 | |
| | | | |
GS Mortgage Securities Trust Series2010-C2 Class A1 144A | | | 3.85 | | | | 12-10-2043 | | | | 304,869 | | | | 307,141 | |
| | | | |
GS Mortgage Securities Trust Series 2012-GCJ7 Class AAB | | | 2.94 | | | | 5-10-2045 | | | | 1,077,473 | | | | 1,080,257 | |
| | | | |
JPMorgan Chase Commercial Mortgage Securities Trust Series2010-C1 Class A2 144A | | | 4.61 | | | | 6-15-2043 | | | | 403,717 | | | | 404,779 | |
| | | | |
Morgan Stanley Capital I Trust Series2011-C2 Class A3 144A | | | 4.21 | | | | 6-15-2044 | | | | 92,932 | | | | 93,338 | |
| | | | |
New Residential Mortgage Loan Trust Series 2019-NQM2 Class A1 144A±± | | | 3.60 | | | | 4-25-2049 | | | | 1,861,790 | | | | 1,886,518 | |
| | | | |
Spruce Hill Mortgage Loan Trust Series2019-SH1 Class A1 144A±± | | | 3.40 | | | | 4-29-2049 | | | | 1,328,081 | | | | 1,341,736 | |
| | | | |
Verus Securitization Trust Series2018-2 Class A1 144A±± | | | 3.68 | | | | 6-1-2058 | | | | 2,437,156 | | | | 2,460,976 | |
| | | | |
Verus Securitization Trust Series2019-1 Class A1 144A±± | | | 3.84 | | | | 2-25-2059 | | | | 2,600,686 | | | | 2,638,198 | |
| | | | |
Verus Securitization Trust Series2019-2 Class A1 144A±± | | | 2.91 | | | | 7-25-2059 | | | | 3,051,380 | | | | 3,075,138 | |
| | | | |
Verus Securitization Trust Series2019-2 Class A1 144A±± | | | 3.21 | | | | 4-25-2059 | | | | 2,817,926 | | | | 2,842,298 | |
The accompanying notes are an integral part of these financial statements.
Wells Fargo Short Duration Government Bond Fund | 13
Portfolio of investments—August 31, 2019
| | | | | | | | | | | | | | | | |
| | | Interest
rate | | | Maturity date | | | Principal | | | Value | |
| | | | |
| Non-Agency Mortgage-Backed Securities (continued) | | | | | | | | | | | | |
| | | | |
Verus Securitization Trust Series2019-3 Class A1 144A | | | 2.78 | % | | | 7-25-2059 | | | $ | 3,091,762 | | | $ | 3,097,783 | |
| | | | |
Visio Trust Series2019-1 Class A1 144A±± | | | 3.57 | | | | 6-25-2054 | | | | 3,146,047 | | | | 3,223,023 | |
| | | | |
TotalNon-Agency Mortgage-Backed Securities (Cost $34,296,502) | | | | | | | | | | | | | | | 34,540,518 | |
| | | | | | | | | | | | | | | | |
| | | | |
U.S. Treasury Securities: 34.09% | | | | | | | | | | | | | | | | |
| | | | |
U.S. Treasury Note | | | 1.50 | | | | 8-15-2022 | | | | 23,709,000 | | | | 23,756,233 | |
| | | | |
U.S. Treasury Note ## | | | 1.75 | | | | 7-31-2021 | | | | 4,793,000 | | | | 4,812,846 | |
| | | | |
U.S. Treasury Note | | | 1.75 | | | | 7-15-2022 | | | | 18,687,000 | | | | 18,848,321 | |
| | | | |
U.S. Treasury Note | | | 1.88 | | | �� | 8-31-2022 | | | | 12,586,000 | | | | 12,747,258 | |
| | | | |
U.S. Treasury Note | | | 2.00 | | | | 10-31-2022 | | | | 2,058,000 | | | | 2,093,854 | |
| | | | |
U.S. Treasury Note | | | 2.13 | | | | 5-31-2021 | | | | 25,390,000 | | | | 25,627,040 | |
| | | | |
U.S. Treasury Note | | | 2.13 | | | | 8-15-2021 | | | | 26,465,000 | | | | 26,757,562 | |
| | | | |
U.S. Treasury Note | | | 2.13 | | | | 5-15-2022 | | | | 17,723,000 | | | | 18,033,845 | |
| | | | |
U.S. Treasury Note | | | 2.25 | | | | 3-31-2021 | | | | 5,821,000 | | | | 5,877,618 | |
| | | | |
U.S. Treasury Note | | | 2.25 | | | | 4-15-2022 | | | | 12,366,000 | | | | 12,615,252 | |
| | | | |
U.S. Treasury Note | | | 2.50 | | | | 1-31-2021 | | | | 4,444,000 | | | | 4,494,863 | |
| | | | |
U.S. Treasury Note | | | 2.75 | | | | 4-30-2023 | | | | 29,019,000 | | | | 30,378,132 | |
| | | | |
U.S. Treasury Note | | | 2.75 | | | | 7-31-2023 | | | | 6,478,000 | | | | 6,801,647 | |
| | | | |
Total U.S. Treasury Securities (Cost $191,265,412) | | | | | | | | | | | | | | | 192,844,471 | |
| | | | | | | | | | | | | | | | |
| | | | |
| | | | | | | | | | | | | | | | |
| | | Yield | | | | | | Shares | | | | |
Short-Term Investments: 1.34% | | | | | | | | | | | | | | | | |
| | | | |
| Investment Companies: 1.34% | | | | | | | | | | | | |
| | | | |
Wells Fargo Government Money Market Fund Select Class (l)(u)## | | | 2.04 | | | | | | | | 7,563,717 | | | | 7,563,717 | |
| | | | | | | | | | | | | | | | |
| | | | |
Total Short-Term Investments (Cost $7,563,717) | | | | | | | | | | | | | | | 7,563,717 | |
| | | | | | | | | | | | | | | | |
| | | | | | | | |
| Total investments in securities (Cost $613,720,935) | | | 109.34 | % | | | 618,487,262 | |
| | |
Other assets and liabilities, net | | | (9.34 | ) | | | (52,824,197 | ) |
| | | | | | | | |
| Total net assets | | | 100.00 | % | | $ | 565,663,065 | |
| | | | | | | | |
| ± | Variable rate investment. The rate shown is the rate in effect at period end. |
| %% | The security is purchased on a when-issued basis. |
| ±± | The coupon of the security is adjusted based on the principal and interest payments received from the underlying pool of mortgages as well as the credit quality and the actual prepayment speed of the underlying mortgages. |
| 144A | The security may be resold in transactions exempt from registration, normally to qualified institutional buyers, pursuant to Rule 144A under the Securities Act of 1933. |
| ## | All or a portion of this security is segregated for when-issued securities. |
| (l) | The issuer of the security is an affiliated person of the Fund as defined in the Investment Company Act of 1940. |
| (u) | The rate represents the7-day annualized yield at period end. |
Abbreviations:
| FHLMC | Federal Home Loan Mortgage Corporation |
| FNMA | Federal National Mortgage Association |
| GNMA | Government National Mortgage Association |
| LIBOR | London Interbank Offered Rate |
The accompanying notes are an integral part of these financial statements.
14 | Wells Fargo Short Duration Government Bond Fund
Portfolio of investments—August 31, 2019
Futures Contracts
| | | | | | | | | | | | | | | | | | | | | | | | |
| Description | | Number of
contracts | | | Expiration
date | | | Notional cost | | | Notional value | | | Unrealized
gains | | | Unrealized
losses | |
Long | | | | | | | | | | | | | | | | | | | | | | | | |
2-Year U.S. Treasury Notes | | | 594 | | | | 12-31-2019 | | | $ | 128,379,088 | | | $ | 128,373,610 | | | $ | 0 | | | $ | (5,478 | ) |
Short | | | | | | | | | | | | | | | | | | | | | | | | |
10-Year Ultra Futures | | | (17 | ) | | | 12-19-2019 | | | | (2,461,381 | ) | | | (2,455,438 | ) | | | 5,943 | | | | 0 | |
5-Year U.S. Treasury Notes | | | (487 | ) | | | 12-31-2019 | | | | (58,437,696 | ) | | | (58,428,586 | ) | | | 9,110 | | | | 0 | |
| | | | | | | | | | | | | | | | | | | | | | | | |
| | | | | | |
| | | | | | | | | | | | | | | | | | $ | 15,053 | | | $ | (5,478 | ) |
| | | | | | | | | | | | | | | | | | | | | | | | |
Investments in Affiliates
An affiliated investment is an investment in which the Fund owns at least 5% of the outstanding voting shares of the issuer or as a result of other relationships, such as the Fund and the issuer having the same investment manager. Transactions with issuers that were either affiliated persons of the Fund at the beginning of the period or the end of the period were as follows:
| | | | | | | | | | | | | | | | | | | | | | | | | | | | | | | | | | | | |
| | | Shares,
beginning
of period | | | Shares
purchased | | | Shares
sold | | | Shares,
end of
period | | | Net
realized
gains
(losses) | | | Net
change in
unrealized
gains
(losses) | | | Income
from
affiliated
securities | | | Value,
end
of period | | | % of
net
assets | |
Short-Term Investments | | | | | | | | | | | | | | | | | | | | | | | | | | | | | | | | | | | | |
Investment Companies | | | | | | | | | | | | | | | | | | | | | | | | | | | | | | | | | | | | |
Wells Fargo Government Money Market Fund Select Class | | | 11,514,693 | | | | 698,667,411 | | | | 702,618,387 | | | | 7,563,717 | | | $ | 0 | | | $ | 0 | | | $ | 291,701 | | | $ | 7,563,717 | | | | 1.34 | % |
The accompanying notes are an integral part of these financial statements.
Wells Fargo Short Duration Government Bond Fund | 15
Statement of assets and liabilities—August 31, 2019
| | | | |
| | | | |
| |
Assets | | | | |
Investments in unaffiliated securities, at value (cost $606,157,218) | | $ | 610,923,545 | |
Investments in affiliated securities, at value (cost $7,563,717) | | | 7,563,717 | |
Cash segregated for future contracts | | | 532,008 | |
Receivable for investments sold | | | 46,066,270 | |
Principal paydown receivable | | | 480,012 | |
Receivable for Fund shares sold | | | 1,499,132 | |
Receivable for interest | | | 2,078,258 | |
Receivable for daily variation margin on open futures contracts | | | 7,906 | |
Prepaid expenses and other assets | | | 109,379 | |
| | | | |
Total assets | | | 669,260,227 | |
| | | | |
| |
Liabilities | | | | |
Payable for investments purchased | | | 102,803,551 | |
Payable for Fund shares redeemed | | | 358,642 | |
Management fee payable | | | 142,916 | |
Dividends payable | | | 56,137 | |
Administration fees payable | | | 42,487 | |
Distribution fee payable | | | 6,902 | |
Trustees’ fees and expenses payable | | | 3,961 | |
Accrued expenses and other liabilities | | | 182,566 | |
| | | | |
Total liabilities | | | 103,597,162 | |
| | | | |
Total net assets | | $ | 565,663,065 | |
| | | | |
| |
Net assets consist of | | | | |
Paid-in capital | | $ | 638,852,285 | |
Total distributable loss | | | (73,189,220 | ) |
| | | | |
Total net assets | | $ | 565,663,065 | |
| | | | |
| |
Computation of net asset value and offering price per share | | | | |
Net assets – Class A | | $ | 29,617,683 | |
Shares outstanding – Class A1 | | | 3,043,029 | |
Net asset value per share – Class A | | | $9.73 | |
Maximum offering price per share – Class A2 | | | $9.93 | |
Net assets – Class C | | $ | 10,031,503 | |
Shares outstanding – Class C1 | | | 1,028,905 | |
Net asset value per share – Class C | | | $9.75 | |
Net assets – Class R6 | | $ | 41,987,080 | |
Shares outstanding – Class R61 | | | 4,297,584 | |
Net asset value per share – Class R6 | | | $9.77 | |
Net assets – Administrator Class | | $ | 38,816,083 | |
Shares outstanding – Administrator Class1 | | | 3,980,035 | |
Net asset value per share – Administrator Class | | | $9.75 | |
Net assets – Institutional Class | | $ | 445,210,716 | |
Shares outstanding – Institutional Class1 | | | 45,668,230 | |
Net asset value per share – Institutional Class | | | $9.75 | |
| 1 | The Fund has an unlimited number of authorized shares. |
| 2 | Maximum offering price is computed as 100/98 of net asset value. On investments of $50,000 or more, the offering price is reduced. |
The accompanying notes are an integral part of these financial statements.
16 | Wells Fargo Short Duration Government Bond Fund
Statement of operations—year ended August 31, 2019
| | | | |
| | | | |
| |
Investment income | | | | |
Interest | | $ | 17,394,295 | |
Income from affiliated securities | | | 291,701 | |
| | | | |
Total investment income | | | 17,685,996 | |
| | | | |
| |
Expenses | | | | |
Management fee | | | 2,057,053 | |
Administration fees | | | | |
Class A | | | 48,098 | |
Class C | | | 20,547 | |
Class R6 | | | 11,117 | |
Administrator Class | | | 56,731 | |
Institutional Class | | | 360,830 | |
Shareholder servicing fees | | | | |
Class A | | | 75,153 | |
Class C | | | 32,104 | |
Administrator Class | | | 141,487 | |
Distribution fee | | | | |
Class C | | | 96,314 | |
Custody and accounting fees | | | 67,151 | |
Professional fees | | | 53,847 | |
Registration fees | | | 79,778 | |
Shareholder report expenses | | | 69,808 | |
Trustees’ fees and expenses | | | 21,592 | |
Other fees and expenses | | | 19,944 | |
| | | | |
Total expenses | | | 3,211,554 | |
Less: Fee waivers and/or expense reimbursements | | | | |
Fund-level | | | (195,364 | ) |
Class A | | | (73 | ) |
Class R6 | | | (11,117 | ) |
Administrator Class | | | (67,745 | ) |
Institutional Class | | | (135,416 | ) |
| | | | |
Net expenses | | | 2,801,839 | |
| | | | |
Net investment income | | | 14,884,157 | |
| | | | |
| |
Realized and unrealized gains (losses) on investments | | | | |
Net realized gains (losses) on | | | | |
Unaffiliated securities | | | 1,611,260 | |
Futures contracts | | | (1,561,137 | ) |
| | | | |
Net realized gains on investments | | | 50,123 | |
| | | | |
| |
Net change in unrealized gains (losses) on | | | | |
Unaffiliated securities | | | 8,951,288 | |
Futures contracts | | | 66,767 | |
| | | | |
Net change in unrealized gains (losses) on investments | | | 9,018,055 | |
| | | | |
Net realized and unrealized gains (losses) on investments | | | 9,068,178 | |
| | | | |
Net increase in net assets resulting from operations | | $ | 23,952,335 | |
| | | | |
The accompanying notes are an integral part of these financial statements.
Wells Fargo Short Duration Government Bond Fund | 17
Statement of changes in net assets
| | | | | | | | | | | | | | | | |
| | | Year ended
August 31, 2019 | | | Year ended
August 31, 20181 | |
| | | | |
Operations | | | | | | | | | | | | | | | | |
Net investment income | | | | | | $ | 14,884,157 | | | | | | | $ | 12,199,482 | |
Net realized gains (losses) on investments | | | | | | | 50,123 | | | | | | | | (11,314,289 | ) |
Net change in unrealized gains (losses) on investments | | | | | | | 9,018,055 | | | | | | | | (3,340,788 | ) |
| | | | |
Net increase (decrease) in net assets resulting from operations | | | | | | | 23,952,335 | | | | | | | | (2,455,595 | ) |
| | | | |
| | | | |
Distributions to shareholders from net investment income and net realized gains | | | | | | | | | | | | | | | | |
Class A | | | | | | | (753,979 | ) | | | | | | | (735,153 | ) |
Class C | | | | | | | (226,983 | ) | | | | | | | (217,568 | ) |
Class R6 | | | | | | | (1,078,024 | ) | | | | | | | (1,398,687 | ) |
Administrator Class | | | | | | | (1,529,339 | ) | | | | | | | (1,726,039 | ) |
Institutional Class | | | | | | | (12,903,892 | ) | | | | | | | (12,631,240 | ) |
| | | | |
Total distributions to shareholders | | | | | | | (16,492,217 | ) | | | | | | | (16,708,687 | ) |
| | | | |
| | | | |
Capital share transactions | | | Shares | | | | | | | | Shares | | | | | |
Proceeds from shares sold | | | | | | | | | | | | | | | | |
Class A | | | 617,334 | | | | 5,934,764 | | | | 376,228 | | | | 3,627,108 | |
Class C | | | 106,035 | | | | 1,018,014 | | | | 22,308 | | | | 218,154 | |
Class R6 | | | 2,188,387 | | | | 21,183,601 | | | | 2,144,288 | | | | 20,939,039 | |
Administrator Class | | | 238,230 | | | | 2,291,607 | | | | 395,318 | | | | 3,847,681 | |
Institutional Class | | | 10,430,140 | | | | 100,435,708 | | | | 13,527,957 | | | | 131,987,736 | |
| | | | |
| | | | | | | 130,863,694 | | | | | | | | 160,619,718 | |
| | | | |
Reinvestment of distributions | | | | | | | | | | | | | | | | |
Class A | | | 74,715 | | | | 719,348 | | | | 71,432 | | | | 692,759 | |
Class C | | | 21,609 | | | | 208,280 | | | | 20,781 | | | | 201,738 | |
Class R6 | | | 93,340 | | | | 902,462 | | | | 126,725 | | | | 1,239,028 | |
Administrator Class | | | 157,806 | | | | 1,521,378 | | | | 178,230 | | | | 1,730,952 | |
Institutional Class | | | 1,279,269 | | | | 12,338,544 | | | | 1,256,662 | | | | 12,199,437 | |
| | | | |
| | | | | | | 15,690,012 | | | | | | | | 16,063,914 | |
| | | | |
Payment for shares redeemed | | | | | | | | | | | | | | | | |
Class A | | | (829,358 | ) | | | (7,984,256 | ) | | | (2,532,682 | ) | | | (24,674,032 | ) |
Class C | | | (667,791 | ) | | | (6,437,263 | ) | | | (502,772 | ) | | | (4,888,594 | ) |
Class R6 | | | (1,664,571 | ) | | | (16,097,185 | ) | | | (15,996,524 | ) | | | (157,173,416 | ) |
Administrator Class | | | (3,899,844 | ) | | | (37,590,853 | ) | | | (2,179,946 | ) | | | (21,230,405 | ) |
Institutional Class | | | (17,338,426 | ) | | | (166,712,595 | ) | | | (22,222,211 | ) | | | (216,535,537 | ) |
| | | | |
| | | | | | | (234,822,152 | ) | | | | | | | (424,501,984 | ) |
| | | | |
Net decrease in net assets resulting from capital share transactions | | | | | | | (88,268,446 | ) | | | | | | | (247,818,352 | ) |
| | | | |
Total decrease in net assets | | | | | | | (80,808,328 | ) | | | | | | | (266,982,634 | ) |
| | | | |
| | | | |
Net assets | | | | | | | | | | | | | | | | |
Beginning of period | | | | | | | 646,471,393 | | | | | | | | 913,454,027 | |
| | | | |
End of period | | | | | | $ | 565,663,065 | | | | | | | $ | 646,471,393 | |
| | | | |
| 1 | Effective for all filings after November 4, 2018, the SEC prospectively eliminated the requirement to parenthetically disclose undistributed net investment income at the end of the period and permitted the aggregation of distributions, with the exception of tax basis returns of capital. Undistributed net investment income at August 31, 2018 was $480,677. The disaggregated distributions information for the year ended August 31, 2018 is included in Note 8,Distributions to Shareholders, in the notes to the financial statements. |
The accompanying notes are an integral part of these financial statements.
18 | Wells Fargo Short Duration Government Bond Fund
Financial highlights
(For a share outstanding throughout each period)
| | | | | | | | | | | | | | | | | | | | |
| | | Year ended August 31 | |
| CLASS A | | 2019 | | | 2018 | | | 2017 | | | 2016 | | | 2015 | |
Net asset value, beginning of period | | | $9.60 | | | | $9.85 | | | | $9.96 | | | | $10.02 | | | | $10.08 | |
Net investment income | | | 0.21 | | | | 0.14 | | | | 0.07 | | | | 0.07 | | | | 0.04 | |
Net realized and unrealized gains (losses) on investments | | | 0.16 | | | | (0.20 | ) | | | (0.03 | ) | | | 0.02 | | | | 0.02 | |
| | | | | | | | | | | | | | | | | | | | |
Total from investment operations | | | 0.37 | | | | (0.06 | ) | | | 0.04 | | | | 0.09 | | | | 0.06 | |
Distributions to shareholders from | | | | | | | | | | | | | | | | | | | | |
Net investment income | | | (0.24 | ) | | | (0.19 | ) | | | (0.15 | ) | | | (0.15 | ) | | | (0.12 | ) |
Net asset value, end of period | | | $9.73 | | | | $9.60 | | | | $9.85 | | | | $9.96 | | | | $10.02 | |
Total return1 | | | 3.92 | % | | | (0.56 | )% | | | 0.45 | % | | | 0.90 | % | | | 0.55 | % |
Ratios to average net assets (annualized) | | | | | | | | | | | | | | | | | | | | |
Gross expenses | | | 0.81 | % | | | 0.80 | % | | | 0.79 | % | | | 0.78 | % | | | 0.78 | % |
Net expenses | | | 0.78 | % | | | 0.78 | % | | | 0.78 | % | | | 0.78 | % | | | 0.78 | % |
Net investment income | | | 2.22 | % | | | 1.36 | % | | | 0.79 | % | | | 0.70 | % | | | 0.55 | % |
Supplemental data | | | | | | | | | | | | | | | | | | | | |
Portfolio turnover rate | | | 635 | % | | | 331 | % | | | 348 | % | | | 284 | % | | | 500 | % |
Net assets, end of period (000s omitted) | | | $29,618 | | | | $30,538 | | | | $51,890 | | | | $57,976 | | | | $62,504 | |
| 1 | Total return calculations do not include any sales charges. |
The accompanying notes are an integral part of these financial statements.
Wells Fargo Short Duration Government Bond Fund | 19
Financial highlights
(For a share outstanding throughout each period)
| | | | | | | | | | | | | | | | | | | | |
| | | Year ended August 31 | |
| CLASS C | | 2019 | | | 2018 | | | 2017 | | | 2016 | | | 2015 | |
Net asset value, beginning of period | | | $9.62 | | | | $9.87 | | | | $9.98 | | | | $10.03 | | | | $10.10 | |
Net investment income (loss) | | | 0.14 | 1 | | | 0.06 | 1 | | | 0.00 | 1,2 | | | (0.01 | ) | | | (0.03 | ) |
Net realized and unrealized gains (losses) on investments | | | 0.16 | | | | (0.19 | ) | | | (0.03 | ) | | | 0.03 | | | | 0.00 | 2 |
| | | | | | | | | | | | | | | | | | | | |
Total from investment operations | | | 0.30 | | | | (0.13 | ) | | | (0.03 | ) | | | 0.02 | | | | (0.03 | ) |
Distributions to shareholders from | | | | | | | | | | | | | | | | | | | | |
Net investment income | | | (0.17 | ) | | | (0.12 | ) | | | (0.08 | ) | | | (0.07 | ) | | | (0.04 | ) |
Net asset value, end of period | | | $9.75 | | | | $9.62 | | | | $9.87 | | | | $9.98 | | | | $10.03 | |
Total return3 | | | 3.14 | % | | | (1.30 | )% | | | (0.30 | )% | | | 0.25 | % | | | (0.30 | )% |
Ratios to average net assets (annualized) | | | | | | | | | | | | | | | | | | | | |
Gross expenses | | | 1.56 | % | | | 1.55 | % | | | 1.54 | % | | | 1.53 | % | | | 1.53 | % |
Net expenses | | | 1.53 | % | | | 1.53 | % | | | 1.53 | % | | | 1.53 | % | | | 1.53 | % |
Net investment income (loss) | | | 1.49 | % | | | 0.62 | % | | | 0.04 | % | | | (0.05 | )% | | | (0.20 | )% |
Supplemental data | | | | | | | | | | | | | | | | | | | | |
Portfolio turnover rate | | | 635 | % | | | 331 | % | | | 348 | % | | | 284 | % | | | 500 | % |
Net assets, end of period (000s omitted) | | | $10,032 | | | | $15,093 | | | | $20,026 | | | | $27,454 | | | | $31,910 | |
| 1 | Calculated based upon average shares outstanding |
| 2 | Amount is less than $0.005. |
| 3 | Total return calculations do not include any sales charges. |
The accompanying notes are an integral part of these financial statements.
20 | Wells Fargo Short Duration Government Bond Fund
Financial highlights
(For a share outstanding throughout each period)
| | | | | | | | | | | | | | | | | | | | |
| | | Year ended August 31 | |
| CLASS R6 | | 2019 | | | 2018 | | | 2017 | | | 2016 | | | 2015 | |
Net asset value, beginning of period | | | $9.64 | | | | $9.89 | | | | $9.99 | | | | $10.05 | | | | $10.11 | |
Net investment income | | | 0.25 | 1 | | | 0.16 | 1 | | | 0.12 | 1 | | | 0.12 | | | | 0.09 | 1 |
Net realized and unrealized gains (losses) on investments | | | 0.16 | | | | (0.17 | ) | | | (0.02 | ) | | | 0.01 | | | | 0.01 | |
| | | | | | | | | | | | | | | | | | | | |
Total from investment operations | | | 0.41 | | | | (0.01 | ) | | | 0.10 | | | | 0.13 | | | | 0.10 | |
Distributions to shareholders from | | | | | | | | | | | | | | | | | | | | |
Net investment income | | | (0.28 | ) | | | (0.24 | ) | | | (0.20 | ) | | | (0.19 | ) | | | (0.16 | ) |
Net asset value, end of period | | | $9.77 | | | | $9.64 | | | | $9.89 | | | | $9.99 | | | | $10.05 | |
Total return | | | 4.34 | % | | | (0.14 | )% | | | 0.96 | % | | | 1.32 | % | | | 0.96 | % |
Ratios to average net assets (annualized) | | | | | | | | | | | | | | | | | | | | |
Gross expenses | | | 0.43 | % | | | 0.42 | % | | | 0.41 | % | | | 0.40 | % | | | 0.40 | % |
Net expenses | | | 0.37 | % | | | 0.37 | % | | | 0.37 | % | | | 0.37 | % | | | 0.37 | % |
Net investment income | | | 2.62 | % | | | 1.64 | % | | | 1.19 | % | | | 1.11 | % | | | 0.88 | % |
Supplemental data | | | | | | | | | | | | | | | | | | | | |
Portfolio turnover rate | | | 635 | % | | | 331 | % | | | 348 | % | | | 284 | % | | | 500 | % |
Net assets, end of period (000s omitted) | | | $41,987 | | | | $35,472 | | | | $172,106 | | | | $233,993 | | | | $231,878 | |
| 1 | Calculated based upon average shares outstanding |
The accompanying notes are an integral part of these financial statements.
Wells Fargo Short Duration Government Bond Fund | 21
Financial highlights
(For a share outstanding throughout each period)
| | | | | | | | | | | | | | | | | | | | |
| | | Year ended August 31 | |
| ADMINISTRATOR CLASS | | 2019 | | | 2018 | | | 2017 | | | 2016 | | | 2015 | |
Net asset value, beginning of period | | | $9.62 | | | | $9.87 | | | | $9.98 | | | | $10.03 | | | | $10.10 | |
Net investment income | | | 0.23 | 1 | | | 0.15 | 1 | | | 0.08 | | | | 0.08 | | | | 0.06 | |
Net realized and unrealized gains (losses) on investments | | | 0.16 | | | | (0.19 | ) | | | (0.02 | ) | | | 0.04 | | | | 0.00 | 2 |
| | | | | | | | | | | | | | | | | | | | |
Total from investment operations | | | 0.39 | | | | (0.04 | ) | | | 0.06 | | | | 0.12 | | | | 0.06 | |
Distributions to shareholders from | | | | | | | | | | | | | | | | | | | | |
Net investment income | | | (0.26 | ) | | | (0.21 | ) | | | (0.17 | ) | | | (0.17 | ) | | | (0.13 | ) |
Net asset value, end of period | | | $9.75 | | | | $9.62 | | | | $9.87 | | | | $9.98 | | | | $10.03 | |
Total return | | | 4.10 | % | | | (0.37 | )% | | | 0.63 | % | | | 1.18 | % | | | 0.63 | % |
Ratios to average net assets (annualized) | | | | | | | | | | | | | | | | | | | | |
Gross expenses | | | 0.75 | % | | | 0.74 | % | | | 0.73 | % | | | 0.72 | % | | | 0.72 | % |
Net expenses | | | 0.60 | % | | | 0.60 | % | | | 0.60 | % | | | 0.60 | % | | | 0.60 | % |
Net investment income | | | 2.41 | % | | | 1.56 | % | | | 0.96 | % | | | 0.87 | % | | | 0.73 | % |
Supplemental data | | | | | | | | | | | | | | | | | | | | |
Portfolio turnover rate | | | 635 | % | | | 331 | % | | | 348 | % | | | 284 | % | | | 500 | % |
Net assets, end of period (000s omitted) | | | $38,816 | | | | $71,997 | | | | $89,743 | | | | $121,576 | | | | $156,669 | |
| 1 | Calculated based upon average shares outstanding |
| 2 | Amount is less than $0.005. |
The accompanying notes are an integral part of these financial statements.
22 | Wells Fargo Short Duration Government Bond Fund
Financial highlights
(For a share outstanding throughout each period)
| | | | | | | | | | | | | | | | | | | | |
| | | Year ended August 31 | |
| INSTITUTIONAL CLASS | | 2019 | | | 2018 | | | 2017 | | | 2016 | | | 2015 | |
Net asset value, beginning of period | | | $9.62 | | | | $9.87 | | | | $9.98 | | | | $10.03 | | | | $10.10 | |
Net investment income | | | 0.25 | | | | 0.17 | | | | 0.11 | | | | 0.11 | | | | 0.09 | 1 |
Net realized and unrealized gains (losses) on investments | | | 0.16 | | | | (0.19 | ) | | | (0.03 | ) | | | 0.03 | | | | (0.01 | ) |
| | | | | | | | | | | | | | | | | | | | |
Total from investment operations | | | 0.41 | | | | (0.02 | ) | | | 0.08 | | | | 0.14 | | | | 0.08 | |
Distributions to shareholders from | | | | | | | | | | | | | | | | | | | | |
Net investment income | | | (0.28 | ) | | | (0.23 | ) | | | (0.19 | ) | | | (0.19 | ) | | | (0.15 | ) |
Net asset value, end of period | | | $9.75 | | | | $9.62 | | | | $9.87 | | | | $9.98 | | | | $10.03 | |
Total return | | | 4.29 | % | | | (0.20 | )% | | | 0.81 | % | | | 1.37 | % | | | 0.81 | % |
Ratios to average net assets (annualized) | | | | | | | | | | | | | | | | | | | | |
Gross expenses | | | 0.48 | % | | | 0.47 | % | | | 0.46 | % | | | 0.45 | % | | | 0.45 | % |
Net expenses | | | 0.42 | % | | | 0.42 | % | | | 0.42 | % | | | 0.42 | % | | | 0.42 | % |
Net investment income | | | 2.57 | % | | | 1.75 | % | | | 1.15 | % | | | 1.06 | % | | | 0.92 | % |
Supplemental data | | | | | | | | | | | | | | | | | | | | |
Portfolio turnover rate | | | 635 | % | | | 331 | % | | | 348 | % | | | 284 | % | | | 500 | % |
Net assets, end of period (000s omitted) | | | $445,211 | | | | $493,372 | | | | $579,690 | | | | $664,047 | | | | $587,835 | |
| 1 | Calculated based upon average shares outstanding |
The accompanying notes are an integral part of these financial statements.
Wells Fargo Short Duration Government Bond Fund | 23
Notes to financial statements
1. ORGANIZATION
Wells Fargo Funds Trust (the “Trust”), a Delaware statutory trust organized on March 10, 1999, is an open-end management investment company registered under the Investment Company Act of 1940, as amended (the “1940 Act”). As an investment company, the Trust follows the accounting and reporting guidance in Financial Accounting Standards Board (“FASB”) Accounting Standards Codification Topic 946, Financial Services – Investment Companies. These financial statements report on the Wells Fargo Short Duration Government Bond Fund (the “Fund”) which is a diversified series of the Trust.
2. SIGNIFICANT ACCOUNTING POLICIES
The following significant accounting policies, which are consistently followed in the preparation of the financial statements of the Fund, are in conformity with U.S. generally accepted accounting principles which require management to make estimates and assumptions that affect the reported amounts of assets and liabilities, disclosure of contingent assets and liabilities at the date of the financial statements, and the reported amounts of revenues and expenses during the reporting period. Actual results could differ from those estimates.
Securities valuation
All investments are valued each business day as of the close of regular trading on the New York Stock Exchange (generally 4 p.m. Eastern Time), although the Fund may deviate from this calculation time under unusual or unexpected circumstances.
Debt securities are valued at the evaluated bid price provided by an independent pricing service (e.g. taking into account various factors, including yields, maturities, or credit ratings) or, if a reliable price is not available, the quoted bid price from an independent broker-dealer.
Futures contracts that are listed on a foreign or domestic exchange or market are valued at the official closing price or, if none, the last sales price.
Investments in registered open-end investment companies are valued at net asset value.
Investments which are not valued using any of the methods discussed above are valued at their fair value, as determined in good faith by the Board of Trustees of the Fund. The Board of Trustees has established a Valuation Committee comprised of the Trustees and has delegated to it the authority to take any actions regarding the valuation of portfolio securities that the Valuation Committee deems necessary or appropriate, including determining the fair value of portfolio securities, unless the determination has been delegated to the Wells Fargo Asset Management Pricing Committee at Wells Fargo Funds Management, LLC (“Funds Management”). The Board of Trustees retains the authority to make or ratify any valuation decisions or approve any changes to the Valuation Procedures as it deems appropriate. On a quarterly basis, the Board of Trustees receives reports on any valuation actions taken by the Valuation Committee or the Wells Fargo Asset Management Pricing Committee which may include items for ratification.
When-issued transactions
The Fund may purchase securities on a forward commitment or when-issued basis. The Fund records a when-issued transaction on the trade date and will segregate assets in an amount at least equal in value to the Fund’s commitment to purchase when-issued securities. Securities purchased on a when-issued basis are marked-to-market daily and the Fund begins earning interest on the settlement date. Losses may arise due to changes in the market value of the underlying securities or if the counterparty does not perform under the contract.
Futures contracts
Futures contracts are agreements between the Fund and a counterparty to buy or sell a specific amount of a commodity, financial instrument or currency at a specified price and on a specified date. The Fund may buy and sell futures contracts in order to gain exposure to, or protect against, changes in interest rates and is subject to interest rate risk. The primary risks associated with the use of futures contracts are the imperfect correlation between changes in market values of securities held by the Fund and the prices of futures contracts, and the possibility of an illiquid market. Futures contracts are generally entered into on a regulated futures exchange and cleared through a clearinghouse associated with the exchange. With futures contracts, there is minimal counterparty risk to the Fund since futures contracts are exchange traded and the exchange’s clearinghouse, as the counterparty to all exchange traded futures, guarantees the futures contracts against default.
Upon entering into a futures contracts, the Fund is required to deposit either cash or securities (initial margin) with the broker in an amount equal to a certain percentage of the contract value. Subsequent payments (variation margin) are paid to or from the broker each day equal to the daily changes in the contract value. Such payments are recorded as unrealized gains or losses and, if any, shown as variation margin receivable (payable) in the Statement of Assets and Liabilities. Should the Fund fail to
24 | Wells Fargo Short Duration Government Bond Fund
Notes to financial statements
make requested variation margin payments, the broker can gain access to the initial margin to satisfy the Fund’s payment obligations. When the contracts are closed, a realized gain or loss is recorded in the Statement of Operations.
Security transactions and income recognition
Securities transactions are recorded on a trade date basis. Realized gains or losses are recorded on the basis of identified cost.
Interest income is accrued daily and bond discounts are accreted and premiums are amortized daily. To the extent debt obligations are placed on non-accrual status, any related interest income may be reduced by writing off interest receivables when the collection of all or a portion of interest has been determined to be doubtful based on consistently applied procedures and the fair value has decreased. If the issuer subsequently resumes interest payments or when the collectability of interest is reasonably assured, the debt obligation is removed from non-accrual status.
Distributions to shareholders
Distributions to shareholders from net investment income are declared daily and paid monthly. Distributions from net realized gains, if any, are recorded on the ex-dividend date and paid at least annually. Such distributions are determined in accordance with income tax regulations and may differ from U.S. generally accepted accounting principles. Dividend sources are estimated at the time of declaration. The tax character of distributions is determined as of the Fund’s fiscal year end. Therefore, a portion of the Fund’s distributions made prior to the Fund’s fiscal year end may be categorized as a tax return of capital at year end.
Federal and other taxes
The Fund intends to continue to qualify as a regulated investment company by distributing substantially all of its investment company taxable income and any net realized capital gains (after reduction for capital loss carryforwards) sufficient to relieve it from all, or substantially all, federal income taxes. Accordingly, no provision for federal income taxes was required.
The Fund’s income and federal excise tax returns and all financial records supporting those returns for the prior three fiscal years are subject to examination by the federal and Delaware revenue authorities. Management has analyzed the Fund’s tax positions taken on federal, state, and foreign tax returns for all open tax years and does not believe that there are any uncertain tax positions that require recognition of a tax liability.
As of August 31, 2019, the aggregate cost of all investments for federal income tax purposes was $613,780,655 and the unrealized gains (losses) consisted of:
| | | | |
| |
Gross unrealized gains | | $ | 5,414,202 | |
| |
Gross unrealized losses | | | (698,020 | ) |
| |
Net unrealized gains | | $ | 4,716,182 | |
As of August 31, 2019, the Fund had capital loss carryforwards which consist of $42,276,451 in short-term capital losses and $36,146,102 in long-term capital losses.
Class allocations
The separate classes of shares offered by the Fund differ principally in applicable sales charges, distribution, shareholder servicing, and administration fees. Class specific expenses are charged directly to that share class. Investment income, common fund-level expenses, and realized and unrealized gains (losses) on investments are allocated daily to each class of shares based on the relative proportion of net assets of each class.
3. FAIR VALUATION MEASUREMENTS
Fair value measurements of investments are determined within a framework that has established a fair value hierarchy based upon the various data inputs utilized in determining the value of the Fund’s investments. The three-level hierarchy gives the highest priority to unadjusted quoted prices in active markets for identical assets or liabilities (Level 1) and the lowest priority to unobservable inputs (Level 3). The Fund’s investments are classified within the fair value hierarchy based on the lowest level of input that is significant to the fair value measurement. The inputs are summarized into three broad levels as follows:
| ∎ | | Level 1 – quoted prices in active markets for identical securities |
| ∎ | | Level 2 – other significant observable inputs (including quoted prices for similar securities, interest rates, prepayment speeds, credit risk, etc.) |
| ∎ | | Level 3 – significant unobservable inputs (including the Fund’s own assumptions in determining the fair value of investments) |
Wells Fargo Short Duration Government Bond Fund | 25
Notes to financial statements
The inputs or methodologies used for valuing investments in securities are not necessarily an indication of the risk associated with investing in those securities.
The following is a summary of the inputs used in valuing the Fund’s assets and liabilities as of August 31, 2019:
| | | | | | | | | | | | | | | | |
| | | | |
| | | Quoted prices
(Level 1) | | | Other significant
observable inputs
(Level 2) | | | Significant
unobservable inputs (Level 3) | | | Total | |
| | | | |
Assets | | | | | | | | | | | | | | | | |
Investments in: | | | | | | | | | | | | | | | | |
| | | | |
Agency securities | | $ | 0 | | | $ | 310,921,605 | | | $ | 0 | | | $ | 310,921,605 | |
| | | | |
Asset-backed securities | | | 0 | | | | 72,616,951 | | | | 0 | | | | 72,616,951 | |
| | | | |
Non-agency mortgage-backed securities | | | 0 | | | | 34,540,518 | | | | 0 | | | | 34,540,518 | |
| | | | |
U.S. Treasury securities | | | 192,844,471 | | | | 0 | | | | 0 | | | | 192,844,471 | |
| | | | |
Short-term investments | | | | | | | | | | | | | | | | |
| | | | |
Investment companies | | | 7,563,717 | | | | 0 | | | | 0 | | | | 7,563,717 | |
| | | | |
| | | 200,408,188 | | | | 418,079,074 | | | | 0 | | | | 618,487,262 | |
| | | | |
Futures contracts | | | 15,053 | | | | 0 | | | | 0 | | | | 15,053 | |
| | | | |
Total assets | | $ | 200,423,241 | | | $ | 418,079,074 | | | $ | 0 | | | $ | 618,502,315 | |
| | | | |
Liabilities | | | | | | | | | | | | | | | | |
| | | | |
Futures contracts | | $ | 5,478 | | | $ | 0 | | | $ | 0 | | | $ | 5,478 | |
| | | | |
Total liabilities | | $ | 5,478 | | | $ | 0 | | | $ | 0 | | | $ | 5,478 | |
Additional sector, industry or geographic detail is included in the Portfolio of Investments.
Futures contracts are reported at their cumulative unrealized gains (losses) at measurement date as reported in the table following the Portfolio of Investments. For futures contracts the current day’s variation margin is reported on the Statement of Assets and Liabilities. All other assets and liabilities are reported at their market value at measurement date.
For the year ended August 31, 2019, the Fund did not have any transfers into/out of Level 3.
4. TRANSACTIONS WITH AFFILIATES
Management fee
Funds Management, an indirect wholly owned subsidiary of Wells Fargo & Company (“Wells Fargo”), is the manager of the Fund and provides advisory and fund-level administrative services under an investment management agreement. Under the investment management agreement, Funds Management is responsible for, among other services, implementing the investment objectives and strategies of the Fund, supervising the subadviser and providing fund-level administrative services in connection with the Fund’s operations. As compensation for its services under the investment management agreement, Funds Management is entitled to receive a management fee at the following annual rate based on the Fund’s average daily net assets:
| | | | |
| |
| Average daily net assets | | Management fee | |
| |
First $1 billion | | | 0.350 | % |
| |
Next $4 billion | | | 0.325 | |
| |
Next $3 billion | | | 0.290 | |
| |
Next $2 billion | | | 0.265 | |
| |
Over $10 billion | | | 0.255 | |
For the year ended August 31, 2019, the management fee was equivalent to an annual rate of 0.35% of the Fund’s average daily net assets.
Funds Management has retained the services of a subadviser to provide daily portfolio management to the Fund. The fee for subadvisory services is borne by Funds Management. Wells Capital Management Incorporated, an affiliate of Funds Management
26 | Wells Fargo Short Duration Government Bond Fund
Notes to financial statements
and an indirect wholly owned subsidiary of Wells Fargo, is the subadviser to the Fund and is entitled to receive a fee from Funds Management at an annual rate starting at 0.15% and declining to 0.05% as the average daily net assets of the Fund increase.
Administration fees
Under a class-level administration agreement, Funds Management provides class-level administrative services to the Fund, which includes paying fees and expenses for services provided by the transfer agent, sub-transfer agents, omnibus account servicers and record-keepers. As compensation for its services under the class-level administration agreement, Funds Management receives an annual fee which is calculated based on the average daily net assets of each class as follows:
| | | | |
| |
| | | Class-level
administration fee | |
| |
Class A, Class C | | | 0.16 | % |
| |
Class R6 | | | 0.03 | |
| |
Administrator Class | | | 0.10 | |
| |
Institutional Class | | | 0.08 | |
Waivers and/or expense reimbursements
Funds Management has contractually waived and/or reimbursed management and administration fees to the extent necessary to maintain certain net operating expense ratios for the Fund. When each class of the Fund has exceeded its expense cap, Funds Management has waived fees and/or reimbursed expenses from fund-level expenses on a proportionate basis and then from class specific expenses. When only certain classes exceed their expense caps, waivers and/or reimbursements are applied against class specific expenses before fund-level expenses. Funds Management has committed through December 31, 2019 to waive fees and/or reimburse expenses to the extent necessary to cap the Fund’s expenses at 0.78% for Class A shares, 1.53% for Class C shares, 0.37% for Class R6 shares, 0.60% for Administrator Class shares, and 0.42% for Institutional Class shares. Prior to or after the commitment expiration date, the cap may be increased or the commitment to maintain the cap may be terminated only with the approval of the Board of Trustees.
Distribution fee
The Trust has adopted a distribution plan for Class C shares of the Fund pursuant to Rule 12b-1 under the 1940 Act. A distribution fee is charged to Class C shares and paid to Wells Fargo Funds Distributor, LLC (“Funds Distributor”), the principal underwriter, at an annual rate of 0.75% of the average daily net assets of Class C shares.
In addition, Funds Distributor is entitled to receive the front-end sales charge from the purchase of Class A shares and a contingent deferred sales charge on the redemption of certain Class A shares. Funds Distributor is also entitled to receive the contingent deferred sales charges from redemptions of Class C shares. For the year ended August 31, 2019, Funds Distributor received $470 from the sale of Class A shares. No contingent deferred sales charges were incurred by Class A and Class C shares for the year ended August 31, 2019.
Shareholder servicing fees
The Trust has entered into contracts with one or more shareholder servicing agents, whereby Class A, Class C, and Administrator Class of the Fund are charged a fee at an annual rate of 0.25% of the average daily net assets of each respective class. A portion of these total shareholder servicing fees were paid to affiliates of Wells Fargo.
Interfund transactions
The Fund may purchase or sell portfolio investment securities to certain other Wells Fargo affiliates pursuant to Rule 17a-7 under the 1940 Act and under procedures adopted by the Board of Trustees. The procedures have been designed to ensure that these interfund transactions, which do not incur broker commissions, are effected at current market prices.
5. INVESTMENT PORTFOLIO TRANSACTIONS
Purchases and sales of investments, excluding short-term securities, for the year ended August 31, 2019 were as follows:
| | | | | | |
Purchases at cost | | Sales proceeds |
U.S.
government | | Non-U.S.
government | | U.S.
government | | Non-U.S.
government |
| $3,754,990,629 | | $93,267,625 | | $3,752,633,840 | | $36,190,340 |
Wells Fargo Short Duration Government Bond Fund | 27
Notes to financial statements
6. DERIVATIVE TRANSACTIONS
During the year ended August 31, 2019, the Fund entered into futures contracts to speculate on interest rates and to help manage the duration of the portfolio. The Fund had an average notional amount of $129,061,129 in long futures contracts and $67,236,156 in short futures contracts during the year ended August 31, 2019.
The fair value, realized gains or losses and change in unrealized gains or losses, if any, on derivative instruments are reflected in the corresponding financial statement captions.
7. BANK BORROWINGS
The Trust (excluding the money market funds), Wells Fargo Master Trust and Wells Fargo Variable Trust are parties to a $280,000,000 revolving credit agreement whereby the Fund is permitted to use bank borrowings for temporary or emergency purposes, such as to fund shareholder redemption requests. Interest under the credit agreement is charged to the Fund based on a borrowing rate equal to the higher of the Federal Funds rate in effect on that day plus 1.25% or the overnight LIBOR rate in effect on that day plus 1.25%. In addition, an annual commitment fee equal to 0.25% of the unused balance is allocated to each participating fund.
For the year ended August 31, 2019, there were no borrowings by the Fund under the agreement.
8. DISTRIBUTIONS TO SHAREHOLDERS
The tax character of distributions paid was $16,492,217 and $16,708,687 of ordinary income for the years ended August 31, 2019 and August 31, 2018, respectively.
As of August 31, 2019, the components of distributable earnings on a tax basis were as follows:
| | | | |
Undistributed ordinary income | | Unrealized gains | | Capital loss carryforward |
| | |
| $573,288 | | $4,716,182 | | $(78,422,553) |
Effective for all filings after November 4, 2018, the Securities and Exchange Commission eliminated the requirement to separately state the components of distributions to shareholders under U.S. generally accepted accounting principles. The amounts of distributions to shareholders for the year ended August 31, 2018 were as follows:
| | | | |
| |
| | | Net investment
income | |
| |
Class A | | $ | 735,153 | |
| |
Class C | | | 217,568 | |
| |
Class R6 | | | 1,398,687 | |
| |
Administrator Class | | | 1,726,039 | |
| |
Institutional Class | | | 12,631,240 | |
9. INDEMNIFICATION
Under the Trust’s organizational documents, the officers and Trustees have been granted certain indemnification rights against certain liabilities that may arise out of performance of their duties to the Trust. Additionally, in the normal course of business, the Trust may enter into contracts with service providers that contain a variety of indemnification clauses. The Trust’s maximum exposure under these arrangements is dependent on future claims that may be made against the Fund and, therefore, cannot be estimated.
10. NEW ACCOUNTING PRONOUNCEMENTS
In August 2018, FASB issued Accounting Standards Update (“ASU”) No. 2018-13, Fair Value Measurement (Topic 820)Disclosure Framework—Changes to the Disclosure Requirements for Fair Value Measurement. ASU 2018-13 updates the disclosure requirements for fair value measurements by modifying or removing certain disclosures and adding certain new disclosures. The amendments are effective for fiscal years, and interim periods within those fiscal years, beginning after December 15, 2019. Early adoption is permitted. Management has adopted the removal and modification of disclosures early, as permitted, and will adopt the additional new disclosures at the effective date.
28 | Wells Fargo Short Duration Government Bond Fund
Notes to financial statements
In March 2017, FASB issued ASU No. 2017-08,Premium Amortization on Purchased Callable Debt Securities. ASU 2017-08 shortens the amortization period for certain callable debt securities held at a premium and requires the premium to be amortized to the earliest call date. The amendments do not require an accounting change for securities held at a discount and discounts will continue to be accreted to the maturity date of the security. ASU 2017-08 is effective for fiscal years beginning after December 15, 2018 and for interim periods within those fiscal years. During the current reporting period, management of the Fund adopted the change in accounting policy which did not have a material impact to the Fund’s financial statements.
Wells Fargo Short Duration Government Bond Fund | 29
Report of independent registered public accounting firm
TO THE SHAREHOLDERS OF THE FUND AND BOARD OF TRUSTEES OF WELLS FARGO FUNDS TRUST:
Opinion on the Financial Statements
We have audited the accompanying statement of assets and liabilities of Wells Fargo Short Duration Government Bond Fund (the Fund), one of the funds constituting Wells Fargo Funds Trust, including the portfolio of investments, as of August 31, 2019, the related statement of operations for the year then ended, the statements of changes in net assets for each of the years in the two-year period then ended, and the related notes (collectively, the financial statements) and the financial highlights for each of the years in the five-year period then ended. In our opinion, the financial statements and financial highlights present fairly, in all material respects, the financial position of the Fund as of August 31, 2019, the results of its operations for the year then ended, the changes in its net assets for each of the years in the two-year period then ended, and the financial highlights for each of the years in the five-year period then ended, in conformity with U.S. generally accepted accounting principles.
Basis for Opinion
These financial statements and financial highlights are the responsibility of the Fund’s management. Our responsibility is to express an opinion on these financial statements and financial highlights based on our audits. We are a public accounting firm registered with the Public Company Accounting Oversight Board (United States) (PCAOB) and are required to be independent with respect to the Fund in accordance with the U.S. federal securities laws and the applicable rules and regulations of the Securities and Exchange Commission and the PCAOB.
We conducted our audits in accordance with the standards of the PCAOB. Those standards require that we plan and perform the audit to obtain reasonable assurance about whether the financial statements and financial highlights are free of material misstatement, whether due to error or fraud. Our audits included performing procedures to assess the risks of material misstatement of the financial statements and financial highlights, whether due to error or fraud, and performing procedures that respond to those risks. Such procedures included examining, on a test basis, evidence regarding the amounts and disclosures in the financial statements and financial highlights. Such procedures also included confirmation of securities owned as of August 31, 2019, by correspondence with the custodian, transfer agent and brokers, or by other appropriate auditing procedures. Our audits also included evaluating the accounting principles used and significant estimates made by management, as well as evaluating the overall presentation of the financial statements and financial highlights. We believe that our audits provide a reasonable basis for our opinion.

We have not been able to determine the specific year that we began serving as the auditor of one or more Wells Fargo Funds investment companies; however we are aware that we have served as the auditor of one or more Wells Fargo Funds investment companies since at least 1955.
Boston, Massachusetts
October 28, 2019
30 | Wells Fargo Short Duration Government Bond Fund
Other information (unaudited)
TAX INFORMATION
For the fiscal year ended August 31, 2019, $16,436,080 has been designated as interest-related dividends for nonresident alien shareholders pursuant to Section 871 of the Internal Revenue Code.
For the fiscal year ended August 31, 2019, 22.15% of the ordinary income distributed was derived from interest on U.S. government securities.
PROXY VOTING INFORMATION
A description of the policies and procedures used to determine how to vote proxies relating to portfolio securities is available, upon request, by calling1-800-222-8222, visiting our website atwfam.com, or visiting the SEC website at sec.gov. Information regarding how the proxies related to portfolio securities were voted during the most recent 12-month period ended June 30 is available on the website atwfam.comor by visiting the SEC website at sec.gov.
QUARTERLY PORTFOLIO HOLDINGS INFORMATION
The Fund files its complete schedule of portfolio holdings with the SEC for the first and third quarters of each fiscal year on Form N-Q or Form N-PORT, which is available by visiting the SEC website at sec.gov. Those forms may be reviewed and copied at the SEC’s Public Reference Room in Washington, DC. Information on the operation of the Public Reference Room may be obtained by calling1-800-SEC-0330.
Wells Fargo Short Duration Government Bond Fund | 31
Other information (unaudited)
BOARD OF TRUSTEES AND OFFICERS
Each of the Trustees and Officers1 listed in the table below acts in identical capacities for each fund in the Wells Fargo family of funds, which consists of 152 mutual funds comprising the Wells Fargo Funds Trust, Wells Fargo Variable Trust, Wells Fargo Master Trust and four closed-end funds (collectively the “Fund Complex”). This table should be read in conjunction with the Prospectus and the Statement of Additional Information2. The mailing address of each Trustee and Officer is 525 Market Street, 12th Floor, San Francisco, CA 94105. Each Trustee and Officer serves an indefinite term, however, each Trustee serves such term until reaching the mandatory retirement age established by the Trustees.
Independent Trustees
| | | | | | |
Name and year of birth | | Position held and
length of service* | | Principal occupations during past five years or longer | | Current other
public company or
investment
company
directorships |
| | | |
William R. Ebsworth (Born 1957) | | Trustee, since 2015 | | Retired. From 1984 to 2013, equities analyst, portfolio manager, research director and chief investment officer at Fidelity Management and Research Company in Boston, Tokyo, and Hong Kong, and retired in 2013 as Chief Investment Officer of Fidelity Strategic Advisers, Inc. where he led a team of investment professionals managing client assets. Prior thereto, Board member of Hong Kong Securities Clearing Co., Hong Kong Options Clearing Corp., the Thailand International Fund, Ltd., Fidelity Investments Life Insurance Company, and Empire Fidelity Investments Life Insurance Company. Audit Committee Chair and Investment Committee Chair of the Vincent Memorial Hospital Endowment (non-profit organization). Mr. Ebsworth is a CFA® charterholder. | | N/A |
| | | |
Jane A. Freeman (Born 1953) | | Trustee, since 2015; Chair Liaison, since 2018 | | Retired. From 2012 to 2014 and 1999 to 2008, Chief Financial Officer of Scientific Learning Corporation. From 2008 to 2012, Ms. Freeman provided consulting services related to strategic business projects. Prior to 1999, Portfolio Manager at Rockefeller & Co. and Scudder, Stevens & Clark. Board member of the Harding Loevner Funds from 1996 to 2014, serving as both Lead Independent Director and chair of the Audit Committee. Board member of the Russell Exchange Traded Funds Trust from 2011 to 2012 and the chair of the Audit Committee. Ms. Freeman is a Board Member of The Ruth Bancroft Garden (non-profit organization). She is also an inactive Chartered Financial Analyst. | | N/A |
| | | |
Isaiah Harris, Jr. (Born 1952) | | Trustee, since 2009; Audit Committee Chairman, since 2019 | | Retired. Chairman of the Board of CIGNA Corporation since 2009, and Director since 2005. From 2003 to 2011, Director of Deluxe Corporation. Prior thereto, President and CEO of BellSouth Advertising and Publishing Corp. from 2005 to 2007, President and CEO of BellSouth Enterprises from 2004 to 2005 and President of BellSouth Consumer Services from 2000 to 2003. Emeritus member of the Iowa State University Foundation Board of Governors. Emeritus Member of the Advisory Board of Iowa State University School of Business. Advisory Board Member, Palm Harbor Academy (private school). Advisory Board Member, Child Evangelism Fellowship (non-profit). Mr. Harris is a certified public accountant (inactive status). | | CIGNA Corporation |
| | | |
Judith M. Johnson (Born 1949) | | Trustee, since 2008; Audit Committee Chairman, from 2009 to 2018 | | Retired. Prior thereto, Chief Executive Officer and Chief Investment Officer of Minneapolis Employees Retirement Fund from 1996 to 2008. Ms. Johnson is an attorney, certified public accountant and a certified managerial accountant. | | N/A |
32 | Wells Fargo Short Duration Government Bond Fund
Other information (unaudited)
| | | | | | |
Name and year of birth | | Position held and
length of service* | | Principal occupations during past five years or longer | | Current other
public company or
investment
company
directorships |
| | | |
David F. Larcker (Born 1950) | | Trustee, since 2009 | | James Irvin Miller Professor of Accounting at the Graduate School of Business, Stanford University, Director of the Corporate Governance Research Initiative and Senior Faculty of The Rock Center for Corporate Governance since 2006. From 2005 to 2008, Professor of Accounting at the Graduate School of Business, Stanford University. Prior thereto, Ernst & Young Professor of Accounting at The Wharton School, University of Pennsylvania from 1985 to 2005. | | N/A |
| | | |
Olivia S. Mitchell (Born 1953) | | Trustee, since 2006; Nominating and Governance Committee Chairman, since 2018 | | International Foundation of Employee Benefit Plans Professor, Wharton School of the University of Pennsylvania since 1993. Director of Wharton’s Pension Research Council and Boettner Center on Pensions & Retirement Research, and Research Associate at the National Bureau of Economic Research. Previously, Cornell University Professor from 1978 to 1993. | | N/A |
| | | |
Timothy J. Penny (Born 1951) | | Trustee, since 1996; Chairman, since 2018 | | President and Chief Executive Officer of Southern Minnesota Initiative Foundation, a non-profit organization, since 2007. Member of the Board of Trustees of NorthStar Education Finance, Inc., a non-profit organization, since 2007. | | N/A |
| | | |
James G. Polisson (Born 1959) | | Trustee, since 2018 | | Retired. Chief Marketing Officer, Source (ETF) UK Services, Ltd, from 2015 to 2017. From 2012 to 2015, Principal of The Polisson Group, LLC, a management consulting, corporate advisory and principal investing company. Chief Executive Officer and Managing Director at Russell Investments, Global Exchange Traded Funds from 2010 to 2012. Managing Director of Barclays Global Investors from 1998 to 2010 and Global Chief Marketing Officer for iShares and Barclays Global Investors from 2000 to 2010. Trustee of the San Francisco Mechanics’ Institute, a non-profit organization, from 2013 to 2015. Board member of the Russell Exchange Traded Fund Trust from 2011 to 2012. Director of Barclays Global Investors Holdings Deutschland GmbH from 2006 to 2009. Mr. Polisson is an attorney and has a retired status with the Massachusetts and District of Columbia Bar Associations. | | N/A |
| * | Length of service dates reflect the Trustee’s commencement of service with the Trust’s predecessor entities, where applicable. |
Wells Fargo Short Duration Government Bond Fund | 33
Other information (unaudited)
Officers
| | | | |
Name and year of birth | | Position held and
length of service | | Principal occupations during past five years or longer |
| | |
Andrew Owen (Born 1960) | | President, since 2017 | | Executive Vice President of Wells Fargo & Company and Head of Affiliated Managers, Wells Fargo Asset Management, since 2014. In addition, Mr. Owen is currently President, Chief Executive Officer and Director of Wells Fargo Funds Management, LLC since 2017. Prior thereto, Executive Vice President responsible for marketing, investments and product development for Wells Fargo Funds Management, LLC, from 2009 to 2014. |
| | |
Nancy Wiser1 (Born 1967) | | Treasurer, since 2012 | | Executive Vice President of Wells Fargo Funds Management, LLC since 2011. Chief Operating Officer and Chief Compliance Officer at LightBox Capital Management LLC, from 2008 to 2011. |
| | |
Michelle Rhee3
(Born 1966) | | Chief Legal Officer, since 2019 | | Secretary of Wells Fargo Funds Management, LLC, Chief Legal Counsel of Wells Fargo Asset Management and Assistant General Counsel of Wells Fargo Bank, N.A. since 2018. Associate General Counsel and Managing Director of Bank of America Corporation from 2004 to 2018. |
| | |
Catherine Kennedy4
(Born 1969) | | Secretary, since 2019 | | Vice President of Wells Fargo Funds Management, LLC and Senior Counsel of the Wells Fargo Legal Department since 2010. Vice President and Senior Counsel of Evergreen Investment Management Company, LLC from 1998 to 2010. |
| | |
Michael H. Whitaker (Born 1967) | | Chief Compliance Officer, since 2016 | | Chief Compliance Officer of Wells Fargo Asset Management since 2016. Senior Vice President and Chief Compliance Officer for Fidelity Investments from 2007 to 2016. |
| | |
David Berardi (Born 1975) | | Assistant Treasurer, since 2009 | | Vice President of Wells Fargo Funds Management, LLC since 2009. Vice President of Evergreen Investment Management Company, LLC from 2008 to 2010. Manager of Fund Reporting and Control for Evergreen Investment Management Company, LLC from 2004 to 2010. |
| | |
Jeremy DePalma1 (Born 1974) | | Assistant Treasurer, since 2009 | | Senior Vice President of Wells Fargo Funds Management, LLC since 2009. Senior Vice President of Evergreen Investment Management Company, LLC from 2008 to 2010 and head of the Fund Reporting and Control Team within Fund Administration from 2005 to 2010. |
| 1 | Nancy Wiser acts as Treasurer of 65 funds in the Fund Complex. Jeremy DePalma acts as Treasurer of 87 funds and Assistant Treasurer of 65 funds in the Fund Complex. |
| 2 | The Statement of Additional Information includes additional information about the Trustees and is available, without charge, upon request, by calling 1-800-222-8222 or by visiting the website atwfam.com. |
| 3 | Michelle Rhee became Chief Legal Officer effective October 22, 2019. |
| 4 | Catherine Kennedy became Secretary effective October 22, 2019. |
34 | Wells Fargo Short Duration Government Bond Fund
Other information (unaudited)
BOARD CONSIDERATION OF INVESTMENT MANAGEMENT AND SUB-ADVISORY AGREEMENTS:
Wells Fargo Short Duration Government Bond Fund
Under the Investment Company Act of 1940 (the “1940 Act”), the Board of Trustees (the “Board”) of Wells Fargo Funds Trust (the “Trust”) must determine annually whether to approve the continuation of the Trust’s investment management and sub-advisory agreements. In this regard, at an in-person meeting held on May 21-22, 2019 (the “Meeting”), the Board, all the members of which have no direct or indirect interest in the investment management and sub-advisory agreements and are not “interested persons” of the Trust, as defined in the 1940 Act (the “Independent Trustees”), reviewed and approved for Wells Fargo Short Duration Government Bond Fund (the “Fund”): (i) an investment management agreement (the “Management Agreement”) with Wells Fargo Funds Management, LLC (“Funds Management”); and (ii) an investment sub-advisory agreement (the “Sub-Advisory Agreement”) with Wells Capital Management Incorporated (the “Sub-Adviser”), an affiliate of Funds Management. The Management Agreement and the Sub-Advisory Agreement are collectively referred to as the “Advisory Agreements.”
At the Meeting, the Board considered the factors and reached the conclusions described below relating to the selection of Funds Management and the Sub-Adviser and the approval of the Advisory Agreements. Prior to the Meeting, including at an in-person meeting in April 2019, the Trustees conferred extensively among themselves and with representatives of Funds Management about these matters. Also, the Board has adopted a team-based approach, with each team consisting of a sub-set of Trustees, to assist the full Board in the discharge of its duties in reviewing investment performance and other matters throughout the year. The Independent Trustees were assisted in their evaluation of the Advisory Agreements by independent legal counsel, from whom they received separate legal advice and with whom they met separately.
In providing information to the Board, Funds Management and the Sub-Adviser were guided by a detailed set of requests for information submitted to them by independent legal counsel on behalf of the Independent Trustees at the start of the Board’s annual contract renewal process earlier in 2019. In considering and approving the Advisory Agreements, the Trustees considered the information they believed relevant, including but not limited to the information discussed below. The Board considered not only the specific information presented in connection with the Meeting, but also the knowledge gained over time through interaction with Funds Management and the Sub-Adviser about various topics. In this regard, the Board reviewed reports of Funds Management at each of its quarterly meetings, which included, among other things, portfolio reviews and investment performance reports. In addition, the Board and the teams mentioned above confer with portfolio managers at various times throughout the year. The Board did not identify any particular information or consideration that was all-important or controlling, and each individual Trustee may have attributed different weights to various factors.
After its deliberations, the Board unanimously approved the continuation of the Advisory Agreements for a one-year term and determined that the compensation payable to Funds Management and the Sub-Adviser under each of the Advisory Agreements was reasonable. The Board considered the approval of the Advisory Agreements for the Fund as part of its consideration of agreements for funds across the complex, but its approvals were made on a fund-by-fund basis. The following summarizes a number of important, but not necessarily all, factors considered by the Board in support of its approvals.
Nature, extent and quality of services
The Board received and considered various information regarding the nature, extent and quality of services provided to the Fund by Funds Management and the Sub-Adviser under the Advisory Agreements. This information included a description of the investment advisory services and Fund-level administrative services covered by the Management Agreement, as well as, among other things, a summary of the background and experience of senior management of Wells Fargo Asset Management (“WFAM”), of which Funds Management and the Sub-Adviser are a part, a summary of investments made in the business of WFAM, a summary of certain organizational and personnel changes involving Funds Management and the Sub-Adviser, and a description of Funds Management’s and the Sub-Adviser’s business continuity planning programs and of their approaches to data privacy and cybersecurity. The Board received and reviewed information about Funds Management’s role as administrator of the Fund’s liquidity risk management program. The Board also considered the qualifications, background, tenure and responsibilities of each of the portfolio managers primarily responsible for the day-to-day portfolio management of the Fund.
The Board evaluated the ability of Funds Management and the Sub-Adviser to attract and retain qualified investment professionals, including research, advisory and supervisory personnel. The Board further considered the compliance programs and compliance records of Funds Management and the Sub-Adviser. In addition, the Board took into account the full range of services provided to the Fund by Funds Management and its affiliates.
Wells Fargo Short Duration Government Bond Fund | 35
Other information (unaudited)
Fund investment performance and expenses
The Board considered the investment performance results for the Fund over various time periods ended December 31, 2018. The Board considered these results in comparison to the investment performance of funds in a universe that was determined by Broadridge Inc. (“Broadridge”) to be similar to the Fund (the “Universe”), and in comparison to the Fund’s benchmark index and to other comparative data. Broadridge is an independent provider of investment company data. The Board received a description of the methodology used by Broadridge to select the mutual funds in the performance Universe. The Board noted that the investment performance of the Fund (Administrator Class) was higher than the average investment performance of the Universe for the three-, five- and ten-year periods under review, but lower than the average investment performance of the Universe for the one-year period under review. The Board also noted that the investment performance of the Fund was in range of or higher than its benchmark index, the Bloomberg Barclays U.S. 1-3 Year Government Bond Index, for the three-, five- and ten-year periods under review, but lower than its benchmark for the one-year period under review.
The Board also received and considered information regarding the Fund’s net operating expense ratios and their various components, including actual management fees, custodian and other non-management fees, and Rule 12b-1 and non-Rule 12b-1 shareholder service fees. The Board considered these ratios in comparison to the median ratios of funds in class-specific expense groups that were determined by Broadridge to be similar to the Fund (the “Groups”). The Board received a description of the methodology used by Broadridge to select the mutual funds in the expense Groups and an explanation of how funds comprising expense groups and their expense ratios may vary from year-to-year. Based on the Broadridge reports, the Board noted that the net operating expense ratios of the Fund were lower than the median net operating expense ratios of the expense Groups for each share class.
The Board took into account the Fund’s investment performance and expense information provided to it among the factors considered in deciding to re-approve the Advisory Agreements.
Investment management and sub-advisory fee rates
The Board reviewed and considered the contractual fee rates payable by the Fund to Funds Management under the Management Agreement, as well as the contractual fee rates payable by the Fund to Funds Management for class-level administrative services under a Class-Level Administration Agreement, which include, among other things, class-level transfer agency and sub-transfer agency costs (collectively, the “Management Rates”). The Board also reviewed and considered the contractual investment sub-advisory fee rates that are payable by Funds Management to the Sub-Adviser for investment sub-advisory services.
Among other information reviewed by the Board was a comparison of the Fund’s Management Rates with the average contractual investment management fee rates of funds in the expense Groups at a common asset level as well as transfer agency costs of the funds in the expense Groups. The Board noted that the Management Rates of the Fund were in range of or lower than the sum of these average rates for the Fund’s expense Groups for all share classes.
The Board also received and considered information about the portion of the total management fee that was retained by Funds Management after payment of the fee to the Sub-Adviser for sub-advisory services. In assessing the reasonableness of this amount, the Board received and evaluated information about the nature and extent of responsibilities retained and risks assumed by Funds Management and not delegated to or assumed by the Sub-Adviser, and about Funds Management’s on-going oversight services. Given the affiliation between Funds Management and the Sub-Adviser, the Board ascribed limited relevance to the allocation of fees between them.
The Board also received and considered information about the nature and extent of services offered and fee rates charged by Funds Management and the Sub-Adviser to other types of clients with investment strategies similar to those of the Fund. In this regard, the Board received information about the significantly greater scope of services, and compliance, reporting and other legal burdens and risks of managing proprietary mutual funds compared with those associated with managing assets of other types of clients, including third-party sub-advised fund clients and non-mutual fund clients such as institutional separate accounts.
Based on its consideration of the factors and information it deemed relevant, including those described here, the Board determined that the compensation payable to Funds Management under the Management Agreement and to the Sub-Adviser under the Sub-Advisory Agreement was reasonable.
Profitability
The Board received and considered information concerning the profitability of Funds Management, as well as the profitability of both WFAM and Wells Fargo & Co. (“Wells Fargo”) from providing services to the fund family as a whole. The Board noted that the Sub-Adviser’s profitability information with respect to providing services to the Fund and other funds in the family was subsumed in the WFAM and Wells Fargo profitability analysis.
36 | Wells Fargo Short Duration Government Bond Fund
Other information (unaudited)
Funds Management reported on the methodologies and estimates used in calculating profitability, including a description of the methodology used to allocate certain expenses. Among other things, the Board noted that the levels of profitability reported on a fund-by-fund basis varied widely, depending on factors such as the size, type and age of fund. Based on its review, the Board did not deem the profits reported by Funds Management, WFAM or Wells Fargo from services provided to the Fund to be at a level that would prevent it from approving the continuation of the Advisory Agreements.
Economies of scale
The Board received and considered information about the potential for Funds Management to experience economies of scale in the provision of management services to the Fund, the difficulties of calculating economies of scale at an individual fund level, and the extent to which potential scale benefits are shared with shareholders. The Board noted the existence of breakpoints in the Fund’s management fee structure, which operate generally to reduce the Fund’s expense ratios as the Fund grows in size. The Board considered that in addition to management fee breakpoints, Funds Management shares potential economies of scale from its management business in a variety of ways, including through fee waiver and expense reimbursement arrangements, services that benefit shareholders, competitive management fee rates set at the outset without regard to breakpoints, and investments in the business intended to enhance services available to shareholders.
The Board concluded that Funds Management’s arrangements with respect to the Fund, including contractual breakpoints, constituted a reasonable approach to sharing potential economies of scale with the Fund and its shareholders.
Other benefits to Funds Management and the Sub-Adviser
The Board received and considered information regarding potential “fall-out” or ancillary benefits received by Funds Management and its affiliates, including the Sub-Adviser, as a result of their relationships with the Fund. Ancillary benefits could include, among others, benefits directly attributable to other relationships with the Fund and benefits potentially derived from an increase in Funds Management’s and the Sub-Adviser’s business as a result of their relationships with the Fund. The Board noted that various affiliates of Funds Management may receive distribution-related fees, shareholder servicing payments and sub-transfer agency fees in respect of shares sold or held through them and services provided.
The Board also reviewed information about soft dollar credits earned and utilized by the Sub-Adviser, fees earned by Funds Management and the Sub-Adviser from managing a private investment vehicle for the fund family’s securities lending collateral, and commissions earned by an affiliated broker from portfolio transactions.
Based on its consideration of the factors and information it deemed relevant, including those described here, the Board did not find that any ancillary benefits received by Funds Management and its affiliates, including the Sub-Adviser, were unreasonable.
Conclusion
At the Meeting, after considering the above-described factors and based on its deliberations and its evaluation of the information described above, the Board unanimously approved the continuation of the Advisory Agreements for a one-year term and determined that the compensation payable to Funds Management and the Sub-Adviser under each of the Advisory Agreements was reasonable.
Wells Fargo Short Duration Government Bond Fund | 37
This page is intentionally left blank.
This page is intentionally left blank.
This page is intentionally left blank.

For more information
More information about Wells Fargo Funds is available free upon request. To obtain literature, please write, visit the Fund’s website, or call:
Wells Fargo Funds
P.O. Box 219967
Kansas City, MO 64121-9967
Website:wfam.com
Individual investors:1-800-222-8222
Retail investment professionals:1-888-877-9275
Institutional investment professionals:1-866-765-0778

This report and the financial statements contained herein are submitted for the general information of the shareholders of the Fund. If this report is used for promotional purposes, distribution of the report must be accompanied or preceded by a current prospectus. Before investing, please consider the investment objectives, risks, charges, and expenses of the investment. For a current prospectus and, if available, a summary prospectus, containing this information, call1-800-222-8222 or visit the Fund’s website atwfam.com. Read the prospectus carefully before you invest or send money.
Wells Fargo Asset Management (WFAM) is the trade name for certain investment advisory/management firms owned by Wells Fargo & Company. These firms include but are not limited to Wells Capital Management Incorporated and Wells Fargo Funds Management, LLC. Certain products managed by WFAM entities are distributed by Wells Fargo Funds Distributor, LLC (a broker-dealer and Member FINRA).
This material is for general informational and educational purposes only and is NOT intended to provide investment advice or a recommendation of any kind—including a recommendation for any specific investment, strategy, or plan.
INVESTMENT PRODUCTS: NOT FDIC INSURED ◾ NO BANK GUARANTEE ◾ MAY LOSE VALUE
© 2019 Wells Fargo Funds Management, LLC. All rights reserved.
405806 10-19
A220/AR220 08-19
Annual Report
August 31, 2019
Wells Fargo
Government Securities Fund
Beginning on January 1, 2021, as permitted by new regulations adopted by the Securities and Exchange Commission, paper copies of the Wells Fargo Funds’ annual and semi-annual shareholder reports issued after this date will no longer be sent by mail, unless you specifically request paper copies of the reports. Instead, the reports will be made available on the Funds’ website, and you will be notified by mail each time a report is posted and provided with a website address to access the report.
If you already elected to receive shareholder reports electronically, you will not be affected by this change and you need not take any action. You may elect to receive shareholder reports and other communications from the Fund electronically at any time by contacting your financial intermediary (such as a broker-dealer or bank) or, if you are a direct investor, by calling1-800-222-8222 or by enrolling at wellsfargo.com/advantagedelivery.
You may elect to receive all future reports in paper free of charge. If you invest through a financial intermediary, you can contact your financial intermediary to request that you continue to receive paper copies of your shareholder reports; if you invest directly with the Fund, you can call 1-800-222-8222. Your election to receive reports in paper will apply to all Wells Fargo Funds held in your account with your financial intermediary or, if you are a direct investor, to all Wells Fargo Funds that you hold.
|
|
|
Reduce clutter. Save trees. |
Sign up for electronic delivery of prospectuses and shareholder reports atwellsfargo.com/advantagedelivery |
The views expressed and any forward-looking statements are as of August 31, 2019, unless otherwise noted, and are those of the Fund managers and/or Wells Fargo Asset Management. Discussions of individual securities, or the markets generally, or any Wells Fargo Fund are not intended as individual recommendations. Future events or results may vary significantly from those expressed in any forward-looking statements. The views expressed are subject to change at any time in response to changing circumstances in the market. Wells Fargo Asset Management and the Fund disclaim any obligation to publicly update or revise any views expressed or forward-looking statements.
INVESTMENT PRODUCTS: NOT FDIC INSURED ◾ NO BANK GUARANTEE ◾ MAY LOSE VALUE
Wells Fargo Government Securities Fund | 1
Letter to shareholders (unaudited)

Andrew Owen
President
Wells Fargo Funds
Dear Shareholder:
We are pleased to offer you this annual report for the Wells Fargo Government Securities Fund for the 12-month period that ended August 31, 2019. After the first half of the period yielded either low-single-digit or negative investment returns, U.S. stock and global bond investors generally saw markets recover during the second half amid intensifying market volatility, global economic growth concerns, international trade staredowns, and simmering geopolitical tensions.
Overall, fixed-income investors enjoyed a distinct advantage over stock investors. For the period, U.S. stocks, based on the S&P 500 Index,1 gained 2.92% and international stocks, as measured by the MSCI ACWI ex USA Index (Net),2 fell 3.27%. The MSCI EM Index (Net)3 slipped 4.36%. Among fixed income investors, the Bloomberg Barclays U.S. Aggregate Bond Index4 added 10.17%, the Bloomberg Barclays Global Aggregate ex-USD Index5 added 5.71%, the Bloomberg Barclays Municipal Bond Index6 gained 8.72%, and the ICE BofAML U.S. High Yield Index7 added 6.58%.
Entering the fourth quarter of 2018, economic data was encouraging.
Entering the fourth quarter of 2018, there were reasons for investors to be optimistic. The U.S. Bureau of Economic Analysis reported U.S. gross domestic product (GDP) grew 4.2% on an annualized basis during the second quarter. Hiring improved. Unemployment declined. Consumer spending gained. Third-quarter corporate earnings reports were generally positive. U.S. trade negotiations with Mexico and Canada advanced. In September 2018, the U.S. Federal Reserve (Fed) raised the federal funds rate by 25 basis points (bps; 100 bps equal 1.00%) to a target range of between 2.00% and 2.25% in an indication of its confidence that U.S. economic growth was sustainable.
International markets presented numerous challenges. U.S.-China trade tensions increased. The U.S. imposed $200 billion in tariffs on Chinese goods. China reacted with $60 billion in tariffs on U.S. goods. Economic growth in China caused concern. In September 2018, international investors began to factor in a number of disconcerting economic and business data points: lower July manufacturing and industrial orders in Germany; declining purchasing managers’ index numbers for August from the United Kingdom, China, and India; and declining household spending for August in Japan. Taken together, the data fed growing concerns that global economic growth was slowing.
| 1 | The S&P 500 Index consists of 500 stocks chosen for market size, liquidity, and industry group representation. It is a market-value-weighted index with each stock’s weight in the index proportionate to its market value. You cannot invest directly in an index. |
| 2 | The Morgan Stanley Capital International (MSCI) All Country World Index (ACWI) ex USA Index (Net) is a free-float-adjusted market-capitalization weighted index that is designed to measure the equity market performance of developed and emerging markets, excluding the U.S. Source: MSCI. MSCI makes no express or implied warranties or representations and shall have no liability whatsoever with respect to any MSCI data contained herein. The MSCI data may not be further redistributed or used as a basis for other indices or any securities or financial products. This report is not approved, reviewed, or produced by MSCI. You cannot invest directly in an index. |
| 3 | The MSCI Emerging Markets (EM) Index (Net) is a free-float-adjusted market-capitalization-weighted index that is designed to measure the equity market performance of emerging markets. You cannot invest directly in an index. |
| 4 | The Bloomberg Barclays U.S. Aggregate Bond Index is a broad-based benchmark that measures the investment-grade, U.S. dollar-denominated, fixed-rate taxable bond market, including Treasuries, government-related and corporate securities, mortgage-backed securities (agency fixed-rate and hybrid adjustable-rate mortgage pass-throughs), asset-backed securities, and commercial mortgage-backed securities. You cannot invest directly in an index. |
| 5 | The Bloomberg Barclays Global Aggregate ex-USD Index is an unmanaged index that provides a broad-based measure of the global investment-grade fixed-income markets excluding the U.S. dollar-denominated debt market. You cannot invest directly in an index. |
| 6 | The Bloomberg Barclays Municipal Bond Index is an unmanaged index composed of long-term tax-exempt bonds with a minimum credit rating of Baa. You cannot invest directly in an index. |
| 7 | The ICE BofAML U.S. High Yield Index is a market-capitalization-weighted index of domestic and Yankee high-yield bonds. The index tracks the performance of high-yield securities traded in the U.S. bond market. You cannot invest directly in an index. Copyright 2019. ICE Data Indices, LLC. All rights reserved. |
2 | Wells Fargo Government Securities Fund
Letter to shareholders (unaudited)
Investors had to digest unsettling events during the fourth quarter of 2018.
November’s U.S. midterm elections shifted control of the House of Representatives from Republicans to Democrats, presaging partisan clashes that followed and caused uncertainty among investors. A partial U.S. government shutdown driven by partisan policy disputes extended into January 2019. Third-quarter U.S. GDP was announced at an annualized 3.4% rate, lower than the second-quarter rate. Brexit efforts stalled. The value of the renminbi declined even as the People’s Bank of China cut reserve requirement ratios, accelerated infrastructure spending, and cut taxes in efforts to spur economic activity.
The combination of news in the U.S. and generally weak economic indicators outside of the U.S. caused investors to seek safe havens. December’s S&P 500 Index performance was the worst since 1931. Globally, fixed-income investments fared better than stocks during the last two months of the year. The Fed increased the federal funds rate by 25 bps in December 2018 to a target range of between 2.25% and 2.50% even as observers expressed concerns that higher rates could slow the economy.
The market climbs a wall of worry.
Investment returns appeared to reaffirm the adage that markets climb a wall of worry as 2019 opened. Following its December decline, the S&P 500 Index gained 8.01% for the month of January, the best monthly performance in 30 years. Returns for the MSCI ACWI ex USA Index (Net), the Bloomberg Barclays U.S. Aggregate Bond Index, and the Bloomberg Barclays Global Aggregate ex-USD Index also were positive.
In February 2019, signs of slowing global growth grew more ominous. The Bureau of Economic Analysis announced fourth-quarter 2018 GDP grew at an annualized 2.2% rate, down from the levels of the prior two quarters. In a February report, the Bank of England forecast the slowest growth for 2019 since the financial crisis. China and the U.S. continued to wrangle over trade issues. By the end of the first quarter of 2019, more accommodative Fed sentiment and steady, if not spectacular, U.S. economic and business metrics encouraged domestic investors.
Early second-quarter 2019 enthusiasm among investors faded.
During April 2019, favorable sentiment found additional support in reports of sustained low inflation, solid employment data, and first-quarter U.S. GDP of an annualized rate of 3.2%. During May, markets tumbled on mixed investment signals. In the U.S., partisan wrangling ramped up as Democrats and Republicans set their sights on 2020 presidential politics. The U.K.’s Brexit contretemps caused Prime Minister Theresa May to resign. Boris Johnson succeeded her only to exacerbate uncertainty about Brexit’s resolution ahead of an October 2019 deadline. The European Commission downgraded the 2019 growth forecast to 1.2%. The U.S. increased tariffs on products from China, China responded, and then talks broke down. President Donald Trump threatened to turn his foreign policy tariff tool to Mexico over immigration issues.
During the third quarter of 2019, investors regrouped. Just as the investment horizon appeared to darken, sentiment turned and U.S. equity markets gained during June and July. The gains, primarily driven by geopolitical and monetary policy events, pushed equity markets to new highs. European Central Bank President Mario Draghi said that if the outlook doesn’t improve, the bank would cut rates or buy more assets to prop up inflation. President Trump backed off of tariff threats against Mexico and China. In the U.S., the Fed implemented a 0.25% federal funds rate cut in July.
Later in July, the U.S. reversed course and threatened to impose higher tariffs on China’s exports after talks failed. China responded with tariff threats of its own and
“December’s S&P 500 Index performance was the worst since 1931.”
“Following its December decline, the S&P 500 Index gained 8.01% for the month of January, the best monthly performance in 30 years.”
Wells Fargo Government Securities Fund | 3
Letter to shareholders (unaudited)
|
|
|
For further information about your Fund, contact your investment professional, visit our website at wfam.com, or call us directly at1-800-222-8222. |
devalued the renminbi, a move that roiled global markets. Major U.S. stock market indices closed July 2019 with the worst weekly results of the year. Bond prices gained as Treasury yields fell to levels not seen since November 2016 and the yield curve inverted at multiple points along the 30-year arc.
In a microcosm, August 2019 encapsulated many of the unnerving events that plagued investors during the prior 11 months. The U.S.-China trade relationship swung from discouraging to hopeful and back again with no evident compromise on the horizon. Evidence of a continued global economic slowdown continued to mount as central banks in China, New Zealand, and Thailand cut interest rates. Industrial and manufacturing data declined in China, Canada, Japan, and Germany. Adding to the uncertain environment, Italy’s prime minister resigned, many feared a crackdown in Hong Kong as protesters sustained their calls for reform throughout the month, and Boris Johnson planned to suspend Parliament as Brexit’s deadline neared.
Don’t let short-term uncertainty derail long-term investment goals.
Periods of investment uncertainty can present challenges, but experience has taught us that maintaining long-term investment goals can be an effective way to plan for the future. To help you create a sound strategy based on your personal goals and risk tolerance, Wells Fargo Funds offers more than 100 mutual funds spanning a wide range of asset classes and investment styles. Although diversification cannot guarantee an investment profit or prevent losses, we believe it can be an effective way to manage investment risk and potentially smooth out overall portfolio performance. We encourage investors to know their investments and to understand that appropriate levels of risk-taking may unlock opportunities.
Thank you for choosing to invest with Wells Fargo Funds. We appreciate your confidence in us and remain committed to helping you meet your financial needs.
Sincerely,

Andrew Owen
President
Wells Fargo Funds
4 | Wells Fargo Government Securities Fund
This page is intentionally left blank.
Performance highlights (unaudited)
Investment objective
The Fund seeks current income.
Manager
Wells Fargo Funds Management, LLC
Subadviser
Wells Capital Management Incorporated
Portfolio managers
Christopher Y. Kauffman, CFA®‡
Jay N. Mueller, CFA®‡
Michal Stanczyk
Average annual total returns (%) as of August 31, 2019
| | | | | | | | | | | | | | | | | | | | | | | | | | | | | | | | | | |
| | | | |
| | | | | Including sales charge | | | Excluding sales charge | | | Expense ratios1 (%) | |
| | | | | | | | | |
| | | Inception date | | 1 year | | | 5 year | | | 10 year | | | 1 year | | | 5 year | | | 10 year | | | Gross | | | Net2 | |
| | | | | | | | | | |
| Class A (SGVDX) | | 8-31-1999 | | | 3.76 | | | | 1.51 | | | | 2.41 | | | | 8.65 | | | | 2.45 | | | | 2.89 | | | | 0.90 | | | | 0.85 | |
| | | | | | | | | | |
| Class C (WGSCX) | | 12-26-2002 | | | 6.84 | | | | 1.69 | | | | 2.12 | | | | 7.84 | | | | 1.69 | | | | 2.12 | | | | 1.65 | | | | 1.60 | |
| | | | | | | | | | |
| Administrator Class (WGSDX) | | 4-8-2005 | | | – | | | | – | | | | – | | | | 8.88 | | | | 2.67 | | | | 3.10 | | | | 0.84 | | | | 0.64 | |
| | | | | | | | | | |
| Institutional Class (SGVIX) | | 8-31-1999 | | | – | | | | – | | | | – | | | | 9.05 | | | | 2.85 | | | | 3.27 | | | | 0.57 | | | | 0.48 | |
| | | | | | | | | | |
| Bloomberg Barclays U.S. Aggregate ex Credit Index3 | | – | | | – | | | | – | | | | – | | | | 9.02 | | | | 2.90 | | | | 3.30 | | | | – | | | | – | |
| | | | | | | | | | |
| Bloomberg Barclays Intermediate U.S. Government Bond Index4 | | – | | | – | | | | – | | | | – | | | | 7.45 | | | | 2.20 | | | | 2.44 | | | | – | | | | – | |
Figures quoted represent past performance, which is no guarantee of future results, and do not reflect taxes that a shareholder may pay on fund distributions or the redemption of fund shares. Investment return and principal value of an investment will fluctuate so that an investor’s shares, when redeemed, may be worth more or less than their original cost. Performance shown without sales charges would be lower if sales charges were reflected. Current performance may be lower or higher than the performance data quoted, which assumes the reinvestment of dividends and capital gains. Currentmonth-end performance is available on the Fund’s website, wfam.com.
Index returns do not include transaction costs associated with buying and selling securities, any mutual fund fees or expenses, or any taxes. It is not possible to invest directly in an index.
For Class A shares, the maximumfront-end sales charge is 4.50%. For Class C shares, the maximum contingent deferred sales charge is 1.00%. Performance including a contingent deferred sales charge assumes the sales charge for the corresponding time period. Administrator Class and Institutional Class shares are sold without afront-end sales charge or contingent deferred sales charge.
Bond values fluctuate in response to the financial condition of individual issuers, general market and economic conditions, and changes in interest rates. Changes in market conditions and government policies may lead to periods of heightened volatility in the bond market and reduced liquidity for certain bonds held by the Fund. In general, when interest rates rise, bond values fall and investors may lose principal value. Interest rate changes and their impact on the Fund and its share price can be sudden and unpredictable. The use of derivatives may reduce returns and/or increase volatility. Securities issued by U.S. government agencies or government sponsored entities may not be guaranteed by the U.S. Treasury. Certain investment strategies tend to increase the total risk of an investment (relative to the broader market). The Fund is exposed to mortgage- and asset-backed securities risk. The U.S. government guarantee applies to certain underlying securities and not to shares of the Fund. Consult the Fund’s prospectus for additional information on these and other risks.
Please see footnotes on page 7.
6 | Wells Fargo Government Securities Fund
Performance highlights (unaudited)
|
|
| Growth of $10,000 investment as of August 31, 20195 |
|
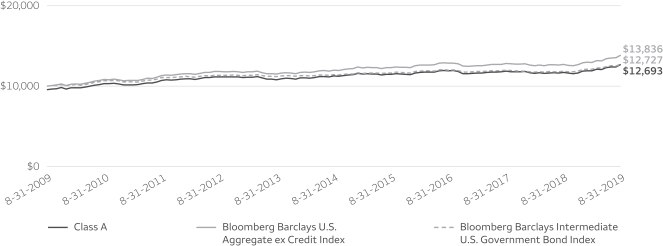
|
| ‡ | CFA® and Chartered Financial Analyst® are trademarks owned by CFA Institute. |
| 1 | Reflects the expense ratios as stated in the most recent prospectuses. The expense ratios shown are subject to change and may differ from the annualized expense ratios shown in the financial highlights of this report. |
| 2 | The manager has contractually committed through December 31, 2019, to waive fees and/or reimburse expenses to the extent necessary to cap the expenses of each class after fee waivers at the amounts shown. Brokerage commissions, stamp duty fees, interest, taxes, acquired fund fees and expenses (if any), and extraordinary expenses are excluded from the expense cap. Prior to or after the commitment expiration date, the cap may be increased or the commitment to maintain the cap may be terminated only with the approval of the Board of Trustees. Without this cap, the Fund’s returns would have been lower. The expense ratio paid by an investor is the net expense ratio (the total annual fund operating expenses after fee waivers) as stated in the prospectus. |
| 3 | The Bloomberg Barclays U.S. Aggregate ex Credit Index is composed of the Bloomberg Barclays U.S. Government Index and the Bloomberg Barclays U.S. Mortgage-Backed Securities Index and includes Treasury issues, agency issues, and mortgage-backed securities. You cannot invest directly in an index. |
| 4 | The Bloomberg Barclays Intermediate U.S. Government Bond Index is an unmanaged index composed of U.S. government securities with maturities in the one to10-year range, including securities issued by the U.S. Treasury and U.S. government agencies. You cannot invest directly in an index. |
| 5 | The chart compares the performance of Class A shares for the most recent ten years with the performance of the Bloomberg Barclays U.S. Aggregate ex Credit Index and the Bloomberg Barclays Intermediate U.S. Government Bond Index. The chart assumes a hypothetical investment of $10,000 in Class A shares and reflects all operating expenses and assumes the maximum initial sales charge of 4.50%. |
| 6 | The ten largest holdings, excluding cash, cash equivalents and any money market funds, are calculated based on the value of the investments divided by total net assets of the Fund. Holdings are subject to change and may have changed since the date specified. |
| 7 | The Personal Consumption Expenditures Index is the primary measure of consumer spending on goods and services in the U.S. economy. It accounts for abouttwo-thirds of domestic final spending and is part of the personal income report issued by the Bureau of Economic Analysis of the Department of Commerce. You cannot invest directly in an index. |
| 8 | Amounts are calculated based on the total long-term investments of the Fund. These amounts are subject to change and may have changed since the date specified. |
Wells Fargo Government Securities Fund | 7
Performance highlights (unaudited)
MANAGER’S DISCUSSION
Fund highlights
| ∎ | | The Fund (Class A shares, excluding sales charges) underperformed its benchmark, the Bloomberg Barclays U.S. Aggregate ex Credit Index, for the12-month period that ended August 31, 2019. |
| ∎ | | An overweight allocation to higher-coupon mortgages detracted due to heightened prepayment concern resulting from the rally in Treasury rates. |
| ∎ | | An underweight to mortgage-backed securities (MBS) contributed to results as the sector underperformed Treasuries and other spread sectors. |
| ∎ | | The Fund’s short duration positioning for most of the period detracted from results as interest rates rallied significantly. The Fund’s yield-curve positioning, however, contributed to performance as the yield curve flattened. |
| ∎ | | The Fund’s overweight to securitized sectors, including commercial mortgage-backed securities (CMBS), collateralized mortgage obligations (CMOs), and asset-backed securities (ABS), contributed to performance over the period due to the sectors’ yield advantage and narrowing spreads. |
| | | | |
| |
| Ten largest holdings(%) as of August 31, 20196 | | | |
| | |
FNMA, 3.00%,12-1-2045 | | | 3.81 | |
| | |
FNMA, 3.00%,6-1-2034 | | | 2.55 | |
| | |
U.S. Treasury Bond, 4.25%,11-15-2040 | | | 2.45 | |
| | |
FNMA, 4.00%,4-1-2046 | | | 2.38 | |
| | |
Resolution Funding Corporation STRIPS,0.00%, 7-15-2020 | | | 2.35 | |
| | |
FNMA, 3.50%,4-1-2034 | | | 2.30 | |
| | |
GNMA, 3.50%,12-20-2047 | | | 2.26 | |
| | |
U.S. Treasury Bond, 3.75%,11-15-2043 | | | 2.10 | |
| | |
FNMA, 4.50%,9-12-2049 | | | 1.92 | |
| | |
TVA, 4.63%,9-15-2060 | | | 1.90 | |
An economic slowdown
The pace of gross domestic product growth decelerated over the past 12 months as business investment, inventory effects, and trade restrained overall economic activity. For the four quarters that ended June 30, 2019, the U.S. economy expanded by 2.3% in inflation-adjusted terms, compared with a 3.2% trailing12-month growth rate at the midway point in 2018. Rising anxiety over the contentious U.S.-China trade relationship appeared to discourage capital investment over the12-month period that ended August 31, 2019. Housing investment also was a modest drag despite low mortgage rates. Consumer spending held up fairly well, however, with the Personal Consumption Expenditures Index7 rising at a 2.7% year-over-year rate though the end of July.
Consumption was supported by a relatively firm labor market. While job growth slowed modestly over the period, wages grew by 3.2% in real terms and the unemployment rate remained below 4%. Measures of labor force participation also generally showed improvement.
In response to slower growth and lower-than-targeted inflation, the Federal Open Market Committee (FOMC) voted to reduce its policy rate target for overnight funds by 0.25% at its July 31 meeting. This was the first interest rate reduction engineered by the FOMC in the decade since the financial crisis. While the monetary authorities suggested that their decision should be seen as a “midcourse correction” rather than the beginning of an extended easing cycle, markets have priced multiple additional rate cuts into the term structure. Indeed, interest rates fell across the board over the past 12 months, with the intermediate-term Treasury yields dropping by about 1.35%.
Please see footnotes on page 7.
8 | Wells Fargo Government Securities Fund
Performance highlights (unaudited)
|
|
| Portfolio composition as of August 31, 20198 |
|
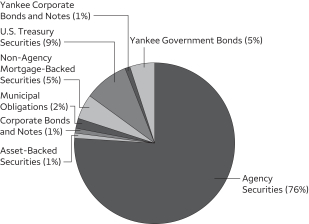 |
The Fund reduced its overweight allocation to securitized sectors.
During the period, we reduced the Fund’s allocation toto-be-announced (TBA) MBS, which offer a forward-settlement feature, and short duration CMO and agency commercial mortgage-backed cash surrogates in favor of specified pools. This caused the Fund’s overall securitized allocation to decline. This change was primarily the result of deteriorating carry or book value on TBA mortgages brought on by the introduction in June 2019 of uniform MBS. Within the MBS sector, the Fund was underweight versus the benchmark, which contributed to performance, with an emphasis on higher-coupon paper. The Fund also maintained an underweight to Ginnie Mae bonds due to their rich valuations, deteriorating prepayment fundamentals, and poor supply/demand technicals, which
contributed slightly to performance. However, the Fund’s overweight to higher-coupon30-year and15-year mortgages detracted because the duration of those pools contracted as rates fell.
During the period, the Fund maintained an overweight to agency CMBS,non-agency CMBS, and ABS, all of which contributed to results. The Fund held government-guaranteed or government-sponsored agency bonds rather than Treasuries, picking up additional yield and benefiting from positive spread performance. The Fund also increased its allocation tonon-agency CMOs—in particular, those collateralized by nonqualifying mortgages, which are not eligible for sale to Fannie Mae and Freddie Mac. We believe certain securities within this sector look attractive due to their better prepayment characteristics and the additional spread offered versus agency CMOs.
The trade war is a persistent cloud.
We expect the U.S.-China trade dispute to drag on for some months to come, depressing business investment. Slower growth, in turn, is likely to incline the monetary authorities to ease policy further, with at least one and probably more rate cuts to be implemented over the next 6 to 12 months. A quick resolution to the dispute—as unlikely as that seems at this time—could probably boost business confidence and perhaps reduce the pressure for accommodative monetary policy. In this environment, we anticipate taking a cautious approach to both duration and sector allocation decisions, with a bias towardup-in-quality trades. As always, relative-value considerations will dominate our security selection process.
Please see footnotes on page 7.
Wells Fargo Government Securities Fund | 9
Fund expenses (unaudited)
As a shareholder of the Fund, you incur two types of costs: (1) transaction costs, including sales charges (loads) on purchase payments and contingent deferred sales charges (if any) on redemptions and (2) ongoing costs, including management fees, distribution(12b-1) and/or shareholder servicing fees, and other Fund expenses. This example is intended to help you understand your ongoing costs (in dollars) of investing in the Fund and to compare these costs with the ongoing costs of investing in other mutual funds.
The example is based on an investment of $1,000 invested at the beginning of thesix-month period and held for the entire period from March 1, 2019 to August 31, 2019.
Actual expenses
The “Actual” line of the table below provides information about actual account values and actual expenses. You may use the information in this line, together with the amount you invested, to estimate the expenses that you paid over the period. Simply divide your account value by $1,000 (for example, an $8,600 account value divided by $1,000 = 8.6), then multiply the result by the number in the “Actual” line under the heading entitled “Expenses paid during period” for your applicable class of shares to estimate the expenses you paid on your account during this period.
Hypothetical example for comparison purposes
The “Hypothetical” line of the table below provides information about hypothetical account values and hypothetical expenses based on the Fund’s actual expense ratio and an assumed rate of return of 5% per year before expenses, which is not the Fund’s actual return. The hypothetical account values and expenses may not be used to estimate the actual ending account balance or expenses you paid for the period. You may use this information to compare the ongoing costs of investing in the Fund and other funds. To do so, compare this 5% hypothetical example with the 5% hypothetical examples that appear in the shareholder reports of the other funds.
Please note that the expenses shown in the table are meant to highlight your ongoing costs only and do not reflect any transactional costs, such as sales charges (loads) and contingent deferred sales charges. Therefore, the “Hypothetical” line of the table is useful in comparing ongoing costs only and will not help you determine the relative total costs of owning different funds. In addition, if these transactional costs were included, your costs would have been higher.
| | | | | | | | | | | | | | | | |
| | | Beginning
account value
3-1-2019 | | | Ending
account value
8-31-2019 | | | Expenses
paid during
the period¹ | | | Annualized net
expense ratio | |
| | | | | |
Class A | | | | | | | | | | | | | | | | |
| | | | |
Actual | | $ | 1,000.00 | | | $ | 1,067.57 | | | $ | 4.43 | | | | 0.85 | % |
| | | | |
Hypothetical (5% return before expenses) | | $ | 1,000.00 | | | $ | 1,020.92 | | | $ | 4.33 | | | | 0.85 | % |
| | | | | |
Class C | | | | | | | | | | | | | | | | |
| | | | |
Actual | | $ | 1,000.00 | | | $ | 1,063.57 | | | $ | 8.32 | | | | 1.60 | % |
| | | | |
Hypothetical (5% return before expenses) | | $ | 1,000.00 | | | $ | 1,017.14 | | | $ | 8.13 | | | | 1.60 | % |
| | | | | |
Administrator Class | | | | | | | | | | | | | | | | |
| | | | |
Actual | | $ | 1,000.00 | | | $ | 1,067.84 | | | $ | 3.34 | | | | 0.64 | % |
| | | | |
Hypothetical (5% return before expenses) | | $ | 1,000.00 | | | $ | 1,021.98 | | | $ | 3.26 | | | | 0.64 | % |
| | | | | |
Institutional Class | | | | | | | | | | | | | | | | |
| | | | |
Actual | | $ | 1,000.00 | | | $ | 1,068.61 | | | $ | 2.50 | | | | 0.48 | % |
| | | | |
Hypothetical (5% return before expenses) | | $ | 1,000.00 | | | $ | 1,022.79 | | | $ | 2.45 | | | | 0.48 | % |
| 1 | Expenses paid is equal to the annualized net expense ratio of each class multiplied by the average account value over the period, multiplied by the number of days in the most recent fiscal half-year divided by the number of days in the fiscal year (to reflect theone-half-year period). |
10 | Wells Fargo Government Securities Fund
Portfolio of investments—August 31, 2019
| | | | | | | | | | | | | | | | |
| | | Interest
rate | | | Maturity
date | | | Principal | | | Value | |
| Agency Securities: 76.36% | |
| | | | |
FDIC Series2010-R1 Class A 144A | | | 2.18 | % | | | 5-25-2050 | | | $ | 38,666 | | | $ | 38,617 | |
| | | | |
FDIC Series2013-R1 Class A 144A | | | 1.15 | | | | 3-25-2033 | | | | 856,251 | | | | 851,125 | |
| | | | |
FHLB | | | 3.25 | | | | 11-16-2028 | | | | 4,240,000 | | | | 4,811,177 | |
| | | | |
FHLB | | | 5.63 | | | | 3-14-2036 | | | | 6,020,000 | | | | 9,025,665 | |
| | | | |
FHLMC | | | 5.00 | | | | 6-1-2026 | | | | 1,335,140 | | | | 1,384,436 | |
| | | | |
FHLMC | | | 2.38 | | | | 4-25-2023 | | | | 551,300 | | | | 553,355 | |
| | | | |
FHLMC | | | 2.46 | | | | 3-25-2022 | | | | 1,310,921 | | | | 1,319,753 | |
| | | | |
FHLMC | | | 2.62 | | | | 12-25-2026 | | | | 3,962,246 | | | | 4,071,735 | |
| | | | |
FHLMC | | | 2.75 | | | | 3-25-2027 | | | | 5,697,793 | | | | 5,880,708 | |
| | | | |
FHLMC | | | 2.90 | | | | 4-25-2026 | | | | 6,339,036 | | | | 6,630,940 | |
| | | | |
FHLMC | | | 3.00 | | | | 5-15-2026 | | | | 609,718 | | | | 621,172 | |
| | | | |
FHLMC | | | 3.00 | | | | 1-15-2054 | | | | 135,253 | | | | 137,163 | |
| | | | |
FHLMC (1 Month LIBOR +1.18%)± | | | 3.38 | | | | 12-15-2036 | | | | 335,832 | | | | 347,460 | |
| | | | |
FHLMC | | | 3.50 | | | | 8-1-2045 | | | | 5,083,095 | | | | 5,307,711 | |
| | | | |
FHLMC | | | 3.50 | | | | 11-1-2045 | | | | 9,244,774 | | | | 9,659,128 | |
| | | | |
FHLMC | | | 3.50 | | | | 12-1-2045 | | | | 1,947,770 | | | | 2,033,832 | |
| | | | |
FHLMC | | | 3.50 | | | | 12-1-2045 | | | | 6,515,019 | | | | 6,806,996 | |
| | | | |
FHLMC (11th District Cost of Funds +1.25%)± | | | 3.55 | | | | 7-1-2032 | | | | 348,377 | | | | 350,427 | |
| | | | |
FHLMC (3 Year Treasury Constant Maturity +2.24%)± | | | 3.63 | | | | 5-1-2026 | | | | 28,179 | | | | 28,507 | |
| | | | |
FHLMC | | | 4.00 | | | | 12-15-2024 | | | | 1,684,356 | | | | 1,747,130 | |
| | | | |
FHLMC | | | 4.00 | | | | 6-1-2044 | | | | 4,472,649 | | | | 4,730,802 | |
| | | | |
FHLMC | | | 4.00 | | | | 9-1-2049 | | | | 1,475,000 | | | | 1,534,700 | |
| | | | |
FHLMC | | | 4.50 | | | | 3-1-2042 | | | | 382,021 | | | | 413,970 | |
| | | | |
FHLMC | | | 4.50 | | | | 9-1-2044 | | | | 3,320,333 | | | | 3,569,541 | |
| | | | |
FHLMC | | | 4.50 | | | | 9-1-2049 | | | | 4,100,000 | | | | 4,324,602 | |
| | | | |
FHLMC (12 Month LIBOR +1.75%)± | | | 4.63 | | | | 7-1-2038 | | | | 1,467,163 | | | | 1,544,540 | |
| | | | |
FHLMC (12 Month LIBOR +1.91%)± | | | 4.66 | | | | 9-1-2031 | | | | 3,166 | | | | 3,208 | |
| | | | |
FHLMC (12 Month LIBOR +1.91%)± | | | 4.66 | | | | 9-1-2031 | | | | 42,555 | | | | 42,835 | |
| | | | |
FHLMC (1 Year Treasury Constant Maturity +2.25%)± | | | 4.67 | | | | 6-1-2032 | | | | 19,943 | | | | 20,643 | |
| | | | |
FHLMC (1 Year Treasury Constant Maturity +2.14%)± | | | 4.69 | | | | 10-1-2026 | | | | 122,023 | | | | 126,125 | |
| | | | |
FHLMC (1 Year Treasury Constant Maturity +2.40%)± | | | 4.90 | | | | 7-1-2029 | | | | 67,882 | | | | 69,873 | |
| | | | |
FHLMC | | | 5.00 | | | | 10-1-2019 | | | | 3,634 | | | | 3,748 | |
| | | | |
FHLMC | | | 5.00 | | | | 2-1-2020 | | | | 39,264 | | | | 40,502 | |
| | | | |
FHLMC | | | 5.00 | | | | 8-1-2040 | | | | 1,026,577 | | | | 1,131,483 | |
| | | | |
FHLMC (12 Month LIBOR +2.05%)± | | | 5.05 | | | | 1-1-2038 | | | | 574,413 | | | | 610,044 | |
| | | | |
FHLMC | | | 5.50 | | | | 7-1-2035 | | | | 2,909,125 | | | | 3,231,937 | |
| | | | |
FHLMC | | | 5.50 | | | | 12-1-2038 | | | | 1,859,484 | | | | 2,092,768 | |
| | | | |
FHLMC | | | 6.00 | | | | 10-1-2032 | | | | 25,125 | | | | 28,809 | |
| | | | |
FHLMC | | | 6.00 | | | | 5-25-2043 | | | | 4,065,752 | | | | 4,677,305 | |
| | | | |
FHLMC (1 Year Treasury Constant Maturity +2.13%)± | | | 6.38 | | | | 1-1-2026 | | | | 49,674 | | | | 48,600 | |
| | | | |
FHLMC | | | 6.50 | | | | 4-1-2021 | | | | 938 | | | | 942 | |
| | | | |
FHLMC | | | 6.50 | | | | 4-1-2022 | | | | 23,737 | | | | 26,307 | |
| | | | |
FHLMC | | | 6.50 | | | | 9-1-2028 | | | | 13,836 | | | | 15,565 | |
| | | | |
FHLMC | | | 6.50 | | | | 9-1-2028 | | | | 17,649 | | | | 19,561 | |
| | | | |
FHLMC | | | 6.50 | | | | 7-1-2031 | | | | 2 | | | | 2 | |
| | | | |
FHLMC | | | 7.00 | | | | 12-1-2023 | | | | 1,874 | | | | 2,012 | |
| | | | |
FHLMC | | | 7.00 | | | | 12-1-2026 | | | | 362 | | | | 389 | |
| | | | |
FHLMC | | | 7.00 | | | | 4-1-2029 | | | | 1,175 | | | | 1,339 | |
| | | | |
FHLMC | | | 7.00 | | | | 5-1-2029 | | | | 7,381 | | | | 8,523 | |
| | | | |
FHLMC | | | 7.00 | | | | 4-1-2032 | | | | 80,014 | | | | 93,124 | |
| | | | |
FHLMC | | | 7.50 | | | | 11-1-2031 | | | | 180,738 | | | | 210,935 | |
The accompanying notes are an integral part of these financial statements.
Wells Fargo Government Securities Fund | 11
Portfolio of investments—August 31, 2019
| | | | | | | | | | | | | | | | |
| | | Interest
rate | | | Maturity
date | | | Principal | | | Value | |
| Agency Securities (continued) | |
| | | | |
FHLMC | | | 7.50 | % | | | 4-1-2032 | | | $ | 151,244 | | | $ | 174,677 | |
| | | | |
FHLMC | | | 8.00 | | | | 8-1-2023 | | | | 5,719 | | | | 6,005 | |
| | | | |
FHLMC | | | 8.00 | | | | 6-1-2024 | | | | 3,144 | | | | 3,374 | |
| | | | |
FHLMC | | | 8.00 | | | | 6-1-2024 | | | | 2,375 | | | | 2,398 | |
| | | | |
FHLMC | | | 8.00 | | | | 6-1-2024 | | | | 4,454 | | | | 4,568 | |
| | | | |
FHLMC | | | 8.00 | | | | 8-1-2026 | | | | 12,832 | | | | 14,671 | |
| | | | |
FHLMC | | | 8.00 | | | | 11-1-2026 | | | | 11,856 | | | | 13,480 | |
| | | | |
FHLMC | | | 8.00 | | | | 11-1-2028 | | | | 7,362 | | | | 7,957 | |
| | | | |
FHLMC | | | 8.50 | | | | 7-1-2022 | | | | 721 | | | | 728 | |
| | | | |
FHLMC | | | 8.50 | | | | 12-1-2025 | | | | 7,897 | | | | 8,607 | |
| | | | |
FHLMC | | | 8.50 | | | | 5-1-2026 | | | | 1,033 | | | | 1,093 | |
| | | | |
FHLMC | | | 8.50 | | | | 8-1-2026 | | | | 4,475 | | | | 4,518 | |
| | | | |
FHLMC | | | 8.50 | | | | 8-1-2026 | | | | 15,350 | | | | 15,384 | |
| | | | |
FHLMC | | | 9.00 | | | | 2-1-2020 | | | | 10 | | | | 10 | |
| | | | |
FHLMC | | | 9.00 | | | | 3-1-2020 | | | | 70 | | | | 70 | |
| | | | |
FHLMC | | | 9.00 | | | | 9-1-2020 | | | | 2 | | | | 2 | |
| | | | |
FHLMC | | | 9.00 | | | | 9-1-2020 | | | | 105 | | | | 105 | |
| | | | |
FHLMC | | | 9.00 | | | | 3-1-2021 | | | | 62 | | | | 63 | |
| | | | |
FHLMC | | | 9.00 | | | | 4-1-2021 | | | | 51 | | | | 51 | |
| | | | |
FHLMC | | | 9.00 | | | | 4-1-2021 | | | | 52 | | | | 53 | |
| | | | |
FHLMC | | | 9.00 | | | | 7-1-2021 | | | | 713 | | | | 716 | |
| | | | |
FHLMC | | | 9.00 | | | | 8-1-2021 | | | | 56 | | | | 58 | |
| | | | |
FHLMC | | | 9.00 | | | | 7-1-2022 | | | | 34 | | | | 35 | |
| | | | |
FHLMC | | | 9.00 | | | | 9-1-2024 | | | | 150 | | | | 151 | |
| | | | |
FHLMC | | | 9.50 | | | | 6-1-2020 | | | | 5 | | | | 5 | |
| | | | |
FHLMC | | | 9.50 | | | | 8-1-2020 | | | | 18 | | | | 18 | |
| | | | |
FHLMC | | | 9.50 | | | | 9-1-2020 | | | | 4 | | | | 4 | |
| | | | |
FHLMC | | | 9.50 | | | | 9-1-2020 | | | | 93 | | | | 93 | |
| | | | |
FHLMC | | | 9.50 | | | | 9-1-2020 | | | | 4 | | | | 4 | |
| | | | |
FHLMC | | | 9.50 | | | | 10-1-2020 | | | | 5 | | | | 5 | |
| | | | |
FHLMC | | | 9.50 | | | | 10-1-2020 | | | | 4 | | | | 4 | |
| | | | |
FHLMC | | | 9.50 | | | | 11-1-2020 | | | | 10 | | | | 10 | |
| | | | |
FHLMC | | | 9.50 | | | | 5-1-2021 | | | | 52 | | | | 54 | |
| | | | |
FHLMC | | | 9.50 | | | | 9-17-2022 | | | | 17,929 | | | | 17,959 | |
| | | | |
FHLMC | | | 9.50 | | | | 4-1-2025 | | | | 12,115 | | | | 12,240 | |
| | | | |
FHLMC | | | 10.00 | | | | 12-1-2019 | | | | 7 | | | | 7 | |
| | | | |
FHLMC | | | 10.00 | | | | 6-1-2020 | | | | 2 | | | | 2 | |
| | | | |
FHLMC | | | 10.00 | | | | 8-1-2020 | | | | 4 | | | | 4 | |
| | | | |
FHLMC | | | 10.00 | | | | 10-1-2021 | | | | 765 | | | | 769 | |
| | | | |
FHLMC | | | 10.00 | | | | 8-17-2022 | | | | 517 | | | | 522 | |
| | | | |
FHLMC | | | 10.00 | | | | 2-17-2025 | | | | 34,346 | | | | 34,347 | |
| | | | |
FHLMC | | | 10.50 | | | | 12-1-2019 | | | | 692 | | | | 691 | |
| | | | |
FHLMC Series 2015-SC01 Class 1A | | | 3.50 | | | | 5-25-2045 | | | | 2,086,267 | | | | 2,128,556 | |
| | | | |
FHLMC Series 2882 Class TF (1 Month LIBOR +0.25%)± | | | 2.45 | | | | 10-15-2034 | | | | 98,140 | | | | 98,177 | |
| | | | |
FHLMC Series 3948 Class DA | | | 3.00 | | | | 12-15-2024 | | | | 30,884 | | | | 30,880 | |
| | | | |
FHLMC Series 4218 Class DF (1 Month LIBOR +0.25%)± | | | 2.45 | | | | 7-15-2042 | | | | 642,259 | | | | 639,964 | |
| | | | |
FHLMC Series K020 Class X1±±(c) | | | 1.53 | | | | 5-25-2022 | | | | 43,388,745 | | | | 1,384,925 | |
| | | | |
FHLMC Series K032 Class A2±± | | | 3.31 | | | | 5-25-2023 | | | | 2,800,000 | | | | 2,940,974 | |
| | | | |
FHLMC Series K039 Class A2 | | | 3.30 | | | | 7-25-2024 | | | | 325,000 | | | | 346,216 | |
| | | | |
FHLMC Series K075 Class A2±± | | | 3.65 | | | | 2-25-2028 | | | | 4,370,000 | | | | 4,900,064 | |
| | | | |
FHLMC Series K153 Class A3±± | | | 3.12 | | | | 10-25-2031 | | | | 160,000 | | | | 172,460 | |
The accompanying notes are an integral part of these financial statements.
12 | Wells Fargo Government Securities Fund
Portfolio of investments—August 31, 2019
| | | | | | | | | | | | | | | | |
| | | Interest
rate | | | Maturity
date | | | Principal | | | Value | |
| Agency Securities (continued) | |
| | | | |
FHLMC Series KF15 Class A (1 Month LIBOR +0.67%)± | | | 2.89 | % | | | 2-25-2023 | | | $ | 273,261 | | | $ | 273,091 | |
| | | | |
FHLMC Series KJ14 Class A1 | | | 2.20 | | | | 11-25-2023 | | | | 2,980,192 | | | | 3,024,711 | |
| | | | |
FHLMC Series M036 Class A | | | 4.16 | | | | 12-15-2029 | | | | 3,550,000 | | | | 3,858,673 | |
| | | | |
FHLMC SeriesT-15 Class A6 (1 Month LIBOR +0.40%)± | | | 2.55 | | | | 11-25-2028 | | | | 180,173 | | | | 180,864 | |
| | | | |
FHLMC SeriesT-23 Class A (1 Month LIBOR +0.14%)± | | | 2.29 | | | | 5-25-2030 | | | | 565,128 | | | | 564,422 | |
| | | | |
FHLMC SeriesT-35 Class A (1 Month LIBOR +0.14%)± | | | 2.55 | | | | 9-25-2031 | | | | 688,249 | | | | 681,460 | |
| | | | |
FHLMC SeriesT-42 Class A6 | | | 9.50 | | | | 2-25-2042 | | | | 735,677 | | | | 909,435 | |
| | | | |
FHLMC SeriesT-55 Class 2A1±± | | | 4.00 | | | | 3-25-2043 | | | | 369,402 | | | | 371,937 | |
| | | | |
FHLMC SeriesT-57 Class 1A1 | | | 6.50 | | | | 7-25-2043 | | | | 949,496 | | | | 1,139,147 | |
| | | | |
FHLMC SeriesT-57 Class 2A1±± | | | 4.16 | | | | 7-25-2043 | | | | 1,821,947 | | | | 1,980,778 | |
| | | | |
FHLMC SeriesT-62 Class 1A1 (12 Month Treasury Average +1.20%)± | | | 3.68 | | | | 10-25-2044 | | | | 994,104 | | | | 1,004,564 | |
| | | | |
FHLMC SeriesT-67 Class 1A1C±± | | | 3.90 | | | | 3-25-2036 | | | | 665,786 | | | | 679,578 | |
| | | | |
FHLMC SeriesT-67 Class 2A1C±± | | | 3.74 | | | | 3-25-2036 | | | | 1,297,787 | | | | 1,314,887 | |
| | | | |
FHLMC SeriesT-75 Class A1 (1 Month LIBOR +0.04%)± | | | 2.31 | | | | 12-25-2036 | | | | 245,627 | | | | 245,912 | |
| | | | |
FNMA ¤ | | | 0.00 | | | | 5-15-2030 | | | | 7,700,000 | | | | 6,242,775 | |
| | | | |
FNMA | | | 1.71 | | | | 12-1-2022 | | | | 2,737,871 | | | | 2,731,177 | |
| | | | |
FNMA (11th District Cost of Funds +1.25%)± | | | 2.45 | | | | 5-1-2036 | | | | 1,110,375 | | | | 1,106,152 | |
| | | | |
FNMA (12 Month LIBOR +1.61%)± | | | 2.49 | | | | 5-1-2046 | | | | 4,867,385 | | | | 4,931,338 | |
| | | | |
FNMA (1 Month LIBOR +0.35%)± | | | 2.50 | | | | 2-25-2032 | | | | 494,137 | | | | 494,571 | |
| | | | |
FNMA | | | 2.50 | | | | 4-25-2039 | | | | 24,930 | | | | 24,826 | |
| | | | |
FNMA | | | 2.55 | | | | 3-1-2022 | | | | 1,592,578 | | | | 1,622,803 | |
| | | | |
FNMA (1 Month LIBOR +0.25%)± | | | 2.60 | | | | 6-27-2036 | | | | 88,133 | | | | 86,538 | |
| | | | |
FNMA (11th District Cost of Funds +1.56%)± | | | 2.68 | | | | 5-1-2023 | | | | 36,064 | | | | 35,957 | |
| | | | |
FNMA (11th District Cost of Funds +1.25%)± | | | 2.79 | | | | 9-1-2027 | | | | 158,855 | | | | 159,821 | |
| | | | |
FNMA | | | 2.86 | | | | 11-1-2021 | | | | 2,518,783 | | | | 2,583,001 | |
| | | | |
FNMA±± | | | 2.89 | | | | 2-25-2027 | | | | 10,000,000 | | | | 10,545,106 | |
| | | | |
FNMA | | | 3.00 | | | | 5-1-2027 | | | | 1,211,416 | | | | 1,246,844 | |
| | | | |
FNMA | | | 3.00 | | | | 6-1-2034 | | | | 14,911,423 | | | | 15,295,165 | |
| | | | |
FNMA | | | 3.00 | | | | 4-1-2045 | | | | 118,755 | | | | 122,369 | |
| | | | |
FNMA | | | 3.00 | | | | 11-1-2045 | | | | 9,643,480 | | | | 9,936,531 | |
| | | | |
FNMA | | | 3.00 | | | | 12-1-2045 | | | | 22,157,494 | | | | 22,831,531 | |
| | | | |
FNMA | | | 3.00 | | | | 12-1-2046 | | | | 743,722 | | | | 764,075 | |
| | | | |
FNMA | | | 3.02 | | | | 2-1-2026 | | | | 6,145,353 | | | | 6,511,221 | |
| | | | |
FNMA | | | 3.05 | | | | 1-1-2024 | | | | 25,134 | | | | 26,006 | |
| | | | |
FNMA | | | 3.31 | | | | 9-25-2020 | | | | 2,551,118 | | | | 2,571,493 | |
| | | | |
FNMA (11th District Cost of Funds +1.25%)± | | | 3.37 | | | | 5-1-2036 | | | | 375,329 | | | | 389,825 | |
| | | | |
FNMA | | | 3.38 | | | | 9-1-2020 | | | | 1,839,486 | | | | 1,851,192 | |
| | | | |
FNMA | | | 3.48 | | | | 3-1-2029 | | | | 924,588 | | | | 1,026,971 | |
| | | | |
FNMA | | | 3.50 | | | | 4-1-2034 | | | | 13,316,949 | | | | 13,803,955 | |
| | | | |
FNMA | | | 3.50 | | | | 2-1-2043 | | | | 53,572 | | | | 56,035 | |
| | | | |
FNMA | | | 3.50 | | | | 2-1-2045 | | | | 1,847,747 | | | | 1,931,394 | |
| | | | |
FNMA | | | 3.50 | | | | 4-1-2045 | | | | 5,136,994 | | | | 5,365,198 | |
| | | | |
FNMA | | | 3.50 | | | | 8-1-2045 | | | | 651,931 | | | | 680,368 | |
| | | | |
FNMA | | | 3.50 | | | | 12-1-2045 | | | | 2,443,329 | | | | 2,549,967 | |
| | | | |
FNMA | | | 3.50 | | | | 2-1-2046 | | | | 2,375,145 | | | | 2,478,569 | |
| | | | |
FNMA | | | 3.50 | | | | 8-1-2049 | | | | 9,148,456 | | | | 9,421,843 | |
| | | | |
FNMA | | | 3.63 | | | | 3-1-2029 | | | | 390,000 | | | | 436,030 | |
| | | | |
FNMA | | | 3.77 | | | | 3-1-2029 | | | | 994,826 | | | | 1,122,144 | |
| | | | |
FNMA | | | 3.86 | | | | 3-1-2029 | | | | 843,870 | | | | 959,132 | |
| | | | |
FNMA (c) | | | 4.00 | | | | 10-25-2025 | | | | 112,609 | | | | 1,788 | |
| | | | |
FNMA | | | 4.00 | | | | 4-1-2046 | | | | 13,547,438 | | | | 14,277,049 | |
The accompanying notes are an integral part of these financial statements.
Wells Fargo Government Securities Fund | 13
Portfolio of investments—August 31, 2019
| | | | | | | | | | | | | | | | |
| | | Interest
rate | | | Maturity
date | | | Principal | | | Value | |
| Agency Securities (continued) | |
| | | | |
FNMA | | | 4.00 | % | | | 3-1-2047 | | | $ | 1,516,070 | | | $ | 1,620,332 | |
| | | | |
FNMA | | | 4.50 | | | | 1-1-2026 | | | | 83,977 | | | | 86,358 | |
| | | | |
FNMA | | | 4.50 | | | | 10-1-2046 | | | | 385,184 | | | | 409,104 | |
| | | | |
FNMA | | | 4.50 | | | | 9-1-2049 | | | | 5,052,371 | | | | 5,334,148 | |
| | | | |
FNMA %% | | | 4.50 | | | | 9-12-2049 | | | | 10,940,000 | | | | 11,515,092 | |
| | | | |
FNMA (12 Month LIBOR +1.78%)± | | | 4.50 | | | | 8-1-2036 | | | | 534,351 | | | | 563,424 | |
| | | | |
FNMA (12 Month LIBOR +1.54%)± | | | 4.51 | | | | 1-1-2043 | | | | 211,595 | | | | 217,833 | |
| | | | |
FNMA (1 Year Treasury Constant Maturity +2.21%)± | | | 4.58 | | | | 9-1-2031 | | | | 28,722 | | | | 30,199 | |
| | | | |
FNMA (1 Year Treasury Constant Maturity +2.26%)± | | | 4.59 | | | | 9-1-2031 | | | | 109,567 | | | | 113,425 | |
| | | | |
FNMA (12 Month LIBOR +1.73%)± | | | 4.61 | | | | 9-1-2036 | | | | 359,573 | | | | 374,315 | |
| | | | |
FNMA (12 Month LIBOR +1.63%)± | | | 4.63 | | | | 4-1-2032 | | | | 66,318 | | | | 66,891 | |
| | | | |
FNMA (1 Year Treasury Constant Maturity +2.19%)± | | | 4.64 | | | | 11-1-2031 | | | | 118,656 | | | | 124,389 | |
| | | | |
FNMA (1 Year Treasury Constant Maturity +2.30%)± | | | 4.67 | | | | 6-1-2034 | | | | 281,380 | | | | 291,762 | |
| | | | |
FNMA (1 Year Treasury Constant Maturity +2.23%)± | | | 4.70 | | | | 12-1-2040 | | | | 24,323 | | | | 25,577 | |
| | | | |
FNMA (1 Year Treasury Constant Maturity +2.22%)± | | | 4.72 | | | | 6-1-2032 | | | | 110,771 | | | | 115,196 | |
| | | | |
FNMA (1 Year Treasury Constant Maturity +2.20%)± | | | 4.76 | | | | 2-1-2027 | | | | 1,445 | | | | 1,445 | |
| | | | |
FNMA (1 Year Treasury Constant Maturity +2.22%)± | | | 4.86 | | | | 12-1-2034 | | | | 419,391 | | | | 436,104 | |
| | | | |
FNMA (1 Year Treasury Constant Maturity +2.42%)± | | | 4.87 | | | | 10-1-2027 | | | | 110,785 | | | | 114,615 | |
| | | | |
FNMA | | | 5.00 | | | | 4-1-2023 | | | | 148,400 | | | | 153,868 | |
| | | | |
FNMA | | | 5.00 | | | | 6-1-2023 | | | | 278,799 | | | | 287,649 | |
| | | | |
FNMA | | | 5.00 | | | | 3-1-2034 | | | | 431,001 | | | | 479,701 | |
| | | | |
FNMA | | | 5.00 | | | | 8-1-2040 | | | | 5,234,006 | | | | 5,751,013 | |
| | | | |
FNMA | | | 5.00 | | | | 10-1-2040 | | | | 653,060 | | | | 719,169 | |
| | | | |
FNMA | | | 5.00 | | | | 1-1-2042 | | | | 496,330 | | | | 545,658 | |
| | | | |
FNMA | | | 5.00 | | | | 11-1-2048 | | | | 2,001,119 | | | | 2,143,579 | |
| | | | |
FNMA | | | 5.00 | | | | 12-1-2048 | | | | 1,809,510 | | | | 1,937,485 | |
| | | | |
FNMA (1 Year Treasury Constant Maturity +2.32%)± | | | 5.13 | | | | 7-1-2026 | | | | 110,411 | | | | 114,277 | |
| | | | |
FNMA | | | 5.50 | | | | 6-1-2020 | | | | 58,058 | | | | 58,292 | |
| | | | |
FNMA | | | 5.50 | | | | 11-1-2023 | | | | 51,042 | | | | 53,500 | |
| | | | |
FNMA | | | 5.50 | | | | 1-1-2025 | | | | 112,660 | | | | 116,560 | |
| | | | |
FNMA | | | 5.50 | | | | 1-1-2025 | | | | 23,105 | | | | 23,941 | |
| | | | |
FNMA | | | 5.50 | | | | 9-1-2033 | | | | 1,753,770 | | | | 1,983,204 | |
| | | | |
FNMA | | | 5.50 | | | | 9-1-2033 | | | | 652,256 | | | | 737,157 | |
| | | | |
FNMA | | | 5.50 | | | | 8-1-2035 | | | | 500,285 | | | | 565,558 | |
| | | | |
FNMA | | | 5.50 | | | | 1-1-2037 | | | | 508,672 | | | | 575,347 | |
| | | | |
FNMA | | | 5.50 | | | | 4-1-2040 | | | | 1,328,210 | | | | 1,502,299 | |
| | | | |
FNMA | | | 5.61 | | | | 2-1-2021 | | | | 719,682 | | | | 731,241 | |
| | | | |
FNMA | | | 5.75 | | | | 5-1-2021 | | | | 3,067,984 | | | | 3,182,238 | |
| | | | |
FNMA | | | 5.95 | | | | 6-1-2024 | | | | 1,558,136 | | | | 1,656,554 | |
| | | | |
FNMA | | | 6.00 | | | | 3-1-2024 | | | | 51,332 | | | | 56,492 | |
| | | | |
FNMA | | | 6.00 | | | | 1-1-2028 | | | | 773,734 | | | | 851,505 | |
| | | | |
FNMA | | | 6.00 | | | | 2-1-2035 | | | | 1,089,146 | | | | 1,205,346 | |
| | | | |
FNMA | | | 6.00 | | | | 11-1-2037 | | | | 409,487 | | | | 467,271 | |
| | | | |
FNMA | | | 6.00 | | | | 7-1-2038 | | | | 146,339 | | | | 167,906 | |
| | | | |
FNMA (6 Month LIBOR +2.86%)± | | | 6.23 | | | | 4-1-2033 | | | | 11,434 | | | | 11,845 | |
| | | | |
FNMA (6 Month LIBOR +3.13%)± | | | 6.24 | | | | 7-1-2033 | | | | 137,139 | | | | 140,302 | |
| | | | |
FNMA | | | 6.50 | | | | 1-1-2024 | | | | 14,050 | | | | 15,565 | |
| | | | |
FNMA | | | 6.50 | | | | 3-1-2028 | | | | 12,827 | | | | 13,703 | |
| | | | |
FNMA | | | 6.50 | | | | 12-1-2029 | | | | 179,669 | | | | 203,647 | |
| | | | |
FNMA | | | 6.50 | | | | 11-1-2031 | | | | 39,820 | | | | 44,596 | |
| | | | |
FNMA | | | 6.50 | | | | 7-1-2036 | | | | 318,443 | | | | 380,640 | |
The accompanying notes are an integral part of these financial statements.
14 | Wells Fargo Government Securities Fund
Portfolio of investments—August 31, 2019
| | | | | | | | | | | | | | | | |
| | | Interest
rate | | | Maturity
date | | | Principal | | | Value | |
| Agency Securities (continued) | |
| | | | |
FNMA | | | 6.50 | % | | | 7-1-2036 | | | $ | 291,477 | | | $ | 337,660 | |
| | | | |
FNMA | | | 6.50 | | | | 7-25-2042 | | | | 1,312,151 | | | | 1,535,653 | |
| | | | |
FNMA | | | 7.00 | | | | 11-1-2026 | | | | 4,612 | | | | 4,939 | |
| | | | |
FNMA | | | 7.00 | | | | 9-1-2031 | | | | 3,374 | | | | 3,375 | |
| | | | |
FNMA | | | 7.00 | | | | 1-1-2032 | | | | 2,002 | | | | 2,243 | |
| | | | |
FNMA | | | 7.00 | | | | 2-1-2032 | | | | 75,418 | | | | 89,678 | |
| | | | |
FNMA | | | 7.00 | | | | 10-1-2032 | | | | 168,066 | | | | 201,199 | |
| | | | |
FNMA | | | 7.00 | | | | 2-1-2034 | | | | 1,865 | | | | 2,129 | |
| | | | |
FNMA | | | 7.00 | | | | 4-1-2034 | | | | 116,738 | | | | 137,348 | |
| | | | |
FNMA | | | 7.00 | | | | 1-1-2036 | | | | 6,191 | | | | 6,608 | |
| | | | |
FNMA | | | 7.50 | | | | 9-1-2031 | | | | 77,081 | | | | 91,106 | |
| | | | |
FNMA | | | 7.50 | | | | 11-25-2031 | | | | 312,471 | | | | 370,558 | |
| | | | |
FNMA | | | 7.50 | | | | 2-1-2032 | | | | 26,742 | | | | 31,104 | |
| | | | |
FNMA | | | 7.50 | | | | 10-1-2037 | | | | 738,285 | | | | 886,937 | |
| | | | |
FNMA | | | 8.00 | | | | 5-1-2027 | | | | 25,701 | | | | 25,870 | |
| | | | |
FNMA | | | 8.00 | | | | 6-1-2028 | | | | 4,047 | | | | 4,412 | |
| | | | |
FNMA | | | 8.00 | | | | 2-1-2030 | | | | 30,160 | | | | 30,455 | |
| | | | |
FNMA | | | 8.00 | | | | 7-1-2031 | | | | 829,465 | | | | 948,349 | |
| | | | |
FNMA | | | 8.50 | | | | 8-1-2024 | | | | 4,616 | | | | 4,624 | |
| | | | |
FNMA | | | 8.50 | | | | 5-1-2026 | | | | 79,346 | | | | 86,372 | |
| | | | |
FNMA | | | 8.50 | | | | 7-1-2026 | | | | 19,545 | | | | 20,078 | |
| | | | |
FNMA | | | 8.50 | | | | 10-1-2026 | | | | 51 | | | | 51 | |
| | | | |
FNMA | | | 8.50 | | | | 10-1-2026 | | | | 2,729 | | | | 2,733 | |
| | | | |
FNMA | | | 8.50 | | | | 11-1-2026 | | | | 25,188 | | | | 25,477 | |
| | | | |
FNMA | | | 8.50 | | | | 11-1-2026 | | | | 6,254 | | | | 6,424 | |
| | | | |
FNMA | | | 8.50 | | | | 12-1-2026 | | | | 106,009 | | | | 118,189 | |
| | | | |
FNMA | | | 8.50 | | | | 12-1-2026 | | | | 13,694 | | | | 15,080 | |
| | | | |
FNMA | | | 8.50 | | | | 12-1-2026 | | | | 237 | | | | 237 | |
| | | | |
FNMA | | | 8.50 | | | | 2-1-2027 | | | | 159 | | | | 175 | |
| | | | |
FNMA | | | 8.50 | | | | 2-1-2027 | | | | 5,645 | | | | 5,654 | |
| | | | |
FNMA | | | 8.50 | | | | 3-1-2027 | | | | 705 | | | | 748 | |
| | | | |
FNMA | | | 8.50 | | | | 6-1-2027 | | | | 56,731 | | | | 58,583 | |
| | | | |
FNMA | | | 9.00 | | | | 3-1-2021 | | | | 2,973 | | | | 2,990 | |
| | | | |
FNMA | | | 9.00 | | | | 6-1-2021 | | | | 38 | | | | 39 | |
| | | | |
FNMA | | | 9.00 | | | | 8-1-2021 | | | | 39 | | | | 40 | |
| | | | |
FNMA | | | 9.00 | | | | 10-1-2021 | | | | 499 | | | | 502 | |
| | | | |
FNMA | | | 9.00 | | | | 1-1-2025 | | | | 13,635 | | | | 14,785 | |
| | | | |
FNMA | | | 9.00 | | | | 3-1-2025 | | | | 1,673 | | | | 1,676 | |
| | | | |
FNMA | | | 9.00 | | | | 3-1-2025 | | | | 803 | | | | 804 | |
| | | | |
FNMA | | | 9.00 | | | | 7-1-2028 | | | | 3,745 | | | | 3,773 | |
| | | | |
FNMA | | | 9.50 | | | | 11-1-2020 | | | | 15 | | | | 15 | |
| | | | |
FNMA | | | 9.50 | | | | 12-15-2020 | | | | 1,471 | | | | 1,479 | |
| | | | |
FNMA | | | 9.50 | | | | 6-1-2022 | | | | 302 | | | | 304 | |
| | | | |
FNMA | | | 9.50 | | | | 7-1-2028 | | | | 5,032 | | | | 5,044 | |
| | | | |
FNMA | | | 11.00 | | | | 10-15-2020 | | | | 45 | | | | 46 | |
| | | | |
FNMA Series1989-100 Class Z | | | 8.75 | | | | 12-25-2019 | | | | 138 | | | | 138 | |
| | | | |
FNMA Series1989-63 Class Z | | | 9.40 | | | | 10-25-2019 | | | | 36 | | | | 36 | |
| | | | |
FNMA Series1990-144 Class W | | | 9.50 | | | | 12-25-2020 | | | | 7,283 | | | | 7,534 | |
| | | | |
FNMA Series1990-75 Class Z | | | 9.50 | | | | 7-25-2020 | | | | 1,993 | | | | 2,015 | |
| | | | |
FNMA Series1990-84 Class Y | | | 9.00 | | | | 7-25-2020 | | | | 1,183 | | | | 1,204 | |
| | | | |
FNMA Series1990-96 Class Z | | | 9.67 | | | | 8-25-2020 | | | | 14,655 | | | | 14,949 | |
The accompanying notes are an integral part of these financial statements.
Wells Fargo Government Securities Fund | 15
Portfolio of investments—August 31, 2019
| | | | | | | | | | | | | | | | |
| | | Interest
rate | | | Maturity
date | | | Principal | | | Value | |
| Agency Securities(continued) | |
| | | | |
FNMA Series1991-5 Class Z | | | 8.75 | % | | | 1-25-2021 | | | $ | 316 | | | $ | 316 | |
| | | | |
FNMA Series1991-85 Class Z | | | 8.00 | | | | 6-25-2021 | | | | 10,405 | | | | 10,767 | |
| | | | |
FNMA Series1992-45 Class Z | | | 8.00 | | | | 4-25-2022 | | | | 31,116 | | | | 32,749 | |
| | | | |
FNMA Series2000-T6 Class A2 | | | 9.50 | | | | 11-25-2040 | | | | 625,123 | | | | 716,068 | |
| | | | |
FNMA Series2001-T10 Class A3 | | | 9.50 | | | | 12-25-2041 | | | | 717,621 | | | | 850,807 | |
| | | | |
FNMA Series2001-T12 Class A3 | | | 9.50 | | | | 8-25-2041 | | | | 200,637 | | | | 243,475 | |
| | | | |
FNMA Series2002-T12 Class A5±± | | | 4.88 | | | | 10-25-2041 | | | | 787,083 | | | | 817,755 | |
| | | | |
FNMA Series2002-T19 Class A1 | | | 6.50 | | | | 7-25-2042 | | | | 3,539,647 | | | | 4,177,499 | |
| | | | |
FNMA Series2002-T5 Class A1 (1 Month LIBOR +0.24%)± | | | 2.39 | | | | 5-25-2032 | | | | 145,153 | | | | 143,552 | |
| | | | |
FNMA Series2002-W4 Class A4 | | | 6.25 | | | | 5-25-2042 | | | | 519,871 | | | | 595,879 | |
| | | | |
FNMA Series2003-T2 Class A1 (1 Month LIBOR +0.14%)± | | | 2.68 | | | | 3-25-2033 | | | | 952,236 | | | | 934,010 | |
| | | | |
FNMA Series2003-W09 Class A (1 Month LIBOR +0.12%)± | | | 2.51 | | | | 6-25-2033 | | | | 83,766 | | | | 82,317 | |
| | | | |
FNMA Series2003-W1 Class 1A1±± | | | 5.32 | | | | 12-25-2042 | | | | 684,476 | | | | 753,673 | |
| | | | |
FNMA Series2003-W11 Class A1±± | | | 5.44 | | | | 6-25-2033 | | | | 40,288 | | | | 42,097 | |
| | | | |
FNMA Series2003-W3 Class 1A4±± | | | 4.23 | | | | 8-25-2042 | | | | 2,160,473 | | | | 2,274,962 | |
| | | | |
FNMA Series2003-W5 Class A (1 Month LIBOR +0.11%)± | | | 2.49 | | | | 4-25-2033 | | | | 279,403 | | | | 273,381 | |
| | | | |
FNMA Series2003-W6 Class 6A±± | | | 4.45 | | | | 8-25-2042 | | | | 1,185,879 | | | | 1,219,488 | |
| | | | |
FNMA Series2003-W6 Class PT4±± | | | 8.57 | | | | 10-25-2042 | | | | 1,205,916 | | | | 1,518,779 | |
| | | | |
FNMA Series2003-W8 Class PT1±± | | | 9.20 | | | | 12-25-2042 | | | | 454,787 | | | | 527,666 | |
| | | | |
FNMA Series2004-T1 Class 1A2 | | | 6.50 | | | | 1-25-2044 | | | | 375,763 | | | | 433,480 | |
| | | | |
FNMA Series2004-W01 Class 2A2 | | | 7.00 | | | | 12-25-2033 | | | | 994,755 | | | | 1,150,556 | |
| | | | |
FNMA Series2004-W15 Class 1A3 | | | 7.00 | | | | 8-25-2044 | | | | 672,925 | | | | 794,129 | |
| | | | |
FNMA Series2005-71 Class DB | | | 4.50 | | | | 8-25-2025 | | | | 445,837 | | | | 456,302 | |
| | | | |
FNMA Series2007-W10 Class 2A±± | | | 6.31 | | | | 8-25-2047 | | | | 323,892 | | | | 364,181 | |
| | | | |
FNMA Series2011-15 Class HI (c) | | | 5.50 | | | | 3-25-2026 | | | | 147,578 | | | | 4,130 | |
| | | | |
FNMA Series2013-17 Class PC | | | 2.00 | | | | 3-25-2039 | | | | 1,268,526 | | | | 1,270,506 | |
| | | | |
FNMA Series2014-20 Class TM±± | | | 4.84 | | | | 4-25-2044 | | | | 1,206,798 | | | | 1,373,156 | |
| | | | |
FNMA Series2018-M13 Class A2±± | | | 3.82 | | | | 9-25-2030 | | | | 460,000 | | | | 523,498 | |
| | | | |
FNMA Series 265 Class 2 | | | 9.00 | | | | 3-25-2024 | | | | 48,703 | | | | 54,570 | |
| | | | |
FNMA SeriesG-8 Class E | | | 9.00 | | | | 4-25-2021 | | | | 10,109 | | | | 10,325 | |
| | | | |
FNMA SeriesG92-30 Class Z | | | 7.00 | | | | 6-25-2022 | | | | 16,128 | | | | 16,613 | |
| | | | |
FNMA SeriesG93-39 Class ZQ | | | 6.50 | | | | 12-25-2023 | | | | 769,497 | | | | 818,328 | |
| | | | |
GNMA±±(c) | | | 1.66 | | | | 4-20-2069 | | | | 11,074,767 | | | | 458,663 | |
| | | | |
GNMA | | | 3.00 | | | | 11-20-2045 | | | | 10,090,833 | | | | 10,452,396 | |
| | | | |
GNMA %% | | | 3.00 | | | | 9-19-2049 | | | | 6,870,000 | | | | 7,083,077 | |
| | | | |
GNMA | | | 3.50 | | | | 12-20-2047 | | | | 13,013,050 | | | | 13,571,676 | |
| | | | |
GNMA %% | | | 3.50 | | | | 9-19-2049 | | | | 8,105,000 | | | | 8,420,335 | |
| | | | |
GNMA (1 Year Treasury Constant Maturity +1.50%)± | | | 4.00 | | | | 8-20-2020 | | | | 13,887 | | | | 13,903 | |
| | | | |
GNMA | | | 4.00 | | | | 11-15-2024 | | | | 1,169,290 | | | | 1,215,284 | |
| | | | |
GNMA | | | 4.00 | | | | 12-20-2047 | | | | 9,465,484 | | | | 9,917,816 | |
| | | | |
GNMA (1 Year Treasury Constant Maturity +1.50%)± | | | 4.13 | | | | 11-20-2020 | | | | 11,118 | | | | 11,160 | |
| | | | |
GNMA | | | 4.25 | | | | 6-20-2036 | | | | 434,801 | | | | 459,974 | |
| | | | |
GNMA | | | 4.50 | | | | 10-20-2048 | | | | 148,597 | | | | 155,204 | |
| | | | |
GNMA | | | 4.50 | | | | 8-20-2049 | | | | 2,565,000 | | | | 2,702,698 | |
| | | | |
GNMA | | | 5.00 | | | | 7-20-2040 | | | | 1,098,607 | | | | 1,211,513 | |
| | | | |
GNMA | | | 5.50 | | | | 4-20-2034 | | | | 601,841 | | | | 647,792 | |
| | | | |
GNMA | | | 6.00 | | | | 8-20-2034 | | | | 85,334 | | | | 91,700 | |
| | | | |
GNMA | | | 6.50 | | | | 12-15-2025 | | | | 6,667 | | | | 7,336 | |
| | | | |
GNMA | | | 6.50 | | | | 5-15-2029 | | | | 602 | | | | 662 | |
| | | | |
GNMA | | | 6.50 | | | | 5-15-2031 | | | | 1,213 | | | | 1,334 | |
| | | | |
GNMA | | | 6.50 | | | | 9-20-2033 | | | | 43,722 | | | | 51,204 | |
The accompanying notes are an integral part of these financial statements.
16 | Wells Fargo Government Securities Fund
Portfolio of investments—August 31, 2019
| | | | | | | | | | | | | | | | |
| | | Interest
rate | | | Maturity
date | | | Principal | | | Value | |
| Agency Securities(continued) | |
| | | | |
GNMA | | | 7.00 | % | | | 12-15-2022 | | | $ | 7,994 | | | $ | 8,268 | |
| | | | |
GNMA | | | 7.00 | | | | 5-15-2026 | | | | 1,659 | | | | 1,763 | |
| | | | |
GNMA | | | 7.00 | | | | 3-15-2028 | | | | 20,913 | | | | 21,166 | |
| | | | |
GNMA | | | 7.00 | | | | 4-15-2031 | | | | 879 | | | | 894 | |
| | | | |
GNMA | | | 7.00 | | | | 8-15-2031 | | | | 18,453 | | | | 19,127 | |
| | | | |
GNMA | | | 7.00 | | | | 3-15-2032 | | | | 13,847 | | | | 14,095 | |
| | | | |
GNMA | | | 7.34 | | | | 10-20-2021 | | | | 16,622 | | | | 16,727 | |
| | | | |
GNMA | | | 7.34 | | | | 9-20-2022 | | | | 5,682 | | | | 5,689 | |
| | | | |
GNMA | | | 8.00 | | | | 6-15-2023 | | | | 2,495 | | | | 2,631 | |
| | | | |
GNMA | | | 8.00 | | | | 12-15-2023 | | | | 130,537 | | | | 140,142 | |
| | | | |
GNMA | | | 8.00 | | | | 2-15-2024 | | | | 507 | | | | 541 | |
| | | | |
GNMA | | | 8.00 | | | | 9-15-2024 | | | | 2,564 | | | | 2,596 | |
| | | | |
GNMA | | | 8.00 | | | | 6-15-2025 | | | | 50 | | | | 50 | |
| | | | |
GNMA | | | 8.35 | | | | 4-15-2020 | | | | 1,281 | | | | 1,281 | |
| | | | |
GNMA | | | 8.40 | | | | 5-15-2020 | | | | 1,866 | | | | 1,866 | |
| | | | |
GNMA | | | 9.50 | | | | 10-20-2019 | | | | 15 | | | | 15 | |
| | | | |
GNMA Series2002-53 Class IO±±(c) | | | 0.60 | | | | 4-16-2042 | | | | 402,814 | | | | 6 | |
| | | | |
GNMA Series2005-23 Class IO±±(c) | | | 0.02 | | | | 6-17-2045 | | | | 1,732,400 | | | | 949 | |
| | | | |
GNMA Series2006-32 Class XM±±(c) | | | 0.03 | | | | 11-16-2045 | | | | 5,848,431 | | | | 5,547 | |
| | | | |
GNMA Series2006-68 Class D±± | | | 5.31 | | | | 12-16-2037 | | | | 218,373 | | | | 218,288 | |
| | | | |
GNMA Series2007-69 Class D±± | | | 5.25 | | | | 6-16-2041 | | | | 447,924 | | | | 464,423 | |
| | | | |
GNMA Series2008-22 Class XM±±(c) | | | 1.00 | | | | 2-16-2050 | | | | 13,558,229 | | | | 322,972 | |
| | | | |
GNMA Series2010-158 Class EI (c) | | | 4.00 | | | | 12-16-2025 | | | | 7,919,898 | | | | 613,065 | |
| | | | |
GNMA Series2012-12 Class HD | | | 2.00 | | | | 5-20-2062 | | | | 332,945 | | | | 331,973 | |
| | | | |
Resolution Funding Corporation STRIPS ¤ | | | 0.00 | | | | 7-15-2020 | | | | 14,300,000 | | | | 14,079,457 | |
| | | | |
Resolution Funding Corporation STRIPS ¤ | | | 0.00 | | | | 4-15-2030 | | | | 6,100,000 | | | | 4,951,158 | |
| | | | |
Resolution Funding Corporation STRIPS ¤ | | | 0.00 | | | | 5-15-2039 | | | | 8,275,000 | | | | 5,643,928 | |
| | | | |
TVA ¤ | | | 0.00 | | | | 11-1-2025 | | | | 10,000,000 | | | | 8,906,925 | |
| | | | |
TVA | | | 4.25 | | | | 9-15-2065 | | | | 2,600,000 | | | | 3,727,742 | |
| | | | |
TVA | | | 2.88 | | | | 2-1-2027 | | | | 2,430,000 | | | | 2,613,906 | |
| | | | |
TVA | | | 4.63 | | | | 9-15-2060 | | | | 7,550,000 | | | | 11,371,456 | |
| | | | |
TVA | | | 5.88 | | | | 4-1-2036 | | | | 4,380,000 | | | | 6,465,583 | |
| |
Total Agency Securities (Cost $437,767,738) | | | | 457,991,426 | |
| | | | | |
|
| Asset-Backed Securities: 0.98% | |
| | | | |
MMAF Equipment Finance LLC Series2017-AA Class A4 144A | | | 2.41 | | | | 8-16-2024 | | | | 4,445,000 | | | | 4,478,325 | |
| | | | |
Tesla Auto Lease Trust Series2018-B Class A 144A | | | 3.71 | | | | 8-20-2021 | | | | 1,372,404 | | | | 1,396,800 | |
| |
Total Asset-Backed Securities (Cost $5,817,416) | | | | 5,875,125 | |
| | | | | |
|
Corporate Bonds and Notes: 0.73% | |
|
Financials: 0.73% | |
|
| Mortgage REITs: 0.73% | |
| | | | |
American Tower Trust I 144A | | | 3.65 | | | | 3-15-2048 | | | | 4,000,000 | | | | 4,356,856 | |
| | | | | | | | | | | | | | | | |
| |
Total Corporate Bonds and Notes (Cost $4,000,000) | | | | 4,356,856 | |
| | | | | |
|
Municipal Obligations: 1.59% | |
|
New Jersey: 0.59% | |
|
| GO Revenue: 0.59% | |
| | | | |
Newark NJ | | | 3.75 | | | | 11-1-2019 | | | | 3,515,000 | | | | 3,521,960 | |
| | | | | | | | | | | | | | | | |
The accompanying notes are an integral part of these financial statements.
Wells Fargo Government Securities Fund | 17
Portfolio of investments—August 31, 2019
| | | | | | | | | | | | | | | | |
| | | Interest
rate | | | Maturity
date | | | Principal | | | Value | |
| Texas: 1.00% | |
|
| Miscellaneous Revenue: 1.00% | |
| | | | |
San Antonio TX Retama Development Corporation | | | 10.00 | % | | | 12-15-2020 | | | $ | 5,405,000 | | | $ | 6,008,198 | |
| | | | | | | | | | | | | | | | |
| |
Total Municipal Obligations (Cost $9,236,244) | | | | 9,530,158 | |
| | | | | |
|
| Non-Agency Mortgage-Backed Securities: 5.52% | |
| | | | |
Benchmark Mortgage Trust Series2018-B1 Class A4 | | | 3.40 | | | | 1-15-2051 | | | | 305,000 | | | | 331,677 | |
| | | | |
CD Commercial Mortgage Trust Series2017-6 Class A5 | | | 3.46 | | | | 11-13-2050 | | | | 2,340,000 | | | | 2,545,153 | |
| | | | |
GS Mortgage Securities Trust Series2013-G1 Class A2 144A±± | | | 3.56 | | | | 4-10-2031 | | | | 5,349,842 | | | | 5,490,754 | |
| | | | |
GS Mortgage Securities Trust Series 2019- PJ1 Class A6 144A±± | | | 4.00 | | | | 8-25-2049 | | | | 1,368,506 | | | | 1,382,386 | |
| | | | |
JPMorgan Chase Commercial Mortgage Securities CorporationSeries 2015-C28 Class A4 | | | 3.23 | | | | 10-15-2048 | | | | 5,000,000 | | | | 5,295,356 | |
| | | | |
Mello Warehouse Securitization Series2019-1 Class A (1 Month LIBOR +0.80%) 144A± | | | 2.95 | | | | 6-25-2052 | | | | 3,000,000 | | | | 2,997,344 | |
| | | | |
Morgan Stanley Capital I Trust Series2011-C2 Class A4 144A | | | 4.66 | | | | 6-15-2044 | | | | 4,900,000 | | | | 5,068,171 | |
| | | | |
Starwood Mortgage Residential Trust Series2019-1 Class A1 144A±± | | | 2.94 | | | | 6-25-2049 | | | | 2,546,734 | | | | 2,552,514 | |
| | | | |
UBS Commercial Mortgage Trust Series2017-C5 Class A5 | | | 3.47 | | | | 11-15-2050 | | | | 2,581,000 | | | | 2,813,896 | |
| | | | |
Vendee Mortgage Trust Series1995-1 Class 4±± | | | 8.29 | | | | 2-15-2025 | | | | 128,630 | | | | 142,787 | |
| | | | |
Vendee Mortgage Trust Series1995-2C Class 3A | | | 8.79 | | | | 6-15-2025 | | | | 169,841 | | | | 192,772 | |
| | | | |
Vendee Mortgage Trust Series2011-1 Class DA | | | 3.75 | | | | 2-15-2035 | | | | 1,006,769 | | | | 1,019,895 | |
| | | | |
Verus Securitization Trust Series2019-2 Class A1 144A±± | | | 3.21 | | | | 4-25-2059 | | | | 3,244,323 | | | | 3,272,383 | |
| |
TotalNon-Agency Mortgage-Backed Securities (Cost $32,412,980) | | | | 33,105,088 | |
| | | | | |
|
| U.S. Treasury Securities: 9.54% | |
| | | | |
TIPS | | | 1.38 | | | | 2-15-2044 | | | | 3,017,057 | | | | 3,740,243 | |
| | | | |
U.S. Treasury Bond ## | | | 1.63 | | | | 8-15-2029 | | | | 1,080,000 | | | | 1,092,277 | |
| | | | |
U.S. Treasury Bond ## | | | 2.50 | | | | 5-15-2046 | | | | 3,600,000 | | | | 4,002,047 | |
| | | | |
U.S. Treasury Bond ## | | | 2.88 | | | | 5-15-2049 | | | | 265,000 | | | | 319,315 | |
| | | | |
U.S. Treasury Bond ## | | | 3.38 | | | | 5-15-2044 | | | | 5,425,000 | | | | 6,955,655 | |
| | | | |
U.S. Treasury Bond ## | | | 3.63 | | | | 2-15-2044 | | | | 7,065,000 | | | | 9,400,038 | |
| | | | |
U.S. Treasury Bond ## | | | 3.75 | | | | 8-15-2041 | | | | 3,310,000 | | | | 4,424,022 | |
| | | | |
U.S. Treasury Bond ## | | | 3.75 | | | | 11-15-2043 | | | | 9,295,000 | | | | 12,580,565 | |
| | | | |
U.S. Treasury Bond ## | | | 4.25 | | | | 11-15-2040 | | | | 10,330,000 | | | | 14,688,372 | |
| |
Total U.S. Treasury Securities (Cost $48,513,011) | | | | 57,202,534 | |
| | | | | |
|
Yankee Corporate Bonds and Notes: 0.42% | |
|
Financials: 0.42% | |
|
| Banks: 0.42% | |
| | | | |
Inter-American Development Bank | | | 7.00 | | | | 6-15-2025 | | | | 2,000,000 | | | | 2,553,763 | |
| | | | | | | | | | | | | | | | |
| |
Total Yankee Corporate Bonds and Notes (Cost $2,379,584) | | | | 2,553,763 | |
| | | | | |
|
| Yankee Government Bonds: 5.48% | |
| | | | |
Hashemite Kingdom of Jordan | | | 3.00 | | | | 6-30-2025 | | | | 10,636,000 | | | | 11,367,997 | |
| | | | |
State of Israel | | | 5.50 | | | | 12-4-2023 | | | | 9,030,000 | | | | 10,466,033 | |
| | | | |
Ukraine | | | 1.47 | | | | 9-29-2021 | | | | 11,090,000 | | | | 11,070,838 | |
| |
Total Yankee Government Bonds (Cost $32,662,552) | | | | 32,904,868 | |
| | | | | |
The accompanying notes are an integral part of these financial statements.
18 | Wells Fargo Government Securities Fund
Portfolio of investments—August 31, 2019
| | | | | | | | | | | | | | | | |
| | | Yield | | | | | | Shares | | | Value | |
| Short-Term Investments: 3.95% | |
|
| Investment Companies: 3.58% | |
| | | | |
Wells Fargo Government Money Market Fund Select Class (l)(u)## | | | 2.04 | % | | | | | | | 21,461,781 | | | $ | 21,461,781 | |
| | | | | | | | | | | | | | | | |
| | | | |
| | | | | | | | | | | | | | | | |
| | | | | | Maturity
date | | | Principal | | | | |
| U.S. Treasury Securities: 0.37% | |
| | | | |
U.S. Treasury Bill (z)# | | | 1.66 | | | | 9-12-2019 | | | $ | 2,225,000 | | | | 2,223,964 | |
| | | | | | | | | | | | | | | | |
| |
Total Short-Term Investments (Cost $23,685,554) | | | | 23,685,745 | |
| | | | | | | | | | | | | | | | |
| | | | | | | | |
| Total investments in securities (Cost $596,475,079) | | | 104.57 | % | | | 627,205,563 | |
| | |
Other assets and liabilities, net | | | (4.57 | ) | | | (27,414,414 | ) |
| | | | | | | | |
| Total net assets | | | 100.00 | % | | $ | 599,791,149 | |
| | | | | | | | |
| 144A | The security may be resold in transactions exempt from registration, normally to qualified institutional buyers, pursuant to Rule 144A under the Securities Act of 1933. |
| ± | Variable rate investment. The rate shown is the rate in effect at period end. |
| ±± | The coupon of the security is adjusted based on the principal and interest payments received from the underlying pool of mortgages as well as the credit quality and the actual prepayment speed of the underlying mortgages. |
| (c) | Investment in an interest-only security entitles holders to receive only the interest payments on the underlying mortgages. The principal amount shown is the notional amount of the underlying mortgages. The rate represents the coupon rate. |
| ¤ | The security is issued in zero coupon form with no periodic interest payments. |
| %% | The security is purchased on a when-issued basis. |
| ## | All or a portion of this security is segregated for when-issued securities. |
| (l) | The issuer of the security is an affiliated person of the Fund as defined in the Investment Company Act of 1940. |
| (u) | The rate represents the7-day annualized yield at period end. |
| (z) | Zero coupon security. The rate represents the current yield to maturity. |
| # | All or a portion of this security is segregated as collateral for investments in derivative instruments. |
Abbreviations:
| FDIC | Federal Deposit Insurance Corporation |
| FHLB | Federal Home Loan Bank |
| FHLMC | Federal Home Loan Mortgage Corporation |
| FNMA | Federal National Mortgage Association |
| GNMA | Government National Mortgage Association |
| LIBOR | London Interbank Offered Rate |
| STRIPS | Separate trading of registered interest and principal securities |
| TIPS | Treasury inflation-protected securities |
| TVA | Tennessee Valley Authority |
Futures Contracts
| | | | | | | | | | | | | | | | | | | | | | | | |
| Description | | Number of
contracts | | | Expiration
date | | | Notional
cost | | | Notional
value | | | Unrealized
gains | | | Unrealized
losses | |
Long | | | | | | | | | | | | | | | | | | | | | | | | |
2-Year U.S. Treasury Notes | | | 257 | | | | 12-31-2019 | | | $ | 55,484,301 | | | $ | 55,542,117 | | | $ | 57,816 | | | $ | 0 | |
5-Year U.S. Treasury Notes | | | 477 | | | | 12-31-2019 | | | | 57,037,372 | | | | 57,228,821 | | | | 191,449 | | | | 0 | |
10-Year U.S. Treasury Notes | | | 139 | | | | 12-19-2019 | | | | 18,231,658 | | | | 18,308,906 | | | | 77,248 | | | | 0 | |
Short | | | | | | | | | | | | | | | | | | | | | | | | |
U.S. Long Term Bonds | | | (138 | ) | | | 12-19-2019 | | | | (22,996,946 | ) | | | (22,804,500 | ) | | | 192,446 | | | | 0 | |
U.S. Ultra Bond | | | (25 | ) | | | 12-19-2019 | | | | (4,997,387 | ) | | | (4,935,938 | ) | | | 61,449 | | | | 0 | |
10-Year Ultra Futures | | | (49 | ) | | | 12-19-2019 | | | | (7,109,506 | ) | | | (7,077,438 | ) | | | 32,068 | | | | 0 | |
| | | | | | | | | | | | | | | | | | | | | | | | |
| | | | | | | | | | | | | | | | | | $ | 612,476 | | | $ | 0 | |
| | | | | | | | | | | | | | | | | | | | | | | | |
The accompanying notes are an integral part of these financial statements.
Wells Fargo Government Securities Fund | 19
Portfolio of investments—August 31, 2019
Investments in Affiliates
An affiliated investment is an investment in which the Fund owns at least 5% of the outstanding voting shares of the issuer or as a result of other relationships, such as the Fund and the issuer having the same investment manager. Transactions with issuers that were either affiliated persons of the Fund at the beginning of the period or the end of the period were as follows:
| | | | | | | | | | | | | | | | | | | | | | | | | | | | | | | | | | | | |
| | | Shares,
beginning
of period | | | Shares
purchased | | | Shares
sold | | | Shares,
end of
period | | | Net
realized
gains
(losses) | | | Net change in
unrealized
gains
(losses) | | | Income
from
affiliated
securities | | | Value,
end
of period | | | % of
net
assets | |
Short-Term Investments | | | | | | | | | | | | | | | | | | | | | | | | | | | | | | | | | | | | |
Investment Companies | | | | | | | | | | | | | | | | | | | | | | | | | | | | | | | | | | | | |
Wells Fargo Government Money Market Fund Select Class | | | 18,303,812 | | | | 237,145,103 | | | | 233,987,134 | | | | 21,461,781 | | | $ | 0 | | | $ | 0 | | | $ | 473,864 | | | $ | 21,461,781 | | | | 3.58 | % |
The accompanying notes are an integral part of these financial statements.
20 | Wells Fargo Government Securities Fund
Statement of assets and liabilities—August 31, 2019
| | | | |
| | | | |
| |
Assets | | | | |
Investments in unaffiliated securities, at value (cost $575,013,298) | | $ | 605,743,782 | |
Investments in affiliated securities, at value (cost $21,461,781) | | | 21,461,781 | |
Receivable for interest | | | 2,604,652 | |
Receivable for investments sold | | | 2,539,981 | |
Receivable for Fund shares sold | | | 548,415 | |
Principal paydown receivable | | | 238,889 | |
Receivable for daily variation margin on open futures contracts | | | 78,543 | |
Prepaid expenses and other assets | | | 48,009 | |
| | | | |
Total assets | | | 633,264,052 | |
| | | | |
| |
Liabilities | | | | |
Payable for investments purchased | | | 28,148,112 | |
Payable for Fund shares redeemed | | | 3,236,803 | |
Due to custodian bank | | | 1,375,401 | |
Distributions payable | | | 185,836 | |
Management fee payable | | | 181,503 | |
Administration fees payable | | | 65,469 | |
Distribution fee payable | | | 7,387 | |
Trustees’ fees and expenses payable | | | 4,105 | |
Accrued expenses and other liabilities | | | 268,287 | |
| | | | |
Total liabilities | | | 33,472,903 | |
| | | | |
Total net assets | | $ | 599,791,149 | |
| | | | |
| |
Net assets consist of | | | | |
Paid-in capital | | $ | 602,622,329 | |
Total distributable loss | | | (2,831,180 | ) |
| | | | |
Total net assets | | $ | 599,791,149 | |
| | | | |
| |
Computation of net asset value and offering price per share | | | | |
Net assets – Class A | | $ | 271,986,111 | |
Shares outstanding – Class A1 | | | 24,047,862 | |
Net asset value per share – Class A | | | $11.31 | |
Maximum offering price per share – Class A2 | | | $11.84 | |
Net assets – Class C | | $ | 11,025,632 | |
Shares outstanding – Class C1 | | | 974,988 | |
Net asset value per share – Class C | | | $11.31 | |
Net assets – Administrator Class | | $ | 106,354,983 | |
Shares outstanding – Administrator Class1 | | | 9,407,329 | |
Net asset value per share – Administrator Class | | | $11.31 | |
Net assets – Institutional Class | | $ | 210,424,423 | |
Shares outstanding – Institutional Class1 | | | 18,611,890 | |
Net asset value per share – Institutional Class | | | $11.31 | |
| 1 | The Fund has an unlimited number of authorized shares. |
| 2 | Maximum offering price is computed as 100/95.50 of net asset value. On investments of $50,000 or more, the offering price is reduced. |
The accompanying notes are an integral part of these financial statements.
Wells Fargo Government Securities Fund | 21
Statement of operations—year ended August 31, 2019
| | | | |
| | | | |
| |
Investment income | | | | |
Interest | | $ | 19,052,950 | |
Income from affiliated securities | | | 473,864 | |
| | | | |
Total investment income | | | 19,526,814 | |
| | | | |
| |
Expenses | | | | |
Management fee | | | 2,851,553 | |
Administration fees | |
Class A | | | 440,859 | |
Class C | | | 20,128 | |
Administrator Class | | | 89,711 | |
Institutional Class | | | 211,036 | |
Shareholder servicing fees | |
Class A | | | 688,842 | |
Class C | | | 31,450 | |
Administrator Class | | | 223,491 | |
Distribution fee | |
Class C | | | 94,349 | |
Custody and accounting fees | | | 76,043 | |
Professional fees | | | 80,775 | |
Registration fees | | | 64,821 | |
Shareholder report expenses | | | 114,685 | |
Trustees’ fees and expenses | | | 21,592 | |
Other fees and expenses | | | 17,221 | |
| | | | |
Total expenses | | | 5,026,556 | |
Less: Fee waivers and/or expense reimbursements | | | | |
Fund-level | | | (402,618 | ) |
Class A | | | (1,598 | ) |
Administrator Class | | | (134,456 | ) |
Institutional Class | | | (104,524 | ) |
| | | | |
Net expenses | | | 4,383,360 | |
| | | | |
Net investment income | | | 15,143,454 | |
| | | | |
| |
Realized and unrealized gains (losses) on investments | | | | |
Net realized gains (losses) on | |
Unaffiliated securities | | | 1,322,922 | |
Futures contracts | | | (3,247,993 | ) |
| | | | |
Net realized losses on investments | | | (1,925,071 | ) |
| | | | |
|
Net change in unrealized gains (losses) on | |
Unaffiliated securities | | | 38,437,441 | |
Futures contracts | | | 689,468 | |
| | | | |
Net change in unrealized gains (losses) on investments | | | 39,126,909 | |
| | | | |
Net realized and unrealized gains (losses) on investments | | | 37,201,838 | |
| | | | |
Net increase in net assets resulting from operations | | $ | 52,345,292 | |
| | | | |
The accompanying notes are an integral part of these financial statements.
22 | Wells Fargo Government Securities Fund
Statement of changes in net assets
| | | | | | | | | | | | | | | | |
| | | Year ended
August 31, 2019 | | | Year ended
August 31, 2018¹ | |
| | | |
Operations | | | | | | | | | | | | |
Net investment income | | | | | | $ | 15,143,454 | | | | | | | $ | 16,455,144 | |
Net realized losses on investments | | | | | | | (1,925,071 | ) | | | | | | | (5,443,980 | ) |
Net change in unrealized gains (losses) on investments | | | | | | | 39,126,909 | | | | | | | | (23,108,606 | ) |
| | | | |
Net increase (decrease) in net assets resulting from operations | | | | | | | 52,345,292 | | | | | | | | (12,097,442 | ) |
| | | | |
| | | | |
Distributions to shareholders from net investment income and net realized gains | | | | | | | | | | | | | | | | |
Class A | | | | | | | (6,313,196 | ) | | | | | | | (6,375,215 | ) |
Class C | | | | | | | (195,136 | ) | | | | | | | (199,378 | ) |
Administrator Class | | | | | | | (2,239,507 | ) | | | | | | | (4,147,365 | ) |
Institutional Class | | | | | | | (7,084,150 | ) | | | | | | | (5,781,887 | ) |
| | | | |
Total distributions to shareholders | | | | | | | (15,831,989 | ) | | | | | | | (16,503,845 | ) |
| | | | |
| | | | |
Capital share transactions | | | Shares | | | | | | | | Shares | | | | | |
Proceeds from shares sold | | | | | | | | | | | | | | | | |
Class A | | | 2,998,141 | | | | 32,247,697 | | | | 3,569,871 | | | | 38,348,367 | |
Class C | | | 130,403 | | | | 1,399,972 | | | | 63,470 | | | | 684,459 | |
Administrator Class | | | 3,748,099 | | | | 40,844,711 | | | | 6,511,960 | | | | 70,326,132 | |
Institutional Class | | | 10,629,768 | | | | 114,197,617 | | | | 19,558,475 | | | | 209,166,296 | |
| | | | |
| | | | | | | 188,689,997 | | | | | | | | 318,525,254 | |
| | | | |
Reinvestment of distributions | | | | | | | | | | | | | | | | |
Class A | | | 514,113 | | | | 5,557,375 | | | | 525,663 | | | | 5,649,695 | |
Class C | | | 6,968 | | | | 75,010 | | | | 7,721 | | | | 82,914 | |
Administrator Class | | | 202,767 | | | | 2,194,061 | | | | 380,074 | | | | 4,081,678 | |
Institutional Class | | | 527,779 | | | | 5,677,579 | | | | 438,702 | | | | 4,717,547 | |
| | | | |
| | | | | | | 13,504,025 | | | | | | | | 14,531,834 | |
| | | | |
Payment for shares redeemed | | | | | | | | | | | | | | | | |
Class A | | | (6,931,745 | ) | | | (74,634,484 | ) | | | (12,470,498 | ) | | | (133,691,683 | ) |
Class C | | | (618,596 | ) | | | (6,623,742 | ) | | | (443,637 | ) | | | (4,768,963 | ) |
Administrator Class | | | (3,152,863 | ) | | | (33,929,729 | ) | | | (16,318,494 | ) | | | (174,401,645 | ) |
Institutional Class | | | (21,756,178 | ) | | | (234,422,675 | ) | | | (28,678,375 | ) | | | (311,030,462 | ) |
| | | | |
| | | | | | | (349,610,630 | ) | | | | | | | (623,892,753 | ) |
| | | | |
Net decrease in net assets resulting from capital share transactions | | | | | | | (147,416,608 | ) | | | | | | | (290,835,665 | ) |
| | | | |
Total decrease in net assets | | | | | | | (110,903,305 | ) | | | | | | | (319,436,952 | ) |
| | | | |
| | |
Net assets | | | | | | | | |
Beginning of period | | | | | | | 710,694,454 | | | | | | | | 1,030,131,406 | |
| | | | |
End of period | | | | | | $ | 599,791,149 | | | | | | | $ | 710,694,454 | |
| | | | |
| 1 | Effective for all filings after November 4, 2018, the SEC prospectively eliminated the requirement to parenthetically disclose undistributed net investment income at the end of the period and permitted the aggregation of distributions, with the exception of tax basis returns of capital. Overdistributed net investment income at August 31, 2018 was $12,956,930. The disaggregated distributions information for the year ended August 31, 2018 is included in Note 8,Distributions to Shareholders,in the notes to the financial statements. |
The accompanying notes are an integral part of these financial statements.
Wells Fargo Government Securities Fund | 23
Financial highlights
(For a share outstanding throughout each period)
| | | | | | | | | | | | | | | | | | | | |
| | | Year ended August 31 | |
| CLASS A | | 2019 | | | 2018 | | | 2017 | | | 2016 | | | 2015 | |
Net asset value, beginning of period | | | $10.65 | | | | $11.01 | | | | $11.51 | | | | $11.22 | | | | $11.11 | |
Net investment income | | | 0.23 | | | | 0.19 | | | | 0.15 | | | | 0.11 | 1 | | | 0.07 | 1 |
Net realized and unrealized gains (losses) on investments | | | 0.68 | | | | (0.35 | ) | | | (0.22 | ) | | | 0.34 | | | | 0.13 | |
| | | | | | | | | | | | | | | | | | | | |
Total from investment operations | | | 0.91 | | | | (0.16 | ) | | | (0.07 | ) | | | 0.45 | | | | 0.20 | |
Distributions to shareholders from | | | | | | | | | | | | | | | | | | | | |
Net investment income | | | (0.25 | ) | | | (0.20 | ) | | | (0.16 | ) | | | (0.10 | ) | | | (0.09 | ) |
Net realized gains | | | 0.00 | | | | 0.00 | | | | (0.27 | ) | | | (0.06 | ) | | | 0.00 | |
| | | | | | | | | | | | | | | | | | | | |
Total distributions to shareholders | | | (0.25 | ) | | | (0.20 | ) | | | (0.43 | ) | | | (0.16 | ) | | | (0.09 | ) |
Net asset value, end of period | | | $11.31 | | | | $10.65 | | | | $11.01 | | | | $11.51 | | | | $11.22 | |
Total return2 | | | 8.65 | % | | | (1.44 | )% | | | (0.52 | )% | | | 4.03 | % | | | 1.84 | % |
Ratios to average net assets (annualized) | | | | | | | | | | | | | | | | | | | | |
Gross expenses | | | 0.91 | % | | | 0.90 | % | | | 0.88 | % | | | 0.87 | % | | | 0.87 | % |
Net expenses | | | 0.85 | % | | | 0.85 | % | | | 0.85 | % | | | 0.85 | % | | | 0.85 | % |
Net investment income | | | 2.20 | % | | | 1.86 | % | | | 1.38 | % | | | 0.94 | % | | | 0.59 | % |
Supplemental data | | | | | | | | | | | | | | | | | | | | |
Portfolio turnover rate | | | 178 | % | | | 197 | % | | | 299 | % | | | 397 | % | | | 349 | % |
Net assets, end of period (000s omitted) | | | $271,986 | | | | $292,550 | | | | $394,645 | | | | $483,112 | | | | $232,545 | |
| 1 | Calculated based upon average shares outstanding |
| 2 | Total return calculations do not include any sales charges. |
The accompanying notes are an integral part of these financial statements.
24 | Wells Fargo Government Securities Fund
Financial highlights
(For a share outstanding throughout each period)
| | | | | | | | | | | | | | | | | | | | |
| | | Year ended August 31 | |
| CLASS C | | 2019 | | | 2018 | | | 2017 | | | 2016 | | | 2015 | |
Net asset value, beginning of period | | | $10.65 | | | | $11.01 | | | | $11.51 | | | | $11.21 | | | | $11.11 | |
Net investment income (loss) | | | 0.15 | 1 | | | 0.12 | 1 | | | 0.07 | 1 | | | 0.02 | 1 | | | (0.01 | )1 |
Net realized and unrealized gains (losses) on investments | | | 0.68 | | | | (0.36 | ) | | | (0.23 | ) | | | 0.36 | | | | 0.12 | |
| | | | | | | | | | | | | | | | | | | | |
Total from investment operations | | | 0.83 | | | | (0.24 | ) | | | (0.16 | ) | | | 0.38 | | | | 0.11 | |
Distributions to shareholders from | | | | | | | | | | | | | | | | | | | | |
Net investment income | | | (0.17 | ) | | | (0.12 | ) | | | (0.07 | ) | | | (0.02 | ) | | | (0.01 | ) |
Net realized gains | | | 0.00 | | | | 0.00 | | | | (0.27 | ) | | | (0.06 | ) | | | 0.00 | |
| | | | | | | | | | | | | | | | | | | | |
Total distributions to shareholders | | | (0.17 | ) | | | (0.12 | ) | | | (0.34 | ) | | | (0.08 | ) | | | (0.01 | ) |
Net asset value, end of period | | | $11.31 | | | | $10.65 | | | | $11.01 | | | | $11.51 | | | | $11.21 | |
Total return2 | | | 7.84 | % | | | (2.18 | )% | | | (1.26 | )% | | | 3.25 | % | | | 1.08 | % |
Ratios to average net assets (annualized) | | | | | | | | | | | | | | | | | | | | |
Gross expenses | | | 1.66 | % | | | 1.65 | % | | | 1.61 | % | | | 1.62 | % | | | 1.62 | % |
Net expenses | | | 1.60 | % | | | 1.60 | % | | | 1.60 | % | | | 1.60 | % | | | 1.60 | % |
Net investment income (loss) | | | 1.44 | % | | | 1.12 | % | | | 0.63 | % | | | 0.16 | % | | | (0.13 | )% |
Supplemental data | | | | | | | | | | | | | | | | | | | | |
Portfolio turnover rate | | | 178 | % | | | 197 | % | | | 299 | % | | | 397 | % | | | 349 | % |
Net assets, end of period (000s omitted) | | | $11,026 | | | | $15,508 | | | | $20,132 | | | | $27,085 | | | | $26,981 | |
| 1 | Calculated based upon average shares outstanding |
| 2 | Total return calculations do not include any sales charges. |
The accompanying notes are an integral part of these financial statements.
Wells Fargo Government Securities Fund | 25
Financial highlights
(For a share outstanding throughout each period)
| | | | | | | | | | | | | | | | | | | | |
| | | Year ended August 31 | |
| ADMINISTRATOR CLASS | | 2019 | | | 2018 | | | 2017 | | | 2016 | | | 2015 | |
Net asset value, beginning of period | | | $10.65 | | | | $11.01 | | | | $11.51 | | | | $11.21 | | | | $11.11 | |
Net investment income | | | 0.26 | 1 | | | 0.22 | 1 | | | 0.18 | 1 | | | 0.13 | | | | 0.10 | |
Net realized and unrealized gains (losses) on investments | | | 0.67 | | | | (0.35 | ) | | | (0.23 | ) | | | 0.36 | | | | 0.12 | |
| | | | | | | | | | | | | | | | | | | | |
Total from investment operations | | | 0.93 | | | | (0.13 | ) | | | (0.05 | ) | | | 0.49 | | | | 0.22 | |
Distributions to shareholders from | | | | | | | | | | | | | | | | | | | | |
Net investment income | | | (0.27 | ) | | | (0.23 | ) | | | (0.18 | ) | | | (0.13 | ) | | | (0.12 | ) |
Net realized gains | | | 0.00 | | | | 0.00 | | | | (0.27 | ) | | | (0.06 | ) | | | 0.00 | |
| | | | | | | | | | | | | | | | | | | | |
Total distributions to shareholders | | | (0.27 | ) | | | (0.23 | ) | | | (0.45 | ) | | | (0.19 | ) | | | (0.12 | ) |
Net asset value, end of period | | | $11.31 | | | | $10.65 | | | | $11.01 | | | | $11.51 | | | | $11.21 | |
Total return | | | 8.88 | % | | | (1.23 | )% | | | (0.31 | )% | | | 4.34 | % | | | 1.97 | % |
Ratios to average net assets (annualized) | | | | | | | | | | | | | | | | | | | | |
Gross expenses | | | 0.85 | % | | | 0.84 | % | | | 0.82 | % | | | 0.81 | % | | | 0.80 | % |
Net expenses | | | 0.64 | % | | | 0.64 | % | | | 0.64 | % | | | 0.64 | % | | | 0.64 | % |
Net investment income | | | 2.42 | % | | | 2.07 | % | | | 1.60 | % | | | 1.13 | % | | | 0.82 | % |
Supplemental data | | | | | | | | | | | | | | | | | | | | |
Portfolio turnover rate | | | 178 | % | | | 197 | % | | | 299 | % | | | 397 | % | | | 349 | % |
Net assets, end of period (000s omitted) | | | $106,355 | | | | $91,671 | | | | $198,520 | | | | $229,169 | | | | $216,428 | |
| 1 | Calculated based upon average shares outstanding |
The accompanying notes are an integral part of these financial statements.
26 | Wells Fargo Government Securities Fund
Financial highlights
(For a share outstanding throughout each period)
| | | | | | | | | | | | | | | | | | | | |
| | | Year ended August 31 | |
| INSTITUTIONAL CLASS | | 2019 | | | 2018 | | | 2017 | | | 2016 | | | 2015 | |
Net asset value, beginning of period | | | $10.65 | | | | $11.00 | | | | $11.50 | | | | $11.21 | | | | $11.10 | |
Net investment income | | | 0.27 | 1 | | | 0.24 | 1 | | | 0.19 | 1 | | | 0.15 | | | | 0.11 | 1 |
Net realized and unrealized gains (losses) on investments | | | 0.68 | | | | (0.35 | ) | | | (0.22 | ) | | | 0.35 | | | | 0.14 | |
| | | | | | | | | | | | | | | | | | | | |
Total from investment operations | | | 0.95 | | | | (0.11 | ) | | | (0.03 | ) | | | 0.50 | | | | 0.25 | |
Distributions to shareholders from | | | | | | | | | | | | | | | | | | | | |
Net investment income | | | (0.29 | ) | | | (0.24 | ) | | | (0.20 | ) | | | (0.15 | ) | | | (0.14 | ) |
Net realized gains | | | 0.00 | | | | 0.00 | | | | (0.27 | ) | | | (0.06 | ) | | | 0.00 | |
| | | | | | | | | | | | | | | | | | | | |
Total distributions to shareholders | | | (0.29 | ) | | | (0.24 | ) | | | (0.47 | ) | | | (0.21 | ) | | | (0.14 | ) |
Net asset value, end of period | | | $11.31 | | | | $10.65 | | | | $11.00 | | | | $11.50 | | | | $11.21 | |
Total return | | | 9.05 | % | | | (0.99 | )% | | | (0.15 | )% | | | 4.42 | % | | | 2.22 | % |
Ratios to average net assets (annualized) | | | | | | | | | | | | | | | | | | | | |
Gross expenses | | | 0.58 | % | | | 0.57 | % | | | 0.55 | % | | | 0.54 | % | | | 0.54 | % |
Net expenses | | | 0.48 | % | | | 0.48 | % | | | 0.48 | % | | | 0.48 | % | | | 0.48 | % |
Net investment income | | | 2.56 | % | | | 2.22 | % | | | 1.75 | % | | | 1.28 | % | | | 0.99 | % |
Supplemental data | | | | | | | | | | | | | | | | | | | | |
Portfolio turnover rate | | | 178 | % | | | 197 | % | | | 299 | % | | | 397 | % | | | 349 | % |
Net assets, end of period (000s omitted) | | | $210,424 | | | | $310,966 | | | | $416,834 | | | | $487,113 | | | | $468,859 | |
| 1 | Calculated based upon average shares outstanding |
The accompanying notes are an integral part of these financial statements.
Wells Fargo Government Securities Fund | 27
Notes to financial statements
1. ORGANIZATION
Wells Fargo Funds Trust (the “Trust”), a Delaware statutory trust organized on March 10, 1999, is anopen-end management investment company registered under the Investment Company Act of 1940, as amended (the “1940 Act”). As an investment company, the Trust follows the accounting and reporting guidance in Financial Accounting Standards Board (“FASB”)Accounting Standards Codification Topic 946, Financial Services – Investment Companies. These financial statements report on the Wells Fargo Government Securities Fund (the “Fund”) which is a diversified series of the Trust.
2. SIGNIFICANT ACCOUNTING POLICIES
The following significant accounting policies, which are consistently followed in the preparation of the financial statements of the Fund, are in conformity with U.S. generally accepted accounting principles which require management to make estimates and assumptions that affect the reported amounts of assets and liabilities, disclosure of contingent assets and liabilities at the date of the financial statements, and the reported amounts of revenues and expenses during the reporting period. Actual results could differ from those estimates.
Securities valuation
All investments are valued each business day as of the close of regular trading on the New York Stock Exchange (generally 4 p.m. Eastern Time), although the Fund may deviate from this calculation time under unusual or unexpected circumstances.
Debt securities are valued at the evaluated bid price provided by an independent pricing service (e.g. taking into account various factors, including yields, maturities, or credit ratings) or, if a reliable price is not available, the quoted bid price from an independent broker-dealer.
Futures contracts that are listed on a foreign or domestic exchange or market are valued at the official closing price or, if none, the last sales price.
Investments in registeredopen-end investment companies are valued at net asset value.
Investments which are not valued using any of the methods discussed above are valued at their fair value, as determined in good faith by the Board of Trustees of the Fund. The Board of Trustees has established a Valuation Committee comprised of the Trustees and has delegated to it the authority to take any actions regarding the valuation of portfolio securities that the Valuation Committee deems necessary or appropriate, including determining the fair value of portfolio securities, unless the determination has been delegated to the Wells Fargo Asset Management Pricing Committee at Wells Fargo Funds Management, LLC (“Funds Management”). The Board of Trustees retains the authority to make or ratify any valuation decisions or approve any changes to the Valuation Procedures as it deems appropriate. On a quarterly basis, the Board of Trustees receives reports on any valuation actions taken by the Valuation Committee or the Wells Fargo Asset Management Pricing Committee which may include items for ratification.
When-issued transactions
The Fund may purchase securities on a forward commitment or when-issued basis. The Fund records a when-issued transaction on the trade date and will segregate assets in an amount at least equal in value to the Fund’s commitment to purchasewhen-issued securities. Securities purchased on a when-issued basis aremarked-to-market daily and the Fund begins earning interest on the settlement date. Losses may arise due to changes in the market value of the underlying securities or if the counterparty does not perform under the contract.
Futures contracts
Futures contracts are agreements between the Fund and a counterparty to buy or sell a specific amount of a commodity, financial instrument or currency at a specified price and on a specified date. The Fund may buy and sell futures contracts in order to gain exposure to, or protect against, changes in interest rates. The primary risks associated with the use of futures contracts are the imperfect correlation between changes in market values of securities held by the Fund and the prices of futures contracts, and the possibility of an illiquid market. Futures contracts are generally entered into on a regulated futures exchange and cleared through a clearinghouse associated with the exchange. With futures contracts, there is minimal counterparty risk to the Fund since futures contracts are exchange traded and the exchange’s clearinghouse, as the counterparty to all exchange traded futures, guarantees the futures contracts against default.
Upon entering into a futures contracts, the Fund is required to deposit either cash or securities (initial margin) with the broker in an amount equal to a certain percentage of the contract value. Subsequent payments (variation margin) are paid to or from the broker each day equal to the daily changes in the contract value. Such payments are recorded as unrealized gains or losses and, if any, shown as variation margin receivable (payable) in the Statement of Assets and Liabilities. Should the Fund fail to make requested variation margin payments, the broker can gain access to the initial margin to satisfy the Fund’s payment obligations. When the contracts are closed, a realized gain or loss is recorded in the Statement of Operations.
28 | Wells Fargo Government Securities Fund
Notes to financial statements
Security transactions and income recognition
Securities transactions are recorded on a trade date basis. Realized gains or losses are recorded on the basis of identified cost.
Interest income is accrued daily and bond discounts are accreted and premiums are amortized daily. To the extent debt obligations are placed onnon-accrual status, any related interest income may be reduced by writing off interest receivables when the collection of all or a portion of interest has been determined to be doubtful based on consistently applied procedures and the fair value has decreased. If the issuer subsequently resumes interest payments or when the collectability of interest is reasonably assured, the debt obligation is removed fromnon-accrual status.
Distributions to shareholders
Distributions to shareholders from net investment income are declared daily and paid monthly. Distributions from net realized gains, if any, are recorded on theex-dividend date and paid at least annually. Such distributions are determined in accordance with income tax regulations and may differ from U.S. generally accepted accounting principles. Dividend sources are estimated at the time of declaration. The tax character of distributions is determined as of the Fund’s fiscal year end. Therefore, a portion of the Fund’s distributions made prior to the Fund’s fiscal year end may be categorized as a tax return of capital at year end.
Federal and other taxes
The Fund intends to continue to qualify as a regulated investment company by distributing substantially all of its investment company taxable income and any net realized capital gains (after reduction for capital loss carryforwards) sufficient to relieve it from all, or substantially all, federal income taxes. Accordingly, no provision for federal income taxes was required.
The Fund’s income and federal excise tax returns and all financial records supporting those returns for the prior three fiscal years are subject to examination by the federal and Delaware revenue authorities. Management has analyzed the Fund’s tax positions taken on federal, state, and foreign tax returns for all open tax years and does not believe that there are any uncertain tax positions that require recognition of a tax liability.
As of August 31, 2019, the aggregate cost of all investments for federal income tax purposes was $610,841,707 and the unrealized gains (losses) consisted of:
| | | | |
| |
Gross unrealized gains | | $ | 18,312,098 | |
| |
Gross unrealized losses | | | (1,335,766 | ) |
| |
Net unrealized gains | | $ | 16,976,332 | |
As of August 31, 2019, the Fund had capital loss carryforwards which consist of $14,573,374 in short-term capital losses and $5,297,260 in long-term capital losses.
Class allocations
The separate classes of shares offered by the Fund differ principally in applicable sales charges, distribution, shareholder servicing, and administration fees. Class specific expenses are charged directly to that share class. Investment income, common fund-level expenses, and realized and unrealized gains (losses) on investments are allocated daily to each class of shares based on the relative proportion of net assets of each class.
3. FAIR VALUATION MEASUREMENTS
Fair value measurements of investments are determined within a framework that has established a fair value hierarchy based upon the various data inputs utilized in determining the value of the Fund’s investments. The three-level hierarchy gives the highest priority to unadjusted quoted prices in active markets for identical assets or liabilities (Level 1) and the lowest priority to unobservable inputs (Level 3). The Fund’s investments are classified within the fair value hierarchy based on the lowest level of input that is significant to the fair value measurement. The inputs are summarized into three broad levels as follows:
| ∎ | | Level 1 – quoted prices in active markets for identical securities |
| ∎ | | Level 2 – other significant observable inputs (including quoted prices for similar securities, interest rates, prepayment speeds, credit risk, etc.) |
| ∎ | | Level 3 – significant unobservable inputs (including the Fund’s own assumptions in determining the fair value of investments) |
The inputs or methodologies used for valuing investments in securities are not necessarily an indication of the risk associated with investing in those securities.
Wells Fargo Government Securities Fund | 29
Notes to financial statements
The following is a summary of the inputs used in valuing the Fund’s assets and liabilities as of August 31, 2019:
| | | | | | | | | | | | | | | | |
| | | | |
| | | Quoted prices
(Level 1) | | | Other significant
observable inputs
(Level 2) | | | Significant
unobservable inputs (Level 3) | | | Total | |
| | | | |
Assets | | | | | | | | | | | | | | | | |
Investments in: | | | | | | | | | | | | | | | | |
| | | | |
Agency securities | | $ | 0 | | | $ | 457,991,426 | | | $ | 0 | | | $ | 457,991,426 | |
| | | | |
Asset-backed securities | | | 0 | | | | 5,875,125 | | | | 0 | | | | 5,875,125 | |
| | | | |
Corporate bonds and notes | | | 0 | | | | 4,356,856 | | | | 0 | | | | 4,356,856 | |
| | | | |
Municipal obligations | | | 0 | | | | 9,530,158 | | | | 0 | | | | 9,530,158 | |
| | | | |
Non-agency mortgage-backed securities | | | 0 | | | | 33,105,088 | | | | 0 | | | | 33,105,088 | |
| | | | |
U.S. Treasury securities | | | 57,202,534 | | | | 0 | | | | 0 | | | | 57,202,534 | |
| | | | |
Yankee corporate bonds and notes | | | 0 | | | | 2,553,763 | | | | 0 | | | | 2,553,763 | |
| | | | |
Yankee government bonds | | | 0 | | | | 32,904,868 | | | | 0 | | | | 32,904,868 | |
| | | | |
Short-term investments | | | | | | | | | | | | | | | | |
| | | | |
Investment companies | | | 21,461,781 | | | | 0 | | | | 0 | | | | 21,461,781 | |
| | | | |
U.S. Treasury securities | | | 2,223,964 | | | | 0 | | | | 0 | | | | 2,223,964 | |
| | | | |
| | | 80,888,279 | | | | 546,317,284 | | | | 0 | | | | 627,205,563 | |
| | | | |
Futures contracts | | | 612,476 | | | | 0 | | | | 0 | | | | 612,476 | |
| | | | |
Total assets | | $ | 81,500,755 | | | $ | 546,317,284 | | | $ | 0 | | | $ | 627,818,039 | |
Additional sector, industry or geographic detail is included in the Portfolio of Investments.
Futures contracts are reported at their cumulative unrealized gains (losses) at measurement date as reported in the table following the Portfolio of Investments. For futures contracts, the current day’s variation margin is reported on the Statement of Assets and Liabilities. All other assets and liabilities are reported at their market value at measurement date.
For year ended August 31, 2019, the Fund did not have any transfers into/out of Level 3.
4. TRANSACTIONS WITH AFFILIATES
Management fee
Funds Management, an indirect wholly owned subsidiary of Wells Fargo & Company (“Wells Fargo”), is the manager of the Fund and provides advisory and fund-level administrative services under an investment management agreement. Under the investment management agreement, Funds Management is responsible for, among other services, implementing the investment objectives and strategies of the Fund, supervising the subadviser and providing fund-level administrative services in connection with the Fund’s operations. As compensation for its services under the investment management agreement, Funds Management is entitled to receive a management fee at the following annual rate based on the Fund’s average daily net assets:
| | | | |
| |
| Average daily net assets | | Management fee | |
| |
First $500 million | | | 0.450 | % |
| |
Next $500 million | | | 0.425 | |
| |
Next $2 billion | | | 0.400 | |
| |
Next $2 billion | | | 0.375 | |
| |
Next $5 billion | | | 0.340 | |
| |
Over $10 billion | | | 0.320 | |
For the year ended August 31, 2019, the management fee was equivalent to an annual rate of 0.44% of the Fund’s average daily net assets.
30 | Wells Fargo Government Securities Fund
Notes to financial statements
Funds Management has retained the services of a subadviser to provide daily portfolio management to the Fund. The fee for subadvisory services is borne by Funds Management. Wells Capital Management Incorporated (“WellsCap”), an affiliate of Funds Management and an indirect wholly owned subsidiary of Wells Fargo, is the subadviser to the Fund and is entitled to receive a fee from Funds Management at an annual rate starting at 0.20% and declining to 0.10% as the average daily net assets of the Fund increase.
Administration fees
Under a class-level administration agreement, Funds Management provides class-level administrative services to the Fund, which includes paying fees and expenses for services provided by the transfer agent,sub-transfer agents, omnibus account servicers and record-keepers. As compensation for its services under the class-level administration agreement, Funds Management receives an annual fee which is calculated based on the average daily net assets of each class as follows:
| | | | |
| |
| | | Class-level
administration fee | |
| |
Class A, Class C | | | 0.16 | % |
| |
Administrator Class | | | 0.10 | |
| |
Institutional Class | | | 0.08 | |
Waivers and/or expense reimbursements
Funds Management has contractually waived and/or reimbursed management and administration fees to the extent necessary to maintain certain net operating expense ratios for the Fund. When each class of the Fund has exceeded its expense cap, Funds Management has waived fees and/or reimbursed expenses from fund-level expenses on a proportionate basis and then from class specific expenses. When only certain classes exceed their expense caps, waivers and/or reimbursements are applied against class specific expenses before fund-level expenses. Funds Management has committed through December 31, 2019 to waive fees and/or reimburse expenses to the extent necessary to cap the Fund’s expenses at 0.85% for Class A shares, 1.60% for Class C shares, 0.64% for Administrator Class shares, and 0.48% for Institutional Class shares. Prior to or after the commitment expiration date, the cap may be increased or the commitment to maintain the cap may be terminated only with the approval of the Board of Trustees.
Distribution fee
The Trust has adopted a distribution plan for Class C shares of the Fund pursuant to Rule12b-1 under the 1940 Act. A distribution fee is charged to Class C shares and paid to Wells Fargo Funds Distributor, LLC (“Funds Distributor”), the principal underwriter, at an annual rate of 0.75% of the average daily net assets of Class C shares.
In addition, Funds Distributor is entitled to receive thefront-end sales charge from the purchase of Class A shares and a contingent deferred sales charge on the redemption of certain Class A shares. Funds Distributor is also entitled to receive the contingent deferred sales charges from redemptions of Class C shares. For the year ended August 31, 2019, Funds Distributor received $3,269 from the sale of Class A shares and $181 in contingent deferred sales charges from redemptions of Class C shares, respectively. No contingent deferred sales charges were incurred by Class A for the year ended August 31, 2019.
Shareholder servicing fees
The Trust has entered into contracts with one or more shareholder servicing agents, whereby Class A, Class C, and Administrator Class of the Fund are charged a fee at an annual rate of 0.25% of the average daily net assets of each respective class. A portion of these total shareholder servicing fees were paid to affiliates of Wells Fargo.
Interfund transactions
The Fund may purchase or sell portfolio investment securities to certain other Wells Fargo affiliates pursuant to Rule17a-7 under the 1940 Act and under procedures adopted by the Board of Trustees. The procedures have been designed to ensure that these interfund transactions, which do not incur broker commissions, are effected at current market prices.
5. INVESTMENT PORTFOLIO TRANSACTIONS
Purchases and sales of investments, excluding short-term securities, for the year ended August 31, 2019 were as follows:
| | | | | | |
Purchases at cost | | Sales proceeds |
U.S.
government | | Non-U.S.
government | | U.S.
government | | Non-U.S.
government |
| $1,206,754,091 | | $37,666,256 | | $1,284,540,702 | | $103,025,530 |
Wells Fargo Government Securities Fund | 31
Notes to financial statements
6. DERIVATIVE TRANSACTIONS
During the year ended August 31, 2019, the Fund entered into futures contracts to manage duration and yield curve exposures. The Fund had an average notional amount of $43,547,365 in long futures contracts and $45,593,937 in short futures contracts during the year ended August 31, 2019.
The fair value, realized gains or losses and change in unrealized gains or losses, if any, on derivative instruments are reflected in the corresponding financial statement captions.
7. BANK BORROWINGS
The Trust (excluding the money market funds), Wells Fargo Master Trust and Wells Fargo Variable Trust are parties to a $280,000,000 revolving credit agreement whereby the Fund is permitted to use bank borrowings for temporary or emergency purposes, such as to fund shareholder redemption requests. Interest under the credit agreement is charged to the Fund based on a borrowing rate equal to the higher of the Federal Funds rate in effect on that day plus 1.25% or the overnight LIBOR rate in effect on that day plus 1.25%. In addition, an annual commitment fee equal to 0.25% of the unused balance is allocated to each participating fund.
For the year ended August 31, 2019, there were no borrowings by the Fund under the agreement.
8. DISTRIBUTIONS TO SHAREHOLDERS
The tax character of distributions paid was $15,831,989 and $16,503,845 of ordinary income for the years ended August 31, 2019 and August 31, 2018, respectively.
As of August 31, 2019, the components of distributable earnings on a tax basis were as follows:
| | | | |
Undistributed ordinary
income | | Unrealized gains | | Capital loss carryforward |
| | |
| $271,874 | | $16,976,332 | | $(19,870,634) |
Effective for all filings after November 4, 2018, the Securities and Exchange Commission eliminated the requirement to separately state the components of distributions to shareholders under U.S. generally accepted accounting principles. The amounts of distributions to shareholders for the year ended August 31, 2018 were as follows:
| | | | |
| |
| | | Net investment
income | |
| |
Class A | | | $6,375,215 | |
| |
Class C | | | 199,378 | |
| |
Administrator Class | | | 4,147,365 | |
| |
Institutional Class | | | 5,781,887 | |
9. INDEMNIFICATION
Under the Trust’s organizational documents, the officers and Trustees have been granted certain indemnification rights against certain liabilities that may arise out of performance of their duties to the Trust. Additionally, in the normal course of business, the Trust may enter into contracts with service providers that contain a variety of indemnification clauses. The Trust’s maximum exposure under these arrangements is dependent on future claims that may be made against the Fund and, therefore, cannot be estimated.
10. NEW ACCOUNTING PRONOUNCEMENTS
In August 2018, FASB issued Accounting Standards Update (“ASU”)No. 2018-13, Fair Value Measurement (Topic 820)Disclosure Framework—Changes to the Disclosure Requirements for Fair Value Measurement.ASU2018-13 updates the disclosure requirements for fair value measurements by modifying or removing certain disclosures and adding certain new disclosures. The amendments are effective for fiscal years, and interim periods within those fiscal years, beginning after December 15, 2019. Early adoption is permitted. Management has adopted the removal and modification of disclosures early, as permitted, and will adopt the additional new disclosures at the effective date.
32 | Wells Fargo Government Securities Fund
Notes to financial statements
In March 2017, FASB issued ASUNo. 2017-08,Premium Amortization on Purchased Callable Debt Securities. ASU2017-08 shortens the amortization period for certain callable debt securities held at a premium and requires the premium to be amortized to the earliest call date. The amendments do not require an accounting change for securities held at a discount and discounts will continue to be accreted to the maturity date of the security. ASU2017-08 is effective for fiscal years beginning after December 15, 2018 and for interim periods within those fiscal years. During the current reporting period, management of the Fund adopted the change in accounting policy which did not have a material impact to the Fund’s financial statements.
Wells Fargo Government Securities Fund | 33
Report of independent registered public accounting firm
TO THE SHAREHOLDERS OF THE FUND AND BOARD OF TRUSTEES OF WELLS FARGO FUNDS TRUST:
Opinion on the Financial Statements
We have audited the accompanying statement of assets and liabilities of Wells Fargo Government Securities Fund (the Fund), one of the funds constituting Wells Fargo Funds Trust, including the portfolio of investments, as of August 31, 2019, the related statement of operations for the year then ended, the statements of changes in net assets for each of the years in the two-year period then ended, and the related notes (collectively, the financial statements) and the financial highlights for each of the years in the five-year period then ended. In our opinion, the financial statements and financial highlights present fairly, in all material respects, the financial position of the Fund as of August 31, 2019, the results of its operations for the year then ended, the changes in its net assets for each of the years in the two-year period then ended, and the financial highlights for each of the years in the five-year period then ended, in conformity with U.S. generally accepted accounting principles.
Basis for Opinion
These financial statements and financial highlights are the responsibility of the Fund’s management. Our responsibility is to express an opinion on these financial statements and financial highlights based on our audits. We are a public accounting firm registered with the Public Company Accounting Oversight Board (United States) (PCAOB) and are required to be independent with respect to the Fund in accordance with the U.S. federal securities laws and the applicable rules and regulations of the Securities and Exchange Commission and the PCAOB.
We conducted our audits in accordance with the standards of the PCAOB. Those standards require that we plan and perform the audit to obtain reasonable assurance about whether the financial statements and financial highlights are free of material misstatement, whether due to error or fraud. Our audits included performing procedures to assess the risks of material misstatement of the financial statements and financial highlights, whether due to error or fraud, and performing procedures that respond to those risks. Such procedures included examining, on a test basis, evidence regarding the amounts and disclosures in the financial statements and financial highlights. Such procedures also included confirmation of securities owned as of August 31, 2019, by correspondence with the custodian, transfer agent and brokers, or by other appropriate auditing procedures. Our audits also included evaluating the accounting principles used and significant estimates made by management, as well as evaluating the overall presentation of the financial statements and financial highlights. We believe that our audits provide a reasonable basis for our opinion.

We have not been able to determine the specific year that we began serving as the auditor of one or more Wells Fargo Funds investment companies; however we are aware that we have served as the auditor of one or more Wells Fargo Funds investment companies since at least 1955.
Boston, Massachusetts
October 28, 2019
34 | Wells Fargo Government Securities Fund
Other information (unaudited)
TAX INFORMATION
For the fiscal year ended August 31, 2019, $15,022,046 has been designated as interest-related dividends for nonresident alien shareholders pursuant to Section 871 of the Internal Revenue Code.
For the fiscal year ended August 31, 2019, 9.95% of the ordinary income distributed was derived from interest on U.S. government securities.
PROXY VOTING INFORMATION
A description of the policies and procedures used to determine how to vote proxies relating to portfolio securities is available, upon request, by calling1-800-222-8222, visiting our website atwfam.com, or visiting the SEC website at sec.gov. Information regarding how the proxies related to portfolio securities were voted during the most recent12-month period ended June 30 is available on the website atwfam.comor by visiting the SEC website at sec.gov.
QUARTERLY PORTFOLIO HOLDINGS INFORMATION
The Fund files its complete schedule of portfolio holdings with the SEC for the first and third quarters of each fiscal year on Form N-Q or FormN-PORT, which is available by visiting the SEC website at sec.gov. Those forms may be reviewed and copied at the SEC’s Public Reference Room in Washington, DC. Information on the operation of the Public Reference Room may be obtained by calling1-800-SEC-0330.
Wells Fargo Government Securities Fund | 35
Other information (unaudited)
BOARD OF TRUSTEES AND OFFICERS
Each of the Trustees and Officers1 listed in the table below acts in identical capacities for each fund in the Wells Fargo family of funds, which consists of 152 mutual funds comprising the Wells Fargo Funds Trust, Wells Fargo Variable Trust, Wells Fargo Master Trust and fourclosed-end funds (collectively the “Fund Complex”). This table should be read in conjunction with the Prospectus and the Statement of Additional Information2. The mailing address of each Trustee and Officer is 525 Market Street, 12th Floor, San Francisco, CA 94105. Each Trustee and Officer serves an indefinite term, however, each Trustee serves such term until reaching the mandatory retirement age established by the Trustees.
Independent Trustees
| | | | | | |
Name and year of birth | | Position held and length of service* | | Principal occupations during past five years or longer | | Current other public company or investment
company directorships |
| | | |
William R. Ebsworth (Born 1957) | | Trustee, since 2015 | | Retired. From 1984 to 2013, equities analyst, portfolio manager, research director and chief investment officer at Fidelity Management and Research Company in Boston, Tokyo, and Hong Kong, and retired in 2013 as Chief Investment Officer of Fidelity Strategic Advisers, Inc. where he led a team of investment professionals managing client assets. Prior thereto, Board member of Hong Kong Securities Clearing Co., Hong Kong Options Clearing Corp., the Thailand International Fund, Ltd., Fidelity Investments Life Insurance Company, and Empire Fidelity Investments Life Insurance Company. Audit Committee Chair and Investment Committee Chair of the Vincent Memorial Hospital Endowment(non-profit organization). Mr. Ebsworth is a CFA® charterholder. | | N/A |
| | | |
Jane A. Freeman (Born 1953) | | Trustee, since 2015; Chair Liaison, since 2018 | | Retired. From 2012 to 2014 and 1999 to 2008, Chief Financial Officer of Scientific Learning Corporation. From 2008 to 2012, Ms. Freeman provided consulting services related to strategic business projects. Prior to 1999, Portfolio Manager at Rockefeller & Co. and Scudder, Stevens & Clark. Board member of the Harding Loevner Funds from 1996 to 2014, serving as both Lead Independent Director and chair of the Audit Committee. Board member of the Russell Exchange Traded Funds Trust from 2011 to 2012 and the chair of the Audit Committee. Ms. Freeman is a Board Member of The Ruth Bancroft Garden(non-profit organization). She is also an inactive Chartered Financial Analyst. | | N/A |
| | | |
Isaiah Harris, Jr. (Born 1952) | | Trustee, since 2009; Audit Committee Chairman, since 2019 | | Retired. Chairman of the Board of CIGNA Corporation since 2009, and Director since 2005. From 2003 to 2011, Director of Deluxe Corporation. Prior thereto, President and CEO of BellSouth Advertising and Publishing Corp. from 2005 to 2007, President and CEO of BellSouth Enterprises from 2004 to 2005 and President of BellSouth Consumer Services from 2000 to 2003. Emeritus member of the Iowa State University Foundation Board of Governors. Emeritus Member of the Advisory Board of Iowa State University School of Business. Advisory Board Member, Palm Harbor Academy (private school). Advisory Board Member, Child Evangelism Fellowship(non-profit). Mr. Harris is a certified public accountant (inactive status). | | CIGNA Corporation |
| | | |
Judith M. Johnson (Born 1949) | | Trustee, since 2008; Audit Committee Chairman, from 2009 to 2018 | | Retired. Prior thereto, Chief Executive Officer and Chief Investment Officer of Minneapolis Employees Retirement Fund from 1996 to 2008. Ms. Johnson is an attorney, certified public accountant and a certified managerial accountant. | | N/A |
36 | Wells Fargo Government Securities Fund
Other information (unaudited)
| | | | | | |
Name and year of birth | | Position held and length of service* | | Principal occupations during past five years or longer | | Current other public company or investment
company directorships |
| | | |
David F. Larcker (Born 1950) | | Trustee, since 2009 | | James Irvin Miller Professor of Accounting at the Graduate School of Business, Stanford University, Director of the Corporate Governance Research Initiative and Senior Faculty of The Rock Center for Corporate Governance since 2006. From 2005 to 2008, Professor of Accounting at the Graduate School of Business, Stanford University. Prior thereto, Ernst & Young Professor of Accounting at The Wharton School, University of Pennsylvania from 1985 to 2005. | | N/A |
| | | |
Olivia S. Mitchell (Born 1953) | | Trustee, since 2006; Nominating and Governance Committee Chairman, since 2018 | | International Foundation of Employee Benefit Plans Professor, Wharton School of the University of Pennsylvania since 1993. Director of Wharton’s Pension Research Council and Boettner Center on Pensions & Retirement Research, and Research Associate at the National Bureau of Economic Research. Previously, Cornell University Professor from 1978 to 1993. | | N/A |
| | | |
Timothy J. Penny (Born 1951) | | Trustee, since 1996; Chairman, since 2018 | | President and Chief Executive Officer of Southern Minnesota Initiative Foundation, anon-profit organization, since 2007. Member of the Board of Trustees of NorthStar Education Finance, Inc., anon-profit organization, since 2007. | | N/A |
| | | |
James G. Polisson (Born 1959) | | Trustee, since 2018 | | Retired. Chief Marketing Officer, Source (ETF) UK Services, Ltd, from 2015 to 2017. From 2012 to 2015, Principal of The Polisson Group, LLC, a management consulting, corporate advisory and principal investing company. Chief Executive Officer and Managing Director at Russell Investments, Global Exchange Traded Funds from 2010 to 2012. Managing Director of Barclays Global Investors from 1998 to 2010 and Global Chief Marketing Officer for iShares and Barclays Global Investors from 2000 to 2010. Trustee of the San Francisco Mechanics’ Institute, anon-profit organization, from 2013 to 2015. Board member of the Russell Exchange Traded Fund Trust from 2011 to 2012. Director of Barclays Global Investors Holdings Deutschland GmbH from 2006 to 2009. Mr. Polisson is an attorney and has a retired status with the Massachusetts and District of Columbia Bar Associations. | | N/A |
| * | Length of service dates reflect the Trustee’s commencement of service with the Trust’s predecessor entities, where applicable. |
Wells Fargo Government Securities Fund | 37
Other information (unaudited)
Officers
| | | | |
Name and year of birth | | Position held and length of service | | Principal occupations during past five years or longer |
| | |
Andrew Owen (Born 1960) | | President, since 2017 | | Executive Vice President of Wells Fargo & Company and Head of Affiliated Managers, Wells Fargo Asset Management, since 2014. In addition, Mr. Owen is currently President, Chief Executive Officer and Director of Wells Fargo Funds Management, LLC since 2017. Prior thereto, Executive Vice President responsible for marketing, investments and product development for Wells Fargo Funds Management, LLC, from 2009 to 2014. |
| | |
Nancy Wiser1 (Born 1967) | | Treasurer, since 2012 | | Executive Vice President of Wells Fargo Funds Management, LLC since 2011. Chief Operating Officer and Chief Compliance Officer at LightBox Capital Management LLC, from 2008 to 2011. |
| | |
Michelle Rhee3
(Born 1966) | | Chief Legal Officer, since 2019 | | Secretary of Wells Fargo Funds Management, LLC, Chief Legal Counsel of Wells Fargo Asset Management and Assistant General Counsel of Wells Fargo Bank, N.A. since 2018. Associate General Counsel and Managing Director of Bank of America Corporation from 2004 to 2018. |
| | |
| Catherine Kennedy4 (Born 1969) | | Secretary, since 2019 | | Vice President of Wells Fargo Funds Management, LLC and Senior Counsel of the Wells Fargo Legal Department since 2010. Vice President and Senior Counsel of Evergreen Investment Management Company, LLC from 1998 to 2010. |
| | |
Michael H. Whitaker (Born 1967) | | Chief Compliance Officer, since 2016 | | Chief Compliance Officer of Wells Fargo Asset Management since 2016. Senior Vice President and Chief Compliance Officer for Fidelity Investments from 2007 to 2016. |
| | |
David Berardi (Born 1975) | | Assistant Treasurer, since 2009 | | Vice President of Wells Fargo Funds Management, LLC since 2009. Vice President of Evergreen Investment Management Company, LLC from 2008 to 2010. Manager of Fund Reporting and Control for Evergreen Investment Management Company, LLC from 2004 to 2010. |
| | |
Jeremy DePalma1 (Born 1974) | | Assistant Treasurer, since 2009 | | Senior Vice President of Wells Fargo Funds Management, LLC since 2009. Senior Vice President of Evergreen Investment Management Company, LLC from 2008 to 2010 and head of the Fund Reporting and Control Team within Fund Administration from 2005 to 2010. |
| 1 | Nancy Wiser acts as Treasurer of 65 funds in the Fund Complex. Jeremy DePalma acts as Treasurer of 87 funds and Assistant Treasurer of 65 funds in the Fund Complex. |
| 2 | The Statement of Additional Information includes additional information about the Trustees and is available, without charge, upon request, by calling1-800-222-8222 or by visiting the website atwfam.com. |
| 3 | Michelle Rhee became Chief Legal Officer effective October 22, 2019. |
| 4 | Catherine Kennedy became Secretary effective October 22, 2019. |
38 | Wells Fargo Government Securities Fund
Other information (unaudited)
BOARD CONSIDERATION OF INVESTMENT MANAGEMENT ANDSUB-ADVISORY AGREEMENTS:
Wells Fargo Government Securities Fund
Under the Investment Company Act of 1940 (the “1940 Act”), the Board of Trustees (the “Board”) of Wells Fargo Funds Trust (the “Trust”) must determine annually whether to approve the continuation of the Trust’s investment management andsub-advisory agreements. In this regard, at anin-person meeting held on May21-22, 2019 (the “Meeting”), the Board, all the members of which have no direct or indirect interest in the investment management andsub-advisory agreements and are not “interested persons” of the Trust, as defined in the 1940 Act (the “Independent Trustees”), reviewed and approved for Wells Fargo Government Securities Fund(the “Fund”): (i) an investment management agreement (the “Management Agreement”) with Wells Fargo Funds Management, LLC (“Funds Management”); and (ii) an investmentsub-advisory agreement (the“Sub-Advisory Agreement”) with Wells Capital Management Incorporated (the“Sub-Adviser”), an affiliate of Funds Management. The Management Agreement and theSub-Advisory Agreement are collectively referred to as the “Advisory Agreements.”
At the Meeting, the Board considered the factors and reached the conclusions described below relating to the selection of Funds Management and theSub-Adviser and the approval of the Advisory Agreements. Prior to the Meeting, including at anin-person meeting in April 2019, the Trustees conferred extensively among themselves and with representatives of Funds Management about these matters. Also, the Board has adopted a team-based approach, with each team consisting of asub-set of Trustees, to assist the full Board in the discharge of its duties in reviewing investment performance and other matters throughout the year. The Independent Trustees were assisted in their evaluation of the Advisory Agreements by independent legal counsel, from whom they received separate legal advice and with whom they met separately.
In providing information to the Board, Funds Management and theSub-Adviser were guided by a detailed set of requests for information submitted to them by independent legal counsel on behalf of the Independent Trustees at the start of the Board’s annual contract renewal process earlier in 2019. In considering and approving the Advisory Agreements, the Trustees considered the information they believed relevant, including but not limited to the information discussed below. The Board considered not only the specific information presented in connection with the Meeting, but also the knowledge gained over time through interaction with Funds Management and theSub-Adviser about various topics. In this regard, the Board reviewed reports of Funds Management at each of its quarterly meetings, which included, among other things, portfolio reviews and investment performance reports. In addition, the Board and the teams mentioned above confer with portfolio managers at various times throughout the year. The Board did not identify any particular information or consideration that wasall-important or controlling, and each individual Trustee may have attributed different weights to various factors.
After its deliberations, the Board unanimously approved the continuation of the Advisory Agreements for aone-year term and determined that the compensation payable to Funds Management and theSub-Adviser under each of the Advisory Agreements was reasonable. The Board considered the approval of the Advisory Agreements for the Fund as part of its consideration of agreements for funds across the complex, but its approvals were made on afund-by-fund basis. The following summarizes a number of important, but not necessarily all, factors considered by the Board in support of its approvals.
Nature, extent and quality of services
The Board received and considered various information regarding the nature, extent and quality of services provided to the Fund by Funds Management and theSub-Adviser under the Advisory Agreements. This information included a description of the investment advisory services and Fund-level administrative services covered by the Management Agreement, as well as, among other things, a summary of the background and experience of senior management of Wells Fargo Asset Management (“WFAM”), of which Funds Management and theSub-Adviser are a part, a summary of investments made in the business of WFAM, a summary of certain organizational and personnel changes involving Funds Management and theSub-Adviser, and a description of Funds Management’s and theSub-Adviser’s business continuity planning programs and of their approaches to data privacy and cybersecurity. The Board received and reviewed information about Funds Management’s role as administrator of the Fund’s liquidity risk management program. The Board also considered the qualifications, background, tenure and responsibilities of each of the portfolio managers primarily responsible for theday-to-day portfolio management of the Fund.
The Board evaluated the ability of Funds Management and theSub-Adviser to attract and retain qualified investment professionals, including research, advisory and supervisory personnel. The Board further considered the compliance programs and compliance records of Funds Management and theSub-Adviser. In addition, the Board took into account the full range of services provided to the Fund by Funds Management and its affiliates.
Wells Fargo Government Securities Fund | 39
Other information (unaudited)
Fund investment performance and expenses
The Board considered the investment performance results for the Fund over various time periods ended December 31, 2018. The Board considered these results in comparison to the investment performance of funds in a universe that was determined by Broadridge Inc. (“Broadridge”) to be similar to the Fund (the “Universe”), and in comparison to the Fund’s benchmark index and to other comparative data. Broadridge is an independent provider of investment company data. The Board received a description of the methodology used by Broadridge to select the mutual funds in the performance Universe. The Board noted that the investment performance of the Fund (Administrator Class) was higher than the average investment performance of the Universe for all periods under review. The Board also noted that the investment performance of the Fund was in range of its benchmark index, the Bloomberg Barclays U.S. Aggregate ex Credit Index, for the three- andten-year periods under review, but lower than its benchmark for theone- and five-year periods under review.
The Board received information concerning, and discussed factors contributing to, the underperformance of the Fund relative to the benchmark for the periods identified above. The Board took note of the explanations for the relative underperformance during these periods, including with respect to market factors that affected the Fund’s investment performance. The Board also took note of the Fund’s outperformance relative to the Universe over all the periods under review.
The Board also received and considered information regarding the Fund’s net operating expense ratios and their various components, including actual management fees, custodian and othernon-management fees, and Rule12b-1 andnon-Rule12b-1 shareholder service fees. The Board considered these ratios in comparison to the median ratios of funds in class-specific expense groups that were determined by Broadridge to be similar to the Fund (the “Groups”). The Board received a description of the methodology used by Broadridge to select the mutual funds in the expense Groups and an explanation of how funds comprising expense groups and their expense ratios may vary fromyear-to-year. Based on the Broadridge reports, the Board noted that the net operating expense ratios of the Fund were lower than the median net operating expense ratios of the expense Groups for each share class.
The Board took into account the Fund’s investment performance and expense information provided to it among the factors considered in deciding tore-approve the Advisory Agreements.
Investment management andsub-advisory fee rates
The Board reviewed and considered the contractual fee rates payable by the Fund to Funds Management under the Management Agreement, as well as the contractual fee rates payable by the Fund to Funds Management for class-level administrative services under a Class-Level Administration Agreement, which include, among other things, class-level transfer agency andsub-transfer agency costs (collectively, the “Management Rates”). The Board also reviewed and considered the contractual investmentsub-advisory fee rates that are payable by Funds Management to theSub-Adviser for investmentsub-advisory services.
Among other information reviewed by the Board was a comparison of the Fund’s Management Rates with the average contractual investment management fee rates of funds in the expense Groups at a common asset level as well as transfer agency costs of the funds in the expense Groups. The Board noted that the Management Rates of the Fund were lower than or in range of the sum of these average rates for the Fund’s expense Groups for all share classes.
The Board also received and considered information about the portion of the total management fee that was retained by Funds Management after payment of the fee to theSub-Adviser forsub-advisory services. In assessing the reasonableness of this amount, the Board received and evaluated information about the nature and extent of responsibilities retained and risks assumed by Funds Management and not delegated to or assumed by theSub-Adviser, and about Funds Management’son-going oversight services. Given the affiliation between Funds Management and theSub-Adviser, the Board ascribed limited relevance to the allocation of fees between them.
The Board also received and considered information about the nature and extent of services offered and fee rates charged by Funds Management and theSub-Adviser to other types of clients with investment strategies similar to those of the Fund. In this regard, the Board received information about the significantly greater scope of services, and compliance, reporting and other legal burdens and risks of managing proprietary mutual funds compared with those associated with managing assets of other types of clients, including third-partysub-advised fund clients andnon-mutual fund clients such as institutional separate accounts.
Based on its consideration of the factors and information it deemed relevant, including those described here, the Board determined that the compensation payable to Funds Management under the Management Agreement and to theSub-Adviser under theSub-Advisory Agreement was reasonable.
40 | Wells Fargo Government Securities Fund
Other information (unaudited)
Profitability
The Board received and considered information concerning the profitability of Funds Management, as well as the profitability of both WFAM and Wells Fargo & Co. (“Wells Fargo”) from providing services to the fund family as a whole. The Board noted that theSub-Adviser’s profitability information with respect to providing services to the Fund and other funds in the family was subsumed in the WFAM and Wells Fargo profitability analysis.
Funds Management reported on the methodologies and estimates used in calculating profitability, including a description of the methodology used to allocate certain expenses. Among other things, the Board noted that the levels of profitability reported on afund-by-fund basis varied widely, depending on factors such as the size, type and age of fund. Based on its review, the Board did not deem the profits reported by Funds Management, WFAM or Wells Fargo from services provided to the Fund to be at a level that would prevent it from approving the continuation of the Advisory Agreements.
Economies of scale
The Board received and considered information about the potential for Funds Management to experience economies of scale in the provision of management services to the Fund, the difficulties of calculating economies of scale at an individual fund level, and the extent to which potential scale benefits are shared with shareholders. The Board noted the existence of breakpoints in the Fund’s management fee structure, which operate generally to reduce the Fund’s expense ratios as the Fund grows in size. The Board considered that in addition to management fee breakpoints, Funds Management shares potential economies of scale from its management business in a variety of ways, including through fee waiver and expense reimbursement arrangements, services that benefit shareholders, competitive management fee rates set at the outset without regard to breakpoints, and investments in the business intended to enhance services available to shareholders.
The Board concluded that Funds Management’s arrangements with respect to the Fund, including contractual breakpoints, constituted a reasonable approach to sharing potential economies of scale with the Fund and its shareholders.
Other benefits to Funds Management and theSub-Adviser
The Board received and considered information regarding potential“fall-out” or ancillary benefits received by Funds Management and its affiliates, including theSub-Adviser, as a result of their relationships with the Fund. Ancillary benefits could include, among others, benefits directly attributable to other relationships with the Fund and benefits potentially derived from an increase in Funds Management’s and theSub-Adviser’s business as a result of their relationships with the Fund. The Board noted that various affiliates of Funds Management may receive distribution-related fees, shareholder servicing payments andsub-transfer agency fees in respect of shares sold or held through them and services provided.
The Board also reviewed information about soft dollar credits earned and utilized by theSub-Adviser, fees earned by Funds Management and theSub-Adviser from managing a private investment vehicle for the fund family’s securities lending collateral, and commissions earned by an affiliated broker from portfolio transactions.
Based on its consideration of the factors and information it deemed relevant, including those described here, the Board did not find that any ancillary benefits received by Funds Management and its affiliates, including theSub-Adviser, were unreasonable.
Conclusion
At the Meeting, after considering the above-described factors and based on its deliberations and its evaluation of the information described above, the Board unanimously approved the continuation of the Advisory Agreements for aone-year term and determined that the compensation payable to Funds Management and theSub-Adviser under each of the Advisory Agreements was reasonable.
Wells Fargo Government Securities Fund | 41
This page is intentionally left blank.
This page is intentionally left blank.
This page is intentionally left blank.

For more information
More information about Wells Fargo Funds is available free upon request. To obtain literature, please write, visit the Fund’s website, or call:
Wells Fargo Funds
P.O. Box 219967
Kansas City, MO 64121-9967
Website:wfam.com
Individual investors:1-800-222-8222
Retail investment professionals:1-888-877-9275
Institutional investment professionals:1-866-765-0778

This report and the financial statements contained herein are submitted for the general information of the shareholders of the Fund. If this report is used for promotional purposes, distribution of the report must be accompanied or preceded by a current prospectus. Before investing, please consider the investment objectives, risks, charges, and expenses of the investment. For a current prospectus and, if available, a summary prospectus, containing this information, call1-800-222-8222 or visit the Fund’s website atwfam.com. Read the prospectus carefully before you invest or send money.
Wells Fargo Asset Management (WFAM) is the trade name for certain investment advisory/management firms owned by Wells Fargo & Company. These firms include but are not limited to Wells Capital Management Incorporated and Wells Fargo Funds Management, LLC. Certain products managed by WFAM entities are distributed by Wells Fargo Funds Distributor, LLC (a broker-dealer and Member FINRA).
This material is for general informational and educational purposes only and is NOT intended to provide investment advice or a recommendation of any kind—including a recommendation for any specific investment, strategy, or plan.
INVESTMENT PRODUCTS: NOT FDIC INSURED ◾ NO BANK GUARANTEE ◾ MAY LOSE VALUE
© 2019 Wells Fargo Funds Management, LLC. All rights reserved.
405803 10-19
A216/AR216 08-19
Annual Report
August 31, 2019
Wells Fargo Short-Term Bond Fund
Beginning on January 1, 2021, as permitted by new regulations adopted by the Securities and Exchange Commission, paper copies of the Wells Fargo Funds’ annual and semi-annual shareholder reports issued after this date will no longer be sent by mail, unless you specifically request paper copies of the reports. Instead, the reports will be made available on the Funds’ website, and you will be notified by mail each time a report is posted and provided with a website address to access the report.
If you already elected to receive shareholder reports electronically, you will not be affected by this change and you need not take any action. You may elect to receive shareholder reports and other communications from the Fund electronically at any time by contacting your financial intermediary (such as a broker-dealer or bank) or, if you are a direct investor, by calling1-800-222-8222 or by enrolling at wellsfargo.com/advantagedelivery.
You may elect to receive all future reports in paper free of charge. If you invest through a financial intermediary, you can contact your financial intermediary to request that you continue to receive paper copies of your shareholder reports; if you invest directly with the Fund, you can call 1-800-222-8222. Your election to receive reports in paper will apply to all Wells Fargo Funds held in your account with your financial intermediary or, if you are a direct investor, to all Wells Fargo Funds that you hold.
|
|
|
Reduce clutter. Save trees. |
Sign up for electronic delivery of prospectuses and shareholder reports at wellsfargo.com/ advantagedelivery |
The views expressed and any forward-looking statements are as of August 31, 2019, unless otherwise noted, and are those of the Fund managers and/or Wells Fargo Asset Management. Discussions of individual securities, or the markets generally, or any Wells Fargo Fund are not intended as individual recommendations. Future events or results may vary significantly from those expressed in any forward-looking statements. The views expressed are subject to change at any time in response to changing circumstances in the market. Wells Fargo Asset Management and the Fund disclaim any obligation to publicly update or revise any views expressed or forward-looking statements.
INVESTMENT PRODUCTS: NOT FDIC INSURED ◾ NO BANK GUARANTEE ◾ MAY LOSE VALUE
Wells Fargo Short-Term Bond Fund | 1
Letter to shareholders (unaudited)

Andrew Owen
President
Wells Fargo Funds
Dear Shareholder:
We are pleased to offer you this annual report for the Wells Fargo Short-Term Bond Fund for the12-month period that ended August 31, 2019. After the first half of the period yielded eitherlow-single-digit or negative investment returns, U.S. stock and global bond investors generally saw markets recover during the second half amid intensifying market volatility, global economic growth concerns, international trade staredowns, and simmering geopolitical tensions.
Overall, fixed-income investors enjoyed a distinct advantage over stock investors. For the period, U.S. stocks, based on the S&P 500 Index,1 gained 2.92% and international stocks, as measured by the MSCI ACWI ex USA Index (Net),2 fell 3.27%. The MSCI EM Index (Net)3 slipped 4.36%. Among fixed income investors, the Bloomberg Barclays U.S. Aggregate Bond Index4 added 10.17%, the Bloomberg Barclays Global Aggregateex-USD Index5 added 5.71%, the Bloomberg Barclays Municipal Bond Index6 gained 8.72%, and the ICE BofAML U.S. High Yield Index7 added 6.58%.
Entering the fourth quarter of 2018, economic data was encouraging.
Entering the fourth quarter of 2018, there were reasons for investors to be optimistic. The U.S. Bureau of Economic Analysis reported U.S. gross domestic product (GDP) grew 4.2% on an annualized basis during the second quarter. Hiring improved. Unemployment declined. Consumer spending gained. Third-quarter corporate earnings reports were generally positive. U.S. trade negotiations with Mexico and Canada advanced. In September 2018, the U.S. Federal Reserve (Fed) raised the federal funds rate by 25 basis points (bps; 100 bps equal 1.00%) to a target range of between 2.00% and 2.25% in an indication of its confidence that U.S. economic growth was sustainable.
International markets presented numerous challenges. U.S.-China trade tensions increased. The U.S. imposed $200 billion in tariffs on Chinese goods. China reacted with $60 billion in tariffs on U.S. goods. Economic growth in China caused concern. In September 2018, international investors began to factor in a number of disconcerting economic and business data points: lower July manufacturing and industrial orders in Germany; declining purchasing managers’ index numbers for August from the United Kingdom, China, and India; and declining household spending for August in Japan. Taken together, the data fed growing concerns that global economic growth was slowing.
| 1 | The S&P 500 Index consists of 500 stocks chosen for market size, liquidity, and industry group representation. It is a market-value-weighted index with each stock’s weight in the index proportionate to its market value. You cannot invest directly in an index. |
| 2 | The Morgan Stanley Capital International (MSCI) All Country World Index (ACWI) ex USA Index (Net) is a free-float-adjusted market-capitalization weighted index that is designed to measure the equity market performance of developed and emerging markets, excluding the U.S. Source: MSCI. MSCI makes no express or implied warranties or representations and shall have no liability whatsoever with respect to any MSCI data contained herein. The MSCI data may not be further redistributed or used as a basis for other indices or any securities or financial products. This report is not approved, reviewed, or produced by MSCI. You cannot invest directly in an index. |
| 3 | The MSCI Emerging Markets (EM) Index (Net) is a free-float-adjusted market-capitalization-weighted index that is designed to measure the equity market performance of emerging markets. You cannot invest directly in an index. |
| 4 | The Bloomberg Barclays U.S. Aggregate Bond Index is a broad-based benchmark that measures the investment-grade, U.S. dollar-denominated, fixed-rate taxable bond market, including Treasuries, government-related and corporate securities, mortgage-backed securities (agency fixed-rate and hybrid adjustable-rate mortgage pass-throughs), asset-backed securities, and commercial mortgage-backed securities. You cannot invest directly in an index. |
| 5 | The Bloomberg Barclays Global Aggregateex-USD Index is an unmanaged index that provides a broad-based measure of the global investment-grade fixed-income markets excluding the U.S. dollar-denominated debt market. You cannot invest directly in an index. |
| 6 | The Bloomberg Barclays Municipal Bond Index is an unmanaged index composed of long-termtax-exempt bonds with a minimum credit rating of Baa. You cannot invest directly in an index. |
| 7 | The ICE BofAML U.S. High Yield Index is a market-capitalization-weighted index of domestic and Yankee high-yield bonds. The index tracks the performance of high-yield securities traded in the U.S. bond market. You cannot invest directly in an index. Copyright 2019. ICE Data Indices, LLC. All rights reserved. |
2 | Wells Fargo Short-Term Bond Fund
Letter to shareholders (unaudited)
Investors had to digest unsettling events during the fourth quarter of 2018.
November’s U.S. midterm elections shifted control of the House of Representatives from Republicans to Democrats, presaging partisan clashes that followed and caused uncertainty among investors. A partial U.S. government shutdown driven by partisan policy disputes extended into January 2019. Third-quarter U.S. GDP was announced at an annualized 3.4% rate, lower than the second-quarter rate. Brexit efforts stalled. The value of the renminbi declined even as the People’s Bank of China cut reserve requirement ratios, accelerated infrastructure spending, and cut taxes in efforts to spur economic activity.
The combination of news in the U.S. and generally weak economic indicators outside of the U.S. caused investors to seek safe havens. December’s S&P 500 Index performance was the worst since 1931. Globally, fixed-income investments fared better than stocks during the last two months of the year. The Fed increased the federal funds rate by 25 bps in December 2018 to a target range of between 2.25% and 2.50% even as observers expressed concerns that higher rates could slow the economy.
The market climbs a wall of worry.
Investment returns appeared to reaffirm the adage that markets climb a wall of worry as 2019 opened. Following its December decline, the S&P 500 Index gained 8.01% for the month of January, the best monthly performance in 30 years. Returns for the MSCI ACWI ex USA Index (Net), the Bloomberg Barclays U.S. Aggregate Bond Index, and the Bloomberg Barclays Global Aggregateex-USD Index also were positive.
In February 2019, signs of slowing global growth grew more ominous. The Bureau of Economic Analysis announced fourth-quarter 2018 GDP grew at an annualized 2.2% rate, down from the levels of the prior two quarters. In a February report, the Bank of England forecast the slowest growth for 2019 since the financial crisis. China and the U.S. continued to wrangle over trade issues. By the end of the first quarter of 2019, more accommodative Fed sentiment and steady, if not spectacular, U.S. economic and business metrics encouraged domestic investors.
Early second-quarter 2019 enthusiasm among investors faded.
During April 2019, favorable sentiment found additional support in reports of sustained low inflation, solid employment data, and first-quarter U.S. GDP of an annualized rate of 3.2%. During May, markets tumbled on mixed investment signals. In the U.S., partisan wrangling ramped up as Democrats and Republicans set their sights on 2020 presidential politics. The U.K.’s Brexit contretemps caused Prime Minister Theresa May to resign. Boris Johnson succeeded her only to exacerbate uncertainty about Brexit’s resolution ahead of an October 2019 deadline. The European Commission downgraded the 2019 growth forecast to 1.2%. The U.S. increased tariffs on products from China, China responded, and then talks broke down. President Donald Trump threatened to turn his foreign policy tariff tool to Mexico over immigration issues.
During the third quarter of 2019, investors regrouped. Just as the investment horizon appeared to darken, sentiment turned and U.S. equity markets gained during June and July. The gains, primarily driven by geopolitical and monetary policy events, pushed equity markets to new highs. European Central Bank President Mario Draghi said that if the outlook doesn’t improve, the bank would cut rates or buy more assets to prop up inflation. President Trump backed off of tariff threats against Mexico and China. In the U.S., the Fed implemented a 0.25% federal funds rate cut in July.
Later in July, the U.S. reversed course and threatened to impose higher tariffs on China’s exports after talks failed. China responded with tariff threats of its own and
“December’s S&P 500 Index performance was the worst since 1931.”
“Following its December decline, the S&P 500 Index gained 8.01% for the month of January, the best monthly performance in 30 years.”
Wells Fargo Short-Term Bond Fund | 3
Letter to shareholders (unaudited)
|
|
|
For further information about your Fund, contact your investment professional, visit our website at wfam.com, or call us directly at1-800-222-8222. |
devalued the renminbi, a move that roiled global markets. Major U.S. stock market indices closed July 2019 with the worst weekly results of the year. Bond prices gained as Treasury yields fell to levels not seen since November 2016 and the yield curve inverted at multiple points along the30-year arc.
In a microcosm, August 2019 encapsulated many of the unnerving events that plagued investors during the prior 11 months. The U.S.-China trade relationship swung from discouraging to hopeful and back again with no evident compromise on the horizon. Evidence of a continued global economic slowdown continued to mount as central banks in China, New Zealand, and Thailand cut interest rates. Industrial and manufacturing data declined in China, Canada, Japan, and Germany. Adding to the uncertain environment, Italy’s prime minister resigned, many feared a crackdown in Hong Kong as protesters sustained their calls for reform throughout the month, and Boris Johnson planned to suspend Parliament as Brexit’s deadline neared.
Don’t let short-term uncertainty derail long-term investment goals.
Periods of investment uncertainty can present challenges, but experience has taught us that maintaining long-term investment goals can be an effective way to plan for the future. To help you create a sound strategy based on your personal goals and risk tolerance, Wells Fargo Funds offers more than 100 mutual funds spanning a wide range of asset classes and investment styles. Although diversification cannot guarantee an investment profit or prevent losses, we believe it can be an effective way to manage investment risk and potentially smooth out overall portfolio performance. We encourage investors to know their investments and to understand that appropriate levels of risk-taking may unlock opportunities.
Thank you for choosing to invest with Wells Fargo Funds. We appreciate your confidence in us and remain committed to helping you meet your financial needs.
Sincerely,

Andrew Owen
President
Wells Fargo Funds
4 | Wells Fargo Short-Term Bond Fund
This page is intentionally left blank.
Performance highlights (unaudited)
Investment objective
The Fund seeks current income consistent with capital preservation.
Manager
Wells Fargo Funds Management, LLC
Subadviser
Wells Capital Management Incorporated
Portfolio managers
Christopher Y. Kauffman, CFA®‡
Jay N. Mueller, CFA®‡
Michael J. Schueller, CFA®‡*
Noah M. Wise, CFA®‡
Average annual total returns (%) as of August 31, 2019
| | | | | | | | | | | | | | | | | | | | | | | | | | | | | | | | | | |
| | | | |
| | | | | Including sales charge | | | Excluding sales charge | | | Expense ratios1 (%) | |
| | | | | | | | | |
| | | Inception date | | 1 year | | | 5 year | | | 10 year | | | 1 year | | | 5 year | | | 10 year | | | Gross | | | Net2 | |
| | | | | | | | | | |
| Class A (SSTVX) | | 8-31-1999 | | | 2.51 | | | | 1.30 | | | | 1.97 | | | | 4.60 | | | | 1.71 | | | | 2.18 | | | | 0.83 | | | | 0.73 | |
| | | | | | | | | | |
| Class C (WFSHX) | | 3-31-2008 | | | 2.82 | | | | 0.95 | | | | 1.42 | | | | 3.82 | | | | 0.95 | | | | 1.42 | | | | 1.58 | | | | 1.48 | |
| | | | | | | | | | |
| Class R6 (SSTYX)3 | | 7-31-2018 | | | – | | | | – | | | | – | | | | 4.69 | | | | 1.93 | | | | 2.47 | | | | 0.45 | | | | 0.41 | |
| | | | | | | | | | |
| Institutional Class (SSHIX) | | 8-31-1999 | | | – | | | | – | | | | – | | | | 4.88 | | | | 1.95 | | | | 2.47 | | | | 0.50 | | | | 0.46 | |
| | | | | | | | | | |
| Bloomberg Barclays U.S.1-3 Year Government/Credit Bond Index4 | | – | | | – | | | | – | | | | – | | | | 4.62 | | | | 1.58 | | | | 1.57 | | | | – | | | | – | |
Figures quoted represent past performance, which is no guarantee of future results, and do not reflect taxes that a shareholder may pay on fund distributions or the redemption of fund shares. Investment return and principal value of an investment will fluctuate so that an investor’s shares, when redeemed, may be worth more or less than their original cost. Performance shown without sales charges would be lower if sales charges were reflected. Current performance may be lower or higher than the performance data quoted, which assumes the reinvestment of dividends and capital gains. Currentmonth-end performance is available on the Fund’s website,wfam.com.
Index returns do not include transaction costs associated with buying and selling securities, any mutual fund fees or expenses, or any taxes. It is not possible to invest directly in an index.
For Class A shares, the maximumfront-end sales charge is 2.00%. For Class C shares, the maximum contingent deferred sales charge is 1.00%. Performance including a contingent deferred sales charge assumes the sales charge for the corresponding time period. Class R6 and Institutional Class shares are sold without afront-end sales charge or contingent deferred sales charge.
Bond values fluctuate in response to the financial condition of individual issuers, general market and economic conditions, and changes in interest rates. Changes in market conditions and government policies may lead to periods of heightened volatility in the bond market and reduced liquidity for certain bonds held by the Fund. In general, when interest rates rise, bond values fall and investors may lose principal value. Interest-rate changes and their impact on the Fund and its share price can be sudden and unpredictable. Loans are subject to risks similar to those associated with other below-investment-grade bond investments, such as credit risk (for example, risk of issuer default), below investment- grade bond risk (for example, risk of greater volatility in value), and risk that the loan may become illiquid or difficult to price. The use of derivatives may reduce returns and/or increase volatility. Certain investment strategies tend to increase the total risk of an investment (relative to the broader market). Foreign investments are especially volatile and can rise or fall dramatically due to differences in the political and economic conditions of the host country. These risks are generally intensified in emerging markets. The Fund is exposed to high-yield securities risk and mortgage- and asset-backed securities risk. Consult the Fund’s prospectus for additional information on these and other risks.
Please see footnotes on page 7.
6 | Wells Fargo Short-Term Bond Fund
Performance highlights (unaudited)
|
|
| Growth of $10,000 investment as of August 31, 20195 |
|
|
| ‡ | CFA®and Chartered Financial Analyst® are trademarks owned by CFA Institute. |
| * | Mr. Schueller became a portfolio manager of the Fund on June 6, 2019. |
| 1 | Reflects the expense ratios as stated in the most recent prospectuses, which include the impact of 0.01% in acquired fund fees and expenses. The expense ratios shown are subject to change and may differ from the annualized expense ratios shown in the financial highlights of this report, which do not include acquired fund fees and expenses. |
| 2 | The manager has contractually committed through December 31, 2019, to waive fees and/or reimburse expenses to the extent necessary to cap the expenses of each class after fee waivers at 0.72% for Class A, 1.47% for Class C, 0.40% for Class R6, and 0.45% for Institutional Class. Brokerage commissions, stamp duty fees, interest, taxes, acquired fund fees and expenses (if any), and extraordinary expenses are excluded from the expense cap. Prior to or after the commitment expiration date, the cap may be increased or the commitment to maintain the cap may be terminated only with the approval of the Board of Trustees. Without this cap, the Fund’s returns would have been lower. The expense ratio paid by an investor is the net expense ratio (the total annual fund operating expenses after fee waivers) as stated in the prospectuses. |
| 3 | Historical performance shown for Class R6 shares prior to their inception reflects the performance of Institutional Class shares and includes the higher expenses applicable to Institutional Class shares. If these expenses had not been included, returns for Class R6 shares would be higher. |
| 4 | The Bloomberg Barclays U.S.1-3 Year Government/Credit Bond Index is theone- to three-year component of the Bloomberg Barclays U.S. Government/Credit Bond Index that includes securities in the Government and Credit Indexes. The Government Index includes Treasuries (that is, public obligations of the U.S. Treasury that have remaining maturities of more than one year) and agencies (that is, publicly issued debt of U.S. government agencies, quasi-federal corporations, and corporate or foreign debt guaranteed by the U.S. government). The Credit Index includes publicly issued U.S. corporate and foreign debentures and secured notes that meet specified maturity, liquidity, and quality requirements. You cannot invest directly in an index. |
| 5 | The chart compares the performance of Class A shares for the most recent ten years with the performance of the Bloomberg Barclays U.S.1-3 Year Government/Credit Bond Index. The chart assumes a hypothetical investment of $10,000 in Class A shares and reflects all operating expenses and assumes the maximum initial sales charge of 2.00%. |
| 6 | The ten largest holdings, excluding cash, cash equivalents and any money market funds, are calculated based on the value of the investments divided by total net assets of the Fund. Holdings are subject to change and may have changed since the date specified. |
| 7 | The Personal Consumption Expenditures Index is the primary measure of consumer spending on goods and services in the U.S. economy. It accounts for abouttwo-thirds of domestic final spending and is part of the personal income report issued by the Bureau of Economic Analysis of the Department of Commerce. You cannot invest directly in an index. |
| 8 | Amounts are calculated based on the total long-term investments of the Fund. These amounts are subject to change and may have changed since the date specified. |
Wells Fargo Short-Term Bond Fund | 7
Performance highlights (unaudited)
MANAGER’S DISCUSSION
Fund highlights
| ∎ | | The Fund (Class A shares, excluding sales charges) underperformed its benchmark, the Bloomberg Barclays 1–3 year U.S. Government/Credit Bond Index, for the12-month period that ended August 31, 2019. |
| ∎ | | Cash reserves were a modest detractor. |
| ∎ | | Overweights to corporate debt and structured products, both of which generated superior yield returns compared with similar-duration Treasuries, generated positive results for the Fund. |
| | | | |
|
| Ten largest holdings(%) as of August 31, 20196 | |
| | |
Jackson National Life Global Company,2.50%, 6-27-2022 | | | 1.16 | |
| | |
Morgan Stanley, 2.75%,5-19-2022 | | | 0.94 | |
| | |
Honda Auto Receivables Owner Trust Series2016-4 Class A4, 1.36%,1-18-2023 | | | 0.79 | |
| | |
GS Mortgage Securities Trust Series2010-C1 Class A2, 4.59%,8-10-2043 | | | 0.75 | |
| | |
Comcast Corporation, 3.45%,10-1-2021 | | | 0.71 | |
| | |
GS Mortgage Securities Trust Series 2014-GC22 Class A3, 3.52%,6-10-2047 | | | 0.71 | |
| | |
HSBC Bank USA NA, 4.88%,8-24-2020 | | | 0.71 | |
| | |
General Motors Financial Company,3.45%, 4-10-2022 | | | 0.70 | |
| | |
Cooperatieve Rabobank U.A., 2.75%,1-10-2022 | | | 0.70 | |
| | |
California Republic Auto Receivables Trust Series2017-1 Class A4, 2.28%,6-15-2022 | | | 0.70 | |
An economic slowdown
The pace of gross domestic product growth decelerated over the past 12 months as business investment, inventory effects, and trade restrained overall economic activity. For the four quarters that ended June 30, 2019, the U.S. economy expanded by 2.3% in inflation-adjusted terms, compared with a 3.2% trailing12-month growth rate at the midway point in 2018. Rising anxiety over the contentious U.S.-China trade relationship appeared to discourage capital investment over the12-month period that ended August 31, 2019. Housing investment also was a modest drag despite low mortgage rates. Consumer spending held up fairly well, however, with the Personal Consumption Expenditures Index7 rising at a 2.7% year-over-year rate though the end of July.
Consumption was supported by a relatively firm labor market. While job growth slowed modestly over the period, wages grew by 3.2% in real terms and the unemployment rate remained below 4%. Measures of labor force participation also generally showed improvement.
In response to slower growth and lower-than-targeted inflation, the Federal Open Market Committee (FOMC) voted to reduce its policy rate target for overnight funds by 0.25% at its July 31 meeting. This was the first interest rate reduction engineered by the FOMC in the decade since the financial crisis. While the monetary authorities suggested that their decision should be seen as a “midcourse correction” rather than the beginning of an extended easing cycle, markets have priced multiple additional rate cuts into the term structure. Indeed, interest rates fell across the board over the past 12 months, with the intermediate-term Treasury yields dropping by about 1.35%.
|
|
| Portfolio composition as of August 31, 20198 |
|
 |
The Fund continued to favor corporate credit and securitized obligations.
The Fund continued to overweight short-term corporate bonds as well as securitized debt while underweighting U.S. Treasuries and agency debentures. The Fund’s investments in corporate debt benefited from a yield advantage versus Treasuries, while short-term credit spreads were little changed on a year-over-year basis. The Fund’s second-largest sector commitment was to securitized debt: asset-backed securities, residential mortgage-backed securities, commercial mortgage-backed securities, and collateralized loan obligations. The Fund benefited from the yield advantage accruing to these holdings.
While our emphasis in certain outperforming sectors like telecom, airlines, and real estate investment trusts added to relative performance, selection in these sectors detracted as the Fund holdings tended to underperform index holdings.
Please see footnotes on page 7.
8 | Wells Fargo Short-Term Bond Fund
Performance highlights (unaudited)
The trade war is a persistent cloud.
We expect the U.S.-China trade dispute to drag on for some months to come, depressing business investment. Slower growth, in turn, is likely to incline the monetary authorities to ease policy further, with at least one and probably more rate cuts to be implemented over the next 6 to 12 months. A quick resolution to the dispute—as unlikely as that seems at this time—could probably boost business confidence and perhaps reduce the pressure for accommodative monetary policy. In this environment, we anticipate taking a cautious approach to both duration and sector allocation decisions, with a bias towardup-in-quality trades. As always, relative-value considerations will dominate our security selection process.
Wells Fargo Short-Term Bond Fund | 9
Fund expenses (unaudited)
As a shareholder of the Fund, you incur two types of costs: (1) transaction costs, including sales charges (loads) on purchase payments and contingent deferred sales charges (if any) on redemptions and (2) ongoing costs, including management fees, distribution(12b-1) and/or shareholder servicing fees, and other Fund expenses. This example is intended to help you understand your ongoing costs (in dollars) of investing in the Fund and to compare these costs with the ongoing costs of investing in other mutual funds.
The example is based on an investment of $1,000 invested at the beginning of thesix-month period and held for the entire period from March 1, 2019 to August 31, 2019.
Actual expenses
The “Actual” line of the table below provides information about actual account values and actual expenses. You may use the information in this line, together with the amount you invested, to estimate the expenses that you paid over the period. Simply divide your account value by $1,000 (for example, an $8,600 account value divided by $1,000 = 8.6), then multiply the result by the number in the “Actual” line under the heading entitled “Expenses paid during period” for your applicable class of shares to estimate the expenses you paid on your account during this period.
Hypothetical example for comparison purposes
The “Hypothetical” line of the table below provides information about hypothetical account values and hypothetical expenses based on the Fund’s actual expense ratio and an assumed rate of return of 5% per year before expenses, which is not the Fund’s actual return. The hypothetical account values and expenses may not be used to estimate the actual ending account balance or expenses you paid for the period. You may use this information to compare the ongoing costs of investing in the Fund and other funds. To do so, compare this 5% hypothetical example with the 5% hypothetical examples that appear in the shareholder reports of the other funds.
Please note that the expenses shown in the table are meant to highlight your ongoing costs only and do not reflect any transactional costs, such as sales charges (loads) and contingent deferred sales charges. Therefore, the “Hypothetical” line of the table is useful in comparing ongoing costs only and will not help you determine the relative total costs of owning different funds. In addition, if these transactional costs were included, your costs would have been higher.
| | | | | | | | | | | | | | | | |
| | | Beginning
account value
3-1-2019 | | | Ending
account value
8-31-2019 | | | Expenses
paid during
the period¹ | | | Annualized net
expense ratio | |
| | | | | |
Class A | | | | | | | | | | | | | | | | |
| | | | |
Actual | | $ | 1,000.00 | | | $ | 1,029.53 | | | $ | 3.68 | | | | 0.72 | % |
| | | | |
Hypothetical (5% return before expenses) | | $ | 1,000.00 | | | $ | 1,021.58 | | | $ | 3.67 | | | | 0.72 | % |
| | | | | |
Class C | | | | | | | | | | | | | | | | |
| | | | |
Actual | | $ | 1,000.00 | | | $ | 1,025.67 | | | $ | 7.50 | | | | 1.47 | % |
| | | | |
Hypothetical (5% return before expenses) | | $ | 1,000.00 | | | $ | 1,017.80 | | | $ | 7.48 | | | | 1.47 | % |
| | | | | |
Class R6 | | | | | | | | | | | | | | | | |
| | | | |
Actual | | $ | 1,000.00 | | | $ | 1,030.02 | | | $ | 2.05 | | | | 0.40 | % |
| | | | |
Hypothetical (5% return before expenses) | | $ | 1,000.00 | | | $ | 1,023.19 | | | $ | 2.04 | | | | 0.40 | % |
| | | | | |
Institutional Class | | | | | | | | | | | | | | | | |
| | | | |
Actual | | $ | 1,000.00 | | | $ | 1,029.74 | | | $ | 2.30 | | | | 0.45 | % |
| | | | |
Hypothetical (5% return before expenses) | | $ | 1,000.00 | | | $ | 1,022.94 | | | $ | 2.29 | | | | 0.45 | % |
| 1 | Expenses paid is equal to the annualized net expense ratio of each class multiplied by the average account value over the period, multiplied by the number of days in the most recent fiscal half-year divided by the number of days in the fiscal year (to reflect theone-half-year period). |
10 | Wells Fargo Short-Term Bond Fund
Portfolio of investments—August 31, 2019
| | | | | | | | | | | | | | | | |
| | | Interest
rate | | | Maturity
date | | | Principal | | | Value | |
| Agency Securities: 4.46% | |
| | | | |
FDIC Series2010-R1 Class A 144A | | | 2.18 | % | | | 5-25-2050 | | | $ | 91,009 | | | $ | 90,894 | |
| | | | |
FDIC Series2013-R1 Class A 144A | | | 1.15 | | | | 3-25-2033 | | | | 267,579 | | | | 265,977 | |
| | | | |
FHLMC | | | 3.50 | | | | 10-15-2025 | | | | 403,486 | | | | 419,552 | |
| | | | |
FHLMC | | | 3.50 | | | | 6-15-2038 | | | | 158,475 | | | | 158,892 | |
| | | | |
FHLMC (3 Year Treasury Constant Maturity +2.24%)± | | | 3.63 | | | | 5-1-2026 | | | | 24,686 | | | | 24,973 | |
| | | | |
FHLMC | | | 4.00 | | | | 5-1-2025 | | | | 704,651 | | | | 735,272 | |
| | | | |
FHLMC (12 Month LIBOR +1.91%)± | | | 4.66 | | | | 9-1-2031 | | | | 2,375 | | | | 2,406 | |
| | | | |
FHLMC (1 Year Treasury Constant Maturity +2.25%)± | | | 4.76 | | | | 4-1-2032 | | | | 34,258 | | | | 36,097 | |
| | | | |
FHLMC (1 Year Treasury Constant Maturity +2.25%)± | | | 4.84 | | | | 4-1-2038 | | | | 215,463 | | | | 227,198 | |
| | | | |
FHLMC (1 Year Treasury Constant Maturity +2.40%)± | | | 4.90 | | | | 7-1-2029 | | | | 1,644 | | | | 1,692 | |
| | | | |
FHLMC | | | 6.00 | | | | 10-1-2021 | | | | 70,341 | | | | 71,996 | |
| | | | |
FHLMC | | | 9.00 | | | | 10-1-2019 | | | | 193 | | | | 192 | |
| | | | |
FHLMC | | | 9.50 | | | | 12-1-2022 | | | | 1,973 | | | | 1,987 | |
| | | | |
FHLMC Series 2597 Class AE | | | 5.50 | | | | 4-15-2033 | | | | 47,435 | | | | 50,916 | |
| | | | |
FHLMC Series 2642 Class AR | | | 4.50 | | | | 7-15-2023 | | | | 170,311 | | | | 174,820 | |
| | | | |
FHLMC Series 3609 Class LA | | | 4.00 | | | | 12-15-2024 | | | | 4,280 | | | | 4,290 | |
| | | | |
FHLMC Series 3855 Class HL | | | 3.50 | | | | 2-15-2026 | | | | 29,777 | | | | 29,806 | |
| | | | |
FHLMC Series 3920 Class AB | | | 3.00 | | | | 9-15-2025 | | | | 191,442 | | | | 192,859 | |
| | | | |
FHLMC Series KI01 Class A (1 Month LIBOR +0.16%)± | | | 2.38 | | | | 9-25-2022 | | | | 89,050 | | | | 88,859 | |
| | | | |
FHLMC Series QO04 Class AFL (12 Month Treasury Average +0.74%)± | | | 3.22 | | | | 5-25-2044 | | | | 1,017,673 | | | | 1,018,558 | |
| | | | |
FHLMC SeriesT-42 Class A6 | | | 9.50 | | | | 2-25-2042 | | | | 297,427 | | | | 367,676 | |
| | | | |
FHLMC SeriesT-57 Class 2A1±± | | | 4.16 | | | | 7-25-2043 | | | | 70,884 | | | | 77,063 | |
| | | | |
FHLMC SeriesT-59 Class 2A1±± | | | 4.03 | | | | 10-25-2043 | | | | 830,165 | | | | 881,290 | |
| | | | |
FHMLC Series 4358 Class DA | | | 3.00 | | | | 6-15-2040 | | | | 1,877,032 | | | | 1,909,992 | |
| | | | |
FNMA | | | 2.02 | | | | 6-1-2021 | | | | 1,988,786 | | | | 1,992,185 | |
| | | | |
FNMA | | | 3.02 | | | | 11-1-2020 | | | | 249,161 | | | | 250,668 | |
| | | | |
FNMA (1 Year Treasury Constant Maturity +1.27%)± | | | 3.83 | | | | 8-1-2034 | | | | 219,591 | | | | 223,134 | |
| | | | |
FNMA | | | 4.00 | | | | 6-25-2026 | | | | 410,003 | | | | 436,183 | |
| | | | |
FNMA | | | 4.00 | | | | 8-25-2037 | | | | 304,808 | | | | 314,715 | |
| | | | |
FNMA (1 Year Treasury Constant Maturity +2.19%)± | | | 4.64 | | | | 11-1-2031 | | | | 39,552 | | | | 41,463 | |
| | | | |
FNMA (12 Month LIBOR +1.81%)± | | | 4.69 | | | | 9-1-2040 | | | | 614,115 | | | | 648,126 | |
| | | | |
FNMA (1 Year Treasury Constant Maturity +2.26%)± | | | 4.72 | | | | 8-1-2036 | | | | 1,035,302 | | | | 1,093,694 | |
| | | | |
FNMA (12 Month Treasury Average +2.29%)± | | | 4.82 | | | | 10-1-2036 | | | | 836,069 | | | | 877,028 | |
| | | | |
FNMA (12 Month Treasury Average +2.43%)± | | | 4.92 | | | | 7-1-2036 | | | | 821,419 | | | | 866,192 | |
| | | | |
FNMA | | | 5.50 | | | | 3-1-2023 | | | | 307,853 | | | | 319,323 | |
| | | | |
FNMA | | | 6.00 | | | | 4-1-2021 | | | | 22,479 | | | | 22,804 | |
| | | | |
FNMA | | | 6.00 | | | | 3-1-2033 | | | | 313,885 | | | | 346,938 | |
| | | | |
FNMA | | | 6.50 | | | | 8-1-2031 | | | | 163,174 | | | | 190,607 | |
| | | | |
FNMA | | | 8.00 | | | | 9-1-2023 | | | | 726 | | | | 730 | |
| | | | |
FNMA | | | 8.33 | | | | 7-15-2020 | | | | 154 | | | | 155 | |
| | | | |
FNMA | | | 9.00 | | | | 2-15-2020 | | | | 22 | | | | 22 | |
| | | | |
FNMA | | | 9.00 | | | | 11-1-2024 | | | | 32,146 | | | | 34,583 | |
| | | | |
FNMA | | | 11.00 | | | | 10-15-2020 | | | | 292 | | | | 294 | |
| | | | |
FNMA Grantor Trust Series2002-T12 Class A4 | | | 9.50 | | | | 5-25-2042 | | | | 490,316 | | | | 586,679 | |
| | | | |
FNMA Series1989-63 Class Z | | | 9.40 | | | | 10-25-2019 | | | | 77 | | | | 77 | |
| | | | |
FNMA Series2002-T1 Class A4 | | | 9.50 | | | | 11-25-2031 | | | | 29,015 | | | | 34,821 | |
| | | | |
FNMA Series2003-41 Class PE | | | 5.50 | | | | 5-25-2023 | | | | 187,546 | | | | 194,798 | |
| | | | |
FNMA Series2003-W11 Class A1±± | | | 5.44 | | | | 6-25-2033 | | | | 5,534 | | | | 5,782 | |
| | | | |
FNMA Series2003-W6 Class 6A±± | | | 4.45 | | | | 8-25-2042 | | | | 555,090 | | | | 570,822 | |
| | | | |
FNMA Series2003-W6 Class PT4±± | | | 8.57 | | | | 10-25-2042 | | | | 54,878 | | | | 69,116 | |
| | | | |
FNMA Series2005-84 Class MB | | | 5.75 | | | | 10-25-2035 | | | | 321,560 | | | | 354,821 | |
The accompanying notes are an integral part of these financial statements.
Wells Fargo Short-Term Bond Fund | 11
Portfolio of investments—August 31, 2019
| | | | | | | | | | | | | | | | |
| | | Interest
rate | | | Maturity
date | | | Principal | | | Value | |
| Agency Securities (continued) | |
| | | | |
FNMA Series2006-W1 Class 2AF2 (1 Month LIBOR +0.19%)± | | | 2.34 | % | | | 2-25-2046 | | | $ | 1,133,667 | | | $ | 1,115,362 | |
| | | | |
FNMA Series2008-53 Class CA | | | 5.00 | | | | 7-25-2023 | | | | 7,416 | | | | 7,412 | |
| | | | |
FNMA Series2010-37 Class A1 | | | 5.41 | | | | 5-25-2035 | | | | 1,436,762 | | | | 1,502,572 | |
| | | | |
FNMA Series2011-133 Class A | | | 3.50 | | | | 6-25-2029 | | | | 43,288 | | | | 43,258 | |
| | | | |
GNMA | | | 4.50 | | | | 4-20-2035 | | | | 83,677 | | | | 87,822 | |
| | | | |
GNMA | | | 8.00 | | | | 12-15-2023 | | | | 10,027 | | | | 10,765 | |
| | | | |
GNMA | | | 9.00 | | | | 11-15-2024 | | | | 1,803 | | | | 1,833 | |
| | | | |
GNMA Series2017-H13 Class FJ (1 Month LIBOR +0.20%)± | | | 2.58 | | | | 5-20-2067 | | | | 137,122 | | | | 137,049 | |
| | | | |
GNMA Series2017-H16 Class FD (1 Month LIBOR +0.20%)± | | | 2.58 | | | | 8-20-2067 | | | | 157,420 | | | | 157,377 | |
| |
Total Agency Securities (Cost $18,862,253) | | | | 19,372,467 | |
| | | | | | | | | | | | | | | | |
|
| Asset-Backed Securities: 12.11% | |
| | | | |
Ascentium Equipment Receivables LLC Series2017-2A Class A2 144A | | | 2.00 | | | | 5-11-2020 | | | | 336,556 | | | | 336,445 | |
| | | | |
California Republic Auto Receivables Trust Series2017-1 Class A4 | | | 2.28 | | | | 6-15-2022 | | | | 3,030,992 | | | | 3,031,406 | |
| | | | |
Chesapeake Funding II LLC Series2017-3A Class A1 144A | | | 1.91 | | | | 8-15-2029 | | | | 1,509,386 | | | | 1,505,211 | |
| | | | |
CPS Auto Trust Series2018-C Class A 144A | | | 2.87 | | | | 9-15-2021 | | | | 1,178,121 | | | | 1,179,153 | |
| | | | |
Dell Equipment Finance Trust Series2018-1 Class A2A 144A | | | 2.97 | | | | 10-22-2020 | | | | 2,211,062 | | | | 2,215,722 | |
| | | | |
DT Auto Owner Trust Series2017-2A Class D 144A | | | 3.89 | | | | 1-15-2023 | | | | 535,000 | | | | 540,333 | |
| | | | |
Education Loan Asset-Backed Trust Series2013-1 Class A1 (1 Month LIBOR +0.80%) 144A± | | | 2.95 | | | | 6-25-2026 | | | | 649,402 | | | | 650,025 | |
| | | | |
Educational Services of America Incorporated Series2015-2 Class A (1 Month LIBOR +1.00%) 144A± | | | 3.15 | | | | 12-25-2056 | | | | 1,051,221 | | | | 1,051,252 | |
| | | | |
Enterprise Fleet Financing Trust Series2017-1 Class A2 144A | | | 2.13 | | | | 7-20-2022 | | | | 988,376 | | | | 988,009 | |
| | | | |
Enterprise Fleet Financing Trust Series2017-2 Class A2 144A | | | 1.97 | | | | 1-20-2023 | | | | 2,799,143 | | | | 2,795,872 | |
| | | | |
Fifth Third Auto Trust Series2019-1 Class A2A | | | 2.66 | | | | 5-16-2022 | | | | 2,015,000 | | | | 2,024,371 | |
| | | | |
Flagship Credit Auto Trust Series2018-2 Class A 144A | | | 2.97 | | | | 10-17-2022 | | | | 1,150,768 | | | | 1,155,689 | |
| | | | |
GM Financial Consumer Automobile Receivables Trust Series2017-2A Class A3 144A | | | 1.86 | | | | 12-16-2021 | | | | 2,830,219 | | | | 2,825,827 | |
| | | | |
GM Financial Securitized Term Auto Receivables Trust Series2018-1 Class A2A | | | 2.08 | | | | 1-19-2021 | | | | 655,927 | | | | 655,793 | |
| | | | |
Hertz Fleet Lease Funding LP Series2016-1 Class A2 144A | | | 1.96 | | | | 4-10-2030 | | | | 91,852 | | | | 91,791 | |
| | | | |
Hertz Vehicle Financing LLC Series2019-1A Class A 144A | | | 3.71 | | | | 3-25-2023 | | | | 2,280,000 | | | | 2,356,621 | |
| | | | |
Hertz Vehicle Financing LLC Series2019-1A Class B 144A | | | 4.10 | | | | 3-25-2023 | | | | 1,500,000 | | | | 1,551,804 | |
| | | | |
Home Equity Asset Trust Series2003-6 Class M1 (1 Month LIBOR +1.05%)± | | | 3.77 | | | | 2-25-2034 | | | | 887,298 | | | | 881,754 | |
| | | | |
Honda Auto Receivables Owner Trust Series2016-4 Class A4 | | | 1.36 | | | | 1-18-2023 | | | | 3,435,000 | | | | 3,418,981 | |
| | | | |
Jimmy John’s Funding LLC Series2017-1A Class A2I 144A | | | 3.61 | | | | 7-30-2047 | | | | 1,225,000 | | | | 1,237,030 | |
| | | | |
Lendmark Funding Trust Series2018-1A Class A 144A | | | 3.81 | | | | 12-21-2026 | | | | 1,855,000 | | | | 1,901,704 | |
| | | | |
MMAF Equipment Finance LLC Series2019-A Class A2 144A | | | 2.84 | | | | 1-10-2022 | | | | 1,875,000 | | | | 1,889,783 | |
| | | | |
Nissan Auto Lease Trust Series2017-B Class A3 | | | 2.05 | | | | 9-15-2020 | | | | 1,198,447 | | | | 1,198,091 | |
| | | | |
SLC Student Loan Trust Series2006-2 Class A5 (3 Month LIBOR +0.10%)± | | | 2.51 | | | | 9-15-2026 | | | | 1,053,077 | | | | 1,050,678 | |
| | | | |
SLM Student Loan Trust Series 2007- 4 Class B1 (3 Month LIBOR +0.14%)± | | | 2.42 | | | | 7-25-2025 | | | | 648,448 | | | | 645,259 | |
| | | | |
SLM Student Loan Trust Series2011-1 Class A1 (1 Month LIBOR +0.52%)± | | | 2.67 | | | | 3-25-2026 | | | | 204,883 | | | | 205,117 | |
| | | | |
SLM Student Loan Trust Series2011-2 Class A1 (1 Month LIBOR +0.60%)± | | | 2.75 | | | | 11-25-2027 | | | | 238,492 | | | | 238,040 | |
| | | | |
SLM Student Loan Trust Series2012-3 Class A (1 Month LIBOR +0.65%)± | | | 2.80 | | | | 12-27-2038 | | | | 1,847,565 | | | | 1,844,427 | |
| | | | |
Student Loan Consolidation Center Series2011-1 Class A (1 Month LIBOR +1.22%) 144A± | | | 3.37 | | | | 10-25-2027 | | | | 1,476,862 | | | | 1,481,224 | |
| | | | |
Tesla Auto Lease Trust Series2018-B Class A 144A | | | 3.71 | | | | 8-20-2021 | | | | 798,193 | | | | 812,382 | |
| | | | |
Towd Point Asset Trust Series2018-SL1 Class A (1 Month LIBOR +0.60%) 144A± | | | 2.75 | | | | 1-25-2046 | | | | 2,116,136 | | | | 2,084,090 | |
| | | | |
Toyota Auto Receivables Owner Trust Series2018-D Class A3 | | | 3.18 | | | | 3-15-2023 | | | | 1,365,000 | | | | 1,394,429 | |
| | | | |
Verizon Owner Trust Series2017-1A Class A 144A | | | 2.06 | | | | 9-20-2021 | | | | 969,117 | | | | 968,780 | |
| | | | |
Volvo Financial Equipment LLC Series2018-A Class A (1 Month LIBOR +0.52%) 144A± | | | 2.72 | | | | 7-17-2023 | | | | 2,240,000 | | | | 2,243,295 | |
The accompanying notes are an integral part of these financial statements.
12 | Wells Fargo Short-Term Bond Fund
Portfolio of investments—August 31, 2019
| | | | | | | | | | | | | | | | |
| | | Interest
rate | | | Maturity
date | | | Principal | | | Value | |
|
| Asset-Backed Securities (continued) | |
| | | | |
Westlake Automobile Receivables Trust Series2018-2A Class B 144A | | | 3.20 | % | | | 1-16-2024 | | | $ | 1,300,000 | | | $ | 1,307,109 | |
| | | | |
Wheels SPV LLC Series2018-1A Class A2 144A | | | 3.06 | | | | 4-20-2027 | | | | 1,109,074 | | | | 1,115,186 | |
| | | | |
World Omni Automobile Lease Southeast Series2019-A Class A4 | | | 3.01 | | | | 7-15-2024 | | | | 1,710,000 | | | | 1,747,675 | |
| |
Total Asset-Backed Securities (Cost $52,375,121) | | | | 52,620,358 | |
| | | | | | | | | | | | | | | | |
|
Corporate Bonds and Notes: 41.59% | |
|
Communication Services: 4.44% | |
|
| Diversified Telecommunication Services: 0.77% | |
| | | | |
AT&T Incorporated | | | 2.80 | | | | 2-17-2021 | | | | 1,910,000 | | | | 1,928,905 | |
| | | | |
Broadcom Corporation | | | 3.00 | | | | 1-15-2022 | | | | 1,415,000 | | | | 1,426,479 | |
| | | | |
| | | | | | | | | | | | | | | 3,355,384 | |
| | | | | | | | | | | | | | | | |
|
| Media: 3.44% | |
| | | | |
Charter Communications Operating LLC | | | 3.58 | | | | 7-23-2020 | | | | 3,000,000 | | | | 3,028,583 | |
| | | | |
Comcast Corporation | | | 3.45 | | | | 10-1-2021 | | | | 3,000,000 | | | | 3,090,009 | |
| | | | |
Discovery Communications LLC | | | 3.50 | | | | 6-15-2022 | | | | 2,025,000 | | | | 2,084,258 | |
| | | | |
Fox Corporation 144A | | | 4.03 | | | | 1-25-2024 | | | | 1,070,000 | | | | 1,145,959 | |
| | | | |
Interpublic Group Companies | | | 3.75 | | | | 2-15-2023 | | | | 2,025,000 | | | | 2,130,190 | |
| | | | |
NBCUniversal Enterprise Incorporated 144A | | | 5.25 | | | | 3-19-2021 | | | | 1,655,000 | | | | 1,708,788 | |
| | | | |
TEGNA Incorporated | | | 5.13 | | | | 7-15-2020 | | | | 1,740,000 | | | | 1,746,090 | |
| | | | |
| | | | | | | | | | | | | | | 14,933,877 | |
| | | | | | | | | | | | | | | | |
|
| Wireless Telecommunication Services: 0.23% | |
| | | | |
Sprint Spectrum Company LLC 144A | | | 3.36 | | | | 3-20-2023 | | | | 990,000 | | | | 993,762 | |
| | | | | | | | | | | | | | | | |
|
Consumer Discretionary: 1.42% | |
|
| Household Durables: 0.66% | |
| | | | |
D.R. Horton Incorporated | | | 4.75 | | | | 2-15-2023 | | | | 2,000,000 | | | | 2,140,775 | |
| | | | |
Lennar Corporation | | | 4.50 | | | | 11-15-2019 | | | | 445,000 | | | | 445,267 | |
| | | | |
Lennar Corporation | | | 4.75 | | | | 11-15-2022 | | | | 251,000 | | | | 264,805 | |
| | | | |
| | | | | | | | | | | | | | | 2,850,847 | |
| | | | | | | | | | | | | | | | |
|
| Internet & Direct Marketing Retail: 0.18% | |
| | | | |
Amazon.com Incorporated | | | 1.90 | | | | 8-21-2020 | | | | 765,000 | | | | 764,527 | |
| | | | | | | | | | | | | | | | |
|
| Multiline Retail: 0.28% | |
| | | | |
Macy’s Retail Holdings Incorporated | | | 3.45 | | | | 1-15-2021 | | | | 1,205,000 | | | | 1,214,771 | |
| | | | | | | | | | | | | | | | |
|
| Specialty Retail: 0.30% | |
| | | | |
Group 1 Automotive Incorporated | | | 5.00 | | | | 6-1-2022 | | | | 1,300,000 | | | | 1,313,000 | |
| | | | | | | | | | | | | | | | |
|
Consumer Staples: 2.86% | |
|
| Food Products: 1.79% | |
| | | | |
Campbell Soup Company | | | 3.30 | | | | 3-15-2021 | | | | 2,380,000 | | | | 2,413,504 | |
| | | | |
Conagra Brands Incorporated | | | 3.80 | | | | 10-22-2021 | | | | 1,440,000 | | | | 1,481,528 | |
| | | | |
General Mills Incorporated | | | 3.20 | | | | 4-16-2021 | | | | 1,800,000 | | | | 1,831,655 | |
| | | | |
Hershey Company | | | 3.38 | | | | 5-15-2023 | | | | 1,935,000 | | | | 2,034,529 | |
| | | | |
| | | | | | | | | | | | | | | 7,761,216 | |
| | | | | | | | | | | | | | | | |
The accompanying notes are an integral part of these financial statements.
Wells Fargo Short-Term Bond Fund | 13
Portfolio of investments—August 31, 2019
| | | | | | | | | | | | | | | | |
| | | Interest
rate | | | Maturity
date | | | Principal | | | Value | |
| Tobacco: 1.07% | |
| | | | |
Altria Group Incorporated | | | 2.85 | % | | | 8-9-2022 | | | $ | 2,805,000 | | | $ | 2,862,846 | |
| | | | |
BAT Capital Corporation | | | 2.30 | | | | 8-14-2020 | | | | 1,785,000 | | | | 1,785,193 | |
| | | | |
| | | | | | | | | | | | | | | 4,648,039 | |
| | | | | | | | | | | | | | | | |
|
Energy: 1.91% | |
|
| Oil, Gas & Consumable Fuels: 1.91% | |
| | | | |
Baker Hughes LLC | | | 2.77 | | | | 12-15-2022 | | | | 1,360,000 | | | | 1,384,692 | |
| | | | |
Energy Transfer Partners LP | | | 5.20 | | | | 2-1-2022 | | | | 2,060,000 | | | | 2,184,940 | |
| | | | |
Occidental Petroleum Corporation | | | 2.90 | | | | 8-15-2024 | | | | 2,365,000 | | | | 2,387,117 | |
| | | | |
Rockies Express Pipeline LLC 144A | | | 5.63 | | | | 4-15-2020 | | | | 2,300,000 | | | | 2,351,187 | |
| | | | |
| | | | | | | | | | | | | | | 8,307,936 | |
| | | | | | | | | | | | | | | | |
|
Financials: 15.87% | |
|
| Banks: 5.63% | |
| | | | |
Australia & New Zealand Banking Group Limited | | | 2.25 | | | | 11-9-2020 | | | | 2,210,000 | | | | 2,218,229 | |
| | | | |
Bank of America Corporation | | | 2.15 | | | | 11-9-2020 | | | | 2,000,000 | | | | 2,001,072 | |
| | | | |
Bank of America NA (3 Month LIBOR +0.65%)± | | | 3.34 | | | | 1-25-2023 | | | | 1,000,000 | | | | 1,030,688 | |
| | | | |
BBVA Bancomer SA 144A | | | 7.25 | | | | 4-22-2020 | | | | 2,240,000 | | | | 2,296,022 | |
| | | | |
Citibank NA | | | 3.40 | | | | 7-23-2021 | | | | 2,000,000 | | | | 2,049,297 | |
| | | | |
Citibank NA (3 Month LIBOR +0.60%)± | | | 2.84 | | | | 5-20-2022 | | | | 2,000,000 | | | | 2,022,377 | |
| | | | |
Citizens Bank | | | 2.20 | | | | 5-26-2020 | | | | 2,000,000 | | | | 1,999,691 | |
| | | | |
HSBC Bank USA NA | | | 4.88 | | | | 8-24-2020 | | | | 3,000,000 | | | | 3,078,196 | |
| | | | |
JPMorgan Chase & Company | | | 1.65 | | | | 9-23-2019 | | | | 2,000,000 | | | | 1,999,403 | |
| | | | |
JPMorgan Chase & Company (3 Month LIBOR +0.70%)± | | | 3.21 | | | | 4-1-2023 | | | | 1,080,000 | | | | 1,110,332 | |
| | | | |
JPMorgan Chase & Company (3 Month LIBOR +0.61%)± | | | 3.51 | | | | 6-18-2022 | | | | 1,000,000 | | | | 1,023,697 | |
| | | | |
Synchrony Bank | | | 3.65 | | | | 5-24-2021 | | | | 1,075,000 | | | | 1,096,925 | |
| | | | |
US Bank NA | | | 2.05 | | | | 10-23-2020 | | | | 2,540,000 | | | | 2,544,029 | |
| | | | |
| | | | | | | | | | | | | | | 24,469,958 | |
| | | | | | | | | | | | | | | | |
|
| Capital Markets: 1.85% | |
| | | | |
Goldman Sachs Group Incorporated | | | 2.30 | | | | 12-13-2019 | | | | 1,000,000 | | | | 1,000,069 | |
| | | | |
Goldman Sachs Group Incorporated (3 Month LIBOR +0.82%)± | | | 2.88 | | | | 10-31-2022 | | | | 2,900,000 | | | | 2,939,954 | |
| | | | |
Morgan Stanley | | | 2.75 | | | | 5-19-2022 | | | | 4,023,000 | | | | 4,092,129 | |
| | | | |
| | | | | | | | | | | | | | | 8,032,152 | |
| | | | | | | | | | | | | | | | |
|
| Consumer Finance: 3.88% | |
| | | | |
American Express Company | | | 3.40 | | | | 2-27-2023 | | | | 1,120,000 | | | | 1,170,046 | |
| | | | |
Capital One Financial Corporation | | | 2.50 | | | | 5-12-2020 | | | | 3,000,000 | | | | 3,005,361 | |
| | | | |
Daimler Finance North America LLC 144A | | | 2.20 | | | | 5-5-2020 | | | | 520,000 | | | | 520,031 | |
| | | | |
Daimler Finance North America LLC 144A | | | 3.00 | | | | 2-22-2021 | | | | 2,850,000 | | | | 2,875,935 | |
| | | | |
Ford Motor Credit Company LLC | | | 3.20 | | | | 1-15-2021 | | | | 1,335,000 | | | | 1,341,607 | |
| | | | |
Ford Motor Credit Company LLC (3 Month LIBOR +0.88%)± | | | 3.22 | | | | 10-12-2021 | | | | 1,160,000 | | | | 1,147,860 | |
| | | | |
General Motors Financial Company | | | 3.45 | | | | 4-10-2022 | | | | 3,000,000 | | | | 3,059,474 | |
| | | | |
Nissan Motor Acceptance Corporation 144A | | | 3.88 | | | | 9-21-2023 | | | | 2,030,000 | | | | 2,138,921 | |
| | | | |
Synchrony Financial | | | 2.70 | | | | 2-3-2020 | | | | 1,645,000 | | | | 1,647,109 | |
| | | | |
| | | | | | | | | | | | | | | 16,906,344 | |
| | | | | | | | | | | | | | | | |
|
| Diversified Financial Services: 1.12% | |
| | | | |
IBM Credit LLC | | | 3.45 | | | | 11-30-2020 | | | | 2,590,000 | | | | 2,634,783 | |
| | | | |
WEA Finance LLC 144A | | | 3.25 | | | | 10-5-2020 | | | | 2,205,000 | | | | 2,231,161 | |
| | | | |
| | | | | | | | | | | | | | | 4,865,944 | |
| | | | | | | | | | | | | | | | |
The accompanying notes are an integral part of these financial statements.
14 | Wells Fargo Short-Term Bond Fund
Portfolio of investments—August 31, 2019
| | | | | | | | | | | | | | | | |
| | | Interest
rate | | | Maturity
date | | | Principal | | | Value | |
| Insurance: 3.39% | |
| | | | |
Axis Specialty Finance LLC | | | 5.88 | % | | | 6-1-2020 | | | $ | 1,794,000 | | | $ | 1,841,188 | |
| | | | |
Jackson National Life Global Company 144A | | | 3.30 | | | | 6-11-2021 | | | | 2,340,000 | | | | 2,387,992 | |
| | | | |
Jackson National Life Global Company 144A | | | 2.50 | | | | 6-27-2022 | | | | 5,000,000 | | | | 5,057,825 | |
| | | | |
Metropolitan Life Global Funding Incorporated 144A | | | 1.55 | | | | 9-13-2019 | | | | 1,820,000 | | | | 1,819,685 | |
| | | | |
OneBeacon US Holdings Incorporated | | | 4.60 | | | | 11-9-2022 | | | | 2,075,000 | | | | 2,160,143 | |
| | | | |
Protective Life Global Funding 144A | | | 2.26 | | | | 4-8-2020 | | | | 1,450,000 | | | | 1,449,827 | |
| | | | |
| | | | | | | | | | | | | | | 14,716,660 | |
| | | | | | | | | | | | | | | | |
|
Health Care: 4.23% | |
|
| Biotechnology: 0.49% | |
| | | | |
AbbVie Incorporated | | | 3.38 | | | | 11-14-2021 | | | | 2,065,000 | | | | 2,116,847 | |
| | | | | | | | | | | | | | | | |
|
| Health Care Providers & Services: 2.54% | |
| | | | |
Anthem Incorporated | | | 2.50 | | | | 11-21-2020 | | | | 1,235,000 | | | | 1,241,186 | |
| | | | |
Cigna Holding Company | | | 4.00 | | | | 2-15-2022 | | | | 2,095,000 | | | | 2,179,579 | |
| | | | |
CVS Health Corporation | | | 2.63 | | | | 8-15-2024 | | | | 1,520,000 | | | | 1,528,710 | |
| | | | |
CVS Health Corporation | | | 2.80 | | | | 7-20-2020 | | | | 2,360,000 | | | | 2,371,764 | |
| | | | |
Dignity Health | | | 3.13 | | | | 11-1-2022 | | | | 2,255,000 | | | | 2,310,357 | |
| | | | |
Tenet Healthcare Corporation | | | 6.00 | | | | 10-1-2020 | | | | 1,340,000 | | | | 1,392,260 | |
| | | | |
| | | | | | | | | | | | | | | 11,023,856 | |
| | | | | | | | | | | | | | | | |
|
| Pharmaceuticals: 1.20% | |
| | | | |
Bayer US Finance LLC 144A | | | 3.88 | | | | 12-15-2023 | | | | 1,725,000 | | | | 1,811,118 | |
| | | | |
EMD Finance LLC 144A | | | 2.40 | | | | 3-19-2020 | | | | 1,925,000 | | | | 1,925,800 | |
| | | | |
Teva Pharmaceutical Finance LLC | | | 2.25 | | | | 3-18-2020 | | | | 1,500,000 | | | | 1,488,750 | |
| | | | |
| | | | | | | | | | | | | | | 5,225,668 | |
| | | | | | | | | | | | | | | | |
|
Industrials: 2.88% | |
|
| Aerospace & Defense: 1.43% | |
| | | | |
Boeing Capital Corporation | | | 1.88 | | | | 6-15-2023 | | | | 3,000,000 | | | | 2,985,255 | |
| | | | |
Spirit AeroSystems Incorporated (3 Month LIBOR +0.80%)± | | | 3.21 | | | | 6-15-2021 | | | | 2,500,000 | | | | 2,499,991 | |
| | | | |
The Boeing Company | | | 2.70 | | | | 5-1-2022 | | | | 710,000 | | | | 724,529 | |
| | | | |
| | | | | | | | | | | | | | | 6,209,775 | |
| | | | | | | | | | | | | | | | |
|
| Airlines: 0.50% | |
| | | | |
Delta Air Lines Incorporated | | | 3.40 | | | | 4-19-2021 | | | | 1,000,000 | | | | 1,013,767 | |
| | | | |
Delta Air Lines Incorporated | | | 4.75 | | | | 11-7-2021 | | | | 1,150,256 | | | | 1,166,130 | |
| | | | |
| | | | | | | | | | | | | | | 2,179,897 | |
| | | | | | | | | | | | | | | | |
|
| Industrial Conglomerates: 0.83% | |
| | | | |
General Electric Company | | | 2.50 | | | | 3-28-2020 | | | | 3,000,000 | | | | 2,980,920 | |
| | | | |
General Electric Company | | | 4.63 | | | | 1-7-2021 | | | | 605,000 | | | | 618,678 | |
| | | | |
| | | | | | | | | | | | | | | 3,599,598 | |
| | | | | | | | | | | | | | | | |
|
| Professional Services: 0.12% | |
| | | | |
Equifax Incorporated | | | 3.60 | | | | 8-15-2021 | | | | 500,000 | | | | 511,015 | |
| | | | | | | | | | | | | | | | |
|
Information Technology: 3.35% | |
|
| IT Services: 0.49% | |
| | | | |
Global Payments Incorporated | | | 2.65 | | | | 2-15-2025 | | | | 2,135,000 | | | | 2,146,460 | |
| | | | | | | | | | | | | | | | |
The accompanying notes are an integral part of these financial statements.
Wells Fargo Short-Term Bond Fund | 15
Portfolio of investments—August 31, 2019
| | | | | | | | | | | | | | | | |
| | | Interest
rate | | | Maturity
date | | | Principal | | | Value | |
| Semiconductors & Semiconductor Equipment: 1.15% | |
| | | | |
Broadcom Corporation | | | 2.65 | % | | | 1-15-2023 | | | $ | 3,000,000 | | | $ | 2,995,998 | |
| | | | |
KLA-Tencor Corporation | | | 3.38 | | | | 11-1-2019 | | | | 2,000,000 | | | | 2,001,418 | |
| | | | |
| | | | | | | | | | | | | | | 4,997,416 | |
| | | | | | | | | | | | | | | | |
|
| Technology Hardware, Storage & Peripherals: 1.71% | |
| | | | |
Apple Incorporated | | | 2.15 | | | | 2-9-2022 | | | | 3,000,000 | | | | 3,026,032 | |
| | | | |
Hewlett Packard Enterprise Company | | | 3.60 | | | | 10-15-2020 | | | | 2,500,000 | | | | 2,535,807 | |
| | | | |
NCR Corporation | | | 4.63 | | | | 2-15-2021 | | | | 1,875,000 | | | | 1,875,188 | |
| | | | |
| | | | | | | | | | | | | | | 7,437,027 | |
| | | | | | | | | | | | | | | | |
|
Materials: 1.07% | |
|
| Chemicals: 0.50% | |
| | | | |
DowDuPont Incorporated | | | 4.21 | | | | 11-15-2023 | | | | 2,010,000 | | | | 2,165,433 | |
| | | | | |
|
| Paper & Forest Products: 0.57% | |
| | | | |
Georgia Pacific LLC 144A | | | 2.54 | | | | 11-15-2019 | | | | 2,495,000 | | | | 2,495,474 | |
| | | | | |
|
Real Estate: 1.08% | |
|
| Equity REITs: 0.61% | |
| | | | |
DDR Corporation | | | 4.63 | | | | 7-15-2022 | | | | 739,000 | | | | 774,836 | |
| | | | |
Host Hotels & Resorts Company | | | 6.00 | | | | 10-1-2021 | | | | 600,000 | | | | 638,039 | |
| | | | |
Omega Healthcare Investors Incorporated | | | 4.95 | | | | 4-1-2024 | | | | 1,160,000 | | | | 1,248,950 | |
| | | | |
| | | | | | | | | | | | | | | 2,661,825 | |
| | | | | |
|
| Real Estate Management & Development: 0.47% | |
| | | | |
Washington Prime Group Incorporated | | | 3.85 | | | | 4-1-2020 | | | | 2,065,000 | | | | 2,051,639 | |
| | | | | |
|
Utilities: 2.48% | |
|
| Electric Utilities: 1.89% | |
| | | | |
Duke Energy Corporation | | | 5.05 | | | | 9-15-2019 | | | | 3,000,000 | | | | 3,002,210 | |
| | | | |
Edison International | | | 2.13 | | | | 4-15-2020 | | | | 1,200,000 | | | | 1,193,526 | |
| | | | |
Exelon Corporation | | | 3.50 | | | | 6-1-2022 | | | | 1,895,000 | | | | 1,951,110 | |
| | | | |
NV Energy Incorporated | | | 6.25 | | | | 11-15-2020 | | | | 2,000,000 | | | | 2,091,350 | |
| | | | |
| | | | | | | | | | | | | | | 8,238,196 | |
| | | | | |
|
| Multi-Utilities: 0.59% | |
| | | | |
Dominion Energy Incorporated | | | 2.72 | | | | 8-15-2021 | | | | 1,170,000 | | | | 1,179,842 | |
| | | | |
DTE Energy Company | | | 2.53 | | | | 10-1-2024 | | | | 1,360,000 | | | | 1,371,582 | |
| | | | |
| | | | | | | | | | | | | | | 2,551,424 | |
| | | | | |
| |
Total Corporate Bonds and Notes (Cost $177,804,166) | | | | 180,745,967 | |
| | | | | |
|
Municipal Obligations: 1.41% | |
|
California: 0.22% | |
|
| Miscellaneous Revenue: 0.22% | |
| | | | |
Roman Catholic Diocese of Oakland CA | | | 6.04 | | | | 11-1-2019 | | | | 935,000 | | | | 940,042 | |
| | | | | |
|
Georgia: 0.25% | |
|
| Health Revenue: 0.25% | |
| | | | |
Georgia Medical Center Hospital Authority Taxable Refunding Bond Columbus Regional Healthcare System Incorporated Project | | | 4.88 | | | | 8-1-2022 | | | | 1,000,000 | | | | 1,066,480 | |
| | | | | |
The accompanying notes are an integral part of these financial statements.
16 | Wells Fargo Short-Term Bond Fund
Portfolio of investments—August 31, 2019
| | | | | | | | | | | | | | | | |
| | | Interest
rate | | | Maturity
date | | | Principal | | | Value | |
Illinois: 0.21% | |
|
| Tax Revenue: 0.21% | |
| | | | |
Chicago IL Retiree Health Series B | | | 6.30 | % | | | 12-1-2021 | | | $ | 870,000 | | | $ | 912,378 | |
| | | | | |
|
Indiana: 0.33% | |
|
| Education Revenue: 0.33% | |
| | | | |
Indiana Secondary Market for Education Loans Incorporated (1 Month LIBOR +0.80%)± | | | 3.07 | | | | 2-25-2044 | | | | 1,444,901 | | | | 1,431,781 | |
| | | | | |
| | | | |
Pennsylvania: 0.21% | | | | | | | | | | | | | | | | |
| | | | |
| Miscellaneous Revenue: 0.21% | | | | | | | | | | | | |
| | | | |
Philadelphia PA IDA Pension Funding Series B (Ambac Insured) ¤ | | | 0.00 | | | | 4-15-2021 | | | | 970,000 | | | | 935,546 | |
| | | | | | | | | | | | | | | | |
| | | | |
Rhode Island: 0.19% | | | | | | | | | | | | | | | | |
| | | | |
| Industrial Development Revenue: 0.19% | | | | | | | | | | | | |
| | | | |
Rhode Island EDA (AGM Insured) | | | 7.75 | | | | 11-1-2020 | | | | 800,000 | | | | 821,744 | |
| | | | | | | | | | | | | | | | |
| |
Total Municipal Obligations (Cost $6,048,615) | | | | 6,107,971 | |
| | | | | | | | | | | | | | | | |
|
| Non-Agency Mortgage-Backed Securities: 21.16% | |
| | | | |
Barclays Commercial Mortgage Trust Series2015-STP Class A 144A | | | 3.32 | | | | 9-10-2028 | | | | 1,426,788 | | | | 1,439,500 | |
| | | | |
BDS Limited Series2018-FL2 Class A (1 Month LIBOR +0.95%) 144A± | | | 3.15 | | | | 8-15-2035 | | | | 1,131,347 | | | | 1,131,347 | |
| | | | |
Benefit Street Partners CLO Limited Series2014-IVA Class A1RR (3 Month LIBOR +1.25%) 144A± | | | 3.53 | | | | 1-20-2029 | | | | 2,300,000 | | �� | | 2,300,398 | |
| | | | |
BlueMountain CLO Limited Series2012-2A Class AR2 (3 Month LIBOR +1.05%) 144A± | | | 3.19 | | | | 11-20-2028 | | | | 1,400,000 | | | | 1,400,008 | |
| | | | |
Bunker Hill Loan Depositary Trust Series2019-1 Class A1 144A | | | 3.61 | | | | 10-26-2048 | | | | 914,768 | | | | 924,172 | |
| | | | |
Cascade Funding Mortgage Trust Series 2018- RM2 Class A 144A±± | | | 4.00 | | | | 10-25-2068 | | | | 489,639 | | | | 507,011 | |
| | | | |
CCG Receivables Trust LLC Series2018-1 Class A2 144A | | | 2.50 | | | | 6-16-2025 | | | | 1,020,043 | | | | 1,022,277 | |
| | | | |
CD Commercial Mortgage Trust Series2017-CD3 Class A1 | | | 1.97 | | | | 2-10-2050 | | | | 959,934 | | | | 958,402 | |
| | | | |
CGBAM Commercial Mortgage Trust Series 2015-SMRT Class A 144A | | | 2.81 | | | | 4-10-2028 | | | | 1,365,000 | | | | 1,366,775 | |
| | | | |
CGDBB Commercial Mortgage Trust Series 2017-BIOC Class A (1 Month LIBOR +0.79%) 144A± | | | 2.99 | | | | 7-15-2032 | | | | 2,850,000 | | | | 2,849,995 | |
| | | | |
CIFC Funding Limited Series2012-2RA Class A1 (3 Month LIBOR +0.80%) 144A± | | | 3.08 | | | | 1-20-2028 | | | | 2,440,000 | | | | 2,431,504 | |
| | | | |
Citigroup Commercial Mortgage Trust Series2016-P5 Class A2 | | | 2.40 | | | | 10-10-2049 | | | | 128,000 | | | | 128,863 | |
| | | | |
Citigroup Commercial Mortgage Trust Series 2017-1500 Class A (1 Month LIBOR +0.85%) 144A± | | | 3.05 | | | | 7-15-2032 | | | | 2,100,000 | | | | 2,100,021 | |
| | | | |
Citigroup Commercial Mortgage Trust Series 2017-MDRB Class A (1 Month LIBOR +1.10%) 144A± | | | 3.30 | | | | 7-15-2030 | | | | 1,056,867 | | | | 1,048,166 | |
| | | | |
Colt Funding LLC Series2018-3 Class A1 144A±± | | | 3.69 | | | | 10-26-2048 | | | | 1,148,300 | | | | 1,157,779 | |
| | | | |
Commercial Mortgage Trust Series2012-CR1 Class ASB | | | 3.05 | | | | 5-15-2045 | | | | 1,632,493 | | | | 1,649,165 | |
| | | | |
Commercial Mortgage Trust Series 2014-LC17 Class A2 | | | 3.16 | | | | 10-10-2047 | | | | 392,385 | | | | 392,206 | |
| | | | |
Commercial Mortgage Trust Series 2015-CR27 Class A1 | | | 1.58 | | | | 10-10-2048 | | | | 829,692 | | | | 826,428 | |
| | | | |
ContiMortgage Home Equity Trust Series1996-2 Class IO±±(c) | | | 0.00 | | | | 7-15-2027 | | | | 592,802 | | | | 11,008 | |
| | | | |
Countrywide Home Loans Mortgage Pass-Through Trust Series 2001-HYB1 Class 2A1±± | | | 4.46 | | | | 6-19-2031 | | | | 99,014 | | | | 99,247 | |
| | | | |
Credit Suisse Mortgage Trust Series 2019-SKLZ Class A (1 Month LIBOR +1.25%) 144A± | | | 3.45 | | | | 1-15-2034 | | | | 1,400,000 | | | | 1,403,192 | |
| | | | |
Crown Point Limited Series2018-6A Class A1 (3 Month LIBOR +1.17%) 144A± | | | 3.45 | | | | 10-20-2028 | | | | 2,350,000 | | | | 2,349,974 | |
| | | | |
Deutsche Bank UBS Securities Mortgage Trust Series 2011-LC2A Class A4 144A | | | 4.54 | | | | 7-10-2044 | | | | 704,369 | | | | 726,213 | |
| | | | |
EquiFirst Mortgage Loan Trust Series2003-2 Class 3A3 (1 Month LIBOR +1.13%) ± | | | 3.32 | | | | 9-25-2033 | | | | 242,366 | | | | 239,879 | |
| | | | |
GCAT Series 2019-NQM1 Class A1 144A | | | 2.99 | | | | 2-25-2059 | | | | 2,772,713 | | | | 2,784,337 | |
The accompanying notes are an integral part of these financial statements.
Wells Fargo Short-Term Bond Fund | 17
Portfolio of investments—August 31, 2019
| | | | | | | | | | | | | | | | |
| | | Interest
rate | | | Maturity
date | | | Principal | | | Value | |
|
| Non-Agency Mortgage-Backed Securities (continued) | |
| | | | |
Golden National Mortgage Asset-Backed Certificates Series1998-GN1 Class M2 | | | 1.00 | % | | | 2-25-2027 | | | $ | 34,322 | | | $ | 34,243 | |
| | | | |
Great Wolf Trust Series 2017 Class A (1 Month LIBOR +0.85%) 144A± | | | 3.05 | | | | 9-15-2034 | | | | 2,150,000 | | | | 2,149,292 | |
| | | | |
GS Mortgage Securities Trust Series2010-C1 Class A2 144A | | | 4.59 | | | | 8-10-2043 | | | | 3,210,000 | | | | 3,250,780 | |
| | | | |
GS Mortgage Securities Trust Series 2012-ALOH Class A 144A | | | 3.55 | | | | 4-10-2034 | | | | 2,414,000 | | | | 2,495,937 | |
| | | | |
GS Mortgage Securities Trust Series2013-G1 Class A2 144A±± | | | 3.56 | | | | 4-10-2031 | | | | 530,140 | | | | 544,104 | |
| | | | |
GS Mortgage Securities Trust Series 2014-GC22 Class A3 | | | 3.52 | | | | 6-10-2047 | | | | 3,031,556 | | | | 3,084,086 | |
| | | | |
GS Mortgage Securities Trust Series2016-GS3 Class A1 | | | 1.43 | | | | 10-10-2049 | | | | 1,299,258 | | | | 1,290,638 | |
| | | | |
GS Mortgage Securities Trust Series 2019- PJ1 Class A6 144A±± | | | 4.00 | | | | 8-25-2049 | | | | 1,054,026 | | | | 1,064,716 | |
| | | | |
GSMPS Mortgage Loan Trust Series1998-1 Class A 144A±± | | | 8.00 | | | | 9-19-2027 | | | | 161,515 | | | | 160,613 | |
| | | | |
Homeward Opportunities Fund I Trust Series2019-1 Class A1 144A±± | | | 3.45 | | | | 1-25-2059 | | | | 1,939,468 | | | | 1,958,169 | |
| | | | |
Hospitality Mortgage Trust Series 2019 Class A (1 Month LIBOR +1.00%) 144A± | | | 3.20 | | | | 11-15-2036 | | | | 2,160,000 | | | | 2,157,967 | |
| | | | |
JPMorgan Chase Commercial Mortgage Securities Trust Series 2007-LDPX Class AM±± | | | 5.46 | | | | 1-15-2049 | | | | 238,603 | | | | 237,783 | |
| | | | |
JPMorgan Chase Commercial Mortgage Securities Trust Series2012-C8 Class A3 | | | 2.83 | | | | 10-15-2045 | | | | 2,456,780 | | | | 2,514,438 | |
| | | | |
JPMorgan Chase Commercial Mortgage Securities Trust Series 2013-LC11 Class A4 | | | 2.69 | | | | 4-15-2046 | | | | 1,608,504 | | | | 1,648,325 | |
| | | | |
JPMorgan Chase Commercial Mortgage Securities Trust Series2018-PHH Class A (1 Month LIBOR +0.91%) 144A± | | | 3.11 | | | | 6-15-2035 | | | | 1,051,458 | | | | 1,051,518 | |
| | | | |
KKR Financial Holdings LLC (3 Month LIBOR +1.34%) 144A± | | | 3.64 | | | | 4-15-2029 | | | | 2,250,000 | | | | 2,250,383 | |
| | | | |
Lendmark Funding Trust Series 2018-2A Class A 144A | | | 4.23 | | | | 4-20-2027 | | | | 160,000 | | | | 166,753 | |
| | | | |
LoanCore Limited Series 2018-CRE1 Class A (1 Month LIBOR +1.13%) 144A± | | | 3.33 | | | | 5-15-2028 | | | | 2,000,000 | | | | 2,001,868 | |
| | | | |
LStar Commercial Mortgage Trust Series2017-5 Class A1 144A | | | 2.42 | | | | 3-10-2050 | | | | 481,800 | | | | 483,281 | |
| | | | |
Master Mortgages Trust Series2002-3 Class 4A1±± | | | 4.98 | | | | 10-25-2032 | | | | 1,458 | | | | 1,482 | |
| | | | |
Mello Warehouse Securitization Series2018-W1 Class A (1 Month LIBOR +0.85%) 144A± | | | 3.00 | | | | 11-25-2051 | | | | 2,000,000 | | | | 1,998,982 | |
| | | | |
Mello Warehouse Securitization Series2019-1 Class A (1 Month LIBOR +0.80%) 144A± | | | 2.95 | | | | 6-25-2052 | | | | 2,240,000 | | | | 2,238,017 | |
| | | | |
Morgan Stanley Capital I Trust Series2016-C30 Class A1 | | | 1.39 | | | | 9-15-2049 | | | | 1,072,744 | | | | 1,064,656 | |
| | | | |
Neuberger Berman Limited Series2015-20A Class AR (3 Month LIBOR +0.80%) 144A± | | | 3.10 | | | | 1-15-2028 | | | | 1,340,000 | | | | 1,332,629 | |
| | | | |
New Residential Mortgage Loan Trust Series 2018-NQM1 Class A1 144A±± | | | 3.99 | | | | 11-25-2048 | | | | 1,435,197 | | | | 1,461,422 | |
| | | | |
Oaktree CLO Limited Series15-1A Class A1R (3 Month LIBOR +0.87%) 144A± | | | 3.15 | | | | 10-20-2027 | | | | 1,500,000 | | | | 1,500,020 | |
| | | | |
Palmer Square Loan Funding Limited Series2017-1A Class A1 (3 Month LIBOR +0.74%) 144A± | | | 3.04 | | | | 10-15-2025 | | | | 1,196,581 | | | | 1,194,626 | |
| | | | |
Palmer Square Loan Funding Limited Series2018-4A Class A1 (3 Month LIBOR +0.90%) 144A± | | | 3.06 | | | | 11-15-2026 | | | | 1,407,306 | | | | 1,407,775 | |
| | | | |
RAIT Trust Series2017-FL7 Class A (1 Month LIBOR +0.95%) 144A± | | | 3.15 | | | | 6-15-2037 | | | | 333,228 | | | | 332,967 | |
| | | | |
ReadyCap Commercial Mortgage Trust Series2019-5 Class A 144A | | | 3.78 | | | | 2-25-2052 | | | | 1,616,963 | | | | 1,674,259 | |
| | | | |
Regatta II Funding LP Series2013-2A Class A1R2 (3 Month LIBOR +1.25%) 144A± | | | 3.55 | | | | 1-15-2029 | | | | 2,925,000 | | | | 2,924,939 | |
| | | | |
Salem Fields CLO Limited Series2016-2A Class A (3 Month LIBOR +1.15%) 144A± | | | 3.43 | | | | 10-25-2028 | | | | 1,800,000 | | | | 1,797,530 | |
| | | | |
SBA Tower Trust Series2014-1A Class C 144A | | | 2.90 | | | | 10-15-2044 | | | | 3,000,000 | | | | 3,000,386 | |
| | | | |
Starwood Mortgage Residential Trust Series2019-1 Class A1 144A±± | | | 2.94 | | | | 6-25-2049 | | | | 1,885,750 | | | | 1,890,029 | |
| | | | |
Stonemont Portfolio Trust Series 2017 Class A (1 Month LIBOR +0.85%) 144A± | | | 3.02 | | | | 8-20-2030 | | | | 1,715,174 | | | | 1,714,611 | |
| | | | |
THL Credit Wind River CLO Limited Series2012-1A Class AR2 (3 Month LIBOR +0.88%) 144A± | | | 3.18 | | | | 1-15-2026 | | | | 2,045,000 | | | | 2,044,965 | |
| | | | |
UBS Commercial Mortgage Trust Series 2018-NYCH Class A (1 Month LIBOR +0.85%) 144A± | | | 3.05 | | | | 2-15-2032 | | | | 1,680,000 | | | | 1,676,332 | |
| | | | |
Vendee Mortgage Trust Series2011-1 Class DA | | | 3.75 | | | | 2-15-2035 | | | | 855,963 | | | | 867,124 | |
The accompanying notes are an integral part of these financial statements.
18 | Wells Fargo Short-Term Bond Fund
Portfolio of investments—August 31, 2019
| | | | | | | | | | | | | | | | |
| | | Interest
rate | | | Maturity
date | | | Principal | | | Value | |
|
| Non-Agency Mortgage-Backed Securities (continued) | |
| | | | |
Verus Securitization Trust Series2019-1 Class A1 144A±± | | | 3.40 | % | | | 12-25-2059 | | | $ | 1,844,348 | | | $ | 1,861,400 | |
| | | | |
Wilshire Funding Corporation Series1996-3 Class M2±± | | | 7.07 | | | | 8-25-2032 | | | | 81,108 | | | | 79,708 | |
| | | | |
Wilshire Funding Corporation Series1996-3 Class M3±± | | �� | 7.07 | | | | 8-25-2032 | | | | 83,832 | | | | 81,227 | |
| | | | |
Wilshire Funding Corporation Series1998-2 Class M1±± | | | 2.00 | | | | 12-28-2037 | | | | 8,615 | | | | 8,695 | |
| |
TotalNon-Agency Mortgage-Backed Securities (Cost $91,791,637) | | | | 91,946,542 | |
| | | | | |
|
| U.S. Treasury Securities: 0.36% | |
| | | | |
U.S. Treasury Note | | | 2.50 | | | | 1-15-2022 | | | | 1,545,000 | | | | 1,581,271 | |
| |
Total U.S. Treasury Securities (Cost $1,544,022) | | | | 1,581,271 | |
| | | | | |
|
Yankee Corporate Bonds and Notes: 15.60% | |
|
Communication Services: 0.55% | |
|
| Interactive Media & Services: 0.55% | |
| | | | |
Tencent Holdings Limited 144A | | | 3.28 | | | | 4-11-2024 | | | | 2,310,000 | | | | 2,392,905 | |
| | | | | | | | | | | | | | | | |
|
Consumer Discretionary: 0.68% | |
|
| Auto Components: 0.58% | |
| | | | |
Toyota Industries Corporation 144A | | | 3.11 | | | | 3-12-2022 | | | | 2,460,000 | | | | 2,510,362 | |
| | | | | | | | | | | | | | | | |
|
| Automobiles: 0.10% | |
| | | | |
Jaguar Land Rover Limited 144A | | | 4.25 | | | | 11-15-2019 | | | | 445,000 | | | | 443,443 | |
| | | | | | | | | | | | | | | | |
|
Energy: 0.23% | |
|
| Oil, Gas & Consumable Fuels: 0.23% | |
| | | | |
Petroleos Mexicanos Company | | | 5.38 | | | | 3-13-2022 | | | | 995,000 | | | | 1,017,388 | |
| | | | | | | | | | | | | | | | |
|
Financials: 11.64% | |
|
| Banks: 9.90% | |
| | | | |
Banco de Credito del Peru 144A | | | 2.25 | | | | 10-25-2019 | | | | 1,500,000 | | | | 1,499,265 | |
| | | | |
Banco Internacional del Peru 144A« | | | 3.38 | | | | 1-18-2023 | | | | 1,305,000 | | | | 1,318,050 | |
| | | | |
Banco Santander SA 144A | | | 4.13 | | | | 11-9-2022 | | | | 2,095,000 | | | | 2,170,944 | |
| | | | |
Banque Federative du Credit Mutuel SA 144A | | | 2.20 | | | | 7-20-2020 | | | | 2,530,000 | | | | 2,533,789 | |
| | | | |
Commonwealth Bank of Australia 144A | | | 1.75 | | | | 11-7-2019 | | | | 1,750,000 | | | | 1,748,605 | |
| | | | |
Cooperatieve Rabobank U.A. | | | 2.75 | | | | 1-10-2022 | | | | 3,000,000 | | | | 3,053,606 | |
| | | | |
Corporación Andina de Fomento | | | 2.13 | | | | 9-27-2021 | | | | 3,000,000 | | | | 2,991,360 | |
| | | | |
Credit Suisse Group Funding Limited | | | 3.13 | | | | 12-10-2020 | | | | 2,110,000 | | | | 2,133,682 | |
| | | | |
Danske Bank AS 144A | | | 1.65 | | | | 9-6-2019 | | | | 3,000,000 | | | | 2,999,890 | |
| | | | |
Danske Bank AS 144A | | | 5.00 | | | | 1-12-2022 | | | | 1,405,000 | | | | 1,481,800 | |
| | | | |
Global Bank Corporation 144A | | | 4.50 | | | | 10-20-2021 | | | | 470,000 | | | | 483,630 | |
| | | | |
Macquarie Bank Limited 144A | | | 2.85 | | | | 7-29-2020 | | | | 3,000,000 | | | | 3,017,929 | |
| | | | |
Mitsubishi UFJ Trust and Banking Corporation 144A | | | 2.45 | | | | 10-16-2019 | | | | 3,000,000 | | | | 3,000,552 | |
| | | | |
Mizuho Financial Group 144A | | | 2.63 | | | | 4-12-2021 | | | | 1,000,000 | | | | 1,006,062 | |
| | | | |
Nordea Bank AB 144A | | | 3.75 | | | | 8-30-2023 | | | | 2,000,000 | | | | 2,102,722 | |
| | | | |
Santander UK plc | | | 3.40 | | | | 6-1-2021 | | | | 2,000,000 | | | | 2,041,429 | |
| | | | |
Sumitomo Mitsui Financial Group | | | 2.70 | | | | 7-16-2024 | | | | 2,510,000 | | | | 2,552,916 | |
| | | | |
Sumitomo Mitsui Financial Group (3 Month LIBOR +0.80%)± | | | 3.12 | | | | 10-16-2023 | | | | 2,000,000 | | | | 2,005,186 | |
| | | | |
Svenska Handelsbanken AB | | | 1.88 | | | | 9-7-2021 | | | | 2,500,000 | | | | 2,490,364 | |
| | | | |
UniCredit SpA 144A | | | 6.57 | | | | 1-14-2022 | | | | 2,220,000 | | | | 2,387,137 | |
| | | | |
| | | | | | | | | | | | | | | 43,018,918 | |
| | | | | |
The accompanying notes are an integral part of these financial statements.
Wells Fargo Short-Term Bond Fund | 19
Portfolio of investments—August 31, 2019
| | | | | | | | | | | | | | | | |
| | | Interest
rate | | | Maturity
date | | | Principal | | | Value | |
| Diversified Financial Services: 1.24% | |
| | | | |
AerCap Ireland Capital DAC | | | 4.45 | % | | | 12-16-2021 | | | $ | 1,410,000 | | | $ | 1,465,141 | |
| | | | |
Enel Finance International NV 144A | | | 4.25 | | | | 9-14-2023 | | | | 2,500,000 | | | | 2,659,236 | |
| | | | |
UBS AG 144A | | | 2.20 | | | | 6-8-2020 | | | | 1,275,000 | | | | 1,275,578 | |
| | | | |
| | | | | | | | | | | | | | | 5,399,955 | |
| | | | | |
|
| Insurance: 0.50% | |
| | | | |
Sompo International Holdings Limited | | | 4.70 | | | | 10-15-2022 | | | | 2,058,000 | | | | 2,149,937 | |
| | | | | |
|
Health Care: 0.78% | |
|
| Pharmaceuticals: 0.78% | |
| | | | |
Perrigo Company plc | | | 4.00 | | | | 11-15-2023 | | | | 323,000 | | | | 330,052 | |
| | | | |
Perrigo Finance Unlimited Company | | | 3.50 | | | | 3-15-2021 | | | | 1,065,000 | | | | 1,070,695 | |
| | | | |
Shire Acquisitions Investment Ireland Limited | | | 1.90 | | | | 9-23-2019 | | | | 1,010,000 | | | | 1,009,778 | |
| | | | |
Shire Acquisitions Investment Ireland Limited | | | 2.40 | | | | 9-23-2021 | | | | 980,000 | | | | 983,038 | |
| | | | |
| | | | | | | | | | | | | | | 3,393,563 | |
| | | | | |
|
Industrials: 0.56% | |
|
| Semiconductors & Semiconductor Equipment: 0.14% | |
| | | | |
NXP BV 144A | | | 4.13 | | | | 6-1-2021 | | | | 585,000 | | | | 600,342 | |
| | | | | |
|
| Transportation Infrastructure: 0.42% | |
| | | | |
Asciano Finance Limited 144A | | | 4.63 | | | | 9-23-2020 | | | | 1,821,000 | | | | 1,856,793 | |
| | | | | | | | | | | | | | | | |
|
Materials: 1.16% | |
|
| Chemicals: 0.48% | |
| | | | |
Syngenta Finance NV 144A | | | 4.44 | | | | 4-24-2023 | | | | 2,000,000 | | | | 2,095,608 | |
| | | | | | | | | | | | | | | | |
|
| Containers & Packaging: 0.36% | |
| | | | |
Ardagh Packaging Finance plc 144A | | | 4.63 | | | | 5-15-2023 | | | | 1,500,000 | | | | 1,535,190 | |
| | | | | | | | | | | | | | | | |
|
| Metals & Mining: 0.32% | |
| | | | |
ArcelorMittal SA | | | 5.50 | | | | 3-1-2021 | | | | 1,340,000 | | | | 1,398,078 | |
| | | | | | | | | | | | | | | | |
| |
Total Yankee Corporate Bonds and Notes (Cost $66,370,559) | | | | 67,812,482 | |
| | | | | |
| |
| | | | | |
| | | Yield | | | | | | Shares | | | | |
| Short-Term Investments: 2.73% | |
|
| Investment Companies: 2.59% | |
| | | | |
Securities Lending Cash Investments LLC (l)(r)(u) | | | 2.24 | | | | | | | | 1,285,334 | | | | 1,285,463 | |
| | | | |
Wells Fargo Government Money Market Fund Select Class (l)(u) | | | 2.04 | | | | | | | | 9,958,213 | | | | 9,958,213 | |
| | | | |
| | | | | | | | | | | | | | | 11,243,676 | |
| | | | | | | | | | | | | | | | |
| | | | |
| | | | | | | | | | | | | | | | |
| | | | | | | | | Principal | | | | |
| U.S. Treasury Securities: 0.14% | |
| | | | |
U.S. Treasury Bill #(z) | | | 1.65 | | | | 9-12-2019 | | | $ | 625,000 | | | | 624,709 | |
| | | | | | | | | | | | | | | | |
| |
Total Short-Term Investments (Cost $11,868,331) | | | | 11,868,385 | |
| | | | | |
| | | | | | | | |
| Total investments in securities (Cost $426,664,704) | | | 99.42 | % | | | 432,055,443 | |
| | |
Other assets and liabilities, net | | | 0.58 | | | | 2,538,130 | |
| | | | | | | | |
| Total net assets | | | 100.00 | % | | $ | 434,593,573 | |
| | | | | | | | |
The accompanying notes are an integral part of these financial statements.
20 | Wells Fargo Short-Term Bond Fund
Portfolio of investments—August 31, 2019
| 144A | The security may be resold in transactions exempt from registration, normally to qualified institutional buyers, pursuant to Rule 144A under the Securities Act of 1933. |
| ± | Variable rate investment. The rate shown is the rate in effect at period end. |
| ±± | The coupon of the security is adjusted based on the principal and interest payments received from the underlying pool of mortgages as well as the credit quality and the actual prepayment speed of the underlying mortgages. |
| ¤ | The security is issued in zero coupon form with no periodic interest payments. |
| (c) | Investment in an interest-only security entitles holders to receive only the interest payments on the underlying mortgages. The principal amount shown is the notional amount of the underlying mortgages. The rate represents the coupon rate. |
| « | All or a portion of this security is on loan. |
| (l) | The issuer of the security is an affiliated person of the Fund as defined in the Investment Company Act of 1940. |
| (r) | The investment is anon-registered investment company purchased with cash collateral received from securities on loan. |
| (u) | The rate represents the7-day annualized yield at period end. |
| # | All or a portion of this security is segregated as collateral for investments in derivative instruments. |
| (z) | Zero coupon security. The rate represents the current yield to maturity. |
Abbreviations:
| AGM | Assured Guaranty Municipal |
| Ambac | Ambac Financial Group Incorporated |
| EDA | Economic Development Authority |
| FDIC | Federal Deposit Insurance Corporation |
| FHLMC | Federal Home Loan Mortgage Corporation |
| FNMA | Federal National Mortgage Association |
| GNMA | Government National Mortgage Association |
| IDA | Industrial Development Authority |
| LIBOR | London Interbank Offered Rate |
| REIT | Real Estate Investment Trust |
Futures Contracts
| | | | | | | | | | | | | | | | | | | | | | | | |
| Description | | Number of
contracts | | | Expiration
date | | | Notional
cost | | | Notional
value | | | Unrealized
gains | | | Unrealized
losses | |
| | | | | | |
Long | | | | | | | | | | | | | | | | | | | | | | | | |
| | | | | | |
2-Year U.S. Treasury Notes | | | 870 | | | | 12-31-2019 | | | $ | 187,833,735 | | | $ | 188,021,953 | | | $ | 188,218 | | | $ | 0 | |
| | | | | | |
Short | | | | | | | | | | | | | | | | | | | | | | | | |
| | | | | | |
5-Year U.S. Treasury Notes | | | (281) | | | | 12-31-2019 | | | | (33,756,350 | ) | | | (33,713,414 | ) | | | 42,936 | | | | 0 | |
| | | | | | | | | | | | | | | | | | | | | | | | |
| | | | | | |
| | | | | | | | | | | | | | | | | | $ | 231,154 | | | $ | 0 | |
| | | | | | | | | | | | | | | | | | | | | | | | |
Investments in Affiliates
An affiliated investment is an investment in which the Fund owns at least 5% of the outstanding voting shares of the issuer or as a result of other relationships, such as the Fund and the issuer having the same investment manager. Transactions with issuers that were either affiliated persons of the Fund at the beginning of the period or the end of the period were as follows:
| | | | | | | | | | | | | | | | | | | | | | | | | | | | | | | | | | | | |
| | | Shares,
beginning of
period | | | Shares
purchased | | | Shares
sold | | | Shares,
end of
period | | | Net
realized
gains
(losses) | | | Net
change in
unrealized
gains
(losses) | | | Income
from
affiliated
securities | | | Value,
end
of period | | | % of
net
assets | |
Short-Term Investments | | | | | | | | | | | | | | | | | | | | | | | | | | | | | | | | | | | | |
Investment Companies | | | | | | | | | | | | | | | | | | | | | | | | | | | | | | | | | | | | |
Securities Lending Cash Investments LLC | | | 0 | | | | 9,154,801 | | | | 7,869,467 | | | | 1,285,334 | | | $ | 10 | | | $ | 0 | | | $ | 17,292 | # | | $ | 1,285,463 | | | | | |
Wells Fargo Government Money Market Fund Select Class | | | 14,823,405 | | | | 189,290,975 | | | | 194,156,167 | | | | 9,958,213 | | | | 0 | | | | 0 | | | | 409,347 | | | | 9,958,213 | | | | | |
| | | | | | | | | | | | | | | | | | | | | | | | | | | | | | | | | | | | |
| | | | | | | | | | | | | | | | | | $ | 10 | | | $ | 0 | | | $ | 426,639 | | | $ | 11,243,676 | | | | 2.59 | % |
| | | | | | | | | | | | | | | | | | | | | | | | | | | | | | | | | | | | |
| # | Amount shown represents income before fees and rebates. |
The accompanying notes are an integral part of these financial statements.
Wells Fargo Short-Term Bond Fund | 21
Statement of assets and liabilities—August 31, 2019
| | | | |
| | | | |
| |
Assets | | | | |
Investments in unaffiliated securities (including $1,259,598 of securities loaned), at value (cost $415,421,028) | | $ | 420,811,767 | |
Investments in affiliated securities, at value (cost $11,243,676) | | | 11,243,676 | |
Cash | | | 1,445,468 | |
Principal paydown receivable | | | 4,664 | |
Receivable for Fund shares sold | | | 520,212 | |
Receivable for interest | | | 2,620,293 | |
Receivable for daily variation margin on open futures contracts | | | 55,587 | |
Receivable for securities lending income, net | | | 301 | |
Prepaid expenses and other assets | | | 38,792 | |
| | | | |
Total assets | | | 436,740,760 | |
| | | | |
| |
Liabilities | | | | |
Payable upon receipt of securities loaned | | | 1,285,389 | |
Payable for Fund shares redeemed | | | 322,186 | |
Dividends payable | | | 237,803 | |
Management fee payable | | | 112,137 | |
Custodian and accounting fees payable | | | 58,894 | |
Administration fees payable | | | 42,723 | |
Distribution fee payable | | | 4,477 | |
Trustees’ fees and expenses payable | | | 4,032 | |
Accrued expenses and other liabilities | | | 79,546 | |
| | | | |
Total liabilities | | | 2,147,187 | |
| | | | |
Total net assets | | $ | 434,593,573 | |
| | | | |
| |
Net assets consist of | | | | |
Paid-in capital | | $ | 431,053,004 | |
Total distributable earnings | | | 3,540,569 | |
| | | | |
Total net assets | | $ | 434,593,573 | |
| | | | |
| |
Computation of net asset value and offering price per share | | | | |
Net assets – Class A | | $ | 170,345,438 | |
Shares outstanding – Class A1 | | | 19,274,610 | |
Net asset value per share – Class A | | | $8.84 | |
Maximum offering price per share – Class A2 | | | $9.02 | |
Net assets – Class C | | $ | 7,146,270 | |
Shares outstanding – Class C1 | | | 809,517 | |
Net asset value per share – Class C | | | $8.83 | |
Net assets – Class R6 | | $ | 30,584,941 | |
Shares outstanding – Class R61 | | | 3,462,649 | |
Net asset value per share – Class R6 | | | $8.83 | |
Net assets – Institutional Class | | $ | 226,516,924 | |
Shares outstanding – Institutional Class1 | | | 25,619,554 | |
Net asset value per share – Institutional Class | | | $8.84 | |
| 1 | The Fund has an unlimited number of authorized shares. |
| 2 | Maximum offering price is computed as 100/98 of net asset value. On investments of $50,000 or more, the offering price is reduced. |
The accompanying notes are an integral part of these financial statements.
22 | Wells Fargo Short-Term Bond Fund
Statement of operations—year ended August 31, 2019
| | | | |
| | | | |
| |
Investment income | | | | |
Interest | | $ | 12,485,728 | |
Income from affiliated securities | | | 411,479 | |
| | | | |
Total investment income | | | 12,897,207 | |
| | | | |
| |
Expenses | | | | |
Management fee | | | 1,478,011 | |
Administration fees | | | | |
Class A | | | 274,215 | |
Class C | | | 12,292 | |
Class R6 | | | 7,907 | |
Institutional Class | | | 173,491 | |
Shareholder servicing fees | | | | |
Class A | | | 428,461 | |
Class C | | | 19,207 | |
Distribution fee | | | | |
Class C | | | 57,620 | |
Custody and accounting fees | | | 41,787 | |
Professional fees | | | 54,403 | |
Registration fees | | | 69,808 | |
Shareholder report expenses | | | 55,845 | |
Trustees’ fees and expenses | | | 21,592 | |
Other fees and expenses | | | 10,972 | |
| | | | |
Total expenses | | | 2,705,611 | |
Less: Fee waivers and/or expense reimbursements | | | | |
Fund-level | | | (167,765 | ) |
Class A | | | (103,572 | ) |
Class C | | | (4,653 | ) |
Institutional Class | | | (1,746 | ) |
| | | | |
Net expenses | | | 2,427,875 | |
| | | | |
Net investment income | | | 10,469,332 | |
| | | | |
| |
Realized and unrealized gains (losses) on investments | | | | |
Net realized gains (losses) on | | | | |
Unaffiliated securities | | | (54,880 | ) |
Affiliated securities | | | 10 | |
Futures contracts | | | 1,043,042 | |
| | | | |
Net realized gains on investments | | | 988,172 | |
| | | | |
| |
Net change in unrealized gains (losses) on | | | | |
Unaffiliated securities | | | 8,047,573 | |
Futures contracts | | | 221,324 | |
| | | | |
Net change in unrealized gains (losses) on investments | | | 8,268,897 | |
| | | | |
Net realized and unrealized gains (losses) on investments | | | 9,257,069 | |
| | | | |
Net increase in net assets resulting from operations | | $ | 19,726,401 | |
| | | | |
The accompanying notes are an integral part of these financial statements.
Wells Fargo Short-Term Bond Fund | 23
Statement of changes in net assets
| | | | | | | | | | | | | | | | |
| | | Year ended
August 31, 2019 | | | Year ended
August 31, 20181 | |
| | | | |
Operations | | | | | | | | | | | | | | | | |
Net investment income | | | | | | $ | 10,469,332 | | | | | | | $ | 8,088,723 | |
Net realized gains (losses) on investments | | | | | | | 988,172 | | | | | | | | (2,019,738 | ) |
Net change in unrealized gains (losses) on investments | | | | | | | 8,268,897 | | | | | | | | (4,384,603 | ) |
| | | | |
Net increase in net assets resulting from operations | | | | | | | 19,726,401 | | | | | | | | 1,684,382 | |
| | | | |
| | | | |
Distributions to shareholders from net investment income and net realized gains | | | | | | | | | | | | | | | | |
Class A | | | | | | | (3,992,982 | ) | | | | | | | (3,469,175 | ) |
Class C | | | | | | | (120,972 | ) | | | | | | | (90,525 | ) |
Class R6 | | | | | | | (713,351 | ) | | | | | | | (4,529 | )2 |
Institutional Class | | | | | | | (5,643,042 | ) | | | | | | | (4,526,238 | ) |
| | | | |
Total distributions to shareholders | | | | | | | (10,470,347 | ) | | | | | | | (8,090,467 | ) |
| | | | |
| | | | |
| | | Shares | | | | | | | | Shares | | | | | |
| | | | |
Capital share transactions | | | | | | | | | | | | | | | | |
Proceeds from shares sold | | | | | | | | | | | | | | | | |
Class A | | | 2,223,647 | | | | 19,328,602 | | | | 2,950,320 | | | | 25,683,232 | |
Class C | | | 271,321 | | | | 2,363,056 | | | | 199,067 | | | | 1,725,463 | |
Class R6 | | | 5,013,680 | | | | 43,272,366 | | | | 295,683 | 2 | |
| 2,557,641
| 2
|
Institutional Class | | | 10,058,620 | | | | 87,525,507 | | | | 9,805,488 | | | | 85,201,932 | |
| | | | |
| | | | | | | 152,489,531 | | | | | | | | 115,168,268 | |
| | | | |
Reinvestment of distributions | | | | | | | | | | | | | | | | |
Class A | | | 431,307 | | | | 3,760,725 | | | | 376,379 | | | | 3,266,179 | |
Class C | | | 11,990 | | | | 104,366 | | | | 8,860 | | | | 76,773 | |
Class R6 | | | 421 | | | | 3,677 | | | | 517 | 2 | | | 4,475 | 2 |
Institutional Class | | | 465,911 | | | | 4,065,263 | | | | 346,975 | | | | 3,011,667 | |
| | | | |
| | | | | | | 7,934,031 | | | | | | | | 6,359,094 | |
| | | | |
Payment for shares redeemed | | | | | | | | | | | | | | | | |
Class A | | | (4,443,303 | ) | | | (38,566,762 | ) | | | (8,005,429 | ) | | | (69,532,343 | ) |
Class C | | | (467,871 | ) | | | (4,067,578 | ) | | | (510,548 | ) | | | (4,431,866 | ) |
Class R6 | | | (1,846,341 | ) | | | (16,085,357 | ) | | | (1,311 | )2 | | | (11,344 | )2 |
Institutional Class | | | (11,098,501 | ) | | | (96,341,169 | ) | | | (10,231,298 | ) | | | (88,878,420 | ) |
| | | | |
| | | | | | | (155,060,866 | ) | | | | | | | (162,853,973 | ) |
| | | | |
Net increase (decrease) in net assets resulting from capital share transactions | | | | | | | 5,362,696 | | | | | | | | (41,326,611 | ) |
| | | | |
Total increase (decrease) in net assets | | | | | | | 14,618,750 | | | | | | | | (47,732,696 | ) |
| | | | |
| | | | |
Net assets | | | | | | | | | | | | | | | | |
Beginning of period | | | | | | | 419,974,823 | | | | | | | | 467,707,519 | |
| | | | |
End of period | | | | | | $ | 434,593,573 | | | | | | | $ | 419,974,823 | |
| | | | |
| 1 | Effective for all filings after November 4, 2018, the SEC prospectively eliminated the requirement to parenthetically disclose undistributed net investment income at the end of the period and permitted the aggregation of distributions, with the exception of tax basis returns of capital. Undistributed net investment income at August 31, 2018 was $37,877. The disaggregated distributions information for the year ended August 31, 2018 is included in Note 9,Distributions to Shareholders, in the notes to the financial statements. |
| 2 | For the period from July 31, 2018 (commencement of class operations) to August 31, 2018 |
The accompanying notes are an integral part of these financial statements.
24 | Wells Fargo Short-Term Bond Fund
Financial highlights
(For a share outstanding throughout each period)
| | | | | | | | | | | | | | | | | | | | |
| | | Year ended August 31 | |
| CLASS A | | 2019 | | | 2018 | | | 2017 | | | 2016 | | | 2015 | |
Net asset value, beginning of period | | | $8.65 | | | | $8.77 | | | | $8.78 | | | | $8.77 | | | | $8.82 | |
Net investment income | | | 0.20 | | | | 0.15 | | | | 0.12 | | | | 0.11 | | | | 0.09 | |
Net realized and unrealized gains (losses) on investments | | | 0.19 | | | | (0.12 | ) | | | (0.01 | ) | | | 0.04 | | | | (0.03 | ) |
| | | | | | | | | | | | | | | | | | | | |
Total from investment operations | | | 0.39 | | | | 0.03 | | | | 0.11 | | | | 0.15 | | | | 0.06 | |
Distributions to shareholders from | | | | | | | | | | | | | | | | | | | | |
Net investment income | | | (0.20 | ) | | | (0.15 | ) | | | (0.12 | ) | | | (0.11 | ) | | | (0.09 | ) |
Net realized gains | | | 0.00 | | | | 0.00 | | | | 0.00 | | | | (0.03 | ) | | | (0.02 | ) |
| | | | | | | | | | | | | | | | | | | | |
Total distributions to shareholders | | | (0.20 | ) | | | (0.15 | ) | | | (0.12 | ) | | | (0.14 | ) | | | (0.11 | ) |
Net asset value, end of period | | | $8.84 | | | | $8.65 | | | | $8.77 | | | | $8.78 | | | | $8.77 | |
Total return1 | | | 4.60 | % | | | 0.31 | % | | | 1.25 | % | | | 1.77 | % | | | 0.66 | % |
Ratios to average net assets (annualized) | | | | | | | | | | | | | | | | | | | | |
Gross expenses | | | 0.82 | % | | | 0.82 | % | | | 0.81 | % | | | 0.81 | % | | | 0.80 | % |
Net expenses | | | 0.72 | % | | | 0.72 | % | | | 0.72 | % | | | 0.72 | % | | | 0.74 | % |
Net investment income | | | 2.33 | % | | | 1.68 | % | | | 1.35 | % | | | 1.29 | % | | | 1.00 | % |
Supplemental data | | | | | | | | | | | | | | | | | | | | |
Portfolio turnover rate | | | 43 | % | | | 43 | % | | | 50 | % | | | 59 | % | | | 57 | % |
Net assets, end of period (000s omitted) | | | $170,345 | | | | $182,179 | | | | $225,797 | | | | $278,802 | | | | $65,454 | |
| 1 | Total return calculations do not include any sales charges. |
The accompanying notes are an integral part of these financial statements.
Wells Fargo Short-Term Bond Fund | 25
Financial highlights
(For a share outstanding throughout each period)
| | | | | | | | | | | | | | | | | | | | |
| | | Year ended August 31 | |
| CLASS C | | 2019 | | | 2018 | | | 2017 | | | 2016 | | | 2015 | |
Net asset value, beginning of period | | | $8.64 | | | | $8.76 | | | | $8.77 | | | | $8.76 | | | | $8.81 | |
Net investment income | | | 0.14 | | | | 0.08 | | | | 0.05 | | | | 0.05 | | | | 0.02 | |
Net realized and unrealized gains (losses) on investments | | | 0.19 | | | | (0.12 | ) | | | (0.01 | ) | | | 0.04 | | | | (0.03 | ) |
| | | | | | | | | | | | | | | | | | | | |
Total from investment operations | | | 0.33 | | | | (0.04 | ) | | | 0.04 | | | | 0.09 | | | | (0.01 | ) |
Distributions to shareholders from | | | | | | | | | | | | | | | | | | | | |
Net investment income | | | (0.14 | ) | | | (0.08 | ) | | | (0.05 | ) | | | (0.05 | ) | | | (0.02 | ) |
Net realized gains | | | 0.00 | | | | 0.00 | | | | 0.00 | | | | (0.03 | ) | | | (0.02 | ) |
| | | | | | | | | | | | | | | | | | | | |
Total distributions to shareholders | | | (0.14 | ) | | | (0.08 | ) | | | (0.05 | ) | | | (0.08 | ) | | | (0.04 | ) |
Net asset value, end of period | | | $8.83 | | | | $8.64 | | | | $8.76 | | | | $8.77 | | | | $8.76 | |
Total return1 | | | 3.82 | % | | | (0.44 | )% | | | 0.49 | % | | | 1.01 | % | | | (0.09 | )% |
Ratios to average net assets (annualized) | | | | | | | | | | | | | | | | | | | | |
Gross expenses | | | 1.57 | % | | | 1.57 | % | | | 1.56 | % | | | 1.56 | % | | | 1.55 | % |
Net expenses | | | 1.47 | % | | | 1.47 | % | | | 1.47 | % | | | 1.47 | % | | | 1.49 | % |
Net investment income | | | 1.57 | % | | | 0.93 | % | | | 0.61 | % | | | 0.53 | % | | | 0.25 | % |
Supplemental data | | | | | | | | | | | | | | | | | | | | |
Portfolio turnover rate | | | 43 | % | | | 43 | % | | | 50 | % | | | 59 | % | | | 57 | % |
Net assets, end of period (000s omitted) | | | $7,146 | | | | $8,588 | | | | $11,361 | | | | $14,204 | | | | $11,508 | |
| 1 | Total return calculations do not include any sales charges. |
The accompanying notes are an integral part of these financial statements.
26 | Wells Fargo Short-Term Bond Fund
Financial highlights
(For a share outstanding throughout each period)
| | | | | | | | |
| | | Year ended August 31 | |
| CLASS R6 | | 2019 | | | 20181 | |
Net asset value, beginning of period | | | $8.66 | | | | $8.64 | |
Net investment income | | | 0.23 | | | | 0.02 | 2 |
Net realized and unrealized gains (losses) on investments | | | 0.17 | | | | 0.02 | |
| | | | | | | | |
Total from investment operations | | | 0.40 | | | | 0.04 | |
Distributions to shareholders from | | | | | | | | |
Net investment income | | | (0.23 | ) | | | (0.02 | ) |
Net asset value, end of period | | | $8.83 | | | | $8.66 | |
Total return3 | | | 4.69 | % | | | 0.42 | % |
Ratios to average net assets (annualized) | | | | | | | | |
Gross expenses | | | 0.44 | % | | | 0.44 | % |
Net expenses | | | 0.40 | % | | | 0.40 | % |
Net investment income | | | 2.71 | % | | | 2.24 | % |
Supplemental data | | | | | | | | |
Portfolio turnover rate | | | 43 | % | | | 43 | % |
Net assets, end of period (000s omitted) | | | $30,585 | | | | $2,553 | |
| 1 | For the period from July 31, 2018 (commencement of class operations) to August 31, 2018 |
| 2 | Calculated based upon average shares outstanding |
| 3 | Returns for periods of less than one year are not annualized. |
The accompanying notes are an integral part of these financial statements.
Wells Fargo Short-Term Bond Fund | 27
Financial highlights
(For a share outstanding throughout each period)
| | | | | | | | | | | | | | | | | | | | |
| | | Year ended August 31 | |
| INSTITUTIONAL CLASS | | 2019 | | | 2018 | | | 2017 | | | 2016 | | | 2015 | |
Net asset value, beginning of period | | | $8.65 | | | | $8.78 | | | | $8.79 | | | | $8.77 | | | | $8.83 | |
Net investment income | | | 0.23 | | | | 0.17 | | | | 0.14 | | | | 0.13 | | | | 0.11 | |
Net realized and unrealized gains (losses) on investments | | | 0.19 | | | | (0.13 | ) | | | (0.01 | ) | | | 0.05 | | | | (0.04 | ) |
| | | | | | | | | | | | | | | | | | | | |
Total from investment operations | | | 0.42 | | | | 0.04 | | | | 0.13 | | | | 0.18 | | | | 0.07 | |
Distributions to shareholders from | | | | | | | | | | | | | | | | | | | | |
Net investment income | | | (0.23 | ) | | | (0.17 | ) | | | (0.14 | ) | | | (0.13 | ) | | | (0.11 | ) |
Net realized gains | | | 0.00 | | | | 0.00 | | | | 0.00 | | | | (0.03 | ) | | | (0.02 | ) |
| | | | | | | | | | | | | | | | | | | | |
Total distributions to shareholders | | | (0.23 | ) | | | (0.17 | ) | | | (0.14 | ) | | | (0.16 | ) | | | (0.13 | ) |
Net asset value, end of period | | | $8.84 | | | | $8.65 | | | | $8.78 | | | | $8.79 | | | | $8.77 | |
Total return | | | 4.88 | % | | | 0.46 | % | | | 1.49 | % | | | 2.14 | % | | | 0.82 | % |
Ratios to average net assets (annualized) | | | | | | | | | | | | | | | | | | | | |
Gross expenses | | | 0.49 | % | | | 0.49 | % | | | 0.48 | % | | | 0.48 | % | | | 0.47 | % |
Net expenses | | | 0.45 | % | | | 0.46 | % | | | 0.48 | % | | | 0.48 | % | | | 0.47 | % |
Net investment income | | | 2.60 | % | | | 1.95 | % | | | 1.59 | % | | | 1.51 | % | | | 1.26 | % |
Supplemental data | | | | | | | | | | | | | | | | | | | | |
Portfolio turnover rate | | | 43 | % | | | 43 | % | | | 50 | % | | | 59 | % | | | 57 | % |
Net assets, end of period (000s omitted) | | | $226,517 | | | | $226,655 | | | | $230,549 | | | | $252,961 | | | | $306,832 | |
The accompanying notes are an integral part of these financial statements.
28 | Wells Fargo Short-Term Bond Fund
Notes to financial statements
1. ORGANIZATION
Wells Fargo Funds Trust (the “Trust”), a Delaware statutory trust organized on March 10, 1999, is anopen-end management investment company registered under the Investment Company Act of 1940, as amended (the “1940 Act”). As an investment company, the Trust follows the accounting and reporting guidance in Financial Accounting Standards Board (“FASB”)Accounting Standards Codification Topic 946, Financial Services – Investment Companies. These financial statements report on the Wells Fargo Short-Term Bond Fund (the “Fund”) which is a diversified series of the Trust.
2. SIGNIFICANT ACCOUNTING POLICIES
The following significant accounting policies, which are consistently followed in the preparation of the financial statements of the Fund, are in conformity with U.S. generally accepted accounting principles which require management to make estimates and assumptions that affect the reported amounts of assets and liabilities, disclosure of contingent assets and liabilities at the date of the financial statements, and the reported amounts of revenues and expenses during the reporting period. Actual results could differ from those estimates.
Securities valuation
All investments are valued each business day as of the close of regular trading on the New York Stock Exchange (generally 4 p.m. Eastern Time), although the Fund may deviate from this calculation time under unusual or unexpected circumstances.
Debt securities are valued at the evaluated bid price provided by an independent pricing service (e.g. taking into account various factors, including yields, maturities, or credit ratings) or, if a reliable price is not available, the quoted bid price from an independent broker-dealer.
Futures contracts that are listed on a foreign or domestic exchange or market are valued at the official closing price or, if none, the last sales price.
Investments in registeredopen-end investment companies are valued at net asset value. Interests innon-registered investment companies that are redeemable at net asset value are fair valued normally at net asset value.
Investments which are not valued using any of the methods discussed above are valued at their fair value, as determined in good faith by the Board of Trustees of the Fund. The Board of Trustees has established a Valuation Committee comprised of the Trustees and has delegated to it the authority to take any actions regarding the valuation of portfolio securities that the Valuation Committee deems necessary or appropriate, including determining the fair value of portfolio securities, unless the determination has been delegated to the Wells Fargo Asset Management Pricing Committee at Wells Fargo Funds Management, LLC (“Funds Management”). The Board of Trustees retains the authority to make or ratify any valuation decisions or approve any changes to the Valuation Procedures as it deems appropriate. On a quarterly basis, the Board of Trustees receives reports on any valuation actions taken by the Valuation Committee or the Wells Fargo Asset Management Pricing Committee which may include items for ratification.
Securities lending
The Fund may lend its securities from time to time in order to earn additional income in the form of fees or interest on securities received as collateral or the investment of any cash received as collateral. When securities are on loan, the Fund receives interest or dividends on those securities. Cash collateral received in connection with its securities lending transactions is invested in Securities Lending Cash Investments, LLC (the “Securities Lending Fund”). Investments in Securities Lending Fund are valued at the evaluated bid price provided by an independent pricing service. Income earned from investment in the Securities Lending Fund (net of fees and rebates), if any, is included in income from affiliated securities on the Statement of Operations.
In a securities lending transaction, the net asset value of the Fund will be affected by an increase or decrease in the value of the securities loaned and by an increase or decrease in the value of the instrument in which collateral is invested. The amount of securities lending activity undertaken by the Fund fluctuates from time to time. The Fund has the right under the lending agreement to recover the securities from the borrower on demand. In the event of default or bankruptcy by the borrower, the Fund may be prevented from recovering the loaned securities or gaining access to the collateral or may experience delays or costs in doing so. In such an event, the terms of the agreement allows the unaffiliated securities lending agent to use the collateral to purchase replacement securities on behalf of the Fund or pay the Fund the market value of the loaned securities. The Fund will bear the risk of loss with respect to depreciation of its investment of the cash collateral.
Futures contracts
Futures contracts are agreements between the Fund and a counterparty to buy or sell a specific amount of a commodity, financial instrument or currency at a specified price and on a specified date. The Fund may buy and sell futures contracts in order to gain exposure to, or protect against, changes in interest rates and is subject to interest rate risk. The primary risks
Wells Fargo Short-Term Bond Fund | 29
Notes to financial statements
associated with the use of futures contracts are the imperfect correlation between changes in market values of securities held by the Fund and the prices of futures contracts, and the possibility of an illiquid market. Futures contracts are generally entered into on a regulated futures exchange and cleared through a clearinghouse associated with the exchange. With futures contracts, there is minimal counterparty risk to the Fund since futures contracts are exchange traded and the exchange’s clearinghouse, as the counterparty to all exchange traded futures, guarantees the futures contracts against default.
Upon entering into a futures contracts, the Fund is required to deposit either cash or securities (initial margin) with the broker in an amount equal to a certain percentage of the contract value. Subsequent payments (variation margin) are paid to or from the broker each day equal to the daily changes in the contract value. Such payments are recorded as unrealized gains or losses and, if any, shown as variation margin receivable (payable) in the Statement of Assets and Liabilities. Should the Fund fail to make requested variation margin payments, the broker can gain access to the initial margin to satisfy the Fund’s payment obligations. When the contracts are closed, a realized gain or loss is recorded in the Statement of Operations.
Security transactions and income recognition
Securities transactions are recorded on a trade date basis. Realized gains or losses are recorded on the basis of identified cost.
Interest income is accrued daily and bond discounts are accreted and premiums are amortized daily. To the extent debt obligations are placed onnon-accrual status, any related interest income may be reduced by writing off interest receivables when the collection of all or a portion of interest has been determined to be doubtful based on consistently applied procedures and the fair value has decreased. If the issuer subsequently resumes interest payments or when the collectability of interest is reasonably assured, the debt obligation is removed fromnon-accrual status.
Distributions to shareholders
Distributions to shareholders from net investment income are declared daily and paid monthly. Distributions from net realized gains, if any, are recorded on theex-dividend date and paid at least annually. Such distributions are determined in accordance with income tax regulations and may differ from U.S. generally accepted accounting principles. Dividend sources are estimated at the time of declaration. The tax character of distributions is determined as of the Fund’s fiscal year end. Therefore, a portion of the Fund’s distributions made prior to the Fund’s fiscal year end may be categorized as a tax return of capital at year end.
Federal and other taxes
The Fund intends to continue to qualify as a regulated investment company by distributing substantially all of its investment company taxable income and any net realized capital gains (after reduction for capital loss carryforwards) sufficient to relieve it from all, or substantially all, federal income taxes. Accordingly, no provision for federal income taxes was required.
The Fund’s income and federal excise tax returns and all financial records supporting those returns for the prior three fiscal years are subject to examination by the federal and Delaware revenue authorities. Management has analyzed the Fund’s tax positions taken on federal, state, and foreign tax returns for all open tax years and does not believe that there are any uncertain tax positions that require recognition of a tax liability.
As of August 31, 2019, the aggregate cost of all investments for federal income tax purposes was $426,950,764 and the unrealized gains (losses) consisted of:
| | | | |
| |
Gross unrealized gains | | $ | 5,667,338 | |
| |
Gross unrealized losses | | | (331,505 | ) |
| |
Net unrealized gains | | $ | 5,335,833 | |
As of August 31, 2019, the Fund had capital loss carryforwards which consist of $209,263 in short-term capital losses and $1,720,034 in long-term capital losses.
Class allocations
The separate classes of shares offered by the Fund differ principally in applicable sales charges, distribution, shareholder servicing, and administration fees. Class specific expenses are charged directly to that share class. Investment income, common fund-level expenses, and realized and unrealized gains (losses) on investments are allocated daily to each class of shares based on the relative proportion of net assets of each class.
30 | Wells Fargo Short-Term Bond Fund
Notes to financial statements
3. FAIR VALUATION MEASUREMENTS
Fair value measurements of investments are determined within a framework that has established a fair value hierarchy based upon the various data inputs utilized in determining the value of the Fund’s investments. The three-level hierarchy gives the highest priority to unadjusted quoted prices in active markets for identical assets or liabilities (Level 1) and the lowest priority to unobservable inputs (Level 3). The Fund’s investments are classified within the fair value hierarchy based on the lowest level of input that is significant to the fair value measurement. The inputs are summarized into three broad levels as follows:
| ∎ | | Level 1 – quoted prices in active markets for identical securities |
| ∎ | | Level 2 – other significant observable inputs (including quoted prices for similar securities, interest rates, prepayment speeds, credit risk, etc.) |
| ∎ | | Level 3 – significant unobservable inputs (including the Fund’s own assumptions in determining the fair value of investments) |
The inputs or methodologies used for valuing investments in securities are not necessarily an indication of the risk associated with investing in those securities.
The following is a summary of the inputs used in valuing the Fund’s assets and liabilities as of August 31, 2019:
| | | | | | | | | | | | | | | | |
| | | | |
| | | Quoted prices
(Level 1) | | | Other significant
observable inputs
(Level 2) | | | Significant
unobservable inputs (Level 3) | | | Total | |
| | | | |
Assets | | | | | | | | | | | | | | | | |
Investments in: | | | | | | | | | | | | | | | | |
| | | | |
Agency securities | | $ | 0 | | | $ | 19,372,467 | | | $ | 0 | | | $ | 19,372,467 | |
| | | | |
Asset-backed securities | | | 0 | | | | 52,620,358 | | | | 0 | | | | 52,620,358 | |
| | | | |
Corporate bonds and notes | | | 0 | | | | 180,745,967 | | | | 0 | | | | 180,745,967 | |
| | | | |
Municipal obligations | | | 0 | | | | 6,107,971 | | | | 0 | | | | 6,107,971 | |
| | | | |
Non-agency mortgage-backed securities | | | 0 | | | | 91,946,542 | | | | 0 | | | | 91,946,542 | |
| | | | |
U.S. Treasury securities | | | 1,581,271 | | | | 0 | | | | 0 | | | | 1,581,271 | |
| | | | |
Yankee corporate bonds and notes | | | 0 | | | | 67,812,482 | | | | 0 | | | | 67,812,482 | |
| | | | |
Short-term investments | | | | | | | | | | | | | | | | |
| | | | |
Investment companies | | | 11,243,676 | | | | 0 | | | | 0 | | | | 11,243,676 | |
| | | | |
U.S. Treasury securities | | | 624,709 | | | | 0 | | | | 0 | | | | 624,709 | |
| | | | |
| | | 13,449,656 | | | | 418,605,787 | | | | 0 | | | | 432,055,443 | |
| | | | |
Futures contracts | | | 231,154 | | | | 0 | | | | 0 | | | | 231,154 | |
| | | | |
Total assets | | $ | 13,680,810 | | | $ | 418,605,787 | | | $ | 0 | | | $ | 432,286,597 | |
Additional sector, industry or geographic detail is included in the Portfolio of Investments.
Futures contracts are reported at their cumulative unrealized gains (losses) at measurement date as reported in the table following the Portfolio of Investments. For futures contracts, the current day’s variation margin is reported on the Statement of Assets and Liabilities. All other assets and liabilities are reported at their market value at measurement date.
For the year ended August 31, 2019, the Fund did not have any transfers into/out of Level 3.
4. TRANSACTIONS WITH AFFILIATES
Management fee
Funds Management, an indirect wholly owned subsidiary of Wells Fargo & Company (“Wells Fargo”), is the manager of the Fund and provides advisory and fund-level administrative services under an investment management agreement. Under the investment management agreement, Funds Management is responsible for, among other services, implementing the investment objectives and strategies of the Fund, supervising the subadviser and providing fund-level administrative services in
Wells Fargo Short-Term Bond Fund | 31
Notes to financial statements
connection with the Fund’s operations. As compensation for its services under the investment management agreement, Funds Management is entitled to receive a management fee at the following annual rate based on the Fund’s average daily net assets:
| | |
| |
| Average daily net assets | | Management fee |
| |
First $1 billion | | 0.350% |
| |
Next $4 billion | | 0.325 |
| |
Next $3 billion | | 0.290 |
| |
Next $2 billion | | 0.265 |
| |
Over $10 billion | | 0.255 |
For the year ended August 31, 2019, the management fee was equivalent to an annual rate of 0.35% of the Fund’s average daily net assets.
Funds Management has retained the services of a subadviser to provide daily portfolio management to the Fund. The fee for subadvisory services is borne by Funds Management. Wells Capital Management Incorporated (“WellsCap”), an affiliate of Funds Management and an indirect wholly owned subsidiary of Wells Fargo, is the subadviser to the Fund and is entitled to receive a fee from Funds Management at an annual rate starting at 0.15% and declining to 0.05% as the average daily net assets of the Fund increase.
Administration fees
Under a class-level administration agreement, Funds Management provides class-level administrative services to the Fund, which includes paying fees and expenses for services provided by the transfer agent,sub-transfer agents, omnibus account servicers and record-keepers. As compensation for its services under the class-level administration agreement, Funds Management receives an annual fee which is calculated based on the average daily net assets of each class as follows:
| | | | |
| |
| | | Class-level
administration fee | |
| |
Class A, Class C | | | 0.16 | % |
| |
Class R6 | | | 0.03 | |
| |
Institutional Class | | | 0.08 | |
Waivers and/or expense reimbursements
Funds Management has contractually waived and/or reimbursed management and administration fees to the extent necessary to maintain certain net operating expense ratios for the Fund. When each class of the Fund has exceeded its expense cap, Funds Management has waived fees and/or reimbursed expenses from fund-level expenses on a proportionate basis and then from class specific expenses. When only certain classes exceed their expense caps, waivers and/or reimbursements are applied against class specific expenses before fund-level expenses. Funds Management has committed through December 31, 2019 to waive fees and/or reimburse expenses to the extent necessary to cap the Fund’s expenses at 0.72% for Class A shares, 1.47% for Class C shares, 0.40% for Class R6 shares, and 0.45% for Institutional Class shares. Prior to or after the commitment expiration date, the cap may be increased or the commitment to maintain the cap may be terminated only with the approval of the Board of Trustees.
Distribution fee
The Trust has adopted a distribution plan for Class C shares of the Fund pursuant to Rule12b-1 under the 1940 Act. A distribution fee is charged to Class C shares and paid to Wells Fargo Funds Distributor, LLC (“Funds Distributor”), the principal underwriter, at an annual rate of 0.75% of the average daily net assets of Class C shares.
In addition, Funds Distributor is entitled to receive thefront-end sales charge from the purchase of Class A shares and a contingent deferred sales charge on the redemption of certain Class A shares. Funds Distributor is also entitled to receive the contingent deferred sales charges from redemptions of Class C shares. For the year ended August 31, 2019, Funds Distributor received $311 from the sale of Class A shares. No contingent deferred sales charges were incurred by Class A and Class C shares for the year ended August 31, 2019.
Shareholder servicing fees
The Trust has entered into contracts with one or more shareholder servicing agents, whereby Class A and Class C of the Fund are charged a fee at an annual rate of 0.25% of the average daily net assets of each respective class. A portion of these total shareholder servicing fees were paid to affiliates of Wells Fargo.
32 | Wells Fargo Short-Term Bond Fund
Notes to financial statements
Interfund transactions
The Fund may purchase or sell portfolio investment securities to certain other Wells Fargo affiliates pursuant to Rule17a-7 under the 1940 Act and under procedures adopted by the Board of Trustees. The procedures have been designed to ensure that these interfund transactions, which do not incur broker commissions, are effected at current market prices.
5. INVESTMENT PORTFOLIO TRANSACTIONS
Purchases and sales of investments, excluding short-term securities, for the year ended August 31, 2019 were as follows:
| | | | | | |
Purchases at cost | | Sales proceeds |
U.S.
government | | Non-U.S.
government | | U.S.
government | | Non-U.S.
government |
| $6,653,434 | | $249,441,965 | | $4,313,219 | | $167,541,977 |
6. SECURITIES LENDING TRANSACTIONS
The Fund lends its securities through an unaffiliated securities lending agent and receives collateral in the form of cash or securities with a value at least equal to the value of the securities on loan. The value of the loaned securities is determined at the close of each business day and any increases or decreases in the required collateral are exchanged between the Fund and the counterparty on the next business day. Cash collateral received is invested in the Securities Lending Fund which seeks to provide a positive return compared to the daily Fed Funds Open Rate by investing in high-quality, U.S. dollar-denominated short-term money market instruments and is exempt from registration under Section 3(c)(7) of the 1940 Act. Securities Lending Fund is managed by Funds Management and is subadvised by WellsCap. Funds Management receives an advisory fee starting at 0.05% and declining to 0.01% as the average daily net assets of the Securities Lending Fund increase. All of the fees received by Funds Management are paid to WellsCap for its services as subadviser.
In the event of counterparty default or the failure of a borrower to return a loaned security, the Fund has the right to use the collateral to offset any losses incurred. As of August 31, 2019, the Fund had securities lending transactions with the following counterparties which are subject to offset:
| | | | | | | | |
| | | |
| Counterparty | | Value of
securities on
loan | | Collateral
received1 | | Net amount | |
| | | |
Barclays Capital Inc. | | $1,259,598 | | $(1,259,598) | | $ | 0 | |
| 1 | Collateral received within this table is limited to the collateral for the net transaction with the counterparty. |
7. DERIVATIVE TRANSACTIONS
During the year ended August 31, 2019, the Fund entered into futures contracts to speculate on interest rates and to help manage the duration of the portfolio. The Fund had an average notional amount of $170,819,980 in long futures contracts and $29,364,082 in short futures contracts during the year ended August 31, 2019.
The fair value, realized gains or losses and change in unrealized gains or losses, if any, on derivative instruments are reflected in the corresponding financial statement captions.
8. BANK BORROWINGS
The Trust (excluding the money market funds), Wells Fargo Master Trust and Wells Fargo Variable Trust are parties to a $280,000,000 revolving credit agreement whereby the Fund is permitted to use bank borrowings for temporary or emergency purposes, such as to fund shareholder redemption requests. Interest under the credit agreement is charged to the Fund based on a borrowing rate equal to the higher of the Federal Funds rate in effect on that day plus 1.25% or the overnight LIBOR rate in effect on that day plus 1.25%. In addition, an annual commitment fee equal to 0.25% of the unused balance is allocated to each participating fund.
For the year ended August 31, 2019, there were no borrowings by the Fund under the agreement.
9. DISTRIBUTIONS TO SHAREHOLDERS
The tax character of distributions paid was $10,470,347 and $8,090,467 of ordinary income for the years ended August 31, 2019 and August 31, 2018, respectively.
Wells Fargo Short-Term Bond Fund | 33
Notes to financial statements
As of August 31, 2019, the components of distributable earnings on a tax basis were as follows:
| | | | |
Undistributed
ordinary
income | | Unrealized
gains | | Capital loss
carryforward |
| | |
| $371,836 | | $5,335,833 | | $(1,929,297) |
Effective for all filings after November 4, 2018, the Securities and Exchange Commission eliminated the requirement to separately state the components of distributions to shareholders under U.S. generally accepted accounting principles. The amounts of distributions to shareholders for the year ended August 31, 2018 were as follows:
| | | | |
| |
| | | Net investment
income | |
| |
Class A | | | $3,469,175 | |
| |
Class C | | | 90,525 | |
| |
Class R6 | | | 4,529 | 1 |
| |
Institutional Class | | | 4,526,238 | |
| 1 | For the period from July 31, 2018 (commencement of class operations) to August 31, 2018. |
10. INDEMNIFICATION
Under the Trust’s organizational documents, the officers and Trustees have been granted certain indemnification rights against certain liabilities that may arise out of performance of their duties to the Trust. Additionally, in the normal course of business, the Trust may enter into contracts with service providers that contain a variety of indemnification clauses. The Trust’s maximum exposure under these arrangements is dependent on future claims that may be made against the Fund and, therefore, cannot be estimated.
11. NEW ACCOUNTING PRONOUNCEMENTS
In August 2018, FASB issued Accounting Standards Update (“ASU”)No. 2018-13, Fair Value Measurement (Topic 820)Disclosure Framework—Changes to the Disclosure Requirements for Fair Value Measurement. ASU2018-13 updates the disclosure requirements for fair value measurements by modifying or removing certain disclosures and adding certain new disclosures. The amendments are effective for fiscal years, and interim periods within those fiscal years, beginning after December 15, 2019. Early adoption is permitted. Management has adopted the removal and modification of disclosures early, as permitted, and will adopt the additional new disclosures at the effective date.
In March 2017, FASB issued ASUNo. 2017-08,Premium Amortization on Purchased Callable Debt Securities. ASU2017-08
shortens the amortization period for certain callable debt securities held at a premium and requires the premium to be amortized to the earliest call date. The amendments do not require an accounting change for securities held at a discount and discounts will continue to be accreted to the maturity date of the security. ASU2017-08 is effective for fiscal years beginning after December 15, 2018 and for interim periods within those fiscal years. During the current reporting period, management of the Fund adopted the change in accounting policy which did not have a material impact to the Fund’s financial statements.
34 | Wells Fargo Short-Term Bond Fund
Report of independent registered public accounting firm
TO THE SHAREHOLDERS OF THE FUND AND BOARD OF TRUSTEES OF WELLS FARGO FUNDS TRUST:
Opinion on the Financial Statements
We have audited the accompanying statement of assets and liabilities of Wells Fargo Short-Term Bond Fund (the Fund), one of the funds constituting Wells Fargo Funds Trust, including the portfolio of investments, as of August 31, 2019, the related statement of operations for the year then ended, the statements of changes in net assets for each of the years in the two-year period then ended, and the related notes (collectively, the financial statements) and the financial highlights for each of the years or periods in the five-year period then ended. In our opinion, the financial statements and financial highlights present fairly, in all material respects, the financial position of the Fund as of August 31, 2019, the results of its operations for the year then ended, the changes in its net assets for each of the years in the two-year period then ended, and the financial highlights for each of the years or periods in the five-year period then ended, in conformity with U.S. generally accepted accounting principles.
Basis for Opinion
These financial statements and financial highlights are the responsibility of the Fund’s management. Our responsibility is to express an opinion on these financial statements and financial highlights based on our audits. We are a public accounting firm registered with the Public Company Accounting Oversight Board (United States) (PCAOB) and are required to be independent with respect to the Fund in accordance with the U.S. federal securities laws and the applicable rules and regulations of the Securities and Exchange Commission and the PCAOB.
We conducted our audits in accordance with the standards of the PCAOB. Those standards require that we plan and perform the audit to obtain reasonable assurance about whether the financial statements and financial highlights are free of material misstatement, whether due to error or fraud. Our audits included performing procedures to assess the risks of material misstatement of the financial statements and financial highlights, whether due to error or fraud, and performing procedures that respond to those risks. Such procedures included examining, on a test basis, evidence regarding the amounts and disclosures in the financial statements and financial highlights. Such procedures also included confirmation of securities owned as of August 31, 2019, by correspondence with the custodian, transfer agent and brokers. Our audits also included evaluating the accounting principles used and significant estimates made by management, as well as evaluating the overall presentation of the financial statements and financial highlights. We believe that our audits provide a reasonable basis for our opinion.

We have not been able to determine the specific year that we began serving as the auditor of one or more Wells Fargo Funds investment companies; however we are aware that we have served as the auditor of one or more Wells Fargo Funds investment companies since at least 1955.
Boston, Massachusetts
October 28, 2019
Wells Fargo Short-Term Bond Fund | 35
Other information (unaudited)
TAX INFORMATION
For the fiscal year ended August 31, 2019, $8,156,126 has been designated as interest-related dividends for nonresident alien shareholders pursuant to Section 871 of the Internal Revenue Code.
PROXY VOTING INFORMATION
A description of the policies and procedures used to determine how to vote proxies relating to portfolio securities is available, upon request, by calling1-800-222-8222, visiting our website atwfam.com, or visiting the SEC website at sec.gov. Information regarding how the proxies related to portfolio securities were voted during the most recent12-month period ended June 30 is available on the website atwfam.comor by visiting the SEC website at sec.gov.
QUARTERLY PORTFOLIO HOLDINGS INFORMATION
The Fund files its complete schedule of portfolio holdings with the SEC for the first and third quarters of each fiscal year on Form N-Q or FormN-PORT, which is available by visiting the SEC website at sec.gov. Those forms may be reviewed and copied at the SEC’s Public Reference Room in Washington, DC. Information on the operation of the Public Reference Room may be obtained by calling1-800-SEC-0330.
36 | Wells Fargo Short-Term Bond Fund
Other information (unaudited)
BOARD OF TRUSTEES AND OFFICERS
Each of the Trustees and Officers1 listed in the table below acts in identical capacities for each fund in the Wells Fargo family of funds, which consists of 152 mutual funds comprising the Wells Fargo Funds Trust, Wells Fargo Variable Trust, Wells Fargo Master Trust and fourclosed-end funds (collectively the “Fund Complex”). This table should be read in conjunction with the Prospectus and the Statement of Additional Information2. The mailing address of each Trustee and Officer is 525 Market Street, 12th Floor, San Francisco, CA 94105. Each Trustee and Officer serves an indefinite term, however, each Trustee serves such term until reaching the mandatory retirement age established by the Trustees.
Independent Trustees
| | | | | | |
Name and year of birth | | Position held and
length of service* | | Principal occupations during past five years or longer | | Current other
public company or
investment
company
directorships |
| | | |
| William R. Ebsworth (Born 1957) | | Trustee, since 2015 | | Retired. From 1984 to 2013, equities analyst, portfolio manager, research director and chief investment officer at Fidelity Management and Research Company in Boston, Tokyo, and Hong Kong, and retired in 2013 as Chief Investment Officer of Fidelity Strategic Advisers, Inc. where he led a team of investment professionals managing client assets. Prior thereto, Board member of Hong Kong Securities Clearing Co., Hong Kong Options Clearing Corp., the Thailand International Fund, Ltd., Fidelity Investments Life Insurance Company, and Empire Fidelity Investments Life Insurance Company. Audit Committee Chair and Investment Committee Chair of the Vincent Memorial Hospital Endowment(non-profit organization). Mr. Ebsworth is a CFA® charterholder. | | N/A |
| | | |
| Jane A. Freeman (Born 1953) | | Trustee, since 2015; Chair Liaison, since 2018 | | Retired. From 2012 to 2014 and 1999 to 2008, Chief Financial Officer of Scientific Learning Corporation. From 2008 to 2012, Ms. Freeman provided consulting services related to strategic business projects. Prior to 1999, Portfolio Manager at Rockefeller & Co. and Scudder, Stevens & Clark. Board member of the Harding Loevner Funds from 1996 to 2014, serving as both Lead Independent Director and chair of the Audit Committee. Board member of the Russell Exchange Traded Funds Trust from 2011 to 2012 and the chair of the Audit Committee. Ms. Freeman is a Board Member of The Ruth Bancroft Garden(non-profit organization). She is also an inactive Chartered Financial Analyst. | | N/A |
| | | |
| Isaiah Harris, Jr. (Born 1952) | | Trustee, since 2009;
Audit Committee Chairman, since 2019 | | Retired. Chairman of the Board of CIGNA Corporation since 2009, and Director since 2005. From 2003 to 2011, Director of Deluxe Corporation. Prior thereto, President and CEO of BellSouth Advertising and Publishing Corp. from 2005 to 2007, President and CEO of BellSouth Enterprises from 2004 to 2005 and President of BellSouth Consumer Services from 2000 to 2003. Emeritus member of the Iowa State University Foundation Board of Governors. Emeritus Member of the Advisory Board of Iowa State University School of Business. Advisory Board Member, Palm Harbor Academy (private school). Advisory Board Member, Child Evangelism Fellowship(non-profit). Mr. Harris is a certified public accountant (inactive status). | | CIGNA Corporation |
| | | |
| Judith M. Johnson (Born 1949) | | Trustee, since 2008;
Audit Committee Chairman, from 2009 to 2018 | | Retired. Prior thereto, Chief Executive Officer and Chief Investment Officer of Minneapolis Employees Retirement Fund from 1996 to 2008. Ms. Johnson is an attorney, certified public accountant and a certified managerial accountant. | | N/A |
Wells Fargo Short-Term Bond Fund | 37
Other information (unaudited)
| | | | | | |
Name and year of birth | | Position held and
length of service* | | Principal occupations during past five years or longer | | Current other
public company or
investment
company
directorships |
| | | |
| David F. Larcker (Born 1950) | | Trustee, since 2009 | | James Irvin Miller Professor of Accounting at the Graduate School of Business, Stanford University, Director of the Corporate Governance Research Initiative and Senior Faculty of The Rock Center for Corporate Governance since 2006. From 2005 to 2008, Professor of Accounting at the Graduate School of Business, Stanford University. Prior thereto, Ernst & Young Professor of Accounting at The Wharton School, University of Pennsylvania from 1985 to 2005. | | N/A |
| | | |
| Olivia S. Mitchell (Born 1953) | | Trustee, since 2006; Nominating and Governance Committee Chairman, since 2018 | | International Foundation of Employee Benefit Plans Professor, Wharton School of the University of Pennsylvania since 1993. Director of Wharton’s Pension Research Council and Boettner Center on Pensions & Retirement Research, and Research Associate at the National Bureau of Economic Research. Previously, Cornell University Professor from 1978 to 1993. | | N/A |
| | | |
| Timothy J. Penny (Born 1951) | | Trustee, since 1996; Chairman, since 2018 | | President and Chief Executive Officer of Southern Minnesota Initiative Foundation, anon-profit organization, since 2007. Member of the Board of Trustees of NorthStar Education Finance, Inc., anon-profit organization, since 2007. | | N/A |
| | | |
| James G. Polisson (Born 1959) | | Trustee, since 2018 | | Retired. Chief Marketing Officer, Source (ETF) UK Services, Ltd, from 2015 to 2017. From 2012 to 2015, Principal of The Polisson Group, LLC, a management consulting, corporate advisory and principal investing company. Chief Executive Officer and Managing Director at Russell Investments, Global Exchange Traded Funds from 2010 to 2012. Managing Director of Barclays Global Investors from 1998 to 2010 and Global Chief Marketing Officer for iShares and Barclays Global Investors from 2000 to 2010. Trustee of the San Francisco Mechanics’ Institute, anon-profit organization, from 2013 to 2015. Board member of the Russell Exchange Traded Fund Trust from 2011 to 2012. Director of Barclays Global Investors Holdings Deutschland GmbH from 2006 to 2009. Mr. Polisson is an attorney and has a retired status with the Massachusetts and District of Columbia Bar Associations. | | N/A |
| * | Length of service dates reflect the Trustee’s commencement of service with the Trust’s predecessor entities, where applicable. |
38 | Wells Fargo Short-Term Bond Fund
Other information (unaudited)
Officers
| | | | |
Name and
year of birth | | Position held and
length of service | | Principal occupations during past five years or longer |
| | |
| Andrew Owen (Born 1960) | | President, since 2017 | | Executive Vice President of Wells Fargo & Company and Head of Affiliated Managers, Wells Fargo Asset Management, since 2014. In addition, Mr. Owen is currently President, Chief Executive Officer and Director of Wells Fargo Funds Management, LLC since 2017. Prior thereto, Executive Vice President responsible for marketing, investments and product development for Wells Fargo Funds Management, LLC, from 2009 to 2014. |
| | |
| Nancy Wiser1 (Born 1967) | | Treasurer, since 2012 | | Executive Vice President of Wells Fargo Funds Management, LLC since 2011. Chief Operating Officer and Chief Compliance Officer at LightBox Capital Management LLC, from 2008 to 2011. |
| | |
Michelle Rhee3
(Born 1966) | | Chief Legal Officer, since 2019 | | Secretary of Wells Fargo Funds Management, LLC, Chief Legal Counsel of Wells Fargo Asset Management and Assistant General Counsel of Wells Fargo Bank, N.A. since 2018. Associate General Counsel and Managing Director of Bank of America Corporation from 2004 to 2018. |
| | |
Catherine Kennedy4
(Born 1969) | | Secretary, since 2019 | | Vice President of Wells Fargo Funds Management, LLC and Senior Counsel of the Wells Fargo Legal Department since 2010. Vice President and Senior Counsel of Evergreen Investment Management Company, LLC from 1998 to 2010. |
| | |
| Michael H. Whitaker(Born 1967) | | Chief Compliance Officer, since 2016 | | Chief Compliance Officer of Wells Fargo Asset Management since 2016. Senior Vice President and Chief Compliance Officer for Fidelity Investments from 2007 to 2016. |
| | |
David Berardi (Born 1975) | | Assistant Treasurer, since 2009 | | Vice President of Wells Fargo Funds Management, LLC since 2009. Vice President of Evergreen Investment Management Company, LLC from 2008 to 2010. Manager of Fund Reporting and Control for Evergreen Investment Management Company, LLC from 2004 to 2010. |
| | |
| Jeremy DePalma1 (Born 1974) | | Assistant Treasurer, since 2009 | | Senior Vice President of Wells Fargo Funds Management, LLC since 2009. Senior Vice President of Evergreen Investment Management Company, LLC from 2008 to 2010 and head of the Fund Reporting and Control Team within Fund Administration from 2005 to 2010. |
| 1 | Nancy Wiser acts as Treasurer of 65 funds in the Fund Complex. Jeremy DePalma acts as Treasurer of 87 funds and Assistant Treasurer of 65 funds in the Fund Complex. |
| 2 | The Statement of Additional Information includes additional information about the Trustees and is available, without charge, upon request, by calling1-800-222-8222 or by visiting the website atwfam.com. |
| 3 | Michelle Rhee became Chief Legal Officer effective October 22, 2019. |
| 4 | Catherine Kennedy became Secretary effective October 22, 2019. |
Wells Fargo Short-Term Bond Fund | 39
Other information (unaudited)
BOARD CONSIDERATION OF INVESTMENT MANAGEMENT ANDSUB-ADVISORY AGREEMENTS:
Wells Fargo Short-Term Bond Fund
Under the Investment Company Act of 1940 (the “1940 Act”), the Board of Trustees (the “Board”) of Wells Fargo Funds Trust (the “Trust”) must determine annually whether to approve the continuation of the Trust’s investment management andsub-advisory agreements. In this regard, at anin-person meeting held on May21-22, 2019 (the “Meeting”), the Board, all the members of which have no direct or indirect interest in the investment management andsub-advisory agreements and are not “interested persons” of the Trust, as defined in the 1940 Act (the “Independent Trustees”), reviewed and approved for Wells Fargo Short-Term Bond Fund(the “Fund”): (i) an investment management agreement (the “Management Agreement”) with Wells Fargo Funds Management, LLC (“Funds Management”); and (ii) an investmentsub-advisory agreement (the“Sub-Advisory Agreement”) with Wells Capital Management Incorporated (the“Sub-Adviser”), an affiliate of Funds Management. The Management Agreement and theSub-Advisory Agreement are collectively referred to as the “Advisory Agreements.”
At the Meeting, the Board considered the factors and reached the conclusions described below relating to the selection of Funds Management and theSub-Adviser and the approval of the Advisory Agreements. Prior to the Meeting, including at anin-person meeting in April 2019, the Trustees conferred extensively among themselves and with representatives of Funds Management about these matters. Also, the Board has adopted a team-based approach, with each team consisting of asub-set of Trustees, to assist the full Board in the discharge of its duties in reviewing investment performance and other matters throughout the year. The Independent Trustees were assisted in their evaluation of the Advisory Agreements by independent legal counsel, from whom they received separate legal advice and with whom they met separately.
In providing information to the Board, Funds Management and theSub-Adviser were guided by a detailed set of requests for information submitted to them by independent legal counsel on behalf of the Independent Trustees at the start of the Board’s annual contract renewal process earlier in 2019. In considering and approving the Advisory Agreements, the Trustees considered the information they believed relevant, including but not limited to the information discussed below. The Board considered not only the specific information presented in connection with the Meeting, but also the knowledge gained over time through interaction with Funds Management and theSub-Adviser about various topics. In this regard, the Board reviewed reports of Funds Management at each of its quarterly meetings, which included, among other things, portfolio reviews and investment performance reports. In addition, the Board and the teams mentioned above confer with portfolio managers at various times throughout the year. The Board did not identify any particular information or consideration that wasall-important or controlling, and each individual Trustee may have attributed different weights to various factors.
After its deliberations, the Board unanimously approved the continuation of the Advisory Agreements for aone-year term and determined that the compensation payable to Funds Management and theSub-Adviser under each of the Advisory Agreements was reasonable. The Board considered the approval of the Advisory Agreements for the Fund as part of its consideration of agreements for funds across the complex, but its approvals were made on afund-by-fund basis. The following summarizes a number of important, but not necessarily all, factors considered by the Board in support of its approvals.
Nature, extent and quality of services
The Board received and considered various information regarding the nature, extent and quality of services provided to the Fund by Funds Management and theSub-Adviser under the Advisory Agreements. This information included a description of the investment advisory services and Fund-level administrative services covered by the Management Agreement, as well as, among other things, a summary of the background and experience of senior management of Wells Fargo Asset Management (“WFAM”), of which Funds Management and theSub-Adviser are a part, a summary of investments made in the business of WFAM, a summary of certain organizational and personnel changes involving Funds Management and theSub-Adviser, and a description of Funds Management’s and theSub-Adviser’s business continuity planning programs and of their approaches to data privacy and cybersecurity. The Board received and reviewed information about Funds Management’s role as administrator of the Fund’s liquidity risk management program. The Board also considered the qualifications, background, tenure and responsibilities of each of the portfolio managers primarily responsible for theday-to-day portfolio management of the Fund.
The Board evaluated the ability of Funds Management and theSub-Adviser to attract and retain qualified investment professionals, including research, advisory and supervisory personnel. The Board further considered the compliance programs and compliance records of Funds Management and theSub-Adviser. In addition, the Board took into account the full range of services provided to the Fund by Funds Management and its affiliates.
40 | Wells Fargo Short-Term Bond Fund
Other information (unaudited)
Fund investment performance and expenses
The Board considered the investment performance results for the Fund over various time periods ended December 31, 2018. The Board considered these results in comparison to the investment performance of funds in a universe that was determined by Broadridge Inc. (“Broadridge”) to be similar to the Fund (the “Universe”), and in comparison to the Fund’s benchmark index and to other comparative data. Broadridge is an independent provider of investment company data. The Board received a description of the methodology used by Broadridge to select the mutual funds in the performance Universe. The Board noted that the investment performance of the Fund (Class A) was in range of or higher than the average investment performance of the Universe for theone-, five- andten-year periods under review, but lower than the average investment performance of the Universe for the three-year period under review. The Board also noted that the investment performance of the Fund was lower than its benchmark index, the Bloomberg Barclays U.S.1-3 Year Government/Credit Bond Index, for theone-year period under review, but higher than its benchmark for the three-, five- andten-year periods under review.
The Board received information concerning, and discussed factors contributing to, the underperformance of the Fund relative to the Universe and benchmark for the periods identified above. The Board took note of the explanations for the relative underperformance during these periods, including with respect to market factors that affected the Fund’s investment performance. The Board also took note of the Fund’s outperformance relative to the benchmark over the longer time periods under review.
The Board also received and considered information regarding the Fund’s net operating expense ratios and their various components, including actual management fees, custodian and othernon-management fees, and Rule12b-1 andnon-Rule12b-1 shareholder service fees. The Board considered these ratios in comparison to the median ratios of funds in class-specific expense groups that were determined by Broadridge to be similar to the Fund (the “Groups”). The Board received a description of the methodology used by Broadridge to select the mutual funds in the expense Groups and an explanation of how funds comprising expense groups and their expense ratios may vary fromyear-to-year. Based on the Broadridge reports, the Board noted that the net operating expense ratios of the Fund were lower than the median net operating expense ratios of the expense Groups for each share class.
The Board took into account the Fund’s investment performance and expense information provided to it among the factors considered in deciding tore-approve the Advisory Agreements.
Investment management andsub-advisory fee rates
The Board reviewed and considered the contractual fee rates payable by the Fund to Funds Management under the Management Agreement, as well as the contractual fee rates payable by the Fund to Funds Management for class-level administrative services under a Class-Level Administration Agreement, which include, among other things, class-level transfer agency andsub-transfer agency costs (collectively, the “Management Rates”). The Board also reviewed and considered the contractual investmentsub-advisory fee rates that are payable by Funds Management to theSub-Adviser for investmentsub-advisory services.
Among other information reviewed by the Board was a comparison of the Fund’s Management Rates with the average contractual investment management fee rates of funds in the expense Groups at a common asset level as well as transfer agency costs of the funds in the expense Groups. The Board noted that the Management Rates of the Fund were lower than the sum of these average rates for the Fund’s expense Groups for all share classes.
The Board also received and considered information about the portion of the total management fee that was retained by Funds Management after payment of the fee to theSub-Adviser forsub-advisory services. In assessing the reasonableness of this amount, the Board received and evaluated information about the nature and extent of responsibilities retained and risks assumed by Funds Management and not delegated to or assumed by theSub-Adviser, and about Funds Management’son-going oversight services. Given the affiliation between Funds Management and theSub-Adviser, the Board ascribed limited relevance to the allocation of fees between them.
The Board also received and considered information about the nature and extent of services offered and fee rates charged by Funds Management and theSub-Adviser to other types of clients with investment strategies similar to those of the Fund. In this regard, the Board received information about the significantly greater scope of services, and compliance, reporting and other legal burdens and risks of managing proprietary mutual funds compared with those associated with managing assets of other types of clients, including third-partysub-advised fund clients andnon-mutual fund clients such as institutional separate accounts.
Based on its consideration of the factors and information it deemed relevant, including those described here, the Board determined that the compensation payable to Funds Management under the Management Agreement and to theSub-Adviser under theSub-Advisory Agreement was reasonable.
Wells Fargo Short-Term Bond Fund | 41
Other information (unaudited)
Profitability
The Board received and considered information concerning the profitability of Funds Management, as well as the profitability of both WFAM and Wells Fargo & Co. (“Wells Fargo”) from providing services to the fund family as a whole. The Board noted that theSub-Adviser’s profitability information with respect to providing services to the Fund and other funds in the family was subsumed in the WFAM and Wells Fargo profitability analysis.
Funds Management reported on the methodologies and estimates used in calculating profitability, including a description of the methodology used to allocate certain expenses. Among other things, the Board noted that the levels of profitability reported on afund-by-fund basis varied widely, depending on factors such as the size, type and age of fund. Based on its review, the Board did not deem the profits reported by Funds Management, WFAM or Wells Fargo from services provided to the Fund to be at a level that would prevent it from approving the continuation of the Advisory Agreements.
Economies of scale
The Board received and considered information about the potential for Funds Management to experience economies of scale in the provision of management services to the Fund, the difficulties of calculating economies of scale at an individual fund level, and the extent to which potential scale benefits are shared with shareholders. The Board noted the existence of breakpoints in the Fund’s management fee structure, which operate generally to reduce the Fund’s expense ratios as the Fund grows in size. The Board considered that in addition to management fee breakpoints, Funds Management shares potential economies of scale from its management business in a variety of ways, including through fee waiver and expense reimbursement arrangements, services that benefit shareholders, competitive management fee rates set at the outset without regard to breakpoints, and investments in the business intended to enhance services available to shareholders.
The Board concluded that Funds Management’s arrangements with respect to the Fund, including contractual breakpoints, constituted a reasonable approach to sharing potential economies of scale with the Fund and its shareholders.
Other Benefits to Funds Management and theSub-Adviser
The Board received and considered information regarding potential“fall-out” or ancillary benefits received by Funds Management and its affiliates, including theSub-Adviser, as a result of their relationships with the Fund. Ancillary benefits could include, among others, benefits directly attributable to other relationships with the Fund and benefits potentially derived from an increase in Funds Management’s and theSub-Adviser’s business as a result of their relationships with the Fund. The Board noted that various affiliates of Funds Management may receive distribution-related fees, shareholder servicing payments andsub-transfer agency fees in respect of shares sold or held through them and services provided.
The Board also reviewed information about soft dollar credits earned and utilized by theSub-Adviser, fees earned by Funds Management and theSub-Adviser from managing a private investment vehicle for the fund family’s securities lending collateral, and commissions earned by an affiliated broker from portfolio transactions.
Based on its consideration of the factors and information it deemed relevant, including those described here, the Board did not find that any ancillary benefits received by Funds Management and its affiliates, including theSub-Adviser, were unreasonable.
Conclusion
At the Meeting, after considering the above-described factors and based on its deliberations and its evaluation of the information described above, the Board unanimously approved the continuation of the Advisory Agreements for aone-year term and determined that the compensation payable to Funds Management and theSub-Adviser under each of the Advisory Agreements was reasonable.
42 | Wells Fargo Short-Term Bond Fund
This page is intentionally left blank.
This page is intentionally left blank.

For more information
More information about Wells Fargo Funds is available free upon request. To obtain literature, please write, visit the Fund’s website, or call:
Wells Fargo Funds
P.O. Box 219967
Kansas City, MO 64121-9967
Website:wfam.com
Individual investors:1-800-222-8222
Retail investment professionals:1-888-877-9275
Institutional investment professionals:1-866-765-0778

This report and the financial statements contained herein are submitted for the general information of the shareholders of the Fund. If this report is used for promotional purposes, distribution of the report must be accompanied or preceded by a current prospectus. Before investing, please consider the investment objectives, risks, charges, and expenses of the investment. For a current prospectus and, if available, a summary prospectus, containing this information, call1-800-222-8222 or visit the Fund’s website atwfam.com. Read the prospectus carefully before you invest or send money.
Wells Fargo Asset Management (WFAM) is the trade name for certain investment advisory/management firms owned by Wells Fargo & Company. These firms include but are not limited to Wells Capital Management Incorporated and Wells Fargo Funds Management, LLC. Certain products managed by WFAM entities are distributed by Wells Fargo Funds Distributor, LLC (a broker-dealer and Member FINRA).
This material is for general informational and educational purposes only and is NOT intended to provide investment advice or a recommendation of any kind—including a recommendation for any specific investment, strategy, or plan.
INVESTMENT PRODUCTS: NOT FDIC INSURED ◾ NO BANK GUARANTEE ◾ MAY LOSE VALUE
© 2019 Wells Fargo Funds Management, LLC. All rights reserved.
405807 10-19
A221/AR221 08-19
Annual Report
August 31, 2019
Wells Fargo
Short-Term High Yield Bond Fund
Beginning on January 1, 2021, as permitted by new regulations adopted by the Securities and Exchange Commission, paper copies of the Wells Fargo Funds’ annual and semi-annual shareholder reports issued after this date will no longer be sent by mail, unless you specifically request paper copies of the reports. Instead, the reports will be made available on the Funds’ website, and you will be notified by mail each time a report is posted and provided with a website address to access the report.
If you already elected to receive shareholder reports electronically, you will not be affected by this change and you need not take any action. You may elect to receive shareholder reports and other communications from the Fund electronically at any time by contacting your financial intermediary (such as a broker-dealer or bank) or, if you are a direct investor, by calling1-800-222-8222 or by enrolling at wellsfargo.com/advantagedelivery.
You may elect to receive all future reports in paper free of charge. If you invest through a financial intermediary, you can contact your financial intermediary to request that you continue to receive paper copies of your shareholder reports; if you invest directly with the Fund, you can call 1-800-222-8222. Your election to receive reports in paper will apply to all Wells Fargo Funds held in your account with your financial intermediary or, if you are a direct investor, to all Wells Fargo Funds that you hold.
|
|
|
Reduce clutter. Save trees. |
Sign up for electronic delivery of prospectuses and shareholder reports atwellsfargo.com/advantagedelivery |
The views expressed and any forward-looking statements are as of August 31, 2019, unless otherwise noted, and are those of the Fund managers and/or Wells Fargo Asset Management. Discussions of individual securities, or the markets generally, or any Wells Fargo Fund are not intended as individual recommendations. Future events or results may vary significantly from those expressed in any forward-looking statements. The views expressed are subject to change at any time in response to changing circumstances in the market. Wells Fargo Asset Management and the Fund disclaim any obligation to publicly update or revise any views expressed or forward-looking statements.
INVESTMENT PRODUCTS: NOT FDIC INSURED ◾ NO BANK GUARANTEE ◾ MAY LOSE VALUE
Wells Fargo Short-Term High Yield Bond Fund | 1
Letter to shareholders (unaudited)

Andrew Owen
President
Wells Fargo Funds
Dear Shareholder:
We are pleased to offer you this annual report for the Wells Fargo Short-Term High Yield Bond Fund for the 12-month period that ended August 31, 2019. After the first half of the period yielded either low-single-digit or negative investment returns, U.S. stock and global bond investors generally saw markets recover during the second half amid intensifying market volatility, global economic growth concerns, international trade staredowns, and simmering geopolitical tensions.
Overall, fixed-income investors enjoyed a distinct advantage over stock investors. For the period, U.S. stocks, based on the S&P 500 Index,1 gained 2.92% and international stocks, as measured by the MSCI ACWI ex USA Index (Net),2 fell 3.27%. The MSCI EM Index (Net)3 slipped 4.36%. Among fixed income investors, the Bloomberg Barclays U.S. Aggregate Bond Index4 added 10.17%, the Bloomberg Barclays Global Aggregate ex-USD Index5 added 5.71%, the Bloomberg Barclays Municipal Bond Index6 gained 8.72%, and the ICE BofAML U.S. High Yield Index7 added 6.58%.
Entering the fourth quarter of 2018, economic data was encouraging.
Entering the fourth quarter of 2018, there were reasons for investors to be optimistic. The U.S. Bureau of Economic Analysis reported U.S. gross domestic product (GDP) grew 4.2% on an annualized basis during the second quarter. Hiring improved. Unemployment declined. Consumer spending gained. Third-quarter corporate earnings reports were generally positive. U.S. trade negotiations with Mexico and Canada advanced. In September 2018, the U.S. Federal Reserve (Fed) raised the federal funds rate by 25 basis points (bps; 100 bps equal 1.00%) to a target range of between 2.00% and 2.25% in an indication of its confidence that U.S. economic growth was sustainable.
International markets presented numerous challenges. U.S.-China trade tensions increased. The U.S. imposed $200 billion in tariffs on Chinese goods. China reacted with $60 billion in tariffs on U.S. goods. Economic growth in China caused concern. In September 2018, international investors began to factor in a number of disconcerting economic and business data points: lower July manufacturing and industrial orders in Germany; declining purchasing managers’ index numbers for August from the United Kingdom, China, and India; and declining household spending for August in Japan. Taken together, the data fed growing concerns that global economic growth was slowing.
| 1 | The S&P 500 Index consists of 500 stocks chosen for market size, liquidity, and industry group representation. It is a market-value-weighted index with each stock’s weight in the index proportionate to its market value. You cannot invest directly in an index. |
| 2 | The Morgan Stanley Capital International (MSCI) All Country World Index (ACWI) ex USA Index (Net) is a free-float-adjusted market-capitalization weighted index that is designed to measure the equity market performance of developed and emerging markets, excluding the U.S. Source: MSCI. MSCI makes no express or implied warranties or representations and shall have no liability whatsoever with respect to any MSCI data contained herein. The MSCI data may not be further redistributed or used as a basis for other indices or any securities or financial products. This report is not approved, reviewed, or produced by MSCI. You cannot invest directly in an index. |
| 3 | The MSCI Emerging Markets (EM) Index (Net) is a free-float-adjusted market-capitalization-weighted index that is designed to measure the equity market performance of emerging markets. You cannot invest directly in an index. |
| 4 | The Bloomberg Barclays U.S. Aggregate Bond Index is a broad-based benchmark that measures the investment-grade, U.S. dollar-denominated, fixed-rate taxable bond market, including Treasuries, government-related and corporate securities, mortgage-backed securities (agency fixed-rate and hybrid adjustable-rate mortgage pass-throughs), asset-backed securities, and commercial mortgage-backed securities. You cannot invest directly in an index. |
| 5 | The Bloomberg Barclays Global Aggregate ex-USD Index is an unmanaged index that provides a broad-based measure of the global investment-grade fixed-income markets excluding the U.S. dollar-denominated debt market. You cannot invest directly in an index. |
| 6 | The Bloomberg Barclays Municipal Bond Index is an unmanaged index composed of long-term tax-exempt bonds with a minimum credit rating of Baa. You cannot invest directly in an index. |
| 7 | The ICE BofAML U.S. High Yield Index is a market-capitalization-weighted index of domestic and Yankee high-yield bonds. The index tracks the performance of high-yield securities traded in the U.S. bond market. You cannot invest directly in an index. Copyright 2019. ICE Data Indices, LLC. All rights reserved. |
2 | Wells Fargo Short-Term High Yield Bond Fund
Letter to shareholders (unaudited)
Investors had to digest unsettling events during the fourth quarter of 2018.
November’s U.S. midterm elections shifted control of the House of Representatives from Republicans to Democrats, presaging partisan clashes that followed and caused uncertainty among investors. A partial U.S. government shutdown driven by partisan policy disputes extended into January 2019. Third-quarter U.S. GDP was announced at an annualized 3.4% rate, lower than the second-quarter rate. Brexit efforts stalled. The value of the renminbi declined even as the People’s Bank of China cut reserve requirement ratios, accelerated infrastructure spending, and cut taxes in efforts to spur economic activity.
The combination of news in the U.S. and generally weak economic indicators outside of the U.S. caused investors to seek safe havens. December’s S&P 500 Index performance was the worst since 1931. Globally, fixed-income investments fared better than stocks during the last two months of the year. The Fed increased the federal funds rate by 25 bps in December 2018 to a target range of between 2.25% and 2.50% even as observers expressed concerns that higher rates could slow the economy.
The market climbs a wall of worry.
Investment returns appeared to reaffirm the adage that markets climb a wall of worry as 2019 opened. Following its December decline, the S&P 500 Index gained 8.01% for the month of January, the best monthly performance in 30 years. Returns for the MSCI ACWI ex USA Index (Net), the Bloomberg Barclays U.S. Aggregate Bond Index, and the Bloomberg Barclays Global Aggregate ex-USD Index also were positive.
In February 2019, signs of slowing global growth grew more ominous. The Bureau of Economic Analysis announced fourth-quarter 2018 GDP grew at an annualized 2.2% rate, down from the levels of the prior two quarters. In a February report, the Bank of England forecast the slowest growth for 2019 since the financial crisis. China and the U.S. continued to wrangle over trade issues. By the end of the first quarter of 2019, more accommodative Fed sentiment and steady, if not spectacular, U.S. economic and business metrics encouraged domestic investors.
Early second-quarter 2019 enthusiasm among investors faded.
During April 2019, favorable sentiment found additional support in reports of sustained low inflation, solid employment data, and first-quarter U.S. GDP of an annualized rate of 3.2%. During May, markets tumbled on mixed investment signals. In the U.S., partisan wrangling ramped up as Democrats and Republicans set their sights on 2020 presidential politics. The U.K.’s Brexit contretemps caused Prime Minister Theresa May to resign. Boris Johnson succeeded her only to exacerbate uncertainty about Brexit’s resolution ahead of an October 2019 deadline. The European Commission downgraded the 2019 growth forecast to 1.2%. The U.S. increased tariffs on products from China, China responded, and then talks broke down. President Donald Trump threatened to turn his foreign policy tariff tool to Mexico over immigration issues.
During the third quarter of 2019, investors regrouped. Just as the investment horizon appeared to darken, sentiment turned and U.S. equity markets gained during June and July. The gains, primarily driven by geopolitical and monetary policy events, pushed equity markets to new highs. European Central Bank President Mario Draghi said that if the outlook doesn’t improve, the bank would cut rates or buy more assets to prop up inflation. President Trump backed off of tariff threats against Mexico and China. In the U.S., the Fed implemented a 0.25% federal funds rate cut in July.
Later in July, the U.S. reversed course and threatened to impose higher tariffs on China’s exports after talks failed. China responded with tariff threats of its own and
“December’s S&P 500 Index performance was the worst since 1931.”
“Following its December decline, the S&P 500 Index gained 8.01% for the month of January, the best monthly performance in 30 years.”
Wells Fargo Short-Term High Yield Bond Fund | 3
Letter to shareholders (unaudited)
|
|
|
For further information about your Fund, contact your investment professional, visit our website at wfam.com, or call us directly at1-800-222-8222. |
devalued the renminbi, a move that roiled global markets. Major U.S. stock market indices closed July 2019 with the worst weekly results of the year. Bond prices gained as Treasury yields fell to levels not seen since November 2016 and the yield curve inverted at multiple points along the 30-year arc.
In a microcosm, August 2019 encapsulated many of the unnerving events that plagued investors during the prior 11 months. The U.S.-China trade relationship swung from discouraging to hopeful and back again with no evident compromise on the horizon. Evidence of a continued global economic slowdown continued to mount as central banks in China, New Zealand, and Thailand cut interest rates. Industrial and manufacturing data declined in China, Canada, Japan, and Germany. Adding to the uncertain environment, Italy’s prime minister resigned, many feared a crackdown in Hong Kong as protesters sustained their calls for reform throughout the month, and Boris Johnson planned to suspend Parliament as Brexit’s deadline neared.
Don’t let short-term uncertainty derail long-term investment goals.
Periods of investment uncertainty can present challenges, but experience has taught us that maintaining long-term investment goals can be an effective way to plan for the future. To help you create a sound strategy based on your personal goals and risk tolerance, Wells Fargo Funds offers more than 100 mutual funds spanning a wide range of asset classes and investment styles. Although diversification cannot guarantee an investment profit or prevent losses, we believe it can be an effective way to manage investment risk and potentially smooth out overall portfolio performance. We encourage investors to know their investments and to understand that appropriate levels of risk-taking may unlock opportunities.
Thank you for choosing to invest with Wells Fargo Funds. We appreciate your confidence in us and remain committed to helping you meet your financial needs.
Sincerely,

Andrew Owen
President
Wells Fargo Funds
4 | Wells Fargo Short-Term High Yield Bond Fund
This page is intentionally left blank.
Performance highlights (unaudited)
Investment objective
The Fund seeks total return, consisting of a high level of current income and capital appreciation.
Manager
Wells Fargo Funds Management, LLC
Subadviser
Wells Capital Management Incorporated
Portfolio managers
Kevin J. Maas, CFA®‡
Thomas M. Price, CFA®‡
Michael J. Schueller, CFA®‡
Average annual total returns (%) as of August 31, 2019
| | | | | | | | | | | | | | | | | | | | | | | | | | | | | | | | | | |
| | | | |
| | | | | Including sales charge | | | Excluding sales charge | | | Expense ratios1 (%) | |
| | | | | | | | | |
| | | Inception date | | 1 year | | | 5 year | | | 10 year | | | 1 year | | | 5 year | | | 10 year | | | Gross | | | Net2 | |
| | | | | | | | | | |
| Class A (SSTHX) | | 2-29-2000 | | | 1.14 | | | | 2.09 | | | | 3.57 | | | | 4.27 | * | | | 2.72 | | | | 3.88 | | | | 0.94 | | | | 0.82 | |
| | | | | | | | | | |
| Class C (WFHYX) | | 3-31-2008 | | | 2.49 | | | | 1.98 | | | | 3.12 | | | | 3.49 | | | | 1.98 | | | | 3.12 | | | | 1.69 | | | | 1.57 | |
| | | | | | | | | | |
| Administrator Class (WDHYX)3 | | 7-30-2010 | | | – | | | | – | | | | – | | | | 4.44 | | | | 2.88 | | | | 4.03 | | | | 0.88 | | | | 0.66 | |
| | | | | | | | | | |
| Institutional Class (STYIX)4 | | 11-30-2012 | | | – | | | | – | | | | – | | | | 4.59 | | | | 3.06 | | | | 4.12 | | | | 0.61 | | | | 0.51 | |
| | | | | | | | | | |
| ICE BofAML High Yield U.S. Corporates, Cash Pay, BB Rated, 1-5 Year Index5 | | – | | | – | | | | – | | | | – | | | | 7.11 | | | | 4.58 | | | | 6.93 | | | | – | | | | – | |
| * | Total return differs from the return in the financial highlights in this report. The total return presented is calculated based on the NAV at which the shareholder transactions were processed. The NAV and total return presented in the financial highlights reflects certain adjustments made to the net assets of the Fund that are necessary under U.S. generally accepted accounting principles. |
Figures quoted represent past performance, which is no guarantee of future results, and do not reflect taxes that a shareholder may pay on fund distributions or the redemption of fund shares. Investment return and principal value of an investment will fluctuate so that an investor’s shares, when redeemed, may be worth more or less than their original cost. Performance shown without sales charges would be lower if sales charges were reflected. Current performance may be lower or higher than the performance data quoted, which assumes the reinvestment of dividends and capital gains. Current month-end performance is available on the Fund’s website,wfam.com.
Index returns do not include transaction costs associated with buying and selling securities, any mutual fund fees or expenses, or any taxes. It is not possible to invest directly in an index.
For Class A shares, the maximum front-end sales charge is 3.00%. For Class C shares, the maximum contingent deferred sales charge is 1.00%. Performance including a contingent deferred sales charge assumes the sales charge for the corresponding time period. Administrator Class and Institutional Class shares are sold without a front-end sales charge or contingent deferred sales charge.
Bond values fluctuate in response to the financial condition of individual issuers, general market and economic conditions, and changes in interest rates. Changes in market conditions and government policies may lead to periods of heightened volatility in the bond market and reduced liquidity for certain bonds held by the Fund. In general, when interest rates rise, bond values fall and investors may lose principal value. Interest rate changes and their impact on the Fund and its share price can be sudden and unpredictable. High-yield securities have a greater risk of default and tend to be more volatile than higher-rated debt securities. Loans are subject to risks similar to those associated with other below investment- grade bond investments, such as credit risk (for example, risk of issuer default), below-investment-grade bond risk (for example, risk of greater volatility in value), and risk that the loan may become illiquid or difficult to price. The use of derivatives may reduce returns and/or increase volatility. Certain investment strategies tend to increase the total risk of an investment (relative to the broader market). The Fund is exposed to foreign investment risk. Consult the Fund’s prospectus for additional information on these and other risks.
Please see footnotes on page 7.
6 | Wells Fargo Short-Term High Yield Bond Fund
Performance highlights (unaudited)
|
|
| Growth of $10,000 investment as of August 31, 20196 |
|
|
| ‡ | CFA® and Chartered Financial Analyst® are trademarks owned by CFA Institute. |
| 1 | Reflects the expense ratios as stated in the most recent prospectuses, which include the impact of 0.01% in acquired fund fees and expenses. The expense ratios shown are subject to change and may differ from the annualized expense ratios shown in the financial highlights of this report, which do not include acquired fund fees and expenses. |
| 2 | The manager has contractually committed through December 31, 2019, to waive fees and/or reimburse expenses to the extent necessary to cap the expenses of each class after fee waivers at 0.81% for Class A, 1.56% for Class C, 0.65% for Administrator Class, and 0.50% for Institutional Class. Brokerage commissions, stamp duty fees, interest, taxes, acquired fund fees and expenses (if any), and extraordinary expenses are excluded from the expense cap. Prior to or after the commitment expiration date, the cap may be increased or the commitment to maintain the cap may be terminated only with the approval of the Board of Trustees. Without this cap, the Fund’s returns would have been lower. The expense ratio paid by an investor is the net expense ratio (the total annual fund operating expenses after fee waivers) as stated in the prospectuses. |
| 3 | Historical performance shown for Administrator Class shares prior to their inception reflects the performance of Class A shares and includes the higher expenses applicable to Class A shares. If these expenses had not been included, returns for Administrator Class shares would be higher. |
| 4 | Historical performance shown for Institutional Class shares prior to their inception reflects the performance of Administrator Class shares and includes the higher expenses applicable to Administrator Class shares. If these expenses had not been included, returns for Institutional Class shares would be higher. |
| 5 | The ICE BofAML High Yield U.S. Corporates, Cash Pay, BB Rated, 1-5 Year Index is an unmanaged index that generally tracks the performance of BB rated U.S. dollar-denominated corporate bonds publicly issued in the U.S. domestic market with maturities of one to five years. You cannot invest directly in an index. |
| 6 | The chart compares the performance of Class A shares for the most recent ten years with the performance of the ICE BofAML High Yield U.S. Corporates, Cash Pay, BB Rated, 1-5 Year Index. The chart assumes a hypothetical investment of $10,000 in Class A shares and reflects all operating expenses and assumes the maximum initial sales charge of 3.00%. |
| 7 | The ten largest holdings, excluding cash, cash equivalents and any money market funds, are calculated based on the value of the investments divided by total net assets of the Fund. Holdings are subject to change and may have changed since the date specified. |
| 8 | The Personal Consumption Expenditures Index is the primary measure of consumer spending on goods and services in the U.S. economy. It accounts for about two-thirds of domestic final spending and is part of the personal income report issued by the Bureau of Economic Analysis of the Department of Commerce. You cannot invest directly in an index. |
| 9 | The credit quality distribution of portfolio holdings reflected in the chart is based on ratings from Standard & Poor’s, Moody’s Investors Service, and/ or Fitch Ratings Ltd. Credit quality ratings apply to the underlying holdings of the Fund and not to the Fund itself. The percentages of the Fund’s portfolio with the ratings depicted in the chart are calculated based on the total market value of fixed income securities held by the Fund. If a security was rated by all three rating agencies, the middle rating was utilized. If rated by two of three rating agencies, the lower rating was utilized, and if rated by one of the rating agencies, that rating was utilized. Standard & Poor’s rates the creditworthiness of bonds, ranging from AAA (highest) to D (lowest). Ratings from A to CCC may be modified by the addition of a plus (+) or minus (-) sign to show relative standing within the rating categories. Standard & Poor’s rates the creditworthiness of short-term notes from SP-1 (highest) to SP-3 (lowest). Moody’s rates the creditworthiness of bonds, ranging from Aaa (highest) to C (lowest). Ratings Aa to B may be modified by the addition of a number 1 (highest) to 3 (lowest) to show relative standing within the ratings categories. Moody’s rates the creditworthiness of short-term U.S. tax exempt municipal securities from MIG 1/VMIG 1 (highest) to SG (lowest). Fitch rates the creditworthiness of bonds, ranging from AAA (highest) to D (lowest). Credit quality distribution is subject to change and may have changed since the date specified. |
Wells Fargo Short-Term High Yield Bond Fund | 7
Performance highlights (unaudited)
MANAGER’S DISCUSSION
Fund highlights
| ∎ | | The Fund underperformed its benchmark, the ICE BofAML High Yield U.S. Corporates, Cash Pay, BB Rated, 1–5 Year Index, for the 12-month period that ended August 31, 2019. |
| ∎ | | The Fund’s conservative positioning relative to the benchmark detracted from performance, as the Fund has a lower yield and shorter duration, both of which detracted during a period when credit spreads ended the period at similar levels to where they started and Treasury rates declined. |
| ∎ | | The Fund focuses on conservative credit selection and seeks to limit volatility, leading to outperformance relative to the benchmark during the fourth quarter of 2018 when credit spreads widened significantly. |
| | | | |
|
| Ten largest holdings (%) as of August 31, 20197 | |
| | |
Sirius XM Radio Incorporated, 3.88%, 8-1-2022 | | | 1.91 | |
| | |
Charter Communications Operating LLC, 4.33%,4-30-2025 | | | 1.88 | |
| | |
Ally Financial Incorporated, 3.75%, 11-18-2019 | | | 1.75 | |
| | |
Ineos US Finance LLC, 4.26%, 3-31-2024 | | | 1.65 | |
| | |
Springleaf Finance Corporation, 7.75%, 10-1-2021 | | | 1.57 | |
| | |
TerraForm Power Operating LLC, 4.25%, 1-31-2023 | | | 1.55 | |
| | |
B&G Foods Incorporated, 4.63%, 6-1-2021 | | | 1.48 | |
| | |
Netflix Incorporated, 5.38%, 2-1-2021 | | | 1.46 | |
| | |
Teva Pharmaceutical Finance BV, 2.20%, 7-21-2021 | | | 1.44 | |
| | |
Sinclair Television Group Incorporated, 6.13%,10-1-2022 | | | 1.41 | |
An economic slowdown
The pace of gross domestic product growth decelerated over the past 12 months as business investment, inventory effects, and trade restrained overall economic activity. For the four quarters that ended June 30, 2019, the U.S. economy expanded by 2.3% in inflation-adjusted terms, compared with a 3.2% trailing 12-month growth rate at the midway point in 2018. Rising anxiety over the contentious U.S.-China trade relationship appeared to discourage capital investment over the 12-month period that ended August 31, 2019. Housing investment also was a modest drag despite low mortgage rates. Consumer spending held up fairly well, however, with the Personal Consumption Expenditures Index8 rising at a 2.7% year-over-year rate through the end of July.
Consumption was supported by a relatively firm labor market. While job growth slowed modestly over the period, wages grew by 3.2% in real terms and the unemployment rate remained below 4%. Measures of labor force participation also generally showed improvement.
In response to slower growth and lower-than-targeted inflation, the Federal Open Market Committee (FOMC) voted to reduce its policy rate target for overnight funds by 0.25% at its July 31 meeting. This was the first interest rate reduction engineered by the FOMC in the decade since the financial crisis. While the monetary authorities suggested that their decision should be seen as a “midcourse correction” rather than the beginning of an extended easing cycle, markets have priced multiple additional rate cuts into the term structure. Indeed, interest rates fell across the board over the past 12 months, with the intermediate-term Treasury yields dropping by about 1.35%.
|
|
| Credit quality as of August 31, 20199 |
|
 |
The Fund invests in shorter-duration and more-conservative securities relative to the index.
BB-rated high-yield credit spreads relative to U.S. Treasury yields were volatile but unchanged over the period. Continued U.S. economic growth, low default rates, and a search for yield combined to create a supportive environment for high-yield spreads. Total returns for the high-yield market were also supported by the reduction in Treasury rates.
Our views on the economy, high-yield spreads, and default rates were largely accurate during the period. However, due to the Fund’s strategy of selecting higher-rated, short-term high-yield securities, our focus is primarily on individual credit selection. Given the end of the FOMC’s rate increases, the three-month London Interbank Offered Rate declined from 2.32% to 2.14% during the period, leading us to reduce our exposure to floating-rate bank loans from 32.6% to 21.3%.
Please see footnotes on page 7.
8 | Wells Fargo Short-Term High Yield Bond Fund
Performance highlights (unaudited)
We continued to adhere to the Fund’s basic portfolio strategy.
The Fund’s investments fit into three principal categories. The first category is composed of short-maturity bonds that we expect to be repaid on the maturity date. The second category is composed of bonds with high coupons that we expect to be refinanced on the call date. These two categories comprised 65% to 75% of the portfolio during the reporting period. The third category consists of floating-rate bank loans.
Yields on the Fund’s leveraged-loan holdings were higher than on its fixed-rate holdings over the period, but the higher yield is appropriate for the greater spread risk, which is the price sensitivity to a change in credit spreads.
Conservative credit selection may likely continue to drive our selection process, and we monitor market conditions to determine the Fund’s floating-rate exposure. We intend to continue evaluating relative-value opportunities for the Fund in the upcoming period, but we do not expect significant changes to overall portfolio positioning.
Wells Fargo Short-Term High Yield Bond Fund | 9
Fund expenses (unaudited)
As a shareholder of the Fund, you incur two types of costs: (1) transaction costs, including sales charges (loads) on purchase payments and contingent deferred sales charges (if any) on redemptions and (2) ongoing costs, including management fees, distribution (12b-1) and/or shareholder servicing fees, and other Fund expenses. This example is intended to help you understand your ongoing costs (in dollars) of investing in the Fund and to compare these costs with the ongoing costs of investing in other mutual funds.
The example is based on an investment of $1,000 invested at the beginning of the six-month period and held for the entire period from March 1, 2019 to August 31, 2019.
Actual expenses
The “Actual” line of the table below provides information about actual account values and actual expenses. You may use the information in this line, together with the amount you invested, to estimate the expenses that you paid over the period. Simply divide your account value by $1,000 (for example, an $8,600 account value divided by $1,000 = 8.6), then multiply the result by the number in the “Actual” line under the heading entitled “Expenses paid during period” for your applicable class of shares to estimate the expenses you paid on your account during this period.
Hypothetical example for comparison purposes
The “Hypothetical” line of the table below provides information about hypothetical account values and hypothetical expenses based on the Fund’s actual expense ratio and an assumed rate of return of 5% per year before expenses, which is not the Fund’s actual return. The hypothetical account values and expenses may not be used to estimate the actual ending account balance or expenses you paid for the period. You may use this information to compare the ongoing costs of investing in the Fund and other funds. To do so, compare this 5% hypothetical example with the 5% hypothetical examples that appear in the shareholder reports of the other funds.
Please note that the expenses shown in the table are meant to highlight your ongoing costs only and do not reflect any transactional costs, such as sales charges (loads) and contingent deferred sales charges. Therefore, the “Hypothetical” line of the table is useful in comparing ongoing costs only and will not help you determine the relative total costs of owning different funds. In addition, if these transactional costs were included, your costs would have been higher.
| | | | | | | | | | | | | | | | |
| | | Beginning
account value
3-1-2019 | | | Ending
account value
8-31-2019 | | | Expenses
paid during
the period¹ | | | Annualized net
expense ratio | |
| | | | | |
Class A | | | | | | | | | | | | | | | | |
| | | | |
Actual | | $ | 1,000.00 | | | $ | 1,021.93 | | | $ | 4.13 | | | | 0.81 | % |
| | | | |
Hypothetical (5% return before expenses) | | $ | 1,000.00 | | | $ | 1,021.12 | | | $ | 4.13 | | | | 0.81 | % |
| | | | | |
Class C | | | | | | | | | | | | | | | | |
| | | | |
Actual | | $ | 1,000.00 | | | $ | 1,019.34 | | | $ | 7.94 | | | | 1.56 | % |
| | | | |
Hypothetical (5% return before expenses) | | $ | 1,000.00 | | | $ | 1,017.34 | | | $ | 7.93 | | | | 1.56 | % |
| | | | | |
Administrator Class | | | | | | | | | | | | | | | | |
| | | | |
Actual | | $ | 1,000.00 | | | $ | 1,024.03 | | | $ | 3.32 | | | | 0.65 | % |
| | | | |
Hypothetical (5% return before expenses) | | $ | 1,000.00 | | | $ | 1,021.93 | | | $ | 3.31 | | | | 0.65 | % |
| | | | | |
Institutional Class | | | | | | | | | | | | | | | | |
| | | | |
Actual | | $ | 1,000.00 | | | $ | 1,024.81 | | | $ | 2.55 | | | | 0.50 | % |
| | | | |
Hypothetical (5% return before expenses) | | $ | 1,000.00 | | | $ | 1022.69 | | | $ | 2.55 | | | | 0.50 | % |
| 1 | Expenses paid is equal to the annualized net expense ratio of each class multiplied by the average account value over the period, multiplied by the number of days in the most recent fiscal half-year divided by the number of days in the fiscal year (to reflect the one-half-year period). |
10 | Wells Fargo Short-Term High Yield Bond Fund
Portfolio of investments—August 31, 2019
| | | | | | | | | | | | | | | | |
| | | Interest
rate | | | Maturity
date | | | Principal | | | Value | |
| Corporate Bonds and Notes: 63.44% | | | | | | | | | | | | | | | | |
| | | | |
Communication Services: 11.54% | | | | | | | | | | | | | | | | |
| | | | |
| Diversified Telecommunication Services: 0.36% | | | | | | | | | | | | |
| | | | |
Level 3 Financing Incorporated | | | 5.38 | % | | | 1-15-2024 | | | $ | 3,390,000 | | | $ | 3,449,325 | |
| | | | | | | | | | | | | | | | |
| | | | |
| Entertainment: 1.46% | | | | | | | | | | | | |
| | | | |
Netflix Incorporated | | | 5.38 | | | | 2-1-2021 | | | | 13,445,000 | | | | 13,915,575 | |
| | | | | | | | | | | | | | | | |
| | | | |
| Media: 8.70% | | | | | | | | | | | | |
| | | | |
CSC Holdings LLC | | | 6.75 | | | | 11-15-2021 | | | | 900,000 | | | | 972,000 | |
| | | | |
DISH DBS Corporation | | | 7.88 | | | | 9-1-2019 | | | | 11,135,000 | | | | 11,135,000 | |
| | | | |
Lamar Media Corporation | | | 5.00 | | | | 5-1-2023 | | | | 5,115,000 | | | | 5,215,702 | |
| | | | |
National CineMedia LLC | | | 6.00 | | | | 4-15-2022 | | | | 10,175,000 | | | | 10,264,031 | |
| | | | |
Nexstar Broadcasting Group Incorporated | | | 5.88 | | | | 11-15-2022 | | | | 1,220,000 | | | | 1,241,350 | |
| | | | |
Nexstar Broadcasting Group Incorporated 144A | | | 6.13 | | | | 2-15-2022 | | | | 11,535,000 | | | | 11,679,188 | |
| | | | |
Sinclair Television Group Incorporated | | | 6.13 | | | | 10-1-2022 | | | | 13,200,000 | | | | 13,381,500 | |
| | | | |
Sirius XM Radio Incorporated 144A | | | 3.88 | | | | 8-1-2022 | | | | 17,870,000 | | | | 18,182,725 | |
| | | | |
TEGNA Incorporated | | | 5.13 | | | | 10-15-2019 | | | | 6,174,000 | | | | 6,180,791 | |
| | | | |
TEGNA Incorporated | | | 5.13 | | | | 7-15-2020 | | | | 4,505,000 | | | | 4,520,768 | |
| |
| | | | 82,773,055 | |
| | | | | | | | | | | | | | | | |
| | | | |
| Wireless Telecommunication Services: 1.02% | | | | | | | | | | | | |
| | | | |
T-Mobile USA Incorporated « | | | 4.00 | | | | 4-15-2022 | | | | 9,442,000 | | | | 9,719,406 | |
| | | | | | | | | | | | | | | | |
| | | | |
Consumer Discretionary: 8.69% | | | | | | | | | | | | | | | | |
| | | | |
| Auto Components: 0.50% | | | | | | | | | | | | |
| | | | |
Allison Transmission Incorporated 144A | | | 5.00 | | | | 10-1-2024 | | | | 2,125,000 | | | | 2,186,306 | |
| | | | |
Cooper Tire & Rubber Company | | | 8.00 | | | | 12-15-2019 | | | | 2,568,000 | | | | 2,600,100 | |
| |
| | | | 4,786,406 | |
| | | | | | | | | | | | | | | | |
| | | | |
| Distributors: 0.52% | | | | | | | | | | | | |
| | | | |
LKQ Corporation | | | 4.75 | | | | 5-15-2023 | | | | 4,875,000 | | | | 4,942,031 | |
| | | | | | | | | | | | | | | | |
| | | | |
| Hotels, Restaurants & Leisure: 1.77% | | | | | | | | | | | | |
| | | | |
MGM Resorts International | | | 7.75 | | | | 3-15-2022 | | | | 3,455,000 | | | | 3,879,032 | |
| | | | |
NCL Corporation Limited 144A | | | 4.75 | | | | 12-15-2021 | | | | 12,741,000 | | | | 12,932,115 | |
| |
| | | | 16,811,147 | |
| | | | | | | | | | | | | | | | |
| | | | |
| Household Durables: 1.46% | | | | | | | | | | | | |
| | | | |
Lennar Corporation | | | 6.63 | | | | 5-1-2020 | | | | 2,485,000 | | | | 2,551,598 | |
| | | | |
Pulte Group Incorporated | | | 4.25 | | | | 3-1-2021 | | | | 11,145,000 | | | | 11,367,900 | |
| |
| | | | 13,919,498 | |
| | | | | | | | | | | | | | | | |
| | | | |
| Specialty Retail: 4.44% | | | | | | | | | | | | |
| | | | |
Gap Incorporated | | | 5.95 | | | | 4-12-2021 | | | | 8,965,000 | | | | 9,335,782 | |
| | | | |
Group 1 Automotive Incorporated | | | 5.00 | | | | 6-1-2022 | | | | 10,865,000 | | | | 10,973,650 | |
| | | | |
L Brands Incorporated | | | 6.63 | | | | 4-1-2021 | | | | 7,805,000 | | | | 8,214,763 | |
| | | | |
Penske Auto Group Incorporated | | | 3.75 | | | | 8-15-2020 | | | | 2,655,000 | | | | 2,661,638 | |
| | | | |
Penske Auto Group Incorporated | | | 5.75 | | | | 10-1-2022 | | | | 10,920,000 | | | | 11,063,052 | |
| |
| | | | 42,248,885 | |
| | | | | | | | | | | | | | | | |
The accompanying notes are an integral part of these financial statements.
Wells Fargo Short-Term High Yield Bond Fund | 11
Portfolio of investments—August 31, 2019
| | | | | | | | | | | | | | | | |
| | | Interest
rate | | | Maturity
date | | | Principal | | | Value | |
Consumer Staples: 2.63% | | | | | | | | | | | | | | | | |
| | | | |
| Food Products: 1.48% | | | | | | | | | | | | |
| | | | |
B&G Foods Incorporated | | | 4.63 | % | | | 6-1-2021 | | | $ | 14,070,000 | | | $ | 14,115,728 | |
| | | | | | | | | | | | | | | | |
| Personal Products: 1.15% | | | | | | | | | | | | |
| | | | |
Edgewell Personal Care Company | | | 4.70 | | | | 5-19-2021 | | | | 10,774,000 | | | | 10,962,545 | |
| | | | | | | | | | | | | | | | |
| | | | |
Energy: 6.43% | | | | | | | | | | | | | | | | |
| | | | |
| Oil, Gas & Consumable Fuels: 6.43% | | | | | | | | | | | | |
| | | | |
Antero Resources Corporation | | | 5.38 | | | | 11-1-2021 | | | | 4,955,000 | | | | 4,812,544 | |
| | | | |
Archrock Partners LP | | | 6.00 | | | | 10-1-2022 | | | | 6,445,000 | | | | 6,547,798 | |
| | | | |
Crestwood Midstream Partners LP | | | 6.25 | | | | 4-1-2023 | | | | 5,620,000 | | | | 5,718,350 | |
| | | | |
DCP Midstream Operating LP 144A | | | 4.75 | | | | 9-30-2021 | | | | 1,515,000 | | | | 1,552,875 | |
| | | | |
DCP Midstream Operating LP 144A | | | 5.35 | | | | 3-15-2020 | | | | 7,943,000 | | | | 8,038,316 | |
| | | | |
Rockies Express Pipeline LLC 144A | | | 5.63 | | | | 4-15-2020 | | | | 3,390,000 | | | | 3,465,444 | |
| | | | |
Sabine Pass Liquefaction LLC | | | 5.63 | | | | 2-1-2021 | | | | 10,000,000 | | | | 10,346,793 | |
| | | | |
Southern Star Central Corporation 144A | | | 5.13 | | | | 7-15-2022 | | | | 11,095,000 | | | | 11,222,703 | |
| | | | |
Tallgrass Energy Partners LP 144A | | | 4.75 | | | | 10-1-2023 | | | | 9,565,000 | | | | 9,481,306 | |
| |
| | | | 61,186,129 | |
| | | | | | | | | | | | | | | | |
| | | | |
Financials: 6.11% | | | | | | | | | | | | | | | | |
| | | | |
| Consumer Finance: 5.44% | | | | | | | | | | | | |
| | | | |
Ally Financial Incorporated | | | 3.75 | | | | 11-18-2019 | | | | 16,660,000 | | | | 16,684,990 | |
| | | | |
Ford Motor Credit Company LLC | | | 3.34 | | | | 3-18-2021 | | | | 4,840,000 | | | | 4,871,611 | |
| | | | |
Ford Motor Credit Company LLC | | | 5.60 | | | | 1-7-2022 | | | | 4,840,000 | | | | 5,118,222 | |
| | | | |
Navient Corporation | | | 5.00 | | | | 10-26-2020 | | | | 4,950,000 | | | | 5,067,563 | |
| | | | |
Navient Corporation | | | 8.00 | | | | 3-25-2020 | | | | 5,000,000 | | | | 5,150,000 | |
| | | | |
Springleaf Finance Corporation | | | 7.75 | | | | 10-1-2021 | | | | 13,645,000 | | | | 14,907,163 | |
| |
| | | | 51,799,549 | |
| | | | | | | | | | | | | | | | |
| | | | |
| Real Estate Management & Development: 0.67% | | | | | | | | | | | | |
| | | | |
Realogy Group LLC 144A« | | | 5.25 | | | | 12-1-2021 | | | | 6,530,000 | | | | 6,399,400 | |
| | | | | | | | | | | | | | | | |
| | | | |
Health Care: 6.94% | | | | | | | | | | | | | | | | |
| | | | |
| Health Care Equipment & Supplies: 0.76% | | | | | | | | | | | | |
| | | | |
Kinetics Concepts Incorporated 144A | | | 7.88 | | | | 2-15-2021 | | | | 7,040,000 | | | | 7,253,242 | |
| | | | | | | | | | | | | | | | |
| | | | |
| Health Care Providers & Services: 6.18% | | | | | | | | | | | | |
| | | | |
Acadia Healthcare Company Incorporated | | | 5.13 | | | | 7-1-2022 | | | | 7,232,000 | | | | 7,286,240 | |
| | | | |
Acadia Healthcare Company Incorporated | | | 6.13 | | | | 3-15-2021 | | | | 1,618,000 | | | | 1,622,045 | |
| | | | |
Centene Corporation | | | 4.75 | | | | 5-15-2022 | | | | 10,555,000 | | | | 10,816,447 | |
| | | | |
DaVita HealthCare Partners Incorporated | | | 5.75 | | | | 8-15-2022 | | | | 7,755,000 | | | | 7,833,326 | |
| | | | |
HCA Incorporated | | | 5.88 | | | | 5-1-2023 | | | | 4,365,000 | | | | 4,820,597 | |
| | | | |
MEDNAX Incorporated 144A | | | 5.25 | | | | 12-1-2023 | | | | 7,315,000 | | | | 7,351,575 | |
| | | | |
Molina Healthcare Incorporated | | | 5.38 | | | | 11-15-2022 | | | | 6,800,000 | | | | 7,267,772 | |
| | | | |
Tenet Healthcare Corporation | | | 4.75 | | | | 6-1-2020 | | | | 2,825,000 | | | | 2,873,025 | |
| | | | |
Tenet Healthcare Corporation | | | 6.00 | | | | 10-1-2020 | | | | 8,550,000 | | | | 8,883,450 | |
| |
| | | | 58,754,477 | |
| | | | | | | | | | | | | | | | |
| | | | |
Industrials: 4.54% | | | | | | | | | | | | | | | | |
| | | | |
| Aerospace & Defense: 2.34% | | | | | | | | | | | | |
| | | | |
Alcoa Incorporated | | | 6.15 | | | | 8-15-2020 | | | | 8,830,000 | | | | 9,129,692 | |
| | | | |
Moog Incorporated 144A | | | 5.25 | | | | 12-1-2022 | | | | 12,865,000 | | | | 13,106,219 | |
| |
| | | | 22,235,911 | |
| | | | | | | | | | | | | | | | |
The accompanying notes are an integral part of these financial statements.
12 | Wells Fargo Short-Term High Yield Bond Fund
Portfolio of investments—August 31, 2019
| | | | | | | | | | | | | | | | |
| | | Interest
rate | | | Maturity
date | | | Principal | | | Value | |
| Airlines: 1.14% | | | | | | | | | | | | |
| | | | |
American Airlines Group Company 144A | | | 5.00 | % | | | 6-1-2022 | | | $ | 5,015,000 | | | $ | 5,215,600 | |
| | | | |
American Airlines Group Company 144A | | | 5.50 | | | | 10-1-2019 | | | | 3,435,000 | | | | 3,440,153 | |
| | | | |
United Continental Holdings Incorporated | | | 4.25 | | | | 10-1-2022 | | | | 2,100,000 | | | | 2,163,000 | |
| | | | |
| | | | | | | | | | | | | | | 10,818,753 | |
| | | | | | | | | | | | | | | | |
| | | | |
| Commercial Services & Supplies: 0.55% | | | | | | | | | | | | |
| | | | |
ADT Corporation | | | 6.25 | | | | 10-15-2021 | | | | 4,975,000 | | | | 5,285,938 | |
| | | | | | | | | | | | | | | | |
| | | | |
| Construction & Engineering: 0.51% | | | | | | | | | | | | |
| | | | |
United Rentals North America Incorporated | | | 4.63 | | | | 7-15-2023 | | | | 4,750,000 | | | | 4,853,906 | |
| | | | | | | | | | | | | | | | |
| | | | |
Information Technology: 3.59% | | | | | | | | | | | | | | | | |
| | | | |
| Software: 1.14% | | | | | | | | | | | | |
| | | | |
Symantec Corporation | | | 4.20 | | | | 9-15-2020 | | | | 10,675,000 | | | | 10,829,886 | |
| | | | | | | | | | | | | | | | |
| | | | |
| Technology Hardware, Storage & Peripherals: 2.45% | | | | | | | | | | | | |
| | | | |
Dell International LLC 144A | | | 5.88 | | | | 6-15-2021 | | | | 2,170,000 | | | | 2,205,866 | |
| | | | |
EMC Corporation | | | 2.65 | | | | 6-1-2020 | | | | 11,850,000 | | | | 11,804,106 | |
| | | | |
NCR Corporation | | | 4.63 | | | | 2-15-2021 | | | | 9,333,000 | | | | 9,333,933 | |
| |
| | | | 23,343,905 | |
| | | | | | | | | | | | | | | | |
| | | | |
Materials: 6.31% | | | | | | | | | | | | | | | | |
| | | | |
| Chemicals: 1.01% | | | | | | | | | | | | |
| | | | |
Chemours Company | | | 6.63 | | | | 5-15-2023 | | | | 9,445,000 | | | | 9,610,288 | |
| | | | | | | | | | | | | | | | |
| | | | |
| Containers & Packaging: 2.36% | | | | | | | | | | | | |
| | | | |
Ball Corporation | | | 4.38 | | | | 12-15-2020 | | | | 10,425,000 | | | | 10,659,563 | |
| | | | |
Owens-Brockway Glass Container Incorporated 144A | | | 5.00 | | | | 1-15-2022 | | | | 6,910,000 | | | | 7,074,113 | |
| | | | |
Reynolds Group Holdings | | | 5.75 | | | | 10-15-2020 | | | | 4,768,010 | | | | 4,779,930 | |
| |
| | | | 22,513,606 | |
| | | | | | | | | | | | | | | | |
| | | | |
| Metals & Mining: 2.94% | | | | | | | | | | | | |
| | | | |
Freeport-McMoRan Incorporated | | | 3.55 | | | | 3-1-2022 | | | | 8,404,000 | | | | 8,425,010 | |
| | | | |
Freeport-McMoRan Incorporated | | | 4.00 | | | | 11-14-2021 | | | | 6,530,000 | | | | 6,637,027 | |
| | | | |
Steel Dynamics Incorporated | | | 5.13 | | | | 10-1-2021 | | | | 12,883,000 | | | | 12,918,944 | |
| |
| | | | 27,980,981 | |
| | | | | | | | | | | | | | | | |
| | | | |
Real Estate: 4.41% | | | | | | | | | | | | | | | | |
| | | | |
| Equity REITs: 3.47% | | | | | | | | | | | | |
| | | | |
CoreCivic Incorporated | | | 4.13 | | | | 4-1-2020 | | | | 11,870,000 | | | | 11,840,325 | |
| | | | |
Equinix Incorporated | | | 5.38 | | | | 1-1-2022 | | | | 12,030,000 | | | | 12,330,750 | |
| | | | |
SBA Communications Corporation | | | 4.00 | | | | 10-1-2022 | | | | 2,270,000 | | | | 2,309,725 | |
| | | | |
SBA Communications Corporation | | | 4.88 | | | | 7-15-2022 | | | | 6,460,000 | | | | 6,560,776 | |
| | | | |
| | | | | | | | | | | | | | | 33,041,576 | |
| | | | | | | | | | | | | | | | |
| | | | |
| Real Estate Management & Development: 0.94% | | | | | | | | | | | | |
| | | | |
Washington Prime Group Incorporated | | | 3.85 | | | | 4-1-2020 | | | | 8,969,000 | | | | 8,910,971 | |
| | | | | | | | | | | | | | | | |
| | | | |
Utilities: 2.25% | | | | | | | | | | | | | | | | |
| | | | |
| Electric Utilities: 0.28% | | | | | | | | | | | | |
| | | | |
NextEra Energy Operating Partners LP 144A | | | 4.25 | | | | 7-15-2024 | | | | 2,575,000 | | | | 2,645,813 | |
| | | | | | | | | | | | | | | | |
The accompanying notes are an integral part of these financial statements.
Wells Fargo Short-Term High Yield Bond Fund | 13
Portfolio of investments—August 31, 2019
| | | | | | | | | | | | | | | | |
| | | Interest
rate | | | Maturity
date | | | Principal | | | Value | |
| Independent Power & Renewable Electricity Producers: 1.97% | | | | | | | | | | | | |
| | | | |
TerraForm Power Operating LLC 144A | | | 4.25 | % | | | 1-31-2023 | | | $ | 14,368,000 | | | $ | 14,722,171 | |
| | | | |
Vistra Energy Corporation | | | 7.63 | | | | 11-1-2024 | | | | 3,795,000 | | | | 4,024,703 | |
| |
| | | | 18,746,874 | |
| | | | | | | | | | | | | | | | |
| | | | |
Total Corporate Bonds and Notes (Cost $600,793,367) | | | | | | | | | | | | | | | 603,854,806 | |
| | | | | | | | | | | | | | | | |
| | | | |
Loans: 21.28% | | | | | | | | | | | | | | | | |
| | | | |
Communication Services: 5.44% | | | | | | | | | | | | | | | | |
| | | | |
| Diversified Telecommunication Services: 0.55% | | | | | | | | | | | | |
| | | | |
Level 3 Financing Incorporated (1 Month LIBOR +2.25%)± | | | 4.36 | | | | 2-22-2024 | | | | 5,258,850 | | | | 5,261,059 | |
| | | | | | | | | | | | | | | | |
| | | | |
| Entertainment: 1.05% | | | | | | | | | | | | |
| | | | |
Diamond Sports Group LLC (3 Month LIBOR +3.25%)±< | | | 5.39 | | | | 8-24-2026 | | | | 10,000,000 | | | | 10,000,000 | |
| | | | | | | | | | | | | | | | |
| | | | |
| Media: 3.28% | | | | | | | | | | | | |
| | | | |
Charter Communications Operating LLC (3 Month LIBOR +2.00%)± | | | 4.33 | | | | 4-30-2025 | | | | 17,835,832 | | | | 17,872,395 | |
| | | | |
CSC Holdings LLC (1 Month LIBOR +2.50%)± | | | 4.70 | | | | 1-25-2026 | | | | 10,924,370 | | | | 10,906,126 | |
| | | | |
Neptune Finco Corporation (1 Month LIBOR +2.25%)± | | | 4.45 | | | | 1-15-2026 | | | | 2,462,625 | | | | 2,448,268 | |
| |
| | | | 31,226,789 | |
| | | | | | | | | | | | | | | | |
| | | | |
| Wireless Telecommunication Services: 0.56% | | | | | | | | | | | | |
| | | | |
SBA Senior Finance II LLC (1 Month LIBOR +2.00%)± | | | 4.12 | | | | 4-11-2025 | | | | 5,360,794 | | | | 5,326,753 | |
| | | | | | | | | | | | | | | | |
| | | | |
Consumer Discretionary: 1.30% | | | | | | | | | | | | | | | | |
| | | | |
| Auto Components: 0.45% | | | | | | | | | | | | |
| | | | |
Allison Transmission Incorporated (1 Month LIBOR +2.00%)± | | | 4.17 | | | | 3-29-2026 | | | | 4,241,093 | | | | 4,274,216 | |
| | | | | | | | | | | | | | | | |
| | | | |
| Household Products: 0.66% | | | | | | | | | | | | |
| | | | |
Michaels Stores Incorporated (1 Month LIBOR +2.50%)± | | | 4.63 | | | | 1-30-2023 | | | | 5,346,993 | | | | 5,066,276 | |
| | | | |
The ServiceMaster Company LLC (1 Month LIBOR +2.50%)± | | | 4.61 | | | | 11-8-2023 | | | | 1,285,413 | | | | 1,283,266 | |
| |
| | | | 6,349,542 | |
| | | | | | | | | | | | | | | | |
| | | | |
| Specialty Retail: 0.19% | | | | | | | | | | | | |
| | | | |
Sally Beauty Holdings Incorporated (1 Month LIBOR +2.25%)±‡ | | | 4.37 | | | | 7-5-2024 | | | | 1,829,113 | | | | 1,787,957 | |
| | | | | | | | | | | | | | | | |
| | | | |
Consumer Staples: 0.70% | | | | | | | | | | | | | | | | |
| | | | |
| Food Products: 0.70% | | | | | | | | | | | | |
| | | | |
Post Holdings Incorporated (1 Month LIBOR +2.00%)± | | | 4.15 | | | | 5-24-2024 | | | | 6,651,665 | | | | 6,650,734 | |
| | | | | | | | | | | | | | | | |
| | | | |
Financials: 3.25% | | | | | | | | | | | | | | | | |
| | | | |
| Consumer Finance: 1.02% | | | | | | | | | | | | |
| | | | |
TransUnion LLC (1 Month LIBOR +2.00%)± | | | 4.11 | | | | 6-19-2025 | | | | 9,719,847 | | | | 9,725,096 | |
| | | | | | | | | | | | | | | | |
| | | | |
| Diversified Financial Services: 2.23% | | | | | | | | | | | | |
| | | | |
Delos Finance SARL (3 Month LIBOR +1.75%)± | | | 4.08 | | | | 10-6-2023 | | | | 8,220,833 | | | | 8,229,630 | |
| | | | |
LPL Holdings Incorporated (1 Month LIBOR +2.25%)± | | | 4.40 | | | | 9-23-2024 | | | | 12,932,708 | | | | 12,948,874 | |
| |
| | | | 21,178,504 | |
| | | | | | | | | | | | | | | | |
| | | | |
Health Care: 1.61% | | | | | | | | | | | | | | | | |
| | | | |
| Health Care Providers & Services: 1.61% | | | | | | | | | | | | |
| | | | |
HCA Incorporated (3 Month LIBOR +1.75%)± | | | 4.08 | | | | 3-17-2023 | | | | 9,981,495 | | | | 9,991,177 | |
| | | | |
Select Medical Corporation (3 Month LIBOR +2.50%)± | | | 4.85 | | | | 3-6-2025 | | | | 5,326,507 | | | | 5,295,454 | |
| |
| | | | 15,286,631 | |
| | | | | | | | | | | | | | | | |
The accompanying notes are an integral part of these financial statements.
14 | Wells Fargo Short-Term High Yield Bond Fund
Portfolio of investments—August 31, 2019
| | | | | | | | | | | | | | | | |
| | | Interest
rate | | | Maturity
date | | | Principal | | | Value | |
Industrials: 5.91% | | | | | | | | | | | | | | | | |
| | | | |
| Airlines: 0.98% | | | | | | | | | | | | |
| | | | |
United Airlines Incorporated (1 Month LIBOR +1.75%)± | | | 3.86 | % | | | 4-1-2024 | | | $ | 7,751,575 | | | $ | 7,734,134 | |
| | | | |
WestJet Airlines Limited (3 Month LIBOR +3.00%)±< | | | 5.14 | | | | 8-6-2026 | | | | 1,550,000 | | | | 1,553,395 | |
| |
| | | | 9,287,529 | |
| | | | | | | | | | | | | | | | |
| | | | |
| Commercial Services & Supplies: 3.21% | | | | | | | | | | | | |
| | | | |
Advanced Disposal Services Incorporated (1 Month LIBOR +2.25%)± | | | 4.39 | | | | 11-10-2023 | | | | 11,941,041 | | | | 11,948,563 | |
| | | | |
Aramark Services Incorporated (3 Month LIBOR +1.75%)± | | | 4.08 | | | | 3-28-2024 | | | | 5,082,497 | | | | 5,074,873 | |
| | | | |
Aramark Services Incorporated (3 Month LIBOR +1.75%)± | | | 4.08 | | | | 3-11-2025 | | | | 5,931,734 | | | | 5,924,319 | |
| | | | |
KAR Auction Services Incorporated (3 Month LIBOR +2.25%)± | | | 4.63 | | | | 3-11-2021 | | | | 3,462,323 | | | | 3,455,121 | |
| | | | |
Sensata Technologies BV (1 Month LIBOR +1.75%)± | | | 3.94 | | | | 10-14-2021 | | | | 4,165,618 | | | | 4,181,239 | |
| |
| | | | 30,584,115 | |
| | | | | | | | | | | | | | | | |
| | | | |
| Communications Equipment: 0.49% | | | | | | | | | | | | |
| | | | |
Virgin Media Bristol LLC (1 Month LIBOR +2.50%)± | | | 4.70 | | | | 1-15-2026 | | | | 4,615,000 | | | | 4,611,446 | |
| | | | | | | | | | | | | | | | |
| | | | |
| Machinery: 1.23% | | | | | | | | | | | | |
| | | | |
Columbus McKinnon Corporation (3 Month LIBOR +2.50%)±‡ | | | 4.83 | | | | 1-31-2024 | | | | 5,012,660 | | | | 5,006,394 | |
| | | | |
RBS Global Incorporated (1 Month LIBOR +2.00%)± | | | 4.11 | | | | 8-21-2024 | | | | 6,706,250 | | | | 6,728,917 | |
| |
| | | | 11,735,311 | |
| | | | | | | | | | | | | | | | |
| | | | |
Information Technology: 0.28% | | | | | | | | | | | | | | | | |
| | | | |
| Electronic Equipment, Instruments & Components: 0.28% | | | | | | | | | | | | |
| | | | |
Dell Incorporated (1 Month LIBOR +2.00%)± | | | 4.12 | | | | 9-7-2023 | | | | 2,627,460 | | | | 2,632,636 | |
| | | | | | | | | | | | | | | | |
| | | | |
Materials: 2.26% | | | | | | | | | | | | | | | | |
| | | | |
| Chemicals: 2.18% | | | | | | | | | | | | |
| | | | |
Ashland LLC (1 Month LIBOR +1.75%)± | | | 3.84 | | | | 5-17-2024 | | | | 5,113,050 | | | | 5,100,267 | |
| | | | |
Ineos US Finance LLC (2 Month LIBOR +2.00%)± | | | 4.26 | | | | 3-31-2024 | | | | 15,975,788 | | | | 15,674,485 | |
| |
| | | | 20,774,752 | |
| | | | | | | | | | | | | | | | |
| | | | |
| Containers & Packaging: 0.08% | | | | | | | | | | | | |
| | | | |
Berry Plastics Group Incorporated (1 Month LIBOR +2.00%)± | | | 4.20 | | | | 1-6-2021 | | | | 741,581 | | | | 741,581 | |
| | | | | | | | | | | | | | | | |
| | | | |
Real Estate: 0.53% | | | | | | | | | | | | | | | | |
| | | | |
| Equity REITs: 0.53% | | | | | | | | | | | | |
| | | | |
MGM Growth Properties LLC (1 Month LIBOR +2.00%)± | | | 4.11 | | | | 3-21-2025 | | | | 5,074,833 | | | | 5,073,260 | |
| | | | | | | | | | | | | | | | |
| |
Total Loans (Cost $203,766,743) | | | | 202,507,911 | |
| | | | | | | | | | | | | | | | |
| | | | |
| Non-Agency Mortgage-Backed Securities: 0.00% | | | | | | | | | | | | |
| | | | |
Salomon Brothers Mortgage Securities VII Series 1994-5 Class B2±± | | | 5.24 | | | | 4-25-2024 | | | | 22,671 | | | | 20,938 | |
| | | | | | | | | | | | | | | | |
| | | | |
Total Non-Agency Mortgage-Backed Securities (Cost $22,452) | | | | | | | | | | | | | | | 20,938 | |
| | | | | | | | | | | | | | | | |
| | | | |
Yankee Corporate Bonds and Notes: 9.14% | | | | | | | | | | | | | | | | |
| | | | |
Communication Services: 1.34% | | | | | | | | | | | | | | | | |
| | | | |
| Media: 1.34% | | | | | | | | | | | | |
| | | | |
Nielsen Holding and Finance BV 144A | | | 5.50 | | | | 10-1-2021 | | | | 12,710,000 | | | | 12,746,859 | |
| | | | | | | | | | | | | | | | |
The accompanying notes are an integral part of these financial statements.
Wells Fargo Short-Term High Yield Bond Fund | 15
Portfolio of investments—August 31, 2019
| | | | | | | | | | | | | | | | |
| | | Interest
rate | | | Maturity
date | | | Principal | | | Value | |
Consumer Discretionary: 1.07% | | | | | | | | | | | | | | | | |
| | | | |
| Automobiles: 0.39% | | | | | | | | | | | | |
| | | | |
Jaguar Land Rover Limited 144A | | | 4.25 | % | | | 11-15-2019 | | | $ | 3,756,000 | | | $ | 3,742,854 | |
| | | | | | | | | | | | | | | | |
| Hotels, Restaurants & Leisure: 0.68% | | | | | | | | | | | | |
| | | | |
International Game Technology plc 144A | | | 6.25 | | | | 2-15-2022 | | | | 6,100,000 | | | | 6,450,750 | |
| | | | | | | | | | | | | | | | |
| | | | |
Financials: 0.54% | | | | | | | | | | | | | | | | |
| | | | |
| Diversified Financial Services: 0.54% | | | | | | | | | | | | |
| | | | |
General Electric Capital International Funding Company | | | 2.34 | | | | 11-15-2020 | | | | 5,225,000 | | | | 5,195,710 | |
| | | | | | | | | | | | | | | | |
| | | | |
Health Care: 3.01% | | | | | | | | | | | | | | | | |
| | | | |
| Pharmaceuticals: 3.01% | | | | | | | | | | | | |
| | | | |
Bausch Health Companies Incorporated 144A | | | 6.50 | | | | 3-15-2022 | | | | 11,695,000 | | | | 12,107,834 | |
| | | | |
Teva Pharmaceutical Finance BV | | | 2.20 | | | | 7-21-2021 | | | | 14,600,000 | | | | 13,669,250 | |
| | | | |
Teva Pharmaceutical Finance BV | | | 3.65 | | | | 11-10-2021 | | | | 3,000,000 | | | | 2,853,750 | |
| |
| | | | 28,630,834 | |
| | | | | | | | | | | | | | | | |
| | | | |
Industrials: 0.66% | | | | | | | | | | | | | | | | |
| | | | |
| Airlines: 0.66% | | | | | | | | | | | | |
| | | | |
Air Canada Company 144A | | | 7.75 | | | | 4-15-2021 | | | | 5,870,000 | | | | 6,284,363 | |
| | | | | | | | | | | | | | | | |
| | | | |
Materials: 2.52% | | | | | | | | | | | | | | | | |
| | | | |
| Chemicals: 1.03% | | | | | | | | | | | | |
| | | | |
Park Aerospace Holdings Company 144A | | | 5.25 | | | | 8-15-2022 | | | | 9,305,000 | | | | 9,828,406 | |
| | | | | | | | | | | | | | | | |
| | | | |
| Containers & Packaging: 0.40% | | | | | | | | | | | | |
| | | | |
Ardagh Packaging Finance plc 144A | | | 4.63 | | | | 5-15-2023 | | | | 3,655,000 | | | | 3,740,746 | |
| | | | | | | | | | | | | | | | |
| | | | |
| Metals & Mining: 1.09% | | | | | | | | | | | | |
| | | | |
ArcelorMittal SA | | | 5.50 | | | | 3-1-2021 | | | | 9,970,000 | | | | 10,402,121 | |
| | | | | | | | | | | | | | | | |
| | | | |
Total Yankee Corporate Bonds and Notes (Cost $86,837,682) | | | | | | | | | | | | | | | 87,022,643 | |
| | | | | | | | | | | | | | | | |
| | | | |
| | | | | | | | | | | | | | | | |
| | | Yield | | | | | | Shares | | | | |
| Short-Term Investments: 5.63% | | | | | | | | | | | | |
| | | | |
| Investment Companies: 5.63% | | | | | | | | | | | | |
| | | | |
Securities Lending Cash Investments LLC (l)(r)(u) | | | 2.24 | | | | | | | | 5,730,371 | | | | 5,730,944 | |
| | | | |
Wells Fargo Government Money Market Fund Select Class (l)(u)## | | | 2.04 | | | | | | | | 47,797,221 | | | | 47,797,221 | |
| | | | |
Total Short-Term Investments (Cost $53,528,165) | | | | | | | | | | | | | | | 53,528,165 | |
| | | | | | | | | | | | | | | | |
| | | | | | | | |
| Total investments in securities (Cost $944,948,409) | | | 99.49 | % | | | 946,934,463 | |
| | |
Other assets and liabilities, net | | | 0.51 | | | | 4,898,385 | |
| | | | | | | | |
| Total net assets | | | 100.00 | % | | $ | 951,832,848 | |
| | | | | | | | |
The accompanying notes are an integral part of these financial statements.
16 | Wells Fargo Short-Term High Yield Bond Fund
Portfolio of investments—August 31, 2019
| 144A | The security may be resold in transactions exempt from registration, normally to qualified institutional buyers, pursuant to Rule 144A under the Securities Act of 1933. |
| « | All or a portion of this security is on loan. |
| ± | Variable rate investment. The rate shown is the rate in effect at period end. |
| < | All or a portion of the position represents an unfunded loan commitment. |
| ‡ | Security is valued using significant unobservable inputs. |
| ±± | The coupon of the security is adjusted based on the principal and interest payments received from the underlying pool of mortgages as well as the credit quality and the actual prepayment speed of the underlying mortgages. |
| (l) | The issuer of the security is an affiliated person of the Fund as defined in the Investment Company Act of 1940. |
| (r) | The investment is a non-registered investment company purchased with cash collateral received from securities on loan. |
| (u) | The rate represents the 7-day annualized yield at period end. |
| ## | All or a portion of this security is segregated for unfunded loans. |
Abbreviations:
| LIBOR | London Interbank Offered Rate |
| REIT | Real estate investment trust |
Investments in Affiliates
An affiliated investment is an investment in which the Fund owns at least 5% of the outstanding voting shares of the issuer or as a result of other relationships, such as the Fund and the issuer having the same investment manager. Transactions with issuers that were either affiliated persons of the Fund at the beginning of the period or the end of the period were as follows:
| | | | | | | | | | | | | | | | | | | | | | | | | | | | | | | | | | | | |
| | | Shares,
beginning
of period | | | Shares
purchased | | | Shares
sold | | | Shares,
end of
period | | | Net
realized
gains
(losses) | | | Net
change in
unrealized
gains
(losses) | | | Income
from
affiliated
securities | | | Value,
end
of period | | | % of
net
assets | |
Short-Term Investments | | | | | | | | | | | | | | | | | | | | | | | | | | | | | | | | | | | | |
Investment Companies | | | | | | | | | | | | | | | | | | | | | | | | | | | | | | | | | | | | |
Securities Lending Cash Investments LLC | | | 146,956 | | | | 26,450,472 | | | | 20,867,057 | | | | 5,730,371 | | | $ | 836 | | | $ | 0 | | | $ | 52,203 | # | | $ | 5,730,944 | | | | | |
Wells Fargo Government Money Market Fund Select Class | | | 48,392,907 | | | | 510,307,507 | | | | 510,903,193 | | | | 47,797,221 | | | | 0 | | | | 0 | | | | 998,183 | | | | 47,797,221 | | | | | |
| | | | | | | | | | | | | | | | | | | | | | | | | | | | | | | | | | | | |
| | | | | | | | | | | | | | | | | | $ | 836 | | | $ | 0 | | | $ | 1,050,386 | | | $ | 53,528,165 | | | | 5.63 | % |
| | | | | | | | | | | | | | | | | | | | | | | | | | | | | | | | | | | | |
| # | Amount shown represents income before fees and rebates. |
The accompanying notes are an integral part of these financial statements.
Wells Fargo Short-Term High Yield Bond Fund | 17
Statement of assets and liabilities—August 31, 2019
| | | | |
| | | | |
| |
Assets | | | | |
Investments in unaffiliated securities (including $5,575,817 of securities loaned), at value (cost $891,420,244) | | $ | 893,406,298 | |
Investments in affiliated securities, at value (cost $53,528,165) | | | 53,528,165 | |
Cash | | | 12,400,012 | |
Receivable for investments sold | | | 517,050 | |
Receivable for Fund shares sold | | | 513,783 | |
Receivable for interest | | | 11,288,066 | |
Receivable for securities lending income, net | | | 745 | |
Prepaid expenses and other assets | | | 970 | |
| | | | |
Total assets | | | 971,655,089 | |
| | | | |
| |
Liabilities | | | | |
Payable for investments purchased | | | 11,588,281 | |
Payable upon receipt of securities loaned | | | 5,730,108 | |
Payable for Fund shares redeemed | | | 1,350,520 | |
Dividends payable | | | 439,697 | |
Management fee payable | | | 315,432 | |
Administration fees payable | | | 82,519 | |
Distribution fee payable | | | 40,224 | |
Trustees’ fees and expenses payable | | | 3,964 | |
Accrued expenses and other liabilities | | | 271,496 | |
| | | | |
Total liabilities | | | 19,822,241 | |
| | | | |
Total net assets | | $ | 951,832,848 | |
| | | | |
| |
Net assets consist of | | | | |
Paid-in capital | | $ | 988,590,268 | |
Total distributable loss | | | (36,757,420 | ) |
| | | | |
Total net assets | | $ | 951,832,848 | |
| | | | |
| |
Computation of net asset value and offering price per share | | | | |
Net assets – Class A | | $ | 104,671,182 | |
Shares outstanding – Class A1 | | | 12,978,218 | |
Net asset value per share – Class A | | | $8.07 | |
Maximum offering price per share – Class A2 | | | $8.32 | |
Net assets – Class C | | $ | 59,112,952 | |
Shares outstanding – Class C1 | | | 7,327,205 | |
Net asset value per share – Class C | | | $8.07 | |
Net assets – Administrator Class | | $ | 86,891,760 | |
Shares outstanding – Administrator Class1 | | | 10,774,722 | |
Net asset value per share – Administrator Class | | | $8.06 | |
Net assets – Institutional Class | | $ | 701,156,954 | |
Shares outstanding – Institutional Class1 | | | 87,060,817 | |
Net asset value per share – Institutional Class | | | $8.05 | |
| 1 | The Fund has an unlimited number of authorized shares. |
| 2 | Maximum offering price is computed as 100/97 of net asset value. On investments of $50,000 or more, the offering price is reduced. |
The accompanying notes are an integral part of these financial statements.
18 | Wells Fargo Short-Term High Yield Bond Fund
Statement of operations—year ended August 31, 2019
| | | | |
| | | | |
| |
Investment income | | | | |
Interest | | $ | 38,092,276 | |
Income from affiliated securities | | | 1,004,993 | |
| | | | |
Total investment income | | | 39,097,269 | |
| | | | |
| |
Expenses | | | | |
Management fee | | | 4,778,296 | |
Administration fees | | | | |
Class A | | | 181,891 | |
Class C | | | 105,617 | |
Administrator Class | | | 91,359 | |
Institutional Class | | | 567,473 | |
Shareholder servicing fees | | | | |
Class A | | | 284,204 | |
Class C | | | 165,027 | |
Administrator Class | | | 225,454 | |
Distribution fee | | | | |
Class C | | | 495,081 | |
Custody and accounting fees | | | 79,778 | |
Professional fees | | | 55,842 | |
Registration fees | | | 99,725 | |
Shareholder report expenses | | | 98,618 | |
Trustees’ fees and expenses | | | 21,592 | |
Other fees and expenses | | | 26,921 | |
| | | | |
Total expenses | | | 7,276,878 | |
Less Fee waivers and/or expense reimbursements | | | | |
Fund-level | | | (1,043,595 | ) |
Class A | | | (22,701 | ) |
Class C | | | (13,167 | ) |
Administrator Class | | | (106,632 | ) |
| | | | |
Net expenses | | | 6,090,783 | |
| | | | |
Net investment income | | | 33,006,486 | |
| | | | |
| |
Realized and unrealized gains (losses) on investments | | | | |
Net realized gains (losses) on | | | | |
Unaffiliated securities | | | (2,707,775 | ) |
Affiliated securities | | | 836 | |
| | | | |
Net realized losses on investments | | | (2,706,939 | ) |
Net change in unrealized gains (losses) on investments | | | 11,155,238 | |
| | | | |
Net realized and unrealized gains (losses) on investments | | | 8,448,299 | |
| | | | |
Net increase in net assets resulting from operations | | $ | 41,454,785 | |
| | | | |
The accompanying notes are an integral part of these financial statements.
Wells Fargo Short-Term High Yield Bond Fund | 19
Statement of changes in net assets
| | | | | | | | | | | | | | | | |
| | | Year ended
August 31, 2019 | | | Year ended
August 31, 20181 | |
| | | | |
Operations | | | | | | | | | | | | | | | | |
Net investment income | | | | | | $ | 33,006,486 | | | | | | | $ | 39,073,468 | |
Net realized losses on investments | | | | | | | (2,706,939 | ) | | | | | | | (3,235,869 | ) |
Net change in unrealized gains (losses) on investments | | | | | | | 11,155,238 | | | | | | | | (9,350,210 | ) |
| | | | |
Net increase in net assets resulting from operations | | | | | | | 41,454,785 | | | | | | | | 26,487,389 | |
| | | | |
| | | | |
Distributions to shareholders from net investment income and net realized gains | | | | | | | | | | | | | | | | |
Class A | | | | | | | (3,762,988 | ) | | | | | | | (4,410,776 | ) |
Class C | | | | | | | (1,689,410 | ) | | | | | | | (2,041,138 | ) |
Administrator Class | | | | | | | (3,168,104 | ) | | | | | | | (3,531,933 | ) |
Institutional Class | | | | | | | (25,680,553 | ) | | | | | | | (29,089,633 | ) |
| | | | |
Total distributions to shareholders | | | | | | | (34,301,055 | ) | | | | | | | (39,073,480 | ) |
| | | | |
| | | | |
Capital share transactions | | | Shares | | | | | | | | Shares | | | | | |
Proceeds from shares sold | | | | | | | | | | | | | | | | |
Class A | | | 2,334,881 | | | | 18,662,572 | | | | 3,772,243 | | | | 30,248,401 | |
Class C | | | 550,907 | | | | 4,399,664 | | | | 821,295 | | | | 6,596,115 | |
Administrator Class | | | 3,608,062 | | | | 28,884,553 | | | | 4,344,267 | | | | 34,806,968 | |
Institutional Class | | | 39,157,823 | | | | 312,749,375 | | | | 40,175,145 | | | | 322,039,713 | |
| | | | |
| | | | | | | 364,696,164 | | | | | | | | 393,691,197 | |
| | | | |
Reinvestment of distributions | | | | | | | | | | | | | | | | |
Class A | | | 455,888 | | | | 3,644,906 | | | | 534,775 | | | | 4,287,383 | |
Class C | | | 206,987 | | | | 1,655,385 | | | | 250,383 | | | | 2,008,417 | |
Administrator Class | | | 388,986 | | | | 3,109,963 | | | | 424,158 | | | | 3,399,349 | |
Institutional Class | | | 2,585,685 | | | | 20,647,043 | | | | 2,938,060 | | | | 23,529,667 | |
| | | | |
| | | | | | | 29,057,297 | | | | | | | | 33,224,816 | |
| | | | |
Payment for shares redeemed | | | | | | | | | | | | | | | | |
Class A | | | (5,701,043 | ) | | | (45,524,301 | ) | | | (9,754,483 | ) | | | (78,216,370 | ) |
Class C | | | (3,080,040 | ) | | | (24,607,930 | ) | | | (5,207,987 | ) | | | (41,812,691 | ) |
Administrator Class | | | (6,065,662 | ) | | | (48,429,129 | ) | | | (8,542,255 | ) | | | (68,570,248 | ) |
Institutional Class | | | (50,462,701 | ) | | | (402,058,756 | ) | | | (72,766,723 | ) | | | (582,432,153 | ) |
| | | | |
| | | | | | | (520,620,116 | ) | | | | | | | (771,031,462 | ) |
| | | | |
Net decrease in net assets resulting from capital share transactions | | | | | | | (126,866,655 | ) | | | | | | | (344,115,449 | ) |
| | | | |
Total decrease in net assets | | | | | | | (119,712,925 | ) | | | | | | | (356,701,540 | ) |
| | | | |
| | | | |
Net assets | | | | | | | | | | | | | | | | |
Beginning of period | | | | | | | 1,071,545,773 | | | | | | | | 1,428,247,313 | |
| | | | |
End of period | | | | | | $ | 951,832,848 | | | | | | | $ | 1,071,545,773 | |
| | | | |
| 1 | Effective for all filings after November 4, 2018, the SEC prospectively eliminated the requirement to parenthetically disclose undistributed net investment income at the end of the period and permitted the aggregation of distributions, with the exception of tax basis returns of capital. Undistributed net investment income at August 31, 2018 was $7. The disaggregated distributions information for the year ended August 31, 2018 is included in Note 8,Distributions to Shareholders, in the notes to the financial statements. |
The accompanying notes are an integral part of these financial statements.
20 | Wells Fargo Short-Term High Yield Bond Fund
Financial highlights
(For a share outstanding throughout each period)
| | | | | | | | | | | | | | | | | | | | |
| | | Year ended August 31 | |
| CLASS A | | 2019 | | | 2018 | | | 2017 | | | 2016 | | | 2015 | |
Net asset value, beginning of period | | | $7.99 | | | | $8.07 | | | | $8.10 | | | | $8.07 | | | | $8.20 | |
Net investment income | | | 0.25 | | | | 0.24 | | | | 0.23 | | | | 0.24 | | | | 0.25 | |
Net realized and unrealized gains (losses) on investments | | | 0.09 | | | | (0.08 | ) | | | (0.03 | ) | | | 0.03 | | | | (0.13 | ) |
| | | | | | | | | | | | | | | | | | | | |
Total from investment operations | | | 0.34 | | | | 0.16 | | | | 0.20 | | | | 0.27 | | | | 0.12 | |
Distributions to shareholders from | | | | | | | | | | | | | | | | | | | | |
Net investment income | | | (0.26 | ) | | | (0.24 | ) | | | (0.23 | ) | | | (0.24 | ) | | | (0.25 | ) |
Net realized gains | | | 0.00 | | | | 0.00 | | | | 0.00 | | | | 0.00 | | | | 0.00 | |
| | | | | | | | | | | | | | | | | | | | |
Total distributions to shareholders | | | (0.26 | ) | | | (0.24 | ) | | | (0.23 | ) | | | (0.24 | ) | | | (0.25 | ) |
Net asset value, end of period | | | $8.07 | | | | $7.99 | | | | $8.07 | | | | $8.10 | | | | $8.07 | |
Total return1 | | | 4.40 | % | | | 2.00 | % | | | 2.51 | % | | | 3.37 | % | | | 1.46 | % |
Ratios to average net assets (annualized) | | | | | | | | | | | | | | | | | | | | |
Gross expenses | | | 0.94 | % | | | 0.93 | % | | | 0.92 | % | | | 0.92 | % | | | 0.92 | % |
Net expenses | | | 0.81 | % | | | 0.81 | % | | | 0.81 | % | | | 0.81 | % | | | 0.81 | % |
Net investment income | | | 3.18 | % | | | 2.96 | % | | | 2.88 | % | | | 2.95 | % | | | 3.11 | % |
Supplemental data | | | | | | | | | | | | | | | | | | | | |
Portfolio turnover rate | | | 44 | % | | | 34 | % | | | 35 | % | | | 32 | % | | | 40 | % |
Net assets, end of period (000s omitted) | | | $104,671 | | | | $127,024 | | | | $172,151 | | | | $296,817 | | | | $203,856 | |
| 1 | Total return calculations do not include any sales charges. |
The accompanying notes are an integral part of these financial statements.
Wells Fargo Short-Term High Yield Bond Fund | 21
Financial highlights
(For a share outstanding throughout each period)
| | | | | | | | | | | | | | | | | | | | |
| | | Year ended August 31 | |
| CLASS C | | 2019 | | | 2018 | | | 2017 | | | 2016 | | | 2015 | |
Net asset value, beginning of period | | | $8.00 | | | | $8.07 | | | | $8.10 | | | | $8.07 | | | | $8.20 | |
Net investment income | | | 0.19 | | | | 0.18 | | | | 0.17 | | | | 0.18 | | | | 0.19 | |
Net realized and unrealized gains (losses) on investments | | | 0.08 | | | | (0.07 | ) | | | (0.03 | ) | | | 0.03 | | | | (0.13 | ) |
| | | | | | | | | | | | | | | | | | | | |
Total from investment operations | | | 0.27 | | | | 0.11 | | | | 0.14 | | | | 0.21 | | | | 0.06 | |
Distributions to shareholders from | | | | | | | | | | | | | | | | | | | | |
Net investment income | | | (0.20 | ) | | | (0.18 | ) | | | (0.17 | ) | | | (0.18 | ) | | | (0.19 | ) |
Net realized gains | | | 0.00 | | | | 0.00 | | | | 0.00 | | | | 0.00 | | | | 0.00 | |
| | | | | | | | | | | | | | | | | | | | |
Total distributions to shareholders | | | (0.20 | ) | | | (0.18 | ) | | | (0.17 | ) | | | (0.18 | ) | | | (0.19 | ) |
Net asset value, end of period | | | $8.07 | | | | $8.00 | | | | $8.07 | | | | $8.10 | | | | $8.07 | |
Total return1 | | | 3.49 | % | | | 1.36 | % | | | 1.75 | % | | | 2.60 | % | | | 0.70 | % |
Ratios to average net assets (annualized) | | | | | | | | | | | | | | | | | | | | |
Gross expenses | | | 1.69 | % | | | 1.68 | % | | | 1.67 | % | | | 1.67 | % | | | 1.67 | % |
Net expenses | | | 1.56 | % | | | 1.56 | % | | | 1.56 | % | | | 1.56 | % | | | 1.56 | % |
Net investment income | | | 2.43 | % | | | 2.21 | % | | | 2.11 | % | | | 2.20 | % | | | 2.36 | % |
Supplemental data | | | | | | | | | | | | | | | | | | | | |
Portfolio turnover rate | | | 44 | % | | | 34 | % | | | 35 | % | | | 32 | % | | | 40 | % |
Net assets, end of period (000s omitted) | | | $59,113 | | | | $77,169 | | | | $111,268 | | | | $123,745 | | | | $123,521 | |
| 1 | Total return calculations do not include any sales charges. |
The accompanying notes are an integral part of these financial statements.
22 | Wells Fargo Short-Term High Yield Bond Fund
Financial highlights
(For a share outstanding throughout each period)
| | | | | | | | | | | | | | | | | | | | |
| | | Year ended August 31 | |
| ADMINISTRATOR CLASS | | 2019 | | | 2018 | | | 2017 | | | 2016 | | | 2015 | |
Net asset value, beginning of period | | | $7.99 | | | | $8.07 | | | | $8.10 | | | | $8.07 | | | | $8.20 | |
Net investment income | | | 0.27 | | | | 0.25 | | | | 0.24 | | | | 0.25 | | | | 0.26 | |
Net realized and unrealized gains (losses) on investments | | | 0.08 | | | | (0.08 | ) | | | (0.03 | ) | | | 0.03 | | | | (0.13 | ) |
| | | | | | | | | | | | | | | | | | | | |
Total from investment operations | | | 0.35 | | | | 0.17 | | | | 0.21 | | | | 0.28 | | | | 0.13 | |
Distributions to shareholders from | | | | | | | | | | | | | | | | | | | | |
Net investment income | | | (0.28 | ) | | | (0.25 | ) | | | (0.24 | ) | | | (0.25 | ) | | | (0.26 | ) |
Net realized gains | | | 0.00 | | | | 0.00 | | | | 0.00 | | | | 0.00 | | | | 0.00 | |
| | | | | | | | | | | | | | | | | | | | |
Total distributions to shareholders | | | (0.28 | ) | | | (0.25 | ) | | | (0.24 | ) | | | (0.25 | ) | | | (0.26 | ) |
Net asset value, end of period | | | $8.06 | | | | $7.99 | | | | $8.07 | | | | $8.10 | | | | $8.07 | |
Total return | | | 4.44 | % | | | 2.16 | % | | | 2.68 | % | | | 3.54 | % | | | 1.62 | % |
Ratios to average net assets (annualized) | | | | | | | | | | | | | | | | | | | | |
Gross expenses | | | 0.87 | % | | | 0.86 | % | | | 0.86 | % | | | 0.86 | % | | | 0.85 | % |
Net expenses | | | 0.65 | % | | | 0.65 | % | | | 0.65 | % | | | 0.65 | % | | | 0.65 | % |
Net investment income | | | 3.34 | % | | | 3.13 | % | | | 3.03 | % | | | 3.11 | % | | | 3.28 | % |
Supplemental data | | | | | | | | | | | | | | | | | | | | |
Portfolio turnover rate | | | 44 | % | | | 34 | % | | | 35 | % | | | 32 | % | | | 40 | % |
Net assets, end of period (000s omitted) | | | $86,892 | | | | $102,673 | | | | $134,070 | | | | $274,878 | | | | $328,934 | |
The accompanying notes are an integral part of these financial statements.
Wells Fargo Short-Term High Yield Bond Fund | 23
Financial highlights
(For a share outstanding throughout each period)
| | | | | | | | | | | | | | | | | | | | |
| | | Year ended August 31 | |
| INSTITUTIONAL CLASS | | 2019 | | | 2018 | | | 2017 | | | 2016 | | | 2015 | |
Net asset value, beginning of period | | | $7.98 | | | | $8.06 | | | | $8.09 | | | | $8.06 | | | | $8.18 | |
Net investment income | | | 0.28 | | | | 0.27 | | | | 0.25 | | | | 0.26 | | | | 0.28 | |
Net realized and unrealized gains (losses) on investments | | | 0.08 | | | | (0.08 | ) | | | (0.02 | ) | | | 0.03 | | | | (0.13 | ) |
| | | | | | | | | | | | | | | | | | | | |
Total from investment operations | | | 0.36 | | | | 0.19 | | | | 0.23 | | | | 0.29 | | | | 0.15 | |
Distributions to shareholders from | | | | | | | | | | | | | | | | | | | | |
Net investment income | | | (0.29 | ) | | | (0.27 | ) | | | (0.26 | ) | | | (0.26 | ) | | | (0.27 | ) |
Net realized gains | | | 0.00 | | | | 0.00 | | | | 0.00 | | | | 0.00 | | | | 0.00 | |
| | | | | | | | | | | | | | | | | | | | |
Total distributions to shareholders | | | (0.29 | ) | | | (0.27 | ) | | | (0.26 | ) | | | (0.26 | ) | | | (0.27 | ) |
Net asset value, end of period | | | $8.05 | | | | $7.98 | | | | $8.06 | | | | $8.09 | | | | $8.06 | |
Total return | | | 4.59 | % | | | 2.31 | % | | | 2.83 | % | | | 3.69 | % | | | 1.90 | % |
Ratios to average net assets (annualized) | | | | | | | | | | | | | | | | | | | | |
Gross expenses | | | 0.61 | % | | | 0.59 | % | | | 0.59 | % | | | 0.59 | % | | | 0.59 | % |
Net expenses | | | 0.50 | % | | | 0.50 | % | | | 0.50 | % | | | 0.50 | % | | | 0.50 | % |
Net investment income | | | 3.49 | % | | | 3.27 | % | | | 3.16 | % | | | 3.26 | % | | | 3.40 | % |
Supplemental data | | | | | | | | | | | | | | | | | | | | |
Portfolio turnover rate | | | 44 | % | | | 34 | % | | | 35 | % | | | 32 | % | | | 40 | % |
Net assets, end of period (000s omitted) | | | $701,157 | | | | $764,680 | | | | $1,010,757 | | | | $735,285 | | | | $608,704 | |
The accompanying notes are an integral part of these financial statements.
24 | Wells Fargo Short-Term High Yield Bond Fund
Notes to financial statements
1. ORGANIZATION
Wells Fargo Funds Trust (the “Trust”), a Delaware statutory trust organized on March 10, 1999, is an open-end management investment company registered under the Investment Company Act of 1940, as amended (the “1940 Act”). As an investment company, the Trust follows the accounting and reporting guidance in Financial Accounting Standards Board (“FASB”) Accounting Standards Codification Topic 946, Financial Services – Investment Companies. These financial statements report on the Wells Fargo Short-Term High Yield Bond Fund (the “Fund”) which is a diversified series of the Trust.
2. SIGNIFICANT ACCOUNTING POLICIES
The following significant accounting policies, which are consistently followed in the preparation of the financial statements of the Fund, are in conformity with U.S. generally accepted accounting principles which require management to make estimates and assumptions that affect the reported amounts of assets and liabilities, disclosure of contingent assets and liabilities at the date of the financial statements, and the reported amounts of revenues and expenses during the reporting period. Actual results could differ from those estimates.
Securities valuation
All investments are valued each business day as of the close of regular trading on the New York Stock Exchange (generally 4 p.m. Eastern Time), although the Fund may deviate from this calculation time under unusual or unexpected circumstances.
Debt securities are valued at the evaluated bid price provided by an independent pricing service (e.g. taking into account various factors, including yields, maturities, or credit ratings) or, if a reliable price is not available, the quoted bid price from an independent broker-dealer.
Investments in registered open-end investment companies are valued at net asset value. Interests in non-registered investment companies that are redeemable at net asset value are fair valued normally at net asset value.
Investments which are not valued using any of the methods discussed above are valued at their fair value, as determined in good faith by the Board of Trustees of the Fund The Board of Trustees has established a Valuation Committee comprised of the Trustees and has delegated to it the authority to take any actions regarding the valuation of portfolio securities that the Valuation Committee deems necessary or appropriate, including determining the fair value of portfolio securities, unless the determination has been delegated to the Wells Fargo Asset Management Pricing Committee at Wells Fargo Funds Management, LLC (“Funds Management”). The Board of Trustees retains the authority to make or ratify any valuation decisions or approve any changes to the Valuation Procedures as it deems appropriate. On a quarterly basis, the Board of Trustees receives reports on any valuation actions taken by the Valuation Committee or the Wells Fargo Asset Management Pricing Committee which may include items for ratification.
Securities lending
The Fund may lend its securities from time to time in order to earn additional income in the form of fees or interest on securities received as collateral or the investment of any cash received as collateral. When securities are on loan, the Fund receives interest or dividends on those securities. Cash collateral received in connection with its securities lending transactions is invested in Securities Lending Cash Investments, LLC (the “Securities Lending Fund”). Investments in Securities Lending Fund are valued at the evaluated bid price provided by an independent pricing service. Income earned from investment in the Securities Lending Fund (net of fees and rebates), if any, is included in income from affiliated securities on the Statement of Operations.
In a securities lending transaction, the net asset value of the Fund will be affected by an increase or decrease in the value of the securities loaned and by an increase or decrease in the value of the instrument in which collateral is invested. The amount of securities lending activity undertaken by the Fund fluctuates from time to time. The Fund has the right under the lending agreement to recover the securities from the borrower on demand. In the event of default or bankruptcy by the borrower, the Fund may be prevented from recovering the loaned securities or gaining access to the collateral or may experience delays or costs in doing so. In such an event, the terms of the agreement allows the unaffiliated securities lending agent to use the collateral to purchase replacement securities on behalf of the Fund or pay the Fund the market value of the loaned securities. The Fund will bear the risk of loss with respect to depreciation of its investment of the cash collateral.
When-issued transactions
The Fund may purchase securities on a forward commitment or when-issued basis. The Fund records a when-issued transaction on the trade date and will segregate assets in an amount at least equal in value to the Fund’s commitment to purchase when-issued securities. Securities purchased on a when-issued basis are marked-to-market daily and the Fund begins earning interest on the settlement date. Losses may arise due to changes in the market value of the underlying securities or if the counterparty does not perform under the contract.
Wells Fargo Short-Term High Yield Bond Fund | 25
Notes to financial statements
Loans
The Fund may invest in direct debt instruments which are interests in amounts owed to lenders by corporate or other borrowers. The loans pay interest at rates which are periodically reset by reference to a base lending rate plus a spread. Investments in loans may be in the form of participations in loans or assignments of all or a portion of loans from third parties. When the Fund purchases participations, it generally has no rights to enforce compliance with the terms of the loan agreement with the borrower. As a result, the Fund assumes the credit risk of both the borrower and the lender that is selling the participation. When the Fund purchases assignments from lenders, it acquires direct rights against the borrower on the loan and may enforce compliance by the borrower with the terms of the loan agreement. Loans may include fully funded term loans or unfunded loan commitments, which are contractual obligations for future funding.
Security transactions and income recognition
Securities transactions are recorded on a trade date basis. Realized gains or losses are recorded on the basis of identified cost.
Interest income is accrued daily and bond discounts are accreted and premiums are amortized daily. To the extent debt obligations are placed on non-accrual status, any related interest income may be reduced by writing off interest receivables when the collection of all or a portion of interest has been determined to be doubtful based on consistently applied procedures and the fair value has decreased. If the issuer subsequently resumes interest payments or when the collectability of interest is reasonably assured, the debt obligation is removed from non-accrual status.
Distributions to shareholders
Distributions to shareholders from net investment income are declared daily and paid monthly. Distributions from net realized gains, if any, are recorded on the ex-dividend date and paid at least annually. Such distributions are determined in accordance with income tax regulations and may differ from U.S. generally accepted accounting principles. Dividend sources are estimated at the time of declaration. The tax character of distributions is determined as of the Fund’s fiscal year end. Therefore, a portion of the Fund’s distributions made prior to the Fund’s fiscal year end may be categorized as a tax return of capital at year end.
Federal and other taxes
The Fund intends to continue to qualify as a regulated investment company by distributing substantially all of its investment company taxable income and any net realized capital gains (after reduction for capital loss carryforwards) sufficient to relieve it from all, or substantially all, federal income taxes. Accordingly, no provision for federal income taxes was required.
The Fund’s income and federal excise tax returns and all financial records supporting those returns for the prior three fiscal years are subject to examination by the federal and Delaware revenue authorities. Management has analyzed the Fund’s tax positions taken on federal, state, and foreign tax returns for all open tax years and does not believe that there are any uncertain tax positions that require recognition of a tax liability.
As of August 31, 2019, the aggregate cost of all investments for federal income tax purposes was $946,242,604 and the unrealized gains (losses) consisted of:
| | | | |
| |
Gross unrealized gains | | $ | 3,811,156 | |
| |
Gross unrealized losses | | | (3,119,297 | ) |
| |
Net unrealized gains | | $ | 691,859 | |
As of August 31, 2019, the Fund had capital loss carryforwards available to offset future net realized capital gains which consist of $11,453,225 in short-term capital losses and $25,995,472 in long-term capital losses.
Class allocations
The separate classes of shares offered by the Fund differ principally in applicable sales charges, distribution, shareholder servicing, and administration fees. Class specific expenses are charged directly to that share class. Investment income, common fund-level expenses, and realized and unrealized gains (losses) on investments are allocated daily to each class of shares based on the relative proportion of net assets of each class.
3. FAIR VALUATION MEASUREMENTS
Fair value measurements of investments are determined within a framework that has established a fair value hierarchy based upon the various data inputs utilized in determining the value of the Fund’s investments. The three-level hierarchy gives the highest priority to unadjusted quoted prices in active markets for identical assets or liabilities (Level 1) and the lowest priority to
26 | Wells Fargo Short-Term High Yield Bond Fund
Notes to financial statements
unobservable inputs (Level 3). The Fund’s investments are classified within the fair value hierarchy based on the lowest level of input that is significant to the fair value measurement. The inputs are summarized into three broad levels as follows:
| ∎ | | Level 1 – quoted prices in active markets for identical securities |
| ∎ | | Level 2 – other significant observable inputs (including quoted prices for similar securities, interest rates, prepayment speeds, credit risk, etc.) |
| ∎ | | Level 3 – significant unobservable inputs (including the Fund’s own assumptions in determining the fair value of investments) |
The inputs or methodologies used for valuing investments in securities are not necessarily an indication of the risk associated with investing in those securities.
The following is a summary of the inputs used in valuing the Fund’s assets and liabilities as of August 31, 2019:
| | | | | | | | | | | | | | | | |
| | | | |
| | | Quoted prices
(Level 1) | | | Other significant
observable inputs
(Level 2) | | | Significant
unobservable inputs (Level 3) | | | Total | |
| | | | |
Assets | | | | | | | | | | | | | | | | |
Investments in: | | | | | | | | | | | | | | | | |
| | | | |
Corporate bonds and notes | | $ | 0 | | | $ | 603,854,806 | | | $ | 0 | | | $ | 603,854,806 | |
| | | | |
Loans | | | 0 | | | | 195,713,560 | | | | 6,794,351 | | | | 202,507,911 | |
| | | | |
Non-agency mortgage-backed securities | | | 0 | | | | 20,938 | | | | 0 | | | | 20,938 | |
| | | | |
Yankee corporate bonds and notes | | | 0 | | | | 87,022,643 | | | | 0 | | | | 87,022,643 | |
| | | | |
Short-term investments | | | | | | | | | | | | | | | | |
| | | | |
Investment companies | | | 53,528,165 | | | | 0 | | | | 0 | | | | 53,528,165 | |
| | | | |
Total assets | | $ | 53,528,165 | | | $ | 886,611,947 | | | $ | 6,794,351 | | | $ | 946,934,463 | |
Additional sector, industry or geographic detail is included in the Portfolio of Investments.
For the year ended August 31, 2019, the Fund had no material transfers into/out of Level 3.
4. TRANSACTIONS WITH AFFILIATES
Management fee
Funds Management, an indirect wholly owned subsidiary of Wells Fargo & Company (“Wells Fargo”) is the manager of the Fund and provides advisory and fund-level administrative services under an investment management agreement. Under the investment management agreement, Funds Management is responsible for, among other services, implementing the investment objectives and strategies of the Fund, supervising the subadviser and providing fund-level administrative services in connection with the Fund’s operations. As compensation for its services under the investment management agreement, Funds Management is entitled to receive a management fee at the following annual rate based on the Fund’s average daily net assets:
| | | | |
| |
| Average daily net assets | | Management Fee | |
| |
First $500 million | | | 0.500 | % |
| |
Next $500 million | | | 0.475 | |
| |
Next $2 billion | | | 0.450 | |
| |
Next $2 billion | | | 0.425 | |
| |
Next $5 billion | | | 0.390 | |
| |
Over $10 billion | | | 0.380 | |
For the year ended August 31, 2019, the management fee was equivalent to an annual rate of 0.49% of the Fund’s average daily net assets.
Funds Management has retained the services of a subadviser to provide daily portfolio management to the Fund. The fee for subadvisory services is borne by Funds Management. Wells Capital Management Incorporated (“WellsCap”), an affiliate of Funds Management and an indirect wholly owned subsidiary of Wells Fargo, is the subadviser to the Fund and is entitled to receive a fee from Funds Management at an annual rate starting at 0.35% and declining to 0.20% as the average daily net assets of the Fund increase.
Wells Fargo Short-Term High Yield Bond Fund | 27
Notes to financial statements
Administration fees
Under a class-level administration agreement, Funds Management provides class-level administrative services to the Fund, which includes paying fees and expenses for services provided by the transfer agent, sub-transfer agents, omnibus account servicers and record-keepers. As compensation for its services under the class-level administration agreement, Funds Management receives an annual fee which is calculated based on the average daily net assets of each class as follows:
| | | | |
| |
| | | Class-level
administration fee | |
| |
Class A, Class C | | | 0.16 | % |
| |
Administrator Class | | | 0.10 | |
| |
Institutional Class | | | 0.08 | |
Waivers and/or expense reimbursements
Funds Management has contractually waived and/or reimbursed management and administration fees to the extent necessary to maintain certain net operating expense ratios for the Fund. When each class of the Fund has exceeded its expense cap, Funds Management has waived fees and/or reimbursed expenses from fund-level expenses on a proportionate basis and then from class specific expenses. When only certain classes exceed their expense caps, waivers and/or reimbursements are applied against class specific expenses before fund-level expenses. Funds Management has committed through December 31, 2019 to waive fees and/or reimburse expenses to the extent necessary to cap the Fund’s expenses at 0.81% for Class A shares, 1.56% for Class C shares, 0.65% for Administrator Class shares, and 0.50% for Institutional Class shares. Prior to or after the commitment expiration date, the cap may be increased or the commitment to maintain the cap may be terminated only with the approval of the Board of Trustees.
Distribution fee
The Trust has adopted a distribution plan for Class C shares of the Fund pursuant to Rule 12b-1 under the 1940 Act. A distribution fee is charged to Class C shares and paid to Wells Fargo Funds Distributor, LLC (“Funds Distributor”), the principal underwriter, at an annual rate of 0.75% of the average daily net assets of Class C shares.
In addition, Funds Distributor is entitled to receive the front-end sales charge from the purchase of Class A shares and a contingent deferred sales charge on the redemption of certain Class A shares. Funds Distributor is also entitled to receive the contingent deferred sales charges from redemptions of Class C shares. For the year ended August 31, 2019, Funds Distributor received $2,468 from the sale of Class A shares and $1,031, in contingent deferred sales charges from redemptions of Class C shares. No contingent deferred sales charges were incurred by Class A shares for the year ended August 31, 2019.
Shareholder servicing fees
The Trust has entered into contracts with one or more shareholder servicing agents, whereby Class A, Class C and Administrator Class of the Fund are charged a fee at an annual rate of 0.25% of the average daily net assets of each respective class. A portion of these total shareholder servicing fees were paid to affiliates of Wells Fargo.
Interfund transactions
The Fund may purchase or sell portfolio investment securities to certain other Wells Fargo affiliates pursuant to Rule 17a-7 under the 1940 Act and under procedures adopted by the Board of Trustees. The procedures have been designed to ensure that these interfund transactions, which do not incur broker commissions, are effected at current market prices.
5. INVESTMENT PORTFOLIO TRANSACTIONS
Purchases and sales of investments, excluding U.S. government obligations (if any) and short-term securities, for the year ended August 31, 2019 were $425,219,949 and $405,355,857, respectively.
As of August 31, 2019, the Fund had unfunded term loan commitments of $11,588,281.
6. SECURITIES LENDING TRANSACTIONS
The Fund lends its securities through an unaffiliated securities lending agent and receives collateral in the form of cash or securities with a value at least equal to the value of the securities on loan. The value of the loaned securities is determined at the close of each business day and any increases or decreases in the required collateral are exchanged between the Fund and the counterparty on the next business day. Cash collateral received is invested in the Securities Lending Fund which seeks to provide a positive return compared to the daily Fed Funds Open Rate by investing in high-quality, U.S. dollar-denominated
28 | Wells Fargo Short-Term High Yield Bond Fund
Notes to financial statements
short-term money market instruments and is exempt from registration under Section 3(c)(7) of the 1940 Act. Securities Lending Fund is managed by Funds Management and is subadvised by WellsCap. Funds Management receives an advisory fee starting at 0.05% and declining to 0.01% as the average daily net assets of the Securities Lending Fund increase. All of the fees received by Funds Management are paid to WellsCap for its services as subadviser. In the event of counterparty default or the failure of a borrower to return a loaned security, the Fund has the right to use the collateral to offset any losses incurred.
In the event of counterparty default or the failure of a borrower to return a loaned security, the Fund has the right to use the collateral to offset any losses incurred. As of August 31, 2019, the Fund had securities lending transactions with the following counterparties which are subject to offset:
| | | | | | | | | | | | |
| | | |
| Counterparty | | Value of
securities on
loan | | | Collateral
received1 | | | Net amount | |
| | | |
Barclays Capital Inc. | | $ | 3,678,763 | | | $ | (3,678,763 | ) | | $ | 0 | |
| | | |
Citigroup Global Markets Inc. | | | 1,897,054 | | | | (1,897,054 | ) | | | 0 | |
| 1 | Collateral received within this table is limited to the collateral for the net transaction with the counterparty. |
7. BANK BORROWINGS
The Trust (excluding the money market funds), Wells Fargo Master Trust and Wells Fargo Variable Trust are parties to a $280,000,000 revolving credit agreement whereby the Fund is permitted to use bank borrowings for temporary or emergency purposes, such as to fund shareholder redemption requests. Interest under the credit agreement is charged to the Fund based on a borrowing rate equal to the higher of the Federal Funds rate in effect on that day plus 1.25% or the overnight LIBOR rate in effect on that day plus 1.25%. In addition, an annual commitment fee equal to 0.25% of the unused balance is allocated to each participating fund.
For the year ended August 31, 2019, there were no borrowings by the Fund under the agreement.
8. DISTRIBUTIONS TO SHAREHOLDERS
The tax character of distributions paid was $34,301,055 and $39,073,480 of ordinary income for the years ended August 31, 2019 and August 31, 2018, respectively.
As of August 31, 2019, the components of distributable earnings on a tax basis were as follows:
| | | | |
Undistributed ordinary income | | Unrealized gains | | Capital loss carryforward |
| | |
$439,115 | | $691,859 | | $(37,448,697) |
Effective for all filings after November 4, 2018, the Securities and Exchange Commission eliminated the requirement to separately state the components of distributions to shareholders under U.S. generally accepted accounting principles. The amounts of distributions to shareholders for the year ended August 31, 2018 were as follows:
| | | | |
| |
| | | Net investment
income | |
| |
Class A | | | $4,410,776 | |
| |
Class C | | | 2,041,138 | |
| |
Administrator Class | | | 3,531,933 | |
| |
Institutional Class | | | 29,089,633 | |
9. INDEMNIFICATION
Under the Trust’s organizational documents, the officers and Trustees have been granted certain indemnification rights against certain liabilities that may arise out of performance of their duties to the Trust. Additionally, in the normal course of business, the Trust may enter into contracts with service providers that contain a variety of indemnification clauses. The Trust’s maximum exposure under these arrangements is dependent on future claims that may be made against the Fund and, therefore, cannot be estimated.
Wells Fargo Short-Term High Yield Bond Fund | 29
Notes to financial statements
10. NEW ACCOUNTING PRONOUNCEMENTS
In August 2018, FASB issued Accounting Standards Update (“ASU”) No. 2018-13, Fair Value Measurement (Topic 820)Disclosure Framework—Changes to the Disclosure Requirements for Fair Value Measurement. ASU 2018-13 updates the disclosure requirements for fair value measurements by modifying or removing certain disclosures and adding certain new disclosures. The amendments are effective for fiscal years, and interim periods within those fiscal years, beginning after December 15, 2019. Early adoption is permitted. Management has adopted the removal and modification of disclosures early, as permitted, and will adopt the additional new disclosures at the effective date.
In March 2017, FASB issued ASU No. 2017-08,Premium Amortization on Purchased Callable Debt Securities. ASU 2017-08 shortens the amortization period for certain callable debt securities held at a premium and requires the premium to be amortized to the earliest call date. The amendments do not require an accounting change for securities held at a discount and discounts will continue to be accreted to the maturity date of the security. ASU 2017-08 is effective for fiscal years beginning after December 15, 2018 and for interim periods within those fiscal years. During the current reporting period, management of the Fund adopted the change in accounting policy which did not have a material impact to the Fund’s financial statements.
30 | Wells Fargo Short-Term High Yield Bond Fund
Report of independent registered public accounting firm
TO THE SHAREHOLDERS OF THE FUND AND BOARD OF TRUSTEES OF WELLS FARGO FUNDS TRUST:
Opinion on the Financial Statements
We have audited the accompanying statement of assets and liabilities of Wells Fargo Short-Term High Yield Bond Fund (the Fund), one of the funds constituting Wells Fargo Funds Trust, including the portfolio of investments, as of August 31, 2019, the related statement of operations for the year then ended, the statements of changes in net assets for each of the years in the two-year period then ended, and the related notes (collectively, the financial statements) and the financial highlights for each of the years in the five-year period then ended. In our opinion, the financial statements and financial highlights present fairly, in all material respects, the financial position of the Fund as of August 31, 2019, the results of its operations for the year then ended, the changes in its net assets for each of the years in the two-year period then ended, and the financial highlights for each of the years in the five-year period then ended, in conformity with U.S. generally accepted accounting principles.
Basis for Opinion
These financial statements and financial highlights are the responsibility of the Fund’s management. Our responsibility is to express an opinion on these financial statements and financial highlights based on our audits. We are a public accounting firm registered with the Public Company Accounting Oversight Board (United States) (PCAOB) and are required to be independent with respect to the Fund in accordance with the U.S. federal securities laws and the applicable rules and regulations of the Securities and Exchange Commission and the PCAOB.
We conducted our audits in accordance with the standards of the PCAOB. Those standards require that we plan and perform the audit to obtain reasonable assurance about whether the financial statements and financial highlights are free of material misstatement, whether due to error or fraud. Our audits included performing procedures to assess the risks of material misstatement of the financial statements and financial highlights, whether due to error or fraud, and performing procedures that respond to those risks. Such procedures included examining, on a test basis, evidence regarding the amounts and disclosures in the financial statements and financial highlights. Such procedures also included confirmation of securities owned as of August 31, 2019, by correspondence with the custodian, transfer agent and brokers, or by other appropriate auditing procedures. Our audits also included evaluating the accounting principles used and significant estimates made by management, as well as evaluating the overall presentation of the financial statements and financial highlights. We believe that our audits provide a reasonable basis for our opinion.

We have not been able to determine the specific year that we began serving as the auditor of one or more Wells Fargo Funds investment companies; however we are aware that we have served as the auditor of one or more Wells Fargo Funds investment companies since at least 1955.
Boston, Massachusetts
October 28, 2019
Wells Fargo Short-Term High Yield Bond Fund | 31
Other information (unaudited)
TAX INFORMATION
For the fiscal year ended August 31, 2019, $20,618,628 has been designated as interest-related dividends for nonresident alien shareholders pursuant to Section 871 of the Internal Revenue Code.
PROXY VOTING INFORMATION
A description of the policies and procedures used to determine how to vote proxies relating to portfolio securities is available, upon request, by calling1-800-222-8222, visiting our website atwfam.com, or visiting the SEC website at sec.gov. Information regarding how the proxies related to portfolio securities were voted during the most recent 12-month period ended June 30 is available on the website atwfam.comor by visiting the SEC website at sec.gov.
QUARTERLY PORTFOLIO HOLDINGS INFORMATION
The Fund files its complete schedule of portfolio holdings with the SEC for the first and third quarters of each fiscal year on Form N-Q or Form N-PORT, which is available by visiting the SEC website at sec.gov. Those forms may be reviewed and copied at the SEC’s Public Reference Room in Washington, DC. Information on the operation of the Public Reference Room may be obtained by calling1-800-SEC-0330.
32 | Wells Fargo Short-Term High Yield Bond Fund
Other information (unaudited)
BOARD OF TRUSTEES AND OFFICERS
Each of the Trustees and Officers1 listed in the table below acts in identical capacities for each fund in the Wells Fargo family of funds, which consists of 152 mutual funds comprising the Wells Fargo Funds Trust, Wells Fargo Variable Trust, Wells Fargo Master Trust and four closed-end funds (collectively the “Fund Complex”). This table should be read in conjunction with the Prospectus and the Statement of Additional Information2. The mailing address of each Trustee and Officer is 525 Market Street, 12th Floor, San Francisco, CA 94105. Each Trustee and Officer serves an indefinite term, however, each Trustee serves such term until reaching the mandatory retirement age established by the Trustees.
Independent Trustees
| | | | | | |
Name and year of birth | | Position held and
length of service* | | Principal occupations during past five years or longer | | Current other
public company or
investment
company
directorships |
| | | |
William R. Ebsworth (Born 1957) | | Trustee, since 2015 | | Retired. From 1984 to 2013, equities analyst, portfolio manager, research director and chief investment officer at Fidelity Management and Research Company in Boston, Tokyo, and Hong Kong, and retired in 2013 as Chief Investment Officer of Fidelity Strategic Advisers, Inc. where he led a team of investment professionals managing client assets. Prior thereto, Board member of Hong Kong Securities Clearing Co., Hong Kong Options Clearing Corp., the Thailand International Fund, Ltd., Fidelity Investments Life Insurance Company, and Empire Fidelity Investments Life Insurance Company. Audit Committee Chair and Investment Committee Chair of the Vincent Memorial Hospital Endowment (non-profit organization). Mr. Ebsworth is a CFA® charterholder. | | N/A |
| | | |
Jane A. Freeman (Born 1953) | | Trustee, since 2015; Chair Liaison, since 2018 | | Retired. From 2012 to 2014 and 1999 to 2008, Chief Financial Officer of Scientific Learning Corporation. From 2008 to 2012, Ms. Freeman provided consulting services related to strategic business projects. Prior to 1999, Portfolio Manager at Rockefeller & Co. and Scudder, Stevens & Clark. Board member of the Harding Loevner Funds from 1996 to 2014, serving as both Lead Independent Director and chair of the Audit Committee. Board member of the Russell Exchange Traded Funds Trust from 2011 to 2012 and the chair of the Audit Committee. Ms. Freeman is a Board Member of The Ruth Bancroft Garden (non-profit organization). She is also an inactive Chartered Financial Analyst. | | N/A |
| | | |
Isaiah Harris, Jr. (Born 1952) | | Trustee, since 2009; Audit Committee Chairman, since 2019 | | Retired. Chairman of the Board of CIGNA Corporation since 2009, and Director since 2005. From 2003 to 2011, Director of Deluxe Corporation. Prior thereto, President and CEO of BellSouth Advertising and Publishing Corp. from 2005 to 2007, President and CEO of BellSouth Enterprises from 2004 to 2005 and President of BellSouth Consumer Services from 2000 to 2003. Emeritus member of the Iowa State University Foundation Board of Governors. Emeritus Member of the Advisory Board of Iowa State University School of Business. Advisory Board Member, Palm Harbor Academy (private school). Advisory Board Member, Child Evangelism Fellowship (non-profit). Mr. Harris is a certified public accountant (inactive status). | | CIGNA Corporation |
| | | |
Judith M. Johnson (Born 1949) | | Trustee, since 2008; Audit Committee Chairman, from 2009 to 2018 | | Retired. Prior thereto, Chief Executive Officer and Chief Investment Officer of Minneapolis Employees Retirement Fund from 1996 to 2008. Ms. Johnson is an attorney, certified public accountant and a certified managerial accountant. | | N/A |
Wells Fargo Short-Term High Yield Bond Fund | 33
Other information (unaudited)
| | | | | | |
Name and year of birth | | Position held and
length of service* | | Principal occupations during past five years or longer | | Current other
public company or
investment
company
directorships |
| | | |
David F. Larcker (Born 1950) | | Trustee, since 2009 | | James Irvin Miller Professor of Accounting at the Graduate School of Business, Stanford University, Director of the Corporate Governance Research Initiative and Senior Faculty of The Rock Center for Corporate Governance since 2006. From 2005 to 2008, Professor of Accounting at the Graduate School of Business, Stanford University. Prior thereto, Ernst & Young Professor of Accounting at The Wharton School, University of Pennsylvania from 1985 to 2005. | | N/A |
| | | |
Olivia S. Mitchell (Born 1953) | | Trustee, since 2006; Nominating and Governance Committee Chairman, since 2018 | | International Foundation of Employee Benefit Plans Professor, Wharton School of the University of Pennsylvania since 1993. Director of Wharton’s Pension Research Council and Boettner Center on Pensions & Retirement Research, and Research Associate at the National Bureau of Economic Research. Previously, Cornell University Professor from 1978 to 1993. | | N/A |
| | | |
Timothy J. Penny (Born 1951) | | Trustee, since 1996; Chairman, since 2018 | | President and Chief Executive Officer of Southern Minnesota Initiative Foundation, a non-profit organization, since 2007. Member of the Board of Trustees of NorthStar Education Finance, Inc., a non-profit organization, since 2007. | | N/A |
| | | |
James G. Polisson (Born 1959) | | Trustee, since 2018 | | Retired. Chief Marketing Officer, Source (ETF) UK Services, Ltd, from 2015 to 2017. From 2012 to 2015, Principal of The Polisson Group, LLC, a management consulting, corporate advisory and principal investing company. Chief Executive Officer and Managing Director at Russell Investments, Global Exchange Traded Funds from 2010 to 2012. Managing Director of Barclays Global Investors from 1998 to 2010 and Global Chief Marketing Officer for iShares and Barclays Global Investors from 2000 to 2010. Trustee of the San Francisco Mechanics’ Institute, a non-profit organization, from 2013 to 2015. Board member of the Russell Exchange Traded Fund Trust from 2011 to 2012. Director of Barclays Global Investors Holdings Deutschland GmbH from 2006 to 2009. Mr. Polisson is an attorney and has a retired status with the Massachusetts and District of Columbia Bar Associations. | | N/A |
| * | Length of service dates reflect the Trustee’s commencement of service with the Trust’s predecessor entities, where applicable. |
34 | Wells Fargo Short-Term High Yield Bond Fund
Other information (unaudited)
Officers
| | | | |
Name and year of birth | | Position held and
length of service | | Principal occupations during past five years or longer |
| | |
| Andrew Owen (Born 1960) | | President, since 2017 | | Executive Vice President of Wells Fargo & Company and Head of Affiliated Managers, Wells Fargo Asset Management, since 2014. In addition, Mr. Owen is currently President, Chief Executive Officer and Director of Wells Fargo Funds Management, LLC since 2017. Prior thereto, Executive Vice President responsible for marketing, investments and product development for Wells Fargo Funds Management, LLC, from 2009 to 2014. |
| | |
| Nancy Wiser1 (Born 1967) | | Treasurer, since 2012 | | Executive Vice President of Wells Fargo Funds Management, LLC since 2011. Chief Operating Officer and Chief Compliance Officer at LightBox Capital Management LLC, from 2008 to 2011. |
| | |
| Michelle Rhee3 (Born 1966) | | Chief Legal Officer, since 2019 | | Secretary of Wells Fargo Funds Management, LLC, Chief Legal Counsel of Wells Fargo Asset Management and Assistant General Counsel of Wells Fargo Bank, N.A. since 2018. Associate General Counsel and Managing Director of Bank of America Corporation from 2004 to 2018. |
| | |
| Catherine Kennedy4 (Born 1969) | | Secretary, since 2019 | | Vice President of Wells Fargo Funds Management, LLC and Senior Counsel of the Wells Fargo Legal Department since 2010. Vice President and Senior Counsel of Evergreen Investment Management Company, LLC from 1998 to 2010. |
| | |
| Michael H. Whitaker (Born 1967) | | Chief Compliance Officer, since 2016 | | Chief Compliance Officer of Wells Fargo Asset Management since 2016. Senior Vice President and Chief Compliance Officer for Fidelity Investments from 2007 to 2016. |
| | |
| David Berardi (Born 1975) | | Assistant Treasurer, since 2009 | | Vice President of Wells Fargo Funds Management, LLC since 2009. Vice President of Evergreen Investment Management Company, LLC from 2008 to 2010. Manager of Fund Reporting and Control for Evergreen Investment Management Company, LLC from 2004 to 2010. |
| | |
| Jeremy DePalma1 (Born 1974) | | Assistant Treasurer, since 2009 | | Senior Vice President of Wells Fargo Funds Management, LLC since 2009. Senior Vice President of Evergreen Investment Management Company, LLC from 2008 to 2010 and head of the Fund Reporting and Control Team within Fund Administration from 2005 to 2010. |
| 1 | Nancy Wiser acts as Treasurer of 65 funds in the Fund Complex. Jeremy DePalma acts as Treasurer of 87 funds and Assistant Treasurer of 65 funds in the Fund Complex. |
| 2 | The Statement of Additional Information includes additional information about the Trustees and is available, without charge, upon request, by calling1-800-222-8222 or by visiting the website atwfam.com. |
| 3 | Michelle Rhee became Chief Legal Officer effective October 22, 2019. |
| 4 | Catherine Kennedy became Secretary effective October 22, 2019. |
Wells Fargo Short-Term High Yield Bond Fund | 35
Other information (unaudited)
BOARD CONSIDERATION OF INVESTMENT MANAGEMENT AND SUB-ADVISORY AGREEMENTS:
Wells Fargo Short-Term High Yield Bond Fund
Under the Investment Company Act of 1940 (the “1940 Act”), the Board of Trustees (the “Board”) of Wells Fargo Funds Trust (the “Trust”) must determine annually whether to approve the continuation of the Trust’s investment management and sub-advisory agreements. In this regard, at an in-person meeting held on May 21-22, 2019 (the “Meeting”), the Board, all the members of which have no direct or indirect interest in the investment management and sub-advisory agreements and are not “interested persons” of the Trust, as defined in the 1940 Act (the “Independent Trustees”), reviewed and approved for Wells Fargo Short-Term High Yield Bond Fund (the “Fund”): (i) an investment management agreement (the “Management Agreement”) with Wells Fargo Funds Management, LLC (“Funds Management”); and (ii) an investment sub-advisory agreement (the “Sub-Advisory Agreement”) with Wells Capital Management Incorporated (the “Sub-Adviser”), an affiliate of Funds Management. The Management Agreement and the Sub-Advisory Agreement are collectively referred to as the “Advisory Agreements.”
At the Meeting, the Board considered the factors and reached the conclusions described below relating to the selection of Funds Management and the Sub-Adviser and the approval of the Advisory Agreements. Prior to the Meeting, including at an in-person meeting in April 2019, the Trustees conferred extensively among themselves and with representatives of Funds Management about these matters. Also, the Board has adopted a team-based approach, with each team consisting of a sub-set of Trustees, to assist the full Board in the discharge of its duties in reviewing investment performance and other matters throughout the year. The Independent Trustees were assisted in their evaluation of the Advisory Agreements by independent legal counsel, from whom they received separate legal advice and with whom they met separately.
In providing information to the Board, Funds Management and the Sub-Adviser were guided by a detailed set of requests for information submitted to them by independent legal counsel on behalf of the Independent Trustees at the start of the Board’s annual contract renewal process earlier in 2019. In considering and approving the Advisory Agreements, the Trustees considered the information they believed relevant, including but not limited to the information discussed below. The Board considered not only the specific information presented in connection with the Meeting, but also the knowledge gained over time through interaction with Funds Management and the Sub-Adviser about various topics. In this regard, the Board reviewed reports of Funds Management at each of its quarterly meetings, which included, among other things, portfolio reviews and investment performance reports. In addition, the Board and the teams mentioned above confer with portfolio managers at various times throughout the year. The Board did not identify any particular information or consideration that was all-important or controlling, and each individual Trustee may have attributed different weights to various factors.
After its deliberations, the Board unanimously approved the continuation of the Advisory Agreements for a one-year term and determined that the compensation payable to Funds Management and the Sub-Adviser under each of the Advisory Agreements was reasonable. The Board considered the approval of the Advisory Agreements for the Fund as part of its consideration of agreements for funds across the complex, but its approvals were made on a fund-by-fund basis. The following summarizes a number of important, but not necessarily all, factors considered by the Board in support of its approvals.
Nature, extent and quality of services
The Board received and considered various information regarding the nature, extent and quality of services provided to the Fund by Funds Management and the Sub-Adviser under the Advisory Agreements. This information included a description of the investment advisory services and Fund-level administrative services covered by the Management Agreement, as well as, among other things, a summary of the background and experience of senior management of Wells Fargo Asset Management (“WFAM”), of which Funds Management and the Sub-Adviser are a part, a summary of investments made in the business of WFAM, a summary of certain organizational and personnel changes involving Funds Management and the Sub-Adviser, and a description of Funds Management’s and the Sub-Adviser’s business continuity planning programs and of their approaches to data privacy and cybersecurity. The Board received and reviewed information about Funds Management’s role as administrator of the Fund’s liquidity risk management program. The Board also considered the qualifications, background, tenure and responsibilities of each of the portfolio managers primarily responsible for the day-to-day portfolio management of the Fund.
The Board evaluated the ability of Funds Management and the Sub-Adviser to attract and retain qualified investment professionals, including research, advisory and supervisory personnel. The Board further considered the compliance programs and compliance records of Funds Management and the Sub-Adviser. In addition, the Board took into account the full range of services provided to the Fund by Funds Management and its affiliates.
36 | Wells Fargo Short-Term High Yield Bond Fund
Other information (unaudited)
Fund investment performance and expenses
The Board considered the investment performance results for the Fund over various time periods ended December 31, 2018. The Board considered these results in comparison to the investment performance of funds in a universe that was determined by Broadridge Inc. (“Broadridge”) to be similar to the Fund (the “Universe”), and in comparison to the Fund’s benchmark index and to other comparative data. Broadridge is an independent provider of investment company data. The Board received a description of the methodology used by Broadridge to select the mutual funds in the performance Universe. The Board noted that the investment performance of the Fund (Class A) was higher than the average investment performance of the Universe for the one-year period under review, but lower than the average investment performance of the Universe for the three-, five- and ten-year periods under review. The Board also noted that the investment performance of the Fund was lower than its benchmark index, the ICE BofAML High Yield U.S. Corporates, Cash Pay, BB Rated, 1-5 Year Index, for the three-, five- and ten-year periods under review, but higher than its benchmark for the one-year period under review.
The Board received information concerning, and discussed factors contributing to, the underperformance of the Fund relative to the Universe and benchmark for the periods identified above. The Board took note of the explanations for the relative underperformance during these periods, including with respect to investment strategies and structural biases, as well as those regarding market factors, that affected the Fund’s investment performance. The Board also took note of the Fund’s short-term outperformance relative to the Universe and benchmark, and of the Fund’s ability to generate positive performance with less than half of the volatility experienced by the other mutual funds in the Universe.
The Board also received and considered information regarding the Fund’s net operating expense ratios and their various components, including actual management fees, custodian and other non-management fees, and Rule 12b-1 and non-Rule 12b-1 shareholder service fees. The Board considered these ratios in comparison to the median ratios of funds in class-specific expense groups that were determined by Broadridge to be similar to the Fund (the “Groups”). The Board received a description of the methodology used by Broadridge to select the mutual funds in the expense Groups and an explanation of how funds comprising expense groups and their expense ratios may vary from year-to-year. Based on the Broadridge reports, the Board noted that the net operating expense ratios of the Fund were lower than the median net operating expense ratios of the expense Groups for each share class.
The Board took into account the Fund’s investment performance and expense information provided to it among the factors considered in deciding to re-approve the Advisory Agreements.
Investment management and sub-advisory fee rates
The Board reviewed and considered the contractual fee rates payable by the Fund to Funds Management under the Management Agreement, as well as the contractual fee rates payable by the Fund to Funds Management for class-level administrative services under a Class-Level Administration Agreement, which include, among other things, class-level transfer agency and sub-transfer agency costs (collectively, the “Management Rates”). The Board also reviewed and considered the contractual investment sub-advisory fee rates that are payable by Funds Management to the Sub-Adviser for investment sub-advisory services.
Among other information reviewed by the Board was a comparison of the Fund’s Management Rates with the average contractual investment management fee rates of funds in the expense Groups at a common asset level as well as transfer agency costs of the funds in the expense Groups. The Board noted that the Management Rates of the Fund were lower than the sum of these average rates for the Fund’s expense Groups for all share classes.
The Board also received and considered information about the portion of the total management fee that was retained by Funds Management after payment of the fee to the Sub-Adviser for sub-advisory services. In assessing the reasonableness of this amount, the Board received and evaluated information about the nature and extent of responsibilities retained and risks assumed by Funds Management and not delegated to or assumed by the Sub-Adviser, and about Funds Management’s on-going oversight services. Given the affiliation between Funds Management and the Sub-Adviser, the Board ascribed limited relevance to the allocation of fees between them.
The Board also received and considered information about the nature and extent of services offered and fee rates charged by Funds Management and the Sub-Adviser to other types of clients with investment strategies similar to those of the Fund. In this regard, the Board received information about the significantly greater scope of services, and compliance, reporting and other legal burdens and risks of managing proprietary mutual funds compared with those associated with managing assets of other types of clients, including third-party sub-advised fund clients and non-mutual fund clients such as institutional separate accounts.
Based on its consideration of the factors and information it deemed relevant, including those described here, the Board determined that the compensation payable to Funds Management under the Management Agreement and to the Sub-Adviser under the Sub-Advisory Agreement was reasonable.
Wells Fargo Short-Term High Yield Bond Fund | 37
Other information (unaudited)
Profitability
The Board received and considered information concerning the profitability of Funds Management, as well as the profitability of both WFAM and Wells Fargo & Co. (“Wells Fargo”) from providing services to the fund family as a whole. The Board noted that the Sub-Adviser’s profitability information with respect to providing services to the Fund and other funds in the family was subsumed in the WFAM and Wells Fargo profitability analysis.
Funds Management reported on the methodologies and estimates used in calculating profitability, including a description of the methodology used to allocate certain expenses. Among other things, the Board noted that the levels of profitability reported on a fund-by-fund basis varied widely, depending on factors such as the size, type and age of fund. Based on its review, the Board did not deem the profits reported by Funds Management, WFAM or Wells Fargo from services provided to the Fund to be at a level that would prevent it from approving the continuation of the Advisory Agreements.
Economies of scale
The Board received and considered information about the potential for Funds Management to experience economies of scale in the provision of management services to the Fund, the difficulties of calculating economies of scale at an individual fund level, and the extent to which potential scale benefits are shared with shareholders. The Board noted the existence of breakpoints in the Fund’s management fee structure, which operate generally to reduce the Fund’s expense ratios as the Fund grows in size. The Board considered that in addition to management fee breakpoints, Funds Management shares potential economies of scale from its management business in a variety of ways, including through fee waiver and expense reimbursement arrangements, services that benefit shareholders, competitive management fee rates set at the outset without regard to breakpoints, and investments in the business intended to enhance services available to shareholders.
The Board concluded that Funds Management’s arrangements with respect to the Fund, including contractual breakpoints, constituted a reasonable approach to sharing potential economies of scale with the Fund and its shareholders.
Other benefits to Funds Management and the Sub-Adviser
The Board received and considered information regarding potential “fall-out” or ancillary benefits received by Funds Management and its affiliates, including the Sub-Adviser, as a result of their relationships with the Fund. Ancillary benefits could include, among others, benefits directly attributable to other relationships with the Fund and benefits potentially derived from an increase in Funds Management’s and the Sub-Adviser’s business as a result of their relationships with the Fund. The Board noted that various affiliates of Funds Management may receive distribution-related fees, shareholder servicing payments and sub-transfer agency fees in respect of shares sold or held through them and services provided.
The Board also reviewed information about soft dollar credits earned and utilized by the Sub-Adviser, fees earned by Funds Management and the Sub-Adviser from managing a private investment vehicle for the fund family’s securities lending collateral, and commissions earned by an affiliated broker from portfolio transactions.
Based on its consideration of the factors and information it deemed relevant, including those described here, the Board did not find that any ancillary benefits received by Funds Management and its affiliates, including the Sub-Adviser, were unreasonable.
Conclusion
At the Meeting, after considering the above-described factors and based on its deliberations and its evaluation of the information described above, the Board unanimously approved the continuation of the Advisory Agreements for a one-year term and determined that the compensation payable to Funds Management and the Sub-Adviser under each of the Advisory Agreements was reasonable.
38 | Wells Fargo Short-Term High Yield Bond Fund
This page is intentionally left blank.
This page is intentionally left blank.

For more information
More information about Wells Fargo Funds is available free upon request. To obtain literature, please write, visit the Fund’s website, or call:
Wells Fargo Funds
P.O. Box 219967
Kansas City, MO 64121-9967
Website:wfam.com
Individual investors:1-800-222-8222
Retail investment professionals:1-888-877-9275
Institutional investment professionals:1-866-765-0778

This report and the financial statements contained herein are submitted for the general information of the shareholders of the Fund. If this report is used for promotional purposes, distribution of the report must be accompanied or preceded by a current prospectus. Before investing, please consider the investment objectives, risks, charges, and expenses of the investment. For a current prospectus and, if available, a summary prospectus, containing this information, call1-800-222-8222 or visit the Fund’s website atwfam.com. Read the prospectus carefully before you invest or send money.
Wells Fargo Asset Management (WFAM) is the trade name for certain investment advisory/management firms owned by Wells Fargo & Company. These firms include but are not limited to Wells Capital Management Incorporated and Wells Fargo Funds Management, LLC. Certain products managed by WFAM entities are distributed by Wells Fargo Funds Distributor, LLC (a broker-dealer and Member FINRA).
This material is for general informational and educational purposes only and is NOT intended to provide investment advice or a recommendation of any kind—including a recommendation for any specific investment, strategy, or plan.
INVESTMENT PRODUCTS: NOT FDIC INSURED ◾ NO BANK GUARANTEE ◾ MAY LOSE VALUE
© 2019 Wells Fargo Funds Management, LLC. All rights reserved.
405808 10-19
A222/AR222 08-19
Annual Report
August 31, 2019
Wells Fargo
Ultra Short-Term Income Fund
Beginning on January 1, 2021, as permitted by new regulations adopted by the Securities and Exchange Commission, paper copies of the Wells Fargo Funds’ annual and semi-annual shareholder reports issued after this date will no longer be sent by mail, unless you specifically request paper copies of the reports. Instead, the reports will be made available on the Funds’ website, and you will be notified by mail each time a report is posted and provided with a website address to access the report.
If you already elected to receive shareholder reports electronically, you will not be affected by this change and you need not take any action. You may elect to receive shareholder reports and other communications from the Fund electronically at any time by contacting your financial intermediary (such as a broker-dealer or bank) or, if you are a direct investor, by calling1-800-222-8222 or by enrolling at wellsfargo.com/advantagedelivery.
You may elect to receive all future reports in paper free of charge. If you invest through a financial intermediary, you can contact your financial intermediary to request that you continue to receive paper copies of your shareholder reports; if you invest directly with the Fund, you can call 1-800-222-8222. Your election to receive reports in paper will apply to all Wells Fargo Funds held in your account with your financial intermediary or, if you are a direct investor, to all Wells Fargo Funds that you hold.
|
|
|
Reduce clutter. Save trees. |
Sign up for electronic delivery of prospectuses and shareholder reports at wellsfargo.com/ advantagedelivery |
The views expressed and any forward-looking statements are as of August 31, 2019, unless otherwise noted, and are those of the Fund managers and/or Wells Fargo Asset Management. Discussions of individual securities, or the markets generally, or any Wells Fargo Fund are not intended as individual recommendations. Future events or results may vary significantly from those expressed in any forward-looking statements. The views expressed are subject to change at any time in response to changing circumstances in the market. Wells Fargo Asset Management and the Fund disclaim any obligation to publicly update or revise any views expressed or forward-looking statements.
INVESTMENT PRODUCTS: NOT FDIC INSURED ◾ NO BANK GUARANTEE ◾ MAY LOSE VALUE
Wells Fargo Ultra Short-Term Income Fund | 1
Letter to shareholders (unaudited)

Andrew Owen
President
Wells Fargo Funds
Dear Shareholder:
We are pleased to offer you this annual report for the Wells Fargo Ultra Short-Term Income Fund for the12-month period that ended August 31, 2019. After the first half of the period yielded eitherlow-single-digit or negative investment returns, U.S. stock and global bond investors generally saw markets recover during the second half amid intensifying market volatility, global economic growth concerns, international trade staredowns, and simmering geopolitical tensions.
Overall, fixed-income investors enjoyed a distinct advantage over stock investors. For the period, U.S. stocks, based on the S&P 500 Index,1 gained 2.92% and international stocks, as measured by the MSCI ACWI ex USA Index (Net),2 fell 3.27%. The MSCI EM Index (Net)3 slipped 4.36%. Among fixed income investors, the Bloomberg Barclays U.S. Aggregate Bond Index4 added 10.17%, the Bloomberg Barclays Global Aggregateex-USD Index5 added 5.71%, the Bloomberg Barclays Municipal Bond Index6 gained 8.72%, and the ICE BofAML U.S. High Yield Index7 added 6.58%.
Entering the fourth quarter of 2018, economic data was encouraging.
Entering the fourth quarter of 2018, there were reasons for investors to be optimistic. The U.S. Bureau of Economic Analysis reported U.S. gross domestic product (GDP) grew 4.2% on an annualized basis during the second quarter. Hiring improved. Unemployment declined. Consumer spending gained. Third-quarter corporate earnings reports were generally positive. U.S. trade negotiations with Mexico and Canada advanced. In September 2018, the U.S. Federal Reserve (Fed) raised the federal funds rate by 25 basis points (bps; 100 bps equal 1.00%) to a target range of between 2.00% and 2.25% in an indication of its confidence that U.S. economic growth was sustainable.
International markets presented numerous challenges. U.S.-China trade tensions increased. The U.S. imposed $200 billion in tariffs on Chinese goods. China reacted with $60 billion in tariffs on U.S. goods. Economic growth in China caused concern. In September 2018, international investors began to factor in a number of disconcerting economic and business data points: lower July manufacturing and industrial orders in Germany; declining purchasing managers’ index numbers for August from the United Kingdom, China, and India; and declining household spending for August in Japan. Taken together, the data fed growing concerns that global economic growth was slowing.
| 1 | The S&P 500 Index consists of 500 stocks chosen for market size, liquidity, and industry group representation. It is a market-value-weighted index with each stock’s weight in the index proportionate to its market value. You cannot invest directly in an index. |
| 2 | The Morgan Stanley Capital International (MSCI) All Country World Index (ACWI) ex USA Index (Net) is a free-float-adjusted market-capitalization weighted index that is designed to measure the equity market performance of developed and emerging markets, excluding the U.S. Source: MSCI. MSCI makes no express or implied warranties or representations and shall have no liability whatsoever with respect to any MSCI data contained herein. The MSCI data may not be further redistributed or used as a basis for other indices or any securities or financial products. This report is not approved, reviewed, or produced by MSCI. You cannot invest directly in an index. |
| 3 | The MSCI Emerging Markets (EM) Index (Net) is a free-float-adjusted market-capitalization-weighted index that is designed to measure the equity market performance of emerging markets. You cannot invest directly in an index. |
| 4 | The Bloomberg Barclays U.S. Aggregate Bond Index is a broad-based benchmark that measures the investment-grade, U.S. dollar-denominated, fixed-rate taxable bond market, including Treasuries, government-related and corporate securities, mortgage-backed securities (agency fixed-rate and hybrid adjustable-rate mortgage pass-throughs), asset-backed securities, and commercial mortgage-backed securities. You cannot invest directly in an index. |
| 5 | The Bloomberg Barclays Global Aggregateex-USD Index is an unmanaged index that provides a broad-based measure of the global investment-grade fixed-income markets excluding the U.S. dollar-denominated debt market. You cannot invest directly in an index. |
| 6 | The Bloomberg Barclays Municipal Bond Index is an unmanaged index composed of long-termtax-exempt bonds with a minimum credit rating of Baa. You cannot invest directly in an index. |
| 7 | The ICE BofAML U.S. High Yield Index is a market-capitalization-weighted index of domestic and Yankee high-yield bonds. The index tracks the performance of high-yield securities traded in the U.S. bond market. You cannot invest directly in an index. Copyright 2019. ICE Data Indices, LLC. All rights reserved. |
2 | Wells Fargo Ultra Short-Term Income Fund
Letter to shareholders (unaudited)
Investors had to digest unsettling events during the fourth quarter of 2018.
November’s U.S. midterm elections shifted control of the House of Representatives from Republicans to Democrats, presaging partisan clashes that followed and caused uncertainty among investors. A partial U.S. government shutdown driven by partisan policy disputes extended into January 2019. Third-quarter U.S. GDP was announced at an annualized 3.4% rate, lower than the second-quarter rate. Brexit efforts stalled. The value of the renminbi declined even as the People’s Bank of China cut reserve requirement ratios, accelerated infrastructure spending, and cut taxes in efforts to spur economic activity.
The combination of news in the U.S. and generally weak economic indicators outside of the U.S. caused investors to seek safe havens. December’s S&P 500 Index performance was the worst since 1931. Globally, fixed-income investments fared better than stocks during the last two months of the year. The Fed increased the federal funds rate by 25 bps in December 2018 to a target range of between 2.25% and 2.50% even as observers expressed concerns that higher rates could slow the economy.
The market climbs a wall of worry.
Investment returns appeared to reaffirm the adage that markets climb a wall of worry as 2019 opened. Following its December decline, the S&P 500 Index gained 8.01% for the month of January, the best monthly performance in 30 years. Returns for the MSCI ACWI ex USA Index (Net), the Bloomberg Barclays U.S. Aggregate Bond Index, and the Bloomberg Barclays Global Aggregateex-USD Index also were positive.
In February 2019, signs of slowing global growth grew more ominous. The Bureau of Economic Analysis announced fourth-quarter 2018 GDP grew at an annualized 2.2% rate, down from the levels of the prior two quarters. In a February report, the Bank of England forecast the slowest growth for 2019 since the financial crisis. China and the U.S. continued to wrangle over trade issues. By the end of the first quarter of 2019, more accommodative Fed sentiment and steady, if not spectacular, U.S. economic and business metrics encouraged domestic investors.
Early second-quarter 2019 enthusiasm among investors faded.
During April 2019, favorable sentiment found additional support in reports of sustained low inflation, solid employment data, and first-quarter U.S. GDP of an annualized rate of 3.2%. During May, markets tumbled on mixed investment signals. In the U.S., partisan wrangling ramped up as Democrats and Republicans set their sights on 2020 presidential politics. The U.K.’s Brexit contretemps caused Prime Minister Theresa May to resign. Boris Johnson succeeded her only to exacerbate uncertainty about Brexit’s resolution ahead of an October 2019 deadline. The European Commission downgraded the 2019 growth forecast to 1.2%. The U.S. increased tariffs on products from China, China responded, and then talks broke down. President Donald Trump threatened to turn his foreign policy tariff tool to Mexico over immigration issues.
During the third quarter of 2019, investors regrouped. Just as the investment horizon appeared to darken, sentiment turned and U.S. equity markets gained during June and July. The gains, primarily driven by geopolitical and monetary policy events, pushed equity markets to new highs. European Central Bank President Mario Draghi said that if the outlook doesn’t improve, the bank would cut rates or buy more assets to prop up inflation. President Trump backed off of tariff threats against Mexico and China. In the U.S., the Fed implemented a 0.25% federal funds rate cut in July.
Later in July, the U.S. reversed course and threatened to impose higher tariffs on China’s exports after talks failed. China responded with tariff threats of its own and
“December’s S&P 500 Index performance was the worst since 1931.”
“Following its December decline, the S&P 500 Index gained 8.01% for the month of January, the best monthly performance in 30 years.”
Wells Fargo Ultra Short-Term Income Fund | 3
Letter to shareholders (unaudited)
|
|
|
For further information about your Fund, contact your investment professional, visit our website at wfam.com, or call us directly at1-800-222-8222. |
devalued the renminbi, a move that roiled global markets. Major U.S. stock market indices closed July 2019 with the worst weekly results of the year. Bond prices gained as Treasury yields fell to levels not seen since November 2016 and the yield curve inverted at multiple points along the30-year arc.
In a microcosm, August 2019 encapsulated many of the unnerving events that plagued investors during the prior 11 months. The U.S.-China trade relationship swung from discouraging to hopeful and back again with no evident compromise on the horizon. Evidence of a continued global economic slowdown continued to mount as central banks in China, New Zealand, and Thailand cut interest rates. Industrial and manufacturing data declined in China, Canada, Japan, and Germany. Adding to the uncertain environment, Italy’s prime minister resigned, many feared a crackdown in Hong Kong as protesters sustained their calls for reform throughout the month, and Boris Johnson planned to suspend Parliament as Brexit’s deadline neared.
Don’t let short-term uncertainty derail long-term investment goals.
Periods of investment uncertainty can present challenges, but experience has taught us that maintaining long-term investment goals can be an effective way to plan for the future. To help you create a sound strategy based on your personal goals and risk tolerance, Wells Fargo Funds offers more than 100 mutual funds spanning a wide range of asset classes and investment styles. Although diversification cannot guarantee an investment profit or prevent losses, we believe it can be an effective way to manage investment risk and potentially smooth out overall portfolio performance. We encourage investors to know their investments and to understand that appropriate levels of risk-taking may unlock opportunities.
Thank you for choosing to invest with Wells Fargo Funds. We appreciate your confidence in us and remain committed to helping you meet your financial needs.
Sincerely,

Andrew Owen
President
Wells Fargo Funds
4 | Wells Fargo Ultra Short-Term Income Fund
This page is intentionally left blank.
Performance highlights (unaudited)
Investment objective
The Fund seeks current income consistent with capital preservation.
Manager
Wells Fargo Funds Management, LLC
Subadviser
Wells Capital Management Incorporated
Portfolio managers
Christopher Y. Kauffman, CFA®‡
Jay N. Mueller, CFA®‡
Michael J. Schueller, CFA®‡*
Noah M. Wise, CFA®‡
Average annual total returns (%) as of August 31, 2019
| | | | | | | | | | | | | | | | | | | | | | | | | | | | | | | | | | |
| | | | |
| | | | | Including sales charge | | | Excluding sales charge | | | Expense ratios1 (%) | |
| | | | | | | | | |
| | | Inception date | | 1 year | | | 5 year | | | 10 year | | | 1 year | | | 5 year | | | 10 year | | | Gross | | | Net2 | |
| | | | | | | | | | |
| Class A (SADAX) | | 8-31-1999 | | | 0.98 | | | | 0.88 | | | | 1.42 | | | | 3.04 | | | | 1.29 | | | | 1.62 | | | | 0.81 | | | | 0.71 | |
| | | | | | | | | | |
| Class C (WUSTX) | | 7-18-2008 | | | 1.27 | | | | 0.56 | | | | 0.88 | | | | 2.27 | | | | 0.56 | | | | 0.88 | | | | 1.56 | | | | 1.46 | |
| | | | | | | | | | |
| Administrator Class (WUSDX) | | 4-8-2005 | | | – | | | | – | | | | – | | | | 3.19 | | | | 1.44 | | | | 1.78 | | | | 0.75 | | | | 0.56 | |
| | | | | | | | | | |
| Institutional Class (SADIX) | | 8-31-1999 | | | – | | | | – | | | | – | | | | 3.40 | | | | 1.64 | | | | 1.98 | | | | 0.48 | | | | 0.36 | |
| | | | | | | | | | |
| Bloomberg Barclays Short-Term U.S. Government/Corporate Bond Index3 | | – | | | – | | | | – | | | | – | | | | 2.76 | | | | 1.20 | | | | 0.81 | | | | – | | | | – | |
Figures quoted represent past performance, which is no guarantee of future results, and do not reflect taxes that a shareholder may pay on fund distributions or the redemption of fund shares. Investment return and principal value of an investment will fluctuate so that an investor’s shares, when redeemed, may be worth more or less than their original cost. Performance shown without sales charges would be lower if sales charges were reflected. Current performance may be lower or higher than the performance data quoted, which assumes the reinvestment of dividends and capital gains. Currentmonth-end performance is available on the Fund’s website,wfam.com.
Index returns do not include transaction costs associated with buying and selling securities, any mutual fund fees or expenses, or any taxes. It is not possible to invest directly in an index.
For Class A shares, the maximumfront-end sales charge is 2.00%. For Class C shares, the maximum contingent deferred sales charge is 1.00%. Performance including a contingent deferred sales charge assumes the sales charge for the corresponding time period. Administrator Class and Institutional Class shares are sold without afront-end sales charge or contingent deferred sales charge.
Bond values fluctuate in response to the financial condition of individual issuers, general market and economic conditions, and changes in interest rates. Changes in market conditions and government policies may lead to periods of heightened volatility in the bond market and reduced liquidity for certain bonds held by the Fund. In general, when interest rates rise, bond values fall and investors may lose principal value. Interest rate changes and their impact on the Fund and its share price can be sudden and unpredictable. Loans are subject to risks similar to those associated with other below-investment-grade bond investments, such as credit risk (for example, risk of issuer default), below investment-grade bond risk (for example, risk of greater volatility in value), and risk that the loan may become illiquid or difficult to price. The use of derivatives may reduce returns and/or increase volatility. Foreign investments are especially volatile and can rise or fall dramatically due to differences in the political and economic conditions of the host country. These risks are generally intensified in emerging markets. Certain investment strategies tend to increase the total risk of an investment (relative to the broader market). The Fund is exposed to high-yield securities risk and mortgage- and asset-backed securities risk. Consult the Fund’s prospectus for additional information on these and other risks.
Please see footnotes on page 7.
6 | Wells Fargo Ultra Short-Term Income Fund
Performance highlights (unaudited)
|
|
| Growth of $10,000 investment as of August 31, 20194 |
|
|
| ‡ | CFA®and Chartered Financial Analyst® are trademarks owned by CFA Institute. |
| * | Mr. Schueller became a portfolio manager of the Fund on June 6, 2019. |
| 1 | Reflects the expense ratios as stated in the most recent prospectuses, which include the impact of 0.01% in acquired fund fees and expenses. The expense ratios shown are subject to change and may differ from the annualized expense ratios shown in the financial highlights of this report, which do not include acquired fund fees and expenses. |
| 2 | The manager has contractually committed through December 31, 2019 to waive fees and/or reimburse expenses to the extent necessary to cap the expenses of each class after fee waivers at 0.70% for Class A, 1.45% for Class C, 0.55% for Administrator Class, and 0.35% for Institutional Class. Brokerage commissions, stamp duty fees, interest, taxes, acquired fund fees and expenses (if any), and extraordinary expenses are excluded from the expense cap. Prior to or after the commitment expiration date, the cap may be increased or the commitment to maintain the cap may be terminated only with the approval of the Board of Trustees. Without this cap, the Fund’s returns would have been lower. The expense ratio paid by an investor is the net expense ratio (the total annual fund operating expenses after fee waivers) as stated in the prospectuses. |
| 3 | The Bloomberg Barclays Short-Term U.S. Government/Corporate Bond Index contains securities that have fallen out of the Bloomberg Barclays U.S. Government/Credit Bond Index because of the standard minimumone-year-to-maturity constraint. Securities in the Bloomberg Barclays Short-Term U.S. Government/Corporate Bond Index must have a maturity from 1 up to (but not including) 12 months. You cannot invest directly in an index. |
| 4 | The chart compares the performance of Class A shares for the most recent 10 years with the performance of the Bloomberg Barclays Short-Term U.S. Government/Corporate Bond Index. The chart assumes a hypothetical investment of $10,000 in Class A shares and reflects all operating expenses and assumes the maximum initial sales charge of 2.00%. |
| 5 | The ten largest holdings, excluding cash, cash equivalents and any money market funds, are calculated based on the value of the investments divided by total net assets of the Fund. Holdings are subject to change and may have changed since the date specified. |
| 6 | The Personal Consumption Expenditures Index is the primary measure of consumer spending on goods and services in the U.S. economy. It accounts for abouttwo-thirds of domestic final spending and is part of the personal income report issued by the Bureau of Economic Analysis of the Department of Commerce. You cannot invest directly in an index. |
| 7 | Amounts are calculated based on the total long-term investments of the Fund. These amounts are subject to change and may have changed since the date specified. |
Wells Fargo Ultra Short-Term Income Fund | 7
Performance highlights (unaudited)
MANAGER’S DISCUSSION
Fund highlights
| ∎ | | The Fund (Class A shares, excluding sales charges) outperformed its benchmark, the Bloomberg Barclays Short-Term U.S. Government/Corporate Bond Index, for the12-month period that ended August 31, 2019. |
| ∎ | | Overweights to corporate debt and structured products, both of which generated positive yield returns compared with similar-duration Treasuries, generated positive results for the Fund. |
| ∎ | | Overnight cash investments were a modest drag on performance. |
| | | | |
|
| Ten largest holdings(%) as of August 31, 20195 | |
| | |
SPDR Portfolio Short Term Corporate Bond ETF | | | 2.88 | |
| | |
iShares Short-Term Corporate Bond ETF | | | 2.87 | |
| | |
Banco Santander SA, 3.50%,4-11-2022 | | | 0.96 | |
| | |
Bank of America Corporation, 2.33%,10-1-2021 | | | 0.94 | |
| | |
Deutsche Telekom International Finance BV,2.23%, 1-17-2020 | | | 0.93 | |
| | |
Morgan Stanley, 2.75%,5-19-2022 | | | 0.90 | |
| | |
American Credit Acceptance Receivables Trust Series2019-2 Class A, 2.85%,7-12-2022 | | | 0.81 | |
| | |
Banco Santander Chile, 2.50%,12-15-2020 | | | 0.77 | |
| | |
ANZ New Zealand International Limited,2.60%, 9-23-2019 | | | 0.76 | |
| | |
Huntington National Bank, 2.38%,3-10-2020 | | | 0.75 | |
An economic slowdown
The pace of gross domestic product growth decelerated over the past 12 months as business investment, inventory effects, and trade restrained overall economic activity. For the four quarters that ended June 30, 2019, the U.S. economy expanded by 2.3% in inflation-adjusted terms, compared with a 3.2% trailing12-month growth rate at the midway point in 2018. Rising anxiety over the contentious U.S.-China trade relationship appeared to discourage capital investment over the12-month period that ended August 31, 2019. Housing investment also was a modest drag despite low mortgage rates. Consumer spending held up fairly well, however, with the Personal Consumption Expenditures Index6 rising at a 2.7% year-over-year rate through the end of July.
Consumption was supported by a relatively firm labor market. While job growth slowed modestly over the period, wages grew by 3.2% in real terms and the unemployment rate remained below 4%. Measures of labor force participation also generally showed improvement.
In response to slower growth and lower-than-targeted inflation, the Federal Open Market Committee (FOMC) voted to reduce its policy rate target for overnight funds by 0.25% at its July 31 meeting. This was the first interest rate reduction engineered by the FOMC in the decade since the financial crisis. While the monetary authorities suggested that their decision should be seen as a “midcourse correction” rather than the beginning of an extended easing cycle, markets have priced multiple additional rate cuts into the term structure. Indeed, interest rates fell across the board over the past 12 months, with intermediate-term Treasury yields dropping by about 1.35%.
|
|
| Portfolio allocation as of August 31, 20197 |
|
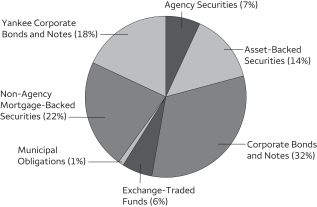 |
The Fund continued to favor corporate credit and securitized obligations.
The Fund continued to overweight short-term corporate bonds as well as securitized debt while underweighting U.S. Treasuries and agency debentures. The Fund’s investments in corporate debt benefited from a yield advantage versus Treasuries, while short-term credit spreads were little changed on a year-over-year basis. The Fund’s second-largest sector commitment was to securitized debt: asset-backed securities, residential mortgage-backed securities, commercial mortgage-backed securities, and collateralized loan obligations. The Fund benefited from the yield advantage provided by these holdings. The Fund’s duration was generally maintained near the0.5-year mark, in line with its benchmark.
Please see footnotes on page 7.
8 | Wells Fargo Ultra Short-Term Income Fund
Performance highlights (unaudited)
The trade war is a persistent cloud.
We expect the U.S.-China trade dispute to drag on for some months to come, depressing business investment. Slower growth, in turn, is likely to incline the monetary authorities to ease policy further, with at least one and probably more rate cuts to be implemented over the next 6 to 12 months. A quick resolution to the dispute—as unlikely as that seems at this time—could potentially boost business confidence and perhaps reduce the pressure for accommodative monetary policy. In this environment, we anticipate taking a cautious approach to both duration and sector allocation decisions, with a bias towardup-in-quality trades. As always, relative-value considerations will dominate our security selection process.
Wells Fargo Ultra Short-Term Income Fund | 9
Fund expenses (unaudited)
As a shareholder of the Fund, you incur two types of costs: (1) transaction costs, including sales charges (loads) on purchase payments and contingent deferred sales charges (if any) on redemptions and (2) ongoing costs, including management fees, distribution(12b-1) and/or shareholder servicing fees, and other Fund expenses. This example is intended to help you understand your ongoing costs (in dollars) of investing in the Fund and to compare these costs with the ongoing costs of investing in other mutual funds.
The example is based on an investment of $1,000 invested at the beginning of thesix-month period and held for the entire period from March 1, 2019 to August 31, 2019.
Actual expenses
The “Actual” line of the table below provides information about actual account values and actual expenses. You may use the information in this line, together with the amount you invested, to estimate the expenses that you paid over the period. Simply divide your account value by $1,000 (for example, an $8,600 account value divided by $1,000 = 8.6), then multiply the result by the number in the “Actual” line under the heading entitled “Expenses paid during period” for your applicable class of shares to estimate the expenses you paid on your account during this period.
Hypothetical example for comparison purposes
The “Hypothetical” line of the table below provides information about hypothetical account values and hypothetical expenses based on the Fund’s actual expense ratio and an assumed rate of return of 5% per year before expenses, which is not the Fund’s actual return. The hypothetical account values and expenses may not be used to estimate the actual ending account balance or expenses you paid for the period. You may use this information to compare the ongoing costs of investing in the Fund and other funds. To do so, compare this 5% hypothetical example with the 5% hypothetical examples that appear in the shareholder reports of the other funds.
Please note that the expenses shown in the table are meant to highlight your ongoing costs only and do not reflect any transactional costs, such as sales charges (loads) and contingent deferred sales charges. Therefore, the “Hypothetical” line of the table is useful in comparing ongoing costs only and will not help you determine the relative total costs of owning different funds. In addition, if these transactional costs were included, your costs would have been higher.
| | | | | | | | | | | | | | | | |
| | | Beginning
account value
3-1-2019 | | | Ending
account value
8-31-2019 | | | Expenses
paid during
the period1 | | | Annualized net
expense ratio | |
| | | | | |
Class A | | | | | | | | | | | | | | | | |
| | | | |
Actual | | $ | 1,000.00 | | | $ | 1,015.55 | | | $ | 3.56 | | | | 0.70 | % |
| | | | |
Hypothetical (5% return before expenses) | | $ | 1,000.00 | | | $ | 1,021.68 | | | $ | 3.57 | | | | 0.70 | % |
| | | | | |
Class C | | | | | | | | | | | | | | | | |
| | | | |
Actual | | $ | 1,000.00 | | | $ | 1,012.91 | | | $ | 7.36 | | | | 1.45 | % |
| | | | |
Hypothetical (5% return before expenses) | | $ | 1,000.00 | | | $ | 1,017.90 | | | $ | 7.37 | | | | 1.45 | % |
| | | | | |
Administrator Class | | | | | | | | | | | | | | | | |
| | | | |
Actual | | $ | 1,000.00 | | | $ | 1,017.54 | | | $ | 2.80 | | | | 0.55 | % |
| | | | |
Hypothetical (5% return before expenses) | | $ | 1,000.00 | | | $ | 1,022.43 | | | $ | 2.80 | | | | 0.55 | % |
| | | | | |
Institutional Class | | | | | | | | | | | | | | | | |
| | | | |
Actual | | $ | 1,000.00 | | | $ | 1,018.54 | | | $ | 1.78 | | | | 0.35 | % |
| | | | |
Hypothetical (5% return before expenses) | | $ | 1,000.00 | | | $ | 1,023.44 | | | $ | 1.78 | | | | 0.35 | % |
| 1 | Expenses paid is equal to the annualized net expense ratio of each class multiplied by the average account value over the period, multiplied by the number of days in the most recent fiscal half-year divided by the number of days in the fiscal year (to reflect theone-half-year period). |
10 | Wells Fargo Ultra Short-Term Income Fund
Portfolio of investments—August 31, 2019
| | | | | | | | | | | | | | | | |
| | | Interest
rate | | | Maturity
date | | | Principal | | | Value | |
| Agency Securities: 6.63% | |
| | | | |
FDIC Series2013-R1 Class A 144A | | | 1.15 | % | | | 3-25-2033 | | | $ | 588,673 | | | $ | 585,149 | |
| | | | |
FHLMC (1 Month LIBOR +0.50%)± | | | 2.70 | | | | 9-15-2041 | | | | 1,607,426 | | | | 1,613,996 | |
| | | | |
FHLMC | | | 4.50 | | | | 2-1-2020 | | | | 42,699 | | | | 43,927 | |
| | | | |
FHLMC | | | 4.50 | | | | 8-1-2020 | | | | 34,432 | | | | 35,422 | |
| | | | |
FHLMC | | | 4.50 | | | | 1-1-2022 | | | | 38,661 | | | | 39,773 | |
| | | | |
FHLMC | | | 4.50 | | | | 6-1-2024 | | | | 854,222 | | | | 888,215 | |
| | | | |
FHLMC | | | 4.50 | | | | 9-1-2026 | | | | 1,345,755 | | | | 1,399,259 | |
| | | | |
FHLMC (1 Year Treasury Constant Maturity +2.25%)± | | | 4.65 | | | | 11-1-2035 | | | | 1,415,751 | | | | 1,488,334 | |
| | | | |
FHLMC (1 Year Treasury Constant Maturity +2.25%)± | | | 4.67 | | | | 6-1-2032 | | | | 1,540 | | | | 1,595 | |
| | | | |
FHLMC (1 Year Treasury Constant Maturity +2.23%)± | | | 4.69 | | | | 3-1-2035 | | | | 641,893 | | | | 677,488 | |
| | | | |
FHLMC (1 Year Treasury Constant Maturity +2.25%)± | | | 4.72 | | | | 10-1-2038 | | | | 646,445 | | | | 687,128 | |
| | | | |
FHLMC (1 Year Treasury Constant Maturity +2.25%)± | | | 4.76 | | | | 4-1-2032 | | | | 81,363 | | | | 85,729 | |
| | | | |
FHLMC (1 Year Treasury Constant Maturity +2.19%)± | | | 4.79 | | | | 5-1-2035 | | | | 238,535 | | | | 251,020 | |
| | | | |
FHLMC (1 Year Treasury Constant Maturity +2.33%)± | | | 4.83 | | | | 1-1-2029 | | | | 33,067 | | | | 33,391 | |
| | | | |
FHLMC (1 Year Treasury Constant Maturity +2.25%)± | | | 4.84 | | | | 4-1-2038 | | | | 649,419 | | | | 684,790 | |
| | | | |
FHLMC (1 Year Treasury Constant Maturity +2.25%)± | | | 4.86 | | | | 9-1-2038 | | | | 1,233,636 | | | | 1,303,476 | |
| | | | |
FHLMC (1 Year Treasury Constant Maturity +2.40%)± | | | 4.90 | | | | 7-1-2029 | | | | 1,644 | | | | 1,692 | |
| | | | |
FHLMC | | | 5.00 | | | | 12-1-2019 | | | | 51,439 | | | | 53,060 | |
| | | | |
FHLMC | | | 5.50 | | | | 12-1-2022 | | | | 321,994 | | | | 333,857 | |
| | | | |
FHLMC | | | 5.50 | | | | 12-1-2023 | | | | 374,695 | | | | 390,664 | |
| | | | |
FHLMC | | | 6.00 | | | | 10-1-2021 | | | | 366,759 | | | | 375,382 | |
| | | | |
FHLMC | | | 6.00 | | | | 10-1-2021 | | | | 393,145 | | | | 402,395 | |
| | | | |
FHLMC | | | 6.00 | | | | 1-1-2024 | | | | 321,958 | | | | 332,338 | |
| | | | |
FHLMC | | | 7.00 | | | | 6-1-2031 | | | | 237,588 | | | | 267,069 | |
| | | | |
FHLMC | | | 9.00 | | | | 10-1-2019 | | | | 57 | | | | 56 | |
| | | | |
FHLMC | | | 9.50 | | | | 9-1-2020 | | | | 6,289 | | | | 6,317 | |
| | | | |
FHLMC | | | 9.50 | | | | 12-1-2022 | | | | 3,373 | | | | 3,397 | |
| | | | |
FHLMC | | | 10.00 | | | | 11-17-2021 | | | | 2,442 | | | | 2,455 | |
| | | | |
FHLMC | | | 10.50 | | | | 5-1-2020 | | | | 4,534 | | | | 4,552 | |
| | | | |
FHLMC Series 2611 Class HD | | | 5.00 | | | | 5-15-2023 | | | | 434,559 | | | | 451,324 | |
| | | | |
FHLMC Series 2649 Class WL | | | 4.00 | | | | 7-15-2023 | | | | 801,622 | | | | 812,735 | |
| | | | |
FHLMC Series 2704 Class BH | | | 4.50 | | | | 11-15-2023 | | | | 312,208 | | | | 320,289 | |
| | | | |
FHLMC Series 2881 Class AE | | | 5.00 | | | | 8-15-2034 | | | | 146,970 | | | | 151,228 | |
| | | | |
FHLMC Series 2896 Class CB | | | 4.50 | | | | 11-15-2019 | | | | 198 | | | | 199 | |
| | | | |
FHLMC Series 2953 Class LD | | | 5.00 | | | | 12-15-2034 | | | | 144,561 | | | | 150,246 | |
| | | | |
FHLMC Series 3166 Class AC | | | 5.00 | | | | 6-15-2021 | | | | 292,149 | | | | 292,519 | |
| | | | |
FHLMC Series 3266 Class D | | | 5.00 | | | | 1-15-2022 | | | | 3 | | | | 3 | |
| | | | |
FHLMC Series 3609 Class LA | | | 4.00 | | | | 12-15-2024 | | | | 6,654 | | | | 6,670 | |
| | | | |
FHLMC Series 3821 Class LA | | | 3.50 | | | | 4-15-2025 | | | | 66,802 | | | | 66,863 | |
| | | | |
FHLMC Series 3834 Class EA | | | 3.50 | | | | 6-15-2029 | | | | 189,123 | | | | 191,502 | |
| | | | |
FHLMC Series 3888 Class NA | | | 2.25 | | | | 1-15-2040 | | | | 1,385,814 | | | | 1,392,160 | |
| | | | |
FHLMC Series 3898 Class NE | | | 4.00 | | | | 7-15-2040 | | | | 95,105 | | | | 95,213 | |
| | | | |
FHLMC Series 4172 Class PB | | | 1.50 | | | | 7-15-2040 | | | | 284,848 | | | | 281,937 | |
| | | | |
FHLMC Series 4318 Class LC | | | 2.00 | | | | 6-15-2038 | | | | 311,488 | | | | 309,971 | |
| | | | |
FHLMC Series 4348 Class MH | | | 3.00 | | | | 6-15-2039 | | | | 1,992,024 | | | | 2,028,753 | |
| | | | |
FHLMC Series 4764 Class BA | | | 4.00 | | | | 6-15-2042 | | | | 1,136,549 | | | | 1,154,630 | |
| | | | |
FHLMC Series 4889 Class CD | | | 3.00 | | | | 4-15-2049 | | | | 4,912,651 | | | | 4,973,171 | |
| | | | |
FHLMC Series K005 Class A2 | | | 4.32 | | | | 11-25-2019 | | | | 319,101 | | | | 318,948 | |
| | | | |
FHLMC Series KF15 Class A (1 Month LIBOR +0.67%)± | | | 2.89 | | | | 2-25-2023 | | | | 722,276 | | | | 721,827 | |
| | | | |
FHLMC Series KI01 Class A (1 Month LIBOR +0.16%)± | | | 2.38 | | | | 9-25-2022 | | | | 2,419,492 | | | | 2,414,301 | |
| | | | |
FHLMC Series KJ13 Class A1 | | | 2.06 | | | | 9-25-2021 | | | | 368,523 | | | | 367,597 | |
The accompanying notes are an integral part of these financial statements.
Wells Fargo Ultra Short-Term Income Fund | 11
Portfolio of investments—August 31, 2019
| | | | | | | | | | | | | | | | |
| | | Interest
rate | | | Maturity
date | | | Principal | | | Value | |
| Agency Securities(continued) | |
| | | | |
FHLMC Series QO04 Class AFL (12 Month Treasury Average +0.74%)± | | | 3.22 | % | | | 5-25-2044 | | | $ | 3,189,768 | | | $ | 3,192,542 | |
| | | | |
FHLMC SeriesT-42 Class A6 | | | 9.50 | | | | 2-25-2042 | | | | 571,975 | | | | 707,069 | |
| | | | |
FNMA | | | 2.00 | | | | 4-1-2023 | | | | 2,578,986 | | | | 2,578,252 | |
| | | | |
FNMA (6 Month LIBOR +1.51%)± | | | 4.16 | | | | 9-1-2037 | | | | 313,887 | | | | 324,557 | |
| | | | |
FNMA (6 Month LIBOR +1.40%)± | | | 4.28 | | | | 10-1-2031 | | | | 69,192 | | | | 70,698 | |
| | | | |
FNMA (1 Year Treasury Constant Maturity +2.02%)± | | | 4.44 | | | | 12-1-2034 | | | | 302,139 | | | | 316,073 | |
| | | | |
FNMA | | | 4.50 | | | | 1-1-2027 | | | | 1,598,272 | | | | 1,683,932 | |
| | | | |
FNMA (1 Year Treasury Constant Maturity +2.25%)± | | | 4.63 | | | | 11-1-2033 | | | | 1,413,896 | | | | 1,492,292 | |
| | | | |
FNMA (1 Year Treasury Constant Maturity +2.19%)± | | | 4.64 | | | | 11-1-2031 | | | | 56,848 | | | | 59,594 | |
| | | | |
FNMA (1 Year Treasury Constant Maturity +2.19%)± | | | 4.65 | | | | 2-1-2035 | | | | 840,268 | | | | 886,130 | |
| | | | |
FNMA (1 Year Treasury Constant Maturity +2.13%)± | | | 4.67 | | | | 5-1-2032 | | | | 4,772 | | | | 4,928 | |
| | | | |
FNMA (1 Year Treasury Constant Maturity +2.19%)± | | | 4.68 | | | | 4-1-2038 | | | | 1,601,313 | | | | 1,688,814 | |
| | | | |
FNMA (12 Month LIBOR +1.81%)± | | | 4.69 | | | | 9-1-2040 | | | | 1,842,345 | | | | 1,944,377 | |
| | | | |
FNMA (1 Year Treasury Constant Maturity +2.22%)± | | | 4.69 | | | | 6-1-2034 | | | | 807,306 | | | | 853,085 | |
| | | | |
FNMA (1 Year Treasury Constant Maturity +2.21%)± | | | 4.70 | | | | 7-1-2038 | | | | 1,100,922 | | | | 1,162,152 | |
| | | | |
FNMA (1 Year Treasury Constant Maturity +2.23%)± | | | 4.70 | | | | 12-1-2040 | | | | 127,696 | | | | 134,279 | |
| | | | |
FNMA (1 Year Treasury Constant Maturity +2.28%)± | | | 4.71 | | | | 11-1-2032 | | | | 454,358 | | | | 475,573 | |
| | | | |
FNMA (1 Year Treasury Constant Maturity +2.22%)± | | | 4.72 | | | | 6-1-2032 | | | | 93,047 | | | | 96,765 | |
| | | | |
FNMA (1 Year Treasury Constant Maturity +2.26%)± | | | 4.72 | | | | 8-1-2036 | | | | 1,760,014 | | | | 1,859,280 | |
| | | | |
FNMA (12 Month Treasury Average +2.22%)± | | | 4.72 | | | | 8-1-2045 | | | | 558,277 | | | | 585,298 | |
| | | | |
FNMA (1 Year Treasury Constant Maturity +2.26%)± | | | 4.76 | | | | 11-1-2035 | | | | 150,524 | | | | 158,851 | |
| | | | |
FNMA (1 Year Treasury Constant Maturity +2.31%)± | | | 4.78 | | | | 5-1-2036 | | | | 500,910 | | | | 529,431 | |
| | | | |
FNMA (1 Year Treasury Constant Maturity +2.36%)± | | | 4.78 | | | | 11-1-2034 | | | | 775,892 | | | | 822,340 | |
| | | | |
FNMA (12 Month Treasury Average +2.33%)± | | | 4.84 | | | | 5-1-2036 | | | | 708,678 | | | | 737,902 | |
| | | | |
FNMA (1 Year Treasury Constant Maturity +2.27%)± | | | 4.99 | | | | 2-1-2036 | | | | 1,169,777 | | | | 1,232,389 | |
| | | | |
FNMA | | | 5.00 | | | | 5-1-2022 | | | | 227,208 | | | | 234,277 | |
| | | | |
FNMA | | | 5.00 | | | | 6-1-2024 | | | | 1,636,900 | | | | 1,698,345 | |
| | | | |
FNMA (1 Year Treasury Constant Maturity +2.27%)± | | | 5.02 | | | | 2-1-2033 | | | | 351,603 | | | | 365,218 | |
| | | | |
FNMA | | | 6.00 | | | | 4-1-2021 | | | | 41,746 | | | | 42,350 | |
| | | | |
FNMA | | | 6.00 | | | | 1-1-2023 | | | | 882,474 | | | | 916,199 | |
| | | | |
FNMA (6 Month LIBOR +2.86%)± | | | 6.23 | | | | 4-1-2033 | | | | 762 | | | | 790 | |
| | | | |
FNMA | | | 6.50 | | | | 8-1-2031 | | | | 262,528 | | | | 306,664 | |
| | | | |
FNMA | | | 8.33 | | | | 7-15-2020 | | | | 215 | | | | 215 | |
| | | | |
FNMA | | | 9.00 | | | | 2-15-2020 | | | | 2,489 | | | | 2,496 | |
| | | | |
FNMA | | | 9.00 | | | | 10-15-2021 | | | | 2,742 | | | | 2,767 | |
| | | | |
FNMA | | | 9.00 | | | | 6-1-2024 | | | | 7,211 | | | | 7,260 | |
| | | | |
FNMA | | | 9.50 | | | | 12-1-2020 | | | | 4,323 | | | | 4,347 | |
| | | | |
FNMA | | | 10.50 | | | | 4-1-2022 | | | | 63 | | | | 63 | |
| | | | |
FNMA Series1990-111 Class Z | | | 8.75 | | | | 9-25-2020 | | | | 977 | | | | 996 | |
| | | | |
FNMA Series1990-119 Class J | | | 9.00 | | | | 10-25-2020 | | | | 7,001 | | | | 7,187 | |
| | | | |
FNMA Series1990-124 Class Z | | | 9.00 | | | | 10-25-2020 | | | | 1,984 | | | | 2,024 | |
| | | | |
FNMA Series1990-21 Class Z | | | 9.00 | | | | 3-25-2020 | | | | 5,972 | | | | 6,021 | |
| | | | |
FNMA Series1990-27 Class Z | | | 9.00 | | | | 3-25-2020 | | | | 1,485 | | | | 1,493 | |
| | | | |
FNMA Series1990-30 Class D | | | 9.75 | | | | 3-25-2020 | | | | 996 | | | | 1,006 | |
| | | | |
FNMA Series1990-77 Class D | | | 9.00 | | | | 6-25-2020 | | | | 3,660 | | | | 3,684 | |
| | | | |
FNMA Series1991-132 Class Z | | | 8.00 | | | | 10-25-2021 | | | | 17,208 | | | | 17,953 | |
| | | | |
FNMA Series1992-71 Class X | | | 8.25 | | | | 5-25-2022 | | | | 12,901 | | | | 13,722 | |
| | | | |
FNMA Series2000-T6 Class A2 | | | 9.50 | | | | 11-25-2040 | | | | 300,233 | | | | 343,911 | |
| | | | |
FNMA Series2001-T10 Class A3 | | | 9.50 | | | | 12-25-2041 | | | | 471,339 | | | | 558,817 | |
| | | | |
FNMA Series2001-T12 Class A3 | | | 9.50 | | | | 8-25-2041 | | | | 440,976 | | | | 535,128 | |
| | | | |
FNMA Series2002-T1 Class A4 | | | 9.50 | | | | 11-25-2031 | | | | 541,294 | | | | 649,595 | |
The accompanying notes are an integral part of these financial statements.
12 | Wells Fargo Ultra Short-Term Income Fund
Portfolio of investments—August 31, 2019
| | | | | | | | | | | | | | | | |
| | | Interest
rate | | | Maturity
date | | | Principal | | | Value | |
| Agency Securities(continued) | |
| | | | |
FNMA Series2002-W04 Class A6±± | | | 4.59 | % | | | 5-25-2042 | | | $ | 554,250 | | | $ | 573,418 | |
| | | | |
FNMA Series2003-W11 Class A1±± | | | 5.44 | | | | 6-25-2033 | | | | 14,267 | | | | 14,908 | |
| | | | |
FNMA Series2003-W3 Class 1A4±± | | | 4.23 | | | | 8-25-2042 | | | | 30,227 | | | | 31,829 | |
| | | | |
FNMA Series2004-92 Class QY | | | 4.50 | | | | 8-25-2034 | | | | 12,109 | | | | 12,084 | |
| | | | |
FNMA Series2007-W2 Class 1A1 (1 Month LIBOR +0.32%)± | | | 2.47 | | | | 3-25-2037 | | | | 306,144 | | | | 306,154 | |
| | | | |
FNMA Series2008-76 Class GF (1 Month LIBOR +0.65%)± | | | 2.80 | | | | 9-25-2023 | | | | 2,681 | | | | 2,679 | |
| | | | |
FNMA Series2009-31 Class B | | | 4.00 | | | | 5-25-2024 | | | | 137,478 | | | | 137,532 | |
| | | | |
FNMA Series2010-115 Class NC | | | 2.75 | | | | 1-25-2039 | | | | 687,850 | | | | 688,030 | |
| | | | |
FNMA Series2010-25 Class ND | | | 3.50 | | | | 3-25-2025 | | | | 9,070 | | | | 9,038 | |
| | | | |
FNMA Series2010-37 Class A1 | | | 5.41 | | | | 5-25-2035 | | | | 4,328,206 | | | | 4,526,455 | |
| | | | |
FNMA Series2010-57 Class DQ | | | 3.00 | | | | 6-25-2025 | | | | 183,455 | | | | 184,723 | |
| | | | |
FNMA Series2010-89 Class DP | | | 3.00 | | | | 6-25-2038 | | | | 483,952 | | | | 483,756 | |
| | | | |
FNMA Series2011-122 Class A | | | 3.00 | | | | 12-25-2025 | | | | 91,107 | | | | 90,969 | |
| | | | |
FNMA Series2012-72 Class QE | | | 3.00 | | | | 1-25-2038 | | | | 307,518 | | | | 310,396 | |
| | | | |
FNMA Series2012-94 Class E | | | 3.00 | | | | 6-25-2022 | | | | 5,805 | | | | 5,798 | |
| | | | |
FNMA Series2013-26 Class AK | | | 2.50 | | | | 11-25-2038 | | | | 3,365,389 | | | | 3,391,767 | |
| | | | |
FNMA Series2014-19 Class HA | | | 2.00 | | | | 6-25-2040 | | | | 752,821 | | | | 760,046 | |
| | | | |
GNMA | | | 7.00 | | | | 6-15-2033 | | | | 379,417 | | | | 454,279 | |
| | | | |
GNMA Series2012-57 Class LG | | | 1.50 | | | | 3-16-2035 | | | | 37,949 | | | | 37,887 | |
| | | | |
GNMA Series2016-H19 Class FE (1 Month LIBOR +0.37%)± | | | 2.75 | | | | 6-20-2061 | | | | 239,109 | | | | 239,102 | |
| | | | |
GNMA Series2017-H13 Class FJ (1 Month LIBOR +0.20%)± | | | 2.58 | | | | 5-20-2067 | | | | 411,365 | | | | 411,146 | |
| | | | |
GNMA Series2017-H16 Class FD (1 Month LIBOR +0.20%)± | | | 2.58 | | | | 8-20-2067 | | | | 489,374 | | | | 489,238 | |
| |
Total Agency Securities (Cost $69,741,456) | | | | 70,974,377 | |
| | | | | |
|
| Asset-Backed Securities: 12.80% | |
| | | | |
American Credit Acceptance Receivables Trust Series2018-1 Class C 144A | | | 3.55 | | | | 4-10-2024 | | | | 2,750,000 | | | | 2,766,408 | |
| | | | |
American Credit Acceptance Receivables Trust Series2019-2 Class A 144A | | | 2.85 | | | | 7-12-2022 | | | | 8,608,483 | | | | 8,628,148 | |
| | | | |
AmeriCredit Automobile Receivables Trust Series2017-2 Class A3 | | | 1.98 | | | | 12-20-2021 | | | | 2,843,167 | | | | 2,840,721 | |
| | | | |
Bank of the West Auto Trust Series2018-1 Class A2 144A | | | 3.09 | | | | 4-15-2021 | | | | 3,264,450 | | | | 3,271,267 | |
| | | | |
California Republic Auto Receivables Trust Series2017-1 Class A4 | | | 2.28 | | | | 6-15-2022 | | | | 3,654,456 | | | | 3,654,955 | |
| | | | |
CCG Receivables Trust Series2017-1 Class A2 144A | | | 1.84 | | | | 11-14-2023 | | | | 1,869,807 | | | | 1,866,388 | |
| | | | |
Chesapeake Funding II LLC Series2017-3A Class A1 144A | | | 1.91 | | | | 8-15-2029 | | | | 4,403,191 | | | | 4,391,013 | |
| | | | |
Chesapeake Funding II LLC Series2018-3A Class A1 144A | | | 3.39 | | | | 1-15-2031 | | | | 6,165,314 | | | | 6,281,609 | |
| | | | |
CPS Auto Trust Series2018-C Class A 144A | | | 2.87 | | | | 9-15-2021 | | | | 464,853 | | | | 465,260 | |
| | | | |
Dell Equipment Finance Trust Series2018-1 Class A2A 144A | | | 2.97 | | | | 10-22-2020 | | | | 5,274,389 | | | | 5,285,505 | |
| | | | |
Drive Auto Receivables Trust Series2015-BA Class D 144A | | | 3.84 | | | | 7-15-2021 | | | | 2,582,594 | | | | 2,587,092 | |
| | | | |
Drive Auto Receivables Trust Series2016-CA Class C 144A | | | 3.02 | | | | 11-15-2021 | | | | 2,761,683 | | | | 2,764,156 | |
| | | | |
Drive Auto Receivables Trust Series2017-BA Class D 144A | | | 3.72 | | | | 10-17-2022 | | | | 3,589,802 | | | | 3,611,270 | |
| | | | |
DT Auto Owner Trust Series2018-3A Class A 144A | | | 3.02 | | | | 2-15-2022 | | | | 2,161,017 | | | | 2,167,466 | |
| | | | |
Education Loan Asset-Backed Trust Series2013-1 Class A1 (1 Month LIBOR +0.80%) 144A± | | | 2.95 | | | | 6-25-2026 | | | | 1,962,732 | | | | 1,964,614 | |
| | | | |
Educational Services of America Incorporated Series2015-2 Class A (1 Month LIBOR +1.00%) 144A± | | | 3.15 | | | | 12-25-2056 | | | | 1,108,044 | | | | 1,108,076 | |
| | | | |
Enterprise Fleet Financing Trust Series2016-2 Class A2 144A | | | 1.74 | | | | 2-22-2022 | | | | 199,131 | | | | 199,035 | |
| | | | |
Enterprise Fleet Financing Trust Series2017-1 Class A2 144A | | | 2.13 | | | | 7-20-2022 | | | | 2,755,404 | | | | 2,754,382 | |
| | | | |
Enterprise Fleet Financing Trust Series2017-2 Class A2 144A | | | 1.97 | | | | 1-20-2023 | | | | 1,576,507 | | | | 1,574,665 | |
| | | | |
Exeter Automobile Receivables Trust Series2019-2A Class A 144A | | | 2.93 | | | | 7-15-2022 | | | | 2,710,300 | | | | 2,718,065 | |
| | | | |
Fifth Third Auto Trust Series2019-1 Class A2A | | | 2.66 | | | | 5-16-2022 | | | | 4,610,000 | | | | 4,631,440 | |
| | | | |
GM Financial Automobile Leasing Trust Series2017-2 Class A3 | | | 2.02 | | | | 9-21-2020 | | | | 882,638 | | | | 882,148 | |
| | | | |
GM Financial Consumer Automobile Receivables Trust Series2017-2A Class A3 144A | | | 1.86 | | | | 12-16-2021 | | | | 6,374,239 | | | | 6,364,348 | |
| | | | |
Honda Auto Receivables Owner Trust Series2018-3 Class A2 | | | 2.67 | | | | 12-21-2020 | | | | 3,185,609 | | | | 3,190,226 | |
The accompanying notes are an integral part of these financial statements.
Wells Fargo Ultra Short-Term Income Fund | 13
Portfolio of investments—August 31, 2019
| | | | | | | | | | | | | | | | |
| | | Interest
rate | | | Maturity
date | | | Principal | | | Value | |
| Asset-Backed Securities(continued) | |
| | | | |
Hyundai Auto Lease Securitization Trust Series2017-C Class A3 144A | | | 2.12 | % | | | 2-16-2021 | | | $ | 4,458,767 | | | $ | 4,458,110 | |
| | | | |
Mercedes-Benz Auto Lease Trust Series2019-A Class A2 | | | 3.01 | | | | 2-16-2021 | | | | 5,398,203 | | | | 5,412,600 | |
| | | | |
MMAF Equipment Finance LLC Series2019-A Class A2 144A | | | 2.84 | | | | 1-10-2022 | | | | 3,100,000 | | | | 3,124,441 | |
| | | | |
Oscar US Funding Trust Series2016-2A Class A4 144A | | | 2.99 | | | | 12-15-2023 | | | | 4,700,000 | | | | 4,729,486 | |
| | | | |
Panhandle Plains Higher Education Authority Incoporated Series2011-1 Class A3 (3 Month LIBOR +0.95%)± | | | 3.27 | | | | 10-1-2037 | | | | 2,937,589 | | | | 2,934,789 | |
| | | | |
Prestige Auto Receivables Trust Series2017-1A Class B 144A | | | 2.39 | | | | 5-16-2022 | | | | 1,370,000 | | | | 1,368,959 | |
| | | | |
SLC Student Loan Trust Series2006-2 Class A5 (3 Month LIBOR +0.10%) ± | | | 2.51 | | | | 9-15-2026 | | | | 1,161,384 | | | | 1,158,738 | |
| | | | |
SLM Student Loan Trust Series2004-8A Class A5 (3 Month LIBOR
+0.50%) 144A± | | | 2.78 | | | | 4-25-2024 | | | | 141,006 | | | | 141,038 | |
| | | | |
SLM Student Loan Trust Series2006-10 Class A5A (3 Month LIBOR
+0.10%) ± | | | 2.38 | | | | 4-25-2027 | | | | 873,998 | | | | 872,421 | |
| | | | |
SLM Student Loan Trust Series2011-2 Class A1 (1 Month LIBOR +0.60%) ± | | | 2.75 | | | | 11-25-2027 | | | | 1,385,637 | | | | 1,383,013 | |
| | | | |
SLM Student Loan Trust Series2012-3 Class A (1 Month LIBOR +0.65%)± | | | 2.80 | | | | 12-27-2038 | | | | 4,691,209 | | | | 4,683,241 | |
| | | | |
SLM Student Loan Trust Series2013-1 Class A3 (1 Month LIBOR +0.55%) ± | | | 2.70 | | | | 5-26-2055 | | | | 4,301,585 | | | | 4,328,488 | |
| | | | |
South Texas Higher Education2012-1 Class A2 (3 Month LIBOR +0.85%)± | | | 3.17 | | | | 10-1-2024 | | | | 3,010,552 | | | | 3,011,997 | |
| | | | |
Structured Asset Securities Corporation Series1998-2 Class A (1 Month LIBOR +0.52%)± | | | 2.67 | | | | 2-25-2028 | | | | 46,969 | | | | 46,799 | |
| | | | |
Student Loan Consolidation Center Series2011-1 Class A (1 Month LIBOR +1.22%) 144A± | | | 3.37 | | | | 10-25-2027 | | | | 4,497,677 | | | | 4,510,961 | |
| | | | |
Tesla Auto Lease Trust Series2018-B Class A 144A | | | 3.71 | | | | 8-20-2021 | | | | 2,007,701 | | | | 2,043,390 | |
| | | | |
Towd Point Asset Trust Series2018-SL1 Class A (1 Month LIBOR
+0.60%) 144A± | | | 2.75 | | | | 1-25-2046 | | | | 4,232,272 | | | | 4,168,180 | |
| | | | |
Verizon Owner Trust Series2017-1A Class A 144A | | | 2.06 | | | | 9-20-2021 | | | | 2,786,211 | | | | 2,785,243 | |
| | | | |
Volvo Financial Equipment LLC Series2017-1A Class A3 144A | | | 1.92 | | | | 3-15-2021 | | | | 5,622,154 | | | | 5,615,623 | |
| | | | |
Wheels SPV LLC Series2018-1A Class A2 144A | | | 3.06 | | | | 4-20-2027 | | | | 2,730,339 | | | | 2,745,385 | |
| | | | |
World Omni Auto Receivables Trust Series2016-B Class A3 | | | 1.30 | | | | 2-15-2022 | | | | 1,670,907 | | | | 1,665,081 | |
| |
Total Asset-Backed Securities (Cost $136,854,625) | | | | 137,156,240 | |
| | | | | |
|
Corporate Bonds and Notes: 30.10% | |
|
Communication Services: 3.16% | |
|
| Diversified Telecommunication Services: 0.99% | |
| | | | |
Broadcom Corporation | | | 2.20 | | | | 1-15-2021 | | | | 7,000,000 | | | | 6,966,699 | |
| | | | |
Broadcom Corporation | | | 3.00 | | | | 1-15-2022 | | | | 3,585,000 | | | | 3,614,082 | |
| | | | |
| | | | | | | | | | | | | | | 10,580,781 | |
| | | | | | | | | | | | | | | | |
|
| Media: 1.93% | |
| | | | |
Discovery Communications LLC | | | 2.20 | | | | 9-20-2019 | | | | 3,725,000 | | | | 3,724,404 | |
| | | | |
Fox Corporation 144A | | | 3.67 | | | | 1-25-2022 | | | | 3,880,000 | | | | 4,021,889 | |
| | | | |
Interpublic Group Companies | | | 3.50 | | | | 10-1-2020 | | | | 2,000,000 | | | | 2,027,472 | |
| | | | |
NBCUniversal Enterprise Incorporated 144A | | | 5.25 | | | | 12-31-2049 | | | | 6,000,000 | | | | 6,195,000 | |
| | | | |
TEGNA Incorporated | | | 5.13 | | | | 7-15-2020 | | | | 4,755,000 | | | | 4,771,643 | |
| | | | |
| | | | | | | | | | | | | | | 20,740,408 | |
| | | | | | | | | | | | | | | | |
|
| Wireless Telecommunication Services: 0.24% | |
| | | | |
Sprint Spectrum Company LLC 144A | | | 3.36 | | | | 3-20-2023 | | | | 2,531,250 | | | | 2,540,869 | |
| | | | | | | | | | | | | | | | |
|
Consumer Discretionary: 0.50% | |
|
| Automobiles: 0.38% | |
| | | | |
Daimler Finance NA LLC 144A | | | 3.40 | | | | 2-22-2022 | | | | 4,000,000 | | | | 4,099,618 | |
| | | | | | | | | | | | | | | | |
|
| Household Durables: 0.12% | |
| | | | |
Lennar Corporation | | | 4.50 | | | | 11-15-2019 | | | | 1,220,000 | | | | 1,220,732 | |
| | | | | | | | | | | | | | | | |
The accompanying notes are an integral part of these financial statements.
14 | Wells Fargo Ultra Short-Term Income Fund
Portfolio of investments—August 31, 2019
| | | | | | | | | | | | | | | | |
| | | Interest
rate | | | Maturity
date | | | Principal | | | Value | |
Consumer Staples: 1.89% | |
|
| Food Products: 0.91% | |
| | | | |
Campbell Soup Company | | | 3.30 | % | | | 3-15-2021 | | | $ | 6,040,000 | | | $ | 6,125,026 | |
| | | | |
Conagra Brands Incorporated | | | 3.80 | | | | 10-22-2021 | | | | 3,560,000 | | | | 3,662,667 | |
| | | | |
| | | | | | | | | | | | | | | 9,787,693 | |
| | | | | | | | | | | | | | | | |
|
| Tobacco: 0.98% | |
| | | | |
Altria Group Incorporated | | | 4.75 | | | | 5-5-2021 | | | | 5,000,000 | | | | 5,216,228 | |
| | | | |
BAT Capital Corporation | | | 2.30 | | | | 8-14-2020 | | | | 5,215,000 | | | | 5,215,563 | |
| | | | |
| | | | | | | | | | | | | | | 10,431,791 | |
| | | | | | | | | | | | | | | | |
|
Energy: 1.95% | |
|
| Oil, Gas & Consumable Fuels: 1.95% | |
| | | | |
Energy Transfer Partners LP | | | 5.20 | | | | 2-1-2022 | | | | 5,435,000 | | | | 5,764,634 | |
| | | | |
Occidental Petroleum Corporation | | | 2.60 | | | | 8-13-2021 | | | | 2,320,000 | | | | 2,335,419 | |
| | | | |
Occidental Petroleum Corporation | | | 2.70 | | | | 8-15-2022 | | | | 3,090,000 | | | | 3,120,414 | |
| | | | |
Rockies Express Pipeline LLC 144A | | | 5.63 | | | | 4-15-2020 | | | | 5,950,000 | | | | 6,082,417 | |
| | | | |
Sabine Pass Liquefaction LLC | | | 5.63 | | | | 2-1-2021 | | | | 3,500,000 | | | | 3,621,378 | |
| | | | |
| | | | | | | | | | | | | | | 20,924,262 | |
| | | | | | | | | | | | | | | | |
|
Financials: 14.30% | |
|
| Banks: 6.83% | |
| | | | |
Australia & New Zealand Banking Group Limited | | | 2.25 | | | | 11-9-2020 | | | | 5,790,000 | | | | 5,811,560 | |
| | | | |
Bank of America Corporation (3 Month LIBOR +0.63%)± | | | 2.33 | | | | 10-1-2021 | | | | 10,000,000 | | | | 10,015,720 | |
| | | | |
BB&T Corporation | | | 2.15 | | | | 2-1-2021 | | | | 7,000,000 | | | | 7,012,104 | |
| | | | |
BBVA Bancomer SA 144A | | | 7.25 | | | | 4-22-2020 | | | | 5,000,000 | | | | 5,125,050 | |
| | | | |
Citibank NA (3 Month LIBOR +0.60%)± | | | 2.84 | | | | 5-20-2022 | | | | 6,000,000 | | | | 6,067,132 | |
| | | | |
Citigroup Incorporated | | | 2.45 | | | | 1-10-2020 | | | | 4,000,000 | | | | 4,002,906 | |
| | | | |
Huntington National Bank | | | 2.38 | | | | 3-10-2020 | | | | 8,000,000 | | | | 8,006,507 | |
| | | | |
JPMorgan Chase & Company (3 Month LIBOR +0.70%)± | | | 3.21 | | | | 4-1-2023 | | | | 2,635,000 | | | | 2,709,005 | |
| | | | |
JPMorgan Chase & Company (3 Month LIBOR +0.61%)± | | | 3.51 | | | | 6-18-2022 | | | | 7,000,000 | | | | 7,165,877 | |
| | | | |
PNC Bank | | | 2.45 | | | | 11-5-2020 | | | | 7,000,000 | | | | 7,036,223 | |
| | | | |
Synchrony Bank | | | 3.65 | | | | 5-24-2021 | | | | 2,650,000 | | | | 2,704,048 | |
| | | | |
US Bank NA | | | 2.05 | | | | 10-23-2020 | | | | 7,460,000 | | | | 7,471,832 | |
| | | | |
| | | | | | | | | | | | | | | 73,127,964 | |
| | | | | | | | | | | | | | | | |
|
| Capital Markets: 1.37% | |
| | | | |
Goldman Sachs Group Incorporated | | | 5.38 | | | | 3-15-2020 | | | | 5,000,000 | | | | 5,084,356 | |
| | | | |
Morgan Stanley | | | 2.75 | | | | 5-19-2022 | | | | 9,435,000 | | | | 9,597,125 | |
| | | | |
| | | | | | | | | | | | | | | 14,681,481 | |
| | | | | | | | | | | | | | | | |
|
| Consumer Finance: 3.77% | |
| | | | |
BMW US Capital LLC 144A | | | 2.15 | | | | 4-6-2020 | | | | 1,000,000 | | | | 999,900 | |
| | | | |
Capital One Financial Corporation | | | 2.50 | | | | 5-12-2020 | | | | 7,000,000 | | | | 7,012,510 | |
| | | | |
Daimler Finance North America LLC 144A | | | 2.20 | | | | 5-5-2020 | | | | 1,480,000 | | | | 1,480,087 | |
| | | | |
Ford Motor Credit Company LLC | | | 3.20 | | | | 1-15-2021 | | | | 3,665,000 | | | | 3,683,139 | |
| | | | |
Ford Motor Credit Company LLC (3 Month LIBOR +0.88%)± | | | 3.22 | | | | 10-12-2021 | | | | 2,840,000 | | | | 2,810,277 | |
| | | | |
General Motors Financial Company Incorporated | | | 4.20 | | | | 11-6-2021 | | | | 5,000,000 | | | | 5,184,943 | |
| | | | |
Hyundai Capital America Incorporated 144A | | | 2.75 | | | | 9-18-2020 | | | | 4,000,000 | | | | 4,009,824 | |
| | | | |
John Deere Capital Corporation | | | 1.95 | | | | 6-22-2020 | | | | 3,000,000 | | | | 2,997,639 | |
The accompanying notes are an integral part of these financial statements.
Wells Fargo Ultra Short-Term Income Fund | 15
Portfolio of investments—August 31, 2019
| | | | | | | | | | | | | | | | |
| | | Interest
rate | | | Maturity
date | | | Principal | | | Value | |
|
| Consumer Finance(continued) | |
| | | | |
Nissan Motor Acceptance Corporation 144A | | | 2.25 | % | | | 1-13-2020 | | | $ | 4,000,000 | | | $ | 3,996,777 | |
| | | | |
Nissan Motor Acceptance Corporation 144A | | | 3.65 | | | | 9-21-2021 | | | | 4,000,000 | | | | 4,097,801 | |
| | | | |
Synchrony Financial | | | 2.70 | | | | 2-3-2020 | | | | 4,140,000 | | | | 4,145,308 | |
| | | | |
| | | | | | | | | | | | | | | 40,418,205 | |
| | | | | | | | | | | | | | | | |
|
| Diversified Financial Services: 0.99% | |
| | | | |
IBM Credit LLC | | | 3.45 | | | | 11-30-2020 | | | | 6,500,000 | | | | 6,612,389 | |
| | | | |
WEA Finance LLC 144A | | | 2.70 | | | | 9-17-2019 | | | | 2,975,000 | | | | 2,975,183 | |
| | | | |
WEA Finance LLC 144A | | | 3.25 | | | | 10-5-2020 | | | | 1,000,000 | | | | 1,011,864 | |
| | | | |
| | | | | | | | | | | | | | | 10,599,436 | |
| | | | | | | | | | | | | | | | |
|
| Insurance: 1.34% | |
| | | | |
Axis Specialty Finance LLC | | | 5.88 | | | | 6-1-2020 | | | | 1,685,000 | | | | 1,729,321 | |
| | | | |
Metropolitan Life Global Funding Incorporated 144A | | | 1.55 | | | | 9-13-2019 | | | | 5,180,000 | | | | 5,179,102 | |
| | | | |
Metropolitan Life Global Funding Incorporated 144A | | | 1.75 | | | | 9-19-2019 | | | | 3,000,000 | | | | 2,999,350 | |
| | | | |
Protective Life Global Funding 144A | | | 2.26 | | | | 4-8-2020 | | | | 4,415,000 | | | | 4,414,473 | |
| | | | |
| | | | | | | | | | | | | | | 14,322,246 | |
| | | | | | | | | | | | | | | | |
|
Health Care: 2.93% | |
|
| Biotechnology: 0.47% | |
| | | | |
Abbvie Incorporated | | | 3.38 | | | | 11-14-2021 | | | | 4,935,000 | | | | 5,058,906 | |
| | | | | | | | | | | | | | | | |
|
| Health Care Providers & Services: 1.90% | |
| | | | |
Anthem Incorporated | | | 2.50 | | | | 11-21-2020 | | | | 5,040,000 | | | | 5,065,245 | |
| | | | |
Cigna Holding Company | | | 4.00 | | | | 2-15-2022 | | | | 5,375,000 | | | | 5,592,000 | |
| | | | |
CVS Health Corporation | | | 2.80 | | | | 7-20-2020 | | | | 5,910,000 | | | | 5,939,461 | |
| | | | |
Tenet Healthcare Corporation | | | 6.00 | | | | 10-1-2020 | | | | 3,660,000 | | | | 3,802,740 | |
| | | | |
| | | | | | | | | | | | | | | 20,399,446 | |
| | | | | | | | | | | | | | | | |
|
| Pharmaceuticals: 0.56% | |
| | | | |
EMD Finance LLC 144A | | | 2.40 | | | | 3-19-2020 | | | | 5,965,000 | | | | 5,967,478 | |
| | | | | | | | | | | | | | | | |
|
Industrials: 2.01% | |
|
| Aerospace & Defense: 0.16% | |
| | | | |
The Boeing Company | | | 2.70 | | | | 5-1-2022 | | | | 1,615,000 | | | | 1,648,047 | |
| | | | | | | | | | | | | | | | |
|
| Air Freight & Logistics: 0.48% | |
| | | | |
FedEx Corporation | | | 3.40 | | | | 1-14-2022 | | | | 5,000,000 | | | | 5,158,425 | |
| | | | | | | | | | | | | | | | |
|
| Airlines: 0.57% | |
| | | | |
Delta Air Lines Incorporated | | | 3.40 | | | | 4-19-2021 | | | | 3,000,000 | | | | 3,041,301 | |
| | | | |
Delta Air Lines Incorporated | | | 3.63 | | | | 3-15-2022 | | | | 3,000,000 | | | | 3,087,544 | |
| | | | |
| | | | | | | | | | | | | | | 6,128,845 | |
| | | | | | | | | | | | | | | | |
|
| Industrial Conglomerates: 0.14% | |
| | | | |
General Electric Company | | | 4.63 | | | | 1-7-2021 | | | | 1,485,000 | | | | 1,518,574 | |
| | | | | | | | | | | | | | | | |
|
| Machinery: 0.32% | |
| | | | |
CNH Industrial Capital LLC | | | 4.38 | | | | 11-6-2020 | | | | 3,375,000 | | | | 3,442,061 | |
| | | | | | | | | | | | | | | | |
|
| Road & Rail: 0.34% | |
| | | | |
ERAC USA Finance LLC 144A | | | 2.35 | | | | 10-15-2019 | | | | 3,605,000 | | | | 3,604,137 | |
| | | | | | | | | | | | | | | | |
The accompanying notes are an integral part of these financial statements.
16 | Wells Fargo Ultra Short-Term Income Fund
Portfolio of investments—August 31, 2019
| | | | | | | | | | | | | | | | |
| | | Interest
rate | | | Maturity
date | | | Principal | | | Value | |
Information Technology: 1.14% | |
|
| Semiconductors & Semiconductor Equipment: 0.48% | |
| | | | |
Qualcomm Incorporated | | | 3.00 | % | | | 5-20-2022 | | | $ | 5,000,000 | | | $ | 5,142,285 | |
| | | | | | | | | | | | | | | | |
|
| Technology Hardware, Storage & Peripherals: 0.66% | |
| | | | |
Hewlett Packard Enterprise Company | | | 3.60 | | | | 10-15-2020 | | | | 7,000,000 | | | | 7,100,258 | |
| | | | | | | | | | | | | | | | |
|
Materials: 1.20% | |
|
| Chemicals: 0.48% | |
| | | | |
DowDuPont Incorporated | | | 3.77 | | | | 11-15-2020 | | | | 5,000,000 | | | | 5,103,145 | |
| | | | | | | | | | | | | | | | |
|
| Paper & Forest Products: 0.72% | |
| | | | |
Georgia Pacific LLC 144A | | | 2.54 | | | | 11-15-2019 | | | | 7,740,000 | | | | 7,741,470 | |
| | | | | | | | | | | | | | | | |
|
Real Estate: 0.44% | |
|
| Equity REITs: 0.44% | |
| | | | |
Crown Castle International Corporation | | | 2.25 | | | | 9-1-2021 | | | | 4,700,000 | | | | 4,700,377 | |
| | | | | | | | | | | | | | | | |
|
Utilities: 0.58% | |
|
| Electric Utilities: 0.33% | |
| | | | |
Duke Energy Florida LLC | | | 2.10 | | | | 12-15-2019 | | | | 500,000 | | | | 499,797 | |
| | | | |
Pinnacle West Capital Corporation | | | 2.25 | | | | 11-30-2020 | | | | 3,000,000 | | | | 2,999,779 | |
| | | | |
| | | | | | | | | | | | | | | 3,499,576 | |
| | | | | | | | | | | | | | | | |
|
| Multi-Utilities: 0.25% | |
| | | | |
Dominion Energy Incorporated | | | 2.72 | | | | 8-15-2021 | | | | 2,700,000 | | | | 2,722,712 | |
| | | | | | | | | | | | | | | | |
| |
Total Corporate Bonds and Notes (Cost $319,332,640) | | | | 322,411,228 | |
| | | | | |
| |
| | | | | |
| | | | | | | | | Shares | | | | |
| Exchange-Traded Funds: 5.76% | |
| | |
iShares Short-Term Corporate Bond ETF | | | | 572,000 | | | | 30,762,160 | |
| | |
SPDR Portfolio Short Term Corporate Bond ETF | | | | 1,000,000 | | | | 30,880,000 | |
| |
Total Exchange-Traded Funds (Cost $60,738,737) | | | | 61,642,160 | |
| | | | | |
| |
| | | | | |
| | | | | | | | | Principal | | | | |
| Municipal Obligations: 0.53% | |
|
Indiana: 0.30% | |
|
| Education Revenue: 0.30% | |
| | | | |
Indiana Secondary Market for Education Loans Incorporated (1 Month LIBOR +0.80%)± | | | 3.07 | | | | 2-25-2044 | | | $ | 3,216,070 | | | | 3,186,868 | |
| | | | | | | | | | | | | | | | |
|
Wisconsin: 0.23% | |
|
| Housing Revenue: 0.23% | |
| | | | |
Wisconsin PFA Affinity Living Group Project (Citizens Bank LOC) | | | 3.75 | | | | 2-1-2022 | | | | 2,500,000 | | | | 2,510,125 | |
| | | | | | | | | | | | | | | | |
| |
Total Municipal Obligations (Cost $5,684,197) | | | | 5,696,993 | |
| | | | | |
|
| Non-Agency Mortgage-Backed Securities: 20.48% | |
| | | | |
Angel Oak Mortgage Trust I LLC Series2019-4 Class A1 144A±± | | | 2.99 | | | | 7-26-2049 | | | | 5,352,169 | | | | 5,372,238 | |
| | | | |
Banc of America Funding Corporation Series2016-R1 Class A1 144A±± | | | 2.50 | | | | 3-25-2040 | | | | 1,372,119 | | | | 1,369,478 | |
The accompanying notes are an integral part of these financial statements.
Wells Fargo Ultra Short-Term Income Fund | 17
Portfolio of investments—August 31, 2019
| | | | | | | | | | | | | | | | |
| | | Interest
rate | | | Maturity
date | | | Principal | | | Value | |
| Non-Agency Mortgage-Backed Securities(continued) | |
| | | | |
BDS Limited Series2018-FL2 Class A (1 Month LIBOR +0.95%) 144A± | | | 3.15 | % | | | 8-15-2035 | | | $ | 2,772,529 | | | $ | 2,772,528 | |
| | | | |
Bluemountain CLO Limited Series2015-1A Class A1R (3 Month LIBOR +1.33%) 144A± | | | 3.63 | | | | 4-13-2027 | | | | 1,138,081 | | | | 1,138,609 | |
| | | | |
Bunker Hill Loan Depositary Trust Series2019-1 Class A1 144A | | | 3.61 | | | | 10-26-2048 | | | | 2,260,275 | | | | 2,283,513 | |
| | | | |
Bunker Hill Loan Depositary Trust Series2019-2 Class A1 144A | | | 2.88 | | | | 7-25-2049 | | | | 4,890,645 | | | | 4,912,302 | |
| | | | |
Cascade Funding Mortgage Trust Series 2018- RM2 Class A 144A±± | | | 4.00 | | | | 10-25-2068 | | | | 1,203,960 | | | | 1,246,675 | |
| | | | |
CD Commercial Mortgage Trust Series2017-CD3 Class A1 | | | 1.97 | | | | 2-10-2050 | | | | 2,981,142 | | | | 2,976,385 | |
| | | | |
CGDBB Commercial Mortgage Trust Series 2017-BIOC Class A (1 Month LIBOR +0.79%) 144A± | | | 2.99 | | | | 7-15-2032 | | | | 5,600,000 | | | | 5,599,991 | |
| | | | |
CIFC Funding Limited Series2012-2RA Class A1 (3 Month LIBOR
+0.80%) 144A± | | | 3.08 | | | | 1-20-2028 | | | | 7,550,000 | | | | 7,523,711 | |
| | | | |
CIFC Funding Limited Series2015-2A Class AR (3 Month LIBOR
+0.78%) 144A± | | | 3.08 | | | | 4-15-2027 | | | | 6,935,849 | | | | 6,918,836 | |
| | | | |
Citigroup Commercial Mortgage Trust Series 2014-GC25 Class A2 | | | 3.26 | | | | 10-10-2047 | | | | 656,976 | | | | 656,835 | |
| | | | |
Citigroup Commercial Mortgage Trust Series 2017-1500 Class A (1 Month LIBOR +0.85%) 144A± | | | 3.05 | | | | 7-15-2032 | | | | 6,150,000 | | | | 6,150,063 | |
| | | | |
Citigroup Commercial Mortgage Trust Series 2017-MDRB Class A (1 Month LIBOR +1.10%) 144A± | | | 3.30 | | | | 7-15-2030 | | | | 3,104,805 | | | | 3,079,246 | |
| | | | |
Collateralized Mortgage Obligation Trust Series 66 Class Z | | | 8.00 | | | | 9-20-2021 | | | | 3,496 | | | | 3,562 | |
| | | | |
Colt Funding LLC Series2018-3 Class A1 144A±± | | | 3.69 | | | | 10-26-2048 | | | | 2,624,212 | | | | 2,645,874 | |
| | | | |
Commercial Mortgage Pass-Through Certificate Series2010-C1 Class A3 144A | | | 4.21 | | | | 7-10-2046 | | | | 2,000,059 | | | | 2,016,901 | |
| | | | |
Commercial Mortgage Trust Series 2014-CR15 Class A2 | | | 2.93 | | | | 2-10-2047 | | | | 2,372,757 | | | | 2,371,863 | |
| | | | |
Commercial Mortgage Trust Series 2014-CR16 Class ASB | | | 3.65 | | | | 4-10-2047 | | | | 3,804,243 | | | | 3,929,582 | |
| | | | |
Commercial Mortgage Trust Series 2014-LC17 Class A2 | | | 3.16 | | | | 10-10-2047 | | | | 1,352,022 | | | | 1,351,405 | |
| | | | |
Commercial Mortgage Trust Series 2014-UBS5 Class A2 | | | 3.03 | | | | 9-10-2047 | | | | 994,418 | | | | 996,847 | |
| | | | |
Commercial Mortgage Trust Series 2015-LC23 Class A1 | | | 1.81 | | | | 10-10-2048 | | | | 2,165,424 | | | | 2,158,679 | |
| | | | |
Countrywide Home Loans Mortgage Pass-Through Trust Series 2001-HYB1 Class 1A1±± | | | 4.07 | | | | 6-19-2031 | | | | 135,898 | | | | 137,816 | |
| | | | |
Countrywide Home Loans Mortgage Pass-Through Trust Series 2001-HYB1 Class 2A1±± | | | 4.46 | | | | 6-19-2031 | | | | 84,534 | | | | 84,733 | |
| | | | |
Credit Suisse Mortgage Trust Series 2019-SKLZ Class A (1 Month LIBOR +1.25%) 144A± | | | 3.45 | | | | 1-15-2034 | | | | 3,600,000 | | | | 3,608,207 | |
| | | | |
Crown Point Limited Series2015-3A Class A1AR (3 Month LIBOR
+0.91%) 144A± | | | 3.21 | | | | 12-31-2027 | | | | 7,030,000 | | | | 7,030,921 | |
| | | | |
CSAIL Commercial Mortgage Trust Series2015-C4 Class A1 | | | 2.01 | | | | 11-15-2048 | | | | 785,491 | | | | 783,047 | |
| | | | |
DLJ Mortgage Acceptance Corporation Series1990-2 Class A±± | | | 3.57 | | | | 1-25-2022 | | | | 1,619 | | | | 1,619 | |
| | | | |
EquiFirst Mortgage Loan Trust Series2003-2 Class 3A3 (1 Month LIBOR +1.13%)± | | | 3.32 | | | | 9-25-2033 | | | | 320,914 | | | | 317,621 | |
| | | | |
FirstKey Mortgage Trust Series2014-1 Class A2 144A±± | | | 3.00 | | | | 11-25-2044 | | | | 1,991,123 | | | | 1,987,060 | |
| | | | |
GCAT Series 2019-NQM1 Class A1 144A | | | 2.99 | | | | 2-25-2059 | | | | 6,238,604 | | | | 6,264,758 | |
| | | | |
GCO Education Loan Funding Trust Series2006-1 Class A9L (3 Month LIBOR +0.16%)± | | | 2.68 | | | | 5-25-2026 | | | | 3,454,085 | | | | 3,451,021 | |
| | | | |
Great Wolf Trust Series 2017 Class A (1 Month LIBOR +0.85%) 144A± | | | 3.05 | | | | 9-15-2034 | | | | 2,500,000 | | | | 2,499,176 | |
| | | | |
GS Mortgage Securities Trust Series2010-C1 Class A1 144A | | | 3.68 | | | | 8-10-2043 | | | | 575,125 | | | | 575,623 | |
| | | | |
GS Mortgage Securities Trust Series2010-C2 Class A2 144A±± | | | 5.16 | | | | 12-10-2043 | | | | 3,190,000 | | | | 3,291,043 | |
| | | | |
GS Mortgage Securities Trust Series2011-GC3 Class A4 144A | | | 4.75 | | | | 3-10-2044 | | | | 5,898,882 | | | | 6,035,771 | |
| | | | |
GS Mortgage Securities Trust Series 2013-KING Class A 144A | | | 2.71 | | | | 12-10-2027 | | | | 5,197,360 | | | | 5,194,445 | |
| | | | |
GS Mortgage Securities Trust Series 2014-GC22 Class A3 | | | 3.52 | | | | 6-10-2047 | | | | 3,031,556 | | | | 3,084,086 | |
| | | | |
GS Mortgage Securities Trust Series2015-GS1 Class A1 | | | 1.94 | | | | 11-10-2048 | | | | 325,110 | | | | 324,236 | |
| | | | |
GS Mortgage Securities Trust Series2016-GS3 Class A1 | | | 1.43 | | | | 10-10-2049 | | | | 1,063,029 | | | | 1,055,977 | |
| | | | |
GSMPS Mortgage Loan Trust Series1998-1 Class A 144A±± | | | 8.00 | | | | 9-19-2027 | | | | 37,148 | | | | 36,941 | |
The accompanying notes are an integral part of these financial statements.
18 | Wells Fargo Ultra Short-Term Income Fund
Portfolio of investments—August 31, 2019
| | | | | | | | | | | | | | | | |
| | | Interest
rate | | | Maturity
date | | | Principal | | | Value | |
|
| Non-Agency Mortgage-Backed Securities(continued) | |
| | | | |
Halcyon Loan Advisors Funding Series2014-3A Class AR (3 Month LIBOR +1.10%) 144A± | | | 3.38 | % | | | 10-22-2025 | | | $ | 4,085,986 | | | $ | 4,086,149 | |
| | | | |
Homeward Opportunities Fund I Trust Series2019-1 Class A1 144A±± | | | 3.45 | | | | 1-25-2059 | | | | 4,679,074 | | | | 4,724,193 | |
| | | | |
Hospitality Mortgage Trust Series 2019 Class A (1 Month LIBOR
+1.00%) 144A± | | | 3.20 | | | | 11-15-2036 | | | | 4,870,000 | | | | 4,865,417 | |
| | | | |
JPMorgan Chase Commercial Mortgage Securities Trust Series2011-C5 Class A3 | | | 4.17 | | | | 8-15-2046 | | | | 4,261,624 | | | | 4,396,535 | |
| | | | |
JPMorgan Chase Commercial Mortgage Securities Trust Series2015-C28 Class A2 | | | 2.77 | | | | 10-15-2048 | | | | 93,259 | | | | 93,211 | |
| | | | |
JPMorgan Chase Commercial Mortgage Securities Trust Series2015-C33 Class A1 | | | 1.90 | | | | 12-15-2048 | | | | 1,556,274 | | | | 1,551,893 | |
| | | | |
JPMorgan Chase Commercial Mortgage Securities Trust Series2017-JP5 Class A1 | | | 2.09 | | | | 3-15-2050 | | | | 2,833,387 | | | | 2,829,365 | |
| | | | |
JPMorgan Chase Commercial Mortgage Securities Trust Series2018-PHH Class A (1 Month LIBOR +0.91%) 144A± | | | 3.11 | | | | 6-15-2035 | | | | 3,793,970 | | | | 3,794,186 | |
| | | | |
JPMorgan Chase Commercial Mortgage Securities Trust Series2019-MFP Class A (1 Month LIBOR +0.96%) 144A± | | | 3.16 | | | | 7-15-2036 | | | | 5,000,000 | | | | 4,996,878 | |
| | | | |
LCM XII LP Series2013-A Class ARR (3 Month LIBOR +1.14%) 144A± | | | 3.32 | | | | 7-19-2027 | | | | 6,000,000 | | | | 6,000,444 | |
| | | | |
Master Mortgages Trust Series2002-3 Class 4A1±± | | | 4.98 | | | | 10-25-2032 | | | | 2,916 | | | | 2,963 | |
| | | | |
Mello Warehouse Securitization Series2018-W1 Class A (1 Month LIBOR +0.85%) 144A± | | | 3.00 | | | | 11-25-2051 | | | | 5,500,000 | | | | 5,497,202 | |
| | | | |
Mello Warehouse Securitization Series2019-1 Class A (1 Month LIBOR +0.80%) 144A± | | | 2.95 | | | | 6-25-2052 | | | | 5,065,000 | | | | 5,060,515 | |
| | | | |
Morgan Stanley Bank of America Merrill Lynch Trust Series2016-C28 Class A1 | | | 1.53 | | | | 1-15-2049 | | | | 732,623 | | | | 728,569 | |
| | | | |
Morgan Stanley Capital I Trust Series2011-C2 Class A4 144A | | | 4.66 | | | | 6-15-2044 | | | | 3,125,000 | | | | 3,232,252 | |
| | | | |
Morgan Stanley Capital I Trust Series2016-C30 Class A1 | | | 1.39 | | | | 9-15-2049 | | | | 4,022,790 | | | | 3,992,461 | |
| | | | |
Neuberger Berman Limited Series2015-20A Class AR (3 Month LIBOR +0.80%) 144A± | | | 3.10 | | | | 1-15-2028 | | | | 4,085,000 | | | | 4,062,528 | |
| | | | |
New Residential Mortgage Loan Trust Series 2018-NQM1 Class A1 144A±± | | | 3.99 | | | | 11-25-2048 | | | | 3,527,858 | | | | 3,592,321 | |
| | | | |
Palmer Square Loan Funding Limited Series2018-4A Class A1 (3 Month LIBOR +0.90%) 144A± | | | 3.06 | | | | 11-15-2026 | | | | 3,559,657 | | | | 3,560,842 | |
| | | | |
RAIT Trust Series2017-FL7 Class A (1 Month LIBOR +0.95%) 144A± | | | 3.15 | | | | 6-15-2037 | | | | 901,413 | | | | 900,706 | |
| | | | |
ReadyCap Commercial Mortgage Trust Series2019-5 Class A 144A | | | 3.78 | | | | 2-25-2052 | | | | 4,089,964 | | | | 4,234,891 | |
| | | | |
Salomon Brothers Mortgage Securities VII Series1990-2 Class A±± | | | 2.71 | | | | 11-25-2020 | | | | 125,120 | | | | 125,097 | |
| | | | |
Starwood Mortgage Residential Trust Series2019-1 Class A1 144A±± | | | 2.94 | | | | 6-25-2049 | | | | 4,408,182 | | | | 4,418,187 | |
| | | | |
Stonemont Portfolio Trust Series 2017 Class A (1 Month LIBOR +0.85%) 144A± | | | 3.02 | | | | 8-20-2030 | | | | 5,024,734 | | | | 5,023,087 | |
| | | | |
Structured Asset Mortgage Investments Incorporated Series2001-4 Class A2 ±± | | | 8.15 | | | | 10-25-2024 | | | | 3,829 | | | | 3,856 | |
| | | | |
THL Credit Wind River CLO Limited Series2012-1A Class AR2 (3 Month LIBOR +0.88%) 144A± | | | 3.18 | | | | 1-15-2026 | | | | 4,705,000 | | | | 4,704,920 | |
| | | | |
UBS Commercial Mortgage Trust Series2012-C1 Class A3 | | | 3.40 | | | | 5-10-2045 | | | | 1,450,550 | | | | 1,491,312 | |
| | | | |
UBS Commercial Mortgage Trust Series 2018-NYCH Class A (1 Month LIBOR +0.85%) 144A± | | | 3.05 | | | | 2-15-2032 | | | | 4,115,000 | | | | 4,106,015 | |
| | | | |
Vendee Mortgage Trust Series2011-1 Class DA | | | 3.75 | | | | 2-15-2035 | | | | 2,178,816 | | | | 2,207,224 | |
| | | | |
Venture CDO Limited Series2015-20A Class AR (3 Month LIBOR
+0.82%) 144A± | | | 3.12 | | | | 4-15-2027 | | | | 6,817,700 | | | | 6,798,303 | |
| | | | |
Verus Securitization Trust Series2019-1 Class A1 144A±± | | | 3.40 | | | | 12-25-2059 | | | | 4,469,887 | | | | 4,511,212 | |
| | | | |
Wilshire Funding Corporation Series1996-3 Class M2±± | | | 7.07 | | | | 8-25-2032 | | | | 134,061 | | | | 131,746 | |
| | | | |
Wilshire Funding Corporation Series1996-3 Class M3±± | | | 7.07 | | | | 8-25-2032 | | | | 122,155 | | | | 118,360 | |
| | | | |
Wilshire Funding Corporation Series1998-2 Class M1±± | | | 2.00 | | | | 12-28-2037 | | | | 164,550 | | | | 166,080 | |
| |
TotalNon-Agency Mortgage-Backed Securities (Cost $218,769,842) | | | | 219,248,144 | |
| | | | | |
The accompanying notes are an integral part of these financial statements.
Wells Fargo Ultra Short-Term Income Fund | 19
Portfolio of investments—August 31, 2019
| | | | | | | | | | | | | | | | |
| | | Interest
rate | | | Maturity
date | | | Principal | | | Value | |
Yankee Corporate Bonds and Notes: 16.54% | |
|
Communication Services: 0.93% | |
|
| Diversified Telecommunication Services: 0.93% | |
| | | | |
Deutsche Telekom International Finance BV 144A | | | 2.23 | % | | | 1-17-2020 | | | $ | 10,000,000 | | | $ | 9,992,791 | |
| | | | | | | | | | | | | | | | |
|
Consumer Discretionary: 1.17% | |
|
| Auto Components: 0.59% | |
| | | | |
Toyota Industries Corporation 144A | | | 3.11 | | | | 3-12-2022 | | | | 6,145,000 | | | | 6,270,803 | |
| | | | | | | | | | | | | | | | |
|
| Automobiles: 0.11% | |
| | | | |
Jaguar Land Rover Limited 144A | | | 4.25 | | | | 11-15-2019 | | | | 1,220,000 | | | | 1,215,730 | |
| | | | | | | | | | | | | | | | |
|
| Household Durables: 0.47% | |
| | | | |
Panasonic Corporation 144A | | | 2.54 | | | | 7-19-2022 | | | | 5,000,000 | | | | 5,048,083 | |
| | | | | | | | | | | | | | | | |
|
Consumer Staples: 0.51% | |
|
| Beverages: 0.08% | |
| | | | |
Suntory Holdings Limited 144A | | | 2.55 | | | | 9-29-2019 | | | | 850,000 | | | | 850,016 | |
| | | | | | | | | | | | | | | | |
|
| Food & Staples Retailing: 0.43% | |
| | | | |
Seven & I Holdings Company Limited 144A | | | 3.35 | | | | 9-17-2021 | | | | 4,500,000 | | | | 4,608,542 | |
| | | | | | | | | | | | | | | | |
|
Energy: 0.88% | |
|
| Oil, Gas & Consumable Fuels: 0.88% | |
| | | | |
Petroleos Mexicanos Company | | | 5.38 | | | | 3-13-2022 | | | | 2,525,000 | | | | 2,581,813 | |
| | | | |
TransCanada PipeLines Limited | | | 9.88 | | | | 1-1-2021 | | | | 6,200,000 | | | | 6,810,895 | |
| | | | |
| | | | | | | | | | | | | | | 9,392,708 | |
| | | | | | | | | | | | | | | | |
|
Financials: 11.26% | |
|
| Banks: 10.07% | |
| | | | |
ABN AMRO Bank NV 144A | | | 3.40 | | | | 8-27-2021 | | | | 7,000,000 | | | | 7,159,804 | |
| | | | |
ANZ New Zealand International Limited 144A | | | 2.60 | | | | 9-23-2019 | | | | 8,175,000 | | | | 8,176,744 | |
| | | | |
Banco de Credito del Peru 144A | | | 2.25 | | | | 10-25-2019 | | | | 4,500,000 | | | | 4,497,795 | |
| | | | |
Banco Santander Chile 144A | | | 2.50 | | | | 12-15-2020 | | | | 8,255,000 | | | | 8,255,000 | |
| | | | |
Banco Santander SA | | | 3.50 | | | | 4-11-2022 | | | | 10,020,000 | | | | 10,325,970 | |
| | | | |
Banque Federative du Credit Mutuel SA 144A | | | 2.20 | | | | 7-20-2020 | | | | 7,470,000 | | | | 7,481,188 | |
| | | | |
Commonwealth Bank of Australia 144A | | | 1.75 | | | | 11-7-2019 | | | | 5,250,000 | | | | 5,245,815 | |
| | | | |
Corporación Andina de Fomento | | | 4.38 | | | | 6-15-2022 | | | | 5,400,000 | | | | 5,708,718 | |
| | | | |
Danske Bank AS 144A | | | 5.00 | | | | 1-12-2022 | | | | 3,565,000 | | | | 3,759,869 | |
| | | | |
DNB Bank ASA 144A | | | 2.13 | | | | 10-2-2020 | | | | 7,000,000 | | | | 7,003,586 | |
| | | | |
Federation des Caisses Desjardins du Quebec 144A | | | 2.25 | | | | 10-30-2020 | | | | 5,000,000 | | | | 5,013,006 | |
| | | | |
Global Bank Corporation 144A | | | 4.50 | | | | 10-20-2021 | | | | 1,180,000 | | | | 1,214,220 | |
| | | | |
Sumitomo Mitsui Banking Corporation (3 Month LIBOR +0.37%)± | | | 2.69 | | | | 10-16-2020 | | | | 5,000,000 | | | | 5,011,768 | |
| | | | |
Sumitomo Mitsui Financial Group | | | 2.06 | | | | 7-14-2021 | | | | 5,000,000 | | | | 4,994,114 | |
| | | | |
Sumitomo Mitsui Trust Bank Limited 144A | | | 1.95 | | | | 9-19-2019 | | | | 7,000,000 | | | | 6,998,611 | |
| | | | |
Suncorp-Metway Limited 144A | | | 2.38 | | | | 11-9-2020 | | | | 4,000,000 | | | | 4,012,300 | |
| | | | |
Svenska Handelsbanken AB | | | 1.88 | | | | 9-7-2021 | | | | 7,000,000 | | | | 6,973,018 | |
| | | | |
UniCredit SpA 144A | | | 6.57 | | | | 1-14-2022 | | | | 5,615,000 | | | | 6,037,736 | |
| | | | |
| | | | | | | | | | | | | | | 107,869,262 | |
| | | | | | | | | | | | | | | | |
The accompanying notes are an integral part of these financial statements.
20 | Wells Fargo Ultra Short-Term Income Fund
Portfolio of investments—August 31, 2019
| | | | | | | | | | | | | | | | |
| | | Interest
rate | | | Maturity
date | | | Principal | | | Value | |
| Diversified Financial Services: 1.19% | |
| | | | |
AerCap Ireland Capital DAC | | | 4.45 | % | | | 12-16-2021 | | | $ | 3,590,000 | | | $ | 3,730,394 | |
| | | | |
General Electric Capital International Funding Company | | | 2.34 | | | | 11-15-2020 | | | | 5,322,000 | | | | 5,292,166 | |
| | | | |
UBS AG 144A | | | 2.20 | | | | 6-8-2020 | | | | 3,725,000 | | | | 3,726,688 | |
| | | | |
| | | | | | | | | | | | | | | 12,749,248 | |
| | | | | | | | | | | | | | | | |
|
Health Care: 0.75% | |
|
| Pharmaceuticals: 0.75% | |
| | | | |
Perrigo Finance Unlimited Company | | | 3.50 | | | | 3-15-2021 | | | | 2,665,000 | | | | 2,679,251 | |
| | | | |
Shire Acquisitions Investment Ireland Limited | | | 1.90 | | | | 9-23-2019 | | | | 2,880,000 | | | | 2,879,366 | |
| | | | |
Shire Acquisitions Investment Ireland Limited | | | 2.40 | | | | 9-23-2021 | | | | 2,520,000 | | | | 2,527,812 | |
| | | | |
| | | | | | | | | | | | | | | 8,086,429 | |
| | | | | | | | | | | | | | | | |
|
Industrials: 0.21% | |
|
| Semiconductors & Semiconductor Equipment: 0.21% | |
| | | | |
NXP BV 144A | | | 4.13 | | | | 6-1-2021 | | | | 2,215,000 | | | | 2,273,088 | |
| | | | | | | | | | | | | | | | |
|
Materials: 0.83% | |
|
| Chemicals: 0.47% | |
| | | | |
Syngenta Finance NV 144A | | | 3.70 | | | | 4-24-2020 | | | | 5,000,000 | | | | 5,019,292 | |
| | | | | | | | | | | | | | | | |
|
| Metals & Mining: 0.36% | |
| | | | |
ArcelorMittal SA | | | 5.50 | | | | 3-1-2021 | | | | 3,660,000 | | | | 3,818,623 | |
| | | | | | | | | | | | | | | | |
| |
Total Yankee Corporate Bonds and Notes (Cost $175,104,535) | | | | 177,194,615 | |
| | | | | |
| |
| | | | | |
| | | Yield | | | | | | Shares | | | | |
| Short-Term Investments: 5.98% | |
|
| Investment Companies: 5.80% | |
| | | | |
Wells Fargo Government Money Market Fund Select Class (l)(u) | | | 2.04 | | | | | | | | 62,084,487 | | | | 62,084,487 | |
| | | | | | | | | | | | | | | | |
| | | | |
| | | | | | | | | | | | | | | | |
| | | | | | | | | Principal | | | | |
| U.S. Treasury Securities: 0.18% | |
| | | | |
U.S. Treasury Bill (z)# | | | 1.65 | | | | 9-12-2019 | | | $ | 1,950,000 | | | | 1,949,092 | |
| | | | | | | | | | | | | | | | |
| |
Total Short-Term Investments (Cost $64,033,412) | | | | 64,033,579 | |
| | | | | |
| | | | | | | | |
| Total investments in securities (Cost $1,050,259,444) | | | 98.82 | % | | | 1,058,357,336 | |
| | |
Other assets and liabilities, net | | | 1.18 | | | | 12,607,762 | |
| | | | | | | | |
| Total net assets | | | 100.00 | % | | $ | 1,070,965,098 | |
| | | | | | | | |
| 144A | The security may be resold in transactions exempt from registration, normally to qualified institutional buyers, pursuant to Rule 144A under the Securities Act of 1933. |
| ± | Variable rate investment. The rate shown is the rate in effect at period end. |
| ±± | The coupon of the security is adjusted based on the principal and interest payments received from the underlying pool of mortgages as well as the credit quality and the actual prepayment speed of the underlying mortgages. |
| (l) | The issuer of the security is an affiliated person of the Fund as defined in the Investment Company Act of 1940. |
| (u) | The rate represents the7-day annualized yield at period end. |
| (z) | Zero coupon security. The rate represents the current yield to maturity. |
| # | All or a portion of this security is segregated as collateral for investments in derivative instruments. |
The accompanying notes are an integral part of these financial statements.
Wells Fargo Ultra Short-Term Income Fund | 21
Portfolio of investments—August 31, 2019
Abbreviations:
| CDO | Collateralized debt obligation |
| FDIC | Federal Deposit Insurance Corporation |
| FHLMC | Federal Home Loan Mortgage Corporation |
| FNMA | Federal National Mortgage Association |
| GNMA | Government National Mortgage Association |
| LIBOR | London Interbank Offered Rate |
| PFA | Public Finance Authority |
| REIT | Real estate investment trust |
Futures Contracts
| | | | | | | | | | | | | | | | | | | | |
| Description | | Number of
contracts | | Expiration
date | | Notional
cost | | | Notional
value | | | Unrealized
gains | | | Unrealized
losses | |
| Short | | | | | | | | | | | | | | | | |
| | | | | | |
2-Year U.S. Treasury Notes | | (1,024) | | 12-31-2019 | | $ | (221,326,360 | ) | | $ | (221,304,000 | ) | | $ | 22,360 | | | $ | 0 | |
| | | | | | |
5-Year U.S. Treasury Notes | | (172) | | 12-31-2019 | | | (20,662,250 | ) | | | (20,635,969 | ) | | | 26,281 | | | | 0 | |
| | | | | | | | | | | | | | | | | | | | |
| | | | | | |
| | | | | | | | | | | | | | $ | 48,641 | | | $ | 0 | |
| | | | | | | | | | | | | | | | | | | | |
Investments in Affiliates
An affiliated investment is an investment in which the Fund owns at least 5% of the outstanding voting shares of the issuer or as a result of other relationships, such as the Fund and the issuer having the same investment manager. Transactions with issuers that were either affiliated persons of the Fund at the beginning of the period or the end of the period were as follows:
| | | | | | | | | | | | | | | | | | | | | | | | | | | | | | | | | | | | |
| | | Shares,
beginning of
period | | | Shares
purchased | | | Shares
sold | | | Shares,
end of
period | | | Net
realized
gains
(losses) | | | Net
change in
unrealized
gains
(losses) | | | Income
from
affiliated
securities | | | Value,
end
of period | | | % of
net
assets | |
Short-Term Investments | | | | | | | | | | | | | | | | | | | | | | | | | | | | | | | | | | | | |
Investment Companies | | | | | | | | | | | | | | | | | | | | | | | | | | | | | | | | | | | | |
Securities Lending Cash Investments LLC* | | | 6,848,410 | | | | 180,438,153 | | | | 187,286,563 | | | | 0 | | | $ | 498 | | | $ | 0 | | | $ | 75,771 | # | | $ | 0 | | | | | |
Wells Fargo Government Money Market Fund Select Class | | | 33,367,503 | | | | 634,446,848 | | | | 605,729,864 | | | | 62,084,487 | | | | 0 | | | | 0 | | | | 1,267,838 | | | | 62,084,487 | | | | | |
| | | | | | | | | | | | | | | | | | | | | | | | | | | | | | | | | | | | |
| | | | | | | | | | | | | | | | | | $ | 498 | | | $ | 0 | | | $ | 1,343,609 | | | $ | 62,084,487 | | | | 5.80 | % |
| | | | | | | | | | | | | | | | | | | | | | | | | | | | | | | | | | | | |
| * | No longer held at the end of the period |
| # | Amount shown represents income before fees and rebates. |
The accompanying notes are an integral part of these financial statements.
22 | Wells Fargo Ultra Short-Term Income Fund
Statement of assets and liabilities—August 31, 2019
| | | | |
| | | | |
| |
Assets | | | | |
Investments in unaffiliated securities, at value (cost $988,174,957) | | $ | 996,272,849 | |
Investments in affiliated securities, at value (cost $62,084,487) | | | 62,084,487 | |
Cash | | | 3,933,707 | |
Cash due from broker | | | 1,900,199 | |
Principal paydown receivable | | | 222,629 | |
Receivable for Fund shares sold | | | 5,802,495 | |
Receivable for interest | | | 5,627,560 | |
Receivable for securities lending income, net | | | 2,283 | |
Prepaid expenses and other assets | | | 758 | |
| | | | |
Total assets | | | 1,075,846,967 | |
| | | | |
| |
Liabilities | | | | |
Dividends payable | | | 860,671 | |
Payable for investments purchased | | | 1,155,626 | |
Payable for Fund shares redeemed | | | 1,880,332 | |
Payable for daily variation margin on open futures contracts | | | 112,143 | |
Management fee payable | | | 226,050 | |
Distribution fee payable | | | 3,470 | |
Administration fees payable | | | 93,492 | |
Trustees’ fees and expenses payable | | | 4,214 | |
Accrued expenses and other liabilities | | | 545,871 | |
| | | | |
Total liabilities | | | 4,881,869 | |
| | | | |
Total net assets | | $ | 1,070,965,098 | |
| | | | |
| |
Net assets consist of | | | | |
Paid-in capital | | $ | 1,093,291,605 | |
Total distributable loss | | | (22,326,507 | ) |
| | | | |
Total net assets | | $ | 1,070,965,098 | |
| | | | |
| |
Computation of net asset value and offering price per share | | | | |
Net assets – Class A | | $ | 215,503,254 | |
Shares outstanding – Class A1 | | | 25,221,232 | |
Net asset value per share – Class A | | | $8.54 | |
Maximum offering price per share – Class A2 | | | $8.71 | |
Net assets – Class C | | $ | 5,257,396 | |
Shares outstanding – Class C1 | | | 615,941 | |
Net asset value per share – Class C | | | $8.54 | |
Net assets – Administrator Class | | $ | 13,748,441 | |
Shares outstanding – Administrator Class1 | | | 1,616,239 | |
Net asset value per share – Administrator Class | | | $8.51 | |
Net assets – Institutional Class | | $ | 836,456,007 | |
Shares outstanding – Institutional Class1 | | | 97,945,444 | |
Net asset value per share – Institutional Class | | | $8.54 | |
| 1 | The Fund has an unlimited number of authorized shares. |
| 2 | Maximum offering price is computed as 100/98 of net asset value. On investments of $50,000 or more, the offering price is reduced. |
The accompanying notes are an integral part of these financial statements.
Wells Fargo Ultra Short-Term Income Fund | 23
Statement of operations—year ended August 31, 2019
| | | | |
| | | | |
| |
Investment income | | | | |
Interest | | $ | 26,063,928 | |
Income from affiliated securities | | | 1,285,732 | |
Dividends | | | 929,050 | |
| | | | |
Total investment income | | | 28,278,710 | |
| | | | |
| |
Expenses | | | | |
Management fee | | | 3,578,435 | |
Administration fees | | | | |
Class A | | | 365,733 | |
Class C | | | 8,531 | |
Administrator Class | | | 13,776 | |
Institutional Class | | | 621,398 | |
Shareholder servicing fees | | | | |
Class A | | | 571,457 | |
Class C | | | 13,329 | |
Administrator Class | | | 34,236 | |
Distribution fee | | | | |
Class C | | | 39,988 | |
Custody and accounting fees | | | 89,751 | |
Professional fees | | | 73,794 | |
Registration fees | | | 134,629 | |
Shareholder report expenses | | | 69,808 | |
Trustees’ fees and expenses | | | 21,592 | |
Other fees and expenses | | | 22,310 | |
| | | | |
Total expenses | | | 5,658,767 | |
Less: Fee waivers and/or expense reimbursements | | | | |
Fund-level | | | (1,019,910 | ) |
Administrator Class | | | (12,184 | ) |
Institutional Class | | | (155,244 | ) |
| | | | |
Net expenses | | | 4,471,429 | |
| | | | |
Net investment income | | | 23,807,281 | |
| | | | |
| |
Realized and unrealized gains (losses) on investments | | | | |
Net realized gains (losses) on | |
Unaffiliated securities | | | (43,464 | ) |
Affiliated securities | | | 498 | |
Futures contracts | | | (5,131,020 | ) |
| | | | |
Net realized losses on investments | | | (5,173,986 | ) |
| | | | |
| |
Net change in unrealized gains (losses) on | | | | |
Unaffiliated securities | | | 14,684,106 | |
Futures contracts | | | 208,939 | |
| | | | |
Net change in unrealized gains (losses) on investments | | | 14,893,045 | |
| | | | |
Net realized and unrealized gains (losses) on investments | | | 9,719,059 | |
| | | | |
Net increase in net assets resulting from operations | | $ | 33,526,340 | |
| | | | |
The accompanying notes are an integral part of these financial statements.
24 | Wells Fargo Ultra Short-Term Income Fund
Statement of changes in net assets
| | | | | | | | | | | | | | | | |
| | | Year ended
August 31, 2019 | | | Year ended
August 31, 20181 | |
| | | | |
Operations | | | | | | | | | | | | | | | | |
Net investment income | | | | | | $ | 23,807,281 | | | | | | | $ | 20,741,167 | |
Net realized gains (losses) on investments | | | | | | | (5,173,986 | ) | | | | | | | 5,245,220 | |
Net change in unrealized gains (losses) on investments | | | | | | | 14,893,045 | | | | | | | | (8,633,812 | ) |
| | | | |
Net increase in net assets resulting from operations | | | | | | | 33,526,340 | | | | | | | | 17,352,575 | |
| | | | |
| | | | |
Distributions to shareholders from net investment income and net realized gains | | | | | | | | | | | | | | | | |
Class A | | | | | | | (4,691,164 | ) | | | | | | | (3,917,235 | ) |
Class C | | | | | | | (69,389 | ) | | | | | | | (37,856 | ) |
Administrator Class | | | | | | | (302,857 | ) | | | | | | | (394,368 | ) |
Institutional Class | | | | | | | (18,718,916 | ) | | | | | | | (16,292,768 | ) |
| | | | |
Total distributions to shareholders | | | | | | | (23,782,326 | ) | | | | | | | (20,642,227 | ) |
| | | | |
| | | | |
Capital share transactions | | | Shares | | | | | | | | Shares | | | | | |
Proceeds from shares sold | | | | | | | | | | | | | | | | |
Class A | | | 3,440,445 | | | | 29,216,109 | | | | 9,821,346 | | | | 83,149,259 | |
Class C | | | 442,509 | | | | 3,748,406 | | | | 132,182 | | | | 1,117,321 | |
Administrator Class | | | 508,071 | | | | 4,302,476 | | | | 5,167,624 | | | | 43,651,565 | |
Institutional Class | | | 79,096,663 | | | | 671,176,689 | | | | 96,798,778 | | | | 819,199,382 | |
| | | | |
| | | | | | | 708,443,680 | | | | | | | | 947,117,527 | |
| | | | |
Reinvestment of distributions | | | | | | | | | | | | | | | | |
Class A | | | 534,195 | | | | 4,540,259 | | | | 449,252 | | | | 3,800,963 | |
Class C | | | 8,101 | | | | 68,784 | | | | 4,431 | | | | 37,441 | |
Administrator Class | | | 35,444 | | | | 299,894 | | | | 46,300 | | | | 390,336 | |
Institutional Class | | | 1,026,803 | | | | 8,724,965 | | | | 710,263 | | | | 6,007,655 | |
| | | | |
| | | | | | | 13,633,902 | | | | | | | | 10,236,395 | |
| | | | |
Payment for shares redeemed | | | | | | | | | | | | | | | | |
Class A | | | (7,567,845 | ) | | | (64,257,129 | ) | | | (13,762,670 | ) | | | (116,485,682 | ) |
Class C | | | (432,645 | ) | | | (3,668,839 | ) | | | (218,323 | ) | | | (1,846,435 | ) |
Administrator Class | | | (711,430 | ) | | | (6,017,265 | ) | | | (6,654,246 | ) | | | (56,159,888 | ) |
Institutional Class | | | (70,211,953 | ) | | | (595,758,632 | ) | | | (134,706,249 | ) | | | (1,139,718,949 | ) |
| | | | |
| | | | | | | (669,701,865 | ) | | | | | | | (1,314,210,954 | ) |
| | | | |
Net increase (decrease) in net assets resulting from capital share transactions | | | | | | | 52,375,717 | | | | | | | | (356,857,032 | ) |
| | | | |
Total increase (decrease) in net assets | | | | | | | 62,119,731 | | | | | | | | (360,146,684 | ) |
| | | | |
| | |
Net assets | | | | | | | | |
Beginning of period | | | | | | | 1,008,845,367 | | | | | | | | 1,368,992,051 | |
| | | | |
End of period | | | | | | $ | 1,070,965,098 | | | | | | | $ | 1,008,845,367 | |
| | | | |
| 1 | Effective for all filings after November 4, 2018, the SEC prospectively eliminated the requirement to parenthetically disclose undistributed net investment income at the end of the period and permitted the aggregation of distributions, with the exception of tax basis returns of capital. Overdistributed net investment income at August 31, 2018 was $597,033. The disaggregated distributions information for the year ended August 31, 2018 is included in Note 9,Distributions to Shareholders, in the notes to the financial statements. |
The accompanying notes are an integral part of these financial statements.
Wells Fargo Ultra Short-Term Income Fund | 25
Financial highlights
(For a share outstanding throughout each period)
| | | | | | | | | | | | | | | | | | | | |
| | | Year ended August 31 | |
| CLASS A | | 2019 | | | 2018 | | | 2017 | | | 2016 | | | 2015 | |
Net asset value, beginning of period | | | $8.46 | | | | $8.48 | | | | $8.49 | | | | $8.46 | | | | $8.53 | |
Net investment income | | | 0.17 | 1 | | | 0.13 | | | | 0.09 | | | | 0.08 | | | | 0.05 | |
Net realized and unrealized gains (losses) on investments | | | 0.08 | | | | (0.02 | ) | | | (0.01 | ) | | | 0.03 | | | | (0.06 | ) |
| | | | | | | | | | | | | | | | | | | | |
Total from investment operations | | | 0.25 | | | | 0.11 | | | | 0.08 | | | | 0.11 | | | | (0.01 | ) |
Distributions to shareholders from | | | | | | | | | | | | | | | | | | | | |
Net investment income | | | (0.17 | ) | | | (0.13 | ) | | | (0.09 | ) | | | (0.08 | ) | | | (0.05 | ) |
Tax basis return of capital | | | 0.00 | | | | 0.00 | | | | 0.00 | | | | 0.00 | | | | (0.01 | ) |
| | | | | | | | | | | | | | | | | | | | |
Total distributions to shareholders | | | (0.17 | ) | | | (0.13 | ) | | | (0.09 | ) | | | (0.08 | ) | | | (0.06 | ) |
Net asset value, end of period | | | $8.54 | | | | $8.46 | | | | $8.48 | | | | $8.49 | | | | $8.46 | |
Total return2 | | | 3.04 | % | | | 1.24 | % | | | 0.97 | % | | | 1.28 | % | | | (0.07 | )% |
Ratios to average net assets (annualized) | | | | | | | | | | | | | | | | | | | | |
Gross expenses | | | 0.80 | % | | | 0.80 | % | | | 0.79 | % | | | 0.79 | % | | | 0.77 | % |
Net expenses | | | 0.70 | % | | | 0.70 | % | | | 0.70 | % | | | 0.70 | % | | | 0.70 | % |
Net investment income | | | 2.05 | % | | | 1.47 | % | | | 1.09 | % | | | 0.93 | % | | | 0.64 | % |
Supplemental data | | | | | | | | | | | | | | | | | | | | |
Portfolio turnover rate | | | 36 | % | | | 55 | % | | | 56 | % | | | 51 | % | | | 70 | % |
Net assets, end of period (000s omitted) | | | $215,503 | | | | $243,909 | | | | $274,079 | | | | $319,565 | | | | $151,561 | |
| 1 | Calculated based upon average shares outstanding |
| 2 | Total return calculations do not include any sales charges. |
The accompanying notes are an integral part of these financial statements.
26 | Wells Fargo Ultra Short-Term Income Fund
Financial highlights
(For a share outstanding throughout each period)
| | | | | | | | | | | | | | | | | | | | |
| | | Year ended August 31 | |
| CLASS C | | 2019 | | | 2018 | | | 2017 | | | 2016 | | | 2015 | |
Net asset value, beginning of period | | | $8.46 | | | | $8.47 | | | | $8.48 | | | | $8.45 | | | | $8.52 | |
Net investment income (loss) | | | 0.11 | | | | 0.06 | | | | 0.02 | | | | 0.01 | | | | (0.01 | ) |
Net realized and unrealized gains (losses) on investments | | | 0.08 | | | | (0.01 | ) | | | 0.00 | | | | 0.03 | | | | (0.06 | ) |
| | | | | | | | | | | | | | | | | | | | |
Total from investment operations | | | 0.19 | | | | 0.05 | | | | 0.02 | | | | 0.04 | | | | (0.07 | ) |
Distributions to shareholders from | | | | | | | | | | | | | | | | | | | | |
Net investment income | | | (0.11 | ) | | | (0.06 | ) | | | (0.03 | ) | | | (0.01 | ) | | | (0.00 | )1 |
Tax basis return of capital | | | 0.00 | | | | 0.00 | | | | 0.00 | | | | 0.00 | | | | (0.00 | )1 |
| | | | | | | | | | | | | | | | | | | | |
Total distributions to shareholders | | | (0.11 | ) | | | (0.06 | ) | | | (0.03 | ) | | | (0.01 | ) | | | (0.00 | )1 |
Net asset value, end of period | | | $8.54 | | | | $8.46 | | | | $8.47 | | | | $8.48 | | | | $8.45 | |
Total return2 | | | 2.27 | % | | | 0.60 | % | | | 0.22 | % | | | 0.52 | % | | | (0.81 | )% |
Ratios to average net assets (annualized) | | | | | | | | | | | | | | | | | | | | |
Gross expenses | | | 1.55 | % | | | 1.55 | % | | | 1.54 | % | | | 1.54 | % | | | 1.52 | % |
Net expenses | | | 1.45 | % | | | 1.45 | % | | | 1.45 | % | | | 1.45 | % | | | 1.45 | % |
Net investment income (loss) | | | 1.31 | % | | | 0.72 | % | | | 0.34 | % | | | 0.17 | % | | | (0.10 | )% |
Supplemental data | | | | | | | | | | | | | | | | | | | | |
Portfolio turnover rate | | | 36 | % | | | 55 | % | | | 56 | % | | | 51 | % | | | 70 | % |
Net assets, end of period (000s omitted) | | | $5,257 | | | | $5,056 | | | | $5,760 | | | | $7,464 | | | | $7,642 | |
| 1 | Amount is less than $0.005. |
| 2 | Total return calculations do not include any sales charges. |
The accompanying notes are an integral part of these financial statements.
Wells Fargo Ultra Short-Term Income Fund | 27
Financial highlights
|
| (For a share outstanding throughout each period) |
| | | | | | | | | | | | | | | | | | | | |
| | | Year ended August 31 | |
| ADMINISTRATOR CLASS | | 2019 | | | 2018 | | | 2017 | | | 2016 | | | 2015 | |
Net asset value, beginning of period | | | $8.43 | | | | $8.45 | | | | $8.46 | | | | $8.42 | | | | $8.50 | |
Net investment income | | | 0.19 | 1 | | | 0.13 | | | | 0.10 | | | | 0.09 | | | | 0.07 | 1 |
Net realized and unrealized gains (losses) on investments | | | 0.08 | | | | (0.01 | ) | | | (0.01 | ) | | | 0.04 | | | | (0.07 | ) |
| | | | | | | | | | | | | | | | | | | | |
Total from investment operations | | | 0.27 | | | | 0.12 | | | | 0.09 | | | | 0.13 | | | | 0.00 | |
Distributions to shareholders from | | | | | | | | | | | | | | | | | | | | |
Net investment income | | | (0.19 | ) | | | (0.14 | ) | | | (0.10 | ) | | | (0.09 | ) | | | (0.07 | ) |
Tax basis return of capital | | | 0.00 | | | | 0.00 | | | | 0.00 | | | | 0.00 | | | | (0.01 | ) |
| | | | | | | | | | | | | | | | | | | | |
Total distributions to shareholders | | | (0.19 | ) | | | (0.14 | ) | | | (0.10 | ) | | | (0.09 | ) | | | (0.08 | ) |
Net asset value, end of period | | | $8.51 | | | | $8.43 | | | | $8.45 | | | | $8.46 | | | | $8.42 | |
Total return | | | 3.19 | % | | | 1.39 | % | | | 1.12 | % | | | 1.55 | % | | | (0.04 | )% |
Ratios to average net assets (annualized) | | | | | | | | | | | | | | | | | | | | |
Gross expenses | | | 0.74 | % | | | 0.74 | % | | | 0.73 | % | | | 0.73 | % | | | 0.71 | % |
Net expenses | | | 0.55 | % | | | 0.55 | % | | | 0.55 | % | | | 0.55 | % | | | 0.55 | % |
Net investment income | | | 2.20 | % | | | 1.54 | % | | | 1.24 | % | | | 1.05 | % | | | 0.81 | % |
Supplemental data | | | | | | | | | | | | | | | | | | | | |
Portfolio turnover rate | | | 36 | % | | | 55 | % | | | 56 | % | | | 51 | % | | | 70 | % |
Net assets, end of period (000s omitted) | | | $13,748 | | | | $15,037 | | | | $27,245 | | | | $26,679 | | | | $44,682 | |
| 1 | Calculated based upon average shares outstanding |
The accompanying notes are an integral part of these financial statements.
28 | Wells Fargo Ultra Short-Term Income Fund
Financial highlights
(For a share outstanding throughout each period)
| | | | | | | | | | | | | | | | | | | | |
| | | Year ended August 31 | |
| INSTITUTIONAL CLASS | | 2019 | | | 2018 | | | 2017 | | | 2016 | | | 2015 | |
Net asset value, beginning of period | | | $8.46 | | | | $8.48 | | | | $8.49 | | | | $8.45 | | | | $8.53 | |
Net investment income | | | 0.20 | | | | 0.15 | | | | 0.12 | | | | 0.11 | | | | 0.08 | |
Net realized and unrealized gains (losses) on investments | | | 0.08 | | | | (0.02 | ) | | | (0.01 | ) | | | 0.04 | | | | (0.07 | ) |
| | | | | | | | | | | | | | | | | | | | |
Total from investment operations | | | 0.28 | | | | 0.13 | | | | 0.11 | | | | 0.15 | | | | 0.01 | |
Distributions to shareholders from | | | | | | | | | | | | | | | | | | | | |
Net investment income | | | (0.20 | ) | | | (0.15 | ) | | | (0.12 | ) | | | (0.11 | ) | | | (0.08 | ) |
Tax basis return of capital | | | 0.00 | | | | 0.00 | | | | 0.00 | | | | 0.00 | | | | (0.01 | ) |
| | | | | | | | | | | | | | | | | | | | |
Total distributions to shareholders | | | (0.20 | ) | | | (0.15 | ) | | | (0.12 | ) | | | (0.11 | ) | | | (0.09 | ) |
Net asset value, end of period | | | $8.54 | | | | $8.46 | | | | $8.48 | | | | $8.49 | | | | $8.45 | |
Total return | | | 3.40 | % | | | 1.59 | % | | | 1.33 | % | | | 1.75 | % | | | 0.16 | % |
Ratios to average net assets (annualized) | | | | | | | | | | | | | | | | | | | | |
Gross expenses | | | 0.47 | % | | | 0.47 | % | | | 0.46 | % | | | 0.46 | % | | | 0.44 | % |
Net expenses | | | 0.35 | % | | | 0.35 | % | | | 0.35 | % | | | 0.35 | % | | | 0.35 | % |
Net investment income | | | 2.41 | % | | | 1.80 | % | | | 1.43 | % | | | 1.27 | % | | | 0.99 | % |
Supplemental data | | | | | | | | | | | | | | | | | | | | |
Portfolio turnover rate | | | 36 | % | | | 55 | % | | | 56 | % | | | 51 | % | | | 70 | % |
Net assets, end of period (000s omitted) | | | $836,456 | | | | $744,844 | | | | $1,061,908 | | | | $1,197,514 | | | | $1,137,808 | |
The accompanying notes are an integral part of these financial statements.
Wells Fargo Ultra Short-Term Income Fund | 29
Notes to financial statements
1. ORGANIZATION
Wells Fargo Funds Trust (the “Trust”), a Delaware statutory trust organized on March 10, 1999, is anopen-end management investment company registered under the Investment Company Act of 1940, as amended (the “1940 Act”). As an investment company, the Trust follows the accounting and reporting guidance in Financial Accounting Standards Board (“FASB”)Accounting Standards Codification Topic 946, Financial Services – Investment Companies. These financial statements report on the Wells Fargo Ultra Short-Term Income Fund (the “Fund”) which is a diversified series of the Trust.
2. SIGNIFICANT ACCOUNTING POLICIES
The following significant accounting policies, which are consistently followed in the preparation of the financial statements of the Fund, are in conformity with U.S. generally accepted accounting principles which require management to make estimates and assumptions that affect the reported amounts of assets and liabilities, disclosure of contingent assets and liabilities at the date of the financial statements, and the reported amounts of revenues and expenses during the reporting period. Actual results could differ from those estimates.
Securities valuation
All investments are valued each business day as of the close of regular trading on the New York Stock Exchange (generally 4 p.m. Eastern Time), although the Fund may deviate from this calculation time under unusual or unexpected circumstances.
Debt securities are valued at the evaluated bid price provided by an independent pricing service (e.g. taking into account various factors, including yields, maturities, or credit ratings) or, if a reliable price is not available, the quoted bid price from an independent broker-dealer.
Equity securities and futures contracts that are listed on a foreign or domestic exchange or market are valued at the official closing price or, if none, the last sales price. If no sale occurs on the principal exchange or market that day, a fair value price will be determined in accordance with the Fund’s Valuation Procedures.
Investments in registeredopen-end investment companies are valued at net asset value. Interests innon-registered investment companies that are redeemable at net asset value are fair valued normally at net asset value.
Investments which are not valued using any of the methods discussed above are valued at their fair value, as determined in good faith by the Board of Trustees of the Fund. The Board of Trustees has established a Valuation Committee comprised of the Trustees and has delegated to it the authority to take any actions regarding the valuation of portfolio securities that the Valuation Committee deems necessary or appropriate, including determining the fair value of portfolio securities, unless the determination has been delegated to the Wells Fargo Asset Management Pricing Committee at Wells Fargo Funds Management, LLC (“Funds Management”). The Board of Trustees retains the authority to make or ratify any valuation decisions or approve any changes to the Valuation Procedures as it deems appropriate. On a quarterly basis, the Board of Trustees receives reports on any valuation actions taken by the Valuation Committee or the Wells Fargo Asset Management Pricing Committee which may include items for ratification.
Securities lending
The Fund may lend its securities from time to time in order to earn additional income in the form of fees or interest on securities received as collateral or the investment of any cash received as collateral. When securities are on loan, the Fund receives interest or dividends on those securities. Cash collateral received in connection with its securities lending transactions is invested in Securities Lending Cash Investments, LLC (the “Securities Lending Fund”). Investments in Securities Lending Fund are valued at the evaluated bid price provided by an independent pricing service. Income earned from investment in the Securities Lending Fund (net of fees and rebates), if any, is included in income from affiliated securities on the Statement of Operations.
In a securities lending transaction, the net asset value of the Fund will be affected by an increase or decrease in the value of the securities loaned and by an increase or decrease in the value of the instrument in which collateral is invested. The amount of securities lending activity undertaken by the Fund fluctuates from time to time. The Fund has the right under the lending agreement to recover the securities from the borrower on demand. In the event of default or bankruptcy by the borrower, the Fund may be prevented from recovering the loaned securities or gaining access to the collateral or may experience delays or costs in doing so. In such an event, the terms of the agreement allows the unaffiliated securities lending agent to use the collateral to purchase replacement securities on behalf of the Fund or pay the Fund the market value of the loaned securities. The Fund will bear the risk of loss with respect to depreciation of its investment of the cash collateral.
30 | Wells Fargo Ultra Short-Term Income Fund
Notes to financial statements
When-issued transactions
The Fund may purchase securities on a forward commitment or when-issued basis. The Fund records a when-issued transaction on the trade date and will segregate assets in an amount at least equal in value to the Fund’s commitment to purchase when-issued securities. Securities purchased on a when-issued basis aremarked-to-market daily and the Fund begins earning interest on the settlement date. Losses may arise due to changes in the market value of the underlying securities or if the counterparty does not perform under the contract.
Futures contracts
Futures contracts are agreements between the Fund and a counterparty to buy or sell a specific amount of a commodity, financial instrument or currency at a specified price and on a specified date. The Fund may buy and sell futures contracts in order to gain exposure to, or protect against, changes in interest rates and is subject to interest rate risk. The primary risks associated with the use of futures contracts are the imperfect correlation between changes in market values of securities held by the Fund and the prices of futures contracts, and the possibility of an illiquid market. Futures contracts are generally entered into on a regulated futures exchange and cleared through a clearinghouse associated with the exchange. With futures contracts, there is minimal counterparty risk to the Fund since futures contracts are exchange traded and the exchange’s clearinghouse, as the counterparty to all exchange traded futures, guarantees the futures contracts against default.
Upon entering into a futures contracts, the Fund is required to deposit either cash or securities (initial margin) with the broker in an amount equal to a certain percentage of the contract value. Subsequent payments (variation margin) are paid to or from the broker each day equal to the daily changes in the contract value. Such payments are recorded as unrealized gains or losses and, if any, shown as variation margin receivable (payable) in the Statement of Assets and Liabilities. Should the Fund fail to make requested variation margin payments, the broker can gain access to the initial margin to satisfy the Fund’s payment obligations. When the contracts are closed, a realized gain or loss is recorded in the Statement of Operations.
Security transactions and income recognition
Securities transactions are recorded on a trade date basis. Realized gains or losses are recorded on the basis of identified cost.
Interest income is accrued daily and bond discounts are accreted and premiums are amortized daily. To the extent debt obligations are placed onnon-accrual status, any related interest income may be reduced by writing off interest receivables when the collection of all or a portion of interest has been determined to be doubtful based on consistently applied procedures and the fair value has decreased. If the issuer subsequently resumes interest payments or when the collectability of interest is reasonably assured, the debt obligation is removed fromnon-accrual status.
Income dividends and capital gain distributions from investment companies are recorded on theex-dividend date. Capital gain distributions from investment companies are treated as realized gains.
Distributions to shareholders
Distributions to shareholders from net investment income are declared daily and paid monthly. Distributions from net realized gains, if any, are recorded on theex-dividend date and paid at least annually. Such distributions are determined in accordance with income tax regulations and may differ from U.S. generally accepted accounting principles. Dividend sources are estimated at the time of declaration. The tax character of distributions is determined as of the Fund’s fiscal year end. Therefore, a portion of the Fund’s distributions made prior to the Fund’s fiscal year end may be categorized as a tax return of capital at year end.
Federal and other taxes
The Fund intends to continue to qualify as a regulated investment company by distributing substantially all of its investment company taxable income and any net realized capital gains (after reduction for capital loss carryforwards) sufficient to relieve it from all, or substantially all, federal income taxes. Accordingly, no provision for federal income taxes was required.
The Fund’s income and federal excise tax returns and all financial records supporting those returns for the prior three fiscal years are subject to examination by the federal and Delaware revenue authorities. Management has analyzed the Fund’s tax positions taken on federal, state, and foreign tax returns for all open tax years and does not believe that there are any uncertain tax positions that require recognition of a tax liability.
As of August 31, 2019, the aggregate cost of all investments for federal income tax purposes was $1,050,308,085 and the unrealized gains (losses) consisted of:
| | | | |
| |
Gross unrealized gains | | $ | 8,817,695 | |
| |
Gross unrealized losses | | | (719,803 | ) |
| |
Net unrealized gains | | $ | 8,097,892 | |
Wells Fargo Ultra Short-Term Income Fund | 31
Notes to financial statements
Reclassifications are made to the Fund’s capital accounts for permanent tax differences to reflect income and gains available for distribution (or available capital loss carryforwards) under federal income tax regulations. U.S. generally accepted accounting principles require that certain components of net assets be adjusted to reflect permanent differences between financial and tax reporting. These reclassifications have no effect on net assets or net asset values per share. The primary permanent difference causing such reclassifications is due expiration of capital loss carryforwards. At August 31, 2019, as a result of permanent book-to-tax differences, the following reclassification adjustments were made on the Statement of Assets and Liabilities:
| | |
| Paid-in capital | | Total distributableloss |
| |
| $(7,448,920) | | $7,448,920 |
As of August 31, 2019, the Fund had capital loss carryforwards which consist of $1,313,832 in short-term capital losses and $22,815,824 in long-term capital losses.
As of August 31, 2019, the Fund had current year deferred post-October capital losses consisting of $2,111,387 in short-term losses and $3,611,278 in long-term losses which will be recognized on the first day of the following fiscal year.
Class allocations
The separate classes of shares offered by the Fund differ principally in applicable sales charges, distribution, shareholder servicing, and administration fees. Class specific expenses are charged directly to that share class. Investment income, common fund-level expenses, and realized and unrealized gains (losses) on investments are allocated daily to each class of shares based on the relative proportion of net assets of each class.
3. FAIR VALUATION MEASUREMENTS
Fair value measurements of investments are determined within a framework that has established a fair value hierarchy based upon the various data inputs utilized in determining the value of the Fund’s investments. The three-level hierarchy gives the highest priority to unadjusted quoted prices in active markets for identical assets or liabilities (Level 1) and the lowest priority to unobservable inputs (Level 3). The Fund’s investments are classified within the fair value hierarchy based on the lowest level of input that is significant to the fair value measurement. The inputs are summarized into three broad levels as follows:
| ∎ | | Level 1 – quoted prices in active markets for identical securities |
| ∎ | | Level 2 – other significant observable inputs (including quoted prices for similar securities, interest rates, prepayment speeds, credit risk, etc.) |
| ∎ | | Level 3 – significant unobservable inputs (including the Fund’s own assumptions in determining the fair value of investments) |
The inputs or methodologies used for valuing investments in securities are not necessarily an indication of the risk associated with investing in those securities.
The following is a summary of the inputs used in valuing the Fund’s assets and liabilities as of August 31, 2019:
| | | | | | | | | | | | | | | | |
| | | | |
| | | Quoted prices
(Level 1) | | | Other significant
observable inputs
(Level 2) | | | Significant
unobservable inputs (Level 3) | | | Total | |
| | | | |
Assets | | | | | | | | | | | | | | | | |
Investments in: | | | | | | | | | | | | | | | | |
| | | | |
Agency securities | | $ | 0 | | | $ | 70,974,377 | | | $ | 0 | | | $ | 70,974,377 | |
| | | | |
Asset-backed securities | | | 0 | | | | 137,156,240 | | | | 0 | | | | 137,156,240 | |
| | | | |
Corporate bonds and notes | | | 0 | | | | 322,411,228 | | | | 0 | | | | 322,411,228 | |
| | | | |
Exchange-traded funds | | | 61,642,160 | | | | 0 | | | | 0 | | | | 61,642,160 | |
| | | | |
Municipal obligations | | | 0 | | | | 5,696,993 | | | | 0 | | | | 5,696,993 | |
| | | | |
Non-agency mortgage-backed securities | | | 0 | | | | 219,248,144 | | | | 0 | | | | 219,248,144 | |
| | | | |
Yankee corporate bonds and notes | | | 0 | | | | 177,194,615 | | | | 0 | | | | 177,194,615 | |
| | | | |
Short-term investments | | | | | | | | | | | | | | | | |
| | | | |
Investment companies | | | 62,084,487 | | | | 0 | | | | 0 | | | | 62,084,487 | |
| | | | |
U.S. Treasury securities | | | 1,949,092 | | | | 0 | | | | 0 | | | | 1,949,092 | |
| | | | |
| | | 125,675,739 | | | | 932,681,597 | | | | 0 | | | | 1,058,357,336 | |
| | | | |
Futures contracts | | | 48,641 | | | | 0 | | | | 0 | | | | 48,641 | |
| | | | |
Total assets | | $ | 125,724,380 | | | $ | 932,681,597 | | | $ | 0 | | | $ | 1,058,405,977 | |
32 | Wells Fargo Ultra Short-Term Income Fund
Notes to financial statements
Additional sector, industry or geographic detail is included in the Portfolio of Investments.
Futures contracts are reported at their cumulative unrealized gains (losses) at measurement date as reported in the table following the Portfolio of Investments. For futures contracts, the current day’s variation margin is reported on the Statement of Assets and Liabilities. All other assets and liabilities are reported at their market value at measurement date.
For the year ended August 31, 2019, the Fund did not have any transfers into/out of Level 3.
4. TRANSACTIONS WITH AFFILIATES
Management fee
Funds Management, an indirect wholly owned subsidiary of Wells Fargo & Company (“Wells Fargo”), is the manager of the Fund and provides advisory and fund-level administrative services under an investment management agreement. Under the investment management agreement, Funds Management is responsible for, among other services, implementing the investment objectives and strategies of the Fund, supervising the subadviser and providing fund-level administrative services in connection with the Fund’s operations. As compensation for its services under the investment management agreement, Funds Management is entitled to receive a management fee at the following annual rate based on the Fund’s average daily net assets:
| | |
| |
| Average daily net assets | | Management fee |
| |
First $1 billion | | 0.350% |
| |
Next $4 billion | | 0.325 |
| |
Next $3 billion | | 0.290 |
| |
Next $2 billion | | 0.265 |
| |
Over $10 billion | | 0.255 |
For the year ended August 31, 2019, the management fee was equivalent to an annual rate of 0.35% of the Fund’s average daily net assets.
Funds Management has retained the services of a subadviser to provide daily portfolio management to the Fund. The fee for subadvisory services is borne by Funds Management. Wells Capital Management Incorporated (“WellsCap”), an affiliate of Funds Management and an indirect wholly owned subsidiary of Wells Fargo, is the subadviser to the Fund and is entitled to receive a fee from Funds Management at an annual rate starting at 0.15% and declining to 0.05% as the average daily net assets of the Fund increase.
Administration fees
Under a class-level administration agreement, Funds Management provides class-level administrative services to the Fund, which includes paying fees and expenses for services provided by the transfer agent,sub-transfer agents, omnibus account servicers and record-keepers. As compensation for its services under the class-level administration agreement, Funds Management receives an annual fee which is calculated based on the average daily net assets of each class as follows:
| | |
| |
| | | Class-level
administration fee |
| |
Class A, Class C | | 0.16% |
| |
Administrator Class | | 0.10 |
| |
Institutional Class | | 0.08 |
Waivers and/or expense reimbursements
Funds Management has contractually waived and/or reimbursed management and administration fees to the extent necessary to maintain certain net operating expense ratios for the Fund. When each class of the Fund has exceeded its expense cap, Funds Management has waived fees and/or reimbursed expenses from fund-level expenses on a proportionate basis and then from class specific expenses. When only certain classes exceed their expense caps, waivers and/or reimbursements are applied against class specific expenses before fund-level expenses. Funds Management has committed through December 31, 2019 to waive fees and/or reimburse expenses to the extent necessary to cap the Fund’s expenses at 0.70% for Class A shares, 1.45% for Class C shares, 0.55% for Administrator Class shares, and 0.35% for Institutional Class shares. Prior to or after the commitment expiration date, the cap may be increased or the commitment to maintain the cap may be terminated only with the approval of the Board of Trustees.
Wells Fargo Ultra Short-Term Income Fund | 33
Notes to financial statements
Distribution fee
The Trust has adopted a distribution plan for Class C shares of the Fund pursuant to Rule12b-1 under the 1940 Act. A distribution fee is charged to Class C shares and paid to Wells Fargo Funds Distributor, LLC (“Funds Distributor”), the principal underwriter, at an annual rate of 0.75% of the average daily net assets of Class C shares.
In addition, Funds Distributor is entitled to receive thefront-end sales charge from the purchase of Class A shares and a contingent deferred sales charge on the redemption of certain Class A shares. Funds Distributor is also entitled to receive the contingent deferred sales charges from redemptions of Class C shares. For the year ended August 31, 2019, Funds Distributor received $818 from the sale of Class A shares. No contingent deferred sales charges were incurred by Class A and Class C shares for the year ended August 31, 2019.
Shareholder servicing fees
The Trust has entered into contracts with one or more shareholder servicing agents, whereby Class A, Class C, and Administrator Class of the Fund are charged a fee at an annual rate of 0.25% of the average daily net assets of each respective class. A portion of these total shareholder servicing fees were paid to affiliates of Wells Fargo.
Interfund transactions
The Fund may purchase or sell portfolio investment securities to certain other Wells Fargo affiliates pursuant to Rule17a-7 under the 1940 Act and under procedures adopted by the Board of Trustees. The procedures have been designed to ensure that these interfund transactions, which do not incur broker commissions, are effected at current market prices.
5. INVESTMENT PORTFOLIO TRANSACTIONS
Purchases and sales of investments, excluding short-term securities, for the year ended August 31, 2019 were as follows:
| | | | | | |
Purchases at cost | | Sales proceeds |
U.S.
government | | Non-U.S.
government | | U.S.
government | | Non-U.S.
government |
| $16,650,778 | | $596,873,611 | | $9,989,248 | | $338,750,943 |
6. SECURITIES LENDING TRANSACTIONS
The Fund lends its securities through an unaffiliated securities lending agent and receives collateral in the form of cash or securities with a value at least equal to the value of the securities on loan. The value of the loaned securities is determined at the close of each business day and any increases or decreases in the required collateral are exchanged between the Fund and the counterparty on the next business day. Cash collateral received is invested in the Securities Lending Fund which seeks to provide a positive return compared to the daily Fed Funds Open Rate by investing in high-quality, U.S. dollar-denominated short-term money market instruments and is exempt from registration under Section 3(c)(7) of the 1940 Act. Securities Lending Fund is managed by Funds Management and is subadvised by WellsCap. Funds Management receives an advisory fee starting at 0.05% and declining to 0.01% as the average daily net assets of the Securities Lending Fund increase. All of the fees received by Funds Management are paid to WellsCap for its services as subadviser.
In the event of counterparty default or the failure of a borrower to return a loaned security, the Fund has the right to use the collateral to offset any losses incurred. As of August 31, 2019, the Fund did not have any securities on loan.
7. DERIVATIVE TRANSACTIONS
During the year ended August 31, 2019, the Fund entered into futures contracts to help manage duration. The Fund had an average notional amount of $277,111,188 in short futures contracts during the year ended August 31, 2019.
The fair value, realized gains or losses and change in unrealized gains or losses, if any, on derivative instruments are reflected in the corresponding financial statement captions.
8. BANK BORROWINGS
The Trust (excluding the money market funds), Wells Fargo Master Trust and Wells Fargo Variable Trust are parties to a $280,000,000 revolving credit agreement whereby the Fund is permitted to use bank borrowings for temporary or emergency purposes, such as to fund shareholder redemption requests. Interest under the credit agreement is charged to the Fund based on a borrowing rate equal to the higher of the Federal Funds rate in effect on that day plus 1.25% or the overnight LIBOR rate in effect on that day plus 1.25%. In addition, an annual commitment fee equal to 0.25% of the unused balance is allocated to each participating fund.
For the year ended August 31, 2019, there were no borrowings by the Fund under the agreement.
34 | Wells Fargo Ultra Short-Term Income Fund
Notes to financial statements
9. DISTRIBUTIONS TO SHAREHOLDERS
The tax character of distributions paid was $23,782,326 and $20,642,227 of ordinary income for the years ended August 31, 2019 and August 31, 2018, respectively.
As of August 31, 2019, the components of distributable earnings on a tax basis were as follows:
| | | | | | |
Undistributed
ordinary
income | | Unrealized
gains | | Post-October capital
losses deferred | | Capital loss
carryforward |
| | | |
| $288,593 | | $8,097,892 | | $(5,722,665) | | $(24,129,656) |
Effective for all filings after November 4, 2018, the Securities and Exchange Commission eliminated the requirement to separately state the components of distributions to shareholders under U.S. generally accepted accounting principles. The amounts of distributions to shareholders for the year ended August 31, 2018 were as follows:
| | | | |
| |
| | | Net investment
income | |
| |
Class A | | | $3,917,235 | |
| |
Class C | | | 37,856 | |
| |
Administrator Class | | | 394,368 | |
| |
Institutional Class | | | 16,292,768 | |
10. INDEMNIFICATION
Under the Trust’s organizational documents, the officers and Trustees have been granted certain indemnification rights against certain liabilities that may arise out of performance of their duties to the Trust. Additionally, in the normal course of business, the Trust may enter into contracts with service providers that contain a variety of indemnification clauses. The Trust’s maximum exposure under these arrangements is dependent on future claims that may be made against the Fund and, therefore, cannot be estimated.
11. NEW ACCOUNTING PRONOUNCEMENTS
In August 2018, FASB issued Accounting Standards Update (“ASU”)No. 2018-13, Fair Value Measurement (Topic 820)Disclosure Framework—Changes to the Disclosure Requirements for Fair Value Measurement. ASU2018-13 updates the disclosure requirements for fair value measurements by modifying or removing certain disclosures and adding certain new disclosures. The amendments are effective for fiscal years, and interim periods within those fiscal years, beginning after December 15, 2019. Early adoption is permitted. Management has adopted the removal and modification of disclosures early, as permitted, and will adopt the additional new disclosures at the effective date.
In March 2017, FASB issued ASUNo. 2017-08,Premium Amortization on Purchased Callable Debt Securities. ASU2017-08 shortens the amortization period for certain callable debt securities held at a premium and requires the premium to be amortized to the earliest call date. The amendments do not require an accounting change for securities held at a discount and discounts will continue to be accreted to the maturity date of the security. ASU2017-08 is effective for fiscal years beginning after December 15, 2018 and for interim periods within those fiscal years. During the current reporting period, management of the Fund adopted the change in accounting policy which did not have a material impact to the Fund’s financial statements.
Wells Fargo Ultra Short-Term Income Fund | 35
Report of independent registered public accounting firm
TO THE SHAREHOLDERS OF THE FUND AND BOARD OF TRUSTEES OF WELLS FARGO FUNDS TRUST:
Opinion on the Financial Statements
We have audited the accompanying statement of assets and liabilities of Wells Fargo Ultra Short-Term Income Fund (the Fund), one of the funds constituting Wells Fargo Funds Trust, including the portfolio of investments, as of August 31, 2019, the related statement of operations for the year then ended, the statements of changes in net assets for each of the years in the two-year period then ended, and the related notes (collectively, the financial statements) and the financial highlights for each of the years in the five-year period then ended. In our opinion, the financial statements and financial highlights present fairly, in all material respects, the financial position of the Fund as of August 31, 2019, the results of its operations for the year then ended, the changes in its net assets for each of the years in the two-year period then ended, and the financial highlights for each of the years in the five-year period then ended, in conformity with U.S. generally accepted accounting principles.
Basis for Opinion
These financial statements and financial highlights are the responsibility of the Fund’s management. Our responsibility is to express an opinion on these financial statements and financial highlights based on our audits. We are a public accounting firm registered with the Public Company Accounting Oversight Board (United States) (PCAOB) and are required to be independent with respect to the Fund in accordance with the U.S. federal securities laws and the applicable rules and regulations of the Securities and Exchange Commission and the PCAOB.
We conducted our audits in accordance with the standards of the PCAOB. Those standards require that we plan and perform the audit to obtain reasonable assurance about whether the financial statements and financial highlights are free of material misstatement, whether due to error or fraud. Our audits included performing procedures to assess the risks of material misstatement of the financial statements and financial highlights, whether due to error or fraud, and performing procedures that respond to those risks. Such procedures included examining, on a test basis, evidence regarding the amounts and disclosures in the financial statements and financial highlights. Such procedures also included confirmation of securities owned as of August 31, 2019, by correspondence with the custodian, transfer agent and brokers, or by other appropriate auditing procedures. Our audits also included evaluating the accounting principles used and significant estimates made by management, as well as evaluating the overall presentation of the financial statements and financial highlights. We believe that our audits provide a reasonable basis for our opinion.

We have not been able to determine the specific year that we began serving as the auditor of one or more Wells Fargo Funds investment companies; however we are aware that we have served as the auditor of one or more Wells Fargo Funds investment companies since at least 1955.
Boston, Massachusetts
October 28, 2019
36 | Wells Fargo Ultra Short-Term Income Fund
Other information (unaudited)
TAX INFORMATION
For the fiscal year ended August 31, 2019, $17,153,023 has been designated as interest-related dividends for nonresident alien shareholders pursuant to Section 871 of the Internal Revenue Code.
PROXY VOTING INFORMATION
A description of the policies and procedures used to determine how to vote proxies relating to portfolio securities is available, upon request, by calling1-800-222-8222, visiting our website atwfam.com, or visiting the SEC website at sec.gov. Information regarding how the proxies related to portfolio securities were voted during the most recent12-month period ended June 30 is available on the website atwfam.comor by visiting the SEC website at sec.gov.
QUARTERLY PORTFOLIO HOLDINGS INFORMATION
The Fund files its complete schedule of portfolio holdings with the SEC for the first and third quarters of each fiscal year on FormN-Q or FormN-PORT, which is available by visiting the SEC website at sec.gov. Those forms may be reviewed and copied at the SEC’s Public Reference Room in Washington, DC. Information on the operation of the Public Reference Room may be obtained by calling1-800-SEC-0330.
Wells Fargo Ultra Short-Term Income Fund | 37
Other information (unaudited)
BOARD OF TRUSTEES AND OFFICERS
Each of the Trustees and Officers1 listed in the table below acts in identical capacities for each fund in the Wells Fargo family of funds, which consists of 152 mutual funds comprising the Wells Fargo Funds Trust, Wells Fargo Variable Trust, Wells Fargo Master Trust and fourclosed-end funds (collectively the “Fund Complex”). This table should be read in conjunction with the Prospectus and the Statement of Additional Information2. The mailing address of each Trustee and Officer is 525 Market Street, 12th Floor, San Francisco, CA 94105. Each Trustee and Officer serves an indefinite term, however, each Trustee serves such term until reaching the mandatory retirement age established by the Trustees.
Independent Trustees
| | | | | | |
Name and
year of birth | | Position held and
length of service* | | Principal occupations during past five years or longer | | Current other
public company or
investment
company
directorships |
| | | |
| William R. Ebsworth (Born 1957) | | Trustee,
since 2015 | | Retired. From 1984 to 2013, equities analyst, portfolio manager, research director and chief investment officer at Fidelity Management and Research Company in Boston, Tokyo, and Hong Kong, and retired in 2013 as Chief Investment Officer of Fidelity Strategic Advisers, Inc. where he led a team of investment professionals managing client assets. Prior thereto, Board member of Hong Kong Securities Clearing Co., Hong Kong Options Clearing Corp., the Thailand International Fund, Ltd., Fidelity Investments Life Insurance Company, and Empire Fidelity Investments Life Insurance Company. Audit Committee Chair and Investment Committee Chair of the Vincent Memorial Hospital Endowment(non-profit organization). Mr. Ebsworth is a CFA® charterholder. | | N/A |
| | | |
| Jane A. Freeman (Born 1953) | | Trustee,
since 2015;
Chair Liaison, since 2018 | | Retired. From 2012 to 2014 and 1999 to 2008, Chief Financial Officer of Scientific Learning Corporation. From 2008 to 2012, Ms. Freeman provided consulting services related to strategic business projects. Prior to 1999, Portfolio Manager at Rockefeller & Co. and Scudder, Stevens & Clark. Board member of the Harding Loevner Funds from 1996 to 2014, serving as both Lead Independent Director and chair of the Audit Committee. Board member of the Russell Exchange Traded Funds Trust from 2011 to 2012 and the chair of the Audit Committee. Ms. Freeman is a Board Member of The Ruth Bancroft Garden(non-profit organization). She is also an inactive Chartered Financial Analyst. | | N/A |
| | | |
Isaiah Harris, Jr.
(Born 1952) | | Trustee,
since 2009;
Audit Committee Chairman,
since 2019 | | Retired. Chairman of the Board of CIGNA Corporation since 2009, and Director since 2005. From 2003 to 2011, Director of Deluxe Corporation. Prior thereto, President and CEO of BellSouth Advertising and Publishing Corp. from 2005 to 2007, President and CEO of BellSouth Enterprises from 2004 to 2005 and President of BellSouth Consumer Services from 2000 to 2003. Emeritus member of the Iowa State University Foundation Board of Governors. Emeritus Member of the Advisory Board of Iowa State University School of Business. Advisory Board Member, Palm Harbor Academy (private school). Advisory Board Member, Child Evangelism Fellowship(non-profit). Mr. Harris is a certified public accountant (inactive status). | | CIGNA Corporation |
| | | |
| Judith M. Johnson (Born 1949) | | Trustee,
since 2008;
Audit Committee Chairman, from 2009 to 2018 | | Retired. Prior thereto, Chief Executive Officer and Chief Investment Officer of Minneapolis Employees Retirement Fund from 1996 to 2008. Ms. Johnson is an attorney, certified public accountant and a certified managerial accountant. | | N/A |
38 | Wells Fargo Ultra Short-Term Income Fund
Other information (unaudited)
| | | | | | |
Name and
year of birth | | Position held and
length of service* | | Principal occupations during past five years or longer | | Current other
public company or
investment
company
directorships |
| | | |
| David F. Larcker (Born 1950) | | Trustee,
since 2009 | | James Irvin Miller Professor of Accounting at the Graduate School of Business, Stanford University, Director of the Corporate Governance Research Initiative and Senior Faculty of The Rock Center for Corporate Governance since 2006. From 2005 to 2008, Professor of Accounting at the Graduate School of Business, Stanford University. Prior thereto, Ernst & Young Professor of Accounting at The Wharton School, University of Pennsylvania from 1985 to 2005. | | N/A |
| | | |
| Olivia S. Mitchell (Born 1953) | | Trustee,
since 2006; Nominating and Governance Committee Chairman,
since 2018 | | International Foundation of Employee Benefit Plans Professor, Wharton School of the University of Pennsylvania since 1993. Director of Wharton’s Pension Research Council and Boettner Center on Pensions & Retirement Research, and Research Associate at the National Bureau of Economic Research. Previously, Cornell University Professor from 1978 to 1993. | | N/A |
| | | |
| Timothy J. Penny (Born 1951) | | Trustee,
since 1996; Chairman,
since 2018 | | President and Chief Executive Officer of Southern Minnesota Initiative Foundation, anon-profit organization, since 2007. Member of the Board of Trustees of NorthStar Education Finance, Inc., anon-profit organization, since 2007. | | N/A |
| | | |
| James G. Polisson (Born 1959) | | Trustee,
since 2018 | | Retired. Chief Marketing Officer, Source (ETF) UK Services, Ltd, from 2015 to 2017. From 2012 to 2015, Principal of The Polisson Group, LLC, a management consulting, corporate advisory and principal investing company. Chief Executive Officer and Managing Director at Russell Investments, Global Exchange Traded Funds from 2010 to 2012. Managing Director of Barclays Global Investors from 1998 to 2010 and Global Chief Marketing Officer for iShares and Barclays Global Investors from 2000 to 2010. Trustee of the San Francisco Mechanics’ Institute, anon-profit organization, from 2013 to 2015. Board member of the Russell Exchange Traded Fund Trust from 2011 to 2012. Director of Barclays Global Investors Holdings Deutschland GmbH from 2006 to 2009. Mr. Polisson is an attorney and has a retired status with the Massachusetts and District of Columbia Bar Associations. | | N/A |
| * | Length of service dates reflect the Trustee’s commencement of service with the Trust’s predecessor entities, where applicable. |
Wells Fargo Ultra Short-Term Income Fund | 39
Other information (unaudited)
Officers
| | | | |
Name and
year of birth | | Position held and
length of service | | Principal occupations during past five years or longer |
| | |
Andrew Owen (Born 1960) | | President,
since 2017 | | Executive Vice President of Wells Fargo & Company and Head of Affiliated Managers, Wells Fargo Asset Management, since 2014. In addition, Mr. Owen is currently President, Chief Executive Officer and Director of Wells Fargo Funds Management, LLC since 2017. Prior thereto, Executive Vice President responsible for marketing, investments and product development for Wells Fargo Funds Management, LLC, from 2009 to 2014. |
| | |
Nancy Wiser1 (Born 1967) | | Treasurer,
since 2012 | | Executive Vice President of Wells Fargo Funds Management, LLC since 2011. Chief Operating Officer and Chief Compliance Officer at LightBox Capital Management LLC, from 2008 to 2011. |
| | |
Michelle Rhee3
(Born 1966) | | Chief Legal Officer, since 2019 | | Secretary of Wells Fargo Funds Management, LLC, Chief Legal Counsel of Wells Fargo Asset Management and Assistant General Counsel of Wells Fargo Bank, N.A. since 2018. Associate General Counsel and Managing Director of Bank of America Corporation from 2004 to 2018. |
| | |
Catherine Kennedy4
(Born 1969) | | Secretary, since 2019 | | Vice President of Wells Fargo Funds Management, LLC and Senior Counsel of the Wells Fargo Legal Department since 2010. Vice President and Senior Counsel of Evergreen Investment Management Company, LLC from 1998 to 2010. |
| | |
| Michael H. Whitaker(Born 1967) | | Chief Compliance Officer,
since 2016 | | Chief Compliance Officer of Wells Fargo Asset Management since 2016. Senior Vice President and Chief Compliance Officer for Fidelity Investments from 2007 to 2016. |
| | |
David Berardi (Born 1975) | | Assistant Treasurer,
since 2009 | | Vice President of Wells Fargo Funds Management, LLC since 2009. Vice President of Evergreen Investment Management Company, LLC from 2008 to 2010. Manager of Fund Reporting and Control for Evergreen Investment Management Company, LLC from 2004 to 2010. |
| | |
| Jeremy DePalma1 (Born 1974) | | Assistant Treasurer,
since 2009 | | Senior Vice President of Wells Fargo Funds Management, LLC since 2009. Senior Vice President of Evergreen Investment Management Company, LLC from 2008 to 2010 and head of the Fund Reporting and Control Team within Fund Administration from 2005 to 2010. |
| 1 | Nancy Wiser acts as Treasurer of 65 funds in the Fund Complex. Jeremy DePalma acts as Treasurer of 87 funds and Assistant Treasurer of 65 funds in the Fund Complex. |
| 2 | The Statement of Additional Information includes additional information about the Trustees and is available, without charge, upon request, by calling1-800-222-8222 or by visiting the website atwfam.com. |
| 3 | Michelle Rhee became Chief Legal Officer effective October 22, 2019. |
| 4 | Catherine Kennedy became Secretary effective October 22, 2019. |
40 | Wells Fargo Ultra Short-Term Income Fund
Other information (unaudited)
BOARD CONSIDERATION OF INVESTMENT MANAGEMENT ANDSUB-ADVISORY AGREEMENTS:
Wells Fargo Ultra Short-Term Income Fund
Under the Investment Company Act of 1940 (the “1940 Act”), the Board of Trustees (the “Board”) of Wells Fargo Funds Trust (the “Trust”) must determine annually whether to approve the continuation of the Trust’s investment management andsub-advisory agreements. In this regard, at anin-person meeting held on May21-22, 2019 (the “Meeting”), the Board, all the members of which have no direct or indirect interest in the investment management andsub-advisory agreements and are not “interested persons” of the Trust, as defined in the 1940 Act (the “Independent Trustees”), reviewed and approved for Wells Fargo Ultra Short-Term Income Fund(the “Fund”): (i) an investment management agreement (the “Management Agreement”) with Wells Fargo Funds Management, LLC (“Funds Management”); and (ii) an investmentsub-advisory agreement (the“Sub-Advisory Agreement”) with Wells Capital Management Incorporated (the“Sub-Adviser”), an affiliate of Funds Management. The Management Agreement and theSub-Advisory Agreement are collectively referred to as the “Advisory Agreements.”
At the Meeting, the Board considered the factors and reached the conclusions described below relating to the selection of Funds Management and theSub-Adviser and the approval of the Advisory Agreements. Prior to the Meeting, including at anin-person meeting in April 2019, the Trustees conferred extensively among themselves and with representatives of Funds Management about these matters. Also, the Board has adopted a team-based approach, with each team consisting of asub-set of Trustees, to assist the full Board in the discharge of its duties in reviewing investment performance and other matters throughout the year. The Independent Trustees were assisted in their evaluation of the Advisory Agreements by independent legal counsel, from whom they received separate legal advice and with whom they met separately.
In providing information to the Board, Funds Management and theSub-Adviser were guided by a detailed set of requests for information submitted to them by independent legal counsel on behalf of the Independent Trustees at the start of the Board’s annual contract renewal process earlier in 2019. In considering and approving the Advisory Agreements, the Trustees considered the information they believed relevant, including but not limited to the information discussed below. The Board considered not only the specific information presented in connection with the Meeting, but also the knowledge gained over time through interaction with Funds Management and theSub-Adviser about various topics. In this regard, the Board reviewed reports of Funds Management at each of its quarterly meetings, which included, among other things, portfolio reviews and investment performance reports. In addition, the Board and the teams mentioned above confer with portfolio managers at various times throughout the year. The Board did not identify any particular information or consideration that wasall-important or controlling, and each individual Trustee may have attributed different weights to various factors.
After its deliberations, the Board unanimously approved the continuation of the Advisory Agreements for aone-year term and determined that the compensation payable to Funds Management and theSub-Adviser under each of the Advisory Agreements was reasonable. The Board considered the approval of the Advisory Agreements for the Fund as part of its consideration of agreements for funds across the complex, but its approvals were made on afund-by-fund basis. The following summarizes a number of important, but not necessarily all, factors considered by the Board in support of its approvals.
Nature, extent and quality of services
The Board received and considered various information regarding the nature, extent and quality of services provided to the Fund by Funds Management and theSub-Adviser under the Advisory Agreements. This information included a description of the investment advisory services and Fund-level administrative services covered by the Management Agreement, as well as, among other things, a summary of the background and experience of senior management of Wells Fargo Asset Management (“WFAM”), of which Funds Management and theSub-Adviser are a part, a summary of investments made in the business of WFAM, a summary of certain organizational and personnel changes involving Funds Management and theSub-Adviser, and a description of Funds Management’s and theSub-Adviser’s business continuity planning programs and of their approaches to data privacy and cybersecurity. The Board received and reviewed information about Funds Management’s role as administrator of the Fund’s liquidity risk management program. The Board also considered the qualifications, background, tenure and responsibilities of each of the portfolio managers primarily responsible for theday-to-day portfolio management of the Fund.
The Board evaluated the ability of Funds Management and theSub-Adviser to attract and retain qualified investment professionals, including research, advisory and supervisory personnel. The Board further considered the compliance programs and compliance records of Funds Management and theSub-Adviser. In addition, the Board took into account the full range of services provided to the Fund by Funds Management and its affiliates.
Wells Fargo Ultra Short-Term Income Fund | 41
Other information (unaudited)
Fund investment performance and expenses
The Board considered the investment performance results for the Fund over various time periods ended December 31, 2018. The Board considered these results in comparison to the investment performance of funds in a universe that was determined by Broadridge Inc. (“Broadridge”) to be similar to the Fund (the “Universe”), and in comparison to the Fund’s benchmark index and to other comparative data. Broadridge is an independent provider of investment company data. The Board received a description of the methodology used by Broadridge to select the mutual funds in the performance Universe. The Board noted that the investment performance of the Fund (Administrator Class) was higher than the average investment performance of the Universe for all periods under review. The Board also noted that the investment performance of the Fund was lower than its benchmark index, the Bloomberg Barclays Short-Term U.S. Government/Corporate Bond Index, for theone-year period under review, but higher than its benchmark for the three-, five- andten-year periods under review.
The Board also received and considered information regarding the Fund’s net operating expense ratios and their various components, including actual management fees, custodian and othernon-management fees, and Rule12b-1 andnon-Rule12b-1 shareholder service fees. The Board considered these ratios in comparison to the median ratios of funds in class-specific expense groups that were determined by Broadridge to be similar to the Fund (the “Groups”). The Board received a description of the methodology used by Broadridge to select the mutual funds in the expense Groups and an explanation of how funds comprising expense groups and their expense ratios may vary fromyear-to-year. Based on the Broadridge reports, the Board noted that the net operating expense ratios of the Fund were in range of, equal to, or lower than, the median net operating expense ratios of the expense Groups for each share class.
The Board took into account the Fund’s investment performance and expense information provided to it among the factors considered in deciding tore-approve the Advisory Agreements.
Investment management andsub-advisory fee rates
The Board reviewed and considered the contractual fee rates payable by the Fund to Funds Management under the Management Agreement, as well as the contractual fee rates payable by the Fund to Funds Management for class-level administrative services under a Class-Level Administration Agreement, which include, among other things, class-level transfer agency andsub-transfer agency costs (collectively, the “Management Rates”). The Board also reviewed and considered the contractual investmentsub-advisory fee rates that are payable by Funds Management to theSub-Adviser for investmentsub-advisory services.
Among other information reviewed by the Board was a comparison of the Fund’s Management Rates with the average contractual investment management fee rates of funds in the expense Groups at a common asset level as well as transfer agency costs of the funds in the expense Groups. The Board noted that the Management Rates of the Fund were in range of the sum of these average rates for the Fund’s expense Groups for all share classes.
The Board also received and considered information about the portion of the total management fee that was retained by Funds Management after payment of the fee to theSub-Adviser forsub-advisory services. In assessing the reasonableness of this amount, the Board received and evaluated information about the nature and extent of responsibilities retained and risks assumed by Funds Management and not delegated to or assumed by theSub-Adviser, and about Funds Management’son-going oversight services. Given the affiliation between Funds Management and theSub-Adviser, the Board ascribed limited relevance to the allocation of fees between them.
The Board also received and considered information about the nature and extent of services offered and fee rates charged by Funds Management and theSub-Adviser to other types of clients with investment strategies similar to those of the Fund. In this regard, the Board received information about the significantly greater scope of services, and compliance, reporting and other legal burdens and risks of managing proprietary mutual funds compared with those associated with managing assets of other types of clients, including third-partysub-advised fund clients andnon-mutual fund clients such as institutional separate accounts.
Based on its consideration of the factors and information it deemed relevant, including those described here, the Board determined that the compensation payable to Funds Management under the Management Agreement and to theSub-Adviser under theSub-Advisory Agreement was reasonable.
Profitability
The Board received and considered information concerning the profitability of Funds Management, as well as the profitability of both WFAM and Wells Fargo & Co. (“Wells Fargo”) from providing services to the fund family as a whole. The Board noted that theSub-Adviser’s profitability information with respect to providing services to the Fund and other funds in the family was subsumed in the WFAM and Wells Fargo profitability analysis.
42 | Wells Fargo Ultra Short-Term Income Fund
Other information (unaudited)
Funds Management reported on the methodologies and estimates used in calculating profitability, including a description of the methodology used to allocate certain expenses. Among other things, the Board noted that the levels of profitability reported on afund-by-fund basis varied widely, depending on factors such as the size, type and age of fund. Based on its review, the Board did not deem the profits reported by Funds Management, WFAM or Wells Fargo from services provided to the Fund to be at a level that would prevent it from approving the continuation of the Advisory Agreements.
Economies of scale
The Board received and considered information about the potential for Funds Management to experience economies of scale in the provision of management services to the Fund, the difficulties of calculating economies of scale at an individual fund level, and the extent to which potential scale benefits are shared with shareholders. The Board noted the existence of breakpoints in the Fund’s management fee structure, which operate generally to reduce the Fund’s expense ratios as the Fund grows in size. The Board considered that in addition to management fee breakpoints, Funds Management shares potential economies of scale from its management business in a variety of ways, including through fee waiver and expense reimbursement arrangements, services that benefit shareholders, competitive management fee rates set at the outset without regard to breakpoints, and investments in the business intended to enhance services available to shareholders.
The Board concluded that Funds Management’s arrangements with respect to the Fund, including contractual breakpoints, constituted a reasonable approach to sharing potential economies of scale with the Fund and its shareholders.
Other benefits to Funds Management and theSub-Adviser
The Board received and considered information regarding potential“fall-out” or ancillary benefits received by Funds Management and its affiliates, including theSub-Adviser, as a result of their relationships with the Fund. Ancillary benefits could include, among others, benefits directly attributable to other relationships with the Fund and benefits potentially derived from an increase in Funds Management’s and theSub-Adviser’s business as a result of their relationships with the Fund. The Board noted that various affiliates of Funds Management may receive distribution-related fees, shareholder servicing payments andsub-transfer agency fees in respect of shares sold or held through them and services provided.
The Board also reviewed information about soft dollar credits earned and utilized by theSub-Adviser, fees earned by Funds Management and theSub-Adviser from managing a private investment vehicle for the fund family’s securities lending collateral, and commissions earned by an affiliated broker from portfolio transactions.
Based on its consideration of the factors and information it deemed relevant, including those described here, the Board did not find that any ancillary benefits received by Funds Management and its affiliates, including theSub-Adviser, were unreasonable.
Conclusion
At the Meeting, after considering the above-described factors and based on its deliberations and its evaluation of the information described above, the Board unanimously approved the continuation of the Advisory Agreements for aone-year term and determined that the compensation payable to Funds Management and theSub-Adviser under each of the Advisory Agreements was reasonable.
Wells Fargo Ultra Short-Term Income Fund | 43
This page is intentionally left blank.

For more information
More information about Wells Fargo Funds is available free upon request. To obtain literature, please write, visit the Fund’s website, or call:
Wells Fargo Funds
P.O. Box 219967
Kansas City, MO 64121-9967
Website:wfam.com
Individual investors:1-800-222-8222
Retail investment professionals:1-888-877-9275
Institutional investment professionals:1-866-765-0778

This report and the financial statements contained herein are submitted for the general information of the shareholders of the Fund. If this report is used for promotional purposes, distribution of the report must be accompanied or preceded by a current prospectus. Before investing, please consider the investment objectives, risks, charges, and expenses of the investment. For a current prospectus and, if available, a summary prospectus, containing this information, call1-800-222-8222 or visit the Fund’s website atwfam.com. Read the prospectus carefully before you invest or send money.
Wells Fargo Asset Management (WFAM) is the trade name for certain investment advisory/management firms owned by Wells Fargo & Company. These firms include but are not limited to Wells Capital Management Incorporated and Wells Fargo Funds Management, LLC. Certain products managed by WFAM entities are distributed by Wells Fargo Funds Distributor, LLC (a broker-dealer and Member FINRA).
This material is for general informational and educational purposes only and is NOT intended to provide investment advice or a recommendation of any kind—including a recommendation for any specific investment, strategy, or plan.
INVESTMENT PRODUCTS: NOT FDIC INSURED ◾ NO BANK GUARANTEE ◾ MAY LOSE VALUE
© 2019 Wells Fargo Funds Management, LLC. All rights reserved.
405809 10-19
A223/AR223 08-19
Annual Report
August 31, 2019
Wells Fargo
Adjustable Rate Government Fund
Beginning on January 1, 2021, as permitted by new regulations adopted by the Securities and Exchange Commission, paper copies of the Wells Fargo Funds’ annual and semi-annual shareholder reports issued after this date will no longer be sent by mail, unless you specifically request paper copies of the reports. Instead, the reports will be made available on the Funds’ website, and you will be notified by mail each time a report is posted and provided with a website address to access the report.
If you already elected to receive shareholder reports electronically, you will not be affected by this change and you need not take any action. You may elect to receive shareholder reports and other communications from the Fund electronically at any time by contacting your financial intermediary (such as a broker-dealer or bank) or, if you are a direct investor, by calling1-800-222-8222 or by enrolling at wellsfargo.com/advantagedelivery.
You may elect to receive all future reports in paper free of charge. If you invest through a financial intermediary, you can contact your financial intermediary to request that you continue to receive paper copies of your shareholder reports; if you invest directly with the Fund, you can call 1-800-222-8222. Your election to receive reports in paper will apply to all Wells Fargo Funds held in your account with your financial intermediary or, if you are a direct investor, to all Wells Fargo Funds that you hold.
|
|
|
Reduce clutter. Save trees. |
Sign up for electronic delivery of prospectuses and shareholder reports atwellsfargo.com/advantagedelivery |
The views expressed and any forward-looking statements are as of August 31, 2019, unless otherwise noted, and are those of the Fund managers and/or Wells Fargo Asset Management. Discussions of individual securities, or the markets generally, or any Wells Fargo Fund are not intended as individual recommendations. Future events or results may vary significantly from those expressed in any forward-looking statements. The views expressed are subject to change at any time in response to changing circumstances in the market. Wells Fargo Asset Management and the Fund disclaim any obligation to publicly update or revise any views expressed or forward-looking statements.
INVESTMENT PRODUCTS: NOT FDIC INSURED ◾ NO BANK GUARANTEE ◾ MAY LOSE VALUE
Wells Fargo Adjustable Rate Government Fund | 1
Letter to shareholders (unaudited)

Andrew Owen
President
Wells Fargo Funds
Dear Shareholder:
We are pleased to offer you this annual report for the Wells Fargo Adjustable Rate Government Fund for the 12-month period that ended August 31, 2019. After the first half of the period yielded either low-single-digit or negative investment returns, U.S. stock and global bond investors generally saw markets recover during the second half amid intensifying market volatility, global economic growth concerns, international trade staredowns, and simmering geopolitical tensions.
Overall, fixed-income investors enjoyed a distinct advantage over stock investors. For the period, U.S. stocks, based on the S&P 500 Index,1 gained 2.92% and international stocks, as measured by the MSCI ACWI ex USA Index (Net),2 fell 3.27%. The MSCI EM Index (Net)3 slipped 4.36%. Among fixed income investors, the Bloomberg Barclays U.S. Aggregate Bond Index4 added 10.17%, the Bloomberg Barclays Global Aggregate ex-USD Index5 added 5.71%, the Bloomberg Barclays Municipal Bond Index6 gained 8.72%, and the ICE BofAML U.S. High Yield Index7 added 6.58%.
Entering the fourth quarter of 2018, economic data was encouraging.
Entering the fourth quarter of 2018, there were reasons for investors to be optimistic. The U.S. Bureau of Economic Analysis reported U.S. gross domestic product (GDP) grew 4.2% on an annualized basis during the second quarter. Hiring improved. Unemployment declined. Consumer spending gained. Third-quarter corporate earnings reports were generally positive. U.S. trade negotiations with Mexico and Canada advanced. In September 2018, the U.S. Federal Reserve (Fed) raised the federal funds rate by 25 basis points (bps; 100 bps equal 1.00%) to a target range of between 2.00% and 2.25% in an indication of its confidence that U.S. economic growth was sustainable.
International markets presented numerous challenges. U.S.-China trade tensions increased. The U.S. imposed $200 billion in tariffs on Chinese goods. China reacted with $60 billion in tariffs on U.S. goods. Economic growth in China caused concern. In September 2018, international investors began to factor in a number of disconcerting economic and business data points: lower July manufacturing and industrial orders in Germany; declining purchasing managers’ index numbers for August from the United Kingdom, China, and India; and declining household spending for August in Japan. Taken together, the data fed growing concerns that global economic growth was slowing.
| 1 | The S&P 500 Index consists of 500 stocks chosen for market size, liquidity, and industry group representation. It is a market-value-weighted index with each stock’s weight in the index proportionate to its market value. You cannot invest directly in an index. |
| 2 | The Morgan Stanley Capital International (MSCI) All Country World Index (ACWI) ex USA Index (Net) is a free-float-adjusted market-capitalization weighted index that is designed to measure the equity market performance of developed and emerging markets, excluding the U.S. Source: MSCI. MSCI makes no express or implied warranties or representations and shall have no liability whatsoever with respect to any MSCI data contained herein. The MSCI data may not be further redistributed or used as a basis for other indices or any securities or financial products. This report is not approved, reviewed, or produced by MSCI. You cannot invest directly in an index. |
| 3 | The MSCI Emerging Markets (EM) Index (Net) is a free-float-adjusted market-capitalization-weighted index that is designed to measure the equity market performance of emerging markets. You cannot invest directly in an index. |
| 4 | The Bloomberg Barclays U.S. Aggregate Bond Index is a broad-based benchmark that measures the investment-grade, U.S. dollar-denominated, fixed-rate taxable bond market, including Treasuries, government-related and corporate securities, mortgage-backed securities (agency fixed-rate and hybrid adjustable-rate mortgage pass-throughs), asset-backed securities, and commercial mortgage-backed securities. You cannot invest directly in an index. |
| 5 | The Bloomberg Barclays Global Aggregate ex-USD Index is an unmanaged index that provides a broad-based measure of the global investment-grade fixed-income markets excluding the U.S. dollar-denominated debt market. You cannot invest directly in an index. |
| 6 | The Bloomberg Barclays Municipal Bond Index is an unmanaged index composed of long-term tax-exempt bonds with a minimum credit rating of Baa. You cannot invest directly in an index. |
| 7 | The ICE BofAML U.S. High Yield Index is a market-capitalization-weighted index of domestic and Yankee high-yield bonds. The index tracks the performance of high-yield securities traded in the U.S. bond market. You cannot invest directly in an index. Copyright 2019. ICE Data Indices, LLC. All rights reserved. |
2 | Wells Fargo Adjustable Rate Government Fund
Letter to shareholders (unaudited)
Investors had to digest unsettling events during the fourth quarter of 2018.
November’s U.S. midterm elections shifted control of the House of Representatives from Republicans to Democrats, presaging partisan clashes that followed and caused uncertainty among investors. A partial U.S. government shutdown driven by partisan policy disputes extended into January 2019. Third-quarter U.S. GDP was announced at an annualized 3.4% rate, lower than the second-quarter rate. Brexit efforts stalled. The value of the renminbi declined even as the People’s Bank of China cut reserve requirement ratios, accelerated infrastructure spending, and cut taxes in efforts to spur economic activity.
The combination of news in the U.S. and generally weak economic indicators outside of the U.S. caused investors to seek safe havens. December’s S&P 500 Index performance was the worst since 1931. Globally, fixed-income investments fared better than stocks during the last two months of the year. The Fed increased the federal funds rate by 25 bps in December 2018 to a target range of between 2.25% and 2.50% even as observers expressed concerns that higher rates could slow the economy.
The market climbs a wall of worry.
Investment returns appeared to reaffirm the adage that markets climb a wall of worry as 2019 opened. Following its December decline, the S&P 500 Index gained 8.01% for the month of January, the best monthly performance in 30 years. Returns for the MSCI ACWI ex USA Index (Net), the Bloomberg Barclays U.S. Aggregate Bond Index, and the Bloomberg Barclays Global Aggregate ex-USD Index also were positive.
In February 2019, signs of slowing global growth grew more ominous. The Bureau of Economic Analysis announced fourth-quarter 2018 GDP grew at an annualized 2.2% rate, down from the levels of the prior two quarters. In a February report, the Bank of England forecast the slowest growth for 2019 since the financial crisis. China and the U.S. continued to wrangle over trade issues. By the end of the first quarter of 2019, more accommodative Fed sentiment and steady, if not spectacular, U.S. economic and business metrics encouraged domestic investors.
Early second-quarter 2019 enthusiasm among investors faded.
During April 2019, favorable sentiment found additional support in reports of sustained low inflation, solid employment data, and first-quarter U.S. GDP of an annualized rate of 3.2%. During May, markets tumbled on mixed investment signals. In the U.S., partisan wrangling ramped up as Democrats and Republicans set their sights on 2020 presidential politics. The U.K.’s Brexit contretemps caused Prime Minister Theresa May to resign. Boris Johnson succeeded her only to exacerbate uncertainty about Brexit’s resolution ahead of an October 2019 deadline. The European Commission downgraded the 2019 growth forecast to 1.2%. The U.S. increased tariffs on products from China, China responded, and then talks broke down. President Donald Trump threatened to turn his foreign policy tariff tool to Mexico over immigration issues.
During the third quarter of 2019, investors regrouped. Just as the investment horizon appeared to darken, sentiment turned and U.S. equity markets gained during June and July. The gains, primarily driven by geopolitical and monetary policy events, pushed equity markets to new highs. European Central Bank President Mario Draghi said that if the outlook doesn’t improve, the bank would cut rates or buy more assets to prop up inflation. President Trump backed off of tariff threats against Mexico and China. In the U.S., the Fed implemented a 0.25% federal funds rate cut in July.
Later in July, the U.S. reversed course and threatened to impose higher tariffs on China’s exports after talks failed. China responded with tariff threats of its own and
“December’s S&P 500 Index performance was the worst since 1931.”
“Following its December decline, the S&P 500 Index gained 8.01% for the month of January, the best monthly performance in 30 years.”
Wells Fargo Adjustable Rate Government Fund | 3
Letter to shareholders (unaudited)
|
|
|
For further information about your Fund, contact your investment professional, visit our website at wfam.com, or call us directly at1-800-222-8222. |
devalued the renminbi, a move that roiled global markets. Major U.S. stock market indices closed July 2019 with the worst weekly results of the year. Bond prices gained as Treasury yields fell to levels not seen since November 2016 and the yield curve inverted at multiple points along the 30-year arc.
In a microcosm, August 2019 encapsulated many of the unnerving events that plagued investors during the prior 11 months. The U.S.-China trade relationship swung from discouraging to hopeful and back again with no evident compromise on the horizon. Evidence of a continued global economic slowdown continued to mount as central banks in China, New Zealand, and Thailand cut interest rates. Industrial and manufacturing data declined in China, Canada, Japan, and Germany. Adding to the uncertain environment, Italy’s prime minister resigned, many feared a crackdown in Hong Kong as protesters sustained their calls for reform throughout the month, and Boris Johnson planned to suspend Parliament as Brexit’s deadline neared.
Don’t let short-term uncertainty derail long-term investment goals.
Periods of investment uncertainty can present challenges, but experience has taught us that maintaining long-term investment goals can be an effective way to plan for the future. To help you create a sound strategy based on your personal goals and risk tolerance, Wells Fargo Funds offers more than 100 mutual funds spanning a wide range of asset classes and investment styles. Although diversification cannot guarantee an investment profit or prevent losses, we believe it can be an effective way to manage investment risk and potentially smooth out overall portfolio performance. We encourage investors to know their investments and to understand that appropriate levels of risk-taking may unlock opportunities.
Thank you for choosing to invest with Wells Fargo Funds. We appreciate your confidence in us and remain committed to helping you meet your financial needs.
Sincerely,

Andrew Owen
President
Wells Fargo Funds
4 | Wells Fargo Adjustable Rate Government Fund
This page is intentionally left blank.
Performance highlights (unaudited)
Investment objective
The Fund seeks current income consistent with capital preservation.
Manager
Wells Fargo Funds Management, LLC
Subadviser
Wells Capital Management Incorporated
Portfolio managers
Christopher Y. Kauffman, CFA®‡
Michal Stanczyk
Average annual total returns (%) as of August 31, 2019
| | | | | | | | | | | | | | | | | | | | | | | | | | | | | | | | | | |
| | | | |
| | | | | Including sales charge | | | Excluding sales charge | | | Expense ratios1 (%) | |
| | | | | | | | | |
| | | Inception date | | 1 year | | | 5 year | | | 10 year | | | 1 year | | | 5 year | | | 10 year | | | Gross | | | Net2 | |
| | | | | | | | | | |
| Class A (ESAAX)3 | | 6-30-2000 | | | 0.61 | | | | 0.36 | | | | 1.04 | | | | 2.64 | | | | 0.77 | | | | 1.24 | | | | 0.83 | | | | 0.74 | |
| | | | | | | | | | |
| Class C (ESACX)3 | | 6-30-2000 | | | 0.76 | | | | 0.00 | | | | 0.47 | | | | 1.76 | | | | 0.00 | | | | 0.47 | | | | 1.58 | | | | 1.49 | |
| | | | | | | | | | |
| Administrator Class (ESADX)3,4 | | 7-30-2010 | | | – | | | | – | | | | – | | | | 2.78 | | | | 0.91 | | | | 1.38 | | | | 0.77 | | | | 0.60 | |
| | | | | | | | | | |
| Institutional Class (EKIZX)3 | | 10-1-1991 | | | – | | | | – | | | | – | | | | 2.93 | | | | 1.06 | | | | 1.51 | | | | 0.50 | | | | 0.46 | |
| | | | | | | | | | |
| Bloomberg Barclays 6-Month Treasury Bill Index5 | | – | | | – | | | | – | | | | – | | | | 2.63 | | | | 1.14 | | | | 0.69 | | | | – | | | | – | |
Figures quoted represent past performance, which is no guarantee of future results, and do not reflect taxes that a shareholder may pay on fund distributions or the redemption of fund shares. Investment return and principal value of an investment will fluctuate so that an investor’s shares, when redeemed, may be worth more or less than their original cost. Performance shown without sales charges would be lower if sales charges were reflected. Current performance may be lower or higher than the performance data quoted, which assumes the reinvestment of dividends and capital gains. Current month-end performance is available on the Fund’s website, wfam.com.
Index returns do not include transaction costs associated with buying and selling securities, any mutual fund fees or expenses, or any taxes. It is not possible to invest directly in an index.
For Class A shares, the maximum front-end sales charge is 2.00%. For Class C shares, the maximum contingent deferred sales charge is 1.00%. Performance including a contingent deferred sales charge assumes the sales charge for the corresponding time period. Administrator Class and Institutional Class shares are sold without a front-end sales charge or contingent deferred sales charge.
Bond values fluctuate in response to the financial condition of individual issuers, general market and economic conditions, and changes in interest rates. Changes in market conditions and government policies may lead to periods of heightened volatility in the bond market and reduced liquidity for certain bonds held by the Fund. In general, when interest rates rise, bond values fall and investors may lose principal value. Interest rate changes and their impact on the Fund and its share price can be sudden and unpredictable. The use of derivatives may reduce returns and/or increase volatility. Securities issued by U.S. government agencies or government-sponsored entities may not be guaranteed by the U.S. Treasury. Certain investment strategies tend to increase the total risk of an investment (relative to the broader market). The Fund is exposed to mortgage- and asset-backed securities risk. The U.S. government guarantee applies to certain underlying securities and not to shares of the Fund. Consult the Fund’s prospectus for additional information on these and other risks.
Please see footnotes on page 7.
6 | Wells Fargo Adjustable Rate Government Fund
Performance highlights (unaudited)
|
|
| Growth of $10,000 investment as of August 31, 20196 |
|
|
| ‡ | CFA® and Chartered Financial Analyst® are trademarks owned by CFA Institute. |
| 1 | Reflects the expense ratios as stated in the most recent prospectuses. The expense ratios shown are subject to change and may differ from the annualized expense ratios shown in the financial highlights of this report. |
| 2 | The manager has contractually committed through December 31, 2019, to waive fees and/or reimburse expenses to the extent necessary to cap the expenses of each class after fee waivers at the amounts shown. Brokerage commissions, stamp duty fees, interest, taxes, acquired fund fees and expenses (if any), and extraordinary expenses are excluded from the expense cap. Prior to or after the commitment expiration date, the cap may be increased or the commitment to maintain the cap may be terminated only with the approval of the Board of Trustees. Without this cap, the Fund’s returns would have been lower. The expense ratio paid by an investor is the net expense ratio (the total annual fund operating expenses after fee waivers) as stated in the prospectuses. |
| 3 | Historical performance shown prior to July 12, 2010, is based on the performance of the Fund’s predecessor, Evergreen Adjustable Rate Fund. |
| 4 | Historical performance shown for Administrator Class shares prior to their inception reflects the performance of Institutional Class shares, adjusted to reflect the higher expenses applicable to Administrator Class shares. |
| 5 | The Bloomberg Barclays 6-Month Treasury Bill Index tracks the performance and attributes of recently issued 6-Month U.S. Treasury bills. The index follows Bloomberg Barclays’ monthly rebalancing conventions. You cannot invest directly in an index. |
| 6 | The chart compares the performance of Class A shares for the most recent ten years with the performance of the Bloomberg Barclays6-Month Treasury Bill Index. The chart assumes a hypothetical investment of $10,000 in Class A shares and reflects all operating expenses and assumes the maximum initial sales charge of 2.00%. |
| 7 | The ten largest holdings, excluding cash, cash equivalents and any money market funds, are calculated based on the value of the investments divided by total net assets of the Fund. Holdings are subject to change and may have changed since the date specified. |
| 8 | The Personal Consumption Expenditures Index is the primary measure of consumer spending on goods and services in the U.S. economy. It accounts for about two-thirds of domestic final spending and is part of the personal income report issued by the Bureau of Economic Analysis of the Department of Commerce. You cannot invest directly in an index. |
| 9 | Amounts are calculated based on the total long-term investments of the Fund. These amounts are subject to change and may have changed since the date specified. |
Wells Fargo Adjustable Rate Government Fund | 7
Performance highlights (unaudited)
MANAGER’S DISCUSSION
Fund highlights
| ∎ | | The Fund (Class A shares, excluding sales charges) outperformed its benchmark, the Bloomberg Barclays 6-Month Treasury Bill Index, for the 12-month period that ended August 31, 2019. |
| ∎ | | Declining prepayment speeds over the period benefited income generated by the Fund and reduced capital losses. Income also benefited from the lagging nature of the coupon resets, which generally reflect short rates from about six months prior. Fund performance also benefited from tightening spreads on both adjustable-rate mortgages (ARMs) and floating-rate collateralized mortgage obligations (CMOs). |
| ∎ | | During the period, the Fund continued to reduce its allocation to higher dollar price ARMs in favor of floating-rate CMOs to mitigate the negative impact of prepayments. The Fund also modestly increased its exposure to short-term, fixed-rate pools and CMOs. |
| ∎ | | The Fund’s duration during the period increased slightly from 0.7 to 0.9 years. |
| ∎ | | The Fund’s allocation to certain CMOs backed by Federal Housing Administration-insured reverse mortgages detracted from performance, as spreads in the sector widened modestly. |
| | | | |
| |
| Ten largest holdings (%) as of August 31, 20197 | | | |
| | |
FNMA, Series 2002-66 Class A3, 4.45%, 4-25-2042 | | | 2.38 | |
| | |
FNMA, Series 2004-W15 Class 3A, 4.56%,6-25-2044 | | | 1.76 | |
| | |
GNMA, Series 2017-H11 Class FE, 2.91%, 5-20-2067 | | | 1.63 | |
| | |
FNMA, Series 2006-W01 Class 3A, 4.40%,10-25-2045 | | | 1.39 | |
| | |
FHLMC, Series T-67 Class 1A1C, 3.90%, 3-25-2036 | | | 1.34 | |
| | |
FNMA, Series 2001-T12 Class A4, 4.66%, 8-25-2041 | | | 1.21 | |
| | |
FHLMC, Series T-67 Class 2A1C, 3.74%, 3-25-2036 | | | 1.17 | |
| | |
FNMA, Series 2004-W12 Class 2A, 4.45%,6-25-2044 | | | 1.14 | |
| | |
FNMA, Series 2003-W18 Class 2A, 4.43%,6-25-2043 | | | 1.11 | |
| | |
FNMA, Series 2002-T18 Class A5, 4.63%,5-25-2042 | | | 1.04 | |
An economic slowdown
The pace of gross domestic product growth decelerated over the past 12 months as business investment, inventory effects, and trade restrained overall economic activity. For the four quarters that ended June 30, 2019, the U.S. economy expanded by 2.3% in inflation-adjusted terms, compared with a 3.2% trailing 12-month growth rate at the midway point last year. Rising anxiety over the contentious U.S.-China trade relationship appeared to discourage capital investment over the past 12 months. Housing investment also was a modest drag despite low mortgage rates. Consumer spending held up fairly well, however, with the Personal Consumption Expenditures Index8 rising at a 2.7% year-over-year rate though the end of July.
Consumption was supported by a relatively firm labor market. While job growth slowed modestly over the period, wages grew by 3.2% in real terms and the unemployment rate remained below 4%. Measures of labor force participation also generally showed improvement.
In response to slower growth and lower-than-targeted inflation, the Federal Open Market Committee (FOMC) voted to reduce its policy rate target for overnight funds by 0.25% at its July 31 meeting. This was the first interest rate reduction engineered by the FOMC in the decade since the financial crisis. While the monetary authorities suggested that their decision should be seen as a “midcourse correction” rather than the beginning of an extended easing cycle, markets have priced multiple additional rate cuts into the term structure. Indeed, interest rates fell across the board over the past 12 months, with the intermediate-term Treasury yields dropping by about 1.35%.
|
|
| Portfolio allocation as of August 31, 20199 |
|
 |
The Fund was predominantly invested in adjustable-rate residential mortgage securities.
The Fund remains defensively positioned with a significant out-of-benchmark allocation to ARMs and floating-rate CMOs that have frequent rate resets and are predominately indexed to the 1-Year Treasury Constant Maturity Rate and the 12-month London Interbank Offered Rate. Performance during the period beat the benchmark due to slowing ARM prepayments and tighter spreads in both the ARM and floating-rate CMO sectors.
The Fund’s duration modestly increased from 0.7 to 0.9 years during the reporting period. We continued to see value in seasoned ARMs that have already had their rates reset with favorable prepayment characteristics. We also increased the Fund’s positioning in floating-rate CMOs.
Please see footnotes on page 7.
8 | Wells Fargo Adjustable Rate Government Fund
Performance highlights (unaudited)
The trade war is a persistent cloud.
We expect the U.S.-China trade dispute to drag on for some months to come, depressing business investment. Slower growth, in turn, is likely to incline the monetary authorities to ease policy further, with at least one and probably more rate cuts to be implemented over the next 6 to 12 months. A quick resolution to the dispute—as unlikely as that seems at this time—could potentially boost business confidence and perhaps reduce the pressure for accommodative monetary policy. In this environment, we anticipate taking a cautious approach to both duration and sector allocation decisions, with a bias toward up-in-quality trades. As always, relative-value considerations will dominate our security selection process.
Wells Fargo Adjustable Rate Government Fund | 9
Fund expenses (unaudited)
As a shareholder of the Fund, you incur two types of costs: (1) transaction costs, including sales charges (loads) on purchase payments and contingent deferred sales charges (if any) on redemptions and (2) ongoing costs, including management fees, distribution (12b-1) and/or shareholder servicing fees, and other Fund expenses. This example is intended to help you understand your ongoing costs (in dollars) of investing in the Fund and to compare these costs with the ongoing costs of investing in other mutual funds.
The example is based on an investment of $1,000 invested at the beginning of the six-month period and held for the entire period from March 1, 2019 to August 31, 2019.
Actual expenses
The “Actual” line of the table below provides information about actual account values and actual expenses. You may use the information in this line, together with the amount you invested, to estimate the expenses that you paid over the period. Simply divide your account value by $1,000 (for example, an $8,600 account value divided by $1,000 = 8.6), then multiply the result by the number in the “Actual” line under the heading entitled “Expenses paid during period” for your applicable class of shares to estimate the expenses you paid on your account during this period.
Hypothetical example for comparison purposes
The “Hypothetical” line of the table below provides information about hypothetical account values and hypothetical expenses based on the Fund’s actual expense ratio and an assumed rate of return of 5% per year before expenses, which is not the Fund’s actual return. The hypothetical account values and expenses may not be used to estimate the actual ending account balance or expenses you paid for the period. You may use this information to compare the ongoing costs of investing in the Fund and other funds. To do so, compare this 5% hypothetical example with the 5% hypothetical examples that appear in the shareholder reports of the other funds.
Please note that the expenses shown in the table are meant to highlight your ongoing costs only and do not reflect any transactional costs, such as sales charges (loads) and contingent deferred sales charges. Therefore, the “Hypothetical” line of the table is useful in comparing ongoing costs only and will not help you determine the relative total costs of owning different funds. In addition, if these transactional costs were included, your costs would have been higher.
| | | | | | | | | | | | | | | | |
| | | Beginning
account value
3-1-2019 | | | Ending
account value
8-31-2019 | | | Expenses
paid during
the period¹ | | | Annualized net
expense ratio | |
| | | | | |
Class A | | | | | | | | | | | | | | | | |
| | | | |
Actual | | $ | 1,000.00 | | | $ | 1,016.41 | | | $ | 3.76 | | | | 0.74 | % |
| | | | |
Hypothetical (5% return before expenses) | | $ | 1,000.00 | | | $ | 1,021.48 | | | $ | 3.77 | | | | 0.74 | % |
| | | | | |
Class C | | | | | | | | | | | | | | | | |
| | | | |
Actual | | $ | 1,000.00 | | | $ | 1,012.58 | | | $ | 7.56 | | | | 1.49 | % |
| | | | |
Hypothetical (5% return before expenses) | | $ | 1,000.00 | | | $ | 1,017.69 | | | $ | 7.58 | | | | 1.49 | % |
| | | | | |
Administrator Class | | | | | | | | | | | | | | | | |
| | | | |
Actual | | $ | 1,000.00 | | | $ | 1,017.13 | | | $ | 3.05 | | | | 0.60 | % |
| | | | |
Hypothetical (5% return before expenses) | | $ | 1,000.00 | | | $ | 1,022.18 | | | $ | 3.06 | | | | 0.60 | % |
| | | | | |
Institutional Class | | | | | | | | | | | | | | | | |
| | | | |
Actual | | $ | 1,000.00 | | | $ | 1,017.84 | | | $ | 2.34 | | | | 0.46 | % |
| | | | |
Hypothetical (5% return before expenses) | | $ | 1,000.00 | | | $ | 1,022.89 | | | $ | 2.34 | | | | 0.46 | % |
| 1 | Expenses paid is equal to the annualized net expense ratio of each class multiplied by the average account value over the period, multiplied by the number of days in the most recent fiscal half-year divided by the number of days in the fiscal year (to reflect the one-half-year period). |
10 | Wells Fargo Adjustable Rate Government Fund
Portfolio of investments—August 31, 2019
| | | | | | | | | | | | | | | | |
| | | Interest
rate | | | Maturity
date | | | Principal | | | Value | |
| Agency Securities: 95.47% | |
| | | | |
FDIC Series2010-S2 Class 3A (1 Month LIBOR +0.70%) 144A± | | | 2.93 | % | | | 12-29-2045 | | | $ | 247,707 | | | $ | 248,019 | |
| | | | |
FHLMC (10 Year Treasury Constant Maturity-0.85%)± | | | 1.22 | | | | 3-15-2024 | | | | 257,294 | | | | 255,783 | |
| | | | |
FHLMC (11th District Cost of Funds +0.90%)± | | | 1.96 | | | | 1-1-2022 | | | | 365 | | | | 363 | |
| | | | |
FHLMC (11th District Cost of Funds +1.25%)± | | | 2.21 | | | | 1-1-2030 | | | | 2,286 | | | | 2,260 | |
| | | | |
FHLMC (11th District Cost of Funds +1.25%)± | | | 2.21 | | | | 1-1-2030 | | | | 1,203 | | | | 1,189 | |
| | | | |
FHLMC (11th District Cost of Funds +1.25%)± | | | 2.21 | | | | 7-1-2030 | | | | 129,856 | | | | 128,163 | |
| | | | |
FHLMC (11th District Cost of Funds +1.37%)± | | | 2.32 | | | | 10-1-2030 | | | | 2,581 | | | | 2,570 | |
| | | | |
FHLMC (11th District Cost of Funds +1.25%)± | | | 2.35 | | | | 2-1-2035 | | | | 129,079 | | | | 127,252 | |
| | | | |
FHLMC (11th District Cost of Funds +1.74%)± | | | 2.81 | | | | 3-1-2025 | | | | 7,276 | | | | 7,251 | |
| | | | |
FHLMC (11th District Cost of Funds +1.25%)± | | | 3.00 | | | | 11-1-2030 | | | | 59,024 | | | | 59,505 | |
| | | | |
FHLMC (1 Year Treasury Constant Maturity +0.71%)± | | | 3.17 | | | | 4-1-2030 | | | | 37,657 | | | | 38,239 | |
| | | | |
FHLMC (11th District Cost of Funds +2.23%)± | | | 3.35 | | | | 6-1-2029 | | | | 43,201 | | | | 43,470 | |
| | | | |
FHLMC (11th District Cost of Funds +2.39%)± | | | 3.47 | | | | 6-1-2021 | | | | 20,647 | | | | 20,676 | |
| | | | |
FHLMC (5 Year Treasury Constant Maturity +2.44%)± | | | 3.82 | | | | 8-1-2027 | | | | 31,438 | | | | 31,554 | |
| | | | |
FHLMC (3 Year Treasury Constant Maturity +2.44%)± | | | 3.89 | | | | 5-1-2032 | | | | 191,910 | | | | 192,613 | |
| | | | |
FHLMC (3 Year Treasury Constant Maturity +2.27%)± | | | 3.97 | | | | 4-1-2032 | | | | 80,510 | | | | 82,297 | |
| | | | |
FHLMC (6 Month LIBOR +1.42%)± | | | 3.99 | | | | 2-1-2037 | | | | 4,483 | | | | 4,622 | |
| | | | |
FHLMC (3 Year Treasury Constant Maturity +2.44%)± | | | 4.03 | | | | 5-1-2031 | | | | 97,545 | | | | 103,417 | |
| | | | |
FHLMC (12 Month Treasury Average +1.90%)± | | | 4.13 | | | | 5-1-2028 | | | | 185,720 | | | | 192,397 | |
| | | | |
FHLMC (1 Year Treasury Constant Maturity +0.00%)± | | | 4.28 | | | | 7-1-2030 | | | | 1,636 | | | | 1,636 | |
| | | | |
FHLMC (1 Year Treasury Constant Maturity +1.88%)± | | | 4.29 | | | | 5-1-2035 | | | | 286,078 | | | | 300,275 | |
| | | | |
FHLMC (6 Month LIBOR +1.73%)± | | | 4.36 | | | | 6-1-2024 | | | | 5,641 | | | | 5,659 | |
| | | | |
FHLMC (6 Month LIBOR +1.68%)± | | | 4.37 | | | | 1-1-2037 | | | | 848,593 | | | | 881,192 | |
| | | | |
FHLMC (11th District Cost of Funds +2.29%)± | | | 4.38 | | | | 12-1-2025 | | | | 7,711 | | | | 7,739 | |
| | | | |
FHLMC (1 Year Treasury Constant Maturity +2.03%)± | | | 4.39 | | | | 3-1-2025 | | | | 32,853 | | | | 33,941 | |
| | | | |
FHLMC (6 Month LIBOR +1.70%)± | | | 4.42 | | | | 6-1-2037 | | | | 332,500 | | | | 342,166 | |
| | | | |
FHLMC (US Treasury H15 Treasury Bill 6 Month Auction High Discount +1.75%) ± | | | 4.44 | | | | 1-1-2023 | | | | 16,766 | | | | 17,397 | |
| | | | |
FHLMC (5 Year Treasury Constant Maturity +2.13%)± | | | 4.44 | | | | 8-1-2029 | | | | 8,375 | | | | 8,379 | |
| | | | |
FHLMC (3 Year Treasury Constant Maturity +2.71%)± | | | 4.44 | | | | 6-1-2035 | | | | 702,505 | | | | 745,567 | |
| | | | |
FHLMC (1 Year Treasury Constant Maturity +1.99%)± | | | 4.49 | | | | 11-1-2034 | | | | 281,052 | | | | 295,792 | |
| | | | |
FHLMC (1 Year Treasury Constant Maturity +2.03%)± | | | 4.49 | | | | 12-1-2035 | | | | 409,215 | | | | 430,074 | |
| | | | |
FHLMC (1 Year Treasury Constant Maturity +2.04%)± | | | 4.52 | | | | 1-1-2030 | | | | 13,677 | | | | 14,141 | |
| | | | |
FHLMC (12 Month LIBOR +1.77%)± | | | 4.54 | | | | 6-1-2035 | | | | 686,563 | | | | 724,958 | |
| | | | |
FHLMC (12 Month LIBOR +1.66%)± | | | 4.54 | | | | 2-1-2037 | | | | 81,040 | | | | 85,103 | |
| | | | |
FHLMC (1 Year Treasury Constant Maturity +2.25%)± | | | 4.56 | | | | 9-1-2033 | | | | 131,309 | | | | 138,122 | |
| | | | |
FHLMC (US Treasury H15 Treasury Bill 6 Month Auction High Discount +1.94%) ± | | | 4.56 | | | | 7-1-2024 | | | | 25,265 | | | | 25,173 | |
| | | | |
FHLMC (12 Month LIBOR +1.78%)± | | | 4.57 | | | | 11-1-2035 | | | | 283,401 | | | | 295,333 | |
| | | | |
FHLMC (1 Year Treasury Constant Maturity +2.06%)± | | | 4.57 | | | | 8-1-2033 | | | | 1,120,396 | | | | 1,164,841 | |
| | | | |
FHLMC (12 Month LIBOR +1.77%)± | | | 4.58 | | | | 10-1-2035 | | | | 694,730 | | | | 730,784 | |
| | | | |
FHLMC (1 Year Treasury Constant Maturity +2.22%)± | | | 4.60 | | | | 8-1-2033 | | | | 68,456 | | | | 71,346 | |
| | | | |
FHLMC (12 Month LIBOR +1.75%)± | | | 4.60 | | | | 6-1-2033 | | | | 389,663 | | | | 408,811 | |
| | | | |
FHLMC (12 Month LIBOR +1.75%)± | | | 4.60 | | | | 9-1-2037 | | | | 293,020 | | | | 308,139 | |
| | | | |
FHLMC (1 Year Treasury Constant Maturity +2.23%)± | | | 4.60 | | | | 11-1-2026 | | | | 61,199 | | | | 62,969 | |
| | | | |
FHLMC (12 Month LIBOR +1.73%)± | | | 4.61 | | | | 1-1-2035 | | | | 392,061 | | | | 414,958 | |
| | | | |
FHLMC (1 Year Treasury Constant Maturity +2.22%)± | | | 4.61 | | | | 10-1-2033 | | | | 226,014 | | | | 237,482 | |
| | | | |
FHLMC (11th District Cost of Funds +2.57%)± | | | 4.61 | | | | 12-1-2025 | | | | 271,687 | | | | 280,638 | |
| | | | |
FHLMC (12 Month LIBOR +1.74%)± | | | 4.62 | | | | 12-1-2036 | | | | 231,157 | | | | 242,849 | |
| | | | |
FHLMC (1 Year Treasury Constant Maturity +2.10%)± | | | 4.62 | | | | 10-1-2037 | | | | 936,275 | | | | 981,993 | |
| | | | |
FHLMC (12 Month LIBOR +1.77%)± | | | 4.63 | | | | 10-1-2036 | | | | 389,557 | | | | 410,867 | |
The accompanying notes are an integral part of these financial statements.
Wells Fargo Adjustable Rate Government Fund | 11
Portfolio of investments—August 31, 2019
| | | | | | | | | | | | | | | | |
| | | Interest
rate | | | Maturity
date | | | Principal | | | Value | |
| Agency Securities (continued) | |
| | | | |
FHLMC (1 Year Treasury Constant Maturity +2.22%)± | | | 4.63 | % | | | 10-1-2033 | | | $ | 814,069 | | | $ | 855,403 | |
| | | | |
FHLMC (1 Year Treasury Constant Maturity +2.25%)± | | | 4.64 | | | | 8-1-2035 | | | | 1,393,092 | | | | 1,471,283 | |
| | | | |
FHLMC (1 Year Treasury Constant Maturity +2.25%)± | | | 4.64 | | | | 2-1-2036 | | | | 804,012 | | | | 848,023 | |
| | | | |
FHLMC (1 Year Treasury Constant Maturity +2.27%)± | | | 4.65 | | | | 5-1-2025 | | | | 56,764 | | | | 57,488 | |
| | | | |
FHLMC (2 Year Treasury Constant Maturity +2.44%)± | | | 4.65 | | | | 8-1-2029 | | | | 90,719 | | | | 94,458 | |
| | | | |
FHLMC (1 Year Treasury Constant Maturity +2.25%)± | | | 4.65 | | | | 11-1-2035 | | | | 486,035 | | | | 510,953 | |
| | | | |
FHLMC (1 Year Treasury Constant Maturity +2.22%)± | | | 4.65 | | | | 10-1-2033 | | | | 511,782 | | | | 538,747 | |
| | | | |
FHLMC (1 Year Treasury Constant Maturity +2.24%)± | | | 4.65 | | | | 10-1-2034 | | | | 719,775 | | | | 759,595 | |
| | | | |
FHLMC (1 Year Treasury Constant Maturity +2.28%)± | | | 4.66 | | | | 7-1-2031 | | | | 606,860 | | | | 627,747 | |
| | | | |
FHLMC (12 Month LIBOR +1.75%)± | | | 4.66 | | | | 5-1-2033 | | | | 143,096 | | | | 150,293 | |
| | | | |
FHLMC (1 Year Treasury Constant Maturity +2.33%)± | | | 4.66 | | | | 9-1-2033 | | | | 576,107 | | | | 608,166 | |
| | | | |
FHLMC (1 Year Treasury Constant Maturity +2.16%)± | | | 4.66 | | | | 8-1-2034 | | | | 705,595 | | | | 738,944 | |
| | | | |
FHLMC (12 Month LIBOR +1.75%)± | | | 4.66 | | | | 4-1-2035 | | | | 151,313 | | | | 159,055 | |
| | | | |
FHLMC (1 Year Treasury Constant Maturity +2.17%)± | | | 4.67 | | | | 5-1-2037 | | | | 78,716 | | | | 82,697 | |
| | | | |
FHLMC (1 Year Treasury Constant Maturity +2.24%)± | | | 4.68 | | | | 2-1-2036 | | | | 723,950 | | | | 762,943 | |
| | | | |
FHLMC (1 Year Treasury Constant Maturity +2.23%)± | | | 4.69 | | | | 10-1-2036 | | | | 284,064 | | | | 298,406 | |
| | | | |
FHLMC (1 Year Treasury Constant Maturity +2.24%)± | | | 4.69 | | | | 3-1-2035 | | | | 549,187 | | | | 579,378 | |
| | | | |
FHLMC (1 Year Treasury Constant Maturity +2.29%)± | | | 4.70 | | | | 11-1-2027 | | | | 379,366 | | | | 397,138 | |
| | | | |
FHLMC (1 Year Treasury Constant Maturity +2.33%)± | | | 4.70 | | | | 7-1-2031 | | | | 152,114 | | | | 161,156 | |
| | | | |
FHLMC (1 Year Treasury Constant Maturity +2.25%)± | | | 4.70 | | | | 4-1-2036 | | | | 400,670 | | | | 422,589 | |
| | | | |
FHLMC (1 Year Treasury Constant Maturity +2.28%)± | | | 4.70 | | | | 10-1-2036 | | | | 307,033 | | | | 324,309 | |
| | | | |
FHLMC (12 Month LIBOR +1.77%)± | | | 4.70 | | | | 9-1-2037 | | | | 392,286 | | | | 408,487 | |
| | | | |
FHLMC (1 Year Treasury Constant Maturity +2.26%)± | | | 4.70 | | | | 7-1-2035 | | | | 439,722 | | | | 464,162 | |
| | | | |
FHLMC (1 Year Treasury Constant Maturity +2.20%)± | | | 4.71 | | | | 11-1-2036 | | | | 806,354 | | | | 848,703 | |
| | | | |
FHLMC (1 Year Treasury Constant Maturity +2.25%)± | | | 4.71 | | | | 9-1-2038 | | | | 146,481 | | | | 151,752 | |
| | | | |
FHLMC (1 Year Treasury Constant Maturity +2.24%)± | | | 4.71 | | | | 5-1-2038 | | | | 639,662 | | | | 676,996 | |
| | | | |
FHLMC (1 Year Treasury Constant Maturity +2.23%)± | | | 4.72 | | | | 7-1-2034 | | | | 103,763 | | | | 109,351 | |
| | | | |
FHLMC (1 Year Treasury Constant Maturity +2.25%)± | | | 4.72 | | | | 5-1-2034 | | | | 73,253 | | | | 77,245 | |
| | | | |
FHLMC (1 Year Treasury Constant Maturity +2.25%)± | | | 4.72 | | | | 3-1-2036 | | | | 431,260 | | | | 454,249 | |
| | | | |
FHLMC (1 Year Treasury Constant Maturity +2.35%)± | | | 4.73 | | | | 7-1-2038 | | | | 339,165 | | | | 358,132 | |
| | | | |
FHLMC (12 Month Treasury Average +2.30%)± | | | 4.73 | | | | 6-1-2028 | | | | 82,111 | | | | 83,763 | |
| | | | |
FHLMC (1 Year Treasury Constant Maturity +2.23%)± | | | 4.73 | | | | 5-1-2032 | | | | 37,709 | | | | 39,006 | |
| | | | |
FHLMC (1 Year Treasury Constant Maturity +2.23%)± | | | 4.73 | | | | 5-1-2034 | | | | 839,274 | | | | 875,921 | |
| | | | |
FHLMC (1 Year Treasury Constant Maturity +2.17%)± | | | 4.73 | | | | 6-1-2036 | | | | 729,435 | | | | 767,702 | |
| | | | |
FHLMC (1 Year Treasury Constant Maturity +2.23%)± | | | 4.73 | | | | 7-1-2036 | | | | 223,626 | | | | 233,187 | |
| | | | |
FHLMC (1 Year Treasury Constant Maturity +2.23%)± | | | 4.73 | | | | 4-1-2034 | | | | 274,528 | | | | 289,094 | |
| | | | |
FHLMC (6 Month LIBOR +2.08%)± | | | 4.73 | | | | 6-1-2026 | | | | 633,822 | | | | 651,557 | |
| | | | |
FHLMC (1 Year Treasury Constant Maturity +2.22%)± | | | 4.73 | | | | 12-1-2033 | | | | 464,073 | | | | 486,211 | |
| | | | |
FHLMC (12 Month LIBOR +1.74%)± | | | 4.74 | | | | 5-1-2037 | | | | 893,117 | | | | 940,620 | |
| | | | |
FHLMC (12 Month LIBOR +1.87%)± | | | 4.75 | | | | 5-1-2035 | | | | 117,167 | | | | 124,223 | |
| | | | |
FHLMC (1 Year Treasury Constant Maturity +2.25%)± | | | 4.75 | | | | 8-1-2035 | | | | 365,133 | | | | 384,976 | |
| | | | |
FHLMC (1 Year Treasury Constant Maturity +2.24%)± | | | 4.75 | | | | 4-1-2037 | | | | 406,132 | | | | 433,760 | |
| | | | |
FHLMC (12 Month LIBOR +1.86%)± | | | 4.75 | | | | 7-1-2038 | | | | 1,356,974 | | | | 1,429,450 | |
| | | | |
FHLMC (1 Year Treasury Constant Maturity +2.25%)± | | | 4.75 | | | | 5-1-2034 | | | | 126,806 | | | | 132,644 | |
| | | | |
FHLMC (1 Year Treasury Constant Maturity +2.34%)± | | | 4.75 | | | | 7-1-2034 | | | | 450,729 | | | | 470,570 | |
| | | | |
FHLMC (1 Year Treasury Constant Maturity +2.24%)± | | | 4.75 | | | | 2-1-2036 | | | | 482,047 | | | | 509,741 | |
| | | | |
FHLMC (1 Year Treasury Constant Maturity +2.36%)± | | | 4.76 | | | | 7-1-2027 | | | | 436,665 | | | | 440,506 | |
| | | | |
FHLMC (1 Year Treasury Constant Maturity +2.21%)± | | | 4.76 | | | | 1-1-2037 | | | | 758,779 | | | | 800,135 | |
| | | | |
FHLMC (1 Year Treasury Constant Maturity +2.31%)± | | | 4.76 | | | | 3-1-2037 | | | | 237,475 | | | | 250,863 | |
| | | | |
FHLMC (1 Year Treasury Constant Maturity +2.23%)± | | | 4.77 | | | | 9-1-2035 | | | | 1,095,337 | | | | 1,155,342 | |
| | | | |
FHLMC (1 Year Treasury Constant Maturity +2.26%)± | | | 4.77 | | | | 5-1-2034 | | | | 1,105,247 | | | | 1,161,472 | |
The accompanying notes are an integral part of these financial statements.
12 | Wells Fargo Adjustable Rate Government Fund
Portfolio of investments—August 31, 2019
| | | | | | | | | | | | | | | | |
| | | Interest
rate | | | Maturity
date | | | Principal | | | Value | |
| Agency Securities (continued) | |
| | | | |
FHLMC (1 Year Treasury Constant Maturity +2.25%)± | | | 4.77 | % | | | 12-1-2034 | | | $ | 278,576 | | | $ | 294,639 | |
| | | | |
FHLMC (1 Year Treasury Constant Maturity +2.25%)± | | | 4.77 | | | | 6-1-2035 | | | | 84,478 | | | | 89,240 | |
| | | | |
FHLMC (1 Year Treasury Constant Maturity +2.27%)± | | | 4.77 | | | | 11-1-2029 | | | | 37,257 | | | | 37,890 | |
| | | | |
FHLMC (1 Year Treasury Constant Maturity +2.28%)± | | | 4.77 | | | | 4-1-2037 | | | | 1,027,582 | | | | 1,085,996 | |
| | | | |
FHLMC (1 Year Treasury Constant Maturity +2.36%)± | | | 4.77 | | | | 1-1-2028 | | | | 2,088 | | | | 2,194 | |
| | | | |
FHLMC (1 Year Treasury Constant Maturity +2.18%)± | | | 4.78 | | | | 4-1-2023 | | | | 134,135 | | | | 135,173 | |
| | | | |
FHLMC (1 Year Treasury Constant Maturity +2.25%)± | | | 4.78 | | | | 11-1-2036 | | | | 682,892 | | | | 720,121 | |
| | | | |
FHLMC (1 Year Treasury Constant Maturity +2.29%)± | | | 4.79 | | | | 11-1-2029 | | | | 60,245 | | | | 61,499 | |
| | | | |
FHLMC (1 Year Treasury Constant Maturity +2.16%)± | | | 4.79 | | | | 6-1-2033 | | | | 438,568 | | | | 459,453 | |
| | | | |
FHLMC (1 Year Treasury Constant Maturity +2.26%)± | | | 4.79 | | | | 2-1-2036 | | | | 366,313 | | | | 386,705 | |
| | | | |
FHLMC (12 Month LIBOR +1.67%)± | | | 4.79 | | | | 8-1-2035 | | | | 136,739 | | | | 139,861 | |
| | | | |
FHLMC (1 Year Treasury Constant Maturity +2.40%)± | | | 4.80 | | | | 9-1-2031 | | | | 62,643 | | | | 63,686 | |
| | | | |
FHLMC (1 Year Treasury Constant Maturity +2.36%)± | | | 4.80 | | | | 1-1-2028 | | | | 15,548 | | | | 16,246 | |
| | | | |
FHLMC (1 Year Treasury Constant Maturity +2.43%)± | | | 4.80 | | | | 6-1-2025 | | | | 46,777 | | | | 47,439 | |
| | | | |
FHLMC (1 Year Treasury Constant Maturity +2.25%)± | | | 4.80 | | | | 1-1-2037 | | | | 99,363 | | | | 105,023 | |
| | | | |
FHLMC (12 Month LIBOR +1.82%)± | | | 4.80 | | | | 5-1-2039 | | | | 609,245 | | | | 645,422 | |
| | | | |
FHLMC (12 Month LIBOR +1.87%)± | | | 4.81 | | | | 9-1-2036 | | | | 549,320 | | | | 579,192 | |
| | | | |
FHLMC (12 Month LIBOR +1.93%)± | | | 4.82 | | | | 4-1-2035 | | | | 801,805 | | | | 844,364 | |
| | | | |
FHLMC (1 Year Treasury Constant Maturity +2.25%)± | | | 4.82 | | | | 7-1-2037 | | | | 393,463 | | | | 414,732 | |
| | | | |
FHLMC (1 Year Treasury Constant Maturity +2.31%)± | | | 4.82 | | | | 7-1-2038 | | | | 497,666 | | | | 525,773 | |
| | | | |
FHLMC (1 Year Treasury Constant Maturity +2.23%)± | | | 4.82 | | | | 1-1-2034 | | | | 625,797 | | | | 663,040 | |
| | | | |
FHLMC (1 Year Treasury Constant Maturity +2.28%)± | | | 4.82 | | | | 1-1-2035 | | | | 249,957 | | | | 263,166 | |
| | | | |
FHLMC (12 Month Treasury Average +2.46%)± | | | 4.83 | | | | 10-1-2029 | | | | 91,511 | | | | 93,833 | |
| | | | |
FHLMC (1 Year Treasury Constant Maturity +2.36%)± | | | 4.83 | | | | 2-1-2031 | | | | 380,824 | | | | 400,102 | |
| | | | |
FHLMC (1 Year Treasury Constant Maturity +2.23%)± | | | 4.84 | | | | 4-1-2034 | | | | 205,291 | | | | 216,213 | |
| | | | |
FHLMC (1 Year Treasury Constant Maturity +2.35%)± | | | 4.84 | | | | 9-1-2030 | | | | 125,178 | | | | 129,678 | |
| | | | |
FHLMC (1 Year Treasury Constant Maturity +2.33%)± | | | 4.84 | | | | 10-1-2033 | | | | 1,060,441 | | | | 1,113,570 | |
| | | | |
FHLMC (1 Year Treasury Constant Maturity +2.34%)± | | | 4.84 | | | | 6-1-2035 | | | | 685,059 | | | | 723,610 | |
| | | | |
FHLMC (1 Year Treasury Constant Maturity +2.24%)± | | | 4.85 | | | | 3-1-2027 | | | | 67,728 | | | | 69,203 | |
| | | | |
FHLMC (1 Year Treasury Constant Maturity +2.29%)± | | | 4.85 | | | | 9-1-2033 | | | | 420,113 | | | | 443,167 | |
| | | | |
FHLMC (1 Year Treasury Constant Maturity +2.32%)± | | | 4.85 | | | | 9-1-2029 | | | | 462,042 | | | | 485,832 | |
| | | | |
FHLMC (1 Year Treasury Constant Maturity +2.36%)± | | | 4.85 | | | | 2-1-2036 | | | | 86,841 | | | | 91,824 | |
| | | | |
FHLMC (6 Month LIBOR +2.12%)± | | | 4.85 | | | | 5-1-2037 | | | | 45,528 | | | | 47,775 | |
| | | | |
FHLMC (12 Month LIBOR +1.98%)± | | | 4.85 | | | | 11-1-2032 | | | | 108,945 | | | | 111,440 | |
| | | | |
FHLMC (1 Year Treasury Constant Maturity +2.48%)± | | | 4.85 | | | | 6-1-2030 | | | | 233,003 | | | | 243,492 | |
| | | | |
FHLMC (1 Year Treasury Constant Maturity +2.36%)± | | | 4.86 | | | | 4-1-2038 | | | | 913,259 | | | | 967,969 | |
| | | | |
FHLMC (12 Month LIBOR +1.89%)± | | | 4.86 | | | | 4-1-2037 | | | | 378,569 | | | | 400,484 | |
| | | | |
FHLMC (1 Year Treasury Constant Maturity +2.24%)± | | | 4.87 | | | | 8-1-2027 | | | | 4,622 | | | | 4,690 | |
| | | | |
FHLMC (1 Year Treasury Constant Maturity +2.31%)± | | | 4.87 | | | | 1-1-2036 | | | | 400,608 | | | | 423,331 | |
| | | | |
FHLMC (12 Month LIBOR +1.86%)± | | | 4.87 | | | | 4-1-2037 | | | | 445,063 | | | | 471,228 | |
| | | | |
FHLMC (1 Year Treasury Constant Maturity +2.29%)± | | | 4.88 | | | | 2-1-2036 | | | | 513,196 | | | | 541,197 | |
| | | | |
FHLMC (1 Year Treasury Constant Maturity +2.25%)± | | | 4.89 | | | | 11-1-2022 | | | | 59,948 | | | | 61,315 | |
| | | | |
FHLMC (1 Year Treasury Constant Maturity +2.25%)± | | | 4.89 | | | | 2-1-2034 | | | | 503,773 | | | | 537,480 | |
| | | | |
FHLMC (1 Year Treasury Constant Maturity +2.26%)± | | | 4.89 | | | | 9-1-2038 | | | | 461,489 | | | | 484,826 | |
| | | | |
FHLMC (1 Year Treasury Constant Maturity +2.39%)± | | | 4.89 | | | | 12-1-2032 | | | | 210,775 | | | | 221,533 | |
| | | | |
FHLMC (1 Year Treasury Constant Maturity +2.39%)± | | | 4.89 | | | | 6-1-2035 | | | | 1,000,720 | | | | 1,044,229 | |
| | | | |
FHLMC (FHLMC National Average Mortgage Contract +0.00%)± | | | 4.89 | | | | 2-1-2021 | | | | 757 | | | | 757 | |
| | | | |
FHLMC (12 Month LIBOR +1.99%)± | | | 4.89 | | | | 7-1-2036 | | | | 678,423 | | | | 715,559 | |
| | | | |
FHLMC (1 Year Treasury Constant Maturity +2.34%)± | | | 4.90 | | | | 9-1-2032 | | | | 1,230,745 | | | | 1,294,144 | |
| | | | |
FHLMC (1 Year Treasury Constant Maturity +2.28%)± | | | 4.90 | | | | 2-1-2034 | | | | 986,944 | | | | 1,039,285 | |
| | | | |
FHLMC (1 Year Treasury Constant Maturity +2.40%)± | | | 4.91 | | | | 7-1-2029 | | | | 50,380 | | | | 52,636 | |
The accompanying notes are an integral part of these financial statements.
Wells Fargo Adjustable Rate Government Fund | 13
Portfolio of investments—August 31, 2019
| | | | | | | | | | | | | | | | |
| | | Interest
rate | | | Maturity
date | | | Principal | | | Value | |
| Agency Securities (continued) | |
| | | | |
FHLMC (12 Month LIBOR +1.91%)± | | | 4.91 | % | | | 3-1-2032 | | | $ | 339,696 | | | $ | 358,794 | |
| | | | |
FHLMC (1 Year Treasury Constant Maturity +2.25%)± | | | 4.91 | | | | 4-1-2038 | | | | 784,611 | | | | 827,070 | |
| | | | |
FHLMC (1 Year Treasury Constant Maturity +2.22%)± | | | 4.91 | | | | 1-1-2033 | | | | 264,753 | | | | 276,887 | |
| | | | |
FHLMC (12 Month LIBOR +1.84%)± | | | 4.91 | | | | 4-1-2035 | | | | 1,007,850 | | | | 1,061,554 | |
| | | | |
FHLMC (1 Year Treasury Constant Maturity +2.23%)± | | | 4.92 | | | | 3-1-2034 | | | | 568,308 | | | | 596,682 | |
| | | | |
FHLMC (1 Year Treasury Constant Maturity +2.36%)± | | | 4.92 | | | | 6-1-2035 | | | | 386,481 | | | | 407,963 | |
| | | | |
FHLMC (1 Year Treasury Constant Maturity +2.28%)± | | | 4.93 | | | | 11-1-2035 | | | | 703,180 | | | | 737,251 | |
| | | | |
FHLMC (1 Year Treasury Constant Maturity +2.23%)± | | | 4.93 | | | | 3-1-2034 | | | | 632,261 | | | | 666,142 | |
| | | | |
FHLMC (1 Year Treasury Constant Maturity +2.25%)± | | | 4.94 | | | | 2-1-2036 | | | | 647,894 | | | | 681,075 | |
| | | | |
FHLMC (1 Year Treasury Constant Maturity +2.47%)± | | | 4.94 | | | | 7-1-2034 | | | | 593,073 | | | | 625,025 | |
| | | | |
FHLMC (1 Year Treasury Constant Maturity +2.40%)± | | | 4.94 | | | | 11-1-2029 | | | | 374,974 | | | | 390,387 | |
| | | | |
FHLMC (1 Year Treasury Constant Maturity +2.38%)± | | | 4.96 | | | | 1-1-2037 | | | | 1,296,215 | | | | 1,371,557 | |
| | | | |
FHLMC (1 Year Treasury Constant Maturity +2.23%)± | | | 4.96 | | | | 2-1-2034 | | | | 905,891 | | | | 949,227 | |
| | | | |
FHLMC (1 Year Treasury Constant Maturity +2.47%)± | | | 4.97 | | | | 6-1-2035 | | | | 181,237 | | | | 190,558 | |
| | | | |
FHLMC (1 Year Treasury Constant Maturity +2.55%)± | | | 4.97 | | | | 9-1-2029 | | | | 80,573 | | | | 81,619 | |
| | | | |
FHLMC (1 Year Treasury Constant Maturity +2.23%)± | | | 4.98 | | | | 2-1-2034 | | | | 444,333 | | | | 469,689 | |
| | | | |
FHLMC (1 Year Treasury Constant Maturity +2.45%)± | | | 4.99 | | | | 10-1-2030 | | | | 1,165,966 | | | | 1,217,671 | |
| | | | |
FHLMC (1 Year Treasury Constant Maturity +2.38%)± | | | 4.99 | | | | 4-1-2034 | | | | 353,319 | | | | 369,403 | |
| | | | |
FHLMC (Federal Cost of Funds +2.72%)± | | | 5.00 | | | | 4-1-2023 | | | | 6,030 | | | | 6,052 | |
| | | | |
FHLMC (1 Year Treasury Constant Maturity +2.48%)± | | | 5.00 | | | | 10-1-2025 | | | | 47,281 | | | | 48,130 | |
| | | | |
FHLMC | | | 5.00 | | | | 10-1-2022 | | | | 6,089 | | | | 6,283 | |
| | | | |
FHLMC (1 Year Treasury Constant Maturity +2.36%)± | | | 5.00 | | | | 2-1-2035 | | | | 792,505 | | | | 841,958 | |
| | | | |
FHLMC (1 Year Treasury Constant Maturity +2.43%)± | | | 5.05 | | | | 8-1-2029 | | | | 55,599 | | | | 56,577 | |
| | | | |
FHLMC (1 Year Treasury Constant Maturity +2.48%)± | | | 5.06 | | | | 6-1-2030 | | | | 28,464 | | | | 29,089 | |
| | | | |
FHLMC (1 Year Treasury Constant Maturity +2.44%)± | | | 5.07 | | | | 4-1-2029 | | | | 77,988 | | | | 79,238 | |
| | | | |
FHLMC (1 Year Treasury Constant Maturity +2.52%)± | | | 5.07 | | | | 11-1-2029 | | | | 89,980 | | | | 92,964 | |
| | | | |
FHLMC (1 Year Treasury Constant Maturity +2.60%)± | | | 5.10 | | | | 6-1-2032 | | | | 135,191 | | | | 137,662 | |
| | | | |
FHLMC (1 Year Treasury Constant Maturity +2.61%)± | | | 5.10 | | | | 5-1-2028 | | | | 167,491 | | | | 173,752 | |
| | | | |
FHLMC (1 Year Treasury Constant Maturity +2.61%)± | | | 5.11 | | | | 9-1-2030 | | | | 94,076 | | | | 96,171 | |
| | | | |
FHLMC (1 Year Treasury Constant Maturity +2.48%)± | | | 5.16 | | | | 6-1-2030 | | | | 74,936 | | | | 76,846 | |
| | | | |
FHLMC (1 Year Treasury Constant Maturity +2.48%)± | | | 5.23 | | | | 10-1-2024 | | | | 65,917 | | | | 68,100 | |
| | | | |
FHLMC (1 Year Treasury Constant Maturity +2.48%)± | | | 5.23 | | | | 2-1-2030 | | | | 28,017 | | | | 28,536 | |
| | | | |
FHLMC (6 Month LIBOR +2.38%)± | | | 5.27 | | | | 2-1-2024 | | | | 12,459 | | | | 12,500 | |
| | | | |
FHLMC (1 Year Treasury Constant Maturity +2.32%)± | | | 5.49 | | | | 8-1-2024 | | | | 173,622 | | | | 175,093 | |
| | | | |
FHLMC (6 Month LIBOR +3.83%)± | | | 6.71 | | | | 11-1-2026 | | | | 27,219 | | | | 27,867 | |
| | | | |
FHLMC Series 0020 Class F±± | | | 3.49 | | | | 7-1-2029 | | | | 8,099 | | | | 8,319 | |
| | | | |
FHLMC Series 1671 Class QA (11th District Cost of Funds +0.95%)± | | | 2.09 | | | | 2-15-2024 | | | | 590,190 | | | | 598,437 | |
| | | | |
FHLMC Series 1686 Class FE (11th District Cost of Funds +1.10%)± | | | 2.24 | | | | 2-15-2024 | | | | 12,421 | | | | 12,623 | |
| | | | |
FHLMC Series 1730 Class FA (10 Year Treasury Constant Maturity-0.60%)± | | | 1.47 | | | | 5-15-2024 | | | | 88,638 | | | | 88,546 | |
| | | | |
FHLMC Series 2315 Class FW (1 Month LIBOR +0.55%)± | | | 2.75 | | | | 4-15-2027 | | | | 63,167 | | | | 63,544 | |
| | | | |
FHLMC Series 2391 Class EF (1 Month LIBOR +0.50%)± | | | 2.70 | | | | 6-15-2031 | | | | 59,951 | | | | 60,362 | |
| | | | |
FHLMC Series 2454 Class SL (1 Month LIBOR +8.00%)±(c) | | | 5.80 | | | | 3-15-2032 | | | | 118,702 | | | | 20,142 | |
| | | | |
FHLMC Series 2461 Class FI (1 Month LIBOR +0.50%)± | | | 2.70 | | | | 4-15-2028 | | | | 83,630 | | �� | | 84,072 | |
| | | | |
FHLMC Series 2464 Class FE (1 Month LIBOR +1.00%)± | | | 3.20 | | | | 3-15-2032 | | | | 77,367 | | | | 79,440 | |
| | | | |
FHLMC Series 2466 Class FV (1 Month LIBOR +0.55%)± | | | 2.75 | | | | 3-15-2032 | | | | 153,289 | | | | 154,699 | |
| | | | |
FHLMC Series 2538 Class F (1 Month LIBOR +0.60%)± | | | 2.80 | | | | 12-15-2032 | | | | 333,259 | | | | 337,006 | |
| | | | |
FHLMC Series 3436 Class A±± | | | 4.44 | | | | 11-15-2036 | | | | 562,829 | | | | 579,522 | |
| | | | |
FHLMC SeriesT-15 Class A6 (1 Month LIBOR +0.40%)± | | | 2.55 | | | | 11-25-2028 | | | | 386,555 | | | | 388,036 | |
| | | | |
FHLMC SeriesT-16 Class A (1 Month LIBOR +0.10%)± | | | 2.25 | | | | 6-25-2029 | | | | 1,134,221 | | | | 1,173,128 | |
| | | | |
FHLMC SeriesT-20 Class A7 (1 Month LIBOR +0.15%)± | | | 2.30 | | | | 12-25-2029 | | | | 2,386,213 | | | | 2,346,017 | |
| | | | |
FHLMC SeriesT-21 Class A (1 Month LIBOR +0.18%)± | | | 2.33 | | | | 10-25-2029 | | | | 924,408 | | | | 919,166 | |
The accompanying notes are an integral part of these financial statements.
14 | Wells Fargo Adjustable Rate Government Fund
Portfolio of investments—August 31, 2019
| | | | | | | | | | | | | | | | |
| | | Interest
rate | | | Maturity
date | | | Principal | | | Value | |
| Agency Securities (continued) | |
| | | | |
FHLMC SeriesT-23 Class A (1 Month LIBOR +0.14%)± | | | 2.29 | % | | | 5-25-2030 | | | $ | 1,364,375 | | | $ | 1,362,672 | |
| | | | |
FHLMC SeriesT-27 Class A (1 Month LIBOR +0.15%)± | | | 2.30 | | | | 10-25-2030 | | | | 895,401 | | | | 899,692 | |
| | | | |
FHLMC SeriesT-30 Class A7 (1 Month LIBOR +0.24%)± | | | 2.39 | | | | 12-25-2030 | | | | 1,011,900 | | | | 982,311 | |
| | | | |
FHLMC SeriesT-35 Class A (1 Month LIBOR +0.14%)± | | | 2.55 | | | | 9-25-2031 | | | | 2,414,479 | | | | 2,390,663 | |
| | | | |
FHLMC SeriesT-48 Class 2A±± | | | 4.26 | | | | 7-25-2033 | | | | 1,851,398 | | | | 1,887,979 | |
| | | | |
FHLMC SeriesT-54 Class 4A±± | | | 4.22 | | | | 2-25-2043 | | | | 1,318,213 | | | | 1,348,898 | |
| | | | |
FHLMC SeriesT-55 Class 1A1 | | | 6.50 | | | | 3-25-2043 | | | | 54,828 | | | | 62,787 | |
| | | | |
FHLMC SeriesT-56 Class 3AF (1 Month LIBOR +1.00%)± | | | 3.15 | | | | 5-25-2043 | | | | 869,828 | | | | 889,075 | |
| | | | |
FHLMC SeriesT-62 Class 1A1 (12 Month Treasury Average +1.20%)± | | | 3.68 | | | | 10-25-2044 | | | | 2,961,013 | | | | 2,992,167 | |
| | | | |
FHLMC SeriesT-63 Class 1A1 (12 Month Treasury Average +1.20%)± | | | 3.51 | | | | 2-25-2045 | | | | 2,618,100 | | | | 2,615,318 | |
| | | | |
FHLMC SeriesT-66 Class 2A1±± | | | 4.35 | | | | 1-25-2036 | | | | 1,611,752 | | | | 1,608,505 | |
| | | | |
FHLMC SeriesT-67 Class 1A1C±± | | | 3.90 | | | | 3-25-2036 | | | | 3,795,174 | | | | 3,873,792 | |
| | | | |
FHLMC SeriesT-67 Class 2A1C±± | | | 3.74 | | | | 3-25-2036 | | | | 3,346,975 | | | | 3,391,075 | |
| | | | |
FHLMC SeriesT-75 Class A1 (1 Month LIBOR +0.04%)± | | | 2.31 | | | | 12-25-2036 | | | | 215,557 | | | | 215,807 | |
| | | | |
FNMA (11th District Cost of Funds +1.25%)± | | | 2.18 | | | | 4-1-2021 | | | | 11,071 | | | | 11,060 | |
| | | | |
FNMA (11th District Cost of Funds +1.25%)± | | | 2.20 | | | | 11-1-2024 | | | | 1,157 | | | | 1,153 | |
| | | | |
FNMA (11th District Cost of Funds +1.25%)± | | | 2.21 | | | | 11-1-2020 | | | | 51,240 | | | | 51,034 | |
| | | | |
FNMA (11th District Cost of Funds +1.25%)± | | | 2.21 | | | | 3-1-2033 | | | | 96,831 | | | | 96,857 | |
| | | | |
FNMA (1 Year Treasury Constant Maturity +1.66%)± | | | 2.26 | | | | 7-1-2048 | | | | 1,893,496 | | | | 1,913,791 | |
| | | | |
FNMA (11th District Cost of Funds +1.25%)± | | | 2.35 | | | | 11-1-2023 | | | | 11,002 | | | | 10,922 | |
| | | | |
FNMA (11th District Cost of Funds +1.25%)± | | | 2.36 | | | | 1-1-2038 | | | | 48,713 | | | | 48,590 | |
| | | | |
FNMA (11th District Cost of Funds +1.26%)± | | | 2.37 | | | | 1-1-2035 | | | | 666,529 | | | | 671,235 | |
| | | | |
FNMA (11th District Cost of Funds +1.25%)± | | | 2.38 | | | | 3-1-2021 | | | | 25 | | | | 24 | |
| | | | |
FNMA (11th District Cost of Funds +1.25%)± | | | 2.39 | | | | 4-1-2042 | | | | 1,714,591 | | | | 1,706,448 | |
| | | | |
FNMA (11th District Cost of Funds +1.25%)± | | | 2.39 | | | | 10-1-2044 | | | | 932,174 | | | | 927,367 | |
| | | | |
FNMA (11th District Cost of Funds +1.25%)± | | | 2.43 | | | | 9-1-2037 | | | | 1,656,570 | | | | 1,649,736 | |
| | | | |
FNMA (11th District Cost of Funds +1.44%)± | | | 2.59 | | | | 4-1-2024 | | | | 1,071,234 | | | | 1,074,062 | |
| | | | |
FNMA (11th District Cost of Funds +1.78%)± | | | 2.76 | | | | 1-1-2036 | | | | 193,902 | | | | 194,922 | |
| | | | |
FNMA (11th District Cost of Funds +1.82%)± | | | 2.78 | | | | 5-1-2028 | | | | 36,641 | | | | 36,785 | |
| | | | |
FNMA (11th District Cost of Funds +1.25%)± | | | 2.80 | | | | 7-1-2020 | | | | 111,500 | | | | 111,179 | |
| | | | |
FNMA (11th District Cost of Funds +1.80%)± | | | 2.89 | | | | 3-1-2033 | | | | 225,061 | | | | 225,261 | |
| | | | |
FNMA (11th District Cost of Funds +1.83%)± | | | 2.90 | | | | 1-1-2036 | | | | 29,626 | | | | 29,733 | |
| | | | |
FNMA (11th District Cost of Funds +1.78%)± | | | 2.91 | | | | 11-1-2022 | | | | 8,257 | | | | 8,248 | |
| | | | |
FNMA (11th District Cost of Funds +1.92%)± | | | 2.94 | | | | 9-1-2030 | | | | 219,759 | | | | 218,141 | |
| | | | |
FNMA (11th District Cost of Funds +1.88%)± | | | 2.97 | | | | 10-1-2024 | | | | 459 | | | | 458 | |
| | | | |
FNMA (11th District Cost of Funds +1.86%)± | | | 2.97 | | | | 10-1-2027 | | | | 336,779 | | | | 339,759 | |
| | | | |
FNMA (11th District Cost of Funds +1.19%)± | | | 3.04 | | | | 10-1-2034 | | | | 97,187 | | | | 97,181 | |
| | | | |
FNMA (11th District Cost of Funds +1.70%)± | | | 3.07 | | | | 4-1-2030 | | | | 827 | | | | 820 | |
| | | | |
FNMA (11th District Cost of Funds +2.09%)± | | | 3.08 | | | | 4-1-2020 | | | | 318,010 | | | | 317,669 | |
| | | | |
FNMA (11th District Cost of Funds +1.25%)± | | | 3.16 | | | | 4-1-2034 | | | | 973,243 | | | | 985,771 | |
| | | | |
FNMA (3 Year Treasury Constant Maturity +2.47%)± | | | 3.22 | | | | 6-1-2024 | | | | 12,770 | | | | 12,897 | |
| | | | |
FNMA (1 Month LIBOR +1.17%)± | | | 3.55 | | | | 5-1-2029 | | | | 40,808 | | | | 42,129 | |
| | | | |
FNMA (6 Month LIBOR +1.15%)± | | | 3.65 | | | | 8-1-2032 | | | | 155,347 | | | | 155,762 | |
| | | | |
FNMA (6 Month LIBOR +1.00%)± | | | 3.67 | | | | 6-1-2021 | | | | 6,121 | | | | 6,197 | |
| | | | |
FNMA (12 Month Treasury Average +1.25%)± | | | 3.74 | | | | 1-1-2021 | | | | 432 | | | | 434 | |
| | | | |
FNMA (12 Month Treasury Average +1.25%)± | | | 3.75 | | | | 1-1-2021 | | | | 712 | | | | 718 | |
| | | | |
FNMA (3 Year Treasury Constant Maturity +2.15%)± | | | 3.77 | | | | 10-1-2024 | | | | 26,318 | | | | 26,751 | |
| | | | |
FNMA (6 Month LIBOR +1.18%)± | | | 3.85 | | | | 8-1-2033 | | | | 161,625 | | | | 167,505 | |
| | | | |
FNMA (5 Year Treasury Constant Maturity +1.90%)± | | | 3.85 | | | | 9-1-2031 | | | | 184,449 | | | | 191,172 | |
| | | | |
FNMA (1 Year Treasury Constant Maturity +1.52%)± | | | 3.86 | | | | 8-1-2033 | | | | 733,796 | | | | 758,604 | |
| | | | |
FNMA (6 Month LIBOR +1.37%)± | | | 3.87 | | | | 1-1-2032 | | | | 196,051 | | | | 202,509 | |
The accompanying notes are an integral part of these financial statements.
Wells Fargo Adjustable Rate Government Fund | 15
Portfolio of investments—August 31, 2019
| | | | | | | | | | | | | | | | |
| | | Interest
rate | | | Maturity
date | | | Principal | | | Value | |
| Agency Securities (continued) | |
| | | | |
FNMA (6 Month LIBOR +1.38%)± | | | 3.88 | % | | | 12-1-2031 | | | $ | 17,817 | | | $ | 17,862 | |
| | | | |
FNMA (12 Month Treasury Average +1.40%)± | | | 3.91 | | | | 12-1-2030 | | | | 66,546 | | | | 65,795 | |
| | | | |
FNMA (3 Year Treasury Constant Maturity +1.21%)± | | | 3.95 | | | | 3-1-2030 | | | | 15,815 | | | | 16,034 | |
| | | | |
FNMA (6 Month LIBOR +1.08%)± | | | 3.95 | | | | 9-1-2032 | | | | 51,051 | | | | 51,036 | |
| | | | |
FNMA (1 Year Treasury Constant Maturity +1.63%)± | | | 4.00 | | | | 11-1-2029 | | | | 6,895 | | | | 6,920 | |
| | | | |
FNMA (6 Month LIBOR +1.16%)± | | | 4.00 | | | | 8-1-2033 | | | | 3,262 | | | | 3,313 | |
| | | | |
FNMA (1 Year Treasury Constant Maturity +1.50%)± | | | 4.00 | | | | 8-1-2030 | | | | 913,875 | | | | 938,001 | |
| | | | |
FNMA (6 Month LIBOR +1.43%)± | | | 4.09 | | | | 10-1-2037 | | | | 601,990 | | | | 621,657 | |
| | | | |
FNMA (6 Month LIBOR +1.42%)± | | | 4.09 | | | | 12-1-2031 | | | | 190,015 | | | | 196,639 | |
| | | | |
FNMA (6 Month LIBOR +1.53%)± | | | 4.11 | | | | 1-1-2035 | | | | 988,580 | | | | 1,022,487 | |
| | | | |
FNMA (1 Year Treasury Constant Maturity +1.76%)± | | | 4.13 | | | | 8-1-2032 | | | | 127,393 | | | | 130,464 | |
| | | | |
FNMA (Federal Cost of Funds +2.00%)± | | | 4.14 | | | | 8-1-2029 | | | | 32,915 | | | | 34,096 | |
| | | | |
FNMA (6 Month LIBOR +1.52%)± | | | 4.14 | | | | 11-1-2034 | | | | 337,321 | | | | 348,629 | |
| | | | |
FNMA (11th District Cost of Funds +1.87%)± | | | 4.15 | | | | 5-1-2034 | | | | 133,158 | | | | 135,728 | |
| | | | |
FNMA (6 Month LIBOR +1.55%)± | | | 4.17 | | | | 12-1-2022 | | | | 3,185 | | | | 3,195 | |
| | | | |
FNMA (5 Year Treasury Constant Maturity +2.43%)± | | | 4.21 | | | | 6-1-2028 | | | | 25,563 | | | | 25,793 | |
| | | | |
FNMA (1 Year Treasury Constant Maturity +1.67%)± | | | 4.21 | | | | 4-1-2033 | | | | 172,808 | | | | 179,786 | |
| | | | |
FNMA (11th District Cost of Funds +1.82%)± | | | 4.21 | | | | 6-1-2034 | | | | 130,691 | | | | 133,311 | |
| | | | |
FNMA (11th District Cost of Funds +1.93%)± | | | 4.23 | | | | 12-1-2036 | | | | 65,384 | | | | 67,751 | |
| | | | |
FNMA (12 Month LIBOR +1.52%)± | | | 4.24 | | | | 9-1-2036 | | | | 367,247 | | | | 381,904 | |
| | | | |
FNMA (6 Month LIBOR +1.63%)± | | | 4.25 | | | | 1-1-2022 | | | | 4,225 | | | | 4,224 | |
| | | | |
FNMA (6 Month LIBOR +1.38%)± | | | 4.25 | | | | 8-1-2031 | | | | 121,280 | | | | 123,315 | |
| | | | |
FNMA (12 Month LIBOR +1.53%)± | | | 4.25 | | | | 9-1-2035 | | | | 937,058 | | | | 976,093 | |
| | | | |
FNMA (1 Year Treasury Constant Maturity +1.88%)± | | | 4.26 | | | | 8-1-2031 | | | | 54,490 | | | | 56,672 | |
| | | | |
FNMA (6 Month LIBOR +1.55%)± | | | 4.28 | | | | 3-1-2034 | | | | 208,521 | | | | 215,355 | |
| | | | |
FNMA (6 Month LIBOR +1.42%)± | | | 4.29 | | | | 9-1-2031 | | | | 124,661 | | | | 127,576 | |
| | | | |
FNMA (1 Year Treasury Constant Maturity +1.58%)± | | | 4.29 | | | | 3-1-2034 | | | | 289,463 | | | | 303,900 | |
| | | | |
FNMA (6 Month LIBOR +1.74%)± | | | 4.37 | | | | 10-1-2024 | | | | 32,947 | | | | 33,083 | |
| | | | |
FNMA (6 Month LIBOR +1.74%)± | | | 4.37 | | | | 12-1-2024 | | | | 46,366 | | | | 46,493 | |
| | | | |
FNMA (1 Year Treasury Constant Maturity +1.74%)± | | | 4.37 | | | | 1-1-2035 | | | | 40,928 | | | | 42,485 | |
| | | | |
FNMA (12 Month Treasury Average +1.86%)± | | | 4.38 | | | | 11-1-2035 | | | | 27,187 | | | | 28,049 | |
| | | | |
FNMA (3 Year Treasury Constant Maturity +2.14%)± | | | 4.39 | | | | 10-1-2025 | | | | 5,477 | | | | 5,511 | |
| | | | |
FNMA (12 Month Treasury Average +1.89%)± | | | 4.40 | | | | 11-1-2035 | | | | 693,227 | | | | 721,215 | |
| | | | |
FNMA (12 Month LIBOR +1.65%)± | | | 4.40 | | | | 9-1-2037 | | | | 558,880 | | | | 578,962 | |
| | | | |
FNMA (1 Year Treasury Constant Maturity +1.93%)± | | | 4.40 | | | | 7-1-2038 | | | | 512,902 | | | | 532,054 | |
| | | | |
FNMA (12 Month LIBOR +1.67%)± | | | 4.41 | | | | 7-1-2035 | | | | 960,348 | | | | 1,009,494 | |
| | | | |
FNMA (1 Year Treasury Constant Maturity +1.70%)± | | | 4.42 | | | | 2-1-2033 | | | | 262,067 | | | | 270,563 | |
| | | | |
FNMA (12 Month Treasury Average +1.94%)± | | | 4.42 | | | | 6-1-2035 | | | | 531,897 | | | | 550,286 | |
| | | | |
FNMA (12 Month Treasury Average +1.95%)± | | | 4.42 | | | | 7-1-2035 | | | | 879,484 | | | | 910,142 | |
| | | | |
FNMA (12 Month Treasury Average +1.91%)± | | | 4.43 | | | | 11-1-2035 | | | | 122,022 | | | | 126,141 | |
| | | | |
FNMA (1 Year Treasury Constant Maturity +2.03%)± | | | 4.43 | | | | 11-1-2027 | | | | 20,306 | | | | 20,379 | |
| | | | |
FNMA (1 Year Treasury Constant Maturity +1.87%)± | | | 4.44 | | | | 4-1-2030 | | | | 46,661 | | | | 47,270 | |
| | | | |
FNMA (Federal Cost of Funds +2.38%)± | | | 4.44 | | | | 2-1-2029 | | | | 895,194 | | | | 918,594 | |
| | | | |
FNMA (1 Year Treasury Constant Maturity +1.82%)± | | | 4.45 | | | | 4-1-2038 | | | | 375,785 | | | | 393,638 | |
| | | | |
FNMA (12 Month Treasury Average +1.98%)± | | | 4.46 | | | | 7-1-2035 | | | | 512,630 | | | | 530,298 | |
| | | | |
FNMA (1 Year Treasury Constant Maturity +2.09%)± | | | 4.46 | | | | 8-1-2025 | | | | 17,400 | | | | 17,680 | |
| | | | |
FNMA (1 Year Treasury Constant Maturity +2.13%)± | | | 4.49 | | | | 10-1-2025 | | | | 78,642 | | | | 80,023 | |
| | | | |
FNMA (1 Year Treasury Constant Maturity +2.12%)± | | | 4.49 | | | | 8-1-2026 | | | | 26,375 | | | | 26,680 | |
| | | | |
FNMA (12 Month LIBOR +1.80%)± | | | 4.49 | | | | 7-1-2033 | | | | 572,478 | | | | 602,705 | |
| | | | |
FNMA (1 Year Treasury Constant Maturity +2.11%)± | | | 4.49 | | | | 7-1-2035 | | | | 456,684 | | | | 479,929 | |
| | | | |
FNMA (1 Year Treasury Constant Maturity +2.10%)± | | | 4.50 | | | | 7-1-2035 | | | | 198,600 | | | | 206,498 | |
The accompanying notes are an integral part of these financial statements.
16 | Wells Fargo Adjustable Rate Government Fund
Portfolio of investments—August 31, 2019
| | | | | | | | | | | | | | | | |
| | | Interest
rate | | | Maturity
date | | | Principal | | | Value | |
| Agency Securities (continued) | |
| | | | |
FNMA (12 Month Treasury Average +1.98%)± | | | 4.50 | % | | | 11-1-2035 | | | $ | 771,481 | | | $ | 791,112 | |
| | | | |
FNMA (1 Year Treasury Constant Maturity +2.05%)± | | | 4.50 | | | | 12-1-2033 | | | | 533,905 | | | | 555,228 | |
| | | | |
FNMA (1 Year Treasury Constant Maturity +2.18%)± | | | 4.51 | | | | 9-1-2035 | | | | 934,601 | | | | 984,162 | |
| | | | |
FNMA (1 Year Treasury Constant Maturity +1.89%)± | | | 4.52 | | | | 6-1-2032 | | | | 55,739 | | | | 56,011 | |
| | | | |
FNMA (1 Year Treasury Constant Maturity +2.28%)± | | | 4.53 | | | | 9-1-2026 | | | | 29,817 | | | | 30,301 | |
| | | | |
FNMA (6 Month LIBOR +1.74%)± | | | 4.53 | | | | 4-1-2033 | | | | 304,369 | | | | 317,858 | |
| | | | |
FNMA (1 Year Treasury Constant Maturity +2.14%)± | | | 4.53 | | | | 10-1-2033 | | | | 195,664 | | | | 205,699 | |
| | | | |
FNMA (12 Month Treasury Average +2.00%)± | | | 4.53 | | | | 10-1-2035 | | | | 391,202 | | | | 405,827 | |
| | | | |
FNMA (12 Month LIBOR +1.63%)± | | | 4.54 | | | | 1-1-2040 | | | | 191,820 | | | | 201,243 | |
| | | | |
FNMA (1 Year Treasury Constant Maturity +2.29%)± | | | 4.54 | | | | 12-1-2030 | | | | 19,861 | | | | 20,226 | |
| | | | |
FNMA (12 Month LIBOR +1.67%)± | | | 4.54 | | | | 9-1-2034 | | | | 820,202 | | | | 862,372 | |
| | | | |
FNMA (1 Year Treasury Constant Maturity +2.05%)± | | | 4.55 | | | | 9-1-2035 | | | | 1,345,057 | | | | 1,413,467 | |
| | | | |
FNMA (6 Month LIBOR +1.93%)± | | | 4.55 | | | | 6-1-2032 | | | | 65,607 | | | | 66,313 | |
| | | | |
FNMA (12 Month LIBOR +1.68%)± | | | 4.55 | | | | 9-1-2038 | | | | 578,779 | | | | 607,110 | |
| | | | |
FNMA (1 Year Treasury Constant Maturity +2.12%)± | | | 4.55 | | | | 10-1-2035 | | | | 131,243 | | | | 137,864 | |
| | | | |
FNMA (12 Month LIBOR +1.91%)± | | | 4.56 | | | | 8-1-2034 | | | | 1,348,534 | | | | 1,426,654 | |
| | | | |
FNMA (12 Month LIBOR +1.67%)± | | | 4.56 | | | | 11-1-2038 | | | | 283,862 | | | | 297,991 | |
| | | | |
FNMA (1 Year Treasury Constant Maturity +2.11%)± | | | 4.56 | | | | 9-1-2036 | | | | 313,896 | | | | 326,467 | |
| | | | |
FNMA (1 Year Treasury Constant Maturity +2.19%)± | | | 4.57 | | | | 8-1-2033 | | | | 506,389 | | | | 531,806 | |
| | | | |
FNMA (1 Year Treasury Constant Maturity +2.25%)± | | | 4.57 | | | | 10-1-2029 | | | | 63,651 | | | | 65,021 | |
| | | | |
FNMA (1 Year Treasury Constant Maturity +2.18%)± | | | 4.57 | | | | 9-1-2036 | | | | 394,347 | | | | 418,759 | |
| | | | |
FNMA (12 Month Treasury Average +2.07%)± | | | 4.57 | | | | 1-1-2035 | | | | 313,350 | | | | 317,813 | |
| | | | |
FNMA (1 Year Treasury Constant Maturity +2.08%)± | | | 4.58 | | | | 11-1-2035 | | | | 435,359 | | | | 456,101 | |
| | | | |
FNMA (1 Year Treasury Constant Maturity +2.21%)± | | | 4.58 | | | | 8-1-2035 | | | | 796,222 | | | | 845,458 | |
| | | | |
FNMA (12 Month LIBOR +1.70%)± | | | 4.58 | | | | 8-1-2036 | | | | 469,794 | | | | 492,717 | |
| | | | |
FNMA (12 Month LIBOR +1.75%)± | | | 4.58 | | | | 7-1-2035 | | | | 464,057 | | | | 488,756 | |
| | | | |
FNMA (1 Year Treasury Constant Maturity +2.21%)± | | | 4.59 | | | | 7-1-2033 | | | | 47,869 | | | | 50,500 | |
| | | | |
FNMA (1 Year Treasury Constant Maturity +2.21%)± | | | 4.59 | | | | 7-1-2035 | | | | 300,309 | | | | 318,857 | |
| | | | |
FNMA (1 Year Treasury Constant Maturity +2.12%)± | | | 4.59 | | | | 4-1-2040 | | | | 105,741 | | | | 111,185 | |
| | | | |
FNMA (12 Month LIBOR +1.72%)± | | | 4.59 | | | | 6-1-2035 | | | | 138,767 | | | | 146,263 | |
| | | | |
FNMA (1 Year Treasury Constant Maturity +2.03%)± | | | 4.60 | | | | 12-1-2032 | | | | 504,096 | | | | 523,367 | |
| | | | |
FNMA (1 Year Treasury Constant Maturity +2.22%)± | | | 4.60 | | | | 6-1-2026 | | | | 7,148 | | | | 7,326 | |
| | | | |
FNMA (1 Year Treasury Constant Maturity +2.22%)± | | | 4.60 | | | | 7-1-2035 | | | | 133,048 | | | | 140,670 | |
| | | | |
FNMA (1 Year Treasury Constant Maturity +2.22%)± | | | 4.60 | | | | 7-1-2035 | | | | 524,792 | | | | 554,599 | |
| | | | |
FNMA (1 Year Treasury Constant Maturity +2.13%)± | | | 4.60 | | | | 1-1-2037 | | | | 665,093 | | | | 700,228 | |
| | | | |
FNMA (1 Year Treasury Constant Maturity +2.04%)± | | | 4.61 | | | | 6-1-2034 | | | | 457,536 | | | | 480,678 | |
| | | | |
FNMA (1 Year Treasury Constant Maturity +2.18%)± | | | 4.61 | | | | 6-1-2035 | | | | 239,550 | | | | 252,343 | |
| | | | |
FNMA (12 Month LIBOR +1.82%)± | | | 4.61 | | | | 4-1-2035 | | | | 795,428 | | | | 837,336 | |
| | | | |
FNMA (12 Month LIBOR +1.71%)± | | | 4.62 | | | | 2-1-2038 | | | | 406,158 | | | | 426,498 | |
| | | | |
FNMA (1 Year Treasury Constant Maturity +2.18%)± | | | 4.62 | | | | 11-1-2038 | | | | 453,841 | | | | 479,313 | |
| | | | |
FNMA (1 Year Treasury Constant Maturity +2.12%)± | | | 4.62 | | | | 5-1-2034 | | | | 409,435 | | | | 426,277 | |
| | | | |
FNMA (12 Month LIBOR +1.74%)± | | | 4.62 | | | | 5-1-2032 | | | | 158,034 | | | | 160,330 | |
| | | | |
FNMA (1 Year Treasury Constant Maturity +2.22%)± | | | 4.62 | | | | 10-1-2034 | | | | 136,237 | | | | 144,029 | |
| | | | |
FNMA (1 Year Treasury Constant Maturity +2.12%)± | | | 4.62 | | | | 3-1-2031 | | | | 30,805 | | | | 30,905 | |
| | | | |
FNMA (12 Month LIBOR +1.79%)± | | | 4.62 | | | | 6-1-2036 | | | | 232,871 | | | | 246,198 | |
| | | | |
FNMA (12 Month Treasury Average +2.48%)± | | | 4.62 | | | | 6-1-2040 | | | | 694,054 | | | | 714,279 | |
| | | | |
FNMA (12 Month LIBOR +1.71%)± | | | 4.62 | | | | 3-1-2037 | | | | 288,590 | | | | 304,651 | |
| | | | |
FNMA (1 Year Treasury Constant Maturity +2.13%)± | | | 4.63 | | | | 5-1-2033 | | | | 336,031 | | | | 348,697 | |
| | | | |
FNMA (1 Year Treasury Constant Maturity +2.33%)± | | | 4.63 | | | | 11-1-2024 | | | | 55,369 | | | | 56,892 | |
| | | | |
FNMA (1 Year Treasury Constant Maturity +2.13%)± | | | 4.63 | | | | 5-1-2033 | | | | 338,498 | | | | 356,176 | |
| | | | |
FNMA (1 Year Treasury Constant Maturity +2.21%)± | | | 4.63 | | | | 9-1-2022 | | | | 59,022 | | | | 59,499 | |
The accompanying notes are an integral part of these financial statements.
Wells Fargo Adjustable Rate Government Fund | 17
Portfolio of investments—August 31, 2019
| | | | | | | | | | | | | | | | |
| | | Interest
rate | | | Maturity
date | | | Principal | | | Value | |
| Agency Securities (continued) | |
| | | | |
FNMA (12 Month LIBOR +1.70%)± | | | 4.63 | % | | | 4-1-2034 | | | $ | 454,696 | | | $ | 476,772 | |
| | | | |
FNMA (12 Month LIBOR +1.72%)± | | | 4.64 | | | | 12-1-2033 | | | | 836,609 | | | | 878,907 | |
| | | | |
FNMA (US Treasury H15 Treasury Bill 6 Month Auction High Discount +2.23%)± | | | 4.64 | | | | 7-1-2025 | | | | 1,207 | | | | 1,227 | |
| | | | |
FNMA (12 Month LIBOR +1.90%)± | | | 4.64 | | | | 10-1-2034 | | | | 404,468 | | | | 425,453 | |
| | | | |
FNMA (1 Year Treasury Constant Maturity +2.20%)± | | | 4.64 | | | | 7-1-2029 | | | | 372,583 | | | | 392,923 | |
| | | | |
FNMA (1 Year Treasury Constant Maturity +2.18%)± | | | 4.64 | | | | 1-1-2036 | | | | 537,272 | | | | 567,476 | |
| | | | |
FNMA (1 Year Treasury Constant Maturity +2.10%)± | | | 4.65 | | | | 5-1-2034 | | | | 510,630 | | | | 531,052 | |
| | | | |
FNMA (6 Month LIBOR +2.00%)± | | | 4.65 | | | | 10-1-2024 | | | | 53,198 | | | | 54,206 | |
| | | | |
FNMA (1 Year Treasury Constant Maturity +2.17%)± | | | 4.65 | | | | 12-1-2034 | | | | 853,658 | | | | 896,340 | |
| | | | |
FNMA (12 Month LIBOR +1.65%)± | | | 4.65 | | | | 12-1-2033 | | | | 873,015 | | | | 907,504 | |
| | | | |
FNMA (1 Year Treasury Constant Maturity +2.21%)± | | | 4.66 | | | | 6-1-2027 | | | | 68,976 | | | | 70,502 | |
| | | | |
FNMA (1 Year Treasury Constant Maturity +2.09%)± | | | 4.66 | | | | 1-1-2036 | | | | 98,539 | | | | 103,612 | |
| | | | |
FNMA (1 Year Treasury Constant Maturity +2.21%)± | | | 4.66 | | | | 1-1-2027 | | | | 251,570 | | | | 253,778 | |
| | | | |
FNMA (1 Year Treasury Constant Maturity +2.20%)± | | | 4.66 | | | | 9-1-2035 | | | | 318,294 | | | | 337,354 | |
| | | | |
FNMA (12 Month LIBOR +1.75%)± | | | 4.67 | | | | 4-1-2034 | | | | 264,633 | | | | 277,738 | |
| | | | |
FNMA (1 Year Treasury Constant Maturity +2.18%)± | | | 4.67 | | | | 9-1-2035 | | | | 126,275 | | | | 133,286 | |
| | | | |
FNMA (1 Year Treasury Constant Maturity +2.29%)± | | | 4.67 | | | | 6-1-2037 | | | | 372,084 | | | | 390,402 | |
| | | | |
FNMA (1 Year Treasury Constant Maturity +2.17%)± | | | 4.67 | | | | 12-1-2039 | | | | 181,096 | | | | 185,858 | |
| | | | |
FNMA (6 Month LIBOR +2.44%)± | | | 4.67 | | | | 1-1-2033 | | | | 88,263 | | | | 90,158 | |
| | | | |
FNMA (1 Year Treasury Constant Maturity +2.19%)± | | | 4.67 | | | | 2-1-2036 | | | | 482,214 | | | | 508,908 | |
| | | | |
FNMA (1 Year Treasury Constant Maturity +2.18%)± | | | 4.68 | | | | 12-1-2035 | | | | 258,651 | | | | 272,532 | |
| | | | |
FNMA (1 Year Treasury Constant Maturity +2.15%)± | | | 4.68 | | | | 5-1-2035 | | | | 458,496 | | | | 482,611 | |
| | | | |
FNMA (1 Year Treasury Constant Maturity +2.20%)± | | | 4.68 | | | | 6-1-2033 | | | | 342,152 | | | | 356,901 | |
| | | | |
FNMA (1 Year Treasury Constant Maturity +2.20%)± | | | 4.68 | | | | 10-1-2036 | | | | 514,543 | | | | 542,042 | |
| | | | |
FNMA (1 Year Treasury Constant Maturity +2.19%)± | | | 4.68 | | | | 1-1-2033 | | | | 1,431,022 | | | | 1,476,026 | |
| | | | |
FNMA (1 Year Treasury Constant Maturity +2.30%)± | | | 4.68 | | | | 2-1-2033 | | | | 76,762 | | | | 78,581 | |
| | | | |
FNMA (1 Year Treasury Constant Maturity +2.19%)± | | | 4.68 | | | | 7-1-2035 | | | | 857,508 | | | | 894,192 | |
| | | | |
FNMA (1 Year Treasury Constant Maturity +2.22%)± | | | 4.68 | | | | 12-1-2040 | | | | 651,261 | | | | 687,703 | |
| | | | |
FNMA (1 Year Treasury Constant Maturity +2.23%)± | | | 4.69 | | | | 1-1-2035 | | | | 386,106 | | | | 407,927 | |
| | | | |
FNMA (1 Year Treasury Constant Maturity +2.18%)± | | | 4.69 | | | | 5-1-2035 | | | | 136,296 | | | | 144,151 | |
| | | | |
FNMA (1 Year Treasury Constant Maturity +2.19%)± | | | 4.69 | | | | 6-1-2036 | | | | 877,405 | | | | 924,450 | |
| | | | |
FNMA (12 Month LIBOR +1.75%)± | | | 4.69 | | | | 5-1-2035 | | | | 653,864 | | | | 688,254 | |
| | | | |
FNMA (1 Year Treasury Constant Maturity +2.28%)± | | | 4.69 | | | | 4-1-2024 | | | | 26,867 | | | | 27,163 | |
| | | | |
FNMA (1 Year Treasury Constant Maturity +2.38%)± | | | 4.69 | | | | 7-1-2027 | | | | 78,785 | | | | 80,737 | |
| | | | |
FNMA (1 Year Treasury Constant Maturity +2.25%)± | | | 4.69 | | | | 1-1-2037 | | | | 1,007,225 | | | | 1,063,922 | |
| | | | |
FNMA (1 Year Treasury Constant Maturity +2.23%)± | | | 4.69 | | | | 7-1-2037 | | | | 357,435 | | | | 378,600 | |
| | | | |
FNMA (1 Year Treasury Constant Maturity +2.24%)± | | | 4.69 | | | | 12-1-2040 | | | | 454,930 | | | | 480,449 | |
| | | | |
FNMA (1 Year Treasury Constant Maturity +2.18%)± | | | 4.69 | | | | 12-1-2040 | | | | 219,924 | | | | 231,821 | |
| | | | |
FNMA (1 Year Treasury Constant Maturity +2.18%)± | | | 4.70 | | | | 12-1-2034 | | | | 414,089 | | | | 434,696 | |
| | | | |
FNMA (1 Year Treasury Constant Maturity +2.20%)± | | | 4.70 | | | | 11-1-2035 | | | | 910,759 | | | | 960,886 | |
| | | | |
FNMA (12 Month LIBOR +1.87%)± | | | 4.70 | | | | 5-1-2038 | | | | 567,089 | | | | 601,907 | |
| | | | |
FNMA (1 Year Treasury Constant Maturity +2.21%)± | | | 4.70 | | | | 6-1-2035 | | | | 514,915 | | | | 544,406 | |
| | | | |
FNMA (1 Year Treasury Constant Maturity +2.30%)± | | | 4.70 | | | | 9-1-2030 | | | | 83,942 | | | | 84,962 | |
| | | | |
FNMA (1 Year Treasury Constant Maturity +2.22%)± | | | 4.70 | | | | 2-1-2034 | | | | 1,103,881 | | | | 1,155,710 | |
| | | | |
FNMA (1 Year Treasury Constant Maturity +2.22%)± | | | 4.71 | | | | 5-1-2033 | | | | 1,002,615 | | | | 1,045,117 | |
| | | | |
FNMA (1 Year Treasury Constant Maturity +2.22%)± | | | 4.71 | | | | 8-1-2026 | | | | 234,561 | | | | 243,292 | |
| | | | |
FNMA (12 Month LIBOR +1.84%)± | | | 4.71 | | | | 6-1-2041 | | | | 571,009 | | | | 599,211 | |
| | | | |
FNMA (1 Year Treasury Constant Maturity +2.25%)± | | | 4.71 | | | | 5-1-2034 | | | | 229,120 | | | | 241,800 | |
| | | | |
FNMA (12 Month LIBOR +1.80%)± | | | 4.72 | | | | 5-1-2033 | | | | 290,949 | | | | 305,881 | |
| | | | |
FNMA (1 Year Treasury Constant Maturity +2.22%)± | | | 4.72 | | | | 6-1-2035 | | | | 356,083 | | | | 376,015 | |
| | | | |
FNMA (1 Year Treasury Constant Maturity +2.21%)± | | | 4.72 | | | | 5-1-2037 | | | | 767,251 | | | | 801,387 | |
The accompanying notes are an integral part of these financial statements.
18 | Wells Fargo Adjustable Rate Government Fund
Portfolio of investments—August 31, 2019
| | | | | | | | | | | | | | | | |
| | | Interest
rate | | | Maturity
date | | | Principal | | | Value | |
| Agency Securities (continued) | |
| | | | |
FNMA (1 Year Treasury Constant Maturity +2.35%)± | | | 4.73 | % | | | 6-1-2030 | | | $ | 48,341 | | | $ | 49,275 | |
| | | | |
FNMA (1 Year Treasury Constant Maturity +2.15%)± | | | 4.73 | | | | 4-1-2033 | | | | 768,913 | | | | 812,048 | |
| | | | |
FNMA (1 Year Treasury Constant Maturity +2.24%)± | | | 4.73 | | | | 12-1-2040 | | | | 1,129,493 | | | | 1,194,431 | |
| | | | |
FNMA (12 Month LIBOR +2.00%)± | | | 4.73 | | | | 9-1-2035 | | | | 390,775 | | | | 414,689 | |
| | | | |
FNMA (12 Month LIBOR +1.75%)± | | | 4.73 | | | | 6-1-2041 | | | | 395,976 | | | | 413,166 | |
| | | | |
FNMA (1 Year Treasury Constant Maturity +2.23%)± | | | 4.74 | | | | 5-1-2033 | | | | 195,745 | | | | 202,583 | |
| | | | |
FNMA (1 Year Treasury Constant Maturity +2.22%)± | | | 4.74 | | | | 6-1-2036 | | | | 559,227 | | | | 589,661 | |
| | | | |
FNMA (1 Year Treasury Constant Maturity +2.27%)± | | | 4.74 | | | | 6-1-2036 | | | | 122,863 | | | | 130,349 | |
| | | | |
FNMA (1 Year Treasury Constant Maturity +2.32%)± | | | 4.74 | | | | 10-1-2034 | | | | 144,397 | | | | 153,179 | |
| | | | |
FNMA (1 Year Treasury Constant Maturity +2.26%)± | | | 4.74 | | | | 1-1-2038 | | | | 434,064 | | | | 459,116 | |
| | | | |
FNMA (1 Year Treasury Constant Maturity +2.22%)± | | | 4.74 | | | | 4-1-2038 | | | | 609,501 | | | | 642,005 | |
| | | | |
FNMA (1 Year Treasury Constant Maturity +2.24%)± | | | 4.74 | | | | 7-1-2028 | | | | 103 | | | | 107 | |
| | | | |
FNMA (1 Year Treasury Constant Maturity +2.23%)± | | | 4.74 | | | | 11-1-2037 | | | | 475,796 | | | | 502,584 | |
| | | | |
FNMA (12 Month LIBOR +1.75%)± | | | 4.75 | | | | 4-1-2033 | | | | 342,644 | | | | 355,767 | |
| | | | |
FNMA (12 Month LIBOR +1.82%)± | | | 4.76 | | | | 12-1-2046 | | | | 292,459 | | | | 309,013 | |
| | | | |
FNMA (1 Year Treasury Constant Maturity +2.19%)± | | | 4.76 | | | | 12-1-2032 | | | | 396,305 | | | | 417,287 | |
| | | | |
FNMA (1 Year Treasury Constant Maturity +2.28%)± | | | 4.76 | | | | 4-1-2024 | | | | 8,319 | | | | 8,540 | |
| | | | |
FNMA (1 Year Treasury Constant Maturity +2.26%)± | | | 4.76 | | | | 5-1-2035 | | | | 404,015 | | | | 424,530 | |
| | | | |
FNMA (1 Year Treasury Constant Maturity +2.37%)± | | | 4.76 | | | | 9-1-2030 | | | | 606,023 | | | | 643,119 | |
| | | | |
FNMA (1 Year Treasury Constant Maturity +2.23%)± | | | 4.76 | | | | 5-1-2035 | | | | 864,128 | | | | 910,855 | |
| | | | |
FNMA (1 Year Treasury Constant Maturity +2.21%)± | | | 4.76 | | | | 12-1-2036 | | | | 360,213 | | | | 380,128 | |
| | | | |
FNMA (1 Year Treasury Constant Maturity +2.21%)± | | | 4.77 | | | | 6-1-2033 | | | | 242,222 | | | | 252,073 | |
| | | | |
FNMA (1 Year Treasury Constant Maturity +2.24%)± | | | 4.77 | | | | 10-1-2035 | | | | 675,910 | | | | 712,872 | |
| | | | |
FNMA (1 Year Treasury Constant Maturity +2.19%)± | | | 4.77 | | | | 5-1-2036 | | | | 558,303 | | | | 588,312 | |
| | | | |
FNMA (1 Year Treasury Constant Maturity +2.24%)± | | | 4.77 | | | | 4-1-2033 | | | | 369,511 | | | | 390,041 | |
| | | | |
FNMA (12 Month LIBOR +1.75%)± | | | 4.77 | | | | 1-1-2035 | | | | 436,152 | | | | 457,875 | |
| | | | |
FNMA (12 Month LIBOR +1.90%)± | | | 4.78 | | | | 5-1-2037 | | | | 1,258,621 | | | | 1,336,685 | |
| | | | |
FNMA (1 Year Treasury Constant Maturity +2.36%)± | | | 4.78 | | | | 11-1-2034 | | | | 308,480 | | | | 326,947 | |
| | | | |
FNMA (12 Month Treasury Average +2.26%)± | | | 4.79 | | | | 9-1-2036 | | | | 340,609 | | | | 349,991 | |
| | | | |
FNMA (12 Month LIBOR +1.83%)± | | | 4.79 | | | | 1-1-2033 | | | | 435,579 | | | | 455,800 | |
| | | | |
FNMA (1 Year Treasury Constant Maturity +2.22%)± | | | 4.79 | | | | 4-1-2033 | | | | 611,479 | | | | 636,153 | |
| | | | |
FNMA (1 Year Treasury Constant Maturity +2.25%)± | | | 4.79 | | | | 5-1-2036 | | | | 1,229,444 | | | | 1,283,687 | |
| | | | |
FNMA (1 Year Treasury Constant Maturity +2.25%)± | | | 4.80 | | | | 7-1-2030 | | | | 357,626 | | | | 373,434 | |
| | | | |
FNMA (1 Year Treasury Constant Maturity +2.31%)± | | | 4.80 | | | | 12-1-2034 | | | | 648,306 | | | | 684,860 | |
| | | | |
FNMA (1 Year Treasury Constant Maturity +2.18%)± | | | 4.80 | | | | 12-1-2024 | | | | 20,760 | | | | 20,962 | |
| | | | |
FNMA (1 Year Treasury Constant Maturity +2.28%)± | | | 4.80 | | | | 10-1-2036 | | | | 451,782 | | | | 477,652 | |
| | | | |
FNMA (1 Year Treasury Constant Maturity +2.22%)± | | | 4.81 | | | | 9-1-2033 | | | | 399,298 | | | | 418,772 | |
| | | | |
FNMA (1 Year Treasury Constant Maturity +2.32%)± | | | 4.82 | | | | 5-1-2025 | | | | 28,259 | | | | 28,417 | |
| | | | |
FNMA (12 Month Treasury Average +2.31%)± | | | 4.82 | | | | 9-1-2036 | | | | 372,261 | | | | 389,883 | |
| | | | |
FNMA (1 Year Treasury Constant Maturity +2.35%)± | | | 4.82 | | | | 7-1-2028 | | | | 429,657 | | | | 445,441 | |
| | | | |
FNMA (1 Year Treasury Constant Maturity +2.31%)± | | | 4.82 | | | | 5-1-2035 | | | | 707,964 | | | | 748,848 | |
| | | | |
FNMA (1 Year Treasury Constant Maturity +2.33%)± | | | 4.83 | | | | 9-1-2037 | | | | 523,145 | | | | 558,723 | |
| | | | |
FNMA (12 Month Treasury Average +2.28%)± | | | 4.83 | | | | 8-1-2035 | | | | 543,923 | | | | 557,558 | |
| | | | |
FNMA (1 Year Treasury Constant Maturity +2.35%)± | | | 4.83 | | | | 12-1-2030 | | | | 620,612 | | | | 649,031 | |
| | | | |
FNMA (1 Year Treasury Constant Maturity +2.35%)± | | | 4.83 | | | | 1-1-2029 | | | | 165,775 | | | | 171,887 | |
| | | | |
FNMA (1 Year Treasury Constant Maturity +2.19%)± | | | 4.83 | | | | 2-1-2035 | | | | 136,289 | | | | 143,315 | |
| | | | |
FNMA (1 Year Treasury Constant Maturity +2.33%)± | | | 4.83 | | | | 4-1-2036 | | | | 394,256 | | | | 418,002 | |
| | | | |
FNMA (1 Year Treasury Constant Maturity +2.47%)± | | | 4.84 | | | | 9-1-2028 | | | | 36,150 | | | | 36,941 | |
| | | | |
FNMA (1 Year Treasury Constant Maturity +2.22%)± | | | 4.84 | | | | 5-1-2033 | | | | 162,441 | | | | 171,205 | |
| | | | |
FNMA (1 Year Treasury Constant Maturity +2.41%)± | | | 4.84 | | | | 9-1-2033 | | | | 460,879 | | | | 487,625 | |
| | | | |
FNMA (1 Year Treasury Constant Maturity +2.22%)± | | | 4.85 | | | | 8-1-2031 | | | | 101,749 | | | | 103,890 | |
| | | | |
FNMA (1 Year Treasury Constant Maturity +2.34%)± | | | 4.85 | | | | 1-1-2037 | | | | 615,554 | | | | 654,388 | |
The accompanying notes are an integral part of these financial statements.
Wells Fargo Adjustable Rate Government Fund | 19
Portfolio of investments—August 31, 2019
| | | | | | | | | | | | | | | | |
| | | Interest
rate | | | Maturity
date | | | Principal | | | Value | |
| Agency Securities (continued) | |
| | | | |
FNMA (6 Month LIBOR +1.98%)± | | | 4.85 | % | | | 9-1-2033 | | | $ | 52,439 | | | $ | 52,881 | |
| | | | |
FNMA (1 Year Treasury Constant Maturity +2.35%)± | | | 4.85 | | | | 6-1-2027 | | | | 63,487 | | | | 64,533 | |
| | | | |
FNMA (12 Month Treasury Average +2.35%)± | | | 4.86 | | | | 8-1-2040 | | | | 417,369 | | | | 427,774 | |
| | | | |
FNMA (1 Year Treasury Constant Maturity +2.29%)± | | | 4.86 | | | | 1-1-2031 | | | | 291,082 | | | | 307,426 | |
| | | | |
FNMA (1 Year Treasury Constant Maturity +2.25%)± | | | 4.87 | | | | 6-1-2027 | | | | 638 | | | | 654 | |
| | | | |
FNMA (1 Year Treasury Constant Maturity +2.37%)± | | | 4.87 | | | | 7-1-2027 | | | | 19,171 | | | | 19,350 | |
| | | | |
FNMA (12 Month Treasury Average +2.37%)± | | | 4.89 | | | | 5-1-2036 | | | | 306,849 | | | | 322,819 | |
| | | | |
FNMA (1 Year Treasury Constant Maturity +2.50%)± | | | 4.89 | | | | 9-1-2030 | | | | 443,041 | | | | 463,360 | |
| | | | |
FNMA (3 Year Treasury Constant Maturity +2.15%)± | | | 4.90 | | | | 8-1-2031 | | | | 32,426 | | | | 32,915 | |
| | | | |
FNMA (1 Year Treasury Constant Maturity +2.30%)± | | | 4.90 | | | | 1-1-2026 | | | | 165,065 | | | | 169,923 | |
| | | | |
FNMA (1 Year Treasury Constant Maturity +2.19%)± | | | 4.90 | | | | 3-1-2035 | | | | 419,076 | | | | 438,663 | |
| | | | |
FNMA (6 Month LIBOR +1.88%)± | | | 4.91 | | | | 2-1-2033 | | | | 299,734 | | | | 309,922 | |
| | | | |
FNMA (1 Year Treasury Constant Maturity +2.18%)± | | | 4.93 | | | | 1-1-2035 | | | | 80,807 | | | | 83,998 | |
| | | | |
FNMA (1 Year Treasury Constant Maturity +2.45%)± | | | 4.93 | | | | 7-1-2037 | | | | 1,584,642 | | | | 1,688,465 | |
| | | | |
FNMA (1 Year Treasury Constant Maturity +2.23%)± | | | 4.93 | | | | 1-1-2032 | | | | 7,320 | | | | 7,405 | |
| | | | |
FNMA (1 Year Treasury Constant Maturity +2.43%)± | | | 4.93 | | | | 7-1-2037 | | | | 393,852 | | | | 411,689 | |
| | | | |
FNMA (1 Year Treasury Constant Maturity +2.35%)± | | | 4.93 | | | | 3-1-2033 | | | | 749,308 | | | | 793,609 | |
| | | | |
FNMA (1 Year Treasury Constant Maturity +2.32%)± | | | 4.95 | | | | 1-1-2028 | | | | 1,380 | | | | 1,386 | |
| | | | |
FNMA (1 Year Treasury Constant Maturity +2.32%)± | | | 4.95 | | | | 4-1-2028 | | | | 117,208 | | | | 121,029 | |
| | | | |
FNMA (1 Year Treasury Constant Maturity +2.32%)± | | | 4.95 | | | | 6-1-2032 | | | | 19,263 | | | | 19,471 | |
| | | | |
FNMA (1 Year Treasury Constant Maturity +2.47%)± | | | 4.97 | | | | 9-1-2035 | | | | 40,064 | | | | 42,621 | |
| | | | |
FNMA (1 Year Treasury Constant Maturity +2.41%)± | | | 5.00 | | | | 5-1-2027 | | | | 51,074 | | | | 52,984 | |
| | | | |
FNMA (1 Year Treasury Constant Maturity +2.50%)± | | | 5.00 | | | | 3-1-2027 | | | | 71,248 | | | | 73,307 | |
| | | | |
FNMA (6 Month LIBOR +2.25%)± | | | 5.01 | | | | 3-1-2034 | | | | 985,222 | | | | 1,038,640 | |
| | | | |
FNMA (1 Year Treasury Constant Maturity +2.52%)± | | | 5.02 | | | | 11-1-2024 | | | | 51,009 | | | | 51,214 | |
| | | | |
FNMA (1 Year Treasury Constant Maturity +2.60%)± | | | 5.02 | | | | 10-1-2025 | | | | 6,764 | | | | 6,850 | |
| | | | |
FNMA (1 Year Treasury Constant Maturity +2.28%)± | | | 5.03 | | | | 7-1-2024 | | | | 7,837 | | | | 7,944 | |
| | | | |
FNMA (1 Year Treasury Constant Maturity +2.28%)± | | | 5.03 | | | | 2-1-2037 | | | | 658,251 | | | | 697,930 | |
| | | | |
FNMA (1 Year Treasury Constant Maturity +2.31%)± | | | 5.05 | | | | 2-1-2035 | | | | 452,332 | | | | 478,005 | |
| | | | |
FNMA (1 Year Treasury Constant Maturity +2.49%)± | | | 5.07 | | | | 5-1-2035 | | | | 1,001,605 | | | | 1,065,968 | |
| | | | |
FNMA (1 Year Treasury Constant Maturity +2.32%)± | | | 5.07 | | | | 4-1-2038 | | | | 276,429 | | | | 287,952 | |
| | | | |
FNMA (1 Year Treasury Constant Maturity +2.50%)± | | | 5.08 | | | | 10-1-2029 | | | | 284,192 | | | | 297,149 | |
| | | | |
FNMA (1 Year Treasury Constant Maturity +2.64%)± | | | 5.08 | | | | 7-1-2028 | | | | 90,714 | | | | 92,722 | |
| | | | |
FNMA (6 Month LIBOR +2.48%)± | | | 5.11 | | | | 7-1-2033 | | | | 33,318 | | | | 33,574 | |
| | | | |
FNMA (1 Year Treasury Constant Maturity +2.64%)± | | | 5.13 | | | | 3-1-2030 | | | | 5,408 | | | | 5,534 | |
| | | | |
FNMA (6 Month LIBOR +2.62%)± | | | 5.14 | | | | 4-1-2033 | | | | 221,581 | | | | 229,954 | |
| | | | |
FNMA (1 Year Treasury Constant Maturity +2.40%)± | | | 5.15 | | | | 6-1-2024 | | | | 30,084 | | | | 30,418 | |
| | | | |
FNMA (1 Year Treasury Constant Maturity +2.51%)± | | | 5.17 | | | | 8-1-2035 | | | | 230,212 | | | | 240,401 | |
| | | | |
FNMA (1 Year Treasury Constant Maturity +2.58%)± | | | 5.19 | | | | 3-1-2032 | | | | 109,434 | | | | 112,833 | |
| | | | |
FNMA (1 Year Treasury Constant Maturity +2.69%)± | | | 5.19 | | | | 5-1-2035 | | | | 562,874 | | | | 601,558 | |
| | | | |
FNMA (1 Year Treasury Constant Maturity +2.64%)± | | | 5.19 | | | | 10-1-2028 | | | | 104,670 | | | | 107,480 | |
| | | | |
FNMA (1 Year Treasury Constant Maturity +2.60%)± | | | 5.22 | | | | 2-1-2028 | | | | 33,012 | | | | 33,357 | |
| | | | |
FNMA (1 Year Treasury Constant Maturity +2.83%)± | | | 5.24 | | | | 9-1-2030 | | | | 182,298 | | | | 192,569 | |
| | | | |
FNMA (1 Year Treasury Constant Maturity +2.50%)± | | | 5.25 | | | | 6-1-2032 | | | | 83,685 | | | | 85,092 | |
| | | | |
FNMA (6 Month LIBOR +2.72%)± | | | 5.42 | | | | 5-1-2033 | | | | 936,489 | | | | 1,006,318 | |
| | | | |
FNMA (6 Month LIBOR +2.66%)± | | | 5.43 | | | | 4-1-2024 | | | | 143,904 | | | | 150,446 | |
| | | | |
FNMA (1 Year Treasury Constant Maturity +2.87%)± | | | 5.50 | | | | 8-1-2030 | | | | 74,946 | | | | 75,600 | |
| | | | |
FNMA (6 Month LIBOR +2.70%)± | | | 5.55 | | | | 1-1-2033 | | | | 59,171 | | | | 60,111 | |
| | | | |
FNMA (6 Month LIBOR +3.11%)± | | | 5.66 | | | | 9-1-2033 | | | | 36,620 | | | | 37,056 | |
| | | | |
FNMA (1 Year Treasury Constant Maturity +1.75%)± | | | 6.00 | | | | 1-1-2020 | | | | 244 | | | | 244 | |
| | | | |
FNMA (6 Month LIBOR +3.47%)± | | | 6.16 | | | | 12-1-2032 | | | | 142,346 | | | | 146,746 | |
| | | | |
FNMA (6 Month LIBOR +3.57%)± | | | 6.45 | | | | 11-1-2031 | | | | 10,679 | | | | 10,670 | |
The accompanying notes are an integral part of these financial statements.
20 | Wells Fargo Adjustable Rate Government Fund
Portfolio of investments—August 31, 2019
| | | | | | | | | | | | | | | | |
| | | Interest
rate | | | Maturity
date | | | Principal | | | Value | |
| Agency Securities (continued) | |
| | | | |
FNMA | | | 6.50 | % | | | 8-1-2028 | | | $ | 45,276 | | | $ | 46,262 | |
| | | | |
FNMA | | | 6.50 | | | | 5-1-2031 | | | | 88,237 | | | | 98,162 | |
| | | | |
FNMA | | | 7.06 | | | | 11-1-2024 | | | | 3,985 | | | | 3,988 | |
| | | | |
FNMA | | | 7.06 | | | | 12-1-2024 | | | | 20,653 | | | | 20,717 | |
| | | | |
FNMA | | | 7.06 | | | | 3-1-2025 | | | | 36,658 | | | | 36,898 | |
| | | | |
FNMA | | | 7.06 | | | | 3-1-2025 | | | | 846 | | | | 846 | |
| | | | |
FNMA | | | 7.06 | | | | 1-1-2027 | | | | 21,544 | | | | 21,557 | |
| | | | |
FNMA | | | 7.50 | | | | 1-1-2031 | | | | 48,491 | | | | 52,240 | |
| | | | |
FNMA | | | 7.50 | | | | 1-1-2033 | | | | 196,374 | | | | 216,244 | |
| | | | |
FNMA | | | 7.50 | | | | 5-1-2033 | | | | 104,330 | | | | 112,856 | |
| | | | |
FNMA | | | 7.50 | | | | 5-1-2033 | | | | 129,396 | | | | 139,832 | |
| | | | |
FNMA | | | 7.50 | | | | 6-1-2033 | | | | 23,743 | | | | 23,875 | |
| | | | |
FNMA | | | 7.50 | | | | 7-1-2033 | | | | 38,275 | | | | 38,559 | |
| | | | |
FNMA | | | 7.50 | | | | 8-1-2033 | | | | 51,084 | | | | 53,306 | |
| | | | |
FNMA | | | 8.00 | | | | 12-1-2026 | | | | 51,014 | | | | 55,983 | |
| | | | |
FNMA | | | 8.00 | | | | 2-1-2030 | | | | 162 | | | | 163 | |
| | | | |
FNMA | | | 8.00 | | | | 3-1-2030 | | | | 207 | | | | 220 | |
| | | | |
FNMA | | | 8.00 | | | | 5-1-2033 | | | | 79,532 | | | | 86,146 | |
| | | | |
FNMA | | | 8.50 | | | | 10-1-2026 | | | | 1,120 | | | | 1,125 | |
| | | | |
FNMA | | | 8.50 | | | | 8-15-2024 | | | | 24,023 | | | | 24,318 | |
| | | | |
FNMA | | | 10.00 | | | | 1-20-2021 | | | | 312 | | | | 315 | |
| | | | |
FNMA Series1989-74 Class J | | | 9.80 | | | | 10-25-2019 | | | | 36 | | | | 36 | |
| | | | |
FNMA Series1989-96 Class H | | | 9.00 | | | | 12-25-2019 | | | | 139 | | | | 139 | |
| | | | |
FNMA Series1992-39 Class FA(7-Year Treasury Constant Maturity +0.00%)± | | | 1.54 | | | | 3-25-2022 | | | | 50,979 | | | | 50,875 | |
| | | | |
FNMA Series1992-45 Class F(7-Year Treasury Constant Maturity +0.00%)± | | | 1.54 | | | | 4-25-2022 | | | | 8,501 | | | | 8,482 | |
| | | | |
FNMA Series1992-87 Class Z | | | 8.00 | | | | 5-25-2022 | | | | 4,758 | | | | 5,010 | |
| | | | |
FNMA Series1993-113 Class FA (10 Year Treasury Constant Maturity-0.65%)± | | | 0.95 | | | | 7-25-2023 | | | | 35,616 | | | | 35,562 | |
| | | | |
FNMA Series1993-247 Class FM (11th District Cost of Funds +1.20%)± | | | 2.34 | | | | 12-25-2023 | | | | 178,844 | | | | 181,704 | |
| | | | |
FNMA Series1994-14 Class F (11th District Cost of Funds +1.60%)± | | | 2.74 | | | | 10-25-2023 | | | | 99,252 | | | | 101,569 | |
| | | | |
FNMA Series2001-50 Class BA | | | 7.00 | | | | 10-25-2041 | | | | 113,995 | | | | 129,549 | |
| | | | |
FNMA Series2001-63 Class FD (1 Month LIBOR +0.60%)± | | | 2.78 | | | | 12-18-2031 | | | | 111,125 | | | | 112,130 | |
| | | | |
FNMA Series2001-81 Class F (1 Month LIBOR +0.55%)± | | | 2.70 | | | | 1-25-2032 | | | | 46,192 | | | | 46,599 | |
| | | | |
FNMA Series2001-T08 Class A1 | | | 7.50 | | | | 7-25-2041 | | | | 103,922 | | | | 121,569 | |
| | | | |
FNMA Series2001-T10 Class A2 | | | 7.50 | | | | 12-25-2041 | | | | 1,712,995 | | | | 1,929,818 | |
| | | | |
FNMA Series2001-T12 Class A2 | | | 7.50 | | | | 8-25-2041 | | | | 139,242 | | | | 164,182 | |
| | | | |
FNMA Series2001-T12 Class A4±± | | | 4.66 | | | | 8-25-2041 | | | | 3,348,533 | | | | 3,480,780 | |
| | | | |
FNMA Series2001-W01 Class AV1 (1 Month LIBOR +0.24%)± | | | 2.51 | | | | 8-25-2031 | | | | 47,019 | | | | 45,879 | |
| | | | |
FNMA Series2001-W03 Class A±± | | | 6.02 | | | | 9-25-2041 | | | | 423,578 | | | | 464,758 | |
| | | | |
FNMA Series2002-05 Class FD (1 Month LIBOR +0.90%)± | | | 3.05 | | | | 2-25-2032 | | | | 94,249 | | | | 95,810 | |
| | | | |
FNMA Series2002-33 Class A4±± | | | 5.46 | | | | 11-25-2030 | | | | 109,588 | | | | 114,334 | |
| | | | |
FNMA Series2002-59 Class F (1 Month LIBOR +0.40%)± | | | 2.55 | | | | 9-25-2032 | | | | 325,928 | | | | 326,756 | |
| | | | |
FNMA Series2002-66 Class A3±± | | | 4.45 | | | | 4-25-2042 | | | | 6,588,925 | | | | 6,875,356 | |
| | | | |
FNMA Series2002-T12 Class A3 | | | 7.50 | | | | 5-25-2042 | | | | 1,150,659 | | | | 1,388,036 | |
| | | | |
FNMA Series2002-T12 Class A5±± | | | 4.88 | | | | 10-25-2041 | | | | 1,395,632 | | | | 1,450,018 | |
| | | | |
FNMA Series2002-T18 Class A5±± | | | 4.63 | | | | 5-25-2042 | | | | 2,875,353 | | | | 3,012,809 | |
| | | | |
FNMA Series2002-T19 Class A4±± | | | 4.64 | | | | 3-25-2042 | | | | 164,194 | | | | 173,670 | |
| | | | |
FNMA Series2002-W01 Class 3A±± | | | 4.22 | | | | 4-25-2042 | | | | 866,614 | | | | 880,415 | |
| | | | |
FNMA Series2002-W04 Class A6±± | | | 4.59 | | | | 5-25-2042 | | | | 1,368,035 | | | | 1,415,349 | |
| | | | |
FNMA Series2003-07 Class A2±± | | | 4.31 | | | | 5-25-2042 | | | | 636,032 | | | | 646,459 | |
| | | | |
FNMA Series2003-63 Class A8±± | | | 4.20 | | | | 1-25-2043 | | | | 995,659 | | | | 1,033,579 | |
| | | | |
FNMA Series2003-W02 Class 1A3 | | | 7.50 | | | | 7-25-2042 | | | | 314,777 | | | | 380,994 | |
| | | | |
FNMA Series2003-W04 Class 5A±± | | | 4.43 | | | | 10-25-2042 | | | | 878,146 | | | | 893,117 | |
The accompanying notes are an integral part of these financial statements.
Wells Fargo Adjustable Rate Government Fund | 21
Portfolio of investments—August 31, 2019
| | | | | | | | | | | | | | | | |
| | | Interest
rate | | | Maturity
date | | | Principal | | | Value | |
| Agency Securities (continued) | |
| | | | |
FNMA Series2003-W08 Class 4A±± | | | 4.54 | % | | | 11-25-2042 | | | $ | 1,049,516 | | | $ | 1,088,222 | |
| | | | |
FNMA Series2003-W09 Class A (1 Month LIBOR +0.12%)± | | | 2.51 | | | | 6-25-2033 | | | | 1,524,309 | | | | 1,497,957 | |
| | | | |
FNMA Series2003-W10 Class 2A±± | | | 4.18 | | | | 6-25-2043 | | | | 2,187,439 | | | | 2,273,057 | |
| | | | |
FNMA Series2003-W18 Class 2A±± | | | 4.43 | | | | 6-25-2043 | | | | 3,041,509 | | | | 3,197,370 | |
| | | | |
FNMA Series2004-T03 Class 1A3 | | | 7.00 | | | | 2-25-2044 | | | | 379,801 | | | | 446,320 | |
| | | | |
FNMA Series2004-T03 Class 2A±± | | | 4.51 | | | | 8-25-2043 | | | | 1,080,274 | | | | 1,122,531 | |
| | | | |
FNMA Series2004-W01 Class 2A2 | | | 7.00 | | | | 12-25-2033 | | | | 203,577 | | | | 235,461 | |
| | | | |
FNMA Series2004-W01 Class 3A±± | | | 4.48 | | | | 1-25-2043 | | | | 61,854 | | | | 63,506 | |
| | | | |
FNMA Series2004-W02 Class 5A | | | 7.50 | | | | 3-25-2044 | | | | 92,750 | | | | 106,390 | |
| | | | |
FNMA Series2004-W12 Class 2A±± | | | 4.45 | | | | 6-25-2044 | | | | 3,144,180 | | | | 3,285,205 | |
| | | | |
FNMA Series2004-W15 Class 3A±± | | | 4.56 | | | | 6-25-2044 | | | | 4,939,686 | | | | 5,077,384 | |
| | | | |
FNMA Series2005-W03 Class 3A±± | | | 4.28 | | | | 4-25-2045 | | | | 994,608 | | | | 1,045,524 | |
| | | | |
FNMA Series2006-15 Class FW (1 Month LIBOR +0.30%)± | | | 2.45 | | | | 1-25-2036 | | | | 50,069 | | | | 50,097 | |
| | | | |
FNMA Series2006-44 Class FY (1 Month LIBOR +0.57%)± | | | 2.72 | | | | 6-25-2036 | | | | 968,674 | | | | 976,061 | |
| | | | |
FNMA Series2006-W01 Class 3A±± | | | 4.40 | | | | 10-25-2045 | | | | 3,840,017 | | | | 4,004,652 | |
| | | | |
FNMA Series2007-95 Class A2 (1 Month LIBOR +0.25%)± | | | 2.52 | | | | 8-27-2036 | | | | 287,292 | | | | 285,892 | |
| | | | |
FNMA Series2012-47 Class FW (1 Month LIBOR +1.70%)± | | | 3.85 | | | | 5-25-2027 | | | | 331,549 | | | | 344,332 | |
| | | | |
FNMA SeriesG92-20 Class FB(7-Year Treasury Constant Maturity +0.00%)± | | | 1.54 | | | | 4-25-2022 | | | | 4,009 | | | | 4,001 | |
| | | | |
FNMA SeriesG93-1 Class K | | | 6.68 | | | | 1-25-2023 | | | | 148,915 | | | | 155,493 | |
| | | | |
FNMA SeriesG93-19 Class FD (10 Year Treasury Constant Maturity-0.65%)± | | | 0.95 | | | | 4-25-2023 | | | | 44,151 | | | | 44,147 | |
| | | | |
GNMA | | | 6.45 | | | | 4-20-2025 | | | | 30,477 | | | | 32,845 | |
| | | | |
GNMA | | | 6.45 | | | | 9-20-2025 | | | | 31,196 | | | | 34,832 | |
| | | | |
GNMA | | | 6.50 | | | | 6-20-2034 | | | | 70,744 | | | | 71,756 | |
| | | | |
GNMA | | | 6.50 | | | | 8-20-2034 | | | | 476,062 | | | | 527,044 | |
| | | | |
GNMA | | | 6.75 | | | | 2-15-2029 | | | | 39,575 | | | | 43,545 | |
| | | | |
GNMA | | | 9.00 | | | | 3-15-2020 | | | | 153 | | | | 153 | |
| | | | |
GNMA | | | 9.00 | | | | 9-20-2024 | | | | 800 | | | | 814 | |
| | | | |
GNMA | | | 9.00 | | | | 11-20-2024 | | | | 108 | | | | 108 | |
| | | | |
GNMA | | | 9.00 | | | | 1-20-2025 | | | | 2,572 | | | | 2,689 | |
| | | | |
GNMA | | | 9.00 | | | | 2-20-2025 | | | | 11,939 | | | | 13,164 | |
| | | | |
GNMA Series2008-65 Class FG (1 Month LIBOR +0.75%)± | | | 2.92 | | | | 8-20-2038 | | | | 1,319,938 | | | | 1,339,089 | |
| | | | |
GNMA Series2008-68 Class FA (1 Month LIBOR +0.95%)± | | | 3.12 | | | | 8-20-2038 | | | | 1,634,475 | | | | 1,670,815 | |
| | | | |
GNMA Series2009-50 Class FW (1 Month LIBOR +1.00%)± | | | 3.17 | | | | 7-20-2039 | | | | 1,696,452 | | | | 1,739,451 | |
| | | | |
GNMA Series2009-52 Class FD (1 Month LIBOR +0.95%)± | | | 3.15 | | | | 7-16-2039 | | | | 806,120 | | | | 823,917 | |
| | | | |
GNMA Series2010-25 Class FH (1 Month LIBOR +0.72%)± | | | 2.92 | | | | 2-16-2040 | | | | 775,388 | | | | 783,371 | |
| | | | |
GNMA Series2011-H12 Class FA (1 Month LIBOR +0.49%)± | | | 2.87 | | | | 2-20-2061 | | | | 2,155,144 | | | | 2,156,081 | |
| | | | |
GNMA Series2011-H17 Class FA (1 Month LIBOR +0.53%)± | | | 2.91 | | | | 6-20-2061 | | | | 882,440 | | | | 883,620 | |
| | | | |
GNMA Series2017-H11 Class FE (12 Month LIBOR +0.18%)± | | | 2.91 | | | | 5-20-2067 | | | | 4,733,752 | | | | 4,699,846 | |
| |
Total Agency Securities (Cost $269,787,369) | | | | 275,663,713 | |
| | | | | | | | | | | | | | | | |
| | | | |
| | | | | | | | | | | | | | | | |
| | | Yield | | | | | | Shares | | | | |
|
Short-Term Investments: 3.68% | |
|
| Investment Companies: 3.68% | |
| | | | |
Wells Fargo Government Money Market Fund Select Class (l)(u) | | | 2.04 | | | | | | | | 10,631,386 | | | | 10,631,386 | |
| | | | | | | | | | | | | | | | |
| |
Total Short-Term Investments (Cost $10,631,386) | | | | 10,631,386 | |
| | | | | | | | | | | | | | | | |
| | | | | | | | |
| Total investments in securities (Cost $280,418,755) | | | 99.15 | % | | | 286,295,099 | |
| | |
Other assets and liabilities, net | | | 0.85 | | | | 2,458,095 | |
| | | | | | | | |
| Total net assets | | | 100.00 | % | | $ | 288,753,194 | |
| | | | | | | | |
The accompanying notes are an integral part of these financial statements.
22 | Wells Fargo Adjustable Rate Government Fund
Portfolio of investments—August 31, 2019
| 144A | The security may be resold in transactions exempt from registration, normally to qualified institutional buyers, pursuant to Rule 144A under the Securities Act of 1933. |
| ± | Variable rate investment. The rate shown is the rate in effect at period end. |
| ±± | The coupon of the security is adjusted based on the principal and interest payments received from the underlying pool of mortgages as well as the credit quality and the actual prepayment speed of the underlying mortgages. |
| (c) | Investment in an interest-only security entitles holders to receive only the interest payments on the underlying mortgages. The principal amount shown is the notional amount of the underlying mortgages. The rate represents the coupon rate. |
| (l) | The issuer of the security is an affiliated person of the Fund as defined in the Investment Company Act of 1940. |
| (u) | The rate represents the7-day annualized yield at period end. |
Abbreviations:
| FDIC | Federal Deposit Insurance Corporation |
| FHLMC | Federal Home Loan Mortgage Corporation |
| FNMA | Federal National Mortgage Association |
| GNMA | Government National Mortgage Association |
| LIBOR | London Interbank Offered Rate |
Investments in Affiliates
An affiliated investment is an investment in which the Fund owns at least 5% of the outstanding voting shares of the issuer or as a result of other relationships, such as the Fund and the issuer having the same investment manager. Transactions with issuers that were either affiliated persons of the Fund at the beginning of the period or the end of the period were as follows:
| | | | | | | | | | | | | | | | | | | | | | | | | | | | | | | | | | | | |
| | | Shares, beginning
of period | | | Shares purchased | | | Shares sold | | | Shares, end of period | | | Net realized gains (losses) | | | Net change in unrealized gains (losses) | | | Income from affiliated securities | | | Value, end of period | | | % of net assets | |
Short-Term Investments | | | | | | | | | | | | | | | | | | | | | | | | | | | | | | | | | | | | |
Investment Companies | | | | | | | | | | | | | | | | | | | | | | | | | | | | | | | | | | | | |
Wells Fargo Government Money Market Fund Select Class | | | 14,194,527 | | | | 98,483,214 | | | | 102,046,355 | | | | 10,631,386 | | | $ | 0 | | | $ | 0 | | | $ | 189,609 | | | $ | 10,631,386 | | | | 3.68 | % |
The accompanying notes are an integral part of these financial statements.
Wells Fargo Adjustable Rate Government Fund | 23
Statement of assets and liabilities—August 31, 2019
| | | | |
| | | | |
| |
Assets | | | | |
Investments in unaffiliated securities, at value (cost $269,787,369) | | $ | 275,663,713 | |
Investments in affiliated securities, at value (cost $10,631,386) | | | 10,631,386 | |
Principal paydown receivable | | | 1,708,782 | |
Receivable for Fund shares sold | | | 53,115 | |
Receivable for interest | | | 1,261,174 | |
Prepaid expenses and other assets | | | 64,649 | |
| | | | |
Total assets | | | 289,382,819 | |
| | | | |
| |
Liabilities | | | | |
Payable for Fund shares redeemed | | | 243,874 | |
Dividends payable | | | 84,616 | |
Management fee payable | | | 59,509 | |
Administration fees payable | | | 30,300 | |
Distribution fee payable | | | 4,505 | |
Trustees’ fees and expenses payable | | | 4,197 | |
Accrued expenses and other liabilities | | | 202,624 | |
| | | | |
Total liabilities | | | 629,625 | |
| | | | |
Total net assets | | $ | 288,753,194 | |
| | | | |
| |
Net assets consist of | | | | |
Paid-in capital | | $ | 283,353,567 | |
Total distributable earnings | | | 5,399,627 | |
| | | | |
Total net assets | | $ | 288,753,194 | |
| | | | |
| |
Computation of net asset value and offering price per share | | | | |
Net assets – Class A | | $ | 118,674,898 | |
Shares outstanding – Class A1 | | | 13,213,889 | |
Net asset value per share – Class A | | | $8.98 | |
Maximum offering price per share – Class A2 | | | $9.16 | |
Net assets – Class C | | $ | 6,593,594 | |
Shares outstanding – Class C1 | | | 735,360 | |
Net asset value per share – Class C | | | $8.97 | |
Net assets – Administrator Class | | $ | 5,337,415 | |
Shares outstanding – Administrator Class1 | | | 594,164 | |
Net asset value per share – Administrator Class | | | $8.98 | |
Net assets – Institutional Class | | $ | 158,147,287 | |
Shares outstanding – Institutional Class1 | | | 17,609,801 | |
Net asset value per share – Institutional Class | | | $8.98 | |
| 1 | The Fund has an unlimited number of authorized shares. |
| 2 | Maximum offering price is computed as 100/98 of net asset value. On investments of $50,000 or more, the offering price is reduced. |
The accompanying notes are an integral part of these financial statements.
24 | Wells Fargo Adjustable Rate Government Fund
Statement of operations—year ended August 31, 2019
| | | | |
| | | | |
| |
Investment income | | | | |
Interest | | $ | 8,885,033 | |
Income from affiliated securities | | | 189,609 | |
| | | | |
Total investment income | | | 9,074,642 | |
| | | | |
| |
Expenses | | | | |
Management fee | | | 1,158,595 | |
Administration fees | | | | |
Class A | | | 179,671 | |
Class C | | | 36,411 | |
Administrator Class | | | 6,645 | |
Institutional Class | | | 151,465 | |
Shareholder servicing fees | | | | |
Class A | | | 280,736 | |
Class C | | | 56,892 | |
Administrator Class | | | 16,412 | |
Distribution fee | | | | |
Class C | | | 170,673 | |
Custody and accounting fees | | | 77,477 | |
Professional fees | | | 68,690 | |
Registration fees | | | 98,018 | |
Shareholder report expenses | | | 59,834 | |
Trustees’ fees and expenses | | | 21,592 | |
Other fees and expenses | | | 51,760 | |
| | | | |
Total expenses | | | 2,434,871 | |
Less: Fee waivers and/or expense reimbursements | | | | |
Fund-level | | | (276,928 | ) |
Class A | | | (59,061 | ) |
Class C | | | (9,995 | ) |
Administrator Class | | | (8,390 | ) |
| | | | |
Net expenses | | | 2,080,497 | |
| | | | |
Net investment income | | | 6,994,145 | |
| | | | |
| |
Realized and unrealized gains (losses) on investments | | | | |
Net realized gains on investments | | | 259,753 | |
Net change in unrealized gains (losses) on investments | | | 1,540,062 | |
| | | | |
Net realized and unrealized gains (losses) on investments | | | 1,799,815 | |
| | | | |
Net increase in net assets resulting from operations | | $ | 8,793,960 | |
| | | | |
The accompanying notes are an integral part of these financial statements.
Wells Fargo Adjustable Rate Government Fund | 25
Statement of changes in net assets
| | | | | | | | | | | | | | | | |
| | | Year ended
August 31, 2019 | | | Year ended
August 31, 20181 | |
| | | |
Operations | | | | | | | | | | | | |
Net investment income | | | | | | $ | 6,994,145 | | | | | | | $ | 6,407,474 | |
Net realized gains on investments | | | | | | | 259,753 | | | | | | | | 736,194 | |
Net change in unrealized gains (losses) on investments | | | | | | | 1,540,062 | | | | | | | | (2,234,630 | ) |
| | | | |
Net increase in net assets resulting from operations | | | | | | | 8,793,960 | | | | | | | | 4,909,038 | |
| | | | |
| | | | |
Distributions to shareholders from net investment income and net realized gains | | | | | | | | | | | | | | | | |
Class A | | | | | | | (2,312,766 | ) | | | | | | | (1,690,233 | ) |
Class C | | | | | | | (274,818 | ) | | | | | | | (291,921 | ) |
Administrator Class | | | | | | | (143,314 | ) | | | | | | | (197,212 | ) |
Institutional Class | | | | | | | (4,363,556 | ) | | | | | | | (4,228,118 | ) |
| | | | |
Total distributions to shareholders | | | | | | | (7,094,454 | ) | | | | | | | (6,407,484 | ) |
| | | | |
| | | | |
Capital share transactions | | | Shares | | | | | | | | Shares | | | | | |
Proceeds from shares sold | | | | | | | | | | | | | | | | |
Class A | | | 4,140,943 | | | | 37,018,425 | | | | 959,219 | | | | 8,580,205 | |
Class C | | | 112,522 | | | | 1,004,070 | | | | 96,466 | | | | 864,644 | |
Administrator Class | | | 4,965 | | | | 44,434 | | | | 106,068 | | | | 950,975 | |
Institutional Class | | | 3,237,102 | | | | 28,915,014 | | | | 5,355,474 | | | | 47,989,301 | |
| | | | |
| | | | | | | 66,981,943 | | | | | | | | 58,385,125 | |
| | | | |
Reinvestment of distributions | | | | | | | | | | | | | | | | |
Class A | | | 220,140 | | | | 1,968,661 | | | | 138,550 | | | | 1,239,446 | |
Class C | | | 29,271 | | | | 261,252 | | | | 31,593 | | | | 282,408 | |
Administrator Class | | | 15,395 | | | | 137,619 | | | | 21,739 | | | | 194,536 | |
Institutional Class | | | 384,451 | | | | 3,436,900 | | | | 358,053 | | | | 3,204,150 | |
| | | | |
| | | | | | | 5,804,432 | | | | | | | | 4,920,540 | |
| | | | |
Payment for shares redeemed | | | | | | | | | | | | | | | | |
Class A | | | (2,790,788 | ) | | | (24,941,456 | ) | | | (6,633,879 | ) | | | (59,360,844 | ) |
Class C | | | (4,524,371 | ) | | | (40,431,473 | ) | | | (1,791,217 | ) | | | (16,036,464 | ) |
Administrator Class | | | (449,737 | ) | | | (4,015,219 | ) | | | (1,202,643 | ) | | | (10,766,120 | ) |
Institutional Class | | | (12,338,837 | ) | | | (110,218,719 | ) | | | (23,742,189 | ) | | | (212,822,264 | ) |
| | | | |
| | | | | | | (179,606,867 | ) | | | | | | | (298,985,692 | ) |
| | | | |
Net decrease in net assets resulting from capital share transactions | | | | | | | (106,820,492 | ) | | | | | | | (235,680,027 | ) |
| | | | |
Total decrease in net assets | | | | | | | (105,120,986 | ) | | | | | | | (237,178,473 | ) |
| | | | |
| | | | |
Net assets | | | | | | | | | | | | | | | | |
Beginning of period | | | | | | | 393,874,180 | | | | | | | | 631,052,653 | |
| | | | |
End of period | | | | | | $ | 288,753,194 | | | | | | | $ | 393,874,180 | |
| | | | |
| 1 | Effective for all filings after November 4, 2018, the SEC prospectively eliminated the requirement to parenthetically disclose undistributed net investment income at the end of the period and permitted the aggregation of distributions, with the exception of tax basis returns of capital. Overdistributed net investment income at August 31, 2018 was $192,257. The disaggregated distributions information for the year ended August 31, 2018 is included in Note 7,Distributions to Shareholders, in the notes to the financial statements. |
The accompanying notes are an integral part of these financial statements.
26 | Wells Fargo Adjustable Rate Government Fund
Financial highlights
(For a share outstanding throughout each period)
| | | | | | | | | | | | | | | | | | | | |
| | | Year ended August 31 | |
| CLASS A | | 2019 | | | 2018 | | | 2017 | | | 2016 | | | 2015 | |
Net asset value, beginning of period | | | $8.93 | | | | $8.96 | | | | $9.01 | | | | $9.10 | | | | $9.15 | |
Net investment income | | | 0.18 | 1 | | | 0.10 | | | | 0.06 | | | | 0.04 | | | | 0.05 | |
Net realized and unrealized gains (losses) on investments | | | 0.05 | | | | (0.01 | ) | | | (0.04 | ) | | | (0.06 | ) | | | (0.03 | ) |
| | | | | | | | | | | | | | | | | | | | |
Total from investment operations | | | 0.23 | | | | 0.09 | | | | 0.02 | | | | (0.02 | ) | | | 0.02 | |
Distributions to shareholders from | | | | | | | | | | | | | | | | | | | | |
Net investment income | | | (0.18 | ) | | | (0.12 | ) | | | (0.07 | ) | | | (0.05 | ) | | | (0.05 | ) |
Tax basis return of capital | | | 0.00 | | | | 0.00 | | | | 0.00 | | | | (0.02 | ) | | | (0.02 | ) |
| | | | | | | | | | | | | | | | | | | | |
Total distributions to shareholders | | | (0.18 | ) | | | (0.12 | ) | | | (0.07 | ) | | | (0.07 | ) | | | (0.07 | ) |
Net asset value, end of period | | | $8.98 | | | | $8.93 | | | | $8.96 | | | | $9.01 | | | | $9.10 | |
Total return2 | | | 2.64 | % | | | 0.98 | % | | | 0.23 | % | | | (0.19 | )% | | | 0.24 | % |
Ratios to average net assets (annualized) | | | | | | | | | | | | | | | | | | | | |
Gross expenses | | | 0.88 | % | | | 0.83 | % | | | 0.80 | % | | | 0.78 | % | | | 0.79 | % |
Net expenses | | | 0.74 | % | | | 0.74 | % | | | 0.74 | % | | | 0.74 | % | | | 0.74 | % |
Net investment income | | | 2.04 | % | | | 1.28 | % | | | 0.72 | % | | | 0.56 | % | | | 0.58 | % |
Supplemental data | | | | | | | | | | | | | | | | | | | | |
Portfolio turnover rate | | | 5 | % | | | 3 | % | | | 2 | % | | | 13 | % | | | 10 | % |
Net assets, end of period (000s omitted) | | | $118,675 | | | | $103,963 | | | | $153,953 | | | | $172,131 | | | | $215,830 | |
| 1 | Calculated based upon average shares outstanding |
| 2 | Total return calculations do not include any sales charges. |
The accompanying notes are an integral part of these financial statements.
Wells Fargo Adjustable Rate Government Fund | 27
Financial highlights
(For a share outstanding throughout each period)
| | | | | | | | | | | | | | | | | | | | |
| | | Year ended August 31 | |
| CLASS C | | 2019 | | | 2018 | | | 2017 | | | 2016 | | | 2015 | |
Net asset value, beginning of period | | | $8.93 | | | | $8.96 | | | | $9.01 | | | | $9.10 | | | | $9.15 | |
Net investment income (loss) | | | 0.10 | 1 | | | 0.05 | 1 | | | (0.00 | )1,2 | | | (0.02 | )1 | | | (0.01 | )1 |
Net realized and unrealized gains (losses) on investments | | | 0.06 | | | | (0.03 | ) | | | (0.05 | ) | | | (0.07 | ) | | | (0.04 | ) |
| | | | | | | | | | | | | | | | | | | | |
Total from investment operations | | | 0.16 | | | | 0.02 | | | | (0.05 | ) | | | (0.09 | ) | | | (0.05 | ) |
Distributions to shareholders from | | | | | | | | | | | | | | | | | | | | |
Net investment income | | | (0.12 | ) | | | (0.05 | ) | | | (0.00 | )3 | | | (0.00 | )3 | | | (0.00 | )3 |
Tax basis return of capital | | | 0.00 | | | | 0.00 | | | | 0.00 | | | | (0.00 | )3 | | | (0.00 | )3 |
| | | | | | | | | | | | | | | | | | | | |
Total distributions to shareholders | | | (0.12 | ) | | | (0.05 | ) | | | (0.00 | )3 | | | (0.00 | )3 | | | (0.00 | )3 |
Net asset value, end of period | | | $8.97 | | | | $8.93 | | | | $8.96 | | | | $9.01 | | | | $9.10 | |
Total return4 | | | 1.76 | % | | | 0.23 | % | | | (0.52 | )% | | | (0.94 | )% | | | (0.51 | )% |
Ratios to average net assets (annualized) | | | | | | | | | | | | | | | | | | | | |
Gross expenses | | | 1.62 | % | | | 1.55 | % | | | 1.55 | % | | | 1.53 | % | | | 1.54 | % |
Net expenses | | | 1.49 | % | | | 1.49 | % | | | 1.49 | % | | | 1.49 | % | | | 1.49 | % |
Net investment income (loss) | | | 1.13 | % | | | 0.54 | % | | | (0.04 | )% | | | (0.19 | )% | | | (0.16 | )% |
Supplemental data | | | | | | | | | | | | | | | | | | | | |
Portfolio turnover rate | | | 5 | % | | | 3 | % | | | 2 | % | | | 13 | % | | | 10 | % |
Net assets, end of period (000s omitted) | | | $6,594 | | | | $45,693 | | | | $60,766 | | | | $97,452 | | | | $121,117 | |
| 1 | Calculated based upon average shares outstanding |
| 2 | Amount is more than $(0.005). |
| 3 | Amount is less than $0.005. |
| 4 | Total return calculations do not include any sales charges. |
The accompanying notes are an integral part of these financial statements.
28 | Wells Fargo Adjustable Rate Government Fund
Financial highlights
(For a share outstanding throughout each period)
| | | | | | | | | | | | | | | | | | | | |
| | | Year ended August 31 | |
| ADMINISTRATOR CLASS | | 2019 | | | 2018 | | | 2017 | | | 2016 | | | 2015 | |
Net asset value, beginning of period | | | $8.93 | | | | $8.96 | | | | $9.01 | | | | $9.10 | | | | $9.15 | |
Net investment income | | | 0.19 | 1 | | | 0.13 | 1 | | | 0.07 | 1 | | | 0.06 | | | | 0.06 | |
Net realized and unrealized gains (losses) on investments | | | 0.06 | | | | (0.03 | ) | | | (0.04 | ) | | | (0.06 | ) | | | (0.03 | ) |
| | | | | | | | | | | | | | | | | | | | |
Total from investment operations | | | 0.25 | | | | 0.10 | | | | 0.03 | | | | 0.00 | | | | 0.03 | |
Distributions to shareholders from | | | | | | | | | | | | | | | | | | | | |
Net investment income | | | (0.20 | ) | | | (0.13 | ) | | | (0.08 | ) | | | (0.07 | ) | | | (0.06 | ) |
Tax basis return of capital | | | 0.00 | | | | 0.00 | | | | 0.00 | | | | (0.02 | ) | | | (0.02 | ) |
| | | | | | | | | | | | | | | | | | | | |
Total distributions to shareholders | | | (0.20 | ) | | | (0.13 | ) | | | (0.08 | ) | | | (0.09 | ) | | | (0.08 | ) |
Net asset value, end of period | | | $8.98 | | | | $8.93 | | | | $8.96 | | | | $9.01 | | | | $9.10 | |
Total return | | | 2.78 | % | | | 1.12 | % | | | 0.37 | % | | | (0.05 | )% | | | 0.38 | % |
Ratios to average net assets (annualized) | | | | | | | | | | | | | | | | | | | | |
Gross expenses | | | 0.81 | % | | | 0.77 | % | | | 0.74 | % | | | 0.72 | % | | | 0.72 | % |
Net expenses | | | 0.60 | % | | | 0.60 | % | | | 0.60 | % | | | 0.60 | % | | | 0.60 | % |
Net investment income | | | 2.12 | % | | | 1.42 | % | | | 0.82 | % | | | 0.71 | % | | | 0.72 | % |
Supplemental data | | | | | | | | | | | | | | | | | | | | |
Portfolio turnover rate | | | 5 | % | | | 3 | % | | | 2 | % | | | 13 | % | | | 10 | % |
Net assets, end of period (000s omitted) | | | $5,337 | | | | $9,140 | | | | $18,805 | | | | $61,658 | | | | $66,037 | |
| 1 | Calculated based upon average shares outstanding |
The accompanying notes are an integral part of these financial statements.
Wells Fargo Adjustable Rate Government Fund | 29
Financial highlights
(For a share outstanding throughout each period)
| | | | | | | | | | | | | | | | | | | | |
| | | Year ended August 31 | |
| INSTITUTIONAL CLASS | | 2019 | | | 2018 | | | 2017 | | | 2016 | | | 2015 | |
Net asset value, beginning of period | | | $8.93 | | | | $8.96 | | | | $9.01 | | | | $9.10 | | | | $9.15 | |
Net investment income | | | 0.22 | | | | 0.16 | | | | 0.09 | | | | 0.08 | | | | 0.08 | |
Net realized and unrealized gains (losses) on investments | | | 0.04 | | | | (0.05 | ) | | | (0.04 | ) | | | (0.07 | ) | | | (0.03 | ) |
| | | | | | | | | | | | | | | | | | | | |
Total from investment operations | | | 0.26 | | | | 0.11 | | | | 0.05 | | | | 0.01 | | | | 0.05 | |
Distributions to shareholders from | | | | | | | | | | | | | | | | | | | | |
Net investment income | | | (0.21 | ) | | | (0.14 | ) | | | (0.10 | ) | | | (0.07 | ) | | | (0.08 | ) |
Tax basis return of capital | | | 0.00 | | | | 0.00 | | | | 0.00 | | | | (0.03 | ) | | | (0.02 | ) |
| | | | | | | | | | | | | | | | | | | | |
Total distributions to shareholders | | | (0.21 | ) | | | (0.14 | ) | | | (0.10 | ) | | | (0.10 | ) | | | (0.10 | ) |
Net asset value, end of period | | | $8.98 | | | | $8.93 | | | | $8.96 | | | | $9.01 | | | | $9.10 | |
Total return | | | 2.93 | % | | | 1.26 | % | | | 0.51 | % | | | 0.09 | % | | | 0.52 | % |
Ratios to average net assets (annualized) | | | | | | | | | | | | | | | | | | | | |
Gross expenses | | | 0.54 | % | | | 0.50 | % | | | 0.47 | % | | | 0.45 | % | | | 0.46 | % |
Net expenses | | | 0.46 | % | | | 0.46 | % | | | 0.46 | % | | | 0.45 | % | | | 0.46 | % |
Net investment income | | | 2.27 | % | | | 1.55 | % | | | 0.98 | % | | | 0.84 | % | | | 0.87 | % |
Supplemental data | | | | | | | | | | | | | | | | | | | | |
Portfolio turnover rate | | | 5 | % | | | 3 | % | | | 2 | % | | | 13 | % | | | 10 | % |
Net assets, end of period (000s omitted) | | | $158,147 | | | | $235,078 | | | | $397,529 | | | | $702,617 | | | | $906,536 | |
The accompanying notes are an integral part of these financial statements.
30 | Wells Fargo Adjustable Rate Government Fund
Notes to financial statements
1. ORGANIZATION
Wells Fargo Funds Trust (the “Trust”), a Delaware statutory trust organized on March 10, 1999, is an open-end management investment company registered under the Investment Company Act of 1940, as amended (the “1940 Act”). As an investment company, the Trust follows the accounting and reporting guidance in Financial Accounting Standards Board (“FASB”) Accounting Standards Codification Topic 946,Financial Services – Investment Companies. These financial statements report on the Wells Fargo Adjustable Rate Government Fund (the “Fund”) which is a diversified series of the Trust.
2. SIGNIFICANT ACCOUNTING POLICIES
The following significant accounting policies, which are consistently followed in the preparation of the financial statements of the Fund, are in conformity with U.S. generally accepted accounting principles which require management to make estimates and assumptions that affect the reported amounts of assets and liabilities, disclosure of contingent assets and liabilities at the date of the financial statements, and the reported amounts of revenues and expenses during the reporting period. Actual results could differ from those estimates.
Securities valuation
All investments are valued each business day as of the close of regular trading on the New York Stock Exchange (generally 4 p.m. Eastern Time), although the Fund may deviate from this calculation time under unusual or unexpected circumstances.
Debt securities are valued at the evaluated bid price provided by an independent pricing service (e.g. taking into account various factors, including yields, maturities, or credit ratings) or, if a reliable price is not available, the quoted bid price from an independent broker-dealer.
Investments in registered open-end investment companies are valued at net asset value.
Investments which are not valued using any of the methods discussed above are valued at their fair value, as determined in good faith by the Board of Trustees of the Fund. The Board of Trustees has established a Valuation Committee comprised of the Trustees and has delegated to it the authority to take any actions regarding the valuation of portfolio securities that the Valuation Committee deems necessary or appropriate, including determining the fair value of portfolio securities, unless the determination has been delegated to the Wells Fargo Asset Management Pricing Committee at Wells Fargo Funds Management, LLC (“Funds Management”). The Board of Trustees retains the authority to make or ratify any valuation decisions or approve any changes to the Valuation Procedures as it deems appropriate. On a quarterly basis, the Board of Trustees receives reports on any valuation actions taken by the Valuation Committee or the Wells Fargo Asset Management Pricing Committee which may include items for ratification.
When-issued transactions
The Fund may purchase securities on a forward commitment or when-issued basis. The Fund records a when-issued transaction on the trade date and will segregate assets in an amount at least equal in value to the Fund’s commitment to purchase when-issued securities. Securities purchased on a when-issued basis are marked-to-market daily and the Fund begins earning interest on the settlement date. Losses may arise due to changes in the market value of the underlying securities or if the counterparty does not perform under the contract.
Security transactions and income recognition
Securities transactions are recorded on a trade date basis. Realized gains or losses are recorded on the basis of identified cost.
Interest income is accrued daily and bond discounts are accreted and premiums are amortized daily. To the extent debt obligations are placed on non-accrual status, any related interest income may be reduced by writing off interest receivables when the collection of all or a portion of interest has been determined to be doubtful based on consistently applied procedures and the fair value has decreased. If the issuer subsequently resumes interest payments or when the collectability of interest is reasonably assured, the debt obligation is removed from non-accrual status. Paydown gains and losses are included in interest income.
Distributions to shareholders
Distributions to shareholders from net investment income are declared daily and paid monthly. Distributions from net realized gains, if any, are recorded on the ex-dividend date and paid at least annually. Such distributions are determined in accordance with income tax regulations and may differ from U.S. generally accepted accounting principles. Dividend sources are estimated at the time of declaration. The tax character of distributions is determined as of the Fund’s fiscal year end. Therefore, a portion of the Fund’s distributions made prior to the Fund’s fiscal year end may be categorized as a tax return of capital at year end.
Wells Fargo Adjustable Rate Government Fund | 31
Notes to financial statements
Federal and other taxes
The Fund intends to continue to qualify as a regulated investment company by distributing substantially all of its investment company taxable income and any net realized capital gains (after reduction for capital loss carryforwards) sufficient to relieve it from all, or substantially all, federal income taxes. Accordingly, no provision for federal income taxes was required.
The Fund’s income and federal excise tax returns and all financial records supporting those returns for the prior three fiscal years are subject to examination by the federal and Delaware revenue authorities. Management has analyzed the Fund’s tax positions taken on federal, state, and foreign tax returns for all open tax years and does not believe that there are any uncertain tax positions that require recognition of a tax liability.
As of August 31, 2019, the aggregate cost of all investments for federal income tax purposes was $280,736,610 and the unrealized gains (losses) consisted of:
| | | | |
| |
Gross unrealized gains | | $ | 6,353,705 | |
| |
Gross unrealized losses | | | (795,216 | ) |
| |
Net unrealized gains | | $ | 5,558,489 | |
Class allocations
The separate classes of shares offered by the Fund differ principally in applicable sales charges, distribution, shareholder servicing, and administration fees. Class specific expenses are charged directly to that share class. Investment income, common fund-level expenses, and realized and unrealized gains (losses) on investments are allocated daily to each class of shares based on the relative proportion of net assets of each class.
3. FAIR VALUATION MEASUREMENTS
Fair value measurements of investments are determined within a framework that has established a fair value hierarchy based upon the various data inputs utilized in determining the value of the Fund’s investments. The three-level hierarchy gives the highest priority to unadjusted quoted prices in active markets for identical assets or liabilities (Level 1) and the lowest priority to unobservable inputs (Level 3). The Fund’s investments are classified within the fair value hierarchy based on the lowest level of input that is significant to the fair value measurement. The inputs are summarized into three broad levels as follows:
| ∎ | | Level 1 – quoted prices in active markets for identical securities |
| ∎ | | Level 2 – other significant observable inputs (including quoted prices for similar securities, interest rates, prepayment speeds, credit risk, etc.) |
| ∎ | | Level 3 – significant unobservable inputs (including the Fund’s own assumptions in determining the fair value of investments) |
The inputs or methodologies used for valuing investments in securities are not necessarily an indication of the risk associated with investing in those securities.
The following is a summary of the inputs used in valuing the Fund’s assets and liabilities as of August 31, 2019:
| | | | | | | | | | | | | | | | |
| | | | |
| | | Quoted prices
(Level 1) | | | Other significant
observable inputs
(Level 2) | | | Significant
unobservable inputs (Level 3) | | | Total | |
| | | | |
Assets | | | | | | | | | | | | | | | | |
Investments in: | | | | | | | | | | | | | | | | |
| | | | |
Agency securities | | $ | 0 | | | $ | 275,663,713 | | | $ | 0 | | | $ | 275,663,713 | |
| | | | |
Short-term investments | | | | | | | | | | | | | | | | |
| | | | |
Investment companies | | | 10,631,386 | | | | 0 | | | | 0 | | | | 10,631,386 | |
| | | | |
Total assets | | $ | 10,631,386 | | | $ | 275,663,713 | | | $ | 0 | | | $ | 286,295,099 | |
Additional sector, industry or geographic detail is included in the Portfolio of Investments.
For the year ended August 31, 2019, the Fund did not have any transfers into/out of Level 3.
32 | Wells Fargo Adjustable Rate Government Fund
Notes to financial statements
4. TRANSACTIONS WITH AFFILIATES
Management fee
Funds Management, an indirect wholly owned subsidiary of Wells Fargo & Company (“Wells Fargo”), is the manager of the Fund and provides advisory and fund-level administrative services under an investment management agreement. Under the investment management agreement, Funds Management is responsible for, among other services, implementing the investment objectives and strategies of the Fund, supervising the subadviser and providing fund-level administrative services in connection with the Fund’s operations. As compensation for its services under the investment management agreement, Funds Management is entitled to receive a management fee at the following annual rate based on the Fund’s average daily net assets:
| | | | |
| |
| Average daily net assets | | Management fee | |
| |
First $1 billion | | | 0.350 | % |
| |
Next $4 billion | | | 0.325 | |
| |
Next $3 billion | | | 0.290 | |
| |
Next $2 billion | | | 0.265 | |
| |
Over $10 billion | | | 0.255 | |
For the year ended August 31, 2019, the management fee was equivalent to an annual rate of 0.35% of the Fund’s average daily net assets.
Funds Management has retained the services of a subadviser to provide daily portfolio management to the Fund. The fee for subadvisory services is borne by Funds Management. Wells Capital Management Incorporated, an affiliate of Funds Management and an indirect wholly owned subsidiary of Wells Fargo, is the subadviser to the Fund and is entitled to receive a fee from Funds Management at an annual rate starting at 0.20% and declining to 0.10% as the average daily net assets of the Fund increase.
Administration fees
Under a class-level administration agreement, Funds Management provides class-level administrative services to the Fund, which includes paying fees and expenses for services provided by the transfer agent, sub-transfer agents, omnibus account servicers and record-keepers. As compensation for its services under the class-level administration agreement, Funds Management receives an annual fee which is calculated based on the average daily net assets of each class as follows:
| | | | |
| |
| | | Class-level
administration fee | |
| |
Class A, Class C | | | 0.16 | % |
| |
Administrator Class | | | 0.10 | |
| |
Institutional Class | | | 0.08 | |
Waivers and/or expense reimbursements
Funds Management has contractually waived and/or reimbursed management and administration fees to the extent necessary to maintain certain net operating expense ratios for the Fund. When each class of the Fund has exceeded its expense cap, Funds Management has waived fees and/or reimbursed expenses from fund-level expenses on a proportionate basis and then from class specific expenses. When only certain classes exceed their expense caps, waivers and/or reimbursements are applied against class specific expenses before fund-level expenses. Funds Management has committed through December 31, 2019 to waive fees and/or reimburse expenses to the extent necessary to cap the Fund’s expenses at 0.74% for Class A shares, 1.49% for Class C shares, 0.60% for Administrator Class shares and 0.46% for Institutional Class shares. Prior to or after the commitment expiration date, the cap may be increased or the commitment to maintain the cap may be terminated only with the approval of the Board of Trustees.
Distribution fee
The Trust has adopted a distribution plan for Class C shares of the Fund pursuant to Rule 12b-1 under the 1940 Act. A distribution fee is charged to Class C shares and paid to Wells Fargo Funds Distributor, LLC (“Funds Distributor”), the principal underwriter, at an annual rate of 0.75% of the average daily net assets of Class C shares.
In addition, Funds Distributor is entitled to receive the front-end sales charge from the purchase of Class A shares and a contingent deferred sales charge on the redemption of certain Class A shares. Funds Distributor is also entitled to receive the
Wells Fargo Adjustable Rate Government Fund | 33
Notes to financial statements
contingent deferred sales charges from redemptions of Class C shares. For the year ended August 31, 2019, Funds Distributor received $394 from the sale of Class A shares. No contingent deferred sales charges were incurred by Class A and Class C shares for the year ended August 31, 2019.
Shareholder servicing fees
The Trust has entered into contracts with one or more shareholder servicing agents, whereby Class A, Class C, and Administrator Class of the Fund are charged a fee at an annual rate of 0.25% of the average daily net assets of each respective class. A portion of these total shareholder servicing fees were paid to affiliates of Wells Fargo.
Interfund transactions
The Fund may purchase or sell portfolio investment securities to certain other Wells Fargo affiliates pursuant to Rule 17a-7 under the 1940 Act and under procedures adopted by the Board of Trustees. The procedures have been designed to ensure that these interfund transactions, which do not incur broker commissions, are effected at current market prices.
5. INVESTMENT PORTFOLIO TRANSACTIONS
Purchases and sales of investments, excluding short-term securities, for the year ended August 31, 2019 were as follows:
| | | | | | |
Purchases at cost | | Sales proceeds |
U.S. government | | Non-U.S. government | | U.S. government | | Non-U.S. government |
| $12,731,730 | | $1,919,481 | | $32,820,491 | | $1,482,219 |
6. BANK BORROWINGS
The Trust (excluding the money market funds), Wells Fargo Master Trust and Wells Fargo Variable Trust are parties to a $280,000,000 revolving credit agreement whereby the Fund is permitted to use bank borrowings for temporary or emergency purposes, such as to fund shareholder redemption requests. Interest under the credit agreement is charged to the Fund based on a borrowing rate equal to the higher of the Federal Funds rate in effect on that day plus 1.25% or the overnight LIBOR rate in effect on that day plus 1.25%. In addition, an annual commitment fee equal to 0.25% of the unused balance is allocated to each participating fund.
For the year ended August 31, 2019, there were no borrowings by the Fund under the agreement.
7. DISTRIBUTIONS TO SHAREHOLDERS
The tax character of distributions paid during the years ended August 31, 2019 and August 31, 2018 were as follows:
| | | | | | | | |
| | | Year ended August 31 | |
| | |
| | | 2019 | | | 2018 | |
| | |
Ordinary income | | $ | 6,985,362 | | | $ | 6,407,484 | |
| | |
Long-term capital gain | | | 109,092 | | | | 0 | |
As of August 31, 2019, the components of distributable earnings on a tax basis were as follows:
| | |
Undistributed long-term gains | | Unrealized gains |
| |
| $24,611 | | $5,558,489 |
Effective for all filings after November 4, 2018, the Securities and Exchange Commission eliminated the requirement to separately state the components of distributions to shareholders under U.S. generally accepted accounting principles. The amounts of distributions to shareholders for the year ended August 31, 2018 were as follows:
| | | | |
| |
| | | Net investment
income | |
| |
Class A | | | $1,690,233 | |
| |
Class C | | | 291,921 | |
| |
Administrator Class | | | 197,212 | |
| |
Institutional Class | | | 4,228,118 | |
34 | Wells Fargo Adjustable Rate Government Fund
Notes to financial statements
8. INDEMNIFICATION
Under the Trust’s organizational documents, the officers and Trustees have been granted certain indemnification rights against certain liabilities that may arise out of performance of their duties to the Trust. Additionally, in the normal course of business, the Trust may enter into contracts with service providers that contain a variety of indemnification clauses. The Trust’s maximum exposure under these arrangements is dependent on future claims that may be made against the Fund and, therefore, cannot be estimated.
9. NEW ACCOUNTING PRONOUNCEMENTS
In August 2018, FASB issued Accounting Standards Update (“ASU”) No. 2018-13, Fair Value Measurement (Topic 820)Disclosure Framework—Changes to the Disclosure Requirements for Fair Value Measurement. ASU 2018-13 updates the disclosure requirements for fair value measurements by modifying or removing certain disclosures and adding certain new disclosures. The amendments are effective for fiscal years, and interim periods within those fiscal years, beginning after December 15, 2019. Early adoption is permitted. Management has adopted the removal and modification of disclosures early, as permitted, and will adopt the additional new disclosures at the effective date.
In March 2017, FASB issued ASU No. 2017-08,Premium Amortization on Purchased Callable Debt Securities. ASU 2017-08 shortens the amortization period for certain callable debt securities held at a premium and requires the premium to be amortized to the earliest call date. The amendments do not require an accounting change for securities held at a discount and discounts will continue to be accreted to the maturity date of the security. ASU 2017-08 is effective for fiscal years beginning after December 15, 2018 and for interim periods within those fiscal years. During the current reporting period, management of the Fund adopted the change in accounting policy which did not have a material impact to the Fund’s financial statements.
Wells Fargo Adjustable Rate Government Fund | 35
Report of independent registered public accounting firm
TO THE SHAREHOLDERS OF THE FUND AND BOARD OF TRUSTEES OF WELLS FARGO FUNDS TRUST:
Opinion on the Financial Statements
We have audited the accompanying statement of assets and liabilities of Wells Fargo Adjustable Rate Government Fund (the Fund), one of the funds constituting Wells Fargo Funds Trust, including the portfolio of investments, as of August 31, 2019, the related statement of operations for the year then ended, the statements of changes in net assets for each of the years in the two-year period then ended, and the related notes (collectively, the financial statements) and the financial highlights for each of the years in the five-year period then ended. In our opinion, the financial statements and financial highlights present fairly, in all material respects, the financial position of the Fund as of August 31, 2019, the results of its operations for the year then ended, the changes in its net assets for each of the years in the two-year period then ended, and the financial highlights for each of the years in the five-year period then ended, in conformity with U.S. generally accepted accounting principles.
Basis for Opinion
These financial statements and financial highlights are the responsibility of the Fund’s management. Our responsibility is to express an opinion on these financial statements and financial highlights based on our audits. We are a public accounting firm registered with the Public Company Accounting Oversight Board (United States) (PCAOB) and are required to be independent with respect to the Fund in accordance with the U.S. federal securities laws and the applicable rules and regulations of the Securities and Exchange Commission and the PCAOB.
We conducted our audits in accordance with the standards of the PCAOB. Those standards require that we plan and perform the audit to obtain reasonable assurance about whether the financial statements and financial highlights are free of material misstatement, whether due to error or fraud. Our audits included performing procedures to assess the risks of material misstatement of the financial statements and financial highlights, whether due to error or fraud, and performing procedures that respond to those risks. Such procedures included examining, on a test basis, evidence regarding the amounts and disclosures in the financial statements and financial highlights. Such procedures also included confirmation of securities owned as of August 31, 2019, by correspondence with the custodian and transfer agent. Our audits also included evaluating the accounting principles used and significant estimates made by management, as well as evaluating the overall presentation of the financial statements and financial highlights. We believe that our audits provide a reasonable basis for our opinion.

We have not been able to determine the specific year that we began serving as the auditor of one or more Wells Fargo Funds investment companies; however we are aware that we have served as the auditor of one or more Wells Fargo Funds investment companies since at least 1955.
Boston, Massachusetts
October 28, 2019
36 | Wells Fargo Adjustable Rate Government Fund
Other information (unaudited)
TAX INFORMATION
Pursuant to Section 852 of the Internal Revenue Code, $109,092 was designated as a 20% rate gain distribution for the fiscal year ended August 31, 2019.
For the fiscal year ended August 31, 2019, $7,141,132 has been designated as interest-related dividends for nonresident alien shareholders pursuant to Section 871 of the Internal Revenue Code.
PROXY VOTING INFORMATION
A description of the policies and procedures used to determine how to vote proxies relating to portfolio securities is available, upon request, by calling1-800-222-8222, visiting our website atwfam.com, or visiting the SEC website at sec.gov. Information regarding how the proxies related to portfolio securities were voted during the most recent 12-month period ended June 30 is available on the website atwfam.com or by visiting the SEC website at sec.gov.
QUARTERLY PORTFOLIO HOLDINGS INFORMATION
The Fund files its complete schedule of portfolio holdings with the SEC for the first and third quarters of each fiscal year on Form N-Q or Form N-PORT, which is available by visiting the SEC website at sec.gov. Those forms may be reviewed and copied at the SEC’s Public Reference Room in Washington, DC. Information on the operation of the Public Reference Room may be obtained by calling 1-800-SEC-0330.
Wells Fargo Adjustable Rate Government Fund | 37
Other information (unaudited)
BOARD OF TRUSTEES AND OFFICERS
Each of the Trustees and Officers1 listed in the table below acts in identical capacities for each fund in the Wells Fargo family of funds, which consists of 152 mutual funds comprising the Wells Fargo Funds Trust, Wells Fargo Variable Trust, Wells Fargo Master Trust and four closed-end funds (collectively the “Fund Complex”). This table should be read in conjunction with the Prospectus and the Statement of Additional Information2. The mailing address of each Trustee and Officer is 525 Market Street, 12th Floor, San Francisco, CA 94105. Each Trustee and Officer serves an indefinite term, however, each Trustee serves such term until reaching the mandatory retirement age established by the Trustees.
Independent Trustees
| | | | | | |
Name and year of birth | | Position held and
length of service* | | Principal occupations during past five years or longer | | Current other
public company or
investment
company
directorships |
| | | |
William R. Ebsworth (Born 1957) | | Trustee, since 2015 | | Retired. From 1984 to 2013, equities analyst, portfolio manager, research director and chief investment officer at Fidelity Management and Research Company in Boston, Tokyo, and Hong Kong, and retired in 2013 as Chief Investment Officer of Fidelity Strategic Advisers, Inc. where he led a team of investment professionals managing client assets. Prior thereto, Board member of Hong Kong Securities Clearing Co., Hong Kong Options Clearing Corp., the Thailand International Fund, Ltd., Fidelity Investments Life Insurance Company, and Empire Fidelity Investments Life Insurance Company. Audit Committee Chair and Investment Committee Chair of the Vincent Memorial Hospital Endowment (non-profit organization). Mr. Ebsworth is a CFA® charterholder. | | N/A |
| | | |
Jane A. Freeman (Born 1953) | | Trustee, since 2015; Chair Liaison, since 2018 | | Retired. From 2012 to 2014 and 1999 to 2008, Chief Financial Officer of Scientific Learning Corporation. From 2008 to 2012, Ms. Freeman provided consulting services related to strategic business projects. Prior to 1999, Portfolio Manager at Rockefeller & Co. and Scudder, Stevens & Clark. Board member of the Harding Loevner Funds from 1996 to 2014, serving as both Lead Independent Director and chair of the Audit Committee. Board member of the Russell Exchange Traded Funds Trust from 2011 to 2012 and the chair of the Audit Committee. Ms. Freeman is a Board Member of The Ruth Bancroft Garden (non-profit organization). She is also an inactive Chartered Financial Analyst. | | N/A |
| | | |
Isaiah Harris, Jr. (Born 1952) | | Trustee, since 2009; Audit Committee Chairman, since 2019 | | Retired. Chairman of the Board of CIGNA Corporation since 2009, and Director since 2005. From 2003 to 2011, Director of Deluxe Corporation. Prior thereto, President and CEO of BellSouth Advertising and Publishing Corp. from 2005 to 2007, President and CEO of BellSouth Enterprises from 2004 to 2005 and President of BellSouth Consumer Services from 2000 to 2003. Emeritus member of the Iowa State University Foundation Board of Governors. Emeritus Member of the Advisory Board of Iowa State University School of Business. Advisory Board Member, Palm Harbor Academy (private school). Advisory Board Member, Child Evangelism Fellowship (non-profit). Mr. Harris is a certified public accountant (inactive status). | | CIGNA Corporation |
| | | |
Judith M. Johnson (Born 1949) | | Trustee, since 2008; Audit Committee Chairman, from 2009 to 2018 | | Retired. Prior thereto, Chief Executive Officer and Chief Investment Officer of Minneapolis Employees Retirement Fund from 1996 to 2008. Ms. Johnson is an attorney, certified public accountant and a certified managerial accountant. | | N/A |
38 | Wells Fargo Adjustable Rate Government Fund
Other information (unaudited)
| | | | | | |
Name and year of birth | | Position held and
length of service* | | Principal occupations during past five years or longer | | Current other
public company or
investment
company
directorships |
| | | |
David F. Larcker (Born 1950) | | Trustee, since 2009 | | James Irvin Miller Professor of Accounting at the Graduate School of Business, Stanford University, Director of the Corporate Governance Research Initiative and Senior Faculty of The Rock Center for Corporate Governance since 2006. From 2005 to 2008, Professor of Accounting at the Graduate School of Business, Stanford University. Prior thereto, Ernst & Young Professor of Accounting at The Wharton School, University of Pennsylvania from 1985 to 2005. | | N/A |
| | | |
Olivia S. Mitchell (Born 1953) | | Trustee, since 2006; Nominating and Governance Committee Chairman, since 2018 | | International Foundation of Employee Benefit Plans Professor, Wharton School of the University of Pennsylvania since 1993. Director of Wharton’s Pension Research Council and Boettner Center on Pensions & Retirement Research, and Research Associate at the National Bureau of Economic Research. Previously, Cornell University Professor from 1978 to 1993. | | N/A |
| | | |
Timothy J. Penny (Born 1951) | | Trustee, since 1996; Chairman, since 2018 | | President and Chief Executive Officer of Southern Minnesota Initiative Foundation, a non-profit organization, since 2007. Member of the Board of Trustees of NorthStar Education Finance, Inc., a non-profit organization, since 2007. | | N/A |
| | | |
James G. Polisson (Born 1959) | | Trustee, since 2018 | | Retired. Chief Marketing Officer, Source (ETF) UK Services, Ltd, from 2015 to 2017. From 2012 to 2015, Principal of The Polisson Group, LLC, a management consulting, corporate advisory and principal investing company. Chief Executive Officer and Managing Director at Russell Investments, Global Exchange Traded Funds from 2010 to 2012. Managing Director of Barclays Global Investors from 1998 to 2010 and Global Chief Marketing Officer for iShares and Barclays Global Investors from 2000 to 2010. Trustee of the San Francisco Mechanics’ Institute, a non-profit organization, from 2013 to 2015. Board member of the Russell Exchange Traded Fund Trust from 2011 to 2012. Director of Barclays Global Investors Holdings Deutschland GmbH from 2006 to 2009. Mr. Polisson is an attorney and has a retired status with the Massachusetts and District of Columbia Bar Associations. | | N/A |
| * | Length of service dates reflect the Trustee’s commencement of service with the Trust’s predecessor entities, where applicable. |
Wells Fargo Adjustable Rate Government Fund | 39
Other information (unaudited)
Officers
| | | | |
Name and year of birth | | Position held and
length of service | | Principal occupations during past five years or longer |
| | |
| Andrew Owen (Born 1960) | | President, since 2017 | | Executive Vice President of Wells Fargo & Company and Head of Affiliated Managers, Wells Fargo Asset Management, since 2014. In addition, Mr. Owen is currently President, Chief Executive Officer and Director of Wells Fargo Funds Management, LLC since 2017. Prior thereto, Executive Vice President responsible for marketing, investments and product development for Wells Fargo Funds Management, LLC, from 2009 to 2014. |
| | |
Nancy Wiser1 (Born 1967) | | Treasurer, since 2012 | | Executive Vice President of Wells Fargo Funds Management, LLC since 2011. Chief Operating Officer and Chief Compliance Officer at LightBox Capital Management LLC, from 2008 to 2011. |
| | |
Michelle Rhee3 (Born 1966) | | Chief Legal Officer, since 2019 | | Secretary of Wells Fargo Funds Management, LLC, Chief Legal Counsel of Wells Fargo Asset Management and Assistant General Counsel of Wells Fargo Bank, N.A. since 2018. Associate General Counsel and Managing Director of Bank of America Corporation from 2004 to 2018. |
| | |
Catherine Kennedy4 (Born 1969) | | Secretary, since 2019 | | Vice President of Wells Fargo Funds Management, LLC and Senior Counsel of the Wells Fargo Legal Department since 2010. Vice President and Senior Counsel of Evergreen Investment Management Company, LLC from 1998 to 2010. |
| | |
Michael H. Whitaker (Born 1967) | | Chief Compliance Officer, since 2016 | | Chief Compliance Officer of Wells Fargo Asset Management since 2016. Senior Vice President and Chief Compliance Officer for Fidelity Investments from 2007 to 2016. |
| | |
David Berardi (Born 1975) | | Assistant Treasurer, since 2009 | | Vice President of Wells Fargo Funds Management, LLC since 2009. Vice President of Evergreen Investment Management Company, LLC from 2008 to 2010. Manager of Fund Reporting and Control for Evergreen Investment Management Company, LLC from 2004 to 2010. |
| | |
| Jeremy DePalma1 (Born 1974) | | Assistant Treasurer, since 2009 | | Senior Vice President of Wells Fargo Funds Management, LLC since 2009. Senior Vice President of Evergreen Investment Management Company, LLC from 2008 to 2010 and head of the Fund Reporting and Control Team within Fund Administration from 2005 to 2010. |
| 1 | Nancy Wiser acts as Treasurer of 65 funds in the Fund Complex. Jeremy DePalma acts as Treasurer of 87 funds and Assistant Treasurer of 65 funds in the Fund Complex. |
| 2 | The Statement of Additional Information includes additional information about the Trustees and is available, without charge, upon request, by calling1-800-222-8222 or by visiting the website atwfam.com. |
| 3 | Michelle Rhee became Chief Legal Officer effective October 22, 2019. |
| 4 | Catherine Kennedy became Secretary effective October 22, 2019. |
40 | Wells Fargo Adjustable Rate Government Fund
Other information (unaudited)
BOARD CONSIDERATION OF INVESTMENT MANAGEMENT AND SUB-ADVISORY AGREEMENTS:
Wells Fargo Adjustable Rate Government Fund
Under the Investment Company Act of 1940 (the “1940 Act”), the Board of Trustees (the “Board”) of Wells Fargo Funds Trust (the “Trust”) must determine annually whether to approve the continuation of the Trust’s investment management and sub-advisory agreements. In this regard, at an in-person meeting held on May 21-22, 2019 (the “Meeting”), the Board, all the members of which have no direct or indirect interest in the investment management and sub-advisory agreements and are not “interested persons” of the Trust, as defined in the 1940 Act (the “Independent Trustees”), reviewed and approved for Wells Fargo Adjustable Rate Government Fund (the “Fund”): (i) an investment management agreement (the “Management Agreement”) with Wells Fargo Funds Management, LLC (“Funds Management”); and (ii) an investment sub-advisory agreement (the “Sub-Advisory Agreement”) with Wells Capital Management Incorporated (the “Sub-Adviser”), an affiliate of Funds Management. The Management Agreement and the Sub-Advisory Agreement are collectively referred to as the “Advisory Agreements.”
At the Meeting, the Board considered the factors and reached the conclusions described below relating to the selection of Funds Management and the Sub-Adviser and the approval of the Advisory Agreements. Prior to the Meeting, including at an in-person meeting in April 2019, the Trustees conferred extensively among themselves and with representatives of Funds Management about these matters. Also, the Board has adopted a team-based approach, with each team consisting of a sub-set of Trustees, to assist the full Board in the discharge of its duties in reviewing investment performance and other matters throughout the year. The Independent Trustees were assisted in their evaluation of the Advisory Agreements by independent legal counsel, from whom they received separate legal advice and with whom they met separately.
In providing information to the Board, Funds Management and the Sub-Adviser were guided by a detailed set of requests for information submitted to them by independent legal counsel on behalf of the Independent Trustees at the start of the Board’s annual contract renewal process earlier in 2019. In considering and approving the Advisory Agreements, the Trustees considered the information they believed relevant, including but not limited to the information discussed below. The Board considered not only the specific information presented in connection with the Meeting, but also the knowledge gained over time through interaction with Funds Management and the Sub-Adviser about various topics. In this regard, the Board reviewed reports of Funds Management at each of its quarterly meetings, which included, among other things, portfolio reviews and investment performance reports. In addition, the Board and the teams mentioned above confer with portfolio managers at various times throughout the year. The Board did not identify any particular information or consideration that was all-important or controlling, and each individual Trustee may have attributed different weights to various factors.
After its deliberations, the Board unanimously approved the continuation of the Advisory Agreements for a one-year term and determined that the compensation payable to Funds Management and the Sub-Adviser under each of the Advisory Agreements was reasonable. The Board considered the approval of the Advisory Agreements for the Fund as part of its consideration of agreements for funds across the complex, but its approvals were made on a fund-by-fund basis. The following summarizes a number of important, but not necessarily all, factors considered by the Board in support of its approvals.
Nature, extent and quality of services
The Board received and considered various information regarding the nature, extent and quality of services provided to the Fund by Funds Management and the Sub-Adviser under the Advisory Agreements. This information included a description of the investment advisory services and Fund-level administrative services covered by the Management Agreement, as well as, among other things, a summary of the background and experience of senior management of Wells Fargo Asset Management (“WFAM”), of which Funds Management and the Sub-Adviser are a part, a summary of investments made in the business of WFAM, a summary of certain organizational and personnel changes involving Funds Management and the Sub-Adviser, and a description of Funds Management’s and the Sub-Adviser’s business continuity planning programs and of their approaches to data privacy and cybersecurity. The Board received and reviewed information about Funds Management’s role as administrator of the Fund’s liquidity risk management program. The Board also considered the qualifications, background, tenure and responsibilities of each of the portfolio managers primarily responsible for the day-to-day portfolio management of the Fund.
The Board evaluated the ability of Funds Management and the Sub-Adviser to attract and retain qualified investment professionals, including research, advisory and supervisory personnel. The Board further considered the compliance programs and compliance records of Funds Management and the Sub-Adviser. In addition, the Board took into account the full range of services provided to the Fund by Funds Management and its affiliates.
Wells Fargo Adjustable Rate Government Fund | 41
Other information (unaudited)
Fund investment performance and expenses
The Board considered the investment performance results for the Fund over various time periods ended December 31, 2018. The Board considered these results in comparison to the investment performance of funds in a universe that was determined by Broadridge Inc. (“Broadridge”) to be similar to the Fund (the “Universe”), and in comparison to the Fund’s benchmark index and to other comparative data. Broadridge is an independent provider of investment company data. The Board received a description of the methodology used by Broadridge to select the mutual funds in the performance Universe. The Board noted that the investment performance of the Fund (Class A) was lower than the average investment performance of the Universe for the one-, three- and five-year periods under review, but higher than the average investment performance of the Universe for the ten-year period under review. The Board also noted that the investment performance of the Fund was lower than its benchmark index, the Bloomberg Barclays 6-Month Treasury Bill Index, for the one-, three- and five-year periods under review, but higher than its benchmark for the ten-year period under review.
The Board received information concerning, and discussed factors contributing to, the underperformance of the Fund relative to the Universe and benchmark for the periods identified above. The Board took note of the explanations for the relative underperformance during these periods, including with respect to the Fund’s investment strategies and structural biases, as well as those regarding market factors, that affected the Fund’s investment performance.
The Board also received and considered information regarding the Fund’s net operating expense ratios and their various components, including actual management fees, custodian and other non-management fees, and Rule 12b-1 and non-Rule 12b-1 shareholder service fees. The Board considered these ratios in comparison to the median ratios of funds in class-specific expense groups that were determined by Broadridge to be similar to the Fund (the “Groups”). The Board received a description of the methodology used by Broadridge to select the mutual funds in the expense Groups and an explanation of how funds comprising expense groups and their expense ratios may vary from year-to-year. Based on the Broadridge reports, the Board noted that the net operating expense ratios of the Fund were in range of or equal to the median net operating expense ratios of the expense Groups for each share class, except for the Fund’s Institutional Class, which had a net operating expense ratio that was higher than the median net operating expense ratio of its expense Group.
The Board took into account the Fund’s investment performance and expense information provided to it among the factors considered in deciding to re-approve the Advisory Agreements.
Investment management and sub-advisory fee rates
The Board reviewed and considered the contractual fee rates payable by the Fund to Funds Management under the Management Agreement, as well as the contractual fee rates payable by the Fund to Funds Management for class-level administrative services under a Class-Level Administration Agreement, which include, among other things, class-level transfer agency and sub-transfer agency costs (collectively, the “Management Rates”). The Board also reviewed and considered the contractual investment sub-advisory fee rates that are payable by Funds Management to the Sub-Adviser for investment sub-advisory services.
Among other information reviewed by the Board was a comparison of the Fund’s Management Rates with the average contractual investment management fee rates of funds in the expense Groups at a common asset level as well as transfer agency costs of the funds in the expense Groups. The Board noted that the Management Rates of the Fund were in range of the sum of these average rates for the Fund’s expense Groups for all share classes.
The Board also received and considered information about the portion of the total management fee that was retained by Funds Management after payment of the fee to the Sub-Adviser for sub-advisory services. In assessing the reasonableness of this amount, the Board received and evaluated information about the nature and extent of responsibilities retained and risks assumed by Funds Management and not delegated to or assumed by the Sub-Adviser, and about Funds Management’s on-going oversight services. Given the affiliation between Funds Management and the Sub-Adviser, the Board ascribed limited relevance to the allocation of fees between them.
The Board also received and considered information about the nature and extent of services offered and fee rates charged by Funds Management and the Sub-Adviser to other types of clients with investment strategies similar to those of the Fund. In this regard, the Board received information about the significantly greater scope of services, and compliance, reporting and other legal burdens and risks of managing proprietary mutual funds compared with those associated with managing assets of other types of clients, including third-party sub-advised fund clients and non-mutual fund clients such as institutional separate accounts.
Based on its consideration of the factors and information it deemed relevant, including those described here, the Board determined that the compensation payable to Funds Management under the Management Agreement and to the Sub-Adviser under the Sub-Advisory Agreement was reasonable.
42 | Wells Fargo Adjustable Rate Government Fund
Other information (unaudited)
Profitability
The Board received and considered information concerning the profitability of Funds Management, as well as the profitability of both WFAM and Wells Fargo & Co. (“Wells Fargo”) from providing services to the fund family as a whole. The Board noted that the Sub-Adviser’s profitability information with respect to providing services to the Fund and other funds in the family was subsumed in the WFAM and Wells Fargo profitability analysis.
Funds Management reported on the methodologies and estimates used in calculating profitability, including a description of the methodology used to allocate certain expenses. Among other things, the Board noted that the levels of profitability reported on a fund-by-fund basis varied widely, depending on factors such as the size, type and age of fund. Based on its review, the Board did not deem the profits reported by Funds Management, WFAM or Wells Fargo from services provided to the Fund to be at a level that would prevent it from approving the continuation of the Advisory Agreements.
Economies of scale
The Board received and considered information about the potential for Funds Management to experience economies of scale in the provision of management services to the Fund, the difficulties of calculating economies of scale at an individual fund level, and the extent to which potential scale benefits are shared with shareholders. The Board noted the existence of breakpoints in the Fund’s management fee structure, which operate generally to reduce the Fund’s expense ratios as the Fund grows in size. The Board considered that in addition to management fee breakpoints, Funds Management shares potential economies of scale from its management business in a variety of ways, including through fee waiver and expense reimbursement arrangements, services that benefit shareholders, competitive management fee rates set at the outset without regard to breakpoints, and investments in the business intended to enhance services available to shareholders.
The Board concluded that Funds Management’s arrangements with respect to the Fund, including contractual breakpoints, constituted a reasonable approach to sharing potential economies of scale with the Fund and its shareholders.
Other benefits to Funds Management and the Sub-Adviser
The Board received and considered information regarding potential “fall-out” or ancillary benefits received by Funds Management and its affiliates, including the Sub-Adviser, as a result of their relationships with the Fund. Ancillary benefits could include, among others, benefits directly attributable to other relationships with the Fund and benefits potentially derived from an increase in Funds Management’s and the Sub-Adviser’s business as a result of their relationships with the Fund. The Board noted that various affiliates of Funds Management may receive distribution-related fees, shareholder servicing payments and sub-transfer agency fees in respect of shares sold or held through them and services provided.
The Board also reviewed information about soft dollar credits earned and utilized by the Sub-Adviser, fees earned by Funds Management and the Sub-Adviser from managing a private investment vehicle for the fund family’s securities lending collateral, and commissions earned by an affiliated broker from portfolio transactions.
Based on its consideration of the factors and information it deemed relevant, including those described here, the Board did not find that any ancillary benefits received by Funds Management and its affiliates, including the Sub-Adviser, were unreasonable.
Conclusion
At the Meeting, after considering the above-described factors and based on its deliberations and its evaluation of the information described above, the Board unanimously approved the continuation of the Advisory Agreements for a one-year term and determined that the compensation payable to Funds Management and the Sub-Adviser under each of the Advisory Agreements was reasonable.
Wells Fargo Adjustable Rate Government Fund | 43
This page is intentionally left blank.

For more information
More information about Wells Fargo Funds is available free upon request. To obtain literature, please write, visit the Fund’s website, or call:
Wells Fargo Funds
P.O. Box 219967
Kansas City, MO 64121-9967
Website:wfam.com
Individual investors:1-800-222-8222
Retail investment professionals:1-888-877-9275
Institutional investment professionals:1-866-765-0778

This report and the financial statements contained herein are submitted for the general information of the shareholders of the Fund. If this report is used for promotional purposes, distribution of the report must be accompanied or preceded by a current prospectus. Before investing, please consider the investment objectives, risks, charges, and expenses of the investment. For a current prospectus and, if available, a summary prospectus, containing this information, call1-800-222-8222 or visit the Fund’s website atwfam.com. Read the prospectus carefully before you invest or send money.
Wells Fargo Asset Management (WFAM) is the trade name for certain investment advisory/management firms owned by Wells Fargo & Company. These firms include but are not limited to Wells Capital Management Incorporated and Wells Fargo Funds Management, LLC. Certain products managed by WFAM entities are distributed by Wells Fargo Funds Distributor, LLC (a broker-dealer and Member FINRA).
This material is for general informational and educational purposes only and is NOT intended to provide investment advice or a recommendation of any kind—including a recommendation for any specific investment, strategy, or plan.
INVESTMENT PRODUCTS: NOT FDIC INSURED ◾ NO BANK GUARANTEE ◾ MAY LOSE VALUE
© 2019 Wells Fargo Funds Management, LLC. All rights reserved.
405801 10-19
A215/AR215 08-19
Annual Report
August 31, 2019
Wells Fargo High Yield Bond Fund
Beginning on January 1, 2021, as permitted by new regulations adopted by the Securities and Exchange Commission, paper copies of the Wells Fargo Funds’ annual and semi-annual shareholder reports issued after this date will no longer be sent by mail, unless you specifically request paper copies of the reports. Instead, the reports will be made available on the Funds’ website, and you will be notified by mail each time a report is posted and provided with a website address to access the report.
If you already elected to receive shareholder reports electronically, you will not be affected by this change and you need not take any action. You may elect to receive shareholder reports and other communications from the Fund electronically at any time by contacting your financial intermediary (such as a broker-dealer or bank) or, if you are a direct investor, by calling1-800-222-8222 or by enrolling at wellsfargo.com/advantagedelivery.
You may elect to receive all future reports in paper free of charge. If you invest through a financial intermediary, you can contact your financial intermediary to request that you continue to receive paper copies of your shareholder reports; if you invest directly with the Fund, you can call 1-800-222-8222. Your election to receive reports in paper will apply to all Wells Fargo Funds held in your account with your financial intermediary or, if you are a direct investor, to all Wells Fargo Funds that you hold.
|
|
|
Reduce clutter. Save trees. |
Sign up for electronic delivery of prospectuses and shareholder reports atwellsfargo.com/advantagedelivery |
The views expressed and any forward-looking statements are as of August 31, 2019, unless otherwise noted, and are those of the Fund managers and/or Wells Fargo Asset Management. Discussions of individual securities, or the markets generally, or any Wells Fargo Fund are not intended as individual recommendations. Future events or results may vary significantly from those expressed in any forward-looking statements. The views expressed are subject to change at any time in response to changing circumstances in the market. Wells Fargo Asset Management and the Fund disclaim any obligation to publicly update or revise any views expressed or forward-looking statements.
INVESTMENT PRODUCTS: NOT FDIC INSURED ◾ NO BANK GUARANTEE ◾ MAY LOSE VALUE
Wells Fargo High Yield Bond Fund | 1
Letter to shareholders (unaudited)

Andrew Owen
President
Wells Fargo Funds
Dear Shareholder:
We are pleased to offer you this annual report for the Wells Fargo High Yield Bond Fund for the 12-month period that ended August 31, 2019. After the first half of the period yielded either low-single-digit or negative investment returns, U.S. stock and global bond investors generally saw markets recover during the second half amid intensifying market volatility, global economic growth concerns, international trade staredowns, and simmering geopolitical tensions.
Overall, fixed-income investors enjoyed a distinct advantage over stock investors. For the period, U.S. stocks, based on the S&P 500 Index,1 gained 2.92% and international stocks, as measured by the MSCI ACWI ex USA Index (Net),2 fell 3.27%. The MSCI EM Index (Net)3 slipped 4.36%. Among fixed income investors, the Bloomberg Barclays U.S. Aggregate Bond Index4 added 10.17%, the Bloomberg Barclays Global Aggregate ex-USD Index5 added 5.71%, the Bloomberg Barclays Municipal Bond Index6 gained 8.72%, and the ICE BofAML U.S. High Yield Index7 added 6.58%.
Entering the fourth quarter of 2018, economic data was encouraging.
Entering the fourth quarter of 2018, there were reasons for investors to be optimistic. The U.S. Bureau of Economic Analysis reported U.S. gross domestic product (GDP) grew 4.2% on an annualized basis during the second quarter. Hiring improved. Unemployment declined. Consumer spending gained. Third-quarter corporate earnings reports were generally positive. U.S. trade negotiations with Mexico and Canada advanced. In September 2018, the U.S. Federal Reserve (Fed) raised the federal funds rate by 25 basis points (bps; 100 bps equal 1.00%) to a target range of between 2.00% and 2.25% in an indication of its confidence that U.S. economic growth was sustainable.
International markets presented numerous challenges. U.S.-China trade tensions increased. The U.S. imposed $200 billion in tariffs on Chinese goods. China reacted with $60 billion in tariffs on U.S. goods. Economic growth in China caused concern. In September 2018, international investors began to factor in a number of disconcerting economic and business data points: lower July manufacturing and industrial orders in Germany; declining purchasing managers’ index numbers for August from the United Kingdom, China, and India; and declining household spending for August in Japan. Taken together, the data fed growing concerns that global economic growth was slowing.
| 1 | The S&P 500 Index consists of 500 stocks chosen for market size, liquidity, and industry group representation. It is a market-value-weighted index with each stock’s weight in the index proportionate to its market value. You cannot invest directly in an index. |
| 2 | The Morgan Stanley Capital International (MSCI) All Country World Index (ACWI) ex USA Index (Net) is a free-float-adjusted market-capitalization weighted index that is designed to measure the equity market performance of developed and emerging markets, excluding the U.S. Source: MSCI. MSCI makes no express or implied warranties or representations and shall have no liability whatsoever with respect to any MSCI data contained herein. The MSCI data may not be further redistributed or used as a basis for other indices or any securities or financial products. This report is not approved, reviewed, or produced by MSCI. You cannot invest directly in an index. |
| 3 | The MSCI Emerging Markets (EM) Index (Net) is a free-float-adjusted market-capitalization-weighted index that is designed to measure the equity market performance of emerging markets. You cannot invest directly in an index. |
| 4 | The Bloomberg Barclays U.S. Aggregate Bond Index is a broad-based benchmark that measures the investment-grade, U.S. dollar-denominated, fixed-rate taxable bond market, including Treasuries, government-related and corporate securities, mortgage-backed securities (agency fixed-rate and hybrid adjustable-rate mortgage pass-throughs), asset-backed securities, and commercial mortgage-backed securities. You cannot invest directly in an index. |
| 5 | The Bloomberg Barclays Global Aggregate ex-USD Index is an unmanaged index that provides a broad-based measure of the global investment-grade fixed-income markets excluding the U.S. dollar-denominated debt market. You cannot invest directly in an index. |
| 6 | The Bloomberg Barclays Municipal Bond Index is an unmanaged index composed of long-term tax-exempt bonds with a minimum credit rating of Baa. You cannot invest directly in an index. |
| 7 | The ICE BofAML U.S. High Yield Index is a market-capitalization-weighted index of domestic and Yankee high-yield bonds. The index tracks the performance of high-yield securities traded in the U.S. bond market. You cannot invest directly in an index. Copyright 2019. ICE Data Indices, LLC. All rights reserved. |
2 | Wells Fargo High Yield Bond Fund
Letter to shareholders (unaudited)
Investors had to digest unsettling events during the fourth quarter of 2018.
November’s U.S. midterm elections shifted control of the House of Representatives from Republicans to Democrats, presaging partisan clashes that followed and caused uncertainty among investors. A partial U.S. government shutdown driven by partisan policy disputes extended into January 2019. Third-quarter U.S. GDP was announced at an annualized 3.4% rate, lower than the second-quarter rate. Brexit efforts stalled. The value of the renminbi declined even as the People’s Bank of China cut reserve requirement ratios, accelerated infrastructure spending, and cut taxes in efforts to spur economic activity.
The combination of news in the U.S. and generally weak economic indicators outside of the U.S. caused investors to seek safe havens. December’s S&P 500 Index performance was the worst since 1931. Globally, fixed-income investments fared better than stocks during the last two months of the year. The Fed increased the federal funds rate by 25 bps in December 2018 to a target range of between 2.25% and 2.50% even as observers expressed concerns that higher rates could slow the economy.
The market climbs a wall of worry.
Investment returns appeared to reaffirm the adage that markets climb a wall of worry as 2019 opened. Following its December decline, the S&P 500 Index gained 8.01% for the month of January, the best monthly performance in 30 years. Returns for the MSCI ACWI ex USA Index (Net), the Bloomberg Barclays U.S. Aggregate Bond Index, and the Bloomberg Barclays Global Aggregate ex-USD Index also were positive.
In February 2019, signs of slowing global growth grew more ominous. The Bureau of Economic Analysis announced fourth-quarter 2018 GDP grew at an annualized 2.2% rate, down from the levels of the prior two quarters. In a February report, the Bank of England forecast the slowest growth for 2019 since the financial crisis. China and the U.S. continued to wrangle over trade issues. By the end of the first quarter of 2019, more accommodative Fed sentiment and steady, if not spectacular, U.S. economic and business metrics encouraged domestic investors.
Early second-quarter 2019 enthusiasm among investors faded.
During April 2019, favorable sentiment found additional support in reports of sustained low inflation, solid employment data, and first-quarter U.S. GDP of an annualized rate of 3.2%. During May, markets tumbled on mixed investment signals. In the U.S., partisan wrangling ramped up as Democrats and Republicans set their sights on 2020 presidential politics. The U.K.’s Brexit contretemps caused Prime Minister Theresa May to resign. Boris Johnson succeeded her only to exacerbate uncertainty about Brexit’s resolution ahead of an October 2019 deadline. The European Commission downgraded the 2019 growth forecast to 1.2%. The U.S. increased tariffs on products from China, China responded, and then talks broke down. President Donald Trump threatened to turn his foreign policy tariff tool to Mexico over immigration issues.
During the third quarter of 2019, investors regrouped. Just as the investment horizon appeared to darken, sentiment turned and U.S. equity markets gained during June and July. The gains, primarily driven by geopolitical and monetary policy events, pushed equity markets to new highs. European Central Bank President Mario Draghi said that if the outlook doesn’t improve, the bank would cut rates or buy more assets to prop up inflation. President Trump backed off of tariff threats against Mexico and China. In the U.S., the Fed implemented a 0.25% federal funds rate cut in July.
Later in July, the U.S. reversed course and threatened to impose higher tariffs on China’s exports after talks failed. China responded with tariff threats of its own and
“December’s S&P 500 Index performance was the worst since 1931.”
“Following its December decline, the S&P 500 Index gained 8.01% for the month of January, the best monthly performance in 30 years.”
Wells Fargo High Yield Bond Fund | 3
Letter to shareholders (unaudited)
|
|
|
For further information about your Fund, contact your investment professional, visit our website at wfam.com, or call us directly at1-800-222-8222. |
devalued the renminbi, a move that roiled global markets. Major U.S. stock market indices closed July 2019 with the worst weekly results of the year. Bond prices gained as Treasury yields fell to levels not seen since November 2016 and the yield curve inverted at multiple points along the 30-year arc.
In a microcosm, August 2019 encapsulated many of the unnerving events that plagued investors during the prior 11 months. The U.S.-China trade relationship swung from discouraging to hopeful and back again with no evident compromise on the horizon. Evidence of a continued global economic slowdown continued to mount as central banks in China, New Zealand, and Thailand cut interest rates. Industrial and manufacturing data declined in China, Canada, Japan, and Germany. Adding to the uncertain environment, Italy’s prime minister resigned, many feared a crackdown in Hong Kong as protesters sustained their calls for reform throughout the month, and Boris Johnson planned to suspend Parliament as Brexit’s deadline neared.
Don’t let short-term uncertainty derail long-term investment goals.
Periods of investment uncertainty can present challenges, but experience has taught us that maintaining long-term investment goals can be an effective way to plan for the future. To help you create a sound strategy based on your personal goals and risk tolerance, Wells Fargo Funds offers more than 100 mutual funds spanning a wide range of asset classes and investment styles. Although diversification cannot guarantee an investment profit or prevent losses, we believe it can be an effective way to manage investment risk and potentially smooth out overall portfolio performance. We encourage investors to know their investments and to understand that appropriate levels of risk-taking may unlock opportunities.
Thank you for choosing to invest with Wells Fargo Funds. We appreciate your confidence in us and remain committed to helping you meet your financial needs.
Sincerely,

Andrew Owen
President
Wells Fargo Funds
4 | Wells Fargo High Yield Bond Fund
This page is intentionally left blank.
Performance highlights (unaudited)
Investment objective
The Fund seeks total return, consisting of a high level of current income and capital appreciation.
Manager
Wells Fargo Funds Management, LLC
Subadviser
Wells Capital Management Incorporated
Portfolio manager
Robert Junkin‡
Margaret D. Patel
Average annual total returns (%) as of August 31, 2019
| | | | | | | | | | | | | | | | | | | | | | | | | | | | | | | | | | |
| | | | |
| | | | | Including sales charge | | | Excluding sales charge | | | Expense ratios1 (%) | |
| | | | | | | | | |
| | | Inception date | | 1 year | | | 5 year | | | 10 Year | | | 1 year | | | 5 year | | | 10 Year | | | Gross | | | Net2 | |
| | | | | | | | | | |
| Class A (EKHAX)3 | | 1-20-1998 | | | 0.20 | | | | 3.00 | | | | 6.70 | | | | 4.79 | | | | 3.96 | | | | 7.19 | | | | 1.02 | | | | 0.93 | |
| | | | | | | | | | |
| Class C (EKHCX)3 | | 1-21-1998 | | | 3.00 | | | | 3.19 | | | | 6.39 | | | | 4.00 | | | | 3.19 | | | | 6.39 | | | | 1.77 | | | | 1.68 | |
| | | | | | | | | | |
| Administrator Class (EKHYX)3 | | 4-14-1998 | | | – | | | | – | | | | – | | | | 4.60 | | | | 4.07 | | | | 7.40 | | | | 0.96 | | | | 0.80 | |
| | | | | | | | | | |
| Institutional Class (EKHIX)3,4 | | 10-31-2014 | | | – | | | | – | | | | – | | | | 5.20 | | | | 4.28 | | | | 7.51 | | | | 0.69 | | | | 0.53 | |
| | | | | | | | | | |
| ICE BofAML U.S. High Yield Constrained Index5 | | – | | | – | | | | – | | | | – | | | | 6.58 | | | | 4.85 | | | | 8.43 | | | | – | | | | – | |
Figures quoted represent past performance, which is no guarantee of future results, and do not reflect taxes that a shareholder may pay on fund distributions or the redemption of fund shares. Investment return and principal value of an investment will fluctuate so that an investor’s shares, when redeemed, may be worth more or less than their original cost. Performance shown without sales charges would be lower if sales charges were reflected. Current performance may be lower or higher than the performance data quoted, which assumes the reinvestment of dividends and capital gains. Current month-end performance is available on the Fund’s website,wfam.com.
Index returns do not include transaction costs associated with buying and selling securities, any mutual fund fees or expenses, or any taxes. It is not possible to invest directly in an index.
For Class A shares, the maximum front-end sales charge is 4.50%. For Class C shares, the maximum contingent deferred sales charge is 1.00%. Performance including a contingent deferred sales charge assumes the sales charge for the corresponding time period. Administrator Class and Institutional Class shares are sold without a front-end sales charge or contingent deferred sales charge.
Bond values fluctuate in response to the financial condition of individual issuers, general market and economic conditions, and changes in interest rates. Changes in market conditions and government policies may lead to periods of heightened volatility in the bond market and reduced liquidity for certain bonds held by the Fund. In general, when interest rates rise, bond values fall and investors may lose principal value. Interest rate changes and their impact on the Fund and its share price can be sudden and unpredictable. The use of derivatives may reduce returns and/or increase volatility. High-yield securities have a greater risk of default and tend to be more volatile than higher-rated debt securities. Loans are subject to risks similar to those associated with other below investment-grade bond investments, such as credit risk (for example, risk of issuer default), below investment-grade bond risk (for example, risk of greater volatility in value), and risk that the loan may become illiquid or difficult to price. The Fund is exposed to foreign investment risk. Consult the Fund’s prospectus for additional information on these and other risks.
Please see footnotes on page 7.
6 | Wells Fargo High Yield Bond Fund
Performance highlights (unaudited)
|
|
| Growth of $10,000 investment as of August 31, 20196 |
|
|
| ‡ | Mr. Robert Junkin became a portfolio manager of the Fund on April 1, 2019. |
| 1 | Reflects the expense ratios as stated in the most recent prospectuses. The expense ratios shown are subject to change and may differ from the annualized expense ratios shown in the financial highlights of this report. |
| 2 | The manager has contractually committed through December 31, 2019, to waive fees and/or reimburse expenses to the extent necessary to cap the expenses of each class after fee waivers at the amounts shown. Brokerage commissions, stamp duty fees, interest, taxes, acquired fund fees and expenses (if any), and extraordinary expenses are excluded from the expense cap. Prior to or after the commitment expiration date, the cap may be increased or the commitment to maintain the cap may be terminated only with the approval of the Board of Trustees. Without this cap, the Fund’s returns would have been lower. The expense ratio paid by an investor is the net expense ratio (the total annual fund operating expenses after fee waivers) as stated in the prospectuses. |
| 3 | Historical performance prior to July 12, 2010 is based on the performance of the Fund’s predecessor, Evergreen High Income Fund. |
| 4 | Historical performance shown for the Institutional Class shares prior to their inception reflects the performance of the Administrator Class shares, and is not adjusted to reflect the Institutional Class expenses. If these expenses had been included, returns for the Institutional Class shares would be higher. |
| 5 | The ICE BofAML U.S. High Yield Constrained Index is a market value-weighted index of all domestic and Yankee high-yield bonds, including deferred interest bonds and payment-in kind securities. Issues included in the index have maturities of one year or more and have a credit rating lower than BBB–/Baa3, but are not in default. The ICE BofAML U.S. High Yield Constrained Index limits any individual issuer to a maximum of 2% benchmark exposure. You cannot invest directly in an index. Copyright 2019. ICE Data Indices, LLC. All rights reserved. |
| 6 | The chart compares the performance of Class A shares for the most recent ten years with the performance of the ICE BofAML U.S. High Yield Constrained Index. The chart assumes a hypothetical investment of $10,000 in Class A shares and reflects all operating expenses and assumes the maximum initial sales charge of 4.50%. |
| 7 | The Russell 1000® Index measures the performance of the 1,000 largest companies in the Russell 3000® Index, which represents approximately 92% of the total market capitalization of the Russell 3000® Index. You cannot invest directly in an index. |
| 8 | The ten largest holdings, excluding cash, cash equivalents and any money market funds, are calculated based on the value of the investments divided by total net assets of the Fund. Holdings are subject to change and may have changed since the date specified. |
| 9 | The credit quality distribution of portfolio holdings reflected in the chart is based on ratings from Standard & Poor’s, Moody’s Investors Service, and/ or Fitch Ratings Ltd. Credit quality ratings apply to the underlying holdings of the Fund and not to the Fund itself. The percentages of the Fund’s portfolio with the ratings depicted in the chart are calculated based on the total market value of fixed income securities held by the Fund. If a security was rated by all three rating agencies, the middle rating was utilized. If rated by two of three rating agencies, the lower rating was utilized, and if rated by one of the rating agencies, that rating was utilized. Standard & Poor’s rates the creditworthiness of bonds, ranging from AAA (highest) to D (lowest). Ratings from A to CCC may be modified by the addition of a plus (+) or minus (-) sign to show relative standing within the rating categories. Standard & Poor’s rates the creditworthiness of short-term notes from SP-1 (highest) to SP-3 (lowest). Moody’s rates the creditworthiness of bonds, ranging from Aaa (highest) to C (lowest). Ratings Aa to B may be modified by the addition of a number 1 (highest) to 3 (lowest) to show relative standing within the ratings categories. Moody’s rates the creditworthiness of short-term U.S. tax-exempt municipal securities from MIG 1/VMIG 1 (highest) to SG (lowest). Fitch rates the creditworthiness of bonds, ranging from AAA (highest) to D (lowest). Credit quality distribution is subject to change and may have changed since the date specified. |
| * | This security was no longer held at the end of the reporting period. |
Wells Fargo High Yield Bond Fund | 7
Performance highlights (unaudited)
MANAGER’S DISCUSSION
Fund highlights
| ∎ | | The Fund underperformed its benchmark, the ICE BofAML U.S. High Yield Constrained Index, for the 12-month period that ended August 31, 2019. |
| ∎ | | The Fund’s modest allocation to common stocks (about 9% of total assets) moderately detracted from returns. Historically, our small allocation to stocks has helped performance. However, in the fiscal year that ended August 31, 2019, the return of the stock market, as measured by the Russell 1000® Index7, was only slightly positive, in contrast to the high-yield bond market’s better-quality tiers that provided returns in the mid- to high-single digits. |
| ∎ | | Detractors from bond performance included two commodity-related names: Rayonier Advanced Materials Incorporated, which produces specialty cellulose fibers, and Dean Foods Company*, a producer of milk and milk-based products. Also detracting was Mallinckrodt plc, a specialty pharmaceutical company with exposure to opioid litigation. |
| ∎ | | Detractors from equity performance included LyondellBasell Industries N.V., a plastics and chemicals company, and Eastman Chemical Company, a specialty chemicals producer. Plains All American Pipeline, L.P.*, an intrastate energy pipeline transport and storage company, also detracted. |
| ∎ | | The Fund’s overweight to better-quality high-yield bonds contributed to performance in the fiscal year because better-quality credit tiers modestly outperformed lower-quality credit tiers as investors grew slightly more risk-averse in seeking yield. |
| ∎ | | Most sectors of the corporate bond market had modest positive returns over the fiscal year, as prices and yield were relatively flat, and most of the returns were due to coupon income. |
| | | | |
|
| Ten largest holdings (%) as of August 31, 20198 | |
| | |
Valvoline Incorporated, 4.38%, 8-15-2025 | | | 3.63 | |
| | |
Iron Mountain Incorporated, 5.38%, 6-1-2026 | | | 3.41 | |
| | |
Western Digital Corporation, 4.75%, 2-15-2026 | | | 2.91 | |
| | |
Tronox Finance plc, 5.75%, 10-1-2025 | | | 2.88 | |
| | |
Post Holdings Incorporated, 5.00%, 8-15-2026 | | | 2.70 | |
| | |
Seagate HDD, 4.88%, 6-1-2027 | | | 2.53 | |
| | |
TransDigm Group Incorporated, 6.38%, 6-15-2026 | | | 2.50 | |
| | |
MTS Systems Corporation, 5.75%, 8-15-2027 | | | 2.43 | |
| | |
TTM Technologies Incorporated, 5.63%, 10-1-2025 | | | 2.27 | |
| | |
Catalent Pharma Solutions Incorporated,4.88%, 1-15-2026 | | | 2.10 | |
The average yield for high-yield bonds fell over the fiscal year, from 6.31% on August 31, 2018, to 5.87% on August 31, 2019. Because Treasury rates fell over the same period, the yield advantage of high-yield bonds increased from +360 basis points (bps; 100 bps equal 1.00%) at the beginning of the fiscal year to +430 bps at fiscal year-end.
The Fund’s stock allocation was a relatively modest 9% of total assets. The Fund’s stock holdings modestly underperformed its fixed-income holdings, as the equity market produced low-single-digit average returns during the Fund’s fiscal year after a volatile year in stock prices. The flattish performance reflected the market’s concerns about a slowing economy and the risk of higher interest rates despite the actual decline in Treasury yields over the fiscal
year. A number of the Fund’s outperformers were in the technology sector and included Akamai Technologies, Incorporated, which provides services for delivery of internet content; Leidos Holdings, Incorporated, a provider of software services for national security, engineering, and health care; and Cypress Semiconductor Corporation, which received a takeout bid to be acquired by Infineon Technologies AG.
Bond outperformers included Diebold Nixdorf, Incorporated, as the company scored improved results after several quarters of disappointing financial performance. Iron Mountain Incorporated, a storage and information management company, also improved due to better earnings. Post Holdings, Incorporated, a manufacturer of cereal products, outperformed because recent acquisitions had positive results. In the technology sector, bonds of disk-drive maker Seagate Technology plc and Western Digital Corporation, a provider of storage solutions and hard and solid-state drives, contributed to performance.
Fixed-income investors realized generally positive returns during the period.
Low inflation, positive growth, and declining Treasury interest rates provided a positive backdrop for corporate bonds. High-yield bonds had returns mostly from coupon income, with small gains in bond prices. Investment-grade corporate bonds generally produced higher returns as most sectors saw moderate price increases in addition to coupon income. Investment-grade bond yields declined, reflecting falling Treasury interest rates, and thus had mid-single-digit price increases. Treasury bond rates dropped significantly in the fiscal year. Bonds due in 10 years fell from 2.86% on August 31, 2018, to 1.50% at month-end August 2019.
Please see footnotes on page 7.
8 | Wells Fargo High Yield Bond Fund
Performance highlights (unaudited)
|
|
| Credit quality as of August 31, 20199 |
|
 |
We expect continued growth in the months ahead.
The Fund’s positioning reflects our expectation for continued economic growth over the next year, although at levels probably around 2% or somewhat lower than typical in periods of economic expansion. We expect high-yield bonds could offer moderate returns with yields stable or somewhat lower, with mild price appreciation if yields decline from today’s levels. Treasury rates should probably continue in a trading range with a downward bias, as inflation remains low in the U.S. and globally. We are optimistic that the equity market should provide returns well above the risk-free rate of return, as we find stock prices reasonable compared with
the earnings-growth potential of many stocks. In addition, with Treasury issues likely to be at low levels for the foreseeable future, stock dividend yields are attractive alternatives to the yields offered on short-maturity fixed-income securities.
The portfolio maintains an allocation to out-of-benchmark BBB-rated debt with continued avoidance of CCC-rated and distressed holdings, which we believe do not represent good relative investment value. In addition, the Fund is concentrated in companies with operations primarily in the U. S. and has minimal exposure to companies with products and services that are dependent on commodity-based emerging market economies, many of which continue to experience growth rates that are below historical levels.
Virtually all of the Fund’s bond holdings are in companies with U.S. public equity outstanding, which we think provides a more flexible capital structure and more transparent reporting of financial results. We hold a modest allocation to common stocks, believing that this exposure offers fixed-income investors the potential for capital appreciation. In today’s high-yield bond market, most bonds are trading at prices around their face value, limiting the potential for future capital appreciation in our bond holdings.
Risk in the high-yield market could increase.
We believe risk in the high-yield market could arise from those highly levered companies in weak or highly competitive industries, putting pressure on those companies as they seek to service their debts. Thus, at a time of historically low interest rates and relatively narrow yield advantage to be gained from speculative-grade bonds, we continue to position the Fund in relatively higher-quality issues and in industries we perceive to be stable to growing, which may offer the best possibility of earning attractive total returns with lower risk of principal losses from deteriorating credits.
Please see footnotes on page 7.
Wells Fargo High Yield Bond Fund | 9
Fund expenses (unaudited)
As a shareholder of the Fund, you incur two types of costs: (1) transaction costs, including sales charges (loads) on purchase payments and contingent deferred sales charges (if any) on redemptions and (2) ongoing costs, including management fees, distribution (12b-1) and/or shareholder servicing fees, and other Fund expenses. This example is intended to help you understand your ongoing costs (in dollars) of investing in the Fund and to compare these costs with the ongoing costs of investing in other mutual funds.
The example is based on an investment of $1,000 invested at the beginning of the six-month period and held for the entire period from March 1, 2019 to August 31, 2019.
Actual expenses
The “Actual” line of the table below provides information about actual account values and actual expenses. You may use the information in this line, together with the amount you invested, to estimate the expenses that you paid over the period. Simply divide your account value by $1,000 (for example, an $8,600 account value divided by $1,000 = 8.6), then multiply the result by the number in the “Actual” line under the heading entitled “Expenses paid during period” for your applicable class of shares to estimate the expenses you paid on your account during this period.
Hypothetical example for comparison purposes
The “Hypothetical” line of the table below provides information about hypothetical account values and hypothetical expenses based on the Fund’s actual expense ratio and an assumed rate of return of 5% per year before expenses, which is not the Fund’s actual return. The hypothetical account values and expenses may not be used to estimate the actual ending account balance or expenses you paid for the period. You may use this information to compare the ongoing costs of investing in the Fund and other funds. To do so, compare this 5% hypothetical example with the 5% hypothetical examples that appear in the shareholder reports of the other funds.
Please note that the expenses shown in the table are meant to highlight your ongoing costs only and do not reflect any transactional costs, such as sales charges (loads) and contingent deferred sales charges. Therefore, the “Hypothetical” line of the table is useful in comparing ongoing costs only and will not help you determine the relative total costs of owning different funds. In addition, if these transactional costs were included, your costs would have been higher.
| | | | | | | | | | | | | | | | |
| | | Beginning
account value
3-1-2019 | | | Ending
account value
8-31-2019 | | | Expenses
paid during
the period¹ | | | Annualized net
expense ratio | |
| | | | | |
Class A | | | | | | | | | | | | | | | | |
| | | | |
Actual | | $ | 1,000.00 | | | $ | 1,037.31 | | | $ | 4.77 | | | | 0.93 | % |
| | | | |
Hypothetical (5% return before expenses) | | $ | 1,000.00 | | | $ | 1,020.52 | | | $ | 4.74 | | | | 0.93 | % |
| | | | | |
Class C | | | | | | | | | | | | | | | | |
| | | | |
Actual | | $ | 1,000.00 | | | $ | 1,033.41 | | | $ | 8.61 | | | | 1.68 | % |
| | | | |
Hypothetical (5% return before expenses) | | $ | 1,000.00 | | | $ | 1,016.74 | | | $ | 8.54 | | | | 1.68 | % |
| | | | | |
Administrator Class | | | | | | | | | | | | | | | | |
| | | | |
Actual | | $ | 1,000.00 | | | $ | 1,034.81 | | | $ | 4.10 | | | | 0.80 | % |
| | | | |
Hypothetical (5% return before expenses) | | $ | 1,000.00 | | | $ | 1,021.17 | | | $ | 4.07 | | | | 0.80 | % |
| | | | | |
Institutional Class | | | | | | | | | | | | | | | | |
| | | | |
Actual | | $ | 1,000.00 | | | $ | 1,036.16 | | | $ | 2.72 | | | | 0.53 | % |
| | | | |
Hypothetical (5% return before expenses) | | $ | 1,000.00 | | | $ | 1,022.53 | | | $ | 2.70 | | | | 0.53 | % |
| 1 | Expenses paid is equal to the annualized net expense ratio of each class multiplied by the average account value over the period, multiplied by the number of days in the most recent fiscal half-year divided by the number of days in the fiscal year (to reflect the one-half-year period). |
10 | Wells Fargo High Yield Bond Fund
Portfolio of investments—August 31, 2019
| | | | | | | | | | | | | | | | |
| | | | | | | | | Shares | | | Value | |
| Common Stocks: 8.68% | | | | | | | | | | | | | | | | |
| | | | |
Consumer Staples: 0.27% | | | | | | | | | | | | | | | | |
| | | | |
| Food Products: 0.27% | | | | | | | | | | | | |
| | | | |
Lamb Weston Holdings Incorporated | | | | | | | | | | | 15,000 | | | $ | 1,055,850 | |
| | | | | | | | | | | | | | | | |
| | | | |
Health Care: 0.53% | | | | | | | | | | | | | | | | |
| | | | |
| Health Care Providers & Services: 0.16% | | | | | | | | | | | | |
| | | | |
HCA Holdings Incorporated | | | | | | | | | | | 5,000 | | | | 601,000 | |
| | | | | | | | | | | | | | | | |
| | | | |
| Pharmaceuticals: 0.37% | | | | | | | | | | | | |
| | | | |
Bristol-Myers Squibb Company | | | | | | | | | | | 30,000 | | | | 1,442,100 | |
| | | | | | | | | | | | | | | | |
| | | | |
Industrials: 1.09% | | | | | | | | | | | | | | | | |
| | | | |
| Aerospace & Defense: 0.83% | | | | | | | | | | | | |
| | | | |
Curtiss-Wright Corporation | | | | | | | | | | | 10,000 | | | | 1,226,400 | |
| | | | |
Huntington Ingalls Industries Incorporated | | | | | | | | | | | 5,000 | | | | 1,045,000 | |
| | | | |
Raytheon Company | | | | | | | | | | | 5,000 | | | | 926,600 | |
| | | | |
| | | | | | | | | | | | | | | 3,198,000 | |
| | | | | | | | | | | | | | | | |
| | | | |
| Machinery: 0.26% | | | | | | | | | | | | |
| | | | |
John Bean Technologies Corporation | | | | | | | | | | | 10,000 | | | | 1,023,200 | |
| | | | | | | | | | | | | | | | |
| | | | |
Information Technology: 3.43% | | | | | | | | | | | | | | | | |
| | | | |
| Electronic Equipment, Instruments & Components: 0.23% | | | | | | | | | | | | |
| | | | |
Amphenol Corporation Class A | | | | | | | | | | | 10,000 | | | | 875,400 | |
| | | | | | | | | | | | | | | | |
| | | | |
| IT Services: 1.14% | | | | | | | | | | | | |
| | | | |
Akamai Technologies Incorporated | | | | | | | | | | | 30,000 | | | | 2,673,900 | |
| | | | |
Leidos Holdings Incorporated | | | | | | | | | | | 20,000 | | | | 1,747,200 | |
| | | | |
| | | | | | | | | | | | | | | 4,421,100 | |
| | | | | | | | | | | | | | | | |
| | | | |
| Semiconductors & Semiconductor Equipment: 1.27% | | | | | | | | | | | | |
| | | | |
Advanced Micro Devices Incorporated † | | | | | | | | | | | 15,000 | | | | 471,750 | |
| | | | |
Applied Materials Incorporated | | | | | | | | | | | 10,000 | | | | 480,200 | |
| | | | |
Broadcom Incorporated | | | | | | | | | | | 5,000 | | | | 1,413,200 | |
| | | | |
Cypress Semiconductor Corporation | | | | | | | | | | | 35,000 | | | | 805,350 | |
| | | | |
Microchip Technology Incorporated | | | | | | | | | | | 7,000 | | | | 604,310 | |
| | | | |
Micron Technology Incorporated † | | | | | | | | | | | 25,000 | | | | 1,131,750 | |
| | | | |
| | | | | | | | | | | | | | | 4,906,560 | |
| | | | | | | | | | | | | | | | |
| | | | |
| Software: 0.77% | | | | | | | | | | | | |
| | | | |
Adobe Systems Incorporated † | | | | | | | | | | | 5,000 | | | | 1,422,550 | |
| | | | |
Nutanix Incorporated Class A | | | | | | | | | | | 5,000 | | | | 121,150 | |
| | | | |
Salesforce.com Incorporated | | | | | | | | | | | 5,000 | | | | 780,350 | |
| | | | |
ServiceNow Incorporated † | | | | | | | | | | | 2,500 | | | | 654,600 | |
| | | | |
| | | | | | | | | | | | | | | 2,978,650 | |
| | | | | | | | | | | | | | | | |
| | | | |
| Technology Hardware, Storage & Peripherals: 0.02% | | | | | | | | | | | | |
| | | | |
Pure Storage Incorporated Class A † | | | | | | | | | | | 5,000 | | | | 81,400 | |
| | | | | | | | | | | | | | | | |
The accompanying notes are an integral part of these financial statements.
Wells Fargo High Yield Bond Fund | 11
Portfolio of investments—August 31, 2019
| | | | | | | | | | | | | | | | |
| | | | | | | | | Shares | | | Value | |
| | | | |
Materials: 1.53% | | | | | | | | | | | | | | | | |
| | | | |
| Chemicals: 1.53% | | | | | | | | | | | | |
| | | | |
Celanese Corporation Series A | | | | | | | | | | | 15,000 | | | $ | 1,700,550 | |
| | | | |
Eastman Chemical Company | | | | | | | | | | | 10,000 | | | | 653,700 | |
| | | | |
Huntsman Corporation | | | | | | | | | | | 22,000 | | | | 438,240 | |
| | | | |
LyondellBasell Industries NV Class A | | | | | | | | | | | 40,000 | | | | 3,095,200 | |
| | | | |
| | | | | | | | | | | | | | | 5,887,690 | |
| | | | | | | | | | | | | | | | |
| | | | |
Real Estate: 0.51% | | | | | | | | | | | | | | | | |
| | | | |
| Equity REITs: 0.51% | | | | | | | | | | | | |
| | | | |
Crown Castle International Corporation | | | | | | | | | | | 4,000 | | | | 580,680 | |
| | | | |
Iron Mountain Incorporated | | | | | | | | | | | 20,000 | | | | 637,000 | |
| | | | |
Saul Centers Incorporated | | | | | | | | | | | 15,000 | | | | 753,450 | |
| | | | |
| | | | | | | | | | | | | | | 1,971,130 | |
| | | | | | | | | | | | | | | | |
| | | | |
Utilities: 1.32% | | | | | | | | | | | | | | | | |
| | | | |
| Gas Utilities: 0.86% | | | | | | | | | | | | |
| | | | |
Atmos Energy Corporation | | | | | | | | | | | 30,000 | | | | 3,306,900 | |
| | | | | | | | | | | | | | | | |
| | | | |
| Independent Power & Renewable Electricity Producers: 0.13% | | | | | | | | | | | | |
| | | | |
Vistra Energy Corporation | | | | | | | | | | | 20,000 | | | | 499,000 | |
| | | | | | | | | | | | | | | | |
| | | | |
| Multi-Utilities: 0.33% | | | | | | | | | | | | |
| | | | |
DTE Energy Company | | | | | | | | | | | 10,000 | | | | 1,296,600 | |
| | | | | | | | | | | | | | | | |
| | | | |
Total Common Stocks (Cost $30,446,205) | | | | | | | | | | | | | | | 33,544,580 | |
| | | | | | | | | | | | | | | | |
| | | | |
| | | | | | | | | | | | | | | | |
| | | Interest
rate | | | Maturity
date | | | Principal | | | | |
| Corporate Bonds and Notes: 76.63% | | | | | | | | | | | | | | | | |
| | | | |
Communication Services: 2.90% | | | | | | | | | | | | | | | | |
| | | | |
| Media: 2.90% | | | | | | | | | | | | |
| | | | |
CCO Holdings LLC 144A | | | 5.75 | % | | | 2-15-2026 | | | $ | 3,000,000 | | | | 3,176,250 | |
| | | | |
McGraw-Hill Global Education Holdings LLC 144A« | | | 7.88 | | | | 5-15-2024 | | | | 5,500,000 | | | | 4,950,000 | |
| | | | |
Sinclair Television Group Incorporated 144A | | | 5.63 | | | | 8-1-2024 | | | | 3,000,000 | | | | 3,090,000 | |
| | | | |
| | | | | | | | | | | | | | | 11,216,250 | |
| | | | | | | | | | | | | | | | |
| | | | |
Consumer Discretionary: 2.95% | | | | | | | | | | | | | | | | |
| | | | |
| Auto Components: 2.13% | | | | | | | | | | | | |
| | | | |
Allison Transmission Incorporated 144A | | | 5.00 | | | | 10-1-2024 | | | | 1,000,000 | | | | 1,028,850 | |
| | | | |
Dana Holding Corporation | | | 5.50 | | | | 12-15-2024 | | | | 1,500,000 | | | | 1,530,000 | |
| | | | |
Goodyear Tire & Rubber Company « | | | 5.13 | | | | 11-15-2023 | | | | 1,000,000 | | | | 1,012,500 | |
| | | | |
Tenneco Incorporated « | | | 5.00 | | | | 7-15-2026 | | | | 6,000,000 | | | | 4,661,280 | |
| | | | |
| | | | | | | | | | | | | | | 8,232,630 | |
| | | | | | | | | | | | | | | | |
| | | | |
| Hotels, Restaurants & Leisure: 0.82% | | | | | | | | | | | | |
| | | | |
Speedway Motorsports Incorporated | | | 5.13 | | | | 2-1-2023 | | | | 3,115,000 | | | | 3,153,938 | |
| | | | | | | | | | | | | | | | |
| | | | |
Consumer Staples: 4.32% | | | | | | | | | | | | | | | | |
| | | | |
| Food Products: 3.78% | | | | | | | | | | | | |
| | | | |
Lamb Weston Holdings Incorporated 144A | | | 4.63 | | | | 11-1-2024 | | | | 1,000,000 | | | | 1,045,410 | |
The accompanying notes are an integral part of these financial statements.
12 | Wells Fargo High Yield Bond Fund
Portfolio of investments—August 31, 2019
| | | | | | | | | | | | | | | | |
| | | Interest
rate | | | Maturity
date | | | Principal | | | Value | |
| | | | |
| Food Products (continued) | | | | | | | | | | | | |
| | | | |
Lamb Weston Holdings Incorporated 144A | | | 4.88 | % | | | 11-1-2026 | | | $ | 3,000,000 | | | $ | 3,131,250 | |
| | | | |
Post Holdings Incorporated 144A | | | 5.00 | | | | 8-15-2026 | | | | 10,000,000 | | | | 10,425,000 | |
| | | | |
| | | | | | | | | | | | | | | 14,601,660 | |
| | | | | | | | | | | | | | | | |
| | | | |
| Household Products: 0.54% | | | | | | | | | | | | |
| | | | |
Spectrum Brands Incorporated | | | 5.75 | | | | 7-15-2025 | | | | 2,000,000 | | | | 2,080,000 | |
| | | | | | | | | | | | | | | | |
| | | | |
Energy: 1.27% | | | | | | | | | | | | | | | | |
| | | | |
| Energy Equipment & Services: 0.27% | | | | | | | | | | | | |
| | | | |
NGPL PipeCo LLC 144A | | | 4.88 | | | | 8-15-2027 | | | | 1,000,000 | | | | 1,061,577 | |
| | | | | | | | | | | | | | | | |
| | | | |
| Oil, Gas & Consumable Fuels: 1.00% | | | | | | | | | | | | |
| | | | |
Cheniere Corpus Christi Holdings LLC | | | 5.13 | | | | 6-30-2027 | | | | 3,500,000 | | | | 3,863,125 | |
| | | | | | | | | | | | | | | | |
| | | | |
Financials: 2.29% | | | | | | | | | | | | | | | | |
| | | | |
| Banks: 0.85% | | | | | | | | | | | | |
| | | | |
Bank of America Corporation (3 Month LIBOR +3.90%)± | | | 6.10 | | | | 12-29-2049 | | | | 3,000,000 | | | | 3,270,000 | |
| | | | | | | | | | | | | | | | |
| | | | |
| Consumer Finance: 0.95% | | | | | | | | | | | | |
| | | | |
Navient Corporation | | | 5.88 | | | | 10-25-2024 | | | | 1,000,000 | | | | 1,051,990 | |
| | | | |
SLM Corporation | | | 5.50 | | | | 1-25-2023 | | | | 2,500,000 | | | | 2,625,750 | |
| | | | |
| | | | | | | | | | | | | | | 3,677,740 | |
| | | | | | | | | | | | | | | | |
| | | | |
| Insurance: 0.49% | | | | | | | | | | | | |
| | | | |
Genworth Holdings Incorporated « | | | 4.80 | | | | 2-15-2024 | | | | 2,000,000 | | | | 1,895,000 | |
| | | | | | | | | | | | | | | | |
| | | | |
Health Care: 11.61% | | | | | | | | | | | | | | | | |
| | | | |
| Health Care Equipment & Supplies: 1.48% | | | | | | | | | | | | |
| | | | |
Teleflex Incorporated | | | 4.88 | | | | 6-1-2026 | | | | 5,415,000 | | | | 5,704,486 | |
| | | | | | | | | | | | | | | | |
| | | | |
| Health Care Providers & Services: 5.74% | | | | | | | | | | | | |
| | | | |
AMN Healthcare Incorporated 144A | | | 5.13 | | | | 10-1-2024 | | | | 6,298,000 | | | | 6,471,195 | |
| | | | |
Davita Incorporated | | | 5.00 | | | | 5-1-2025 | | | | 3,000,000 | | | | 3,003,750 | |
| | | | |
Encompass Health Corporation | | | 5.75 | | | | 11-1-2024 | | | | 3,667,000 | | | | 3,712,838 | |
| | | | |
HealthSouth Corporation | | | 5.13 | | | | 3-15-2023 | | | | 5,000,000 | | | | 5,081,250 | |
| | | | |
West Street Merger Sub Incorporated 144A | | | 6.38 | | | | 9-1-2025 | | | | 4,400,000 | | | | 3,917,320 | |
| | | | |
| | | | | | | | | | | | | | | 22,186,353 | |
| | | | | | | | | | | | | | | | |
| | | | |
| Health Care Technology: 0.55% | | | | | | | | | | | | |
| | | | |
Quintiles IMS Holdings Incorporated 144A | | | 5.00 | | | | 10-15-2026 | | | | 2,000,000 | | | | 2,110,000 | |
| | | | | | | | | | | | | | | | |
| | | | |
| Life Sciences Tools & Services: 1.74% | | | | | | | | | | | | |
| | | | |
Charles River Laboratories Incorporated 144A | | | 5.50 | | | | 4-1-2026 | | | | 6,300,000 | | | | 6,740,370 | |
| | | | | | | | | | | | | | | | |
| | | | |
| Pharmaceuticals: 2.10% | | | | | | | | | | | | |
| | | | |
Catalent Pharma Solutions Incorporated 144A | | | 4.88 | | | | 1-15-2026 | | | | 8,000,000 | | | | 8,120,000 | |
| | | | | | | | | | | | | | | | |
| | | | |
Industrials: 13.62% | | | | | | | | | | | | | | | | |
| | | | |
| Aerospace & Defense: 4.50% | | | | | | | | | | | | |
| | | | |
Huntington Ingalls Industries Incorporated 144A | | | 5.00 | | | | 11-15-2025 | | | | 2,500,000 | | | | 2,620,000 | |
| | | | |
Moog Incorporated 144A | | | 5.25 | | | | 12-1-2022 | | | | 5,000,000 | | | | 5,093,750 | |
| | | | |
TransDigm Group Incorporated | | | 6.38 | | | | 6-15-2026 | | | | 9,200,000 | | | | 9,655,308 | |
| | | | |
| | | | | | | | | | | | | | | 17,369,058 | |
| | | | | | | | | | | | | | | | |
The accompanying notes are an integral part of these financial statements.
Wells Fargo High Yield Bond Fund | 13
Portfolio of investments—August 31, 2019
| | | | | | | | | | | | | | | | |
| | | Interest
rate | | | Maturity
date | | | Principal | | | Value | |
| | | | |
| Commercial Services & Supplies: 4.74% | | | | | | | | | | | | |
| | | | |
ACCO Brands Corporation 144A | | | 5.25 | % | | | 12-15-2024 | | | $ | 7,417,000 | | | $ | 7,611,696 | |
| | | | |
Clean Harbors Incorporated 144A | | | 4.88 | | | | 7-15-2027 | | | | 3,000,000 | | | | 3,172,500 | |
| | | | |
Clean Harbors Incorporated 144A | | | 5.13 | | | | 7-15-2029 | | | | 2,250,000 | | | | 2,396,250 | |
| | | | |
Stericycle Incorporated 144A | | | 5.38 | | | | 7-15-2024 | | | | 5,000,000 | | | | 5,125,000 | |
| | | | |
| | | | | | | | | | | | | | | 18,305,446 | |
| | | | | | | | | | | | | | | | |
| | | | |
| Construction & Engineering: 0.81% | | | | | | | | | | | | |
| | | | |
Aecom Company | | | 5.13 | | | | 3-15-2027 | | | | 3,000,000 | | | | 3,133,560 | |
| | | | | | | | | | | | | | | | |
| | | | |
| Electrical Equipment: 0.55% | | | | | | | | | | | | |
| | | | |
Resideo Funding Incorporated 144A | | | 6.13 | | | | 11-1-2026 | | | | 2,000,000 | | | �� | 2,125,000 | |
| | | | | | | | | | | | | | | | |
| | | | |
| Machinery: 1.35% | | | | | | | | | | | | |
| | | | |
SPX FLOW Incorporated 144A | | | 5.63 | | | | 8-15-2024 | | | | 5,000,000 | | | | 5,218,750 | |
| | | | | | | | | | | | | | | | |
| | | | |
| Trading Companies & Distributors: 1.67% | | | | | | | | | | | | |
| | | | |
WESCO Distribution Incorporated | | | 5.38 | | | | 6-15-2024 | | | | 6,245,000 | | | | 6,447,963 | |
| | | | | | | | | | | | | | | | |
| | | | |
Information Technology: 20.88% | | | | | | | | | | | | | | | | |
| | | | |
| Communications Equipment: 2.93% | | | | | | | | | | | | |
| | | | |
CommScope Incorporated 144A | | | 5.50 | | | | 6-15-2024 | | | | 8,200,000 | | | | 7,759,250 | |
| | | | |
CommScope Technologies Finance LLC 144A | | | 6.00 | | | | 6-15-2025 | | | | 4,000,000 | | | | 3,570,000 | |
| | | | |
| | | | | | | | | | | | | | | 11,329,250 | |
| | | | | | | | | | | | | | | | |
| | | | |
| Electronic Equipment, Instruments & Components: 4.71% | | | | | | | | | | | | |
| | | | |
MTS Systems Corporation 144A | | | 5.75 | | | | 8-15-2027 | | | | 9,000,000 | | | | 9,405,000 | |
| | | | |
TTM Technologies Incorporated 144A | | | 5.63 | | | | 10-1-2025 | | | | 9,000,000 | | | | 8,775,000 | |
| | | | |
| | | | | | | | | | | | | | | 18,180,000 | |
| | | | | | | | | | | | | | | | |
| | | | |
| IT Services: 1.36% | | | | | | | | | | | | |
| | | | |
Gartner Incorporated 144A | | | 5.13 | | | | 4-1-2025 | | | | 5,000,000 | | | | 5,243,700 | |
| | | | | | | | | | | | | | | | |
| | | | |
| Semiconductors & Semiconductor Equipment: 3.45% | | | | | | | | | | | | |
| | | | |
Broadcom Incorporated 144A | | | 4.75 | | | | 4-15-2029 | | | | 5,000,000 | | | | 5,267,753 | |
| | | | |
Micron Technology Incorporated | | | 5.50 | | | | 2-1-2025 | | | | 7,900,000 | | | | 8,065,223 | |
| | | | |
| | | | | | | | | | | | | | | 13,332,976 | |
| | | | | | | | | | | | | | | | |
| | | | |
| Software: 3.66% | | | | | | | | | | | | |
| | | | |
Fair Isaac Corporation 144A | | | 5.25 | | | | 5-15-2026 | | | | 1,000,000 | | | | 1,065,000 | |
| | | | |
Nuance Communications Company | | | 6.00 | | | | 7-1-2024 | | | | 6,760,000 | | | | 7,030,400 | |
| | | | |
Symantec Corporation 144A | | | 5.00 | | | | 4-15-2025 | | | | 6,000,000 | | | | 6,040,021 | |
| | | | |
| | | | | | | | | | | | | | | 14,135,421 | |
| | | | | | | | | | | | | | | | |
| | | | |
| Technology Hardware, Storage & Peripherals: 4.77% | | | | | | | | | | | | |
| | | | |
Diebold Nixdorf Incorporated | | | 8.50 | | | | 4-15-2024 | | | | 7,700,000 | | | | 7,180,250 | |
| | | | |
Western Digital Corporation | | | 4.75 | | | | 2-15-2026 | | | | 11,000,000 | | | | 11,257,950 | |
| | | | |
| | | | | | | | | | | | | | | 18,438,200 | |
| | | | | | | | | | | | | | | | |
| | | | |
Materials: 10.40% | | | | | | | | | | | | | | | | |
| | | | |
| Chemicals: 7.28% | | | | | | | | | | | | |
| | | | |
Koppers Incorporated 144A | | | 6.00 | | | | 2-15-2025 | | | | 3,363,000 | | | | 3,270,518 | |
The accompanying notes are an integral part of these financial statements.
14 | Wells Fargo High Yield Bond Fund
Portfolio of investments—August 31, 2019
| | | | | | | | | | | | | | | | |
| | | Interest
rate | | | Maturity
date | | | Principal | | | Value | |
| | | | |
| Chemicals (continued) | | | | | | | | | | | | |
| | | | |
Olin Corporation | | | 5.50 | % | | | 8-15-2022 | | | $ | 5,275,000 | | | $ | 5,578,313 | |
| | | | |
Rayonier Advanced Materials Incorporated 144A | | | 5.50 | | | | 6-1-2024 | | | | 5,000,000 | | | | 3,327,500 | |
| | | | |
Tronox Incorporated 144A« | | | 6.50 | | | | 4-15-2026 | | | | 2,000,000 | | | | 1,900,000 | |
| | | | |
Valvoline Incorporated | | | 4.38 | | | | 8-15-2025 | | | | 13,901,000 | | | | 14,040,010 | |
| | | | |
| | | | | | | | | | | | | | | 28,116,341 | |
| | | | | | | | | | | | | | | | |
| | | | |
| Containers & Packaging: 3.12% | | | | | | | | | | | | |
| | | | |
Berry Global Incorporated 144A | | | 4.50 | | | | 2-15-2026 | | | | 8,000,000 | | | | 7,960,000 | |
| | | | |
Berry Global Incorporated | | | 5.13 | | | | 7-15-2023 | | | | 4,000,000 | | | | 4,100,000 | |
| | | | |
| | | | | | | | | | | | | | | 12,060,000 | |
| | | | | | | | | | | | | | | | |
| | | | |
Real Estate: 6.39% | | | | | | | | | | | | | | | | |
| | | | |
| Equity REITs: 6.39% | | | | | | | | | | | | |
| | | | |
Equinix Incorporated | | | 5.38 | | | | 5-15-2027 | | | | 6,430,000 | | | | 6,946,522 | |
| | | | |
Iron Mountain Incorporated 144A | | | 4.88 | | | | 9-15-2027 | | | | 500,000 | | | | 513,440 | |
| | | | |
Iron Mountain Incorporated 144A | | | 5.38 | | | | 6-1-2026 | | | | 12,750,000 | | | | 13,164,375 | |
| | | | |
Sabra Health Care LP | | | 5.38 | | | | 6-1-2023 | | | | 4,000,000 | | | | 4,055,000 | |
| | | | |
| | | | | | | | | | | | | | | 24,679,337 | |
| | | | | | | | | | | | | | | | |
| | | | |
Total Corporate Bonds and Notes (Cost $294,740,011) | | | | | | | | | | | | | | | 296,028,131 | |
| | | | | | | | | | | | | | | | |
| | | | |
Yankee Corporate Bonds and Notes: 12.49% | | | | | | | | | | | | | | | | |
| | | | |
Communication Services: 1.10% | | | | | | | | | | | | | | | | |
| | | | |
| Diversified Telecommunication Services: 0.54% | | | | | | | | | | | | |
| | | | |
Virgin Media Finance plc 144A | | | 5.75 | | | | 1-15-2025 | | | | 2,000,000 | | | | 2,079,420 | |
| | | | | | | | | | | | | | | | |
| | | | |
| Media: 0.56% | | | | | | | | | | | | |
| | | | |
Quebecor Media Incorporated | | | 5.75 | | | | 1-15-2023 | | | | 2,000,000 | | | | 2,165,660 | |
| | | | | | | | | | | | | | | | |
| | | | |
Consumer Discretionary: 2.69% | | | | | | | | | | | | | | | | |
| | | | |
| Auto Components: 1.84% | | | | | | | | | | | | |
| | | | |
Adient Global Holdings Company 144A | | | 4.88 | | | | 8-15-2026 | | | | 9,210,000 | | | | 7,114,725 | |
| | | | | | | | | | | | | | | | |
| | | | |
| Hotels, Restaurants & Leisure: 0.85% | | | | | | | | | | | | |
| | | | |
International Game Technology plc 144A | | | 6.50 | | | | 2-15-2025 | | | | 3,000,000 | | | | 3,292,500 | |
| | | | | | | | | | | | | | | | |
| | | | |
Financials: 2.88% | | | | | | | | | | | | | | | | |
| | | | |
| Diversified Financial Services: 2.88% | | | | | | | | | | | | |
| | | | |
Tronox Finance plc 144A | | | 5.75 | | | | 10-1-2025 | | | | 12,000,000 | | | | 11,130,000 | |
| | | | | | | | | | | | | | | | |
| | | | |
Health Care: 1.88% | | | | | | | | | | | | | | | | |
| | | | |
| Pharmaceuticals: 1.88% | | | | | | | | | | | | |
| | | | |
Mallinckrodt plc 144A | | | 5.50 | | | | 4-15-2025 | | | | 16,500,000 | | | | 7,260,000 | |
| | | | | | | | | | | | | | | | |
| | | | |
Industrials: 1.41% | | | | | | | | | | | | | | | | |
| | | | |
| Electrical Equipment: 1.41% | | | | | | | | | | | | |
| | | | |
Sensata Technologies BV 144A | | | 5.63 | | | | 11-1-2024 | | | | 5,000,000 | | | | 5,425,000 | |
| | | | | | | | | | | | | | | | |
The accompanying notes are an integral part of these financial statements.
Wells Fargo High Yield Bond Fund | 15
Portfolio of investments—August 31, 2019
| | | | | | | | | | | | | | | | |
| | | Interest
rate | | | Maturity
date | | | Principal | | | Value | |
Information Technology: 2.53% | | | | | | | | | | | | | | | | |
| | | | |
| Technology Hardware, Storage & Peripherals: 2.53% | | | | | | | | | | | | |
| | | | |
Seagate HDD | | | 4.88 | % | | | 6-1-2027 | | | $ | 9,500,000 | | | $ | 9,777,085 | |
| | | | | | | | | | | | | | | | |
| | | | |
Total Yankee Corporate Bonds and Notes (Cost $58,836,437) | | | | | | | | | | | | | | | 48,244,390 | |
| | | | | | | | | | | | | | | | |
| | | | |
| | | | | | | | | | | | | | | | |
| | | Yield | | | | | | Shares | | | | |
Short-Term Investments: 3.79% | | | | | | | | | | | | | | | | |
| | | | |
| Investment Companies: 3.79% | | | | | | | | | | | | |
| | | | |
Securities Lending Cash Investments LLC (l)(r)(u) | | | 2.24 | | | | | | | | 8,780,656 | | | | 8,781,534 | |
| | | | |
Wells Fargo Government Money Market Fund Select Class (l)(u) | | | 2.04 | | | | | | | | 5,876,344 | | | | 5,876,344 | |
| |
Total Short-Term Investments (Cost $14,657,878) | | | | 14,657,878 | |
| | | | | | | | | | | | | | | | |
| | | | | | | | |
| Total investments in securities (Cost $398,680,531) | | | 101.59 | % | | | 392,474,979 | |
| | |
Other assets and liabilities, net | | | (1.59 | ) | | | (6,158,094 | ) |
| | | | | | | | |
| Total net assets | | | 100.00 | % | | $ | 386,316,885 | |
| | | | | | | | |
| † | Non-income-earning security |
| 144A | The security may be resold in transactions exempt from registration, normally to qualified institutional buyers, pursuant to Rule 144A under the Securities Act of 1933. |
| « | All or a portion of this security is on loan. |
| ± | Variable rate investment. The rate shown is the rate in effect at period end. |
| (l) | The issuer of the security is an affiliated person of the Fund as defined in the Investment Company Act of 1940. |
| (r) | The investment is a non-registered investment company purchased with cash collateral received from securities on loan. |
| (u) | The rate represents the 7-day annualized yield at period end. |
Abbreviations:
| LIBOR | London Interbank Offered Rate |
| REIT | Real estate investment trust |
Investments in Affiliates
An affiliated investment is an investment in which the Fund owns at least 5% of the outstanding voting shares of the issuer or as a result of other relationships, such as the Fund and the issuer having the same investment manager. Transactions with issuers that were either affiliated persons of the Fund at the beginning of the period or the end of the period were as follows:
| | | | | | | | | | | | | | | | | | | | | | | | | | | | | | | | | | | | |
| | | Shares, beginning of period | | | Shares
purchased | | | Shares
sold | | | Shares,
end of
period | | | Net
realized
gains
(losses) | | | Net
change in unrealized gains (losses) | | | Income from affiliated securities | | | Value, end
of period | | | % of
net assets | |
Short-Term Investments | | | | | | | | | | | | | | | | | | | | | | | | | | | | | | | | | | | | |
Investment Companies | | | | | | | | | | | | | | | | | | | | | | | | | | | | | | | | | | | | |
Securities Lending Cash Investments LLC | | | 34,166,983 | | | | 107,894,041 | | | | 133,280,368 | | | | 8,780,656 | | | $ | (637 | ) | | $ | 0 | | | $ | 495,674 | # | | $ | 8,781,534 | | | | | |
Wells Fargo Government Money Market Fund Select Class | | | 3,114,436 | | | | 177,049,202 | | | | 174,287,294 | | | | 5,876,344 | | | | 0 | | | | 0 | | | | 104,038 | | | | 5,876,344 | | | | | |
| | | | | | | | | | | | | | | | | | | | | | | | | | | | | | | | | | | | |
| | | | | | | | | | | | | | | | | | $ | (637 | ) | | $ | 0 | | | $ | 599,712 | | | $ | 14,657,878 | | | | 3.79 | % |
| | | | | | | | | | | | | | | | | | | | | | | | | | | | | | | | | | | | |
| # | Amount shown represents income before fees and rebates. |
The accompanying notes are an integral part of these financial statements.
16 | Wells Fargo High Yield Bond Fund
Statement of assets and liabilities—August 31, 2019
| | | | |
| | | | |
| |
Assets | | | | |
Investments in unaffiliated securities (including $8,537,785 of securities loaned), at value (cost $384,022,653) | | $ | 377,817,101 | |
Investments in affiliated securities, at value (cost $14,657,878) | | | 14,657,878 | |
Receivable for Fund shares sold | | | 63,343 | |
Receivable for dividends and interest | | | 4,614,336 | |
Receivable for securities lending income, net | | | 5,034 | |
Prepaid expenses and other assets | | | 95,254 | |
| | | | |
Total assets | | | 397,252,946 | |
| | | | |
| |
Liabilities | | | | |
Payable upon receipt of securities loaned | | | 8,781,063 | |
Payable for Fund shares redeemed | | | 1,645,987 | |
Management fee payable | | | 147,186 | |
Dividends payable | | | 95,344 | |
Administration fees payable | | | 49,429 | |
Distribution fee payable | | | 8,384 | |
Trustees’ fees and expenses payable | | | 4,042 | |
Accrued expenses and other liabilities | | | 204,626 | |
| | | | |
Total liabilities | | | 10,936,061 | |
| | | | |
Total net assets | | $ | 386,316,885 | |
| | | | |
| |
Net assets consist of | | | | |
Paid-in capital | | $ | 435,286,221 | |
Total distributable loss | | | (48,969,336 | ) |
| | | | |
Total net assets | | $ | 386,316,885 | |
| | | | |
| |
Computation of net asset value and offering price per share | | | | |
Net assets – Class A | | $ | 273,552,693 | |
Shares outstanding – Class A1 | | | 83,175,544 | |
Net asset value per share – Class A | | | $3.29 | |
Maximum offering price per share – Class A2 | | | $3.45 | |
Net assets – Class C | | $ | 12,220,161 | |
Shares outstanding – Class C1 | | | 3,719,740 | |
Net asset value per share – Class C | | | $3.29 | |
Net assets – Administrator Class | | $ | 24,666,628 | |
Shares outstanding – Administrator Class1 | | | 7,493,105 | |
Net asset value per share – Administrator Class | | | $3.29 | |
Net assets – Institutional Class | | $ | 75,877,403 | |
Shares outstanding – Institutional Class1 | | | 23,044,868 | |
Net asset value per share – Institutional Class | | | $3.29 | |
| 1 | The Fund has an unlimited number of authorized shares. |
| 2 | Maximum offering price is computed as 100/95.50 of net asset value. On investments of $50,000 or more, the offering price is reduced. |
The accompanying notes are an integral part of these financial statements.
Wells Fargo High Yield Bond Fund | 17
Statement of operations—year ended August 31, 2019
| | | | |
| | | | |
| |
Investment income | | | | |
Interest | | $ | 20,987,819 | |
Dividends (net of foreign withholding taxes of $812) | | | 610,231 | |
Income from affiliated securities | | | 211,554 | |
| | | | |
Total investment income | | | 21,809,604 | |
| | | | |
| |
Expenses | | | | |
Management fee | | | 2,268,810 | |
Administration fees | | | | |
Class A | | | 425,905 | |
Class C | | | 42,280 | |
Administrator Class | | | 23,280 | |
Institutional Class | | | 77,292 | |
Shareholder servicing fees | | | | |
Class A | | | 665,477 | |
Class C | | | 66,062 | |
Administrator Class | | | 58,201 | |
Distribution fee | | | | |
Class C | | | 198,187 | |
Custody and accounting fees | | | 32,330 | |
Professional fees | | | 67,711 | |
Registration fees | | | 89,751 | |
Shareholder report expenses | | | 99,729 | |
Trustees’ fees and expenses | | | 21,592 | |
Interest expense | | | 512 | |
Other fees and expenses | | | 17,944 | |
| | | | |
Total expenses | | | 4,155,063 | |
Less: Fee waivers and/or expense reimbursements | | | | |
Fund-level | | | (449,310 | ) |
Class A | | | (3,239 | ) |
Administrator Class | | | (16,577 | ) |
Institutional Class | | | (67,963 | ) |
| | | | |
Net expenses | | | 3,617,974 | |
| | | | |
Net investment income | | | 18,191,630 | |
| | | | |
| |
Realized and unrealized gains (losses) on investments | | | | |
Net realized losses on | | | | |
Unaffiliated securities | | | (2,339,805 | ) |
Affiliated securities | | | (637 | ) |
| | | | |
Net realized losses on investments | | | (2,340,442 | ) |
Net change in unrealized gains (losses) on investments | | | (106,513 | ) |
| | | | |
Net realized and unrealized gains (losses) on investments | | | (2,446,955 | ) |
| | | | |
Net increase in net assets resulting from operations | | $ | 15,744,675 | |
| | | | |
The accompanying notes are an integral part of these financial statements.
18 | Wells Fargo High Yield Bond Fund
Statement of changes in net assets
| | | | | | | | | | | | | | | | |
| | | Year ended
August 31, 2019 | | | Year ended
August 31, 20181 | |
| | | |
Operations | | | | | | | | | | | | |
Net investment income | | | | | | $ | 18,191,630 | | | | | | | $ | 21,855,801 | |
Net realized gains (losses) on investments | | | | | | | (2,340,442 | ) | | | | | | | 6,373,390 | |
Net change in unrealized gains (losses) on investments | | | | | | | (106,513 | ) | | | | | | | (25,332,823 | ) |
| | | | |
Net increase in net assets resulting from operations | | | | | | | 15,744,675 | | | | | | | | 2,896,368 | |
| | | | |
| | | |
Distributions to shareholders from | | | | | | | | | | | | |
Net investment income and net realized gains | | | | | | | | | | | | | | | | |
Class A | | | | | | | (11,648,408 | ) | | | | | | | (11,998,114 | ) |
Class C | | | | | | | (966,845 | ) | | | | | | | (1,891,216 | ) |
Administrator Class | | | | | | | (1,048,193 | ) | | | | | | | (1,158,390 | ) |
Institutional Class | | | | | | | (4,608,052 | ) | | | | | | | (6,020,709 | ) |
Tax basis return of capital | | | | | | | | | | | | | | | | |
Class A | | | | | | | 0 | | | | | | | | (464,808 | ) |
Class C | | | | | | | 0 | | | | | | | | (73,266 | ) |
Administrator Class | | | | | | | 0 | | | | | | | | (44,876 | ) |
Institutional Class | | | | | | | 0 | | | | | | | | (233,242 | ) |
| | | | |
Total distributions to shareholders | | | | | | | (18,271,498 | ) | | | | | | | (21,884,621 | ) |
| | | | |
| | | | |
Capital share transactions | | | Shares | | | | | | | | Shares | | | | | |
Proceeds from shares sold | | | | | | | | | | | | | | | | |
Class A | | | 12,335,218 | | | | 39,632,798 | | | | 4,507,185 | | | | 15,024,416 | |
Class C | | | 215,166 | | | | 696,992 | | | | 604,048 | | | | 2,028,540 | |
Administrator Class | | | 1,559,733 | | | | 5,085,129 | | | | 1,169,119 | | | | 3,905,011 | |
Institutional Class | | | 24,871,051 | | | | 80,385,234 | | | | 26,302,261 | | | | 88,474,810 | |
| | | | |
| | | | | | | 125,800,153 | | | | | | | | 109,432,777 | |
| | | | |
Reinvestment of distributions | | | | | | | | | | | | | | | | |
Class A | | | 3,272,349 | | | | 10,551,156 | | | | 3,396,062 | | | | 11,304,123 | |
Class C | | | 291,746 | | | | 931,523 | | | | 579,628 | | | | 1,929,924 | |
Administrator Class | | | 309,697 | | | | 998,849 | | | | 345,781 | | | | 1,152,618 | |
Institutional Class | | | 1,388,617 | | | | 4,476,567 | | | | 1,807,352 | | | | 6,016,786 | |
| | | | |
| | | | | | | 16,958,095 | | | | | | | | 20,403,451 | |
| | | | |
Payment for shares redeemed | | | | | | | | | | | | | | | | |
Class A | | | (15,355,876 | ) | | | (49,481,698 | ) | | | (17,281,250 | ) | | | (57,593,665 | ) |
Class C | | | (11,351,514 | ) | | | (36,368,438 | ) | | | (4,753,703 | ) | | | (15,786,507 | ) |
Administrator Class | | | (1,663,412 | ) | | | (5,370,540 | ) | | | (3,502,094 | ) | | | (11,686,695 | ) |
Institutional Class | | | (44,246,117 | ) | | | (141,384,353 | ) | | | (24,076,647 | ) | | | (80,563,659 | ) |
| | | | |
| | | | | | | (232,605,029 | ) | | | | | | | (165,630,526 | ) |
| | | | |
Net decrease in net assets resulting from capital share transactions | | | | | | | (89,846,781 | ) | | | | | | | (35,794,298 | ) |
| | | | |
Total decrease in net assets | | | | | | | (92,373,604 | ) | | | | | | | (54,782,551 | ) |
| | | | |
| | |
Net assets | | | | | | | | |
Beginning of period | | | | | | | 478,690,489 | | | | | | | | 533,473,040 | |
| | | | |
End of period | | | | | | $ | 386,316,885 | | | | | | | $ | 478,690,489 | |
| | | | |
| 1 | Effective for all filings after November 4, 2018, the SEC prospectively eliminated the requirement to parenthetically disclose undistributed net investment income at the end of the period and permitted the aggregation of distributions, with the exception of tax basis returns of capital. Overdistributed net investment income at August 31, 2018 was $35,978. The disaggregated distributions information for the year ended August 31, 2018 is included in Note 8,Distributions to Shareholders, in the notes to the financial statements. |
The accompanying notes are an integral part of these financial statements.
Wells Fargo High Yield Bond Fund | 19
Financial highlights
(For a share outstanding throughout each period)
| | | | | | | | | | | | | | | | | | | | |
| | | Year ended August 31 | |
| CLASS A | | 2019 | | | 2018 | | | 2017 | | | 2016 | | | 2015 | |
Net asset value, beginning of period | | | $3.28 | | | | $3.40 | | | | $3.31 | | | | $3.16 | | | | $3.35 | |
Net investment income | | | 0.14 | | | | 0.14 | | | | 0.14 | | | | 0.13 | | | | 0.13 | |
Net realized and unrealized gains (losses) on investments | | | 0.01 | | | | (0.12 | ) | | | 0.10 | | | | 0.15 | | | | (0.19 | ) |
| | | | | | | | | | | | | | | | | | | | |
Total from investment operations | | | 0.15 | | | | 0.02 | | | | 0.24 | | | | 0.28 | | | | (0.06 | ) |
Distributions to shareholders from | | | | | | | | | | | | | | | | | | | | |
Net investment income | | | (0.14 | ) | | | (0.13 | ) | | | (0.15 | ) | | | (0.13 | ) | | | (0.13 | ) |
Tax basis return of capital | | | 0.00 | | | | (0.01 | ) | | | (0.00 | )1 | | | 0.00 | | | | 0.00 | |
| | | | | | | | | | | | | | | | | | | | |
Total distributions to shareholders | | | (0.14 | ) | | | (0.14 | ) | | | (0.15 | ) | | | (0.13 | ) | | | (0.13 | ) |
Net asset value, end of period | | | $3.29 | | | | $3.28 | | | | $3.40 | | | | $3.31 | | | | $3.16 | |
Total return2 | | | 4.79 | % | | | 0.68 | % | | | 7.28 | % | | | 9.25 | % | | | (1.79 | )% |
Ratios to average net assets (annualized) | | | | | | | | | | | | | | | | | | | | |
Gross expenses | | | 1.04 | % | | | 1.02 | % | | | 1.01 | % | | | 1.04 | % | | | 1.04 | % |
Net expenses | | | 0.93 | % | | | 0.93 | % | | | 0.93 | % | | | 1.01 | % | | | 1.03 | % |
Net investment income | | | 4.36 | % | | | 4.26 | % | | | 4.39 | % | | | 4.24 | % | | | 4.04 | % |
Supplemental data | | | | | | | | | | | | | | | | | | | | |
Portfolio turnover rate | | | 26 | % | | | 18 | % | | | 20 | % | | | 75 | % | | | 55 | % |
Net assets, end of period (000s omitted) | | | $273,553 | | | | $272,170 | | | | $314,156 | | | | $370,560 | | | | $179,357 | |
| 1 | Amount is less than $0.005. |
| 2 | Total return calculations do not include any sales charges. |
The accompanying notes are an integral part of these financial statements.
20 | Wells Fargo High Yield Bond Fund
Financial highlights
(For a share outstanding throughout each period)
| | | | | | | | | | | | | | | | | | | | |
| | | Year ended August 31 | |
| CLASS C | | 2019 | | | 2018 | | | 2017 | | | 2016 | | | 2015 | |
Net asset value, beginning of period | | | $3.28 | | | | $3.40 | | | | $3.31 | | | | $3.16 | | | | $3.35 | |
Net investment income | | | 0.12 | 1 | | | 0.12 | | | | 0.12 | | | | 0.11 | | | | 0.11 | |
Net realized and unrealized gains (losses) on investments | | | 0.01 | | | | (0.12 | ) | | | 0.09 | | | | 0.15 | | | | (0.19 | ) |
| | | | | | | | | | | | | | | | | | | | |
Total from investment operations | | | 0.13 | | | | (0.00 | ) | | | 0.21 | | | | 0.26 | | | | (0.08 | ) |
Distributions to shareholders from | | | | | | | | | | | | | | | | | | | | |
Net investment income | | | (0.12 | ) | | | (0.11 | ) | | | (0.12 | ) | | | (0.11 | ) | | | (0.11 | ) |
Tax basis return of capital | | | 0.00 | | | | (0.01 | ) | | | (0.00 | )2 | | | 0.00 | | | | 0.00 | |
| | | | | | | | | | | | | | | | | | | | |
Total distributions to shareholders | | | (0.12 | ) | | | (0.12 | ) | | | (0.12 | ) | | | (0.11 | ) | | | (0.11 | ) |
Net asset value, end of period | | | $3.29 | | | | $3.28 | | | | $3.40 | | | | $3.31 | | | | $3.16 | |
Total return3 | | | 4.00 | % | | | (0.07 | )% | | | 6.49 | % | | | 8.44 | % | | | (2.52 | )% |
Ratios to average net assets (annualized) | | | | | | | | | | | | | | | | | | | | |
Gross expenses | | | 1.79 | % | | | 1.77 | % | | | 1.76 | % | | | 1.80 | % | | | 1.79 | % |
Net expenses | | | 1.68 | % | | | 1.68 | % | | | 1.68 | % | | | 1.77 | % | | | 1.78 | % |
Net investment income | | | 3.64 | % | | | 3.51 | % | | | 3.65 | % | | | 3.48 | % | | | 3.29 | % |
Supplemental data | | | | | | | | | | | | | | | | | | | | |
Portfolio turnover rate | | | 26 | % | | | 18 | % | | | 20 | % | | | 75 | % | | | 55 | % |
Net assets, end of period (000s omitted) | | | $12,220 | | | | $47,811 | | | | $61,734 | | | | $72,908 | | | | $60,753 | |
| 1 | Calculated based upon average shares outstanding. |
| 2 | Amount is less than $0.005. |
| 3 | Total return calculations do not include any sales charges. |
The accompanying notes are an integral part of these financial statements.
Wells Fargo High Yield Bond Fund | 21
Financial highlights
(For a share outstanding throughout each period)
| | | | | | | | | | | | | | | | | | | | |
| | | Year ended August 31 | |
| ADMINISTRATOR CLASS | | 2019 | | | 2018 | | | 2017 | | | 2016 | | | 2015 | |
Net asset value, beginning of period | | | $3.29 | | | | $3.41 | | | | $3.31 | | | | $3.16 | | | | $3.36 | |
Net investment income | | | 0.15 | 1 | | | 0.15 | | | | 0.15 | | | | 0.14 | 1 | | | 0.14 | |
Net realized and unrealized gains (losses) on investments | | | 0.00 | | | | (0.12 | ) | | | 0.10 | | | | 0.15 | | | | (0.20 | ) |
| | | | | | | | | | | | | | | | | | | | |
Total from investment operations | | | 0.15 | | | | 0.03 | | | | 0.25 | | | | 0.29 | | | | (0.06 | ) |
Distributions to shareholders from | | | | | | | | | | | | | | | | | | | | |
Net investment income | | | (0.15 | ) | | | (0.14 | ) | | | (0.15 | ) | | | (0.14 | ) | | | (0.14 | ) |
Tax basis return of capital | | | 0.00 | | | | (0.01 | ) | | | (0.00 | )2 | | | 0.00 | | | | 0.00 | |
| | | | | | | | | | | | | | | | | | | | |
Total distributions to shareholders | | | (0.15 | ) | | | (0.15 | ) | | | (0.15 | ) | | | (0.14 | ) | | | (0.14 | ) |
Net asset value, end of period | | | $3.29 | | | | $3.29 | | | | $3.41 | | | | $3.31 | | | | $3.16 | |
Total return | | | 4.60 | % | | | 0.82 | % | | | 7.74 | % | | | 9.48 | % | | | (1.86 | )% |
Ratios to average net assets (annualized) | | | | | | | | | | | | | | | | | | | | |
Gross expenses | | | 0.98 | % | | | 0.96 | % | | | 0.95 | % | | | 0.98 | % | | | 0.98 | % |
Net expenses | | | 0.80 | % | | | 0.80 | % | | | 0.80 | % | | | 0.80 | % | | | 0.80 | % |
Net investment income | | | 4.48 | % | | | 4.39 | % | | | 4.55 | % | | | 4.43 | % | | | 4.27 | % |
Supplemental data | | | | | | | | | | | | | | | | | | | | |
Portfolio turnover rate | | | 26 | % | | | 18 | % | | | 20 | % | | | 75 | % | | | 55 | % |
Net assets, end of period (000s omitted) | | | $24,667 | | | | $23,940 | | | | $31,592 | | | | $76,688 | | | | $13,129 | |
| 1 | Calculated based upon average shares outstanding |
| 2 | Amount is less than $0.005. |
The accompanying notes are an integral part of these financial statements.
22 | Wells Fargo High Yield Bond Fund
Financial highlights
(For a share outstanding throughout each period)
| | | | | | | | | | | | | | | | | | | | |
| | | Year ended August 31 | |
| INSTITUTIONAL CLASS | | 2019 | | | 2018 | | | 2017 | | | 2016 | | | 20151 | |
Net asset value, beginning of period | | | $3.28 | | | | $3.41 | | | | $3.31 | | | | $3.17 | | | | $3.33 | |
Net investment income | | | 0.15 | | | | 0.16 | | | | 0.16 | | | | 0.14 | | | | 0.12 | |
Net realized and unrealized gains (losses) on investments | | | 0.01 | | | | (0.13 | ) | | | 0.10 | | | | 0.14 | | | | (0.16 | ) |
| | | | | | | | | | | | | | | | | | | | |
Total from investment operations | | | 0.16 | | | | 0.03 | | | | 0.26 | | | | 0.28 | | | | (0.04 | ) |
Distributions to shareholders from | | | | | | | | | | | | | | | | | | | | |
Net investment income | | | (0.15 | ) | | | (0.15 | ) | | | (0.16 | ) | | | (0.14 | ) | | | (0.12 | ) |
Tax basis return of capital | | | 0.00 | | | | (0.01 | ) | | | (0.00 | )2 | | | 0.00 | | | | 0.00 | |
| | | | | | | | | | | | | | | | | | | | |
Total distributions to shareholders | | | (0.15 | ) | | | (0.16 | ) | | | (0.16 | ) | | | (0.14 | ) | | | (0.12 | ) |
Net asset value, end of period | | | $3.29 | | | | $3.28 | | | | $3.41 | | | | $3.31 | | | | $3.17 | |
Total return3 | | | 5.20 | % | | | 0.79 | % | | | 8.03 | % | | | 9.27 | % | | | (1.31 | )% |
Ratios to average net assets (annualized) | | | | | | | | | | | | | | | | | | | | |
Gross expenses | | | 0.71 | % | | | 0.69 | % | | | 0.68 | % | | | 0.70 | % | | | 0.71 | % |
Net expenses | | | 0.53 | % | | | 0.53 | % | | | 0.53 | % | | | 0.61 | % | | | 0.70 | % |
Net investment income | | | 4.75 | % | | | 4.67 | % | | | 4.79 | % | | | 4.65 | % | | | 4.33 | % |
Supplemental data | | | | | | | | | | | | | | | | | | | | |
Portfolio turnover rate | | | 26 | % | | | 18 | % | | | 20 | % | | | 75 | % | | | 55 | % |
Net assets, end of period (000s omitted) | | | $75,877 | | | | $134,770 | | | | $125,991 | | | | $100,023 | | | | $4,847 | |
| 1 | For the period from October 31, 2014 (commencement of class operations) to August 31, 2015. |
| 2 | Amount is less than $0.005. |
| 3 | Returns for periods of less than one year are not annualized. |
The accompanying notes are an integral part of these financial statements.
Wells Fargo High Yield Bond Fund | 23
Notes to financial statements
1. ORGANIZATION
Wells Fargo Funds Trust (the “Trust”), a Delaware statutory trust organized on March 10, 1999, is an open-end management investment company registered under the Investment Company Act of 1940, as amended (the “1940 Act”). As an investment company, the Trust follows the accounting and reporting guidance in Financial Accounting Standards Board (“FASB”) Accounting Standards Codification Topic 946, Financial Services – Investment Companies. These financial statements report on the Wells Fargo High Yield Bond Fund (the “Fund”) which is a diversified series of the Trust.
2. SIGNIFICANT ACCOUNTING POLICIES
The following significant accounting policies, which are consistently followed in the preparation of the financial statements of the Fund, are in conformity with U.S. generally accepted accounting principles which require management to make estimates and assumptions that affect the reported amounts of assets and liabilities, disclosure of contingent assets and liabilities at the date of the financial statements, and the reported amounts of revenues and expenses during the reporting period. Actual results could differ from those estimates.
Securities valuation
All investments are valued each business day as of the close of regular trading on the New York Stock Exchange (generally 4 p.m. Eastern Time), although the Fund may deviate from this calculation time under unusual or unexpected circumstances.
Debt securities are valued at the evaluated bid price provided by an independent pricing service (e.g. taking into account various factors, including yields, maturities, or credit ratings) or, if a reliable price is not available, the quoted bid price from an independent broker-dealer.
Equity securities that are listed on a foreign or domestic exchange or market are valued at the official closing price or, if none, the last sales price. If no sale occurs on the principal exchange or market that day, a fair value price will be determined in accordance with the Fund’s Valuation Procedures.
Investments in registered open-end investment companies are valued at net asset value. Interests in non-registered investment companies that are redeemable at net asset value are fair valued normally at net asset value.
Investments which are not valued using any of the methods discussed above are valued at their fair value, as determined in good faith by the Board of Trustees. The Board of Trustees has established a Valuation Committee comprised of the Trustees and has delegated to it the authority to take any actions regarding the valuation of portfolio securities that the Valuation Committee deems necessary or appropriate, including determining the fair value of portfolio securities, unless the determination has been delegated to the Wells Fargo Asset Management Pricing Committee at Wells Fargo Funds Management, LLC (“Funds Management”). The Board of Trustees retains the authority to make or ratify any valuation decisions or approve any changes to the Valuation Procedures as it deems appropriate. On a quarterly basis, the Board of Trustees receives reports on any valuation actions taken by the Valuation Committee or the Wells Fargo Asset Management Pricing Committee which may include items for ratification.
Securities lending
The Fund may lend its securities from time to time in order to earn additional income in the form of fees or interest on securities received as collateral or the investment of any cash received as collateral. When securities are on loan, the Fund receives interest or dividends on those securities. Cash collateral received in connection with its securities lending transactions is invested in Securities Lending Cash Investments, LLC (the “Securities Lending Fund”). Investments in Securities Lending Fund are valued at the evaluated bid price provided by an independent pricing service. Income earned from investment in the Securities Lending Fund (net of fees and rebates), if any, is included in income from affiliated securities on the Statement of Operations.
In a securities lending transaction, the net asset value of the Fund will be affected by an increase or decrease in the value of the securities loaned and by an increase or decrease in the value of the instrument in which collateral is invested. The amount of securities lending activity undertaken by the Fund fluctuates from time to time. The Fund has the right under the lending agreement to recover the securities from the borrower on demand. In the event of default or bankruptcy by the borrower, the Fund may be prevented from recovering the loaned securities or gaining access to the collateral or may experience delays or costs in doing so. In such an event, the terms of the agreement allows the unaffiliated securities lending agent to use the collateral to purchase replacement securities on behalf of the Fund or pay the Fund the market value of the loaned securities. The Fund will bear the risk of loss with respect to depreciation of its investment of the cash collateral.
Security transactions and income recognition
Securities transactions are recorded on a trade date basis. Realized gains or losses are recorded on the basis of identified cost.
24 | Wells Fargo High Yield Bond Fund
Notes to financial statements
Interest income is accrued daily and bond discounts are accreted and premiums are amortized daily. To the extent debt obligations are placed on non-accrual status, any related interest income may be reduced by writing off interest receivables when the collection of all or a portion of interest has been determined to be doubtful based on consistently applied procedures and the fair value has decreased. If the issuer subsequently resumes interest payments or when the collectability of interest is reasonably assured, the debt obligation is removed from non-accrual status.
Dividend income is recognized on the ex-dividend date. Dividend income is recorded net of foreign taxes withheld where recovery of such taxes is not assured.
Distributions to shareholders
Distributions to shareholders from net investment income are declared daily and paid monthly. Distributions from net realized gains, if any, are recorded on the ex-dividend date and paid at least annually. Such distributions are determined in accordance with income tax regulations and may differ from U.S. generally accepted accounting principles. Dividend sources are estimated at the time of declaration. The tax character of distributions is determined as of the Fund’s fiscal year end. Therefore, a portion of the Fund’s distributions made prior to the Fund’s fiscal year end may be categorized as a tax return of capital at year end.
Federal and other taxes
The Fund intends to continue to qualify as a regulated investment company by distributing substantially all of its investment company taxable income and any net realized capital gains (after reduction for capital loss carryforwards) sufficient to relieve it from all, or substantially all, federal income taxes. Accordingly, no provision for federal income taxes was required.
The Fund’s income and federal excise tax returns and all financial records supporting those returns for the prior three fiscal years are subject to examination by the federal and Delaware revenue authorities. Management has analyzed the Fund’s tax positions taken on federal, state, and foreign tax returns for all open tax years and does not believe that there are any uncertain tax positions that require recognition of a tax liability.
As of August 31, 2019, the aggregate cost of all investments for federal income tax purposes was $398,782,686 and the unrealized gains (losses) consisted of:
| | | | |
| |
Gross unrealized gains | | $ | 14,832,360 | |
| |
Gross unrealized losses | | | (21,140,067 | ) |
| |
Net unrealized losses | | $ | (6,307,707 | ) |
Reclassifications are made to the Fund’s capital accounts for permanent tax differences to reflect income and gains available for distribution (or available capital loss carryforwards) under federal income tax regulations. U.S. generally accepted accounting principles require that certain components of net assets be adjusted to reflect permanent differences between financial and tax reporting. These reclassifications have no effect on net assets or net asset values per share. At August 31, 2019, as a result of permanent book-to-tax differences, the following reclassification adjustments were made on the Statement of Assets and Liabilities:
| | |
| Paid-in capital | | Total distributable
earnings |
| |
| $(2,113) | | $2,113 |
As of August 31, 2019, the Fund had capital loss carryforwards which consist of $17,264,367 in short-term capital losses and $25,479,759 in long-term capital losses.
Class allocations
The separate classes of shares offered by the Fund differ principally in applicable sales charges, distribution, shareholder servicing, and administration fees. Class specific expenses are charged directly to that share class. Investment income, common fund-level expenses, and realized and unrealized gains (losses) on investments are allocated daily to each class of shares based on the relative proportion of net assets of each class.
3. FAIR VALUATION MEASUREMENTS
Fair value measurements of investments are determined within a framework that has established a fair value hierarchy based upon the various data inputs utilized in determining the value of the Fund’s investments. The three-level hierarchy gives the highest priority to unadjusted quoted prices in active markets for identical assets or liabilities (Level 1) and the lowest priority to
Wells Fargo High Yield Bond Fund | 25
Notes to financial statements
unobservable inputs (Level 3). The Fund’s investments are classified within the fair value hierarchy based on the lowest level of input that is significant to the fair value measurement. The inputs are summarized into three broad levels as follows:
| ∎ | | Level 1 – quoted prices in active markets for identical securities |
| ∎ | | Level 2 – other significant observable inputs (including quoted prices for similar securities, interest rates, prepayment speeds, credit risk, etc.) |
| ∎ | | Level 3 – significant unobservable inputs (including the Fund’s own assumptions in determining the fair value of investments) |
The inputs or methodologies used for valuing investments in securities are not necessarily an indication of the risk associated with investing in those securities.
The following is a summary of the inputs used in valuing the Fund’s assets and liabilities as of August 31, 2019:
| | | | | | | | | | | | | | | | |
| | | | |
| | | Quoted prices
(Level 1) | | | Other significant
observable inputs
(Level 2) | | | Significant
unobservable inputs (Level 3) | | | Total | |
| | | | |
Assets | | | | | | | | | | | | | | | | |
Investments in: | | | | | | | | | | | | | | | | |
| | | | |
Common stocks | | | | | | | | | | | | | | | | |
| | | | |
Consumer staples | | $ | 1,055,850 | | | $ | 0 | | | $ | 0 | | | $ | 1,055,850 | |
| | | | |
Health care | | | 2,043,100 | | | | 0 | | | | 0 | | | | 2,043,100 | |
| | | | |
Industrials | | | 4,221,200 | | | | 0 | | | | 0 | | | | 4,221,200 | |
| | | | |
Information technology | | | 13,263,110 | | | | 0 | | | | 0 | | | | 13,263,110 | |
| | | | |
Materials | | | 5,887,690 | | | | 0 | | | | 0 | | | | 5,887,690 | |
| | | | |
Real estate | | | 1,971,130 | | | | 0 | | | | 0 | | | | 1,971,130 | |
| | | | |
Utilities | | | 5,102,500 | | | | 0 | | | | 0 | | | | 5,102,500 | |
| | | | |
Corporate bonds and notes | | | 0 | | | | 296,028,131 | | | | 0 | | | | 296,028,131 | |
| | | | |
Yankee corporate bonds and notes | | | 0 | | | | 48,244,390 | | | | 0 | | | | 48,244,390 | |
| | | | |
Short-term investments | | | | | | | | | | | | | | | | |
| | | | |
Investment companies | | | 14,657,878 | | | | 0 | | | | 0 | | | | 14,657,878 | |
| | | | |
Total assets | | $ | 48,202,458 | | | $ | 344,272,521 | | | $ | 0 | | | $ | 392,474,979 | |
Additional sector, industry or geographic detail is included in the Portfolio of Investments.
For the year ended August 31, 2019, the Fund did not have any transfers into/out of Level 3.
4. TRANSACTIONS WITH AFFILIATES
Management fee
Funds Management, an indirect wholly owned subsidiary of Wells Fargo & Company (“Wells Fargo”), is the manager of the Fund and provides advisory and fund-level administrative services under an investment management agreement. Under the investment management agreement, Funds Management is responsible for, among other services, implementing the investment objectives and strategies of the Fund, supervising the subadviser and providing fund-level administrative services in connection with the Fund’s operations. As compensation for its services under the investment management agreement, Funds Management is entitled to receive a management fee at the following annual rate based on the Fund’s average daily net assets:
| | | | |
| |
| Average daily net assets | | Management fee | |
| |
First $500 million | | | 0.550 | % |
| |
Next $500 million | | | 0.525 | |
| |
Next $2 billion | | | 0.500 | |
| |
Next $2 billion | | | 0.475 | |
| |
Next $5 billion | | | 0.440 | |
| |
Over $10 billion | | | 0.430 | |
26 | Wells Fargo High Yield Bond Fund
Notes to financial statements
For the year ended August 31, 2019, the management fee was equivalent to an annual rate of 0.55% of the Fund’s average daily net assets.
Funds Management has retained the services of a subadviser to provide daily portfolio management to the Fund. The fee for subadvisory services is borne by Funds Management. Wells Capital Management Incorporated (“WellsCap”), an affiliate of Funds Management and an indirect wholly owned subsidiary of Wells Fargo, is the subadviser to the Fund and is entitled to receive a fee from Funds Management at an annual rate starting at 0.35% and declining to 0.20% as the average daily net assets of the Fund increase.
Administration fees
Under a class-level administration agreement, Funds Management provides class-level administrative services to the Fund, which includes paying fees and expenses for services provided by the transfer agent, sub-transfer agents, omnibus account servicers and record-keepers. As compensation for its services under the class-level administration agreement, Funds Management receives an annual fee which is calculated based on the average daily net assets of each class as follows:
| | | | |
| |
| | | Class-level
administration fee | |
| |
Class A, Class C | | | 0.16 | % |
| |
Administrator Class | | | 0.10 | |
| |
Institutional Class | | | 0.08 | |
Waivers and/or expense reimbursements
Funds Management has contractually waived and/or reimbursed management and administration fees to the extent necessary to maintain certain net operating expense ratios for the Fund. When each class of the Fund has exceeded its expense cap, Funds Management has waived fees and/or reimbursed expenses from fund-level expenses on a proportionate basis and then from class specific expenses. When only certain classes exceed their expense caps, waivers and/or reimbursements are applied against class specific expenses before fund-level expenses. Funds Management has committed through December 31, 2019 to waive fees and/or reimburse expenses to the extent necessary to cap the Fund’s expenses at 0.93% for Class A shares, 1.68% for Class C shares, 0.80% for Administrator Class shares and 0.53% for Institutional Class shares. Prior to or after the commitment expiration date, the cap may be increased or the commitment to maintain the cap may be terminated only with the approval of the Board of Trustees.
Distribution fee
The Trust has adopted a distribution plan for Class C shares of the Fund pursuant to Rule 12b-1 under the 1940 Act. A distribution fee is charged to Class C shares and paid to Wells Fargo Funds Distributor, LLC (“Funds Distributor”), the principal underwriter, at an annual rate of 0.75% of the average daily net assets of Class C shares.
In addition, Funds Distributor is entitled to receive the front-end sales charge from the purchase of Class A shares and a contingent deferred sales charge on the redemption of certain Class A shares. Funds Distributor is also entitled to receive the contingent deferred sales charges from redemptions of Class C shares. For the year ended August 31, 2019, Funds Distributor received $6,243 from the sale of Class A shares and $33 in contingent deferred sales charges from redemptions of Class C shares. No contingent deferred sales charges were incurred by Class A for the year ended August 31, 2019.
Shareholder servicing fees
The Trust has entered into contracts with one or more shareholder servicing agents, whereby Class A, Class C and Administrator Class of the Fund are charged a fee at an annual rate of 0.25% of the average daily net assets of each respective class.
A portion of these total shareholder servicing fees were paid to affiliates of Wells Fargo.
Interfund transactions
The Fund may purchase or sell portfolio investment securities to certain other Wells Fargo affiliates pursuant to Rule 17a-7 under the 1940 Act and under procedures adopted by the Board of Trustees. The procedures have been designed to ensure that these interfund transactions, which do not incur broker commissions, are effected at current market prices. Pursuant to these procedures, the Fund had $8,145,000 and $54,133,125 in interfund purchases and sales, respectively, during the year ended August 31, 2019.
Wells Fargo High Yield Bond Fund | 27
Notes to financial statements
5. INVESTMENT PORTFOLIO TRANSACTIONS
Purchases and sales of investments, excluding U.S. government obligations (if any) and short-term securities, for the year ended August 31, 2019 were $104,731,655 and $194,954,615, respectively.
6. SECURITIES LENDING TRANSACTIONS
The Fund lends its securities through an unaffiliated securities lending agent and receives collateral in the form of cash or securities with a value at least equal to the value of the securities on loan. The value of the loaned securities is determined at the close of each business day and any increases or decreases in the required collateral are exchanged between the Fund and the counterparty on the next business day. Cash collateral received is invested in the Securities Lending Fund which seeks to provide a positive return compared to the daily Fed Funds Open Rate by investing in high-quality, U.S. dollar-denominated short-term money market instruments and is exempt from registration under Section 3(c)(7) of the 1940 Act. Securities Lending Fund is managed by Funds Management and is subadvised by WellsCap. Funds Management receives an advisory fee starting at 0.05% and declining to 0.01% as the average daily net assets of the Securities Lending Fund increase. All of the fees received by Funds Management are paid to WellsCap for its services as subadviser.
In the event of counterparty default or the failure of a borrower to return a loaned security, the Fund has the right to use the collateral to offset any losses incurred. As of August 31, 2019, the Fund had securities lending transactions with the following counterparties which are subject to offset:
| | | | | | | | | | | | |
| | | |
| Counterparty | | Value of
securities on
loan | | | Collateral
received1 | | | Net amount | |
| | | |
Barclays Capital Inc. | | $ | 878,984 | | | $ | (878,984 | ) | | $ | 0 | |
| | | |
Citigroup Global Markets Inc. | | | 2,013,382 | | | | (2,013,382 | ) | | | 0 | |
| | | |
JPMorgan Securities LLC | | | 5,645,419 | | | | (5,645,419 | ) | | | 0 | |
| 1 | Collateral received within this table is limited to the collateral for the net transaction with the counterparty. |
7. BANK BORROWINGS
The Trust (excluding the money market funds), Wells Fargo Master Trust and Wells Fargo Variable Trust are parties to a $280,000,000 revolving credit agreement whereby the Fund is permitted to use bank borrowings for temporary or emergency purposes, such as to fund shareholder redemption requests. Interest under the credit agreement is charged to the Fund based on a borrowing rate equal to the higher of the Federal Funds rate in effect on that day plus 1.25% or the overnight LIBOR rate in effect on that day plus 1.25%. In addition, an annual commitment fee equal to 0.25% of the unused balance is allocated to each participating fund.
During the year ended August 31, 2019, the Fund had average borrowings outstanding of $13,727 at an average interest rate of 3.73% and paid interest in the amount of $512.
8. DISTRIBUTIONS TO SHAREHOLDERS
The tax character of distributions paid during the years ended August 31, 2019 and August 31, 2018 were as follows:
| | | | | | | | |
| | | Year ended August 31 | |
| | |
| | | 2019 | | | 2018 | |
| | |
Ordinary income | | $ | 18,271,498 | | | $ | 21,068,429 | |
| | |
Tax basis return of capital | | | 0 | | | | 816,192 | |
As of August 31, 2019, the components of distributable earnings on a tax basis were as follows:
| | | | |
Undistributed ordinary income | | Unrealized
losses | | Capital loss
carryforward |
| | |
$212,636 | | $(6,307,707) | | $(42,744,126) |
28 | Wells Fargo High Yield Bond Fund
Notes to financial statements
Effective for all filings after November 4, 2018, the Securities and Exchange Commission eliminated the requirement to separately state the components of distributions to shareholders under U.S. generally accepted accounting principles. The amounts of distributions to shareholders for the year ended August 31, 2018 were as follows:
| | | | | | | | |
| | |
| | | Net investment
income | | | Net realized
gains | |
| | |
Class A | | $ | 11,998,114 | | | $ | 464,808 | |
| | |
Class C | | | 1,891,216 | | | | 73,266 | |
| | |
Administrator Class | | | 1,158,390 | | | | 44,876 | |
| | |
Institutional Class | | | 6,020,709 | | | | 233,242 | |
9. INDEMNIFICATION
Under the Trust’s organizational documents, the officers and Trustees have been granted certain indemnification rights against certain liabilities that may arise out of performance of their duties to the Trust. Additionally, in the normal course of business, the Trust may enter into contracts with service providers that contain a variety of indemnification clauses. The Trust’s maximum exposure under these arrangements is dependent on future claims that may be made against the Fund and, therefore, cannot be estimated.
10. NEW ACCOUNTING PRONOUNCEMENTS
In August 2018, FASB issued Accounting Standards Update (“ASU”) No. 2018-13, Fair Value Measurement (Topic 820)Disclosure Framework—Changes to the Disclosure Requirements for Fair Value Measurement. ASU 2018-13 updates the disclosure requirements for fair value measurements by modifying or removing certain disclosures and adding certain new disclosures. The amendments are effective for fiscal years, and interim periods within those fiscal years, beginning after December 15, 2019. Early adoption is permitted. Management has adopted the removal and modification of disclosures early, as permitted, and will adopt the additional new disclosures at the effective date.
In March 2017, FASB issued ASU No. 2017-08,Premium Amortization on Purchased Callable Debt Securities. ASU 2017-08 shortens the amortization period for certain callable debt securities held at a premium and requires the premium to be amortized to the earliest call date. The amendments do not require an accounting change for securities held at a discount and discounts will continue to be accreted to the maturity date of the security. ASU 2017-08 is effective for fiscal years beginning after December 15, 2018 and for interim periods within those fiscal years. During the current reporting period, management of the Fund adopted the change in accounting policy which did not have a material impact to the Fund’s financial statements.
Wells Fargo High Yield Bond Fund | 29
Report of independent registered public accounting firm
TO THE SHAREHOLDERS OF THE FUND AND BOARD OF TRUSTEES OF WELLS FARGO FUNDS TRUST:
Opinion on the Financial Statements
We have audited the accompanying statement of assets and liabilities of Wells Fargo High Yield Bond Fund (the Fund), one of the funds constituting Wells Fargo Funds Trust, including the portfolio of investments, as of August 31, 2019, the related statement of operations for the year then ended, the statements of changes in net assets for each of the years in the two-year period then ended, and the related notes (collectively, the financial statements) and the financial highlights for each of the years or periods in the five-year period then ended. In our opinion, the financial statements and financial highlights present fairly, in all material respects, the financial position of the Fund as of August 31, 2019, the results of its operations for the year then ended, the changes in its net assets for each of the years in the two-year period then ended, and the financial highlights for each of the years or periods in the five-year period then ended, in conformity with U.S. generally accepted accounting principles.
Basis for Opinion
These financial statements and financial highlights are the responsibility of the Fund’s management. Our responsibility is to express an opinion on these financial statements and financial highlights based on our audits. We are a public accounting firm registered with the Public Company Accounting Oversight Board (United States) (PCAOB) and are required to be independent with respect to the Fund in accordance with the U.S. federal securities laws and the applicable rules and regulations of the Securities and Exchange Commission and the PCAOB.
We conducted our audits in accordance with the standards of the PCAOB. Those standards require that we plan and perform the audit to obtain reasonable assurance about whether the financial statements and financial highlights are free of material misstatement, whether due to error or fraud. Our audits included performing procedures to assess the risks of material misstatement of the financial statements and financial highlights, whether due to error or fraud, and performing procedures that respond to those risks. Such procedures included examining, on a test basis, evidence regarding the amounts and disclosures in the financial statements and financial highlights. Such procedures also included confirmation of securities owned as of August 31, 2019, by correspondence with the custodian and transfer agent. Our audits also included evaluating the accounting principles used and significant estimates made by management, as well as evaluating the overall presentation of the financial statements and financial highlights. We believe that our audits provide a reasonable basis for our opinion.

We have not been able to determine the specific year that we began serving as the auditor of one or more Wells Fargo Funds investment companies; however we are aware that we have served as the auditor of one or more Wells Fargo Funds investment companies since at least 1955.
Boston, Massachusetts
October 28, 2019
30 | Wells Fargo High Yield Bond Fund
Other information (unaudited)
TAX INFORMATION
For corporate shareholders, pursuant to Section 854 of the Internal Revenue Code, 2.09% of ordinary income dividends qualify for the corporate dividends-received deduction for the fiscal year ended August 31, 2019.
Pursuant to Section 854 of the Internal Revenue Code, $510,841 of income dividends paid during the fiscal year ended August 31, 2019 has been designated as qualified dividend income (QDI).
For the fiscal year ended August 31, 2019, $14,420,961 has been designated as interest-related dividends for nonresident alien shareholders pursuant to Section 871 of the Internal Revenue Code.
PROXY VOTING INFORMATION
A description of the policies and procedures used to determine how to vote proxies relating to portfolio securities is available, upon request, by calling1-800-222-8222, visiting our website atwfam.com, or visiting the SEC website at sec.gov. Information regarding how the proxies related to portfolio securities were voted during the most recent 12-month period ended June 30 is available on the website atwfam.comor by visiting the SEC website at sec.gov.
QUARTERLY PORTFOLIO HOLDINGS INFORMATION
The Fund files its complete schedule of portfolio holdings with the SEC for the first and third quarters of each fiscal year on Form N-Q or Form N-PORT, which is available by visiting the SEC website at sec.gov. Those forms may be reviewed and copied at the SEC’s Public Reference Room in Washington, DC. Information on the operation of the Public Reference Room may be obtained by calling1-800-SEC-0330.
Wells Fargo High Yield Bond Fund | 31
Other information (unaudited)
BOARD OF TRUSTEES AND OFFICERS
Each of the Trustees and Officers1 listed in the table below acts in identical capacities for each fund in the Wells Fargo family of funds, which consists of 152 mutual funds comprising the Wells Fargo Funds Trust, Wells Fargo Variable Trust, Wells Fargo Master Trust and four closed-end funds (collectively the “Fund Complex”). This table should be read in conjunction with the Prospectus and the Statement of Additional Information2. The mailing address of each Trustee and Officer is 525 Market Street, 12th Floor, San Francisco, CA 94105. Each Trustee and Officer serves an indefinite term, however, each Trustee serves such term until reaching the mandatory retirement age established by the Trustees.
Independent Trustees
| | | | | | |
Name and
year of birth | | Position held and
length of service* | | Principal occupations during past five years or longer | | Current other
public company or
investment
company
directorships |
| | | |
William R. Ebsworth
(Born 1957) | | Trustee, since 2015 | | Retired. From 1984 to 2013, equities analyst, portfolio manager, research director and chief investment officer at Fidelity Management and Research Company in Boston, Tokyo, and Hong Kong, and retired in 2013 as Chief Investment Officer of Fidelity Strategic Advisers, Inc. where he led a team of investment professionals managing client assets. Prior thereto, Board member of Hong Kong Securities Clearing Co., Hong Kong Options Clearing Corp., the Thailand International Fund, Ltd., Fidelity Investments Life Insurance Company, and Empire Fidelity Investments Life Insurance Company. Audit Committee Chair and Investment Committee Chair of the Vincent Memorial Hospital Endowment (non-profit organization). Mr. Ebsworth is a CFA® charterholder. | | N/A |
| | | |
Jane A. Freeman
(Born 1953) | | Trustee, since 2015; Chair Liaison, since 2018 | | Retired. From 2012 to 2014 and 1999 to 2008, Chief Financial Officer of Scientific Learning Corporation. From 2008 to 2012, Ms. Freeman provided consulting services related to strategic business projects. Prior to 1999, Portfolio Manager at Rockefeller & Co. and Scudder, Stevens & Clark. Board member of the Harding Loevner Funds from 1996 to 2014, serving as both Lead Independent Director and chair of the Audit Committee. Board member of the Russell Exchange Traded Funds Trust from 2011 to 2012 and the chair of the Audit Committee. Ms. Freeman is a Board Member of The Ruth Bancroft Garden (non-profit organization). She is also an inactive Chartered Financial Analyst. | | N/A |
| | | |
Isaiah Harris, Jr.
(Born 1952) | | Trustee, since 2009; Audit Committee Chairman, since 2019 | | Retired. Chairman of the Board of CIGNA Corporation since 2009, and Director since 2005. From 2003 to 2011, Director of Deluxe Corporation. Prior thereto, President and CEO of BellSouth Advertising and Publishing Corp. from 2005 to 2007, President and CEO of BellSouth Enterprises from 2004 to 2005 and President of BellSouth Consumer Services from 2000 to 2003. Emeritus member of the Iowa State University Foundation Board of Governors. Emeritus Member of the Advisory Board of Iowa State University School of Business. Advisory Board Member, Palm Harbor Academy (private school). Advisory Board Member, Child Evangelism Fellowship (non-profit). Mr. Harris is a certified public accountant (inactive status). | | CIGNA Corporation |
| | | |
Judith M. Johnson
(Born 1949) | | Trustee, since 2008; Audit Committee Chairman, from 2009 to 2018 | | Retired. Prior thereto, Chief Executive Officer and Chief Investment Officer of Minneapolis Employees Retirement Fund from 1996 to 2008. Ms. Johnson is an attorney, certified public accountant and a certified managerial accountant. | | N/A |
32 | Wells Fargo High Yield Bond Fund
Other information (unaudited)
| | | | | | |
Name and
year of birth | | Position held and
length of service* | | Principal occupations during past five years or longer | | Current other
public company or
investment
company
directorships |
| | | |
David F. Larcker
(Born 1950) | | Trustee, since 2009 | | James Irvin Miller Professor of Accounting at the Graduate School of Business, Stanford University, Director of the Corporate Governance Research Initiative and Senior Faculty of The Rock Center for Corporate Governance since 2006. From 2005 to 2008, Professor of Accounting at the Graduate School of Business, Stanford University. Prior thereto, Ernst & Young Professor of Accounting at The Wharton School, University of Pennsylvania from 1985 to 2005. | | N/A |
| | | |
Olivia S. Mitchell
(Born 1953) | | Trustee, since 2006; Nominating and Governance Committee Chairman, since 2018 | | International Foundation of Employee Benefit Plans Professor, Wharton School of the University of Pennsylvania since 1993. Director of Wharton’s Pension Research Council and Boettner Center on Pensions & Retirement Research, and Research Associate at the National Bureau of Economic Research. Previously, Cornell University Professor from 1978 to 1993. | | N/A |
| | | |
Timothy J. Penny
(Born 1951) | | Trustee, since 1996; Chairman, since 2018 | | President and Chief Executive Officer of Southern Minnesota Initiative Foundation, a non-profit organization, since 2007. Member of the Board of Trustees of NorthStar Education Finance, Inc., a non-profit organization, since 2007. | | N/A |
| | | |
James G. Polisson
(Born 1959) | | Trustee, since 2018 | | Retired. Chief Marketing Officer, Source (ETF) UK Services, Ltd, from 2015 to 2017. From 2012 to 2015, Principal of The Polisson Group, LLC, a management consulting, corporate advisory and principal investing company. Chief Executive Officer and Managing Director at Russell Investments, Global Exchange Traded Funds from 2010 to 2012. Managing Director of Barclays Global Investors from 1998 to 2010 and Global Chief Marketing Officer for iShares and Barclays Global Investors from 2000 to 2010. Trustee of the San Francisco Mechanics’ Institute, a non-profit organization, from 2013 to 2015. Board member of the Russell Exchange Traded Fund Trust from 2011 to 2012. Director of Barclays Global Investors Holdings Deutschland GmbH from 2006 to 2009. Mr. Polisson is an attorney and has a retired status with the Massachusetts and District of Columbia Bar Associations. | | N/A |
| * | Length of service dates reflect the Trustee’s commencement of service with the Trust’s predecessor entities, where applicable. |
Wells Fargo High Yield Bond Fund | 33
Other information (unaudited)
Officers
| | | | |
Name and
year of birth | | Position held and
length of service | | Principal occupations during past five years or longer |
| | |
Andrew Owen
(Born 1960) | | President, since 2017 | | Executive Vice President of Wells Fargo & Company and Head of Affiliated Managers, Wells Fargo Asset Management, since 2014. In addition, Mr. Owen is currently President, Chief Executive Officer and Director of Wells Fargo Funds Management, LLC since 2017. Prior thereto, Executive Vice President responsible for marketing, investments and product development for Wells Fargo Funds Management, LLC, from 2009 to 2014. |
| | |
Nancy Wiser1
(Born 1967) | | Treasurer, since 2012 | | Executive Vice President of Wells Fargo Funds Management, LLC since 2011. Chief Operating Officer and Chief Compliance Officer at LightBox Capital Management LLC, from 2008 to 2011. |
| | |
Michelle Rhee3
(Born 1966) | | Chief Legal Officer, since 2019 | | Secretary of Wells Fargo Funds Management, LLC, Chief Legal Counsel of Wells Fargo Asset Management and Assistant General Counsel of Wells Fargo Bank, N.A. since 2018. Associate General Counsel and Managing Director of Bank of America Corporation from 2004 to 2018. |
| | |
Catherine Kennedy4
(Born 1969) | | Secretary, since 2019 | | Vice President of Wells Fargo Funds Management, LLC and Senior Counsel of the Wells Fargo Legal Department since 2010. Vice President and Senior Counsel of Evergreen Investment Management Company, LLC from 1998 to 2010. |
| | |
Michael H. Whitaker
(Born 1967) | | Chief Compliance Officer, since 2016 | | Chief Compliance Officer of Wells Fargo Asset Management since 2016. Senior Vice President and Chief Compliance Officer for Fidelity Investments from 2007 to 2016. |
| | |
David Berardi
(Born 1975) | | Assistant Treasurer, since 2009 | | Vice President of Wells Fargo Funds Management, LLC since 2009. Vice President of Evergreen Investment Management Company, LLC from 2008 to 2010. Manager of Fund Reporting and Control for Evergreen Investment Management Company, LLC from 2004 to 2010. |
| | |
Jeremy DePalma1
(Born 1974) | | Assistant Treasurer, since 2009 | | Senior Vice President of Wells Fargo Funds Management, LLC since 2009. Senior Vice President of Evergreen Investment Management Company, LLC from 2008 to 2010 and head of the Fund Reporting and Control Team within Fund Administration from 2005 to 2010. |
| 1 | Nancy Wiser acts as Treasurer of 65 funds in the Fund Complex. Jeremy DePalma acts as Treasurer of 87 funds and Assistant Treasurer of 65 funds in the Fund Complex. |
| 2 | The Statement of Additional Information includes additional information about the Trustees and is available, without charge, upon request, by calling 1-800-222-8222 or by visiting the website atwfam.com. |
| 3 | Michelle Rhee became Chief Legal Officer effective October 22, 2019. |
| 4 | Catherine Kennedy became Secretary effective October 22, 2019. |
34 | Wells Fargo High Yield Bond Fund
Other information (unaudited)
BOARD CONSIDERATION OF INVESTMENT MANAGEMENT AND SUB-ADVISORY AGREEMENTS:
Wells Fargo High Yield Bond Fund
Under the Investment Company Act of 1940 (the “1940 Act”), the Board of Trustees (the “Board”) of Wells Fargo Funds Trust (the “Trust”) must determine annually whether to approve the continuation of the Trust’s investment management and sub-advisory agreements. In this regard, at an in-person meeting held on May 21-22, 2019 (the “Meeting”), the Board, all the members of which have no direct or indirect interest in the investment management and sub-advisory agreements and are not “interested persons” of the Trust, as defined in the 1940 Act (the “Independent Trustees”), reviewed and approved for Wells Fargo High Yield Bond Fund (the “Fund”): (i) an investment management agreement (the “Management Agreement”) with Wells Fargo Funds Management, LLC (“Funds Management”); and (ii) an investment sub-advisory agreement (the “Sub-Advisory Agreement”) with Wells Capital Management Incorporated (the “Sub-Adviser”), an affiliate of Funds Management. The Management Agreement and the Sub-Advisory Agreement are collectively referred to as the “Advisory Agreements.”
At the Meeting, the Board considered the factors and reached the conclusions described below relating to the selection of Funds Management and the Sub-Adviser and the approval of the Advisory Agreements. Prior to the Meeting, including at an in-person meeting in April 2019, the Trustees conferred extensively among themselves and with representatives of Funds Management about these matters. Also, the Board has adopted a team-based approach, with each team consisting of a sub-set of Trustees, to assist the full Board in the discharge of its duties in reviewing investment performance and other matters throughout the year. The Independent Trustees were assisted in their evaluation of the Advisory Agreements by independent legal counsel, from whom they received separate legal advice and with whom they met separately.
In providing information to the Board, Funds Management and the Sub-Adviser were guided by a detailed set of requests for information submitted to them by independent legal counsel on behalf of the Independent Trustees at the start of the Board’s annual contract renewal process earlier in 2019. In considering and approving the Advisory Agreements, the Trustees considered the information they believed relevant, including but not limited to the information discussed below. The Board considered not only the specific information presented in connection with the Meeting, but also the knowledge gained over time through interaction with Funds Management and the Sub-Adviser about various topics. In this regard, the Board reviewed reports of Funds Management at each of its quarterly meetings, which included, among other things, portfolio reviews and investment performance reports. In addition, the Board and the teams mentioned above confer with portfolio managers at various times throughout the year. The Board did not identify any particular information or consideration that was all-important or controlling, and each individual Trustee may have attributed different weights to various factors.
After its deliberations, the Board unanimously approved the continuation of the Advisory Agreements for a one-year term and determined that the compensation payable to Funds Management and the Sub-Adviser under each of the Advisory Agreements was reasonable. The Board considered the approval of the Advisory Agreements for the Fund as part of its consideration of agreements for funds across the complex, but its approvals were made on a fund-by-fund basis. The following summarizes a number of important, but not necessarily all, factors considered by the Board in support of its approvals.
Nature, extent and quality of services
The Board received and considered various information regarding the nature, extent and quality of services provided to the Fund by Funds Management and the Sub-Adviser under the Advisory Agreements. This information included a description of the investment advisory services and Fund-level administrative services covered by the Management Agreement, as well as, among other things, a summary of the background and experience of senior management of Wells Fargo Asset Management (“WFAM”), of which Funds Management and the Sub-Adviser are a part, a summary of investments made in the business of WFAM, a summary of certain organizational and personnel changes involving Funds Management and the Sub-Adviser, and a description of Funds Management’s and the Sub-Adviser’s business continuity planning programs and of their approaches to data privacy and cybersecurity. The Board received and reviewed information about Funds Management’s role as administrator of the Fund’s liquidity risk management program. The Board also considered the qualifications, background, tenure and responsibilities of each of the portfolio managers primarily responsible for the day-to-day portfolio management of the Fund.
The Board evaluated the ability of Funds Management and the Sub-Adviser to attract and retain qualified investment professionals, including research, advisory and supervisory personnel. The Board further considered the compliance programs and compliance records of Funds Management and the Sub-Adviser. In addition, the Board took into account the full range of services provided to the Fund by Funds Management and its affiliates.
Wells Fargo High Yield Bond Fund | 35
Other information (unaudited)
Fund investment performance and expenses
The Board considered the investment performance results for the Fund over various time periods ended December 31, 2018. The Board considered these results in comparison to the investment performance of funds in a universe that was determined by Broadridge Inc. (“Broadridge”) to be similar to the Fund (the “Universe”), and in comparison to the Fund’s benchmark index and to other comparative data. Broadridge is an independent provider of investment company data. The Board received a description of the methodology used by Broadridge to select the mutual funds in the performance Universe. The Board noted that the investment performance of the Fund (Administrator Class) was higher than the average investment performance of the Universe for the five- and ten-year periods under review, but lower than the average investment performance of the Universe for the one- and three-year periods under review. The Board also noted that the investment performance of the Fund was lower than its benchmark index, the ICE BofAML U.S. High Yield Constrained Index, for all periods under review.
The Board received information concerning, and discussed factors contributing to, the underperformance of the Fund relative to the Universe and benchmark for the periods identified above. The Board took note of the explanations for the relative underperformance during these periods, including with respect to investment decisions that affected the Fund’s investment performance. The Board also took note of the Fund’s outperformance relative to the Universe over the longer time periods under review.
The Board also received and considered information regarding the Fund’s net operating expense ratios and their various components, including actual management fees, custodian and other non-management fees, and Rule 12b-1 and non-Rule 12b-1 shareholder service fees. The Board considered these ratios in comparison to the median ratios of funds in class-specific expense groups that were determined by Broadridge to be similar to the Fund (the “Groups”). The Board received a description of the methodology used by Broadridge to select the mutual funds in the expense Groups and an explanation of how funds comprising expense groups and their expense ratios may vary from year-to-year. Based on the Broadridge reports, the Board noted that the net operating expense ratios of the Fund were lower than the median net operating expense ratios of the expense Groups for each share class.
The Board took into account the Fund’s investment performance and expense information provided to it among the factors considered in deciding to re-approve the Advisory Agreements.
Investment management and sub-advisory fee rates
The Board reviewed and considered the contractual fee rates payable by the Fund to Funds Management under the Management Agreement, as well as the contractual fee rates payable by the Fund to Funds Management for class-level administrative services under a Class-Level Administration Agreement, which include, among other things, class-level transfer agency and sub-transfer agency costs (collectively, the “Management Rates”). The Board also reviewed and considered the contractual investment sub-advisory fee rates that are payable by Funds Management to the Sub-Adviser for investment sub-advisory services.
Among other information reviewed by the Board was a comparison of the Fund’s Management Rates with the average contractual investment management fee rates of funds in the expense Groups at a common asset level as well as transfer agency costs of the funds in the expense Groups. The Board noted that the Management Rates of the Fund were lower than or equal to the sum of these average rates for the Fund’s expense Groups for all share classes.
The Board also received and considered information about the portion of the total management fee that was retained by Funds Management after payment of the fee to the Sub-Adviser for sub-advisory services. In assessing the reasonableness of this amount, the Board received and evaluated information about the nature and extent of responsibilities retained and risks assumed by Funds Management and not delegated to or assumed by the Sub-Adviser, and about Funds Management’s on-going oversight services. Given the affiliation between Funds Management and the Sub-Adviser, the Board ascribed limited relevance to the allocation of fees between them.
The Board also received and considered information about the nature and extent of services offered and fee rates charged by Funds Management and the Sub-Adviser to other types of clients with investment strategies similar to those of the Fund. In this regard, the Board received information about the significantly greater scope of services, and compliance, reporting and other legal burdens and risks of managing proprietary mutual funds compared with those associated with managing assets of other types of clients, including third-party sub-advised fund clients and non-mutual fund clients such as institutional separate accounts.
Based on its consideration of the factors and information it deemed relevant, including those described here, the Board determined that the compensation payable to Funds Management under the Management Agreement and to the Sub-Adviser under the Sub-Advisory Agreement was reasonable.
36 | Wells Fargo High Yield Bond Fund
Other information (unaudited)
Profitability
The Board received and considered information concerning the profitability of Funds Management, as well as the profitability of both WFAM and Wells Fargo & Co. (“Wells Fargo”) from providing services to the fund family as a whole. The Board noted that the Sub-Adviser’s profitability information with respect to providing services to the Fund and other funds in the family was subsumed in the WFAM and Wells Fargo profitability analysis.
Funds Management reported on the methodologies and estimates used in calculating profitability, including a description of the methodology used to allocate certain expenses. Among other things, the Board noted that the levels of profitability reported on a fund-by-fund basis varied widely, depending on factors such as the size, type and age of fund. Based on its review, the Board did not deem the profits reported by Funds Management, WFAM or Wells Fargo from services provided to the Fund to be at a level that would prevent it from approving the continuation of the Advisory Agreements.
Economies of scale
The Board received and considered information about the potential for Funds Management to experience economies of scale in the provision of management services to the Fund, the difficulties of calculating economies of scale at an individual fund level, and the extent to which potential scale benefits are shared with shareholders. The Board noted the existence of breakpoints in the Fund’s management fee structure, which operate generally to reduce the Fund’s expense ratios as the Fund grows in size. The Board considered that in addition to management fee breakpoints, Funds Management shares potential economies of scale from its management business in a variety of ways, including through fee waiver and expense reimbursement arrangements, services that benefit shareholders, competitive management fee rates set at the outset without regard to breakpoints, and investments in the business intended to enhance services available to shareholders.
The Board concluded that Funds Management’s arrangements with respect to the Fund, including contractual breakpoints, constituted a reasonable approach to sharing potential economies of scale with the Fund and its shareholders.
Other benefits to Funds Management and the Sub-Adviser
The Board received and considered information regarding potential “fall-out” or ancillary benefits received by Funds Management and its affiliates, including the Sub-Adviser, as a result of their relationships with the Fund. Ancillary benefits could include, among others, benefits directly attributable to other relationships with the Fund and benefits potentially derived from an increase in Funds Management’s and the Sub-Adviser’s business as a result of their relationships with the Fund. The Board noted that various affiliates of Funds Management may receive distribution-related fees, shareholder servicing payments and sub-transfer agency fees in respect of shares sold or held through them and services provided.
The Board also reviewed information about soft dollar credits earned and utilized by the Sub-Adviser, fees earned by Funds Management and the Sub-Adviser from managing a private investment vehicle for the fund family’s securities lending collateral, and commissions earned by an affiliated broker from portfolio transactions.
Based on its consideration of the factors and information it deemed relevant, including those described here, the Board did not find that any ancillary benefits received by Funds Management and its affiliates, including the Sub-Adviser, were unreasonable.
Conclusion
At the Meeting, after considering the above-described factors and based on its deliberations and its evaluation of the information described above, the Board unanimously approved the continuation of the Advisory Agreements for a one-year term and determined that the compensation payable to Funds Management and the Sub-Adviser under each of the Advisory Agreements was reasonable.
Wells Fargo High Yield Bond Fund | 37
This page is intentionally left blank.
This page is intentionally left blank.
This page is intentionally left blank.

For more information
More information about Wells Fargo Funds is available free upon request. To obtain literature, please write, visit the Fund’s website, or call:
Wells Fargo Funds
P.O. Box 219967
Kansas City, MO 64121-9967
Website:wfam.com
Individual investors:1-800-222-8222
Retail investment professionals:1-888-877-9275
Institutional investment professionals:1-866-765-0778

This report and the financial statements contained herein are submitted for the general information of the shareholders of the Fund. If this report is used for promotional purposes, distribution of the report must be accompanied or preceded by a current prospectus. Before investing, please consider the investment objectives, risks, charges, and expenses of the investment. For a current prospectus and, if available, a summary prospectus, containing this information, call1-800-222-8222 or visit the Fund’s website atwfam.com. Read the prospectus carefully before you invest or send money.
Wells Fargo Asset Management (WFAM) is the trade name for certain investment advisory/management firms owned by Wells Fargo & Company. These firms include but are not limited to Wells Capital Management Incorporated and Wells Fargo Funds Management, LLC. Certain products managed by WFAM entities are distributed by Wells Fargo Funds Distributor, LLC (a broker-dealer and Member FINRA).
This material is for general informational and educational purposes only and is NOT intended to provide investment advice or a recommendation of any kind—including a recommendation for any specific investment, strategy, or plan.
INVESTMENT PRODUCTS: NOT FDIC INSURED ◾ NO BANK GUARANTEE ◾ MAY LOSE VALUE
© 2019 Wells Fargo Funds Management, LLC. All rights reserved.
405804 10-19
A218/AR218 08-19
Annual Report
August 31, 2019
Wells Fargo
Conservative Income Fund
Beginning on January 1, 2021, as permitted by new regulations adopted by the Securities and Exchange Commission, paper copies of the Wells Fargo Funds’ annual and semi-annual shareholder reports issued after this date will no longer be sent by mail, unless you specifically request paper copies of the reports. Instead, the reports will be made available on the Funds’ website, and you will be notified by mail each time a report is posted and provided with a website address to access the report.
If you already elected to receive shareholder reports electronically, you will not be affected by this change and you need not take any action. You may elect to receive shareholder reports and other communications from the Fund electronically at any time by contacting your financial intermediary (such as a broker-dealer or bank) or, if you are a direct investor, by calling1-800-222-8222 or by enrolling at wellsfargo.com/advantagedelivery.
You may elect to receive all future reports in paper free of charge. If you invest through a financial intermediary, you can contact your financial intermediary to request that you continue to receive paper copies of your shareholder reports; if you invest directly with the Fund, you can call 1-800-222-8222. Your election to receive reports in paper will apply to all Wells Fargo Funds held in your account with your financial intermediary or, if you are a direct investor, to all Wells Fargo Funds that you hold.
|
|
|
Reduce clutter. Save trees. |
Sign up for electronic delivery of prospectuses and shareholder reports atwellsfargo.com/advantagedelivery |
The views expressed and any forward-looking statements are as of August 31, 2019, unless otherwise noted, and are those of the Fund managers and/or Wells Fargo Asset Management. Discussions of individual securities, or the markets generally, or any Wells Fargo Fund are not intended as individual recommendations. Future events or results may vary significantly from those expressed in any forward-looking statements. The views expressed are subject to change at any time in response to changing circumstances in the market. Wells Fargo Asset Management and the Fund disclaim any obligation to publicly update or revise any views expressed or forward-looking statements.
INVESTMENT PRODUCTS: NOT FDIC INSURED ◾ NO BANK GUARANTEE ◾ MAY LOSE VALUE
Wells Fargo Conservative Income Fund | 1
Letter to shareholders (unaudited)

Andrew Owen
President
Wells Fargo Funds
Dear Shareholder:
We are pleased to offer you this annual report for the Wells Fargo Conservative Income Fund for the 12-month period that ended August 31, 2019. After the first half of the period yielded either low-single-digit or negative investment returns, U.S. stock and global bond investors generally saw markets recover during the second half amid intensifying market volatility, global economic growth concerns, international trade staredowns, and simmering geopolitical tensions.
Overall, fixed-income investors enjoyed a distinct advantage over stock investors. For the period, U.S. stocks, based on the S&P 500 Index,1 gained 2.92% and international stocks, as measured by the MSCI ACWI ex USA Index (Net),2 fell 3.27%. The MSCI EM Index (Net)3 slipped 4.36%. Among fixed income investors, the Bloomberg Barclays U.S. Aggregate Bond Index4 added 10.17%, the Bloomberg Barclays Global Aggregate ex-USD Index5 added 5.71%, the Bloomberg Barclays Municipal Bond Index6 gained 8.72%, and the ICE BofAML U.S. High Yield Index7 added 6.58%.
Entering the fourth quarter of 2018, economic data was encouraging.
Entering the fourth quarter of 2018, there were reasons for investors to be optimistic. The U.S. Bureau of Economic Analysis reported U.S. gross domestic product (GDP) grew 4.2% on an annualized basis during the second quarter. Hiring improved. Unemployment declined. Consumer spending gained. Third-quarter corporate earnings reports were generally positive. U.S. trade negotiations with Mexico and Canada advanced. In September 2018, the U.S. Federal Reserve (Fed) raised the federal funds rate by 25 basis points (bps; 100 bps equal 1.00%) to a target range of between 2.00% and 2.25% in an indication of its confidence that U.S. economic growth was sustainable.
International markets presented numerous challenges. U.S.-China trade tensions increased. The U.S. imposed $200 billion in tariffs on Chinese goods. China reacted with $60 billion in tariffs on U.S. goods. Economic growth in China caused concern. In September 2018, international investors began to factor in a number of disconcerting economic and business data points: lower July manufacturing and industrial orders in Germany; declining purchasing managers’ index numbers for August from the United Kingdom, China, and India; and declining household spending for August in Japan. Taken together, the data fed growing concerns that global economic growth was slowing.
| 1 | The S&P 500 Index consists of 500 stocks chosen for market size, liquidity, and industry group representation. It is a market-value-weighted index with each stock’s weight in the index proportionate to its market value. You cannot invest directly in an index. |
| 2 | The Morgan Stanley Capital International (MSCI) All Country World Index (ACWI) ex USA Index (Net) is a free-float-adjusted market-capitalization weighted index that is designed to measure the equity market performance of developed and emerging markets, excluding the U.S. Source: MSCI. MSCI makes no express or implied warranties or representations and shall have no liability whatsoever with respect to any MSCI data contained herein. The MSCI data may not be further redistributed or used as a basis for other indices or any securities or financial products. This report is not approved, reviewed, or produced by MSCI. You cannot invest directly in an index. |
| 3 | The MSCI Emerging Markets (EM) Index (Net) is a free-float-adjusted market-capitalization-weighted index that is designed to measure the equity market performance of emerging markets. You cannot invest directly in an index. |
| 4 | The Bloomberg Barclays U.S. Aggregate Bond Index is a broad-based benchmark that measures the investment-grade, U.S. dollar-denominated, fixed-rate taxable bond market, including Treasuries, government-related and corporate securities, mortgage-backed securities (agency fixed-rate and hybrid adjustable-rate mortgage pass-throughs), asset-backed securities, and commercial mortgage-backed securities. You cannot invest directly in an index. |
| 5 | The Bloomberg Barclays Global Aggregate ex-USD Index is an unmanaged index that provides a broad-based measure of the global investment-grade fixed-income markets excluding the U.S. dollar-denominated debt market. You cannot invest directly in an index. |
| 6 | The Bloomberg Barclays Municipal Bond Index is an unmanaged index composed of long-term tax-exempt bonds with a minimum credit rating of Baa. You cannot invest directly in an index. |
| 7 | The ICE BofAML U.S. High Yield Index is a market-capitalization-weighted index of domestic and Yankee high-yield bonds. The index tracks the performance of high-yield securities traded in the U.S. bond market. You cannot invest directly in an index. Copyright 2019. ICE Data Indices, LLC. All rights reserved. |
2 | Wells Fargo Conservative Income Fund
Letter to shareholders (unaudited)
Investors had to digest unsettling events during the fourth quarter of 2018.
November’s U.S. midterm elections shifted control of the House of Representatives from Republicans to Democrats, presaging partisan clashes that followed and caused uncertainty among investors. A partial U.S. government shutdown driven by partisan policy disputes extended into January 2019. Third-quarter U.S. GDP was announced at an annualized 3.4% rate, lower than the second-quarter rate. Brexit efforts stalled. The value of the renminbi declined even as the People’s Bank of China cut reserve requirement ratios, accelerated infrastructure spending, and cut taxes in efforts to spur economic activity.
The combination of news in the U.S. and generally weak economic indicators outside of the U.S. caused investors to seek safe havens. December’s S&P 500 Index performance was the worst since 1931. Globally, fixed-income investments fared better than stocks during the last two months of the year. The Fed increased the federal funds rate by 25 bps in December 2018 to a target range of between 2.25% and 2.50% even as observers expressed concerns that higher rates could slow the economy.
The market climbs a wall of worry.
Investment returns appeared to reaffirm the adage that markets climb a wall of worry as 2019 opened. Following its December decline, the S&P 500 Index gained 8.01% for the month of January, the best monthly performance in 30 years. Returns for the MSCI ACWI ex USA Index (Net), the Bloomberg Barclays U.S. Aggregate Bond Index, and the Bloomberg Barclays Global Aggregate ex-USD Index also were positive.
In February 2019, signs of slowing global growth grew more ominous. The Bureau of Economic Analysis announced fourth-quarter 2018 GDP grew at an annualized 2.2% rate, down from the levels of the prior two quarters. In a February report, the Bank of England forecast the slowest growth for 2019 since the financial crisis. China and the U.S. continued to wrangle over trade issues. By the end of the first quarter of 2019, more accommodative Fed sentiment and steady, if not spectacular, U.S. economic and business metrics encouraged domestic investors.
Early second-quarter 2019 enthusiasm among investors faded.
During April 2019, favorable sentiment found additional support in reports of sustained low inflation, solid employment data, and first-quarter U.S. GDP of an annualized rate of 3.2%. During May, markets tumbled on mixed investment signals. In the U.S., partisan wrangling ramped up as Democrats and Republicans set their sights on 2020 presidential politics. The U.K.’s Brexit contretemps caused Prime Minister Theresa May to resign. Boris Johnson succeeded her only to exacerbate uncertainty about Brexit’s resolution ahead of an October 2019 deadline. The European Commission downgraded the 2019 growth forecast to 1.2%. The U.S. increased tariffs on products from China, China responded, and then talks broke down. President Donald Trump threatened to turn his foreign policy tariff tool to Mexico over immigration issues.
During the third quarter of 2019, investors regrouped. Just as the investment horizon appeared to darken, sentiment turned and U.S. equity markets gained during June and July. The gains, primarily driven by geopolitical and monetary policy events, pushed equity markets to new highs. European Central Bank President Mario Draghi said that if the outlook doesn’t improve, the bank would cut rates or buy more assets to prop up inflation. President Trump backed off of tariff threats against Mexico and China. In the U.S., the Fed implemented a 0.25% federal funds rate cut in July.
Later in July, the U.S. reversed course and threatened to impose higher tariffs on China’s exports after talks failed. China responded with tariff threats of its own and
“December’s S&P 500 Index performance was the worst since 1931.”
“Following its December decline, the S&P 500 Index gained 8.01% for the month of January, the best monthly performance in 30 years.”
Wells Fargo Conservative Income Fund | 3
Letter to shareholders (unaudited)
|
|
|
For further information about your Fund, contact your investment professional, visit our website at wfam.com, or call us directly at1-800-222-8222. |
devalued the renminbi, a move that roiled global markets. Major U.S. stock market indices closed July 2019 with the worst weekly results of the year. Bond prices gained as Treasury yields fell to levels not seen since November 2016 and the yield curve inverted at multiple points along the 30-year arc.
In a microcosm, August 2019 encapsulated many of the unnerving events that plagued investors during the prior 11 months. The U.S.-China trade relationship swung from discouraging to hopeful and back again with no evident compromise on the horizon. Evidence of a continued global economic slowdown continued to mount as central banks in China, New Zealand, and Thailand cut interest rates. Industrial and manufacturing data declined in China, Canada, Japan, and Germany. Adding to the uncertain environment, Italy’s prime minister resigned, many feared a crackdown in Hong Kong as protesters sustained their calls for reform throughout the month, and Boris Johnson planned to suspend Parliament as Brexit’s deadline neared.
Don’t let short-term uncertainty derail long-term investment goals.
Periods of investment uncertainty can present challenges, but experience has taught us that maintaining long-term investment goals can be an effective way to plan for the future. To help you create a sound strategy based on your personal goals and risk tolerance, Wells Fargo Funds offers more than 100 mutual funds spanning a wide range of asset classes and investment styles. Although diversification cannot guarantee an investment profit or prevent losses, we believe it can be an effective way to manage investment risk and potentially smooth out overall portfolio performance. We encourage investors to know their investments and to understand that appropriate levels of risk-taking may unlock opportunities.
Thank you for choosing to invest with Wells Fargo Funds. We appreciate your confidence in us and remain committed to helping you meet your financial needs.
Sincerely,

Andrew Owen
President
Wells Fargo Funds
4 | Wells Fargo Conservative Income Fund
This page is intentionally left blank.
Performance highlights (unaudited)
Investment objective
The Fund seeks current income consistent with capital preservation.
Manager
Wells Fargo Funds Management, LLC
Subadviser
Wells Capital Management Incorporated
Portfolio managers
Andrew M. Greenberg, CFA®‡
Anthony J. Melville, CFA®‡
Jeffrey L. Weaver, CFA®‡
Average annual total returns (%) as of August 31, 2019
| | | | | | | | | | | | | | | | | | | | | | |
| | | |
| | | | | | | | Expense ratios1 (%) | |
| | | | | | |
| | | Inception date | | 1 year | | | 5 year | | | Since
inception | | | Gross | | | Net2 | |
| | | | | | | |
| Institutional Class (WCIIX) | | 5-31-2013 | | | 2.71 | | | | 1.32 | | | | 1.18 | | | | 0.37 | | | | 0.27 | |
| | | | | | | |
| Bloomberg Barclays6-9 Month Treasury Bill Index3 | | – | | | 2.68 | | | | 1.01 | | | | 0.83 | * | | | – | | | | – | |
| * | Based on the inception date of Institutional Class. |
Figures quoted represent past performance, which is no guarantee of future results, and do not reflect taxes that a shareholder may pay on fund distributions or the redemption of fund shares. Investment return and principal value of an investment will fluctuate so that an investor’s shares, when redeemed, may be worth more or less than their original cost. Current performance may be lower or higher than the performance data quoted, which assumes the reinvestment of dividends and capital gains. Currentmonth-end performance is available on the Fund’s website,wfam.com.
Index returns do not include transaction costs associated with buying and selling securities, any mutual fund fees or expenses, or any taxes. It is not possible to invest directly in an index.
Institutional Class shares are sold without afront-end sales charge or contingent deferred sales charge.
Bond values fluctuate in response to the financial condition of individual issuers, general market and economic conditions, and changes in interest rates. Changes in market conditions and government policies may lead to periods of heightened volatility in the bond market and reduced liquidity for certain bonds held by the Fund. In general, when interest rates rise, bond values fall and investors may lose principal value. Interest rate changes and their impact on the Fund and its share price can be sudden and unpredictable. The use of derivatives may reduce returns and/or increase volatility. Certain investment strategies tend to increase the total risk of an investment (relative to the broader market). The Fund is exposed to foreign investment risk, mortgage- and asset-backed securities risk, and municipal securities risk. Consult the Fund’s prospectus for additional information on these and other risks.
Please see footnotes on page 7.
6 | Wells Fargo Conservative Income Fund
Performance highlights (unaudited)
|
|
| Growth of $1,000,000 investment as of August 31, 20194 |
|
|
| ‡ | CFA® and Chartered Financial Analyst® are trademarks owned by CFA Institute. |
| 1 | Reflects the expense ratios as stated in the most recent prospectus. The expense ratios shown are subject to change and may differ from the annualized expense ratio shown in the financial highlights of this report. |
| 2 | The manager has contractually committed through December 31, 2019, to waive fees and/or reimburse expenses to the extent necessary to cap the expenses at the amount shown. Brokerage commissions, stamp duty fees, interest, taxes, acquired fund fees and expenses (if any), and extraordinary expenses are excluded from the expense cap. Prior to or after the commitment expiration date, the cap may be increased or the commitment to maintain the cap may be terminated only with the approval of the Board of Trustees. Without this cap, the Fund’s returns would have been lower. The expense ratio paid by an investor is the net expense ratio (the total annual fund operating expenses after fee waivers) as stated in the prospectus. |
| 3 | The Bloomberg Barclays6-9 Month Treasury Bill Index includes all publicly issuedzero-coupon U.S. Treasury bills that have a remaining maturity of less than nine months and more than six, are rated investment-grade, and have $250 million or more of outstanding face value. You cannot invest directly in an index. |
| 4 | The chart compares the performance of Institutional Class shares since inception with the performance of the Bloomberg Barclays6-9 Month Treasury Bill Index. The chart assumes a hypothetical investment of $1,000,000 in Institutional Class shares and reflects all operating expenses. |
| 5 | The ten largest holdings, excluding cash, cash equivalents and any money market, are calculated based on the value of the investments divided by total net assets of the Fund. Holdings are subject to change and may have changed since the date specified. |
| 6 | Amounts are calculated based on the total long-term investments of the Fund. These amounts are subject to change and may have changed since the date specified. |
Wells Fargo Conservative Income Fund | 7
Performance highlights (unaudited)
MANAGER’S DISCUSSION
Fund highlights
| ∎ | | The Fund outperformed its benchmark, the Bloomberg Barclays 6–9 Month Treasury Bill Index, for the12-month period that ended August 31, 2019. |
| ∎ | | The Fund is primarily invested in securities with a yield advantage over Treasuries, which added to performance. Asset-backed securities (ABS) were the best-performing asset class within the portfolio, followed by corporate notes and commercial paper. |
| ∎ | | The Fund’s duration was extended over the past 12 months to enhance return in a declining interest rate environment. |
| ∎ | | Duration and yield curve positioning were slight detractors. |
| | | | |
| |
| Ten largest holdings(%) as of August 31, 20195 | | | |
| | |
GNMA, Series2019-H04 Class CA,3.00%, 3-20-2069 | | | 1.89 | |
| | |
World Omni Auto Lease Trust Series2018-A Class A3, 2.00%,4-17-2023 | | | 1.82 | |
| | |
TTX Company, 2.60%,6-15-2020 | | | 1.81 | |
| | |
Bank of America Credit Card Trust Series2017-A1 Class A1, 1.95%,8-15-2022 | | | 1.80 | |
| | |
FHLMC Multi Family Structured Pass-Through Securities, SeriesK-715 Class A2,2.86%, 1-25-2021 | | | 1.73 | |
| | |
WEA Finance LLC, 3.25%,10-5-2020 | | | 1.52 | |
| | |
Protective Life Global Funding, 2.85%,6-28-2021 | | | 1.51 | |
| | |
NextGear Floorplan Master Trust Series2018-1A Class A1, 2.84%,2-15-2023 | | | 1.51 | |
| | |
Delamare Cards Series2018-1A Class A1,2.88%, 11-19-2025 | | | 1.51 | |
| | |
WM Wrigley Jr. Company, 2.90%,10-21-2019 | | | 1.50 | |
Yield-advantaged sectors added value.
The largest allocation of the Fund was to corporate bonds. This allocation drove the performance of the portfolio. The finance sector had the highest return of all subsectors within the corporate sector, driving the performance of the portfolio.
The Fund’s sector allocation changed during the year. The allocation to fixed-rate corporate positions increased by 26%. The allocation to floating-rate corporate notes decreased by 11%, resulting in an overall increase of 15% to the corporate sector. The allocation to commercial paper was reduced by 21% to a total of 16%, including CDs and daily sweeps. These changes were implemented in order to lengthen the duration of the portfolio, which did increase from 0.33 years to 0.48 years. The floating-rate corporate note exposure, which generated a positive contribution to return for the year, was decreased by 11% to 23% due to concerns about lower interest rates. Floating-rate notes benchmarked to the London Interbank Offered Rate (LIBOR) have continued to offer attractive yields. However, LIBOR will likely move lower along with interest rates, which will result in lower coupons.
The Fund maintained significant exposure toAAA-rated ABS throughout the year. The Fund held primarily fixed-rate short-dated tranches(two-year and shorter weighted average life) across ABS sectors, with particular emphasis on senior classes in equipment and prime auto issuers. Sector fundamentals have been solid, and automobile ABS exhibited strong, resilient credit trends even at this later stage of the economic cycle. Tighter underwriting standards have led tonear-record-low defaults and net losses. The ABS sector currently offers a good risk-adjusted return profile and a large investable universe with good liquidity. The Fund did add exposure to short-term government mortgage-backed securities as the sector has become attractive due to the reduction in purchases by the U.S. Federal Reserve (Fed) and commercial banks.
|
|
| Portfolio allocation as of August 31, 20196 |
|
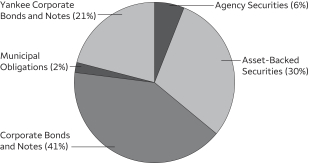 |
We extended duration to take advantage of lower interest rates.
The Fed increased the federal funds rate by 25 basis points (bps; 100 bps equal 1.00%) in December 2018. In a reaction to increasingly volatile markets, uncertainty around a trade war, and a weaker global economy, the Fed reversed course and cut the federal funds rate in July 2019 by 25 bps. Short-term Treasury yields were quite volatile during the12-month period that ended August 31, 2019. Yields on the1-year Treasury bill dropped 67 bps to yield 1.76%,2-year Treasury note yields dropped 112 bps to yield 1.50%, and3-year Treasury note yields dropped 126 bps to yield 1.42%. In addition to the volatility in interest rates, the yield curve inverted with longer-term Treasuries yielding less than short-term Treasuries across certain segments of the curve.
Please see footnotes on page 7.
8 | Wells Fargo Conservative Income Fund
Performance highlights (unaudited)
The Fund’s duration, which is shorter than the benchmark and was a slight detractor from performance for the portfolio, was increased to 0.48 years from 0.33 years during the period. We expect to maintain the Fund’s duration and will look for opportunities to extend the Fund’s duration as the Fed has embarked on an easing policy consistent with amid-cycle adjustment.
We see opportunities ahead.
We believe the Fed will likely lower the federal funds rate twice during the remainder of 2019. Looking ahead to 2020, the Fed will likely reiterate its message that it is data dependent and take the appropriate steps to support economic growth and employment. The corporate bond market is both technically and fundamentally strong.Year-to-date issuance was down 6% versus the same time period last year. While nonfinancial supply was up 10% during this time period, financial issuance was down 27%. Given the reduction in supply and steady demand, corporates performed well. The Fund’s strategy requires investing in high-quality securities, and given the tight spreads currently available in the corporate market, the Fund may potentially benefit by avoiding lower-credit-quality corporates, which are more likely to underperform in a spread widening environment.
Automobile ABS issuance increased through August 2019 versus the same time period in 2018. Overall ABS issuance, however, decreased, led by credit cards, which were down $13 billion. As noted previously, the fundamentals of the sector are strong and we expect the Fund will maintain significant exposure to this high-credit-quality and defensive sector. Nonfinancial commercial paper issuance is declining, in large part due to bond market activity among active borrowers who are issuing longer-dated corporate notes to lock in attractive rates. Commercial paper rates will likely move lower due to the decreased supply and falling LIBOR rates. The commercial paper allocation to the Fund was reduced to focus on other attractive sectors.
The duration of the Fund will likely be positioned in a conservative manner and may be extended in anticipation of lower interest rates. We continue to rely on our significant credit research capabilities to potentially avoid credit downgrades from companies that are likely to leverage their balance sheets as the result of merger and acquisition activity.
Wells Fargo Conservative Income Fund | 9
Fund expenses (unaudited)
As a shareholder of the Fund, you incur ongoing costs including management fees and other Fund expenses. This example is intended to help you understand your ongoing costs (in dollars) of investing in the Fund and to compare these costs with the ongoing costs of investing in other mutual funds.
The example is based on an investment of $1,000 invested at the beginning of thesix-month period and held for the entire period from March 1, 2019 to August 31, 2019.
Actual expenses
The “Actual” line of the table below provides information about actual account values and actual expenses. You may use the information in this line, together with the amount you invested, to estimate the expenses that you paid over the period. Simply divide your account value by $1,000 (for example, an $8,600 account value divided by $1,000 = 8.6), then multiply the result by the number in the “Actual” line under the heading entitled “Expenses paid during period” for your applicable class of shares to estimate the expenses you paid on your account during this period.
Hypothetical example for comparison purposes
The “Hypothetical” line of the table below provides information about hypothetical account values and hypothetical expenses based on the Fund’s actual expense ratio and an assumed rate of return of 5% per year before expenses, which is not the Fund’s actual return. The hypothetical account values and expenses may not be used to estimate the actual ending account balance or expenses you paid for the period. You may use this information to compare the ongoing costs of investing in the Fund and other funds. To do so, compare this 5% hypothetical example with the 5% hypothetical examples that appear in the shareholder reports of the other funds.
Please note that the expenses shown in the table are meant to highlight your ongoing costs. Therefore, the “Hypothetical” line of the table is useful in comparing ongoing costs only and will not help you determine the relative total costs of owning different funds.
| | | | | | | | | | | | | | | | |
| | | Beginning
account value
3-1-2019 | | | Ending
account value
8-31-2019 | | | Expenses
paid during
the period¹ | | | Annualized net
expense ratio | |
| | | | | |
Institutional Class | | | | | | | | | | | | | | | | |
| | | | |
Actual | | $ | 1,000.00 | | | $ | 1,015.13 | | | $ | 1.37 | | | | 0.27 | % |
| | | | |
Hypothetical (5% return before expenses) | | $ | 1,000.00 | | | $ | 1,023.84 | | | $ | 1.38 | | | | 0.27 | % |
| 1 | Expenses paid is equal to the net annualized ratio multiplied by the average account value over the period, multiplied by the number of days in the most recent fiscal half-year divided by the number of days in the fiscal year (to reflect theone-half-year period). |
10 | Wells Fargo Conservative Income Fund
Portfolio of investments—August 31, 2019
| | | | | | | | | | | | | | | | |
| | | Interest
rate | | | Maturity
date | | | Principal | | | Value | |
| Agency Securities: 5.10% | |
| | | | |
FHLMC Multi Family Structured Pass-Through Securities SeriesK-714 Class A2 ±± | | | 3.03 | % | | | 10-25-2020 | | | $ | 4,894,716 | | | $ | 4,925,958 | |
| | | | |
FHLMC Multi Family Structured Pass-Through Securities SeriesK-715 Class A2 ±± | | | 2.86 | | | | 1-25-2021 | | | | 5,705,184 | | | | 5,745,794 | |
| | | | |
GNMA Series2019-H04 Class CA±± | | | 3.00 | | | | 3-20-2069 | | | | 6,249,346 | | | | 6,282,435 | |
| |
Total Agency Securities (Cost $16,924,556) | | | | 16,954,187 | |
| | | | | |
|
| Asset-Backed Securities: 24.65% | |
| | | | |
Ally Auto Receivables Trust Series2018-2 Class A3 | | | 2.92 | | | | 11-15-2022 | | | | 2,465,000 | | | | 2,485,989 | |
| | | | |
American Express Credit Account Master Trust Series2017-1 Class A | | | 1.93 | | | | 9-15-2022 | | | | 1,300,000 | | | | 1,299,044 | |
| | | | |
American Express Credit Account Master Trust Series2017-6 Class A | | | 2.04 | | | | 5-15-2023 | | | | 2,236,000 | | | | 2,240,389 | |
| | | | |
AmeriCredit Automobile Receivables Trust Series2019-1 Class A2A | | | 2.93 | | | | 6-20-2022 | | | | 2,000,000 | | | | 2,008,815 | |
| | | | |
Bank of America Credit Card Trust Series2017-A1 Class A1 | | | 1.95 | | | | 8-15-2022 | | | | 6,000,000 | | | | 5,996,775 | |
| | | | |
Bank of the West Auto Trust Series2018-1 Class A2 144A | | | 3.09 | | | | 4-15-2021 | | | | 1,958,670 | | | | 1,962,760 | |
| | | | |
Canadian Pacer Auto Receivables Trust Series2018-2A Class A2A 144A | | | 3.00 | | | | 6-21-2021 | | | | 1,008,803 | | | | 1,011,817 | |
| | | | |
Canadian Pacer Auto Receivables Trust Series2019-1A Class A2 144A | | | 2.78 | | | | 3-21-2022 | | | | 2,000,000 | | | | 2,008,794 | |
| | | | |
CarMax Auto Owner Trust Series2018-4 Class A2A | | | 3.11 | | | | 2-15-2022 | | | | 2,624,921 | | | | 2,638,680 | |
| | | | |
CCG Receivables Trust Series2018-2 Class A2 144A | | | 3.09 | | | | 12-15-2025 | | | | 3,731,131 | | | | 3,763,797 | |
| | | | |
Chase Issuance Trust Series2015-A4 Class A4 | | | 1.84 | | | | 4-15-2022 | | | | 3,500,000 | | | | 3,496,865 | |
| | | | |
Chase Issuance Trust Series2016-A4 Class A4 | | | 1.49 | | | | 7-15-2022 | | | | 3,000,000 | | | | 2,987,831 | |
| | | | |
Delamare Cards Series2018-1A Class A1 (1 Month LIBOR +0.70%) 144A± | | | 2.88 | | | | 11-19-2025 | | | | 5,000,000 | | | | 5,006,210 | |
| | | | |
Dell Equipment Finance Trust Series2018-1 Class A2A 144A | | | 2.97 | | | | 10-22-2020 | | | | 670,019 | | | | 671,431 | |
| | | | |
Dell Equipment Finance Trust Series2018-2 Class A2 144A | | | 3.16 | | | | 2-22-2021 | | | | 1,387,211 | | | | 1,395,632 | |
| | | | |
Hertz Fleet Lease Funding LP Series2017-1 Class A1 (1 Month LIBOR +0.65%) 144A± | | | 3.03 | | | | 4-10-2031 | | | | 1,013,037 | | | | 1,014,234 | |
| | | | |
Hyundai Auto Lease Securitization Trust Series2019-B Class A2 144A | | | 2.08 | | | | 12-15-2021 | | | | 830,000 | | | | 831,190 | |
| | | | |
Mercedes-Benz Auto Lease Trust Series2019-A Class A2 | | | 3.01 | | | | 2-16-2021 | | | | 3,051,158 | | | | 3,059,296 | |
| | | | |
NextGear Floorplan Master Trust Series2018-1A Class A1 (1 Month LIBOR +0.64%) 144A± | | | 2.84 | | | | 2-15-2023 | | | | 5,000,000 | | | | 5,007,548 | |
| | | | |
Nissan Auto Receivables Owner Trust Series2019-B Class A2 | | | 2.56 | | | | 3-15-2022 | | | | 1,350,000 | | | | 1,356,582 | |
| | | | |
Oscar US Funding Trust Series2017-2A Class A2A 144A | | | 2.13 | | | | 11-10-2020 | | | | 41,883 | | | | 41,870 | |
| | | | |
Oscar US Funding Trust Series2018-1A Class A2B (1 Month LIBOR +0.49%) 144A± | | | 2.87 | | | | 4-12-2021 | | | | 675,620 | | | | 675,879 | |
| | | | |
Oscar US Funding Trust Series2018-2A Class A2A 144A | | | 3.15 | | | | 8-10-2021 | | | | 2,001,433 | | | | 2,007,736 | |
| | | | |
Oscar US Funding Trust Series2019-2A Class A2 144A | | | 2.49 | | | | 8-10-2022 | | | | 500,000 | | | | 501,441 | |
| | | | |
Penarth Master Issuer plc Series2019-1A Class A1 (1 Month LIBOR +0.54%) 144A± | | | 2.72 | | | | 7-18-2023 | | | | 2,000,000 | | | | 1,998,580 | |
| | | | |
Santander Retail Auto Lease Trust Series2019-B Class A2A 144A | | | 2.29 | | | | 4-20-2022 | | | | 1,000,000 | | | | 1,002,882 | |
| | | | |
Securitized Term Auto Receivables Trust Series2018-2A Class A2A 144A | | | 3.06 | | | | 2-25-2021 | | | | 1,071,809 | | | | 1,074,843 | |
| | | | |
SoFi Consumer Loan Program Trust Series2018-4 Class A 144A | | | 3.54 | | | | 11-26-2027 | | | | 3,852,662 | | | | 3,891,138 | |
| | | | |
SoFi Consumer Loan Program Trust Series2019-2 Class A 144A | | | 3.01 | | | | 4-25-2028 | | | | 1,313,112 | | | | 1,324,308 | |
| | | | |
Tesla Auto Lease Trust Series2018-A Class C 144A | | | 2.97 | | | | 4-20-2020 | | | | 1,870,000 | | | | 1,872,628 | |
| | | | |
Trillium Credit Card Trust II Series2019-2A Class A 144A | | | 3.04 | | | | 1-26-2024 | | | | 2,000,000 | | | | 2,030,459 | |
| | | | |
Trillium Credit Card Trust III Series2018-2A Class A (1 Month LIBOR +0.35%) 144A± | | | 2.50 | | | | 9-26-2023 | | | | 1,150,000 | | | | 1,150,806 | |
| | | | |
Verizon Owner Trust Series2017-3A Class A1A 144A | | | 2.06 | | | | 4-20-2022 | | | | 4,486,000 | | | | 4,484,458 | |
| | | | |
Verizon Owner Trust Series2018-1A Class A1 144A | | | 2.82 | | | | 9-20-2022 | | | | 2,000,000 | | | | 2,017,514 | |
| | | | |
Volvo Financial Equipment LLC Series2019-1A Class A2 144A | | | 2.90 | | | | 11-15-2021 | | | | 1,600,000 | | | | 1,607,023 | |
| | | | |
World Omni Auto Lease Trust Series2018-A Class A3 | | | 2.50 | | | | 4-17-2023 | | | | 6,000,000 | | | | 6,041,380 | |
| |
Total Asset-Backed Securities (Cost $81,657,327) | | | | 81,966,624 | |
| | | | | |
The accompanying notes are an integral part of these financial statements.
Wells Fargo Conservative Income Fund | 11
Portfolio of investments—August 31, 2019
| | | | | | | | | | | | | | | | |
| | | Interest
rate | | | Maturity
date | | | Principal | | | Value | |
| Corporate Bonds and Notes: 33.53% | |
|
Communication Services: 2.12% | |
|
| Entertainment: 1.20% | |
| | | | |
The Walt Disney Company | | | 1.95 | % | | | 3-4-2020 | | | $ | 4,000,000 | | | $ | 4,000,226 | |
| | | | | | | | | | | | | | | | |
|
| Media: 0.92% | |
| | | | |
Comcast Corporation | | | 3.30 | | | | 10-1-2020 | | | | 3,000,000 | | | | 3,043,651 | |
| | | | | | | | | | | | | | | | |
|
| Consumer Discretionary: 0.91% | |
|
| Automobiles: 0.91% | |
| | | | |
Volkswagen Group America Company (3 Month LIBOR +0.77%) 144A± | | | 2.95 | | | | 11-13-2020 | | | | 3,000,000 | | | | 3,013,016 | |
| | | | | | | | | | | | | | | | |
|
Consumer Staples: 1.50% | |
|
| Food Products: 1.50% | |
| | | | |
WM Wrigley Jr. Company 144A | | | 2.90 | | | | 10-21-2019 | | | | 5,000,000 | | | | 5,002,131 | |
| | | | | | | | | | | | | | | | |
|
Energy: 1.32% | |
|
| Oil, Gas & Consumable Fuels: 1.32% | |
| | | | |
Exxon Mobil Corporation (3 Month LIBOR +0.33%)± | | | 2.50 | | | | 8-16-2022 | | | | 4,375,000 | | | | 4,386,305 | |
| | | | | | | | | | | | | | | | |
|
Financials: 24.67% | |
|
| Banks: 5.11% | |
| | | | |
BB&T Corporation | | | 2.45 | | | | 1-15-2020 | | | | 3,500,000 | | | | 3,502,485 | |
| | | | |
Branch Banking Trust | | | 2.10 | | | | 1-15-2020 | | | | 1,350,000 | | | | 1,349,862 | |
| | | | |
Citigroup Incorporated | | | 2.70 | | | | 3-30-2021 | | | | 2,000,000 | | | | 2,020,193 | |
| | | | |
HSBC Bank USA NA | | | 4.88 | | | | 8-24-2020 | | | | 2,000,000 | | | | 2,052,131 | |
| | | | |
JPMorgan Chase & Company | | | 4.25 | | | | 10-15-2020 | | | | 2,000,000 | | | | 2,048,913 | |
| | | | |
JPMorgan Chase Bank NA (3 Month LIBOR +0.37%)± | | | 2.49 | | | | 2-19-2021 | | | | 2,000,000 | | | | 2,001,235 | |
| | | | |
US Bank NA | | | 2.35 | | | | 1-23-2020 | | | | 4,000,000 | | | | 4,003,537 | |
| |
| | | | 16,978,356 | |
| | | | | |
|
| Capital Markets: 2.89% | |
| | | | |
Bank of New York Mellon Corporation (3 Month LIBOR +0.28%)± | | | 2.78 | | | | 6-4-2021 | | | | 900,000 | | | | 900,491 | |
| | | | |
Charles Schwab Corporation (3 Month LIBOR +0.32%)± | | | 2.47 | | | | 5-21-2021 | | | | 4,540,000 | | | | 4,542,148 | |
| | | | |
Goldman Sachs Group Incorporated | | | 6.00 | | | | 6-15-2020 | | | | 1,000,000 | | | | 1,028,729 | |
| | | | |
Morgan Stanley | | | 5.75 | | | | 1-25-2021 | | | | 3,000,000 | | | | 3,147,476 | |
| |
| | | | 9,618,844 | |
| | | | | |
|
| Consumer Finance: 4.66% | |
| | | | |
American Honda Finance Corporation (3 Month LIBOR +0.15%)± | | | 2.30 | | | | 2-21-2020 | | | | 5,000,000 | | | | 5,001,329 | |
| | | | |
BMW US Capital LLC 144A | | | 1.45 | | | | 9-13-2019 | | | | 2,000,000 | | | | 1,999,433 | |
| | | | |
BMW US Capital LLC (3 Month LIBOR +0.41%) 144A± | | | 2.82 | | | | 9-13-2019 | | | | 2,000,000 | | | | 2,000,303 | |
| | | | |
Daimler Finance North America LLC 144A | | | 2.25 | | | | 9-3-2019 | | | | 1,000,000 | | | | 1,000,000 | |
| | | | |
John Deere Capital Corporation | | | 2.20 | | | | 3-13-2020 | | | | 2,500,000 | | | | 2,500,615 | |
| | | | |
Nissan Motor Acceptance Corporation (3 Month LIBOR +0.52%) 144A± | | | 2.93 | | | | 3-15-2021 | | | | 1,000,000 | | | | 999,590 | |
| | | | |
Toyota Motor Credit Corporation (3 Month LIBOR +0.17%)± | | | 2.57 | | | | 9-18-2020 | | | | 2,000,000 | | | | 2,002,582 | |
| |
| | | | 15,503,852 | |
| | | | | |
|
| Diversified Financial Services: 1.52% | |
| | | | |
WEA Finance LLC 144A | | | 3.25 | | | | 10-5-2020 | | | | 5,000,000 | | | | 5,059,322 | |
| | | | | | | | | | | | | | | | |
The accompanying notes are an integral part of these financial statements.
12 | Wells Fargo Conservative Income Fund
Portfolio of investments—August 31, 2019
| | | | | | | | | | | | | | | | |
| | | Interest
rate | | | Maturity
date | | | Principal | | | Value | |
| Insurance: 10.49% | |
| | | | |
AIG Global Funding 144A | | | 1.95 | % | | | 10-18-2019 | | | $ | 1,750,000 | | | $ | 1,749,486 | |
| | | | |
AIG Global Funding (3 Month LIBOR +0.46%) 144A± | | | 2.81 | | | | 6-25-2021 | | | | 2,950,000 | | | | 2,958,676 | |
| | | | |
Athene Global Funding 144A | | | 2.75 | | | | 4-20-2020 | | | | 4,085,000 | | | | 4,098,491 | |
| | | | |
MassMutual Global Funding II 144A | | | 1.95 | | | | 9-22-2020 | | | | 3,826,000 | | | | 3,824,048 | |
| | | | |
Metropolitan Life Global Funding I (3 Month LIBOR +0.40%) 144A± | | | 2.84 | | | | 6-12-2020 | | | | 4,475,000 | | | | 4,486,098 | |
| | | | |
Pricoa Global Funding 144A | | | 1.45 | | | | 9-13-2019 | | | | 2,497,000 | | | | 2,496,529 | |
| | | | |
Principal Life Global Funding II 144A | | | 2.15 | | | | 1-10-2020 | | | | 4,900,000 | | | | 4,899,590 | |
| | | | |
Protective Life Global Funding (3 Month LIBOR +0.52%) 144A± | | | 2.85 | | | | 6-28-2021 | | | | 5,000,000 | | | | 5,022,867 | |
| | | | |
The Allstate Corporation (3 Month LIBOR +0.43%)± | | | 2.76 | | | | 3-29-2021 | | | | 825,000 | | | | 825,905 | |
| | | | |
USAA Capital Corporation 144A | | | 2.00 | | | | 6-1-2021 | | | | 4,500,000 | | | | 4,510,357 | |
| |
| | | | 34,872,047 | |
| | | | | |
|
Industrials: 1.81% | |
|
| Road & Rail: 1.81% | |
| | | | |
TTX Company 144A | | | 2.60 | | | | 6-15-2020 | | | | 6,000,000 | | | | 6,001,412 | |
| | | | | | | | | | | | | | | | |
|
Materials: 1.20% | |
|
| Paper & Forest Products: 1.20% | |
| | | | |
Georgia Pacific LLC 144A | | | 2.54 | | | | 11-15-2019 | | | | 4,000,000 | | | | 4,000,759 | |
| | | | | | | | | | | | | | | | |
| |
Total Corporate Bonds and Notes (Cost $111,180,085) | | | | 111,479,921 | |
| | | | | |
|
Municipal Obligations: 1.53% | |
|
California: 0.30% | |
|
| Miscellaneous Revenue: 0.30% | |
| | | | |
Fresno County CA Pension CAB Series A (National Insured) ¤ | | | 0.00 | | | | 8-15-2020 | | | | 1,025,000 | | | | 1,004,695 | |
| | | | | | | | | | | | | | | | |
|
Tennessee: 1.23% | |
|
| Health Revenue: 1.23% | |
| | | | |
Nashville & Davidson Counties TN Vanderbilt University Medical Center Series D (1 Month LIBOR +2.50%)± | | | 4.74 | | | | 7-1-2046 | | | | 4,000,000 | | | | 4,104,160 | |
| | | | | | | | | | | | | | | | |
| |
Total Municipal Obligations (Cost $5,104,499) | | | | 5,108,855 | |
| | | | | |
|
Yankee Corporate Bonds and Notes: 18.85% | |
|
Energy: 1.74% | |
|
| Oil, Gas & Consumable Fuels: 1.74% | |
| | | | |
BP Capital Markets plc (3 Month LIBOR +0.25%)± | | | 2.38 | | | | 11-24-2020 | | | | 1,270,000 | | | | 1,271,238 | |
| | | | |
BP Capital Markets plc | | | 2.52 | | | | 1-15-2020 | | | | 4,500,000 | | | | 4,506,200 | |
| |
| | | | 5,777,438 | |
| | | | | |
|
Financials: 15.06% | |
|
| Banks: 13.65% | |
| | | | |
Australia and New Zealand Banking Group 144A | | | 4.88 | | | | 1-12-2021 | | | | 1,000,000 | | | | 1,038,159 | |
| | | | |
Australia and New Zealand Banking Group 144A | | | 5.10 | | | | 1-13-2020 | | | | 4,000,000 | | | | 4,040,993 | |
| | | | |
Barclays Bank plc (3 Month LIBOR +0.46%)± | | | 2.80 | | | | 1-11-2021 | | | | 4,000,000 | | | | 3,993,537 | |
| | | | |
BNZ International Funding of London (3 Month LIBOR +0.70%) 144A± | | | 2.85 | | | | 2-21-2020 | | | | 1,750,000 | | | | 1,755,014 | |
| | | | |
Cooperatieve Rabobank UA (3 Month LIBOR +0.43%)± | | | 2.70 | | | | 4-26-2021 | | | | 3,000,000 | | | | 3,008,483 | |
| | | | |
Credit Agricole 144A | | | 2.75 | | | | 6-10-2020 | | | | 4,550,000 | | | | 4,569,964 | |
The accompanying notes are an integral part of these financial statements.
Wells Fargo Conservative Income Fund | 13
Portfolio of investments—August 31, 2019
| | | | | | | | | | | | | | | | |
| | | Interest
rate | | | Maturity
date | | | Principal | | | Value | |
| Banks (continued) | |
| | | | |
HSBC Holdings plc (3 Month LIBOR +0.65%)± | | | 3.09 | % | | | 9-11-2021 | | | $ | 2,000,000 | | | $ | 2,001,804 | |
| | | | |
Macquarie Bank Limited 144A | | | 2.85 | | | | 1-15-2021 | | | | 4,000,000 | | | | 4,034,959 | |
| | | | |
Santander UK plc (3 Month LIBOR +0.62%)± | | | 3.14 | | | | 6-1-2021 | | | | 4,000,000 | | | | 4,001,552 | |
| | | | |
Santander UK plc (3 Month LIBOR +0.66%)± | | | 2.82 | | | | 11-15-2021 | | | | 1,270,000 | | | | 1,273,159 | |
| | | | |
Skandinaviska Enskilda Banken 144A | | | 2.63 | | | | 11-17-2020 | | | | 3,000,000 | | | | 3,015,390 | |
| | | | |
Sumitomo Mitsui Banking Corporation (3 Month LIBOR +0.35%)± | | | 2.65 | | | | 1-17-2020 | | | | 3,000,000 | | | | 3,003,120 | |
| | | | |
Svenska Handelsbanken AB (3 Month LIBOR +0.47%)± | | | 2.60 | | | | 5-24-2021 | | | | 4,000,000 | | | | 4,015,541 | |
| | | | |
United Overseas Bank Limited (3 Month LIBOR +0.48%) 144A± | | | 2.74 | | | | 4-23-2021 | | | | 1,800,000 | | | | 1,803,738 | |
| | | | |
Westpac Banking Corporation (3 Month LIBOR +0.28%)± | | | 2.44 | | | | 5-15-2020 | | | | 2,325,000 | | | | 2,328,373 | |
| | | | |
Westpac Banking Corporation (3 Month LIBOR +1.00%)± | | | 3.18 | | | | 5-13-2021 | | | | 1,525,000 | | | | 1,542,627 | |
| | | | |
| | | | | | | | | | | | | | | 45,426,413 | |
| | | | | | | | | | | | | | | | |
|
| Diversified Financial Services: 0.30% | |
| | | | |
UBS AG (3 Month LIBOR +0.48%) 144A± | | | 3.00 | | | | 12-1-2020 | | | | 1,000,000 | | | | 1,002,380 | |
| | | | | | | | | | | | | | | | |
|
| Insurance: 1.11% | |
| | | | |
AIA Group Limited (3 Month LIBOR +0.52%) 144A± | | | 2.91 | | | | 9-20-2021 | | | | 3,680,000 | | | | 3,679,926 | |
| | | | | | | | | | | | | | | | |
|
Industrials: 2.05% | |
|
| Electrical Equipment: 2.05% | |
| | | | |
Siemens Financieringsmaatschappij NV 144A | | | 2.15 | | | | 5-27-2020 | | | | 1,900,000 | | | | 1,899,082 | |
| | | | |
Tyco Electronics Group SA (3 Month LIBOR +0.45%)± | | | 2.93 | | | | 6-5-2020 | | | | 4,900,000 | | | | 4,904,900 | |
| |
| | | | 6,803,982 | |
| | | | | |
| |
Total Yankee Corporate Bonds and Notes (Cost $62,520,438) | | | | 62,690,139 | |
| | | | | |
|
Short-Term Investments: 16.07% | |
|
| Certificates of Deposit: 3.88% | |
| | | | |
Credit Suisse (3 Month LIBOR +0.12%)± | | | 2.26 | | | | 2-28-2020 | | | | 3,000,000 | | | | 3,000,574 | |
| | | | |
Goldman Sachs Bank USA (1 Month LIBOR +0.30%)± | | | 2.52 | | | | 11-4-2019 | | | | 1,900,000 | | | | 1,900,848 | |
| | | | |
Natixis (3 Month LIBOR +0.23%)± | | | 2.57 | | | | 1-10-2020 | | | | 3,000,000 | | | | 3,001,656 | |
| | | | |
Societe Generale SA (1 Month LIBOR +0.20%)± | | | 2.40 | | | | 2-10-2020 | | | | 5,000,000 | | | | 5,000,347 | |
| |
| | | | 12,903,425 | |
| | | | | |
|
| Commercial Paper: 12.13% | |
| | | | |
Anglesea Funding plc 144A(p)(z) | | | 2.03 | | | | 9-30-2019 | | | | 5,500,000 | | | | 5,489,779 | |
| | | | |
Banco de Credito e Inversiones 144A(z) | | | 2.25 | | | | 9-25-2019 | | | | 1,000,000 | | | | 998,386 | |
| | | | |
Charta LLC 144A(p)(z) | | | 2.32 | | | | 10-1-2019 | | | | 1,250,000 | | | | 1,247,680 | |
| | | | |
Coca-Cola Company 144A(z) | | | 2.67 | | | | 10-24-2019 | | | | 2,100,000 | | | | 2,093,301 | |
| | | | |
Concord Minutemen Capital Company 144A(p)(z) | | | 1.71 | | | | 9-13-2019 | | | | 1,300,000 | | | | 1,298,902 | |
| | | | |
Concord Minutemen Capital Company 144A(p)(z) | | | 2.09 | | | | 10-2-2019 | | | | 2,500,000 | | | | 2,495,080 | |
| | | | |
Grand China Air Limited (z) | | | 1.40 | | | | 9-6-2019 | | | | 2,100,000 | | | | 2,099,110 | |
| | | | |
Grand China Air Limited (z) | | | 2.16 | | | | 9-13-2019 | | | | 3,900,000 | | | | 3,896,707 | |
| | | | |
Great Bridge Capital Company LLC 144A(p)(z) | | | 0.61 | | | | 9-4-2019 | | | | 6,000,000 | | | | 5,998,167 | |
| | | | |
Great Bridge Capital Company LLC 144A(p)(z) | | | 2.12 | | | | 10-18-2019 | | | | 2,000,000 | | | | 1,993,886 | |
| | | | |
LMA Americas LLC 144A(p)(z) | | | 1.93 | | | | 10-2-2019 | | | | 3,750,000 | | | | 3,742,895 | |
| | | | |
LMA Americas LLC 144A(p)(z) | | | 2.03 | | | | 10-7-2019 | | | | 1,500,000 | | | | 1,496,735 | |
| | | | |
Metropolitan Life Short Term Funding LLC 144A(z) | | | 2.05 | | | | 10-2-2019 | | | | 4,000,000 | | | | 3,992,311 | |
| | | | |
Ontario Teachers’ Finance Trust 144A(z) | | | 2.44 | | | | 10-18-2019 | | | | 3,500,000 | | | | 3,490,158 | |
| |
| | | | 40,333,097 | |
| | | | | |
The accompanying notes are an integral part of these financial statements.
14 | Wells Fargo Conservative Income Fund
Portfolio of investments—August 31, 2019
| | | | | | | | | | | | | | | | |
| | | Yield | | | | | | Shares | | | Value | |
| Investment Companies: 0.06% | |
| | | | |
Wells Fargo Government Money Market Fund Select Class (l)(u) | | | 2.04 | % | | | | | | | 220,913 | | | $ | 220,913 | |
| | | | | | | | | | | | | | | | |
| |
Total Short-Term Investments (Cost $53,459,535) | | | | 53,457,435 | |
| | | | | |
| | | | | | | | |
| Total investments in securities (Cost $330,846,440) | | | 99.73 | % | | | 331,657,161 | |
| | |
Other assets and liabilities, net | | | 0.27 | | | | 893,772 | |
| | | | | | | | |
| Total net assets | | | 100.00 | % | | $ | 332,550,933 | |
| | | | | | | | |
| ±± | The coupon of the security is adjusted based on the principal and interest payments received from the underlying pool of mortgages as well as the credit quality and the actual prepayment speed of the underlying mortgages. |
| 144A | The security may be resold in transactions exempt from registration, normally to qualified institutional buyers, pursuant to Rule 144A under the Securities Act of 1933. |
| ± | Variable rate investment. The rate shown is the rate in effect at period end. |
| ¤ | The security is issued in zero coupon form with no periodic interest payments. |
| (p) | Asset-backed commercial paper |
| (z) | Zero coupon security. The rate represents the current yield to maturity. |
| (l) | The issuer of the security is an affiliated person of the Fund as defined in the Investment Company Act of 1940. |
| (u) | The rate represents the7-day annualized yield at period end. |
Abbreviations:
| CAB | Capital appreciation bond |
| FHLMC | Federal Home Loan Mortgage Corporation |
| GNMA | Government National Mortgage Association |
| LIBOR | London Interbank Offered Rate |
| National | National Public Finance Guarantee Corporation |
Investments in Affiliates
An affiliated investment is an investment in which the Fund owns at least 5% of the outstanding voting shares of the issuer or as a result of other relationships, such as the Fund and the issuer having the same investment manager. Transactions with issuers that were either affiliated persons of the Fund at the beginning of the period or the end of the period were as follows:
| | | | | | | | | | | | | | | | | | | | | | | | | | | | | | | | | | | | |
| | | Shares,
beginning
of period | | | Shares
purchased | | | Shares
sold | | | Shares,
end of
period | | | Net
realized
gains
(losses) | | | Net
change in
unrealized
gains
(losses) | | | Income
from
affiliated
securities | | | Value,
end
of period | | | % of
net
assets | |
Short-Term Investments | | | | | | | | | | | | | | | | | | | | | | | | | | | | | | | | | | | | |
Investment Companies | | | | | | | | | | | | | | | | | | | | | | | | | | | | | | | | | | | | |
Wells Fargo Government Money Market Fund Select Class | | | 96,943 | | | | 206,637,029 | | | | 206,513,059 | | | | 220,913 | | | $ | 0 | | | $ | 0 | | | $ | 33,562 | | | $ | 220,913 | | | | 0.06 | % |
The accompanying notes are an integral part of these financial statements.
Wells Fargo Conservative Income Fund | 15
Statement of assets and liabilities—August 31, 2019
| | | | |
| | | | |
| |
Assets | | | | |
Investments in unaffiliated securities, at value (cost $330,625,527) | | $ | 331,436,248 | |
Investments in affiliated securities, at value (cost $220,913) | | | 220,913 | |
Cash | | | 294 | |
Receivable for interest | | | 1,187,563 | |
Prepaid expenses and other assets | | | 23,139 | |
| | | | |
Total assets | | | 332,868,157 | |
| | | | |
| |
Liabilities | | | | |
Dividends payable | | | 86,361 | |
Payable for Fund shares redeemed | | | 102,478 | |
Management fee payable | | | 41,397 | |
Administration fee payable | | | 24,447 | |
Trustees’ fees and expenses payable | | | 3,927 | |
Custodian and accounting fees payable | | | 27,221 | |
Professional fees payable | | | 31,393 | |
| | | | |
Total liabilities | | | 317,224 | |
| | | | |
Total net assets | | $ | 332,550,933 | |
| | | | |
| |
Net assets consist of | | | | |
Paid-in capital | | $ | 333,511,744 | |
Total distributable loss | | | (960,811 | ) |
| | | | |
Total net assets | | $ | 332,550,933 | |
| | | | |
| |
Computation of net asset value per share | | | | |
Net assets – Institutional Class | | $ | 332,550,933 | |
Shares outstanding – Institutional Class1 | | | 33,240,629 | |
Net asset value per share – Institutional Class | | | $10.00 | |
| 1 | The Fund has an unlimited number of authorized shares. |
The accompanying notes are an integral part of these financial statements.
16 | Wells Fargo Conservative Income Fund
Statement of operations—year ended August 31, 2019
| | | | |
| | | | |
| |
Investment income | | | | |
Interest | | $ | 11,996,990 | |
Income from affiliated securities | | | 33,562 | |
| | | | |
Total investment income | | | 12,030,552 | |
| | | | |
| |
Expenses | | | | |
Management fee | | | 1,069,985 | |
Administration fee | |
Institutional Class | | | 342,395 | |
Custody and accounting fees | | | 29,116 | |
Professional fees | | | 43,342 | |
Registration fees | | | 64,184 | |
Shareholder report expenses | | | 14,957 | |
Trustees’ fees and expenses | | | 21,592 | |
Other fees and expenses | | | 10,273 | |
| | | | |
Total expenses | | | 1,595,844 | |
Less: Fee waivers and/or expense reimbursements | | | | |
Fund-level | | | (440,605 | ) |
| | | | |
Net expenses | | | 1,155,239 | |
| | | | |
Net investment income | | | 10,875,313 | |
| | | | |
| |
Realized and unrealized gains (losses) on investments | | | | |
Net realized losses on investments | | | (993,936 | ) |
Net change in unrealized gains (losses) on investments | | | 441,843 | |
| | | | |
Net realized and unrealized gains (losses) on investments | | | (552,093 | ) |
| | | | |
Net increase in net assets resulting from operations | | $ | 10,323,220 | |
| | | | |
The accompanying notes are an integral part of these financial statements.
Wells Fargo Conservative Income Fund | 17
Statement of changes in net assets
| | | | | | | | | | | | | | | | |
| | | Year ended
August 31, 2019 | | | Year ended
August 31, 20181 | |
| |
Operations | | | | | |
Net investment income | | | | | | $ | 10,875,313 | | | | | | | $ | 8,442,895 | |
Net realized losses on investments | | | | | | | (993,936 | ) | | | | | | | (776,935 | ) |
Net change in unrealized gains (losses) on investments | | | | | | | 441,843 | | | | | | | | (313,636 | ) |
| | | | |
Net increase in net assets resulting from operations | | | | | | | 10,323,220 | | | | | | | | 7,352,324 | |
| | | | |
| | | | |
Distributions to shareholders from net investment income and net realized gains | | | | | | | | | | | | | | | | |
Institutional Class | | | | | | | (10,880,158 | ) | | | | | | | (8,591,551 | ) |
| | | | |
| | | | |
Capital share transactions | | | Shares | | | | | | | | Shares | | | | | |
Proceeds from shares sold | |
Institutional Class | | | 62,007,026 | | | | 619,230,806 | | | | 50,241,480 | | | | 502,485,302 | |
Reinvestment of distributions | |
Institutional Class | | | 821,227 | | | | 8,198,093 | | | | 739,437 | | | | 7,389,754 | |
Payment for shares redeemed | |
Institutional Class | | | (69,621,267 | ) | | | (694,323,386 | ) | | | (52,808,731 | ) | | | (527,872,511 | ) |
| | | | |
Net decrease in net assets resulting from capital share transactions | | | | | | | (66,894,487 | ) | | | | | | | (17,997,455 | ) |
| | | | |
Total decrease in net assets | | | | | | | (67,451,425 | ) | | | | | | | (19,236,682 | ) |
| | | | |
| | |
Net assets | | | | | | | | |
Beginning of period | | | | | | | 400,002,358 | | | | | | | | 419,239,040 | |
| | | | |
End of period | | | | | | $ | 332,550,933 | | | | | | | $ | 400,002,358 | |
| | | | |
| 1 | Effective for all filings after November 4, 2018, the SEC prospectively eliminated the requirement to parenthetically disclose undistributed net investment income at the end of the period and permitted the aggregation of distributions, with the exception of tax basis returns of capital. Undistributed net investment income at August 31, 2018 was $4,184. The disaggregated distributions information for the year ended August 31, 2018 is included in Note 7,Distributions to Shareholders,in the notes to the financial statements. |
The accompanying notes are an integral part of these financial statements.
18 | Wells Fargo Conservative Income Fund
Financial highlights
(For a share outstanding throughout each period)
| | | | | | | | | | | | | | | | | | | | |
| | | Year ended August 31 | |
| INSTITUTIONAL CLASS | | 2019 | | | 2018 | | | 2017 | | | 2016 | | | 2015 | |
Net asset value, beginning of period | | | $9.99 | | | | $10.01 | | | | $10.01 | | | | $10.00 | | | | $10.02 | |
Net investment income | | | 0.26 | | | | 0.18 | | | | 0.12 | | | | 0.07 | | | | 0.05 | |
Net realized and unrealized gains (losses) on investments | | | 0.01 | | | | (0.02 | ) | | | 0.00 | 1 | | | 0.01 | | | | (0.02 | ) |
| | | | | | | | | | | | | | | | | | | | |
Total from investment operations | | | 0.27 | | | | 0.16 | | | | 0.12 | | | | 0.08 | | | | 0.03 | |
Distributions to shareholders from | | | | | | | | | | | | | | | | | | | | |
Net investment income | | | (0.26 | ) | | | (0.18 | ) | | | (0.12 | ) | | | (0.07 | ) | | | (0.05 | ) |
Net realized gains | | | 0.00 | | | | (0.00 | )1 | | | 0.00 | | | | 0.00 | | | | (0.00 | )1 |
| | | | | | | | | | | | | | | | | | | | |
Total distributions to shareholders | | | (0.26 | ) | | | (0.18 | ) | | | (0.12 | ) | | | (0.07 | ) | | | (0.05 | ) |
Net asset value, end of period | | | $10.00 | | | | $9.99 | | | | $10.01 | | | | $10.01 | | | | $10.00 | |
Total return | | | 2.71 | % | | | 1.65 | % | | | 1.20 | % | | | 0.79 | % | | | 0.28 | % |
Ratios to average net assets (annualized) | | | | | | | | | | | | | | | | | | | | |
Gross expenses | | | 0.37 | % | | | 0.37 | % | | | 0.36 | % | | | 0.36 | % | | | 0.38 | % |
Net expenses | | | 0.27 | % | | | 0.27 | % | | | 0.27 | % | | | 0.27 | % | | | 0.27 | % |
Net investment income | | | 2.54 | % | | | 1.79 | % | | | 1.17 | % | | | 0.72 | % | | | 0.48 | % |
Supplemental data | | | | | | | | | | | | | | | | | | | | |
Portfolio turnover rate | | | 171 | % | | | 197 | % | | | 197 | % | | | 269 | % | | | 80 | % |
Net assets, end of period (000s omitted) | | | $332,551 | | | | $400,002 | | | | $419,239 | | | | $547,829 | | | | $336,608 | |
| 1 | Amount is less than $0.005. |
The accompanying notes are an integral part of these financial statements.
Wells Fargo Conservative Income Fund | 19
Notes to financial statements
1. ORGANIZATION
Wells Fargo Funds Trust (the “Trust”), a Delaware statutory trust organized on March 10, 1999, is anopen-end management investment company registered under the Investment Company Act of 1940, as amended (the “1940 Act”). As an investment company, the Trust follows the accounting and reporting guidance in Financial Accounting Standards Board (“FASB”)Accounting Standards Codification Topic 946, Financial Services – Investment Companies. These financial statements report on the Wells Fargo Conservative Income Fund (the “Fund”) which is a diversified series of the Trust.
2. SIGNIFICANT ACCOUNTING POLICIES
The following significant accounting policies, which are consistently followed in the preparation of the financial statements of the Fund, are in conformity with U.S. generally accepted accounting principles which require management to make estimates and assumptions that affect the reported amounts of assets and liabilities, disclosure of contingent assets and liabilities at the date of the financial statements, and the reported amounts of revenues and expenses during the reporting period. Actual results could differ from those estimates.
Securities valuation
All investments are valued each business day as of the close of regular trading on the New York Stock Exchange (generally 4 p.m. Eastern Time), although the Fund may deviate from this calculation time under unusual or unexpected circumstances.
Debt securities are valued at the evaluated bid price provided by an independent pricing service (e.g. taking into account various factors, including yields, maturities, or credit ratings) or, if a reliable price is not available, the quoted bid price from an independent broker-dealer.
Investments in registeredopen-end investment companies are valued at net asset value.
Investments which are not valued using any of the methods discussed above are valued at their fair value, as determined in good faith by the Board of Trustees of the Fund. The Board of Trustees has established a Valuation Committee comprised of the Trustees and has delegated to it the authority to take any actions regarding the valuation of portfolio securities that the Valuation Committee deems necessary or appropriate, including determining the fair value of portfolio securities, unless the determination has been delegated to the Wells Fargo Asset Management Pricing Committee at Wells Fargo Funds Management, LLC (“Funds Management”). The Board of Trustees retains the authority to make or ratify any valuation decisions or approve any changes to the Valuation Procedures as it deems appropriate. On a quarterly basis, the Board of Trustees receives reports on any valuation actions taken by the Valuation Committee or the Wells Fargo Asset Management Pricing Committee which may include items for ratification.
Security transactions and income recognition
Securities transactions are recorded on a trade date basis. Realized gains or losses are recorded on the basis of identified cost.
Interest income is accrued daily and bond discounts are accreted and premiums are amortized daily. To the extent debt obligations are placed onnon-accrual status, any related interest income may be reduced by writing off interest receivables when the collection of all or a portion of interest has been determined to be doubtful based on consistently applied procedures and the fair value has decreased. If the issuer subsequently resumes interest payments or when the collectability of interest is reasonably assured, the debt obligation is removed fromnon-accrual status.
Distributions to shareholders
Distributions to shareholders from net investment income are declared daily and paid monthly. Distributions from net realized gains, if any, are recorded on theex-dividend date and paid at least annually. Such distributions are determined in accordance with income tax regulations and may differ from U.S. generally accepted accounting principles. Dividend sources are estimated at the time of declaration. The tax character of distributions is determined as of the Fund’s fiscal year end. Therefore, a portion of the Fund’s distributions made prior to the Fund’s fiscal year end may be categorized as a tax return of capital at year end.
Federal and other taxes
The Fund intends to continue to qualify as a regulated investment company by distributing substantially all of its investment company taxable income and any net realized capital gains (after reduction for capital loss carryforwards) sufficient to relieve it from all, or substantially all, federal income taxes. Accordingly, no provision for federal income taxes was required.
The Fund’s income and federal excise tax returns and all financial records supporting those returns for the prior three fiscal years are subject to examination by the federal and Delaware revenue authorities. Management has analyzed the Fund’s tax positions taken on federal, state, and foreign tax returns for all open tax years and does not believe that there are any uncertain tax positions that require recognition of a tax liability.
20 | Wells Fargo Conservative Income Fund
Notes to financial statements
As of August 31, 2019, the aggregate cost of all investments for federal income tax purposes was $330,846,440 and the unrealized gains (losses) consisted of:
| | | | |
| |
Gross unrealized gains | | $ | 841,472 | |
| |
Gross unrealized losses | | | (30,751 | ) |
| |
Net unrealized gains | | $ | 810,721 | |
As of August 31, 2019, the Fund had a capital loss carryforward which consists of $1,770,871 in short-term capital losses.
3. FAIR VALUATION MEASUREMENTS
Fair value measurements of investments are determined within a framework that has established a fair value hierarchy based upon the various data inputs utilized in determining the value of the Fund’s investments. The three-level hierarchy gives the highest priority to unadjusted quoted prices in active markets for identical assets or liabilities (Level 1) and the lowest priority to unobservable inputs (Level 3). The Fund’s investments are classified within the fair value hierarchy based on the lowest level of input that is significant to the fair value measurement. The inputs are summarized into three broad levels as follows:
| ∎ | | Level 1 – quoted prices in active markets for identical securities |
| ∎ | | Level 2 – other significant observable inputs (including quoted prices for similar securities, interest rates, prepayment speeds, credit risk, etc.) |
| ∎ | | Level 3 – significant unobservable inputs (including the Fund’s own assumptions in determining the fair value of investments) |
The inputs or methodologies used for valuing investments in securities are not necessarily an indication of the risk associated with investing in those securities.
The following is a summary of the inputs used in valuing the Fund’s assets and liabilities as of August 31, 2019:
| | | | | | | | | | | | | | | | |
| | | | |
| | | Quoted prices
(Level 1) | | | Other significant
observable inputs
(Level 2) | | | Significant
unobservable inputs (Level 3) | | | Total | |
|
| | | | |
Assets | | | | | | | | | | | | | | | | |
Investments in: |
| | | | |
Agency securities | | $ | 0 | | | $ | 16,954,187 | | | $ | 0 | | | $ | 16,954,187 | |
| | | | |
Asset-backed securities | | | 0 | | | | 81,966,624 | | | | 0 | | | | 81,966,624 | |
| | | | |
Corporate bonds and notes | | | 0 | | | | 111,479,921 | | | | 0 | | | | 111,479,921 | |
| | | | |
Municipal obligations | | | 0 | | | | 5,108,855 | | | | 0 | | | | 5,108,855 | |
| | | | |
Yankee corporate bonds and notes | | | 0 | | | | 62,690,139 | | | | 0 | | | | 62,690,139 | |
| | | | |
Short-term investments | | | | | | | | | | | | | | | | |
| | | | |
Certificates of deposit | | | 0 | | | | 12,903,425 | | | | 0 | | | | 12,903,425 | |
| | | | |
Commercial paper | | | 0 | | | | 40,333,097 | | | | 0 | | | | 40,333,097 | |
| | | | |
Investment companies | | | 220,913 | | | | 0 | | | | 0 | | | | 220,913 | |
| | | | |
Total assets | | $ | 220,913 | | | $ | 331,436,248 | | | $ | 0 | | | $ | 331,657,161 | |
Additional sector, industry or geographic detail is included in the Portfolio of Investments.
For the year ended August 31, 2019, the Fund did not have any transfers into/out of Level 3.
4. TRANSACTIONS WITH AFFILIATES
Management fee
Funds Management, an indirect wholly owned subsidiary of Wells Fargo & Company (“Wells Fargo”), is the manager of the Fund and provides advisory and fund-level administrative services under an investment management agreement. Under the investment management agreement, Funds Management is responsible for, among other services, implementing the investment objectives and strategies of the Fund, supervising the subadviser and providing fund-level administrative services in connection with the Fund’s
Wells Fargo Conservative Income Fund | 21
Notes to financial statements
operations. As compensation for its services under the investment management agreement, Funds Management is entitled to receive a management fee at the following annual rate based on the Fund’s average daily net assets:
| | | | |
| |
| Average daily net assets | | Management fee | |
| |
First $1 billion | | | 0.250 | % |
| |
Next $4 billion | | | 0.225 | |
| |
Next $5 billion | | | 0.190 | |
| |
Over $10 billion | | | 0.180 | |
For the year ended August 31, 2019, the management fee was equivalent to an annual rate of 0.25% of the Fund’s average daily net assets.
Funds Management has retained the services of a subadviser to provide daily portfolio management to the Fund. The fee for subadvisory services is borne by Funds Management. Wells Capital Management Incorporated, an affiliate of Funds Management and an indirect wholly owned subsidiary of Wells Fargo, is the subadviser to the Fund and is entitled to receive a fee from Funds Management at an annual rate starting at 0.10% and declining to 0.05% as the average daily net assets of the Fund increase.
Administration fee
Under a class-level administration agreement, Funds Management provides class-level administrative services to the Fund, which includes paying fees and expenses for services provided by the transfer agent,sub-transfer agents, omnibus account servicers and record-keepers. As compensation for its services under the class-level administration agreement, Funds Management receives an annual fee of 0.08% which is calculated based on the average daily net assets of the Institutional Class.
Waivers and/or expense reimbursements
Funds Management has contractually waived and/or reimbursed management and administration fees to the extent necessary to maintain certain net operating expense ratios for the Fund. When the Institutional Class of the Fund has exceeded its expense cap, Funds Management has waived fees and/or reimbursed expenses from fund-level expenses on a proportionate basis and then from class specific expenses. Funds Management has committed through December 31, 2019 to waive fees and/or reimburse expenses to the extent necessary to cap the Fund’s expenses at 0.27% for Institutional Class shares. Prior to or after the commitment expiration date, the cap may be increased or the commitment to maintain the cap may be terminated only with the approval of the Board of Trustees.
Interfund transactions
The Fund may purchase or sell portfolio investment securities to certain other Wells Fargo affiliates pursuant to Rule17a-7 under the 1940 Act and under procedures adopted by the Board of Trustees. The procedures have been designed to ensure that these interfund transactions, which do not incur broker commissions, are effected at current market prices. Pursuant to these procedures, the Fund had $0 and $12,740,858 in interfund purchases and sales, respectively, during the year ended August 31, 2019.
5. INVESTMENT PORTFOLIO TRANSACTIONS
Purchases and sales of investments, excluding U.S. government obligations (if any) and short-term securities, for the year ended August 31, 2019 were $571,176,399 and $524,933,106, respectively.
6. BANK BORROWINGS
The Trust (excluding the money market funds), Wells Fargo Master Trust and Wells Fargo Variable Trust are parties to a $280,000,000 revolving credit agreement whereby the Fund is permitted to use bank borrowings for temporary or emergency purposes, such as to fund shareholder redemption requests. Interest under the credit agreement is charged to the Fund based on a borrowing rate equal to the higher of the Federal Funds rate in effect on that day plus 1.25% or the overnight LIBOR rate in effect on that day plus 1.25%. In addition, an annual commitment fee equal to 0.25% of the unused balance is allocated to each participating fund.
For the year ended August 31, 2019, there were no borrowings by the Fund under the agreement.
22 | Wells Fargo Conservative Income Fund
Notes to financial statements
7. DISTRIBUTIONS TO SHAREHOLDERS
The tax character of distributions paid during the years ended August 31, 2019 and August 31, 2018 were as follows:
| | | | | | | | |
| | | Year ended August 31 | |
| | |
| | | 2019 | | | 2018 | |
| | |
Ordinary income | | $ | 10,880,158 | | | $ | 8,572,794 | |
| | |
Long-term capital gain | | | 0 | | | | 18,757 | |
As of August 31, 2019, the components of distributable earnings on a tax basis were as follows:
| | | | |
Undistributed ordinary income | | Unrealized gains | | Capital loss carryforward |
| | |
| $85,700 | | $810,721 | | $(1,770,871) |
Effective for all filings after November 4, 2018, the Securities and Exchange Commission eliminated the requirement to separately state the components of distributions to shareholders under U.S. generally accepted accounting principles. The amounts of distributions to shareholders for the year ended August 31, 2018 were as follows:
| | | | | | | | |
| | |
| | | Net investment
income | | | Net realized
gains | |
| | |
Institutional Class | | $ | 8,443,388 | | | $ | 148,163 | |
8. INDEMNIFICATION
Under the Trust’s organizational documents, the officers and Trustees have been granted certain indemnification rights against certain liabilities that may arise out of performance of their duties to the Trust. Additionally, in the normal course of business, the Trust may enter into contracts with service providers that contain a variety of indemnification clauses. The Trust’s maximum exposure under these arrangements is dependent on future claims that may be made against the Fund and, therefore, cannot be estimated.
9. NEW ACCOUNTING PRONOUNCEMENTS
In August 2018, FASB issued Accounting Standards Update (“ASU”)No. 2018-13, Fair Value Measurement (Topic 820)Disclosure Framework—Changes to the Disclosure Requirements for Fair Value Measurement. ASU2018-13 updates the disclosure requirements for fair value measurements by modifying or removing certain disclosures and adding certain new disclosures. The amendments are effective for fiscal years, and interim periods within those fiscal years, beginning after December 15, 2019. Early adoption is permitted. Management has adopted the removal and modification of disclosures early, as permitted, and will adopt the additional new disclosures at the effective date.
In March 2017, FASB issued ASUNo. 2017-08,Premium Amortization on Purchased Callable Debt Securities. ASU2017-08 shortens the amortization period for certain callable debt securities held at a premium and requires the premium to be amortized to the earliest call date. The amendments do not require an accounting change for securities held at a discount and discounts will continue to be accreted to the maturity date of the security. ASU2017-08 is effective for fiscal years beginning after December 15, 2018 and for interim periods within those fiscal years. During the current reporting period, management of the Fund adopted the change in accounting policy which did not have a material impact to the Fund’s financial statements.
Wells Fargo Conservative Income Fund | 23
Report of independent registered public accounting firm
TO THE SHAREHOLDERS OF THE FUND AND BOARD OF TRUSTEES OF WELLS FARGO FUNDS TRUST:
Opinion on the Financial Statements
We have audited the accompanying statement of assets and liabilities of Wells Fargo Conservative Income Fund (the Fund), one of the funds constituting Wells Fargo Funds Trust, including the portfolio of investments, as of August 31, 2019, the related statement of operations for the year then ended, the statements of changes in net assets for each of the years in the two-year period then ended, and the related notes (collectively, the financial statements) and the financial highlights for each of the years in the five-year period then ended. In our opinion, the financial statements and financial highlights present fairly, in all material respects, the financial position of the Fund as of August 31, 2019, the results of its operations for the year then ended, the changes in its net assets for each of the years in the two-year period then ended, and the financial highlights for each of the years in the five-year period then ended, in conformity with U.S. generally accepted accounting principles.
Basis for Opinion
These financial statements and financial highlights are the responsibility of the Fund’s management. Our responsibility is to express an opinion on these financial statements and financial highlights based on our audits. We are a public accounting firm registered with the Public Company Accounting Oversight Board (United States) (PCAOB) and are required to be independent with respect to the Fund in accordance with the U.S. federal securities laws and the applicable rules and regulations of the Securities and Exchange Commission and the PCAOB.
We conducted our audits in accordance with the standards of the PCAOB. Those standards require that we plan and perform the audit to obtain reasonable assurance about whether the financial statements and financial highlights are free of material misstatement, whether due to error or fraud. Our audits included performing procedures to assess the risks of material misstatement of the financial statements and financial highlights, whether due to error or fraud, and performing procedures that respond to those risks. Such procedures included examining, on a test basis, evidence regarding the amounts and disclosures in the financial statements and financial highlights. Such procedures also included confirmation of securities owned as of August 31, 2019, by correspondence with the custodian and transfer agent. Our audits also included evaluating the accounting principles used and significant estimates made by management, as well as evaluating the overall presentation of the financial statements and financial highlights. We believe that our audits provide a reasonable basis for our opinion.

We have not been able to determine the specific year that we began serving as the auditor of one or more Wells Fargo Funds investment companies; however we are aware that we have served as the auditor of one or more Wells Fargo Funds investment companies since at least 1955.
Boston, Massachusetts
October 28, 2019
24 | Wells Fargo Conservative Income Fund
Other information (unaudited)
TAX INFORMATION
For the fiscal year ended August 31, 2019, $7,468,128 has been designated as interest-related dividends for nonresident alien shareholders pursuant to Section 871 of the Internal Revenue Code.
PROXY VOTING INFORMATION
A description of the policies and procedures used to determine how to vote proxies relating to portfolio securities is available, upon request, by calling1-800-222-8222, visiting our website atwfam.com, or visiting the SEC website at sec.gov. Information regarding how the proxies related to portfolio securities were voted during the most recent12-month period ended June 30 is available on the website atwfam.comor by visiting the SEC website at sec.gov.
QUARTERLY PORTFOLIO HOLDINGS INFORMATION
The Fund files its complete schedule of portfolio holdings with the SEC for the first and third quarters of each fiscal year on Form N-Q or FormN-PORT, which is available by visiting the SEC website at sec.gov. Those forms may be reviewed and copied at the SEC’s Public Reference Room in Washington, DC. Information on the operation of the Public Reference Room may be obtained by calling1-800-SEC-0330.
Wells Fargo Conservative Income Fund | 25
Other information (unaudited)
BOARD OF TRUSTEES AND OFFICERS
Each of the Trustees and Officers1 listed in the table below acts in identical capacities for each fund in the Wells Fargo family of funds, which consists of 152 mutual funds comprising the Wells Fargo Funds Trust, Wells Fargo Variable Trust, Wells Fargo Master Trust and fourclosed-end funds (collectively the “Fund Complex”). This table should be read in conjunction with the Prospectus and the Statement of Additional Information2. The mailing address of each Trustee and Officer is 525 Market Street, 12th Floor, San Francisco, CA 94105. Each Trustee and Officer serves an indefinite term, however, each Trustee serves such term until reaching the mandatory retirement age established by the Trustees.
Independent Trustees
| | | | | | |
Name and
year of birth | | Position held and
length of service* | | Principal occupations during past five years or longer | | Current other
public company or
investment
company
directorships |
| | | |
William R. Ebsworth
(Born 1957) | | Trustee,
since 2015 | | Retired. From 1984 to 2013, equities analyst, portfolio manager, research director and chief investment officer at Fidelity Management and Research Company in Boston, Tokyo, and Hong Kong, and retired in 2013 as Chief Investment Officer of Fidelity Strategic Advisers, Inc. where he led a team of investment professionals managing client assets. Prior thereto, Board member of Hong Kong Securities Clearing Co., Hong Kong Options Clearing Corp., the Thailand International Fund, Ltd., Fidelity Investments Life Insurance Company, and Empire Fidelity Investments Life Insurance Company. Audit Committee Chair and Investment Committee Chair of the Vincent Memorial Hospital Endowment(non-profit organization). Mr. Ebsworth is a CFA® charterholder. | | N/A |
| | | |
Jane A. Freeman (Born 1953) | | Trustee, since 2015; Chair Liaison, since 2018 | | Retired. From 2012 to 2014 and 1999 to 2008, Chief Financial Officer of Scientific Learning Corporation. From 2008 to 2012, Ms. Freeman provided consulting services related to strategic business projects. Prior to 1999, Portfolio Manager at Rockefeller & Co. and Scudder, Stevens & Clark. Board member of the Harding Loevner Funds from 1996 to 2014, serving as both Lead Independent Director and chair of the Audit Committee. Board member of the Russell Exchange Traded Funds Trust from 2011 to 2012 and the chair of the Audit Committee. Ms. Freeman is a Board Member of The Ruth Bancroft Garden(non-profit organization). She is also an inactive Chartered Financial Analyst. | | N/A |
| | | |
Isaiah Harris, Jr. (Born 1952) | | Trustee, since 2009; Audit Committee Chairman, since 2019 | | Retired. Chairman of the Board of CIGNA Corporation since 2009, and Director since 2005. From 2003 to 2011, Director of Deluxe Corporation. Prior thereto, President and CEO of BellSouth Advertising and Publishing Corp. from 2005 to 2007, President and CEO of BellSouth Enterprises from 2004 to 2005 and President of BellSouth Consumer Services from 2000 to 2003. Emeritus member of the Iowa State University Foundation Board of Governors. Emeritus Member of the Advisory Board of Iowa State University School of Business. Advisory Board Member, Palm Harbor Academy (private school). Advisory Board Member, Child Evangelism Fellowship(non-profit). Mr. Harris is a certified public accountant (inactive status). | | CIGNA Corporation |
| | | |
Judith M. Johnson (Born 1949) | | Trustee, since 2008; Audit Committee Chairman, from 2009 to 2018 | | Retired. Prior thereto, Chief Executive Officer and Chief Investment Officer of Minneapolis Employees Retirement Fund from 1996 to 2008. Ms. Johnson is an attorney, certified public accountant and a certified managerial accountant. | | N/A |
26 | Wells Fargo Conservative Income Fund
Other information (unaudited)
| | | | | | |
Name and
year of birth | | Position held and
length of service* | | Principal occupations during past five years or longer | | Current other
public company or
investment
company
directorships |
| | | |
David F. Larcker (Born 1950) | | Trustee, since 2009 | | James Irvin Miller Professor of Accounting at the Graduate School of Business, Stanford University, Director of the Corporate Governance Research Initiative and Senior Faculty of The Rock Center for Corporate Governance since 2006. From 2005 to 2008, Professor of Accounting at the Graduate School of Business, Stanford University. Prior thereto, Ernst & Young Professor of Accounting at The Wharton School, University of Pennsylvania from 1985 to 2005. | | N/A |
| | | |
Olivia S. Mitchell (Born 1953) | | Trustee, since 2006; Nominating and Governance Committee Chairman, since 2018 | | International Foundation of Employee Benefit Plans Professor, Wharton School of the University of Pennsylvania since 1993. Director of Wharton’s Pension Research Council and Boettner Center on Pensions & Retirement Research, and Research Associate at the National Bureau of Economic Research. Previously, Cornell University Professor from 1978 to 1993. | | N/A |
| | | |
Timothy J. Penny (Born 1951) | | Trustee, since 1996; Chairman, since 2018 | | President and Chief Executive Officer of Southern Minnesota Initiative Foundation, anon-profit organization, since 2007. Member of the Board of Trustees of NorthStar Education Finance, Inc., anon-profit organization, since 2007. | | N/A |
| | | |
James G. Polisson (Born 1959) | | Trustee, since 2018 | | Retired. Chief Marketing Officer, Source (ETF) UK Services, Ltd, from 2015 to 2017. From 2012 to 2015, Principal of The Polisson Group, LLC, a management consulting, corporate advisory and principal investing company. Chief Executive Officer and Managing Director at Russell Investments, Global Exchange Traded Funds from 2010 to 2012. Managing Director of Barclays Global Investors from 1998 to 2010 and Global Chief Marketing Officer for iShares and Barclays Global Investors from 2000 to 2010. Trustee of the San Francisco Mechanics’ Institute, anon-profit organization, from 2013 to 2015. Board member of the Russell Exchange Traded Fund Trust from 2011 to 2012. Director of Barclays Global Investors Holdings Deutschland GmbH from 2006 to 2009. Mr. Polisson is an attorney and has a retired status with the Massachusetts and District of Columbia Bar Associations. | | N/A |
| * | Length of service dates reflect the Trustee’s commencement of service with the Trust’s predecessor entities, where applicable. |
Wells Fargo Conservative Income Fund | 27
Other information (unaudited)
Officers
| | | | |
Name and
year of birth | | Position held and
length of service | | Principal occupations during past five years or longer |
| | |
Andrew Owen (Born 1960) | | President, since 2017 | | Executive Vice President of Wells Fargo & Company and Head of Affiliated Managers, Wells Fargo Asset Management, since 2014. In addition, Mr. Owen is currently President, Chief Executive Officer and Director of Wells Fargo Funds Management, LLC since 2017. Prior thereto, Executive Vice President responsible for marketing, investments and product development for Wells Fargo Funds Management, LLC, from 2009 to 2014. |
| | |
Nancy Wiser1 (Born 1967) | | Treasurer, since 2012 | | Executive Vice President of Wells Fargo Funds Management, LLC since 2011. Chief Operating Officer and Chief Compliance Officer at LightBox Capital Management LLC, from 2008 to 2011. |
| | |
Michelle Rhee3 (Born 1966) | | Chief Legal Officer, since 2019 | | Secretary of Wells Fargo Funds Management, LLC, Chief Legal Counsel of Wells Fargo Asset Management and Assistant General Counsel of Wells Fargo Bank, N.A. since 2018. Associate General Counsel and Managing Director of Bank of America Corporation from 2004 to 2018. |
| | |
Catherine Kennedy4 (Born 1969) | | Secretary, since 2019 | | Vice President of Wells Fargo Funds Management, LLC and Senior Counsel of the Wells Fargo Legal Department since 2010. Vice President and Senior Counsel of Evergreen Investment Management Company, LLC from 1998 to 2010. |
| | |
Michael H. Whitaker (Born 1967) | | Chief Compliance Officer, since 2016 | | Chief Compliance Officer of Wells Fargo Asset Management since 2016. Senior Vice President and Chief Compliance Officer for Fidelity Investments from 2007 to 2016. |
| | |
David Berardi (Born 1975) | | Assistant Treasurer, since 2009 | | Vice President of Wells Fargo Funds Management, LLC since 2009. Vice President of Evergreen Investment Management Company, LLC from 2008 to 2010. Manager of Fund Reporting and Control for Evergreen Investment Management Company, LLC from 2004 to 2010. |
| | |
Jeremy DePalma1 (Born 1974) | | Assistant Treasurer, since 2009 | | Senior Vice President of Wells Fargo Funds Management, LLC since 2009. Senior Vice President of Evergreen Investment Management Company, LLC from 2008 to 2010 and head of the Fund Reporting and Control Team within Fund Administration from 2005 to 2010. |
| 1 | Nancy Wiser acts as Treasurer of 65 funds in the Fund Complex. Jeremy DePalma acts as Treasurer of 87 funds and Assistant Treasurer of 65 funds in the Fund Complex. |
| 2 | The Statement of Additional Information includes additional information about the Trustees and is available, without charge, upon request, by calling1-800-222-8222 or by visiting the website atwfam.com. |
| 3 | Michelle Rhee became Chief Legal Officer effective October 22, 2019. |
| 4 | Catherine Kennedy became Secretary effective October 22, 2019. |
28 | Wells Fargo Conservative Income Fund
Other information (unaudited)
BOARD CONSIDERATION OF INVESTMENT MANAGEMENT ANDSUB-ADVISORY AGREEMENTS:
Wells Fargo Conservative Income Fund
Under the Investment Company Act of 1940 (the “1940 Act”), the Board of Trustees (the “Board”) of Wells Fargo Funds Trust (the “Trust”) must determine annually whether to approve the continuation of the Trust’s investment management andsub-advisory agreements. In this regard, at anin-person meeting held on May21-22, 2019 (the “Meeting”), the Board, all the members of which have no direct or indirect interest in the investment management andsub-advisory agreements and are not “interested persons” of the Trust, as defined in the 1940 Act (the “Independent Trustees”), reviewed and approved for Wells Fargo Conservative Income Fund(the “Fund”): (i) an investment management agreement (the “Management Agreement”) with Wells Fargo Funds Management, LLC (“Funds Management”); and (ii) an investmentsub-advisory agreement (the“Sub-Advisory Agreement”) with Wells Capital Management Incorporated (the“Sub-Adviser”), an affiliate of Funds Management. The Management Agreement and theSub-Advisory Agreement are collectively referred to as the “Advisory Agreements.”
At the Meeting, the Board considered the factors and reached the conclusions described below relating to the selection of Funds Management and theSub-Adviser and the approval of the Advisory Agreements. Prior to the Meeting, including at anin-person meeting in April 2019, the Trustees conferred extensively among themselves and with representatives of Funds Management about these matters. Also, the Board has adopted a team-based approach, with each team consisting of asub-set of Trustees, to assist the full Board in the discharge of its duties in reviewing investment performance and other matters throughout the year. The Independent Trustees were assisted in their evaluation of the Advisory Agreements by independent legal counsel, from whom they received separate legal advice and with whom they met separately.
In providing information to the Board, Funds Management and theSub-Adviser were guided by a detailed set of requests for information submitted to them by independent legal counsel on behalf of the Independent Trustees at the start of the Board’s annual contract renewal process earlier in 2019. In considering and approving the Advisory Agreements, the Trustees considered the information they believed relevant, including but not limited to the information discussed below. The Board considered not only the specific information presented in connection with the Meeting, but also the knowledge gained over time through interaction with Funds Management and theSub-Adviser about various topics. In this regard, the Board reviewed reports of Funds Management at each of its quarterly meetings, which included, among other things, portfolio reviews and investment performance reports. In addition, the Board and the teams mentioned above confer with portfolio managers at various times throughout the year. The Board did not identify any particular information or consideration that wasall-important or controlling, and each individual Trustee may have attributed different weights to various factors.
After its deliberations, the Board unanimously approved the continuation of the Advisory Agreements for aone-year term and determined that the compensation payable to Funds Management and theSub-Adviser under each of the Advisory Agreements was reasonable. The Board considered the approval of the Advisory Agreements for the Fund as part of its consideration of agreements for funds across the complex, but its approvals were made on afund-by-fund basis. The following summarizes a number of important, but not necessarily all, factors considered by the Board in support of its approvals.
Nature, extent and quality of services
The Board received and considered various information regarding the nature, extent and quality of services provided to the Fund by Funds Management and theSub-Adviser under the Advisory Agreements. This information included a description of the investment advisory services and Fund-level administrative services covered by the Management Agreement, as well as, among other things, a summary of the background and experience of senior management of Wells Fargo Asset Management (“WFAM”), of which Funds Management and theSub-Adviser are a part, a summary of investments made in the business of WFAM, a summary of certain organizational and personnel changes involving Funds Management and theSub-Adviser, and a description of Funds Management’s and theSub-Adviser’s business continuity planning programs and of their approaches to data privacy and cybersecurity. The Board received and reviewed information about Funds Management’s role as administrator of the Fund’s liquidity risk management program. The Board also considered the qualifications, background, tenure and responsibilities of each of the portfolio managers primarily responsible for theday-to-day portfolio management of the Fund.
The Board evaluated the ability of Funds Management and theSub-Adviser to attract and retain qualified investment professionals, including research, advisory and supervisory personnel. The Board further considered the compliance programs and compliance records of Funds Management and theSub-Adviser. In addition, the Board took into account the full range of services provided to the Fund by Funds Management and its affiliates.
Fund investment performance and expenses
The Board considered the investment performance results for the Fund over various time periods ended December 31, 2018. The Board considered these results in comparison to the investment performance of funds in a universe that was determined by
Wells Fargo Conservative Income Fund | 29
Other information (unaudited)
Broadridge Inc. (“Broadridge”) to be similar to the Fund (the “Universe”), and in comparison to the Fund’s benchmark index and to other comparative data. Broadridge is an independent provider of investment company data. The Board received a description of the methodology used by Broadridge to select the mutual funds in the performance Universe. The Board noted that the investment performance of the Fund (Institutional Class) was higher than the average investment performance of the Universe for all periods under review. The Board also noted that the investment performance of the Fund was in range of or higher than its benchmark index, the Bloomberg Barclays6-9 Month Treasury Bill Index, for all periods under review.
The Board also received and considered information regarding the Fund’s net operating expense ratios and their various components, including actual management fees, custodian and othernon-management fees, and Rule12b-1 andnon-Rule12b-1 shareholder service fees. The Board considered these ratios in comparison to the median ratios of funds in class-specific expense groups that were determined by Broadridge to be similar to the Fund (the “Groups”). The Board received a description of the methodology used by Broadridge to select the mutual funds in the expense Groups and an explanation of how funds comprising expense groups and their expense ratios may vary fromyear-to-year. Based on the Broadridge reports, the Board noted that the net operating expense ratio of the Fund’s Institutional Class was lower than the median net operating expense ratio of its expense Group.
The Board took into account the Fund’s investment performance and expense information provided to it among the factors considered in deciding tore-approve the Advisory Agreements.
Investment management andsub-advisory fee rates
The Board reviewed and considered the contractual fee rates payable by the Fund to Funds Management under the Management Agreement, as well as the contractual fee rates payable by the Fund to Funds Management for class-level administrative services under a Class-Level Administration Agreement, which include, among other things, class-level transfer agency andsub-transfer agency costs (collectively, the “Management Rates”). The Board also reviewed and considered the contractual investmentsub-advisory fee rates that are payable by Funds Management to theSub-Adviser for investmentsub-advisory services.
Among other information reviewed by the Board was a comparison of the Fund’s Management Rates with the average contractual investment management fee rates of funds in the expense Groups at a common asset level as well as transfer agency costs of the funds in the expense Groups. The Board noted that the Management Rate of the Fund’s Institutional Class was equal to the sum of the average rates for its expense Group.
The Board also received and considered information about the portion of the total management fee that was retained by Funds Management after payment of the fee to theSub-Adviser forsub-advisory services. In assessing the reasonableness of this amount, the Board received and evaluated information about the nature and extent of responsibilities retained and risks assumed by Funds Management and not delegated to or assumed by theSub-Adviser, and about Funds Management’son-going oversight services. Given the affiliation between Funds Management and theSub-Adviser, the Board ascribed limited relevance to the allocation of fees between them.
The Board also received and considered information about the nature and extent of services offered and fee rates charged by Funds Management and theSub-Adviser to other types of clients with investment strategies similar to those of the Fund. In this regard, the Board received information about the significantly greater scope of services, and compliance, reporting and other legal burdens and risks of managing proprietary mutual funds compared with those associated with managing assets of other types of clients, including third-partysub-advised fund clients andnon-mutual fund clients such as institutional separate accounts.
Based on its consideration of the factors and information it deemed relevant, including those described here, the Board determined that the compensation payable to Funds Management under the Management Agreement and to theSub-Adviser under theSub-Advisory Agreement was reasonable.
Profitability
The Board received and considered information concerning the profitability of Funds Management, as well as the profitability of both WFAM and Wells Fargo & Co. (“Wells Fargo”) from providing services to the fund family as a whole. The Board noted that theSub-Adviser’s profitability information with respect to providing services to the Fund and other funds in the family was subsumed in the WFAM and Wells Fargo profitability analysis.
Funds Management reported on the methodologies and estimates used in calculating profitability, including a description of the methodology used to allocate certain expenses. Among other things, the Board noted that the levels of profitability reported on afund-by-fund basis varied widely, depending on factors such as the size, type and age of fund. Based on its review, the Board did not deem the profits reported by Funds Management, WFAM or Wells Fargo from services provided to the Fund to be at a level that would prevent it from approving the continuation of the Advisory Agreements.
30 | Wells Fargo Conservative Income Fund
Other information (unaudited)
Economies of scale
The Board received and considered information about the potential for Funds Management to experience economies of scale in the provision of management services to the Fund, the difficulties of calculating economies of scale at an individual fund level, and the extent to which potential scale benefits are shared with shareholders. The Board noted the existence of breakpoints in the Fund’s management fee structure, which operate generally to reduce the Fund’s expense ratios as the Fund grows in size. The Board considered that in addition to management fee breakpoints, Funds Management shares potential economies of scale from its management business in a variety of ways, including through fee waiver and expense reimbursement arrangements, services that benefit shareholders, competitive management fee rates set at the outset without regard to breakpoints, and investments in the business intended to enhance services available to shareholders.
The Board concluded that Funds Management’s arrangements with respect to the Fund, including contractual breakpoints, constituted a reasonable approach to sharing potential economies of scale with the Fund and its shareholders.
Other benefits to Funds Management and theSub-Adviser
The Board received and considered information regarding potential“fall-out” or ancillary benefits received by Funds Management and its affiliates, including theSub-Adviser, as a result of their relationships with the Fund. Ancillary benefits could include, among others, benefits directly attributable to other relationships with the Fund and benefits potentially derived from an increase in Funds Management’s and theSub-Adviser’s business as a result of their relationships with the Fund. The Board noted that various affiliates of Funds Management may receive distribution-related fees, shareholder servicing payments andsub-transfer agency fees in respect of shares sold or held through them and services provided.
The Board also reviewed information about soft dollar credits earned and utilized by theSub-Adviser, fees earned by Funds Management and theSub-Adviser from managing a private investment vehicle for the fund family’s securities lending collateral, and commissions earned by an affiliated broker from portfolio transactions.
Based on its consideration of the factors and information it deemed relevant, including those described here, the Board did not find that any ancillary benefits received by Funds Management and its affiliates, including theSub-Adviser, were unreasonable.
Conclusion
At the Meeting, after considering the above-described factors and based on its deliberations and its evaluation of the information described above, the Board unanimously approved the continuation of the Advisory Agreements for aone-year term and determined that the compensation payable to Funds Management and theSub-Adviser under each of the Advisory Agreements was reasonable.
Wells Fargo Conservative Income Fund | 31
This page is intentionally left blank.

For more information
More information about Wells Fargo Funds is available free upon request. To obtain literature, please write, visit the Fund’s website, or call:
Wells Fargo Funds
P.O. Box 219967
Kansas City, MO 64121-9967
Website:wfam.com
Individual investors:1-800-222-8222
Retail investment professionals:1-888-877-9275
Institutional investment professionals:1-866-765-0778

This report and the financial statements contained herein are submitted for the general information of the shareholders of the Fund. If this report is used for promotional purposes, distribution of the report must be accompanied or preceded by a current prospectus. Before investing, please consider the investment objectives, risks, charges, and expenses of the investment. For a current prospectus and, if available, a summary prospectus, containing this information, call1-800-222-8222 or visit the Fund’s website atwfam.com. Read the prospectus carefully before you invest or send money.
Wells Fargo Asset Management (WFAM) is the trade name for certain investment advisory/management firms owned by Wells Fargo & Company. These firms include but are not limited to Wells Capital Management Incorporated and Wells Fargo Funds Management, LLC. Certain products managed by WFAM entities are distributed by Wells Fargo Funds Distributor, LLC (a broker-dealer and Member FINRA).
This material is for general informational and educational purposes only and is NOT intended to provide investment advice or a recommendation of any kind—including a recommendation for any specific investment, strategy, or plan.
INVESTMENT PRODUCTS: NOT FDIC INSURED ◾ NO BANK GUARANTEE ◾ MAY LOSE VALUE
© 2019 Wells Fargo Funds Management, LLC. All rights reserved.
405802 10-19
A265/AR265 08-19
ITEM 2. CODE OF ETHICS
(a) As of the end of the period covered by the report, Wells Fargo Funds Trust has adopted a code of ethics that applies to its President and Treasurer. A copy of the code of ethics is filed as an exhibit to this FormN-CSR.
(c) During the period covered by this report, there were no amendments to the provisions of the code of ethics adopted in Item 2(a) above.
(d) During the period covered by this report, there were no implicit or explicit waivers to the provisions of the code of ethics adopted in Item 2(a) above.
ITEM 3. AUDIT COMMITTEE FINANCIAL EXPERT
The Board of Trustees of Wells Fargo Funds Trust has determined that Judith Johnson is an audit committee financial expert, as defined in Item 3 of FormN-CSR. Mrs. Johnson is independent for purposes of Item 3 of FormN-CSR.
ITEM 4. PRINCIPAL ACCOUNTANT FEES AND SERVICES
(a), (b), (c), (d) The following table presents aggregate fees billed in each of the last two fiscal years for services rendered to the Registrant by the Registrant’s principal accountant. These fees were billed to the registrant and were approved by the Registrant’s audit committee.
| | | | | | | | |
| | | Fiscal
year ended
August 31, 2019 | | | Fiscal
year ended
August 31, 2018 | |
Audit fees | | $ | 426,800 | | | $ | 421,385 | |
| | |
Audit-related fees | | | — | | | | — | |
| | |
Tax fees (1) | | | 39,575 | | | | 39,335 | |
All other fees | | | — | | | | — | |
| | | | | | | | |
| | $ | 466,375 | | | $ | 460,720 | |
| | | | | | | | |
| (1) | Tax fees consist of fees for tax compliance, tax advice, tax planning and excise tax. |
(e) The Chairman of the Audit Committees is authorized topre-approve: (1) audit services for the mutual funds of Wells Fargo Funds Trust;(2) non-audit tax or compliance consulting or training services provided to the Funds by the independent auditors (“Auditors”) if the fees for any particular engagement are not anticipated to exceed $50,000; and(3) non-audit tax or compliance consulting or training services provided by the Auditors to a Fund’s investment adviser and its controlling entities (wherepre-approval is required because the engagement relates directly to the operations and financial reporting of the Fund) if the fee to the Auditors for any particular engagement is not anticipated to exceed $50,000. For any suchpre-approval sought from the Chairman, Management shall prepare a brief description of the proposed services.
If the Chairman approves of such service, he or she shall sign the statement prepared by Management.
Such written statement shall be presented to the full Committees at their next regularly scheduled meetings.
(f) Not applicable
(g) Not applicable
(h) Not applicable
ITEM 5. AUDIT COMMITTEE OF LISTED REGISTRANTS
Not applicable.
ITEM 6. INVESTMENTS
A Portfolio of Investments for each series of Wells Fargo Funds Trust is included as part of the report to shareholders filed under Item 1 of this Form.
ITEM 7. DISCLOSURE OF PROXY VOTING POLICIES AND PROCEDURES FORCLOSED-END MANAGEMENT INVESTMENT COMPANIES
Not applicable.
ITEM 8. PORTFOLIO MANAGERS OFCLOSED-END MANAGEMENT INVESTMENT COMPANIES
Not applicable.
ITEM 9. PURCHASES OF EQUITY SECURITIES BYCLOSED-END MANAGEMENT INVESTMENT COMPANY AND AFFILIATED PURCHASERS
Not applicable.
ITEM 10. SUBMISSION OF MATTERS TO A VOTE OF SECURITY HOLDERS
There have been no material changes to the procedures by which shareholders may recommend nominees to the registrant’s Board of Trustees that have been implemented since the registrant’s last provided disclosure in response to the requirements of this Item.
ITEM 11. CONTROLS AND PROCEDURES
(a) The President and Treasurer have concluded that the Wells Fargo Funds Trust disclosure controls and procedures (as defined in Rule30a-3(c) under the Investment Company Act of 1940) provide reasonable assurances that material information relating to the registrant is made known to them by the appropriate persons based on their evaluation of these controls and procedures as of a date within 90 days of the filing of this report.
(b) There were no significant changes in the registrant’s internal controls over financial reporting (as defined in Rule30a-3(d) under the Investment Company Act of 1940) that occurred during the most recent fiscal half-year of the period covered by this report that materially affected, or is reasonably likely to materially affect, the registrant’s internal control over financial reporting.
ITEM 12. DISCLOSURES OF SECURITIES LENDING ACTIVITES FORCLOSED-END MANAGEMENT INVESTMENT COMPANIES
Not applicable.
ITEM 13. EXHIBITS
(a)(1) Code of Ethics pursuant to Item 2 of FormN-CSR is filed and attached hereto as Exhibit COE.
(a)(2) Certification pursuant to Rule30a-2(a) under the Investment Company Act of 1940 (17 CFR270.30a-2(a)) is filed and attached hereto as Exhibit 99.CERT.
(b) Certification pursuant to Rule30a-2(b) under the Investment Company Act of 1940 (17 CFR270.30a-2(b)) is filed and attached hereto as Exhibit 99.906CERT.

SIGNATURES
Pursuant to the requirements of the Securities Exchange Act of 1934 and the Investment Company Act of 1940, the registrant has duly caused this report to be signed on its behalf by the undersigned, thereunto duly authorized.
| | |
| Wells Fargo Funds Trust |
| |
| By: | | |
| | /s/ Andrew Owen |
| |
| | Andrew Owen |
| | President |
|
| Date: October 28, 2019 |
Pursuant to the requirements of the Securities Exchange Act of 1934 and the Investment Company Act of 1940, this report has been signed below by the following persons on behalf of the registrant and in the capacities and on the date indicated.
| | |
| Wells Fargo Funds Trust |
| |
| By: | | |
| | /s/ Andrew Owen |
| |
| | Andrew Owen |
| | President |
|
| Date: October 28, 2019 |
| |
| By: | | |
| | /s/ Nancy Wiser |
| |
| | Nancy Wiser |
| | Treasurer |
|
| Date: October 28, 2019 |