
UNITED STATES
SECURITIES AND EXCHANGE COMMISSION
Washington, D.C. 20549
FORMN-CSR
CERTIFIED SHAREHOLDER REPORT OF REGISTERED
MANAGEMENT INVESTMENT COMPANIES
Investment Company Act file number:811-09253
Wells Fargo Funds Trust
(Exact name of registrant as specified in charter)
525 Market St., San Francisco, CA 94105
(Address of principal executive offices) (Zip code)
Alexander Kymn
Wells Fargo Funds Management, LLC
525 Market St., San Francisco, CA 94105
(Name and address of agent for service)
Registrant’s telephone number, including area code:800-222-8222
Date of fiscal year end: June 30
Registrant is making a filing for 12 of its series:
Wells Fargo Alternative Risk Premia Fund, Wells Fargo California Limited-TermTax-Free Fund, Wells Fargo CaliforniaTax-Free Fund, Wells Fargo High Yield Municipal Bond Fund, Wells Fargo IntermediateTax/AMT-Free Fund, Wells Fargo MinnesotaTax-Free Fund, Wells Fargo Municipal Bond Fund, Wells Fargo PennsylvaniaTax-Free Fund, Wells Fargo Short-Term Municipal Bond Fund, Wells Fargo Strategic Municipal Bond Fund, Wells Fargo Ultra Short-Term Municipal Income Fund, and Wells Fargo WisconsinTax-Free Fund.
Date of reporting period: June 30, 2019
ITEM 1. REPORT TO STOCKHOLDERS
Annual Report
June 30, 2019
Wells Fargo
Minnesota Tax-Free Fund
Beginning on January 1, 2021, as permitted by new regulations adopted by the Securities and Exchange Commission, paper copies of the Wells Fargo Funds’ annual and semi-annual shareholder reports issued after this date will no longer be sent by mail, unless you specifically request paper copies of the reports. Instead, the reports will be made available on the Funds’ website, and you will be notified by mail each time a report is posted and provided with a website address to access the report.
If you already elected to receive shareholder reports electronically, you will not be affected by this change and you need not take any action. You may elect to receive shareholder reports and other communications from the Fund electronically at any time by contacting your financial intermediary (such as a broker-dealer or bank) or, if you are a direct investor, by calling1-800-222-8222 or by enrolling at wellsfargo.com/advantagedelivery.
You may elect to receive all future reports in paper free of charge. If you invest through a financial intermediary, you can contact your financial intermediary to request that you continue to receive paper copies of your shareholder reports; if you invest directly with the Fund, you can call 1-800-222-8222. Your election to receive reports in paper will apply to all Wells Fargo Funds held in your account with your financial intermediary or, if you are a direct investor, to all Wells Fargo Funds that you hold.
|
|
|
Reduce clutter. Save trees. |
Sign up for electronic delivery of prospectuses and shareholder reports atwellsfargo.com/advantagedelivery |
The views expressed and any forward-looking statements are as of June 30, 2019, unless otherwise noted, and are those of the Fund managers and/or Wells Fargo Asset Management. Discussions of individual securities, or the markets generally, or any Wells Fargo Fund are not intended as individual recommendations. Future events or results may vary significantly from those expressed in any forward-looking statements. The views expressed are subject to change at any time in response to changing circumstances in the market. Wells Fargo Asset Management and the Fund disclaim any obligation to publicly update or revise any views expressed or forward-looking statements.
INVESTMENT PRODUCTS: NOT FDIC INSURED ◾ NO BANK GUARANTEE ◾ MAY LOSE VALUE
Wells Fargo Minnesota Tax-Free Fund | 1
Letter to shareholders (unaudited)

Andrew Owen
President
Wells Fargo Funds
Dear Shareholder:
We are pleased to offer you this annual report for the Wells Fargo Minnesota Tax-Free Fund for the 12-month period that ended June 30, 2019. After the first six months of the period yielded either low-single-digit or negative investment returns, stock and bond investors enjoyed a recovery during the final six months. The gains came amid continued concerns about global economic growth, international trade, geopolitical tensions, and bouts of market volatility.
For the period, U.S. stocks, based on the S&P 500 Index,1 gained 10.42% and international stocks, as measured by the MSCI ACWI ex USA Index (Net),2 rose 1.29%. The MSCI EM Index (Net)3 added 1.21%. For bond investors, the Bloomberg Barclays U.S. Aggregate Bond Index4 added 7.87%, the Bloomberg Barclays Global Aggregate ex-USD Index5 rose 4.10%, the Bloomberg Barclays Municipal Bond Index6 gained 6.71%, and the ICE BofAML U.S. High Yield Index7 added 7.58%.
U.S. and international markets diverged during the third quarter of 2018.
Domestic equity investors received encouraging news during the third quarter of 2018. The U.S. Bureau of Economic Analysis reported second-quarter annualized gross domestic product (GDP) growth of 4.2%. Hiring improved. Unemployment declined. Consumer confidence and spending increased. Third-quarter corporate earnings reports were generally positive. U.S. trade negotiations with Mexico and Canada progressed. The U.S. Federal Reserve (Fed) raised the federal funds rate by 25 basis points (bps; 100 bps equal 1.00%) to a target range of between 2.00% and 2.25% in September, one of four rate increases implemented during 2018, expressing confidence in the strength of the U.S. economic expansion’s durability.
Investors in international markets were not as confident. Tensions between the U.S. and China increased. The U.S. imposed $200 billion in tariffs on Chinese goods. China reacted with $60 billion in tariffs on U.S. goods. Economic growth in China caused concern. During the quarter, the MSCI ACWI ex USA Index (Net) gained 0.71%. The MSCI EM Index (Net) declined 1.09%. In fixed-income markets, U.S. bonds were flat, as measured by the Bloomberg Barclays U.S. Aggregate Bond Index. The Bloomberg Barclays Global Aggregate ex-USD Index fell 1.74%.
| 1 | The S&P 500 Index consists of 500 stocks chosen for market size, liquidity, and industry group representation. It is a market-value-weighted index with each stock’s weight in the index proportionate to its market value. You cannot invest directly in an index. |
| 2 | The Morgan Stanley Capital International (MSCI) All Country World Index (ACWI) ex USA Index (Net) is a free-float-adjusted market-capitalization weighted index that is designed to measure the equity market performance of developed and emerging markets, excluding the U.S. Source: MSCI. MSCI makes no express or implied warranties or representations and shall have no liability whatsoever with respect to any MSCI data contained herein. The MSCI data may not be further redistributed or used as a basis for other indices or any securities or financial products. This report is not approved, reviewed, or produced by MSCI. You cannot invest directly in an index. |
| 3 | The MSCI Emerging Markets (EM) Index (Net) is a free-float-adjusted market-capitalization-weighted index that is designed to measure the equity market performance of emerging markets. You cannot invest directly in an index. |
| 4 | The Bloomberg Barclays U.S. Aggregate Bond Index is a broad-based benchmark that measures the investment-grade, U.S. dollar-denominated, fixed-rate taxable bond market, including Treasuries, government-related and corporate securities, mortgage-backed securities (agency fixed-rate and hybrid adjustable-rate mortgage pass-throughs), asset-backed securities, and commercial mortgage-backed securities. You cannot invest directly in an index. |
| 5 | The Bloomberg Barclays Global Aggregate ex-USD Index is an unmanaged index that provides a broad-based measure of the global investment-grade fixed-income markets excluding the U.S. dollar-denominated debt market. You cannot invest directly in an index. |
| 6 | The Bloomberg Barclays Municipal Bond Index is an unmanaged index composed of long-term tax-exempt bonds with a minimum credit rating of Baa. You cannot invest directly in an index. |
| 7 | The ICE BofAML U.S. High Yield Index is a market-capitalization-weighted index of domestic and Yankee high-yield bonds. The index tracks the performance of high-yield securities traded in the U.S. bond market. You cannot invest directly in an index. Copyright 2019. ICE Data Indices, LLC. All rights reserved. |
2 | Wells Fargo Minnesota Tax-Free Fund
Letter to shareholders (unaudited)
Global markets suffered during the fourth quarter of 2018.
November’s U.S. midterm elections shifted control of the House of Representatives from Republicans to Democrats, presaging partisan clashes that followed and caused uncertainty among investors. Third-quarter U.S. GDP was announced at an annualized 3.4% rate, lower than the second-quarter rate. Brexit efforts stalled ahead of the March 2019 deadline. The People’s Bank of China cut reserve requirement ratios, accelerated infrastructure spending, and cut taxes even as the value of the yuan declined to low levels last seen in 2008. A partial U.S. government shutdown driven by partisan policy disputes extended into January.
The combination of news in the U.S. and generally weak economic indicators outside of the U.S. caused investors to seek safe havens. December’s S&P 500 Index performance was the worst since 1931. Globally, fixed-income investments fared better than stocks during the last two months of the year. The Fed increased the federal funds rate by 25 bps in December to a target range of between 2.25% and 2.50%.
The market climbs a wall of worry.
Investors entered 2019 with reasons to be concerned. Investment returns appeared to reaffirm the adage that markets climb a wall of worry. The S&P 500 Index gained 8.01% for the month of January, the best monthly performance in 30 years. Returns for the MSCI ACWI ex USA Index (Net), the Bloomberg Barclays U.S. Aggregate Bond Index, and the Bloomberg Barclays Global Aggregate ex-USD Index also were positive. The Fed indicated that it would pause its program of regular rate increases during 2019 as inflation remained low.
In February 2019, concerns over slowing global growth persisted. The Bureau of Economic Analysis announced fourth-quarter 2018 GDP grew at an annualized 2.2% rate, down from the levels of the prior two quarters. In a February report, the Bank of England forecast the slowest growth since the financial crisis for 2019. China and the U.S. continued to wrangle over trade issues.
By the end of March 2019, the combination of dovish Fed sentiment and steady, if not spectacular, economic and business metrics reinforced investors’ confidence. Monthly job creation data and corporate profits, while less consistent than during 2018, were solid. China announced a roughly $300 billion stimulus package through tax and fee cuts intended to reinvigorate economic growth.
During April 2019, investors drew confidence from favorable economic projections, sustained low inflation, and solid employment data. First-quarter GDP showed the economy grew at an annualized rate of 3.2% on improvement in business investment and exports. Favorable sentiment extended to foreign markets as the MSCI ACWI ex USA Index (Net) gained 2.64% and the MSCI EM Index (Net) added 2.11% for the month.
During May 2019, investing signals were mixed. In the U.S., partisan wrangling ramped up as Democrats and Republicans set their sights on 2020 presidential politics. The U.K.’s Brexit caused Prime Minister Theresa May to resign. The European Commission downgraded the 2019 growth forecast to 1.2%. The U.S. increased tariffs on products from China, China responded, and then talks broke down. President Donald Trump threatened to turn his foreign policy tariff tool to Mexico over immigration issues. Markets tumbled.
As had been the case during most of 2019 to date, just as the investment horizon appeared to darken, sentiment turned and markets gained. The gains, primarily driven by geopolitical and monetary policy events, drove equity markets to new highs. President Trump dropped his threats of new tariffs on Mexico after talks and further tariffs on China after meeting with China’s President Xi Jinping at the G-20 summit. President Mario Draghi of the European Central Bank said that if the outlook doesn’t
“December’s S&P 500 Index performance was the worst since 1931.”
“The S&P 500 Index gained 8.01% for the month of January, the best monthly performance in 30 years.”
Wells Fargo Minnesota Tax-Free Fund | 3
Letter to shareholders (unaudited)
improve, the bank will cut rates or buy more assets to prop up inflation. In the U.S., the Fed said growth shifted from “solid” to “moderate” and indicated a willingness to cut rates.
Don’t let short-term uncertainty derail long-term investment goals.
Periods of investment uncertainty can present challenges, but experience has taught us that maintaining long-term investment goals can be an effective way to plan for the future. To help you create a sound strategy based on your personal goals and risk tolerance, Wells Fargo Funds offers more than 100 mutual funds spanning a wide range of asset classes and investment styles. Although diversification cannot guarantee an investment profit or prevent losses, we believe it can be an effective way to manage investment risk and potentially smooth out overall portfolio performance. We encourage investors to know their investments and to understand that appropriate levels of risk-taking may unlock opportunities.
Thank you for choosing to invest with Wells Fargo Funds. We appreciate your confidence in us and remain committed to helping you meet your financial needs.
Sincerely,

Andrew Owen
President
Wells Fargo Funds
|
|
|
For further information about your Fund, contact your investment professional, visit our website at wfam.com, or call us directly at1-800-222-8222. |
4 | Wells Fargo Minnesota Tax-Free Fund
This page is intentionally left blank.
Performance highlights (unaudited)
Investment objective
The Fund seeks current income exempt from federal income tax and Minnesota individual income tax.
Manager
Wells Fargo Funds Management, LLC
Subadviser
Wells Capital Management Incorporated
Portfolio managers
Wendy Casetta
Bruce R. Johns
Average annual total returns (%) as of June 30, 2019
| | | | | | | | | | | | | | | | | | | | | | | | | | | | | | | | | | |
| | | | |
| | | | | Including sales charge | | | Excluding sales charge | | | Expense
ratios1 (%) | |
| | | | | | | | | |
| | | Inception date | | 1 year | | | 5 year | | | 10 year | | | 1 year | | | 5 year | | | 10 year | | | Gross | | | Net2 | |
| | | | | | | | | | |
| Class A (NMTFX) | | 1-12-1988 | | | 0.40 | | | | 1.86 | | | | 3.45 | | | | 5.13 | | | | 2.80 | | | | 3.93 | | | | 0.84 | | | | 0.84 | |
| | | | | | | | | | |
| Class C (WMTCX) | | 4-8-2005 | | | 3.35 | | | | 2.04 | | | | 3.15 | | | | 4.35 | | | | 2.04 | | | | 3.15 | | | | 1.59 | | | | 1.59 | |
| | | | | | | | | | |
| Administrator Class (NWMIX) | | 8-2-1993 | | | – | | | | – | | | | – | | | | 5.29 | | | | 3.04 | | | | 4.18 | | | | 0.78 | | | | 0.60 | |
| | | | | | | | | | |
| Institutional Class (WMTIX)3 | | 10-31-2016 | | | – | | | | – | | | | – | | | | 5.37 | | | | 3.10 | | | | 4.21 | | | | 0.51 | | | | 0.51 | |
| | | | | | | | | | |
| Bloomberg Barclays Municipal Bond Index4 | | – | | | – | | | | – | | | | – | | | | 6.71 | | | | 3.64 | | | | 4.72 | | | | – | | | | – | |
| | | | | | | | | | |
| Bloomberg Barclays Minnesota Municipal Bond Index5 | | – | | | – | | | | – | | | | – | | | | 6.39 | | | | 3.07 | | | | 4.00 | | | | – | | | | – | |
Figures quoted represent past performance, which is no guarantee of future results, and do not reflect taxes that a shareholder may pay on fund distributions or the redemption of fund shares. Investment return and principal value of an investment will fluctuate so that an investor’s shares, when redeemed, may be worth more or less than their original cost. Performance shown without sales charges would be lower if sales charges were reflected. Current performance may be lower or higher than the performance data quoted, which assumes the reinvestment of dividends and capital gains. Current month-end performance is available on the Fund’s website,wfam.com.
Index returns do not include transaction costs associated with buying and selling securities, any mutual fund fees or expenses, or any taxes. It is not possible to invest directly in an index.
For Class A shares, the maximum front-end sales charge is 4.50%. For Class C shares, the maximum contingent deferred sales charge is 1.00%. Performance including a contingent deferred sales charge assumes the sales charge for the corresponding time period. Administrator Class and Institutional Class shares are sold without a front-end sales charge or contingent deferred sales charge.
Bond values fluctuate in response to the financial condition of individual issuers, general market and economic conditions, and changes in interest rates. Changes in market conditions and government policies may lead to periods of heightened volatility in the bond market and reduced liquidity for certain bonds held by the Fund. In general, when interest rates rise, bond values fall and investors may lose principal value. Interest rate changes and their impact on the Fund and its share price can be sudden and unpredictable. The use of derivatives may reduce returns and/or increase volatility. Certain investment strategies tend to increase the total risk of an investment (relative to the broader market). The Fund is exposed to Minnesota municipal securities risk and high-yield securities risk. Consult the Fund’s prospectus for additional information on these and other risks. A portion of the Fund’s income may be subject to federal, state, and/ or local income taxes or the Alternative Minimum Tax (AMT). Any capital gains distributions may be taxable.
Please see footnotes on page 7.
6 | Wells Fargo Minnesota Tax-Free Fund
Performance highlights (unaudited)
|
|
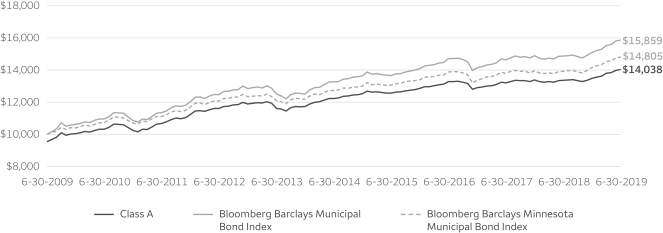
| Growth of $10,000 investment as of June 30, 20196 |
|
|
| 1 | Reflects the expense ratios as stated in the most recent prospectuses. The expense ratios shown are subject to change and may differ from the annualized expense ratios shown in the financial highlights of this report. |
| 2 | The manager has contractually committed through October 31, 2019, to waive fees and/or reimburse expenses to the extent necessary to cap the expenses of each class after fee waivers at 0.85% for Class A, 1.60% for Class C, 0.60% for Administrator Class, and 0.52% for Institutional Class. Brokerage commissions, stamp duty fees, interest, taxes, acquired fund fees and expenses (if any), and extraordinary expenses are excluded from the expense cap. Prior to or after the commitment expiration date, the cap may be increased or the commitment to maintain the cap may be terminated only with the approval of the Board of Trustees. Without this cap, the Fund’s returns would have been lower. The expense ratio paid by an investor is the net expense ratio (the total annual fund operating expenses after fee waivers) as stated in the prospectuses. |
| 3 | Historical performance shown for the Institutional Class shares prior to their inception reflects the performance of the Administrator Class shares, and is not adjusted to reflect Institutional Class expenses. If these expenses had been included, returns for Institutional Class shares would be higher. |
| 4 | The Bloomberg Barclays Municipal Bond Index is an unmanaged index composed of long-term tax-exempt bonds with a minimum credit rating of Baa. You cannot invest directly in an index. |
| 5 | The Bloomberg Barclays Minnesota Municipal Bond Index is the Minnesota component of the Bloomberg Barclays Municipal Bond Index. You cannot invest directly in an index. |
| 6 | The chart compares the performance of Class A shares for the most recent ten years with the Bloomberg Barclays Municipal Bond Index and the Bloomberg Barclays Minnesota Municipal Bond Index. The chart assumes a hypothetical $10,000 investment in Class A shares and reflects all operating expenses and assumes the maximum initial sales charge of 4.50%. |
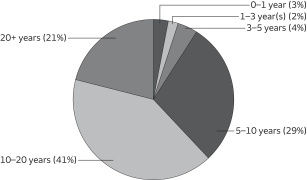
| 7 | Amounts are calculated based on the long-term total investments of the Fund. These amounts are subject to change and may have changed since the date specified. |
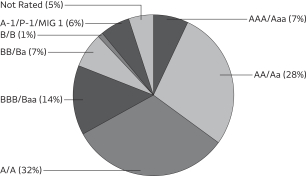
| 8 | The credit quality distribution of portfolio holdings reflected in the chart is based on ratings from Standard & Poor’s, Moody’s Investors Service, and/or Fitch Ratings Ltd. Credit quality ratings apply to the underlying holdings of the Fund and not to the Fund itself. The percentages of the Fund’s portfolio with the ratings depicted in the chart are calculated based on the total market value of fixed income securities held by the Fund. If a security was rated by all three rating agencies, the middle rating was utilized. If rated by two of three rating agencies, the lower rating was utilized, and if rated by one of the rating agencies, that rating was utilized. Standard & Poor’s rates the creditworthiness of bonds, ranging from AAA (highest) to D (lowest). Ratings from A to CCC may be modified by the addition of a plus (+) or minus (-) sign to show relative standing within the rating categories. Standard & Poor’s rates the creditworthiness of short-term notes from SP-1 (highest) to SP-3 (lowest). Moody’s rates the creditworthiness of bonds, ranging from Aaa (highest) to C (lowest). Ratings Aa to B may be modified by the addition of a number 1 (highest) to 3 (lowest) to show relative standing within the ratings categories. Moody’s rates the creditworthiness of short-term U.S. tax-exempt municipal securities from MIG 1/VMIG 1 (highest) to SG (lowest). Fitch rates the creditworthiness of bonds, ranging from AAA (highest) to D (lowest). Credit quality distribution is subject to change and may have changed since the date specified. |
Wells Fargo Minnesota Tax-Free Fund | 7
Performance highlights (unaudited)
MANAGER’S DISCUSSION
Fund highlights
| ∎ | | The Fund underperformed its benchmarks, the Bloomberg Barclays Municipal Bond Index, which is the primary benchmark, and the Bloomberg Barclays Minnesota Municipal Bond Index, which is the secondary benchmark, for the 12-month period that ended June 30, 2019. |
| ∎ | | We extended the Fund’s duration during the year but ended the year shorter than the benchmark, which was a detractor from performance as yields rallied over the second half of the period. |
| ∎ | | The Fund’s overweight to A-rated and BBB-rated bonds along with an out-of-benchmark position in non-investment-grade bonds were drivers of performance, as lower-rated investment-grade bonds outperformed higher-rated AAA-rated and AA-rated bonds. Additionally, the Fund’s overweights to local general obligation (GO) bonds and education bonds were positive contributors to performance. |
|
|
| Effective maturity distribution as of June 30, 20197 |
|
 |
The Fed abruptly changed course from raising rates to a potential rate cut on fading growth expectations.
Throughout most of 2018, the fixed-income markets expected the U.S. Federal Reserve (Fed) to continue the path to normalize monetary policy. Moderate economic growth, stronger employment data, and inflation near its 2% target enabled the Fed to increase the federal funds rate four times in the calendar year. Despite a Fed rate hike in December, the Treasury market rallied in the fourth quarter of 2018 as the market lowered expectations for further rate hikes amid slower global growth, trade tariffs, and uncertainty concerning Britain’s departure from the
European Union. These concerns only increased as we moved into the first half of 2019, and discussions changed from when the Fed might hike to when it might cut the federal funds rate. As a result, fixed-income markets rallied, pushing the benchmark 10-year Treasury yield from a 3.23% peak in November 2018 to 2.00% by the end of June 2019. The municipal market mutual fund bond flows in the first half of 2019 were in excess of $42 billion, a number not seen since 1992. With this strong technical backdrop for the municipal market and the Fed possibly cutting rates, all bonds rallied in the first half of 2019. Intermediate and longer bonds outperformed shorter maturities. With these factors at play, we see strong support for the municipal market over the short to intermediate term.
Minnesota’s municipal credit fundamentals are solid, based on our analysis.
Minnesota State credit ratings are AAA (stable), Aa1 (stable) and AAA (stable) by Standard & Poor’s Financial Services LLC; Moody’s Investors Service, Inc.; and Fitch Ratings Inc., respectively. Known as the state of 10,000 lakes, Minnesota is the21st-largest state in terms of population and 17th by gross domestic product (GDP) as of December 31, 2018. Credit fundamentals remain solid, based on our analysis, as Minnesota’s economy continues to perform well and the state is benefiting from ample operating surpluses. Debt and pension liabilities remain manageable, in our view, and the state’s reserves have increased significantly over the past several years. The state’s economy is broad and well diversified and is characterized by low unemployment and above-average income levels. The state’s population base is well educated, the labor participation rate is high, and the poverty rate is low. The state has a long history of conservative management practices and outperforming budgeted projections. Minnesota ended fiscal-year 2018 with a total general fund balance of $4.7 billion, compared with $3.4 billion at the end of the prior fiscal year. The state’s latest forecast, released in February 2019, points to a somewhat weakened economic outlook for the current biennium. Slower projected economic growth and lower collections have reduced the revenue forecast, though a slightly lower spending forecast offsets the overall reduction to the projected surplus. State legislators recently passed a balanced budget for the biennium starting July 1, 2019.
During the period, several factors drove Fund performance.
The Fund’s overweight to lower-rated investment-grade (A-rated and BBB-rated) bonds were the main drivers of performance. Yield-curve positioning along with overweights to credit sectors including local GOs, hospitals, and education benefited the Fund. The Fund’s short duration positioning along with sector and security selection detracted from performance.
Please see footnotes on page 7.
8 | Wells Fargo Minnesota Tax-Free Fund
Performance highlights (unaudited)
As the period began, the Fund was defensively positioned and was short duration to its primary benchmark as the Fed was expected to raise rates two more times in the second half of 2018 and expected to continue to raise rates in 2019. We started to extend duration in late 2018 as growth expectations slowed, but the Fund was still short duration relative to the benchmarks at the end of the year. This positioning detracted from performance as the Fed changed directions abruptly. Yield-curve positioning was supportive of positive performance as the Fund was modestly bulleted and overweight the intermediate part of the curve, which was the best-performing part of the curve on a risk-adjusted basis. The Fund was underweight shorter maturities, which underperformed, and longer-maturity bonds, which outperformed. When extending the Fund’s duration, we focused on buying longer, higher-quality bonds and taking credit exposure in short maturities as we felt credit spreads had contracted to a point that individuals are not being compensated for taking on additional credit risk.
|
|
| Credit quality as of June 30, 20198 |
|
 |
The Fund was overweight local GOs, education, and health care bonds, which outperformed over the period. Some of the better-performing bonds in the Fund were Roseville, MN, Independent School District Bonds; Hennepin County, MN, bonds; and Saint Cloud, MN, health care (CentraCare Health) bonds. While the Fund was underweight state GO bonds, an underperforming sector, the $6.1 million in state of Minnesota bonds that we held outperformed significantly. Being underweight revenue bonds was a detractor from performance as revenue bonds outperformed. There were no positions that were large detractors from performance. However, some securities failed to keep pace with the benchmark and underperformed due to subpar security selection.
Slowing growth supports credit fundamentals, but market technicals are driving performance and issue selection remains key in state-specific funds.
We believe U.S. economic growth is slowing but still continues at a modest pace. Minnesota’s economy performed well, which may lead to higher revenues for many municipalities and improved credit fundamentals. We view the Fed becoming more dovish and potentially cutting rates in the latter half of 2019 as supportive of GDP growth. Some municipalities may do well and others may continue to struggle, making credit selection very important. We expect to remain overweight lower-quality investment-grade bonds, though we believe investors currently are not being compensated sufficiently for making new investments in some of these areas. In our view, the long-term drivers of valuations will be supply and demand trends, absolute yield levels, the shape of the yield curve, and credit fundamentals. While we will continue our bias to overweighting lower-quality investment-grade bonds, it will be to a lesser degree, and we likely will add some higher-quality bonds as opportunities arise. We will monitor economic growth, the technical market, and fundamental credit quality to see if any changes are warranted in duration, yield-curve positioning, or credit-quality selections over the next year.
Please see footnotes on page 7.
Wells Fargo Minnesota Tax-Free Fund | 9
Fund expenses (unaudited)
As a shareholder of the Fund, you incur two types of costs: (1) transaction costs, including sales charges (loads) on purchase payments and contingent deferred sales charges (if any) on redemptions and (2) ongoing costs, including management fees, distribution (12b-1) and/or shareholder servicing fees, and other Fund expenses. This example is intended to help you understand your ongoing costs (in dollars) of investing in the Fund and to compare these costs with the ongoing costs of investing in other mutual funds.
The example is based on an investment of $1,000 invested at the beginning of the six-month period and held for the entire period from January 1, 2019 to June 30, 2019.
Actual expenses
The “Actual” line of the table below provides information about actual account values and actual expenses. You may use the information in this line, together with the amount you invested, to estimate the expenses that you paid over the period. Simply divide your account value by $1,000 (for example, an $8,600 account value divided by $1,000 = 8.6), then multiply the result by the number in the “Actual” line under the heading entitled “Expenses paid during period” for your applicable class of shares to estimate the expenses you paid on your account during this period.
Hypothetical example for comparison purposes
The “Hypothetical” line of the table below provides information about hypothetical account values and hypothetical expenses based on the Fund’s actual expense ratio and an assumed rate of return of 5% per year before expenses, which is not the Fund’s actual return. The hypothetical account values and expenses may not be used to estimate the actual ending account balance or expenses you paid for the period. You may use this information to compare the ongoing costs of investing in the Fund and other funds. To do so, compare this 5% hypothetical example with the 5% hypothetical examples that appear in the shareholder reports of the other funds.
Please note that the expenses shown in the table are meant to highlight your ongoing costs only and do not reflect any transactional costs, such as sales charges (loads) and contingent deferred sales charges. Therefore, the “Hypothetical” line of the table is useful in comparing ongoing costs only and will not help you determine the relative total costs of owning different funds. In addition, if these transactional costs were included, your costs would have been higher.
| | | | | | | | | | | | | | | | |
| | | Beginning
account value
1-1-2019 | | | Ending
account value
6-30-2019 | | | Expenses
paid during
the period¹ | | | Annualized net
expense ratio | |
| | | | | |
Class A | | | | | | | | | | | | | | | | |
| | | | |
Actual | | $ | 1,000.00 | | | $ | 1,041.16 | | | $ | 4.30 | | | | 0.85 | % |
| | | | |
Hypothetical (5% return before expenses) | | $ | 1,000.00 | | | $ | 1,020.58 | | | $ | 4.26 | | | | 0.85 | % |
| | | | | |
Class C | | | | | | | | | | | | | | | | |
| | | | |
Actual | | $ | 1,000.00 | | | $ | 1,037.31 | | | $ | 8.08 | | | | 1.60 | % |
| | | | |
Hypothetical (5% return before expenses) | | $ | 1,000.00 | | | $ | 1,016.86 | | | $ | 8.00 | | | | 1.60 | % |
| | | | | |
Administrator Class | | | | | | | | | | | | | | | | |
| | | | |
Actual | | $ | 1,000.00 | | | $ | 1,041.48 | | | $ | 3.04 | | | | 0.60 | % |
| | | | |
Hypothetical (5% return before expenses) | | $ | 1,000.00 | | | $ | 1,021.82 | | | $ | 3.01 | | | | 0.60 | % |
| | | | | |
Institutional Class | | | | | | | | | | | | | | | | |
| | | | |
Actual | | $ | 1,000.00 | | | $ | 1,041.86 | | | $ | 2.63 | | | | 0.52 | % |
| | | | |
Hypothetical (5% return before expenses) | | $ | 1,000.00 | | | $ | 1,022.22 | | | $ | 2.61 | | | | 0.52 | % |
| 1 | Expenses paid is equal to the annualized net expense ratio of each class multiplied by the average account value over the period, multiplied by the number of days in the most recent fiscal half-year divided by the number of days in the fiscal year (to reflect the one-half-year period). |
10 | Wells Fargo Minnesota Tax-Free Fund
Portfolio of investments—June 30, 2019
| | | | | | | | | | | | | | | | |
| | | Interest
rate | | | Maturity
date | | | Principal | | | Value | |
| Municipal Obligations: 99.98% | | | | | | | | | | | | | | | | |
| | | | |
Guam: 1.16% | | | | | | | | | | | | | | | | |
| | | | |
| Airport Revenue: 0.58% | | | | | | | | | | | | |
| | | | |
Guam Port Authority Series 2018B | | | 5.00 | % | | | 7-1-2019 | | | $ | 250,000 | | | $ | 250,000 | |
| | | | |
Guam Port Authority Series 2018B | | | 5.00 | | | | 7-1-2035 | | | | 605,000 | | | | 692,846 | |
| | | | |
| | | | | | | | | | | | | | | 942,846 | |
| | | | | | | | | | | | | | | | |
| | | | |
| Water & Sewer Revenue: 0.58% | | | | | | | | | | | | |
| | | | |
Guam Government Waterworks Authority Water & Wastewater System Project Series 2013 | | | 5.25 | | | | 7-1-2022 | | | | 865,000 | | | | 945,142 | |
| | | | | | | | | | | | | | | | |
| | | | |
| | | | | | | | | | | | | | | 1,887,988 | |
| | | | | | | | | | | | | | | | |
| | | | |
Illinois: 0.99% | | | | | | | | | | | | | | | | |
| | | | |
| GO Revenue: 0.99% | | | | | | | | | | | | |
| | | | |
Illinois Refunding Bond Series 2018A | | | 5.00 | | | | 10-1-2021 | | | | 500,000 | | | | 533,600 | |
| | | | |
Kane, Cook and DuPage Counties IL School District #46 Series 2015D | | | 5.00 | | | | 1-1-2027 | | | | 965,000 | | | | 1,090,518 | |
| | | | |
| | | | | | | | | | | | | | | 1,624,118 | |
| | | | | | | | | | | | | | | | |
| | | | |
Minnesota: 97.52% | | | | | | | | | | | | | | | | |
| | | | |
| Airport Revenue: 2.64% | | | | | | | | | | | | |
| | | | |
Minneapolis & St. Paul MN Metropolitan Airports Commission Series 2014A | | | 5.00 | | | | 1-1-2032 | | | | 750,000 | | | | 851,820 | |
| | | | |
Minneapolis & St. Paul MN Metropolitan Airports Commission Series 2016C | | | 5.00 | | | | 1-1-2046 | | | | 1,000,000 | | | | 1,172,300 | |
| | | | |
Minneapolis & St. Paul MN Metropolitan Airports Commission Series 2016D | | | 5.00 | | | | 1-1-2041 | | | | 250,000 | | | | 288,985 | |
| | | | |
Minneapolis & St. Paul MN Metropolitan Airports Commission Subordinate Bond Series 2014A | | | 5.00 | | | | 1-1-2029 | | | | 500,000 | | | | 572,530 | |
| | | | |
Minneapolis & St. Paul MN Metropolitan Airports Commission Subordinate Bond Series 2014B | | | 5.00 | | | | 1-1-2026 | | | | 1,250,000 | | | | 1,427,250 | |
| | | | |
| | | | | | | | | | | | | | | 4,312,885 | |
| | | | | | | | | | | | | | | | |
| | | | |
| Education Revenue: 22.81% | | | | | | | | | | | | |
| | | | |
Anoka County MN Charter School Series A | | | 3.65 | | | | 6-1-2020 | | | | 185,000 | | | | 188,765 | |
| | | | |
Anoka County MN Charter School Series A | | | 3.75 | | | | 6-1-2021 | | | | 245,000 | | | | 255,045 | |
| | | | |
Anoka County MN Charter School Series A | | | 5.00 | | | | 6-1-2027 | | | | 510,000 | | | | 536,918 | |
| | | | |
Anoka County MN Charter School Series A | | | 5.00 | | | | 6-1-2032 | | | | 300,000 | | | | 315,834 | |
| | | | |
Anoka County MN Charter School Series A | | | 5.00 | | | | 6-1-2043 | | | | 1,100,000 | | | | 1,158,058 | |
| | | | |
Brooklyn Park MN Charter School Athlos Leadership Academy Project Series 2015A | | | 4.00 | | | | 7-1-2020 | | | | 100,000 | | | | 100,213 | |
| | | | |
Brooklyn Park MN Charter School Athlos Leadership Academy Project Series 2015A | | | 5.50 | | | | 7-1-2040 | | | | 750,000 | | | | 783,428 | |
| | | | |
Cologne MN Charter School Cologne Academy Project Series 2014A | | | 5.00 | | | | 7-1-2029 | | | | 590,000 | | | | 633,607 | |
| | | | |
Cologne MN Charter School Cologne Academy Project Series 2014A | | | 5.00 | | | | 7-1-2034 | | | | 500,000 | | | | 529,410 | |
| | | | |
Columbus MN Charter School New Millennium Academy Project Series 2015A | | | 5.50 | | | | 7-1-2030 | | | | 1,000,000 | | | | 918,600 | |
| | | | |
Deephaven MN Charter School Eagle Ridge Academy Project Series 2015A | | | 5.25 | | | | 7-1-2040 | | | | 500,000 | | | | 538,280 | |
| | | | |
Deephaven MN Charter School Eagle Ridge Academy Project Series 2016A | | | 4.00 | | | | 7-1-2025 | | | | 125,000 | | | | 132,095 | |
| | | | |
Deephaven MN Charter School Eagle Ridge Academy Project Series 2016A | | | 4.00 | | | | 7-1-2026 | | | | 100,000 | | | | 105,171 | |
| | | | |
Deephaven MN Charter School Eagle Ridge Academy Project Series 2016A | | | 4.00 | | | | 7-1-2027 | | | | 100,000 | | | | 104,556 | |
| | | | |
Deephaven MN Charter School Eagle Ridge Academy Project Series A | | | 5.25 | | | | 7-1-2037 | | | | 400,000 | | | | 432,628 | |
| | | | |
Forest Lakes MN Charter School Lakes International Language Academy Project Series 2014A | | | 5.50 | | | | 8-1-2036 | | | | 500,000 | | | | 535,650 | |
| | | | |
Ham Lake MN Charter School DaVinci Academy Project Series 2012A | | | 4.00 | | | | 7-1-2028 | | | | 370,000 | | | | 377,015 | |
| | | | |
Ham Lake MN Charter School DaVinci Academy Project Series 2016A | | | 5.00 | | | | 7-1-2031 | | | | 625,000 | | | | 666,250 | |
| | | | |
Hugo MN Charter School Lease Revenue Bonds Noble Academy Project Series 2014A | | | 5.00 | | | | 7-1-2029 | | | | 600,000 | | | | 638,670 | |
Wells Fargo Minnesota Tax-Free Fund | 11
Portfolio of investments—June 30, 2019
| | | | | | | | | | | | | | | | |
| | | Interest
rate | | | Maturity
date | | | Principal | | | Value | |
| Education Revenue (continued) | | | | | | | | | | | | |
| | | | |
Minneapolis MN Charter School Yinghua Academy Project Series 2013A | | | 5.00 | % | | | 7-1-2023 | | | $ | 250,000 | | | $ | 260,303 | |
| | | | |
Minnesota HEFAR Bethel University Series 2017 | | | 5.00 | | | | 5-1-2037 | | | | 1,250,000 | | | | 1,412,100 | |
| | | | |
Minnesota HEFAR College of St. Scholastica Series 7R | | | 4.25 | | | | 12-1-2027 | | | | 400,000 | | | | 423,512 | |
| | | | |
Minnesota HEFAR Hamline University Series 2017B | | | 5.00 | | | | 10-1-2035 | | | | 1,000,000 | | | | 1,115,560 | |
| | | | |
Minnesota HEFAR Hamline University Series 7E | | | 4.50 | | | | 10-1-2021 | | | | 300,000 | | | | 311,604 | |
| | | | |
Minnesota HEFAR Hamline University Series 7E | | | 5.00 | | | | 10-1-2029 | | | | 500,000 | | | | 522,420 | |
| | | | |
Minnesota HEFAR St. Benedict College Series 2017 | | | 4.00 | | | | 3-1-2036 | | | | 410,000 | | | | 432,927 | |
| | | | |
Minnesota HEFAR St. Benedict College Series 7M | | | 5.13 | | | | 3-1-2036 | | | | 275,000 | | | | 281,834 | |
| | | | |
Minnesota HEFAR St. Catherine University Series A | | | 5.00 | | | | 10-1-2045 | | | | 2,000,000 | | | | 2,295,660 | |
| | | | |
Minnesota HEFAR St. Olaf College Series 8N | | | 4.50 | | | | 10-1-2030 | | | | 500,000 | | | | 503,800 | |
| | | | |
Minnesota HEFAR St. Thomas University Series 7U | | | 5.00 | | | | 4-1-2023 | | | | 750,000 | | | | 846,458 | |
| | | | |
Minnesota HEFAR St. Thomas University Series 8L | | | 5.00 | | | | 4-1-2028 | | | | 920,000 | | | | 1,105,536 | |
| | | | |
Minnesota HEFAR St. Thomas University Series 8L | | | 5.00 | | | | 4-1-2029 | | | | 750,000 | | | | 898,485 | |
| | | | |
Minnesota HEFAR St. Thomas University Series 8L | | | 5.00 | | | | 4-1-2035 | | | | 750,000 | | | | 876,195 | |
| | | | |
Minnesota Higher Education Facilities Authority Series 2019 | | | 5.00 | | | | 10-1-2040 | | | | 750,000 | | | | 911,430 | |
| | | | |
Minnesota Office of Higher Education Supplemental Student Loan Program Revenue Bonds Series 2018 | | | 5.00 | | | | 11-1-2026 | | | | 700,000 | | | | 830,228 | |
| | | | |
Minnesota State Colleges & Universities Revenue Fund & Refunding Bond Series 2017A | | | 5.00 | | | | 10-1-2027 | | | | 500,000 | | | | 618,220 | |
| | | | |
Moorhead MN Educational Facilities Bond The Concordia College Corporation Project Series 2016 | | | 5.00 | | | | 12-1-2025 | | | | 2,000,000 | | | | 2,244,620 | |
| | | | |
Otsego MN Charter School Kaleidoscope Charter School Project Series 2014A | | | 4.15 | | | | 9-1-2024 | | | | 515,000 | | | | 526,551 | |
| | | | |
Otsego MN Charter School Kaleidoscope Charter School Project Series 2014A | | | 5.00 | | | | 9-1-2034 | | | | 1,100,000 | | | | 1,158,146 | |
| | | | |
Rice County MN Educational Facilities Shattuck-St. Mary’s School Project 144A | | | 5.00 | | | | 8-1-2022 | | | | 955,000 | | | | 1,004,889 | |
| | | | |
St. Cloud MN Charter School Lease Revenue Bonds Stride Academy Project Series 2016A | | | 5.00 | | | | 4-1-2036 | | | | 750,000 | | | | 457,065 | |
| | | | |
St. Paul MN Housing & RDA Charter School Hmong College Preparatory Academy Project Series 2016A | | | 5.25 | | | | 9-1-2031 | | | | 1,000,000 | | | | 1,096,710 | |
| | | | |
St. Paul MN Housing & RDA Charter School Lease Revenue German Immersion School Project Series 2013A | | | 4.00 | | | | 7-1-2023 | | | | 175,000 | | | | 177,930 | |
| | | | |
St. Paul MN Housing & RDA Charter School Lease Revenue Twin Cities Academy Project Series 2015A | | | 5.00 | | | | 7-1-2035 | | | | 925,000 | | | | 979,954 | |
| | | | |
St. Paul MN Housing & RDA Conservatory for Performing Artists Series A | | | 4.00 | | | | 3-1-2028 | | | | 150,000 | | | | 150,146 | |
| | | | |
St. Paul MN Housing & RDA Hope Community Academy Project Series 2015A | | | 5.00 | | | | 12-1-2034 | | | | 1,645,000 | | | | 1,734,143 | |
| | | | |
University of Minnesota Series 2017A | | | 5.00 | | | | 9-1-2042 | | | | 770,000 | | | | 925,686 | |
| | | | |
University of Minnesota Series 2019A | | | 5.00 | | | | 4-1-2044 | | | | 2,000,000 | | | | 2,459,600 | |
| | | | |
University of Minnesota State Supported Biomedical Science Series 2011B | | | 5.00 | | | | 8-1-2036 | | | | 1,000,000 | | | | 1,067,450 | |
| | | | |
Woodbury MN Charter School Series A | | | 3.90 | | | | 12-1-2022 | | | | 220,000 | | | | 228,655 | |
| | | | |
Woodbury MN Charter School Series A | | | 5.00 | | | | 12-1-2027 | | | | 215,000 | | | | 226,320 | |
| | | | |
Woodbury MN Charter School Series A | | | 5.00 | | | | 12-1-2032 | | | | 220,000 | | | | 230,060 | |
| | | | |
| | | | | | | | | | | | | | | 37,264,390 | |
| | | | | | | | | | | | | | | | |
| | | | |
| GO Revenue: 14.45% | | | | | | | | | | | | |
| | | | |
Hastings MN Independent School District #200 CAB Series A (South Dakota Credit Program Insured) ¤ | | | 0.00 | | | | 2-1-2032 | | | | 1,305,000 | | | | 910,864 | |
| | | | |
Hastings MN Independent School District #200 CAB Series A (South Dakota Credit Program Insured) ¤ | | | 0.00 | | | | 2-1-2033 | | | | 1,145,000 | | | | 765,536 | |
| | | | |
Hennepin County MN Series 2016B | | | 5.00 | | | | 12-1-2029 | | | | 450,000 | | | | 555,107 | |
| | | | |
Hennepin County MN Series 2017C | | | 5.00 | | | | 12-1-2031 | | | | 2,000,000 | | | | 2,449,100 | |
| | | | |
Long Prairie MN Sewer Revenue Bond Series 2018A (Minnesota Credit Program Insured) | | | 5.00 | | | | 2-1-2025 | | | | 160,000 | | | | 185,925 | |
| | | | |
Long Prairie MN Sewer Revenue Bond Series 2018A (Minnesota Credit Program Insured) | | | 5.00 | | | | 2-1-2026 | | | | 185,000 | | | | 219,464 | |
12 | Wells Fargo Minnesota Tax-Free Fund
Portfolio of investments—June 30, 2019
| | | | | | | | | | | | | | | | |
| | | Interest
rate | | | Maturity
date | | | Principal | | | Value | |
| GO Revenue (continued) | | | | | | | | | | | | |
| | | | |
Minnesota Series 2018A | | | 5.00 | % | | | 8-1-2032 | | | $ | 2,700,000 | | | $ | 3,398,193 | |
| | | | |
Minnesota Various Purpose Bonds Series 2015A | | | 5.00 | | | | 8-1-2028 | | | | 3,400,000 | | | | 4,078,096 | |
| | | | |
Mounds View MN Independent School District #621 Series A (South Dakota Credit Program Insured) | | | 4.00 | | | | 2-1-2022 | | | | 530,000 | | | | 531,049 | |
| | | | |
Rosemount MN Independent School District #196 School Building Series 2016A (South Dakota Credit Program Insured) | | | 5.00 | | | | 2-1-2027 | | | | 1,500,000 | | | | 1,824,765 | |
| | | | |
Roseville MN Independent School District #623 School Building Series A (South Dakota Credit Program Insured) | | | 5.00 | | | | 2-1-2031 | | | | 2,090,000 | | | | 2,518,868 | |
| | | | |
Sartell MN Independent School District #748 St. Stephen Public Schools GO Series 2016A (South Dakota Credit Program Insured) | | | 5.00 | | | | 2-1-2027 | | | | 1,250,000 | | | | 1,486,038 | |
| | | | |
Shakopee MN Independent School District #720 Series 2015A (South Dakota Credit Program Insured) | | | 5.00 | | | | 2-1-2023 | | | | 1,000,000 | | | | 1,116,560 | |
| | | | |
St. Francis MN Independent School District #15 Series A (South Dakota Credit Program Insured) | | | 5.00 | | | | 2-1-2027 | | | | 485,000 | | | | 542,967 | |
| | | | |
St. Francis MN Independent School District #15 Series A (South Dakota Credit Program Insured) | | | 5.00 | | | | 2-1-2028 | | | | 220,000 | | | | 246,213 | |
| | | | |
St. Louis Park Independent School District #203 Series 2019A (South Dakota Credit Program Insured) %% | | | 5.00 | | | | 2-1-2028 | | | | 1,370,000 | | | | 1,729,968 | |
| | | | |
Willmar MN Rice Memorial Hospital Project Series 2012A | | | 5.00 | | | | 2-1-2026 | | | | 1,000,000 | | | | 1,053,760 | |
| | | | |
| | | | | | | | | | | | | | | 23,612,473 | |
| | | | | | | | | | | | | | | | |
| | | | |
| Health Revenue: 22.73% | | | | | | | | | | | | |
| | | | |
Center City MN Health Care Facilities Hazelden Betty Ford Foundation Project Series 2014 | | | 5.00 | | | | 11-1-2026 | | | | 750,000 | | | | 859,778 | |
| | | | |
Center City MN Health Care Facilities Hazelden Betty Ford Foundation Project Series 2014 | | | 5.00 | | | | 11-1-2027 | | | | 500,000 | | | | 571,390 | |
| | | | |
Center City MN Health Care Facilities Hazelden Betty Ford Foundation Project Series 2014 | | | 5.00 | | | | 11-1-2029 | | | | 300,000 | | | | 339,708 | |
| | | | |
Duluth MN EDA Health Care Facilities Essentia Health Series A | | | 5.00 | | | | 2-15-2048 | | | | 650,000 | | | | 750,042 | |
| | | | |
Duluth MN EDA Health Care Facilities Essentia Health Series A | | | 5.25 | | | | 2-15-2053 | | | | 2,500,000 | | | | 2,917,075 | |
| | | | |
Glencoe MN HCFR Glencoe Regional Health Services Project Series 2013 | | | 4.00 | | | | 4-1-2022 | | | | 735,000 | | | | 776,630 | |
| | | | |
Maple Grove MN HCFR Maple Grove Hospital Corporation | | | 5.00 | | | | 5-1-2030 | | | | 850,000 | | | | 1,017,034 | |
| | | | |
Maple Grove MN HCFR North Memorial Health Care Series 2015 | | | 5.00 | | | | 9-1-2023 | | | | 655,000 | | | | 740,903 | |
| | | | |
Maple Grove MN HCFR Series 2017 | | | 5.00 | | | | 5-1-2031 | | | | 500,000 | | | | 594,145 | |
| | | | |
Maple Grove MN HCFR Series 2017 | | | 5.00 | | | | 5-1-2032 | | | | 500,000 | | | | 591,255 | |
| | | | |
Minneapolis & St. Paul MN Housing & RDA Allina Health System Series 2017A | | | 5.00 | | | | 11-15-2029 | | | | 1,000,000 | | | | 1,223,350 | |
| | | | |
Minneapolis & St. Paul MN Housing & RDA Children’s Health Care Facilities Series A | | | 5.25 | | | | 8-15-2025 | | | | 1,000,000 | | | | 1,039,970 | |
| | | | |
Minneapolis & St. Paul MN Housing & RDA Children’s Health Care Facilities Series A | | | 5.25 | | | | 8-15-2035 | | | | 1,000,000 | | | | 1,039,850 | |
| | | | |
Minneapolis MN Health Care System Fairview Health Services Series 2015A | | | 5.00 | | | | 11-15-2033 | | | | 2,000,000 | | | | 2,320,140 | |
| | | | |
Minneapolis MN Health Care System Revenue Refunded Bond Fairview Health Services Series A | | | 5.00 | | | | 11-15-2049 | | | | 1,000,000 | | | | 1,171,830 | |
| | | | |
Minnesota Agricultural & Economic Development Board Health Care Essentia Health Series C1 (AGC Insured) | | | 4.00 | | | | 2-15-2020 | | | | 50,000 | | | | 50,846 | |
| | | | |
Minnesota Agricultural & Economic Development Board Health Care Essentia Health Series C1 (AGC Insured) | | | 5.00 | | | | 2-15-2030 | | | | 2,000,000 | | | | 2,037,080 | |
| | | | |
Plato MN Health Care Facilities Bond Glencoe Regional Health Services Project Series 2017 | | | 5.00 | | | | 4-1-2041 | | | | 550,000 | | | | 612,453 | |
| | | | |
Red Wing MN Senior Housing Deer Crest Project Series A | | | 5.00 | | | | 11-1-2032 | | | | 660,000 | | | | 682,090 | |
| | | | |
Red Wing MN Senior Housing Deer Crest Project Series A | | | 5.00 | | | | 11-1-2042 | | | | 560,000 | | | | 577,780 | |
| | | | |
Rochester MN Healthcare Facilities Mayo Clinic ø | | | 1.93 | | | | 11-15-2047 | | | | 4,700,000 | | | | 4,700,000 | |
| | | | |
Shakopee MN St. Francis Regional Medical Center Series 2014 | | | 5.00 | | | | 9-1-2027 | | | | 700,000 | | | | 800,975 | |
| | | | |
Shakopee MN St. Francis Regional Medical Center Series 2014 | | | 5.00 | | | | 9-1-2029 | | | | 725,000 | | | | 825,514 | |
Wells Fargo Minnesota Tax-Free Fund | 13
Portfolio of investments—June 30, 2019
| | | | | | | | | | | | | | | | |
| | | Interest
rate | | | Maturity
date | | | Principal | | | Value | |
| Health Revenue (continued) | | | | | | | | | | | | |
| | | | |
St. Cloud MN Health Care Revenue Bonds Series 2016A | | | 5.00 | % | | | 5-1-2030 | | | $ | 2,000,000 | | | $ | 2,381,440 | |
| | | | |
St. Cloud MN Health Care Revenue Bonds Series 2016A | | | 5.00 | | | | 5-1-2031 | | | | 2,000,000 | | | | 2,369,640 | |
| | | | |
St. Cloud MN Health Care Unrefunded Revenue Bond CentraCare Health | | | 5.13 | | | | 5-1-2030 | | | | 125,000 | | | | 128,650 | |
| | | | |
St. Louis Park MN Nicollett Health Services Series 2009 | | | 5.50 | | | | 7-1-2029 | | | | 1,000,000 | | | | 1,000,000 | |
| | | | |
St. Paul MN Housing & RDA Fairview Health Services Series 2017A | | | 5.00 | | | | 11-15-2034 | | | | 565,000 | | | | 677,395 | |
| | | | |
St. Paul MN Housing & RDA Health Care Facilities Refunding Bond Series 2015A | | | 5.00 | | | | 7-1-2025 | | | | 250,000 | | | | 297,563 | |
| | | | |
St. Paul MN Housing & RDA HealthEast Care Systems Project Series 2015A | | | 5.00 | | | | 11-15-2027 | | | | 1,000,000 | | | | 1,207,790 | |
| | | | |
St. Paul MN Housing & RDA HealthPartners Obligated Group Series 2015A | | | 5.00 | | | | 7-1-2031 | | | | 2,010,000 | | | | 2,308,003 | |
| | | | |
Winona MN Health Care Facilities Refunding Bond Series 2012 | | | 5.00 | | | | 7-1-2034 | | | | 500,000 | | | | 518,380 | |
| | | | |
| | | | | | | | | | | | | | | 37,128,699 | |
| | | | | | | | | | | | | | | | |
| | | | |
| Housing Revenue: 6.02% | | | | | | | | | | | | |
| | | | |
Dakota County MN Community Development Agency SFMR (GNMA/FNMA/FHLMC Insured) | | | 5.30 | | | | 12-1-2039 | | | | 9,502 | | | | 9,508 | |
| | | | |
Minneapolis MN Student Housing Riverton Community Housing Project Series 2014 | | | 5.00 | | | | 8-1-2032 | | | | 860,000 | | | | 913,372 | |
| | | | |
Minnesota HFA Series D (SIFMA Municipal Swap +0.43%) (GNMA/FNMA/FHLMC Insured)± | | | 2.33 | | | | 1-1-2045 | | | | 1,000,000 | | | | 994,700 | |
| | | | |
Minnesota Housing Finance Agency Residential Housing Series 2009E | | | 4.20 | | | | 7-1-2021 | | | | 670,000 | | | | 670,000 | |
| | | | |
Minnesota Housing Finance Agency Residential Housing Series 2012D (GNMA/FNMA/FHLMC Insured) | | | 4.00 | | | | 7-1-2040 | | | | 215,000 | | | | 219,816 | |
| | | | |
Minnesota Housing Finance Agency Series 2015A | | | 5.00 | | | | 8-1-2027 | | | | 1,665,000 | | | | 1,944,720 | |
| | | | |
Minnesota Housing Finance Agency State Appropriation Bonds Series 2015A | | | 5.00 | | | | 8-1-2032 | | | | 500,000 | | | | 576,620 | |
| | | | |
Oak Park Heights MN Boutwells Landing Project Series 2005 (FHLMC LIQ) ø | | | 1.93 | | | | 11-1-2035 | | | | 3,000,000 | | | | 3,000,000 | |
| | | | |
Rochester MN Multifamily Housing Series 2019B (United Fidelity Bank LOC) ø | | | 1.96 | | | | 5-1-2061 | | | | 1,500,000 | | | | 1,500,000 | |
| | | | |
| | | | | | | | | | | | | | | 9,828,736 | |
| | | | | | | | | | | | | | | | |
| | | | |
| Miscellaneous Revenue: 16.40% | | | | | | | | | | | | |
| | | | |
Anoka Hennepin MN Independent School District #11 Certificate of Participation Series 2014A | | | 5.00 | | | | 2-1-2034 | | | | 1,000,000 | | | | 1,136,970 | |
| | | | |
Center City MN Health Care Facilities Hazelden Betty Ford Foundation Project Series 2011 | | | 5.00 | | | | 11-1-2041 | | | | 3,000,000 | | | | 3,024,120 | |
| | | | |
Center City MN Heath Care Facilities Hazelden Betty Ford Foundation Project Series 2019 %% | | | 4.00 | | | | 11-1-2030 | | | | 250,000 | | | | 283,013 | |
| | | | |
Center City MN Heath Care Facilities Hazelden Betty Ford Foundation Project Series 2019 %% | | | 4.00 | | | | 11-1-2031 | | | | 250,000 | | | | 280,988 | |
| | | | |
Center City MN Heath Care Facilities Hazelden Betty Ford Foundation Project Series 2019 %% | | | 4.00 | | | | 11-1-2034 | | | | 300,000 | | | | 332,403 | |
| | | | |
Duluth MN Independent School District #709 Certificate of Participation Series 2019A | | | 4.00 | | | | 3-1-2026 | | | | 700,000 | | | | 751,457 | |
| | | | |
Duluth MN Independent School District #709 Certificate of Participation Series 2019B (South Dakota Credit Program Insured) | | | 5.00 | | | | 2-1-2026 | | | | 395,000 | | | | 470,465 | |
| | | | |
Duluth MN Independent School District #709 Certificate of Participation Series 2019B (South Dakota Credit Program Insured) | | | 5.00 | | | | 2-1-2028 | | | | 700,000 | | | | 862,176 | |
| | | | |
Goodhue County MN Education District #6051 Red Wing Certificate of Participation Series 2014A | | | 5.00 | | | | 2-1-2029 | | | | 750,000 | | | | 845,895 | |
| | | | |
Minneapolis & St. Paul MN Housing & RDA Children’s Hospital Clinics Series A (AGM Insured, U.S. Bank NA SPA) ø | | | 1.33 | | | | 8-15-2037 | | | | 1,000,000 | | | | 1,000,000 | |
| | | | |
Minneapolis MN Development Limited Tax Supported Common Bond Series 2A | | | 6.00 | | | | 12-1-2040 | | | | 1,000,000 | | | | 1,062,240 | |
| | | | |
Minnesota General Fund Appropriation Bonds Series 2012B | | | 5.00 | | | | 3-1-2027 | | | | 2,000,000 | | | | 2,184,100 | |
| | | | |
Minnesota General Fund Appropriation Bonds Series 2012B | | | 5.00 | | | | 3-1-2029 | | | | 2,000,000 | | | | 2,180,260 | |
| | | | |
Minnesota General Fund Appropriation Bonds Series 2014A | | | 5.00 | | | | 6-1-2033 | | | | 1,000,000 | | | | 1,127,610 | |
14 | Wells Fargo Minnesota Tax-Free Fund
Portfolio of investments—June 30, 2019
| | | | | | | | | | | | | | | | |
| | | Interest
rate | | | Maturity
date | | | Principal | | | Value | |
| Miscellaneous Revenue (continued) | | | | | | | | | | | | |
| | | | |
Minnesota Legislative Office Facility Project Certificate of Participation Series 2014 | | | 5.00 | % | | | 6-1-2023 | | | $ | 435,000 | | | $ | 495,239 | |
| | | | |
Minnetonka MN Independent School District #276 Certificate of Participation Series 2016F | | | 5.00 | | | | 2-1-2025 | | | | 205,000 | | | | 229,807 | |
| | | | |
Minnetonka MN Independent School District #276 Certificate of Participation Series 2018C | | | 5.75 | | | | 2-1-2042 | | | | 2,145,000 | | | | 2,542,554 | |
| | | | |
Northeastern Minnesota Metropolitan Intermediate School District #916 Certificate of Participation Series 2013A | | | 4.00 | | | | 2-1-2024 | | | | 1,100,000 | | | | 1,188,594 | |
| | | | |
Northeastern Minnesota Metropolitan Intermediate School District #916 Certificate of Participation Series 2015B | | | 5.00 | | | | 2-1-2034 | | | | 1,500,000 | | | | 1,725,705 | |
| | | | |
Plymouth MN Intermediate School District #287 Certificate of Participation Series 2009A | | | 5.00 | | | | 2-1-2024 | | | | 250,000 | | | | 250,663 | |
| | | | |
Plymouth MN Intermediate School District #287 Certificate of Participation Series 2016A | | | 4.00 | | | | 5-1-2026 | | | | 500,000 | | | | 559,810 | |
| | | | |
Plymouth MN Intermediate School District #287 Certificate of Participation Series 2016A | | | 4.00 | | | | 5-1-2027 | | | | 1,000,000 | | | | 1,112,810 | |
| | | | |
St. Cloud MN Independent School District #742 Certificate of Participation Series 2017A | | | 5.00 | | | | 2-1-2032 | | | | 500,000 | | | | 578,130 | |
| | | | |
St. Cloud MN Independent School District #742 Certificate of Participation Series 2017A | | | 5.00 | | | | 2-1-2034 | | | | 350,000 | | | | 402,665 | |
| | | | |
St. Paul MN Housing & RDA Charter School Nova Classical Academy Project Series 2011A | | | 6.63 | | | | 9-1-2042 | | | | 865,000 | | | | 960,591 | |
| | | | |
White Bear Lake MN Revenue Refunding Bond YMCA of Greater Twin Cities Project Series 2018 | | | 5.00 | | | | 6-1-2032 | | | | 1,000,000 | | | | 1,204,810 | |
| | | | |
| | | | | | | | | | | | | | | 26,793,075 | |
| | | | | | | | | | | | | | | | |
| | | | |
| Transportation Revenue: 1.11% | | | | | | | | | | | | |
| | | | |
St. Paul MN Housing & RDA Parking Enterprise Refunding Bond Series 2017A | | | 4.00 | | | | 8-1-2026 | | | | 525,000 | | | | 593,523 | |
| | | | |
St. Paul MN Housing & RDA Parking Enterprise Refunding Bond Series 2017A | | | 4.00 | | | | 8-1-2027 | | | | 545,000 | | | | 612,166 | |
| | | | |
St. Paul MN Housing & RDA Parking Enterprise Refunding Bond Series 2017A | | | 5.00 | | | | 8-1-2025 | | | | 500,000 | | | | 601,075 | |
| | | | |
| | | | | | | | | | | | | | | 1,806,764 | |
| | | | | | | | | | | | | | | | |
| | | | |
| Utilities Revenue: 11.36% | | | | | | | | | | | | |
| | | | |
Central Minnesota Municipal Power Agency Brookings Southeast Twin Cities Transmission Project Series 2012 | | | 5.00 | | | | 1-1-2042 | | | | 1,500,000 | | | | 1,610,595 | |
| | | | |
Hutchinson MN Public Utility Revenue Refunding Bond Series 2012A | | | 5.00 | | | | 12-1-2026 | | | | 700,000 | | | | 777,525 | |
| | | | |
Minnesota Municipal Power Agency Series A | | | 5.00 | | | | 10-1-2025 | | | | 2,335,000 | | | | 2,439,071 | |
| | | | |
Northern Minnesota Municipal Power Agency Series 2013A | | | 4.00 | | | | 1-1-2028 | | | | 450,000 | | | | 479,966 | |
| | | | |
Northern Minnesota Municipal Power Agency Series 2016 | | | 5.00 | | | | 1-1-2030 | | | | 520,000 | | | | 612,232 | |
| | | | |
Northern Minnesota Municipal Power Agency Series 2016 | | | 5.00 | | | | 1-1-2031 | | | | 350,000 | | | | 409,609 | |
| | | | |
Northern Minnesota Municipal Power Agency Series 2017 | | | 5.00 | | | | 1-1-2041 | | | | 400,000 | | | | 463,260 | |
| | | | |
Rochester MN Electric Utility Revenue Series 2013B | | | 5.00 | | | | 12-1-2025 | | | | 315,000 | | | | 362,373 | |
| | | | |
Rochester MN Electric Utility Revenue Series 2013B | | | 5.00 | | | | 12-1-2026 | | | | 250,000 | | | | 286,328 | |
| | | | |
Rochester MN Electric Utility Revenue Series 2017A | | | 5.00 | | | | 12-1-2037 | | | | 500,000 | | | | 591,470 | |
| | | | |
Southern Minnesota Municipal Power Agency CAB Series A (National Insured) ¤ ## | | | 0.00 | | | | 1-1-2020 | | | | 5,100,000 | | | | 5,062,005 | |
| | | | |
Western Minnesota Municipal Power Agency Series A | | | 5.00 | | | | 1-1-2027 | | | | 1,565,000 | | | | 1,745,711 | |
| | | | |
Western Minnesota Municipal Power Agency Series A | | | 5.00 | | | | 1-1-2030 | | | | 1,000,000 | | | | 1,112,220 | |
| | | | |
Western Minnesota Municipal Power Agency Series A | | | 5.00 | | | | 1-1-2031 | | | | 1,000,000 | | | | 1,191,670 | |
| | | | |
Western Minnesota Municipal Power Agency Series A | | | 5.00 | | | | 1-1-2032 | | | | 1,250,000 | | | | 1,417,988 | |
| | | | |
| | | | | | | | | | | | | | | 18,562,023 | |
| | | | | | | | | | | | | | | | |
| | | | |
| | | | | | | | | | | | | | | 159,309,045 | |
| | | | | | | | | | | | | | | | |
Wells Fargo Minnesota Tax-Free Fund | 15
Portfolio of investments—June 30, 2019
| | | | | | | | | | | | | | | | |
| | | Interest
rate | | | Maturity
date | | | Principal | | | Value | |
Virgin Islands: 0.31% | | | | | | | | | | | | | | | | |
| | | | |
| Tax Revenue: 0.31% | | | | | | | | | | | | |
| | | | |
Virgin Islands PFA Matching Fund Loan Notes Senior Lien Series B (AGM Insured) | | | 5.00 | % | | | 10-1-2025 | | | $ | 500,000 | | | $ | 504,520 | |
| | | | | | | | | | | | | | | | |
| |
Total Municipal Obligations (Cost $157,632,251) | | | | 163,325,671 | |
| | | | | | | | | | | | | | | | |
| | | | | | | | |
| Total investments in securities (Cost $157,632,251) | | | 99.98 | % | | | 163,325,671 | |
| | |
Other assets and liabilities, net | | | 0.02 | | | | 29,244 | |
| | | | | | | | |
| Total net assets | | | 100.00 | % | | $ | 163,354,915 | |
| | | | | | | | |
| 144A | The security may be resold in transactions exempt from registration, normally to qualified institutional buyers, pursuant to Rule 144A under the Securities Act of 1933. |
| ¤ | The security is issued in zero coupon form with no periodic interest payments. |
| %% | The security is purchased on a when-issued basis. |
| ø | Variable rate demand notes are subject to a demand feature which reduces the effective maturity. The maturity date shown represents the final maturity date of the security. The interest rate is determined and reset by the issuer daily, weekly, or monthly depending upon the terms of the security. The rate shown is the rate in effect at period end. |
| ± | Variable rate investment. The rate shown is the rate in effect at period end. |
| ## | All or a portion of this security is segregated for when-issued securities. |
Abbreviations:
| AGC | Assured Guaranty Corporation |
| AGM | Assured Guaranty Municipal |
| CAB | Capital appreciation bond |
| EDA | Economic Development Authority |
| FHLMC | Federal Home Loan Mortgage Corporation |
| FNMA | Federal National Mortgage Association |
| GNMA | Government National Mortgage Association |
| HCFR | Healthcare facilities revenue |
| HEFAR | Higher Education Facilities Authority Revenue |
| HFA | Housing Finance Authority |
| National | National Public Finance Guarantee Corporation |
| PFA | Public Finance Authority |
| RDA | Redevelopment Authority |
| SFMR | Single-family mortgage revenue |
| SIFMA | Securities Industry and Financial Markets Association |
| SPA | Standby purchase agreement |
16 | Wells Fargo Minnesota Tax-Free Fund
Statement of assets and liabilities—June 30, 2019
| | | | |
| | | | |
| |
Assets | | | | |
Investments in unaffiliated securities, at value (cost $157,632,251) | | $ | 163,325,671 | |
Cash | | | 366,623 | |
Receivable for investments sold | | | 210,076 | |
Receivable for Fund shares sold | | | 161,719 | |
Receivable for interest | | | 2,087,030 | |
Prepaid expenses and other assets | | | 119,024 | |
| | | | |
Total assets | | | 166,270,143 | |
| | | | |
| |
Liabilities | | | | |
Payable for investments purchased | | | 2,626,185 | |
Payable for Fund shares redeemed | | | 160,729 | |
Dividends payable | | | 51,467 | |
Management fee payable | | | 26,600 | |
Administration fees payable | | | 14,440 | |
Distribution fee payable | | | 3,290 | |
Trustees’ fees and expenses payable | | | 1,393 | |
Accrued expenses and other liabilities | | | 31,124 | |
| | | | |
Total liabilities | | | 2,915,228 | |
| | | | |
Total net assets | | $ | 163,354,915 | |
| | | | |
| |
Net assets consist of | | | | |
Paid-in capital | | $ | 156,863,626 | |
Total distributable earnings | | | 6,491,289 | |
| | | | |
Total net assets | | $ | 163,354,915 | |
| | | | |
| |
Computation of net asset value and offering price per share | | | | |
Net assets – Class A | | $ | 27,398,846 | |
Shares outstanding – Class A1 | | | 2,544,705 | |
Net asset value per share – Class A2 | | | $10.77 | |
Maximum offering price per share – Class A | | | $11.28 | |
Net assets – Class C | | $ | 5,254,447 | |
Shares outstanding – Class C1 | | | 488,052 | |
Net asset value per share – Class C | | | $10.77 | |
Net assets – Administrator Class | | $ | 95,071,549 | |
Shares outstanding – Administrator Class1 | | | 8,833,502 | |
Net asset value per share – Administrator Class | | | $10.76 | |
Net assets – Institutional Class | | $ | 35,630,073 | |
Shares outstanding – Institutional Class1 | | | 3,307,136 | |
Net asset value per share – Institutional Class | | | $10.77 | |
| 1 | The Fund has an unlimited number of authorized shares. |
| 2 | Maximum offering price is computed as 100/95.50 of net asset value. On investments of $50,000 or more, the offering price is reduced. |
The accompanying notes are an integral part of these financial statements.
Wells Fargo Minnesota Tax-Free Fund | 17
Statement of operations—year ended June 30, 2019
| | | | |
| | | | |
| |
Investment income | | | | |
Interest | | $ | 5,209,712 | |
| | | | |
| |
Expenses | | | | |
Management fee | | | 610,988 | |
Administration fees | | | | |
Class A | | | 44,330 | |
Class C | | | 10,280 | |
Administrator Class | | | 87,266 | |
Institutional Class | | | 25,080 | |
Shareholder servicing fees | | | | |
Class A | | | 69,265 | |
Class C | | | 16,062 | |
Administrator Class | | | 218,165 | |
Distribution fee | | | | |
Class C | | | 48,187 | |
Custody and accounting fees | | | 5,518 | |
Professional fees | | | 55,204 | |
Registration fees | | | 82,131 | |
Shareholder report expenses | | | 23,124 | |
Trustees’ fees and expenses | | | 21,275 | |
Other fees and expenses | | | 10,491 | |
| | | | |
Total expenses | | | 1,327,366 | |
Less: Fee waivers and/or expense reimbursements | | | (302,492 | ) |
| | | | |
Net expenses | | | 1,024,874 | |
| | | | |
Net investment income | | | 4,184,838 | |
| | | | |
| |
Realized and unrealized gains (losses) on investments | | | | |
Net realized gains on investments | | | 42,540 | |
Net change in unrealized gains (losses) on investments | | | 3,698,165 | |
| | | | |
Net realized and unrealized gains (losses) on investments | | | 3,740,705 | |
| | | | |
Net increase in net assets resulting from operations | | $ | 7,925,543 | |
| | | | |
The accompanying notes are an integral part of these financial statements.
18 | Wells Fargo Minnesota Tax-Free Fund
Statement of changes in net assets
| | | | | | | | | | | | | | | | |
| | | Year ended
June 30, 2019 | | | Year ended
June 30, 20181 | |
| | | |
Operations | | | | | | | | | | | | |
Net investment income | | | | | | $ | 4,184,838 | | | | | | | $ | 4,586,522 | |
Net realized gains on investments | | | | | | | 42,540 | | | | | | | | 195,726 | |
Net change in unrealized gains (losses) on investments | | | | | | | 3,698,165 | | | | | | | | (2,825,310 | ) |
| | | | |
Net increase in net assets resulting from operations | | | | | | | 7,925,543 | | | | | | | | 1,956,938 | |
| | | | |
| | | | |
Distributions to shareholders from net investment income and net realized gains | | | | | | | | | | | | | | | | |
Class A | | | | | | | (711,001 | ) | | | | | | | (872,744 | ) |
Class C | | | | | | | (117,484 | ) | | | | | | | (162,373 | ) |
Administrator Class | | | | | | | (2,451,244 | ) | | | | | | | (2,841,350 | ) |
Institutional Class | | | | | | | (905,109 | ) | | | | | | | (793,549 | ) |
| | | | |
Total distributions to shareholders | | | | | | | (4,184,838 | ) | | | | | | | (4,670,016 | ) |
| | | | |
| | | | |
Capital share transactions | | | Shares | | | | | | | | Shares | | | | | |
Proceeds from shares sold | | | | | | | | | | | | | | | | |
Class A | | | 347,091 | | | | 3,649,133 | | | | 171,297 | | | | 1,824,591 | |
Class C | | | 7,412 | | | | 78,298 | | | | 30,242 | | | | 320,610 | |
Administrator Class | | | 3,125,314 | | | | 32,846,044 | | | | 1,645,104 | | | | 17,459,103 | |
Institutional Class | | | 1,422,688 | | | | 14,957,048 | | | | 1,450,392 | | | | 15,399,618 | |
| | | | |
| | | | | | | 51,530,523 | | | | | | | | 35,003,922 | |
| | | | |
Reinvestment of distributions | | | | | | | | | | | | | | | | |
Class A | | | 67,230 | | | | 708,091 | | | | 80,361 | | | | 852,641 | |
Class C | | | 11,169 | | | | 117,470 | | | | 15,294 | | | | 162,268 | |
Administrator Class | | | 163,889 | | | | 1,727,163 | | | | 181,284 | | | | 1,922,161 | |
Institutional Class | | | 85,728 | | | | 904,258 | | | | 74,672 | | | | 792,417 | |
| | | | |
| | | | | | | 3,456,982 | | | | | | | | 3,729,487 | |
| | | | |
Payment for shares redeemed | | | | | | | | | | | | | | | | |
Class A | | | (680,950 | ) | | | (7,140,320 | ) | | | (689,876 | ) | | | (7,312,506 | ) |
Class C | | | (233,266 | ) | | | (2,454,511 | ) | | | (234,385 | ) | | | (2,490,668 | ) |
Administrator Class | | | (2,569,156 | ) | | | (26,934,068 | ) | | | (3,535,508 | ) | | | (37,420,099 | ) |
Institutional Class | | | (1,018,861 | ) | | | (10,683,211 | ) | | | (838,851 | ) | | | (8,894,018 | ) |
| | | | |
| | | | | | | (47,212,110 | ) | | | | | | | (56,117,291 | ) |
| | | | |
Net increase (decrease) in net assets resulting from capital share transactions | | | | | | | 7,775,395 | | | | | | | | (17,383,882 | ) |
| | | | |
Total increase (decrease) in net assets | | | | | | | 11,516,100 | | | | | | | | (20,096,960 | ) |
| | | | |
| | |
Net assets | | | | | | | | |
Beginning of period | | | | | | | 151,838,815 | | | | | | | | 171,935,775 | |
| | | | |
End of period | | | | | | $ | 163,354,915 | | | | | | | $ | 151,838,815 | |
| | | | |
| 1 | Effective for all filings after November 4, 2018, the SEC prospectively eliminated the requirement to parenthetically disclose undistributed net investment income at the end of the period and permitted the aggregation of distributions, with the exception of tax basis returns of capital. Undistributed net investment income at June 30, 2018 was $830,755. The disaggregated distributions information for the year ended June 30, 2018 is included in Note 7,Distributions to Shareholders, in the notes to the financial statements. |
The accompanying notes are an integral part of these financial statements.
Wells Fargo Minnesota Tax-Free Fund | 19
Financial highlights
(For a share outstanding throughout each period)
| | | | | | | | | | | | | | | | | | | | |
| | | Year ended June 30 | |
| CLASS A | | 2019 | | | 2018 | | | 2017 | | | 2016 | | | 2015 | |
Net asset value, beginning of period | | | $10.51 | | | | $10.68 | | | | $11.07 | | | | $10.79 | | | | $10.86 | |
Net investment income | | | 0.27 | 1 | | | 0.28 | 1 | | | 0.28 | 1 | | | 0.33 | | | | 0.33 | |
Net realized and unrealized gains (losses) on investments | | | 0.26 | | | | (0.16 | ) | | | (0.34 | ) | | | 0.28 | | | | (0.04 | ) |
| | | | | | | | | | | | | | | | | | | | |
Total from investment operations | | | 0.53 | | | | 0.12 | | | | (0.06 | ) | | | 0.61 | | | | 0.29 | |
Distributions to shareholders from | | | | | | | | | | | | | | | | | | | | |
Net investment income | | | (0.27 | ) | | | (0.28 | ) | | | (0.28 | ) | | | (0.33 | ) | | | (0.33 | ) |
Net realized gains | | | 0.00 | | | | (0.01 | ) | | | (0.05 | ) | | | (0.00 | )2 | | | (0.03 | ) |
| | | | | | | | | | | | | | | | | | | | |
Total distributions to shareholders | | | (0.27 | ) | | | (0.29 | ) | | | (0.33 | ) | | | (0.33 | ) | | | (0.36 | ) |
Net asset value, end of period | | | $10.77 | | | | $10.51 | | | | $10.68 | | | | $11.07 | | | | $10.79 | |
Total return3 | | | 5.13 | % | | | 1.10 | % | | | (0.53 | )% | | | 5.74 | % | | | 2.72 | % |
Ratios to average net assets (annualized) | | | | | | | | | | | | | | | | | | | | |
Gross expenses | | | 0.94 | % | | | 0.85 | % | | | 0.91 | % | | | 0.89 | % | | | 0.89 | % |
Net expenses | | | 0.85 | % | | | 0.84 | % | | | 0.85 | % | | | 0.85 | % | | | 0.85 | % |
Net investment income | | | 2.57 | % | | | 2.64 | % | | | 2.63 | % | | | 2.99 | % | | | 3.03 | % |
Supplemental data | | | | | | | | | | | | | | | | | | | | |
Portfolio turnover rate | | | 18 | % | | | 15 | % | | | 22 | % | | | 16 | % | | | 20 | % |
Net assets, end of period (000s omitted) | | | $27,399 | | | | $29,554 | | | | $34,720 | | | | $45,437 | | | | $45,437 | |
| 1 | Calculated based upon average shares outstanding |
| 2 | Amount is less than $0.005. |
| 3 | Total return calculations do not include any sales charges. |
The accompanying notes are an integral part of these financial statements.
20 | Wells Fargo Minnesota Tax-Free Fund
Financial highlights
(For a share outstanding throughout each period)
| | | | | | | | | | | | | | | | | | | | |
| | | Year ended June 30 | |
| CLASS C | | 2019 | | | 2018 | | | 2017 | | | 2016 | | | 2015 | |
Net asset value, beginning of period | | | $10.51 | | | | $10.68 | | | | $11.07 | | | | $10.79 | | | | $10.86 | |
Net investment income | | | 0.19 | 1 | | | 0.20 | | | | 0.20 | | | | 0.24 | | | | 0.25 | |
Net realized and unrealized gains (losses) on investments | | | 0.26 | | | | (0.16 | ) | | | (0.34 | ) | | | 0.28 | | | | (0.04 | ) |
| | | | | | | | | | | | | | | | | | | | |
Total from investment operations | | | 0.45 | | | | 0.04 | | | | (0.14 | ) | | | 0.52 | | | | 0.21 | |
Distributions to shareholders from | | | | | | | | | | | | | | | | | | | | |
Net investment income | | | (0.19 | ) | | | (0.20 | ) | | | (0.20 | ) | | | (0.24 | ) | | | (0.25 | ) |
Net realized gains | | | 0.00 | | | | (0.01 | ) | | | (0.05 | ) | | | (0.00 | )1 | | | (0.03 | ) |
| | | | | | | | | | | | | | | | | | | | |
Total distributions to shareholders | | | (0.19 | ) | | | (0.21 | ) | | | (0.25 | ) | | | (0.24 | ) | | | (0.28 | ) |
Net asset value, end of period | | | $10.77 | | | | $10.51 | | | | $10.68 | | | | $11.07 | | | | $10.79 | |
Total return2 | | | 4.35 | % | | | 0.34 | % | | | (1.27 | )% | | | 4.95 | % | | | 1.96 | % |
Ratios to average net assets (annualized) | | | | | | | | | | | | | | | | | | | | |
Gross expenses | | | 1.69 | % | | | 1.59 | % | | | 1.65 | % | | | 1.64 | % | | | 1.64 | % |
Net expenses | | | 1.60 | % | | | 1.59 | % | | | 1.60 | % | | | 1.60 | % | | | 1.60 | % |
Net investment income | | | 1.83 | % | | | 1.89 | % | | | 1.88 | % | | | 2.24 | % | | | 2.28 | % |
Supplemental data | | | | | | | | | | | | | | | | | | | | |
Portfolio turnover rate | | | 18 | % | | | 15 | % | | | 22 | % | | | 16 | % | | | 20 | % |
Net assets, end of period (000s omitted) | | | $5,254 | | | | $7,387 | | | | $9,525 | | | | $10,358 | | | | $10,061 | |
| 1 | Calculated based upon average shares outstanding |
| 2 | Total return calculations do not include any sales charges. |
The accompanying notes are an integral part of these financial statements.
Wells Fargo Minnesota Tax-Free Fund | 21
Financial highlights
(For a share outstanding throughout each period)
| | | | | | | | | | | | | | | | | | | | |
| | | Year ended June 30 | |
| ADMINISTRATOR CLASS | | 2019 | | | 2018 | | | 2017 | | | 2016 | | | 2015 | |
Net asset value, beginning of period | | | $10.51 | | | | $10.68 | | | | $11.07 | | | | $10.78 | | | | $10.86 | |
Net investment income | | | 0.30 | 1 | | | 0.31 | 1 | | | 0.31 | 1 | | | 0.35 | | | | 0.36 | |
Net realized and unrealized gains (losses) on investments | | | 0.25 | | | | (0.16 | ) | | | (0.34 | ) | | | 0.29 | | | | (0.05 | ) |
| | | | | | | | | | | | | | | | | | | | |
Total from investment operations | | | 0.55 | | | | 0.15 | | | | (0.03 | ) | | | 0.64 | | | | 0.31 | |
Distributions to shareholders from | | | | | | | | | | | | | | | | | | | | |
Net investment income | | | (0.30 | ) | | | (0.31 | ) | | | (0.31 | ) | | | (0.35 | ) | | | (0.36 | ) |
Net realized gains | | | 0.00 | | | | (0.01 | ) | | | (0.05 | ) | | | (0.00 | )2 | | | (0.03 | ) |
| | | | | | | | | | | | | | | | | | | | |
Total distributions to shareholders | | | (0.30 | ) | | | (0.32 | ) | | | (0.36 | ) | | | (0.35 | ) | | | (0.39 | ) |
Net asset value, end of period | | | $10.76 | | | | $10.51 | | | | $10.68 | | | | $11.07 | | | | $10.78 | |
Total return | | | 5.29 | % | | | 1.34 | % | | | (0.28 | )% | | | 6.10 | % | | | 2.88 | % |
Ratios to average net assets (annualized) | | | | | | | | | | | | | | | | | | | | |
Gross expenses | | | 0.88 | % | | | 0.78 | % | | | 0.84 | % | | | 0.83 | % | | | 0.83 | % |
Net expenses | | | 0.60 | % | | | 0.60 | % | | | 0.60 | % | | | 0.60 | % | | | 0.60 | % |
Net investment income | | | 2.81 | % | | | 2.89 | % | | | 2.87 | % | | | 3.24 | % | | | 3.28 | % |
Supplemental data | | | | | | | | | | | | | | | | | | | | |
Portfolio turnover rate | | | 18 | % | | | 15 | % | | | 22 | % | | | 16 | % | | | 20 | % |
Net assets, end of period (000s omitted) | | | $95,072 | | | | $85,259 | | | | $104,906 | | | | $124,485 | | | | $111,475 | |
| 1 | Calculated based upon average shares outstanding |
| 2 | Amount is less than $0.005. |
The accompanying notes are an integral part of these financial statements.
22 | Wells Fargo Minnesota Tax-Free Fund
Financial highlights
(For a share outstanding throughout each period)
| | | | | | | | | | | | |
| | | Year ended June 30 | |
| INSTITUTIONAL CLASS | | 2019 | | | 2018 | | | 20171 | |
Net asset value, beginning of period | | | $10.52 | | | | $10.69 | | | | $10.88 | |
Net investment income | | | 0.30 | | | | 0.32 | | | | 0.21 | |
Net realized and unrealized gains (losses) on investments | | | 0.25 | | | | (0.16 | ) | | | (0.14 | ) |
| | | | | | | | | | | | |
Total from investment operations | | | 0.55 | | | | 0.16 | | | | 0.07 | |
Distributions to shareholders from | | | | | | | | | | | | |
Net investment income | | | (0.30 | ) | | | (0.32 | ) | | | (0.21 | ) |
Net realized gains | | | 0.00 | | | | (0.01 | ) | | | (0.05 | ) |
| | | | | | | | | | | | |
Total distributions to shareholders | | | (0.30 | ) | | | (0.33 | ) | | | (0.26 | ) |
Net asset value, end of period | | | $10.77 | | | | $10.52 | | | | $10.69 | |
Total return2 | | | 5.37 | % | | | 1.43 | % | | | 0.62 | % |
Ratios to average net assets (annualized) | | | | | | | | | | | | |
Gross expenses | | | 0.61 | % | | | 0.52 | % | | | 0.52 | % |
Net expenses | | | 0.52 | % | | | 0.52 | % | | | 0.51 | % |
Net investment income | | | 2.89 | % | | | 2.98 | % | | | 2.91 | % |
Supplemental data | | | | | | | | | | | | |
Portfolio turnover rate | | | 18 | % | | | 15 | % | | | 22 | % |
Net assets, end of period (000s omitted) | | | $35,630 | | | | $29,639 | | | | $22,785 | |
| 1 | For the period from October 31, 2016 (commencement of class operations) to June 30, 2017 |
| 2 | Returns for periods of less than one year are not annualized. |
The accompanying notes are an integral part of these financial statements.
Wells Fargo Minnesota Tax-Free Fund | 23
Notes to financial statements
1. ORGANIZATION
Wells Fargo Funds Trust (the “Trust”), a Delaware statutory trust organized on March 10, 1999, is an open-end management investment company registered under the Investment Company Act of 1940, as amended (the “1940 Act”). As an investment company, the Trust follows the accounting and reporting guidance in Financial Accounting Standards Board (“FASB”) Accounting Standards Codification Topic 946, Financial Services – Investment Companies. These financial statements report on the Wells Fargo Minnesota Tax-Free Fund (the “Fund”) which is a diversified series of the Trust.
2. SIGNIFICANT ACCOUNTING POLICIES
The following significant accounting policies, which are consistently followed in the preparation of the financial statements of the Fund, are in conformity with U.S. generally accepted accounting principles which require management to make estimates and assumptions that affect the reported amounts of assets and liabilities, disclosure of contingent assets and liabilities at the date of the financial statements, and the reported amounts of revenues and expenses during the reporting period. Actual results could differ from those estimates.
Securities valuation
All investments are valued each business day as of the close of regular trading on the New York Stock Exchange (generally 4 p.m. Eastern Time), although the Fund may deviate from this calculation time under unusual or unexpected circumstances.
Debt securities are valued at the evaluated bid price provided by an independent pricing service (e.g. taking into account various factors, including yields, maturities, or credit ratings) or, if a reliable price is not available, the quoted bid price from an independent broker-dealer.
Investments which are not valued using any of the methods discussed above are valued at their fair value, as determined in good faith by the Board of Trustees of the Fund. The Board of Trustees has established a Valuation Committee comprised of the Trustees and has delegated to it the authority to take any actions regarding the valuation of portfolio securities that the Valuation Committee deems necessary or appropriate, including determining the fair value of portfolio securities, unless the determination has been delegated to the Wells Fargo Asset Management Pricing Committee at Wells Fargo Funds Management, LLC (“Funds Management”). The Board of Trustees retains the authority to make or ratify any valuation decisions or approve any changes to the Valuation Procedures as it deems appropriate. On a quarterly basis, the Board of Trustees receives reports on any valuation actions taken by the Valuation Committee or the Wells Fargo Asset Management Pricing Committee which may include items for ratification.
When-issued transactions
The Fund may purchase securities on a forward commitment or when-issued basis. The Fund records a when-issued transaction on the trade date and will segregate assets in an amount at least equal in value to the Fund’s commitment to purchase when-issued securities. Securities purchased on a when-issued basis are marked-to-market daily and the Fund begins earning interest on the settlement date. Losses may arise due to changes in the market value of the underlying securities or if the counterparty does not perform under the contract.
Security transactions and income recognition
Securities transactions are recorded on a trade date basis. Realized gains or losses are recorded on the basis of identified cost.
Interest income is accrued daily and bond discounts are accreted and premiums are amortized daily. To the extent debt obligations are placed on non-accrual status, any related interest income may be reduced by writing off interest receivables when the collection of all or a portion of interest has been determined to be doubtful based on consistently applied procedures and the fair value has decreased. If the issuer subsequently resumes interest payments or when the collectability of interest is reasonably assured, the debt obligation is removed from non-accrual status.
Distributions to shareholders
Distributions to shareholders from net investment income are declared daily and paid monthly. Distributions from net realized gains, if any, are recorded on the ex-dividend date and paid at least annually. Such distributions are determined in accordance with income tax regulations and may differ from U.S. generally accepted accounting principles. Dividend sources are estimated at the time of declaration. The tax character of distributions is determined as of the Fund’s fiscal year end. Therefore, a portion of the Fund’s distributions made prior to the Fund’s fiscal year end may be categorized as a tax return of capital at year end.
Federal and other taxes
The Fund intends to continue to qualify as a regulated investment company by distributing substantially all of its investment company taxable and tax-exempt income and any net realized capital gains (after reduction for capital loss carryforwards) sufficient to relieve it from all, or substantially all, federal income taxes. Accordingly, no provision for federal income taxes was required.
24 | Wells Fargo Minnesota Tax-Free Fund
Notes to financial statements
The Fund’s income and federal excise tax returns and all financial records supporting those returns for the prior three fiscal years are subject to examination by the federal and Delaware revenue authorities. Management has analyzed the Fund’s tax positions taken on federal, state, and foreign tax returns for all open tax years and does not believe that there are any uncertain tax positions that require recognition of a tax liability.
As of June 30, 2019, the aggregate cost of all investments for federal income tax purposes was $157,632,249 and the unrealized gains (losses) consisted of:
| | | | |
| |
Gross unrealized gains | | $ | 6,088,985 | |
| |
Gross unrealized losses | | | (395,563 | ) |
| |
Net unrealized gains | | $ | 5,693,422 | |
As of June 30, 2019, the Fund had capital loss carryforwards which consist of $32,886 in short-term capital losses.
Class allocations
The separate classes of shares offered by the Fund differ principally in applicable sales charges, distribution, shareholder servicing, and administration fees. Class specific expenses are charged directly to that share class. Investment income, common fund-level expenses, and realized and unrealized gains (losses) on investments are allocated daily to each class of shares based on the relative proportion of net assets of each class.
3. FAIR VALUATION MEASUREMENTS
Fair value measurements of investments are determined within a framework that has established a fair value hierarchy based upon the various data inputs utilized in determining the value of the Fund’s investments. The three-level hierarchy gives the highest priority to unadjusted quoted prices in active markets for identical assets or liabilities (Level 1) and the lowest priority to unobservable inputs (Level 3). The Fund’s investments are classified within the fair value hierarchy based on the lowest level of input that is significant to the fair value measurement. The inputs are summarized into three broad levels as follows:
| ∎ | | Level 1 – quoted prices in active markets for identical securities |
| ∎ | | Level 2 – other significant observable inputs (including quoted prices for similar securities, interest rates, prepayment speeds, credit risk, etc.) |
| ∎ | | Level 3 – significant unobservable inputs (including the Fund’s own assumptions in determining the fair value of investments) |
The inputs or methodologies used for valuing investments in securities are not necessarily an indication of the risk associated with investing in those securities.
The following is a summary of the inputs used in valuing the Fund’s assets and liabilities as of June 30, 2019:
| | | | | | | | | | | | | | | | |
| | | | |
| | | Quoted prices
(Level 1) | | | Other significant
observable inputs
(Level 2) | | | Significant
unobservable inputs (Level 3) | | | Total | |
| | | | |
Assets | | | | | | | | | | | | | | | | |
Investments in: | | | | | | | | | | | | | | | | |
| | | | |
Municipal obligations | | $ | 0 | | | $ | 163,325,671 | | | $ | 0 | | | $ | 163,325,671 | |
Additional sector, industry or geographic detail is included in the Portfolio of Investments.
At June 30, 2019, the Fund did not have any transfers into/out of Level 3.
4. TRANSACTIONS WITH AFFILIATES
Management fee
Funds Management, an indirect wholly owned subsidiary of Wells Fargo & Company (“Wells Fargo”), is the manager of the Fund and provides advisory and fund-level administrative services under an investment management agreement. Under the investment management agreement, Funds Management is responsible for, among other services, implementing the investment objectives and strategies of the Fund, supervising the subadviser and providing fund-level administrative services in connection with the
Wells Fargo Minnesota Tax-Free Fund | 25
Notes to financial statements
Fund’s operations. As compensation for its services under the investment management agreement, Funds Management is entitled to receive a management fee at the following annual rate based on the Fund’s average daily net assets:
| | | | |
| |
| Average daily net assets | | Management fee | |
| |
First $500 million | | | 0.400 | % |
| |
Next $500 million | | | 0.375 | |
| |
Next $2 billion | | | 0.350 | |
| |
Next $2 billion | | | 0.325 | |
| |
Next $5 billion | | | 0.290 | |
| |
Over $10 billion | | | 0.280 | |
For the year ended June 30, 2019, the management fee was equivalent to an annual rate of 0.40% of the Fund’s average daily net assets.
Funds Management has retained the services of a subadviser to provide daily portfolio management to the Fund. The fee for subadvisory services is borne by Funds Management. Wells Capital Management Incorporated, an affiliate of Funds Management and an indirect wholly owned subsidiary of Wells Fargo, is the subadviser to the Fund and is entitled to receive a fee from Funds Management at an annual rate starting at 0.20% and declining to 0.10% as the average daily net assets of the Fund increase.
Administration fees
Under a class-level administration agreement, Funds Management provides class-level administrative services to the Fund, which includes paying fees and expenses for services provided by the transfer agent, sub-transfer agents, omnibus account servicers and record-keepers. As compensation for its services under the class-level administration agreement, Funds Management receives an annual fee which is calculated based on the average daily net assets of each class as follows:
| | |
| |
| | | Class-level
administration fee |
| |
Class A, Class C | | 0.16% |
| |
Administrator Class | | 0.10 |
| |
Institutional Class | | 0.08 |
Funds Management has contractually waived and/or reimbursed management and administration fees to the extent necessary to maintain certain net operating expense ratios for the Fund. When each class of the Fund has exceeded its expense cap, Funds Management has waived fees and/or reimbursed expenses from fund-level expenses on a proportionate basis and then from class specific expenses. When only certain classes exceed their expense caps, waivers and/or reimbursements are applied against class specific expenses before fund-level expenses. Funds Management has committed through October 31, 2019 to waive fees and/or reimburse expenses to the extent necessary to cap the Fund’s expenses at 0.85% for Class A shares, 1.60% for Class C shares, 0.60% for Administrator Class shares, and 0.52% for Institutional Class shares. Prior to or after the commitment expiration date, the cap may be increased or the commitment to maintain the cap may be terminated only with the approval of the Board of Trustees.
Distribution fee
The Trust has adopted a distribution plan for Class C of the Fund pursuant to Rule 12b-1 under the 1940 Act. A distribution fee is charged to Class C shares and paid to Wells Fargo Funds Distributor, LLC (“Funds Distributor”), the principal underwriter, at an annual rate of 0.75% of the average daily net assets of Class C shares.
In addition, Funds Distributor is entitled to receive the front-end sales charge from the purchase of Class A shares and a contingent deferred sales charge on the redemption of certain Class A shares. Funds Distributor is also entitled to receive the contingent deferred sales charges from redemptions of Class C shares. For the year ended June 30, 2019, Funds Distributor received $1,565 from the sale of Class A shares. No contingent deferred sales charges were incurred by Class A and Class C shares for the year ended June 30, 2019.
Shareholder servicing fees
The Trust has entered into contracts with one or more shareholder servicing agents, whereby Class A, Class C, and Administrator Class of the Fund are charged a fee at an annual rate of 0.25% of the average daily net assets of each respective class. A portion of these total shareholder servicing fees were paid to affiliates of Wells Fargo.
26 | Wells Fargo Minnesota Tax-Free Fund
Notes to financial statements
Interfund transactions
The Fund may purchase or sell portfolio investment securities to certain other Wells Fargo affiliates pursuant to Rule 17a-7 under the 1940 Act and under procedures adopted by the Board of Trustees. The procedures have been designed to ensure that these interfund transactions, which do not incur broker commissions, are effected at current market prices. Pursuant to these procedures, the Fund had $8,600,000 and $12,825,000 in interfund purchases and sales, respectively, during the year ended June 30, 2019.
5. INVESTMENT PORTFOLIO TRANSACTIONS
Purchases and sales of investments, excluding U.S. government obligations (if any) and short-term securities, for the year ended June 30, 2019 were $27,897,219 and $26,691,036, respectively.
6. BANK BORROWINGS
The Trust (excluding the money market funds), Wells Fargo Master Trust and Wells Fargo Variable Trust are parties to a $280,000,000 revolving credit agreement whereby the Fund is permitted to use bank borrowings for temporary or emergency purposes, such as to fund shareholder redemption requests. Interest under the credit agreement is charged to the Fund based on a borrowing rate equal to the higher of the Federal Funds rate in effect on that day plus 1.25% or the overnight LIBOR rate in effect on that day plus 1.25%. In addition, an annual commitment fee equal to 0.25% of the unused balance is allocated to each participating fund.
For the year ended June 30, 2019, there were no borrowings by the Fund under the agreement.
7. DISTRIBUTIONS TO SHAREHOLDERS
The tax character of distributions paid during the years ended June 30, 2019 and June 30, 2018 were as follows:
| | | | | | | | |
| | | Year ended June 30 | |
| | |
| | | 2019 | | | 2018 | |
| | |
Tax-exempt income | | $ | 4,184,838 | | | $ | 4,586,603 | |
| | |
Long-term capital gain | | | 0 | | | | 83,413 | |
As of June 30, 2019, the components of distributable earnings on a tax basis were as follows:
| | | | |
Undistributed tax-exempt income | | Unrealized gains | | Capital loss carryforward |
| | |
| $882,220 | | $5,693,422 | | $(32,886) |
Effective for all filings after November 4, 2018, the Securities and Exchange Commission eliminated the requirement to separately state the components of distributions to shareholders under U.S. generally accepted accounting principles. The amounts of distributions to shareholders for the year ended June 30, 2018 were as follows:
| | | | | | | | |
| | |
| | | Net investment income | | | Net realized gains | |
| | |
Class A | | | $ 855,881 | | | $ | 16,863 | |
| | |
Class C | | | 158,147 | | | | 4,226 | |
| | |
Administrator Class | | | 2,792,428 | | | | 48,922 | |
| | |
Institutional Class | | | 780,067 | | | | 13,482 | |
8. CONCENTRATION RISK
The Fund invests a substantial portion of its assets in issuers of municipal debt securities located in a single state or territory of the U.S. Therefore, it may be more affected by economic and political developments in that state or region than would be a comparable general tax-exempt fund.
9. INDEMNIFICATION
Under the Trust’s organizational documents, the officers and Trustees have been granted certain indemnification rights against certain liabilities that may arise out of performance of their duties to the Trust. Additionally, in the normal course of business, the
Wells Fargo Minnesota Tax-Free Fund | 27
Notes to financial statements
Trust may enter into contracts with service providers that contain a variety of indemnification clauses. The Trust’s maximum exposure under these arrangements is dependent on future claims that may be made against the Fund and, therefore, cannot be estimated.
10. NEW ACCOUNTING PRONOUNCEMENTS
In August 2018, FASB issued Accounting Standards Update (“ASU”) No. 2018-13, Fair Value Measurement (Topic 820)Disclosure Framework—Changes to the Disclosure Requirements for Fair Value Measurement. ASU 2018-13 updates the disclosure requirements for fair value measurements by modifying or removing certain disclosures and adding certain new disclosures. The amendments are effective for fiscal years, and interim periods within those fiscal years, beginning after December 15, 2019. Early adoption is permitted. Management has adopted the removal and modification of disclosures early, as permitted, and will adopt the additional new disclosures at the effective date.
In March 2017, FASB issued ASU No. 2017-08,Premium Amortization on Purchased Callable Debt Securities. ASU 2017-08 shortens the amortization period for certain callable debt securities held at a premium and requires the premium to be amortized to the earliest call date. The amendments do not require an accounting change for securities held at a discount and discounts will continue to be accreted to the maturity of the security. ASU 2017-08 is effective for fiscal years beginning after December 15, 2018 and for interim periods within those fiscal years. During the current reporting period, management of the Fund adopted the change in accounting policy which did not have a material impact to the Fund’s financial statements.
28 | Wells Fargo Minnesota Tax-Free Fund
Report of independent registered public accounting firm
TO THE SHAREHOLDERS OF THE FUND AND BOARD OF TRUSTEES OF WELLS FARGO FUNDS TRUST:
Opinion on the Financial Statements
We have audited the accompanying statement of assets and liabilities of Wells Fargo Minnesota Tax-Free Fund (the Fund), one of the funds constituting Wells Fargo Funds Trust, including the portfolio of investments, as of June 30, 2019, the related statement of operations for the year then ended, the statements of changes in net assets for each of the years in the two year period then ended, and the related notes (collectively, the financial statements) and the financial highlights for each of the years or periods in the five year period then ended. In our opinion, the financial statements and financial highlights present fairly, in all material respects, the financial position of the Fund as of June 30, 2019, the results of its operations for the year then ended, the changes in its net assets for each of the years in the two year period then ended, and the financial highlights for each of the years or periods in the five year period then ended, in conformity with U.S. generally accepted accounting principles.
Basis for Opinion
These financial statements and financial highlights are the responsibility of the Fund’s management. Our responsibility is to express an opinion on these financial statements and financial highlights based on our audits. We are a public accounting firm registered with the Public Company Accounting Oversight Board (United States) (PCAOB) and are required to be independent with respect to the Fund in accordance with the U.S. federal securities laws and the applicable rules and regulations of the Securities and Exchange Commission and the PCAOB.
We conducted our audits in accordance with the standards of the PCAOB. Those standards require that we plan and perform the audit to obtain reasonable assurance about whether the financial statements and financial highlights are free of material misstatement, whether due to error or fraud. Our audits included performing procedures to assess the risks of material misstatement of the financial statements and financial highlights, whether due to error or fraud, and performing procedures that respond to those risks. Such procedures included examining, on a test basis, evidence regarding the amounts and disclosures in the financial statements and financial highlights. Such procedures also included confirmation of securities owned as of June 30, 2019, by correspondence with the custodian and brokers, or by other appropriate auditing procedures. Our audits also included evaluating the accounting principles used and significant estimates made by management, as well as evaluating the overall presentation of the financial statements and financial highlights. We believe that our audits provide a reasonable basis for our opinion.

We have not been able to determine the specific year that we began serving as the auditor of one or more Wells Fargo Funds investment companies; however we are aware that we have served as the auditor of one or more Wells Fargo Funds investment companies since at least 1955.
Boston, Massachusetts
August 26, 2019
Wells Fargo Minnesota Tax-Free Fund | 29
Other information (unaudited)
TAX INFORMATION
Pursuant to Section 852 of the Internal Revenue Code, 100% of distributions paid from net investment income is designated as exempt-interest dividends for the fiscal year ended June 30, 2019.
PROXY VOTING INFORMATION
A description of the policies and procedures used to determine how to vote proxies relating to portfolio securities is available, upon request, by calling1-800-222-8222, visiting our website atwfam.com, or visiting the SEC website at sec.gov. Information regarding how the proxies related to portfolio securities were voted during the most recent 12-month period ended June 30 is available on the website atwfam.comor by visiting the SEC website at sec.gov.
QUARTERLY PORTFOLIO HOLDINGS INFORMATION
The Fund files its complete schedule of portfolio holdings with the SEC for the first and third quarters of each fiscal year on Form N-Q or Form N-PORT, which is available by visiting the SEC website at sec.gov. Those forms may be reviewed and copied at the SEC’s Public Reference Room in Washington, DC. Information on the operation of the Public Reference Room may be obtained by calling 1-800-SEC-0330.
30 | Wells Fargo Minnesota Tax-Free Fund
Other information (unaudited)
BOARD OF TRUSTEES AND OFFICERS
Each of the Trustees and Officers1 listed in the table below acts in identical capacities for each fund in the Wells Fargo family of funds, which consists of 152 mutual funds comprising the Wells Fargo Funds Trust, Wells Fargo Variable Trust, Wells Fargo Master Trust and four closed-end funds (collectively the “Fund Complex”). This table should be read in conjunction with the Prospectus and the Statement of Additional Information2. The mailing address of each Trustee and Officer is 525 Market Street, 12th Floor, San Francisco, CA 94105. Each Trustee and Officer serves an indefinite term, however, each Trustee serves such term until reaching the mandatory retirement age established by the Trustees.
Independent Trustees
| | | | | | |
Name and year of birth | | Position held and length of service* | | Principal occupations during past five years or longer | | Current other public company or investment company directorships |
| | | |
William R. Ebsworth (Born 1957) | | Trustee, since 2015 | | Retired. From 1984 to 2013, equities analyst, portfolio manager, research director and chief investment officer at Fidelity Management and Research Company in Boston, Tokyo, and Hong Kong, and retired in 2013 as Chief Investment Officer of Fidelity Strategic Advisers, Inc. where he led a team of investment professionals managing client assets. Prior thereto, Board member of Hong Kong Securities Clearing Co., Hong Kong Options Clearing Corp., the Thailand International Fund, Ltd., Fidelity Investments Life Insurance Company, and Empire Fidelity Investments Life Insurance Company. Audit Committee Chair and Investment Committee Chair of the Vincent Memorial Hospital Endowment (non-profit organization). Mr. Ebsworth is a CFA® charterholder. | | N/A |
| | | |
Jane A. Freeman (Born 1953) | | Trustee, since 2015; Chair Liaison, since 2018 | | Retired. From 2012 to 2014 and 1999 to 2008, Chief Financial Officer of Scientific Learning Corporation. From 2008 to 2012, Ms. Freeman provided consulting services related to strategic business projects. Prior to 1999, Portfolio Manager at Rockefeller & Co. and Scudder, Stevens & Clark. Board member of the Harding Loevner Funds from 1996 to 2014, serving as both Lead Independent Director and chair of the Audit Committee. Board member of the Russell Exchange Traded Funds Trust from 2011 to 2012 and the chair of the Audit Committee. Ms. Freeman is a Board Member of The Ruth Bancroft Garden (non-profit organization). She is also an inactive Chartered Financial Analyst. | | N/A |
| | | |
Isaiah Harris, Jr. (Born 1952) | | Trustee, since 2009; Audit Committee Chairman, since 2019 | | Retired. Chairman of the Board of CIGNA Corporation since 2009, and Director since 2005. From 2003 to 2011, Director of Deluxe Corporation. Prior thereto, President and CEO of BellSouth Advertising and Publishing Corp. from 2005 to 2007, President and CEO of BellSouth Enterprises from 2004 to 2005 and President of BellSouth Consumer Services from 2000 to 2003. Emeritus member of the Iowa State University Foundation Board of Governors. Emeritus Member of the Advisory Board of Iowa State University School of Business. Advisory Board Member, Palm Harbor Academy (private school). Advisory Board Member, Child Evangelism Fellowship (non-profit). Mr. Harris is a certified public accountant (inactive status). | | CIGNA Corporation |
| | | |
Judith M. Johnson (Born 1949) | | Trustee, since 2008; Audit Committee Chairman, from 2009 to 2018 | | Retired. Prior thereto, Chief Executive Officer and Chief Investment Officer of Minneapolis Employees Retirement Fund from 1996 to 2008. Ms. Johnson is an attorney, certified public accountant and a certified managerial accountant. | | N/A |
Wells Fargo Minnesota Tax-Free Fund | 31
Other information (unaudited)
| | | | | | |
Name and year of birth | | Position held and length of service* | | Principal occupations during past five years or longer | | Current other public company or investment company directorships |
| | | |
David F. Larcker (Born 1950) | | Trustee, since 2009 | | James Irvin Miller Professor of Accounting at the Graduate School of Business, Stanford University, Director of the Corporate Governance Research Initiative and Senior Faculty of The Rock Center for Corporate Governance since 2006. From 2005 to 2008, Professor of Accounting at the Graduate School of Business, Stanford University. Prior thereto, Ernst & Young Professor of Accounting at The Wharton School, University of Pennsylvania from 1985 to 2005. | | N/A |
| | | |
Olivia S. Mitchell (Born 1953) | | Trustee, since 2006; Nominating and Governance Committee Chairman, since 2018 | | International Foundation of Employee Benefit Plans Professor, Wharton School of the University of Pennsylvania since 1993. Director of Wharton’s Pension Research Council and Boettner Center on Pensions & Retirement Research, and Research Associate at the National Bureau of Economic Research. Previously, Cornell University Professor from 1978 to 1993. | | N/A |
| | | |
Timothy J. Penny (Born 1951) | | Trustee, since 1996; Chairman, since 2018 | | President and Chief Executive Officer of Southern Minnesota Initiative Foundation, a non-profit organization, since 2007. Member of the Board of Trustees of NorthStar Education Finance, Inc., a non-profit organization, since 2007. | | N/A |
| | | |
James G. Polisson (Born 1959) | | Trustee, since 2018 | | Retired. Chief Marketing Officer, Source (ETF) UK Services, Ltd, from 2015 to 2017. From 2012 to 2015, Principal of The Polisson Group, LLC, a management consulting, corporate advisory and principal investing company. Chief Executive Officer and Managing Director at Russell Investments, Global Exchange Traded Funds from 2010 to 2012. Managing Director of Barclays Global Investors from 1998 to 2010 and Global Chief Marketing Officer for iShares and Barclays Global Investors from 2000 to 2010. Trustee of the San Francisco Mechanics’ Institute, a non-profit organization, from 2013 to 2015. Board member of the Russell Exchange Traded Fund Trust from 2011 to 2012. Director of Barclays Global Investors Holdings Deutschland GmbH from 2006 to 2009. Mr. Polisson is an attorney and has a retired status with the Massachusetts and District of Columbia Bar Associations. | | N/A |
| * | Length of service dates reflect the Trustee’s commencement of service with the Trust’s predecessor entities, where applicable. |
32 | Wells Fargo Minnesota Tax-Free Fund
Other information (unaudited)
Officers
| | | | |
Name and year of birth | | Position held and length of service | | Principal occupations during past five years or longer |
| | |
Andrew Owen (Born 1960) | | President, since 2017 | | Executive Vice President of Wells Fargo & Company and Head of Affiliated Managers, Wells Fargo Asset Management, since 2014. In addition, Mr. Owen is currently President, Chief Executive Officer and Director of Wells Fargo Funds Management, LLC since 2017. Prior thereto, Executive Vice President responsible for marketing, investments and product development for Wells Fargo Funds Management, LLC, from 2009 to 2014. |
| | |
Nancy Wiser1 (Born 1967) | | Treasurer, since 2012 | | Executive Vice President of Wells Fargo Funds Management, LLC since 2011. Chief Operating Officer and Chief Compliance Officer at LightBox Capital Management LLC, from 2008 to 2011. |
| | |
Alexander Kymn (Born 1973) | | Secretary and Chief Legal Officer, since 2018 | | Senior Company Counsel of Wells Fargo Bank, N.A. since 2018 (previously Senior Counsel from 2007 to 2018). Vice President of Wells Fargo Funds Management, LLC from 2008 to 2014. |
| | |
Michael H. Whitaker (Born 1967) | | Chief Compliance Officer, since 2016 | | Senior Vice President and Chief Compliance Officer since 2016. Senior Vice President and Chief Compliance Officer for Fidelity Investments from 2007 to 2016. |
| | |
David Berardi (Born 1975) | | Assistant Treasurer, since 2009 | | Vice President of Wells Fargo Funds Management, LLC since 2009. Vice President of Evergreen Investment Management Company, LLC from 2008 to 2010. Manager of Fund Reporting and Control for Evergreen Investment Management Company, LLC from 2004 to 2010. |
| | |
| Jeremy DePalma1 (Born 1974) | | Assistant Treasurer, since 2009 | | Senior Vice President of Wells Fargo Funds Management, LLC since 2009. Senior Vice President of Evergreen Investment Management Company, LLC from 2008 to 2010 and head of the Fund Reporting and Control Team within Fund Administration from 2005 to 2010. |
| 1 | Nancy Wiser acts as Treasurer of 65 funds in the Fund Complex. Jeremy DePalma acts as Treasurer of 87 funds and Assistant Treasurer of 65 funds in the Fund Complex. |
| 2 | The Statement of Additional Information includes additional information about the Trustees and is available, without charge, upon request, by calling 1-800-222-8222 or by visiting the website atwfam.com. |
Wells Fargo Minnesota Tax-Free Fund | 33
Other information (unaudited)
BOARD CONSIDERATION OF INVESTMENT MANAGEMENT AND SUB-ADVISORY AGREEMENTS:
Wells Fargo Minnesota Tax-Free Fund
Under the Investment Company Act of 1940 (the “1940 Act”), the Board of Trustees (the “Board”) of Wells Fargo Funds Trust (the “Trust”) must determine annually whether to approve the continuation of the Trust’s investment management and sub-advisory agreements. In this regard, at an in-person meeting held on May 21-22, 2019 (the “Meeting”), the Board, all the members of which have no direct or indirect interest in the investment management and sub-advisory agreements and are not “interested persons” of the Trust, as defined in the 1940 Act (the “Independent Trustees”), reviewed and approved for Wells Fargo Minnesota Tax-Free Fund (the “Fund”): (i) an investment management agreement (the “Management Agreement”) with Wells Fargo Funds Management, LLC (“Funds Management”); and (ii) an investment sub-advisory agreement (the “Sub-Advisory Agreement”) with Wells Capital Management Incorporated (the “Sub-Adviser”), an affiliate of Funds Management. The Management Agreement and the Sub-Advisory Agreement are collectively referred to as the “Advisory Agreements.”
At the Meeting, the Board considered the factors and reached the conclusions described below relating to the selection of Funds Management and the Sub-Adviser and the approval of the Advisory Agreements. Prior to the Meeting, including at an in-person meeting in April 2019, the Trustees conferred extensively among themselves and with representatives of Funds Management about these matters. Also, the Board has adopted a team-based approach, with each team consisting of a sub-set of Trustees, to assist the full Board in the discharge of its duties in reviewing investment performance and other matters throughout the year. The Independent Trustees were assisted in their evaluation of the Advisory Agreements by independent legal counsel, from whom they received separate legal advice and with whom they met separately.
In providing information to the Board, Funds Management and the Sub-Adviser were guided by a detailed set of requests for information submitted to them by independent legal counsel on behalf of the Independent Trustees at the start of the Board’s annual contract renewal process earlier in 2019. In considering and approving the Advisory Agreements, the Trustees considered the information they believed relevant, including but not limited to the information discussed below. The Board considered not only the specific information presented in connection with the Meeting, but also the knowledge gained over time through interaction with Funds Management and the Sub-Adviser about various topics. In this regard, the Board reviewed reports of Funds Management at each of its quarterly meetings, which included, among other things, portfolio reviews and investment performance reports. In addition, the Board and the teams mentioned above confer with portfolio managers at various times throughout the year. The Board did not identify any particular information or consideration that was all-important or controlling, and each individual Trustee may have attributed different weights to various factors.
After its deliberations, the Board unanimously approved the continuation of the Advisory Agreements for a one-year term and determined that the compensation payable to Funds Management and the Sub-Adviser under each of the Advisory Agreements was reasonable. The Board considered the approval of the Advisory Agreements for the Fund as part of its consideration of agreements for funds across the complex, but its approvals were made on a fund-by-fund basis. The following summarizes a number of important, but not necessarily all, factors considered by the Board in support of its approvals.
Nature, extent and quality of services
The Board received and considered various information regarding the nature, extent and quality of services provided to the Fund by Funds Management and the Sub-Adviser under the Advisory Agreements. This information included a description of the investment advisory services and Fund-level administrative services covered by the Management Agreement, as well as, among other things, a summary of the background and experience of senior management of Wells Fargo Asset Management (“WFAM”), of which Funds Management and the Sub-Adviser are a part, a summary of investments made in the business of WFAM, a summary of certain organizational and personnel changes involving Funds Management and the Sub-Adviser, and a description of Funds Management’s and the Sub-Adviser’s business continuity planning programs and of their approaches to data privacy and cybersecurity. The Board received and reviewed information about Funds Management’s role as administrator of the Fund’s liquidity risk management program. The Board also considered the qualifications, background, tenure and responsibilities of each of the portfolio managers primarily responsible for the day-to-day portfolio management of the Fund.
The Board evaluated the ability of Funds Management and the Sub-Adviser to attract and retain qualified investment professionals, including research, advisory and supervisory personnel. The Board further considered the compliance programs and compliance records of Funds Management and the Sub-Adviser. In addition, the Board took into account the full range of services provided to the Fund by Funds Management and its affiliates.
Fund investment performance and expenses
The Board considered the investment performance results for the Fund over various time periods ended December 31, 2018. The Board considered these results in comparison to the investment performance of funds in a universe that was determined by
34 | Wells Fargo Minnesota Tax-Free Fund
Other information (unaudited)
Broadridge Inc. (“Broadridge”) to be similar to the Fund (the “Universe”), and in comparison to the Fund’s benchmark index and to other comparative data. Broadridge is an independent provider of investment company data. The Board received a description of the methodology used by Broadridge to select the mutual funds in the performance Universe. The Board noted that the investment performance of the Fund (Administrator Class) was higher than the average investment performance of the Universe for the one- and three-year periods under review, equal to the average investment performance of the Universe for the ten-year period under review, and in range of the average investment performance of the Universe for the three-year period under review. The Board also noted that the investment performance of the Fund was lower than its benchmark index, the Bloomberg Barclays Municipal Bond Index, for all periods under review.
The Board also received and considered information regarding the Fund’s net operating expense ratios and their various components, including actual management fees, custodian and other non-management fees, and Rule 12b-1 and non-Rule 12b-1 shareholder service fees. The Board considered these ratios in comparison to the median ratios of funds in class-specific expense groups that were determined by Broadridge to be similar to the Fund (the “Groups”). The Board received a description of the methodology used by Broadridge to select the mutual funds in the expense Groups and an explanation of how funds comprising expense groups and their expense ratios may vary from year-to-year. Based on the Broadridge reports, the Board noted that the net operating expense ratios of the Fund were lower than or equal to the median net operating expense ratios of the expense Groups for each share class.
The Board took into account the Fund’s investment performance and expense information provided to it among the factors considered in deciding to re-approve the Advisory Agreements.
Investment management and sub-advisory fee rates
The Board reviewed and considered the contractual fee rates payable by the Fund to Funds Management under the Management Agreement, as well as the contractual fee rates payable by the Fund to Funds Management for class-level administrative services under a Class-Level Administration Agreement, which include, among other things, class-level transfer agency and sub-transfer agency costs (collectively, the “Management Rates”). The Board also reviewed and considered the contractual investment sub-advisory fee rates that are payable by Funds Management to the Sub-Adviser for investment sub-advisory services.
Among other information reviewed by the Board was a comparison of the Fund’s Management Rates with the average contractual investment management fee rates of funds in the expense Groups at a common asset level as well as transfer agency costs of the funds in the expense Groups. The Board noted that the Management Rates of the Fund were lower than or in range of the sum of these average rates for the Fund’s expense Groups for all share classes.
The Board also received and considered information about the portion of the total management fee that was retained by Funds Management after payment of the fee to the Sub-Adviser for sub-advisory services. In assessing the reasonableness of this amount, the Board received and evaluated information about the nature and extent of responsibilities retained and risks assumed by Funds Management and not delegated to or assumed by the Sub-Adviser, and about Funds Management’s on-going oversight services. Given the affiliation between Funds Management and the Sub-Adviser, the Board ascribed limited relevance to the allocation of fees between them.
The Board also received and considered information about the nature and extent of services offered and fee rates charged by Funds Management and the Sub-Adviser to other types of clients with investment strategies similar to those of the Fund. In this regard, the Board received information about the significantly greater scope of services, and compliance, reporting and other legal burdens and risks of managing proprietary mutual funds compared with those associated with managing assets of other types of clients, including third-party sub-advised fund clients and non-mutual fund clients such as institutional separate accounts.
Based on its consideration of the factors and information it deemed relevant, including those described here, the Board determined that the compensation payable to Funds Management under the Management Agreement and to the Sub-Adviser under the Sub-Advisory Agreement was reasonable.
Profitability
The Board received and considered information concerning the profitability of Funds Management, as well as the profitability of both WFAM and Wells Fargo & Co. (“Wells Fargo”) from providing services to the fund family as a whole. The Board noted that the Sub-Adviser’s profitability information with respect to providing services to the Fund and other funds in the family was subsumed in the WFAM and Wells Fargo profitability analysis.
Funds Management reported on the methodologies and estimates used in calculating profitability, including a description of the methodology used to allocate certain expenses. Among other things, the Board noted that the levels of profitability
Wells Fargo Minnesota Tax-Free Fund | 35
Other information (unaudited)
reported on a fund-by-fund basis varied widely, depending on factors such as the size, type and age of fund. Based on its review, the Board did not deem the profits reported by Funds Management, WFAM or Wells Fargo from services provided to the Fund to be at a level that would prevent it from approving the continuation of the Advisory Agreements.
Economies of scale
The Board received and considered information about the potential for Funds Management to experience economies of scale in the provision of management services to the Fund, the difficulties of calculating economies of scale at an individual fund level, and the extent to which potential scale benefits are shared with shareholders. The Board noted the existence of breakpoints in the Fund’s management fee structure, which operate generally to reduce the Fund’s expense ratios as the Fund grows in size. The Board considered that in addition to management fee breakpoints, Funds Management shares potential economies of scale from its management business in a variety of ways, including through fee waiver and expense reimbursement arrangements, services that benefit shareholders, competitive management fee rates set at the outset without regard to breakpoints, and investments in the business intended to enhance services available to shareholders.
The Board concluded that Funds Management’s arrangements with respect to the Fund, including contractual breakpoints, constituted a reasonable approach to sharing potential economies of scale with the Fund and its shareholders.
Other benefits to Funds Management and the Sub-Adviser
The Board received and considered information regarding potential “fall-out” or ancillary benefits received by Funds Management and its affiliates, including the Sub-Adviser, as a result of their relationships with the Fund. Ancillary benefits could include, among others, benefits directly attributable to other relationships with the Fund and benefits potentially derived from an increase in Funds Management’s and the Sub-Adviser’s business as a result of their relationships with the Fund. The Board noted that various affiliates of Funds Management may receive distribution-related fees, shareholder servicing payments and sub-transfer agency fees in respect of shares sold or held through them and services provided.
The Board also reviewed information about soft dollar credits earned and utilized by the Sub-Adviser, fees earned by Funds Management and the Sub-Adviser from managing a private investment vehicle for the fund family’s securities lending collateral, and commissions earned by an affiliated broker from portfolio transactions.
Based on its consideration of the factors and information it deemed relevant, including those described here, the Board did not find that any ancillary benefits received by Funds Management and its affiliates, including the Sub-Adviser, were unreasonable.
Conclusion
At the Meeting, after considering the above-described factors and based on its deliberations and its evaluation of the information described above, the Board unanimously approved the continuation of the Advisory Agreements for a one-year term and determined that the compensation payable to Funds Management and the Sub-Adviser under each of the Advisory Agreements was reasonable.
36 | Wells Fargo Minnesota Tax-Free Fund

For more information
More information about Wells Fargo Funds is available free upon request. To obtain literature, please write, visit the Fund’s website, or call:
Wells Fargo Funds
P.O. Box 219967
Kansas City, MO 64121-9967
Website:wfam.com
Individual investors:1-800-222-8222
Retail investment professionals:1-888-877-9275
Institutional investment professionals:1-866-765-0778

This report and the financial statements contained herein are submitted for the general information of the shareholders of the Fund. If this report is used for promotional purposes, distribution of the report must be accompanied or preceded by a current prospectus. Before investing, please consider the investment objectives, risks, charges, and expenses of the investment. For a current prospectus and, if available, a summary prospectus, containing this information, call1-800-222-8222 or visit the Fund’s website atwfam.com. Read the prospectus carefully before you invest or send money.
Wells Fargo Asset Management (WFAM) is the trade name for certain investment advisory/management firms owned by Wells Fargo & Company. These firms include but are not limited to Wells Capital Management Incorporated and Wells Fargo Funds Management, LLC. Certain products managed by WFAM entities are distributed by Wells Fargo Funds Distributor, LLC (a broker-dealer and Member FINRA).
This material is for general informational and educational purposes only and is NOT intended to provide investment advice or a recommendation of any kind—including a recommendation for any specific investment, strategy, or plan.
INVESTMENT PRODUCTS: NOT FDIC INSURED ◾ NO BANK GUARANTEE ◾ MAY LOSE VALUE
© 2019 Wells Fargo Funds Management, LLC. All rights reserved.
404824 08-19
A252/AR252 06-19
Annual Report
June 30, 2019
Wells Fargo
California Tax-Free Fund
Beginning on January 1, 2021, as permitted by new regulations adopted by the Securities and Exchange Commission, paper copies of the Wells Fargo Funds’ annual and semi-annual shareholder reports issued after this date will no longer be sent by mail, unless you specifically request paper copies of the reports. Instead, the reports will be made available on the Funds’ website, and you will be notified by mail each time a report is posted and provided with a website address to access the report.
If you already elected to receive shareholder reports electronically, you will not be affected by this change and you need not take any action. You may elect to receive shareholder reports and other communications from the Fund electronically at any time by contacting your financial intermediary (such as a broker-dealer or bank) or, if you are a direct investor, by calling1-800-222-8222 or by enrolling at wellsfargo.com/advantagedelivery.
You may elect to receive all future reports in paper free of charge. If you invest through a financial intermediary, you can contact your financial intermediary to request that you continue to receive paper copies of your shareholder reports; if you invest directly with the Fund, you can call 1-800-222-8222. Your election to receive reports in paper will apply to all Wells Fargo Funds held in your account with your financial intermediary or, if you are a direct investor, to all Wells Fargo Funds that you hold.
|
|
|
Reduce clutter. Save trees. |
Sign up for electronic delivery of prospectuses and shareholder reports atwellsfargo.com/advantagedelivery |
The views expressed and any forward-looking statements are as of June 30, 2019, unless otherwise noted, and are those of the Fund managers and/or Wells Fargo Asset Management. Discussions of individual securities, or the markets generally, or any Wells Fargo Fund are not intended as individual recommendations. Future events or results may vary significantly from those expressed in any forward-looking statements. The views expressed are subject to change at any time in response to changing circumstances in the market. Wells Fargo Asset Management and the Fund disclaim any obligation to publicly update or revise any views expressed or forward-looking statements.
INVESTMENT PRODUCTS: NOT FDIC INSURED ◾ NO BANK GUARANTEE ◾ MAY LOSE VALUE
Wells Fargo California Tax-Free Fund | 1
Letter to shareholders (unaudited)

Andrew Owen
President
Wells Fargo Funds
Dear Shareholder:
We are pleased to offer you this annual report for the Wells Fargo California Tax-Free Fund for the 12-month period that ended June 30, 2019. After the first six months of the period yielded either low-single-digit or negative investment returns, stock and bond investors enjoyed a recovery during the final six months. The gains came amid continued concerns about global economic growth, international trade, geopolitical tensions, and bouts of market volatility.
For the period, U.S. stocks, based on the S&P 500 Index,1 gained 10.42% and international stocks, as measured by the MSCI ACWI ex USA Index (Net),2 rose 1.29%. The MSCI EM Index (Net)3 added 1.21%. For bond investors, the Bloomberg Barclays U.S. Aggregate Bond Index4 added 7.87%, the Bloomberg Barclays Global Aggregate ex-USD Index5 rose 4.10%, the Bloomberg Barclays Municipal Bond Index6 gained 6.71%, and the ICE BofAML U.S. High Yield Index7 added 7.58%.
U.S. and international markets diverged during the third quarter of 2018.
Domestic equity investors received encouraging news during the third quarter of 2018. The U.S. Bureau of Economic Analysis reported second-quarter annualized gross domestic product (GDP) growth of 4.2%. Hiring improved. Unemployment declined. Consumer confidence and spending increased. Third-quarter corporate earnings reports were generally positive. U.S. trade negotiations with Mexico and Canada progressed. The U.S. Federal Reserve (Fed) raised the federal funds rate by 25 basis points (bps; 100 bps equal 1.00%) to a target range of between 2.00% and 2.25% in September, one of four rate increases implemented during 2018, expressing confidence in the strength of the U.S. economic expansion’s durability.
Investors in international markets were not as confident. Tensions between the U.S. and China increased. The U.S. imposed $200 billion in tariffs on Chinese goods. China reacted with $60 billion in tariffs on U.S. goods. Economic growth in China caused concern. During the quarter, the MSCI ACWI ex USA Index (Net) gained 0.71%. The MSCI EM Index (Net) declined 1.09%. In fixed-income markets, U.S. bonds were flat, as measured by the Bloomberg Barclays U.S. Aggregate Bond Index. The Bloomberg Barclays Global Aggregate ex-USD Index fell 1.74%.
| 1 | The S&P 500 Index consists of 500 stocks chosen for market size, liquidity, and industry group representation. It is a market-value-weighted index with each stock’s weight in the index proportionate to its market value. You cannot invest directly in an index. |
| 2 | The Morgan Stanley Capital International (MSCI) All Country World Index (ACWI) ex USA Index (Net) is a free-float-adjusted market-capitalization weighted index that is designed to measure the equity market performance of developed and emerging markets, excluding the U.S. Source: MSCI. MSCI makes no express or implied warranties or representations and shall have no liability whatsoever with respect to any MSCI data contained herein. The MSCI data may not be further redistributed or used as a basis for other indices or any securities or financial products. This report is not approved, reviewed, or produced by MSCI. You cannot invest directly in an index. |
| 3 | The MSCI Emerging Markets (EM) Index (Net) is a free-float-adjusted market-capitalization-weighted index that is designed to measure the equity market performance of emerging markets. You cannot invest directly in an index. |
| 4 | The Bloomberg Barclays U.S. Aggregate Bond Index is a broad-based benchmark that measures the investment-grade, U.S. dollar-denominated, fixed-rate taxable bond market, including Treasuries, government-related and corporate securities, mortgage-backed securities (agency fixed-rate and hybrid adjustable-rate mortgage pass-throughs), asset-backed securities, and commercial mortgage-backed securities. You cannot invest directly in an index. |
| 5 | The Bloomberg Barclays Global Aggregate ex-USD Index is an unmanaged index that provides a broad-based measure of the global investment-grade fixed-income markets excluding the U.S. dollar-denominated debt market. You cannot invest directly in an index. |
| 6 | The Bloomberg Barclays Municipal Bond Index is an unmanaged index composed of long-term tax-exempt bonds with a minimum credit rating of Baa. You cannot invest directly in an index. |
| 7 | The ICE BofAML U.S. High Yield Index is a market-capitalization-weighted index of domestic and Yankee high-yield bonds. The index tracks the performance of high-yield securities traded in the U.S. bond market. You cannot invest directly in an index. Copyright 2019. ICE Data Indices, LLC. All rights reserved. |
2 | Wells Fargo California Tax-Free Fund
Letter to shareholders (unaudited)
Global markets suffered during the fourth quarter of 2018.
November’s U.S. midterm elections shifted control of the House of Representatives from Republicans to Democrats, presaging partisan clashes that followed and caused uncertainty among investors. Third-quarter U.S. GDP was announced at an annualized 3.4% rate, lower than the second-quarter rate. Brexit efforts stalled ahead of the March 2019 deadline. The People’s Bank of China cut reserve requirement ratios, accelerated infrastructure spending, and cut taxes even as the value of the yuan declined to low levels last seen in 2008. A partial U.S. government shutdown driven by partisan policy disputes extended into January.
The combination of news in the U.S. and generally weak economic indicators outside of the U.S. caused investors to seek safe havens. December’s S&P 500 Index performance was the worst since 1931. Globally, fixed-income investments fared better than stocks during the last two months of the year. The Fed increased the federal funds rate by 25 bps in December to a target range of between 2.25% and 2.50%.
The market climbs a wall of worry.
Investors entered 2019 with reasons to be concerned. Investment returns appeared to reaffirm the adage that markets climb a wall of worry. The S&P 500 Index gained 8.01% for the month of January, the best monthly performance in 30 years. Returns for the MSCI ACWI ex USA Index (Net), the Bloomberg Barclays U.S. Aggregate Bond Index, and the Bloomberg Barclays Global Aggregate ex-USD Index also were positive. The Fed indicated that it would pause its program of regular rate increases during 2019 as inflation remained low.
In February 2019, concerns over slowing global growth persisted. The Bureau of Economic Analysis announced fourth-quarter 2018 GDP grew at an annualized 2.2% rate, down from the levels of the prior two quarters. In a February report, the Bank of England forecast the slowest growth since the financial crisis for 2019. China and the U.S. continued to wrangle over trade issues.
By the end of March 2019, the combination of dovish Fed sentiment and steady, if not spectacular, economic and business metrics reinforced investors’ confidence. Monthly job creation data and corporate profits, while less consistent than during 2018, were solid. China announced a roughly $300 billion stimulus package through tax and fee cuts intended to reinvigorate economic growth.
During April 2019, investors drew confidence from favorable economic projections, sustained low inflation, and solid employment data. First-quarter GDP showed the economy grew at an annualized rate of 3.2% on improvement in business investment and exports. Favorable sentiment extended to foreign markets as the MSCI ACWI ex USA Index (Net) gained 2.64% and the MSCI EM Index (Net) added 2.11% for the month.
During May 2019, investing signals were mixed. In the U.S., partisan wrangling ramped up as Democrats and Republicans set their sights on 2020 presidential politics. The U.K.’s Brexit caused Prime Minister Theresa May to resign. The European Commission downgraded the 2019 growth forecast to 1.2%. The U.S. increased tariffs on products from China, China responded, and then talks broke down. President Donald Trump threatened to turn his foreign policy tariff tool to Mexico over immigration issues. Markets tumbled.
As had been the case during most of 2019 to date, just as the investment horizon appeared to darken, sentiment turned and markets gained. The gains, primarily driven by geopolitical and monetary policy events, drove equity markets to new highs. President Trump dropped his threats of new tariffs on Mexico after talks and further tariffs on China after meeting with China’s President Xi Jinping at the G-20 summit. President Mario Draghi of the European Central Bank said that if the outlook doesn’t
“December’s S&P 500 Index performance was the worst since 1931.”
“The S&P 500 Index gained 8.01% for the month of January, the best monthly performance in 30 years.”
Wells Fargo California Tax-Free Fund | 3
Letter to shareholders (unaudited)
improve, the bank will cut rates or buy more assets to prop up inflation. In the U.S., the Fed said growth shifted from “solid” to “moderate” and indicated a willingness to cut rates.
Don’t let short-term uncertainty derail long-term investment goals.
Periods of investment uncertainty can present challenges, but experience has taught us that maintaining long-term investment goals can be an effective way to plan for the future. To help you create a sound strategy based on your personal goals and risk tolerance, Wells Fargo Funds offers more than 100 mutual funds spanning a wide range of asset classes and investment styles. Although diversification cannot guarantee an investment profit or prevent losses, we believe it can be an effective way to manage investment risk and potentially smooth out overall portfolio performance. We encourage investors to know their investments and to understand that appropriate levels of risk-taking may unlock opportunities.
Thank you for choosing to invest with Wells Fargo Funds. We appreciate your confidence in us and remain committed to helping you meet your financial needs.
Sincerely,

Andrew Owen
President
Wells Fargo Funds
|
|
|
For further information about your Fund, contact your investment professional, visit our website at wfam.com, or call us directly at1-800-222-8222. |
4 | Wells Fargo California Tax-Free Fund
This page is intentionally left blank.
Performance highlights (unaudited)
Investment objective
The Fund seeks current income exempt from federal income tax and California individual income tax.
Manager
Wells Fargo Funds Management, LLC
Subadviser
Wells Capital Management Incorporated
Portfolio managers
Terry J. Goode
Brandon Pae‡
Adrian Van Poppel
Average annual total returns (%) as of June 30, 2019
| | | | | | | | | | | | | | | | | | | | | | | | | | | | | | | | | | |
| | | | |
| | | | | Including sales charge | | | Excluding sales charge | | | Expense
ratios1 (%) | |
| | | | | | | | | |
| | | Inception date | | 1 year | | | 5 year | | | 10 year | | | 1 year | | | 5 year | | | 10 year | | | Gross | | | Net2 | |
| | | | | | | | | | |
| Class A (SCTAX) | | 10-6-1988 | | | 0.93 | | | | 2.52 | | | | 4.80 | | | | 5.70 | | | | 3.47 | | | | 5.29 | | | | 0.83 | | | | 0.75 | |
| | | | | | | | | | |
| Class C (SCTCX) | | 7-1-1993 | | | 3.95 | | | | 2.71 | | | | 4.50 | | | | 4.95 | | | | 2.71 | | | | 4.50 | | | | 1.58 | | | | 1.50 | |
| | | | | | | | | | |
| Administrator Class (SGCAX) | | 12-15-1997 | | | – | | | | – | | | | – | | | | 5.99 | | | | 3.69 | | | | 5.51 | | | | 0.77 | | | | 0.55 | |
| | | | | | | | | | |
| Institutional Class (SGTIX)3 | | 10-31-2014 | | | – | | | | – | | | | – | | | | 6.07 | | | | 3.75 | | | | 5.54 | | | | 0.50 | | | | 0.48 | |
| | | | | | | | | | |
| Bloomberg Barclays Municipal Bond Index4 | | – | | | – | | | | – | | | | – | | | | 6.71 | | | | 3.64 | | | | 4.72 | | | | – | | | | – | |
| | | | | | | | | | |
| Bloomberg Barclays Municipal Bond: California Index5 | | – | | | – | | | | – | | | | – | | | | 6.42 | | | | 3.66 | | | | 5.33 | | | | – | | | | – | |
Figures quoted represent past performance, which is no guarantee of future results, and do not reflect taxes that a shareholder may pay on fund distributions or the redemption of fund shares. Investment return and principal value of an investment will fluctuate so that an investor’s shares, when redeemed, may be worth more or less than their original cost. Performance shown without sales charges would be lower if sales charges were reflected. Current performance may be lower or higher than the performance data quoted, which assumes the reinvestment of dividends and capital gains. Currentmonth-end performance is available on the Fund’s website,wfam.com.
Index returns do not include transaction costs associated with buying and selling securities, any mutual fund fees or expenses, or any taxes. It is not possible to invest directly in an index.
For Class A shares, the maximumfront-end sales charge is 4.50%. For Class C shares, the maximum contingent deferred sales charge is 1.00%. Performance including a contingent deferred sales charge assumes the sales charge for the corresponding time period. Administrator Class and Institutional Class shares are sold without afront-end sales charge or contingent deferred sales charge.
Bond values fluctuate in response to the financial condition of individual issuers, general market and economic conditions, and changes in interest rates. Changes in market conditions and government policies may lead to periods of heightened volatility in the bond market and reduced liquidity for certain bonds held by the Fund. In general, when interest rates rise, bond values fall and investors may lose principal value. Interest-rate changes and their impact on the Fund and its share price can be sudden and unpredictable. The use of derivatives may reduce returns and/or increase volatility. Certain investment strategies tend to increase the total risk of an investment (relative to the broader market). The Fund is exposed to California municipal securities risk, high-yield securities risk, andnon-diversification risk. Consult the Fund’s prospectus for additional information on these and other risks. A portion of the Fund’s income may be subject to federal, state, and/or local income taxes or the Alternative Minimum Tax (AMT). Any capital gains distributions may be taxable.
Please see footnotes on page 7.
6 | Wells Fargo California Tax-Free Fund
Performance highlights (unaudited)
|
|
| Growth of $10,000 investment as of June 30, 20196 |
|
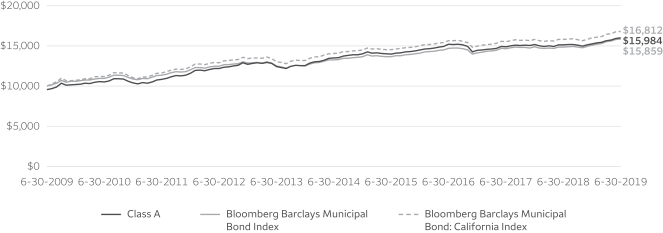
|
| ‡ | Mr. Pae became a portfolio manager of the Fund on March 28, 2019. |
| 1 | Reflects the expense ratios as stated in the most recent prospectuses. The expense ratios shown are subject to change and may differ from the annualized expense ratios shown in the financial highlights of this report. |
| 2 | The manager has contractually committed through October 31, 2019, to waive fees and/or reimburse expenses to the extent necessary to cap the expenses of each class after fee waivers at the amounts shown. Brokerage commissions, stamp duty fees, interest, taxes, acquired fund fees and expenses (if any), and extraordinary expenses are excluded from the expense cap. Prior to or after the commitment expiration date, the cap may be increased or the commitment to maintain the cap may be terminated only with the approval of the Board of Trustees. Without this cap, the Fund’s returns would have been lower. The expense ratio paid by an investor is the net expense ratio (the total annual fund operating expenses after fee waivers) as stated in the prospectuses. |
| 3 | Historical performance shown for the Institutional Class shares prior to their inception reflects the performance of the Administrator Class shares and includes the higher expenses applicable to Administrator Class shares. If these expenses had not been included, returns for Institutional Class shares would be higher. |
| 4 | The Bloomberg Barclays Municipal Bond Index is an unmanaged index composed of long-termtax-exempt bonds with a minimum credit rating of Baa. You cannot invest directly in an index. |
| 5 | The Bloomberg Barclays Municipal Bond: California Index is the California component of the Bloomberg Barclays Municipal Bond Index. You cannot invest directly in an index. |
| 6 | The chart compares the performance of Class A shares for the most recent ten years with the Bloomberg Barclays Municipal Bond Index and the Bloomberg Barclays Municipal Bond: California Index. The chart assumes a hypothetical $10,000 investment in Class A shares and reflects all operating expenses and assumes the maximum initial sales charge of 4.50%. |
| 7 | Amounts are calculated based on the long-term total investments of the Fund. These amounts are subject to change and may have changed since the date specified. |
| 8 | The credit quality distribution of portfolio holdings reflected in the chart is based on ratings from Standard & Poor’s, Moody’s Investors Service, and/or Fitch Ratings Ltd. Credit quality ratings apply to the underlying holdings of the Fund and not to the Fund itself. The percentages of the Fund’s portfolio with the ratings depicted in the chart are calculated based on the total market value of fixed income securities held by the Fund. If a security was rated by all three rating agencies, the middle rating was utilized. If rated by two of three rating agencies, the lower rating was utilized, and if rated by one of the rating agencies, that rating was utilized. Standard & Poor’s rates the creditworthiness of bonds, ranging from AAA (highest) to D (lowest). Ratings from A to CCC may be modified by the addition of a plus (+) or minus (-) sign to show relative standing within the rating categories. Standard & Poor’s rates the creditworthiness of short-term notes fromSP-1 (highest) toSP-3 (lowest). Moody’s rates the creditworthiness of bonds, ranging from Aaa (highest) to C (lowest). Ratings Aa to B may be modified by the addition of a number 1 (highest) to 3 (lowest) to show relative standing within the ratings categories. Moody’s rates the creditworthiness of short-term U.S.tax-exempt municipal securities from MIG 1/VMIG 1 (highest) to SG (lowest). Fitch rates the creditworthiness of bonds, ranging from AAA (highest) to D (lowest). Credit quality distribution is subject to change and may have changed since the date specified. |
Wells Fargo California Tax-Free Fund | 7
Performance highlights (unaudited)
MANAGER’S DISCUSSION
Fund highlights
| ∎ | | The Fund underperformed the Bloomberg Barclays Municipal Bond Index and the Bloomberg Barclays Municipal Bond: California Index for the12-month period that ended June 30, 2019. |
| ∎ | | The Fund’s shorter-duration profile was a detractor as longer-duration bonds outperformed shorter maturities during this period of flattening. The Fund also saw several of its large, attractive Great Recession–era California State general obligation (GO) bonds refunded over the year that had book yields that could not be replaced in the current interest rate environment. |
| ∎ | | The primary drivers of performance were the Fund’s credit profile, security selection, and yield-curve positioning with an overweight to the best-performing long-term bond maturity segment. Strong demand for lower-rated credits benefited the Fund’s overweight toA-rated andBBB-rated bonds. Security selection was also a contributor as several hospitals and special tax bonds performed well relative to similar credits in the Bloomberg Barclays Municipal Bond: California Index. |
|
|
| Effective maturity distribution as of June 30, 20197 |
|
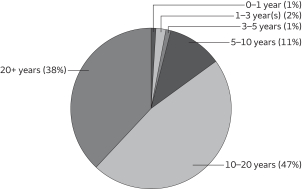 |
Fading growth expectations put the Fed on hold.
Throughout most of 2018, the fixed-income markets expected the U.S. Federal Reserve (Fed) to continue the path to normalize monetary policy. Moderate economic growth, stronger employment data, and inflation near its 2% target enabled the Fed to increase the federal funds rate four times in the calendar year. Despite a Fed rate hike in December, the Treasury market rallied in the fourth quarter of 2018 as the market lowered expectations for further rate hikes amid slower global growth, trade tariffs, and uncertainty concerning Britain’s departure from the European Union. These concerns only increased as we moved into the first half of 2019 and discussions changed from
when the Fed might hike to when they might cut the federal funds rate. As a result, fixed-income markets rallied, pushing the benchmark10-year Treasury yield from a 3.23% peak in November 2018 to 2.00% by the end of June.
Specific to the municipal bond market, the beginning of the reporting period was marked with significant outflows due to a generalrisk-on sentiment in equity markets and the fear of rising interest rates. As the calendar turned, so did market sentiment. Flows into municipal mutual funds not only turned positive, but record inflows were reported as investor opinion toward fixed income, particularly municipals, improved due to investor expectations that interest rates would remain stable. While new issue supply was higher than it was a year earlier, it was still much lower than a typical year due to tax reform, which eliminated the ability of issuers to advance refund outstanding higher-cost debt. Overall, reduced supply, state and local sales tax caps for individuals, and lower interest rates fueled demand and thus returns for municipal bonds over the period.
The Fund’s duration started at 94% of the Bloomberg Barclays Municipal Bond: California Index but we moved closer to neutral, or to 97% of the index, by the end of the period as expectations of additional Fed rate hikes moderated in 2019. We continue to maintain an overweight to bonds rated A and below as higher-grade bonds have priced historically rich in the wake of tax reform, especially for states like California, which were affected to a greater degree by the cap on state and local tax deductions. Over the period, we have also added higher-rated, lower-coupon bonds, which offered additional incremental yield with lower expected price volatility in the current interest rate environment compared with lower-rated, higher-coupon bonds. Our exposure to state GOs decreased markedly as several large positions were refunded by the State of California, and we deployed those resources to other sectors, including hospitals, local GOs, and airports, which all have had strong relative performance over the period.
Please see footnotes on page 7.
8 | Wells Fargo California Tax-Free Fund
Performance highlights (unaudited)
|
|
| Credit quality as of June 30, 20198 |
|
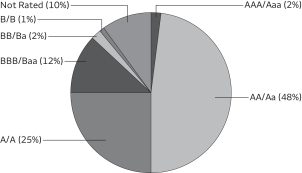 |
As the yield curve flattened over the period and credit spreads tightened, longer-duration bonds and credit outperformed. The30-year AAA municipal benchmark rallied 63 bps (bps; 100 bps equal 1.00%) over the period, based on the Thomson Municipal Market Data AAA yield curve, resulting in a bull flattening, and as a result, long-duration bonds performed well. Many of our top contributors werenon-callablezero-coupon bonds. Strong demand for lower-rated bonds also contributed to the Fund’s relative performance as we maintained our overweight to this segment. Lower-rated airports and higher-rated 4% coupon bonds were among our most significant contributors to performance during the period. Finally, several nonrated special tax bonds experienced strong total return over the period as technical factors, including strong high-yield fund flows and historically tight credit spreads, supported demand.
Shorter-maturing bonds inside of 10 years did not rally as strongly as longer maturities. As a result, the Fund’s exposure to this maturity range hampered performance. Higher-quality bonds also generally underperformed. This includedpre-refunded, state GOs, and water and sewer bonds. The Fund’s overweight to the weaker-performing leasing/appropriation sector was a detractor and the Fund’s bonds underperformed those in the index. The Fund’s limited exposure to golden tobacco settlement bonds also detracted from performance as the specter of increased regulation and plunging smoking consumption led Standard & Poor’s to revise its modeling assumptions and place some credits on negative watch. Finally, the State of California refunded several large positions over the period—bonds issued when the state’s credit spreads were at recent highs—and as a result, we could not replace those book yields at a similar risk profile.
Our outlook is for lower rates
Overall, technicals remain strong in the municipal bond market and we expect municipal bond valuations in the medium term to be helped by high state income tax rates, record levels of municipal debt maturities and calls, and limited availability of gross municipal bond supply. However, we believe overall economic growth in this cycle has neared its peak and, as a result, the Fed may lower rates before the end of the year. As a result, we will look to maintain a neutral duration positioning and anup-in-quality trade approach.
Please see footnotes on page 7.
Wells Fargo California Tax-Free Fund | 9
Fund expenses (unaudited)
As a shareholder of the Fund, you incur two types of costs: (1) transaction costs, including sales charges (loads) on purchase payments and contingent deferred sales charges (if any) on redemptions and (2) ongoing costs, including management fees, distribution(12b-1) and/or shareholder servicing fees, and other Fund expenses. This example is intended to help you understand your ongoing costs (in dollars) of investing in the Fund and to compare these costs with the ongoing costs of investing in other mutual funds.
The example is based on an investment of $1,000 invested at the beginning of thesix-month period and held for the entire period from January 1, 2019 to June 30, 2019.
Actual expenses
The “Actual” line of the table below provides information about actual account values and actual expenses. You may use the information in this line, together with the amount you invested, to estimate the expenses that you paid over the period. Simply divide your account value by $1,000 (for example, an $8,600 account value divided by $1,000 = 8.6), then multiply the result by the number in the “Actual” line under the heading entitled “Expenses paid during period” for your applicable class of shares to estimate the expenses you paid on your account during this period.
Hypothetical example for comparison purposes
The “Hypothetical” line of the table below provides information about hypothetical account values and hypothetical expenses based on the Fund’s actual expense ratio and an assumed rate of return of 5% per year before expenses, which is not the Fund’s actual return. The hypothetical account values and expenses may not be used to estimate the actual ending account balance or expenses you paid for the period. You may use this information to compare the ongoing costs of investing in the Fund and other funds. To do so, compare this 5% hypothetical example with the 5% hypothetical examples that appear in the shareholder reports of the other funds.
Please note that the expenses shown in the table are meant to highlight your ongoing costs only and do not reflect any transactional costs, such as sales charges (loads) and contingent deferred sales charges. Therefore, the “Hypothetical” line of the table is useful in comparing ongoing costs only and will not help you determine the relative total costs of owning different funds. In addition, if these transactional costs were included, your costs would have been higher.
| | | | | | | | | | | | | | | | |
| | | Beginning
account value
1-1-2019 | | | Ending
account value
6-30-2019 | | | Expenses
paid during
the period¹ | | | Annualized net
expense ratio | |
| | | | | |
Class A | | | | | | | | | | | | | | | | |
| | | | |
Actual | | $ | 1,000.00 | | | $ | 1,047.96 | | | $ | 3.81 | | | | 0.75 | % |
| | | | |
Hypothetical (5% return before expenses) | | $ | 1,000.00 | | | $ | 1,021.08 | | | $ | 3.76 | | | | 0.75 | % |
| | | | | |
Class C | | | | | | | | | | | | | | | | |
| | | | |
Actual | | $ | 1,000.00 | | | $ | 1,044.33 | | | $ | 7.60 | | | | 1.50 | % |
| | | | |
Hypothetical (5% return before expenses) | | $ | 1,000.00 | | | $ | 1,017.36 | | | $ | 7.50 | | | | 1.50 | % |
| | | | | |
Administrator Class | | | | | | | | | | | | | | | | |
| | | | |
Actual | | $ | 1,000.00 | | | $ | 1,049.82 | | | $ | 2.80 | | | | 0.55 | % |
| | | | |
Hypothetical (5% return before expenses) | | $ | 1,000.00 | | | $ | 1,022.07 | | | $ | 2.76 | | | | 0.55 | % |
| | | | | |
Institutional Class | | | | | | | | | | | | | | | | |
| | | | |
Actual | | $ | 1,000.00 | | | $ | 1,049.27 | | | $ | 2.44 | | | | 0.48 | % |
| | | | |
Hypothetical (5% return before expenses) | | $ | 1,000.00 | | | $ | 1,022.41 | | | $ | 2.41 | | | | 0.48 | % |
| 1 | Expenses paid is equal to the annualized net expense ratio of each class multiplied by the average account value over the period, multiplied by the number of days in the most recent fiscal half-year divided by the number of days in the fiscal year (to reflect theone-half-year period). |
10 | Wells Fargo California Tax-Free Fund
Portfolio of investments—June 30, 2019
| | | | | | | | | | | | | | | | |
| | | Interest
rate | | | Maturity
date | | | Principal | | | Value | |
| Municipal Obligations: 98.82% | |
|
California: 94.75% | |
|
| Airport Revenue: 3.96% | |
| | | | |
California Municipal Finance Authority AMT Senior Lien Linxs Apartment Project Series A | | | 5.00 | % | | | 12-31-2043 | | | $ | 5,730,000 | | | $ | 6,698,599 | |
| | | | |
Los Angeles CA Department Of Airports Revenue | | | 5.00 | | | | 5-15-2049 | | | | 5,000,000 | | | | 5,966,000 | |
| | | | |
Palm Springs CA Palm Springs International Airport | | | 6.40 | | | | 7-1-2023 | | | | 380,000 | | | | 380,239 | |
| | | | |
Sacramento County CA Airport System Refunding Bond AMT Senior Series C | | | 5.00 | | | | 7-1-2037 | | | | 7,300,000 | | | | 8,797,157 | |
| | | | |
Sacramento County CA Airport System Refunding Bond AMT Senior Series C | | | 5.00 | | | | 7-1-2038 | | | | 3,000,000 | | | | 3,605,610 | |
| | | | |
San Francisco CA City & County International Airport AMT Series A ## | | | 5.00 | | | | 5-1-2047 | | | | 7,715,000 | | | | 9,002,016 | |
| | | | |
San Jose CA Airport AMT Refunding Bond Series A | | | 5.00 | | | | 3-1-2047 | | | | 4,000,000 | | | | 4,631,120 | |
| | | | |
San Jose CA Airport Refunding Bond Series B | | | 5.00 | | | | 3-1-2042 | | | | 1,750,000 | | | | 2,071,615 | |
| |
| | | | 41,152,356 | |
| | | | | |
|
| Education Revenue: 5.01% | |
| | | | |
California Educational Facilities Authority Loma Linda University Series A | | | 5.00 | | | | 4-1-2042 | | | | 2,645,000 | | | | 3,072,538 | |
| | | | |
California Municipal Finance Authority California Baptist University Series A 144A | | | 4.00 | | | | 11-1-2021 | | | | 595,000 | | | | 609,161 | |
| | | | |
California Municipal Finance Authority California Baptist University Series A 144A | | | 5.00 | | | | 11-1-2025 | | | | 1,025,000 | | | | 1,137,176 | |
| | | | |
California Municipal Finance Authority Charter School Albert Einstein Academies Project Series A | | | 6.75 | | | | 8-1-2033 | | | | 1,525,000 | | | | 1,695,342 | |
| | | | |
California Municipal Finance Authority Charter School Albert Einstein Academies Project Series A | | | 7.13 | | | | 8-1-2043 | | | | 1,000,000 | | | | 1,114,940 | |
| | | | |
California Municipal Finance Authority Refunding Bond Biola University Incorporated | | | 5.00 | | | | 10-1-2035 | | | | 600,000 | | | | 710,850 | |
| | | | |
California Municipal Finance Authority Charter School Palmdale Aerospace Academy Project 144A | | | 5.00 | | | | 7-1-2041 | | | | 1,250,000 | | | | 1,363,862 | |
| | | | |
California Municipal Finance Authority Charter School Revenue Palmdale Aerospace Academy Series A 144A | | | 5.00 | | | | 7-1-2049 | | | | 1,800,000 | | | | 1,989,306 | |
| | | | |
California School Finance Authority Bright Star Schools Obligation Group 144A | | | 5.00 | | | | 6-1-2047 | | | | 1,000,000 | | | | 1,064,440 | |
| | | | |
California School Finance Authority Bright Star Schools Obligation Group 144A | | | 5.00 | | | | 6-1-2054 | | | | 1,000,000 | | | | 1,055,420 | |
| | | | |
California School Finance Authority Green Dot Public Schools Projects 144A | | | 4.00 | | | | 8-1-2025 | | | | 475,000 | | | | 525,972 | |
| | | | |
California School Finance Authority Green Dot Public Schools Projects 144A | | | 5.00 | | | | 8-1-2035 | | | | 2,525,000 | | | | 2,841,054 | |
| | | | |
California School Finance Authority KIPP Louisiana School Projects Series A 144A | | | 5.00 | | | | 7-1-2035 | | | | 1,000,000 | | | | 1,129,800 | |
| | | | |
California School Finance Authority Rocketship Education Series A 144A | | | 5.00 | | | | 6-1-2036 | | | | 945,000 | | | | 1,001,955 | |
| | | | |
California School Finance Authority Rocketship Education Series A 144A | | | 5.00 | | | | 6-1-2046 | | | | 2,100,000 | | | | 2,207,289 | |
| | | | |
California Statewide CDA Refunding Bond California Baptist University Series A 144A | | | 5.00 | | | | 11-1-2032 | | | | 1,135,000 | | | | 1,332,240 | |
| | | | |
California Statewide CDA Refunding Bond California Baptist University Series A 144A | | | 5.00 | | | | 11-1-2041 | | | | 2,875,000 | | | | 3,293,658 | |
| | | | |
California Statewide CDA School Facility Alliance for College-Ready Public Schools | | | 6.75 | | | | 7-1-2031 | | | | 1,625,000 | | | | 1,741,626 | |
| | | | |
California University Systemwide Refunding Bond Series A | | | 4.00 | | | | 11-1-2038 | | | | 8,000,000 | | | | 8,789,120 | |
| | | | |
California University Systemwide Refunding Bond Series A | | | 5.00 | | | | 11-1-2045 | | | | 6,400,000 | | | | 7,470,464 | |
| | | | |
University of California Series AI | | | 5.00 | | | | 5-15-2038 | | | | 2,000,000 | | | | 2,249,020 | |
| | | | |
University of California Series K | | | 4.00 | | | | 5-15-2046 | | | | 5,295,000 | | | | 5,694,825 | |
| |
| | | | 52,090,058 | |
| | | | | |
|
| GO Revenue: 30.39% | |
| | | | |
Alhambra CA Unified School District Election of 2008 Series B (AGM Insured) | | | 6.00 | | | | 8-1-2029 | | | | 4,100,000 | | | | 4,512,952 | |
| | | | |
Alvord CA Unified School District Election of 2012 Series A (AGM Insured) | | | 5.25 | | | | 8-1-2037 | | | | 1,620,000 | | | | 1,843,738 | |
Wells Fargo California Tax-Free Fund | 11
Portfolio of investments—June 30, 2019
| | | | | | | | | | | | | | | | |
| | | Interest
rate | | | Maturity
date | | | Principal | | | Value | |
|
| GO Revenue (continued) | |
| | | | |
Bassett CA Unified School District Refunding Bond Series B (Build America Mutual Assurance Company Insured) | | | 5.00 | % | | | 8-1-2027 | | | $ | 1,050,000 | | | $ | 1,248,818 | |
| | | | |
Beaumont CA Unified School District Election of 2008 Series D (Build America Mutual Assurance Company Insured) | | | 5.25 | | | | 8-1-2044 | | | | 2,000,000 | | | | 2,414,200 | |
| | | | |
Cabrillo CA Unified School District CAB Series A (Ambac Insured) ¤ | | | 0.00 | | | | 8-1-2021 | | | | 1,500,000 | | | | 1,453,875 | |
| | | | |
California | | | 5.25 | | | | 11-1-2040 | | | | 3,000,000 | | | | 3,149,970 | |
| | | | |
California Statewide Series B (1 Month LIBOR +0.76%)± | | | 2.46 | | | | 12-1-2031 | | | | 2,500,000 | | | | 2,512,625 | |
| | | | |
California Various Purposes | | | 5.00 | | | | 9-1-2029 | | | | 1,475,000 | | | | 1,590,478 | |
| | | | |
California Various Purposes | | | 5.00 | | | | 10-1-2029 | | | | 7,000,000 | | | | 7,065,450 | |
| | | | |
California Various Purposes | | | 5.00 | | | | 9-1-2032 | | | | 5,100,000 | | | | 5,835,165 | |
| | | | |
California Various Purposes | | | 5.00 | | | | 2-1-2038 | | | | 5,000,000 | | | | 5,571,200 | |
| | | | |
California Various Purposes | | | 5.00 | | | | 10-1-2039 | | | | 5,000,000 | | | | 5,881,950 | |
| | | | |
California Various Purposes | | | 5.00 | | | | 8-1-2046 | | | | 10,000,000 | | | | 11,742,300 | |
| | | | |
California Various Purposes | | | 5.00 | | | | 4-1-2049 | | | | 2,500,000 | | | | 3,055,900 | |
| | | | |
California Various Purposes | | | 5.25 | | | | 9-1-2028 | | | | 5,000,000 | | | | 5,418,000 | |
| | | | |
California Various Purposes | | | 5.25 | | | | 10-1-2029 | | | | 800,000 | | | | 807,936 | |
| | | | |
California Various Purposes | | | 5.25 | | | | 4-1-2035 | | | | 12,640,000 | | | | 13,981,357 | |
| | | | |
California Various Purposes | | | 5.60 | | | | 3-1-2036 | | | | 8,715,000 | | | | 8,957,016 | |
| | | | |
California Various Purposes Refunding Bond | | | 5.00 | | | | 9-1-2035 | | | | 35,000,000 | | | | 41,942,950 | |
| | | | |
Center Unified School District California CAB Series C (National Insured) ¤ | | | 0.00 | | | | 9-1-2021 | | | | 5,000,000 | | | | 4,841,150 | |
| | | | |
Centinela Valley CA Union High School District Election of 2008 Series B | | | 6.00 | | | | 8-1-2036 | | | | 2,500,000 | | | | 2,987,475 | |
| | | | |
Centinela Valley CA Union High School District Election of 2008 Series C | | | 5.00 | | | | 8-1-2035 | | | | 2,000,000 | | | | 2,314,760 | |
| | | | |
Cerritos CA Community College CAB Election of 2004 ¤ | | | 0.00 | | | | 8-1-2029 | | | | 1,750,000 | | | | 1,384,040 | |
| | | | |
Cerritos CA Community College CAB Election of 2004 ¤ | | | 0.00 | | | | 8-1-2033 | | | | 1,500,000 | | | | 1,028,325 | |
| | | | |
College of the Sequoias Tulare Area Improvement District #3 CAB Election of 2008 Series A (AGC Insured) ¤ | | | 0.00 | | | | 8-1-2024 | | | | 1,000,000 | | | | 913,510 | |
| | | | |
Compton CA Community College CAB Election of 2002 Series C ¤ | | | 0.00 | | | | 8-1-2035 | | | | 3,445,000 | | | | 2,077,886 | |
| | | | |
Contra Costa County CA Community College District Election of 2006 | | | 5.00 | | | | 8-1-2038 | | | | 3,250,000 | | | | 3,663,465 | |
| | | | |
Delano CA Union High School Election of 2010 Series B (AGM Insured) | | | 5.75 | | | | 8-1-2035 | | | | 4,510,000 | | | | 4,720,076 | |
| | | | |
Escondido CA Union High School CAB Election of 2008 Series A (AGC Insured) ¤ | | | 0.00 | | | | 8-1-2027 | | | | 8,385,000 | | | | 7,157,939 | |
| | | | |
Escondido CA Union School District | | | 4.00 | | | | 8-1-2043 | | | | 2,150,000 | | | | 2,346,532 | |
| | | | |
Garden Grove CA Unified School District Election of 2010 Series C | | | 5.25 | | | | 8-1-2037 | | | | 2,000,000 | | | | 2,282,160 | |
| | | | |
Gilroy CA Unified School District Election of 2008 Series A (AGC Insured) | | | 6.00 | | | | 8-1-2027 | | | | 1,000,000 | | | | 1,003,920 | |
| | | | |
Hayward CA Unified School District Refunding Bond | | | 5.00 | | | | 8-1-2038 | | | | 6,000,000 | | | | 6,823,260 | |
| | | | |
Inglewood CA Unified School District Election of 2012 Series B (Build America Mutual Assurance Company Insured) | | | 5.00 | | | | 8-1-2036 | | | | 200,000 | | | | 232,514 | |
| | | | |
Inglewood CA Unified School District Election of 2012 Series B (Build America Mutual Assurance Company Insured) | | | 5.00 | | | | 8-1-2038 | | | | 500,000 | | | | 577,300 | |
| | | | |
Long Beach CA Unified School District CAB Election of 2008 Series B ¤ | | | 0.00 | | | | 8-1-2035 | | | | 2,000,000 | | | | 1,269,060 | |
| | | | |
Long Beach CA Unified School District Prerefunded Bond Election of 2008 Series A | | | 5.50 | | | | 8-1-2026 | | | | 1,435,000 | | | | 1,439,994 | |
| | | | |
Long Beach CA Unified School District Unrefunded Bond Election of 2008 Series A | | | 5.50 | | | | 8-1-2026 | | | | 95,000 | | | | 95,326 | |
| | | | |
Los Angeles CA Community College District Refunding Bond | | | 4.00 | | | | 8-1-2038 | | | | 10,000,000 | | | | 11,025,500 | |
| | | | |
Lynwood CA Unified School District Election of 2012 Series A (AGM Insured) | | | 5.00 | | | | 8-1-2033 | | | | 5,000 | | | | 5,604 | |
| | | | |
Merced CA City School District Election of 2014 | | | 5.00 | | | | 8-1-2045 | | | | 1,000,000 | | | | 1,161,490 | |
| | | | |
Merced CA Union High School District CAB Series C ¤ | | | 0.00 | | | | 8-1-2032 | | | | 3,380,000 | | | | 2,411,562 | |
| | | | |
Mount San Antonio CA Community College District CAB Election of 2008 Series A ¤ | | | 0.00 | | | | 8-1-2024 | | | | 1,610,000 | | | | 1,481,168 | |
| | | | |
Natomas CA Unified School District Series 1999 (National Insured) | | | 5.95 | | | | 9-1-2021 | | | | 285,000 | | | | 299,022 | |
| | | | |
Norwalk-La Mirada CA Unified School District CAB Election of 2002 Series D (AGM Insured) ¤ | | | 0.00 | | | | 8-1-2023 | | | | 1,500,000 | | | | 1,405,020 | |
| | | | |
Oakland CA Unified School District Alameda County | | | 5.00 | | | | 8-1-2029 | | | | 10,125,000 | | | | 12,179,464 | |
12 | Wells Fargo California Tax-Free Fund
Portfolio of investments—June 30, 2019
| | | | | | | | | | | | | | | | |
| | | Interest
rate | | | Maturity
date | | | Principal | | | Value | |
|
| GO Revenue (continued) | |
| | | | |
Oakland CA Unified School District Election of 2012 | | | 5.50 | % | | | 8-1-2023 | | | $ | 500,000 | | | $ | 568,635 | |
| | | | |
Oakland CA Unified School District Election of 2012 | | | 6.63 | | | | 8-1-2038 | | | | 7,750,000 | | | | 8,628,307 | |
| | | | |
Oakland CA Unified School District Election of 2012 Series A | | | 5.00 | | | | 8-1-2040 | | | | 3,500,000 | | | | 3,973,655 | |
| | | | |
Oxnard CA School District Election of 2012 Series D (AGM Insured) | | | 5.00 | | | | 8-1-2034 | | | | 1,695,000 | | | | 2,007,982 | |
| | | | |
Pajaro Valley CA Unified School District Election of 2012 Series A | | | 5.00 | | | | 8-1-2038 | | | | 1,700,000 | | | | 1,916,988 | |
| | | | |
Paramount CA Unified School District CAB Election of 2006 ¤ | | | 0.00 | | | | 8-1-2033 | | | | 2,500,000 | | | | 1,664,625 | |
| | | | |
Pomona CA Unified School District Series A (National Insured) | | | 6.55 | | | | 8-1-2029 | | | | 1,480,000 | | | | 1,905,692 | |
| | | | |
Poway CA Unified School District CAB Election of 2008 ImprovementDistrict 07-1-A ¤ | | | 0.00 | | | | 8-1-2024 | | | | 1,800,000 | | | | 1,653,462 | |
| | | | |
Rialto CA Unified School District CAB Election of 2010 Series A (AGM Insured) ¤ | | | 0.00 | | | | 8-1-2026 | | | | 3,320,000 | | | | 2,910,246 | |
| | | | |
Sacramento CA Unified School District Election of 2012 Series A (Build America Mutual Assurance Company Insured) | | | 5.25 | | | | 8-1-2033 | | | | 1,000,000 | | | | 1,130,530 | |
| | | | |
Sacramento CA Unified School District Election of 2012 Series C (AGM Insured) | | | 5.00 | | | | 8-1-2033 | | | | 2,735,000 | | | | 3,166,993 | |
| | | | |
San Bernardino County CA Community Election of 2008 Series D | | | 5.00 | | | | 8-1-2045 | | | | 2,000,000 | | | | 2,316,800 | |
| | | | |
San Bernardino County CA Unified School District Election of 2012 Series C (AGM Insured) | | | 5.00 | | | | 8-1-2040 | | | | 8,000,000 | | | | 9,327,440 | |
| | | | |
San Diego CA Community College Election of 2002 | | | 5.00 | | | | 8-1-2031 | | | | 4,000,000 | | | | 4,582,920 | |
| | | | |
San Diego CA Unified School District | | | 4.00 | | | | 7-1-2047 | | | | 2,025,000 | | | | 2,203,949 | |
| | | | |
San Gorgonio CA Memorial Healthcare Refunding Bond | | | 5.00 | | | | 8-1-2032 | | | | 1,750,000 | | | | 1,940,067 | |
| | | | |
San Gorgonio CA Memorial Healthcare Refunding Bond | | | 5.50 | | | | 8-1-2028 | | | | 2,525,000 | | | | 2,919,456 | |
| | | | |
San Joaquin CA Delta Community College District Election of 2004 Series C | | | 5.00 | | | | 8-1-2033 | | | | 3,195,000 | | | | 3,724,955 | |
| | | | |
San Joaquin CA Delta Community College District Election of 2004 Series C | | | 5.00 | | | | 8-1-2034 | | | | 3,315,000 | | | | 3,849,047 | |
| | | | |
San Jose CA Libraries & Parks Project | | | 5.13 | | | | 9-1-2031 | | | | 2,040,000 | | | | 2,045,977 | |
| | | | |
San Jose CA Unified School District Santa Clara County %% | | | 4.00 | | | | 8-1-2042 | | | | 4,000,000 | | | | 4,473,200 | |
| | | | |
San Mateo County CA Jefferson Union High School District CAB Election of 2006 Series D ¤ | | | 0.00 | | | | 8-1-2033 | | | | 7,000,000 | | | | 2,565,710 | |
| | | | |
San Mateo County CA Jefferson Union High School District CAB Election of 2006 Series D ¤ | | | 0.00 | | | | 8-1-2036 | | | | 11,130,000 | | | | 3,185,851 | |
| | | | |
San Mateo County CA Jefferson Union High School District Prerefunded CAB Election of 2006 Series D ¤ | | | 0.00 | | | | 8-1-2034 | | | | 6,915,000 | | | | 2,333,190 | |
| | | | |
San Mateo County CA Jefferson Union High School District Unrefunded CAB Election of 2006 Series D ¤ | | | 0.00 | | | | 8-1-2034 | | | | 2,990,000 | | | | 1,007,809 | |
| | | | |
San Rafael CA City High School District CAB Election of 2002 Series B (National Insured) ¤ | | | 0.00 | | | | 8-1-2023 | | | | 1,260,000 | | | | 1,180,217 | |
| | | | |
Sanger CA Unified School District Refunding Bond (National Insured) | | | 5.60 | | | | 8-1-2023 | | | | 655,000 | | | | 691,117 | |
| | | | |
Santa Ana CA Unified School District CAB Election of 2008 Series B (AGC Insured) ¤ | | | 0.00 | | | | 8-1-2038 | | | | 15,000,000 | | | | 8,394,600 | |
| | | | |
Santa Rosa CA High School District Prerefunded Bond | | | 5.00 | | | | 8-1-2024 | | | | 750,000 | | | | 837,382 | |
| | | | |
Santa Rosa CA High School District Unrefunded Bond | | | 5.00 | | | | 8-1-2024 | | | | 255,000 | | | | 283,155 | |
| | | | |
Sierra Kings CA Health Care District | | | 5.00 | | | | 8-1-2028 | | | | 1,000,000 | | | | 1,169,690 | |
| | | | |
Sierra Kings CA Health Care District | | | 5.00 | | | | 8-1-2032 | | | | 1,500,000 | | | | 1,721,445 | |
| | | | |
Sierra Kings CA Health Care District | | | 5.00 | | | | 8-1-2037 | | | | 1,750,000 | | | | 1,984,815 | |
| | | | |
Simi Valley CA Unified School District | | | 4.00 | | | | 8-1-2048 | | | | 3,250,000 | | | | 3,537,137 | |
| | | | |
Sonoma Valley CA Unified School District CAB Election of 2010 Series A ¤ | | | 0.00 | | | | 8-1-2027 | | | | 1,020,000 | | | | 862,410 | |
| | | | |
South Pasadena CA Unified School District Series A (FGIC Insured) | | | 5.55 | | | | 11-1-2020 | | | | 220,000 | | | | 227,944 | |
| | | | |
Stockton CA Unified School District Election of 2012 Series A (AGM Insured) | | | 5.00 | | | | 8-1-2038 | | | | 1,025,000 | | | | 1,162,473 | |
| | | | |
Washington Township CA Health Care District Election of 2004 Series B | | | 5.50 | | | | 8-1-2038 | | | | 1,500,000 | | | | 1,761,480 | |
| | | | |
West Contra Costa CA Unified School District (AGM Insured) | | | 5.25 | | | | 8-1-2024 | | | | 1,350,000 | | | | 1,461,524 | |
| | | | |
West Contra Costa CA Unified School District CAB Election of 2005 Series B | | | 6.00 | | | | 8-1-2027 | | | | 1,080,000 | | | | 1,460,495 | |
| | | | |
West Contra Costa CA Unified School District CAB Election of 2005 SeriesC-1 (AGC Insured) ¤ | | | 0.00 | | | | 8-1-2021 | | | | 6,000,000 | | | | 5,814,300 | |
| | | | |
Wiseburn CA School District CAB (AGC Insured) ¤ | | | 0.00 | | | | 8-1-2027 | | | | 1,525,000 | | | | 1,308,099 | |
| |
| | | | 315,975,171 | |
| | | | | |
Wells Fargo California Tax-Free Fund | 13
Portfolio of investments—June 30, 2019
| | | | | | | | | | | | | | | | |
| | | Interest
rate | | | Maturity
date | | | Principal | | | Value | |
| Health Revenue: 13.87% | |
| | | | |
Association of Bay Area Governments California Finance Authority for Nonprofit Corporation Insured O’Connor Woods Project | | | 5.00 | % | | | 1-1-2043 | | | $ | 5,000,000 | | | $ | 5,521,250 | |
| | | | |
Association of Bay Area Governments California Finance Authority for Nonprofit Corporation Insured Senior Living Odd Fellows Home of California Series A | | | 5.00 | | | | 4-1-2042 | | | | 1,100,000 | | | | 1,211,606 | |
| | | | |
California HFFA Catholic Healthcare West Series A | | | 5.25 | | | | 3-1-2023 | | | | 3,000,000 | | | | 3,180,360 | |
| | | | |
California HFFA Catholic Healthcare West Series A | | | 6.00 | | | | 7-1-2029 | | | | 4,000,000 | | | | 4,000,000 | |
| | | | |
California HFFA El Camino Hospital | | | 5.00 | | | | 2-1-2035 | | | | 3,000,000 | | | | 3,579,900 | |
| | | | |
California HFFA LA Biomedical Research Institutute at Harbor-UCLA Medical Center | | | 5.00 | | | | 9-1-2048 | | | | 6,095,000 | | | | 6,963,598 | |
| | | | |
California HFFA Nevada Methodist Homes | | | 5.00 | | | | 7-1-2030 | | | | 1,830,000 | | | | 2,168,971 | |
| | | | |
California HFFA Nevada Methodist Homes | | | 5.00 | | | | 7-1-2035 | | | | 1,000,000 | | | | 1,168,430 | |
| | | | |
California HFFA Nevada Methodist Homes | | | 5.00 | | | | 7-1-2045 | | | | 4,500,000 | | | | 5,144,265 | |
| | | | |
California HFFA Refunding Bond Cedars Sinai Medical Center Series B | | | 4.00 | | | | 8-15-2039 | | | | 10,500,000 | | | | 11,399,430 | |
| | | | |
California HFFA Refunding Bond Children’s Hospital Series A | | | 5.00 | | | | 8-15-2047 | | | | 5,000,000 | | | | 5,824,050 | |
| | | | |
California HFFA Sutter Health Series B | | | 5.00 | | | | 11-15-2046 | | | | 5,000,000 | | | | 5,854,150 | |
| | | | |
California HFFA Sutter Health Series D | | | 5.25 | | | | 8-15-2031 | | | | 3,100,000 | | | | 3,347,163 | |
| | | | |
California Municipal Finance Authority Refunding Bond Channing House Project Series A | | | 5.00 | | | | 5-15-2034 | | | | 1,000,000 | | | | 1,203,580 | |
| | | | |
California Municipal Finance Authority Refunding Bond Community Medical Centers Series A | | | 5.00 | | | | 2-1-2047 | | | | 6,625,000 | | | | 7,543,888 | |
| | | | |
California Municipal Finance Authority Refunding Bond Eisenhower Medical Center Series A | | | 5.00 | | | | 7-1-2047 | | | | 1,400,000 | | | | 1,591,282 | |
| | | | |
California PFA Refunding Bond Henry Mayo Newhall Hospital | | | 5.00 | | | | 10-15-2037 | | | | 500,000 | | | | 564,745 | |
| | | | |
California PFA Refunding Bond Henry Mayo Newhall Hospital | | | 5.00 | | | | 10-15-2047 | | | | 5,265,000 | | | | 5,873,950 | |
| | | | |
California State Health Facilities Financing Authority | | | 4.00 | | | | 11-15-2048 | | | | 5,000,000 | | | | 5,391,600 | |
| | | | |
California State Health Facilities Financing Authority | | | 4.00 | | | | 11-1-2051 | | | | 3,000,000 | | | | 3,244,350 | |
| | | | |
California State Municipal Finance Authority Revenue | | | 5.00 | | | | 7-1-2039 | | | | 1,000,000 | | | | 1,229,230 | |
| | | | |
California State Municipal Finance Authority Revenue | | | 5.00 | | | | 7-1-2049 | | | | 2,650,000 | | | | 3,207,004 | |
| | | | |
California State Municipal Finance Authority Senior Living Revenue %% | | | 5.00 | | | | 11-15-2049 | | | | 1,125,000 | | | | 1,297,609 | |
| | | | |
California Statewide CDA Adventist Health System Series A | | | 5.00 | | | | 3-1-2045 | | | | 2,500,000 | | | | 2,880,150 | |
| | | | |
California Statewide CDA Enloe Medical Center (Ambac Insured) | | | 5.00 | | | | 8-15-2033 | | | | 1,650,000 | | | | 1,949,657 | |
| | | | |
California Statewide CDA Enloe Medical Center (Ambac Insured) | | | 5.00 | | | | 8-15-2035 | | | | 1,000,000 | | | | 1,174,240 | |
| | | | |
California Statewide CDA Enloe Medical Center (Ambac Insured) | | | 5.00 | | | | 8-15-2038 | | | | 2,000,000 | | | | 2,328,860 | |
| | | | |
California Statewide CDA Loma Linda University Medical Center Refunding Bond Series A | | | 5.25 | | | | 12-1-2044 | | | | 5,150,000 | | | | 5,677,618 | |
| | | | |
California Statewide CDA Redwoods Projects | | | 5.13 | | | | 11-15-2035 | | | | 1,500,000 | | | | 1,705,860 | |
| | | | |
California Statewide CDA Revenue Refunding Bond Adventist Health System West Series A | | | 5.00 | | | | 3-1-2048 | | | | 5,000,000 | | | | 5,889,750 | |
| | | | |
California Statewide Communities Marin General Hospital Series A | | | 5.00 | | | | 8-1-2036 | | | | 700,000 | | | | 847,497 | |
| | | | |
California Statewide Communities Marin General Hospital Series A | | | 5.00 | | | | 8-1-2037 | | | | 500,000 | | | | 603,295 | |
| | | | |
California Statewide Communities Marin General Hospital Series A | | | 5.00 | | | | 8-1-2038 | | | | 450,000 | | | | 540,027 | |
| | | | |
California Statewide Communities Development Authority | | | 5.00 | | | | 2-1-2045 | | | | 2,505,000 | | | | 2,739,769 | |
| | | | |
Palomar Health CA Refunding Bond | | | 5.00 | | | | 11-1-2042 | | | | 4,000,000 | | | | 4,474,960 | |
| | | | |
San Buenaventura CA Community Mental Health System | | | 8.00 | | | | 12-1-2031 | | | | 1,615,000 | | | | 1,825,580 | |
| | | | |
University of California Regents Medical Center Prerefunded Bond Series J | | | 5.25 | | | | 5-15-2038 | | | | 7,790,000 | | | | 8,985,687 | |
| | | | |
University of California Regents Medical Center Series J | | | 5.00 | | | | 5-15-2033 | | | | 2,265,000 | | | | 2,600,560 | |
| | | | |
University of California Regents Medical Center Series L | | | 4.00 | | | | 5-15-2044 | | | | 4,065,000 | | | | 4,375,891 | |
| | | | |
University of California Regents Medical Center Unrefunded Bond Series J | | | 5.25 | | | | 5-15-2038 | | | | 2,210,000 | | | | 2,499,576 | |
| | | | |
Washington Township CA Health Care District Series A | | | 5.00 | | | | 7-1-2026 | | | | 1,190,000 | | | | 1,394,906 | |
| | | | |
Washington Township CA Health Care District Series A | | | 5.00 | | | | 7-1-2042 | | | | 1,000,000 | | | | 1,147,360 | |
| |
| | | | 144,151,654 | |
| | | | | |
14 | Wells Fargo California Tax-Free Fund
Portfolio of investments—June 30, 2019
| | | | | | | | | | | | | | | | |
| | | Interest
rate | | | Maturity
date | | | Principal | | | Value | |
| Housing Revenue: 2.47% | |
| | | | |
California Community Housing Agency Workforce Apartments Series A 144A | | | 5.00 | % | | | 4-1-2049 | | | $ | 3,000,000 | | | $ | 3,293,370 | |
| | | | |
California Municipal Finance AuthorityLLC-West Village Student Housing Project | | | 5.00 | | | | 5-15-2048 | | | | 6,700,000 | | | | 7,818,297 | |
| | | | |
California Municipal Finance Authority Mobile Senior Caritas Projects Series A | | | 5.00 | | | | 8-15-2029 | | | | 500,000 | | | | 588,115 | |
| | | | |
California PFA Claremont Properties LLC University Housing Project Series A 144A | | | 5.00 | | | | 7-1-2047 | | | | 2,950,000 | | | | 3,018,293 | |
| | | | |
California Statewide CDA College Housing Series 2019 144A | | | 5.25 | | | | 7-1-2049 | | | | 2,000,000 | | | | 2,260,660 | |
| | | | |
California Statewide CDA Poway Retirement Housing Foundation Housing Incorporated Series A | | | 5.25 | | | | 11-15-2035 | | | | 1,500,000 | | | | 1,719,120 | |
| | | | |
California Statewide Communities Development Authority 144A | | | 5.00 | | | | 6-1-2051 | | | | 1,440,000 | | | | 1,628,597 | |
| | | | |
Contra Costa County CA Home Mortgage Revenue Bonds GNMA Mortgage-Backed Securities Program (GNMA Insured) | | | 7.75 | | | | 5-1-2022 | | | | 90,000 | | | | 98,422 | |
| | | | |
Independent Cities CA Finance Authority Mobil Home Park Revenue | | | 5.00 | | | | 5-15-2048 | | | | 2,000,000 | | | | 2,341,300 | |
| | | | |
Independent Cities California Finance Refunding Bond Sanitary Juan Mobile Estates | | | 5.00 | | | | 8-15-2030 | | | | 1,000,000 | | | | 1,140,790 | |
| | | | |
Independent Cities California Finance Refunding Bond Santa Rose Leisure Mobile | | | 5.00 | | | | 8-15-2046 | | | | 1,570,000 | | | | 1,801,230 | |
| |
| | | | 25,708,194 | |
| | | | | |
|
| Industrial Development Revenue: 0.21% | |
| | | | |
California PCFA Solid Waste Disposal AMT Green Bond Calplant I Project 144A | | | 8.00 | | | | 7-1-2039 | | | | 2,000,000 | | | | 2,171,840 | |
| | | | | | | | | | | | | | | | |
|
| Miscellaneous Revenue: 16.54% | |
| | | | |
Alameda CA Joint Powers Authority Multiple Capital Projects Series A | | | 5.00 | | | | 12-1-2034 | | | | 1,005,000 | | | | 1,144,162 | |
| | | | |
Anaheim CA PFA CAB Subordinate Lien Public Improvements Project Series C (AGM Insured) ¤ | | | 0.00 | | | | 9-1-2025 | | | | 10,000,000 | | | | 8,888,200 | |
| | | | |
Anaheim CA PFA Convention Center Expansion Project Series A | | | 5.00 | | | | 5-1-2039 | | | | 3,000,000 | | | | 3,422,640 | |
| | | | |
Anaheim CA PFA Convention Center Expansion Project Series A | | | 5.00 | | | | 5-1-2046 | | | | 3,000,000 | | | | 3,401,460 | |
| | | | |
California Infrastructure & Economic Development King City Joint Union High School | | | 5.75 | | | | 8-15-2029 | | | | 2,150,000 | | | | 2,209,082 | |
| | | | |
California Public Works Board California State University Projects SeriesB-1 | | | 5.70 | | | | 3-1-2035 | | | | 2,210,000 | | | | 2,271,637 | |
| | | | |
California Public Works Board Judicial Council Projects Series A | | | 5.00 | | | | 3-1-2038 | | | | 7,000,000 | | | | 7,777,350 | |
| | | | |
California Public Works Board Judicial Council Projects Series D | | | 5.25 | | | | 12-1-2025 | | | | 4,000,000 | | | | 4,374,200 | |
| | | | |
California Public Works Board Various Capital Projects Series A | | | 5.00 | | | | 4-1-2037 | | | | 4,925,000 | | | | 5,369,826 | |
| | | | |
California Public Works Board Various Capital Projects Series G | | | 5.00 | | | | 11-1-2037 | | | | 23,000,000 | | | | 25,488,600 | |
| | | | |
California Public Works Board Various Capital Projects Series I | | | 5.50 | | | | 11-1-2033 | | | | 2,000,000 | | | | 2,334,520 | |
| | | | |
California Public Works University of California Board of Regents Series G | | | 5.00 | | | | 12-1-2030 | | | | 9,850,000 | | | | 10,762,504 | |
| | | | |
California Statewide Communities Series A | | | 5.00 | | | | 9-2-2047 | | | | 2,000,000 | | | | 2,294,780 | |
| | | | |
Compton CA PFA Refunding Bond 144A | | | 4.00 | | | | 9-1-2027 | | | | 3,800,000 | | | | 3,887,096 | |
| | | | |
Compton CA PFA Refunding Bond 144A | | | 4.50 | | | | 9-1-2032 | | | | 2,000,000 | | | | 2,064,040 | |
| | | | |
Emeryville CA PFA Assessment District Refinancing | | | 5.90 | | | | 9-2-2021 | | | | 765,000 | | | | 766,966 | |
| | | | |
Fullerton CA Joint Union High School Project Certificate of Participation (Build America Mutual Assurance Company Insured) | | | 5.00 | | | | 9-1-2035 | | | | 1,385,000 | | | | 1,607,154 | |
| | | | |
Irvine CA Improvement Bond Act 1915 Limited Obligation ReassessmentDistrict #15-2 | | | 5.00 | | | | 9-2-2025 | | | | 725,000 | | | | 851,186 | |
| | | | |
Irvine CA Improvement Bond Act 1915 Limited Obligation ReassessmentDistrict #15-2 | | | 5.00 | | | | 9-2-2026 | | | | 400,000 | | | | 467,284 | |
| | | | |
Irvine CA Improvement Bond Act 1915 Limited Obligation ReassessmentDistrict #15-2 | | | 5.00 | | | | 9-2-2042 | | | | 1,500,000 | | | | 1,673,775 | |
| | | | |
Los Angeles CA Certificate of Participation Sonneblick del Rio Project (Ambac Insured) | | | 6.00 | | | | 11-1-2019 | | | | 535,000 | | | | 536,974 | |
| | | | |
Los Angeles CA Community Redevelopment Vermont Manchester Social Services Project (Ambac Insured) | | | 5.00 | | | | 9-1-2025 | | | | 2,310,000 | | | | 2,316,653 | |
| | | | |
Los Angeles CA Public Works Financing Authority Series A | | | 5.00 | | | | 12-1-2039 | | | | 2,860,000 | | | | 3,279,162 | |
Wells Fargo California Tax-Free Fund | 15
Portfolio of investments—June 30, 2019
| | | | | | | | | | | | | | | | |
| | | Interest
rate | | | Maturity
date | | | Principal | | | Value | |
|
| Miscellaneous Revenue (continued) | |
| | | | |
Modesto CA Irrigation District Financing Authority Series A | | | 5.00 | % | | | 10-1-2040 | | | $ | 3,500,000 | | | $ | 4,072,530 | |
| | | | |
Montclair CA PFA Lease Refunding Bond (AGM Insured) | | | 5.00 | | | | 10-1-2035 | | | | 2,400,000 | | | | 2,754,840 | |
| | | | |
Richmond CA Joint Powers Financing Authority Civic Center Project Series A (AGC Insured) | | | 5.88 | | | | 8-1-2037 | | | | 5,000,000 | | | | 5,017,100 | |
| | | | |
Richmond CA Joint Powers Financing Authority Point Potrero Series A | | | 6.25 | | | | 7-1-2024 | | | | 7,500,000 | | | | 7,529,250 | |
| | | | |
Riverside County CA Asset Leasing Corporation Riverside County Hospital Project (National Insured) ¤ | | | 0.00 | | | | 6-1-2026 | | | | 10,000,000 | | | | 8,654,700 | |
| | | | |
Sacramento CA City Financing Authority Refunding Bond Master Lease Program Facilities (Build America Mutual Assurance Company Insured) | | | 5.00 | | | | 12-1-2035 | | | | 1,300,000 | | | | 1,528,254 | |
| | | | |
Sacramento CA City Financing Authority Series A (Ambac Insured) | | | 5.40 | | | | 11-1-2020 | | | | 920,000 | | | | 948,630 | |
| | | | |
Sacramento CA City School Joint Refunding Bond Series A (Build America Mutual Assurance Company Insured) | | | 5.00 | | | | 3-1-2040 | | | | 2,165,000 | | | | 2,399,989 | |
| | | | |
San Bernardino County CA Certificate of Participation Arrowhead Project Series A | | | 5.50 | | | | 8-1-2020 | | | | 6,000,000 | | | | 6,021,360 | |
| | | | |
San Bernardino County CA Certificate of Participation Medical Center Financing Project (National Insured) | | | 5.00 | | | | 8-1-2028 | | | | 5,720,000 | | | | 5,840,349 | |
| | | | |
San Francisco CA City & County Certificate of Participation Multiple Capital Improvement Projects Series A | | | 5.20 | | | | 4-1-2026 | | | | 3,000,000 | | | | 3,009,060 | |
| | | | |
San Jose CA Unified School District CAB (AGM Insured) ¤ | | | 0.00 | | | | 1-1-2021 | | | | 1,205,000 | | | | 1,182,900 | |
| | | | |
San Jose CA Unified School District CAB (AGM Insured) ¤ | | | 0.00 | | | | 1-1-2026 | | | | 3,175,000 | | | | 2,862,707 | |
| | | | |
San Marino CA Unified School District Certificate of Participation Los Angeles County Schools Pooled Financing Program Series A | | | 5.00 | | | | 12-1-2041 | | | | 500,000 | | | | 500,775 | |
| | | | |
San Ysidro CA School District Certificate of Participation School Facilities Bridge Funding Program (Build America Mutual Assurance Company Insured) | | | 5.00 | | | | 9-1-2037 | | | | 250,000 | | | | 275,363 | |
| | | | |
San Ysidro CA School District Certificate of Participation School Facilities Bridge Funding Program (Build America Mutual Assurance Company Insured) | | | 5.00 | | | | 9-1-2042 | | | | 625,000 | | | | 684,969 | |
| | | | |
San Ysidro CA School District Certificate of Participation School Facilities Bridge Funding Program (Build America Mutual Assurance Company Insured) | | | 5.00 | | | | 9-1-2047 | | | | 1,000,000 | | | | 1,091,370 | |
| | | | |
Simi Valley CA Unified School District Capital Improvement Projects (Ambac Insured) | | | 5.25 | | | | 8-1-2022 | | | | 1,330,000 | | | | 1,412,580 | |
| | | | |
Stockton CA Unified School District Community Improvement Project | | | 5.00 | | | | 2-1-2033 | | | | 550,000 | | | | 663,702 | |
| | | | |
Sutter Butte CA Flood Control Agency (Build America Mutual Assurance Company Insured) | | | 5.00 | | | | 10-1-2040 | | | | 3,545,000 | | | | 4,082,387 | |
| | | | |
Torrance CA Certificate of Participation | | | 5.25 | | | | 6-1-2039 | | | | 5,385,000 | | | | 6,251,123 | |
| | | | |
Tracy CA Operating Partnership Joint Powers Authority Capital Improvement Projects (AGC Insured) | | | 6.25 | | | | 10-1-2033 | | | | 1,000,000 | | | | 1,003,700 | |
| | | | |
Upland CA Certificate of Participation San Antonio Regional Hospital | | | 5.00 | | | | 1-1-2047 | | | | 1,955,000 | | | | 2,220,684 | |
| | | | |
Ventura County CA PFA Series A | | | 5.00 | | | | 11-1-2038 | | | | 4,250,000 | | | | 4,712,782 | |
| |
| | | | 171,910,355 | |
| | | | | |
|
| Tax Revenue: 11.54% | |
| | | | |
Beaumont CA Community Facilities District#93-1 Special Tax Improvement Area Number 17C | | | 5.00 | | | | 9-1-2043 | | | | 750,000 | | | | 855,188 | |
| | | | |
Beaumont CA Community Facilities District#93-1 Special Tax Improvement Area Number 17C | | | 5.00 | | | | 9-1-2048 | | | | 1,100,000 | | | | 1,249,094 | |
| | | | |
Beaumont CA Community Facilities District#93-1 Special Tax Improvement Area Number 8D Series A | | | 5.00 | | | | 9-1-2043 | | | | 750,000 | | | | 855,188 | |
| | | | |
Beaumont CA Community Facilities District#93-1 Special Tax Improvement Area Number 8D Series A | | | 5.00 | | | | 9-1-2048 | | | | 1,035,000 | | | | 1,175,284 | |
| | | | |
Belmont CA Community Facilities Special Tax District#2000-1 Library Project Series A (Ambac Insured) | | | 5.75 | | | | 8-1-2030 | | | | 3,190,000 | | | | 4,269,464 | |
16 | Wells Fargo California Tax-Free Fund
Portfolio of investments—June 30, 2019
| | | | | | | | | | | | | | | | |
| | | Interest
rate | | | Maturity
date | | | Principal | | | Value | |
|
| Tax Revenue (continued) | |
| | | | |
California Statewide CDA Community Facilities District#2015-01 | | | 5.00 | % | | | 9-1-2047 | | | $ | 1,420,000 | | | $ | 1,623,926 | |
| | | | |
California Statewide Communities Development Authority Special Tax Community Facilities District#2017-01 | | | 5.00 | | | | 9-1-2048 | | | | 5,000,000 | | | | 5,786,050 | |
| | | | |
Casitas CA Municipal Water District Community Facilities District#2013-1-OJAI Series B (Build America Mutual Assurance Company Insured) | | | 5.25 | | | | 9-1-2047 | | | | 5,000,000 | | | | 6,065,400 | |
| | | | |
Cathedral City CA RDA Successor Agency to Merged Redevelopment Project Tax Allocation Bond Series A (AGM Insured) | | | 5.00 | | | | 8-1-2032 | | | | 1,450,000 | | | | 1,656,291 | |
| | | | |
Cathedral City CA RDA Successor Agency to Merged Redevelopment Project Tax Allocation Bond Series A (AGM Insured) | | | 5.00 | | | | 8-1-2033 | | | | 880,000 | | | | 1,002,390 | |
| | | | |
Chino CA Community Facilitiess District Special Tax#2003-3 Improvement Area #7 | | | 5.00 | | | | 9-1-2048 | | | | 2,500,000 | | | | 2,892,575 | |
| | | | |
Chula Vista CA Community Facilities District Special Tax #16I Improvement Area #1 | | | 5.00 | | | | 9-1-2043 | | | | 500,000 | | | | 569,795 | |
| | | | |
Chula Vista CA Community Facilities District Special Tax #16I Improvement Area #1 | | | 5.00 | | | | 9-1-2048 | | | | 1,000,000 | | | | 1,135,730 | |
| | | | |
Compton CA Community College RDA Project 2nd Lien Series A | | | 5.00 | | | | 8-1-2020 | | | | 1,140,000 | | | | 1,176,605 | |
| | | | |
Corona CA Community Facilities District Special Tax #2018-1 Improvement Area #1 Series A | | | 5.00 | | | | 9-1-2048 | | | | 1,000,000 | | | | 1,115,060 | |
| | | | |
Corona Norco CA Unified School Districts Special Tax Community Facilities District#16-1 | | | 5.00 | | | | 9-1-2048 | | | | 1,500,000 | | | | 1,703,520 | |
| | | | |
Dinuba CA RDA Merged City Redevelopment Project (Build America Mutual Assurance Company Insured) | | | 5.00 | | | | 9-1-2033 | | | | 1,500,000 | | | | 1,736,955 | |
| | | | |
Elk Grove CA Financing Authority Special Tax Refunding Bond (Build America Mutual Assurance Company Insured) | | | 5.00 | | | | 9-1-2038 | | | | 1,500,000 | | | | 1,738,170 | |
| | | | |
Folsom Ranch Financing Authority California Facilities District #20 Russell | | | 5.00 | | | | 9-1-2048 | | | | 1,650,000 | | | | 1,872,569 | |
| | | | |
Fremont CA Community Facilities District #1 Refunding Bond | | | 5.00 | | | | 9-1-2040 | | | | 2,700,000 | | | | 3,018,465 | |
| | | | |
Inglewood CA Redevelopment Successor Agency to Merged Redevelopment Project Tax Allocation Refunding Bond Subordinate Lien Series A (Build America Mutual Assurance Company Insured) | | | 5.00 | | | | 5-1-2034 | | | | 500,000 | | | | 596,250 | |
| | | | |
Inglewood CA Redevelopment Successor Agency to Merged Redevelopment Project Tax Allocation Refunding Bond Subordinate Lien Series A (Build America Mutual Assurance Company Insured) | | | 5.00 | | | | 5-1-2038 | | | | 305,000 | | | | 358,518 | |
| | | | |
Inland Valley CA Development Agency Series A | | | 5.25 | | | | 9-1-2037 | | | | 4,000,000 | | | | 4,567,880 | |
| | | | |
Lafayette CA RDA Refunding Bond Lafayette Redevelopment Project (AGM Insured) | | | 5.00 | | | | 8-1-2033 | | | | 1,500,000 | | | | 1,723,440 | |
| | | | |
Lafayette CA RDA Refunding Bond Lafayette Redevelopment Project (AGM Insured) | | | 5.00 | | | | 8-1-2038 | | | | 1,635,000 | | | | 1,865,257 | |
| | | | |
Lancaster CA RDA Tax Allocation Combined Redevelopment Project Areas | | | 6.50 | | | | 8-1-2029 | | | | 2,000,000 | | | | 2,008,460 | |
| | | | |
Lancaster CA RDA Tax Allocation Refunding Bond Combined Redevelopment Project Areas (AGM Insured) | | | 5.00 | | | | 8-1-2033 | | | | 1,200,000 | | | | 1,430,496 | |
| | | | |
Oakland CA Redevelopment Successor Agency Refunding Bond Subordinate Series TE (AGM Insured) | | | 5.00 | | | | 9-1-2035 | | | | 2,545,000 | | | | 2,962,787 | |
| | | | |
Oakland CA Redevelopment Successor Agency Refunding Bond Subordinate Series TE (AGM Insured) | | | 5.00 | | | | 9-1-2036 | | | | 4,000,000 | | | | 4,645,680 | |
| | | | |
Orange County CA Community Facilities District#2015-1 Esencia Village Series A | | | 5.25 | | | | 8-15-2045 | | | | 2,000,000 | | | | 2,253,380 | |
| | | | |
Rancho Cucamonga CA RDA Rancho Redevelopment Project Area (AGM Insured) | | | 5.00 | | | | 9-1-2032 | | | | 1,870,000 | | | | 2,158,691 | |
| | | | |
Redwood City CA RDA CAB Redevelopment Project Area Series2-A (Ambac Insured) ¤ | | | 0.00 | | | | 7-15-2030 | | | | 3,505,000 | | | | 2,622,161 | |
| | | | |
Rio Vista CA Community Facilities District Special Tax#2018-1 | | | 5.00 | | | | 9-1-2048 | | | | 1,190,000 | | | | 1,351,531 | |
| | | | |
Riverside County CA Community Facilities Districts Special Tax#05-8 | | | 5.00 | | | | 9-1-2048 | | | | 1,600,000 | | | | 1,816,464 | |
| | | | |
Romoland School District Community Facilities District#2004-1 Heritage Lake Improvement Area #4 Series 2018 Special Tax Bond | | | 5.00 | | | | 9-1-2048 | | | | 3,000,000 | | | | 3,407,880 | |
Wells Fargo California Tax-Free Fund | 17
Portfolio of investments—June 30, 2019
| | | | | | | | | | | | | | | | |
| | | Interest
rate | | | Maturity
date | | | Principal | | | Value | |
|
| Tax Revenue (continued) | |
| | | | |
Sacramento CA Transient Occupancy Tax Convention Center Complex Series A | | | 5.00 | % | | | 6-1-2048 | | | $ | 3,750,000 | | | $ | 4,452,487 | |
| | | | |
San Bernardino CA Special Tax Community Facilities District#2006-1 Series 2018 | | | 5.00 | | | | 9-1-2048 | | | | 1,200,000 | | | | 1,362,600 | |
| | | | |
San Clemente CA Special Tax Community Facilities District#2006-1 | | | 5.00 | | | | 9-1-2040 | | | | 980,000 | | | | 1,095,356 | |
| | | | |
San Clemente CA Special Tax Community Facilities District#2006-1 | | | 5.00 | | | | 9-1-2046 | | | | 1,190,000 | | | | 1,323,780 | |
| | | | |
San Diego CA RDA CAB Tax Allocation Centre (AGM Insured) ¤ | | | 0.00 | | | | 9-1-2023 | | | | 885,000 | | | | 825,386 | |
| | | | |
San Diego CA RDA Naval Training Center Series A | | | 5.00 | | | | 9-1-2025 | | | | 575,000 | | | | 600,651 | |
| | | | |
San Francisco CA City & County RDA Mission Bay South Redevelopment Project Series A | | | 5.00 | | | | 8-1-2043 | | | | 2,500,000 | | | | 2,820,400 | |
| | | | |
San Francisco CA City & County RDA Tax Transbay Infrastructure Project Third Lien Series B (AGM Insured) | | | 5.00 | | | | 8-1-2046 | | | | 1,500,000 | | | | 1,769,520 | |
| | | | |
San Francisco City & County CA RDA CAB Mission Bay South Redevelopment Project Subordinate Bond Series D 144A¤ | | | 0.00 | | | | 8-1-2026 | | | | 4,000,000 | | | | 2,942,840 | |
| | | | |
San Marcos CA Unified School District Special Tax Community Facilities District #4 (Build America Mutual Assurance Company Insured) | | | 5.00 | | | | 9-1-2034 | | | | 1,710,000 | | | | 1,981,753 | |
| | | | |
San Marcos CA Unified School District Special Tax Community Facilities District #5 (Build America Mutual Assurance Company Insured) | | | 5.00 | | | | 9-1-2028 | | | | 1,290,000 | | | | 1,515,440 | |
| | | | |
San Marcos CA Unified School District Special Tax Community Facilities District #5 (Build America Mutual Assurance Company Insured) | | | 5.00 | | | | 9-1-2029 | | | | 1,325,000 | | | | 1,549,667 | |
| | | | |
Santa Ana CA Community Redevelopment Merged Project Area Series A | | | 6.00 | | | | 9-1-2022 | | | | 2,000,000 | | | | 2,159,720 | |
| | | | |
Santa Cruz County CA RDA Live Oak Soquel Community Improvement Project | | | 6.63 | | | | 9-1-2029 | | | | 2,100,000 | | | | 2,118,501 | |
| | | | |
Sonoma CA CDA Successor Agency to Sonoma Redevelopment Project Tax Allocation Bond (National Insured) | | | 5.00 | | | | 6-1-2033 | | | | 1,325,000 | | | | 1,561,592 | |
| | | | |
Successor Agency to the Marina Redevelopment Agency Tax Allocation Bonds Series A | | | 5.00 | | | | 9-1-2033 | | | | 340,000 | | | | 388,355 | |
| | | | |
Successor Agency to the Marina Redevelopment Agency Tax Allocation Bonds Series A | | | 5.00 | | | | 9-1-2038 | | | | 400,000 | | | | 451,528 | |
| | | | |
Successor Agency to the Marina Redevelopment Agency Tax Allocation Bonds Series B | | | 5.00 | | | | 9-1-2033 | | | | 250,000 | | | | 282,358 | |
| | | | |
Successor Agency to the Marina Redevelopment Agency Tax Allocation Bonds Series B | | | 5.00 | | | | 9-1-2038 | | | | 250,000 | | | | 279,350 | |
| | | | |
Tracy Hills CA Improvement Area #1 Community Facilities District#2016-1 Special Tax Bonds Series 2018 | | | 5.00 | | | | 9-1-2048 | | | | 2,750,000 | | | | 3,109,480 | |
| | | | |
Tustin CA Community Facilities District Special Tax#2014-1 Legacy/Standard Pacific Series A | | | 5.00 | | | | 9-1-2040 | | | | 750,000 | | | | 838,282 | |
| | | | |
Tustin CA Community Facilities District Special Tax#2014-1 Legacy/Standard Pacific Series A | | | 5.00 | | | | 9-1-2045 | | | | 1,000,000 | | | | 1,113,530 | |
| | | | |
Union City CA Community RDA Successor Agency to Community Redevelopment Project Tax Allocation Refunding Bond Series A | | | 5.00 | | | | 10-1-2036 | | | | 1,000,000 | | | | 1,179,190 | |
| | | | |
Union City CA Community RDA Successor Agency to Union City Community Redevelopment Project (AGC Insured) | | | 5.25 | | | | 10-1-2033 | | | | 8,000,000 | | | | 8,406,880 | |
| | | | |
Yorba Linda CA RDA CAB Series A (National Insured) ¤ | | | 0.00 | | | | 9-1-2019 | | | | 630,000 | | | | 628,217 | |
| |
| | | | 120,023,457 | |
| | | | | |
|
| Tobacco Revenue: 0.52% | |
| | | | |
Golden State Tobacco Securitization Corporation Tobacco Settlement Refunding Bond SeriesA-1 | | | 5.00 | | | | 6-1-2028 | | | | 2,000,000 | | | | 2,377,220 | |
| | | | |
Golden State Tobacco Securitization Corporation Tobacco Settlement Refunding Bond SeriesA-2 | | | 5.00 | | | | 6-1-2047 | | | | 3,000,000 | | | | 3,002,130 | |
| |
| | | | 5,379,350 | |
| | | | | |
|
| Transportation Revenue: 2.73% | |
| | | | |
Alameda County CA Corridor Transportation Authority Prerefunded Bond CAB Subordinate Lien Series A (Ambac Insured) ¤ | | | 0.00 | | | | 10-1-2019 | | | | 2,780,000 | | | | 2,771,577 | |
| | | | |
Alameda County CA Corridor Transportation Authority Unrefunded Bond CAB Subordinate Lien Series A (Ambac Insured) ¤ | | | 0.00 | | | | 10-1-2019 | | | | 220,000 | | | | 218,896 | |
18 | Wells Fargo California Tax-Free Fund
Portfolio of investments—June 30, 2019
| | | | | | | | | | | | | | | | |
| | | Interest
rate | | | Maturity
date | | | Principal | | | Value | |
|
| Transportation Revenue (continued) | |
| | | | |
Bay Area CA Toll Authority Toll Bridge SeriesS-4 | | | 5.00 | % | | | 4-1-2030 | | | $ | 2,000,000 | | | $ | 2,287,120 | |
| | | | |
Bay Area CA Toll Authority Toll Bridge SeriesS-H | | | 5.00 | | | | 4-1-2049 | | | | 8,000,000 | | | | 9,686,160 | |
| | | | |
Foothill-Eastern Corridor CA Transportation Agency Subordinate BondSeries B-3 | | | 5.50 | | | | 1-15-2053 | | | | 8,000,000 | | | | 8,919,840 | |
| | | | |
San Diego CA RDA Centre City Subordinate Refunding Bond Parking Series B | | | 5.30 | | | | 9-1-2020 | | | | 1,060,000 | | | | 1,063,466 | |
| | | | |
San Francisco CA Municipal Transportation | | | 5.00 | | | | 3-1-2039 | | | | 3,000,000 | | | | 3,425,340 | |
| |
| | | | 28,372,399 | |
| | | | | |
|
| Utilities Revenue: 4.39% | |
| | | | |
Banning CA Financing Authority Refunding Bond Electric System Project (AGM Insured) | | | 5.00 | | | | 6-1-2037 | | | | 5,000,000 | | | | 5,786,500 | |
| | | | |
Imperial CA Irrigation District Electric System Refunding Bond Series A | | | 5.00 | | | | 11-1-2040 | | | | 3,715,000 | | | | 4,358,624 | |
| | | | |
Imperial CA Irrigation District Electric System Refunding Bond Series A | | | 5.00 | | | | 11-1-2045 | | | | 1,060,000 | | | | 1,238,154 | |
| | | | |
Imperial CA Irrigation District Electric System Refunding Bond Series C | | | 5.00 | | | | 11-1-2038 | | | | 2,500,000 | | | | 2,951,375 | |
| | | | |
Los Angeles CA Department of Water and Power Series E | | | 5.00 | | | | 7-1-2044 | | | | 12,475,000 | | | | 14,277,887 | |
| | | | |
M-S-R California Energy Authority Gas Series B | | | 7.00 | | | | 11-1-2034 | | | | 4,000,000 | | | | 5,996,360 | |
| | | | |
M-S-R California Energy Authority Gas Series C | | | 6.13 | | | | 11-1-2029 | | | | 1,060,000 | | | | 1,345,659 | |
| | | | |
Northern California Power Agency Public Power Prerefunded Bond (Ambac Insured) | | | 7.50 | | | | 7-1-2023 | | | | 30,000 | | | | 32,489 | |
| | | | |
Redding CA Joint Powers Financing Authority Election System Series A | | | 5.00 | | | | 6-1-2032 | | | | 440,000 | | | | 521,400 | |
| | | | |
Roseville CA Natural Gas Financing Authority | | | 5.00 | | | | 2-15-2025 | | | | 1,930,000 | | | | 2,241,174 | |
| | | | |
Southern California Public Power Authority Natural Gas Project #1 Series A | | | 5.25 | | | | 11-1-2025 | | | | 1,000,000 | | | | 1,183,980 | |
| | | | |
Turlock CA Irrigation District First Priority Subordinated Revenue Refunding Bond | | | 5.50 | | | | 1-1-2041 | | | | 2,000,000 | | | | 2,114,860 | |
| | | | |
Walnut CA Energy Center Authority Series A | | | 5.00 | | | | 1-1-2034 | | | | 3,115,000 | | | | 3,576,238 | |
| |
| | | | 45,624,700 | |
| | | | | |
|
| Water & Sewer Revenue: 3.12% | |
| | | | |
Adelanto CA Public Utility Authority Refunding Bond (AGM Insured) | | | 5.00 | | | | 7-1-2039 | | | | 2,000,000 | | | | 2,401,060 | |
| | | | |
Bay Area CA Water Supply & Conservation Agency Series A | | | 5.00 | | | | 10-1-2034 | | | | 6,000,000 | | | | 6,711,120 | |
| | | | |
California Statewide CDA Water & Wastewater Pooled Financing Program Series B (AGM Insured) | | | 5.25 | | | | 10-1-2027 | | | | 1,040,000 | | | | 1,043,338 | |
| | | | |
Compton CA Sewer Revenue | | | 6.00 | | | | 9-1-2039 | | | | 1,775,000 | | | | 1,780,183 | |
| | | | |
El Dorado CA Irrigation District Refunding Bond Series A (AGM Insured) | | | 5.25 | | | | 3-1-2039 | | | | 2,000,000 | | | | 2,304,860 | |
| | | | |
Florin CA Resource Conservation Refunding Bond Second Senior Lien Series A (National Insured) | | | 5.00 | | | | 9-1-2032 | | | | 2,000,000 | | | | 2,296,000 | |
| | | | |
Merced CA Irrigation District Water & Hydroelectric System Series A (AGM Insured) | | | 5.00 | | | | 10-1-2038 | | | | 4,000,000 | | | | 4,571,000 | |
| | | | |
Pico Rivera CA Water Authority Series A | | | 6.25 | | | | 12-1-2032 | | | | 4,015,000 | | | | 4,053,303 | |
| | | | |
San Buenaventura CA PFFA Series B | | | 5.00 | | | | 7-1-2042 | | | | 4,000,000 | | | | 4,387,760 | |
| | | | |
Tulare CA Sewer Refunding Bond (AGM Insured) | | | 5.00 | | | | 11-15-2041 | | | | 1,500,000 | | | | 1,750,470 | |
| | | | |
Vallejo CA Refunding Bond | | | 5.25 | | | | 5-1-2031 | | | | 1,000,000 | | | | 1,128,600 | |
| |
| | | | 32,427,694 | |
| | | | | |
| |
| | | | 984,987,228 | |
| | | | | |
|
Guam: 0.72% | |
|
| Airport Revenue: 0.14% | |
| | | | |
Guam Port Authority AMT Series A | | | 5.00 | | | | 7-1-2048 | | | | 1,235,000 | | | | 1,415,890 | |
| | | | | | | | | | | | | | | | |
|
| Tax Revenue: 0.10% | |
| | | | |
Guam Government Business Privilege Tax Series A | | | 5.00 | | | | 1-1-2031 | | | | 1,000,000 | | | | 1,050,110 | |
| | | | | | | | | | | | | | | | |
Wells Fargo California Tax-Free Fund | 19
Portfolio of investments—June 30, 2019
| | | | | | | | | | | | | | | | |
| | | Interest
rate | | | Maturity
date | | | Principal | | | Value | |
| Water & Sewer Revenue: 0.48% | |
| | | | |
Guam Government Waterworks Authority | | | 5.25 | % | | | 7-1-2033 | | | $ | 1,500,000 | | | $ | 1,634,220 | |
| | | | |
Guam Government Waterworks Authority | | | 5.50 | | | | 7-1-2043 | | | | 3,125,000 | | | | 3,411,000 | |
| |
| | | | 5,045,220 | |
| | | | | |
| |
| | | | 7,511,220 | |
| | | | | |
|
Illinois: 1.20% | |
|
| Miscellaneous Revenue: 1.09% | |
| | | | |
Illinois Series D | | | 5.00 | | | | 11-1-2025 | | | | 10,000,000 | | | | 11,368,600 | |
| | | | | | | | | | | | | | | | |
|
| Tax Revenue: 0.11% | |
| | | | |
Metropolitan Pier & Exposition Authority McCormick Place Expansion Project Series A | | | 5.00 | | | | 6-15-2057 | | | | 1,000,000 | | | | 1,097,410 | |
| | | | | | | | | | | | | | | | |
| |
| | | | 12,466,010 | |
| | | | | |
|
| New York: 1.17% | |
|
| Industrial Development Revenue: 0.56% | |
| | | | |
New York Transportation Development Corporation Special Facilities Revenue Delta Air Lines Incorporated LaGuardia Airport Terminals C&D Redevelopment | | | 5.00 | | | | 1-1-2026 | | | | 5,000,000 | | | | 5,878,250 | |
| | | | | | | | | | | | | | | | |
|
| Tax Revenue: 0.51% | |
| | | | |
New York NY Transitional Adjusted Future Tax SecuredTax-Exempt Subordinate Bond (Adjustable Rate Bond) Fiscal 2015 SubseriesA-4 (Mizuho Bank Limited SPA) ø | | | 1.87 | | | | 8-1-2043 | | | | 1,440,000 | | | | 1,440,000 | |
| | | | |
New York NY Transitional Finance Authority Recovery Subordinate Bond Series C3 (Dexia Credit Local SPA) ø | | | 2.02 | | | | 8-1-2031 | | | | 1,300,000 | | | | 1,300,000 | |
| | | | |
New York NY Transitional Finance Authority Subordinate Bond Series 2B (Dexia Credit Local SPA) ø | | | 2.02 | | | | 11-1-2022 | | | | 2,550,000 | | | | 2,550,000 | |
| |
| | | | 5,290,000 | |
| | | | | |
|
| Water & Sewer Revenue: 0.10% | |
| | | | |
New York NY Municipal Water Finance Authority Water and Sewer System Revenue (JPMorgan Chase & Company SPA) ø | | | 1.95 | | | | 6-15-2050 | | | | 1,000,000 | | | | 1,000,000 | |
| | | | | | | | | | | | | | | | |
| |
| | | | 12,168,250 | |
| | | | | |
|
Texas: 0.98% | |
|
| Resource Recovery Revenue: 0.98% | |
| | | | |
Port Arthur TX Navigation District Jefferson County Environmental Facilities Motiva Enterprises LLC Project Series A ø | | | 2.07 | | | | 4-1-2040 | | | | 2,805,000 | | | | 2,805,000 | |
| | | | |
Port Arthur TX Navigation District Jefferson County Environmental Facilities Motiva Enterprises LLC Project Series B ø | | | 2.07 | | | | 4-1-2040 | | | | 7,400,000 | | | | 7,400,000 | |
| |
| | | | 10,205,000 | |
| | | | | |
| |
Total Municipal Obligations (Cost $942,239,162) | | | | 1,027,337,708 | |
| | | | | |
| | | | |
| | | | | | | | | | | | | | | | |
| | | | | | | | | Shares | | | | |
Closed End Municipal Bond Funds: 0.48% | |
|
| California: 0.48% | |
| | | | |
Nuveen California AMT-Free Quality Municipal Income Fund Variable Rate Demand Preferred Shares Series A 2.20% 144A | | | | | | | | | | | 5,000,000 | | | | 5,000,000 | |
| | | | | | | | | | | | | | | | |
| |
Total Closed End Municipal Bond Funds (Cost $5,000,000) | | | | 5,000,000 | |
| | | | | |
20 | Wells Fargo California Tax-Free Fund
Portfolio of investments—June 30, 2019
| | | | | | | | | | | | | | | | |
| | | Yield | | | | | | Shares | | | Value | |
| Short-Term Investments: 0.02% | | | | | | | | | | | | |
| | | | |
| Investment Companies: 0.02% | | | | | | | | | | | | |
| | | | |
Wells Fargo Municipal Cash Management Money Market Fund Institutional Class (I)(u)## | | | 1.82 | % | | | | | | | 207,750 | | | $ | 207,875 | |
| | | | | | | | | | | | | | | | |
| | | | |
Total Short-Term Investments (Cost $207,875) | | | | | | | | | | | | | | | 207,875 | |
| | | | | | | | | | | | | | | | |
| | | | | | | | |
| Total investments in securities (Cost $947,447,037) | | | 99.32 | % | | | 1,032,545,583 | |
| | |
Other assets and liabilities, net | | | 0.68 | | | | 7,038,918 | |
| | | | | | | | |
| Total net assets | | | 100.00 | % | | $ | 1,039,584,501 | |
| | | | | | | | |
| ## | All or a portion of this security is segregated for when-issued securities. |
| 144A | The security may be resold in transactions exempt from registration, normally to qualified institutional buyers, pursuant to Rule 144A under the Securities Act of 1933. |
| ¤ | The security is issued in zero coupon form with no periodic interest payments. |
| ø | Variable rate demand notes are subject to a demand feature which reduces the effective maturity. The maturity date shown represents the final maturity date of the security. The interest rate is determined and reset by the issuer daily, weekly, or monthly depending upon the terms of the security. The rate shown is the rate in effect at period end. |
| ± | Variable rate investment. The rate shown is the rate in effect at period end. |
| %% | The security is purchased on a when-issued basis. |
| (l) | The issuer of the security is an affiliated person of the Fund as defined in the Investment Company Act of 1940. |
| (u) | The rate represents the7-day annualized yield at period end. |
Abbreviations:
| AGC | Assured Guaranty Corporation |
| AGM | Assured Guaranty Municipal |
| Ambac | Ambac Financial Group Incorporated |
| AMT | Alternative minimum tax |
| CDA | Community Development Authority |
| FGIC | Financial Guaranty Insurance Corporation |
| GNMA | Government National Mortgage Association |
| HFFA | Health Facilities Financing Authority |
| LIBOR | London Interbank Offered Rate |
| National | National Public Finance Guarantee Corporation |
| PCFA | Pollution Control Financing Authority |
| PFA | Public Finance Authority |
| PFFA | Public Facilities Financing Authority |
| RDA | Redevelopment Authority |
| SPA | Standby purchase agreement |
Investments in Affiliates
An affiliated investment is an investment in which the Fund owns at least 5% of the outstanding voting shares of the issuer or as a result of other relationships, such as the Fund and the issuer having the same investment manager. Transactions with issuers that were either affiliated persons of the Fund at the beginning of the period or the end of the period were as follows:
| | | | | | | | | | | | | | | | | | | | | | | | | | | | | | | | | | | | |
| | | Shares,
beginning
of period | | | Shares
purchased | | | Shares
sold | | | Shares,
end of
period | | | Net
realized
gains
(losses) | | | Net
change in
unrealized
gains
(losses) | | | Income
from
affiliated
securities | | | Value,
end of
period | | | % of
net
assets | |
Short-Term Investments | | | | | | | | | | | | | | | | | | | | | | | | | | | | | | | | | | | | |
Investment Companies | | | | | | | | | | | | | | | | | | | | | | | | | | | | | | | | | | | | |
Wells Fargo Municipal Cash Management Money Market Fund Institutional Class | | | 896,900 | | | | 165,452,135 | | | | 166,141,285 | | | | 207,750 | | | $ | 170 | | | $ | 0 | | | $ | 41,120 | | | $ | 207,875 | | | | 0.02 | % |
Wells Fargo California Tax-Free Fund | 21
Statement of assets and liabilities—June 30, 2019
| | | | |
| | | | |
| |
Assets | | | | |
Investments in unaffiliated securities, at value (cost $947,239,162) | | $ | 1,032,337,708 | |
Investments in affiliated securities, at value (cost $207,875) | | | 207,875 | |
Receivable for investments sold | | | 505,000 | |
Receivable for Fund shares sold | | | 1,262,595 | |
Receivable for interest | | | 12,920,608 | |
Prepaid expenses and other assets | | | 4,329 | |
| | | | |
Total assets | | | 1,047,238,115 | |
| | | | |
| |
Liabilities | | | | |
Payable for investments purchased | | | 5,770,212 | |
Payable for Fund shares redeemed | | | 727,501 | |
Dividends payable | | | 534,847 | |
Management fee payable | | | 259,341 | |
Administration fees payable | | | 105,745 | |
Distribution fee payable | | | 20,195 | |
Trustees’ fees and expenses payable | | | 1,356 | |
Accrued expenses and other liabilities | | | 234,417 | |
| | | | |
Total liabilities | | | 7,653,614 | |
| | | | |
Total net assets | | $ | 1,039,584,501 | |
| | | | |
| |
Net assets consist of | | | | |
Paid-in capital | | $ | 977,945,454 | |
Total distributable earnings | | | 61,639,047 | |
| | | | |
Total net assets | | $ | 1,039,584,501 | |
| | | | |
| |
Computation of net asset value and offering price per share | | | | |
Net assets – Class A | | $ | 482,394,577 | |
Shares outstanding – Class A1 | | | 40,488,155 | |
Net asset value per share – Class A | | | $11.91 | |
Maximum offering price per share – Class A2 | | | $12.47 | |
Net assets – Class C | | $ | 32,757,979 | |
Shares outstanding – Class C1 | | | 2,695,945 | |
Net asset value per share – Class C | | | $12.15 | |
Net assets – Administrator Class | | $ | 231,251,891 | |
Shares outstanding – Administrator Class1 | | | 19,372,364 | |
Net asset value per share – Administrator Class | | | $11.94 | |
Net assets – Institutional Class | | $ | 293,180,054 | |
Shares outstanding – Institutional Class1 | | | 24,558,770 | |
Net asset value per share – Institutional Class | | | $11.94 | |
| 1 | The Fund has an unlimited number of authorized shares. |
| 2 | Maximum offering price is computed as 100/95.50 of net asset value. On investments of $50,000 or more, the offering price is reduced. |
The accompanying notes are an integral part of these financial statements.
22 | Wells Fargo California Tax-Free Fund
Statement of operations—year ended June 30, 2019
| | | | |
| | | | |
| |
Investment income | | | | |
Interest | | $ | 39,067,843 | |
Income from affiliated securities | | | 41,120 | |
| | | | |
Total investment income | | | 39,108,963 | |
| | | | |
| |
Expenses | | | | |
Management fee | | | 3,813,968 | |
Administration fees | | | | |
Class A | | | 721,616 | |
Class C | | | 63,172 | |
Administrator Class | | | 216,794 | |
Institutional Class | | | 221,495 | |
Shareholder servicing fees | | | | |
Class A | | | 1,127,525 | |
Class C | | | 98,705 | |
Administrator Class | | | 540,631 | |
Distribution fee | | | | |
Class C | | | 296,116 | |
Custody and accounting fees | | | 20,158 | |
Professional fees | | | 65,652 | |
Registration fees | | | 96,963 | |
Shareholder report expenses | | | 52,956 | |
Trustees’ fees and expenses | | | 21,411 | |
Other fees and expenses | | | 20,649 | |
| | | | |
Total expenses | | | 7,377,811 | |
Less: Fee waivers and/or expense reimbursements | | | (881,664 | ) |
| | | | |
Net expenses | | | 6,496,147 | |
| | | | |
Net investment income | | | 32,612,816 | |
| | | | |
| |
Realized and unrealized gains (losses) on investments | | | | |
Net realized gains (losses) on: | | | | |
Unaffiliated securities | | | (1,718,231 | ) |
Affiliated securities | | | 170 | |
| | | | |
Net realized losses on investments | | | (1,718,061 | ) |
Net change in unrealized gains (losses) on investments | | | 24,999,907 | |
| | | | |
Net realized and unrealized gains (losses) on investments | | | 23,281,846 | |
| | | | |
Net increase in net assets resulting from operations | | $ | 55,894,662 | |
| | | | |
The accompanying notes are an integral part of these financial statements.
Wells Fargo California Tax-Free Fund | 23
Statement of changes in net assets
| | | | | | | | | | | | | | | | |
| | | Year ended
June 30, 2019 | | | Year ended
June 30, 20181 | |
| | | | |
Operations | | | | | | | | | | | | | | | | |
Net investment income | | | | | | $ | 32,612,816 | | | | | | | $ | 32,756,804 | |
Net realized losses on investments | | | | | | | (1,718,061 | ) | | | | | | | (397,135 | ) |
Net change in unrealized gains (losses) on investments | | | | | | | 24,999,907 | | | | | | | | (15,921,703 | ) |
| | | | |
Net increase in net assets resulting from operations | | | | | | | 55,894,662 | | | | | | | | 16,437,966 | |
| | | | |
| | | | |
Distributions to shareholders from net investment income and net realized gains | | | | | | | | | | | | | | | | |
Class A | | | | | | | (14,669,880 | ) | | | | | | | (14,178,372 | ) |
Class C | | | | | | | (988,682 | ) | | | | | | | (1,262,333 | ) |
Administrator Class | | | | | | | (7,503,063 | ) | | | | | | | (6,997,042 | ) |
Institutional Class | | | | | | | (9,759,221 | ) | | | | | | | (10,318,698 | ) |
| | | | |
Total distributions to shareholders | | | | | | | (32,920,846 | ) | | | | | | | (32,756,445 | ) |
| | | | |
| | | | |
Capital share transactions | | | Shares | | | | | | | | Shares | | | | | |
Proceeds from shares sold | | | | | | | | | | | | | | | | |
Class A | | | 8,095,324 | | | | 94,284,323 | | | | 5,412,756 | | | | 63,532,063 | |
Class C | | | 277,749 | | | | 3,305,964 | | | | 207,470 | | | | 2,494,341 | |
Administrator Class | | | 5,658,401 | | | | 65,422,085 | | | | 3,150,137 | | | | 37,468,056 | |
Institutional Class | | | 8,350,924 | | | | 97,289,819 | | | | 8,312,600 | | | | 95,794,566 | |
| | | | |
| | | | | | | 260,302,191 | | | | | | | | 199,289,026 | |
| | | | |
Reinvestment of distributions | | | | | | | | | | | | | | | | |
Class A | | | 1,185,493 | | | | 13,804,957 | | | | 1,121,916 | | | | 13,180,807 | |
Class C | | | 78,205 | | | | 927,056 | | | | 98,749 | | | | 1,183,379 | |
Administrator Class | | | 629,219 | | | | 7,340,761 | | | | 579,082 | | | | 6,823,267 | |
Institutional Class | | | 330,436 | | | | 3,856,316 | | | | 368,770 | | | | 4,342,226 | |
| | | | |
| | | | | | | 25,929,090 | | | | | | | | 25,529,679 | |
| | | | |
Payment for shares redeemed | | | | | | | | | | | | | | | | |
Class A | | | (6,860,157 | ) | | | (79,217,878 | ) | | | (8,403,699 | ) | | | (98,926,917 | ) |
Class C | | | (1,688,840 | ) | | | (19,964,764 | ) | | | (1,060,979 | ) | | | (12,741,782 | ) |
Administrator Class | | | (2,915,007 | ) | | | (33,837,058 | ) | | | (5,458,094 | ) | | | (64,458,360 | ) |
Institutional Class | | | (8,779,437 | ) | | | (101,838,732 | ) | | | (9,927,151 | ) | | | (116,905,096 | ) |
| | | | |
| | | | | | | (234,858,432 | ) | | | | | | | (293,032,155 | ) |
| | | | |
Net increase (decrease) in net assets resulting from capital share transactions | | | | | | | 51,372,849 | | | | | | | | (68,213,450 | ) |
| | | | |
Total increase (decrease) in net assets | | | | | | | 74,346,665 | | | | | | | | (84,531,929 | ) |
| | | | |
| | | | |
Net assets | | | | | | | | | | | | | | | | |
Beginning of period | | | | | | | 965,237,836 | | | | | | | | 1,049,769,765 | |
| | | | |
End of period | | | | | | $ | 1,039,584,501 | | | | | | | $ | 965,237,836 | |
| | | | |
| 1 | Effective for all filings after November 4, 2018, the SEC prospectively eliminated the requirement to parenthetically disclose undistributed net investment income at the end of the period and permitted the aggregation of distributions, with the exception of tax basis returns of capital. Undistributed net investment income at June 30, 2018 was $59,885. The disaggregated distributions information for the year ended June 30, 2018 is included in Note 7,Distributions to Shareholders, in the notes to the financial statements. |
The accompanying notes are an integral part of these financial statements.
24 | Wells Fargo California Tax-Free Fund
Financial highlights
(For a share outstanding throughout each period)
| | | | | | | | | | | | | | | | | | | | |
| | | Year ended June 30 | |
| CLASS A | | 2019 | | | 2018 | | | 2017 | | | 2016 | | | 2015 | |
Net asset value, beginning of period | | | $11.64 | | | | $11.83 | | | | $12.45 | | | | $11.79 | | | | $11.73 | |
Net investment income | | | 0.37 | | | | 0.37 | | | | 0.36 | | | | 0.36 | | | | 0.38 | |
Net realized and unrealized gains (losses) on investments | | | 0.28 | | | | (0.19 | ) | | | (0.62 | ) | | | 0.66 | | | | 0.06 | |
| | | | | | | | | | | | | | | | | | | | |
Total from investment operations | | | 0.65 | | | | 0.18 | | | | (0.26 | ) | | | 1.02 | | | | 0.44 | |
Distributions to shareholders from | | | | | | | | | | | | | | | | | | | | |
Net investment income | | | (0.38 | ) | | | (0.37 | ) | | | (0.36 | ) | | | (0.36 | ) | | | (0.38 | ) |
Net asset value, end of period | | | $11.91 | | | | $11.64 | | | | $11.83 | | | | $12.45 | | | | $11.79 | |
Total return1 | | | 5.70 | % | | | 1.55 | % | | | (2.09 | )% | | | 8.77 | % | | | 3.74 | % |
Ratios to average net assets (annualized) | | | | | | | | | | | | | | | | | | | | |
Gross expenses | | | 0.83 | % | | | 0.83 | % | | | 0.82 | % | | | 0.82 | % | | | 0.83 | % |
Net expenses | | | 0.75 | % | | | 0.75 | % | | | 0.75 | % | | | 0.75 | % | | | 0.75 | % |
Net investment income | | | 3.22 | % | | | 3.15 | % | | | 2.99 | % | | | 2.96 | % | | | 3.17 | % |
Supplemental data | | | | | | | | | | | | | | | | | | | | |
Portfolio turnover rate | | | 9 | % | | | 33 | % | | | 48 | % | | | 17 | % | | | 30 | % |
Net assets, end of period (000s omitted) | | | $482,395 | | | | $443,165 | | | | $472,584 | | | | $528,238 | | | | $470,368 | |
| 1 | Total return calculations do not include any sales charges. |
The accompanying notes are an integral part of these financial statements.
Wells Fargo California Tax-Free Fund | 25
Financial highlights
(For a share outstanding throughout each period)
| | | | | | | | | | | | | | | | | | | | |
| | | Year ended June 30 | |
| CLASS C | | 2019 | | | 2018 | | | 2017 | | | 2016 | | | 2015 | |
Net asset value, beginning of period | | | $11.87 | | | | $12.07 | | | | $12.70 | | | | $12.02 | | | | $11.96 | |
Net investment income | | | 0.29 | | | | 0.29 | | | | 0.27 | | | | 0.27 | | | | 0.29 | |
Net realized and unrealized gains (losses) on investments | | | 0.29 | | | | (0.20 | ) | | | (0.63 | ) | | | 0.68 | | | | 0.06 | |
| | | | | | | | | | | | | | | | | | | | |
Total from investment operations | | | 0.58 | | | | 0.09 | | | | (0.36 | ) | | | 0.95 | | | | 0.35 | |
Distributions to shareholders from | | | | | | | | | | | | | | | | | | | | |
Net investment income | | | (0.30 | ) | | | (0.29 | ) | | | (0.27 | ) | | | (0.27 | ) | | | (0.29 | ) |
Net asset value, end of period | | | $12.15 | | | | $11.87 | | | | $12.07 | | | | $12.70 | | | | $12.02 | |
Total return1 | | | 4.95 | % | | | 0.74 | % | | | (2.80 | )% | | | 8.02 | % | | | 2.96 | % |
Ratios to average net assets (annualized) | | | | | | | | | | | | | | | | | | | | |
Gross expenses | | | 1.58 | % | | | 1.58 | % | | | 1.57 | % | | | 1.57 | % | | | 1.58 | % |
Net expenses | | | 1.50 | % | | | 1.50 | % | | | 1.50 | % | | | 1.50 | % | | | 1.50 | % |
Net investment income | | | 2.47 | % | | | 2.40 | % | | | 2.24 | % | | | 2.21 | % | | | 2.42 | % |
Supplemental data | | | | | | | | | | | | | | | | | | | | |
Portfolio turnover rate | | | 9 | % | | | 33 | % | | | 48 | % | | | 17 | % | | | 30 | % |
Net assets, end of period (000s omitted) | | | $32,758 | | | | $47,831 | | | | $57,727 | | | | $66,427 | | | | $50,787 | |
| 1 | Total return calculations do not include any sales charges. |
The accompanying notes are an integral part of these financial statements.
26 | Wells Fargo California Tax-Free Fund
Financial highlights
(For a share outstanding throughout each period)
| | | | | | | | | | | | | | | | | | | | |
| | | Year ended June 30 | |
| ADMINISTRATOR CLASS | | 2019 | | | 2018 | | | 2017 | | | 2016 | | | 2015 | |
Net asset value, beginning of period | | | $11.66 | | | | $11.86 | | | | $12.48 | | | | $11.81 | | | | $11.75 | |
Net investment income | | | 0.40 | | | | 0.39 | | | | 0.38 | | | | 0.38 | | | | 0.40 | |
Net realized and unrealized gains (losses) on investments | | | 0.28 | | | | (0.20 | ) | | | (0.62 | ) | | | 0.67 | | | | 0.06 | |
| | | | | | | | | | | | | | | | | | | | |
Total from investment operations | | | 0.68 | | | | 0.19 | | | | (0.24 | ) | | | 1.05 | | | | 0.46 | |
Distributions to shareholders from | | | | | | | | | | | | | | | | | | | | |
Net investment income | | | (0.40 | ) | | | (0.39 | ) | | | (0.38 | ) | | | (0.38 | ) | | | (0.40 | ) |
Net asset value, end of period | | | $11.94 | | | | $11.66 | | | | $11.86 | | | | $12.48 | | | | $11.81 | |
Total return | | | 5.99 | % | | | 1.67 | % | | | (1.88 | )% | | | 9.06 | % | | | 3.95 | % |
Ratios to average net assets (annualized) | | | | | | | | | | | | | | | | | | | | |
Gross expenses | | | 0.77 | % | | | 0.77 | % | | | 0.76 | % | | | 0.76 | % | | | 0.77 | % |
Net expenses | | | 0.55 | % | | | 0.55 | % | | | 0.55 | % | | | 0.55 | % | | | 0.55 | % |
Net investment income | | | 3.43 | % | | | 3.34 | % | | | 3.16 | % | | | 3.16 | % | | | 3.39 | % |
Supplemental data | | | | | | | | | | | | | | | | | | | | |
Portfolio turnover rate | | | 9 | % | | | 33 | % | | | 48 | % | | | 17 | % | | | 30 | % |
Net assets, end of period (000s omitted) | | | $231,252 | | | | $186,626 | | | | $210,209 | | | | $344,090 | | | | $210,265 | |
The accompanying notes are an integral part of these financial statements.
Wells Fargo California Tax-Free Fund | 27
Financial highlights
(For a share outstanding throughout each period)
| | | | | | | | | | | | | | | | | | | | |
| | | Year ended June 30 | |
| INSTITUTIONAL CLASS | | 2019 | | | 2018 | | | 2017 | | | 2016 | | | 20151 | |
Net asset value, beginning of period | | | $11.66 | | | | $11.86 | | | | $12.48 | | | | $11.81 | | | | $11.99 | |
Net investment income | | | 0.41 | | | | 0.40 | | | | 0.39 | | | | 0.39 | | | | 0.27 | |
Net realized and unrealized gains (losses) on investments | | | 0.28 | | | | (0.20 | ) | | | (0.62 | ) | | | 0.67 | | | | (0.18 | ) |
| | | | | | | | | | | | | | | | | | | | |
Total from investment operations | | | 0.69 | | | | 0.20 | | | | (0.23 | ) | | | 1.06 | | | | 0.09 | |
Distributions to shareholders from | | | | | | | | | | | | | | | | | | | | |
Net investment income | | | (0.41 | ) | | | (0.40 | ) | | | (0.39 | ) | | | (0.39 | ) | | | (0.27 | ) |
Net asset value, end of period | | | $11.94 | | | | $11.66 | | | | $11.86 | | | | $12.48 | | | | $11.81 | |
Total return2 | | | 6.07 | % | | | 1.74 | % | | | (1.81 | )% | | | 9.14 | % | | | 0.72 | % |
Ratios to average net assets (annualized) | | | | | | | | | | | | | | | | | | | | |
Gross expenses | | | 0.50 | % | | | 0.50 | % | | | 0.49 | % | | | 0.49 | % | | | 0.50 | % |
Net expenses | | | 0.48 | % | | | 0.48 | % | | | 0.48 | % | | | 0.48 | % | | | 0.48 | % |
Net investment income | | | 3.49 | % | | | 3.42 | % | | | 3.28 | % | | | 3.24 | % | | | 3.35 | % |
Supplemental data | | | | | | | | | | | | | | | | | | | | |
Portfolio turnover rate | | | 9 | % | | | 33 | % | | | 48 | % | | | 17 | % | | | 30 | % |
Net assets, end of period (000s omitted) | | | $293,180 | | | | $287,616 | | | | $309,253 | | | | $193,154 | | | | $149,368 | |
| 1 | For the period from October 31, 2014 (commencement of class operations) to June 30, 2015 |
| 2 | Returns for periods of less than one year are not annualized. |
The accompanying notes are an integral part of these financial statements.
28 | Wells Fargo California Tax-Free Fund
Notes to financial statements
1. ORGANIZATION
Wells Fargo Funds Trust (the “Trust”), a Delaware statutory trust organized on March 10, 1999, is anopen-end management investment company registered under the Investment Company Act of 1940, as amended (the “1940 Act”). As an investment company, the Trust follows the accounting and reporting guidance in Financial Accounting Standards Board(“FASB”)Accounting Standards Codification Topic 946, Financial Services – Investment Companies. These financial statements report on the Wells Fargo CaliforniaTax-Free Fund (the “Fund”) which is anon-diversified series of the Trust.
2. SIGNIFICANT ACCOUNTING POLICIES
The following significant accounting policies, which are consistently followed in the preparation of the financial statements of the Fund, are in conformity with U.S. generally accepted accounting principles which require management to make estimates and assumptions that affect the reported amounts of assets and liabilities, disclosure of contingent assets and liabilities at the date of the financial statements, and the reported amounts of revenues and expenses during the reporting period. Actual results could differ from those estimates.
Securities valuation
All investments are valued each business day as of the close of regular trading on the New York Stock Exchange (generally 4 p.m. Eastern Time), although the Fund may deviate from this calculation time under unusual or unexpected circumstances.
Debt securities are valued at the evaluated bid price provided by an independent pricing service (e.g. taking into account various factors, including yields, maturities, or credit ratings) or, if a reliable price is not available, the quoted bid price from an independent broker-dealer.
Investments in registeredopen-end investment companies are valued at net asset value.
Investments which are not valued using any of the methods discussed above are valued at their fair value, as determined in good faith by the Board of Trustees of the Fund. The Board of Trustees has established a Valuation Committee comprised of the Trustees and has delegated to it the authority to take any actions regarding the valuation of portfolio securities that the Valuation Committee deems necessary or appropriate, including determining the fair value of portfolio securities, unless the determination has been delegated to the Wells Fargo Asset Management Pricing Committee at Wells Fargo Funds Management, LLC (“Funds Management”). The Board of Trustees retains the authority to make or ratify any valuation decisions or approve any changes to the Valuation Procedures as it deems appropriate. On a quarterly basis, the Board of Trustees receives reports on any valuation actions taken by the Valuation Committee or the Wells Fargo Asset Management Pricing Committee which may include items for ratification.
When-issued transactions
The Fund may purchase securities on a forward commitment or when-issued basis. The Fund records a when-issued transaction on the trade date and will segregate assets in an amount at least equal in value to the Fund’s commitment to purchase when-issued securities. Securities purchased on a when-issued basis aremarked-to-market daily and the Fund begins earning interest on the settlement date. Losses may arise due to changes in the market value of the underlying securities or if the counterparty does not perform under the contract.
Security transactions and income recognition
Securities transactions are recorded on a trade date basis. Realized gains or losses are recorded on the basis of identified cost.
Interest income is accrued daily and bond discounts are accreted and premiums are amortized daily. To the extent debt obligations are placed onnon-accrual status, any related interest income may be reduced by writing off interest receivables when the collection of all or a portion of interest has been determined to be doubtful based on consistently applied procedures and the fair value has decreased. If the issuer subsequently resumes interest payments or when the collectability of interest is reasonably assured, the debt obligation is removed fromnon-accrual status.
Distributions to shareholders
Distributions to shareholders from net investment income are declared daily and paid monthly. Distributions from net realized gains, if any, are recorded on theex-dividend date and paid at least annually. Such distributions are determined in accordance with income tax regulations and may differ from U.S. generally accepted accounting principles. Dividend sources are estimated at the time of declaration. The tax character of distributions is determined as of the Fund’s fiscal year end. Therefore, a portion of the Fund’s distributions made prior to the Fund’s fiscal year end may be categorized as a tax return of capital at year end.
Wells Fargo California Tax-Free Fund | 29
Notes to financial statements
Federal and other taxes
The Fund intends to continue to qualify as a regulated investment company by distributing substantially all of its investment company taxable andtax-exempt income and any net realized capital gains (after reduction for capital loss carryforwards) sufficient to relieve it from all, or substantially all, federal income taxes. Accordingly, no provision for federal income taxes was required.
The Fund’s income and federal excise tax returns and all financial records supporting those returns for the prior three fiscal years are subject to examination by the federal and Delaware revenue authorities. Management has analyzed the Fund’s tax positions taken on federal, state, and foreign tax returns for all open tax years and does not believe that there are any uncertain tax positions that require recognition of a tax liability.
As of June 30, 2019, the aggregate cost of all investments for federal income tax purposes was $947,575,257 and the unrealized gains (losses) consisted of:
| | | | |
| |
Gross unrealized gains | | $ | 85,103,611 | |
| |
Gross unrealized losses | | | (133,285 | ) |
| |
Net unrealized gains | | $ | 84,970,326 | |
As of June 30, 2019, the Fund had capital loss carryforwards which consist of $22,802,291 in short-term capital losses and $280,843 in long-term capital losses.
Class allocations
The separate classes of shares offered by the Fund differ principally in applicable sales charges, distribution, shareholder servicing, and administration fees. Class specific expenses are charged directly to that share class. Investment income, common fund-level expenses, and realized and unrealized gains (losses) on investments are allocated daily to each class of shares based on the relative proportion of net assets of each class.
3. FAIR VALUATION MEASUREMENTS
Fair value measurements of investments are determined within a framework that has established a fair value hierarchy based upon the various data inputs utilized in determining the value of the Fund’s investments. The three-level hierarchy gives the highest priority to unadjusted quoted prices in active markets for identical assets or liabilities (Level 1) and the lowest priority to unobservable inputs (Level 3). The Fund’s investments are classified within the fair value hierarchy based on the lowest level of input that is significant to the fair value measurement. The inputs are summarized into three broad levels as follows:
| ∎ | | Level 1 – quoted prices in active markets for identical securities |
| ∎ | | Level 2 – other significant observable inputs (including quoted prices for similar securities, interest rates, prepayment speeds, credit risk, etc.) |
| ∎ | | Level 3 – significant unobservable inputs (including the Fund’s own assumptions in determining the fair value of investments) |
The inputs or methodologies used for valuing investments in securities are not necessarily an indication of the risk associated with investing in those securities.
The following is a summary of the inputs used in valuing the Fund’s assets and liabilities as of June 30, 2019:
| | | | | | | | | | | | | | | | |
| | | | |
| | | Quoted prices
(Level 1) | | | Other significant
observable inputs
(Level 2) | | | Significant
unobservable inputs (Level 3) | | | Total | |
| | | | |
Assets | | | | | | | | | | | | | | | | |
Investments in: | | | | | | | | | | | | | | | | |
| | | | |
Municipal obligations | | $ | 0 | | | $ | 1,027,337,708 | | | $ | 0 | | | $ | 1,027,337,708 | |
| | | | |
Closed end municipal bond funds | | | 0 | | | | 5,000,000 | | | | 0 | | | | 5,000,000 | |
| | | | |
Short-term investments | | | | | | | | | | | | | | | | |
| | | | |
Investment companies | | | 207,875 | | | | 0 | | | | 0 | | | | 207,875 | |
| | | | |
Total assets | | $ | 207,875 | | | $ | 1,032,337,708 | | | $ | 0 | | | $ | 1,032,545,583 | |
Additional sector, industry or geographic detail is included in the Portfolio of Investments.
At June 30, 2019, the Fund did not have any transfers into/out of Level 3.
30 | Wells Fargo California Tax-Free Fund
Notes to financial statements
4. TRANSACTIONS WITH AFFILIATES
Management fee
Funds Management, an indirect wholly owned subsidiary of Wells Fargo & Company (“Wells Fargo”), is the manager of the Fund and provides advisory and fund-level administrative services under an investment management agreement. Under the investment management agreement, Funds Management is responsible for, among other services, implementing the investment objectives and strategies of the Fund, supervising the subadviser and providing fund-level administrative services in connection with the Fund’s operations. As compensation for its services under the investment management agreement, Funds Management is entitled to receive a management fee at the following annual rate based on the Fund’s average daily net assets:
| | | | |
| |
| Average daily net assets | | Management fee | |
| |
First $500 million | | | 0.400 | % |
| |
Next $500 million | | | 0.375 | |
| |
Next $2 billion | | | 0.350 | |
| |
Next $2 billion | | | 0.325 | |
| |
Next $5 billion | | | 0.290 | |
| |
Over $10 billion | | | 0.280 | |
For the year ended June 30, 2019, the management fee was equivalent to an annual rate of 0.39% of the Fund’s average daily net assets.
Funds Management has retained the services of a subadviser to provide daily portfolio management to the Fund. The fee for subadvisory services is borne by Funds Management. Wells Capital Management Incorporated, an affiliate of Funds Management and an indirect wholly owned subsidiary of Wells Fargo, is the subadviser to the Fund and is entitled to receive a fee from Funds Management at an annual rate starting at 0.20% and declining to 0.10% as the average daily net assets of the Fund increase.
Administration fees
Under a class-level administration agreement, Funds Management provides class-level administrative services to the Fund, which includes paying fees and expenses for services provided by the transfer agent,sub-transfer agents, omnibus account servicers and record-keepers. As compensation for its services under the class-level administration agreement, Funds Management receives an annual fee which is calculated based on the average daily net assets of each class as follows:
| | |
| |
| | | Class-level
administration fee |
| |
Class A, Class C | | 0.16% |
| |
Administrator Class | | 0.10 |
| |
Institutional Class | | 0.08 |
Funds Management has contractually waived and/or reimbursed management and administration fees to the extent necessary to maintain certain net operating expense ratios for the Fund. When each class of the Fund has exceeded its expense cap, Funds Management has waived fees and/or reimbursed expenses from fund-level expenses on a proportionate basis and then from class specific expenses. When only certain classes exceed their expense caps, waivers and/or reimbursements are applied against class specific expenses before fund-level expenses. Funds Management has committed through October 31, 2019 to waive fees and/or reimburse expenses to the extent necessary to cap the Fund’s expenses at 0.75% for Class A shares, 1.50% for Class C shares, 0.55% for Administrator Class shares, and 0.48% for Institutional Class shares. Prior to or after the commitment expiration date, the cap may be increased or the commitment to maintain the cap may be terminated only with the approval of the Board of Trustees.
Distribution fee
The Trust has adopted a distribution plan for Class C shares of the Fund pursuant to Rule12b-1 under the 1940 Act. A distribution fee is charged to Class C shares and paid to Wells Fargo Funds Distributor, LLC (“Funds Distributor”), the principal underwriter, at an annual rate of 0.75% of the average daily net assets of Class C shares.
Wells Fargo California Tax-Free Fund | 31
Notes to financial statements
In addition, Funds Distributor is entitled to receive thefront-end sales charge from the purchase of Class A shares and a contingent deferred sales charge on the redemption of certain Class A shares. Funds Distributor is also entitled to receive the contingent deferred sales charges from redemptions of Class C shares. For the year ended June 30, 2019, Funds Distributor received $9,448 from the sale of Class A shares. No contingent deferred sales charges were incurred by Class A and Class C shares for the year ended June 30, 2019.
Shareholder servicing fees
The Trust has entered into contracts with one or more shareholder servicing agents, whereby Class A, Class C, and Administrator Class of the Fund are charged a fee at an annual rate of 0.25% of the average daily net assets of each respective class. A portion of these total shareholder servicing fees were paid to affiliates of Wells Fargo.
Interfund transactions
The Fund may purchase or sell portfolio investment securities to certain other Wells Fargo affiliates pursuant to Rule17a-7 under the 1940 Act and under procedures adopted by the Board of Trustees. The procedures have been designed to ensure that these interfund transactions, which do not incur broker commissions, are effected at current market prices. Pursuant to these procedures, the Fund had $79,875,000 and $54,866,984 in interfund purchases and sales, respectively, during the year ended June 30, 2019.
5. INVESTMENT PORTFOLIO TRANSACTIONS
Purchases and sales of investments, excluding U.S. government obligations (if any) and short-term securities, for the year ended June 30, 2019 were $173,333,858 and $90,237,125, respectively.
6. BANK BORROWINGS
The Trust (excluding the money market funds), Wells Fargo Master Trust and Wells Fargo Variable Trust are parties to a $280,000,000 revolving credit agreement whereby the Fund is permitted to use bank borrowings for temporary or emergency purposes, such as to fund shareholder redemption requests. Interest under the credit agreement is charged to the Fund based on a borrowing rate equal to the higher of the Federal Funds rate in effect on that day plus 1.25% or the overnight LIBOR rate in effect on that day plus 1.25%. In addition, an annual commitment fee equal to 0.25% of the unused balance is allocated to each participating fund.
For the year ended June 30, 2019, there were no borrowings by the Fund under the agreement.
7. DISTRIBUTIONS TO SHAREHOLDERS
The tax character of distributions paid was $32,920,846 and $32,756,445 oftax-exempt income for the years ended June 30, 2019 and June 30, 2018, respectively.
As of June 30, 2019, the components of distributable earnings on a tax basis were as follows:
| | | | |
Undistributed tax-exempt income | | Unrealized gains | | Capital loss
carry forward |
| | |
| $287,958 | | $84,970,326 | | $(23,083,134) |
Effective for all filings after November 4, 2018, the Securities and Exchange Commission eliminated the requirement to separately state the components of distributions to shareholders under U.S. generally accepted accounting principles. The amounts of distributions to shareholders for the year ended June 30, 2018 were as follows:
| | | | |
| |
| | | Net investment
income | |
| |
Class A | | | $14,178,372 | |
| |
Class C | | | 1,262,333 | |
| |
Administrator Class | | | 6,997,042 | |
| |
Institutional Class | | | 10,318,698 | |
8. CONCENTRATION RISK
The Fund invests a substantial portion of its assets in issuers of municipal debt securities located in a single state or territory of the U.S. Therefore, it may be more affected by economic and political developments in that state or region than would be a comparable generaltax-exempt fund.
32 | Wells Fargo California Tax-Free Fund
Notes to financial statements
9. INDEMNIFICATION
Under the Trust’s organizational documents, the officers and Trustees have been granted certain indemnification rights against certain liabilities that may arise out of performance of their duties to the Trust. Additionally, in the normal course of business, the Trust may enter into contracts with service providers that contain a variety of indemnification clauses. The Trust’s maximum exposure under these arrangements is dependent on future claims that may be made against the Fund and, therefore, cannot be estimated.
10. NEW ACCOUNTING PRONOUNCEMENTS
In August 2018, FASB issued Accounting Standards Update (“ASU”)No. 2018-13, Fair Value Measurement (Topic 820)Disclosure Framework—Changes to the Disclosure Requirements for Fair Value Measurement.ASU2018-13 updates the disclosure requirements for fair value measurements by modifying or removing certain disclosures and adding certain new disclosures. The amendments are effective for fiscal years, and interim periods within those fiscal years, beginning after December 15, 2019. Early adoption is permitted. Management has adopted the removal and modification of disclosures early, as permitted, and will adopt the additional new disclosures at the effective date.
In March 2017, FASB issued ASU No. 2017-08,Premium Amortization on Purchased Callable Debt Securities. ASU 2017-08 shortens the amortization period for certain callable debt securities held at a premium and requires the premium to be amortized to the earliest call date. The amendments do not require an accounting change for securities held at a discount; and discounts will continue to be accreted to the maturity date of the security. ASU 2017-08 is effective for fiscal years beginning after December 15, 2018 and for interim periods within those fiscal years. During the current reporting period, management of the Fund adopted the change in accounting policy which did not have a material impact to the Fund’s financial statements.
Wells Fargo California Tax-Free Fund | 33
Report of independent registered public accounting firm
TO THE SHAREHOLDERS OF THE FUND AND BOARD OF TRUSTEES OF WELLS FARGO FUNDS TRUST:
Opinion on the Financial Statements
We have audited the accompanying statement of assets and liabilities of Wells Fargo California Tax-Free Fund (the Fund), one of the funds constituting Wells Fargo Funds Trust, including the portfolio of investments, as of June 30, 2019, the related statement of operations for the year then ended, the statements of changes in net assets for each of the years in the two year period then ended, and the related notes (collectively, the financial statements) and the financial highlights for each of the years or periods in the five year period then ended. In our opinion, the financial statements and financial highlights present fairly, in all material respects, the financial position of the Fund as of June 30, 2019, the results of its operations for the year then ended, the changes in its net assets for each of the years in the two year period then ended, and the financial highlights for each of the years or periods in the five year period then ended, in conformity with U.S. generally accepted accounting principles.
Basis for Opinion
These financial statements and financial highlights are the responsibility of the Fund’s management. Our responsibility is to express an opinion on these financial statements and financial highlights based on our audits. We are a public accounting firm registered with the Public Company Accounting Oversight Board (United States) (PCAOB) and are required to be independent with respect to the Fund in accordance with the U.S. federal securities laws and the applicable rules and regulations of the Securities and Exchange Commission and the PCAOB.
We conducted our audits in accordance with the standards of the PCAOB. Those standards require that we plan and perform the audit to obtain reasonable assurance about whether the financial statements and financial highlights are free of material misstatement, whether due to error or fraud. Our audits included performing procedures to assess the risks of material misstatement of the financial statements and financial highlights, whether due to error or fraud, and performing procedures that respond to those risks. Such procedures included examining, on a test basis, evidence regarding the amounts and disclosures in the financial statements and financial highlights. Such procedures also included confirmation of securities owned as of June 30, 2019, by correspondence with the custodian and brokers, or by other appropriate auditing procedures. Our audits also included evaluating the accounting principles used and significant estimates made by management, as well as evaluating the overall presentation of the financial statements and financial highlights. We believe that our audits provide a reasonable basis for our opinion.

We have not been able to determine the specific year that we began serving as the auditor of one or more Wells Fargo Funds investment companies; however we are aware that we have served as the auditor of one or more Wells Fargo Funds investment companies since at least 1955.
Boston, Massachusetts
August 26, 2019
34 | Wells Fargo California Tax-Free Fund
Other information (unaudited)
TAX INFORMATION
For federal and California income tax purposes, the Fund designates 100% of its distributions paid from net investment income during the fiscal year as exempt-interest dividends under Section 852(b)(5) of the Internal Revenue Code and under Section 17145 of the California Revenue and Taxation Code.
PROXY VOTING INFORMATION
A description of the policies and procedures used to determine how to vote proxies relating to portfolio securities is available, upon request, by calling1-800-222-8222, visiting our website atwfam.com, or visiting the SEC website at sec.gov. Information regarding how the proxies related to portfolio securities were voted during the most recent12-month period ended June 30 is available on the website atwfam.comor by visiting the SEC website at sec.gov.
QUARTERLY PORTFOLIO HOLDINGS INFORMATION
The Fund files its complete schedule of portfolio holdings with the SEC for the first and third quarters of each fiscal year on FormN-Q or FormN-PORT, which is available by visiting the SEC website at sec.gov. Those forms may be reviewed and copied at the SEC’s Public Reference Room in Washington, DC. Information on the operation of the Public Reference Room may be obtained by calling1-800-SEC-0330.
Wells Fargo California Tax-Free Fund | 35
Other information (unaudited)
BOARD OF TRUSTEES AND OFFICERS
Each of the Trustees and Officers1 listed in the table below acts in identical capacities for each fund in the Wells Fargo family of funds, which consists of 152 mutual funds comprising the Wells Fargo Funds Trust, Wells Fargo Variable Trust, Wells Fargo Master Trust and fourclosed-end funds (collectively the “Fund Complex”). This table should be read in conjunction with the Prospectus and the Statement of Additional Information2. The mailing address of each Trustee and Officer is 525 Market Street, 12th Floor, San Francisco, CA 94105. Each Trustee and Officer serves an indefinite term, however, each Trustee serves such term until reaching the mandatory retirement age established by the Trustees.
Independent Trustees
| | | | | | |
Name and
year of birth | | Position held and
length of service* | | Principal occupations during past five years or longer | | Current other
public company or
investment
company
directorships |
| | | |
| William R. Ebsworth (Born 1957) | | Trustee, since 2015 | | Retired. From 1984 to 2013, equities analyst, portfolio manager, research director and chief investment officer at Fidelity Management and Research Company in Boston, Tokyo, and Hong Kong, and retired in 2013 as Chief Investment Officer of Fidelity Strategic Advisers, Inc. where he led a team of investment professionals managing client assets. Prior thereto, Board member of Hong Kong Securities Clearing Co., Hong Kong Options Clearing Corp., the Thailand International Fund, Ltd., Fidelity Investments Life Insurance Company, and Empire Fidelity Investments Life Insurance Company. Audit Committee Chair and Investment Committee Chair of the Vincent Memorial Hospital Endowment(non-profit organization). Mr. Ebsworth is a CFA® charterholder. | | N/A |
| | | |
| Jane A. Freeman (Born 1953) | | Trustee, since 2015; Chair Liaison, since 2018 | | Retired. From 2012 to 2014 and 1999 to 2008, Chief Financial Officer of Scientific Learning Corporation. From 2008 to 2012, Ms. Freeman provided consulting services related to strategic business projects. Prior to 1999, Portfolio Manager at Rockefeller & Co. and Scudder, Stevens & Clark. Board member of the Harding Loevner Funds from 1996 to 2014, serving as both Lead Independent Director and chair of the Audit Committee. Board member of the Russell Exchange Traded Funds Trust from 2011 to 2012 and the chair of the Audit Committee. Ms. Freeman is a Board Member of The Ruth Bancroft Garden(non-profit organization). She is also an inactive Chartered Financial Analyst. | | N/A |
| | | |
| Isaiah Harris, Jr. (Born 1952) | | Trustee, since 2009; Audit Committee Chairman, since 2019 | | Retired. Chairman of the Board of CIGNA Corporation since 2009, and Director since 2005. From 2003 to 2011, Director of Deluxe Corporation. Prior thereto, President and CEO of BellSouth Advertising and Publishing Corp. from 2005 to 2007, President and CEO of BellSouth Enterprises from 2004 to 2005 and President of BellSouth Consumer Services from 2000 to 2003. Emeritus member of the Iowa State University Foundation Board of Governors. Emeritus Member of the Advisory Board of Iowa State University School of Business. Advisory Board Member, Palm Harbor Academy (private school). Advisory Board Member, Child Evangelism Fellowship(non-profit). Mr. Harris is a certified public accountant (inactive status). | | CIGNA Corporation |
| | | |
| Judith M. Johnson (Born 1949) | | Trustee, since 2008; Audit Committee Chairman, from 2009 to 2018 | | Retired. Prior thereto, Chief Executive Officer and Chief Investment Officer of Minneapolis Employees Retirement Fund from 1996 to 2008. Ms. Johnson is an attorney, certified public accountant and a certified managerial accountant. | | N/A |
36 | Wells Fargo California Tax-Free Fund
Other information (unaudited)
| | | | | | |
Name and
year of birth | | Position held and
length of service* | | Principal occupations during past five years or longer | | Current other
public company or
investment
company
directorships |
| | | |
| David F. Larcker (Born 1950) | | Trustee, since 2009 | | James Irvin Miller Professor of Accounting at the Graduate School of Business, Stanford University, Director of the Corporate Governance Research Initiative and Senior Faculty of The Rock Center for Corporate Governance since 2006. From 2005 to 2008, Professor of Accounting at the Graduate School of Business, Stanford University. Prior thereto, Ernst & Young Professor of Accounting at The Wharton School, University of Pennsylvania from 1985 to 2005. | | N/A |
| | | |
| Olivia S. Mitchell (Born 1953) | | Trustee, since 2006; Nominating and Governance Committee Chairman, since 2018 | | International Foundation of Employee Benefit Plans Professor, Wharton School of the University of Pennsylvania since 1993. Director of Wharton’s Pension Research Council and Boettner Center on Pensions & Retirement Research, and Research Associate at the National Bureau of Economic Research. Previously, Cornell University Professor from 1978 to 1993. | | N/A |
| | | |
| Timothy J. Penny (Born 1951) | | Trustee, since 1996; Chairman, since 2018 | | President and Chief Executive Officer of Southern Minnesota Initiative Foundation, anon-profit organization, since 2007. Member of the Board of Trustees of NorthStar Education Finance, Inc., anon-profit organization, since 2007. | | N/A |
| | | |
| James G. Polisson (Born 1959) | | Trustee, since 2018 | | Retired. Chief Marketing Officer, Source (ETF) UK Services, Ltd, from 2015 to 2017. From 2012 to 2015, Principal of The Polisson Group, LLC, a management consulting, corporate advisory and principal investing company. Chief Executive Officer and Managing Director at Russell Investments, Global Exchange Traded Funds from 2010 to 2012. Managing Director of Barclays Global Investors from 1998 to 2010 and Global Chief Marketing Officer for iShares and Barclays Global Investors from 2000 to 2010. Trustee of the San Francisco Mechanics’ Institute, anon-profit organization, from 2013 to 2015. Board member of the Russell Exchange Traded Fund Trust from 2011 to 2012. Director of Barclays Global Investors Holdings Deutschland GmbH from 2006 to 2009. Mr. Polisson is an attorney and has a retired status with the Massachusetts and District of Columbia Bar Associations. | | N/A |
| * | Length of service dates reflect the Trustee’s commencement of service with the Trust’s predecessor entities, where applicable. |
Wells Fargo California Tax-Free Fund | 37
Other information (unaudited)
Officers
| | | | | | |
Name and year of birth | | Position held and
length of service | | Principal occupations during past five years or longer | | |
| | | |
| Andrew Owen (Born 1960) | | President, since 2017 | | Executive Vice President of Wells Fargo & Company and Head of Affiliated Managers, Wells Fargo Asset Management, since 2014. In addition, Mr. Owen is currently President, Chief Executive Officer and Director of Wells Fargo Funds Management, LLC since 2017. Prior thereto, Executive Vice President responsible for marketing, investments and product development for Wells Fargo Funds Management, LLC, from 2009 to 2014. | | |
| | | |
| Nancy Wiser1 (Born 1967) | | Treasurer, since 2012 | | Executive Vice President of Wells Fargo Funds Management, LLC since 2011. Chief Operating Officer and Chief Compliance Officer at LightBox Capital Management LLC, from 2008 to 2011. | | |
| | | |
| Alexander Kymn (Born 1973) | | Secretary and Chief Legal Officer, since 2018 | | Senior Company Counsel of Wells Fargo Bank, N.A. since 2018 (previously Senior Counsel from 2007 to 2018). Vice President of Wells Fargo Funds Management, LLC from 2008 to 2014. | | |
| | | |
| Michael H. Whitaker(Born 1967) | | Chief Compliance Officer, since 2016 | | Senior Vice President and Chief Compliance Officer since 2016. Senior Vice President and Chief Compliance Officer for Fidelity Investments from 2007 to 2016. | | |
| | | |
| David Berardi (Born 1975) | | Assistant Treasurer, since 2009 | | Vice President of Wells Fargo Funds Management, LLC since 2009. Vice President of Evergreen Investment Management Company, LLC from 2008 to 2010. Manager of Fund Reporting and Control for Evergreen Investment Management Company, LLC from 2004 to 2010. | | |
| | | |
| Jeremy DePalma1 (Born 1974) | | Assistant Treasurer, since 2009 | | Senior Vice President of Wells Fargo Funds Management, LLC since 2009. Senior Vice President of Evergreen Investment Management Company, LLC from 2008 to 2010 and head of the Fund Reporting and Control Team within Fund Administration from 2005 to 2010. | | |
| 1 | Nancy Wiser acts as Treasurer of 65 funds in the Fund Complex. Jeremy DePalma acts as Treasurer of 87 funds and Assistant Treasurer of 65 funds in the Fund Complex. |
| 2 | The Statement of Additional Information includes additional information about the Trustees and is available, without charge, upon request, by calling1-800-222-8222 or by visiting the website atwfam.com. |
38 | Wells Fargo California Tax-Free Fund
Other information (unaudited)
BOARD CONSIDERATION OF INVESTMENT MANAGEMENT AND SUB-ADVISORY AGREEMENTS:
Wells Fargo California Tax-Free Fund
Under the Investment Company Act of 1940 (the “1940 Act”), the Board of Trustees (the “Board”) of Wells Fargo Funds Trust (the “Trust”) must determine annually whether to approve the continuation of the Trust’s investment management andsub-advisory agreements. In this regard, at an in-person meeting held on May 21-22, 2019 (the “Meeting”), the Board, all the members of which have no direct or indirect interest in the investment management and sub-advisory agreements and are not “interested persons” of the Trust, as defined in the 1940 Act (the “Independent Trustees”), reviewed and approved for Wells Fargo California Tax-Free Fund (the “Fund”): (i) an investment management agreement (the “Management Agreement”) with Wells Fargo Funds Management, LLC (“Funds Management”); and (ii) an investment sub-advisory agreement (the“Sub-Advisory Agreement”) with Wells Capital Management Incorporated (the “Sub-Adviser”), an affiliate of Funds Management. The Management Agreement and theSub-Advisory Agreement are collectively referred to as the “Advisory Agreements.”
At the Meeting, the Board considered the factors and reached the conclusions described below relating to the selection of Funds Management and the Sub-Adviser and the approval of the Advisory Agreements. Prior to the Meeting, including at anin-person meeting in April 2019, the Trustees conferred extensively among themselves and with representatives of Funds Management about these matters. Also, the Board has adopted a team-based approach, with each team consisting of a sub-set of Trustees, to assist the full Board in the discharge of its duties in reviewing investment performance and other matters throughout the year. The Independent Trustees were assisted in their evaluation of the Advisory Agreements by independent legal counsel, from whom they received separate legal advice and with whom they met separately.
In providing information to the Board, Funds Management and the Sub-Adviser were guided by a detailed set of requests for information submitted to them by independent legal counsel on behalf of the Independent Trustees at the start of the Board’s annual contract renewal process earlier in 2019. In considering and approving the Advisory Agreements, the Trustees considered the information they believed relevant, including but not limited to the information discussed below. The Board considered not only the specific information presented in connection with the Meeting, but also the knowledge gained over time through interaction with Funds Management and the Sub-Adviser about various topics. In this regard, the Board reviewed reports of Funds Management at each of its quarterly meetings, which included, among other things, portfolio reviews and investment performance reports. In addition, the Board and the teams mentioned above confer with portfolio managers at various times throughout the year. The Board did not identify any particular information or consideration that was all-important or controlling, and each individual Trustee may have attributed different weights to various factors.
After its deliberations, the Board unanimously approved the continuation of the Advisory Agreements for a one-year term and determined that the compensation payable to Funds Management and the Sub-Adviser under each of the Advisory Agreements was reasonable. The Board considered the approval of the Advisory Agreements for the Fund as part of its consideration of agreements for funds across the complex, but its approvals were made on a fund-by-fund basis. The following summarizes a number of important, but not necessarily all, factors considered by the Board in support of its approvals.
Nature, extent and quality of services
The Board received and considered various information regarding the nature, extent and quality of services provided to the Fund by Funds Management and the Sub-Adviser under the Advisory Agreements. This information included a description of the investment advisory services and Fund-level administrative services covered by the Management Agreement, as well as, among other things, a summary of the background and experience of senior management of Wells Fargo Asset Management (“WFAM”), of which Funds Management and the Sub-Adviser are a part, a summary of investments made in the business of WFAM, a summary of certain organizational and personnel changes involving Funds Management and the Sub-Adviser, and a description of Funds Management’s and the Sub-Adviser’s business continuity planning programs and of their approaches to data privacy and cybersecurity. The Board received and reviewed information about Funds Management’s role as administrator of the Fund’s liquidity risk management program. The Board also considered the qualifications, background, tenure and responsibilities of each of the portfolio managers primarily responsible for the day-to-day portfolio management of the Fund.
The Board evaluated the ability of Funds Management and the Sub-Adviser to attract and retain qualified investment professionals, including research, advisory and supervisory personnel. The Board further considered the compliance programs and compliance records of Funds Management and the Sub-Adviser. In addition, the Board took into account the full range of services provided to the Fund by Funds Management and its affiliates.
Fund investment performance and expenses
The Board considered the investment performance results for the Fund over various time periods ended December 31, 2018. The Board considered these results in comparison to the investment performance of funds in a universe that was determined by
Wells Fargo California Tax-Free Fund | 39
Other information (unaudited)
Broadridge Inc. (“Broadridge”) to be similar to the Fund (the “Universe”), and in comparison to the Fund’s benchmark index and to other comparative data. Broadridge is an independent provider of investment company data. The Board received a description of the methodology used by Broadridge to select the mutual funds in the performance Universe. The Board noted that the investment performance of the Fund (Administrator Class) was higher than the average investment performance of the Universe for the one-, and ten-year periods under review, and in range of the average investment performance of the Universe for the three- and five-year periods under review. The Board also noted that the investment performance of the Fund was lower than its benchmark index, the Bloomberg Barclays Municipal Bond Index, for the one-, and three-year periods under review, but higher than its benchmark for the five- and ten-year periods under review.
The Board also received and considered information regarding the Fund’s net operating expense ratios and their various components, including actual management fees, custodian and other non-management fees, and Rule 12b-1 and non-Rule 12b-1 shareholder service fees. The Board considered these ratios in comparison to the median ratios of funds in class-specific expense groups that were determined by Broadridge to be similar to the Fund (the “Groups”). The Board received a description of the methodology used by Broadridge to select the mutual funds in the expense Groups and an explanation of how funds comprising expense groups and their expense ratios may vary from year-to-year. Based on the Broadridge reports, the Board noted that the net operating expense ratios of the Fund were lower than or equal to the median net operating expense ratios of the expense Groups for each share class.
The Board took into account the Fund’s investment performance and expense information provided to it among the factors considered in deciding to re-approve the Advisory Agreements.
Investment management and sub-advisory fee rates
The Board reviewed and considered the contractual fee rates payable by the Fund to Funds Management under the Management Agreement, as well as the contractual fee rates payable by the Fund to Funds Management for class-level administrative services under a Class-Level Administration Agreement, which include, among other things, class-level transfer agency and sub-transfer agency costs (collectively, the “Management Rates”). The Board also reviewed and considered the contractual investmentsub-advisory fee rates that are payable by Funds Management to the Sub-Adviser for investment sub-advisory services.
Among other information reviewed by the Board was a comparison of the Fund’s Management Rates with the average contractual investment management fee rates of funds in the expense Groups at a common asset level as well as transfer agency costs of the funds in the expense Groups. The Board noted that the Management Rates of the Fund were lower than or in range of the sum of these average rates for the Fund’s expense Groups for all share classes.
The Board also received and considered information about the portion of the total management fee that was retained by Funds Management after payment of the fee to the Sub-Adviser for sub-advisory services. In assessing the reasonableness of this amount, the Board received and evaluated information about the nature and extent of responsibilities retained and risks assumed by Funds Management and not delegated to or assumed by the Sub-Adviser, and about Funds Management’son-going oversight services. Given the affiliation between Funds Management and the Sub-Adviser, the Board ascribed limited relevance to the allocation of fees between them.
The Board also received and considered information about the nature and extent of services offered and fee rates charged by Funds Management and the Sub-Adviser to other types of clients with investment strategies similar to those of the Fund. In this regard, the Board received information about the significantly greater scope of services, and compliance, reporting and other legal burdens and risks of managing proprietary mutual funds compared with those associated with managing assets of other types of clients, including third-party sub-advised fund clients and non-mutual fund clients such as institutional separate accounts.
Based on its consideration of the factors and information it deemed relevant, including those described here, the Board determined that the compensation payable to Funds Management under the Management Agreement and to the Sub-Adviser under the Sub-Advisory Agreement was reasonable.
Profitability
The Board received and considered information concerning the profitability of Funds Management, as well as the profitability of both WFAM and Wells Fargo & Co. (“Wells Fargo”) from providing services to the fund family as a whole. The Board noted that the Sub-Adviser’s profitability information with respect to providing services to the Fund and other funds in the family was subsumed in the WFAM and Wells Fargo profitability analysis.
Funds Management reported on the methodologies and estimates used in calculating profitability, including a description of the methodology used to allocate certain expenses. Among other things, the Board noted that the levels of profitability reported on a fund-by-fund basis varied widely, depending on factors such as the size, type and age of fund. Based on its review,
40 | Wells Fargo California Tax-Free Fund
Other information (unaudited)
the Board did not deem the profits reported by Funds Management, WFAM or Wells Fargo from services provided to the Fund to be at a level that would prevent it from approving the continuation of the Advisory Agreements.
Economies of scale
The Board received and considered information about the potential for Funds Management to experience economies of scale in the provision of management services to the Fund, the difficulties of calculating economies of scale at an individual fund level, and the extent to which potential scale benefits are shared with shareholders. The Board noted the existence of breakpoints in the Fund’s management fee structure, which operate generally to reduce the Fund’s expense ratios as the Fund grows in size. The Board considered that in addition to management fee breakpoints, Funds Management shares potential economies of scale from its management business in a variety of ways, including through fee waiver and expense reimbursement arrangements, services that benefit shareholders, competitive management fee rates set at the outset without regard to breakpoints, and investments in the business intended to enhance services available to shareholders.
The Board concluded that Funds Management’s arrangements with respect to the Fund, including contractual breakpoints, constituted a reasonable approach to sharing potential economies of scale with the Fund and its shareholders.
Other benefits to Funds Management and the Sub-Adviser
The Board received and considered information regarding potential “fall-out” or ancillary benefits received by Funds Management and its affiliates, including the Sub-Adviser, as a result of their relationships with the Fund. Ancillary benefits could include, among others, benefits directly attributable to other relationships with the Fund and benefits potentially derived from an increase in Funds Management’s and the Sub-Adviser’s business as a result of their relationships with the Fund. The Board noted that various affiliates of Funds Management may receive distribution-related fees, shareholder servicing payments and sub-transfer agency fees in respect of shares sold or held through them and services provided.
The Board also reviewed information about soft dollar credits earned and utilized by the Sub-Adviser, fees earned by Funds Management and the Sub-Adviser from managing a private investment vehicle for the fund family’s securities lending collateral, and commissions earned by an affiliated broker from portfolio transactions.
Based on its consideration of the factors and information it deemed relevant, including those described here, the Board did not find that any ancillary benefits received by Funds Management and its affiliates, including the Sub-Adviser, were unreasonable.
Conclusion
At the Meeting, after considering the above-described factors and based on its deliberations and its evaluation of the information described above, the Board unanimously approved the continuation of the Advisory Agreements for a one-year term and determined that the compensation payable to Funds Management and the Sub-Adviser under each of the Advisory Agreements was reasonable.
Wells Fargo California Tax-Free Fund | 41
This page is intentionally left blank.
This page is intentionally left blank.
This page is intentionally left blank.

For more information
More information about Wells Fargo Funds is available free upon request. To obtain literature, please write, visit the Fund’s website, or call:
Wells Fargo Funds
P.O. Box 219967
Kansas City, MO 64121-9967
Website:wfam.com
Individual investors:1-800-222-8222
Retail investment professionals:1-888-877-9275
Institutional investment professionals:1-866-765-0778

This report and the financial statements contained herein are submitted for the general information of the shareholders of the Fund. If this report is used for promotional purposes, distribution of the report must be accompanied or preceded by a current prospectus. Before investing, please consider the investment objectives, risks, charges, and expenses of the investment. For a current prospectus and, if available, a summary prospectus, containing this information, call1-800-222-8222 or visit the Fund’s website atwfam.com. Read the prospectus carefully before you invest or send money.
Wells Fargo Asset Management (WFAM) is the trade name for certain investment advisory/management firms owned by Wells Fargo & Company. These firms include but are not limited to Wells Capital Management Incorporated and Wells Fargo Funds Management, LLC. Certain products managed by WFAM entities are distributed by Wells Fargo Funds Distributor, LLC (a broker-dealer and Member FINRA).
This material is for general informational and educational purposes only and is NOT intended to provide investment advice or a recommendation of any kind—including a recommendation for any specific investment, strategy, or plan.
INVESTMENT PRODUCTS: NOT FDIC INSURED ◾ NO BANK GUARANTEE ◾ MAY LOSE VALUE
© 2019 Wells Fargo Funds Management, LLC. All rights reserved.
404821 08-19
A249/AR249 06-19
Annual Report
June 30, 2019
Wells Fargo
California Limited-Term Tax-Free Fund
Beginning on January 1, 2021, as permitted by new regulations adopted by the Securities and Exchange Commission, paper copies of the Wells Fargo Funds’ annual and semi-annual shareholder reports issued after this date will no longer be sent by mail, unless you specifically request paper copies of the reports. Instead, the reports will be made available on the Funds’ website, and you will be notified by mail each time a report is posted and provided with a website address to access the report.
If you already elected to receive shareholder reports electronically, you will not be affected by this change and you need not take any action. You may elect to receive shareholder reports and other communications from the Fund electronically at any time by contacting your financial intermediary (such as a broker-dealer or bank) or, if you are a direct investor, by calling1-800-222-8222 or by enrolling at wellsfargo.com/advantagedelivery.
You may elect to receive all future reports in paper free of charge. If you invest through a financial intermediary, you can contact your financial intermediary to request that you continue to receive paper copies of your shareholder reports; if you invest directly with the Fund, you can call 1-800-222-8222. Your election to receive reports in paper will apply to all Wells Fargo Funds held in your account with your financial intermediary or, if you are a direct investor, to all Wells Fargo Funds that you hold.
|
|
|
Reduce clutter. Save trees. |
Sign up for electronic delivery of prospectuses and shareholder reports atwellsfargo.com/advantagedelivery |
The views expressed and any forward-looking statements are as of June 30, 2019, unless otherwise noted, and are those of the Fund managers and/or Wells Fargo Asset Management. Discussions of individual securities, or the markets generally, or any Wells Fargo Fund are not intended as individual recommendations. Future events or results may vary significantly from those expressed in any forward-looking statements. The views expressed are subject to change at any time in response to changing circumstances in the market. Wells Fargo Asset Management and the Fund disclaim any obligation to publicly update or revise any views expressed or forward-looking statements.
INVESTMENT PRODUCTS: NOT FDIC INSURED ◾ NO BANK GUARANTEE ◾ MAY LOSE VALUE
Wells Fargo California Limited-Term Tax-Free Fund | 1
Letter to shareholders (unaudited)

Andrew Owen
President
Wells Fargo Funds
Dear Shareholder:
We are pleased to offer you this annual report for the Wells Fargo CaliforniaLimited-Term Tax-Free Fund for the 12-month period that ended June 30, 2019. After the first six months of the period yielded either low-single-digit or negative investment returns, stock and bond investors enjoyed a recovery during the final six months. The gains came amid continued concerns about global economic growth, international trade, geopolitical tensions, and bouts of market volatility.
For the period, U.S. stocks, based on the S&P 500 Index,1 gained 10.42% and international stocks, as measured by the MSCI ACWI ex USA Index (Net),2 rose 1.29%. The MSCI EM Index (Net)3 added 1.21%. For bond investors, the Bloomberg Barclays U.S. Aggregate Bond Index4 added 7.87%, the Bloomberg Barclays Global Aggregate ex-USD Index5 rose 4.10%, the Bloomberg Barclays Municipal Bond Index6 gained 6.71%, and the ICE BofAML U.S. High Yield Index7 added 7.58%.
U.S. and international markets diverged during the third quarter of 2018.
Domestic equity investors received encouraging news during the third quarter of 2018. The U.S. Bureau of Economic Analysis reported second-quarter annualized gross domestic product (GDP) growth of 4.2%. Hiring improved. Unemployment declined. Consumer confidence and spending increased. Third-quarter corporate earnings reports were generally positive. U.S. trade negotiations with Mexico and Canada progressed. The U.S. Federal Reserve (Fed) raised the federal funds rate by 25 basis points (bps; 100 bps equal 1.00%) to a target range of between 2.00% and 2.25% in September, one of four rate increases implemented during 2018, expressing confidence in the strength of the U.S. economic expansion’s durability.
Investors in international markets were not as confident. Tensions between the U.S. and China increased. The U.S. imposed $200 billion in tariffs on Chinese goods. China reacted with $60 billion in tariffs on U.S. goods. Economic growth in China caused concern. During the quarter, the MSCI ACWI ex USA Index (Net) gained 0.71%. The MSCI EM Index (Net) declined 1.09%. In fixed-income markets, U.S. bonds were flat, as measured by the Bloomberg Barclays U.S. Aggregate Bond Index. The Bloomberg Barclays Global Aggregate ex-USD Index fell 1.74%.
| 1 | The S&P 500 Index consists of 500 stocks chosen for market size, liquidity, and industry group representation. It is a market-value-weighted index with each stock’s weight in the index proportionate to its market value. You cannot invest directly in an index. |
| 2 | The Morgan Stanley Capital International (MSCI) All Country World Index (ACWI) ex USA Index (Net) is a free-float-adjusted market-capitalization weighted index that is designed to measure the equity market performance of developed and emerging markets, excluding the U.S. Source: MSCI. MSCI makes no express or implied warranties or representations and shall have no liability whatsoever with respect to any MSCI data contained herein. The MSCI data may not be further redistributed or used as a basis for other indices or any securities or financial products. This report is not approved, reviewed, or produced by MSCI. You cannot invest directly in an index. |
| 3 | The MSCI Emerging Markets (EM) Index (Net) is a free-float-adjusted market-capitalization-weighted index that is designed to measure the equity market performance of emerging markets. You cannot invest directly in an index. |
| 4 | The Bloomberg Barclays U.S. Aggregate Bond Index is a broad-based benchmark that measures the investment-grade, U.S. dollar-denominated, fixed-rate taxable bond market, including Treasuries, government-related and corporate securities, mortgage-backed securities (agency fixed-rate and hybrid adjustable-rate mortgage pass-throughs), asset-backed securities, and commercial mortgage-backed securities. You cannot invest directly in an index. |
| 5 | The Bloomberg Barclays Global Aggregate ex-USD Index is an unmanaged index that provides a broad-based measure of the global investment-grade fixed-income markets excluding the U.S. dollar-denominated debt market. You cannot invest directly in an index. |
| 6 | The Bloomberg Barclays Municipal Bond Index is an unmanaged index composed of long-term tax-exempt bonds with a minimum credit rating of Baa. You cannot invest directly in an index. |
| 7 | The ICE BofAML U.S. High Yield Index is a market-capitalization-weighted index of domestic and Yankee high-yield bonds. The index tracks the performance of high-yield securities traded in the U.S. bond market. You cannot invest directly in an index. Copyright 2019. ICE Data Indices, LLC. All rights reserved. |
2 | Wells Fargo California Limited-Term Tax-Free Fund
Letter to shareholders (unaudited)
Global markets suffered during the fourth quarter of 2018.
November’s U.S. midterm elections shifted control of the House of Representatives from Republicans to Democrats, presaging partisan clashes that followed and caused uncertainty among investors. Third-quarter U.S. GDP was announced at an annualized 3.4% rate, lower than the second-quarter rate. Brexit efforts stalled ahead of the March 2019 deadline. The People’s Bank of China cut reserve requirement ratios, accelerated infrastructure spending, and cut taxes even as the value of the yuan declined to low levels last seen in 2008. A partial U.S. government shutdown driven by partisan policy disputes extended into January.
The combination of news in the U.S. and generally weak economic indicators outside of the U.S. caused investors to seek safe havens. December’s S&P 500 Index performance was the worst since 1931. Globally, fixed-income investments fared better than stocks during the last two months of the year. The Fed increased the federal funds rate by 25 bps in December to a target range of between 2.25% and 2.50%.
The market climbs a wall of worry.
Investors entered 2019 with reasons to be concerned. Investment returns appeared to reaffirm the adage that markets climb a wall of worry. The S&P 500 Index gained 8.01% for the month of January, the best monthly performance in 30 years. Returns for the MSCI ACWI ex USA Index (Net), the Bloomberg Barclays U.S. Aggregate Bond Index, and the Bloomberg Barclays Global Aggregate ex-USD Index also were positive. The Fed indicated that it would pause its program of regular rate increases during 2019 as inflation remained low.
In February 2019, concerns over slowing global growth persisted. The Bureau of Economic Analysis announced fourth-quarter 2018 GDP grew at an annualized 2.2% rate, down from the levels of the prior two quarters. In a February report, the Bank of England forecast the slowest growth since the financial crisis for 2019. China and the U.S. continued to wrangle over trade issues.
By the end of March 2019, the combination of dovish Fed sentiment and steady, if not spectacular, economic and business metrics reinforced investors’ confidence. Monthly job creation data and corporate profits, while less consistent than during 2018, were solid. China announced a roughly $300 billion stimulus package through tax and fee cuts intended to reinvigorate economic growth.
During April 2019, investors drew confidence from favorable economic projections, sustained low inflation, and solid employment data. First-quarter GDP showed the economy grew at an annualized rate of 3.2% on improvement in business investment and exports. Favorable sentiment extended to foreign markets as the MSCI ACWI ex USA Index (Net) gained 2.64% and the MSCI EM Index (Net) added 2.11% for the month.
During May 2019, investing signals were mixed. In the U.S., partisan wrangling ramped up as Democrats and Republicans set their sights on 2020 presidential politics. The U.K.’s Brexit caused Prime Minister Theresa May to resign. The European Commission downgraded the 2019 growth forecast to 1.2%. The U.S. increased tariffs on products from China, China responded, and then talks broke down. President Donald Trump threatened to turn his foreign policy tariff tool to Mexico over immigration issues. Markets tumbled.
As had been the case during most of 2019 to date, just as the investment horizon appeared to darken, sentiment turned and markets gained. The gains, primarily driven by geopolitical and monetary policy events, drove equity markets to new highs. President Trump dropped his threats of new tariffs on Mexico after talks and further tariffs on China after meeting with China’s President Xi Jinping at the G-20 summit. President Mario Draghi of the European Central Bank said that if the outlook doesn’t
“December’s S&P 500 Index performance was the worst since 1931.”
“The S&P 500 Index gained 8.01% for the month of January, the best monthly performance in 30 years.”
Wells Fargo California Limited-Term Tax-Free Fund | 3
Letter to shareholders (unaudited)
improve, the bank will cut rates or buy more assets to prop up inflation. In the U.S., the Fed said growth shifted from “solid” to “moderate” and indicated a willingness to cut rates.
Don’t let short-term uncertainty derail long-term investment goals.
Periods of investment uncertainty can present challenges, but experience has taught us that maintaining long-term investment goals can be an effective way to plan for the future. To help you create a sound strategy based on your personal goals and risk tolerance, Wells Fargo Funds offers more than 100 mutual funds spanning a wide range of asset classes and investment styles. Although diversification cannot guarantee an investment profit or prevent losses, we believe it can be an effective way to manage investment risk and potentially smooth out overall portfolio performance. We encourage investors to know their investments and to understand that appropriate levels of risk-taking may unlock opportunities.
Thank you for choosing to invest with Wells Fargo Funds. We appreciate your confidence in us and remain committed to helping you meet your financial needs.
Sincerely,

Andrew Owen
President
Wells Fargo Funds
|
|
|
For further information about your Fund, contact your investment professional, visit our website at wfam.com, or call us directly at1-800-222-8222. |
4 | Wells Fargo California Limited-Term Tax-Free Fund
This page is intentionally left blank.
Performance highlights (unaudited)
Investment objective
The Fund seeks current income exempt from federal income tax and California individual income tax, consistent with capital preservation.
Manager
Wells Fargo Funds Management, LLC
Subadviser
Wells Capital Management Incorporated
Portfolio managers
Terry J. Goode
Brandon Pae‡
Adrian Van Poppel
Average annual total returns (%) as of June 30, 2019
| | | | | | | | | | | | | | | | | | | | | | | | | | | | | | | | | | |
| | | | |
| | | | | Including sales charge | | | Excluding sales charge | | | Expense
ratios1 (%) | |
| | | | | | | | | |
| | | Inception date | | 1 year | | | 5 year | | | 10 year | | | 1 year | | | 5 year | | | 10 year | | | Gross | | | Net2 | |
| | | | | | | | | | |
| Class A (SFCIX) | | 11-18-1992 | | | 1.23 | | | | 1.08 | | | | 2.26 | | | | 3.33 | | | | 1.49 | | | | 2.46 | | | | 0.84 | | | | 0.80 | |
| | | | | | | | | | |
| Class C (SFCCX) | | 8-30-2002 | | | 1.56 | | | | 0.73 | | | | 1.70 | | | | 2.56 | | | | 0.73 | | | | 1.70 | | | | 1.59 | | | | 1.55 | |
| | | | | | | | | | |
| Administrator Class (SCTIX) | | 9-6-1996 | | | – | | | | – | | | | – | | | | 3.56 | | | | 1.69 | | | | 2.68 | | | | 0.78 | | | | 0.60 | |
| | | | | | | | | | |
| Institutional Class (SFCNX)3 | | 10-31-2014 | | | – | | | | – | | | | – | | | | 3.66 | | | | 1.76 | | | | 2.72 | | | | 0.51 | | | | 0.50 | |
| | | | | | | | | | |
| Bloomberg Barclays Municipal1-5 Year Blend Index4 | | – | | | – | | | | – | | | | – | | | | 3.85 | | | | 1.65 | | | | 2.20 | | | | – | | | | – | |
| | | | | | | | | | |
| Bloomberg Barclays California Municipal 1-5 Year Blend Index5 | | – | | | – | | | | – | | | | – | | | | 3.36 | | | | 1.51 | | | | 2.25 | | | | – | | | | – | |
Figures quoted represent past performance, which is no guarantee of future results, and do not reflect taxes that a shareholder may pay on fund distributions or the redemption of fund shares. Investment return and principal value of an investment will fluctuate so that an investor’s shares, when redeemed, may be worth more or less than their original cost. Performance shown without sales charges would be lower if sales charges were reflected. Current performance may be lower or higher than the performance data quoted, which assumes the reinvestment of dividends and capital gains. Current month-end performance is available on the Fund’s website,wfam.com.
Index returns do not include transaction costs associated with buying and selling securities, any mutual fund fees or expenses, or any taxes. It is not possible to invest directly in an index.
For Class A shares, the maximum front-end sales charge is 2.00%. For Class C shares, the maximum contingent deferred sales charge is 1.00%. Performance including a contingent deferred sales charge assumes the sales charge for the corresponding time period. Administrator Class and Institutional Class shares are sold without a front-end sales charge or contingent deferred sales charge.
Bond values fluctuate in response to the financial condition of individual issuers, general market and economic conditions, and changes in interest rates. Changes in market conditions and government policies may lead to periods of heightened volatility in the bond market and reduced liquidity for certain bonds held by the Fund. In general, when interest rates rise, bond values fall and investors may lose principal value. Interest-rate changes and their impact on the Fund and its share price can be sudden and unpredictable. The use of derivatives may reduce returns and/or increase volatility. Certain investment strategies tend to increase the total risk of an investment (relative to the broader market). The Fund is exposed to California municipal securities risk and high-yield securities risk. Consult the Fund’s prospectus for additional information on these and other risks. A portion of the Fund’s income may be subject to federal, state, and/or local income taxes or the Alternative Minimum Tax (AMT). Any capital gains distributions may be taxable.
Please see footnotes on page 7.
6 | Wells Fargo California Limited-Term Tax-Free Fund
Performance highlights (unaudited)
|
|
| Growth of $10,000 investment as of June 30, 20196 |
|
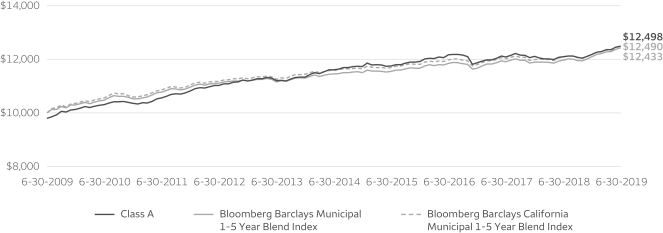
|
| ‡ | Mr. Pae became a portfolio manager of the Fund on March 28, 2019. |
| 1 | Reflects the expense ratios as stated in the most recent prospectuses. The expense ratios shown are subject to change and may differ from the annualized expense ratios shown in the financial highlights of this report. |
| 2 | The manager has contractually committed through October 31, 2019, to waive fees and/or reimburse expenses to the extent necessary to cap the expenses of each class after fee waivers at the amounts shown. Brokerage commissions, stamp duty fees, interest, taxes, acquired fund fees and expenses (if any), and extraordinary expenses are excluded from the expense cap. Prior to or after the commitment expiration date, the cap may be increased or the commitment to maintain the cap may be terminated only with the approval of the Board of Trustees. Without this cap, the Fund’s returns would have been lower. The expense ratio paid by an investor is the net expense ratio (the total annual fund operating expenses after fee waivers) as stated in the prospectuses. |
| 3 | Historical performance shown for the Institutional Class shares prior to their inception reflects the performance of the Administrator Class shares, and is not adjusted to reflect the Institutional Class share expenses. If these expenses had been included, returns for the Institutional Class shares would be higher. |
| 4 | The Bloomberg Barclays Municipal 1-5 Year Blend Index is the 1-5 Year component of the Bloomberg Barclays Municipal Bond Index. The Bloomberg Barclays Municipal Bond Index is an unmanaged index composed of long-term tax-exempt bonds with a minimum credit rating of Baa. You cannot invest directly in an index. |
| 5 | The Bloomberg Barclays California Municipal 1-5 Year Blend Index is the 1-5 Year component of the Bloomberg Barclays California Municipal Bond Index. You cannot invest directly in an index. |
| 6 | The chart compares the performance of Class A shares for the most recent ten years with the Bloomberg Barclays Municipal Bond 1-5 Year Blend Index and the Bloomberg Barclays California Municipal Bond 1-5 Year Blend Index. The chart assumes a hypothetical $10,000 investment in Class A shares and reflects all operating expenses and assumes the maximum initial sales charge of 2.00%. |
| 7 | Amounts are calculated based on the long-term total investments of the Fund. These amounts are subject to change and may have changed since the date specified. |
| 8 | The credit quality distribution of portfolio holdings reflected in the chart is based on ratings from Standard & Poor’s, Moody’s Investors Service, and/ or Fitch Ratings Ltd. Credit quality ratings apply to the underlying holdings of the Fund and not to the Fund itself. The percentages of the Fund’s portfolio with the ratings depicted in the chart are calculated based on the total market value of fixed income securities held by the Fund. If a security was rated by all three rating agencies, the middle rating was utilized. If rated by two of three rating agencies, the lower rating was utilized, and if rated by one of the rating agencies, that rating was utilized. Standard & Poor’s rates the creditworthiness of bonds, ranging from AAA (highest) to D (lowest). Ratings from A to CCC may be modified by the addition of a plus (+) or minus (-) sign to show relative standing within the rating categories. Standard & Poor’s rates the creditworthiness of short-term notes from SP-1 (highest) to SP-3 (lowest). Moody’s rates the creditworthiness of bonds, ranging from Aaa (highest) to C (lowest). Ratings Aa to B may be modified by the addition of a number 1 (highest) to 3 (lowest) to show relative standing within the ratings categories. Moody’s rates the creditworthiness of short-term U.S. tax-exempt municipal securities from MIG 1/VMIG 1 (highest) to SG (lowest). Fitch rates the creditworthiness of bonds, ranging from AAA (highest) to D (lowest). Credit quality distribution is subject to change and may have changed since the date specified. |
Wells Fargo California Limited-Term Tax-Free Fund | 7
Performance highlights (unaudited)
MANAGER’S DISCUSSION
Fund highlights
| ∎ | | The Fund (Class A shares, excluding sales charges) underperformed both of its benchmarks, the Bloomberg Barclays Municipal 1-5 Year Blend Index and the Bloomberg Barclays California Municipal 1-5 Year Blend Index, during the 12-month period that ended June 30, 2019. |
| ∎ | | The Fund’s modest overweight exposure to AAA bonds was a detractor as lower-rated bonds outperformed higher-rated bonds during this period of credit spread compression. The Fund’s exposure to the electric, water and sewer, and leasing sectors were also detractors. |
| ∎ | | The primary drivers of performance were the Fund’s yield-curve positioning, security selection, and credit profile with an overweight to the best-performing long bond maturity segment. Strong demand for lower-rated credits benefited the Fund’s overweight to A-rated and BBB-rated bonds. Security selection was also a contributor as our alternative minimum tax (AMT) holdings performed well relative to similar credits in the Bloomberg Barclays California Municipal 1-5 Year Blend Index. |
|
|
| Effective maturity distribution as of June 30, 20197 |
|
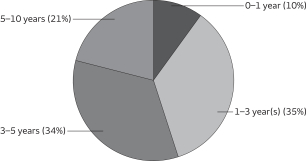 |
Fading growth expectations put the Fed on hold.
Throughout most of 2018, the fixed-income markets expected the U.S. Federal Reserve (Fed) to continue the path to normalize monetary policy. Moderate economic growth, stronger employment data, and inflation near its 2% target enabled the Fed to increase the federal funds rate four times in the calendar year. Despite a Fed rate hike in December, the Treasury market rallied in the fourth quarter of 2018 as the market lowered expectations for further rate hikes amid slower global growth, trade tariffs, and uncertainty concerning Britain’s departure from the
European Union. These concerns only increased as we moved into the first half of 2019 and discussions changed from when the Fed might hike to when they might cut the federal funds rate. As a result, fixed-income markets rallied, pushing the benchmark 10-year Treasury yield from a 3.23% peak in November 2018 to 2.00% by the end of June.
Specific to the municipal bond market, the beginning of the reporting period was marked with significant outflows due to a general risk-on sentiment in equity markets and the fear of rising interest rates. As the calendar turned, so did market sentiment. Flows into municipal mutual funds not only turned positive, but record inflows were reported as investor opinion toward fixed income, particularly municipals, improved due to investor expectations that interest rates would remain stable. While new issue supply was higher than it was a year earlier, it was still much lower than a typical year due to tax reform, which eliminated the ability of issuers to advance refund outstanding higher-cost debt. Overall, reduced supply, state and local sales tax caps for individuals, and lower interest rates fueled demand and thus returns for municipal bonds over the period.
The Fund’s duration started the period at about 113% of the Bloomberg Barclays California Municipal 1-5 Year Blend Index but we did let it drift down to 107% by the end of the period. Additionally, we temporarily entered into a tactical trade through which we shorted 10-year Treasury futures contracts in the first half of the period as rates were still moving higher. We continued to maintain an overweight to bonds rated A and below but slightly reduced this overweight during the period as credit spreads have approached historical lows. A few selective lower-rated new issues offered some relative value but, generally speaking, our new purchases were focused on higher-quality bonds. Additionally, we increased our exposure to state general obligation (GO) and AMT bonds during the year.
As the yield curve flattened over the period, longer maturities outperformed shorter maturity bonds. The Fund benefited from an overweight to the 7- to 10-year maturity range, where yields declined the most. Strong demand for lower-rated bonds contributed to the Fund’s relative performance as we maintained our overweight to this segment. Within this lower-rated space, our exposure to hospital and special tax bonds had some of the highest returns. Additionally, some of our larger positions in state GOs and airport revenue bonds were among our largest contributors to performance during the year. A few lower-rated bonds issued by universities saw their prices appreciate significantly and added to the Fund’s total return.
Please see footnotes on page 7.
8 | Wells Fargo California Limited-Term Tax-Free Fund
Performance highlights (unaudited)
Shorter-maturity bonds inside of three years didn’t see their yields decline as much as longer maturities and have lower price sensitivity. As a result, the Fund’s exposure to this maturity range lagged in performance. Higher-quality bonds generally underperformed as well. This included pre-refunded, electric, and water and sewer revenue bonds. Some premium-price bonds that experienced partial par calls during the period detracted from performance.
|
|
| Credit quality as of June 30, 20198 |
|
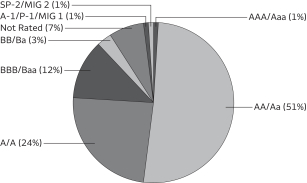 |
Our outlook is for lower rates
Overall, technicals remain strong in the municipal bond market and we expect municipal bond valuations in the medium term to be helped by high state-income-tax rates, record levels of municipal debt maturities and calls, and limited availability of gross municipal bond supply. However, we believe overall economic growth in this cycle has neared its peak and, as a result, the Fed may lower rates before the end of the year. As a result, we will look to maintain a neutral duration positioning and an up-in-quality trade approach.
Please see footnotes on page 7.
Wells Fargo California Limited-Term Tax-Free Fund | 9
Fund expenses (unaudited)
As a shareholder of the Fund, you incur two types of costs: (1) transaction costs, including sales charges (loads) on purchase payments and contingent deferred sales charges (if any) on redemptions and (2) ongoing costs, including management fees, distribution (12b-1) and/or shareholder servicing fees, and other Fund expenses. This example is intended to help you understand your ongoing costs (in dollars) of investing in the Fund and to compare these costs with the ongoing costs of investing in other mutual funds.
The example is based on an investment of $1,000 invested at the beginning of the six-month period and held for the entire period from January 1, 2019 to June 30, 2019.
Actual expenses
The “Actual” line of the table below provides information about actual account values and actual expenses. You may use the information in this line, together with the amount you invested, to estimate the expenses that you paid over the period. Simply divide your account value by $1,000 (for example, an $8,600 account value divided by $1,000 = 8.6), then multiply the result by the number in the “Actual” line under the heading entitled “Expenses paid during period” for your applicable class of shares to estimate the expenses you paid on your account during this period.
Hypothetical example for comparison purposes
The “Hypothetical” line of the table below provides information about hypothetical account values and hypothetical expenses based on the Fund’s actual expense ratio and an assumed rate of return of 5% per year before expenses, which is not the Fund’s actual return. The hypothetical account values and expenses may not be used to estimate the actual ending account balance or expenses you paid for the period. You may use this information to compare the ongoing costs of investing in the Fund and other funds. To do so, compare this 5% hypothetical example with the 5% hypothetical examples that appear in the shareholder reports of the other funds.
Please note that the expenses shown in the table are meant to highlight your ongoing costs only and do not reflect any transactional costs, such as sales charges (loads) and contingent deferred sales charges. Therefore, the “Hypothetical” line of the table is useful in comparing ongoing costs only and will not help you determine the relative total costs of owning different funds. In addition, if these transactional costs were included, your costs would have been higher.
| | | | | | | | | | | | | | | | |
| | | Beginning
account value
1-1-2019 | | | Ending
account value
6-30-2019 | | | Expenses
paid during
the period¹ | | | Annualized net
expense ratio | |
| | | | | |
Class A | | | | | | | | | | | | | | | | |
| | | | |
Actual | | $ | 1,000.00 | | | $ | 1,025.67 | | | $ | 4.02 | | | | 0.80 | % |
| | | | |
Hypothetical (5% return before expenses) | | $ | 1,000.00 | | | $ | 1,020.83 | | | $ | 4.01 | | | | 0.80 | % |
| | | | | |
Class C | | | | | | | | | | | | | | | | |
| | | | |
Actual | | $ | 1,000.00 | | | $ | 1,021.87 | | | $ | 7.77 | | | | 1.55 | % |
| | | | |
Hypothetical (5% return before expenses) | | $ | 1,000.00 | | | $ | 1,017.11 | | | $ | 7.75 | | | | 1.55 | % |
| | | | | |
Administrator Class | | | | | | | | | | | | | | | | |
| | | | |
Actual | | $ | 1,000.00 | | | $ | 1,026.93 | | | $ | 3.02 | | | | 0.60 | % |
| | | | |
Hypothetical (5% return before expenses) | | $ | 1,000.00 | | | $ | 1,021.82 | | | $ | 3.01 | | | | 0.60 | % |
| | | | | |
Institutional Class | | | | | | | | | | | | | | | | |
| | | | |
Actual | | $ | 1,000.00 | | | $ | 1,027.46 | | | $ | 2.51 | | | | 0.50 | % |
| | | | |
Hypothetical (5% return before expenses) | | $ | 1,000.00 | | | $ | 1,022.32 | | | $ | 2.51 | | | | 0.50 | % |
| 1 | Expenses paid is equal to the annualized net expense ratio of each class multiplied by the average account value over the period, multiplied by the number of days in the most recent fiscal half-year divided by the number of days in the fiscal year (to reflect the one-half-year period). |
10 | Wells Fargo California Limited-Term Tax-Free Fund
Portfolio of investments—June 30, 2019
| | | | | | | | | | | | | | | | |
| | | Interest
rate | | | Maturity
date | | | Principal | | | Value | |
Municipal Obligations: 98.64% | |
|
California: 92.60% | |
|
| Airport Revenue: 6.24% | |
| | | | |
California Municipal Finance Authority Revenue Senior Lien Linxs APM Project Series A | | | 5.00 | % | | | 12-31-2023 | | | $ | 750,000 | | | $ | 853,185 | |
| | | | |
California Municipal Finance Authority Revenue Senior Lien Linxs APM Project Series A | | | 5.00 | | | | 6-30-2024 | | | | 950,000 | | | | 1,093,393 | |
| | | | |
California Municipal Finance Authority Revenue Senior Lien Linxs APM Project Series A | | | 5.00 | | | | 12-31-2024 | | | | 750,000 | | | | 872,543 | |
| | | | |
Los Angeles CA Department of Airports AMT Series B | | | 5.00 | | | | 5-15-2024 | | | | 5,000,000 | | | | 5,821,100 | |
| | | | |
Los Angeles CA Department of Airports AMT Series B | | | 5.00 | | | | 5-15-2025 | | | | 6,000,000 | | | | 7,150,140 | |
| | | | |
Los Angeles CA Department of Airports AMT Series B | | | 5.00 | | | | 5-15-2026 | | | | 2,500,000 | | | | 3,036,500 | |
| | | | |
Los Angeles CA Department of Airports AMT Subordinate Bond Series C | | | 5.00 | | | | 5-15-2024 | | | | 4,315,000 | | | | 5,017,007 | |
| | | | |
Sacramento County CA Airport System Refunding Bond AMT Subordinate Series F | | | 5.00 | | | | 7-1-2021 | | | | 2,585,000 | | | | 2,763,960 | |
| | | | |
Sacramento County CA Airport System Refunding Bond AMT Subordinate Series F | | | 5.00 | | | | 7-1-2022 | | | | 2,590,000 | | | | 2,858,143 | |
| | | | |
Sacramento County CA Airport System Refunding Bond AMT Subordinate Series F | | | 5.00 | | | | 7-1-2023 | | | | 2,585,000 | | | | 2,932,863 | |
| | | | |
Sacramento County CA Airport System Refunding Bond AMT Subordinate Series F | | | 5.00 | | | | 7-1-2024 | | | | 1,760,000 | | | | 2,051,421 | |
| | | | |
| | | | | | | | | | | | | | | 34,450,255 | |
| | | | | | | | | | | | | | | | |
|
| Education Revenue: 5.09% | |
| | | | |
California Educational Facilities Authority Revenue Loma Linda University Series A | | | 5.00 | | | | 4-1-2024 | | | | 550,000 | | | | 638,495 | |
| | | | |
California Educational Facilities Authority Revenue Loma Linda University Series A | | | 5.00 | | | | 4-1-2026 | | | | 325,000 | | | | 395,766 | |
| | | | |
California Municipal Finance Authority California Baptist University Series A 144A | | | 4.00 | | | | 11-1-2021 | | | | 600,000 | | | | 614,280 | |
| | | | |
California Municipal Finance Authority Charter School Albert Einstein Academies Project Series A | | | 6.00 | | | | 8-1-2023 | | | | 580,000 | | | | 613,019 | |
| | | | |
California Municipal Finance Authority Charter School Revenue Palmdale Aerospace Academy Project Series A 144A | | | 3.88 | | | | 7-1-2028 | | | | 1,400,000 | | | | 1,465,366 | |
| | | | |
California Municipal Finance Authority Revenue Refunding Bond Biola University | | | 5.00 | | | | 10-1-2027 | | | | 790,000 | | | | 979,102 | |
| | | | |
California Municipal Finance Authority Revenue Refunding Bond California Lutheran University | | | 5.00 | | | | 10-1-2021 | | | | 250,000 | | | | 269,038 | |
| | | | |
California Municipal Finance Authority Revenue Refunding Bond California Lutheran University | | | 5.00 | | | | 10-1-2022 | | | | 250,000 | | | | 276,830 | |
| | | | |
California Municipal Finance Authority Revenue Refunding Bond California Lutheran University | | | 5.00 | | | | 10-1-2023 | | | | 225,000 | | | | 255,650 | |
| | | | |
California Municipal Finance Authority Revenue Refunding Bond California Lutheran University | | | 5.00 | | | | 10-1-2024 | | | | 275,000 | | | | 319,811 | |
| | | | |
California Municipal Finance Authority Revenue Refunding Bond California Lutheran University | | | 5.00 | | | | 10-1-2025 | | | | 275,000 | | | | 326,332 | |
| | | | |
California Municipal Finance Authority Revenue Refunding Bond California Lutheran University | | | 5.00 | | | | 10-1-2026 | | | | 300,000 | | | | 362,475 | |
| | | | |
California Municipal Finance Authority Revenue Refunding Bond William Jessup University | | | 2.50 | | | | 8-1-2019 | | | | 1,065,000 | | | | 1,065,330 | |
| | | | |
California School Finance Authority Bright Star School Obligation Group 144A | | | 5.00 | | | | 6-1-2027 | | | | 1,860,000 | | | | 1,995,966 | |
| | | | |
California School Finance Authority Classical Academies Project Series A 144A | | | 3.25 | | | | 10-1-2022 | | | | 2,560,000 | | | | 2,587,008 | |
| | | | |
California School Finance Authority Coastal Academy Project Series A 144A | | | 5.00 | | | | 10-1-2022 | | | | 250,000 | | | | 262,218 | |
| | | | |
California School Finance Authority Rocketship Education Series A 144A | | | 5.00 | | | | 6-1-2021 | | | | 255,000 | | | | 262,143 | |
| | | | |
California School Finance Authority Rocketship Education Series A 144A | | | 5.00 | | | | 6-1-2026 | | | | 500,000 | | | | 545,315 | |
Wells Fargo California Limited-Term Tax-Free Fund | 11
Portfolio of investments—June 30, 2019
| | | | | | | | | | | | | | | | |
| | | Interest
rate | | | Maturity
date | | | Principal | | | Value | |
| Education Revenue (continued) | |
| | | | |
California Statewide CDA California Baptist University Series A | | | 5.13 | % | | | 11-1-2023 | | | $ | 715,000 | | | $ | 762,698 | |
| | | | |
California Statewide CDA School Facilities | | | 5.88 | | | | 7-1-2022 | | | | 940,000 | | | | 990,215 | |
| | | | |
California Statewide Community Refunding Bond California Baptist University Series A 144A | | | 3.00 | | | | 11-1-2022 | | | | 1,665,000 | | | | 1,687,711 | |
| | | | |
University of California Series AK | | | 5.00 | | | | 5-15-2048 | | | | 10,000,000 | | | | 11,443,200 | |
| | | | |
| | | | | | | | | | | | | | | 28,117,968 | |
| | | | | | | | | | | | | | | | |
|
| GO Revenue: 26.88% | |
| | | | |
Alvord CA Unified School District Election of 2007 Series B (AGM Insured) | | | 6.50 | | | | 8-1-2020 | | | | 1,605,000 | | | | 1,696,212 | |
| | | | |
Bassett CA Unified School District Refunding Bond Series B (Build America Mutual Assurance Company Insured) | | | 5.00 | | | | 8-1-2019 | | | | 420,000 | | | | 421,327 | |
| | | | |
Bassett CA Unified School District Refunding Bond Series B (Build America Mutual Assurance Company Insured) | | | 5.00 | | | | 8-1-2021 | | | | 550,000 | | | | 592,499 | |
| | | | |
Bassett CA Unified School District Refunding Bond Series B (Build America Mutual Assurance Company Insured) | | | 5.00 | | | | 8-1-2023 | | | | 725,000 | | | | 830,343 | |
| | | | |
California | | | 5.00 | | | | 10-1-2021 | | | | 6,795,000 | | | | 7,370,672 | |
| | | | |
California | | | 5.00 | | | | 11-1-2022 | | | | 2,500,000 | | | | 2,809,450 | |
| | | | |
California | | | 5.00 | | | | 10-1-2023 | | | | 8,400,000 | | | | 9,708,636 | |
| | | | |
California | | | 5.25 | | | | 10-1-2022 | | | | 2,750,000 | | | | 3,104,090 | |
| | | | |
California Refunding Bond Various Purpose Bidding Group C | | | 5.00 | | | | 9-1-2027 | | | | 8,500,000 | | | | 10,518,750 | |
| | | | |
California Series B (SIFMA Municipal Swap +0.38%)± | | | 2.28 | | | | 12-1-2027 | | | | 5,000,000 | | | | 5,004,150 | |
| | | | |
California Series B | | | 5.00 | | | | 9-1-2023 | | | | 10,730,000 | | | | 12,370,724 | |
| | | | |
California Statewide Refunding Bond Various Purpose | | | 5.00 | | | | 8-1-2025 | | | | 3,500,000 | | | | 4,243,785 | |
| | | | |
California Statewide Series B (1 Month LIBOR +0.76%)± | | | 2.46 | | | | 12-1-2031 | | | | 2,500,000 | | | | 2,512,625 | |
| | | | |
California Statewide Series E (SIFMA Municipal Swap +0.43%)± | | | 2.33 | | | | 12-1-2029 | | | | 3,050,000 | | | | 3,059,425 | |
| | | | |
Central California Unified School District Refunding Bond (AGM Insured) | | | 4.00 | | | | 7-1-2020 | | | | 500,000 | | | | 514,595 | |
| | | | |
Central California Unified School District Refunding Bond (AGM Insured) | | | 5.00 | | | | 7-1-2021 | | | | 400,000 | | | | 431,148 | |
| | | | |
Central California Unified School District Refunding Bond (AGM Insured) | | | 5.00 | | | | 7-1-2022 | | | | 750,000 | | | | 835,838 | |
| | | | |
Coachella Valley CA Unified School District (Build America Mutual Assurance Company Insured) | | | 4.00 | | | | 8-1-2020 | | | | 2,455,000 | | | | 2,528,552 | |
| | | | |
Coachella Valley CA Unified School District (Build America Mutual Assurance Company Insured) | | | 4.00 | | | | 8-1-2021 | | | | 2,230,000 | | | | 2,359,964 | |
| | | | |
Coachella Valley CA Unified School District (Build America Mutual Assurance Company Insured) | | | 4.00 | | | | 8-1-2022 | | | | 1,000,000 | | | | 1,085,700 | |
| | | | |
Cotati Rohnert Park CA Unified School District Series B (AGM Insured) | | | 5.00 | | | | 8-1-2020 | | | | 2,275,000 | | | | 2,368,776 | |
| | | | |
Dixon CA Unified School District (AGM Insured) | | | 5.00 | | | | 8-1-2021 | | | | 1,210,000 | | | | 1,305,578 | |
| | | | |
Dixon CA Unified School District (AGM Insured) | | | 5.00 | | | | 8-1-2022 | | | | 1,285,000 | | | | 1,433,482 | |
| | | | |
El Monte CA City School District CAB BAN ¤ | | | 0.00 | | | | 4-1-2023 | | | | 2,000,000 | | | | 1,879,880 | |
| | | | |
El Monte CA Union High School Refunding Bond | | | 5.00 | | | | 6-1-2021 | | | | 1,315,000 | | | | 1,413,152 | |
| | | | |
Fowler CA Unified School District School Facilities Improvement District #1 (National Insured) | | | 5.20 | | | | 7-1-2020 | | | | 385,000 | | | | 392,280 | |
| | | | |
Hayward CA Unified School District Certificate of Participation (AGM Insured) | | | 5.00 | | | | 8-1-2022 | | | | 500,000 | | | | 557,615 | |
| | | | |
Hayward CA Unified School District Certificate of Participation (AGM Insured) | | | 5.00 | | | | 8-1-2023 | | | | 805,000 | | | | 926,120 | |
| | | | |
Huntington Beach CA City School District Election of 2002 | | | 4.00 | | | | 8-1-2021 | | | | 505,000 | | | | 535,073 | |
| | | | |
Inglewood CA Unified School District Election of 2012 Series B (Build America Mutual Assurance Company Insured) | | | 4.00 | | | | 8-1-2021 | | | | 320,000 | | | | 336,416 | |
| | | | |
Inglewood CA Unified School District Election of 2012 Series B (Build America Mutual Assurance Company Insured) | | | 4.00 | | | | 8-1-2022 | | | | 200,000 | | | | 214,808 | |
| | | | |
Inglewood CA Unified School District Election of 2012 Series B (Build America Mutual Assurance Company Insured) | | | 5.00 | | | | 8-1-2023 | | | | 195,000 | | | | 220,925 | |
| | | | |
Inglewood CA Unified School District Election of 2012 Series B (Build America Mutual Assurance Company Insured) | | | 5.00 | | | | 8-1-2024 | | | | 150,000 | | | | 174,245 | |
| | | | |
Inglewood CA Unified School District Election of 2012 Series B (Build America Mutual Assurance Company Insured) | | | 5.00 | | | | 8-1-2025 | | | | 170,000 | | | | 201,758 | |
12 | Wells Fargo California Limited-Term Tax-Free Fund
Portfolio of investments—June 30, 2019
| | | | | | | | | | | | | | | | |
| | | Interest
rate | | | Maturity
date | | | Principal | | | Value | |
|
| GO Revenue (continued) | |
| | | | |
Inglewood CA Unified School District Election of 2012 Series B (Build America Mutual Assurance Company Insured) | | | 5.00 | % | | | 8-1-2026 | | | $ | 235,000 | | | $ | 284,620 | |
| | | | |
La Habra CA School District Refunding Bond | | | 5.00 | | | | 8-1-2019 | | | | 950,000 | | | | 953,002 | |
| | | | |
La Habra CA School District Refunding Bond | | | 5.00 | | | | 8-1-2020 | | | | 1,045,000 | | | | 1,089,224 | |
| | | | |
La Habra CA School District Refunding Bond | | | 5.00 | | | | 8-1-2021 | | | | 805,000 | | | | 868,587 | |
| | | | |
Los Angeles CA Unified School District Refunding Bond Series D | | | 5.00 | | | | 7-1-2023 | | | | 6,180,000 | | | | 7,050,391 | |
| | | | |
Merced CA Union High School CAB Series A (National Insured) ¤ | | | 0.00 | | | | 8-1-2019 | | | | 2,190,000 | | | | 2,187,635 | |
| | | | |
Mount San Antonio Community College District CAB ¤ | | | 0.00 | | | | 4-1-2022 | | | | 10,000,000 | | | | 9,601,900 | |
| | | | |
Natomas CA Unified School District (AGM Insured) | | | 3.00 | | | | 9-1-2019 | | | | 1,000,000 | | | | 1,002,990 | |
| | | | |
Oak Valley CA Hospital District Refunding Bond Los Angeles County CA Redevelopment Authority | | | 4.00 | | | | 7-1-2020 | | | | 500,000 | | | | 514,040 | |
| | | | |
Oak Valley CA Hospital District Refunding Bond Los Angeles County CA Redevelopment Authority | | | 5.00 | | | | 7-1-2021 | | | | 950,000 | | | | 1,019,863 | |
| | | | |
Oak Valley CA Hospital District Refunding Bond Los Angeles County CA Redevelopment Authority | | | 5.00 | | | | 7-1-2022 | | | | 750,000 | | | | 826,485 | |
| | | | |
Oak Valley CA Hospital District Refunding Bond Los Angeles County CA Redevelopment Authority | | | 5.00 | | | | 7-1-2023 | | | | 755,000 | | | | 856,291 | |
| | | | |
Oakland CA Unified School District Alameda County Election of 2012 Series A | | | 5.00 | | | | 8-1-2022 | | | | 750,000 | | | | 831,848 | |
| | | | |
Oakland CA Unified School District Alameda County Election of 2012 Series A | | | 5.00 | | | | 8-1-2024 | | | | 600,000 | | | | 702,078 | |
| | | | |
Oakland CA Unified School District Refunding Bond | | | 5.00 | | | | 8-1-2025 | | | | 1,540,000 | | | | 1,846,368 | |
| | | | |
Oakland CA Unified School District Refunding Bond | | | 5.00 | | | | 8-1-2028 | | | | 2,500,000 | | | | 3,029,550 | |
| | | | |
Oakland CA Unified School District Refunding Bond Measure B Series B | | | 5.00 | | | | 8-1-2026 | | | | 500,000 | | | | 612,650 | |
| | | | |
Oakland CA Unified School District Refunding Bond Measure J Series C | | | 5.00 | | | | 8-1-2025 | | | | 795,000 | | | | 953,157 | |
| | | | |
Redondo Beach CA Unified School District CAB Election of 2008 Series E ¤ | | | 0.00 | | | | 8-1-2020 | | | | 460,000 | | | | 452,971 | |
| | | | |
Riverside CA Community College District Election of 2004 CAB Series D ¤ | | | 0.00 | | | | 8-1-2020 | | | | 535,000 | | | | 526,938 | |
| | | | |
Sacramento CA City Unified School Election 2012 Measure Q Series E | | | 5.00 | | | | 8-1-2029 | | | | 1,500,000 | | | | 1,816,650 | |
| | | | |
Sacramento CA City Unified School Refunding Bond | | | 5.00 | | | | 7-1-2026 | | | | 2,430,000 | | | | 2,590,988 | |
| | | | |
Sacramento CA City Unified School Refunding Bond | | | 5.00 | | | | 7-1-2022 | | | | 485,000 | | | | 529,382 | |
| | | | |
Salinas CA Union High School District CAB ¤ | | | 0.00 | | | | 8-1-2020 | | | | 5,000,000 | | | | 4,888,650 | |
| | | | |
San Gorgonio CA Memorial Healthcare Refunding Bond | | | 5.00 | | | | 8-1-2021 | | | | 275,000 | | | | 293,898 | |
| | | | |
San Gorgonio CA Memorial Healthcare Refunding Bond | | | 5.00 | | | | 8-1-2022 | | | | 500,000 | | | | 547,105 | |
| | | | |
San Gorgonio CA Memorial Healthcare Refunding Bond | | | 5.00 | | | | 8-1-2023 | | | | 1,000,000 | | | | 1,122,420 | |
| | | | |
San Mateo Foster City CA School District | | | 5.00 | | | | 8-15-2020 | | | | 2,000,000 | | | | 2,087,660 | |
| | | | |
Santa Ana CA Unified School District CAB Election of 2008 Series A ¤ | | | 0.00 | | | | 8-1-2020 | | | | 1,815,000 | | | | 1,785,724 | |
| | | | |
Sierra Kings CA Health Care Refunding Bond | | | 4.00 | | | | 8-1-2019 | | | | 225,000 | | | | 225,506 | |
| | | | |
Sierra Kings CA Health Care Refunding Bond | | | 4.00 | | | | 8-1-2021 | | | | 345,000 | | | | 363,789 | |
| | | | |
Sierra Kings CA Health Care Refunding Bond | | | 4.00 | | | | 8-1-2022 | | | | 425,000 | | | | 458,337 | |
| | | | |
Sierra Kings CA Health Care Refunding Bond | | | 4.00 | | | | 8-1-2023 | | | | 405,000 | | | | 444,933 | |
| | | | |
Sierra Kings CA Health Care Refunding Bond | | | 4.00 | | | | 8-1-2024 | | | | 420,000 | | | | 470,555 | |
| | | | |
Southern CA Mono Healthcare District | | | 4.00 | | | | 8-1-2019 | | | | 845,000 | | | | 846,707 | |
| | | | |
SouthWestern Community College District Refunding Bond | | | 5.00 | | | | 8-1-2020 | | | | 1,250,000 | | | | 1,302,488 | |
| | | | |
SouthWestern Community College District Refunding Bond | | | 5.00 | | | | 8-1-2021 | | | | 2,710,000 | | | | 2,926,990 | |
| | | | |
Sweetwater CA Union High School District PFA Refunding Bond (Build America Mutual Assurance Company Insured) | | | 5.00 | | | | 8-1-2021 | | | | 620,000 | | | | 664,063 | |
| | | | |
Twin Rivers CA Unified School District Series A (Build America Mutual Assurance Company Insured) | | | 4.00 | | | | 8-1-2019 | | | | 385,000 | | | | 385,878 | |
| | | | |
Twin Rivers CA Unified School District Series A (Build America Mutual Assurance Company Insured) | | | 5.00 | | | | 8-1-2020 | | | | 510,000 | | | | 531,022 | |
| | | | |
Vacaville CA Unified School District Series C (Build America Mutual Assurance Company Insured) | | | 5.00 | | | | 8-1-2022 | | | | 675,000 | | | | 754,083 | |
| | | | |
Vallejo City CA Unified School District Refunding Bond Series A (National Insured) | | | 5.90 | | | | 2-1-2022 | | | | 3,905,000 | | | | 4,306,629 | |
| | | | |
| | | | | | | | | | | | | | | 148,512,638 | |
| | | | | | | | | | | | | | | | |
Wells Fargo California Limited-Term Tax-Free Fund | 13
Portfolio of investments—June 30, 2019
| | | | | | | | | | | | | | | | |
| | | Interest
rate | | | Maturity
date | | | Principal | | | Value | |
| Health Revenue: 7.18% | |
| | | | |
Association of Bay Area Governments California Finance Authority for Nonprofit Corporations Sharp Healthcare Series A | | | 5.00 | % | | | 8-1-2019 | | | $ | 500,000 | | | $ | 501,560 | |
| | | | |
California HFFA Catholic Healthcare West Series A | | | 5.25 | | | | 3-1-2023 | | | | 4,000,000 | | | | 4,240,480 | |
| | | | |
California HFFA El Camino Hospital | | | 5.00 | | | | 2-1-2025 | | | | 1,000,000 | | | | 1,198,910 | |
| | | | |
California HFFA Fellowship Homes Incorporated | | | 5.00 | | | | 9-1-2019 | | | | 390,000 | | | | 392,340 | |
| | | | |
California HFFA Memorial Health Services Series A | | | 5.00 | | | | 10-1-2023 | | | | 2,475,000 | | | | 2,781,628 | |
| | | | |
California HFFA Providence St. Joseph Series B1 | | | 1.25 | | | | 10-1-2036 | | | | 2,000,000 | | | | 1,994,080 | |
| | | | |
California HFFA Sutter Health Series A | | | 5.00 | | | | 11-15-2023 | | | | 2,500,000 | | | | 2,904,650 | |
| | | | |
California Municipal Finance Authority Community Medical Centers Series A | | | 5.00 | | | | 2-1-2023 | | | | 735,000 | | | | 825,581 | |
| | | | |
California Municipal Finance Authority Community Medical Centers Series A | | | 5.00 | | | | 2-1-2024 | | | | 500,000 | | | | 576,635 | |
| | | | |
California Municipal Finance Authority Revenue Community Medical Centers Series A | | | 5.00 | | | | 2-1-2025 | | | | 1,000,000 | | | | 1,180,590 | |
| | | | |
California Municipal Finance Authority Revenue Paradise Valley Estates Project Series B1 | | | 2.25 | | | | 7-1-2025 | | | | 2,200,000 | | | | 2,213,442 | |
| | | | |
California Municipal Finance Authority Revenue Paradise Valley Estates Project Series B2 | | | 2.00 | | | | 7-1-2024 | | | | 2,500,000 | | | | 2,514,575 | |
| | | | |
California Municipal Finance Authority Revenue Insured Channing House Project Series A | | | 5.00 | | | | 5-15-2022 | | | | 475,000 | | | | 526,528 | |
| | | | |
California Municipal Finance Authority Revenue Insured Channing House Project Series A | | | 5.00 | | | | 5-15-2023 | | | | 925,000 | | | | 1,058,496 | |
| | | | |
California Municipal Finance Authority Revenue Refunding Bond Community Medical Centers Series A | | | 5.00 | | | | 2-1-2022 | | | | 1,000,000 | | | | 1,091,120 | |
| | | | |
California Municipal Finance Authority Revenue Refunding Bond Eisenhower Medical Center Series A | | | 5.00 | | | | 7-1-2027 | | | | 750,000 | | | | 907,290 | |
| | | | |
California Municipal Finance Authority Revenue Refunding Bond Eisenhower Medical Center Series A | | | 5.00 | | | | 7-1-2029 | | | | 400,000 | | | | 479,340 | |
| | | | |
California Statewide CDA Adventist Health Systems West Series A | | | 5.00 | | | | 3-1-2024 | | | | 800,000 | | | | 929,768 | |
| | | | |
California Statewide CDA Health Facilities Catholic Series F (AGM Insured) (m) | | | 2.00 | | | | 7-1-2040 | | | | 1,000,000 | | | | 1,000,000 | |
| | | | |
California Statewide CDA Henry Mayo Newhall Memorial Hospital Series A (AGM Insured) | | | 5.00 | | | | 10-1-2021 | | | | 500,000 | | | | 538,880 | |
| | | | |
California Statewide CDA Henry Mayo Newhall Memorial Hospital Series A (AGM Insured) | | | 5.00 | | | | 10-1-2022 | | | | 395,000 | | | | 439,118 | |
| | | | |
California Statewide CDA Henry Mayo Newhall Memorial Hospital Series A (AGM Insured) | | | 5.00 | | | | 10-1-2023 | | | | 500,000 | | | | 571,205 | |
| | | | |
California Statewide CDA Huntington Memorial Hospital | | | 5.00 | | | | 7-1-2025 | | | | 500,000 | | | | 593,240 | |
| | | | |
California Statewide CDA Huntington Memorial Hospital | | | 5.00 | | | | 7-1-2026 | | | | 500,000 | | | | 605,695 | |
| | | | |
California Statewide CDA Insured Viamonte Senior Living 1 Project | | | 3.00 | | | | 7-1-2025 | | | | 3,000,000 | | | | 3,058,560 | |
| | | | |
California Statewide CDA Revenue Loma Linda University Medical Center Series A 144A | | | 5.00 | | | | 12-1-2026 | | | | 250,000 | | | | 291,888 | |
| | | | |
California Statewide CDA Revenue Loma Linda University Medical Center Series A 144A | | | 5.00 | | | | 12-1-2027 | | | | 300,000 | | | | 354,234 | |
| | | | |
California Statewide CDA Revenue Loma Linda University Medical Center Series A 144A | | | 5.00 | | | | 12-1-2028 | | | | 250,000 | | | | 295,783 | |
| | | | |
San Buenaventura CA Community Mental Health System | | | 6.00 | | | | 12-1-2019 | | | | 2,000,000 | | | | 2,033,260 | |
| | | | |
San Buenaventura CA Community Mental Health System | | | 6.50 | | | | 12-1-2021 | | | | 2,585,000 | | | | 2,862,241 | |
| | | | |
Washington Township CA Health Care District Revenue Refunding Bond Series A | | | 5.00 | | | | 7-1-2023 | | | | 600,000 | | | | 676,518 | |
| | | | |
| | | | | | | | | | | | | | | 39,637,635 | |
| | | | | | | | | | | | | | | | |
|
| Housing Revenue: 4.51% | |
| | | | |
California Department of Veterans Affairs Home Purchase Series A | | | 3.50 | | | | 12-1-2021 | | | | 855,000 | | | | 890,927 | |
| | | | |
California HFA Home Mortgage Series A (GNMA/FNMA/FHLMC Insured) | | | 3.75 | | | | 8-1-2020 | | | | 335,000 | | | | 335,978 | |
| | | | |
California Independent Cities Finance Authority Union City Tropics Mobile Home Park Revenue Refunding Bond | | | 4.25 | | | | 5-15-2024 | | | | 745,000 | | | | 818,755 | |
14 | Wells Fargo California Limited-Term Tax-Free Fund
Portfolio of investments—June 30, 2019
| | | | | | | | | | | | | | | | |
| | | Interest
rate | | | Maturity
date | | | Principal | | | Value | |
| Housing Revenue (continued) | |
| | | | |
California Municipal Finance Authority Mobile Senior Caritas Affordable Housing Incorporated Projects Series A | | | 5.00 | % | | | 8-15-2019 | | | $ | 515,000 | | | $ | 517,075 | |
| | | | |
California Municipal Finance Authority Multifamily 1 Church Street Series B | | | 2.19 | | | | 9-1-2021 | | | | 10,000,000 | | | | 10,080,700 | |
| | | | |
California Municipal Finance Authority Peppertree Senior Apartments Series A (FHLMC Insured, FHLMC LIQ) | | | 2.80 | | | | 6-1-2023 | | | | 2,500,000 | | | | 2,626,500 | |
| | | | |
California Municipal Finance Authority Student Housing Davis I LLC West Village Student Housing Project | | | 5.00 | | | | 5-15-2024 | | | | 1,200,000 | | | | 1,378,200 | |
| | | | |
California Municipal Finance Authority Student Housing Davis I LLC West Village Student Housing Project | | | 5.00 | | | | 5-15-2025 | | | | 3,435,000 | | | | 4,026,129 | |
| | | | |
California Municipal Finance Authority Village Grove Apartments Series A (FHLMC Insured, FHLMC LIQ) | | | 3.10 | | | | 12-1-2021 | | | | 1,000,000 | | | | 1,038,020 | |
| | | | |
California PFA University Housing Revenue Claremont Properties LLC Project Series A 144A | | | 5.00 | | | | 7-1-2027 | | | | 1,825,000 | | | | 1,922,054 | |
| | | | |
California Statewide CDA College Housing Revenue Bonds 144A | | | 5.00 | | | | 7-1-2024 | | | | 500,000 | | | | 543,055 | |
| | | | |
California Statewide CDA Revenue Lancer Educational Student Housing Project 144A | | | 3.00 | | | | 6-1-2029 | | | | 750,000 | | | | 758,655 | |
| | | | |
| | | | | | | | | | | | | | | 24,936,048 | |
| | | | | | | | | | | | | | | | |
|
| Industrial Development Revenue: 1.02% | |
| | | | |
California PCFA AMT Calplant I Project 144A | | | 7.00 | | | | 7-1-2022 | | | | 500,000 | | | | 515,525 | |
| | | | |
California PCFA AMT Calplant I Project 144A | | | 7.50 | | | | 7-1-2032 | | | | 1,500,000 | | | | 1,575,480 | |
| | | | |
San Francisco CA City And County Airports Commission International Airport Revenue AMT Special Facilities Lease SFO Fuel Company Series 2019A | | | 5.00 | | | | 1-1-2025 | | | | 3,000,000 | | | | 3,524,460 | |
| | | | |
| | | | | | | | | | | | | | | 5,615,465 | |
| | | | | | | | | | | | | | | | |
|
| Miscellaneous Revenue: 13.88% | |
| | | | |
Alameda County CA Joint Powers Authority Multiple Capital Projects Series A | | | 4.00 | | | | 12-1-2019 | | | | 1,000,000 | | | | 1,012,140 | |
| | | | |
Alameda County CA Joint Powers Authority Multiple Capital Projects Series A | | | 5.00 | | | | 12-1-2021 | | | | 1,000,000 | | | | 1,091,630 | |
| | | | |
Albany CA Limited Obligation Improvement Bond Act of 1915 (Ambac Insured) | | | 4.75 | | | | 9-2-2019 | | | | 455,000 | | | | 457,671 | |
| | | | |
Association of Bay Area Governments California Finance Authority for Nonprofit Corporations Jackson Laboratory | | | 5.00 | | | | 7-1-2019 | | | | 730,000 | | | | 730,000 | |
| | | | |
Brentwood CA Infrastructure Financing Authority Subordinate Bond Series B | | | 4.00 | | | | 9-2-2021 | | | | 1,135,000 | | | | 1,199,809 | |
| | | | |
California | | | 5.00 | | | | 9-1-2022 | | | | 2,240,000 | | | | 2,504,029 | |
| | | | |
California Infrastructure & Economic Development Bank Refunding Bond California Academy of Sciences Project Series C (1 Month LIBOR +0.38%) ± | | | 2.06 | | | | 8-1-2047 | | | | 4,000,000 | | | | 3,999,960 | |
| | | | |
California Public Works Board Capital Project Series G | | | 5.00 | | | | 11-1-2020 | | | | 3,000,000 | | | | 3,149,970 | |
| | | | |
California Public Works Board Department of Corrections & Rehabilitation Series C | | | 5.00 | | | | 10-1-2022 | | | | 1,500,000 | | | | 1,679,190 | |
| | | | |
California Public Works Board Judicial Council Projects Series B | | | 5.00 | | | | 10-1-2022 | | | | 500,000 | | | | 559,730 | |
| | | | |
California Public Works Board Judicial Council Projects Series D | | | 5.00 | | | | 12-1-2019 | | | | 1,000,000 | | | | 1,015,840 | |
| | | | |
California Public Works Board Various Capital Projects Series I | | | 5.00 | | | | 11-1-2020 | | | | 1,250,000 | | | | 1,312,488 | |
| | | | |
California Statewide CDA Refunding Bond (AGM Insured) | | | 5.00 | | | | 11-15-2019 | | | | 250,000 | | | | 253,628 | |
| | | | |
California Statewide CDA Refunding Bond (AGM Insured) | | | 5.00 | | | | 11-15-2020 | | | | 210,000 | | | | 221,246 | |
| | | | |
California Statewide CDA Refunding Bond (AGM Insured) | | | 5.00 | | | | 11-15-2021 | | | | 200,000 | | | | 217,846 | |
| | | | |
California Statewide CDA Refunding Bond (AGM Insured) | | | 5.00 | | | | 11-15-2022 | | | | 200,000 | | | | 224,890 | |
| | | | |
California Statewide Community Monterey County Savers Bond (Build America Mutual Assurance Company Insured) | | | 5.00 | | | | 8-1-2027 | | | | 2,185,000 | | | | 2,702,211 | |
| | | | |
Carlsbad CA Improvement Bond Act of 1915 | | | 3.00 | | | | 9-2-2019 | | | | 540,000 | | | | 541,118 | |
| | | | |
Chula Vista CA Certificate of Participation Refunding Bond Police Facility Project | | | 5.00 | | | | 10-1-2021 | | | | 720,000 | | | | 782,338 | |
| | | | |
Compton CA PFA Lease 144A | | | 4.00 | | | | 9-1-2022 | | | | 2,000,000 | | | | 2,039,480 | |
| | | | |
Compton CA PFA Refunding Bond 144A | | | 4.00 | | | | 9-1-2027 | | | | 2,000,000 | | | | 2,045,840 | |
| | | | |
Desert Sands CA Unified School District Certificate of Participation (Build America Mutual Assurance Company Insured) | | | 5.00 | | | | 3-1-2024 | | | | 1,500,000 | | | | 1,759,620 | |
Wells Fargo California Limited-Term Tax-Free Fund | 15
Portfolio of investments—June 30, 2019
| | | | | | | | | | | | | | | | |
| | | Interest
rate | | | Maturity
date | | | Principal | | | Value | |
|
| Miscellaneous Revenue (continued) | |
| | | | |
Fresno County CA Financing Authority Lease Series A (AGM Insured) | | | 3.00 | % | | | 8-1-2019 | | | $ | 970,000 | | | $ | 971,513 | |
| | | | |
Golden Empire School CA Financing Authority Refunding Bond Kern High School District | | | 5.00 | | | | 5-1-2021 | | | | 1,000,000 | | | | 1,067,830 | |
| | | | |
Inglewood CA Unified School District School Facilities Authority (AGM Insured) | | | 5.25 | | | | 10-15-2023 | | | | 8,670,000 | | | | 9,758,345 | |
| | | | |
Irvine CA Limited Obligation Improvement Bonds Reassessment District#15-2 | | | 5.00 | | | | 9-2-2023 | | | | 800,000 | | | | 901,816 | |
| | | | |
Irvine CA Limited Obligation Improvement Bonds ReassessmentDistrict #15-2 | | | 5.00 | | | | 9-2-2024 | | | | 850,000 | | | | 978,384 | |
| | | | |
Lodi CA Public Financing Authority Electric Refunding Bond (AGM Insured) | | | 5.00 | | | | 9-1-2024 | | | | 1,100,000 | | | | 1,300,046 | |
| | | | |
Los Angeles CA Public Works Series D | | | 5.00 | | | | 12-1-2027 | | | | 1,605,000 | | | | 1,964,745 | |
| | | | |
Los Angeles CA Unified School District Certificate of Participation Headquarters Building Projects Series B | | | 5.00 | | | | 10-1-2025 | | | | 1,875,000 | | | | 2,081,250 | |
| | | | |
Los Angeles County CA Public Works Multiple Capital Projects II | | | 5.00 | | | | 8-1-2020 | | | | 500,000 | | | | 521,160 | |
| | | | |
Norwalk CA Community Facilities Financing Series A (AGM Insured) | | | 4.00 | | | | 6-1-2020 | | | | 350,000 | | | | 359,363 | |
| | | | |
Norwalk CA Community Facilities Financing Series B (AGM Insured) | | | 4.00 | | | | 6-1-2020 | | | | 650,000 | | | | 667,388 | |
| | | | |
Palo Alto CA Improvement Bond Act of 1915 University AreaOff-Street Parking Assessment District | | | 4.00 | | | | 9-2-2021 | | | | 450,000 | | | | 476,091 | |
| | | | |
Palomar Health California Certificate of Participation Health & Arch Health Partners Incorporated | | | 5.00 | | | | 11-1-2019 | | | | 400,000 | | | | 403,960 | |
| | | | |
Palomar Health California Certificate of Participation Health & Arch Health Partners Incorporated | | | 5.00 | | | | 11-1-2020 | | | | 250,000 | | | | 259,853 | |
| | | | |
Palomar Health California Certificate of Participation Health & Arch Health Partners Incorporated | | | 5.00 | | | | 11-1-2021 | | | | 275,000 | | | | 293,755 | |
| | | | |
Palomar Health California Certificate of Participation Health & Arch Health Partners Incorporated | | | 5.00 | | | | 11-1-2022 | | | | 375,000 | | | | 411,225 | |
| | | | |
Palomar Health California Certificate of Participation Health & Arch Health Partners Incorporated | | | 5.00 | | | | 11-1-2023 | | | | 300,000 | | | | 336,669 | |
| | | | |
Palomar Health California Certificate of Participation Health & Arch Health Partners Incorporated | | | 5.00 | | | | 11-1-2024 | | | | 300,000 | | | | 344,121 | |
| | | | |
Palomar Health California Certificate of Participation Health & Arch Health Partners Incorporated | | | 5.00 | | | | 11-1-2025 | | | | 330,000 | | | | 385,638 | |
| | | | |
Riverside County CA Public Financing County Facilities Projects | | | 4.00 | | | | 5-1-2020 | | | | 795,000 | | | | 813,865 | |
| | | | |
Sacramento CA City Financing Refunding Bond Master Lease Program Facilities (Build America Mutual Assurance Company Insured) | | | 5.00 | | | | 12-1-2022 | | | | 800,000 | | | | 902,240 | |
| | | | |
Sacramento CA City Schools Joint Powers Financing Authority Series A (Build America Mutual Assurance Company Insured) | | | 5.00 | | | | 3-1-2020 | | | | 1,185,000 | | | | 1,215,869 | |
| | | | |
Sacramento CA City Schools Joint Powers Financing Authority Series A (Build America Mutual Assurance Company Insured) | | | 5.00 | | | | 3-1-2021 | | | | 830,000 | | | | 879,949 | |
| | | | |
Sacramento CA City Schools Joint Powers Financing Authority Series A (Build America Mutual Assurance Company Insured) | | | 5.00 | | | | 3-1-2022 | | | | 775,000 | | | | 849,540 | |
| | | | |
Sacramento CA City Schools Joint Powers Financing Authority Series A (Build America Mutual Assurance Company Insured) | | | 5.00 | | | | 3-1-2023 | | | | 815,000 | | | | 920,437 | |
| | | | |
San Bernardino County CA Certificate of Participation Arrowhead Project Series A | | | 5.50 | | | | 8-1-2020 | | | | 1,000,000 | | | | 1,003,560 | |
| | | | |
Santa Clara County CA Financing Authority Capital Projects Series A | | | 4.00 | | | | 2-1-2024 | | | | 6,000,000 | | | | 6,420,480 | |
| | | | |
Santa Cruz County CA Capital Financing Public Facilities Project (AGM Insured) | | | 4.00 | | | | 8-1-2020 | | | | 150,000 | | | | 154,577 | |
| | | | |
Santa Cruz County CA Capital Financing Public Facilities Project (AGM Insured) | | | 5.00 | | | | 8-1-2021 | | | | 125,000 | | | | 134,551 | |
| | | | |
Santa Cruz County CA Capital Financing Public Facilities Project (AGM Insured) | | | 5.00 | | | | 8-1-2022 | | | | 165,000 | | | | 183,534 | |
| | | | |
Soledad CA Unified School District BAN ¤ | | | 0.00 | | | | 8-1-2021 | | | | 3,000,000 | | | | 2,896,980 | |
| | | | |
Sutter Butte CA Flood Agency Assessment (Build America Mutual Assurance Company Insured) | | | 5.00 | | | | 10-1-2023 | | | | 1,280,000 | | | | 1,466,253 | |
| | | | |
Sutter Butte CA Flood Agency Assessment (Build America Mutual Assurance Company Insured) | | | 5.00 | | | | 10-1-2024 | | | | 715,000 | | | | 839,746 | |
| | | | |
Sutter Butte CA Flood Agency Assessment (Build America Mutual Assurance Company Insured) | | | 5.00 | | | | 10-1-2025 | | | | 1,575,000 | | | | 1,889,575 | |
16 | Wells Fargo California Limited-Term Tax-Free Fund
Portfolio of investments—June 30, 2019
| | | | | | | | | | | | | | | | |
| | | Interest
rate | | | Maturity
date | | | Principal | | | Value | |
|
| Miscellaneous Revenue (continued) | |
| | | | |
Sweetwater CA Union High School District PFA Refunding Bond (Build America Mutual Assurance Company Insured) | | | 5.00 | % | | | 9-1-2019 | | | $ | 1,000,000 | | | $ | 1,006,430 | |
| | | | |
Ventura County CA PFA Series B | | | 5.00 | | | | 11-1-2019 | | | | 375,000 | | | | 379,868 | |
| | | | |
Ventura County CA PFA Series B | | | 5.00 | | | | 11-1-2020 | | | | 250,000 | | | | 263,010 | |
| | | | |
Visalia CA Certificate of Participation (AGM Insured) | | | 4.00 | | | | 12-1-2020 | | | | 250,000 | | | | 260,143 | |
| | | | |
Visalia CA Certificate of Participation (AGM Insured) | | | 4.00 | | | | 12-1-2021 | | | | 250,000 | | | | 267,033 | |
| | | | |
Visalia CA Certificate of Participation (AGM Insured) | | | 5.00 | | | | 12-1-2022 | | | | 335,000 | | | | 377,934 | |
| | | | |
West Sacramento CA Flood Control Agency | | | 2.75 | | | | 9-1-2019 | | | | 285,000 | | | | 285,789 | |
| | | | |
West Sacramento CA Flood Control Agency | | | 5.00 | | | | 9-1-2020 | | | | 290,000 | | | | 303,212 | |
| | | | |
| | | | | | | | | | | | | | | 76,698,401 | |
| | | | | | | | | | | | | | | | |
|
| Tax Revenue: 20.68% | |
| | | | |
California School Infrastructure Financing Agency Refunding Bond (AGM Insured) | | | 5.00 | | | | 9-1-2021 | | | | 1,300,000 | | | | 1,402,349 | |
| | | | |
California Statewide Community Facilities District#2015-01 | | | 5.00 | | | | 9-1-2027 | | | | 500,000 | | | | 564,430 | |
| | | | |
Carson CA RDA Project Area #1 Series A (AGM Insured) | | | 5.00 | | | | 10-1-2020 | | | | 775,000 | | | | 811,727 | |
| | | | |
Carson CA RDA Project Area #1 Series A (AGM Insured) | | | 5.00 | | | | 10-1-2021 | | | | 855,000 | | | | 927,436 | |
| | | | |
Carson CA RDA Project Area #1 Series A (AGM Insured) | | | 5.00 | | | | 10-1-2022 | | | | 600,000 | | | | 672,288 | |
| | | | |
Cathedral City CA RDA Refunding Bond Merged Redevelopment Project Series A | | | 5.00 | | | | 8-1-2020 | | | | 2,295,000 | | | | 2,384,276 | |
| | | | |
Cathedral City CA RDA Refunding Bond Merged Redevelopment Project Series A | | | 5.00 | | | | 8-1-2021 | | | | 2,425,000 | | | | 2,611,337 | |
| | | | |
Cathedral City CA RDA Refunding Bond Merged Redevelopment Project Series A | | | 5.00 | | | | 8-1-2022 | | | | 2,550,000 | | | | 2,831,546 | |
| | | | |
Cathedral City CA RDA Refunding Bond Merged Redevelopment Project Series A | | | 5.00 | | | | 8-1-2023 | | | | 1,735,000 | | | | 1,984,875 | |
| | | | |
Cathedral City CA RDA Refunding Bond Merged Redevelopment Project Series A (AGM Insured) | | | 5.00 | | | | 8-1-2024 | | | | 1,770,000 | | | | 2,074,918 | |
| | | | |
Chino CA PFA Local Agency Series A (AGM Insured) | | | 5.00 | | | | 9-1-2022 | | | | 1,830,000 | | | | 2,043,268 | |
| | | | |
Chino CA PFA Local Agency Series A (AGM Insured) | | | 5.00 | | | | 9-1-2024 | | | | 660,000 | | | | 781,836 | |
| | | | |
Commerce CA RDA CAB Project #1 ¤ | | | 0.00 | | | | 8-1-2021 | | | | 935,000 | | | | 848,391 | |
| | | | |
Commerce CA Successor Agency to the Community Development Commission Refunding Bond Series A (AGM Insured) | | | 5.00 | | | | 8-1-2023 | | | | 600,000 | | | | 685,896 | |
| | | | |
Culver City CA RDA CAB Tax Allocation Series A ¤ | | | 0.00 | | | | 11-1-2019 | | | | 2,575,000 | | | | 2,562,795 | |
| | | | |
Dinuba CA RDA Successor Agency to Merged City Project #2 (Build America Mutual Assurance Company Insured) | | | 4.00 | | | | 9-1-2019 | | | | 210,000 | | | | 210,960 | |
| | | | |
Dinuba CA RDA Successor Agency to Merged City Project #2 (Build America Mutual Assurance Company Insured) | | | 5.00 | | | | 9-1-2021 | | | | 250,000 | | | | 269,795 | |
| | | | |
Dinuba CA RDA Successor Agency to Merged City Project #2 (Build America Mutual Assurance Company Insured) | | | 5.00 | | | | 9-1-2022 | | | | 250,000 | | | | 278,723 | |
| | | | |
Fairfield CA RDA Successor Agency Tax Allocation Refunding Bond | | | 5.00 | | | | 8-1-2020 | | | | 1,000,000 | | | | 1,042,320 | |
| | | | |
Fairfield CA RDA Successor Agency Tax Allocation Refunding Bond | | | 5.00 | | | | 8-1-2021 | | | | 3,170,000 | | | | 3,421,096 | |
| | | | |
Fairfield CA RDA Successor Agency Tax Allocation Refunding Bond | | | 5.00 | | | | 8-1-2022 | | | | 2,395,000 | | | | 2,670,209 | |
| | | | |
Fairfield CA RDA Successor Agency Tax Allocation Refunding Bond | | | 5.00 | | | | 8-1-2023 | | | | 1,025,000 | | | | 1,177,899 | |
| | | | |
Fremont CA Community Facilities District | | | 5.00 | | | | 9-1-2024 | | | | 1,000,000 | | | | 1,140,300 | |
| | | | |
Fullerton CA Community Facilities District | | | 4.00 | | | | 9-1-2019 | | | | 665,000 | | | | 668,086 | |
| | | | |
Garden Grove CA Agency Community Refunding Bond Garden Grove Community Project (Build America Mutual Assurance Company Insured) | | | 4.00 | | | | 10-1-2021 | | | | 770,000 | | | | 816,439 | |
| | | | |
Garden Grove CA Agency Community Refunding Bond Garden Grove Community Project (Build America Mutual Assurance Company Insured) | | | 5.00 | | | | 10-1-2022 | | | | 3,015,000 | | | | 3,374,177 | |
| | | | |
Imperial Beach CA RDA Palm Avenue Commercial Redevelopment Project (Build America Mutual Assurance Company Insured) | | | 4.00 | | | | 6-1-2020 | | | | 775,000 | | | | 794,011 | |
| | | | |
Inglewood CA Redevelopment Refunding Bond Subordinate Lien Merged Redevelopment Project (Build America Mutual Assurance Company Insured) | | | 5.00 | | | | 5-1-2025 | | | | 1,000,000 | | | | 1,193,680 | |
| | | | |
Irwindale CA CDA City Industrial Development Project (AGM Insured) | | | 5.00 | | | | 7-15-2020 | | | | 320,000 | | | | 332,989 | |
| | | | |
Irwindale CA CDA City Industrial Development Project (AGM Insured) | | | 5.00 | | | | 7-15-2021 | | | | 340,000 | | | | 366,296 | |
| | | | |
Irwindale CA CDA City Industrial Development Project (AGM Insured) | | | 5.00 | | | | 7-15-2022 | | | | 365,000 | | | | 406,825 | |
| | | | |
Irwindale CA CDA City Industrial Development Project (AGM Insured) | | | 5.00 | | | | 7-15-2023 | | | | 375,000 | | | | 430,365 | |
Wells Fargo California Limited-Term Tax-Free Fund | 17
Portfolio of investments—June 30, 2019
| | | | | | | | | | | | | | | | |
| | | Interest
rate | | | Maturity
date | | | Principal | | | Value | |
|
| Tax Revenue (continued) | |
| | | | |
Jurupa CA PFA Series A | | | 5.00 | % | | | 9-1-2020 | | | $ | 750,000 | | | $ | 783,098 | |
| | | | |
La Quinta CA RDA Project Areas #1 & 2 Series A | | | 5.00 | | | | 9-1-2019 | | | | 1,150,000 | | | | 1,157,245 | |
| | | | |
La Quinta CA RDA Project Areas #1 & 2 Series A | | | 5.00 | | | | 9-1-2020 | | | | 1,045,000 | | | | 1,091,617 | |
| | | | |
La Quinta CA RDA Project Areas #1 & 2 Series A | | | 5.00 | | | | 9-1-2021 | | | | 565,000 | | | | 612,014 | |
| | | | |
La Quinta CA RDA Project Areas #1 & 2 Series A | | | 5.00 | | | | 9-1-2022 | | | | 615,000 | | | | 689,120 | |
| | | | |
Lancaster CA RDA Refunding Bond Combined Redevelopment Project Areas (AGM Insured) | | | 5.00 | | | | 8-1-2024 | | | | 870,000 | | | | 1,023,607 | |
| | | | |
Lancaster CA RDA Refunding Bond Combined Redevelopment Project Areas (AGM Insured) | | | 5.00 | | | | 8-1-2029 | | | | 400,000 | | | | 486,780 | |
| | | | |
Lincoln CA Special Tax Refunding Bond Community Facilities District#2003-1 Lincoln Crossing Project | | | 4.00 | | | | 9-1-2024 | | | | 600,000 | | | | 676,080 | |
| | | | |
Lincoln CA Special Tax Refunding Bond Community Facilities District#2003-1 Lincoln Crossing Project | | | 5.00 | | | | 9-1-2025 | | | | 550,000 | | | | 663,597 | |
| | | | |
Los Angeles County CA Community Facilities District #5 Rowland Heights Area (AGM Insured) | | | 5.00 | | | | 9-1-2019 | | | | 165,000 | | | | 165,942 | |
| | | | |
Los Angeles County CA Redevelopment Refunding Bond Authority Series D | | | 5.00 | | | | 9-1-2019 | | | | 2,545,000 | | | | 2,560,448 | |
| | | | |
Menifee CA Union School District Public Series A | | | 4.00 | | | | 9-1-2022 | | | | 540,000 | | | | 579,085 | |
| | | | |
Modesto CA Community Facilities District#2004-1 Village One #2 | | | 4.50 | | | | 9-1-2019 | | | | 580,000 | | | | 582,738 | |
| | | | |
Monrovia CA RDA Subordinate Bond Central Project #1 | | | 4.00 | | | | 8-1-2019 | | | | 815,000 | | | | 816,826 | |
| | | | |
Oakdale CA Successor Agency to Oakdale Community RDA Series A (AGM Insured) | | | 5.00 | | | | 6-1-2027 | | | | 350,000 | | | | 428,719 | |
| | | | |
Orange County CA Community Facilities#2015-1 Esencia Village Series A | | | 5.00 | | | | 8-15-2023 | | | | 375,000 | | | | 418,796 | |
| | | | |
Orange County CA Community Facilities#2015-1 Esencia Village Series A | | | 5.00 | | | | 8-15-2025 | | | | 335,000 | | | | 389,880 | |
| | | | |
Orange County CA Development Agency Santa Ana Heights Project | | | 5.00 | | | | 9-1-2019 | | | | 1,085,000 | | | | 1,091,705 | |
| | | | |
Orange County CA Development Agency Santa Ana Heights Project | | | 5.00 | | | | 3-1-2020 | | | | 1,110,000 | | | | 1,137,794 | |
| | | | |
Orange County CA Development Agency Santa Ana Heights Project | | | 5.00 | | | | 9-1-2020 | | | | 1,140,000 | | | | 1,189,898 | |
| | | | |
Pittsburg CA Successor Agency of Los Medanos Community Development (AGM Insured) | | | 5.00 | | | | 8-1-2021 | | | | 1,885,000 | | | | 2,031,879 | |
| | | | |
Pittsburg CA Successor Agency of Los Medanos Community Development (AGM Insured) | | | 5.00 | | | | 8-1-2022 | | | | 1,305,000 | | | | 1,454,527 | |
| | | | |
Pittsburg CA Successor Agency of Los Medanos Community Development (AGM Insured) | | | 5.00 | | | | 8-1-2023 | | | | 780,000 | | | | 895,682 | |
| | | | |
Placentia CA RDA Project (Build America Mutual Assurance Company Insured) | | | 4.00 | | | | 8-1-2019 | | | | 580,000 | | | | 581,369 | |
| | | | |
Placentia CA RDA Project (Build America Mutual Assurance Company Insured) | | | 5.00 | | | | 8-1-2020 | | | | 600,000 | | | | 625,392 | |
| | | | |
Poway CA Unified School District PFA | | | 4.00 | | | | 9-15-2020 | | | | 335,000 | | | | 346,775 | |
| | | | |
Poway CA Unified School District PFA (Build America Mutual Assurance Company Insured) | | | 4.00 | | | | 10-1-2020 | | | | 300,000 | | | | 310,935 | |
| | | | |
Poway CA Unified School District PFA (Build America Mutual Assurance Company Insured) | | | 4.00 | | | | 10-1-2021 | | | | 185,000 | | | | 196,796 | |
| | | | |
Poway CA Unified School District PFA Series B (Build America Mutual Assurance Company Insured) | | | 5.00 | | | | 9-1-2024 | | | | 1,115,000 | | | | 1,326,973 | |
| | | | |
Poway CA Unified School District PFA Series B (Build America Mutual Assurance Company Insured) | | | 5.00 | | | | 9-1-2025 | | | | 775,000 | | | | 947,337 | |
| | | | |
Rialto CA RDA Successor Agency to Merged Project Area | | | 5.00 | | | | 9-1-2022 | | | | 475,000 | | | | 530,832 | |
| | | | |
Riverside CA PFA Local Measure Certificate of Participation Riverside Pavement Rehabilitation Project (AGM Insured) | | | 5.00 | | | | 6-1-2023 | | | | 845,000 | | | | 969,680 | |
| | | | |
Riverside County CA PFA Indian Wells Project Series A (AGM Insured) | | | 5.00 | | | | 9-1-2020 | | | | 1,610,000 | | | | 1,680,277 | |
| | | | |
Romoland CA School District Community Facilities District#2004-1 | | | 4.00 | | | | 9-1-2019 | | | | 850,000 | | | | 853,290 | |
| | | | |
Roseville CA Finance Authority Special Refunding Bond Series A | | | 5.00 | | | | 9-1-2023 | | | | 400,000 | | | | 462,048 | |
| | | | |
Roseville CA Finance Authority Special Refunding Bond Series A | | | 5.00 | | | | 9-1-2029 | | | | 300,000 | | | | 378,591 | |
| | | | |
Roseville CA Special Tax Refunding Bond Community Facilities District | | | 4.00 | | | | 9-1-2019 | | | | 875,000 | | | | 878,430 | |
| | | | |
Roseville CA Special Tax Refunding Bond Community Facilities District | | | 5.00 | | | | 9-1-2020 | | | | 1,050,000 | | | | 1,090,026 | |
| | | | |
Roseville CA Special Tax Refunding Bond Community Facilities District | | | 5.00 | | | | 9-1-2021 | | | | 500,000 | | | | 534,600 | |
| | | | |
Roseville CA Special Tax Refunding Bond Fiddyment Ranch Community | | | 5.00 | | | | 9-1-2024 | | | | 1,905,000 | | | | 2,177,396 | |
18 | Wells Fargo California Limited-Term Tax-Free Fund
Portfolio of investments—June 30, 2019
| | | | | | | | | | | | | | | | |
| | | Interest
rate | | | Maturity
date | | | Principal | | | Value | |
|
| Tax Revenue (continued) | |
| | | | |
Roseville CA Special Tax Refunding Bond Fiddyment Ranch Community | | | 5.00 | % | | | 9-1-2029 | | | $ | 1,595,000 | | | $ | 1,906,727 | |
| | | | |
San Francisco CA City & County RDA Successor Agency to Community Facilities District #6 Mission Bay South Series A | | | 5.00 | | | | 8-1-2019 | | | | 555,000 | | | | 556,510 | |
| | | | |
San Francisco CA City & County RDA Successor Agency to Community Facilities District #6 Mission Bay South Series A | | | 5.00 | | | | 8-1-2025 | | | | 1,600,000 | | | | 1,747,200 | |
| | | | |
San Francisco CA City & County RDA Successor Agency to Mission Bay South Redevelopment Project Series A | | | 5.00 | | | | 8-1-2020 | | | | 500,000 | | | | 520,330 | |
| | | | |
San Francisco CA City & County RDA Successor Agency to Mission Bay South Redevelopment Project Series A | | | 5.00 | | | | 8-1-2022 | | | | 375,000 | | | | 416,524 | |
| | | | |
San Francisco CA City & County RDA Successor Agency to Mission Bay South Redevelopment Project Subordinate Bond Series D 144A | | | 3.00 | | | | 8-1-2021 | | | | 2,555,000 | | | | 2,602,089 | |
| | | | |
San Jose CA Convention Center Expansion & Renovation Project | | | 5.25 | | | | 5-1-2023 | | | | 1,465,000 | | | | 1,569,191 | |
| | | | |
San Jose CA RDA Tax Refunding Bond Merged Area Redevelopment ProjectSeries A-1 | | | 5.00 | | | | 8-1-2022 | | | | 800,000 | | | | 833,152 | |
| | | | |
San Marcos CA Unified School District Community Facilities District #5 (Build America Mutual Assurance Company Insured) | | | 5.00 | | | | 9-1-2020 | | | | 220,000 | | | | 230,023 | |
| | | | |
San Marcos CA Unified School District Community Facilities District #5 (Build America Mutual Assurance Company Insured) | | | 5.00 | | | | 9-1-2021 | | | | 270,000 | | | | 292,224 | |
| | | | |
San Marcos CA Unified School District Community Facilities District #5 (Build America Mutual Assurance Company Insured) | | | 5.00 | | | | 9-1-2022 | | | | 250,000 | | | | 279,300 | |
| | | | |
San Pablo CA RDA Series B (AGM Insured) | | | 5.00 | | | | 6-15-2021 | | | | 1,775,000 | | | | 1,901,220 | |
| | | | |
San Pablo CA RDA Series B (AGM Insured) | | | 5.00 | | | | 6-15-2022 | | | | 1,865,000 | | | | 2,064,443 | |
| | | | |
San Pablo CA RDA Series B (AGM Insured) | | | 5.00 | | | | 6-15-2023 | | | | 1,945,000 | | | | 2,214,441 | |
| | | | |
Santa Ana CA Community RDA Merged Project Area Series A | | | 5.25 | | | | 9-1-2019 | | | | 1,000,000 | | | | 1,006,590 | |
| | | | |
Santa Cruz County CA Redevelopment Successor Agency Tax Allocation Refunding Bond (Build America Mutual Assurance Company Insured) | | | 5.00 | | | | 9-1-2019 | | | | 625,000 | | | | 628,925 | |
| | | | |
Santa Cruz County CA Redevelopment Successor Agency Tax Allocation Refunding Bond (Build America Mutual Assurance Company Insured) | | | 5.00 | | | | 9-1-2020 | | | | 1,000,000 | | | | 1,044,490 | |
| | | | |
Solana Beach CA School District Special Tax PFA | | | 4.00 | | | | 9-1-2019 | | | | 735,000 | | | | 738,410 | |
| | | | |
Stockton CA RDA Refunding Bond Series A (AGM Insured) | | | 5.00 | | | | 9-1-2025 | | | | 1,675,000 | | | | 2,019,849 | |
| | | | |
Successor Agency to the Morgan Hill CA RDA Series A | | | 5.00 | | | | 9-1-2021 | | | | 1,055,000 | | | | 1,142,787 | |
| | | | |
Successor Agency to the Richmond CA Community RDA Series A (Build America Mutual Assurance Company Insured) | | | 4.50 | | | | 9-1-2025 | | | | 160,000 | | | | 181,960 | |
| | | | |
Successor Agency to the Richmond CA Community RDA Series A (Build America Mutual Assurance Company Insured) | | | 5.00 | | | | 9-1-2021 | | | | 310,000 | | | | 334,270 | |
| | | | |
Successor Agency to the Richmond CA Community RDA Series A (Build America Mutual Assurance Company Insured) | | | 5.00 | | | | 9-1-2022 | | | | 300,000 | | | | 334,071 | |
| | | | |
Successor Agency to the Richmond CA Community RDA Series A (Build America Mutual Assurance Company Insured) | | | 5.00 | | | | 9-1-2023 | | | | 265,000 | | | | 303,430 | |
| | | | |
Successor Agency to the Richmond CA Community RDA Series A (Build America Mutual Assurance Company Insured) | | | 5.00 | | | | 9-1-2025 | | | | 150,000 | | | | 173,796 | |
| | | | |
Successor Agency to the Riverside County CA RDA Desert Communities Project Area Series D | | | 5.00 | | | | 10-1-2022 | | | | 445,000 | | | | 496,504 | |
| | | | |
Successor Agency to the Riverside County CA RDA Desert Communities Project Area Series D | | | 5.00 | | | | 10-1-2023 | | | | 470,000 | | | | 540,068 | |
| | | | |
Successor Agency to the Riverside County CA RDA Project Area #1 Series A | | | 5.00 | | | | 10-1-2022 | | | | 240,000 | | | | 267,778 | |
| | | | |
Successor Agency to the Riverside County CA RDA Project Area #1 Series A | | | 5.00 | | | | 10-1-2023 | | | | 460,000 | | | | 528,577 | |
| | | | |
Sulphur Springs CA Union School District Prerefunded Bond Community Facilities District#2002-1 Series A | | | 3.00 | | | | 9-1-2019 | | | | 295,000 | | | | 295,814 | |
| | | | |
Sulphur Springs CA Union School District Unrefunded Bond Community Facilities District#2002-1 Series A | | | 3.00 | | | | 9-1-2019 | | | | 300,000 | | | | 300,951 | |
| | | | |
Tracy CA Community Facilities District#2016-1 | | | 4.00 | | | | 9-1-2021 | | | | 140,000 | | | | 145,475 | |
| | | | |
Tracy CA Community Facilities District#2016-1 | | | 4.00 | | | | 9-1-2022 | | | | 180,000 | | | | 189,410 | |
| | | | |
Tracy CA Community Facilities District#2016-1 | | | 4.00 | | | | 9-1-2024 | | | | 135,000 | | | | 145,415 | |
| | | | |
Tracy CA Community Facilities District#2016-1 | | | 4.00 | | | | 9-1-2025 | | | | 155,000 | | | | 168,612 | |
| | | | |
Tracy CA Community Facilities District#2016-1 | | | 5.00 | | | | 9-1-2028 | | | | 425,000 | | | | 500,293 | |
Wells Fargo California Limited-Term Tax-Free Fund | 19
Portfolio of investments—June 30, 2019
| | | | | | | | | | | | | | | | |
| | | Interest
rate | | | Maturity
date | | | Principal | | | Value | |
|
| Tax Revenue (continued) | |
| | | | |
Tustin CA Community Facilities District#6-1 Legacy Columbus Villages Series A | | | 5.00 | % | | | 9-1-2025 | | | $ | 1,000,000 | | | $ | 1,203,920 | |
| | | | |
Upland CA Successor Agency to Merged Project Tax Allocation Bond (AGM Insured) | | | 5.00 | | | | 9-1-2023 | | | | 1,000,000 | | | | 1,148,080 | |
| | | | |
Vacaville CA RDA Tax Allocation Refunding Bond Subordinate Redevelopment Projects | | | 5.00 | | | | 9-1-2020 | | | | 600,000 | | | | 626,622 | |
| | | | |
Vacaville CA RDA Tax Allocation Refunding Bond Subordinate Redevelopment Projects | | | 5.00 | | | | 9-1-2021 | | | | 600,000 | | | | 647,376 | |
| | | | |
Vacaville CA RDA Tax Allocation Refunding Bond Subordinate Redevelopment Projects | | | 5.00 | | | | 9-1-2022 | | | | 1,050,000 | | | | 1,170,981 | |
| | | | |
Val Verde CA Unified School District (Build America Mutual Assurance Company Insured) | | | 4.00 | | | | 10-1-2020 | | | | 350,000 | | | | 362,313 | |
| | | | |
Val Verde CA Unified School District (Build America Mutual Assurance Company Insured) | | | 4.00 | | | | 10-1-2021 | | | | 375,000 | | | | 396,758 | |
| | | | |
Val Verde CA Unified School District (Build America Mutual Assurance Company Insured) | | | 5.00 | | | | 10-1-2022 | | | | 665,000 | | | | 740,617 | |
| | | | |
Western Riverside County CA Regional Wastewater Authority SeriesA-1 | | | 4.00 | | | | 9-1-2019 | | | | 1,830,000 | | | | 1,837,961 | |
| | | | |
Yuba City CA RDA Refunding Bond (AGM Insured) | | | 5.00 | | | | 9-1-2025 | | | | 750,000 | | | | 907,358 | |
| | | | |
| | | | | | | | | | | | | | | 114,262,197 | |
| | | | | | | | | | | | | | | | |
|
| Tobacco Revenue: 0.64% | |
| | | | |
Golden State Tobacco Securitization Corporation Tobacco Settlement Refunding Bond Series A1 | | | 5.00 | | | | 6-1-2026 | | | | 3,000,000 | | | | 3,529,650 | |
| | | | | | | | | | | | | | | | |
|
| Transportation Revenue: 0.54% | |
| | | | |
Alameda County CA Corridor Transportation Authority Prerefunded Bond CAB Subordinate Lien Series A (Ambac Insured) ¤ | | | 0.00 | | | | 10-1-2019 | | | | 2,780,000 | | | | 2,771,577 | |
| | | | |
Alameda County CA Corridor Transportation Authority Unrefunded Bond CAB Subordinate Lien Series A (Ambac Insured) ¤ | | | 0.00 | | | | 10-1-2019 | | | | 220,000 | | | | 218,896 | |
| | | | |
| | | | | | | | | | | | | | | 2,990,473 | |
| | | | | | | | | | | | | | | | |
|
| Utilities Revenue: 2.20% | |
| | | | |
Modesto CA Irrigation District Electric Refunding Bond Series A | | | 5.00 | | | | 7-1-2020 | | | | 500,000 | | | | 519,540 | |
| | | | |
Southern California Public Power Authority Refunding Bond Canyon Power Project Series A | | | 2.25 | | | | 7-1-2040 | | | | 6,000,000 | | | | 6,057,420 | |
| | | | |
Southern California Public Power Authority Refunding Bond Canyon Power Project Series A | | | 5.00 | | | | 7-1-2027 | | | | 1,000,000 | | | | 1,069,930 | |
| | | | |
Southern California Public Power Authority Refunding Bond Canyon Power Project Series B (SIFMA Municipal Swap +0.25%)± | | | 2.15 | | | | 7-1-2040 | | | | 4,000,000 | | | | 3,993,080 | |
| | | | |
Walnut CA Energy Center Authority Refunding Bond Series A | | | 5.00 | | | | 1-1-2021 | | | | 500,000 | | | | 529,265 | |
| | | | |
| | | | | | | | | | | | | | | 12,169,235 | |
| | | | | | | | | | | | | | | | |
|
| Water & Sewer Revenue: 3.74% | |
| | | | |
Eastern California Municipal Water District Refunding Bond Series C (SIFMA Municipal Swap +0.25%)± | | | 2.15 | | | | 7-1-2046 | | | | 3,000,000 | | | | 2,997,090 | |
| | | | |
Florin CA Resource Conservation District Series A (National Insured) | | | 5.00 | | | | 9-1-2019 | | | | 1,000,000 | | | | 1,006,180 | |
| | | | |
Florin CA Resource Conservation District Series A (National Insured) | | | 5.00 | | | | 9-1-2020 | | | | 1,000,000 | | | | 1,043,770 | |
| | | | |
Florin CA Resource Conservation District Series A (National Insured) | | | 5.00 | | | | 9-1-2021 | | | | 1,250,000 | | | | 1,347,025 | |
| | | | |
Florin CA Resource Conservation District Series A (National Insured) | | | 5.00 | | | | 9-1-2022 | | | | 1,250,000 | | | | 1,390,725 | |
| | | | |
Goleta CA Water District Certificate of Participation Series A (AGM Insured) | | | 5.00 | | | | 12-1-2019 | | | | 125,000 | | | | 126,975 | |
| | | | |
Goleta CA Water District Certificate of Participation Series A (AGM Insured) | | | 5.00 | | | | 12-1-2020 | | | | 140,000 | | | | 147,414 | |
| | | | |
Oxnard CA Financing Authority Refunding Bond (AGM Insured) | | | 5.00 | | | | 6-1-2021 | | | | 735,000 | | | | 788,405 | |
| | | | |
San Francisco City & County CA Public Utilities Commisison Series C Green Bond | | | 2.13 | | | | 10-1-2048 | | | | 10,000,000 | | | | 10,223,200 | |
| | | | |
San Luis & Delta-Mendota CA Water Authority Delta Habitat Conservation & Conveyance Program Development Project Series A (Build America Mutual Assurance Company Insured) | | | 5.00 | | | | 3-1-2020 | | | | 100,000 | | | | 102,605 | |
20 | Wells Fargo California Limited-Term Tax-Free Fund
Portfolio of investments—June 30, 2019
| | | | | | | | | | | | | | | | |
| | | Interest
rate | | | Maturity
date | | | Principal | | | Value | |
|
| Water & Sewer Revenue (continued) | |
| | | | |
Vallejo CA Refunding Bond (National Insured) | | | 5.00 | % | | | 5-1-2021 | | | $ | 1,500,000 | | | $ | 1,503,735 | |
| | | | |
| | | | | | | | | | | | | | | 20,677,124 | |
| | | | | | | | | | | | | | | | |
| | | | |
| | | | | | | | | | | | | | | 511,597,089 | |
| | | | | | | | | | | | | | | | |
|
| Guam: 1.33% | |
|
| Airport Revenue: 0.26% | |
| | | | |
Guam Port Authority AMT Series B | | | 5.00 | | | | 7-1-2023 | | | | 540,000 | | | | 594,999 | |
| | | | |
Guam Port Authority AMT Series B | | | 5.00 | | | | 7-1-2024 | | | | 750,000 | | | | 842,663 | |
| | | | |
| | | | | | | | | | | | | | | 1,437,662 | |
| | | | | | | | | | | | | | | | |
|
| Miscellaneous Revenue: 0.77% | |
| | | | |
Guam Education Financing Foundation Certificates of Participation Refunding Bond Series A | | | 5.00 | | | | 10-1-2023 | | | | 3,840,000 | | | | 4,236,787 | |
| | | | | | | | | | | | | | | | |
|
| Utilities Revenue: 0.30% | |
| | | | |
Guam Power Authority Series A (AGM Insured) | | | 5.00 | | | | 10-1-2019 | | | | 1,640,000 | | | | 1,653,645 | |
| | | | | | | | | | | | | | | | |
| | | | |
| | | | | | | | | | | | | | | 7,328,094 | |
| | | | | | | | | | | | | | | | |
|
Illinois: 2.51% | |
|
| Miscellaneous Revenue: 2.06% | |
| | | | |
Illinois Series D | | | 5.00 | | | | 11-1-2025 | | | | 10,000,000 | | | | 11,368,600 | |
| | | | | | | | | | | | | | | | |
|
| Tax Revenue: 0.45% | |
| | | | |
Metropolitan Pier & Exposition Authority McCormick Place Expansion Project Series B | | | 5.00 | | | | 12-15-2025 | | | | 650,000 | | | | 733,252 | |
| | | | |
Sales Tax Securitization Corporation Series 2017A | | | 5.00 | | | | 1-1-2026 | | | | 1,500,000 | | | | 1,744,920 | |
| | | | |
| | | | | | | | | | | | | | | 2,478,172 | |
| | | | | | | | | | | | | | | | |
| | | | |
| | | | | | | | | | | | | | | 13,846,772 | |
| | | | | | | | | | | | | | | | |
|
New York: 1.06% | |
|
| Industrial Development Revenue: 1.06% | |
| | | | |
New York Transportation Development Corporation Special Facilities Revenue Delta Air Lines Incorporated LaGuardia Airport Terminals C&D Redevelopment | | | 5.00 | | | | 1-1-2026 | | | | 5,000,000 | | | | 5,878,250 | |
| | | | | | | | | | | | | | | | |
|
Texas: 1.14% | |
|
| Resource Recovery Revenue: 1.14% | |
| | | | |
Port Arthur TX Navigation District Jefferson County Environmental Facilities Motiva Enterprises LLC Project Series A ø | | | 2.07 | | | | 4-1-2040 | | | | 6,300,000 | | | | 6,300,000 | |
| | | | | | | | | | | | | | | | |
| |
Total Municipal Obligations (Cost $528,228,738) | | | | 544,950,205 | |
| | | | | |
| | | | |
| | | | | | | | | | | | | | | | |
| | | Yield | | | | | | Shares | | | | |
| Short-Term Investments: 0.07% | |
|
| Investment Companies: 0.07% | |
| | | | |
Wells Fargo Municipal Cash Management Money Market Fund Institutional Class (l)(u) | | | 1.82 | | | | | | | | 398,366 | | | | 398,605 | |
| | | | | | | | | | | | | | | | |
| | | | |
Total Short-Term Investments (Cost $398,605) | | | | | | | | | | | | | | | 398,605 | |
| | | | | | | | | | | | | | | | |
| | | | | | | | |
| Total investments in securities (Cost $528,627,343) | | | 98.71 | % | | | 545,348,810 | |
| | |
Other assets and liabilities, net | | | 1.29 | | | | 7,101,760 | |
| | | | | | | | |
| Total net assets | | | 100.00 | % | | $ | 552,450,570 | |
| | | | | | | | |
Wells Fargo California Limited-Term Tax-Free Fund | 21
Portfolio of investments—June 30, 2019
| 144A | The security may be resold in transactions exempt from registration, normally to qualified institutional buyers, pursuant to Rule 144A under the Securities Act of 1933. |
| ± | Variable rate investment. The rate shown is the rate in effect at period end. |
| ¤ | The security is issued in zero coupon form with no periodic interest payments. |
| (m) | The security is an auction-rate security which has an interest rate that resets at predetermined short-term intervals through a Dutch auction. The rate shown is the rate in effect at period end. |
| ø | Variable rate demand notes are subject to a demand feature which reduces the effective maturity. The maturity date shown represents the final maturity date of the security. The interest rate is determined and reset by the issuer daily, weekly, or monthly depending upon the terms of the security. The rate shown is the rate in effect at period end. |
| (l) | The issuer of the security is an affiliated person of the Fund as defined in the Investment Company Act of 1940. |
| (u) | The rate represents the7-day annualized yield at period end. |
Abbreviations:
| AGM | Assured Guaranty Municipal |
| Ambac | Ambac Financial Group Incorporated |
| AMT | Alternative minimum tax |
| BAN | Bond anticipation notes |
| CAB | Capital appreciation bond |
| CDA | Community Development Authority |
| FHLMC | Federal Home Loan Mortgage Corporation |
| FNMA | Federal National Mortgage Association |
| GNMA | Government National Mortgage Association |
| HFA | Housing Finance Authority |
| HFFA | Health Facilities Financing Authority |
| LIBOR | London Interbank Offered Rate |
| National | National Public Finance Guarantee Corporation |
| PCFA | Pollution Control Financing Authority |
| PFA | Public Finance Authority |
| RDA | Redevelopment Authority |
| SIFMA | Securities Industry and Financial Markets Association |
Investments in Affiliates
An affiliated investment is an investment in which the Fund owns at least 5% of the outstanding voting shares of the issuer or as a result of other relationships, such as the Fund and the issuer having the same investment manager. Transactions with issuers that were either affiliated persons of the Fund at the beginning of the period or the end of the period were as follows:
| | | | | | | | | | | | | | | | | | | | | | | | | | | | | | | | | | | | |
| | | Shares, beginning of period | | | Shares purchased | | | Shares sold | | | Shares, end of period | | | Net realized gains (losses) | | | Net
change in unrealized gains (losses) | | | Income
from
affiliated
securities | | | Value, end of period | | | % of
net
assets | |
Short-Term Investments | | | | | | | | | | | | | | | | | | | | | | | | | | | | | | | | | | | | |
Investment Companies | | | | | | | | | | | | | | | | | | | | | | | | | | | | | | | | | | | | |
Wells Fargo Municipal Cash Management Money Market Fund Institutional Class | | | 1,529,712 | | | | 176,750,908 | | | | 177,882,254 | | | | 398,366 | | | $ | 455 | | | $ | 0 | | | $ | 32,181 | | | $ | 398,605 | | | | 0.07 | % |
22 | Wells Fargo California Limited-Term Tax-Free Fund
Statement of assets and liabilities—June 30, 2019
| | | | |
| | | | |
| |
Assets | | | | |
Investments in unaffiliated securities, at value (cost $528,228,738) | | $ | 544,950,205 | |
Investments in affiliated securities, at value (cost $398,605) | | | 398,605 | |
Receivable for investments sold | | | 1,970,000 | |
Receivable for Fund shares sold | | | 1,019,709 | |
Receivable for interest | | | 6,425,107 | |
Prepaid expenses and other assets | | | 1,128 | |
| | | | |
Total assets | | | 554,764,754 | |
| | | | |
| |
Liabilities | | | | |
Payable for Fund shares redeemed | | | 1,742,720 | |
Dividends payable | | | 286,583 | |
Management fee payable | | | 156,238 | |
Administration fees payable | | | 46,584 | |
Distribution fee payable | | | 12,480 | |
Trustees’ fees and expenses payable | | | 1,370 | |
Accrued expenses and other liabilities | | | 68,209 | |
| | | | |
Total liabilities | | | 2,314,184 | |
| | | | |
Total net assets | | $ | 552,450,570 | |
| | | | |
| |
Net assets consist of | | | | |
Paid-in capital | | $ | 543,015,580 | |
Total distributable earnings | | | 9,434,990 | |
| | | | |
Total net assets | | $ | 552,450,570 | |
| | | | |
| |
Computation of net asset value and offering price per share | | | | |
Net assets – Class A | | $ | 101,765,068 | |
Shares outstanding – Class A1 | | | 9,457,907 | |
Net asset value per share – Class A | | | $10.76 | |
Maximum offering price per share – Class A2 | | | $10.98 | |
Net assets – Class C | | $ | 19,929,287 | |
Shares outstanding – Class C1 | | | 1,852,461 | |
Net asset value per share – Class C | | | $10.76 | |
Net assets – Administrator Class | | $ | 108,483,707 | |
Shares outstanding – Administrator Class1 | | | 10,238,272 | |
Net asset value per share – Administrator Class | | | $10.60 | |
Net assets – Institutional Class | | $ | 322,272,508 | |
Shares outstanding – Institutional Class1 | | | 30,432,483 | |
Net asset value per share – Institutional Class | | | $10.59 | |
| 1 | The Fund has an unlimited number of authorized shares. |
| 2 | Maximum offering price is computed as 100/98 of net asset value. On investments of $50,000 or more, the offering price is reduced. |
The accompanying notes are an integral part of these financial statements.
Wells Fargo California Limited-Term Tax-Free Fund | 23
Statement of operations—year ended June 30, 2019
| | | | |
| | | | |
| |
Investment income | | | | |
Interest | | $ | 15,186,588 | |
Income from affiliated securities | | | 32,181 | |
| | | | |
Total investment income | | | 15,218,769 | |
| | | | |
| |
Expenses | | | | |
Management fee | | | 2,262,791 | |
Administration fees | | | | |
Class A | | | 182,592 | |
Class C | | | 37,353 | |
Administrator Class | | | 112,380 | |
Institutional Class | | | 256,258 | |
Shareholder servicing fees | | | | |
Class A | | | 285,300 | |
Class C | | | 58,364 | |
Administrator Class | | | 280,732 | |
Distribution fee | | | | |
Class C | | | 175,093 | |
Custody and accounting fees | | | 17,529 | |
Professional fees | | | 51,618 | |
Registration fees | | | 89,580 | |
Shareholder report expenses | | | 24,301 | |
Trustees’ fees and expenses | | | 21,923 | |
Other fees and expenses | | | 22,153 | |
| | | | |
Total expenses | | | 3,877,967 | |
Less: Fee waivers and/or expense reimbursements | | | (327,253 | ) |
| | | | |
Net expenses | | | 3,550,714 | |
| | | | |
Net investment income | | | 11,668,055 | |
| | | | |
| |
Realized and unrealized gains (losses) on investments | | | | |
Net realized gains (losses) on: | | | | |
Unaffiliated securities | | | (716,940 | ) |
Affiliated securities | | | 455 | |
Futures contracts | | | 343,070 | |
| | | | |
Net realized losses on investments | | | (373,415 | ) |
Net change in unrealized gains (losses) on investments | | | 7,937,606 | |
| | | | |
Net realized and unrealized gains (losses) on investments | | | 7,564,191 | |
| | | | |
Net increase in net assets resulting from operations | | $ | 19,232,246 | |
| | | | |
The accompanying notes are an integral part of these financial statements.
24 | Wells Fargo California Limited-Term Tax-Free Fund
Statement of changes in net assets
| | | | | | | | | | | | | | | | |
| | | Year ended
June 30, 2019 | | | Year ended
June 30, 20181 | |
| | | | |
Operations | | | | | | | | | | | | | | | | |
Net investment income | | | | | | $ | 11,668,055 | | | | | | | $ | 12,429,693 | |
Net realized losses on investments | | | | | | | (373,415 | ) | | | | | | | (3,427,387 | ) |
Net change in unrealized gains (losses) on investments | | | | | | | 7,937,606 | | | | | | | | (8,011,347 | ) |
| | | | |
Net increase in net assets resulting from operations | | | | | | | 19,232,246 | | | | | | | | 990,959 | |
| | | | |
| | | | |
Distributions to shareholders from net investment income and net realized gains | | | | | | | | | | | | | | | | |
Class A | | | | | | | (2,134,113 | ) | | | | | | | (2,407,589 | ) |
Class C | | | | | | | (259,977 | ) | | | | | | | (297,433 | ) |
Administrator Class | | | | | | | (2,322,335 | ) | | | | | | | (2,899,311 | ) |
Institutional Class | | | | | | | (6,949,628 | ) | | | | | | | (6,825,360 | ) |
| | | | |
Total distributions to shareholders | | | | | | | (11,666,053 | ) | | | | | | | (12,429,693 | ) |
| | | | |
| | | | |
Capital share transactions | | | Shares | | | | | | | | Shares | | | | | |
Proceeds from shares sold | | | | | | | | | | | | | | | | |
Class A | | | 1,420,606 | | | | 15,083,751 | | | | 2,077,616 | | | | 22,303,849 | |
Class C | | | 57,265 | | | | 608,051 | | | | 177,303 | | | | 1,905,490 | |
Administrator Class | | | 3,778,231 | | | | 39,543,664 | | | | 1,932,144 | | | | 20,369,275 | |
Institutional Class | | | 18,976,610 | | | | 198,518,558 | | | | 16,566,094 | | | | 174,446,045 | |
| | | | |
| | | | | | | 253,754,024 | | | | | | | | 219,024,659 | |
| | | | |
Reinvestment of distributions | | | | | | | | | | | | | | | | |
Class A | | | 174,915 | | | | 1,858,738 | | | | 197,697 | | | | 2,114,653 | |
Class C | | | 22,692 | | | | 240,998 | | | | 25,519 | | | | 272,822 | |
Administrator Class | | | 221,324 | | | | 2,316,258 | | | | 273,523 | | | | 2,881,478 | |
Institutional Class | | | 318,708 | | | | 3,334,607 | | | | 298,293 | | | | 3,139,346 | |
| | | | |
| | | | | | | 7,750,601 | | | | | | | | 8,408,299 | |
| | | | |
Payment for shares redeemed | | | | | | | | | | | | | | | | |
Class A | | | (3,417,410 | ) | | | (36,369,774 | ) | | | (4,796,149 | ) | | | (51,144,759 | ) |
Class C | | | (760,735 | ) | | | (8,078,258 | ) | | | (831,210 | ) | | | (8,905,544 | ) |
Administrator Class | | | (6,547,996 | ) | | | (68,431,582 | ) | | | (4,731,716 | ) | | | (49,743,594 | ) |
Institutional Class | | | (20,085,267 | ) | | | (209,818,936 | ) | | | (20,555,577 | ) | | | (216,738,610 | ) |
| | | | |
| | | | | | | (322,698,550 | ) | | | | | | | (326,532,507 | ) |
| | | | |
Net decrease in net assets resulting from capital share transactions | | | | | | | (61,193,925 | ) | | | | | | | (99,099,549 | ) |
| | | | |
Total decrease in net assets | | | | | | | (53,627,732 | ) | | | | | | | (110,538,283 | ) |
| | | | |
| | | | |
Net assets | | | | | | | | | | | | | | | | |
Beginning of period | | | | | | | 606,078,302 | | | | | | | | 716,616,585 | |
| | | | |
End of period | | | | | | $ | 552,450,570 | | | | | | | $ | 606,078,302 | |
| | | | |
| 1 | Effective for all filings after November 4, 2018, the SEC prospectively eliminated the requirement to parenthetically disclose undistributed net investment income at the end of the period and permitted the aggregation of distributions, with the exception of tax basis returns of capital. Undistributed net investment income at June 30, 2018 was $475,690. The disaggregated distributions information for the year ended June 30, 2018 is included in Note 8,Distributions to Shareholders, in the notes to the financial statements. |
The accompanying notes are an integral part of these financial statements.
Wells Fargo California Limited-Term Tax-Free Fund | 25
Financial highlights
(For a share outstanding throughout each period)
| | | | | | | | | | | | | | | | | | | | |
| | | Year ended June 30 | |
| CLASS A | | 2019 | | | 2018 | | | 2017 | | | 2016 | | | 2015 | |
Net asset value, beginning of period | | | $10.61 | | | | $10.79 | | | | $11.04 | | | | $10.83 | | | | $10.86 | |
Net investment income | | | 0.20 | | | | 0.19 | | | | 0.18 | | | | 0.17 | | | | 0.16 | |
Net realized and unrealized gains (losses) on investments | | | 0.15 | | | | (0.18 | ) | | | (0.25 | ) | | | 0.21 | | | | (0.03 | ) |
| | | | | | | | | | | | | | | | | | | | |
Total from investment operations | | | 0.35 | | | | 0.01 | | | | (0.07 | ) | | | 0.38 | | | | 0.13 | |
Distributions to shareholders from | | | | | | | | | | | | | | | | | | | | |
Net investment income | | | (0.20 | ) | | | (0.19 | ) | | | (0.18 | ) | | | (0.17 | ) | | | (0.16 | ) |
Net asset value, end of period | | | $10.76 | | | | $10.61 | | | | $10.79 | | | | $11.04 | | | | $10.83 | |
Total return1 | | | 3.33 | % | | | 0.05 | % | | | (0.64 | )% | | | 3.54 | % | | | 1.22 | % |
Ratios to average net assets (annualized) | | | | | | | | | | | | | | | | | | | | |
Gross expenses | | | 0.85 | % | | | 0.84 | % | | | 0.83 | % | | | 0.83 | % | | | 0.82 | % |
Net expenses | | | 0.80 | % | | | 0.80 | % | | | 0.80 | % | | | 0.80 | % | | | 0.80 | % |
Net investment income | | | 1.87 | % | | | 1.73 | % | | | 1.65 | % | | | 1.56 | % | | | 1.49 | % |
Supplemental data | | | | | | | | | | | | | | | | | | | | |
Portfolio turnover rate | | | 11 | % | | | 45 | % | | | 21 | % | | | 21 | % | | | 31 | % |
Net assets, end of period (000s omitted) | | | $101,765 | | | | $119,657 | | | | $148,933 | | | | $196,629 | | | | $198,402 | |
| 1 | Total return calculations do not include any sales charges. |
The accompanying notes are an integral part of these financial statements.
26 | Wells Fargo California Limited-Term Tax-Free Fund
Financial highlights
(For a share outstanding throughout each period)
| | | | | | | | | | | | | | | | | | | | |
| | | Year ended June 30 | |
| CLASS C | | 2019 | | | 2018 | | | 2017 | | | 2016 | | | 2015 | |
Net asset value, beginning of period | | | $10.61 | | | | $10.79 | | | | $11.04 | | | | $10.83 | | | | $10.86 | |
Net investment income | | | 0.12 | | | | 0.11 | | | | 0.10 | | | | 0.09 | | | | 0.08 | |
Net realized and unrealized gains (losses) on investments | | | 0.15 | | | | (0.18 | ) | | | (0.25 | ) | | | 0.21 | | | | (0.03 | ) |
| | | | | | | | | | | | | | | | | | | | |
Total from investment operations | | | 0.27 | | | | (0.07 | ) | | | (0.15 | ) | | | 0.30 | | | | 0.05 | |
Distributions to shareholders from | | | | | | | | | | | | | | | | | | | | |
Net investment income | | | (0.12 | ) | | | (0.11 | ) | | | (0.10 | ) | | | (0.09 | ) | | | (0.08 | ) |
Net asset value, end of period | | | $10.76 | | | | $10.61 | | | | $10.79 | | | | $11.04 | | | | $10.83 | |
Total return1 | | | 2.56 | % | | | (0.70 | )% | | | (1.38 | )% | | | 2.76 | % | | | 0.47 | % |
Ratios to average net assets (annualized) | | | | | | | | | | | | | | | | | | | | |
Gross expenses | | | 1.60 | % | | | 1.59 | % | | | 1.58 | % | | | 1.58 | % | | | 1.57 | % |
Net expenses | | | 1.55 | % | | | 1.55 | % | | | 1.55 | % | | | 1.55 | % | | | 1.55 | % |
Net investment income | | | 1.12 | % | | | 0.98 | % | | | 0.90 | % | | | 0.81 | % | | | 0.74 | % |
Supplemental data | | | | | | | | | | | | | | | | | | | | |
Portfolio turnover rate | | | 11 | % | | | 45 | % | | | 21 | % | | | 21 | % | | | 31 | % |
Net assets, end of period (000s omitted) | | | $19,929 | | | | $26,868 | | | | $34,113 | | | | $40,098 | | | | $33,996 | |
| 1 | Total return calculations do not include any sales charges. |
The accompanying notes are an integral part of these financial statements.
Wells Fargo California Limited-Term Tax-Free Fund | 27
Financial highlights
(For a share outstanding throughout each period)
| | | | | | | | | | | | | | | | | | | | |
| | | Year ended June 30 | |
| ADMINISTRATOR CLASS | | 2019 | | | 2018 | | | 2017 | | | 2016 | | | 2015 | |
Net asset value, beginning of period | | | $10.45 | | | | $10.63 | | | | $10.87 | | | | $10.66 | | | | $10.70 | |
Net investment income | | | 0.22 | | | | 0.20 | 1 | | | 0.20 | | | | 0.19 | | | | 0.18 | |
Net realized and unrealized gains (losses) on investments | | | 0.15 | | | | (0.18 | ) | | | (0.24 | ) | | | 0.21 | | | | (0.04 | ) |
| | | | | | | | | | | | | | | | | | | | |
Total from investment operations | | | 0.37 | | | | 0.02 | | | | (0.04 | ) | | | 0.40 | | | | 0.14 | |
Distributions to shareholders from | | | | | | | | | | | | | | | | | | | | |
Net investment income | | | (0.22 | ) | | | (0.20 | ) | | | (0.20 | ) | | | (0.19 | ) | | | (0.18 | ) |
Net asset value, end of period | | | $10.60 | | | | $10.45 | | | | $10.63 | | | | $10.87 | | | | $10.66 | |
Total return | | | 3.56 | % | | | 0.23 | % | | | (0.38 | )% | | | 3.78 | % | | | 1.33 | % |
Ratios to average net assets (annualized) | | | | | | | | | | | | | | | | | | | | |
Gross expenses | | | 0.79 | % | | | 0.78 | % | | | 0.77 | % | | | 0.77 | % | | | 0.76 | % |
Net expenses | | | 0.60 | % | | | 0.60 | % | | | 0.60 | % | | | 0.60 | % | | | 0.60 | % |
Net investment income | | | 2.07 | % | | | 1.93 | % | | | 1.84 | % | | | 1.75 | % | | | 1.69 | % |
Supplemental data | | | | | | | | | | | | | | | | | | | | |
Portfolio turnover rate | | | 11 | % | | | 45 | % | | | 21 | % | | | 21 | % | | | 31 | % |
Net assets, end of period (000s omitted) | | | $108,484 | | | | $133,581 | | | | $162,747 | | | | $226,581 | | | | $309,120 | |
| 1 | Calculated based upon average shares outstanding |
The accompanying notes are an integral part of these financial statements.
28 | Wells Fargo California Limited-Term Tax-Free Fund
Financial highlights
(For a share outstanding throughout each period)
| | | | | | | | | | | | | | | | | | | | |
| | | Year ended June 30 | |
| INSTITUTIONAL CLASS | | 2019 | | | 2018 | | | 2017 | | | 2016 | | | 20151 | |
Net asset value, beginning of period | | | $10.44 | | | | $10.62 | | | | $10.86 | | | | $10.66 | | | | $10.75 | |
Net investment income | | | 0.23 | | | | 0.21 | | | | 0.21 | | | | 0.20 | | | | 0.13 | |
Net realized and unrealized gains (losses) on investments | | | 0.15 | | | | (0.18 | ) | | | (0.24 | ) | | | 0.20 | | | | (0.09 | ) |
| | | | | | | | | | | | | | | | | | | | |
Total from investment operations | | | 0.38 | | | | 0.03 | | | | (0.03 | ) | | | 0.40 | | | | 0.04 | |
Distributions to shareholders from | | | | | | | | | | | | | | | | | | | | |
Net investment income | | | (0.23 | ) | | | (0.21 | ) | | | (0.21 | ) | | | (0.20 | ) | | | (0.13 | ) |
Net asset value, end of period | | | $10.59 | | | | $10.44 | | | | $10.62 | | | | $10.86 | | | | $10.66 | |
Total return2 | | | 3.66 | % | | | 0.33 | % | | | (0.28 | )% | | | 3.79 | % | | | 0.35 | % |
Ratios to average net assets (annualized) | | | | | | | | | | | | | | | | | | | | |
Gross expenses | | | 0.52 | % | | | 0.51 | % | | | 0.50 | % | | | 0.50 | % | | | 0.50 | % |
Net expenses | | | 0.50 | % | | | 0.50 | % | | | 0.50 | % | | | 0.50 | % | | | 0.50 | % |
Net investment income | | | 2.17 | % | | | 2.03 | % | | | 1.95 | % | | | 1.86 | % | | | 1.82 | % |
Supplemental data | | | | | | | | | | | | | | | | | | | | |
Portfolio turnover rate | | | 11 | % | | | 45 | % | | | 21 | % | | | 21 | % | | | 31 | % |
Net assets, end of period (000s omitted) | | | $322,273 | | | | $325,973 | | | | $370,824 | | | | $351,080 | | | | $280,061 | |
| 1 | For the period from October 31, 2014 (commencement of class operations) to June 30, 2015 |
| 2 | Returns for periods of less than one year are not annualized. |
The accompanying notes are an integral part of these financial statements.
Wells Fargo California Limited-Term Tax-Free Fund | 29
Notes to financial statements
1. ORGANIZATION
Wells Fargo Funds Trust (the “Trust”), a Delaware statutory trust organized on March 10, 1999, is anopen-end management investment company registered under the Investment Company Act of 1940, as amended (the “1940 Act”). As an investment company, the Trust follows the accounting and reporting guidance in Financial Accounting Standards Board (“FASB”)Accounting Standards Codification Topic 946, Financial Services – Investment Companies. These financial statements report on the Wells Fargo California Limited-TermTax-Free Fund (the “Fund”) which is a diversified series of the Trust.
2. SIGNIFICANT ACCOUNTING POLICIES
The following significant accounting policies, which are consistently followed in the preparation of the financial statements of the Fund, are in conformity with U.S. generally accepted accounting principles which require management to make estimates and assumptions that affect the reported amounts of assets and liabilities, disclosure of contingent assets and liabilities at the date of the financial statements, and the reported amounts of revenues and expenses during the reporting period. Actual results could differ from those estimates.
Securities valuation
All investments are valued each business day as of the close of regular trading on the New York Stock Exchange (generally 4 p.m. Eastern Time), although the Fund may deviate from this calculation time under unusual or unexpected circumstances.
Debt securities are valued at the evaluated bid price provided by an independent pricing service (e.g. taking into account various factors, including yields, maturities, or credit ratings) or, if a reliable price is not available, the quoted bid price from an independent broker-dealer.
Futures contracts that are listed on a foreign or domestic exchange or market are valued at the official closing price or, if none, the last sales price.
Investments in registeredopen-end investment companies are valued at net asset value.
Investments which are not valued using any of the methods discussed above are valued at their fair value, as determined in good faith by the Board of Trustees of the Fund. The Board of Trustees has established a Valuation Committee comprised of the Trustees and has delegated to it the authority to take any actions regarding the valuation of portfolio securities that the Valuation Committee deems necessary or appropriate, including determining the fair value of portfolio securities, unless the determination has been delegated to the Wells Fargo Asset Management Pricing Committee at Wells Fargo Funds Management, LLC (“Funds Management”).The Board of Trustees retains the authority to make or ratify any valuation decisions or approve any changes to the Valuation Procedures as it deems appropriate. On a quarterly basis, the Board of Trustees receives reports on any valuation actions taken by the Valuation Committee or the Wells Fargo Asset Management Pricing Committee which may include items for ratification.
When-issued transactions
The Fund may purchase securities on a forward commitment or when-issued basis. The Fund records a when-issued transaction on the trade date and will segregate assets in an amount at least equal in value to the Fund’s commitment to purchase when-issued securities. Securities purchased on a when-issued basis aremarked-to-market daily and the Fund begins earning interest on the settlement date. Losses may arise due to changes in the market value of the underlying securities or if the counterparty does not perform under the contract.
Futures contracts
Futures contracts are agreements between the Fund and a counterparty to buy or sell a specific amount of a commodity, financial instrument or currency at specified price and on a specified date. The Fund may buy and sell futures contracts in order to gain exposure to, or protect against, changes in interest rates and is subject to interest rate risk. The primary risks associated with the use of futures contracts are the imperfect correlation between changes in market values of securities held by the Fund and the prices of futures contracts, and the possibility of an illiquid market. Futures contracts are generally entered into on a regulated futures exchange and cleared through a clearinghouse associated with the exchange. With futures contracts, there is minimal counterparty risk to the Fund since futures contracts are exchange traded and the exchange’s clearinghouse, as counterparty to all exchange traded futures, guarantees the futures contracts against default.
Upon entering into a futures contracts, the Fund is required to deposit either cash or securities (initial margin) with the broker in an amount equal to a certain percentage of the contract value. Subsequent payments (variation margin) are paid to or from the broker each day equal to the daily changes in the contract value. Such payments are recorded as unrealized gains or losses and, if any, shown as variation margin receivable (payable) in the Statement of Assets and Liabilities. Should the Fund fail to make requested variation margin payments, the broker can gain access to the initial margin to satisfy the Fund’s payment obligations. When the contracts are closed, a realized gain or loss is recorded in the Statement of Operations.
30 | Wells Fargo California Limited-Term Tax-Free Fund
Notes to financial statements
Security transactions and income recognition
Securities transactions are recorded on a trade date basis. Realized gains or losses are recorded on the basis of identified cost.
Interest income is accrued daily and bond discounts are accreted and premiums are amortized daily. To the extent debt obligations are placed onnon-accrual status, any related interest income may be reduced by writing off interest receivables when the collection of all or a portion of interest has been determined to be doubtful based on consistently applied procedures and the fair value has decreased. If the issuer subsequently resumes interest payments or when the collectability of interest is reasonably assured, the debt obligation is removed fromnon-accrual status.
Distributions to shareholders
Distributions to shareholders from net investment income are declared daily and paid monthly. Distributions from net realized gains, if any, are recorded on theex-dividend date and paid at least annually. Such distributions are determined in accordance with income tax regulations and may differ from U.S. generally accepted accounting principles. Dividend sources are estimated at the time of declaration. The tax character of distributions is determined as of the Fund’s fiscal year end. Therefore, a portion of the Fund’s distributions made prior to the Fund’s fiscal year end may be categorized as a tax return of capital at year end.
Federal and other taxes
The Fund intends to continue to qualify as a regulated investment company by distributing substantially all of its investment company taxable andtax-exempt income and any net realized capital gains (after reduction for capital loss carryforwards) sufficient to relieve it from all, or substantially all, federal income taxes. Accordingly, no provision for federal income taxes was required.
The Fund’s income and federal excise tax returns and all financial records supporting those returns for the prior three fiscal years are subject to examination by the federal and Delaware revenue authorities. Management has analyzed the Fund’s tax positions taken on federal, state, and foreign tax returns for all open tax years and does not believe that there are any uncertain tax positions that require recognition of a tax liability.
As of June 30, 2019, the aggregate cost of all investments for federal income tax purposes was $528,686,012 and the unrealized gains (losses) consisted of:
| | | | |
| |
Gross unrealized gains | | $ | 17,040,085 | |
| |
Gross unrealized losses | | | (377,287 | ) |
| |
Net unrealized gains | | $ | 16,662,798 | |
Reclassifications are made to the Fund’s capital accounts for permanent tax differences to reflect income and gains available for distribution (or available capital loss carryforwards) under federal income tax regulations. U.S. generally accepted accounting principles require that certain components of net assets be adjusted to reflect permanent differences between financial and tax reporting. These reclassifications have no effect on net assets or net asset values per share. At June 30, 2019, as a result of permanentbook-to-tax differences, the following reclassification adjustments were made on the Statement of Assets and Liabilities:
| | |
| Paid-in capital | | Total distributable earnings |
| |
| $(110,356) | | $110,356 |
As of June 30, 2019, the Fund had capital loss carryforwards which consist of $6,762,696 in short-term capital losses and $1,013,978 in long-term capital losses.
Class allocations
The separate classes of shares offered by the Fund differ principally in applicable sales charges, distribution, shareholder servicing, and administration fees. Class specific expenses are charged directly to that share class. Investment income, common fund-level expenses, and realized and unrealized gains (losses) on investments are allocated daily to each class of shares based on the relative proportion of net assets of each class.
3. FAIR VALUATION MEASUREMENTS
Fair value measurements of investments are determined within a framework that has established a fair value hierarchy based upon the various data inputs utilized in determining the value of the Fund’s investments. The three-level hierarchy gives the highest priority to unadjusted quoted prices in active markets for identical assets or liabilities (Level 1) and the lowest priority to
Wells Fargo California Limited-Term Tax-Free Fund | 31
Notes to financial statements
unobservable inputs (Level 3). The Fund’s investments are classified within the fair value hierarchy based on the lowest level of input that is significant to the fair value measurement. The inputs are summarized into three broad levels as follows:
| ∎ | | Level 1 – quoted prices in active markets for identical securities |
| ∎ | | Level 2 – other significant observable inputs (including quoted prices for similar securities, interest rates, prepayment speeds, credit risk, etc.) |
| ∎ | | Level 3 – significant unobservable inputs (including the Fund’s own assumptions in determining the fair value of investments) |
The inputs or methodologies used for valuing investments in securities are not necessarily an indication of the risk associated with investing in those securities.
The following is a summary of the inputs used in valuing the Fund’s assets and liabilities as of June 30, 2019:
| | | | | | | | | | | | | | | | |
| | | | |
| | | Quoted prices
(Level 1) | | | Other significant
observable inputs
(Level 2) | | | Significant
unobservable inputs (Level 3) | | | Total | |
| | | | |
Assets | | | | | | | | | | | | | | | | |
Investments in: | | | | | | | | | | | | | | | | |
| | | | |
Municipal obligations | | $ | 0 | | | $ | 544,950,205 | | | $ | 0 | | | $ | 544,950,205 | |
| | | | |
Short-term investments | | | | | | | | | | | | | | | | |
| | | | |
Investment companies | | | 398,605 | | | | 0 | | | | 0 | | | | 398,605 | |
| | | | |
Total assets | | $ | 398,605 | | | $ | 544,950,205 | | | $ | 0 | | | $ | 545,348,810 | |
Additional sector, industry or geographic detail is included in the Portfolio of Investments.
At June 30, 2019, the Fund did not have any transfers into/out of Level 3.
4. TRANSACTIONS WITH AFFILIATES
Management fee
Funds Management, an indirect wholly owned subsidiary of Wells Fargo & Company (“Wells Fargo”), is the manager of the Fund and provides advisory and fund-level administrative services under an investment management agreement. Under the investment management agreement, Funds Management is responsible for, among other services, implementing the investment objectives and strategies of the Fund, supervising the subadviser and providing fund-level administrative services in connection with the Fund’s operations. As compensation for its services under the investment management agreement, Funds Management is entitled to receive a management fee at the following annual rate based on the Fund’s average daily net assets:
| | | | |
| |
| Average daily net assets | | Management fee | |
| |
First $500 million | | | 0.400 | % |
| |
Next $500 million | | | 0.375 | |
| |
Next $2 billion | | | 0.350 | |
| |
Next $2 billion | | | 0.325 | |
| |
Next $5 billion | | | 0.290 | |
| |
Over $10 billion | | | 0.280 | |
For the year ended June 30, 2019, the management fee was equivalent to an annual rate of 0.40% of the Fund’s average daily net assets.
Funds Management has retained the services of a subadviser to provide daily portfolio management to the Fund. The fee for subadvisory services is borne by Funds Management. Wells Capital Management Incorporated, an affiliate of Funds Management and an indirect wholly owned subsidiary of Wells Fargo, is the subadviser to the Fund and is entitled to receive a fee from Funds Management at an annual rate starting at 0.15% and declining to 0.05% as the average daily net assets of the Fund increase.
32 | Wells Fargo California Limited-Term Tax-Free Fund
Notes to financial statements
Administration fees
Under a class-level administration agreement, Funds Management provides class-level administrative services to the Fund, which includes paying fees and expenses for services provided by the transfer agent,sub-transfer agents, omnibus account servicers and record-keepers. As compensation for its services under the class-level administration agreement, Funds Management receives an annual fee which is calculated based on the average daily net assets of each class as follows:
| | | | |
| |
| | | Class-level
administration fee | |
| |
Class A, Class C | | | 0.16 | % |
| |
Administrator Class | | | 0.10 | |
| |
Institutional Class | | | 0.08 | |
Funds Management has contractually waived and/or reimbursed management and administration fees to the extent necessary to maintain certain net operating expense ratios for the Fund. When each class of the Fund has exceeded its expense cap, Funds Management has waived fees and/or reimbursed expenses from fund-level expenses on a proportionate basis and then from class specific expenses. When only certain classes exceed their expense caps, waivers and/or reimbursements are applied against class specific expenses before fund-level expenses. Funds Management has committed through October 31, 2019 to waive fees and/or reimburse expenses to the extent necessary to cap the Fund’s expenses at 0.80% for Class A shares, 1.55% for Class C shares, 0.60% for Administrator Class shares, and 0.50% for Institutional Class shares. Prior to or after the commitment expiration date, the cap may be increased or the commitment to maintain the cap may be terminated only with the approval of the Board of Trustees.
Distribution fee
The Trust has adopted a distribution plan for Class C shares of the Fund pursuant to Rule12b-1 under the 1940 Act. A distribution fee is charged to Class C shares and paid to Wells Fargo Funds Distributor, LLC (“Funds Distributor”), the principal underwriter, at an annual rate of 0.75% of the average daily net assets of Class C shares.
In addition, Funds Distributor is entitled to receive thefront-end sales charge from the purchase of Class A shares and a contingent deferred sales charge on the redemption of certain Class A shares. Funds Distributor is also entitled to receive the contingent deferred sales charges from redemptions of Class C shares. For the year ended June 30, 2019, Funds Distributor received $332 from the sale of Class A shares and $1,040 in contingent deferred sales charges from redemptions of Class A shares. No contingent deferred sales charges were incurred by Class C shares for the year ended June 30, 2019.
Shareholder servicing fees
The Trust has entered into contracts with one or more shareholder servicing agents, whereby Class A, Class C, and Administrator Class of the Fund are charged a fee at an annual rate of 0.25% of the average daily net assets of each respective class. A portion of these total shareholder servicing fees were paid to affiliates of Wells Fargo.
Interfund transactions
The Fund may purchase or sell portfolio investment securities to certain other Wells Fargo affiliates pursuant to Rule17a-7 under the 1940 Act and under procedures adopted by the Board of Trustees. The procedures have been designed to ensure that these interfund transactions, which do not incur broker commissions, are effected at current market prices. Pursuant to these procedures, the Fund had $46,536,984 and $74,370,000 in interfund purchases and sales, respectively, during the year ended June 30, 2019.
5. INVESTMENT PORTFOLIO TRANSACTIONS
Purchases and sales of investments, excluding U.S. government obligations (if any) and short-term securities, for the year ended June 30, 2019 were $131,993,368 and $58,780,388, respectively.
6. DERIVATIVE TRANSACTIONS
During the year ended June 30, 2019 the Fund entered into futures contracts to gain market exposure. The Fund had an average notional amount of $1,508,369 in short futures contracts during the year ended June 30, 2019.
The fair value, realized gains or losses and change in unrealized gains or losses, if any, on derivative instruments are reflected in the corresponding financial statement captions.
Wells Fargo California Limited-Term Tax-Free Fund | 33
Notes to financial statements
7. BANK BORROWINGS
The Trust (excluding the money market funds), Wells Fargo Master Trust and Wells Fargo Variable Trust are parties to a $280,000,000 revolving credit agreement whereby the Fund is permitted to use bank borrowings for temporary or emergency purposes, such as to fund shareholder redemption requests. Interest under the credit agreement is charged to the Fund based on a borrowing rate equal to the higher of the Federal Funds rate in effect on that day plus 1.25% or the overnight LIBOR rate in effect on that day plus 1.25%. In addition, an annual commitment fee equal to 0.25% of the unused balance is allocated to each participating fund.
For the year ended June 30, 2019, there were no borrowings by the Fund under the agreement.
8. DISTRIBUTIONS TO SHAREHOLDERS
The tax character of distributions paid during the years ended June 30, 2019 and June 30, 2018 were as follows:
| | | | | | | | |
| | | Year ended June 30 | |
| | |
| | | 2019 | | | 2018 | |
| | |
Ordinary income | | $ | 0 | | | $ | 63,209 | |
| | |
Tax-exempt income | | | 11,666,053 | | | | 12,366,484 | |
As of June 30, 2019, the components of distributable earnings on a tax basis were as follows:
| | | | |
Undistributed
tax-exempt
income | | Unrealized
gains | | Capital loss
carryforward |
| | |
| $835,449 | | $16,662,798 | | $(7,776,674) |
Effective for all filings after November 4, 2018, the Securities and Exchange Commission eliminated the requirement to separately state the components of distributions to shareholders under U.S. generally accepted accounting principles. The amounts of distributions to shareholders for the year ended June 30, 2018 were as follows:
| | | | |
| |
| | | Net investment
income | |
| |
Class A | | | $2,407,589 | |
| |
Class C | | | 297,433 | |
| |
Administrator Class | | | 2,899,311 | |
| |
Institutional Class | | | 6,825,360 | |
9. CONCENTRATION RISK
The Fund invests a substantial portion of its assets in issuers of municipal debt securities located in a single state or territory of the U.S. Therefore, it may be more affected by economic and political developments in that state or region than would be a comparable generaltax-exempt fund.
10. INDEMNIFICATION
Under the Trust’s organizational documents, the officers and Trustees have been granted certain indemnification rights against certain liabilities that may arise out of performance of their duties to the Trust. Additionally, in the normal course of business, the Trust may enter into contracts with service providers that contain a variety of indemnification clauses. The Trust’s maximum exposure under these arrangements is dependent on future claims that may be made against the Fund and, therefore, cannot be estimated.
11. NEW ACCOUNTING PRONOUNCEMENTS
In August 2018, FASB issued Accounting Standards Update (“ASU”)No. 2018-13, Fair Value Measurement (Topic 820)Disclosure Framework—Changes to the Disclosure Requirements for Fair Value Measurement. ASU2018-13 updates the disclosure requirements for fair value measurements by modifying or removing certain disclosures and adding certain new disclosures. The amendments are effective for fiscal years, and interim periods within those fiscal years, beginning after December 15, 2019. Early adoption is permitted. Management has adopted the removal and modification of disclosures early, as permitted, and will adopt the additional new disclosures at the effective date.
34 | Wells Fargo California Limited-Term Tax-Free Fund
Notes to financial statements
In March 2017, FASB issued ASU No. 2017-08,Premium Amortization on Purchased Callable Debt Securities. ASU 2017-08 shortens the amortization period for certain callable debt securities held at a premium and requires the premium to be amortized to the earliest call date. The amendments do not require an accounting change for securities held at a discount and discounts will continue to be accreted to the maturity date of the security. ASU 2017-08 is effective for fiscal years beginning after December 15, 2018 and for interim periods within those fiscal years. During the current reporting period, management of the Fund adopted the change in accounting policy which did not have a material impact to the Fund’s financial statements.
Wells Fargo California Limited-Term Tax-Free Fund | 35
Report of independent registered public accounting firm
TO THE SHAREHOLDERS OF THE FUND AND BOARD OF TRUSTEES OF WELLS FARGO FUNDS TRUST:
Opinion on the Financial Statements
We have audited the accompanying statement of assets and liabilities of Wells Fargo California Limited-Term Tax-Free Fund (the Fund), one of the funds constituting Wells Fargo Funds Trust, including the portfolio of investments, as of June 30, 2019, the related statement of operations for the year then ended, the statements of changes in net assets for each of the years in the two year period then ended, and the related notes (collectively, the financial statements) and the financial highlights for each of the years or periods in the five year period then ended. In our opinion, the financial statements and financial highlights present fairly, in all material respects, the financial position of the Fund as of June 30, 2019, the results of its operations for the year then ended, the changes in its net assets for each of the years in the two year period then ended, and the financial highlights for each of the years or periods in the five year period then ended, in conformity with U.S. generally accepted accounting principles.
Basis for Opinion
These financial statements and financial highlights are the responsibility of the Fund’s management. Our responsibility is to express an opinion on these financial statements and financial highlights based on our audits. We are a public accounting firm registered with the Public Company Accounting Oversight Board (United States) (PCAOB) and are required to be independent with respect to the Fund in accordance with the U.S. federal securities laws and the applicable rules and regulations of the Securities and Exchange Commission and the PCAOB.
We conducted our audits in accordance with the standards of the PCAOB. Those standards require that we plan and perform the audit to obtain reasonable assurance about whether the financial statements and financial highlights are free of material misstatement, whether due to error or fraud. Our audits included performing procedures to assess the risks of material misstatement of the financial statements and financial highlights, whether due to error or fraud, and performing procedures that respond to those risks. Such procedures included examining, on a test basis, evidence regarding the amounts and disclosures in the financial statements and financial highlights. Such procedures also included confirmation of securities owned as of June 30, 2019, by correspondence with the custodian or by other appropriate auditing procedures. Our audits also included evaluating the accounting principles used and significant estimates made by management, as well as evaluating the overall presentation of the financial statements and financial highlights. We believe that our audits provide a reasonable basis for our opinion.

We have not been able to determine the specific year that we began serving as the auditor of one or more Wells Fargo Funds investment companies; however we are aware that we have served as the auditor of one or more Wells Fargo Funds investment companies since at least 1955.
Boston, Massachusetts
August 26, 2019
36 | Wells Fargo California Limited-Term Tax-Free Fund
Other information (unaudited)
TAX INFORMATION
For federal and California income tax purposes, the Fund designates 100% of its distributions paid from net investment income during the fiscal year as exempt-interest dividends under Section 852(b)(5) of the Internal Revenue Code and under Section 17145 of the California Revenue and Taxation Code.
PROXY VOTING INFORMATION
A description of the policies and procedures used to determine how to vote proxies relating to portfolio securities is available, upon request, by calling1-800-222-8222, visiting our website atwfam.com, or visiting the SEC website at sec.gov. Information regarding how the proxies related to portfolio securities were voted during the most recent12-month period ended June 30 is available on the website atwfam.com or by visiting the SEC website at sec.gov.
QUARTERLY PORTFOLIO HOLDINGS INFORMATION
The Fund files its complete schedule of portfolio holdings with the SEC for the first and third quarters of each fiscal year on Form N-Q or FormN-PORT, which is available by visiting the SEC website at sec.gov. Those forms may be reviewed and copied at the SEC’s Public Reference Room in Washington, DC. Information on the operation of the Public Reference Room may be obtained by calling1-800-SEC-0330.
Wells Fargo California Limited-Term Tax-Free Fund | 37
Other information (unaudited)
BOARD OF TRUSTEES AND OFFICERS
Each of the Trustees and Officers1 listed in the table below acts in identical capacities for each fund in the Wells Fargo family of funds, which consists of 152 mutual funds comprising the Wells Fargo Funds Trust, Wells Fargo Variable Trust, Wells Fargo Master Trust and fourclosed-end funds (collectively the “Fund Complex”). This table should be read in conjunction with the Prospectus and the Statement of Additional Information2. The mailing address of each Trustee and Officer is 525 Market Street, 12th Floor, San Francisco, CA 94105. Each Trustee and Officer serves an indefinite term, however, each Trustee serves such term until reaching the mandatory retirement age established by the Trustees.
Independent Trustees
| | | | | | |
Name and year of birth | | Position held and length of service* | | Principal occupations during past five years or longer | | Current other
public company or
investment
company
directorships |
| | | |
William R. Ebsworth (Born 1957) | | Trustee, since 2015 | | Retired. From 1984 to 2013, equities analyst, portfolio manager, research director and chief investment officer at Fidelity Management and Research Company in Boston, Tokyo, and Hong Kong, and retired in 2013 as Chief Investment Officer of Fidelity Strategic Advisers, Inc. where he led a team of investment professionals managing client assets. Prior thereto, Board member of Hong Kong Securities Clearing Co., Hong Kong Options Clearing Corp., the Thailand International Fund, Ltd., Fidelity Investments Life Insurance Company, and Empire Fidelity Investments Life Insurance Company. Audit Committee Chair and Investment Committee Chair of the Vincent Memorial Hospital Endowment(non-profit organization). Mr. Ebsworth is a CFA® charterholder. | | N/A |
| | | |
Jane A. Freeman (Born 1953) | | Trustee, since 2015; Chair Liaison, since 2018 | | Retired. From 2012 to 2014 and 1999 to 2008, Chief Financial Officer of Scientific Learning Corporation. From 2008 to 2012, Ms. Freeman provided consulting services related to strategic business projects. Prior to 1999, Portfolio Manager at Rockefeller & Co. and Scudder, Stevens & Clark. Board member of the Harding Loevner Funds from 1996 to 2014, serving as both Lead Independent Director and chair of the Audit Committee. Board member of the Russell Exchange Traded Funds Trust from 2011 to 2012 and the chair of the Audit Committee. Ms. Freeman is a Board Member of The Ruth Bancroft Garden(non-profit organization). She is also an inactive Chartered Financial Analyst. | | N/A |
| | | |
Isaiah Harris, Jr. (Born 1952) | | Trustee, since 2009; Audit Committee Chairman, since 2019 | | Retired. Chairman of the Board of CIGNA Corporation since 2009, and Director since 2005. From 2003 to 2011, Director of Deluxe Corporation. Prior thereto, President and CEO of BellSouth Advertising and Publishing Corp. from 2005 to 2007, President and CEO of BellSouth Enterprises from 2004 to 2005 and President of BellSouth Consumer Services from 2000 to 2003. Emeritus member of the Iowa State University Foundation Board of Governors. Emeritus Member of the Advisory Board of Iowa State University School of Business. Advisory Board Member, Palm Harbor Academy (private school). Advisory Board Member, Child Evangelism Fellowship(non-profit). Mr. Harris is a certified public accountant (inactive status). | | CIGNA Corporation |
| | | |
Judith M. Johnson (Born 1949) | | Trustee, since 2008; Audit Committee Chairman, from 2009 to 2018 | | Retired. Prior thereto, Chief Executive Officer and Chief Investment Officer of Minneapolis Employees Retirement Fund from 1996 to 2008. Ms. Johnson is an attorney, certified public accountant and a certified managerial accountant. | | N/A |
38 | Wells Fargo California Limited-Term Tax-Free Fund
Other information (unaudited)
| | | | | | |
Name and year of birth | | Position held and length of service* | | Principal occupations during past five years or longer | | Current other
public company or
investment
company
directorships |
| | | |
David F. Larcker (Born 1950) | | Trustee, since 2009 | | James Irvin Miller Professor of Accounting at the Graduate School of Business, Stanford University, Director of the Corporate Governance Research Initiative and Senior Faculty of The Rock Center for Corporate Governance since 2006. From 2005 to 2008, Professor of Accounting at the Graduate School of Business, Stanford University. Prior thereto, Ernst & Young Professor of Accounting at The Wharton School, University of Pennsylvania from 1985 to 2005. | | N/A |
| | | |
Olivia S. Mitchell (Born 1953) | | Trustee, since 2006; Nominating and Governance Committee Chairman, since 2018 | | International Foundation of Employee Benefit Plans Professor, Wharton School of the University of Pennsylvania since 1993. Director of Wharton’s Pension Research Council and Boettner Center on Pensions & Retirement Research, and Research Associate at the National Bureau of Economic Research. Previously, Cornell University Professor from 1978 to 1993. | | N/A |
| | | |
Timothy J. Penny (Born 1951) | | Trustee, since 1996; Chairman, since 2018 | | President and Chief Executive Officer of Southern Minnesota Initiative Foundation, anon-profit organization, since 2007. Member of the Board of Trustees of NorthStar Education Finance, Inc., anon-profit organization, since 2007. | | N/A |
| | | |
James G. Polisson (Born 1959) | | Trustee, since 2018 | | Retired. Chief Marketing Officer, Source (ETF) UK Services, Ltd, from 2015 to 2017. From 2012 to 2015, Principal of The Polisson Group, LLC, a management consulting, corporate advisory and principal investing company. Chief Executive Officer and Managing Director at Russell Investments, Global Exchange Traded Funds from 2010 to 2012. Managing Director of Barclays Global Investors from 1998 to 2010 and Global Chief Marketing Officer for iShares and Barclays Global Investors from 2000 to 2010. Trustee of the San Francisco Mechanics’ Institute, anon-profit organization, from 2013 to 2015. Board member of the Russell Exchange Traded Fund Trust from 2011 to 2012. Director of Barclays Global Investors Holdings Deutschland GmbH from 2006 to 2009. Mr. Polisson is an attorney and has a retired status with the Massachusetts and District of Columbia Bar Associations. | | N/A |
| * | Length of service dates reflect the Trustee’s commencement of service with the Trust’s predecessor entities, where applicable. |
Wells Fargo California Limited-Term Tax-Free Fund | 39
Other information (unaudited)
Officers
| | | | |
Name and year of birth | | Position held and
length of service | | Principal occupations during past five years or longer |
| | |
| Andrew Owen (Born 1960) | | President, since 2017 | | Executive Vice President of Wells Fargo & Company and Head of Affiliated Managers, Wells Fargo Asset Management, since 2014. In addition, Mr. Owen is currently President, Chief Executive Officer and Director of Wells Fargo Funds Management, LLC since 2017. Prior thereto, Executive Vice President responsible for marketing, investments and product development for Wells Fargo Funds Management, LLC, from 2009 to 2014. |
| | |
| Nancy Wiser1 (Born 1967) | | Treasurer, since 2012 | | Executive Vice President of Wells Fargo Funds Management, LLC since 2011. Chief Operating Officer and Chief Compliance Officer at LightBox Capital Management LLC, from 2008 to 2011. |
| | |
Alexander Kymn (Born 1973) | | Secretary and Chief Legal Officer, since 2018 | | Senior Company Counsel of Wells Fargo Bank, N.A. since 2018 (previously Senior Counsel from 2007 to 2018). Vice President of Wells Fargo Funds Management, LLC from 2008 to 2014. |
| | |
Michael H. Whitaker (Born 1967) | | Chief Compliance Officer, since 2016 | | Senior Vice President and Chief Compliance Officer since 2016. Senior Vice President and Chief Compliance Officer for Fidelity Investments from 2007 to 2016. |
| | |
| David Berardi (Born 1975) | | Assistant Treasurer, since 2009 | | Vice President of Wells Fargo Funds Management, LLC since 2009. Vice President of Evergreen Investment Management Company, LLC from 2008 to 2010. Manager of Fund Reporting and Control for Evergreen Investment Management Company, LLC from 2004 to 2010. |
| | |
Jeremy DePalma1 (Born 1974) | | Assistant Treasurer, since 2009 | | Senior Vice President of Wells Fargo Funds Management, LLC since 2009. Senior Vice President of Evergreen Investment Management Company, LLC from 2008 to 2010 and head of the Fund Reporting and Control Team within Fund Administration from 2005 to 2010. |
| 1 | Nancy Wiser acts as Treasurer of 65 funds in the Fund Complex. Jeremy DePalma acts as Treasurer of 87 funds and Assistant Treasurer of 65 funds in the Fund Complex. |
| 2 | The Statement of Additional Information includes additional information about the Trustees and is available, without charge, upon request, by calling1-800-222-8222 or by visiting the website atwfam.com. |
40 | Wells Fargo California Limited-Term Tax-Free Fund
Other information (unaudited)
BOARD CONSIDERATION OF INVESTMENT MANAGEMENT ANDSUB-ADVISORY AGREEMENTS:
Wells Fargo California Limited-TermTax-Free Fund
Under the Investment Company Act of 1940 (the “1940 Act”), the Board of Trustees (the “Board”) of Wells Fargo Funds Trust (the “Trust”) must determine annually whether to approve the continuation of the Trust’s investment management andsub-advisory agreements. In this regard, at anin-person meeting held on May21-22, 2019 (the “Meeting”), the Board, all the members of which have no direct or indirect interest in the investment management andsub-advisory agreements and are not “interested persons” of the Trust, as defined in the 1940 Act (the “Independent Trustees”), reviewed and approved for Wells Fargo California Limited-TermTax-Free Fund(the “Fund”): (i) an investment management agreement (the “Management Agreement”) with Wells Fargo Funds Management, LLC (“Funds Management”); and (ii) an investmentsub-advisory agreement (the“Sub-Advisory Agreement”) with Wells Capital Management Incorporated (the“Sub-Adviser”), an affiliate of Funds Management. The Management Agreement and theSub-Advisory Agreement are collectively referred to as the “Advisory Agreements.”
At the Meeting, the Board considered the factors and reached the conclusions described below relating to the selection of Funds Management and theSub-Adviser and the approval of the Advisory Agreements. Prior to the Meeting, including at anin-person meeting in April 2019, the Trustees conferred extensively among themselves and with representatives of Funds Management about these matters. Also, the Board has adopted a team-based approach, with each team consisting of asub-set of Trustees, to assist the full Board in the discharge of its duties in reviewing investment performance and other matters throughout the year. The Independent Trustees were assisted in their evaluation of the Advisory Agreements by independent legal counsel, from whom they received separate legal advice and with whom they met separately.
In providing information to the Board, Funds Management and theSub-Adviser were guided by a detailed set of requests for information submitted to them by independent legal counsel on behalf of the Independent Trustees at the start of the Board’s annual contract renewal process earlier in 2019. In considering and approving the Advisory Agreements, the Trustees considered the information they believed relevant, including but not limited to the information discussed below. The Board considered not only the specific information presented in connection with the Meeting, but also the knowledge gained over time through interaction with Funds Management and theSub-Adviser about various topics. In this regard, the Board reviewed reports of Funds Management at each of its quarterly meetings, which included, among other things, portfolio reviews and investment performance reports. In addition, the Board and the teams mentioned above confer with portfolio managers at various times throughout the year. The Board did not identify any particular information or consideration that wasall-important or controlling, and each individual Trustee may have attributed different weights to various factors.
After its deliberations, the Board unanimously approved the continuation of the Advisory Agreements for aone-year term and determined that the compensation payable to Funds Management and theSub-Adviser under each of the Advisory Agreements was reasonable. The Board considered the approval of the Advisory Agreements for the Fund as part of its consideration of agreements for funds across the complex, but its approvals were made on afund-by-fund basis. The following summarizes a number of important, but not necessarily all, factors considered by the Board in support of its approvals.
Nature, extent and quality of services
The Board received and considered various information regarding the nature, extent and quality of services provided to the Fund by Funds Management and theSub-Adviser under the Advisory Agreements. This information included a description of the investment advisory services and Fund-level administrative services covered by the Management Agreement, as well as, among other things, a summary of the background and experience of senior management of Wells Fargo Asset Management (“WFAM”), of which Funds Management and theSub-Adviser are a part, a summary of investments made in the business of WFAM, a summary of certain organizational and personnel changes involving Funds Management and theSub-Adviser, and a description of Funds Management’s and theSub-Adviser’s business continuity planning programs and of their approaches to data privacy and cybersecurity. The Board received and reviewed information about Funds Management’s role as administrator of the Fund’s liquidity risk management program. The Board also considered the qualifications, background, tenure and responsibilities of each of the portfolio managers primarily responsible for theday-to-day portfolio management of the Fund.
The Board evaluated the ability of Funds Management and theSub-Adviser to attract and retain qualified investment professionals, including research, advisory and supervisory personnel. The Board further considered the compliance programs and compliance records of Funds Management and theSub-Adviser. In addition, the Board took into account the full range of services provided to the Fund by Funds Management and its affiliates.
Wells Fargo California Limited-Term Tax-Free Fund | 41
Other information (unaudited)
Fund investment performance and expenses
The Board considered the investment performance results for the Fund over various time periods ended December 31, 2018. The Board considered these results in comparison to the investment performance of funds in a universe that was determined by Broadridge Inc. (“Broadridge”) to be similar to the Fund (the “Universe”), and in comparison to the Fund’s benchmark index and to other comparative data. Broadridge is an independent provider of investment company data. The Board received a description of the methodology used by Broadridge to select the mutual funds in the performance Universe. The Board noted that the investment performance of the Fund (Administrator Class) was higher than the average investment performance of the Universe for the five- andten-year periods under review,in-range of the average investment performance of the Universe for the three-year period under review, and lower than the average investment performance of the Universe for theone-year period under review. The Board also noted that the investment performance of the Fund was lower than its benchmark index, the Bloomberg Barclays Municipal1-5 Year Blend Index, for theone- and three-year periods under review, but higher than its benchmark for the five- andten-year periods under review.
The Board received information concerning, and discussed factors contributing to, the underperformance of the Fund relative to the Universe and benchmark index for the periods identified above. The Board took note of the explanations for the relative underperformance during these periods, including with respect to investment decisions and market factors that affected the Fund’s investment performance. The Board also took note of the Fund’s outperformance relative to the Universe and benchmark index over the longer time periods under review.
The Board also received and considered information regarding the Fund’s net operating expense ratios and their various components, including actual management fees, custodian and othernon-management fees, and Rule12b-1 andnon-Rule12b-1 shareholder service fees. The Board considered these ratios in comparison to the median ratios of funds in class-specific expense groups that were determined by Broadridge to be similar to the Fund (the “Groups”). The Board received a description of the methodology used by Broadridge to select the mutual funds in the expense Groups and an explanation of how funds comprising expense groups and their expense ratios may vary fromyear-to-year. Based on the Broadridge reports, the Board noted that the net operating expense ratios of the Fund were in range of or equal to the median net operating expense ratios of the expense Groups for each share class.
The Board took into account the Fund’s investment performance and expense information provided to it among the factors considered in deciding tore-approve the Advisory Agreements.
Investment management andsub-advisory fee rates
The Board reviewed and considered the contractual fee rates payable by the Fund to Funds Management under the Management Agreement, as well as the contractual fee rates payable by the Fund to Funds Management for class-level administrative services under a Class-Level Administration Agreement, which include, among other things, class-level transfer agency andsub-transfer agency costs (collectively, the “Management Rates”). The Board also reviewed and considered the contractual investmentsub-advisory fee rates that are payable by Funds Management to theSub-Adviser for investmentsub-advisory services.
Among other information reviewed by the Board was a comparison of the Fund’s Management Rates with the average contractual investment management fee rates of funds in the expense Groups at a common asset level as well as transfer agency costs of the funds in the expense Groups. The Board noted that the Management Rates of the Fund were lower than or in range of the sum of these average rates for the Fund’s expense Groups for all share classes.
The Board also received and considered information about the portion of the total management fee that was retained by Funds Management after payment of the fee to theSub-Adviser forsub-advisory services. In assessing the reasonableness of this amount, the Board received and evaluated information about the nature and extent of responsibilities retained and risks assumed by Funds Management and not delegated to or assumed by theSub-Adviser, and about Funds Management’son-going oversight services. Given the affiliation between Funds Management and theSub-Adviser, the Board ascribed limited relevance to the allocation of fees between them.
The Board also received and considered information about the nature and extent of services offered and fee rates charged by Funds Management and theSub-Adviser to other types of clients with investment strategies similar to those of the Fund. In this regard, the Board received information about the significantly greater scope of services, and compliance, reporting and other legal burdens and risks of managing proprietary mutual funds compared with those associated with managing assets of other types of clients, including third-partysub-advised fund clients andnon-mutual fund clients such as institutional separate accounts.
42 | Wells Fargo California Limited-Term Tax-Free Fund
Other information (unaudited)
Based on its consideration of the factors and information it deemed relevant, including those described here, the Board determined that the compensation payable to Funds Management under the Management Agreement and to theSub-Adviser under theSub-Advisory Agreement was reasonable.
Profitability
The Board received and considered information concerning the profitability of Funds Management, as well as the profitability of both WFAM and Wells Fargo & Co. (“Wells Fargo”) from providing services to the fund family as a whole. The Board noted that theSub-Adviser’s profitability information with respect to providing services to the Fund and other funds in the family was subsumed in the WFAM and Wells Fargo profitability analysis.
Funds Management reported on the methodologies and estimates used in calculating profitability, including a description of the methodology used to allocate certain expenses. Among other things, the Board noted that the levels of profitability reported on afund-by-fund basis varied widely, depending on factors such as the size, type and age of fund. Based on its review, the Board did not deem the profits reported by Funds Management, WFAM or Wells Fargo from services provided to the Fund to be at a level that would prevent it from approving the continuation of the Advisory Agreements.
Economies of scale
The Board received and considered information about the potential for Funds Management to experience economies of scale in the provision of management services to the Fund, the difficulties of calculating economies of scale at an individual fund level, and the extent to which potential scale benefits are shared with shareholders. The Board noted the existence of breakpoints in the Fund’s management fee structure, which operate generally to reduce the Fund’s expense ratios as the Fund grows in size. The Board considered that in addition to management fee breakpoints, Funds Management shares potential economies of scale from its management business in a variety of ways, including through fee waiver and expense reimbursement arrangements, services that benefit shareholders, competitive management fee rates set at the outset without regard to breakpoints, and investments in the business intended to enhance services available to shareholders.
The Board concluded that Funds Management’s arrangements with respect to the Fund, including contractual breakpoints, constituted a reasonable approach to sharing potential economies of scale with the Fund and its shareholders.
Other benefits to Funds Management and theSub-Adviser
The Board received and considered information regarding potential“fall-out” or ancillary benefits received by Funds Management and its affiliates, including theSub-Adviser, as a result of their relationships with the Fund. Ancillary benefits could include, among others, benefits directly attributable to other relationships with the Fund and benefits potentially derived from an increase in Funds Management’s and theSub-Adviser’s business as a result of their relationships with the Fund. The Board noted that various affiliates of Funds Management may receive distribution-related fees, shareholder servicing payments andsub-transfer agency fees in respect of shares sold or held through them and services provided.
The Board also reviewed information about soft dollar credits earned and utilized by theSub-Adviser, fees earned by Funds Management and theSub-Adviser from managing a private investment vehicle for the fund family’s securities lending collateral, and commissions earned by an affiliated broker from portfolio transactions.
Based on its consideration of the factors and information it deemed relevant, including those described here, the Board did not find that any ancillary benefits received by Funds Management and its affiliates, including theSub-Adviser, were unreasonable.
Conclusion
At the Meeting, after considering the above-described factors and based on its deliberations and its evaluation of the information described above, the Board unanimously approved the continuation of the Advisory Agreements for aone-year term and determined that the compensation payable to Funds Management and theSub-Adviser under each of the Advisory Agreements was reasonable.
Wells Fargo California Limited-Term Tax-Free Fund | 43
This page is intentionally left blank.

For more information
More information about Wells Fargo Funds is available free upon request. To obtain literature, please write, visit the Fund’s website, or call:
Wells Fargo Funds
P.O. Box 219967
Kansas City, MO 64121-9967
Website:wfam.com
Individual investors:1-800-222-8222
Retail investment professionals:1-888-877-9275
Institutional investment professionals:1-866-765-0778

This report and the financial statements contained herein are submitted for the general information of the shareholders of the Fund. If this report is used for promotional purposes, distribution of the report must be accompanied or preceded by a current prospectus. Before investing, please consider the investment objectives, risks, charges, and expenses of the investment. For a current prospectus and, if available, a summary prospectus, containing this information, call1-800-222-8222 or visit the Fund’s website atwfam.com. Read the prospectus carefully before you invest or send money.
Wells Fargo Asset Management (WFAM) is the trade name for certain investment advisory/management firms owned by Wells Fargo & Company. These firms include but are not limited to Wells Capital Management Incorporated and Wells Fargo Funds Management, LLC. Certain products managed by WFAM entities are distributed by Wells Fargo Funds Distributor, LLC (a broker-dealer and Member FINRA).
This material is for general informational and educational purposes only and is NOT intended to provide investment advice or a recommendation of any kind—including a recommendation for any specific investment, strategy, or plan.
INVESTMENT PRODUCTS: NOT FDIC INSURED ◾ NO BANK GUARANTEE ◾ MAY LOSE VALUE
© 2019 Wells Fargo Funds Management, LLC. All rights reserved.
404820 08-19
A248/AR248 06-19
Annual Report
June 30, 2019
Wells Fargo
Intermediate Tax/AMT-Free Fund
Beginning on January 1, 2021, as permitted by new regulations adopted by the Securities and Exchange Commission, paper copies of the Wells Fargo Funds’ annual and semi-annual shareholder reports issued after this date will no longer be sent by mail, unless you specifically request paper copies of the reports. Instead, the reports will be made available on the Funds’ website, and you will be notified by mail each time a report is posted and provided with a website address to access the report.
If you already elected to receive shareholder reports electronically, you will not be affected by this change and you need not take any action. You may elect to receive shareholder reports and other communications from the Fund electronically at any time by contacting your financial intermediary (such as a broker-dealer or bank) or, if you are a direct investor, by calling1-800-222-8222 or by enrolling at wellsfargo.com/advantagedelivery.
You may elect to receive all future reports in paper free of charge. If you invest through a financial intermediary, you can contact your financial intermediary to request that you continue to receive paper copies of your shareholder reports; if you invest directly with the Fund, you can call 1-800-222-8222. Your election to receive reports in paper will apply to all Wells Fargo Funds held in your account with your financial intermediary or, if you are a direct investor, to all Wells Fargo Funds that you hold.
|
|
|
Reduce clutter. Save trees. |
Sign up for electronic delivery of prospectuses and shareholder reports atwellsfargo.com/advantagedelivery |
The views expressed and any forward-looking statements are as of June 30, 2019, unless otherwise noted, and are those of the Fund managers and/or Wells Fargo Asset Management. Discussions of individual securities, or the markets generally, or any Wells Fargo Fund are not intended as individual recommendations. Future events or results may vary significantly from those expressed in any forward-looking statements. The views expressed are subject to change at any time in response to changing circumstances in the market. Wells Fargo Asset Management and the Fund disclaim any obligation to publicly update or revise any views expressed or forward-looking statements.
INVESTMENT PRODUCTS: NOT FDIC INSURED ◾ NO BANK GUARANTEE ◾ MAY LOSE VALUE
Wells Fargo Intermediate Tax/AMT-Free Fund | 1
Letter to shareholders (unaudited)

Andrew Owen
President
Wells Fargo Funds
Dear Shareholder:
We are pleased to offer you this annual report for the Wells Fargo Intermediate Tax/AMT-Free Fund for the 12-month period that ended June 30, 2019. After the first six months of the period yielded either low-single-digit or negative investment returns, stock and bond investors enjoyed a recovery during the final six months. The gains came amid continued concerns about global economic growth, international trade, geopolitical tensions, and bouts of market volatility.
For the period, U.S. stocks, based on the S&P 500 Index,1 gained 10.42% and international stocks, as measured by the MSCI ACWI ex USA Index (Net),2 rose 1.29%. The MSCI EM Index (Net)3 added 1.21%. For bond investors, the Bloomberg Barclays U.S. Aggregate Bond Index4 added 7.87%, the Bloomberg Barclays Global Aggregate ex-USD Index5 rose 4.10%, the Bloomberg Barclays Municipal Bond Index6 gained 6.71%, and the ICE BofAML U.S. High Yield Index7 added 7.58%.
U.S. and international markets diverged during the third quarter of 2018.
Domestic equity investors received encouraging news during the third quarter of 2018. The U.S. Bureau of Economic Analysis reported second-quarter annualized gross domestic product (GDP) growth of 4.2%. Hiring improved. Unemployment declined. Consumer confidence and spending increased. Third-quarter corporate earnings reports were generally positive. U.S. trade negotiations with Mexico and Canada progressed. The U.S. Federal Reserve (Fed) raised the federal funds rate by 25 basis points (bps; 100 bps equal 1.00%) to a target range of between 2.00% and 2.25% in September, one of four rate increases implemented during 2018, expressing confidence in the strength of the U.S. economic expansion’s durability.
Investors in international markets were not as confident. Tensions between the U.S. and China increased. The U.S. imposed $200 billion in tariffs on Chinese goods. China reacted with $60 billion in tariffs on U.S. goods. Economic growth in China caused concern. During the quarter, the MSCI ACWI ex USA Index (Net) gained 0.71%. The MSCI EM Index (Net) declined 1.09%. In fixed-income markets, U.S. bonds were flat, as measured by the Bloomberg Barclays U.S. Aggregate Bond Index. The Bloomberg Barclays Global Aggregate ex-USD Index fell 1.74%.
| 1 | The S&P 500 Index consists of 500 stocks chosen for market size, liquidity, and industry group representation. It is a market-value-weighted index with each stock’s weight in the index proportionate to its market value. You cannot invest directly in an index. |
| 2 | The Morgan Stanley Capital International (MSCI) All Country World Index (ACWI) ex USA Index (Net) is a free-float-adjusted market-capitalization weighted index that is designed to measure the equity market performance of developed and emerging markets, excluding the U.S. Source: MSCI. MSCI makes no express or implied warranties or representations and shall have no liability whatsoever with respect to any MSCI data contained herein. The MSCI data may not be further redistributed or used as a basis for other indices or any securities or financial products. This report is not approved, reviewed, or produced by MSCI. You cannot invest directly in an index. |
| 3 | The MSCI Emerging Markets (EM) Index (Net) is a free-float-adjusted market-capitalization-weighted index that is designed to measure the equity market performance of emerging markets. You cannot invest directly in an index. |
| 4 | The Bloomberg Barclays U.S. Aggregate Bond Index is a broad-based benchmark that measures the investment-grade, U.S. dollar-denominated, fixed-rate taxable bond market, including Treasuries, government-related and corporate securities, mortgage-backed securities (agency fixed-rate and hybrid adjustable-rate mortgage pass-throughs), asset-backed securities, and commercial mortgage-backed securities. You cannot invest directly in an index. |
| 5 | The Bloomberg Barclays Global Aggregate ex-USD Index is an unmanaged index that provides a broad-based measure of the global investment-grade fixed-income markets excluding the U.S. dollar-denominated debt market. You cannot invest directly in an index. |
| 6 | The Bloomberg Barclays Municipal Bond Index is an unmanaged index composed of long-term tax-exempt bonds with a minimum credit rating of Baa. You cannot invest directly in an index. |
| 7 | The ICE BofAML U.S. High Yield Index is a market-capitalization-weighted index of domestic and Yankee high-yield bonds. The index tracks the performance of high-yield securities traded in the U.S. bond market. You cannot invest directly in an index. Copyright 2019. ICE Data Indices, LLC. All rights reserved. |
2 | Wells Fargo Intermediate Tax/AMT-Free Fund
Letter to shareholders (unaudited)
Global markets suffered during the fourth quarter of 2018.
November’s U.S. midterm elections shifted control of the House of Representatives from Republicans to Democrats, presaging partisan clashes that followed and caused uncertainty among investors. Third-quarter U.S. GDP was announced at an annualized 3.4% rate, lower than the second-quarter rate. Brexit efforts stalled ahead of the March 2019 deadline. The People’s Bank of China cut reserve requirement ratios, accelerated infrastructure spending, and cut taxes even as the value of the yuan declined to low levels last seen in 2008. A partial U.S. government shutdown driven by partisan policy disputes extended into January.
The combination of news in the U.S. and generally weak economic indicators outside of the U.S. caused investors to seek safe havens. December’s S&P 500 Index performance was the worst since 1931. Globally, fixed-income investments fared better than stocks during the last two months of the year. The Fed increased the federal funds rate by 25 bps in December to a target range of between 2.25% and 2.50%.
The market climbs a wall of worry.
Investors entered 2019 with reasons to be concerned. Investment returns appeared to reaffirm the adage that markets climb a wall of worry. The S&P 500 Index gained 8.01% for the month of January, the best monthly performance in 30 years. Returns for the MSCI ACWI ex USA Index (Net), the Bloomberg Barclays U.S. Aggregate Bond Index, and the Bloomberg Barclays Global Aggregate ex-USD Index also were positive. The Fed indicated that it would pause its program of regular rate increases during 2019 as inflation remained low.
In February 2019, concerns over slowing global growth persisted. The Bureau of Economic Analysis announced fourth-quarter 2018 GDP grew at an annualized 2.2% rate, down from the levels of the prior two quarters. In a February report, the Bank of England forecast the slowest growth since the financial crisis for 2019. China and the U.S. continued to wrangle over trade issues.
By the end of March 2019, the combination of dovish Fed sentiment and steady, if not spectacular, economic and business metrics reinforced investors’ confidence. Monthly job creation data and corporate profits, while less consistent than during 2018, were solid. China announced a roughly $300 billion stimulus package through tax and fee cuts intended to reinvigorate economic growth.
During April 2019, investors drew confidence from favorable economic projections, sustained low inflation, and solid employment data. First-quarter GDP showed the economy grew at an annualized rate of 3.2% on improvement in business investment and exports. Favorable sentiment extended to foreign markets as the MSCI ACWI ex USA Index (Net) gained 2.64% and the MSCI EM Index (Net) added 2.11% for the month.
During May 2019, investing signals were mixed. In the U.S., partisan wrangling ramped up as Democrats and Republicans set their sights on 2020 presidential politics. The U.K.’s Brexit caused Prime Minister Theresa May to resign. The European Commission downgraded the 2019 growth forecast to 1.2%. The U.S. increased tariffs on products from China, China responded, and then talks broke down. President Donald Trump threatened to turn his foreign policy tariff tool to Mexico over immigration issues. Markets tumbled.
As had been the case during most of 2019 to date, just as the investment horizon appeared to darken, sentiment turned and markets gained. The gains, primarily driven by geopolitical and monetary policy events, drove equity markets to new highs. President Trump dropped his threats of new tariffs on Mexico after talks and further tariffs on China after meeting with China’s President Xi Jinping at the G-20 summit. President Mario Draghi of the European Central Bank said that if the outlook doesn’t
“December’s S&P 500 Index performance was the worst since 1931.”
“The S&P 500 Index gained 8.01% for the month of January, the best monthly performance in 30 years.”
Wells Fargo Intermediate Tax/AMT-Free Fund | 3
Letter to shareholders (unaudited)
improve, the bank will cut rates or buy more assets to prop up inflation. In the U.S., the Fed said growth shifted from “solid” to “moderate” and indicated a willingness to cut rates.
Don’t let short-term uncertainty derail long-term investment goals.
Periods of investment uncertainty can present challenges, but experience has taught us that maintaining long-term investment goals can be an effective way to plan for the future. To help you create a sound strategy based on your personal goals and risk tolerance, Wells Fargo Funds offers more than 100 mutual funds spanning a wide range of asset classes and investment styles. Although diversification cannot guarantee an investment profit or prevent losses, we believe it can be an effective way to manage investment risk and potentially smooth out overall portfolio performance. We encourage investors to know their investments and to understand that appropriate levels of risk-taking may unlock opportunities.
Thank you for choosing to invest with Wells Fargo Funds. We appreciate your confidence in us and remain committed to helping you meet your financial needs.
Sincerely,

Andrew Owen
President
Wells Fargo Funds
|
|
|
For further information about your Fund, contact your investment professional, visit our website at wfam.com, or call us directly at1-800-222-8222. |
4 | Wells Fargo Intermediate Tax/AMT-Free Fund
This page is intentionally left blank.
Performance highlights (unaudited)
Investment objective
The Fund seeks current income exempt from federal income tax.
Manager
Wells Fargo Funds Management, LLC
Subadviser
Wells Capital Management Incorporated
Portfolio managers
Bruce R. Johns‡
Robert J. Miller
Adrian Van Poppel‡
Average annual total returns (%) as of June 30, 2019
| | | | | | | | | | | | | | | | | | | | | | | | | | | | | | | | | | |
| | | | |
| | | | | Including sales charge | | | Excluding sales charge | | | Expense
ratios1 (%) | |
| | | | | | | | | |
| | | Inception date | | 1 year | | | 5 year | | | 10 year | | | 1 year | | | 5 year | | | 10 year | | | Gross | | | Net2 | |
| | | | | | | | | | |
| Class A (WFTAX) | | 7-31-2007 | | | 2.50 | | | | 1.97 | | | | 3.85 | | | | 5.67 | | | | 2.59 | | | | 4.17 | | | | 0.79 | | | | 0.70 | |
| | | | | | | | | | |
| Class C (WFTFX) | | 7-31-2007 | | | 3.88 | | | | 1.83 | | | | 3.39 | | | | 4.88 | | | | 1.83 | | | | 3.39 | | | | 1.54 | | | | 1.45 | |
| | | | | | | | | | |
| Class R6 (WFRTX)3 | | 7-31-2018 | | | – | | | | – | | | | – | | | | 5.89 | | | | 2.85 | | | | 4.45 | | | | 0.41 | | | | 0.40 | |
| | | | | | | | | | |
| Administrator Class (WFITX) | | 3-31-2008 | | | – | | | | – | | | | – | | | | 5.77 | | | | 2.69 | | | | 4.28 | | | | 0.73 | | | | 0.60 | |
| | | | | | | | | | |
| Institutional Class (WITIX) | | 3-31-2008 | | | – | | | | – | | | | – | | | | 5.93 | | | | 2.86 | | | | 4.46 | | | | 0.46 | | | | 0.45 | |
| | | | | | | | | | |
| Bloomberg Barclays Municipal Bond 1-15 Year Blend Index4 | | – | | | – | | | | – | | | | – | | | | 6.12 | | | | 3.03 | | | | 3.92 | | | | – | | | | – | |
Figures quoted represent past performance, which is no guarantee of future results, and do not reflect taxes that a shareholder may pay on fund distributions or the redemption of fund shares. Investment return and principal value of an investment will fluctuate so that an investor’s shares, when redeemed, may be worth more or less than their original cost. Performance shown without sales charges would be lower if sales charges were reflected. Current performance may be lower or higher than the performance data quoted, which assumes the reinvestment of dividends and capital gains. Current month-end performance is available on the Fund’s website, wfam.com.
Index returns do not include transaction costs associated with buying and selling securities, any mutual fund fees or expenses, or any taxes. It is not possible to invest directly in an index.
For Class A shares, the maximum front-end sales charge is 3.00%. For Class C shares, the maximum contingent deferred sales charge is 1.00%. Performance including a contingent deferred sales charge assumes the sales charge for the corresponding time period. Class R6, Administrator Class, and Institutional shares are sold without a front-end sales charge or contingent deferred sales charge.
Bond values fluctuate in response to the financial condition of individual issuers, general market and economic conditions, and changes in interest rates. Changes in market conditions and government policies may lead to periods of heightened volatility in the bond market and reduced liquidity for certain bonds held by the Fund. In general, when interest rates rise, bond values fall and investors may lose principal value. Interest rate changes and their impact on the Fund and its share price can be sudden and unpredictable. High-yield securities have a greater risk of default and tend to be more volatile than higher-rated debt securities. The use of derivatives may reduce returns and/or increase volatility. Certain investment strategies tend to increase the total risk of an investment (relative to the broader market). The Fund is exposed to municipal securities risk. Consult the Fund’s prospectus for additional information on these and other risks. A portion of the Fund’s income may be subject to federal, state, and/or local income taxes or the Alternative Minimum Tax (AMT). Any capital gains distributions may be taxable.
Please see footnotes on page 7.
6 | Wells Fargo Intermediate Tax/AMT-Free Fund
Performance highlights (unaudited)
|
|
| Growth of $10,000 investment as of June 30, 20195 |
|
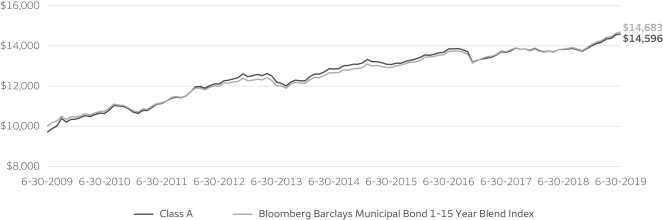
|
| ‡ | Mr. Johns and Mr. Van Poppel became portfolio managers of the Fund on March 28, 2019. |
| 1 | Reflects the expense ratios as stated in the most recent prospectuses. The expense ratios shown are subject to change and may differ from the annualized expense ratios shown in the financial highlights of this report. |
| 2 | The manager has contractually committed through October 31, 2019, to waive fees and/or reimburse expenses to the extent necessary to cap the expenses of each class after fee waivers at the amounts shown. Brokerage commissions, stamp duty fees, interest, taxes, acquired fund fees and expenses (if any), and extraordinary expenses are excluded from the expense cap. Prior to or after the commitment expiration date, the cap may be increased or the commitment to maintain the cap may be terminated only with the approval of the Board of Trustees. Without this cap, the Fund’s returns would have been lower. The expense ratio paid by an investor is the net expense ratio (the total annual fund operating expenses after fee waivers) as stated in the prospectuses. |
| 3 | Historical performance shown for Class R6 shares prior to their inception reflects the performance of the Institutional Class shares, and includes the higher expenses applicable to Institutional Class shares. If these expenses had not been included, returns for Class R6 shares would be higher. |
| 4 | The Bloomberg Barclays Municipal Bond 1–15 Year Blend Index is the 1–15 year component of the Bloomberg Barclays Municipal Bond Index. The Bloomberg Barclays Municipal Bond Index is an unmanaged index composed of long-term tax-exempt bonds with a minimum credit rating of Baa. You cannot invest directly in an index. |
| 5 | The chart compares the performance of Class A shares for the most recent ten years with the Bloomberg Barclays Municipal Bond 1–15 Year Blend Index. The chart assumes a hypothetical $10,000 investment in Class A shares and reflects all operating expenses and assumes the maximum initial sales charge of 3.00%. |
| 6 | Amounts are calculated based on the long-term total investments of the Fund. These amounts are subject to change and may have changed since the date specified. |
| 7 | The credit quality distribution of portfolio holdings reflected in the chart is based on ratings from Standard & Poor’s, Moody’s Investors Service, and/or Fitch Ratings Ltd. Credit quality ratings apply to the underlying holdings of the Fund and not to the Fund itself. The percentages of the Fund’s portfolio with the ratings depicted in the chart are calculated based on the total market value of fixed income securities held by the Fund. If a security was rated by all three rating agencies, the middle rating was utilized. If rated by two of three rating agencies, the lower rating was utilized, and if rated by one of the rating agencies, that rating was utilized. Standard & Poor’s rates the creditworthiness of bonds, ranging from AAA (highest) to D (lowest). Ratings from A to CCC may be modified by the addition of a plus (+) or minus (-) sign to show relative standing within the rating categories. Standard & Poor’s rates the creditworthiness of short-term notes from SP-1 (highest) to SP-3 (lowest). Moody’s rates the creditworthiness of bonds, ranging from Aaa (highest) to C (lowest). Ratings Aa to B may be modified by the addition of a number 1 (highest) to 3 (lowest) to show relative standing within the ratings categories. Moody’s rates the creditworthiness of short-term U.S. tax-exempt municipal securities from MIG 1/VMIG 1 (highest) to SG (lowest). Fitch rates the creditworthiness of bonds, ranging from AAA (highest) to D (lowest). Credit quality distribution is subject to change and may have changed since the date specified. |
Wells Fargo Intermediate Tax/AMT-Free Fund | 7
Performance highlights (unaudited)
MANAGER’S DISCUSSION
Fund highlights
| ∎ | | The Fund underperformed its benchmark, the Bloomberg Barclays Municipal Bond 1-15 Year Blend Index, for the 12-month period that ended June 30, 2019. |
| ∎ | | We were short duration to the benchmark over the period, which detracted from performance as the market rallied. Our conservative duration position minimized volatility during the first half of the period but was a significant detractor as the market rallied in the second half of the period. |
| ∎ | | Yield-curve positioning was a positive contributor to performance as our bias toward a flatter curve in the first half of the year added to returns. |
| ∎ | | Credit positioning was the biggest driver of performance, and our overweight to lower-investment-grade credits (A-rated and BBB-rated) as well as a modest allocation to high-yield bonds positively influenced returns as these types of bonds benefited from a growing economy and a strong demand for income. |
| ∎ | | Sector allocation and security selection were also positive contributors to performance. Overweights to the local general obligation (GO), industrial development revenue (IDR)/pollution control revenue (PCR), leasing, and special tax sectors was positive. Selection within the state GOs, especially budget-challenged states such as Illinois and New Jersey, aided performance. Underweights to the housing and hospital sectors detracted from overall results. |
|
|
| Effective maturity distribution as of June 30, 20196 |
|
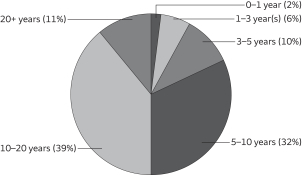
|
The Federal Reserve abruptly changed course from raising rates to a potential rate cut over the period.
Throughout most of 2018, the fixed-income markets expected the Federal Reserve (Fed) to continue the path to normalize monetary policy. Moderate economic growth, stronger employment data, and inflation near its 2% target enabled the Fed to increase the federal funds rate four times in the calendar year. Despite a Fed rate hike in December, the Treasury market rallied in the fourth quarter of 2018 as the market lowered expectations for further rate hikes amid slower global growth, trade tariffs, and uncertainty concerning Britain’s departure from the European Union.
These concerns only increased as we moved into the first half of 2019 and discussions changed from when the Fed might hike to when it might cut the federal funds rate. As a result, fixed-income markets rallied, pushing the benchmark 10-year Treasury yield from a 3.23% peak in November to 2.00% by the end of June.
Specific to the municipal bond market, the beginning of the reporting period was marked with significant outflows due to a general risk-on sentiment in equity markets and the fear of rising interest rates. Short municipals slightly underperformed Treasuries over the period. As the calendar turned, so did market sentiment. Flows into municipal mutual funds not only turned positive but record inflows were reported as investor opinion toward fixed income, particularly municipals, improved due to investor expectations that interest rates would remain stable. While new issue supply was higher than it was a year earlier, it was still much lower than a typical year due to tax reform, which eliminated the ability of issuers to advance refund outstanding higher-cost debt on a tax-exempt basis. Technicals drove the market as overall reduced supply, state and local sales tax caps for individuals, and lower interest rates fueled demand and thus returns for municipal bonds over the period.
Please see footnotes on page 7.
8 | Wells Fargo Intermediate Tax/AMT-Free Fund
Performance highlights (unaudited)
|
|
| Credit quality as of June 30, 20197 |
|
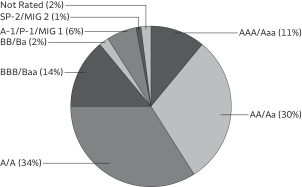 |
Factors across the market influenced Fund performance.
Credit positioning was a key performance driver. Yield-curve positioning, sector allocation, and security selection also aided performance while conservative duration positioning detracted.
Demand for income remained strong during the period as overall interest rates remained low by historical standards. This demand combined with positive fund flows, low supply, and slowing but steady economic growth helped lower-investment-grade bonds (A-rated and BBB-rated bonds) as well as high-yield bonds to outperform bonds in other rating categories. The Fund was overweight these rating categories and benefited as prices rose.
As the year progressed, we became increasingly cautious as yields of lower-investment-grade and high-yield bonds remained near historic lows. While we maintain a modest overweight to these rating categories, we took the opportunity to sell into strength and we have gradually reduced our exposure to bonds rated single-A and below and added to bonds rated AA and AAA.
We maintained duration short to the benchmark, which reduced volatility but detracted as the market rallied over the period. We altered the magnitude of the short-duration position to tactically take advantage of market peaks and troughs. The Fund’s duration ranged from a low of 4.20 years to a high of 4.73 years. We began the period with the Fund’s duration at about 90% of the benchmark’s and ended at roughly 95% of benchmark. We began extending duration in the third quarter of 2018 and continued into the fourth quarter, as supply increased and valuations were attractive. During the first quarter of 2019, we allowed duration to drift down as seasonal market factors took hold, with the intention of extending around tax time when technical strength typically subsides. Fund flows and lower-than-expected supply delayed and shortened the typical window, but we took the opportunity to get duration closer to neutral by buying bonds in the 12- to 17-year part of the curve and added higher-quality bonds.
We were underweight state GO bonds, as these bonds typically represent poor relative value. Despite the underweight, the Fund’s holdings outperformed the state GO bonds in the benchmark, indicating good selection within the sector. We were overweight local GOs, which was positive. The sector outperformed other sectors in the benchmark. Within revenue bond subsectors, overweights to IDR/PCR, education, leasing, and special tax bonds was positive as these sectors outperformed other sectors in the benchmark. Underweights to housing and hospital bonds was a drag on performance as these sectors also outperformed other sectors in the benchmark. We were also underweight the transportation and water and sewer sectors, both of which outperformed other sectors in the benchmark. Despite the underweights, the fund’s holdings within the sectors outperformed the corresponding sectors in the benchmark, which indicated favorable selection within the sectors. Illinois and New Jersey bonds were the two best-performing states in the index, and the Fund was overweight both. We reduced our exposure but still maintain an overweight to Illinois issuers. This was positive as Illinois was one of the top-performing states among bond issuers. Underweights to states New York and California were positive as both underperformed the bonds issued by other states that are represented in the benchmark. Fortunately, the Fund’s limited number of poor-performing securities mostly were higher-quality names purchased as part of our up-in-quality trade approach. We believe these bonds will outperform other securities in the benchmark over time as technicals unwind.
As the expansion appears to be in the rearview mirror, we believe a transition from risk may occur.
The economic expansion started in June 2009 and is the longest since the Great Depression. Low-quality bonds and equities have performed well with stocks near record high prices and bonds marching to record-low yields. We believe we are at late-cycle and, although there remains economic strength, the trend is negative and we expect growth to slow throughout the rest of the year. Our base case does not include a recession but rather suboptimal growth with little risk of an upside surprise to inflation at this point. Global economic growth is anemic at best with trade issues and Brexit concerns adding to a weakening economic environment. Fed rhetoric is dovish and, as of June 30, 2019, the bond market was pricing in multiple rate cuts by year-end, the effect of which would likely serve to inflate asset prices rather than provide any real economic stimulus. Slow economic growth bodes well for bonds but not necessarily for credit spreads as slower economic growth typically weighs on credit quality.
Overall, technicals remain strong in the municipal bond market. Bond valuations in the medium term are supported by strong technicals such as record levels of municipal debt maturities and calls, limited availability of gross municipal bond supply, and continued flows into the asset class. The Fund is structured for a slower growth environment with duration close to neutral, curve positioning based largely on a key rate structure as we transition to a rate-cutting cycle, a higher credit-quality bias, and a focus on sectors that should perform well as the economic growth slows.
Please see footnotes on page 7.
Wells Fargo Intermediate Tax/AMT-Free Fund | 9
Fund expenses (unaudited)
As a shareholder of the Fund, you incur two types of costs: (1) transaction costs, including sales charges (loads) on purchase payments and contingent deferred sales charges (if any) on redemptions and (2) ongoing costs, including management fees, distribution (12b-1) and/or shareholder servicing fees, and other Fund expenses. This example is intended to help you understand your ongoing costs (in dollars) of investing in the Fund and to compare these costs with the ongoing costs of investing in other mutual funds.
The example is based on an investment of $1,000 invested at the beginning of the six-month period and held for the entire period from January 1, 2019 to June 30, 2019.
Actual expenses
The “Actual” line of the table below provides information about actual account values and actual expenses. You may use the information in this line, together with the amount you invested, to estimate the expenses that you paid over the period. Simply divide your account value by $1,000 (for example, an $8,600 account value divided by $1,000 = 8.6), then multiply the result by the number in the “Actual” line under the heading entitled “Expenses paid during period” for your applicable class of shares to estimate the expenses you paid on your account during this period.
Hypothetical example for comparison purposes
The “Hypothetical” line of the table below provides information about hypothetical account values and hypothetical expenses based on the Fund’s actual expense ratio and an assumed rate of return of 5% per year before expenses, which is not the Fund’s actual return. The hypothetical account values and expenses may not be used to estimate the actual ending account balance or expenses you paid for the period. You may use this information to compare the ongoing costs of investing in the Fund and other funds. To do so, compare this 5% hypothetical example with the 5% hypothetical examples that appear in the shareholder reports of the other funds.
Please note that the expenses shown in the table are meant to highlight your ongoing costs only and do not reflect any transactional costs, such as sales charges (loads) and contingent deferred sales charges. Therefore, the “Hypothetical” line of the table is useful in comparing ongoing costs only and will not help you determine the relative total costs of owning different funds. In addition, if these transactional costs were included, your costs would have been higher.
| | | | | | | | | | | | | | | | |
| | | Beginning
account value
1-1-2019 | | | Ending
account value
6-30-2019 | | | Expenses
paid during
the period¹ | | | Annualized net
expense ratio | |
| | | | | |
Class A | | | | | | | | | | | | | | | | |
| | | | |
Actual | | $ | 1,000.00 | | | $ | 1,042.51 | | | $ | 3.55 | | | | 0.70 | % |
| | | | |
Hypothetical (5% return before expenses) | | $ | 1,000.00 | | | $ | 1,021.32 | | | $ | 3.51 | | | | 0.70 | % |
| | | | | |
Class C | | | | | | | | | | | | | | | | |
| | | | |
Actual | | $ | 1,000.00 | | | $ | 1,038.66 | | | $ | 7.33 | | | | 1.45 | % |
| | | | |
Hypothetical (5% return before expenses) | | $ | 1,000.00 | | | $ | 1,017.60 | | | $ | 7.25 | | | | 1.45 | % |
| | | | | |
Class R6 | | | | | | | | | | | | | | | | |
| | | | |
Actual | | $ | 1,000.00 | | | $ | 1,044.04 | | | $ | 2.03 | | | | 0.40 | % |
| | | | |
Hypothetical (5% return before expenses) | | $ | 1,000.00 | | | $ | 1,022.81 | | | $ | 2.01 | | | | 0.40 | % |
| | | | | |
Administrator Class | | | | | | | | | | | | | | | | |
| | | | |
Actual | | $ | 1,000.00 | | | $ | 1,043.93 | | | $ | 3.04 | | | | 0.60 | % |
| | | | |
Hypothetical (5% return before expenses) | | $ | 1,000.00 | | | $ | 1,021.82 | | | $ | 3.01 | | | | 0.60 | % |
| | | | | |
Institutional Class | | | | | | | | | | | | | | | | |
| | | | |
Actual | | $ | 1,000.00 | | | $ | 1,044.66 | | | $ | 2.28 | | | | 0.45 | % |
| | | | |
Hypothetical (5% return before expenses) | | $ | 1,000.00 | | | $ | 1,022.56 | | | $ | 2.26 | | | | 0.45 | % |
| 1 | Expenses paid is equal to the annualized net expense ratio of each class multiplied by the average account value over the period, multiplied by the number of days in the most recent fiscal half-year divided by the number of days in the fiscal year (to reflect the one-half-year period). |
10 | Wells Fargo Intermediate Tax/AMT-Free Fund
Portfolio of investments—June 30, 2019
| | | | | | | | | | | | | | | | |
| | | Interest rate | | | Maturity date | | | Principal | | | Value | |
| Municipal Obligations: 99.80% | |
| | | | |
Alabama: 0.85% | | | | | | | | | | | | | | | | |
| | | | |
| Education Revenue: 0.04% | | | | | | | | | | | | |
| | | | |
Auburn AL Refunding Bond Series A | | | 4.00 | % | | | 6-1-2033 | | | $ | 1,000,000 | | | $ | 1,110,010 | |
| | | | | | | | | | | | | | | | |
| | | | |
| Utilities Revenue: 0.81% | | | | | | | | | | | | |
| | | | |
Southeast Alabama Gas Supply District Series A | | | 4.00 | | | | 4-1-2049 | | | | 6,180,000 | | | | 6,700,850 | |
| | | | |
Southeast Alabama Gas Supply District Series B (1 Month LIBOR +0.85%)± | | | 2.49 | | | | 6-1-2049 | | | | 15,000,000 | | | | 14,770,800 | |
| |
| | | | 21,471,650 | |
| | | | | | | | | | | | | | | | |
| |
| | | | 22,581,660 | |
| | | | | | | | | | | | | | | | |
| | | | |
Alaska: 0.20% | | | | | | | | | | | | | | | | |
| | | | |
| Industrial Development Revenue: 0.04% | | | | | | | | | | | | |
| | | | |
Valdez AK Marine Terminal BP Pipelines Project Series B | | | 5.00 | | | | 1-1-2021 | | | | 1,000,000 | | | | 1,051,780 | |
| | | | | | | | | | | | | | | | |
| | | | |
| Miscellaneous Revenue: 0.16% | | | | | | | | | | | | |
| | | | |
Matanuska Susitna Borough AL Goose Creek Correctional Project | | | 4.00 | | | | 9-1-2030 | | | | 3,870,000 | | | | 4,239,624 | |
| | | | | | | | | | | | | | | | |
| |
| | | | 5,291,404 | |
| | | | | | | | | | | | | | | | |
| | | | |
Arizona: 2.60% | | | | | | | | | | | | | | | | |
| | | | |
| Airport Revenue: 0.51% | | | | | | | | | | | | |
| | | | |
Phoenix AZ Civic Improvement Corporation Series A | | | 5.00 | | | | 7-1-2029 | | | | 5,000,000 | | | | 5,182,700 | |
| | | | |
Phoenix AZ Civic Improvement Corporation Series D | | | 5.00 | | | | 7-1-2036 | | | | 7,000,000 | | | | 8,374,660 | |
| |
| | | | 13,557,360 | |
| | | | | | | | | | | | | | | | |
| | | | |
| Education Revenue: 0.45% | | | | | | | | | | | | |
| | | | |
Arizona Board of Regents University of Arizona System Series A | | | 5.00 | | | | 6-1-2037 | | | | 2,645,000 | | | | 3,292,708 | |
| | | | |
McAllister AZ Arizona State University Hassayampa Academic Village Project | | | 5.00 | | | | 7-1-2025 | | | | 750,000 | | | | 899,318 | |
| | | | |
Pima County AZ Community College District Series 2019 | | | 5.00 | | | | 7-1-2033 | | | | 450,000 | | | | 552,965 | |
| | | | |
Pima County AZ Community College District Series 2019 | | | 5.00 | | | | 7-1-2034 | | | | 500,000 | | | | 611,975 | |
| | | | |
Pima County AZ Community College District Series 2019 | | | 5.00 | | | | 7-1-2035 | | | | 600,000 | | | | 731,790 | |
| | | | |
Pima County AZ Community College District Series 2019 | | | 5.00 | | | | 7-1-2036 | | | | 500,000 | | | | 607,895 | |
| | | | |
Pima County AZ IDA New Plan Learning Project Series A | | | 7.00 | | | | 7-1-2021 | | | | 360,000 | | | | 364,259 | |
| | | | |
Pima County AZ IDA New Plan Learning Project Series A | | | 7.75 | | | | 7-1-2035 | | | | 4,920,000 | | | | 4,983,124 | |
| |
| | | | 12,044,034 | |
| | | | | | | | | | | | | | | | |
| | | | |
| GO Revenue: 0.38% | | | | | | | | | | | | |
| | | | |
Estrella Mountain Ranch AZ Community Facilities District Refunding Bond (AGM Insured) | | | 5.00 | | | | 7-15-2025 | | | | 585,000 | | | | 685,181 | |
| | | | |
Maricopa County AZ Elementary School District #28 Kyrene Elementary School Project 2010 Series B | | | 4.50 | | | | 7-1-2024 | | | | 1,575,000 | | | | 1,772,001 | |
| | | | |
Maricopa County AZ Elementary School District #28 Kyrene Elementary School Project 2010 Series B | | | 4.50 | | | | 7-1-2025 | | | | 1,270,000 | | | | 1,428,852 | |
| | | | |
Maricopa County AZ Elementary School District #28 Kyrene Elementary School Project 2010 Series B | | | 5.00 | | | | 7-1-2027 | | | | 420,000 | | | | 480,694 | |
| | | | |
Maricopa County AZ Elementary School District #28 Kyrene Elementary School Project 2010 Series B | | | 5.50 | | | | 7-1-2029 | | | | 960,000 | | | | 1,117,373 | |
| | | | |
Phoenix AZ | | | 5.00 | | | | 7-1-2026 | | | | 3,810,000 | | | | 4,702,835 | |
| |
| | | | 10,186,936 | |
| | | | | | | | | | | | | | | | |
Wells Fargo Intermediate Tax/AMT-Free Fund | 11
Portfolio of investments—June 30, 2019
| | | | | | | | | | | | | | | | |
| | | Interest rate | | | Maturity date | | | Principal | | | Value | |
| Health Revenue: 0.70% | |
| | | | |
Arizona IDA Phoenix Children Hospital (JPMorgan Chase & Company LOC) ø | | | 1.95 | % | | | 2-1-2048 | | | $ | 15,310,000 | | | $ | 15,310,000 | |
| | | | |
Maricopa County AZ IDA Bond ø | | | 2.02 | | | | 1-1-2049 | | | | 2,000,000 | | | | 2,000,000 | |
| | | | |
Maricopa County AZ IDA Bond | | | 5.00 | | | | 1-1-2048 | | | | 1,000,000 | | | | 1,168,080 | |
| |
| | | | 18,478,080 | |
| | | | | | | | | | | | | | | | |
| | | | |
| Miscellaneous Revenue: 0.14% | | | | | | | | | | | | |
| | | | |
Arizona Refunding Bond Certificate of Participation | | | 5.00 | | | | 9-1-2027 | | | | 3,040,000 | | | | 3,634,107 | |
| | | | | | | | | | | | | | | | |
| | | | |
| Tax Revenue: 0.33% | | | | | | | | | | | | |
| | | | |
Arizona Sports & Tourism Authority Series A | | | 4.00 | | | | 7-1-2020 | | | | 1,365,000 | | | | 1,396,327 | |
| | | | |
Arizona Sports & Tourism Authority Series A | | | 5.00 | | | | 7-1-2021 | | | | 795,000 | | | | 843,885 | |
| | | | |
Arizona Sports & Tourism Authority Series A | | | 5.00 | | | | 7-1-2022 | | | | 1,000,000 | | | | 1,089,990 | |
| | | | |
San Luis AZ Pledged Excise Tax Series A (Build America Mutual Assurance Company Insured) | | | 5.00 | | | | 7-1-2027 | | | | 450,000 | | | | 519,606 | |
| | | | |
San Luis AZ Pledged Excise Tax Series A (Build America Mutual Assurance Company Insured) | | | 5.00 | | | | 7-1-2028 | | | | 700,000 | | | | 806,827 | |
| | | | |
San Luis AZ Pledged Excise Tax Series A (Build America Mutual Assurance Company Insured) | | | 5.00 | | | | 7-1-2034 | | | | 3,680,000 | | | | 4,195,384 | |
| |
| | | | 8,852,019 | |
| | | | | | | | | | | | | | | | |
| | | | |
| Utilities Revenue: 0.09% | | | | | | | | | | | | |
| | | | |
Salt River Project AZ Electric System Revenue Bond 2017 Series A | | | 5.00 | | | | 1-1-2034 | | | | 2,000,000 | | | | 2,471,740 | |
| | | | | | | | | | | | | | | | |
| |
| | | | 69,224,276 | |
| | | | | | | | | | | | | | | | |
| | | | |
California: 8.29% | | | | | | | | | | | | | | | | |
| | | | |
| Airport Revenue: 0.18% | | | | | | | | | | | | |
| | | | |
Sacramento CA Airport System Senior Bond | | | 5.00 | | | | 7-1-2025 | | | | 2,000,000 | | | | 2,072,880 | |
| | | | |
Sacramento CA Airport System Senior Bond Series B | | | 5.00 | | | | 7-1-2032 | | | | 600,000 | | | | 751,794 | |
| | | | |
Sacramento CA Airport System Senior Bond Series B | | | 5.00 | | | | 7-1-2033 | | | | 500,000 | | | | 623,655 | |
| | | | |
Sacramento CA Airport System Senior Bond Series B | | | 5.00 | | | | 7-1-2034 | | | | 1,000,000 | | | | 1,240,510 | |
| |
| | | | 4,688,839 | |
| | | | | | | | | | | | | | | | |
| | | | |
| Education Revenue: 0.51% | | | | | | | | | | | | |
| | | | |
California Statewide CDA Series A | | | 6.90 | | | | 8-1-2031 | | | | 1,860,000 | | | | 2,040,773 | |
| | | | |
University of California General Project Unrefunded Bond Series Q | | | 5.25 | | | | 5-15-2024 | | | | 65,000 | | | | 65,203 | |
| | | | |
University of California Limited Project Prerefunded Bond Series G | | | 5.00 | | | | 5-15-2037 | | | | 5,180,000 | | | | 5,742,807 | |
| | | | |
University of California Limited Project Unrefunded Bond Series G | | | 5.00 | | | | 5-15-2037 | | | | 5,210,000 | | | | 5,692,394 | |
| |
| | | | 13,541,177 | |
| | | | | | | | | | | | | | | | |
| | | | |
| GO Revenue: 3.89% | | | | | | | | | | | | |
| | | | |
California | | | 5.25 | | | | 3-1-2024 | | | | 5,000,000 | | | | 5,135,100 | |
| | | | |
California | | | 5.25 | | | | 3-1-2030 | | | | 1,440,000 | | | | 1,477,642 | |
| | | | |
California | | | 6.00 | | | | 3-1-2033 | | | | 2,510,000 | | | | 2,587,835 | |
| | | | |
California Refunding Bond | | | 5.00 | | | | 4-1-2032 | | | | 9,000,000 | | | | 12,130,200 | |
| | | | |
California Various Purposes | | | 5.00 | | | | 8-1-2030 | | | | 1,500,000 | | | | 1,829,955 | |
| | | | |
California Various Purposes | | | 5.00 | | | | 8-1-2032 | | | | 6,700,000 | | | | 8,100,568 | |
| | | | |
Cerritos CA Community College District CAB Series D ¤ | | | 0.00 | | | | 8-1-2025 | | | | 1,800,000 | | | | 1,609,524 | |
| | | | |
Compton CA Community College District Election of 2002 CAB Series C ¤ | | | 0.00 | | | | 8-1-2029 | | | | 1,565,000 | | | | 1,208,493 | |
| | | | |
Compton CA Community College District Election of 2002 CAB Series C ¤ | | | 0.00 | | | | 8-1-2031 | | | | 2,400,000 | | | | 1,702,992 | |
| | | | |
Emery CA Unified School District Election of 2010 Series A (AGM Insured) | | | 6.25 | | | | 8-1-2031 | | | | 4,500,000 | | | | 4,976,325 | |
| | | | |
Monterey County CA Alisal Union School District Series A (Build America Mutual Assurance Company Insured) | | | 5.25 | | | | 8-1-2042 | | | | 1,500,000 | | | | 1,820,715 | |
12 | Wells Fargo Intermediate Tax/AMT-Free Fund
Portfolio of investments—June 30, 2019
| | | | | | | | | | | | | | | | |
| | | Interest rate | | | Maturity date | | | Principal | | | Value | |
| GO Revenue (continued) | | | | | | | | | | | | |
| | | | |
New Haven CA Unified School District CAB Project (AGC Insured) ¤ | | | 0.00 | % | | | 8-1-2033 | | | $ | 5,590,000 | | | $ | 3,816,293 | |
| | | | |
Northern Humboldt CA High School District Election of 2010 Series A | | | 6.50 | | | | 8-1-2034 | | | | 1,145,000 | | | | 1,271,820 | |
| | | | |
Oakland CA Unified School District Alameda County Election of 2006 Series A | | | 6.50 | | | | 8-1-2020 | | | | 1,730,000 | | | | 1,737,456 | |
| | | | |
Oakland CA Unified School District Alameda County Election of 2009 Series A | | | 6.25 | | | | 8-1-2019 | | | | 1,285,000 | | | | 1,290,089 | |
| | | | |
Oakland CA Unified School District Alameda County Election of 2012 | | | 6.25 | | | | 8-1-2028 | | | | 2,000,000 | | | | 2,211,700 | |
| | | | |
Oakland CA Unified School District Alameda County Election of 2012 | | | 6.25 | | | | 8-1-2030 | | | | 2,000,000 | | | | 2,211,700 | |
| | | | |
Oxnard CA School District Series A (National Insured) | | | 5.75 | | | | 8-1-2030 | | | | 1,825,000 | | | | 2,090,957 | |
| | | | |
Patterson CA Unified School District CAB Election of 2008 Project Series B (AGM Insured) ¤ | | | 0.00 | | | | 8-1-2033 | | | | 3,000,000 | | | | 2,033,910 | |
| | | | |
Peralta CA Community College District Alameda County | | | 5.00 | | | | 8-1-2023 | | | | 3,045,000 | | | | 3,389,999 | |
| | | | |
Peralta CA Community College District Alameda County | | | 5.00 | | | | 8-1-2024 | | | | 3,000,000 | | | | 3,334,110 | |
| | | | |
Rio Hondo CA Community College District ¤ | | | 0.00 | | | | 8-1-2030 | | | | 2,315,000 | | | | 1,790,838 | |
| | | | |
San Diego CA Community College District Election of 2012 | | | 5.00 | | | | 8-1-2032 | | | | 3,095,000 | | | | 3,540,742 | |
| | | | |
San Diego CA Unified School District Election of 1998 Series E-2 (AGM Insured) | | | 5.50 | | | | 7-1-2027 | | | | 5,000,000 | | | | 6,593,050 | |
| | | | |
San Jose CA Libraries & Parks Project | | | 5.13 | | | | 9-1-2031 | | | | 6,110,000 | | | | 6,127,902 | |
| | | | |
State of California Series A4 (Citibank NA LOC) ø | | | 1.53 | | | | 5-1-2034 | | | | 10,000,000 | | | | 10,000,000 | |
| | | | |
Sylvan CA Unified School District CAB Election of 2006 (AGM Insured) ¤ | | | 0.00 | | | | 8-1-2031 | | | | 2,590,000 | | | | 1,875,419 | |
| | | | |
Sylvan CA Unified School District CAB Election of 2006 (AGM Insured) ¤ | | | 0.00 | | | | 8-1-2032 | | | | 2,800,000 | | | | 1,944,348 | |
| | | | |
Tustin CA Unified School District #88-1 Election of 2008 Series B | | | 6.00 | | | | 8-1-2036 | | | | 1,500,000 | | | | 1,651,080 | |
| | | | |
West Contra Costa CA Unified School District Election of 2005 Series C-1 (AGC Insured) ¤ | | | 0.00 | | | | 8-1-2026 | | | | 4,620,000 | | | | 4,018,661 | |
| |
| | | | 103,509,423 | |
| | | | | | | | | | | | | | | | |
| | | | |
| Health Revenue: 1.23% | | | | | | | | | | | | |
| | | | |
California Municipal Finance Authority Institute of Aging Project | | | 5.00 | | | | 8-15-2032 | | | | 975,000 | | | | 1,193,244 | |
| | | | |
California Municipal Finance Authority Institute of Aging Project | | | 5.00 | | | | 8-15-2033 | | | | 1,150,000 | | | | 1,396,641 | |
| | | | |
California Statewide CDA Series C | | | 5.25 | | | | 8-15-2031 | | | | 3,000,000 | | | | 3,239,190 | |
| | | | |
California Tender Option Bond Trust Receipts/Floater Certificates Series 2017-013 (Barclays Bank plc LOC, Barclays Bank plc LIQ) 144Aø | | | 2.02 | | | | 8-15-2051 | | | | 8,710,000 | | | | 8,710,000 | |
| | | | |
University of California Medical Center Prerefunded Bond Series J | | | 5.25 | | | | 5-15-2030 | | | | 13,135,000 | | | | 15,151,091 | |
| | | | |
University of California Medical Center Unrefunded Bond Series J | | | 5.25 | | | | 5-15-2030 | | | | 1,865,000 | | | | 2,131,191 | |
| | | | |
Washington Township CA Health Care District Series A | | | 5.00 | | | | 7-1-2019 | | | | 905,000 | | | | 905,000 | |
| |
| | | | 32,726,357 | |
| | | | | | | | | | | | | | | | |
| | | | |
| Miscellaneous Revenue: 0.90% | | | | | | | | | | | | |
| | | | |
Anaheim CA PFA Convention Center Expansion Project Series A | | | 5.00 | | | | 5-1-2039 | | | | 2,500,000 | | | | 2,852,200 | |
| | | | |
California Public Works Board Various Judicial Council Project Series D | | | 5.25 | | | | 12-1-2026 | | | | 1,000,000 | | | | 1,092,800 | |
| | | | |
California Public Works University of California Board of Regents Series G | | | 5.00 | | | | 12-1-2030 | | | | 12,110,000 | | | | 13,231,870 | |
| | | | |
Foothill De Anza CA Community College District Certificate of Participation | | | 5.00 | | | | 4-1-2033 | | | | 500,000 | | | | 580,445 | |
| | | | |
Gold Coast Transit District California Transit Finance Corporation Certificate of Participation | | | 5.00 | | | | 7-1-2027 | | | | 520,000 | | | | 643,703 | |
| | | | |
Richmond CA Joint Powers Financing Authority Point Potrero Series A | | | 6.25 | | | | 7-1-2024 | | | | 2,700,000 | | | | 2,710,530 | |
| | | | |
San Diego CA PFFA Capital Improvement Projects Series B | | | 5.00 | | | | 10-15-2027 | | | | 500,000 | | | | 613,815 | |
| | | | |
San Diego CA PFFA Capital Improvement Projects Series B | | | 5.00 | | | | 10-15-2028 | | | | 1,000,000 | | | | 1,223,560 | |
| | | | |
Santa Ana CA Financing Authority Police Administration and Holding Facilities Prerefunded Balance Bond (National Insured) | | | 6.25 | | | | 7-1-2019 | | | | 500,000 | | | | 500,000 | |
| | | | |
Santa Ana CA Financing Authority Police Administration and Holding Facilities Unrefunded Balance Bond (National Insured) | | | 6.25 | | | | 7-1-2019 | | | | 500,000 | | | | 500,000 | |
| |
| | | | 23,948,923 | |
| | | | | | | | | | | | | | | | |
Wells Fargo Intermediate Tax/AMT-Free Fund | 13
Portfolio of investments—June 30, 2019
| | | | | | | | | | | | | | | | |
| | | Interest rate | | | Maturity date | | | Principal | | | Value | |
| Tax Revenue: 0.05% | |
| | | | |
San Jose CA RDA Series A-1 | | | 5.50 | % | | | 8-1-2030 | | | $ | 1,355,000 | | | $ | 1,418,400 | |
| | | | | | | | | | | | | | | | |
| | | | |
| Transportation Revenue: 0.38% | | | | | | | | | | | | |
| | | | |
Bay Area CA Toll Authority Toll Bridge Series A (SIFMA Municipal Swap +1.25%)± | | | 3.15 | | | | 4-1-2036 | | | | 9,810,000 | | | | 10,118,230 | |
| | | | | | | | | | | | | | | | |
| | | | |
| Utilities Revenue: 0.78% | | | | | | | | | | | | |
| | | | |
California Municipal Finance Authority | | | 5.00 | | | | 10-1-2025 | | | | 1,500,000 | | | | 1,835,535 | |
| | | | |
M-S-R California Energy Authority Gas Series B | | | 7.00 | | | | 11-1-2034 | | | | 2,000,000 | | | | 2,998,180 | |
| | | | |
M-S-R California Energy Authority Gas Series C | | | 7.00 | | | | 11-1-2034 | | | | 3,000,000 | | | | 4,497,270 | |
| | | | |
Northern California Power Agency Series A | | | 5.25 | | | | 8-1-2023 | | | | 5,150,000 | | | | 5,265,721 | |
| | | | |
Sacramento CA MUD Series B | | | 5.00 | | | | 8-15-2030 | | | | 1,075,000 | | | | 1,229,800 | |
| | | | |
Southern California Public Power Authority Milford Wind Corridor Project #1 | | | 5.00 | | | | 7-1-2024 | | | | 5,000,000 | | | | 5,095,150 | |
| |
| | | | 20,921,656 | |
| | | | | | | | | | | | | | | | |
| | | | |
| Water & Sewer Revenue: 0.37% | | | | | | | | | | | | |
| | | | |
California Department of Water Resources Central Valley Project Series AT (SIFMA Municipal Swap +0.37%)± | | | 2.27 | | | | 12-1-2035 | | | | 10,000,000 | | | | 9,999,600 | |
| | | | | | | | | | | | | | | | |
| |
| | | | 220,872,605 | |
| | | | | | | | | | | | | | | | |
| | | | |
Colorado: 0.70% | | | | | | | | | | | | | | | | |
| | | | |
| Education Revenue: 0.05% | | | | | | | | | | | | |
| | | | |
Colorado ECFA University of Denver Project (National Insured) | | | 5.25 | | | | 3-1-2025 | | | | 1,110,000 | | | | 1,298,034 | |
| | | | | | | | | | | | | | | | |
| | | | |
| GO Revenue: 0.28% | | | | | | | | | | | | |
| | | | |
Adams County CO 12 Five Star Schools Series B | | | 5.00 | | | | 12-15-2028 | | | | 3,800,000 | | | | 4,686,274 | |
| | | | |
Mesa County CO Valley School District # 51 Grand Junction | | | 5.50 | | | | 12-1-2035 | | | | 2,175,000 | | | | 2,755,442 | |
| |
| | | | 7,441,716 | |
| | | | | | | | | | | | | | | | |
| | | | |
| Industrial Development Revenue: 0.12% | | | | | | | | | | | | |
| | | | |
Denver CO Convention Center Hotel Authority Refunding Bond | | | 5.00 | | | | 12-1-2023 | | | | 3,000,000 | | | | 3,367,230 | |
| | | | | | | | | | | | | | | | |
| | | | |
| Miscellaneous Revenue: 0.25% | | | | | | | | | | | | |
| | | | |
Adams County CO Refunding & Improvement Certificate of Participation | | | 5.00 | | | | 12-1-2021 | | | | 830,000 | | | | 900,865 | |
| | | | |
Regents of the University of Colorado Certificate of Participation Series A | | | 5.00 | | | | 11-1-2028 | | | | 5,000,000 | | | | 5,689,050 | |
| |
| | | | 6,589,915 | |
| | | | | | | | | | | | | | | | |
| |
| | | | 18,696,895 | |
| | | | | | | | | | | | | | | | |
| | | | |
Connecticut: 3.32% | | | | | | | | | | | | | | | | |
| | | | |
| Education Revenue: 1.69% | | | | | | | | | | | | |
| | | | |
Connecticut HEFAR Yale University Issue Series A | | | 1.00 | | | | 7-1-2042 | | | | 25,000,000 | | | | 25,000,000 | |
| | | | |
Connecticut HEFAR Yale University Issue Series A | | | 2.05 | | | | 7-1-2035 | | | | 10,000,000 | | | | 10,146,400 | |
| | | | |
Connecticut HEFAR Yale University Issue Series A-2 | | | 2.00 | | | | 7-1-2042 | | | | 3,425,000 | | | | 3,474,252 | |
| | | | |
University of Connecticut Series A | | | 5.00 | | | | 3-15-2027 | | | | 1,000,000 | | | | 1,199,340 | |
| | | | |
University of Connecticut Series A | | | 5.00 | | | | 3-15-2032 | | | | 4,355,000 | | | | 5,116,820 | |
| |
| | | | 44,936,812 | |
| | | | | | | | | | | | | | | | |
| | | | |
| GO Revenue: 0.91% | | | | | | | | | | | | |
| | | | |
Connecticut Series A | | | 5.00 | | | | 3-1-2029 | | | | 2,500,000 | | | | 2,841,075 | |
| | | | |
Connecticut Series B | | | 5.00 | | | | 6-15-2027 | | | | 3,000,000 | | | | 3,522,720 | |
| | | | |
Connecticut Series F | | | 5.00 | | | | 11-15-2032 | | | | 300,000 | | | | 348,510 | |
| | | | |
Hamden CT | | | 4.00 | | | | 8-15-2020 | | | | 1,235,000 | | | | 1,271,087 | |
14 | Wells Fargo Intermediate Tax/AMT-Free Fund
Portfolio of investments—June 30, 2019
| | | | | | | | | | | | | | | | |
| | | Interest rate | | | Maturity date | | | Principal | | | Value | |
| GO Revenue (continued) | | | | | | | | | | | | |
| | | | |
Hamden CT | | | 4.00 | % | | | 8-15-2021 | | | $ | 1,235,000 | | | $ | 1,302,876 | |
| | | | |
Hamden CT (AGM Insured) | | | 5.00 | | | | 8-15-2022 | | | | 1,000,000 | | | | 1,098,190 | |
| | | | |
Hamden CT Prerefunded Bond (AGM Insured) | | | 5.00 | | | | 8-15-2021 | | | | 125,000 | | | | 134,473 | |
| | | | |
Hamden CT Refunding Bond Series A (Build America Mutual Assurance Company Insured) | | | 5.00 | | | | 8-15-2029 | | | | 500,000 | | | | 606,145 | |
| | | | |
Hamden CT Refunding Bond Series A (Build America Mutual Assurance Company Insured) | | | 5.00 | | | | 8-15-2030 | | | | 1,200,000 | | | | 1,440,684 | |
| | | | |
Hamden CT Series A (Build America Mutual Assurance Company Insured) | | | 5.00 | | | | 8-15-2026 | | | | 2,000,000 | | | | 2,388,700 | |
| | | | |
Hamden CT Series A (Build America Mutual Assurance Company Insured) | | | 5.00 | | | | 8-15-2027 | | | | 1,200,000 | | | | 1,447,596 | |
| | | | |
Hamden CT Unrefunded Bond (AGM Insured) | | | 5.00 | | | | 8-15-2021 | | | | 875,000 | | | | 933,765 | |
| | | | |
Hartford CT Series A (AGM Insured) | | | 5.00 | | | | 4-1-2022 | | | | 3,010,000 | | | | 3,292,910 | |
| | | | |
Hartford CT Series A (AGM Insured) | | | 5.00 | | | | 7-1-2026 | | | | 1,000,000 | | | | 1,182,130 | |
| | | | |
Hartford CT Series C (AGM Insured) | | | 5.00 | | | | 7-15-2022 | | | | 2,320,000 | | | | 2,560,213 | |
| |
| | | | 24,371,074 | |
| | | | | | | | | | | | | | | | |
| | | | |
| Health Revenue: 0.36% | | | | | | | | | | | | |
| | | | |
Connecticut HEFA Yale New Haven Hospital Series C (JPMorgan Chase & Company LOC) ø | | | 1.95 | | | | 7-1-2025 | | | | 9,500,000 | | | | 9,500,000 | |
| | | | | | | | | | | | | | | | |
| | | | |
| Miscellaneous Revenue: 0.32% | | | | | | | | | | | | |
| | | | |
Connecticut Series A (SIFMA Municipal Swap +0.85%)± | | | 2.75 | | | | 3-1-2022 | | | | 3,000,000 | | | | 3,022,440 | |
| | | | |
Connecticut Series A (SIFMA Municipal Swap +1.25%)± | | | 3.15 | | | | 4-15-2020 | | | | 3,300,000 | | | | 3,325,047 | |
| | | | |
Connecticut Series G | | | 4.00 | | | | 10-15-2026 | | | | 1,985,000 | | | | 2,117,042 | |
| |
| | | | 8,464,529 | |
| | | | | | | | | | | | | | | | |
| | | | |
| Tax Revenue: 0.04% | | | | | | | | | | | | |
| | | | |
Connecticut Special Tax Obligation Bonds Transportation Infrastructure Purposes Series A | | | 5.00 | | | | 8-1-2030 | | | | 1,000,000 | | | | 1,166,550 | |
| | | | | | | | | | | | | | | | |
| |
| | | | 88,438,965 | |
| | | | | | | | | | | | | | | | |
| | | | |
Delaware: 0.08% | | | | | | | | | | | | | | | | |
| | | | |
| Education Revenue: 0.08% | | | | | | | | | | | | |
| | | | |
Delaware EDA Odyssey Charter School Project Series B 144A | | | 6.75 | | | | 9-1-2035 | | | | 2,000,000 | | | | 2,158,360 | |
| | | | | | | | | | | | | | | | |
| | | | |
District of Columbia: 1.29% | | | | | | | | | | | | | | | | |
| | | | |
| Education Revenue: 0.10% | | | | | | | | | | | | |
| | | | |
District of Columbia Howard University Series A | | | 5.75 | | | | 10-1-2026 | | | | 2,510,000 | | | | 2,628,698 | |
| | | | | | | | | | | | | | | | |
| | | | |
| GO Revenue: 0.53% | | | | | | | | | | | | |
| | | | |
District of Columbia Series 2014C | | | 5.00 | | | | 6-1-2034 | | | | 3,000,000 | | | | 3,449,220 | |
| | | | |
District of Columbia Series 2014C | | | 5.00 | | | | 6-1-2035 | | | | 1,620,000 | | | | 1,859,290 | |
| | | | |
District of Columbia Series 2016A | | | 5.00 | | | | 6-1-2033 | | | | 5,000,000 | | | | 5,977,750 | |
| | | | |
District of Columbia Series 2017A | | | 5.00 | | | | 6-1-2033 | | | | 2,400,000 | | | | 2,928,192 | |
| |
| | | | 14,214,452 | |
| | | | | | | | | | | | | | | | |
| | | | |
| Miscellaneous Revenue: 0.42% | | | | | | | | | | | | |
| | | | |
District of Columbia Federal Highway Grant Anticipation Bond | | | 5.00 | | | | 12-1-2023 | | | | 1,000,000 | | | | 1,113,930 | |
| | | | |
District of Columbia Federal Highway Grant Anticipation Bond | | | 5.00 | | | | 12-1-2025 | | | | 3,520,000 | | | | 3,901,181 | |
| | | | |
District of Columbia Federal Highway Grant Anticipation Bond | | | 5.25 | | | | 12-1-2025 | | | | 2,630,000 | | | | 2,766,970 | |
| | | | |
District of Columbia Medical Association of Colleges Series B | | | 5.00 | | | | 10-1-2024 | | | | 3,095,000 | | | | 3,309,360 | |
| |
| | | | 11,091,441 | |
| | | | | | | | | | | | | | | | |
Wells Fargo Intermediate Tax/AMT-Free Fund | 15
Portfolio of investments—June 30, 2019
| | | | | | | | | | | | | | | | |
| | | Interest rate | | | Maturity date | | | Principal | | | Value | |
| Transportation Revenue: 0.14% | |
| | | | |
Washington Metropolitan Area Transit Authority Series B | | | 5.00 | % | | | 7-1-2032 | | | $ | 3,000,000 | | | $ | 3,658,560 | |
| | | | | | | | | | | | | | | | |
| | | | |
| Water & Sewer Revenue: 0.10% | | | | | | | | | | | | |
| | | | |
District of Columbia Water & Sewer Authority Public Utility Senior Lien Series A | | | 5.00 | | | | 10-1-2037 | | | | 2,260,000 | | | | 2,753,810 | |
| | | | | | | | | | | | | | | | |
| |
| | | | 34,346,961 | |
| | | | | | | | | | | | | | | | |
| | | | |
Florida: 4.87% | | | | | | | | | | | | | | | | |
| | | | |
| Airport Revenue: 0.09% | | | | | | | | | | | | |
| | | | |
Jacksonville FL Port Authority Series B | | | 5.00 | | | | 11-1-2035 | | | | 2,045,000 | | | | 2,489,072 | |
| | | | | | | | | | | | | | | | |
| | | | |
| Education Revenue: 0.06% | | | | | | | | | | | | |
| | | | |
Florida Development Finance Corporation Renaissance Charter School Series A | | | 5.00 | | | | 9-15-2020 | | | | 665,000 | | | | 670,766 | |
| | | | |
Florida HEFAR | | | 4.00 | | | | 4-1-2021 | | | | 1,000,000 | | | | 1,042,940 | |
| |
| | | | 1,713,706 | |
| | | | | | | | | | | | | | | | |
| | | | |
| GO Revenue: 0.05% | | | | | | | | | | | | |
| | | | |
Plantation FL Ad Valorem Bond | | | 5.00 | | | | 7-1-2031 | | | | 1,155,000 | | | | 1,417,924 | |
| | | | | | | | | | | | | | | | |
| | | | |
| Health Revenue: 1.07% | | | | | | | | | | | | |
| | | | |
ACTS Retirement Life Communities Incorporated Obligated Group Escambia County Health Facilities Authority Refunding Bonds Series 2003B (AGC Insured, TD Bank NA SPA) ø | | | 2.05 | | | | 11-15-2029 | | | | 2,400,000 | | | | 2,400,000 | |
| | | | |
Florida Health System Lee Memorial Hospital Series A | | | 5.00 | | | | 4-1-2036 | | | | 4,500,000 | | | | 5,442,930 | |
| | | | |
Jacksonville FL HCFR Baptist Health Series D ø | | | 1.85 | | | | 8-1-2036 | | | | 13,000,000 | | | | 13,000,000 | |
| | | | |
Jacksonville FL HCFR Baptist Health Series E ø | | | 1.85 | | | | 8-1-2036 | | | | 5,000,000 | | | | 5,000,000 | |
| | | | |
Miami-Dade County FL Health Facilities Authority Nicklaus Children’s Hospital Project | | | 5.00 | | | | 8-1-2031 | | | | 500,000 | | | | 598,605 | |
| | | | |
Miami-Dade County FL Health Facilities Authority Nicklaus Children’s Hospital Project | | | 5.00 | | | | 8-1-2033 | | | | 1,645,000 | | | | 1,954,869 | |
| |
| | | | 28,396,404 | |
| | | | | | | | | | | | | | | | |
| | | | |
| Industrial Development Revenue: 0.12% | | | | | | | | | | | | |
| | | | |
Saint Lucie County FL Florida Power & Light Company ø | | | 1.93 | | | | 9-1-2028 | | | | 3,100,000 | | | | 3,100,000 | |
| | | | | | | | | | | | | | | | |
| | | | |
| Miscellaneous Revenue: 2.06% | | | | | | | | | | | | |
| | | | |
Boynton FL PFA Capital Improvement Series 2018 | | | 4.00 | | | | 7-1-2030 | | | | 2,090,000 | | | | 2,344,144 | |
| | | | |
Boynton FL PFA Capital Improvement Series 2018 | | | 5.00 | | | | 7-1-2035 | | | | 3,590,000 | | | | 4,317,047 | |
| | | | |
Broward County FL School Board Certificate of Participation Series A | | | 5.00 | | | | 7-1-2024 | | | | 5,000,000 | | | | 5,851,550 | |
| | | | |
Cityplace Florida Community Development District Special Assessment | | | 5.00 | | | | 5-1-2021 | | | | 2,945,000 | | | | 3,122,407 | |
| | | | |
Duval County FL School Board Certificate of Participation Series B | | | 5.00 | | | | 7-1-2028 | | | | 2,500,000 | | | | 2,939,700 | |
| | | | |
Duval County FL School Board Certificate of Participation Series B | | | 5.00 | | | | 7-1-2029 | | | | 5,000,000 | | | | 5,876,700 | |
| | | | |
Miami-Dade County FL School Board Certificate of Participation Series A | | | 5.00 | | | | 5-1-2031 | | | | 3,000,000 | | | | 3,445,230 | |
| | | | |
Miami-Dade County FL School Board Certificate of Participation Series D | | | 5.00 | | | | 11-1-2027 | | | | 6,600,000 | | | | 7,650,522 | |
| | | | |
Monroe County FL School Board Certificate of Participation Series A | | | 5.00 | | | | 6-1-2034 | | | | 1,500,000 | | | | 1,797,045 | |
| | | | |
Monroe County FL School Board Certificate of Participation Series A | | | 5.00 | | | | 6-1-2035 | | | | 1,000,000 | | | | 1,194,210 | |
| | | | |
Orange County FL School Board Certificate of Participation Series C | | | 5.00 | | | | 8-1-2029 | | | | 2,000,000 | | | | 2,366,900 | |
| | | | |
Orlando FL Senior Tourist Development 6th Cent Contract Payment Bond Series A (AGM Insured) | | | 5.00 | | | | 11-1-2032 | | | | 2,000,000 | | | | 2,421,060 | |
| | | | |
Orlando FL Senior Tourist Development 6th Cent Contract Payment Bond Series A (AGM Insured) | | | 5.00 | | | | 11-1-2033 | | | | 4,500,000 | | | | 5,430,330 | |
| | | | |
Orlando FL Senior Tourist Development 6th Cent Contract Payment Bond Series A (AGM Insured) | | | 5.00 | | | | 11-1-2034 | | | | 600,000 | | | | 719,952 | |
| | | | |
Palm Beach County FL Refunding Bond | | | 5.00 | | | | 5-1-2029 | | | | 2,000,000 | | | | 2,425,320 | |
16 | Wells Fargo Intermediate Tax/AMT-Free Fund
Portfolio of investments—June 30, 2019
| | | | | | | | | | | | | | | | |
| | | Interest rate | | | Maturity date | | | Principal | | | Value | |
| Miscellaneous Revenue (continued) | | | | | | | | | | | | |
| | | | |
University of South Florida Financing Corporation Certificate of Participation Master Lease Program Series A | | | 5.00 | % | | | 7-1-2022 | | | $ | 1,730,000 | | | $ | 1,908,571 | |
| | | | |
University of South Florida Financing Corporation Certificate of Participation Master Lease Program Series A | | | 5.00 | | | | 7-1-2023 | | | | 815,000 | | | | 922,645 | |
| |
| | | | 54,733,333 | |
| | | | | | | | | | | | | | | | |
| | | | |
| Tax Revenue: 0.69% | | | | | | | | | | | | |
| | | | |
Miami-Dade County FL Public Services (AGM Insured) | | | 4.00 | | | | 10-1-2019 | | | | 3,440,000 | | | | 3,462,188 | |
| | | | |
Miami-Dade County FL Public Services (AGM Insured) | | | 4.00 | | | | 10-1-2020 | | | | 3,600,000 | | | | 3,717,540 | |
| | | | |
Miami-Dade County FL Public Services (AGM Insured) | | | 4.00 | | | | 4-1-2021 | | | | 2,485,000 | | | | 2,597,421 | |
| | | | |
Miami-Dade County FL Special Obligation Series A | | | 5.00 | | | | 10-1-2023 | | | | 700,000 | | | | 777,707 | |
| | | | |
Polk County FL School District | | | 5.00 | | | | 10-1-2033 | | | | 2,900,000 | | | | 3,675,257 | |
| | | | |
Tampa FL Sports Authority Stadium Project | | | 5.00 | | | | 1-1-2025 | | | | 3,550,000 | | | | 4,211,614 | |
| |
| | | | 18,441,727 | |
| | | | | | | | | | | | | | | | |
| | | | |
| Transportation Revenue: 0.45% | | | | | | | | | | | | |
| | | | |
Florida Department of Transportation Turnpike System Series A | | | 5.00 | | | | 7-1-2023 | | | | 3,910,000 | | | | 4,470,538 | |
| | | | |
Florida Department of Transportation Turnpike System Series A | | | 5.00 | | | | 7-1-2025 | | | | 4,950,000 | | | | 5,976,482 | |
| | | | |
Florida Mid-Bay Bridge Authority Series A | | | 5.00 | | | | 10-1-2025 | | | | 1,250,000 | | | | 1,465,588 | |
| |
| | | | 11,912,608 | |
| | | | | | | | | | | | | | | | |
| | | | |
| Utilities Revenue: 0.19% | | | | | | | | | | | | |
| | | | |
Escambia County FL Pollution Control Gulf Power Company Project ø | | | 1.98 | | | | 7-1-2022 | | | | 5,000,000 | | | | 5,000,000 | |
| | | | | | | | | | | | | | | | |
| | | | |
| Water & Sewer Revenue: 0.09% | | | | | | | | | | | | |
| | | | |
Daytona Beach FL Utility System (AGM Insured) | | | 5.00 | | | | 11-1-2022 | | | | 2,205,000 | | | | 2,454,209 | |
| | | | | | | | | | | | | | | | |
| |
| | | | 129,658,983 | |
| | | | | | | | | | | | | | | | |
| | | | |
Georgia: 2.53% | | | | | | | | | | | | | | | | |
| | | | |
| Education Revenue: 0.13% | | | | | | | | | | | | |
| | | | |
Private Colleges & Universities Authority of Georgia Series A | | | 5.00 | | | | 10-1-2021 | | | | 3,330,000 | | | | 3,564,432 | |
| | | | | | | | | | | | | | | | |
| | | | |
| Health Revenue: 0.40% | | | | | | | | | | | | |
| | | | |
Georgia Tender Option Bond Trust Receipts/Floater CertificatesSeries 2015-XF1016 (Barclays Bank plc LIQ) 144Aø | | | 1.95 | | | | 8-15-2049 | | | | 10,520,000 | | | | 10,520,000 | |
| | | | | | | | | | | | | | | | |
| | | | |
| Industrial Development Revenue: 0.08% | | | | | | | | | | | | |
| | | | |
Monroe County GA PCR Georgia Power Company Plant Scherer Project | | | 2.35 | | | | 10-1-2048 | | | | 2,000,000 | | | | 2,019,560 | |
| | | | | | | | | | | | | | | | |
| | | | |
| Utilities Revenue: 1.92% | | | | | | | | | | | | |
| | | | |
Burke County GA Development Authority Georgia Power Company Plant Vogtle Project | | | 2.25 | | | | 10-1-2032 | | | | 4,800,000 | | | | 4,842,144 | |
| | | | |
Burke County GA Development Authority Oglethorpe Power Corporation Vogtle Project Series E | | | 3.25 | | | | 11-1-2045 | | | | 6,000,000 | | | | 6,212,820 | |
| | | | |
Floyd County GA PCR Georgia Power Company Plant Hammond Project | | | 2.35 | | | | 7-1-2022 | | | | 1,000,000 | | | | 1,009,780 | |
| | | | |
Georgia Public Gas Partners Incorporated Series A | | | 5.00 | | | | 10-1-2019 | | | | 5,000,000 | | | | 5,042,250 | |
| | | | |
Main Street Natural Gas Incorporated Georgia Gas Project Series A | | | 5.00 | | | | 5-15-2029 | | | | 2,600,000 | | | | 3,220,932 | |
| | | | |
Main Street Natural Gas Incorporated Georgia Gas Project Series A | | | 5.50 | | | | 9-15-2022 | | | | 1,000,000 | | | | 1,113,180 | |
| | | | |
Main Street Natural Gas Incorporated Georgia Gas Project Series B | | | 4.00 | | | | 8-1-2049 | | | | 10,000,000 | | | | 11,093,100 | |
| | | | |
Main Street Natural Gas Incorporated Georgia Gas Project Series C | | | 4.00 | | | | 8-1-2048 | | | | 2,500,000 | | | | 2,731,325 | |
| | | | |
Main Street Natural Gas Incorporated Georgia Gas Project Subordinate Bond Series A (Royal Bank of Canada LIQ) | | | 4.00 | | | | 4-1-2048 | | | | 5,500,000 | | | | 5,989,610 | |
Wells Fargo Intermediate Tax/AMT-Free Fund | 17
Portfolio of investments—June 30, 2019
| | | | | | | | | | | | | | | | |
| | | Interest rate | | | Maturity date | | | Principal | | | Value | |
| Utilities Revenue (continued) | | | | | | | | | | | | |
| | | | |
Main Street Natural Gas Incorporated Georgia Gas Project Subordinate Bond Series B (1 Month LIBOR +0.75%)± | | | 2.39 | % | | | 4-1-2048 | | | $ | 10,000,000 | | | $ | 9,891,100 | |
| |
| | | | 51,146,241 | |
| | | | | | | | | | | | | | | | |
| |
| | | | 67,250,233 | |
| | | | | | | | | | | | | | | | |
| | | | |
Guam: 0.27% | | | | | | | | | | | | | | | | |
| | | | |
| Airport Revenue: 0.10% | | | | | | | | | | | | |
| | | | |
Guam International Airport Authority | | | 5.00 | | | | 10-1-2022 | | | | 1,000,000 | | | | 1,080,240 | |
| | | | |
Guam International Airport Authority | | | 5.00 | | | | 10-1-2023 | | | | 1,500,000 | | | | 1,601,790 | |
| |
| | | | 2,682,030 | |
| | | | | | | | | | | | | | | | |
| | | | |
| Tax Revenue: 0.05% | | | | | | | | | | | | |
| | | | |
Guam Government Business Privilege Tax Bond Series A | | | 5.00 | | | | 1-1-2020 | | | | 1,365,000 | | | | 1,385,161 | |
| | | | | | | | | | | | | | | | |
| | | | |
| Water & Sewer Revenue: 0.12% | | | | | | | | | | | | |
| | | | |
Guam Government Waterworks Authority | | | 5.25 | | | | 7-1-2020 | | | | 350,000 | | | | 360,822 | |
| | | | |
Guam Government Waterworks Authority | | | 5.25 | | | | 7-1-2033 | | | | 2,500,000 | | | | 2,723,700 | |
| |
| | | | 3,084,522 | |
| | | | | | | | | | | | | | | | |
| |
| | | | 7,151,713 | |
| | | | | | | | | | | | | | | | |
| | | | |
Hawaii: 0.38% | | | | | | | | | | | | | | | | |
| | | | |
| GO Revenue: 0.38% | | | | | | | | | | | | |
| | | | |
Honolulu HI Rail Transit Project Series H (SIFMA Municipal Swap +0.30%)± | | | 2.20 | | | | 9-1-2022 | | | | 2,500,000 | | | | 2,499,500 | |
| | | | |
Honolulu HI Rail Transit Project Series H (SIFMA Municipal Swap +0.32%)± | | | 2.22 | | | | 9-1-2025 | | | | 2,500,000 | | | | 2,499,500 | |
| | | | |
Honolulu HI Rail Transit Project Series H (SIFMA Municipal Swap +0.32%)± | | | 2.22 | | | | 9-1-2028 | | | | 5,000,000 | | | | 4,999,000 | |
| |
| | | | 9,998,000 | |
| | | | | | | | | | | | | | | | |
| | | | |
Illinois: 14.60% | | | | | | | | | | | | | | | | |
| | | | |
| Airport Revenue: 1.31% | | | | | | | | | | | | |
| | | | |
Chicago IL O’Hare International Airport Senior Lien (AGM Insured) | | | 5.13 | | | | 1-1-2030 | | | | 2,610,000 | | | | 2,909,210 | |
| | | | |
Chicago IL O’Hare International Airport Senior Lien (AGM Insured) | | | 5.13 | | | | 1-1-2031 | | | | 3,335,000 | | | | 3,711,321 | |
| | | | |
Chicago IL O’Hare International Airport Senior Lien | | | 5.25 | | | | 1-1-2032 | | | | 8,755,000 | | | | 9,735,823 | |
| | | | |
Chicago IL O’Hare International Airport Senior Lien Series B | | | 5.00 | | | | 1-1-2030 | | | | 8,000,000 | | | | 9,248,720 | |
| | | | |
Chicago IL O’Hare International Airport Senior Lien Series B | | | 5.00 | | | | 1-1-2036 | | | | 1,500,000 | | | | 1,824,270 | |
| | | | |
Chicago IL O’Hare International Airport Third Lien Series C (AGC Insured) | | | 5.25 | | | | 1-1-2025 | | | | 4,075,000 | | | | 4,153,485 | |
| | | | |
Chicago IL O’Hare International Airport Third Lien Series F | | | 4.25 | | | | 1-1-2021 | | | | 735,000 | | | | 745,268 | |
| | | | |
Peoria IL Metropolitan Airport Authority Series D | | | 5.00 | | | | 12-1-2027 | | | | 2,250,000 | | | | 2,708,753 | |
| |
| | | | 35,036,850 | |
| | | | | | | | | | | | | | | | |
| | | | |
| Education Revenue: 0.63% | | | | | | | | | | | | |
| | | | |
Illinois Finance Authority Academic Facilities University of Illinois at Urbana-Champaign Project Series A | | | 5.00 | | | | 10-1-2026 | | | | 450,000 | | | | 541,683 | |
| | | | |
Illinois Finance Authority Academic Facilities University of Illinois at Urbana-Champaign Project Series A | | | 5.00 | | | | 10-1-2031 | | | | 400,000 | | | | 495,680 | |
| | | | |
Illinois Finance Authority Academic Facilities University of Illinois at Urbana-Champaign Project Series A | | | 5.00 | | | | 10-1-2039 | | | | 700,000 | | | | 842,940 | |
| | | | |
Illinois Finance Authority Bradley University Project Series C | | | 5.00 | | | | 8-1-2032 | | | | 1,250,000 | | | | 1,469,575 | |
| | | | |
Illinois Finance Authority Student Housing Illinois State University Project | | | 5.50 | | | | 4-1-2021 | | | | 1,930,000 | | | | 2,010,192 | |
| | | | |
Illinois Finance Authority Wesleyan University | | | 5.00 | | | | 9-1-2026 | | | | 680,000 | | | | 805,331 | |
18 | Wells Fargo Intermediate Tax/AMT-Free Fund
Portfolio of investments—June 30, 2019
| | | | | | | | | | | | | | | | |
| | | Interest rate | | | Maturity date | | | Principal | | | Value | |
| Education Revenue (continued) | | | | | | | | | | | | |
| | | | |
Northern Illinois University Board of Trustees Certificate of Participation (AGM Insured) | | | 5.00 | % | | | 9-1-2022 | | | $ | 1,325,000 | | | $ | 1,452,982 | |
| | | | |
Northern Illinois University Board of Trustees Certificate of Participation (AGM Insured) | | | 5.00 | | | | 9-1-2024 | | | | 1,000,000 | | | | 1,142,100 | |
| | | | |
University of Illinois Auxiliary Facilities Systems CAB ¤ | | | 0.00 | | | | 4-1-2020 | | | | 8,270,000 | | | | 8,152,731 | |
| |
| | | | 16,913,214 | |
| | | | | | | | | | | | | | | | |
| | | | |
| GO Revenue: 4.55% | | | | | | | | | | | | |
| | | | |
Bolingbrook, Will & DuPage Counties IL Series A (AGM Insured) | | | 5.00 | | | | 1-1-2023 | | | | 650,000 | | | | 719,440 | |
| | | | |
Chicago IL Board of Education CAB School Reform Series B-1 (National Insured) ¤ | | | 0.00 | | | | 12-1-2025 | | | | 3,380,000 | | | | 2,809,862 | |
| | | | |
Chicago IL Board of Education CAB School Reform Series B-1 (National Insured) ¤ | | | 0.00 | | | | 12-1-2026 | | | | 4,030,000 | | | | 3,243,747 | |
| | | | |
Chicago IL Board of Education Series F | | | 5.00 | | | | 12-1-2020 | | | | 2,375,000 | | | | 2,473,800 | |
| | | | |
Chicago IL CAB Series C ¤ | | | 0.00 | | | | 1-1-2023 | | | | 2,500,000 | | | | 2,259,575 | |
| | | | |
Chicago IL Metropolitan Reclamation Series B | | | 5.00 | | | | 12-1-2025 | | | | 2,500,000 | | | | 2,706,000 | |
| | | | |
Chicago IL Park District Series A | | | 5.00 | | | | 1-1-2036 | | | | 2,250,000 | | | | 2,367,585 | |
| | | | |
Chicago IL Park District Series B | | | 5.00 | | | | 1-1-2021 | | | | 3,765,000 | | | | 3,933,408 | |
| | | | |
Chicago IL Park District Series B (Build America Mutual Assurance Company Insured) | | | 5.00 | | | | 1-1-2029 | | | | 2,000,000 | | | | 2,235,500 | |
| | | | |
Chicago IL Park District Series C | | | 5.00 | | | | 1-1-2022 | | | | 1,615,000 | | | | 1,725,531 | |
| | | | |
Chicago IL Series A | | | 5.00 | | | | 1-1-2025 | | | | 750,000 | | | | 817,845 | |
| | | | |
Chicago IL Series C | | | 4.00 | | | | 1-1-2020 | | | | 1,505,000 | | | | 1,518,620 | |
| | | | |
Chicago IL Series C | | | 5.00 | | | | 1-1-2026 | | | | 5,000,000 | | | | 5,605,500 | |
| | | | |
Chicago IL Series G (Ambac Insured) | | | 5.00 | | | | 12-1-2024 | | | | 13,465,000 | | | | 13,517,917 | |
| | | | |
Cook County IL | | | 5.00 | | | | 11-15-2035 | | | | 1,300,000 | | | | 1,463,397 | |
| | | | |
Cook County IL Community College District #508 | | | 5.25 | | | | 12-1-2025 | | | | 1,425,000 | | | | 1,553,977 | |
| | | | |
Cook County IL Community College District #508 | | | 5.25 | | | | 12-1-2027 | | | | 1,295,000 | | | | 1,401,410 | |
| | | | |
Cook County IL Community College District #508 | | | 5.25 | | | | 12-1-2028 | | | | 1,250,000 | | | | 1,346,588 | |
| | | | |
Cook County IL Community College District #508 | | | 5.25 | | | | 12-1-2030 | | | | 3,000,000 | | | | 3,210,030 | |
| | | | |
Cook County IL Community College District #508 | | | 5.25 | | | | 12-1-2031 | | | | 3,200,000 | | | | 3,415,232 | |
| | | | |
Cook County IL Series A | | | 5.00 | | | | 11-15-2031 | | | | 1,000,000 | | | | 1,139,120 | |
| | | | |
Cook County IL Series A | | | 5.25 | | | | 11-15-2022 | | | | 7,240,000 | | | | 7,590,416 | |
| | | | |
Cook County IL Series A | | | 5.25 | | | | 11-15-2023 | | | | 7,680,000 | | | | 8,049,869 | |
| | | | |
Cook County IL Series A | | | 5.25 | | | | 11-15-2024 | | | | 2,200,000 | | | | 2,360,996 | |
| | | | |
Cook County IL Series B | | | 5.00 | | | | 11-15-2023 | | | | 600,000 | | | | 675,744 | |
| | | | |
Cook County IL Series C | | | 5.00 | | | | 11-15-2021 | | | | 1,460,000 | | | | 1,568,566 | |
| | | | |
Cook County IL Series C | | | 5.00 | | | | 11-15-2024 | | | | 2,175,000 | | | | 2,388,041 | |
| | | | |
Cook County IL Series C | | | 5.00 | | | | 11-15-2025 | | | | 2,450,000 | | | | 2,679,737 | |
| | | | |
DuPage, Cook & Will Counties IL Community College District #502 Series A | | | 5.00 | | | | 6-1-2022 | | | | 2,650,000 | | | | 2,920,141 | |
| | | | |
Homer, Glen, Will & Cook Village Counties IL Series A | | | 4.00 | | | | 12-1-2019 | | | | 1,000,000 | | | | 1,010,800 | |
| | | | |
Homer, Glen, Will & Cook Village Counties IL Series A | | | 5.00 | | | | 12-1-2021 | | | | 1,015,000 | | | | 1,030,266 | |
| | | | |
Illinois (AGM Insured) | | | 5.00 | | | | 1-1-2023 | | | | 2,450,000 | | | | 2,491,062 | |
| | | | |
Illinois (AGM Insured) | | | 5.00 | | | | 4-1-2026 | | | | 5,000,000 | | | | 5,633,850 | |
| | | | |
Illinois | | | 4.75 | | | | 4-1-2020 | | | | 2,650,000 | | | | 2,655,698 | |
| | | | |
Illinois Series A | | | 5.00 | | | | 4-1-2023 | | | | 4,500,000 | | | | 4,938,795 | |
| | | | |
Illinois Series A (AGM Insured) | | | 5.00 | | | | 4-1-2024 | | | | 2,500,000 | | | | 2,766,775 | |
| | | | |
Kane, Cook & DuPage Counties IL School District #46 Prerefunded Balance Bond Series B | | | 4.50 | | | | 1-1-2024 | | | | 1,170,000 | | | | 1,259,599 | |
| | | | |
Kane, Cook & DuPage Counties IL School District #46 Unrefunded Balance Bond Series B | | | 4.50 | | | | 1-1-2024 | | | | 3,100,000 | | | | 3,316,008 | |
| | | | |
Kendall, Kane & Will Counties IL Unified School District Series A | | | 5.00 | | | | 2-1-2023 | | | | 1,000,000 | | | | 1,052,950 | |
| | | | |
McHenry & Kane Counties IL Community Consolidated School District #158 | | | 5.63 | | | | 1-15-2031 | | | | 2,000,000 | | | | 2,177,960 | |
Wells Fargo Intermediate Tax/AMT-Free Fund | 19
Portfolio of investments—June 30, 2019
| | | | | | | | | | | | | | | | |
| | | Interest rate | | | Maturity date | | | Principal | | | Value | |
| | | | |
| GO Revenue (continued) | | | | | | | | | | | | |
| | | | |
McHenry & Lake Counties IL Community Consolidated School District #26 (AGM Insured) | | | 5.00 | % | | | 2-1-2020 | | | $ | 1,455,000 | | | $ | 1,485,162 | |
| | | | |
Springfield IL | | | 5.00 | | | | 12-1-2021 | | | | 850,000 | | | | 910,818 | |
| | | | |
Springfield IL | | | 5.00 | | | | 12-1-2023 | | | | 570,000 | | | | 640,902 | |
| | | | |
Stephenson County IL School District #145 Series A (AGM Insured) | | | 5.00 | | | | 2-1-2033 | | | | 750,000 | | | | 899,880 | |
| | | | |
Waukegan IL Series B (AGM Insured) | | | 4.00 | | | | 12-30-2024 | | | | 1,030,000 | | | | 1,138,418 | |
| |
| | | | 121,106,537 | |
| | | | | | | | | | | | | | | | |
| | | | |
| Health Revenue: 0.14% | | | | | | | | | | | | |
| | | | |
Illinois Development Finance Authority Evanston Northwestern Healthcare Corporation Series B (JPMorgan Chase & Company SPA) ø | | | 1.95 | | | | 5-1-2031 | | | | 1,250,000 | | | | 1,250,000 | |
| | | | |
Illinois Finance Authority Ann & Robert H. Laurie Children’s Hospital Project of Chicago | | | 5.00 | | | | 8-15-2034 | | | | 1,000,000 | | | | 1,192,870 | |
| | | | |
Illinois Finance Authority Edward Elmhurst Healthcare Series A | | | 5.00 | | | | 1-1-2026 | | | | 1,000,000 | | | | 1,174,320 | |
| |
| | | | 3,617,190 | |
| | | | | | | | | | | | | | | | |
| | | | |
| Miscellaneous Revenue: 0.80% | | | | | | | | | | | | |
| | | | |
Chicago IL Board of Education Series C | | | 5.00 | | | | 12-1-2021 | | | | 5,000,000 | | | | 5,260,700 | |
| | | | |
Illinois | | | 5.00 | | | | 7-1-2023 | | | | 5,065,000 | | | | 5,589,025 | |
| | | | |
Illinois | | | 5.00 | | | | 8-1-2024 | | | | 1,000,000 | | | | 1,075,560 | |
| | | | |
Illinois | | | 5.50 | | | | 7-1-2026 | | | | 2,300,000 | | | | 2,553,138 | |
| | | | |
Peoria IL Public Building Commission Illinois School District Facilities Refunding Bond (Build America Mutual Assurance Company Insured) | | | 5.00 | | | | 12-1-2023 | | | | 4,040,000 | | | | 4,602,974 | |
| | | | |
Peoria IL Public Building Commission Illinois School District Facilities Refunding Bond (Build America Mutual Assurance Company Insured) | | | 5.00 | | | | 12-1-2024 | | | | 1,000,000 | | | | 1,165,740 | |
| | | | |
University of Illinois Board of Trustees Certificate of Participation Unrefunded Bond Series B (AGM Insured) | | | 5.00 | | | | 10-1-2020 | | | | 955,000 | | | | 957,502 | |
| |
| | | | 21,204,639 | |
| | | | | | | | | | | | | | | | |
| | | | |
| Tax Revenue: 5.82% | | | | | | | | | | | | |
| | | | |
Chicago IL Sales Tax Refunding Bond | | | 5.00 | | | | 1-1-2026 | | | | 5,140,000 | | | | 6,097,788 | |
| | | | |
Chicago IL Sales Tax Refunding Bond | | | 5.00 | | | | 1-1-2027 | | | | 3,000,000 | | | | 3,559,020 | |
| | | | |
Chicago IL Sales Tax Refunding Bond | | | 5.00 | | | | 1-1-2030 | | | | 2,075,000 | | | | 2,461,656 | |
| | | | |
Chicago IL Sales Tax Securitization Bond Series C | | | 5.00 | | | | 1-1-2027 | | | | 3,500,000 | | | | 4,128,180 | |
| | | | |
Chicago IL Sales Tax Securitization Bond Series C | | | 5.25 | | | | 1-1-2035 | | | | 4,700,000 | | | | 5,602,494 | |
| | | | |
Chicago IL Transit Authority Sales Tax Receipts | | | 5.25 | | | | 12-1-2027 | | | | 2,600,000 | | | | 2,797,210 | |
| | | | |
Cook County IL Sales Tax Bond | | | 5.00 | | | | 11-15-2033 | | | | 4,000,000 | | | | 4,732,680 | |
| | | | |
Cook County IL Sales Tax Bond | | | 5.25 | | | | 11-15-2035 | | | | 2,000,000 | | | | 2,387,780 | |
| | | | |
Illinois | | | 5.00 | | | | 6-15-2023 | | | | 16,150,000 | | | | 17,694,909 | |
| | | | |
Illinois Junior Obligation | | | 5.00 | | | | 6-15-2025 | | | | 6,000,000 | | | | 6,551,160 | |
| | | | |
Illinois Regional Transportation Authority (National Insured) | | | 6.50 | | | | 7-1-2026 | | | | 8,615,000 | | | | 10,829,830 | |
| | | | |
Illinois Sales Tax Revenue Build Illinois Bond | | | 5.00 | | | | 6-15-2029 | | | | 1,000,000 | | | | 1,049,130 | |
| | | | |
Illinois Series A | | | 5.00 | | | | 1-1-2027 | | | | 10,625,000 | | | | 11,247,200 | |
| | | | |
Illinois Sports Facilities Authority State Tax Supported Refunding Bond (AGM Insured) | | | 5.00 | | | | 6-15-2028 | | | | 2,500,000 | | | | 2,795,450 | |
| | | | |
Illinois Sports Facilities Authority State Tax Supported Refunding Bond (AGM Insured) | | | 5.25 | | | | 6-15-2030 | | | | 4,000,000 | | | | 4,487,640 | |
| | | | |
Illinois Sports Facilities Authority State Tax Supported Refunding Bond (AGM Insured) | | | 5.25 | | | | 6-15-2032 | | | | 3,000,000 | | | | 3,346,140 | |
| | | | |
Illinois Tender Option Bond Trust Receipts/Floater Certificates Series 2018-XF0603 (Royal Bank of Canada LIQ) 144Aø | | | 2.05 | | | | 1-1-2026 | | | | 2,265,000 | | | | 2,265,000 | |
| | | | |
Illinois Tender Option Bond Trust Receipts/Floater Certificates Series 2018-XM0713 (Morgan Stanley Bank LIQ) 144Aø | | | 2.05 | | | | 1-1-2043 | | | | 17,000,000 | | | | 17,000,000 | |
20 | Wells Fargo Intermediate Tax/AMT-Free Fund
Portfolio of investments—June 30, 2019
| | | | | | | | | | | | | | | | |
| | | Interest rate | | | Maturity date | | | Principal | | | Value | |
| Tax Revenue (continued) | | | | | | | | | | | | |
| | | | |
Metropolitan Pier & Exposition Authority CAB McCormick Place Expansion Project Series A (National Insured) ¤ | | | 0.00 | % | | | 12-15-2029 | | | $ | 35,200,000 | | | $ | 25,879,040 | |
| | | | |
Metropolitan Pier & Exposition Authority CAB McCormick Place Expansion Project Series A (National Insured) ¤ | | | 0.00 | | | | 12-15-2030 | | | | 12,800,000 | | | | 9,007,872 | |
| | | | |
Metropolitan Pier & Exposition Authority CAB McCormick Place Expansion Project Series B (National Insured) ¤ | | | 0.00 | | | | 6-15-2029 | | | | 10,000,000 | | | | 7,501,000 | |
| | | | |
Metropolitan Pier & Exposition Authority McCormick Place Expansion Project Series B | | | 5.00 | | | | 12-15-2028 | | | | 1,945,000 | | | | 2,072,825 | |
| | | | |
Southwestern Illinois Development Authority Local Government Program Collinsville Limited | | | 5.00 | | | | 3-1-2025 | | | | 1,875,000 | | | | 1,541,438 | |
| |
| | | | 155,035,442 | |
| | | | | | | | | | | | | | | | |
| | | | |
| Tobacco Revenue: 0.13% | | | | | | | | | | | | |
| | | | |
Railsplitter IL Tobacco Settlement Authority | | | 5.00 | | | | 6-1-2024 | | | | 3,000,000 | | | | 3,449,220 | |
| | | | | | | | | | | | | | | | |
| | | | |
| Transportation Revenue: 0.15% | | | | | | | | | | | | |
| | | | |
Illinois Toll Highway Authority Series A-1 | | | 5.25 | | | | 1-1-2026 | | | | 3,850,000 | | | | 3,922,226 | |
| | | | | | | | | | | | | | | | |
| | | | |
| Utilities Revenue: 0.14% | | | | | | | | | | | | |
| | | | |
Illinois Finance Authority Clean Water Initiative Revolving Fund Bond | | | 5.25 | | | | 7-1-2035 | | | | 3,000,000 | | | | 3,806,250 | |
| | | | | | | | | | | | | | | | |
| | | | |
| Water & Sewer Revenue: 0.93% | | | | | | | | | | | | |
| | | | |
Chicago IL Second Lien | | | 5.00 | | | | 11-1-2022 | | | | 1,730,000 | | | | 1,907,706 | |
| | | | |
Chicago IL Second Lien | | | 5.00 | | | | 11-1-2023 | | | | 1,515,000 | | | | 1,666,545 | |
| | | | |
Chicago IL Second Lien | | | 5.00 | | | | 11-1-2025 | | | | 620,000 | | | | 678,206 | |
| | | | |
Chicago IL Second Lien | | | 5.00 | | | | 11-1-2026 | | | | 2,000,000 | | | | 2,188,680 | |
| | | | |
Chicago IL Second Lien | | | 5.00 | | | | 11-1-2028 | | | | 3,000,000 | | | | 3,265,230 | |
| | | | |
Chicago IL Second Lien | | | 5.00 | | | | 11-1-2029 | | | | 1,490,000 | | | | 1,617,052 | |
| | | | |
Chicago IL Second Lien | | | 5.00 | | | | 11-1-2033 | | | | 1,000,000 | | | | 1,121,220 | |
| | | | |
Chicago IL Waste Water Transmission Second Lien | | | 5.00 | | | | 1-1-2022 | | | | 1,340,000 | | | | 1,445,565 | |
| | | | |
Chicago IL Waste Water Transmission Second Lien | | | 5.00 | | | | 1-1-2023 | | | | 2,335,000 | | | | 2,512,950 | |
| | | | |
Chicago IL Waste Water Transmission Second Lien | | | 5.00 | | | | 1-1-2024 | | | | 2,000,000 | | | | 2,149,980 | |
| | | | |
Chicago IL Waste Water Transmission Second Lien | | | 5.00 | | | | 1-1-2027 | | | | 2,670,000 | | | | 2,990,400 | |
| | | | |
Chicago IL Waste Water Transmission Second Lien | | | 5.00 | | | | 1-1-2032 | | | | 1,000,000 | | | | 1,101,680 | |
| | | | |
Chicago IL Waste Water Transmission Second Lien | | | 5.00 | | | | 1-1-2033 | | | | 1,000,000 | | | | 1,097,920 | |
| | | | |
Chicago IL Waste Water Transmission Second Lien | | | 5.00 | | | | 1-1-2034 | | | | 1,000,000 | | | | 1,093,180 | |
| |
| | | | 24,836,314 | |
| | | | | | | | | | | | | | | | |
| |
| | | | 388,927,882 | |
| | | | | | | | | | | | | | | | |
| | | | |
Indiana: 1.11% | | | | | | | | | | | | | | | | |
| | | | |
| Education Revenue: 0.04% | | | | | | | | | | | | |
| | | | |
University of Southern Indiana Student Fee Series J (AGC Insured) | | | 5.00 | | | | 10-1-2019 | | | | 1,000,000 | | | | 1,009,030 | |
| | | | | | | | | | | | | | | | |
| | | | |
| Health Revenue: 0.19% | | | | | | | | | | | | |
| | | | |
Indiana HFFA Ascension Health Subordinate Bond Credit Group Series A-3 | | | 1.35 | | | | 11-1-2027 | | | | 2,500,000 | | | | 2,497,025 | |
| | | | |
Knox County IN EDA Series A | | | 5.00 | | | | 4-1-2022 | | | | 925,000 | | | | 983,099 | |
| | | | |
Knox County IN EDA Series A | | | 5.00 | | | | 4-1-2023 | | | | 665,000 | | | | 705,937 | |
| | | | |
Knox County IN EDA Series A | | | 5.00 | | | | 4-1-2026 | | | | 750,000 | | | | 793,830 | |
| |
| | | | 4,979,891 | |
| | | | | | | | | | | | | | | | |
| | | | |
| Miscellaneous Revenue: 0.63% | | | | | | | | | | | | |
| | | | |
Dubois IN Greater Jasper School Building Corporation First Mortgage Bond | | | 5.00 | | | | 7-15-2029 | | | | 1,500,000 | | | | 1,896,195 | |
| | | | |
Indiana Bond Bank Special Program Series A (AGM Insured) | | | 5.00 | | | | 9-1-2022 | | | | 1,545,000 | | | | 1,678,751 | |
Wells Fargo Intermediate Tax/AMT-Free Fund | 21
Portfolio of investments—June 30, 2019
| | | | | | | | | | | | | | | | |
| | | Interest rate | | | Maturity date | | | Principal | | | Value | |
| Miscellaneous Revenue (continued) | | | | | | | | | | | | |
| | | | |
Indiana Finance Authority Stadium Project Series A | | | 5.25 | % | | | 2-1-2028 | | | $ | 2,000,000 | | | $ | 2,405,600 | |
| | | | |
Indianapolis IN Local Public Improvement Bond Bank Series E | | | 5.00 | | | | 1-1-2027 | | | | 760,000 | | | | 923,879 | |
| | | | |
Indianapolis IN Local Public Improvement Bond Bank Series E | | | 5.00 | | | | 1-1-2028 | | | | 1,000,000 | | | | 1,213,940 | |
| | | | |
Indianapolis IN Local Public Improvement Bond Bank Series E | | | 5.00 | | | | 1-1-2029 | | | | 735,000 | | | | 888,960 | |
| | | | |
Indianapolis IN Local Public Improvement Bond Bank Series E | | | 5.00 | | | | 1-1-2030 | | | | 1,375,000 | | | | 1,655,954 | |
| | | | |
Indianapolis IN Local Public Improvement Bond Bank Series E | | | 5.00 | | | | 1-1-2031 | | | | 1,000,000 | | | | 1,198,440 | |
| | | | |
Indianapolis IN Local Public Improvement Bond Bank Series E | | | 5.00 | | | | 1-1-2033 | | | | 1,545,000 | | | | 1,839,091 | |
| | | | |
Indianapolis IN Local Public Improvement Bond Bank Series E | | | 5.00 | | | | 1-1-2034 | | | | 2,000,000 | | | | 2,361,000 | |
| | | | |
Valparaiso IN Multi-Schools Building Corporation | | | 5.00 | | | | 7-15-2024 | | | | 750,000 | | | | 875,430 | |
| |
| | | | 16,937,240 | |
| | | | | | | | | | | | | | | | |
| | | | |
| Water & Sewer Revenue: 0.25% | | | | | | | | | | | | |
| | | | |
Indiana Finance Authority First Lien Wastewater Utility Clean Water Project Series A | | | 5.00 | | | | 10-1-2030 | | | | 2,315,000 | | | | 2,677,460 | |
| | | | |
Indiana Finance Authority First Lien Wastewater Utility Clean Water Project Series A | | | 5.00 | | | | 10-1-2031 | | | | 1,035,000 | | | | 1,193,469 | |
| | | | |
Indiana Finance Authority First Lien Wastewater Utilities Clean Water Act Authority Project Series A | | | 5.25 | | | | 10-1-2038 | | | | 2,500,000 | | | | 2,693,725 | |
| |
| | | | 6,564,654 | |
| | | | | | | | | | | | | | | | |
| |
| | | | 29,490,815 | |
| | | | | | | | | | | | | | | | |
| | | | |
Iowa: 0.43% | | | | | | | | | | | | | | | | |
| | | | |
| GO Revenue: 0.10% | | | | | | | | | | | | |
| | | | |
Altoona IA Annual Appropriation Urban Renewal Refunding Bond | | | 5.00 | | | | 6-1-2027 | | | | 2,310,000 | | | | 2,765,486 | |
| | | | | | | | | | | | | | | | |
| | | | |
| Industrial Development Revenue: 0.33% | | | | | | | | | | | | |
| | | | |
Iowa Finance Authority Midwestern Disaster Area Project (Korea Development Bank LOC) ø | | | 2.40 | | | | 4-1-2022 | | | | 8,800,000 | | | | 8,800,000 | |
| | | | | | | | | | | | | | | | |
| |
| | | | 11,565,486 | |
| | | | | | | | | | | | | | | | |
| | | | |
Kansas: 0.21% | | | | | | | | | | | | | | | | |
| | | | |
| Health Revenue: 0.05% | | | | | | | | | | | | |
| | | | |
Kansas Development Finance Authority Health Facilities Series F | | | 5.00 | | | | 11-15-2021 | | | | 1,300,000 | | | | 1,404,559 | |
| | | | | | | | | | | | | | | | |
| | | | |
| Miscellaneous Revenue: 0.11% | | | | | | | | | | | | |
| | | | |
Kansas Development Finance Authority Agro-Defense Facility Series G | | | 5.00 | | | | 4-1-2030 | | | | 2,650,000 | | | | 2,943,567 | |
| | | | | | | | | | | | | | | | |
| | | | |
| Tax Revenue: 0.05% | | | | | | | | | | | | |
| | | | |
Wyandotte County & Kansas City KS Special Obligation Vacation Village Project Area 4 Major Multi-Sport Athletic Complex Project CAB Series 2015 144A¤ | | | 0.00 | | | | 9-1-2034 | | | | 3,395,000 | | | | 1,346,219 | |
| | | | | | | | | | | | | | | | |
| |
| | | | 5,694,345 | |
| | | | | | | | | | | | | | | | |
| | | | |
Kentucky: 1.50% | | | | | | | | | | | | | | | | |
| | | | |
| Health Revenue: 0.04% | | | | | | | | | | | | |
| | | | |
Kentucky EDFA Catholic Health Initiative Series B2 (1 Month LIBOR +0.90%)± | | | 2.56 | | | | 2-1-2046 | | | | 1,250,000 | | | | 1,250,113 | |
| | | | | | | | | | | | | | | | |
| | | | |
| Transportation Revenue: 0.35% | | | | | | | | | | | | |
| | | | |
Kentucky Public Transportation Infrastructure Authority Downtown Crossing Project CAB Series B ¤ | | | 0.00 | | | | 7-1-2020 | | | | 1,000,000 | | | | 975,340 | |
| | | | |
Kentucky Public Transportation Infrastructure Authority Downtown Crossing Project CAB Series B ¤ | | | 0.00 | | | | 7-1-2021 | | | | 2,750,000 | | | | 2,602,985 | |
22 | Wells Fargo Intermediate Tax/AMT-Free Fund
Portfolio of investments—June 30, 2019
| | | | | | | | | | | | | | | | |
| | | Interest rate | | | Maturity date | | | Principal | | | Value | |
| Transportation Revenue (continued) | | | | | | | | | | | | |
| | | | |
Kentucky Public Transportation Infrastructure Authority Downtown Crossing Project CAB Series B ¤ | | | 0.00 | % | | | 7-1-2022 | | | $ | 4,320,000 | | | $ | 3,965,198 | |
| | | | |
Kentucky Public Transportation Infrastructure Authority Downtown Crossing Project CAB Series B ¤ | | | 0.00 | | | | 7-1-2025 | | | | 1,020,000 | | | | 805,137 | |
| | | | |
Kentucky Public Transportation Infrastructure Authority Downtown Crossing Project CAB Series B ¤ | | | 0.00 | | | | 7-1-2029 | | | | 1,400,000 | | | | 955,416 | |
| |
| | | | 9,304,076 | |
| | | | | | | | | | | | | | | | |
|
| Utilities Revenue: 1.11% | |
| | | | |
Kentucky Public Energy Authority Gas Supply Series A-1 | | | 4.00 | | | | 12-1-2049 | | | | 16,770,000 | | | | 18,492,782 | |
| | | | |
Kentucky Public Energy Authority Gas Supply Series B | | | 4.00 | | | | 1-1-2049 | | | | 10,000,000 | | | | 11,034,400 | |
| |
| | | | 29,527,182 | |
| | | | | | | | | | | | | | | | |
| |
| | | | 40,081,371 | |
| | | | | | | | | | | | | | | | |
| | | | |
Louisiana: 1.69% | | | | | | | | | | | | | | | | |
| | | | |
| Airport Revenue: 0.12% | | | | | | | | | | | | |
| | | | |
New Orleans LA Aviation Board Consolidated Rental Car Project (AGM Insured) | | | 5.00 | | | | 1-1-2035 | | | | 2,000,000 | | | | 2,376,980 | |
| | | | |
New Orleans LA Aviation Board North Terminal Project Series A | | | 5.00 | | | | 1-1-2033 | | | | 750,000 | | | | 889,035 | |
| |
| | | | 3,266,015 | |
| | | | | | | | | | | | | | | | |
| | | | |
| Education Revenue: 0.21% | | | | | | | | | | | | |
| | | | |
Louisiana Public Facilities Authority Loyola University Project CAB ¤ | | | 0.00 | | | | 10-1-2027 | | | | 3,380,000 | | | | 3,174,259 | |
| | | | |
Louisiana Public Facilities Authority Loyola University Project CAB ¤ | | | 0.00 | | | | 10-1-2028 | | | | 2,500,000 | | | | 2,380,675 | |
| |
| | | | 5,554,934 | |
| | | | | | | | | | | | | | | | |
| | | | |
| Industrial Development Revenue: 0.21% | | | | | | | | | | | | |
| | | | |
St. James Parish LA Nucor Steel LLC Project Gulf Opportunity ZoneSeries A-1 ø | | | 2.09 | | | | 11-1-2040 | | | | 5,550,000 | | | | 5,550,000 | |
| | | | | | | | | | | | | | | | |
| | | | |
| Miscellaneous Revenue: 0.75% | | | | | | | | | | | | |
| | | | |
Lafayette LA Communications System (AGM Insured) | | | 5.00 | | | | 11-1-2025 | | | | 1,500,000 | | | | 1,797,075 | |
| | | | |
Louisiana Correctional Facilities Corporation (Ambac Insured) | | | 5.00 | | | | 9-1-2019 | | | | 1,000,000 | | | | 1,005,850 | |
| | | | |
Louisiana Public Facilities Authority Archdiocese of New Orleans Project | | | 5.00 | | | | 7-1-2024 | | | | 1,000,000 | | | | 1,131,610 | |
| | | | |
Louisiana Public Facilities Authority Archdiocese of New Orleans Project | | | 5.00 | | | | 7-1-2025 | | | | 600,000 | | | | 687,930 | |
| | | | |
Louisiana Public Facilities Authority Archdiocese of New Orleans Project | | | 5.00 | | | | 7-1-2026 | | | | 500,000 | | | | 581,035 | |
| | | | |
Louisiana Unclaimed Property Special Bond 1-49 South Project | | | 5.00 | | | | 9-1-2026 | | | | 2,000,000 | | | | 2,373,800 | |
| | | | |
Louisiana Unclaimed Property Special Bond 1-49 South Project | | | 5.00 | | | | 9-1-2027 | | | | 2,700,000 | | | | 3,201,552 | |
| | | | |
Louisiana Unclaimed Property Special Bond 1-49 South Project | | | 5.00 | | | | 9-1-2028 | | | | 2,405,000 | | | | 2,847,929 | |
| | | | |
Louisiana Unclaimed Property Special Bond 1-49 South Project | | | 5.00 | | | | 9-1-2029 | | | | 2,695,000 | | | | 3,180,693 | |
| | | | |
Louisiana Unclaimed Property Special Bond 1-49 South Project | | | 5.00 | | | | 9-1-2030 | | | | 2,700,000 | | | | 3,183,354 | |
| |
| | | | 19,990,828 | |
| | | | | | | | | | | | | | | | |
| | | | |
| Tax Revenue: 0.23% | | | | | | | | | | | | |
| | | | |
Jefferson LA Sales Tax District Series B (AGM Insured) | | | 5.00 | | | | 12-1-2031 | | | | 1,000,000 | | | | 1,216,870 | |
| | | | |
Jefferson LA Sales Tax District Series B (AGM Insured) | | | 5.00 | | | | 12-1-2032 | | | | 1,000,000 | | | | 1,210,470 | |
| | | | |
St. Bernard Parish LA Sales Tax Refunding Bond | | | 4.00 | | | | 3-1-2023 | | | | 3,405,000 | | | | 3,658,434 | |
| |
| | | | 6,085,774 | |
| | | | | | | | | | | | | | | | |
| | | | |
| Transportation Revenue: 0.13% | | | | | | | | | | | | |
| | | | |
Greater New Orleans LA Expressway Commission Toll Subordinate Lien Bond (AGM Insured) | | | 5.00 | | | | 11-1-2031 | | | | 1,000,000 | | | | 1,179,330 | |
| | | | |
Greater New Orleans LA Expressway Commission Toll Subordinate Lien Bond (AGM Insured) | | | 5.00 | | | | 11-1-2032 | | | | 1,000,000 | | | | 1,176,370 | |
Wells Fargo Intermediate Tax/AMT-Free Fund | 23
Portfolio of investments—June 30, 2019
| | | | | | | | | | | | | | | | |
| | | Interest rate | | | Maturity date | | | Principal | | | Value | |
| Transportation Revenue (continued) | | | | | | | | | | | | |
| | | | |
Greater New Orleans LA Expressway Commission Toll Subordinate Lien Bond (AGM Insured) | | | 5.00 | % | | | 11-1-2033 | | | $ | 1,000,000 | | | $ | 1,174,110 | |
| |
| | | | 3,529,810 | |
| | | | | | | | | | | | | | | | |
|
| Water & Sewer Revenue: 0.04% | |
| | | | |
Louisiana Local Government Environmental Facilities & CDA East Baton Rouge Series A | | | 5.00 | | | | 2-1-2030 | | | | 1,000,000 | | | | 1,134,610 | |
| | | | | | | | | | | | | | | | |
| |
| | | | 45,111,971 | |
| | | | | | | | | | | | | | | | |
| | | | |
Maine: 0.23% | | | | | | | | | | | | | | | | |
| | | | |
| Education Revenue: 0.23% | | | | | | | | | | | | |
| | | | |
Maine Health and HEFAR University of New England Issue Series A | | | 5.00 | | | | 7-1-2029 | | | | 1,015,000 | | | | 1,227,044 | |
| | | | |
Maine Health and HEFAR University of New England Issue Series A | | | 5.00 | | | | 7-1-2030 | | | | 1,200,000 | | | | 1,440,924 | |
| | | | |
Maine Health and HEFAR University of New England Issue Series A | | | 5.00 | | | | 7-1-2032 | | | | 1,415,000 | | | | 1,677,383 | |
| | | | |
Maine Health and HEFAR University of New England Issue Series A | | | 5.00 | | | | 7-1-2033 | | | | 1,485,000 | | | | 1,759,101 | |
| |
| | | | 6,104,452 | |
| | | | | | | | | | | | | | | | |
| | | | |
Maryland: 2.23% | | | | | | | | | | | | | | | | |
| | | | |
| Education Revenue: 0.13% | | | | | | | | | | | | |
| | | | |
Maryland Economic Development Corporation Salisbury University Project | | | 5.00 | | | | 6-1-2027 | | | | 500,000 | | | | 529,555 | |
| | | | |
Westminster MD Educational Facilities McDaniel College | | | 5.00 | | | | 11-1-2026 | | | | 2,450,000 | | | | 2,848,223 | |
| |
| | | | 3,377,778 | |
| | | | | | | | | | | | | | | | |
| | | | |
| GO Revenue: 1.69% | | | | | | | | | | | | |
| | | | |
Howard County MD Metropolitan District Project Series B | | | 4.00 | | | | 8-15-2030 | | | | 2,070,000 | | | | 2,424,094 | |
| | | | |
Howard County MD Metropolitan District Project Series B | | | 4.00 | | | | 8-15-2032 | | | | 1,430,000 | | | | 1,654,496 | |
| | | | |
Maryland Series B | | | 4.00 | | | | 8-1-2023 | | | | 5,000,000 | | | | 5,524,350 | |
| | | | |
Maryland Series B | | | 4.00 | | | | 8-1-2024 | | | | 15,000,000 | | | | 16,907,250 | |
| | | | |
Maryland Series C | | | 5.00 | | | | 8-1-2022 | | | | 2,975,000 | | | | 3,307,278 | |
| | | | |
Prince George’s County MD Consolidated Public Improvement Bonds Series C | | | 4.00 | | | | 8-1-2027 | | | | 6,000,000 | | | | 6,582,120 | |
| | | | |
Prince Georges County MD Consolidated Public Improvement Bonds Series C | | | 4.00 | | | | 8-1-2029 | | | | 8,000,000 | | | | 8,735,200 | |
| |
| | | | 45,134,788 | |
| | | | | | | | | | | | | | | | |
| | | | |
| Miscellaneous Revenue: 0.35% | | | | | | | | | | | | |
| | | | |
Maryland CDA Local Government Infrastructure Bond Series A-2 | | | 2.00 | | | | 6-1-2022 | | | | 460,000 | | | | 467,107 | |
| | | | |
Maryland State and Local Facilities Loan Series A | | | 4.00 | | | | 8-1-2030 | | | | 5,000,000 | | | | 5,762,650 | |
| | | | |
Prince Georges County MD Upper Marlboro Courthouse Project Series A | | | 5.00 | | | | 5-1-2028 | | | | 1,215,000 | | | | 1,538,469 | |
| | | | |
Prince Georges County MD Upper Marlboro Courthouse Project Series A | | | 5.00 | | | | 5-1-2029 | | | | 1,275,000 | | | | 1,606,704 | |
| |
| | | | 9,374,930 | |
| | | | | | | | | | | | | | | | |
| | | | |
| Tax Revenue: 0.06% | | | | | | | | | | | | |
| | | | |
Howard County MD Downtown Columbia Project Series A 144A | | | 4.00 | | | | 2-15-2028 | | | | 500,000 | | | | 528,080 | |
| | | | |
Howard County MD Downtown Columbia Project Series A 144A | | | 4.13 | | | | 2-15-2034 | | | | 1,000,000 | | | | 1,042,620 | |
| |
| | | | 1,570,700 | |
| | | | | | | | | | | | | | | | |
| |
| | | | 59,458,196 | |
| | | | | | | | | | | | | | | | |
Massachusetts: 2.70% | | | | | | | | | | | | | | | | |
| | | | |
| Education Revenue: 0.19% | | | | | | | | | | | | |
| | | | |
Massachusetts Development Finance Agency Lasell College | | | 5.00 | | | | 7-1-2021 | | | | 1,210,000 | | | | 1,246,022 | |
| | | | |
Massachusetts Development Finance Agency Merrimack College Series A | | | 5.00 | | | | 7-1-2021 | | | | 1,035,000 | | | | 1,095,703 | |
24 | Wells Fargo Intermediate Tax/AMT-Free Fund
Portfolio of investments—June 30, 2019
| | | | | | | | | | | | | | | | |
| | | Interest rate | | | Maturity date | | | Principal | | | Value | |
| | | | |
| Education Revenue (continued) | | | | | | | | | | | | |
| | | | |
Massachusetts Development Finance Agency Sabis International Charter Series A | | | 6.55 | % | | | 4-15-2020 | | | $ | 615,000 | | | $ | 624,243 | |
| | | | |
Massachusetts HEFA Harvard University Series A | | | 5.00 | | | | 12-15-2029 | | | | 1,890,000 | | | | 1,921,884 | |
| |
| | | | 4,887,852 | |
| | | | | | | | | | | | | | | | |
| | | | |
| GO Revenue: 2.02% | | | | | | | | | | | | |
| | | | |
Boston MA Series A | | | 4.00 | | | | 4-1-2031 | | | | 1,500,000 | | | | 1,746,360 | |
| | | | |
Boston MA Series A | | | 5.00 | | | | 4-1-2026 | | | | 5,790,000 | | | | 6,974,634 | |
| | | | |
Massachusetts Consolidated Loan Series D | | | 5.00 | | | | 9-1-2028 | | | | 10,000,000 | | | | 12,003,000 | |
| | | | |
Massachusetts Series A (Barclays Bank plc SPA) ø | | | 1.85 | | | | 3-1-2026 | | | | 7,875,000 | | | | 7,875,000 | |
| | | | |
Massachusetts Series A | | | 5.25 | | | | 1-1-2033 | | | | 15,630,000 | | | | 19,996,984 | |
| | | | |
Massachusetts Series B | | | 5.00 | | | | 7-1-2035 | | | | 1,500,000 | | | | 1,869,075 | |
| | | | |
Massachusetts Series B | | | 5.00 | | | | 7-1-2036 | | | | 2,700,000 | | | | 3,342,708 | |
| |
| | | | 53,807,761 | |
| | | | | | | | | | | | | | | | |
| | | | |
| Miscellaneous Revenue: 0.49% | | | | | | | | | | | | |
| | | | |
Massachusetts Consolidated Loan Series D | | | 1.05 | | | | 8-1-2043 | | | | 10,000,000 | | | | 9,962,500 | |
| | | | |
Massachusetts Consolidated Loan Series I | | | 5.00 | | | | 12-1-2030 | | | | 2,570,000 | | | | 3,138,741 | |
| |
| | | | 13,101,241 | |
| | | | | | | | | | | | | | | | |
| |
| | | | 71,796,854 | |
| | | | | | | | | | | | | | | | |
| | | | |
Michigan: 2.71% | | | | | | | | | | | | | | | | |
| | | | |
| Airport Revenue: 0.06% | | | | | | | | | | | | |
| | | | |
Wayne County MI Airport Authority Detroit Metropolitan Bond Series A | | | 5.00 | | | | 12-1-2032 | | | | 800,000 | | | | 975,912 | |
| | | | |
Wayne County MI Airport Authority Detroit Metropolitan Bond Series A | | | 5.00 | | | | 12-1-2034 | | | | 600,000 | | | | 729,534 | |
| |
| | | | 1,705,446 | |
| | | | | | | | | | | | | | | | |
| | | | |
| Education Revenue: 0.52% | | | | | | | | | | | | |
| | | | |
Flint MI International Academy | | | 5.38 | | | | 10-1-2022 | | | | 1,870,000 | | | | 1,871,178 | |
| | | | |
Flint MI International Academy | | | 5.50 | | | | 10-1-2027 | | | | 1,985,000 | | | | 1,985,814 | |
| | | | |
Michigan Finance Authority Limited Obligation Public School Academy Cesar Chavez Academy Project | | | 5.00 | | | | 2-1-2022 | | | | 1,600,000 | | | | 1,621,040 | |
| | | | |
Michigan State University Board of Trustees | | | 5.00 | | | | 2-15-2036 | | | | 1,325,000 | | | | 1,638,323 | |
| | | | |
RBC Municipal Products Incorporated Trust Series E-127 (Royal Bank of Canada LOC, Royal Bank of Canada LIQ) 144Aø | | | 1.94 | | | | 7-1-2020 | | | | 3,900,000 | | | | 3,900,000 | |
| | | | |
Western Michigan University Board of Trustees | | | 5.25 | | | | 11-15-2027 | | | | 600,000 | | | | 686,124 | |
| | | | |
Western Michigan University Board of Trustees | | | 5.25 | | | | 11-15-2029 | | | | 1,000,000 | | | | 1,144,900 | |
| | | | |
Western Michigan University Board of Trustees (AGM Insured) | | | 5.25 | | | | 11-15-2033 | | | | 750,000 | | | | 859,440 | |
| |
| | | | 13,706,819 | |
| | | | | | | | | | | | | | | | |
| | | | |
| GO Revenue: 0.42% | | | | | | | | | | | | |
| | | | |
Eaton Rapids MI Public Schools (Qualified School Board Loan Fund Insured) | | | 5.00 | | | | 5-1-2022 | | | | 1,785,000 | | | | 1,959,287 | |
| | | | |
Hazel Park MI School District (AGM Insured, Qualified School Board Loan Fund Insured) | | | 5.00 | | | | 5-1-2020 | | | | 1,160,000 | | | | 1,195,519 | |
| | | | |
Kent County MI Limited Tax Capital Improvement Bond | | | 5.00 | | | | 6-1-2030 | | | | 1,040,000 | | | | 1,259,492 | |
| | | | |
Pinckney MI Community School District (Qualified School Board Loan Fund Insured) | | | 5.00 | | | | 5-1-2025 | | | | 2,040,000 | | | | 2,340,716 | |
| | | | |
Pinckney MI Community School District (Qualified School Board Loan Fund Insured) | | | 5.00 | | | | 5-1-2026 | | | | 2,505,000 | | | | 2,867,023 | |
| | | | |
Southfield MI 2015 Street Improvement | | | 4.00 | | | | 5-1-2025 | | | | 1,490,000 | | | | 1,677,993 | |
| |
| | | | 11,300,030 | |
| | | | | | | | | | | | | | | | |
Wells Fargo Intermediate Tax/AMT-Free Fund | 25
Portfolio of investments—June 30, 2019
| | | | | | | | | | | | | | | | |
| | | Interest rate | | | Maturity date | | | Principal | | | Value | |
| | | | |
| Health Revenue: 0.30% | | | | | | | | | | | | |
| | | | |
Michigan Finance Authority Sparrow Obligated Group | | | 5.00 | % | | | 11-15-2023 | | | $ | 400,000 | | | $ | 446,544 | |
| | | | |
Michigan Finance Authority Sparrow Obligated Group | | | 5.00 | | | | 11-15-2026 | | | | 800,000 | | | | 888,904 | |
| | | | |
Michigan Hospital Finance Authority Ascension Health Senior Credit Group Series F-2 | | | 1.90 | | | | 11-15-2047 | | | | 6,570,000 | | | | 6,613,953 | |
| |
| | | | 7,949,401 | |
| | | | | | | | | | | | | | | | |
| | | | |
| Miscellaneous Revenue: 0.38% | | | | | | | | | | | | |
| | | | |
Macomb MI Interceptor Drainage | | | 5.00 | | | | 5-1-2024 | | | | 1,750,000 | | | | 1,801,223 | |
| | | | |
Macomb MI Interceptor Drainage | | | 5.00 | | | | 5-1-2025 | | | | 1,750,000 | | | | 1,801,363 | |
| | | | |
Macomb MI Interceptor Drainage | | | 5.00 | | | | 5-1-2026 | | | | 1,930,000 | | | | 1,986,491 | |
| | | | |
Michigan Strategic Fund Limited Obligation Cadillac Place Office Building Project | | | 5.25 | | | | 10-15-2025 | | | | 4,165,000 | | | | 4,513,735 | |
| |
| | | | 10,102,812 | |
| | | | | | | | | | | | | | | | |
| | | | |
| Tax Revenue: 0.12% | | | | | | | | | | | | |
| | | | |
Michigan Finance Authority Local Government Loan Program Series F | | | 4.00 | | | | 10-1-2024 | | | | 3,000,000 | | | | 3,218,880 | |
| | | | | | | | | | | | | | | | |
| | | | |
| Water & Sewer Revenue: 0.91% | | | | | | | | | | | | |
| | | | |
Great Lakes MI Water Authority Sewage Disposal System Series C | | | 5.00 | | | | 7-1-2030 | | | | 3,350,000 | | | | 3,978,293 | |
| | | | |
Michigan Finance Authority Local Government Loan Program Series D (National Insured) | | | 5.00 | | | | 7-1-2025 | | | | 1,000,000 | | | | 1,160,860 | |
| | | | |
Michigan Finance Authority Local Government Loan Program Series D | | | 5.00 | | | | 7-1-2030 | | | | 12,000,000 | | | | 13,757,160 | |
| | | | |
Michigan Finance Authority Local Government Loan Program Series D (AGM Insured) | | | 5.00 | | | | 7-1-2035 | | | | 2,750,000 | | | | 3,110,388 | |
| | | | |
Michigan Finance Authority Local Government Loan Program Series D (AGM Insured) | | | 5.00 | | | | 7-1-2037 | | | | 2,000,000 | | | | 2,250,880 | |
| |
| | | | 24,257,581 | |
| | | | | | | | | | | | | | | | |
| |
| | | | 72,240,969 | |
| | | | | | | | | | | | | | | | |
| | | | |
Minnesota: 0.11% | | | | | | | | | | | | | | | | |
| | | | |
| Health Revenue: 0.01% | | | | | | | | | | | | |
| | | | |
Rochester MN Healthcare Facilities Mayo Clinic ø | | | 1.93 | | | | 11-15-2047 | | | | 300,000 | | | | 300,000 | |
| | | | | | | | | | | | | | | | |
| | | | |
| Miscellaneous Revenue: 0.10% | | | | | | | | | | | | |
| | | | |
Minneapolis & St. Paul MN Housing & RDA Children’s Hospital Clinics Series A (AGM Insured, U.S. Bank NA SPA) | | | 1.33 | | | | 8-15-2037 | | | | 2,725,000 | | | | 2,725,000 | |
| | | | | | | | | | | | | | | | |
| |
| | | | 3,025,000 | |
| | | | | | | | | | | | | | | | |
| | | | |
Mississippi: 0.81% | | | | | | | | | | | | | | | | |
| | | | |
| GO Revenue: 0.04% | | | | | | | | | | | | |
| | | | |
Mississippi Development Bank Special Obligation Jackson Public School District Project Series A | | | 5.00 | | | | 4-1-2020 | | | | 1,000,000 | | | | 1,026,490 | |
| | | | | | | | | | | | | | | | |
| | | | |
| Miscellaneous Revenue: 0.41% | | | | | | | | | | | | |
| | | | |
Mississippi Development Bank Special Obligation Jackson Water & Sewer System Project Series A (AGM Insured) | | | 5.00 | | | | 9-1-2030 | | | | 10,000,000 | | | | 10,891,800 | |
| | | | | | | | | | | | | | | | |
| | | | |
| Utilities Revenue: 0.19% | | | | | | | | | | | | |
| | | | |
Mississippi Business Finance Corporation Pollution Control Gulf Power Company Project ø | | | 1.98 | | | | 4-1-2044 | | | | 5,075,000 | | | | 5,075,000 | |
| | | | | | | | | | | | | | | | |
|
| Water & Sewer Revenue: 0.17% | |
| | | | |
Mississippi Development Bank Special Obligation Jackson Water & Sewer System Project (AGM Insured) | | | 6.00 | | | | 12-1-2023 | | | | 1,145,000 | | | | 1,336,043 | |
26 | Wells Fargo Intermediate Tax/AMT-Free Fund
Portfolio of investments—June 30, 2019
| | | | | | | | | | | | | | | | |
| | | Interest rate | | | Maturity date | | | Principal | | | Value | |
|
| Water & Sewer Revenue (continued) | |
| | | | |
West Rankin MS Utility Authority Series 2018 (AGM Insured) | | | 5.00 | % | | | 1-1-2026 | | | $ | 525,000 | | | $ | 617,537 | |
| | | | |
West Rankin MS Utility Authority Series 2018 (AGM Insured) | | | 5.00 | | | | 1-1-2027 | | | | 435,000 | | | | 510,433 | |
| | | | |
West Rankin MS Utility Authority Series 2018 (AGM Insured) | | | 5.00 | | | | 1-1-2034 | | | | 750,000 | | | | 859,785 | |
| | | | |
West Rankin MS Utility Authority Series 2018 (AGM Insured) | | | 5.00 | | | | 1-1-2035 | | | | 1,000,000 | | | | 1,143,580 | |
| |
| | | | 4,467,378 | |
| | | | | | | | | | | | | | | | |
| |
| | | | 21,460,668 | |
| | | | | | | | | | | | | | | | |
| | | | |
Missouri: 0.38% | | | | | | | | | | | | | | | | |
| | | | |
| Airport Revenue: 0.02% | | | | | | | | | | | | |
| | | | |
St. Louis MO Lambert St. Louis International Airport Series A-1 | | | 6.00 | | | | 7-1-2019 | | | | 415,000 | | | | 415,000 | |
| | | | | | | | | | | | | | | | |
| | | | |
| Education Revenue: 0.09% | | | | | | | | | | | | |
| | | | |
Missouri HEFA Webster University Project | | | 5.00 | | | | 4-1-2027 | | | | 2,155,000 | | | | 2,476,569 | |
| | | | | | | | | | | | | | | | |
| | | | |
| GO Revenue: 0.03% | | | | | | | | | | | | |
| | | | |
Belton MO School District #124 Missouri Direct Deposit Program Project | | | 5.00 | | | | 3-1-2026 | | | | 750,000 | | | | 912,630 | |
| | | | | | | | | | | | | | | | |
| | | | |
| Miscellaneous Revenue: 0.24% | | | | | | | | | | | | |
| | | | |
Kansas City MO Municipal Assistance Corporation CAB Series B-1 (Ambac Insured) ¤ | | | 0.00 | | | | 4-15-2022 | | | | 3,640,000 | | | | 3,444,168 | |
| | | | |
Poplar Bluff MO School District (AGM Insured) | | | 5.00 | | | | 3-1-2032 | | | | 1,500,000 | | | | 1,705,965 | |
| | | | |
Poplar Bluff MO School District (AGM Insured) | | | 5.00 | | | | 3-1-2034 | | | | 1,000,000 | | | | 1,132,430 | |
| |
| | | | 6,282,563 | |
| | | | | | | | | | | | | | | | |
| | | | |
| Tax Revenue: 0.00% | | | | | | | | | | | | |
| | | | |
Manchester MO Highway 141 Manchester Road Project | | | 6.00 | | | | 11-1-2025 | | | | 25,000 | | | | 25,025 | |
| | | | | | | | | | | | | | | | |
| |
| | | | 10,111,787 | |
| | | | | | | | | | | | | | | | |
| | | | |
Nebraska: 0.18% | | | | | | | | | | | | | | | | |
| | | | |
| Health Revenue: 0.04% | | | | | | | | | | | | |
| | | | |
Lincoln County NE Hospital Authority Great Plains Regional Medical Center | | | 5.00 | | | | 11-1-2024 | | | | 1,000,000 | | | | 1,072,700 | |
| | | | | | | | | | | | | | | | |
| | | | |
| Utilities Revenue: 0.14% | | | | | | | | | | | | |
| | | | |
Central Plains NE Energy Gas Project #3 | | | 5.00 | | | | 9-1-2027 | | | | 1,290,000 | | | | 1,398,541 | |
| | | | |
Central Plains NE Energy Gas Project #4 | | | 5.00 | | | | 3-1-2050 | | | | 2,000,000 | | | | 2,246,200 | |
| |
| | | | 3,644,741 | |
| | | | | | | | | | | | | | | | |
| |
| | | | 4,717,441 | |
| | | | | | | | | | | | | | | | |
| | | | |
Nevada: 1.49% | | | | | | | | | | | | | | | | |
| | | | |
| Airport Revenue: 0.32% | | | | | | | | | | | | |
| | | | |
Clark County NV Airport Series C (AGM Insured) | | | 5.00 | | | | 7-1-2023 | | | | 5,600,000 | | | | 5,600,000 | |
| | | | |
Clark County NV Airport Series D | | | 5.00 | | | | 7-1-2024 | | | | 2,750,000 | | | | 2,800,958 | |
| |
| | | | 8,400,958 | |
| | | | | | | | | | | | | | | | |
| GO Revenue: 1.12% | | | | | | | | | | | | |
| | | | |
Clark County NV Refunding Bond | | | 5.00 | | | | 6-1-2030 | | | | 3,905,000 | | | | 4,804,673 | |
| | | | |
Clark County NV Refunding Bond Series B | | | 5.00 | | | | 11-1-2028 | | | | 5,000,000 | | | | 6,140,300 | |
| | | | |
Clark County NV Stadium Improvement Bond Series A | | | 5.00 | | | | 6-1-2032 | | | | 1,615,000 | | | | 2,002,745 | |
| | | | |
Clark County NV Stadium Improvement Bond Series A | | | 5.00 | | | | 6-1-2033 | | | | 3,900,000 | | | | 4,821,648 | |
| | | | |
Clark County NV Water Reclamation District | | | 5.00 | | | | 7-1-2027 | | | | 4,155,000 | | | | 4,966,721 | |
| | | | |
Clark County NV Water Reclamation District Series A | | | 5.25 | | | | 7-1-2038 | | | | 2,880,000 | | | | 2,880,000 | |
Wells Fargo Intermediate Tax/AMT-Free Fund | 27
Portfolio of investments—June 30, 2019
| | | | | | | | | | | | | | | | |
| | | Interest rate | | | Maturity date | | | Principal | | | Value | |
| GO Revenue (continued) | | | | | | | | | | | | |
| | | | |
Las Vegas NV Series A | | | 5.00 | % | | | 5-1-2031 | | | $ | 1,985,000 | | | $ | 2,279,276 | |
| | | | |
Las Vegas NV Valley Water District Series A | | | 4.00 | | | | 6-1-2028 | | | | 1,665,000 | | | | 1,875,672 | |
| |
| | | | 29,771,035 | |
| | | | | | | | | | | | | | | | |
| | | | |
| Miscellaneous Revenue: 0.05% | | | | | | | | | | | | |
| | | | |
Las Vegas NV Special Improvement District #607 | | | 4.00 | | | | 6-1-2020 | | | | 520,000 | | | | 526,994 | |
| | | | |
Las Vegas NV Special Improvement District #607 | | | 4.00 | | | | 6-1-2021 | | | | 670,000 | | | | 687,963 | |
| | | | |
Las Vegas NV Special Improvement District #607 | | | 4.25 | | | | 6-1-2024 | | | | 200,000 | | | | 210,770 | |
| |
| | | | 1,425,727 | |
| | | | | | | | | | | | | | | | |
| |
| | | | 39,597,720 | |
| | | | | | | | | | | | | | | | |
| | | | |
New Hampshire: 0.03% | | | | | | | | | | | | | | | | |
| | | | |
| Housing Revenue: 0.03% | | | | | | | | | | | | |
| | | | |
New Hampshire HFA Single Family Mortgage Acquisition Series E & F | | | 4.80 | | | | 7-1-2028 | | | | 895,000 | | | | 911,423 | |
| | | | | | | | | | | | | | | | |
| | | | |
New Jersey: 3.17% | | | | | | | | | | | | | | | | |
| | | | |
| Airport Revenue: 0.19% | | | | | | | | | | | | |
| | | | |
South Jersey NJ Port Corporation Marine Terminal Refunding Bond Series S | | | 5.00 | | | | 1-1-2028 | | | | 2,130,000 | | | | 2,474,080 | |
| | | | |
South Jersey NJ Port Corporation Marine Terminal Refunding Bond Series S | | | 5.00 | | | | 1-1-2029 | | | | 2,200,000 | | | | 2,547,468 | |
| |
| | | | 5,021,548 | |
| | | | | | | | | | | | | | | | |
| | | | |
| GO Revenue: 0.46% | | | | | | | | | | | | |
| | | | |
Montclair NJ School Refunding Bond Series B | | | 4.00 | | | | 3-1-2026 | | | | 500,000 | | | | 580,325 | |
| | | | |
Trenton City NJ (Build America Mutual Assurance Company Insured) | | | 5.00 | | | | 12-1-2022 | | | | 1,630,000 | | | | 1,803,660 | |
| | | | |
Trenton City NJ (Build America Mutual Assurance Company Insured) | | | 5.00 | | | | 12-1-2024 | | | | 1,775,000 | | | | 2,052,308 | |
| | | | |
Trenton City NJ (Build America Mutual Assurance Company Insured) | | | 5.00 | | | | 12-1-2025 | | | | 1,860,000 | | | | 2,195,395 | |
| | | | |
Trenton City NJ (Build America Mutual Assurance Company Insured) | | | 5.00 | | | | 12-1-2026 | | | | 1,000,000 | | | | 1,179,140 | |
| | | | |
Union County NJ General Improvement Bond | | | 3.00 | | | | 3-1-2026 | | | | 4,165,000 | | | | 4,467,671 | |
| |
| | | | 12,278,499 | |
| | | | | | | | | | | | | | | | |
| | | | |
| Miscellaneous Revenue: 1.88% | | | | | | | | | | | | |
| | | | |
Essex County NJ Import Authority Series A | | | 6.00 | | | | 11-1-2025 | | | | 5,000,000 | | | | 5,301,350 | |
| | | | |
New Jersey EDA Motor Vehicle Surcharge Revenue Refunding Bond Series A | | | 3.13 | | | | 7-1-2029 | | | | 1,000,000 | | | | 1,008,050 | |
| | | | |
New Jersey EDA Motor Vehicle Surcharges Series A | | | 5.00 | | | | 7-1-2033 | | | | 2,500,000 | | | | 2,863,700 | |
| | | | |
New Jersey EDA Prerefunded Bond Motor Vehicle Surcharges Series A (National Insured) | | | 5.25 | | | | 7-1-2026 | | | | 540,000 | | | | 674,033 | |
| | | | |
New Jersey EDA School Facilities Construction Refunding Bond Series NN | | | 5.00 | | | | 3-1-2021 | | | | 4,315,000 | | | | 4,527,859 | |
| | | | |
New Jersey EDA School Facilities Construction Refunding Bond Series NN | | | 5.00 | | | | 3-1-2023 | | | | 3,000,000 | | | | 3,317,760 | |
| | | | |
New Jersey EDA School Facilities Construction Refunding Bond Series NN | | | 5.00 | | | | 3-1-2026 | | | | 9,830,000 | | | | 10,749,597 | |
| | | | |
New Jersey EDA Series XX | | | 5.00 | | | | 6-15-2022 | | | | 5,020,000 | | | | 5,466,780 | |
| | | | |
New Jersey EDA Unrefunded Bond Motor Vehicle Surcharges Series A (National Insured) | | | 5.25 | | | | 7-1-2026 | | | | 2,320,000 | | | | 2,770,892 | |
| | | | |
New Jersey Educational Facilities Authority | | | 5.00 | | | | 6-15-2026 | | | | 3,015,000 | | | | 3,377,102 | |
| | | | |
New Jersey Sports & Exposition Authority (National Insured) | | | 5.50 | | | | 3-1-2022 | | | | 1,755,000 | | | | 1,943,926 | |
| | | | |
New Jersey TTFA Series A | | | 5.00 | | | | 6-15-2020 | | | | 4,000,000 | | | | 4,123,440 | |
| | | | |
New Jersey TTFA Series A | | | 5.25 | | | | 6-15-2024 | | | | 1,695,000 | | | | 1,806,938 | |
| | | | |
New Jersey TTFA Series A | | | 5.25 | | | | 6-15-2025 | | | | 2,000,000 | | | | 2,130,100 | |
| |
| | | | 50,061,527 | |
| | | | | | | | | | | | | | | | |
| | | | |
| Tax Revenue: 0.14% | | | | | | | | | | | | |
| | | | |
Gardens NJ Preservation Trust Open & Farmland Series A (AGM Insured) | | | 5.75 | | | | 11-1-2028 | | | | 3,000,000 | | | | 3,772,380 | |
| | | | | | | | | | | | | | | | |
28 | Wells Fargo Intermediate Tax/AMT-Free Fund
Portfolio of investments—June 30, 2019
| | | | | | | | | | | | | | | | |
| | | Interest rate | | | Maturity date | | | Principal | | | Value | |
| | | | |
| Tobacco Revenue: 0.10% | | | | | | | | | | | | |
| | | | |
New Jersey EDA Cigarette Tax Refunding Bond | | | 5.00 | % | | | 6-15-2021 | | | $ | 2,500,000 | | | $ | 2,652,550 | |
| | | | | | | | | | | | | | | | |
| | | | |
| Transportation Revenue: 0.40% | | | | | | | | | | | | |
| | | | |
New Jersey TTFA Series A | | | 5.25 | | | | 12-15-2020 | | | | 1,305,000 | | | | 1,370,798 | |
| | | | |
New Jersey TTFA Series C | | | 5.25 | | | | 6-15-2032 | | | | 2,500,000 | | | | 2,815,475 | |
| | | | |
New Jersey TTFA Unrefunded Balance Bond (National Insured) | | | 5.25 | | | | 12-15-2021 | | | | 6,000,000 | | | | 6,504,840 | |
| |
| | | | 10,691,113 | |
| | | | | | | | | | | | | | | | |
| |
| | | | 84,477,617 | |
| | | | | | | | | | | | | | | | |
| | | | |
New Mexico: 0.65% | | | | | | | | | | | | | | | | |
| | | | |
| GO Revenue: 0.13% | | | | | | | | | | | | |
| | | | |
Albuquerque, Bernalillo & Sandoval Counties NM Municipal School District #12 | | | 5.00 | | | | 8-1-2025 | | | | 400,000 | | | | 481,636 | |
| | | | |
Albuquerque, Bernalillo & Sandoval Counties NM Municipal School District #12 | | | 5.00 | | | | 8-1-2026 | | | | 1,205,000 | | | | 1,483,729 | |
| | | | |
Albuquerque, Bernalillo & Sandoval Counties NM Municipal School District #12 | | | 5.00 | | | | 8-1-2034 | | | | 1,150,000 | | | | 1,425,253 | |
| |
| | | | 3,390,618 | |
| | | | | | | | | | | | | | | | |
| | | | |
| Housing Revenue: 0.04% | | | | | | | | | | | | |
| | | | |
New Mexico Mortgage Finance Authority SFMR Class I Series A (GNMA/FNMA/FHLMC Insured) | | | 4.63 | | | | 9-1-2025 | | | | 725,000 | | | | 734,280 | |
| | | | |
New Mexico Mortgage Finance Authority SFMR Class I Series B (GNMA/FNMA/FHLMC Insured) | | | 5.00 | | | | 3-1-2028 | | | | 260,000 | | | | 268,221 | |
| |
| | | | 1,002,501 | |
| | | | | | | | | | | | | | | | |
| | | | |
| Miscellaneous Revenue: 0.44% | | | | | | | | | | | | |
| | | | |
Clayton NM Jail Project Improvement & Refunding Bond (National Insured) | | | 5.00 | | | | 11-1-2028 | | | | 9,265,000 | | | | 10,601,384 | |
| | | | |
Clayton NM Jail Project Improvement & Refunding Bond (National Insured) | | | 5.00 | | | | 11-1-2029 | | | | 1,000,000 | | | | 1,139,000 | |
| |
| | | | 11,740,384 | |
| | | | | | | | | | | | | | | | |
| | | | |
| Water & Sewer Revenue: 0.04% | | | | | | | | | | | | |
| | | | |
Albuquerque & Bernalillo Counties NM Water Utility Authority Series B | | | 5.00 | | | | 7-1-2024 | | | | 1,000,000 | | | | 1,170,840 | |
| | | | | | | | | | | | | | | | |
| |
| | | | 17,304,343 | |
| | | | | | | | | | | | | | | | |
| | | | |
New York: 8.58% | | | | | | | | | | | | | | | | |
| | | | |
| Airport Revenue: 0.12% | | | | | | | | | | | | |
| | | | |
Port Authority New York & New Jersey Special Obligation | | | 5.00 | | | | 12-1-2020 | | | | 3,070,000 | | | | 3,170,266 | |
| | | | | | | | | | | | | | | | |
|
| Education Revenue: 0.71% | |
| | | | |
Dutchess County NY Local Development Corporation The Culinary Institute of America Project Series A-1 | | | 5.00 | | | | 7-1-2027 | | | | 335,000 | | | | 399,029 | |
| | | | |
Hempstead NY Local Development Corporation The Academy Charter School Project Series A | | | 6.24 | | | | 2-1-2047 | | | | 1,750,000 | | | | 1,817,218 | |
| | | | |
Hempstead Town NY Local Development Corporation The Academy Charter School Project Series A | | | 5.89 | | | | 2-1-2032 | | | | 2,745,000 | | | | 2,864,023 | |
| | | | |
Hempstead Town NY Local Development Corporation The Academy Charter School Project Series A | | | 7.65 | | | | 2-1-2044 | | | | 2,700,000 | | | | 2,798,145 | |
| | | | |
Monroe County NY Industrial Development Monroe Community College Project Series A (AGM Insured) | | | 5.00 | | | | 1-15-2022 | | | | 790,000 | | | | 855,428 | |
| | | | |
Monroe County NY Industrial Development Monroe Community College Project Series A (AGM Insured) | | | 5.00 | | | | 1-15-2023 | | | | 645,000 | | | | 721,903 | |
| | | | |
Monroe County NY Industrial Development Monroe Community College Project Series A (AGM Insured) | | | 5.00 | | | | 1-15-2024 | | | | 905,000 | | | | 1,040,316 | |
Wells Fargo Intermediate Tax/AMT-Free Fund | 29
Portfolio of investments—June 30, 2019
| | | | | | | | | | | | | | | | |
| | | Interest rate | | | Maturity date | | | Principal | | | Value | |
|
| Education Revenue (continued) | |
| | | | |
Monroe County NY Industrial Development St. John Fisher College Project Series A | | | 5.00 | % | | | 6-1-2020 | | | $ | 2,125,000 | | | $ | 2,193,808 | |
| | | | |
New York Dormitory Authority Mount Sinai School of Medicine | | | 5.50 | | | | 7-1-2022 | | | | 2,000,000 | | | | 2,000,000 | |
| | | | |
Niagara NY Area Development Corporation | | | 5.00 | | | | 5-1-2020 | | | | 1,160,000 | | | | 1,195,914 | |
| | | | |
Niagara NY Area Development Corporation | | | 5.00 | | | | 5-1-2022 | | | | 1,350,000 | | | | 1,485,770 | |
| | | | |
Troy NY Capital Resource Corporation Rensselaer Polytechnic Series B | | | 5.00 | | | | 9-1-2020 | | | | 1,430,000 | | | | 1,488,187 | |
| |
| | | | 18,859,741 | |
| | | | | | | | | | | | | | | | |
| | | | |
| GO Revenue: 0.91% | | | | | | | | | | | | |
| | | | |
Hempstead Town Nassau County NY Public Improvement Series A | | | 4.00 | | | | 6-15-2028 | | | | 5,000,000 | | | | 5,857,900 | |
| | | | |
Nassau County NY | | | 5.00 | | | | 10-1-2024 | | | | 4,965,000 | | | | 5,850,458 | |
| | | | |
New York NY Subordinate Bond Series 2017A-6 (Landesbank Hessen-Thüringen SPA) ø | | | 1.97 | | | | 8-1-2044 | | | | 3,200,000 | | | | 3,200,000 | |
| | | | |
New York NY Series B | | | 5.00 | | | | 12-1-2032 | | | | 2,000,000 | | | | 2,411,320 | |
| | | | |
New York NY Series C | | | 5.00 | | | | 8-1-2031 | | | | 5,000,000 | | | | 5,851,550 | |
| | | | |
Yonkers NY Series A (AGM Insured) | | | 5.00 | | | | 10-1-2024 | | | | 1,000,000 | | | | 1,085,850 | |
| |
| | | | 24,257,078 | |
| | | | | | | | | | | | | | | | |
| | | | |
| Miscellaneous Revenue: 0.71% | | | | | | | | | | | | |
| | | | |
New York Dormitory Authority Non State Supported Debt Prerefunded Bond | | | 4.00 | | | | 7-1-2019 | | | | 30,000 | | | | 30,000 | |
| | | | |
New York Dormitory Authority Non State Supported Debt Unrefunded Bond | | | 4.00 | | | | 7-1-2019 | | | | 640,000 | | | | 640,000 | |
| | | | |
New York Dormitory Authority Series D | | | 5.00 | | | | 10-1-2031 | | | | 2,005,000 | | | | 2,488,005 | |
| | | | |
New York NY Transitional Finance Authority Building Aid Bond Series S-1 | | | 5.00 | | | | 7-15-2032 | | | | 2,500,000 | | | | 3,057,125 | |
| | | | |
New York NY Trust for Cultural Resources Series A-1 | | | 5.00 | | | | 7-1-2031 | | | | 2,475,000 | | | | 2,603,428 | |
| | | | |
New York Tender Option Bond Trust Receipts/Floater Certificates Series 2019-BAML3002 (Bank of America NA LIQ) 144Aø | | | 1.98 | | | | 1-15-2056 | | | | 10,000,000 | | | | 10,000,000 | |
| |
| | | | 18,818,558 | |
| | | | | | | | | | | | | | | | |
| | | | |
| Tax Revenue: 2.31% | | | | | | | | | | | | |
| | | | |
New York Convention Center Development Corporation | | | 5.00 | | | | 11-15-2028 | | | | 8,000,000 | | | | 9,644,320 | |
| | | | |
New York Dormitory Authority Series A | | | 5.00 | | | | 3-15-2028 | | | | 5,000,000 | | | | 5,953,350 | |
| | | | |
New York Dormitory Authority Series A | | | 5.00 | | | | 2-15-2031 | | | | 3,000,000 | | | | 3,639,720 | |
| | | | |
New York Dormitory Authority Series B (Ambac Insured) | | | 5.50 | | | | 3-15-2025 | | | | 3,885,000 | | | | 4,743,624 | |
| | | | |
New York Dormitory Authority Series E | | | 5.00 | | | | 3-15-2035 | | | | 15,000,000 | | | | 18,620,400 | |
| | | | |
New York NY Transitional Finance Authority Series B | | | 5.00 | | | | 8-1-2027 | | | | 1,115,000 | | | | 1,306,490 | |
| | | | |
New York NY Transitional Finance Authority Series C | | | 5.00 | | | | 11-1-2027 | | | | 5,000,000 | | | | 5,970,300 | |
| | | | |
New York NY Transitional Finance Authority Subordinate Bond Series B-1 | | | 5.00 | | | | 11-1-2028 | | | | 1,000,000 | | | | 1,206,570 | |
| | | | |
New York Urban Development Corporation Personal Income Tax Series A | | | 5.00 | | | | 3-15-2031 | | | | 3,815,000 | | | | 4,396,101 | |
| | | | |
New York Urban Development Corporation Personal income Tax Series A | | | 5.00 | | | | 3-15-2032 | | | | 5,000,000 | | | | 5,981,400 | |
| |
| | | | 61,462,275 | |
| | | | | | | | | | | | | | | | |
| | | | |
| Tobacco Revenue: 0.04% | | | | | | | | | | | | |
| | | | |
Suffolk NY Tobacco Asset Securitization Corporation Tobacco Settlement Series B | | | 4.00 | | | | 6-1-2022 | | | | 420,000 | | | | 437,590 | |
| | | | |
Suffolk NY Tobacco Asset Securitization Corporation Tobacco Settlement Series B | | | 5.00 | | | | 6-1-2023 | | | | 500,000 | | | | 534,470 | |
| |
| | | | 972,060 | |
| | | | | | | | | | | | | | | | |
| Transportation Revenue: 2.75% | | | | | | | | | | | | |
| | | | |
New York Metropolitan Transportation Authority Series A | | | 5.00 | | | | 11-15-2024 | | | | 6,010,000 | | | | 6,755,781 | |
| | | | |
New York Metropolitan Transportation Authority Series A | | | 5.00 | | | | 11-15-2030 | | | | 4,010,000 | | | | 4,426,960 | |
| | | | |
New York Metropolitan Transportation Authority Series C | | | 5.25 | | | | 11-15-2028 | | | | 5,000,000 | | | | 6,066,000 | |
| | | | |
New York Metropolitan Transportation Authority Series C | | | 5.25 | | | | 11-15-2029 | | | | 11,100,000 | | | | 13,418,901 | |
| | | | |
New York Metropolitan Transportation Authority Series C | | | 5.25 | | | | 11-15-2030 | | | | 8,350,000 | | | | 10,045,635 | |
| | | | |
New York Metropolitan Transportation Authority Series C | | | 5.25 | | | | 11-15-2031 | | | | 4,500,000 | | | | 5,395,995 | |
30 | Wells Fargo Intermediate Tax/AMT-Free Fund
Portfolio of investments—June 30, 2019
| | | | | | | | | | | | | | | | |
| | | Interest rate | | | Maturity date | | | Principal | | | Value | |
| Transportation Revenue (continued) | | | | | | | | | | | | |
| | | | |
New York Metropolitan Transportation Authority Series D | | | 5.00 | % | | | 11-15-2027 | | | $ | 2,000,000 | | | $ | 2,293,020 | |
| | | | |
New York Metropolitan Transportation Authority Series F | | | 5.00 | | | | 11-15-2025 | | | | 2,490,000 | | | | 2,992,432 | |
| | | | |
New York Metropolitan Transportation Authority Series F | | | 5.00 | | | | 11-15-2028 | | | | 2,450,000 | | | | 2,710,803 | |
| | | | |
Triborough NY MTA Bridges & Tunnels Authority Series B | | | 5.00 | | | | 11-15-2030 | | | | 6,000,000 | | | | 8,028,240 | |
| | | | |
Triborough NY MTA Bridges & Tunnels Authority Series C | | | 5.00 | | | | 11-15-2034 | | | | 4,000,000 | | | | 5,006,680 | |
| | | | |
Triborough NY MTA Bridges & Tunnels Authority Series C | | | 5.00 | | | | 11-15-2035 | | | | 5,000,000 | | | | 6,231,550 | |
| |
| | | | 73,371,997 | |
| | | | | | | | | | | | | | | | |
| | | | |
| Utilities Revenue: 0.72% | | | | | | | | | | | | |
| | | | |
Long Island NY Power Authority Electric System Series C (1 Month LIBOR +0.75%)± | | | 2.46 | | | | 5-1-2033 | | | | 10,000,000 | | | | 10,006,300 | |
| | | | |
New York Utility Debt Securitization Authority | | | 5.00 | | | | 12-15-2032 | | | | 1,250,000 | | | | 1,434,113 | |
| | | | |
New York Utility Debt Securitization Authority | | | 5.00 | | | | 12-15-2033 | | | | 6,575,000 | | | | 7,887,107 | |
| |
| | | | 19,327,520 | |
| | | | | | | | | | | | | | | | |
| | | | |
| Water & Sewer Revenue: 0.31% | | | | | | | | | | | | |
| | | | |
Nassau NY Water Authority Series A | | | 5.00 | | | | 4-1-2027 | | | | 350,000 | | | | 411,534 | |
| | | | |
Nassau NY Water Authority Series A | | | 5.00 | | | | 4-1-2028 | | | | 300,000 | | | | 352,530 | |
| | | | |
Nassau NY Water Authority Series B | | | 5.00 | | | | 4-1-2024 | | | | 400,000 | | | | 463,764 | |
| | | | |
Nassau NY Water Authority Series B | | | 5.00 | | | | 4-1-2026 | | | | 755,000 | | | | 890,658 | |
| | | | |
New York NY Municipal Water Finance Authority Series GG | | | 5.00 | | | | 6-15-2029 | | | | 1,295,000 | | | | 1,547,292 | |
| | | | |
New York NY Municipal Water Finance Authority Series HH | | | 5.00 | | | | 6-15-2037 | | | | 4,000,000 | | | | 4,664,240 | |
| |
| | | | 8,330,018 | |
| | | | | | | | | | | | | | | | |
| |
| | | | 228,569,513 | |
| | | | | | | | | | | | | | | | |
| | | | |
North Carolina: 0.48% | | | | | | | | | | | | | | | | |
| | | | |
| Health Revenue: 0.37% | | | | | | | | | | | | |
| | | | |
Charlotte-Mecklenburg NC Hospital Authority Series 2007C (JPMorgan Chase & Company SPA) ø | | | 1.94 | | | | 1-15-2037 | | | | 8,000,000 | | | | 8,000,000 | |
| | | | |
New Hanover County NC Regional Medical Center | | | 5.00 | | | | 10-1-2022 | | | | 250,000 | | | | 278,005 | |
| | | | |
New Hanover County NC Regional Medical Center | | | 5.00 | | | | 10-1-2023 | | | | 1,000,000 | | | | 1,141,960 | |
| | | | |
North Carolina Medical Care Commission Novant Health Obligated Group Series A (JPMorgan Chase & Company SPA) ø | | | 1.95 | | | | 11-1-2034 | | | | 400,000 | | | | 400,000 | |
| |
| | | | 9,819,965 | |
| | | | | | | | | | | | | | | | |
|
| Miscellaneous Revenue: 0.11% | |
| | | | |
North Carolina Grant Anticipation Vehicle Bond | | | 5.00 | | | | 3-1-2029 | | | | 2,470,000 | | | | 2,894,223 | |
| | | | |
Onslow County NC Limited Obligation Series A | | | 4.00 | | | | 6-1-2022 | | | | 90,000 | | | | 96,641 | |
| |
| | | | 2,990,864 | |
| | | | | | | | | | | | | | | | |
| |
| | | | 12,810,829 | |
| | | | | | | | | | | | | | | | |
| | | | |
North Dakota: 0.00% | | | | | | | | | | | | | | | | |
| | | | |
| Housing Revenue: 0.00% | | | | | | | | | | | | |
| | | | |
North Dakota Housing Finance Agency Series D | | | 4.50 | | | | 1-1-2029 | | | | 80,000 | | | | 80,157 | |
| | | | | | | | | | | | | | | | |
| | | | |
Ohio: 1.75% | | | | | | | | | | | | | | | | |
| | | | |
| Airport Revenue: 0.01% | | | | | | | | | | | | |
| | | | |
Cleveland OH Airport System Series D (U.S. Bank NA LOC) ø | | | 1.89 | | | | 1-1-2024 | | | | 375,000 | | | | 375,000 | |
| | | | | | | | | | | | | | | | |
Wells Fargo Intermediate Tax/AMT-Free Fund | 31
Portfolio of investments—June 30, 2019
| | | | | | | | | | | | | | | | |
| | | Interest rate | | | Maturity date | | | Principal | | | Value | |
| Education Revenue: 0.04% | | | | | | | | | | | | |
| | | | |
Summit County OH Port Authority University of Akron Student Housing Project | | | 5.25 | % | | | 1-1-2024 | | | $ | 685,000 | | | $ | 724,360 | |
| | | | |
Summit County OH Port Authority University of Akron Student Housing Project | | | 5.25 | | | | 1-1-2024 | | | | 315,000 | | | | 331,160 | |
| |
| | | | 1,055,520 | |
| | | | | | | | | | | | | | | | |
| | | | |
| GO Revenue: 0.08% | | | | | | | | | | | | |
| | | | |
Columbus OH Various Purposes Series 2 | | | 5.00 | | | | 7-1-2026 | | | | 1,775,000 | | | | 2,190,954 | |
| | | | | | | | | | | | | | | | |
| | | | |
| Miscellaneous Revenue: 0.59% | | | | | | | | | | | | |
| | | | |
Cincinnati OH City School District Improvement Project Certificate of Participation | | | 5.00 | | | | 12-15-2024 | | | | 4,815,000 | | | | 5,675,537 | |
| | | | |
Cincinnati OH City School District Improvement Project Certificate of Participation | | | 5.00 | | | | 12-15-2025 | | | | 2,095,000 | | | | 2,463,992 | |
| | | | |
Clermont County OH Port Authority West Clermont Local School District Project (Build America Mutual Assurance Company Insured) | | | 5.00 | | | | 12-1-2025 | | | | 500,000 | | | | 596,800 | |
| | | | |
Clermont County OH Port Authority West Clermont Local School District Project (Build America Mutual Assurance Company Insured) | | | 5.00 | | | | 12-1-2026 | | | | 600,000 | | | | 713,046 | |
| | | | |
Clermont County OH Port Authority West Clermont Local School District Project (Build America Mutual Assurance Company Insured) | | | 5.00 | | | | 12-1-2028 | | | | 1,250,000 | | | | 1,478,238 | |
| | | | |
JobsOhio Beverage System Statewide Liquor Profits Senior Lien Series A | | | 5.00 | | | | 1-1-2022 | | | | 2,500,000 | | | | 2,723,250 | |
| | | | |
Ohio Building Authority Series A | | | 5.00 | | | | 10-1-2024 | | | | 1,000,000 | | | | 1,079,610 | |
| | | | |
RiverSouth OH Lazarus Building Redevelopment Series A | | | 5.75 | | | | 12-1-2027 | | | | 835,000 | | | | 836,946 | |
| |
| | | | 15,567,419 | |
| | | | | | | | | | | | | | | | |
| | | | |
| Tax Revenue: 0.12% | | | | | | | | | | | | |
| | | | |
Cleveland OH Subordinate Lien Income Tax Refunding Bond Series B-1 | | | 5.00 | | | | 10-1-2030 | | | | 2,500,000 | | | | 3,102,625 | |
| | | | | | | | | | | | | | | | |
| | | | |
| Transportation Revenue: 0.04% | | | | | | | | | | | | |
| | | | |
Ohio Turnpike Commission Junior Lien Infrastructure Projects Series A-1 | | | 5.25 | | | | 2-15-2029 | | | | 1,000,000 | | | | 1,127,610 | |
| | | | | | | | | | | | | | | | |
| | | | |
| Utilities Revenue: 0.16% | | | | | | | | | | | | |
| | | | |
Cleveland OH Public Power System Refunding Bond (AGM Insured) | | | 5.00 | | | | 11-15-2033 | | | | 625,000 | | | | 755,506 | |
| | | | |
Lancaster OH Port Authority Gas Supply | | | 5.00 | | | | 8-1-2049 | | | | 3,000,000 | | | | 3,490,950 | |
| |
| | | | 4,246,456 | |
| | | | | | | | | | | | | | | | |
| | | | |
| Water & Sewer Revenue: 0.71% | | | | | | | | | | | | |
| | | | |
Ohio Water Development Authority Fresh Water | | | 5.00 | | | | 6-1-2028 | | | | 14,000,000 | | | | 17,732,820 | |
| | | | |
Ohio Water Development Authority Pollution Control Series A | | | 5.00 | | | | 12-1-2031 | | | | 1,000,000 | | | | 1,231,720 | |
| |
| | | | 18,964,540 | |
| | | | | | | | | | | | | | | | |
| |
| | | | 46,630,124 | |
| | | | | | | | | | | | | | | | |
| | | | |
Oklahoma: 2.28% | | | | | | | | | | | | | | | | |
| | | | |
| Airport Revenue: 0.22% | | | | | | | | | | | | |
| | | | |
Tulsa OK Airports Improvement Trust Series D (Build America Mutual Assurance Company Insured) | | | 5.00 | | | | 6-1-2021 | | | | 1,185,000 | | | | 1,222,268 | |
| | | | |
Tulsa OK Airports Improvement Trust Series D (Build America Mutual Assurance Company Insured) | | | 5.00 | | | | 6-1-2022 | | | | 520,000 | | | | 536,115 | |
| | | | |
Tulsa OK Airports Improvement Trust Series D (Build America Mutual Assurance Company Insured) | | | 5.00 | | | | 6-1-2025 | | | | 1,200,000 | | | | 1,236,960 | |
| | | | |
Tulsa OK Airports Improvement Trust Series D (Build America Mutual Assurance Company Insured) | | | 5.00 | | | | 6-1-2026 | | | | 1,250,000 | | | | 1,288,500 | |
| | | | |
Tulsa OK Airports Improvement Trust Series D (Build America Mutual Assurance Company Insured) | | | 5.00 | | | | 6-1-2027 | | | | 1,000,000 | | | | 1,030,800 | |
32 | Wells Fargo Intermediate Tax/AMT-Free Fund
Portfolio of investments—June 30, 2019
| | | | | | | | | | | | | | | | |
| | | Interest rate | | | Maturity date | | | Principal | | | Value | |
| | | | |
| Airport Revenue (continued) | | | | | | | | | | | | |
| | | | |
Tulsa OK Airports Improvement Trust Series D (Build America Mutual Assurance Company Insured) | | | 5.00 | % | | | 6-1-2028 | | | $ | 500,000 | | | $ | 515,540 | |
| |
| | | | 5,830,183 | |
| | | | | | | | | | | | | | | | |
| | | | |
| Miscellaneous Revenue: 1.71% | | | | | | | | | | | | |
| | | | |
Cache OK Educational Facilities Authority Cache Public Schools Project Series A | | | 5.00 | | | | 9-1-2024 | | | | 2,905,000 | | | | 3,371,863 | |
| | | | |
Cache OK Educational Facilities Authority Cache Public Schools Project Series A | | | 5.00 | | | | 9-1-2025 | | | | 3,055,000 | | | | 3,626,560 | |
| | | | |
Canadian County OK Education Facilities Authority Mustang Public Schools Project | | | 4.00 | | | | 9-1-2025 | | | | 1,110,000 | | | | 1,259,395 | |
| | | | |
Canadian County OK Education Facilities Authority Mustang Public Schools Project | | | 5.00 | | | | 9-1-2027 | | | | 2,000,000 | | | | 2,429,540 | |
| | | | |
Canadian County OK Education Facilities Authority Mustang Public Schools Project | | | 5.00 | | | | 9-1-2028 | | | | 2,180,000 | | | | 2,637,604 | |
| | | | |
Carter County OK Public Facilities Authority Educational Facilities Plainview Public School Project | | | 5.00 | | | | 12-1-2026 | | | | 1,000,000 | | | | 1,218,130 | |
| | | | |
Carter County OK Public Facilities Authority Educational Facilities Plainview Public School Project | | | 5.00 | | | | 12-1-2027 | | | | 1,000,000 | | | | 1,212,320 | |
| | | | |
Carter County OK Public Facilities Authority Educational Facilities Plainview Public School Project | | | 5.00 | | | | 12-1-2028 | | | | 1,285,000 | | | | 1,546,755 | |
| | | | |
Cleveland County OK Educational Facilities Authority Noble Public Schools Project | | | 5.00 | | | | 9-1-2027 | | | | 700,000 | | | | 850,857 | |
| | | | |
Cleveland County OK Educational Facilities Authority Noble Public Schools Project | | | 5.00 | | | | 9-1-2028 | | | | 400,000 | | | | 485,372 | |
| | | | |
Cleveland County OK Educational Facilities Authority Noble Public Schools Project | | | 5.00 | | | | 9-1-2029 | | | | 250,000 | | | | 302,698 | |
| | | | |
Cleveland County OK Educational Facilities Authority Noble Public Schools Project | | | 5.00 | | | | 9-1-2030 | | | | 625,000 | | | | 753,169 | |
| | | | |
Cleveland County OK Educational Facilities Authority Noble Public Schools Project | | | 5.00 | | | | 9-1-2031 | | | | 675,000 | | | | 808,583 | |
| | | | |
Comanche County OK Educational Facilities Authority Elgin Public Schools Project Series A | | | 5.00 | | | | 12-1-2032 | | | | 1,600,000 | | | | 1,912,352 | |
| | | | |
Cushing OK Educational Facilities Authority | | | 5.00 | | | | 9-1-2022 | | | | 2,210,000 | | | | 2,443,597 | |
| | | | |
Dewey County OK Educational Facilities Authority Seiling Public Schools Project | | | 5.00 | | | | 9-1-2026 | | | | 1,230,000 | | | | 1,495,791 | |
| | | | |
Dewey County OK Educational Facilities Authority Seiling Public Schools Project | | | 5.00 | | | | 9-1-2027 | | | | 1,240,000 | | | | 1,501,665 | |
| | | | |
Garvin County OK Educational Facilities Authority Lindsay Public Schools Project | | | 5.00 | | | | 9-1-2019 | | | | 860,000 | | | | 864,997 | |
| | | | |
Garvin County OK Educational Facilities Authority Lindsay Public Schools Project | | | 5.00 | | | | 9-1-2020 | | | | 455,000 | | | | 472,381 | |
| | | | |
Garvin County OK Educational Facilities Authority Lindsay Public Schools Project | | | 5.00 | | | | 9-1-2026 | | | | 1,000,000 | | | | 1,176,680 | |
| | | | |
Garvin County OK Educational Facilities Authority Lindsay Public Schools Project | | | 5.00 | | | | 9-1-2027 | | | | 1,245,000 | | | | 1,468,316 | |
| | | | |
Grady County OK Educational Facilities Tuttle Public Schools Project | | | 5.00 | | | | 9-1-2023 | | | | 1,000,000 | | | | 1,135,900 | |
| | | | |
Grady County OK Educational Facilities Tuttle Public Schools Project | | | 5.00 | | | | 9-1-2024 | | | | 1,075,000 | | | | 1,250,075 | |
| | | | |
Grady County OK Educational Facilities Tuttle Public Schools Project | | | 5.00 | | | | 9-1-2025 | | | | 500,000 | | | | 594,510 | |
| | | | |
Grady County OK Educational Facilities Tuttle Public Schools Project | | | 5.00 | | | | 9-1-2028 | | | | 1,160,000 | | | | 1,369,183 | |
| | | | |
Muskogee OK Industrial Trust Educational Facilities | | | 5.00 | | | | 9-1-2020 | | | | 1,250,000 | | | | 1,294,800 | |
| | | | |
Muskogee OK Industrial Trust Educational Facilities | | | 5.00 | | | | 9-1-2021 | | | | 1,000,000 | | | | 1,061,720 | |
| | | | |
Muskogee OK Industrial Trust Educational Facilities | | | 5.00 | | | | 9-1-2022 | | | | 1,000,000 | | | | 1,088,220 | |
| | | | |
Oklahoma Development Finance Authority | | | 4.00 | | | | 6-1-2023 | | | | 1,270,000 | | | | 1,391,514 | |
| | | | |
Oklahoma Development Finance Authority | | | 5.00 | | | | 6-1-2023 | | | | 1,230,000 | | | | 1,395,300 | |
| | | | |
Oklahoma Development Finance Authority State System of Higher Education Series B | | | 5.00 | | | | 6-1-2030 | | | | 500,000 | | | | 631,400 | |
| | | | |
Oklahoma Development Finance Authority State System of Higher Education Series B | | | 5.00 | | | | 6-1-2031 | | | | 520,000 | | | | 652,226 | |
Wells Fargo Intermediate Tax/AMT-Free Fund | 33
Portfolio of investments—June 30, 2019
| | | | | | | | | | | | | | | | |
| | | Interest rate | | | Maturity date | | | Principal | | | Value | |
| | | | |
| Miscellaneous Revenue (continued) | | | | | | | | | | | | |
| | | | |
Oklahoma Development Finance Authority State System of Higher Education Series B | | | 5.00 | % | | | 6-1-2032 | | | $ | 550,000 | | | $ | 685,916 | |
| | | | |
Tulsa County OK Industrial Authority Educational Facilities Glenpool Public Schools Project Series A | | | 5.00 | | | | 9-1-2025 | | | | 880,000 | | | | 1,043,504 | |
| |
| | | | 45,432,893 | |
| | | | | | | | | | | | | | | | |
| | | | |
| Tax Revenue: 0.17% | | | | | | | | | | | | |
| | | | |
Oklahoma City OK Public Property Authority | | | 5.00 | | | | 10-1-2026 | | | | 1,495,000 | | | | 1,778,482 | |
| | | | |
Oklahoma City OK Public Property Authority | | | 5.00 | | | | 10-1-2027 | | | | 1,140,000 | | | | 1,353,431 | |
| | | | |
Oklahoma City OK Public Property Authority | | | 5.00 | | | | 10-1-2028 | | | | 1,265,000 | | | | 1,499,569 | |
| |
| | | | 4,631,482 | |
| | | | | | | | | | | | | | | | |
| | | | |
| Utilities Revenue: 0.14% | | | | | | | | | | | | |
| | | | |
Claremore OK Public Works Authority | | | 4.00 | | | | 6-1-2022 | | | | 2,595,000 | | | | 2,772,654 | |
| | | | |
Claremore OK Public Works Authority | | | 4.00 | | | | 6-1-2023 | | | | 1,010,000 | | | | 1,076,206 | |
| |
| | | | 3,848,860 | |
| | | | | | | | | | | | | | | | |
| | | | |
| Water & Sewer Revenue: 0.04% | | | | | | | | | | | | |
| | | | |
McGee Creek OK Authority (National Insured) | | | 6.00 | | | | 1-1-2023 | | | | 920,000 | | | | 994,272 | |
| | | | | | | | | | | | | | | | |
| |
| | | | 60,737,690 | |
| | | | | | | | | | | | | | | | |
| | | | |
Oregon: 0.64% | | | | | | | | | | | | | | | | |
| | | | |
| GO Revenue: 0.53% | | | | | | | | | | | | |
| | | | |
Benton & Linn Counties OR Corvallis School District Series B (AGM Insured) | | | 5.00 | | | | 6-15-2031 | | | | 5,110,000 | | | | 6,397,516 | |
| | | | |
Washington & Multnomah Counties OR Beaverton School District Series D (AGM Insured) | | | 5.00 | | | | 6-15-2035 | | | | 1,500,000 | | | | 1,821,555 | |
| | | | |
Washington County OR Full Faith & Credit Obligations Series B | | | 5.00 | | | | 3-1-2022 | | | | 5,345,000 | | | | 5,865,015 | |
| |
| | | | 14,084,086 | |
| | | | | | | | | | | | | | | | |
| | | | |
| Health Revenue: 0.11% | | | | | | | | | | | | |
| | | | |
Medford OR Hospital Facilities Authority | | | 5.00 | | | | 10-1-2020 | | | | 1,155,000 | | | | 1,202,667 | |
| | | | |
Oregon Facilities Authority Samaritan Health Services Project Series A | | | 5.00 | | | | 10-1-2026 | | | | 1,500,000 | | | | 1,792,185 | |
| |
| | | | 2,994,852 | |
| | | | | | | | | | | | | | | | |
| |
| | | | 17,078,938 | |
| | | | | | | | | | | | | | | | |
|
| Pennsylvania: 9.29% | |
| | | | |
| Education Revenue: 1.41% | | | | | | | | | | | | |
| | | | |
Adams County PA IDA Gettysburg College Project | | | 5.00 | | | | 8-15-2024 | | | | 1,500,000 | | | | 1,556,325 | |
| | | | |
Adams County PA IDA Gettysburg College Project | | | 5.00 | | | | 8-15-2025 | | | | 1,500,000 | | | | 1,556,325 | |
| | | | |
Chester County PA IDA Collegium Charter School Project Series A | | | 5.00 | | | | 10-15-2027 | | | | 1,500,000 | | | | 1,654,260 | |
| | | | |
Lycoming County PA Authority Pennsylvania College of Technology | | | 5.50 | | | | 7-1-2026 | | | | 4,000,000 | | | | 4,304,160 | |
| | | | |
Northampton County PA General Purpose Authority College Refunding Bond | | | 5.00 | | | | 11-1-2027 | | | | 1,000,000 | | | | 1,258,830 | |
| | | | |
Northeastern Pennsylvania Hospital & Education Authority Series A | | | 5.00 | | | | 3-1-2026 | | | | 885,000 | | | | 1,000,802 | |
| | | | |
Northeastern Pennsylvania Hospital & Education Authority Series A | | | 5.00 | | | | 3-1-2028 | | | | 660,000 | | | | 742,276 | |
| | | | |
Pennsylvania HEFAR Series AQ | | | 5.00 | | | | 6-15-2023 | | | | 6,090,000 | | | | 6,905,999 | |
| | | | |
Pennsylvania HEFAR Series AR | | | 5.00 | | | | 6-15-2025 | | | | 1,000,000 | | | | 1,187,150 | |
| | | | |
Pennsylvania HEFAR Series AS | | | 5.00 | | | | 6-15-2025 | | | | 1,575,000 | | | | 1,869,761 | |
| | | | |
Pennsylvania HEFAR Series AS | | | 5.00 | | | | 6-15-2027 | | | | 2,190,000 | | | | 2,633,190 | |
| | | | |
Pennsylvania HEFAR Series LL1 | | | 5.00 | | | | 11-1-2019 | | | | 880,000 | | | | 884,752 | |
| | | | |
Pennsylvania HEFAR Series LL1 | | | 5.00 | | | | 11-1-2020 | | | | 590,000 | | | | 601,765 | |
| | | | |
Pennsylvania HEFAR Series LL1 | | | 5.00 | | | | 11-1-2022 | | | | 1,310,000 | | | | 1,366,173 | |
34 | Wells Fargo Intermediate Tax/AMT-Free Fund
Portfolio of investments—June 30, 2019
| | | | | | | | | | | | | | | | |
| | | Interest rate | | | Maturity date | | | Principal | | | Value | |
| | | | |
| Education Revenue (continued) | | | | | | | | | | | | |
| | | | |
Pennsylvania Public School Building Authority | | | 5.00 | % | | | 5-1-2023 | | | $ | 2,185,000 | | | $ | 2,464,920 | |
| | | | |
Pennsylvania Public School Building Authority | | | 5.00 | | | | 6-15-2025 | | | | 2,265,000 | | | | 2,656,664 | |
| | | | |
Philadelphia PA IDA | | | 6.13 | | | | 6-15-2023 | | | | 795,000 | | | | 850,229 | |
| | | | |
Philadelphia PA IDA | | | 5.88 | | | | 6-15-2022 | | | | 755,000 | | | | 794,811 | |
| | | | |
Philadelphia PA IDA | | | 7.00 | | | | 5-1-2026 | | | | 740,000 | | | | 791,208 | |
| | | | |
Philadelphia PA IDA Master Charter School Aid | | | 5.00 | | | | 8-1-2020 | | | | 110,000 | | | | 112,123 | |
| | | | |
Philadelphia PA IDA West Philadelphia Achievement Charter Elementary School Project | | | 6.25 | | | | 5-1-2021 | | | | 125,000 | | | | 129,931 | |
| | | | |
Philadelphia PA Public School Building Authority (Build America Mutual Assurance Company Insured) | | | 5.00 | | | | 6-15-2026 | | | | 2,000,000 | | | | 2,340,940 | |
| |
| | | | 37,662,594 | |
| | | | | | | | | | | | | | | | |
| | | | |
| GO Revenue: 3.39% | | | | | | | | | | | | |
| | | | |
Allegheny County PA Moon Area School District Series A | | | 5.00 | | | | 11-15-2024 | | | | 3,400,000 | | | | 3,933,052 | |
| | | | |
Allegheny County PA Series 72 | | | 5.25 | | | | 12-1-2033 | | | | 4,000,000 | | | | 4,579,840 | |
| | | | |
Allegheny County PA Shaler Area School District (Build America Mutual Assurance Company Insured) | | | 5.00 | | | | 9-1-2038 | | | | 2,300,000 | | | | 2,797,467 | |
| | | | |
Central Dauphin PA School District | | | 5.00 | | | | 2-1-2030 | | | | 1,110,000 | | | | 1,338,083 | |
| | | | |
Johnstown PA School District (AGM Insured) | | | 5.00 | | | | 8-1-2024 | | | | 2,730,000 | | | | 2,910,671 | |
| | | | |
Norristown PA Area School District Montgomery County Series 2018 (Build America Mutual Assurance Company Insured) | | | 5.00 | | | | 9-1-2035 | | | | 2,035,000 | | | | 2,383,860 | |
| | | | |
Pennsylvania Hills PA School District (Build America Mutual Assurance Company Insured) | | | 4.00 | | | | 10-1-2021 | | | | 1,460,000 | | | | 1,546,330 | |
| | | | |
Philadelphia PA (AGM Insured) | | | 5.00 | | | | 8-1-2025 | | | | 7,000,000 | | | | 8,397,060 | |
| | | | |
Philadelphia PA School District Refunding Bond Series C | | | 5.00 | | | | 9-1-2021 | | | | 2,200,000 | | | | 2,355,628 | |
| | | | |
Philadelphia PA School District Refunding Bond Series D | | | 5.00 | | | | 9-1-2022 | | | | 3,750,000 | | | | 4,132,913 | |
| | | | |
Philadelphia PA School District Refunding Bond Series E | | | 5.25 | | | | 9-1-2021 | | | | 1,490,000 | | | | 1,552,476 | |
| | | | |
Philadelphia PA School District Refunding Bond Series F | | | 5.00 | | | | 9-1-2028 | | | | 5,000,000 | | | | 5,942,500 | |
| | | | |
Philadelphia PA School District Refunding Bond Series F | | | 5.00 | | | | 9-1-2029 | | | | 5,000,000 | | | | 5,912,750 | |
| | | | |
Philadelphia PA School District Refunding Bond Series F | | | 5.00 | | | | 9-1-2031 | | | | 1,240,000 | | | | 1,451,507 | |
| | | | |
Philadelphia PA School District Refunding Bond Series F | | | 5.00 | | | | 9-1-2032 | | | | 1,000,000 | | | | 1,167,220 | |
| | | | |
Philadelphia PA Series A | | | 5.00 | | | | 8-1-2024 | | | | 1,000,000 | | | | 1,169,600 | |
| | | | |
Philadelphia PA Series A | | | 5.00 | | | | 7-15-2026 | | | | 3,000,000 | | | | 3,411,210 | |
| | | | |
Philadelphia PA Series A | | | 5.00 | | | | 8-1-2027 | | | | 1,500,000 | | | | 1,859,745 | |
| | | | |
Philadelphia PA Series A | | | 5.00 | | | | 8-1-2033 | | | | 2,000,000 | | | | 2,389,700 | |
| | | | |
Philadelphia PA Series A | | | 5.25 | | | | 7-15-2028 | | | | 2,590,000 | | | | 2,959,723 | |
| | | | |
Philadelphia PA Series A | | | 5.25 | | | | 7-15-2029 | | | | 4,410,000 | | | | 5,022,990 | |
| | | | |
Philadelphia PA Series A | | | 5.25 | | | | 7-15-2032 | | | | 4,380,000 | | | | 4,956,539 | |
| | | | |
Pittsburgh PA Moon Area School District Series A | | | 5.00 | | | | 11-15-2029 | | | | 1,000,000 | | | | 1,142,290 | |
| | | | |
Pittsburgh PA Series A | | | 4.00 | | | | 9-1-2022 | | | | 1,000,000 | | | | 1,080,100 | |
| | | | |
Pittsburgh PA Series A | | | 5.00 | | | | 9-1-2022 | | | | 2,060,000 | | | | 2,288,536 | |
| | | | |
Pittsburgh PA Series A | | | 5.00 | | | | 9-1-2023 | | | | 3,810,000 | | | | 4,230,167 | |
| | | | |
Reading Berks PA Series A (Build America Mutual Assurance Company Insured) | | | 5.00 | | | | 11-1-2026 | | | | 1,000,000 | | | | 1,195,000 | |
| | | | |
Reading PA School District | | | 5.00 | | | | 4-1-2021 | | | | 3,120,000 | | | | 3,291,444 | |
| | | | |
Reading PA School District (AGM Insured) | | | 5.00 | | | | 3-1-2037 | | | | 2,000,000 | | | | 2,331,460 | |
| | | | |
Reading PA School District (AGM Insured) | | | 5.00 | | | | 3-1-2038 | | | | 1,735,000 | | | | 2,010,761 | |
| | | | |
Scranton Lackawanna County PA School District Bond Series A (Build America Mutual Assurance Company Insured) | | | 5.00 | | | | 6-1-2037 | | | | 500,000 | | | | 592,185 | |
| |
| | | | 90,332,807 | |
| | | | | | | | | | | | | | | | |
| | | | |
| Health Revenue: 1.10% | | | | | | | | | | | | |
| | | | |
Allegheny County PA Hospital Development Authority Series A | | | 4.00 | | | | 7-15-2035 | | | | 5,100,000 | | | | 5,666,661 | |
| | | | |
Allegheny County PA Hospital Development Authority Series A | | | 5.00 | | | | 7-15-2031 | | | | 3,750,000 | | | | 4,699,313 | |
Wells Fargo Intermediate Tax/AMT-Free Fund | 35
Portfolio of investments—June 30, 2019
| | | | | | | | | | | | | | | | |
| | | Interest rate | | | Maturity date | | | Principal | | | Value | |
| | | | |
| Health Revenue (continued) | | | | | | | | | | | | |
| | | | |
Allegheny County PA Hospital Development Authority Series B (National Insured) | | | 6.00 | % | | | 7-1-2025 | | | $ | 2,605,000 | | | $ | 3,257,188 | |
| | | | |
Berks County PA Municipal Authority Reading Hospital & Medical Center Project Series B (SIFMA Municipal Swap +1.50%)± | | | 3.40 | | | | 11-1-2039 | | | | 10,000,000 | | | | 10,102,200 | |
| | | | |
Cumberland County PA Diakon Lutheran Social Ministries Project | | | 5.00 | | | | 1-1-2025 | | | | 1,340,000 | | | | 1,511,842 | |
| | | | |
Cumberland County PA Diakon Lutheran Social Ministries Project | | | 5.00 | | | | 1-1-2026 | | | | 1,370,000 | | | | 1,542,319 | |
| | | | |
Cumberland County PA Diakon Lutheran Social Ministries Project | | | 5.00 | | | | 1-1-2027 | | | | 1,225,000 | | | | 1,375,773 | |
| | | | |
Montgomery County PA HEFA Thomas Jefferson University | | | 4.00 | | | | 9-1-2037 | | | | 1,000,000 | | | | 1,084,000 | |
| |
| | | | 29,239,296 | |
| | | | | | | | | | | | | | | | |
| | | | |
| Miscellaneous Revenue: 1.96% | | | | | | | | | | | | |
| | | | |
Delaware County PA Vocational & Technical School Authority (Build America Mutual Assurance Company Insured) | | | 5.25 | | | | 11-1-2033 | | | | 2,000,000 | | | | 2,253,000 | |
| | | | |
Pennsylvania Certificate of Participation Municipal Real Estate Payment Series A | | | 5.00 | | | | 7-1-2028 | | | | 400,000 | | | | 492,964 | |
| | | | |
Pennsylvania Certificate of Participation Municipal Real Estate Payment Series A | | | 5.00 | | | | 7-1-2029 | | | | 300,000 | | | | 367,608 | |
| | | | |
Pennsylvania Certificate of Participation Municipal Real Estate Payment Series A | | | 5.00 | | | | 7-1-2030 | | | | 375,000 | | | | 456,551 | |
| | | | |
Pennsylvania Certificate of Participation Retained Basic Lease Payment (AGM Insured) | | | 5.00 | | | | 11-1-2022 | | | | 3,015,000 | | | | 3,337,092 | |
| | | | |
Pennsylvania Certificate of Participation Retained Basic Lease Payment (AGM Insured) | | | 5.00 | | | | 11-1-2023 | | | | 1,900,000 | | | | 2,154,182 | |
| | | | |
Pennsylvania Certificate of Participation Retained Basic Lease Payment (AGM Insured) | | | 5.00 | | | | 11-1-2024 | | | | 1,660,000 | | | | 1,928,704 | |
| | | | |
Pennsylvania Public School Building Authority (Build America Mutual Assurance Company Insured) | | | 4.00 | | | | 5-15-2021 | | | | 500,000 | | | | 524,750 | |
| | | | |
Pennsylvania Public School Building Authority (Build America Mutual Assurance Company Insured) | | | 4.00 | | | | 5-15-2022 | | | | 1,000,000 | | | | 1,045,980 | |
| | | | |
Pennsylvania Public School Building Authority | | | 5.00 | | | | 4-1-2020 | | | | 5,600,000 | | | | 5,738,600 | |
| | | | |
Pennsylvania Public School Building Authority | | | 5.00 | | | | 4-1-2029 | | | | 1,000,000 | | | | 1,079,680 | |
| | | | |
Pennsylvania Public School Building Authority Chester Upland School District Project Series B | | | 5.25 | | | | 9-15-2030 | | | | 2,000,000 | | | | 2,435,220 | |
| | | | |
Pennsylvania Public School Building Authority City of Harrisburg Project Series A (AGM Insured) | | | 5.00 | | | | 12-1-2028 | | | | 3,500,000 | | | | 4,212,950 | |
| | | | |
Pennsylvania Public School Building Authority City of Harrisburg Project Series A (AGM Insured) | | | 5.00 | | | | 12-1-2033 | | | | 4,425,000 | | | | 5,167,028 | |
| | | | |
Pennsylvania Public School Building Authority Philadelphia School District Project | | | 5.00 | | | | 4-1-2024 | | | | 2,000,000 | | | | 2,174,260 | |
| | | | |
Pennsylvania Public School Building Authority Series B (AGM Insured) | | | 5.00 | | | | 6-1-2029 | | | | 2,000,000 | | | | 2,509,160 | |
| | | | |
Pennsylvania Public School Building Authority Series B-2 (Build America Mutual Assurance Company Insured) | | | 5.00 | | | | 12-1-2024 | | | | 1,250,000 | | | | 1,457,875 | |
| | | | |
Pennsylvania Public School Building Authority Series B-2 (Build America Mutual Assurance Company Insured) | | | 5.00 | | | | 12-1-2025 | | | | 1,250,000 | | | | 1,446,975 | |
| | | | |
Pennsylvania Public School Building Authority Series B-2 (Build America Mutual Assurance Company Insured) | | | 5.00 | | | | 12-1-2026 | | | | 1,250,000 | | | | 1,443,638 | |
| | | | |
Pennsylvania Public School Building Authority Series B-2 (Build America Mutual Assurance Company Insured) | | | 5.00 | | | | 12-1-2027 | | | | 1,010,000 | | | | 1,163,369 | |
| | | | |
Philadelphia PA Municipal Authority Juvenile Justice Services Center | | | 5.00 | | | | 4-1-2031 | | | | 3,630,000 | | | | 4,331,461 | |
| | | | |
Philadelphia PA Municipal Authority Juvenile Justice Services Center | | | 5.00 | | | | 4-1-2034 | | | | 1,800,000 | | | | 2,126,934 | |
| | | | |
Southeastern Pennsylvania Transportation Authority | | | 5.00 | | | | 3-1-2028 | | | | 725,000 | | | | 908,730 | |
| | | | |
York County PA School of Technology Authority Series A (Build America Mutual Assurance Company Insured) | | | 5.00 | | | | 2-15-2024 | | | | 1,590,000 | | | | 1,827,928 | |
36 | Wells Fargo Intermediate Tax/AMT-Free Fund
Portfolio of investments—June 30, 2019
| | | | | | | | | | | | | | | | |
| | | Interest rate | | | Maturity date | | | Principal | | | Value | |
| | | | |
| Miscellaneous Revenue (continued) | | | | | | | | | | | | |
| | | | |
York County PA School of Technology Authority Series B (Build America Mutual Assurance Company Insured) | | | 5.00 | % | | | 2-15-2027 | | | $ | 800,000 | | | $ | 923,784 | |
| | | | |
York County PA School of Technology Authority Series B (Build America Mutual Assurance Company Insured) | | | 5.00 | | | | 2-15-2029 | | | | 500,000 | | | | 574,905 | |
| |
| | | | 52,083,328 | |
| | | | | | | | | | | | | | | | |
| | | | |
| Resource Recovery Revenue: 0.24% | | | | | | | | | | | | |
| | | | |
Lancaster County PA Solid Waste Management Authority Series A | | | 5.25 | | | | 12-15-2028 | | | | 5,665,000 | | | | 6,404,283 | |
| | | | | | | | | | | | | | | | |
| | | | |
| Tobacco Revenue: 0.23% | | | | | | | | | | | | |
| | | | |
Commonwealth Financing Authority Tobacco Master Settlement Payment | | | 5.00 | | | | 6-1-2027 | | | | 2,500,000 | | | | 3,030,350 | |
| | | | |
Commonwealth Financing Authority Tobacco Master Settlement Payment | | | 5.00 | | | | 6-1-2028 | | | | 2,500,000 | | | | 3,073,050 | |
| |
| | | | 6,103,400 | |
| | | | | | | | | | | | | | | | |
| | | | |
| Transportation Revenue: 0.59% | | | | | | | | | | | | |
| | | | |
Pennsylvania Turnpike Commission Motor License Fund-Enhanced Refunding Bond | | | 5.00 | | | | 6-1-2027 | | | | 1,000,000 | | | | 1,231,830 | |
| | | | |
Pennsylvania Turnpike Commission Refunding Bond | | | 5.00 | | | | 12-1-2033 | | | | 3,780,000 | | | | 4,370,171 | |
| | | | |
Pennsylvania Turnpike Commission Subordinate Bond Series B | | | 5.00 | | | | 6-1-2031 | | | | 5,000,000 | | | | 5,916,150 | |
| | | | |
Pennsylvania Turnpike Commission Subordinate Bond Series C (AGM Insured) | | | 6.25 | | | | 6-1-2033 | | | | 1,350,000 | | | | 1,711,611 | |
| | | | |
Pennsylvania Turnpike Commission Subordinate Bond Series E | | | 6.38 | | | | 12-1-2038 | | | | 2,000,000 | | | | 2,574,780 | |
| |
| | | | 15,804,542 | |
| | | | | | | | | | | | | | | | |
| | | | |
| Water & Sewer Revenue: 0.37% | | | | | | | | | | | | |
| | | | |
Bucks County PA Water & Sewer Authority Water System (AGM Insured) | | | 5.00 | | | | 12-1-2026 | | | | 2,400,000 | | | | 2,612,112 | |
| | | | |
Pennsylvania Capital Region Water Sewer System | | | 5.00 | | | | 7-15-2030 | | | | 1,180,000 | | | | 1,429,216 | |
| | | | |
Pennsylvania Capital Region Water System | | | 5.00 | | | | 7-15-2030 | | | | 1,500,000 | | | | 1,852,590 | |
| | | | |
Philadelphia PA Water and Wastewater Bond Series B | | | 5.00 | | | | 11-1-2027 | | | | 1,535,000 | | | | 1,922,802 | |
| | | | |
Philadelphia PA Water and Wastewater Bond Series B | | | 5.00 | | | | 11-1-2033 | | | | 1,760,000 | | | | 2,125,358 | |
| |
| | | | 9,942,078 | |
| | | | | | | | | | | | | | | | |
| |
| | | | 247,572,328 | |
| | | | | | | | | | | | | | | | |
| | | | |
South Carolina: 0.56% | | | | | | | | | | | | | | | | |
| | | | |
| Education Revenue: 0.31% | | | | | | | | | | | | |
| | | | |
South Carolina Education Assistance Authority Student Loan Series I | | | 5.00 | | | | 10-1-2024 | | | | 1,580,000 | | | | 1,591,060 | |
| | | | |
South Carolina Jobs EDA Furman University Project | | | 5.00 | | | | 10-1-2028 | | | | 700,000 | | | | 828,849 | |
| | | | |
South Carolina Jobs EDA Furman University Project | | | 5.00 | | | | 10-1-2030 | | | | 1,885,000 | | | | 2,223,471 | |
| | | | |
South Carolina Jobs EDA Furman University Project | | | 5.00 | | | | 10-1-2031 | | | | 2,155,000 | | | | 2,537,232 | |
| | | | |
South Carolina Jobs EDA York Preparatory Academy Project Series A | | | 7.00 | | | | 11-1-2033 | | | | 1,000,000 | | | | 1,109,740 | |
| |
| | | | 8,290,352 | |
| | | | | | | | | | | | | | | | |
| | | | |
| Miscellaneous Revenue: 0.25% | | | | | | | | | | | | |
| | | | |
Laurens County SC Education Assistance for District #55 | | | 5.00 | | | | 12-1-2021 | | | | 1,000,000 | | | | 1,073,270 | |
| | | | |
Laurens County SC Education Assistance for District #55 | | | 5.00 | | | | 12-1-2022 | | | | 1,250,000 | | | | 1,376,188 | |
| | | | |
Laurens County SC Education Assistance for District #55 | | | 5.00 | | | | 12-1-2025 | | | | 1,000,000 | | | | 1,176,370 | |
| | | | |
Scago SC Educational Facilities Corporation for Sumter County School District #17 | | | 4.00 | | | | 12-1-2019 | | | | 1,000,000 | | | | 1,008,640 | |
| | | | |
Scago SC Educational Facilities Corporation for Sumter County School District #17 | | | 5.00 | | | | 12-1-2022 | | | | 1,720,000 | | | | 1,896,025 | |
| |
| | | | 6,530,493 | |
| | | | | | | | | | | | | | | | |
| |
| | | | 14,820,845 | |
| | | | | | | | | | | | | | | | |
Wells Fargo Intermediate Tax/AMT-Free Fund | 37
Portfolio of investments—June 30, 2019
| | | | | | | | | | | | | | | | |
| | | Interest rate | | | Maturity date | | | Principal | | | Value | |
| | | | |
South Dakota: 0.04% | | | | | | | | | | | | | | | | |
| | | | |
| Airport Revenue: 0.04% | | | | | | | | | | | | |
| | | | |
Rapid City SD Airport Project | | | 6.25 | % | | | 12-1-2026 | | | $ | 920,000 | | | $ | 939,118 | |
| | | | | | | | | | | | | | | | |
| | | | |
Tennessee: 1.03% | | | | | | | | | | | | | | | | |
| | | | |
| Education Revenue: 0.03% | | | | | | | | | | | | |
| | | | |
Franklin County TN HEFA | | | 4.00 | | | | 9-1-2024 | | | | 250,000 | | | | 267,775 | |
| | | | |
Franklin County TN HEFA | | | 5.00 | | | | 9-1-2030 | | | | 560,000 | | | | 615,362 | |
| |
| | | | 883,137 | |
| | | | | | | | | | | | | | | | |
| | | | |
| GO Revenue: 0.02% | | | | | | | | | | | | |
| | | | |
White County TN | | | 4.05 | | | | 6-1-2020 | | | | 515,000 | | | | 527,345 | |
| | | | | | | | | | | | | | | | |
| | | | |
| Health Revenue: 0.01% | | | | | | | | | | | | |
| | | | |
Shelby County TN Health Educational & Housing Facilities Board Le Bonheur Children’s Medical Center Series D (National Insured) | | | 5.50 | | | | 8-15-2019 | | | | 125,000 | | | | 125,623 | |
| | | | | | | | | | | | | | | | |
| | | | |
| Housing Revenue: 0.03% | | | | | | | | | | | | |
| | | | |
Chattanooga TN Health Educational & Housing Facilities University of Tennessee at Chattanooga Project | | | 5.00 | | | | 10-1-2023 | | | | 750,000 | | | | 841,350 | |
| | | | | | | | | | | | | | | | |
| | | | |
| Utilities Revenue: 0.94% | | | | | | | | | | | | |
| | | | |
Tennessee Energy Acquisition Corporation Gas Project | | | 4.00 | | | | 11-1-2049 | | | | 11,000,000 | | | | 12,121,120 | |
| | | | |
Tennessee Energy Acquisition Corporation Series A | | | 4.00 | | | | 5-1-2048 | | | | 12,120,000 | | | | 12,992,155 | |
| |
| | | | 25,113,275 | |
| | | | | | | | | | | | | | | | |
| |
| | | | 27,490,730 | |
| | | | | | | | | | | | | | | | |
| | | | |
Texas: 9.19% | | | | | | | | | | | | | | | | |
| | | | |
| Airport Revenue: 0.47% | | | | | | | | | | | | |
| | | | |
Galveston TX Wharves & Terminal | | | 5.00 | | | | 2-1-2026 | | | | 2,000,000 | | | | 2,088,160 | |
| | | | |
Houston TX Airport System Subordinate Lien Refunding Bonds Series D | | | 5.00 | | | | 7-1-2033 | | | | 3,000,000 | | | | 3,683,700 | |
| | | | |
Houston TX Airport System Subordinate Lien Refunding Bonds Series D | | | 5.00 | | | | 7-1-2034 | | | | 3,500,000 | | | | 4,280,640 | |
| | | | |
Houston TX Airport System Subordinate Lien Refunding Bonds Series D | | | 5.00 | | | | 7-1-2035 | | | | 2,000,000 | | | | 2,437,480 | |
| |
| | | | 12,489,980 | |
| | | | | | | | | | | | | | | | |
| | | | |
| Education Revenue: 0.44% | | | | | | | | | | | | |
| | | | |
Houston TX Higher Education Finance Corporation Series A | | | 4.00 | | | | 2-15-2022 | | | | 395,000 | | | | 407,711 | |
| | | | |
North Texas Higher Education Authority Incoming Student Loan Series A-2 (3 Month LIBOR +0.90%)± | | | 3.49 | | | | 7-1-2030 | | | | 4,985,000 | | | | 4,979,616 | |
| | | | |
Texas Woman’s University Financing System | | | 4.00 | | | | 7-1-2020 | | | | 1,000,000 | | | | 1,026,660 | |
| | | | |
University of Houston Texas Series B | | | 5.25 | | | | 7-1-2026 | | | | 4,225,000 | | | | 5,281,926 | |
| |
| | | | 11,695,913 | |
| | | | | | | | | | | | | | | | |
| GO Revenue: 4.52% | |
| | | | |
Austin TX Independent School District Series B | | | 5.00 | | | | 8-1-2023 | | | | 3,805,000 | | | | 4,341,581 | |
| | | | |
Austin TX Independent School District Series B | | | 5.00 | | | | 8-1-2024 | | | | 3,970,000 | | | | 4,656,056 | |
| | | | |
Austin TX Independent School District Series B | | | 5.00 | | | | 8-1-2025 | | | | 2,050,000 | | | | 2,464,408 | |
| | | | |
Austin TX Independent School District Series B | | | 5.00 | | | | 8-1-2026 | | | | 1,450,000 | | | | 1,737,419 | |
| | | | |
Austin TX Public Improvement Bond | | | 5.00 | | | | 9-1-2030 | | | | 960,000 | | | | 1,185,898 | |
| | | | |
Bexar County TX Combination Tax Certificate of Obligation | | | 5.00 | | | | 6-15-2024 | | | | 1,000,000 | | | | 1,172,560 | |
| | | | |
Bexar County TX Hospital District Refunding Bond | | | 5.00 | | | | 2-15-2037 | | | | 1,250,000 | | | | 1,505,063 | |
| | | | |
Collin County TX Unlimited Tax Road & Refunding Bond | | | 5.00 | | | | 2-15-2023 | | | | 1,350,000 | | | | 1,523,664 | |
| | | | |
Collin County TX Unlimited Tax Road & Refunding Bond | | | 5.00 | | | | 2-15-2026 | | | | 1,000,000 | | | | 1,192,130 | |
| | | | |
Collin County TX Unlimited Tax Road & Refunding Bond | | | 5.00 | | | | 2-15-2027 | | | | 1,300,000 | | | | 1,546,506 | |
38 | Wells Fargo Intermediate Tax/AMT-Free Fund
Portfolio of investments—June 30, 2019
| | | | | | | | | | | | | | | | |
| | | Interest rate | | | Maturity date | | | Principal | | | Value | |
| GO Revenue (continued) | |
| | | | |
Coppell TX Independent School District | | | 4.00 | % | | | 8-15-2035 | | | $ | 1,640,000 | | | $ | 1,843,655 | |
| | | | |
Coppell TX Independent School District | | | 4.00 | | | | 8-15-2037 | | | | 1,975,000 | | | | 2,203,093 | |
| | | | |
Crane County TX Water District Unlimited Tax Bond | | | 5.00 | | | | 2-15-2023 | | | | 1,395,000 | | | | 1,561,326 | |
| | | | |
Crane County TX Water District Unlimited Tax Bond | | | 5.00 | | | | 2-15-2026 | | | | 1,000,000 | | | | 1,165,080 | |
| | | | |
Crane County TX Water District Unlimited Tax Bond | | | 5.00 | | | | 2-15-2030 | | | | 1,130,000 | | | | 1,300,235 | |
| | | | |
Crane County TX Water District Unlimited Tax Bond | | | 5.00 | | | | 2-15-2031 | | | | 1,000,000 | | | | 1,145,760 | |
| | | | |
Dallas County TX Combination Tax and Parking Garage Certification of Obligation | | | 5.00 | | | | 8-15-2024 | | | | 5,600,000 | | | | 6,583,304 | |
| | | | |
Dallas County TX Combination Tax and Parking Garage Certification of Obligation | | | 5.00 | | | | 8-15-2025 | | | | 3,235,000 | | | | 3,894,714 | |
| | | | |
Del Rio TX Refunding Bond (Build America Mutual Assurance Company Insured) | | | 4.00 | | | | 6-1-2023 | | | | 720,000 | | | | 787,738 | |
| | | | |
Del Rio TX Refunding Bond (Build America Mutual Assurance Company Insured) | | | 4.00 | | | | 6-1-2024 | | | | 745,000 | | | | 829,841 | |
| | | | |
Denton County TX Permanent Improvement & Refunding Bond | | | 5.00 | | | | 7-15-2023 | | | | 1,990,000 | | | | 2,271,983 | |
| | | | |
Denton County TX Permanent Improvement & Refunding Bond | | | 5.00 | | | | 7-15-2024 | | | | 1,145,000 | | | | 1,344,379 | |
| | | | |
Denton County TX Permanent Improvement & Refunding Bond | | | 5.00 | | | | 7-15-2025 | | | | 1,000,000 | | | | 1,174,130 | |
| | | | |
Denton County TX Permanent Improvement & Refunding Bond | | | 5.00 | | | | 7-15-2030 | | | | 1,000,000 | | | | 1,165,100 | |
| | | | |
El Paso County TX Hospital District | | | 5.00 | | | | 8-15-2028 | | | | 2,045,000 | | | | 2,228,539 | |
| | | | |
El Paso County TX Refunding Bond Series A | | | 5.00 | | | | 2-15-2031 | | | | 2,000,000 | | | | 2,374,920 | |
| | | | |
El Paso County TX Refunding Bond Series A | | | 5.00 | | | | 2-15-2032 | | | | 2,120,000 | | | | 2,508,638 | |
| | | | |
Flower Mound, Denton & Tarrant Counties TX Refunding Bond | | | 4.00 | | | | 3-1-2026 | | | | 755,000 | | | | 848,771 | |
| | | | |
Flower Mound, Denton & Tarrant Counties TX Refunding Bond | | | 5.00 | | | | 3-1-2022 | | | | 1,000,000 | | | | 1,095,080 | |
| | | | |
Flower Mound, Denton & Tarrant Counties TX Refunding Bond | | | 5.00 | | | | 3-1-2023 | | | | 620,000 | | | | 698,548 | |
| | | | |
Flower Mound, Denton & Tarrant Counties TX Refunding Bond | | | 5.00 | | | | 3-1-2024 | | | | 1,660,000 | | | | 1,920,321 | |
| | | | |
Fort Worth TX Independent School District Unlimited Tax Refunding and School Building Bond | | | 5.00 | | | | 2-15-2026 | | | | 3,000,000 | | | | 3,657,270 | |
| | | | |
Harris County TX Cypress-Fairbanks Independent High School Series B-1 | | | 2.13 | | | | 2-15-2040 | | | | 10,000,000 | | | | 10,105,500 | |
| | | | |
Harris County TX Tax Road Refunding Bond Series 2014-A | | | 5.00 | | | | 10-1-2025 | | | | 8,445,000 | | | | 9,989,675 | |
| | | | |
Harris County TX Tax Road Refunding Bond Series 2015-A | | | 5.00 | | | | 10-1-2025 | | | | 4,215,000 | | | | 5,101,457 | |
| | | | |
Harris County TX Toll Road Project Series C (AGM Insured) | | | 5.25 | | | | 8-15-2027 | | | | 4,000,000 | | | | 5,100,560 | |
| | | | |
Hays County TX Limited Tax Bond | | | 5.00 | | | | 2-15-2026 | | | | 650,000 | | | | 788,756 | |
| | | | |
Hays County TX Limited Tax Bond | | | 5.00 | | | | 2-15-2027 | | | | 1,000,000 | | | | 1,239,600 | |
| | | | |
Hays County TX Limited Tax Refunding Bond | | | 5.00 | | | | 2-15-2023 | | | | 1,750,000 | | | | 1,969,170 | |
| | | | |
Northwest TX Independent School District Refunding Bond | | | 5.00 | | | | 2-15-2030 | | | | 4,000,000 | | | | 4,671,800 | |
| | | | |
Plano TX | | | 5.00 | | | | 9-1-2030 | | | | 2,155,000 | | | | 2,648,754 | |
| | | | |
San Antonio TX Certificate of Obligation | | | 5.00 | | | | 8-1-2036 | | | | 3,990,000 | | | | 4,915,361 | |
| | | | |
San Antonio TX Independent School District Unlimited Tax Series 2018 | | | 5.00 | | | | 8-15-2037 | | | | 2,000,000 | | | | 2,341,280 | |
| | | | |
Texas Independent School District Refunding Bond | | | 5.00 | | | | 8-15-2025 | | | | 2,260,000 | | | | 2,715,028 | |
| | | | |
Travis County TX Certificate of Obligation Series A | | | 5.00 | | | | 3-1-2038 | | | | 4,010,000 | | | | 4,946,977 | |
| |
| | | | 120,461,628 | |
| | | | | | | | | | | | | | | | |
| Miscellaneous Revenue: 1.05% | | | | | | | | | | | | |
| | | | |
Austin TX Community College District Public Facility Corporation Bond Series C | | | 5.00 | | | | 8-1-2026 | | | | 565,000 | | | | 691,447 | |
| | | | |
Austin TX Community College District Public Facility Corporation Bond Series C | | | 5.00 | | | | 8-1-2029 | | | | 400,000 | | | | 494,808 | |
| | | | |
Austin TX Community College District Public Facility Corporation Bond Series C | | | 5.00 | | | | 8-1-2030 | | | | 500,000 | | | | 614,735 | |
| | | | |
Lower Colorado River TX Authority | | | 5.50 | | | | 5-15-2031 | | | | 2,500,000 | | | | 2,847,850 | |
| | | | |
Texas PFA Refunding Bond | | | 4.00 | | | | 2-1-2033 | | | | 7,000,000 | | | | 8,006,320 | |
| | | | |
Texas Transportation Commission Highway Improvement Series A | | | 5.00 | | | | 4-1-2042 | | | | 5,000,000 | | | | 5,433,300 | |
| | | | |
Texas Transportation Commission Refunding Bond Series B | | | 5.00 | | | | 10-1-2031 | | | | 5,000,000 | | | | 6,187,250 | |
| | | | |
Texas Water Development Board Series A | | | 5.00 | | | | 10-15-2031 | | | | 3,000,000 | | | | 3,712,350 | |
| |
| | | | 27,988,060 | |
| | | | | | | | | | | | | | | | |
Wells Fargo Intermediate Tax/AMT-Free Fund | 39
Portfolio of investments—June 30, 2019
| | | | | | | | | | | | | | | | |
| | | Interest rate | | | Maturity date | | | Principal | | | Value | |
| | | | |
| Resource Recovery Revenue: 0.31% | | | | | | | | | | | | |
| | | | |
Port Arthur TX Navigation District Jefferson County Environmental Facilities Motiva Enterprises LLC Project Subordinate Bond Series E ø | | | 2.05 | % | | | 11-1-2040 | | | $ | 8,100,000 | | | $ | 8,100,000 | |
| | | | | | | | | | | | | | | | |
| | | | |
| Tax Revenue: 0.43% | | | | | | | | | | | | |
| | | | |
Midtown TX RDA (Build America Mutual Assurance Company Insured) | | | 5.25 | | | | 1-1-2027 | | | | 1,880,000 | | | | 2,098,042 | |
| | | | |
Midtown TX RDA (Build America Mutual Assurance Company Insured) | | | 5.25 | | | | 1-1-2029 | | | | 2,390,000 | | | | 2,661,169 | |
| | | | |
Midtown TX RDA (Build America Mutual Assurance Company Insured) | | | 5.25 | | | | 1-1-2030 | | | | 1,500,000 | | | | 1,668,045 | |
| | | | |
Midtown TX RDA (Build America Mutual Assurance Company Insured) | | | 5.25 | | | | 1-1-2031 | | | | 1,000,000 | | | | 1,110,600 | |
| | | | |
Texas Transportation Commission Highway Fund Series A | | | 5.00 | | | | 10-1-2025 | | | | 3,250,000 | | | | 3,937,830 | |
| |
| | | | 11,475,686 | |
| | | | | | | | | | | | | | | | |
| | | | |
| Transportation Revenue: 0.68% | | | | | | | | | | | | |
| | | | |
Central Texas Regional Mobility Authority Series B | | | 5.00 | | | | 1-1-2045 | | | | 8,000,000 | | | | 8,262,160 | |
| | | | |
Texas Grand Parkway Transportation Corporation System Series A | | | 5.00 | | | | 10-1-2034 | | | | 1,500,000 | | | | 1,837,860 | |
| | | | |
Texas Private Activity Bond Surface Transportation Corporation | | | 7.50 | | | | 6-30-2032 | | | | 2,000,000 | | | | 2,118,820 | |
| | | | |
Texas Private Activity Bond Surface Transportation Corporation | | | 7.50 | | | | 6-30-2033 | | | | 2,000,000 | | | | 2,118,000 | |
| | | | |
Texas Private Activity Bond Surface Transportation Corporation Senior Lien Note | | | 7.50 | | | | 12-31-2031 | | | | 3,745,000 | | | | 3,857,425 | |
| |
| | | | 18,194,265 | |
| | | | | | | | | | | | | | | | |
| | | | |
| Utilities Revenue: 0.82% | | | | | | | | | | | | |
| | | | |
Austin TX Refunding Bond (National Insured) | | | 5.25 | | | | 5-15-2025 | | | | 1,400,000 | | | | 1,602,944 | |
| | | | |
Brownsville TX Utilities System Refunding Bond | | | 5.00 | | | | 9-1-2026 | | | | 2,190,000 | | | | 2,590,901 | |
| | | | |
Brownsville TX Utilities System Refunding Bond | | | 5.00 | | | | 9-1-2029 | | | | 1,500,000 | | | | 1,769,385 | |
| | | | |
Brownsville TX Utilities System Refunding Bond | | | 5.00 | | | | 9-1-2030 | | | | 2,500,000 | | | | 2,944,375 | |
| | | | |
Texas Municipal Gas Acquisition & Supply Corporation III Gas Supply Series 2012 | | | 5.00 | | | | 12-15-2021 | | | | 3,945,000 | | | | 4,241,506 | |
| | | | |
Texas Municipal Gas Acquisition & Supply Corporation Series B | | | 5.00 | | | | 12-15-2022 | | | | 5,000,000 | | | | 5,517,150 | |
| | | | |
Texas SA Energy Acquisition Public Facility Corporation Gas Supply | | | 5.50 | | | | 8-1-2019 | | | | 1,465,000 | | | | 1,469,278 | |
| | | | |
Weatherford TX Utility System Refunding & Improvement Bond (AGM Insured) | | | 5.00 | | | | 9-1-2025 | | | | 1,000,000 | | | | 1,187,090 | |
| | | | |
Weatherford TX Utility System Refunding & Improvement Bond (AGM Insured) | | | 5.00 | | | | 9-1-2026 | | | | 375,000 | | | | 445,328 | |
| |
| | | | 21,767,957 | |
| | | | | | | | | | | | | | | | |
| | | | |
| Water & Sewer Revenue: 0.47% | | | | | | | | | | | | |
| | | | |
Amarillo TX Waterworks and Sewer System Bond Series B | | | 5.00 | | | | 4-1-2028 | | | | 645,000 | | | | 813,074 | |
| | | | |
Houston TX Utilities Systems Series A | | | 5.25 | | | | 11-15-2031 | | | | 3,000,000 | | | | 3,159,870 | |
| | | | |
North Harris County TX Regional Water Authority Senior Lien (Build America Mutual Assurance Company Insured) | | | 5.00 | | | | 12-15-2029 | | | | 1,215,000 | | | | 1,347,557 | |
| | | | |
Nueces River TX Water Supply Facility Corpus Christi Lake Texana Project | | | 5.00 | | | | 7-15-2026 | | | | 1,000,000 | | | | 1,192,560 | |
| | | | |
Nueces River TX Water Supply Facility Corpus Christi Lake Texana Project | | | 5.00 | | | | 7-15-2027 | | | | 1,250,000 | | | | 1,481,300 | |
| | | | |
Texas Water Development Board State Implementation Series 2018A | | | 4.00 | | | | 10-15-2032 | | | | 3,000,000 | | | | 3,432,810 | |
| | | | |
Trinity River TX Authority Electric Company Project Series A | | | 4.00 | | | | 2-1-2027 | | | | 1,000,000 | | | | 1,144,030 | |
| |
| | | | 12,571,201 | |
| | | | | | | | | | | | | | | | |
| |
| | | | 244,744,690 | |
| | | | | | | | | | | | | | | | |
|
Utah: 0.34% | |
| | | | |
| Education Revenue: 0.12% | | | | | | | | | | | | |
| | | | |
Utah Charter School Finance Authority Refunding Bond (CSCE Insured) | | | 4.00 | | | | 4-15-2020 | | | | 250,000 | | | | 254,485 | |
| | | | |
Utah Charter School Finance Authority Refunding Bond (CSCE Insured) | | | 4.00 | | | | 4-15-2021 | | | | 400,000 | | | | 416,180 | |
| | | | |
Utah Charter School Finance Authority Refunding Bond (CSCE Insured) | | | 4.00 | | | | 4-15-2022 | | | | 400,000 | | | | 423,636 | |
| | | | |
Utah Charter School Finance Authority Refunding Bond (CSCE Insured) | | | 4.00 | | | | 4-15-2023 | | | | 400,000 | | | | 430,672 | |
40 | Wells Fargo Intermediate Tax/AMT-Free Fund
Portfolio of investments—June 30, 2019
| | | | | | | | | | | | | | | | |
| | | Interest rate | | | Maturity date | | | Principal | | | Value | |
| | | | |
| Education Revenue (continued) | | | | | | | | | | | | |
| | | | |
Utah Charter School Finance Authority Refunding Bond (CSCE Insured) | | | 4.00 | % | | | 4-15-2024 | | | $ | 450,000 | | | $ | 492,197 | |
| | | | |
Utah Charter School Finance Authority Refunding Bond 144A | | | 4.50 | | | | 6-15-2027 | | | | 1,025,000 | | | | 1,058,897 | |
| |
| | | | 3,076,067 | |
| | | | | | | | | | | | | | | | |
| | | | |
| GO Revenue: 0.08% | | | | | | | | | | | | |
| | | | |
Canyons UT Board of Education Utah School Bond Guaranty Program (AGM Insured) | | | 5.00 | | | | 6-15-2022 | | | | 1,860,000 | | | | 2,061,754 | |
| | | | | | | | | | | | | | | | |
| | | | |
| Miscellaneous Revenue: 0.14% | | | | | | | | | | | | |
| | | | |
West Valley City UT Municipal Building Authority (AGM Insured) | | | 5.00 | | | | 2-1-2028 | | | | 1,000,000 | | | | 1,220,050 | |
| | | | |
West Valley City UT Municipal Building Authority (AGM Insured) | | | 5.00 | | | | 2-1-2032 | | | | 1,555,000 | | | | 1,860,526 | |
| | | | |
West Valley City UT Municipal Building Authority (AGM Insured) | | | 5.00 | | | | 2-1-2033 | | | | 645,000 | | | | 769,562 | |
| |
| | | | 3,850,138 | |
| | | | | | | | | | | | | | | | |
| |
| | | | 8,987,959 | |
| | | | | | | | | | | | | | | | |
| | | | |
Virginia: 0.23% | | | | | | | | | | | | | | | | |
| | | | |
| Education Revenue: 0.13% | | | | | | | | | | | | |
| | | | |
Virginia Small Business Financing Authority | | | 5.25 | | | | 10-1-2029 | | | | 3,000,000 | | | | 3,505,140 | |
| | | | | | | | | | | | | | | | |
| | | | |
| Miscellaneous Revenue: 0.01% | | | | | | | | | | | | |
| | | | |
Watkins Centre VA CDA | | | 5.40 | | | | 3-1-2020 | | | | 214,000 | | | | 214,293 | |
| | | | | | | | | | | | | | | | |
| | | | |
| Tax Revenue: 0.09% | | | | | | | | | | | | |
| | | | |
Greater Richmond VA Convention Center | | | 5.00 | | | | 6-15-2025 | | | | 1,000,000 | | | | 1,187,150 | |
| | | | |
Marquis VA CDA CAB Series 2015 144A¤ | | | 0.00 | | | | 9-1-2045 | | | | 386,000 | | | | 284,243 | |
| | | | |
Marquis VA CDA CAB Series C ¤ | | | 0.00 | | | | 9-1-2041 | | | | 1,772,000 | | | | 100,402 | |
| | | | |
Marquis VA CDA Series B | | | 5.63 | | | | 9-1-2041 | | | | 1,274,000 | | | | 847,019 | |
| |
| | | | 2,418,814 | |
| | | | | | | | | | | | | | | | |
| |
| | | | 6,138,247 | |
| | | | | | | | | | | | | | | | |
| | | | |
Washington: 4.19% | | | | | | | | | | | | | | | | |
| | | | |
| Education Revenue: 0.04% | | | | | | | | | | | | |
| | | | |
Washington EDFA | | | 5.00 | | | | 6-1-2028 | | | | 1,000,000 | | | | 1,155,990 | |
| | | | | | | | | | | | | | | | |
| | | | |
| GO Revenue: 1.82% | | | | | | | | | | | | |
| | | | |
King County WA Federal Way School District #210 (AGM Insured) | | | 4.00 | | | | 12-1-2023 | | | | 4,085,000 | | | | 4,542,030 | |
| | | | |
King County WA Public Hospital District #1 Valley Medical Center Refunding Bond | | | 5.00 | | | | 12-1-2029 | | | | 1,600,000 | | | | 1,915,664 | |
| | | | |
King County WA Public Hospital District #1 Valley Medical Center Refunding Bond | | | 5.00 | | | | 12-1-2031 | | | | 6,665,000 | | | | 7,901,891 | |
| | | | |
King County WA Public Hospital District #1 Valley Medical Center Refunding Bond | | | 5.00 | | | | 12-1-2032 | | | | 2,905,000 | | | | 3,434,349 | |
| | | | |
King County WA Public Hospital District #1 Valley Medical Center Refunding Bond | | | 5.00 | | | | 12-1-2033 | | | | 7,045,000 | | | | 8,304,646 | |
| | | | |
Seattle WA Refunding Bond Series A | | | 5.00 | | | | 6-1-2024 | | | | 6,345,000 | | | | 7,441,860 | |
| | | | |
Thurston & Pierce Counties WA Community Schools (AGM Insured) | | | 5.00 | | | | 12-1-2030 | | | | 1,415,000 | | | | 1,784,768 | |
| | | | |
Washington Various Purposes Bond Series C | | | 5.00 | | | | 2-1-2034 | | | | 5,800,000 | | | | 6,853,686 | |
| | | | |
Washington Various Purposes Refunding Bond Series B | | | 5.00 | | | | 7-1-2028 | | | | 4,000,000 | | | | 4,829,640 | |
| | | | |
Yakima County WA West Valley School District #208 (AGM Insured) | | | 5.00 | | | | 12-1-2032 | | | | 1,200,000 | | | | 1,500,348 | |
| |
| | | | 48,508,882 | |
| | | | | | | | | | | | | | | | |
Wells Fargo Intermediate Tax/AMT-Free Fund | 41
Portfolio of investments—June 30, 2019
| | | | | | | | | | | | | | | | |
| | | Interest rate | | | Maturity date | | | Principal | | | Value | |
| | | | |
| Health Revenue: 0.75% | | | | | | | | | | | | |
| | | | |
Washington HCFR Fred Hutchinson Cancer Research Center (SIFMA Municipal Swap +1.05%)± | | | 2.95 | % | | | 1-1-2042 | | | $ | 10,000,000 | | | $ | 10,147,900 | |
| | | | |
Washington HCFR Fred Hutchinson Cancer Research Center | | | 5.00 | | | | 1-1-2023 | | | | 4,000,000 | | | | 4,454,640 | |
| | | | |
Washington HCFR Fred Hutchinson Cancer Research Center | | | 5.00 | | | | 1-1-2026 | | | | 2,250,000 | | | | 2,649,960 | |
| | | | |
Washington HCFR Fred Hutchinson Cancer Research Center | | | 5.00 | | | | 1-1-2027 | | | | 1,050,000 | | | | 1,230,170 | |
| | | | |
Washington HCFR Fred Hutchinson Cancer Research Center | | | 5.00 | | | | 1-1-2028 | | | | 1,350,000 | | | | 1,574,627 | |
| |
| | | | 20,057,297 | |
| | | | | | | | | | | | | | | | |
| | | | |
| Housing Revenue: 0.19% | | | | | | | | | | | | |
| | | | |
Snohomish County WA Housing Authority Carvel Apartments Project | | | 5.00 | | | | 4-1-2032 | | | | 1,955,000 | | | | 2,363,673 | |
| | | | |
Snohomish County WA Housing Authority Carvel Apartments Project | | | 5.00 | | | | 4-1-2033 | | | | 1,550,000 | | | | 1,864,774 | |
| | | | |
Snohomish County WA Housing Authority Carvel Apartments Project | | | 5.00 | | | | 4-1-2034 | | | | 655,000 | | | | 784,893 | |
| |
| | | | 5,013,340 | |
| | | | | | | | | | | | | | | | |
| | | | |
| Miscellaneous Revenue: 0.79% | | | | | | | | | | | | |
| | | | |
FYI Properties Washington Lease Revenue Refunding Bond | | | 5.00 | | | | 6-1-2034 | | | | 6,000,000 | | | | 7,323,840 | |
| | | | |
Washington Certificate of Participation Series B | | | 5.00 | | | | 7-1-2035 | | | | 1,335,000 | | | | 1,659,979 | |
| | | | |
Washington Certificate of Participation Series B | | | 5.00 | | | | 7-1-2037 | | | | 1,585,000 | | | | 1,957,840 | |
| | | | |
Washington Motor Vehicle Fuel Tax Refunding Bond Series D | | | 5.00 | | | | 7-1-2031 | | | | 5,830,000 | | | | 6,790,259 | |
| | | | |
Washington Office Building Refunding Bond | | | 5.00 | | | | 7-1-2026 | | | | 2,750,000 | | | | 3,186,700 | |
| |
| | | | 20,918,618 | |
| | | | | | | | | | | | | | | | |
| | | | |
| Resource Recovery Revenue: 0.21% | | | | | | | | | | | | |
| | | | |
Seattle WA Solid Waste System Improvement & Refunding Bond | | | 4.00 | | | | 6-1-2033 | | | | 1,175,000 | | | | 1,299,503 | |
| | | | |
Tacoma WA Solid Waste Refunding Bond Series B | | | 5.00 | | | | 12-1-2027 | | | | 620,000 | | | | 750,932 | |
| | | | |
Tacoma WA Solid Waste Refunding Bond Series B | | | 5.00 | | | | 12-1-2028 | | | | 1,455,000 | | | | 1,756,738 | |
| | | | |
Tacoma WA Solid Waste Refunding Bond Series B | | | 5.00 | | | | 12-1-2029 | | | | 1,525,000 | | | | 1,834,194 | |
| |
| | | | 5,641,367 | |
| | | | | | | | | | | | | | | | |
| | | | |
| Utilities Revenue: 0.31% | | | | | | | | | | | | |
| | | | |
Energy Northwest Washington Wind Project | | | 5.00 | | | | 7-1-2022 | | | | 1,185,000 | | | | 1,304,744 | |
| | | | |
Lewis County WA Public Utility District Refunding Bond | | | 5.25 | | | | 4-1-2032 | | | | 6,115,000 | | | | 7,010,419 | |
| |
| | | | 8,315,163 | |
| | | | | | | | | | | | | | | | |
| | | | |
| Water & Sewer Revenue: 0.08% | | | | | | | | | | | | |
| | | | |
King County WA Multi-Modal Limited Refunding Bond (TD Bank NA SPA) ø | | | 1.95 | | | | 1-1-2046 | | | | 2,000,000 | | | | 2,000,000 | |
| | | | | | | | | | | | | | | | |
| |
| | | | 111,610,657 | |
| | | | | | | | | | | | | | | | |
West Virginia: 0.70% | | | | | | | | | | | | | | | | |
| | | | |
| GO Revenue: 0.29% | | | | | | | | | | | | |
| | | | |
Ohio County WV Public School Bond | | | 3.00 | | | | 6-1-2027 | | | | 2,740,000 | | | | 2,941,965 | |
| | | | |
West Virginia State Road Bond Series 2018 B | | | 5.00 | | | | 12-1-2036 | | | | 4,000,000 | | | | 4,902,680 | |
| |
| | | | 7,844,645 | |
| | | | | | | | | | | | | | | | |
| | | | |
| Health Revenue: 0.06% | | | | | | | | | | | | |
| | | | |
West Virginia Hospital Finance Authority West Virginia University Health System Series A | | | 5.00 | | | | 6-1-2031 | | | | 375,000 | | | | 445,196 | |
| | | | |
West Virginia Hospital Finance Authority West Virginia University Health System Series A | | | 5.00 | | | | 6-1-2032 | | | | 950,000 | | | | 1,124,021 | |
| |
| | | | 1,569,217 | |
| | | | | | | | | | | | | | | | |
42 | Wells Fargo Intermediate Tax/AMT-Free Fund
Portfolio of investments—June 30, 2019
| | | | | | | | | | | | | | | | |
| | | Interest rate | | | Maturity date | | | Principal | | | Value | |
| | | | |
| Miscellaneous Revenue: 0.35% | | | | | | | | | | | | |
| | | | |
West Virginia EDA Excess Lottery Series A | | | 5.00 | % | | | 7-1-2038 | | | $ | 2,980,000 | | | $ | 3,576,268 | |
| | | | |
West Virginia School Building Authority Capital Improvement Bond Series A | | | 5.00 | | | | 7-1-2026 | | | | 1,520,000 | | | | 1,806,307 | |
| | | | |
West Virginia School Building Authority Capital Improvement Bond Series A | | | 5.00 | | | | 7-1-2027 | | | | 1,595,000 | | | | 1,892,436 | |
| | | | |
West Virginia School Building Authority Capital Improvement Bond Series A | | | 5.00 | | | | 7-1-2029 | | | | 1,755,000 | | | | 2,070,338 | |
| |
| | | | 9,345,349 | |
| | | | | | | | | | | | | | | | |
| |
| | | | 18,759,211 | |
| | | | | | | | | | | | | | | | |
| | | | |
Wisconsin: 0.89% | | | | | | | | | | | | | | | | |
| | | | |
| Education Revenue: 0.25% | | | | | | | | | | | | |
| | | | |
Wisconsin PFA Charter School Voyager Foundation Incorporate Project Series A | | | 6.00 | | | | 10-1-2032 | | | | 1,475,000 | | | | 1,616,615 | |
| | | | |
Wisconsin PFA KU Campus Development Corporation Central District Development Project | | | 5.00 | | | | 3-1-2032 | | | | 4,315,000 | | | | 5,148,960 | |
| |
| | | | 6,765,575 | |
| | | | | | | | | | | | | | | | |
| | | | |
| GO Revenue: 0.08% | | | | | | | | | | | | |
| | | | |
Wisconsin Series A | | | 4.00 | | | | 5-1-2032 | | | | 2,000,000 | | | | 2,118,780 | |
| | | | | | | | | | | | | | | | |
| | | | |
| Health Revenue: 0.51% | | | | | | | | | | | | |
| | | | |
University of Wisconsin Hospitals & Clinics Authority Refunding Bond Series B (JPMorgan Chase & Company SPA) ø | | | 1.93 | | | | 4-1-2048 | | | | 5,800,000 | | | | 5,800,000 | |
| | | | |
Wisconsin HEFA Series A | | | 5.00 | | | | 7-15-2021 | | | | 3,500,000 | | | | 3,758,650 | |
| | | | |
Wisconsin HEFA Series A | | | 5.00 | | | | 11-15-2023 | | | | 3,500,000 | | | | 4,003,825 | |
| |
| | | | 13,562,475 | |
| | | | | | | | | | | | | | | | |
| | | | |
| Miscellaneous Revenue: 0.05% | | | | | | | | | | | | |
| | | | |
Milwaukee WI RDA Public Schools | | | 5.00 | | | | 11-15-2029 | | | | 420,000 | | | | 502,837 | |
| | | | |
Milwaukee WI RDA Public Schools | | | 5.00 | | | | 11-15-2030 | | | | 635,000 | | | | 757,498 | |
| |
| | | | 1,260,335 | |
| | | | | | | | | | | | | | | | |
| |
| | | | 23,707,165 | |
| | | | | | | | | | | | | | | | |
| |
Total Municipal Obligations (Cost $2,528,781,389) | | | | 2,658,426,596 | |
| | | | | | | | | | | | | | | | |
| | | | | | | | |
| Total investments in securities (Cost $2,528,781,389) | | | 99.80 | % | | | 2,658,426,596 | |
| | |
Other assets and liabilities, net | | | 0.20 | | | | 5,229,213 | |
| | | | | | | | |
| Total net assets | | | 100.00 | % | | $ | 2,663,655,809 | |
| | | | | | | | |
| ± | Variable rate investment. The rate shown is the rate in effect at period end. |
| ø | Variable rate demand notes are subject to a demand feature which reduces the effective maturity. The maturity date shown represents the final maturity date of the security. The interest rate is determined and reset by the issuer daily, weekly, or monthly depending upon the terms of the security. The rate shown is the rate in effect at period end. |
| ¤ | The security is issued in zero coupon form with no periodic interest payments. |
| 144A | The security may be resold in transactions exempt from registration, normally to qualified institutional buyers, pursuant to Rule 144A under the Securities Act of 1933. |
Abbreviations:
| AGC | Assured Guaranty Corporation |
| AGM | Assured Guaranty Municipal |
| Ambac | Ambac Financial Group Incorporated |
| CAB | Capital appreciation bond |
| CDA | Community Development Authority |
| ECFA | Educational & Cultural Facilities Authority |
Wells Fargo Intermediate Tax/AMT-Free Fund | 43
Portfolio of investments—June 30, 2019
| EDA | Economic Development Authority |
| EDFA | Economic Development Finance Authority |
| FHLMC | Federal Home Loan Mortgage Corporation |
| FNMA | Federal National Mortgage Association |
| GNMA | Government National Mortgage Association |
| HCFR | Healthcare facilities revenue |
| HEFA | Health & Educational Facilities Authority |
| HEFAR | Higher Education Facilities Authority Revenue |
| HFA | Housing Finance Authority |
| HFFA | Health Facilities Financing Authority |
| IDA | Industrial Development Authority |
| LIBOR | London Interbank Offered Rate |
| MUD | Municipal Utility District |
| National | National Public Finance Guarantee Corporation |
| PCR | Pollution control revenue |
| PFA | Public Finance Authority |
| PFFA | Public Facilities Financing Authority |
| RDA | Redevelopment Authority |
| SFMR | Single-family mortgage revenue |
| SIFMA | Securities Industry and Financial Markets Association |
| SPA | Standby purchase agreement |
| TTFA | Transportation Trust Fund Authority |
44 | Wells Fargo Intermediate Tax/AMT-Free Fund
Statement of assets and liabilities—June 30, 2019
| | | | |
| | | | |
| |
Assets | | | | |
Investments in unaffiliated securities, at value (cost $2,528,781,389) | | $ | 2,658,426,596 | |
Cash | | | 783,256 | |
Receivable for investments sold | | | 955,000 | |
Receivable for Fund shares sold | | | 2,196,630 | |
Receivable for interest | | | 27,933,650 | |
Prepaid expenses and other assets | | | 30,668 | |
| | | | |
Total assets | | | 2,690,325,800 | |
| | | | |
| |
Liabilities | | | | |
Payable for investments purchased | | | 19,500,000 | |
Payable for Fund shares redeemed | | | 4,459,231 | |
Dividends payable | | | 1,633,824 | |
Management fee payable | | | 733,000 | |
Administration fees payable | | | 155,609 | |
Distribution fee payable | | | 16,578 | |
Trustees’ fees and expenses payable | | | 1,381 | |
Accrued expenses and other liabilities | | | 170,368 | |
| | | | |
Total liabilities | | | 26,669,991 | |
| | | | |
Total net assets | | $ | 2,663,655,809 | |
| | | | |
| |
Net assets consist of | | | | |
Paid-in capital | | $ | 2,566,462,372 | |
Total distributable earnings | | | 97,193,437 | |
| | | | |
Total net assets | | $ | 2,663,655,809 | |
| | | | |
| |
Computation of net asset value and offering price per share | | | | |
Net assets – Class A | | $ | 263,112,834 | |
Shares outstanding – Class A1 | | | 22,561,057 | |
Net asset value per share – Class A | | | $11.66 | |
Maximum offering price per share – Class A2 | | | $12.02 | |
Net assets – Class C | | $ | 26,736,914 | |
Shares outstanding – Class C1 | | | 2,292,703 | |
Net asset value per share – Class C | | | $11.66 | |
Net assets – Class R6 | | $ | 996,476,846 | |
Shares outstanding – Class R61 | | | 85,351,522 | |
Net asset value per share – Class R6 | | | $11.67 | |
Net assets – Administrator Class | | $ | 177,741,596 | |
Shares outstanding – Administrator Class1 | | | 15,231,478 | |
Net asset value per share – Administrator Class | | | $11.67 | |
Net assets – Institutional Class | | $ | 1,199,587,619 | |
Shares outstanding – Institutional Class1 | | | 102,714,700 | |
Net asset value per share – Institutional Class | | | $11.68 | |
| 1 | The Fund has an unlimited number of authorized shares. |
| 2 | Maximum offering price is computed as 100/97 of net asset value. On investments of $50,000 or more, the offering price is reduced. |
The accompanying notes are an integral part of these financial statements.
Wells Fargo Intermediate Tax/AMT-Free Fund | 45
Statement of operations—year ended June 30, 2019
| | | | |
| | | | |
| |
Investment income | | | | |
Interest | | $ | 77,760,819 | |
| | | | |
| |
Expenses | | | | |
Management fee | | | 8,962,662 | |
Administration fees | |
Class A | | | 430,413 | |
Class C | | | 49,766 | |
Class R6 | | | 152,093 | 1 |
Administrator Class | | | 168,062 | |
Institutional Class | | | 1,183,007 | |
Shareholder servicing fees | |
Class A | | | 672,521 | |
Class C | | | 77,759 | |
Administrator Class | | | 419,165 | |
Distribution fee | |
Class C | | | 233,277 | |
Custody and accounting fees | | | 67,766 | |
Professional fees | | | 48,870 | |
Registration fees | | | 157,472 | |
Shareholder report expenses | | | 127,787 | |
Trustees’ fees and expenses | | | 21,546 | |
Other fees and expenses | | | 63,058 | |
| | | | |
Total expenses | | | 12,835,224 | |
Less: Fee waivers and/or expense reimbursements | | | (812,399 | ) |
| | | | |
Net expenses | | | 12,022,825 | |
| | | | |
Net investment income | | | 65,737,994 | |
| | | | |
| |
Realized and unrealized gains (losses) on investments | | | | |
Net realized losses on investments | | | (4,121,284 | ) |
Net change in unrealized gains (losses) on investments | | | 78,795,074 | |
| | | | |
Net realized and unrealized gains (losses) on investments | | | 74,673,790 | |
| | | | |
Net increase in net assets resulting from operations | | $ | 140,411,784 | |
| | | | |
| 1 | For the period from July 31, 2018 (commencement of class operations) to June 30, 2019. |
The accompanying notes are an integral part of these financial statements.
46 | Wells Fargo Intermediate Tax/AMT-Free Fund
Statement of changes in net assets
| | | | | | | | | | | | | | | | |
| | | Year ended
June 30, 2019 | | | Year ended
June 30, 20181 | |
| | | | |
Operations | | | | | | | | | | | | | | | | |
Net investment income | | | | | | $ | 65,737,994 | | | | | | | $ | 64,629,670 | |
Net realized losses on investments | | | | | | | (4,121,284 | ) | | | | | | | (20,159,193 | ) |
Net change in unrealized gains (losses) on investments | | | | | | | 78,795,074 | | | | | | | | (11,473,459 | ) |
| | | | |
Net increase in net assets resulting from operations | | | | | | | 140,411,784 | | | | | | | | 32,997,018 | |
| | | | |
| | | | |
Distributions to shareholders from net investment income and net realized gains | | | | | | | | | | | | | | | | |
Class A | | | | | | | (6,656,236 | ) | | | | | | | (7,895,731 | ) |
Class C | | | | | | | (537,102 | ) | | | | | | | (658,860 | ) |
Class R6 | | | | | | | (13,953,353 | )2 | | | | | | | N/A | |
Administrator Class | | | | | | | (4,326,110 | ) | | | | | | | (5,042,057 | ) |
Institutional Class | | | | | | | (40,268,740 | ) | | | | | | | (51,032,969 | ) |
| | | | |
Total distributions to shareholders | | | | | | | (65,741,541 | ) | | | | | | | (64,629,617 | ) |
| | | | |
| | | | |
Capital share transactions | | | Shares | | | | | | | | Shares | | | | | |
Proceeds from shares sold | | | | | | | | | | | | | | | | |
Class A | | | 2,268,249 | | | | 25,839,853 | | | | 1,632,641 | | | | 18,704,577 | |
Class C | | | 236,883 | | | | 2,686,470 | | | | 197,033 | | | | 2,251,627 | |
Class R6 | | | 96,158,706 | 2 | | | 1,084,942,320 | 2 | | | N/A | | | | N/A | |
Administrator Class | | | 6,429,407 | | | | 73,171,373 | | | | 5,587,566 | | | | 63,999,285 | |
Institutional Class | | | 49,788,518 | | | | 565,405,649 | | | | 64,629,532 | | | | 740,609,789 | |
| | | | |
| | | | | | | 1,752,045,665 | | | | | | | | 825,565,278 | |
| | | | |
Reinvestment of distributions | | | | | | | | | | | | | | | | |
Class A | | | 560,089 | | | | 6,376,313 | | | | 661,923 | | | | 7,556,467 | |
Class C | | | 43,204 | | | | 491,272 | | | | 53,280 | | | | 608,195 | |
Class R6 | | | 552,098 | 2 | | | 6,337,313 | 2 | | | N/A | | | | N/A | |
Administrator Class | | | 367,364 | | | | 4,186,398 | | | | 427,778 | | | | 4,887,456 | |
Institutional Class | | | 2,596,341 | | | | 29,571,995 | | | | 2,842,189 | | | | 32,483,030 | |
| | | | |
| | | | | | | 46,963,291 | | | | | | | | 45,535,148 | |
| | | | |
Payment for shares redeemed | | | | | | | | | | | | | | | | |
Class A | | | (5,668,788 | ) | | | (64,362,323 | ) | | | (8,283,850 | ) | | | (94,494,393 | ) |
Class C | | | (1,118,105 | ) | | | (12,711,333 | ) | | | (1,000,458 | ) | | | (11,414,204 | ) |
Class R6 | | | (11,359,282 | )2 | | | (129,862,171 | )2 | | | N/A | | | | N/A | |
Administrator Class | | | (7,784,897 | ) | | | (87,831,846 | ) | | | (16,814,971 | ) | | | (193,295,593 | ) |
Institutional Class | | | (120,238,740 | ) | | | (1,354,090,765 | ) | | | (55,101,625 | ) | | | (630,172,565 | ) |
| | | | |
| | | | | | | (1,648,858,438 | ) | | | | | | | (929,376,755 | ) |
| | | | |
Net increase (decrease) in net assets resulting from capital share transactions | | | | | | | 150,150,518 | | | | | | | | (58,276,329 | ) |
| | | | |
Total increase (decrease) in net assets | | | | | | | 224,820,761 | | | | | | | | (89,908,928 | ) |
| | | | |
| | | | |
Net assets | | | | | | | | | | | | | | | | |
Beginning of period | | | | | | | 2,438,835,048 | | | | | | | | 2,528,743,976 | |
| | | | |
End of period | | | | | | $ | 2,663,655,809 | | | | | | | $ | 2,438,835,048 | |
| | | | |
| 1 | Effective for all filings after November 4, 2018, the SEC prospectively eliminated the requirement to parenthetically disclose undistributed net investment income at the end of the period and permitted the aggregation of distributions, with the exception of tax basis returns of capital. Overdistributed net investment income at June 30, 2018 was $54,682. The disaggregated distributions information for the year ended June 30, 2018 is included in Note 7,Distributions to Shareholders, in the notes to the financial statements. |
| 2 | For the period from July 31, 2018 (commencement of class operations) to June 30, 2019. |
The accompanying notes are an integral part of these financial statements.
Wells Fargo Intermediate Tax/AMT-Free Fund | 47
Financial highlights
(For a share outstanding throughout each period)
| | | | | | | | | | | | | | | | | | | | |
| | | Year ended June 30 | |
| CLASS A | | 2019 | | | 2018 | | | 2017 | | | 2016 | | | 2015 | |
Net asset value, beginning of period | | | $11.31 | | | | $11.46 | | | | $11.89 | | | | $11.47 | | | | $11.53 | |
Net investment income | | | 0.28 | | | | 0.27 | | | | 0.27 | | | | 0.26 | | | | 0.25 | |
Net realized and unrealized gains (losses) on investments | | | 0.35 | | | | (0.15 | ) | | | (0.42 | ) | | | 0.42 | | | | (0.06 | ) |
| | | | | | | | | | | | | | | | | | | | |
Total from investment operations | | | 0.63 | | | | 0.12 | | | | (0.15 | ) | | | 0.68 | | | | 0.19 | |
Distributions to shareholders from | | | | | | | | | | | | | | | | | | | | |
Net investment income | | | (0.28 | ) | | | (0.27 | ) | | | (0.27 | ) | | | (0.26 | ) | | | (0.25 | ) |
Net realized gains | | | 0.00 | | | | 0.00 | | | | (0.01 | ) | | | 0.00 | | | | 0.00 | |
| | | | | | | | | | | | | | | | | | | | |
Total distributions to shareholders | | | (0.28 | ) | | | (0.27 | ) | | | (0.28 | ) | | | (0.26 | ) | | | (0.25 | ) |
Net asset value, end of period | | | $11.66 | | | | $11.31 | | | | $11.46 | | | | $11.89 | | | | $11.47 | |
Total return1 | | | 5.67 | % | | | 1.08 | % | | | (1.27 | )% | | | 5.99 | % | | | 1.68 | % |
Ratios to average net assets (annualized) | | | | | | | | | | | | | | | | | | | | |
Gross expenses | | | 0.80 | % | | | 0.80 | % | | | 0.79 | % | | | 0.80 | % | | | 0.80 | % |
Net expenses | | | 0.70 | % | | | 0.70 | % | | | 0.70 | % | | | 0.70 | % | | | 0.70 | % |
Net investment income | | | 2.47 | % | | | 2.38 | % | | | 2.31 | % | | | 2.23 | % | | | 2.19 | % |
Supplemental data | | | | | | | | | | | | | | | | | | | | |
Portfolio turnover rate | | | 14 | % | | | 14 | % | | | 19 | % | | | 14 | % | | | 38 | % |
Net assets, end of period (000s omitted) | | | $263,113 | | | | $287,408 | | | | $359,649 | | | | $556,673 | | | | $214,880 | |
| 1 | Total return calculations do not include any sales charges. |
The accompanying notes are an integral part of these financial statements.
48 | Wells Fargo Intermediate Tax/AMT-Free Fund
Financial highlights
(For a share outstanding throughout each period)
| | | | | | | | | | | | | | | | | | | | |
| | | Year ended June 30 | |
| CLASS C | | 2019 | | | 2018 | | | 2017 | | | 2016 | | | 2015 | |
Net asset value, beginning of period | | | $11.31 | | | | $11.46 | | | | $11.89 | | | | $11.47 | | | | $11.53 | |
Net investment income | | | 0.20 | | | | 0.19 | | | | 0.18 | | | | 0.17 | | | | 0.17 | |
Net realized and unrealized gains (losses) on investments | | | 0.35 | | | | (0.15 | ) | | | (0.42 | ) | | | 0.42 | | | | (0.06 | ) |
| | | | | | | | | | | | | | | | | | | | |
Total from investment operations | | | 0.55 | | | | 0.04 | | | | (0.24 | ) | | | 0.59 | | | | 0.11 | |
Distributions to shareholders from | | | | | | | | | | | | | | | | | | | | |
Net investment income | | | (0.20 | ) | | | (0.19 | ) | | | (0.18 | ) | | | (0.17 | ) | | | (0.17 | ) |
Net realized gains | | | 0.00 | | | | 0.00 | | | | (0.01 | ) | | | 0.00 | | | | 0.00 | |
| | | | | | | | | | | | | | | | | | | | |
Total distributions to shareholders | | | (0.20 | ) | | | (0.19 | ) | | | (0.19 | ) | | | (0.17 | ) | | | (0.17 | ) |
Net asset value, end of period | | | $11.66 | | | | $11.31 | | | | $11.46 | | | | $11.89 | | | | $11.47 | |
Total return1 | | | 4.88 | % | | | 0.32 | % | | | (2.01 | )% | | | 5.20 | % | | | 0.92 | % |
Ratios to average net assets (annualized) | | | | | | | | | | | | | | | | | | | | |
Gross expenses | | | 1.55 | % | | | 1.55 | % | | | 1.54 | % | | | 1.55 | % | | | 1.55 | % |
Net expenses | | | 1.45 | % | | | 1.45 | % | | | 1.45 | % | | | 1.45 | % | | | 1.45 | % |
Net investment income | | | 1.73 | % | | | 1.63 | % | | | 1.56 | % | | | 1.48 | % | | | 1.44 | % |
Supplemental data | | | | | | | | | | | | | | | | | | | | |
Portfolio turnover rate | | | 14 | % | | | 14 | % | | | 19 | % | | | 14 | % | | | 38 | % |
Net assets, end of period (000s omitted) | | | $26,737 | | | | $35,421 | | | | $44,462 | | | | $56,601 | | | | $56,703 | |
| 1 | Total return calculations do not include any sales charges. |
The accompanying notes are an integral part of these financial statements.
Wells Fargo Intermediate Tax/AMT-Free Fund | 49
Financial highlights
(For a share outstanding throughout the period)
| | | | |
| CLASS R6 | | Year ended June 30, 20191 | |
Net asset value, beginning of period | | | $11.33 | |
Net investment income | | | 0.29 | |
Net realized and unrealized gains (losses) on investments | | | 0.34 | |
| | | | |
Total from investment operations | | | 0.63 | |
Distributions to shareholders from net investment income | | | (0.29 | ) |
Net asset value, end of period | | | $11.67 | |
Total return2 | | | 5.65 | % |
Ratios to average net assets (annualized) | | | | |
Gross expenses | | | 0.41 | % |
Net expenses | | | 0.40 | % |
Net investment income | | | 2.75 | % |
Supplemental data | | | | |
Portfolio turnover rate | | | 14 | % |
Net assets, end of period (000s omitted) | | | $996,477 | |
| 1 | For the period from July 31, 2018 (commencement of class operations) to June 30, 2019. |
| 2 | Returns for periods of less than one year are not annualized. |
The accompanying notes are an integral part of these financial statements.
50 | Wells Fargo Intermediate Tax/AMT-Free Fund
Financial highlights
(For a share outstanding throughout each period)
| | | | | | | | | | | | | | | | | | | | |
| | | Year ended June 30 | |
| ADMINISTRATOR CLASS | | 2019 | | | 2018 | | | 2017 | | | 2016 | | | 2015 | |
Net asset value, beginning of period | | | $11.32 | | | | $11.47 | | | | $11.90 | | | | $11.48 | | | | $11.54 | |
Net investment income | | | 0.29 | | | | 0.28 | | | | 0.28 | | | | 0.27 | | | | 0.27 | |
Net realized and unrealized gains (losses) on investments | | | 0.35 | | | | (0.15 | ) | | | (0.42 | ) | | | 0.42 | | | | (0.06 | ) |
| | | | | | | | | | | | | | | | | | | | |
Total from investment operations | | | 0.64 | | | | 0.13 | | | | (0.14 | ) | | | 0.69 | | | | 0.21 | |
Distributions to shareholders from | | | | | | | | | | | | | | | | | | | | |
Net investment income | | | (0.29 | ) | | | (0.28 | ) | | | (0.28 | ) | | | (0.27 | ) | | | (0.27 | ) |
Net realized gains | | | 0.00 | | | | 0.00 | | | | (0.01 | ) | | | 0.00 | | | | 0.00 | |
| | | | | | | | | | | | | | | | | | | | |
Total distributions to shareholders | | | (0.29 | ) | | | (0.28 | ) | | | (0.29 | ) | | | (0.27 | ) | | | (0.27 | ) |
Net asset value, end of period | | | $11.67 | | | | $11.32 | | | | $11.47 | | | | $11.90 | | | | $11.48 | |
Total return | | | 5.77 | % | | | 1.18 | % | | | (1.17 | )% | | | 6.09 | % | | | 1.78 | % |
Ratios to average net assets (annualized) | | | | | | | | | | | | | | | | | | | | |
Gross expenses | | | 0.74 | % | | | 0.73 | % | | | 0.73 | % | | | 0.74 | % | | | 0.74 | % |
Net expenses | | | 0.60 | % | | | 0.60 | % | | | 0.60 | % | | | 0.60 | % | | | 0.60 | % |
Net investment income | | | 2.57 | % | | | 2.48 | % | | | 2.39 | % | | | 2.33 | % | | | 2.29 | % |
Supplemental data | | | | | | | | | | | | | | | | | | | | |
Portfolio turnover rate | | | 14 | % | | | 14 | % | | | 19 | % | | | 14 | % | | | 38 | % |
Net assets, end of period (000s omitted) | | | $177,742 | | | | $183,624 | | | | $309,793 | | | | $802,527 | | | | $773,770 | |
The accompanying notes are an integral part of these financial statements.
Wells Fargo Intermediate Tax/AMT-Free Fund | 51
Financial highlights
(For a share outstanding throughout each period)
| | | | | | | | | | | | | | | | | | | | |
| | | Year ended June 30 | |
| INSTITUTIONAL CLASS | | 2019 | | | 2018 | | | 2017 | | | 2016 | | | 2015 | |
Net asset value, beginning of period | | | $11.33 | | | | $11.47 | | | | $11.91 | | | | $11.49 | | | | $11.55 | |
Net investment income | | | 0.31 | | | | 0.30 | | | | 0.30 | | | | 0.29 | | | | 0.29 | |
Net realized and unrealized gains (losses) on investments | | | 0.35 | | | | (0.14 | ) | | | (0.43 | ) | | | 0.42 | | | | (0.06 | ) |
| | | | | | | | | | | | | | | | | | | | |
Total from investment operations | | | 0.66 | | | | 0.16 | | | | (0.13 | ) | | | 0.71 | | | | 0.23 | |
Distributions to shareholders from | | | | | | | | | | | | | | | | | | | | |
Net investment income | | | (0.31 | ) | | | (0.30 | ) | | | (0.30 | ) | | | (0.29 | ) | | | (0.29 | ) |
Net realized gains | | | 0.00 | | | | 0.00 | | | | (0.01 | ) | | | 0.00 | | | | 0.00 | |
| | | | | | | | | | | | | | | | | | | | |
Total distributions to shareholders | | | (0.31 | ) | | | (0.30 | ) | | | (0.31 | ) | | | (0.29 | ) | | | (0.29 | ) |
Net asset value, end of period | | | $11.68 | | | | $11.33 | | | | $11.47 | | | | $11.91 | | | | $11.49 | |
Total return | | | 5.93 | % | | | 1.42 | % | | | (1.10 | )% | | | 6.26 | % | | | 1.97 | % |
Ratios to average net assets (annualized) | | | | | | | | | | | | | | | | | | | | |
Gross expenses | | | 0.47 | % | | | 0.47 | % | | | 0.47 | % | | | 0.47 | % | | | 0.47 | % |
Net expenses | | | 0.45 | % | | | 0.45 | % | | | 0.45 | % | | | 0.44 | % | | | 0.42 | % |
Net investment income | | | 2.72 | % | | | 2.64 | % | | | 2.58 | % | | | 2.49 | % | | | 2.47 | % |
Supplemental data | | | | | | | | | | | | | | | | | | | | |
Portfolio turnover rate | | | 14 | % | | | 14 | % | | | 19 | % | | | 14 | % | | | 38 | % |
Net assets, end of period (000s omitted) | | | $1,199,588 | | | | $1,932,382 | | | | $1,814,841 | | | | $1,260,636 | | | | $878,585 | |
The accompanying notes are an integral part of these financial statements.
52 | Wells Fargo Intermediate Tax/AMT-Free Fund
Notes to financial statements
1. ORGANIZATION
Wells Fargo Funds Trust (the “Trust”), a Delaware statutory trust organized on March 10, 1999, is anopen-end management investment company registered under the Investment Company Act of 1940, as amended (the “1940 Act”). As an investment company, the Trust follows the accounting and reporting guidance in Financial Accounting Standards Board (“FASB”)Accounting Standards Codification Topic 946, Financial Services – Investment Companies. These financial statements report on the Wells Fargo IntermediateTax/AMT-Free Fund (the “Fund”) which is a diversified series of the Trust.
2. SIGNIFICANT ACCOUNTING POLICIES
The following significant accounting policies, which are consistently followed in the preparation of the financial statements of the Fund, are in conformity with U.S. generally accepted accounting principles which require management to make estimates and assumptions that affect the reported amounts of assets and liabilities, disclosure of contingent assets and liabilities at the date of the financial statements, and the reported amounts of revenues and expenses during the reporting period. Actual results could differ from those estimates.
Securities valuation
All investments are valued each business day as of the close of regular trading on the New York Stock Exchange (generally 4 p.m. Eastern Time), although the Fund may deviate from this calculation time under unusual or unexpected circumstances.
Debt securities are valued at the evaluated bid price provided by an independent pricing service (e.g. taking into account various factors, including yields, maturities, or credit ratings) or, if a reliable price is not available, the quoted bid price from an independent broker-dealer.
Investments which are not valued using any of the methods discussed above are valued at their fair value, as determined in good faith by the Board of Trustees of the Fund. The Board of Trustees has established a Valuation Committee comprised of the Trustees and has delegated to it the authority to take any actions regarding the valuation of portfolio securities that the Valuation Committee deems necessary or appropriate, including determining the fair value of portfolio securities, unless the determination has been delegated to the Wells Fargo Asset Management Pricing Committee at Wells Fargo Funds Management, LLC (“Funds Management”). The Board of Trustees retains the authority to make or ratify any valuation decisions or approve any changes to the Valuation Procedures as it deems appropriate. On a quarterly basis, the Board of Trustees receives reports on any valuation actions taken by the Valuation Committee or the Wells Fargo Asset Management Pricing Committee which may include items for ratification.
When-issued transactions
The Fund may purchase securities on a forward commitment or when-issued basis. The Fund records a when-issued transaction on the trade date and will segregate assets in an amount at least equal in value to the Fund’s commitment to purchase when-issued securities. Securities purchased on a when-issued basis aremarked-to-market daily and the Fund begins earning interest on the settlement date. Losses may arise due to changes in the market value of the underlying securities or if the counterparty does not perform under the contract.
Security transactions and income recognition
Securities transactions are recorded on a trade date basis. Realized gains or losses are recorded on the basis of identified cost.
Interest income is accrued daily and bond discounts are accreted and premiums are amortized daily. To the extent debt obligations are placed onnon-accrual status, any related interest income may be reduced by writing off interest receivables when the collection of all or a portion of interest has been determined to be doubtful based on consistently applied procedures and the fair value has decreased. If the issuer subsequently resumes interest payments or when the collectability of interest is reasonably assured, the debt obligation is removed fromnon-accrual status.
Distributions to shareholders
Distributions to shareholders from net investment income are declared daily and paid monthly. Distributions from net realized gains, if any, are recorded on theex-dividend date and paid at least annually. Such distributions are determined in accordance with income tax regulations and may differ from U.S. generally accepted accounting principles. Dividend sources are estimated at the time of declaration. The tax character of distributions is determined as of the Fund’s fiscal year end. Therefore, a portion of the Fund’s distributions made prior to the Fund’s fiscal year end may be categorized as a tax return of capital at year end.
Federal and other taxes
The Fund intends to continue to qualify as a regulated investment company by distributing substantially all of its investment company taxable andtax-exempt income and any net realized capital gains (after reduction for capital loss carryforwards) sufficient to relieve it from all, or substantially all, federal income taxes. Accordingly, no provision for federal income taxes was required.
Wells Fargo Intermediate Tax/AMT-Free Fund | 53
Notes to financial statements
The Fund’s income and federal excise tax returns and all financial records supporting those returns for the prior three fiscal years are subject to examination by the federal and Delaware revenue authorities. Management has analyzed the Fund’s tax positions taken on federal, state, and foreign tax returns for all open tax years and does not believe that there are any uncertain tax positions that require recognition of a tax liability.
As of June 30, 2019, the aggregate cost of all investments for federal income tax purposes was $2,528,780,711 and the unrealized gains (losses) consisted of:
| | | | |
| |
Gross unrealized gains | | $ | 131,065,671 | |
| |
Gross unrealized losses | | | (1,419,786 | ) |
| |
Net unrealized gains | | $ | 129,645,885 | |
As of June 30, 2019, the Fund had capital loss carryforwards which consist of $9,449,449 in short-term capital losses and $22,944,773 in long-term capital losses.
Class allocations
The separate classes of shares offered by the Fund differ principally in applicable sales charges, distribution, shareholder servicing, and administration fees. Class specific expenses are charged directly to that share class. Investment income, common fund-level expenses, and realized and unrealized gains (losses) on investments are allocated daily to each class of shares based on the relative proportion of net assets of each class.
3. FAIR VALUATION MEASUREMENTS
Fair value measurements of investments are determined within a framework that has established a fair value hierarchy based upon the various data inputs utilized in determining the value of the Fund’s investments. The three-level hierarchy gives the highest priority to unadjusted quoted prices in active markets for identical assets or liabilities (Level 1) and the lowest priority to unobservable inputs (Level 3). The Fund’s investments are classified within the fair value hierarchy based on the lowest level of input that is significant to the fair value measurement. The inputs are summarized into three broad levels as follows:
| ∎ | | Level 1 – quoted prices in active markets for identical securities |
| ∎ | | Level 2 – other significant observable inputs (including quoted prices for similar securities, interest rates, prepayment speeds, credit risk, etc.) |
| ∎ | | Level 3 – significant unobservable inputs (including the Fund’s own assumptions in determining the fair value of investments) |
The inputs or methodologies used for valuing investments in securities are not necessarily an indication of the risk associated with investing in those securities.
The following is a summary of the inputs used in valuing the Fund’s assets and liabilities as of June 30, 2019:
| | | | | | | | | | | | | | | | |
| | | | |
| | | Quoted prices
(Level 1) | | | Other significant
observable inputs
(Level 2) | | | Significant
unobservable inputs (Level 3) | | | Total | |
| | | | |
Assets | | | | | | | | | | | | | | | | |
Investments in: | | | | | | | | | | | | | | | | |
| | | | |
Municipal obligations | | $ | 0 | | | $ | 2,658,426,596 | | | $ | 0 | | | $ | 2,658,426,596 | |
Additional sector, industry or geographic detail is included in the Portfolio of Investments.
At June 30, 2019, the Fund did not have any transfers into/out of Level 3.
4. TRANSACTIONS WITH AFFILIATES
Management fee
Funds Management, an indirect wholly owned subsidiary of Wells Fargo & Company (“Wells Fargo”), is the manager of the Fund and provides advisory and fund-level administrative services under an investment management agreement. Under the investment management agreement, Funds Management is responsible for, among other services, implementing the investment objectives and strategies of the Fund, supervising the subadviser and providing fund-level administrative services in
54 | Wells Fargo Intermediate Tax/AMT-Free Fund
Notes to financial statements
connection with the Fund’s operations. As compensation for its services under the investment management agreement, Funds Management is entitled to receive a management fee at the following annual rate based on the Fund’s average daily net assets:
| | | | |
| |
| Average daily net assets | | Management fee | |
| |
First $500 million | | | 0.400 | % |
| |
Next $500 million | | | 0.375 | |
| |
Next $2 billion | | | 0.350 | |
| |
Next $2 billion | | | 0.325 | |
| |
Next $5 billion | | | 0.290 | |
| |
Over $10 billion | | | 0.280 | |
For the year ended June 30, 2019, the management fee was equivalent to an annual rate of 0.37% of the Fund’s average daily net assets.
Funds Management has retained the services of a subadviser to provide daily portfolio management to the Fund. The fee for subadvisory services is borne by Funds Management. Wells Capital Management Incorporated, an affiliate of Funds Management and an indirect wholly owned subsidiary of Wells Fargo, is the subadviser to the Fund and is entitled to receive a fee from Funds Management at an annual rate starting at 0.20% and declining to 0.10% as the average daily net assets of the Fund increase.
Administration fees
Under a class-level administration agreement, Funds Management provides class-level administrative services to the Fund, which includes paying fees and expenses for services provided by the transfer agent,sub-transfer agents, omnibus account servicers and record-keepers. As compensation for its services under the class-level administration agreement, Funds Management receives an annual fee which is calculated based on the average daily net assets of each class as follows:
| | | | |
| |
| | | Class-level
administration fee | |
| |
Class A, Class C | | | 0.16 | % |
| |
Class R6 | | | 0.03 | |
| |
Administrator Class | | | 0.10 | |
| |
Institutional Class | | | 0.08 | |
Funds Management has contractually waived and/or reimbursed management and administration fees to the extent necessary to maintain certain net operating expense ratios for the Fund. When each class of the Fund has exceeded its expense cap, Funds Management has waived fees and/or reimbursed expenses from fund-level expenses on a proportionate basis and then from class specific expenses. When only certain classes exceed their expense caps, waivers and/or reimbursements are applied against class specific expenses before fund-level expenses. Funds Management has committed through October 31, 2019 to waive fees and/or reimburse expenses to the extent necessary to cap the Fund’s expenses at 0.70% for Class A shares, 1.45% for Class C shares, 0.40% for Class R6 shares, 0.60% for Administrator Class shares, and 0.45% for Institutional Class shares. Prior to or after the commitment expiration date, the cap may be increased or the commitment to maintain the cap may be terminated only with the approval of the Board of Trustees.
Distribution fee
The Trust has adopted a distribution plan for Class C of the Fund pursuant to Rule12b-1 under the 1940 Act. A distribution fees is charged to Class C shares and paid to Wells Fargo Funds Distributor, LLC (“Funds Distributor”), the principal underwriter, at an annual rate of 0.75% of the average daily net assets of Class C shares.
In addition, Funds Distributor is entitled to receive thefront-end sales charge from the purchase of Class A shares and a contingent deferred sales charge on the redemption of certain Class A shares. Funds Distributor is also entitled to receive the contingent deferred sales charges from redemptions of Class C shares. For the year ended June 30, 2019, Funds Distributor received $3,143 from the sale of Class A shares. No contingent deferred sales charges were incurred by Class A and Class C shares for the year ended June 30, 2019.
Shareholder servicing fees
The Trust has entered into contracts with one or more shareholder servicing agents, whereby Class A, Class C, and Administrator Class of the Fund are charged a fee at an annual rate of 0.25% of the average daily net assets of each respective class. A portion of these total shareholder servicing fees were paid to affiliates of Wells Fargo.
Wells Fargo Intermediate Tax/AMT-Free Fund | 55
Notes to financial statements
Interfund transactions
The Fund may purchase or sell portfolio investment securities to certain other Wells Fargo affiliates pursuant to Rule17a-7 under the 1940 Act and under procedures adopted by the Board of Trustees. The procedures have been designed to ensure that these interfund transactions, which do not incur broker commissions, are effected at current market prices. Pursuant to these procedures, the Fund had $155,050,000 and $180,960,000 in interfund purchases and sales, respectively, during the year ended June 30, 2019.
5. INVESTMENT PORTFOLIO TRANSACTIONS
Purchases and sales of investments, excluding U.S. government obligations (if any) and short-term securities, for the year ended June 30, 2019 were $543,972,561 and $339,497,075, respectively.
6. BANK BORROWINGS
The Trust (excluding the money market funds), Wells Fargo Master Trust and Wells Fargo Variable Trust are parties to a $280,000,000 revolving credit agreement whereby the Fund is permitted to use bank borrowings for temporary or emergency purposes, such as to fund shareholder redemption requests. Interest under the credit agreement is charged to the Fund based on a borrowing rate equal to the higher of the Federal Funds rate in effect on that day plus 1.25% or the overnight LIBOR rate in effect on that day plus 1.25%. In addition, an annual commitment fee equal to 0.25% of the unused balance is allocated to each participating fund.
For the year ended June 30, 2019, there were no borrowings by the Fund under the agreement.
7. DISTRIBUTIONS TO SHAREHOLDERS
The tax character of distributions paid was $65,741,541 and $64,629,617 oftax-exempt income for the years ended June 30, 2019 and June 30, 2018, respectively.
As of June 30, 2019, the components of distributable earnings on a tax basis were as follows:
| | | | |
Undistributed tax-exempt income | | Unrealized gains | | Capital loss carryforward |
| | |
| $1,586,339 | | $129,645,885 | | $(32,394,222) |
Effective for all filings after November 4, 2018, the Securities and Exchange Commission eliminated the requirement to separately state the components of distributions to shareholders under U.S. generally accepted accounting principles. The amounts of distributions to shareholders for the year ended June 30, 2018 were as follows:
| | | | |
| |
| | | Net investment income | |
| |
Class A | | $ | 7,895,731 | |
| |
Class C | | | 658,860 | |
| |
Administrator Class | | | 5,042,057 | |
| |
Institutional Class | | | 51,032,969 | |
8. INDEMNIFICATION
Under the Trust’s organizational documents, the officers and Trustees have been granted certain indemnification rights against certain liabilities that may arise out of performance of their duties to the Trust. Additionally, in the normal course of business, the Trust may enter into contracts with service providers that contain a variety of indemnification clauses. The Trust’s maximum exposure under these arrangements is dependent on future claims that may be made against the Fund and, therefore, cannot be estimated.
9. NEW ACCOUNTING PRONOUNCEMENTS
In August 2018, FASB issued Accounting Standards Update (“ASU”)No. 2018-13, Fair Value Measurement (Topic 820)Disclosure Framework—Changes to the Disclosure Requirements for Fair Value Measurement. ASU2018-13 updates the disclosure requirements for fair value measurements by modifying or removing certain disclosures and adding certain new disclosures. The amendments are effective for fiscal years, and interim periods within those fiscal years, beginning after December 15, 2019. Early adoption is permitted. Management has adopted the removal and modification of disclosures early, as permitted, and will adopt the additional new disclosures at the effective date.
56 | Wells Fargo Intermediate Tax/AMT-Free Fund
Notes to financial statements
In March 2017, FASB issued ASU No. 2017-08,Premium Amortization on Purchased Callable Debt Securities. ASU 2017-08 shortens the amortization period for certain callable debt securities held at a premium and requires the premium to be amortized to the earliest call date. The amendments do not require an accounting change for securities held at a discount and discounts will continue to be accreted to the maturity date of the security. ASU 2017-08 is effective for fiscal years beginning after December 15, 2018 and for interim periods within those fiscal years. During the current reporting period, management of the Fund adopted the change in accounting policy which did not have a material impact to the Fund’s financial statements.
Wells Fargo Intermediate Tax/AMT-Free Fund | 57
Report of independent registered public accounting firm
TO THE SHAREHOLDERS OF THE FUND AND BOARD OF TRUSTEES OF WELLS FARGO FUNDS TRUST:
Opinion on the Financial Statements
We have audited the accompanying statement of assets and liabilities of Wells Fargo Intermediate Tax/AMT-Free Fund (the Fund), one of the funds constituting Wells Fargo Funds Trust, including the portfolio of investments, as of June 30, 2019, the related statement of operations for the year then ended, the statements of changes in net assets for each of the years in the two year period then ended, and the related notes (collectively, the financial statements) and the financial highlights for each of the years or periods in the five year period then ended. In our opinion, the financial statements and financial highlights present fairly, in all material respects, the financial position of the Fund as of June 30, 2019, the results of its operations for the year then ended, the changes in its net assets for each of the years in the two year period then ended, and the financial highlights for each of the years or periods in the five year period then ended, in conformity with U.S. generally accepted accounting principles.
Basis for Opinion
These financial statements and financial highlights are the responsibility of the Fund’s management. Our responsibility is to express an opinion on these financial statements and financial highlights based on our audits. We are a public accounting firm registered with the Public Company Accounting Oversight Board (United States) (PCAOB) and are required to be independent with respect to the Fund in accordance with the U.S. federal securities laws and the applicable rules and regulations of the Securities and Exchange Commission and the PCAOB.
We conducted our audits in accordance with the standards of the PCAOB. Those standards require that we plan and perform the audit to obtain reasonable assurance about whether the financial statements and financial highlights are free of material misstatement, whether due to error or fraud. Our audits included performing procedures to assess the risks of material misstatement of the financial statements and financial highlights, whether due to error or fraud, and performing procedures that respond to those risks. Such procedures included examining, on a test basis, evidence regarding the amounts and disclosures in the financial statements and financial highlights. Such procedures also included confirmation of securities owned as of June 30, 2019, by correspondence with the custodian and brokers, or by other appropriate auditing procedures. Our audits also included evaluating the accounting principles used and significant estimates made by management, as well as evaluating the overall presentation of the financial statements and financial highlights. We believe that our audits provide a reasonable basis for our opinion.

We have not been able to determine the specific year that we began serving as the auditor of one or more Wells Fargo Funds investment companies; however we are aware that we have served as the auditor of one or more Wells Fargo Funds investment companies since at least 1955.
Boston, Massachusetts
August 26, 2019
58 | Wells Fargo Intermediate Tax/AMT-Free Fund
Other information (unaudited)
TAX INFORMATION
Pursuant to Section 852 of the Internal Revenue Code, 100% of distributions paid from net investment income is designated as exempt-interest dividends for the fiscal year ended June 30, 2019.
PROXY VOTING INFORMATION
A description of the policies and procedures used to determine how to vote proxies relating to portfolio securities is available, upon request, by calling1-800-222-8222, visiting our website atwfam.com, or visiting the SEC website at sec.gov. Information regarding how the proxies related to portfolio securities were voted during the most recent12-month period ended June 30 is available on the website atwfam.comor by visiting the SEC website at sec.gov.
QUARTERLY PORTFOLIO HOLDINGS INFORMATION
The Fund files its complete schedule of portfolio holdings with the SEC for the first and third quarters of each fiscal year on Form N-Q or FormN-PORT, which is available by visiting the SEC website at sec.gov. Those forms may be reviewed and copied at the SEC’s Public Reference Room in Washington, DC. Information on the operation of the Public Reference Room may be obtained by calling1-800-SEC-0330.
Wells Fargo Intermediate Tax/AMT-Free Fund | 59
Other information (unaudited)
BOARD OF TRUSTEES AND OFFICERS
Each of the Trustees and Officers1 listed in the table below acts in identical capacities for each fund in the Wells Fargo family of funds, which consists of 152 mutual funds comprising the Wells Fargo Funds Trust, Wells Fargo Variable Trust, Wells Fargo Master Trust and fourclosed-end funds (collectively the “Fund Complex”). This table should be read in conjunction with the Prospectus and the Statement of Additional Information2. The mailing address of each Trustee and Officer is 525 Market Street, 12th Floor, San Francisco, CA 94105. Each Trustee and Officer serves an indefinite term, however, each Trustee serves such term until reaching the mandatory retirement age established by the Trustees.
Independent Trustees
| | | | | | |
Name and year of birth | | Position held and
length of service* | | Principal occupations during past five years or longer | | Current other
public company or
investment
company
directorships |
| | | |
| William R. Ebsworth (Born 1957) | | Trustee, since 2015 | | Retired. From 1984 to 2013, equities analyst, portfolio manager, research director and chief investment officer at Fidelity Management and Research Company in Boston, Tokyo, and Hong Kong, and retired in 2013 as Chief Investment Officer of Fidelity Strategic Advisers, Inc. where he led a team of investment professionals managing client assets. Prior thereto, Board member of Hong Kong Securities Clearing Co., Hong Kong Options Clearing Corp., the Thailand International Fund, Ltd., Fidelity Investments Life Insurance Company, and Empire Fidelity Investments Life Insurance Company. Audit Committee Chair and Investment Committee Chair of the Vincent Memorial Hospital Endowment(non-profit organization). Mr. Ebsworth is a CFA® charterholder. | | N/A |
| | | |
| Jane A. Freeman (Born 1953) | | Trustee, since 2015; Chair Liaison, since 2018 | | Retired. From 2012 to 2014 and 1999 to 2008, Chief Financial Officer of Scientific Learning Corporation. From 2008 to 2012, Ms. Freeman provided consulting services related to strategic business projects. Prior to 1999, Portfolio Manager at Rockefeller & Co. and Scudder, Stevens & Clark. Board member of the Harding Loevner Funds from 1996 to 2014, serving as both Lead Independent Director and chair of the Audit Committee. Board member of the Russell Exchange Traded Funds Trust from 2011 to 2012 and the chair of the Audit Committee. Ms. Freeman is a Board Member of The Ruth Bancroft Garden(non-profit organization). She is also an inactive Chartered Financial Analyst. | | N/A |
| | | |
Isaiah Harris, Jr. (Born 1952) | | Trustee, since 2009; Audit Committee Chairman, since 2019 | | Retired. Chairman of the Board of CIGNA Corporation since 2009, and Director since 2005. From 2003 to 2011, Director of Deluxe Corporation. Prior thereto, President and CEO of BellSouth Advertising and Publishing Corp. from 2005 to 2007, President and CEO of BellSouth Enterprises from 2004 to 2005 and President of BellSouth Consumer Services from 2000 to 2003. Emeritus member of the Iowa State University Foundation Board of Governors. Emeritus Member of the Advisory Board of Iowa State University School of Business. Advisory Board Member, Palm Harbor Academy (private school). Advisory Board Member, Child Evangelism Fellowship(non-profit). Mr. Harris is a certified public accountant (inactive status). | | CIGNA Corporation |
| | | |
| Judith M. Johnson (Born 1949) | | Trustee, since 2008; Audit Committee Chairman, from 2009 to 2018 | | Retired. Prior thereto, Chief Executive Officer and Chief Investment Officer of Minneapolis Employees Retirement Fund from 1996 to 2008. Ms. Johnson is an attorney, certified public accountant and a certified managerial accountant. | | N/A |
60 | Wells Fargo Intermediate Tax/AMT-Free Fund
Other information (unaudited)
| | | | | | |
Name and year of birth | | Position held and
length of service* | | Principal occupations during past five years or longer | | Current other
public company or
investment
company
directorships |
| | | |
David F. Larcker (Born 1950) | | Trustee, since 2009 | | James Irvin Miller Professor of Accounting at the Graduate School of Business, Stanford University, Director of the Corporate Governance Research Initiative and Senior Faculty of The Rock Center for Corporate Governance since 2006. From 2005 to 2008, Professor of Accounting at the Graduate School of Business, Stanford University. Prior thereto, Ernst & Young Professor of Accounting at The Wharton School, University of Pennsylvania from 1985 to 2005. | | N/A |
| | | |
Olivia S. Mitchell (Born 1953) | | Trustee, since 2006; Nominating and Governance Committee Chairman, since 2018 | | International Foundation of Employee Benefit Plans Professor, Wharton School of the University of Pennsylvania since 1993. Director of Wharton’s Pension Research Council and Boettner Center on Pensions & Retirement Research, and Research Associate at the National Bureau of Economic Research. Previously, Cornell University Professor from 1978 to 1993. | | N/A |
| | | |
| Timothy J. Penny (Born 1951) | | Trustee, since 1996; Chairman, since 2018 | | President and Chief Executive Officer of Southern Minnesota Initiative Foundation, anon-profit organization, since 2007. Member of the Board of Trustees of NorthStar Education Finance, Inc., anon-profit organization, since 2007. | | N/A |
| | | |
| James G. Polisson (Born 1959) | | Trustee, since 2018 | | Retired. Chief Marketing Officer, Source (ETF) UK Services, Ltd, from 2015 to 2017. From 2012 to 2015, Principal of The Polisson Group, LLC, a management consulting, corporate advisory and principal investing company. Chief Executive Officer and Managing Director at Russell Investments, Global Exchange Traded Funds from 2010 to 2012. Managing Director of Barclays Global Investors from 1998 to 2010 and Global Chief Marketing Officer for iShares and Barclays Global Investors from 2000 to 2010. Trustee of the San Francisco Mechanics’ Institute, anon-profit organization, from 2013 to 2015. Board member of the Russell Exchange Traded Fund Trust from 2011 to 2012. Director of Barclays Global Investors Holdings Deutschland GmbH from 2006 to 2009. Mr. Polisson is an attorney and has a retired status with the Massachusetts and District of Columbia Bar Associations. | | N/A |
| * | Length of service dates reflect the Trustee’s commencement of service with the Trust’s predecessor entities, where applicable. |
Wells Fargo Intermediate Tax/AMT-Free Fund | 61
Other information (unaudited)
Officers
| | | | |
Name and year of birth | | Position held and
length of service | | Principal occupations during past five years or longer |
| | |
| Andrew Owen (Born 1960) | | President, since 2017 | | Executive Vice President of Wells Fargo & Company and Head of Affiliated Managers, Wells Fargo Asset Management, since 2014. In addition, Mr. Owen is currently President, Chief Executive Officer and Director of Wells Fargo Funds Management, LLC since 2017. Prior thereto, Executive Vice President responsible for marketing, investments and product development for Wells Fargo Funds Management, LLC, from 2009 to 2014. |
| | |
| Nancy Wiser1(Born 1967) | | Treasurer, since 2012 | | Executive Vice President of Wells Fargo Funds Management, LLC since 2011. Chief Operating Officer and Chief Compliance Officer at LightBox Capital Management LLC, from 2008 to 2011. |
| | |
Alexander Kymn (Born 1973) | | Secretary and Chief Legal Officer, since 2018 | | Senior Company Counsel of Wells Fargo Bank, N.A. since 2018 (previously Senior Counsel from 2007 to 2018). Vice President of Wells Fargo Funds Management, LLC from 2008 to 2014. |
| | |
| Michael H. Whitaker(Born 1967) | | Chief Compliance Officer, since 2016 | | Senior Vice President and Chief Compliance Officer since 2016. Senior Vice President and Chief Compliance Officer for Fidelity Investments from 2007 to 2016. |
| | |
| David Berardi (Born 1975) | | Assistant Treasurer, since 2009 | | Vice President of Wells Fargo Funds Management, LLC since 2009. Vice President of Evergreen Investment Management Company, LLC from 2008 to 2010. Manager of Fund Reporting and Control for Evergreen Investment Management Company, LLC from 2004 to 2010. |
| | |
| Jeremy DePalma1(Born 1974) | | Assistant Treasurer, since 2009 | | Senior Vice President of Wells Fargo Funds Management, LLC since 2009. Senior Vice President of Evergreen Investment Management Company, LLC from 2008 to 2010 and head of the Fund Reporting and Control Team within Fund Administration from 2005 to 2010. |
| 1 | Nancy Wiser acts as Treasurer of 65 funds in the Fund Complex. Jeremy DePalma acts as Treasurer of 87 funds and Assistant Treasurer of 65 funds in the Fund Complex. |
| 2 | The Statement of Additional Information includes additional information about the Trustees and is available, without charge, upon request, by calling1-800-222-8222 or by visiting the website atwfam.com. |
62 | Wells Fargo Intermediate Tax/AMT-Free Fund
Other information (unaudited)
BOARD CONSIDERATION OF INVESTMENT MANAGEMENT AND SUB-ADVISORY AGREEMENTS:
Wells Fargo Intermediate Tax/AMT-Free Fund
Under the Investment Company Act of 1940 (the “1940 Act”), the Board of Trustees (the “Board”) of Wells Fargo Funds Trust (the “Trust”) must determine annually whether to approve the continuation of the Trust’s investment management and sub-advisory agreements. In this regard, at an in-person meeting held on May 21-22, 2019 (the “Meeting”), the Board, all the members of which have no direct or indirect interest in the investment management and sub-advisory agreements and are not “interested persons” of the Trust, as defined in the 1940 Act (the “Independent Trustees”), reviewed and approved for Wells Fargo Intermediate Tax/AMT-Free Fund (the “Fund”): (i) an investment management agreement (the “Management Agreement”) with Wells Fargo Funds Management, LLC (“Funds Management”); and (ii) an investment sub-advisory agreement (the “Sub-Advisory Agreement”) with Wells Capital Management Incorporated (the “Sub-Adviser”), an affiliate of Funds Management. The Management Agreement and the Sub-Advisory Agreement are collectively referred to as the “Advisory Agreements.”
At the Meeting, the Board considered the factors and reached the conclusions described below relating to the selection of Funds Management and the Sub-Adviser and the approval of the Advisory Agreements. Prior to the Meeting, including at an in-person meeting in April 2019, the Trustees conferred extensively among themselves and with representatives of Funds Management about these matters. Also, the Board has adopted a team-based approach, with each team consisting of a sub-set of Trustees, to assist the full Board in the discharge of its duties in reviewing investment performance and other matters throughout the year. The Independent Trustees were assisted in their evaluation of the Advisory Agreements by independent legal counsel, from whom they received separate legal advice and with whom they met separately.
In providing information to the Board, Funds Management and the Sub-Adviser were guided by a detailed set of requests for information submitted to them by independent legal counsel on behalf of the Independent Trustees at the start of the Board’s annual contract renewal process earlier in 2019. In considering and approving the Advisory Agreements, the Trustees considered the information they believed relevant, including but not limited to the information discussed below. The Board considered not only the specific information presented in connection with the Meeting, but also the knowledge gained over time through interaction with Funds Management and the Sub-Adviser about various topics. In this regard, the Board reviewed reports of Funds Management at each of its quarterly meetings, which included, among other things, portfolio reviews and investment performance reports. In addition, the Board and the teams mentioned above confer with portfolio managers at various times throughout the year. The Board did not identify any particular information or consideration that was all-important or controlling, and each individual Trustee may have attributed different weights to various factors.
After its deliberations, the Board unanimously approved the continuation of the Advisory Agreements for a one-year term and determined that the compensation payable to Funds Management and the Sub-Adviser under each of the Advisory Agreements was reasonable. The Board considered the approval of the Advisory Agreements for the Fund as part of its consideration of agreements for funds across the complex, but its approvals were made on a fund-by-fund basis. The following summarizes a number of important, but not necessarily all, factors considered by the Board in support of its approvals.
Nature, extent and quality of services
The Board received and considered various information regarding the nature, extent and quality of services provided to the Fund by Funds Management and the Sub-Adviser under the Advisory Agreements. This information included a description of the investment advisory services and Fund-level administrative services covered by the Management Agreement, as well as, among other things, a summary of the background and experience of senior management of Wells Fargo Asset Management (“WFAM”), of which Funds Management and the Sub-Adviser are a part, a summary of investments made in the business of WFAM, a summary of certain organizational and personnel changes involving Funds Management and the Sub-Adviser, and a description of Funds Management’s and the Sub-Adviser’s business continuity planning programs and of their approaches to data privacy and cybersecurity. The Board received and reviewed information about Funds Management’s role as administrator of the Fund’s liquidity risk management program. The Board also considered the qualifications, background, tenure and responsibilities of each of the portfolio managers primarily responsible for the day-to-day portfolio management of the Fund.
The Board evaluated the ability of Funds Management and the Sub-Adviser to attract and retain qualified investment professionals, including research, advisory and supervisory personnel. The Board further considered the compliance programs and compliance records of Funds Management and the Sub-Adviser. In addition, the Board took into account the full range of services provided to the Fund by Funds Management and its affiliates.
Wells Fargo Intermediate Tax/AMT-Free Fund | 63
Other information (unaudited)
Fund investment performance and expenses
The Board considered the investment performance results for the Fund over various time periods ended December 31, 2018. The Board considered these results in comparison to the investment performance of funds in a universe that was determined by Broadridge Inc. (“Broadridge”) to be similar to the Fund (the “Universe”), and in comparison to the Fund’s benchmark index and to other comparative data. Broadridge is an independent provider of investment company data. The Board received a description of the methodology used by Broadridge to select the mutual funds in the performance Universe. The Board noted that the investment performance of the Fund (Administrator Class) was higher than the average investment performance of the Universe for the one-, five- and ten-year periods under review, and in range of the average investment performance of the Universe for the three-year period under review. The Board also noted that the investment performance of the Fund was lower than its benchmark index, the Bloomberg Barclays Municipal Bond 1-15 Year Blend Index, for the one-, three- and five-year periods under review, but higher than its benchmark for the ten-year period under review.
The Board also received and considered information regarding the Fund’s net operating expense ratios and their various components, including actual management fees, custodian and other non-management fees, and Rule 12b-1 and non-Rule 12b-1 shareholder service fees. The Board considered these ratios in comparison to the median ratios of funds in class-specific expense groups that were determined by Broadridge to be similar to the Fund (the “Groups”). The Board received a description of the methodology used by Broadridge to select the mutual funds in the expense Groups and an explanation of how funds comprising expense groups and their expense ratios may vary from year-to-year. Based on the Broadridge reports, the Board noted that the net operating expense ratios of the Fund were lower than or equal to the median net operating expense ratios of the expense Groups for each share class.
The Board took into account the Fund’s investment performance and expense information provided to it among the factors considered in deciding to re-approve the Advisory Agreements.
Investment management and sub-advisory fee rates
The Board reviewed and considered the contractual fee rates payable by the Fund to Funds Management under the Management Agreement, as well as the contractual fee rates payable by the Fund to Funds Management for class-level administrative services under a Class-Level Administration Agreement, which include, among other things, class-level transfer agency and sub-transfer agency costs (collectively, the “Management Rates”). The Board also reviewed and considered the contractual investment sub-advisory fee rates that are payable by Funds Management to the Sub-Adviser for investment sub-advisory services.
Among other information reviewed by the Board was a comparison of the Fund’s Management Rates with the average contractual investment management fee rates of funds in the expense Groups at a common asset level as well as transfer agency costs of the funds in the expense Groups. The Board noted that the Management Rates of the Fund were lower than or in range of the sum of these average rates for the Fund’s expense Groups for all share classes.
The Board also received and considered information about the portion of the total management fee that was retained by Funds Management after payment of the fee to the Sub-Adviser for sub-advisory services. In assessing the reasonableness of this amount, the Board received and evaluated information about the nature and extent of responsibilities retained and risks assumed by Funds Management and not delegated to or assumed by the Sub-Adviser, and about Funds Management’s on-going oversight services. Given the affiliation between Funds Management and the Sub-Adviser, the Board ascribed limited relevance to the allocation of fees between them.
The Board also received and considered information about the nature and extent of services offered and fee rates charged by Funds Management and the Sub-Adviser to other types of clients with investment strategies similar to those of the Fund. In this regard, the Board received information about the significantly greater scope of services, and compliance, reporting and other legal burdens and risks of managing proprietary mutual funds compared with those associated with managing assets of other types of clients, including third-party sub-advised fund clients and non-mutual fund clients such as institutional separate accounts.
Based on its consideration of the factors and information it deemed relevant, including those described here, the Board determined that the compensation payable to Funds Management under the Management Agreement and to the Sub-Adviser under the Sub-Advisory Agreement was reasonable.
Profitability
The Board received and considered information concerning the profitability of Funds Management, as well as the profitability of both WFAM and Wells Fargo & Co. (“Wells Fargo”) from providing services to the fund family as a whole. The Board noted that the Sub-Adviser’s profitability information with respect to providing services to the Fund and other funds in the family was subsumed in the WFAM and Wells Fargo profitability analysis.
64 | Wells Fargo Intermediate Tax/AMT-Free Fund
Other information (unaudited)
Funds Management reported on the methodologies and estimates used in calculating profitability, including a description of the methodology used to allocate certain expenses. Among other things, the Board noted that the levels of profitability reported on a fund-by-fund basis varied widely, depending on factors such as the size, type and age of fund. Based on its review, the Board did not deem the profits reported by Funds Management, WFAM or Wells Fargo from services provided to the Fund to be at a level that would prevent it from approving the continuation of the Advisory Agreements.
Economies of scale
The Board received and considered information about the potential for Funds Management to experience economies of scale in the provision of management services to the Fund, the difficulties of calculating economies of scale at an individual fund level, and the extent to which potential scale benefits are shared with shareholders. The Board noted the existence of breakpoints in the Fund’s management fee structure, which operate generally to reduce the Fund’s expense ratios as the Fund grows in size. The Board considered that in addition to management fee breakpoints, Funds Management shares potential economies of scale from its management business in a variety of ways, including through fee waiver and expense reimbursement arrangements, services that benefit shareholders, competitive management fee rates set at the outset without regard to breakpoints, and investments in the business intended to enhance services available to shareholders.
The Board concluded that Funds Management’s arrangements with respect to the Fund, including contractual breakpoints, constituted a reasonable approach to sharing potential economies of scale with the Fund and its shareholders.
Other benefits to Funds Management and the Sub-Adviser
The Board received and considered information regarding potential “fall-out” or ancillary benefits received by Funds Management and its affiliates, including the Sub-Adviser, as a result of their relationships with the Fund. Ancillary benefits could include, among others, benefits directly attributable to other relationships with the Fund and benefits potentially derived from an increase in Funds Management’s and the Sub-Adviser’s business as a result of their relationships with the Fund. The Board noted that various affiliates of Funds Management may receive distribution-related fees, shareholder servicing payments and sub-transfer agency fees in respect of shares sold or held through them and services provided.
The Board also reviewed information about soft dollar credits earned and utilized by the Sub-Adviser, fees earned by Funds Management and the Sub-Adviser from managing a private investment vehicle for the fund family’s securities lending collateral, and commissions earned by an affiliated broker from portfolio transactions.
Based on its consideration of the factors and information it deemed relevant, including those described here, the Board did not find that any ancillary benefits received by Funds Management and its affiliates, including the Sub-Adviser, were unreasonable.
Conclusion
At the Meeting, after considering the above-described factors and based on its deliberations and its evaluation of the information described above, the Board unanimously approved the continuation of the Advisory Agreements for a one-year term and determined that the compensation payable to Funds Management and the Sub-Adviser under each of the Advisory Agreements was reasonable.
Wells Fargo Intermediate Tax/AMT-Free Fund | 65
This page is intentionally left blank.
This page is intentionally left blank.
This page is intentionally left blank.

For more information
More information about Wells Fargo Funds is available free upon request. To obtain literature, please write, visit the Fund’s website, or call:
Wells Fargo Funds
P.O. Box 219967
Kansas City, MO 64121-9967
Website:wfam.com
Individual investors:1-800-222-8222
Retail investment professionals:1-888-877-9275
Institutional investment professionals:1-866-765-0778

This report and the financial statements contained herein are submitted for the general information of the shareholders of the Fund. If this report is used for promotional purposes, distribution of the report must be accompanied or preceded by a current prospectus. Before investing, please consider the investment objectives, risks, charges, and expenses of the investment. For a current prospectus and, if available, a summary prospectus, containing this information, call1-800-222-8222 or visit the Fund’s website atwfam.com. Read the prospectus carefully before you invest or send money.
Wells Fargo Asset Management (WFAM) is the trade name for certain investment advisory/management firms owned by Wells Fargo & Company. These firms include but are not limited to Wells Capital Management Incorporated and Wells Fargo Funds Management, LLC. Certain products managed by WFAM entities are distributed by Wells Fargo Funds Distributor, LLC (a broker-dealer and Member FINRA).
This material is for general informational and educational purposes only and is NOT intended to provide investment advice or a recommendation of any kind—including a recommendation for any specific investment, strategy, or plan.
INVESTMENT PRODUCTS: NOT FDIC INSURED ◾ NO BANK GUARANTEE ◾ MAY LOSE VALUE
© 2019 Wells Fargo Funds Management, LLC. All rights reserved.
404823 08-19
A251/AR251 06-19
Annual Report
June 30, 2019
Wells Fargo Municipal Bond Fund
Beginning on January 1, 2021, as permitted by new regulations adopted by the Securities and Exchange Commission, paper copies of the Wells Fargo Funds’ annual and semi-annual shareholder reports issued after this date will no longer be sent by mail, unless you specifically request paper copies of the reports. Instead, the reports will be made available on the Funds’ website, and you will be notified by mail each time a report is posted and provided with a website address to access the report.
If you already elected to receive shareholder reports electronically, you will not be affected by this change and you need not take any action. You may elect to receive shareholder reports and other communications from the Fund electronically at any time by contacting your financial intermediary (such as a broker-dealer or bank) or, if you are a direct investor, by calling1-800-222-8222 or by enrolling at wellsfargo.com/advantagedelivery.
You may elect to receive all future reports in paper free of charge. If you invest through a financial intermediary, you can contact your financial intermediary to request that you continue to receive paper copies of your shareholder reports; if you invest directly with the Fund, you can call 1-800-222-8222. Your election to receive reports in paper will apply to all Wells Fargo Funds held in your account with your financial intermediary or, if you are a direct investor, to all Wells Fargo Funds that you hold.
|
|
|
Reduce clutter. Save trees. |
Sign up for electronic delivery of prospectuses and shareholder reports atwellsfargo.com/advantagedelivery |
The views expressed and any forward-looking statements are as of June 30, 2019, unless otherwise noted, and are those of the Fund managers and/or Wells Fargo Asset Management. Discussions of individual securities, or the markets generally, or any Wells Fargo Fund are not intended as individual recommendations. Future events or results may vary significantly from those expressed in any forward-looking statements. The views expressed are subject to change at any time in response to changing circumstances in the market. Wells Fargo Asset Management and the Fund disclaim any obligation to publicly update or revise any views expressed or forward-looking statements.
INVESTMENT PRODUCTS: NOT FDIC INSURED ◾ NO BANK GUARANTEE ◾ MAY LOSE VALUE
Wells Fargo Municipal Bond Fund | 1
Letter to shareholders (unaudited)

Andrew Owen
President
Wells Fargo Funds
Dear Shareholder:
We are pleased to offer you this annual report for the Wells Fargo Municipal Bond Fund for the 12-month period that ended June 30, 2019. After the first six months of the period yielded either low-single-digit or negative investment returns, stock and bond investors enjoyed a recovery during the final six months. The gains came amid continued concerns about global economic growth, international trade, geopolitical tensions, and bouts of market volatility.
For the period, U.S. stocks, based on the S&P 500 Index,1 gained 10.42% and international stocks, as measured by the MSCI ACWI ex USA Index (Net),2 rose 1.29%. The MSCI EM Index (Net)3 added 1.21%. For bond investors, the Bloomberg Barclays U.S. Aggregate Bond Index4 added 7.87%, the Bloomberg Barclays Global Aggregate ex-USD Index5 rose 4.10%, the Bloomberg Barclays Municipal Bond Index6 gained 6.71%, and the ICE BofAML U.S. High Yield Index7 added 7.58%.
U.S. and international markets diverged during the third quarter of 2018.
Domestic equity investors received encouraging news during the third quarter of 2018. The U.S. Bureau of Economic Analysis reported second-quarter annualized gross domestic product (GDP) growth of 4.2%. Hiring improved. Unemployment declined. Consumer confidence and spending increased. Third-quarter corporate earnings reports were generally positive. U.S. trade negotiations with Mexico and Canada progressed. The U.S. Federal Reserve (Fed) raised the federal funds rate by 25 basis points (bps; 100 bps equal 1.00%) to a target range of between 2.00% and 2.25% in September, one of four rate increases implemented during 2018, expressing confidence in the strength of the U.S. economic expansion’s durability.
Investors in international markets were not as confident. Tensions between the U.S. and China increased. The U.S. imposed $200 billion in tariffs on Chinese goods. China reacted with $60 billion in tariffs on U.S. goods. Economic growth in China caused concern. During the quarter, the MSCI ACWI ex USA Index (Net) gained 0.71%. The MSCI EM Index (Net) declined 1.09%. In fixed-income markets, U.S. bonds were flat, as measured by the Bloomberg Barclays U.S. Aggregate Bond Index. The Bloomberg Barclays Global Aggregate ex-USD Index fell 1.74%.
| 1 | The S&P 500 Index consists of 500 stocks chosen for market size, liquidity, and industry group representation. It is a market-value-weighted index with each stock’s weight in the index proportionate to its market value. You cannot invest directly in an index. |
| 2 | The Morgan Stanley Capital International (MSCI) All Country World Index (ACWI) ex USA Index (Net) is a free-float-adjusted market-capitalization weighted index that is designed to measure the equity market performance of developed and emerging markets, excluding the U.S. Source: MSCI. MSCI makes no express or implied warranties or representations and shall have no liability whatsoever with respect to any MSCI data contained herein. The MSCI data may not be further redistributed or used as a basis for other indices or any securities or financial products. This report is not approved, reviewed, or produced by MSCI. You cannot invest directly in an index. |
| 3 | The MSCI Emerging Markets (EM) Index (Net) is a free-float-adjusted market-capitalization-weighted index that is designed to measure the equity market performance of emerging markets. You cannot invest directly in an index. |
| 4 | The Bloomberg Barclays U.S. Aggregate Bond Index is a broad-based benchmark that measures the investment-grade, U.S. dollar-denominated, fixed-rate taxable bond market, including Treasuries, government-related and corporate securities, mortgage-backed securities (agency fixed-rate and hybrid adjustable-rate mortgage pass-throughs), asset-backed securities, and commercial mortgage-backed securities. You cannot invest directly in an index. |
| 5 | The Bloomberg Barclays Global Aggregate ex-USD Index is an unmanaged index that provides a broad-based measure of the global investment-grade fixed-income markets excluding the U.S. dollar-denominated debt market. You cannot invest directly in an index. |
| 6 | The Bloomberg Barclays Municipal Bond Index is an unmanaged index composed of long-term tax-exempt bonds with a minimum credit rating of Baa. You cannot invest directly in an index. |
| 7 | The ICE BofAML U.S. High Yield Index is a market-capitalization-weighted index of domestic and Yankee high-yield bonds. The index tracks the performance of high-yield securities traded in the U.S. bond market. You cannot invest directly in an index. Copyright 2019. ICE Data Indices, LLC. All rights reserved. |
2 | Wells Fargo Municipal Bond Fund
Letter to shareholders (unaudited)
Global markets suffered during the fourth quarter of 2018.
November’s U.S. midterm elections shifted control of the House of Representatives from Republicans to Democrats, presaging partisan clashes that followed and caused uncertainty among investors. Third-quarter U.S. GDP was announced at an annualized 3.4% rate, lower than the second-quarter rate. Brexit efforts stalled ahead of the March 2019 deadline. The People’s Bank of China cut reserve requirement ratios, accelerated infrastructure spending, and cut taxes even as the value of the yuan declined to low levels last seen in 2008. A partial U.S. government shutdown driven by partisan policy disputes extended into January.
The combination of news in the U.S. and generally weak economic indicators outside of the U.S. caused investors to seek safe havens. December’s S&P 500 Index performance was the worst since 1931. Globally, fixed-income investments fared better than stocks during the last two months of the year. The Fed increased the federal funds rate by 25 bps in December to a target range of between 2.25% and 2.50%.
The market climbs a wall of worry.
Investors entered 2019 with reasons to be concerned. Investment returns appeared to reaffirm the adage that markets climb a wall of worry. The S&P 500 Index gained 8.01% for the month of January, the best monthly performance in 30 years. Returns for the MSCI ACWI ex USA Index (Net), the Bloomberg Barclays U.S. Aggregate Bond Index, and the Bloomberg Barclays Global Aggregate ex-USD Index also were positive. The Fed indicated that it would pause its program of regular rate increases during 2019 as inflation remained low.
In February 2019, concerns over slowing global growth persisted. The Bureau of Economic Analysis announced fourth-quarter 2018 GDP grew at an annualized 2.2% rate, down from the levels of the prior two quarters. In a February report, the Bank of England forecast the slowest growth since the financial crisis for 2019. China and the U.S. continued to wrangle over trade issues.
By the end of March 2019, the combination of dovish Fed sentiment and steady, if not spectacular, economic and business metrics reinforced investors’ confidence. Monthly job creation data and corporate profits, while less consistent than during 2018, were solid. China announced a roughly $300 billion stimulus package through tax and fee cuts intended to reinvigorate economic growth.
During April 2019, investors drew confidence from favorable economic projections, sustained low inflation, and solid employment data. First-quarter GDP showed the economy grew at an annualized rate of 3.2% on improvement in business investment and exports. Favorable sentiment extended to foreign markets as the MSCI ACWI ex USA Index (Net) gained 2.64% and the MSCI EM Index (Net) added 2.11% for the month.
During May 2019, investing signals were mixed. In the U.S., partisan wrangling ramped up as Democrats and Republicans set their sights on 2020 presidential politics. The U.K.’s Brexit caused Prime Minister Theresa May to resign. The European Commission downgraded the 2019 growth forecast to 1.2%. The U.S. increased tariffs on products from China, China responded, and then talks broke down. President Donald Trump threatened to turn his foreign policy tariff tool to Mexico over immigration issues. Markets tumbled.
As had been the case during most of 2019 to date, just as the investment horizon appeared to darken, sentiment turned and markets gained. The gains, primarily driven by geopolitical and monetary policy events, drove equity markets to new highs. President Trump dropped his threats of new tariffs on Mexico after talks and further tariffs on China after meeting with China’s President Xi Jinping at the G-20 summit. President Mario Draghi of the European Central Bank said that if the outlook doesn’t
“December’s S&P 500 Index performance was the worst since 1931.”
“The S&P 500 Index gained 8.01% for the month of January, the best monthly performance in 30 years.”
Wells Fargo Municipal Bond Fund | 3
Letter to shareholders (unaudited)
improve, the bank will cut rates or buy more assets to prop up inflation. In the U.S., the Fed said growth shifted from “solid” to “moderate” and indicated a willingness to cut rates.
Don’t let short-term uncertainty derail long-term investment goals.
Periods of investment uncertainty can present challenges, but experience has taught us that maintaining long-term investment goals can be an effective way to plan for the future. To help you create a sound strategy based on your personal goals and risk tolerance, Wells Fargo Funds offers more than 100 mutual funds spanning a wide range of asset classes and investment styles. Although diversification cannot guarantee an investment profit or prevent losses, we believe it can be an effective way to manage investment risk and potentially smooth out overall portfolio performance. We encourage investors to know their investments and to understand that appropriate levels of risk-taking may unlock opportunities.
Thank you for choosing to invest with Wells Fargo Funds. We appreciate your confidence in us and remain committed to helping you meet your financial needs.
Sincerely,

Andrew Owen
President
Wells Fargo Funds
|
|
|
For further information about your Fund, contact your investment professional, visit our website at wfam.com, or call us directly at1-800-222-8222. |
4 | Wells Fargo Municipal Bond Fund
This page is intentionally left blank.
Performance highlights (unaudited)
Investment objective
The Fund seeks current income exempt from federal income tax.
Manager
Wells Fargo Funds Management, LLC
Subadviser
Wells Capital Management Incorporated
Portfolio managers
Wendy Casetta‡
Terry J. Goode‡
Robert J. Miller
Average annual total returns (%) as of June 30, 2019
| | | | | | | | | | | | | | | | | | | | | | | | | | | | | | | | | | |
| | | | |
| | | | | Including sales charge | | | Excluding sales charge | | | Expense
ratios 1 (%) | |
| | | | | | | | | |
| | | Inception date | | 1 year | | | 5 year | | | 10 year | | | 1 year | | | 5 year | | | 10 year | | | Gross | | | Net2 | |
| | | | | | | | | | |
| Class A (WMFAX) | | 4-8-2005 | | | 1.58 | | | | 2.94 | | | | 5.37 | | | | 6.35 | | | | 3.90 | | | | 5.86 | | | | 0.79 | | | | 0.75 | |
| | | | | | | | | | |
| Class C (WMFCX) | | 4-8-2005 | | | 4.56 | | | | 3.12 | | | | 5.07 | | | | 5.56 | | | | 3.12 | | | | 5.07 | | | | 1.54 | | | | 1.50 | |
| | | | | | | | | | |
| Class R6 (WMBRX)3 | | 7-31-2018 | | | – | | | | – | | | | – | | | | 6.72 | | | | 4.21 | | | | 6.18 | | | | 0.41 | | | | 0.41 | |
| | | | | | | | | | |
| Administrator Class (WMFDX) | | 4-8-2005 | | | – | | | | – | | | | – | | | | 6.51 | | | | 4.03 | | | | 6.02 | | | | 0.73 | | | | 0.60 | |
| | | | | | | | | | |
| Institutional Class (WMBIX) | | 3-31-2008 | | | – | | | | – | | | | – | | | | 6.67 | | | | 4.20 | | | | 6.17 | | | | 0.46 | | | | 0.46 | |
| | | | | | | | | | |
| Bloomberg Barclays Municipal Bond Index4 | | – | | | – | | | | – | | | | – | | | | 6.71 | | | | 3.64 | | | | 4.72 | | | | – | | | | – | |
Figures quoted represent past performance, which is no guarantee of future results, and do not reflect taxes that a shareholder may pay on fund distributions or the redemption of fund shares. Investment return and principal value of an investment will fluctuate so that an investor’s shares, when redeemed, may be worth more or less than their original cost. Performance shown without sales charges would be lower if sales charges were reflected. Current performance may be lower or higher than the performance data quoted, which assumes the reinvestment of dividends and capital gains. Current month-end performance is available on the Fund’s website, wfam.com.
Index returns do not include transaction costs associated with buying and selling securities, any mutual fund fees or expenses, or any taxes. It is not possible to invest directly in an index.
For Class A shares, the maximum front-end sales charge is 4.50%. For Class C shares, the maximum contingent deferred sales charge is 1.00%. Performance including a contingent deferred sales charge assumes the sales charge for the corresponding time period. Class R6, Administrator Class, and Institutional Class shares are sold without a front-end sales charge or contingent deferred sales charge.
Bond values fluctuate in response to the financial condition of individual issuers, general market and economic conditions, and changes in interest rates. Changes in market conditions and government policies may lead to periods of heightened volatility in the bond market and reduced liquidity for certain bonds held by the Fund. In general, when interest rates rise, bond values fall and investors may lose principal value. Interest rate changes and their impact on the Fund and its share price can be sudden and unpredictable. The use of derivatives may reduce returns and/or increase volatility. Certain investment strategies tend to increase the total risk of an investment (relative to the broader market). The Fund is exposed to high-yield securities risk and municipal securities risk. Consult the Fund’s prospectus for additional information on these and other risks. A portion of the Fund’s income may be subject to federal, state, and/ or local income taxes or the Alternative Minimum Tax (AMT). Any capital gains distributions may be taxable.
Please see footnotes on page 7.
6 | Wells Fargo Municipal Bond Fund
Performance highlights (unaudited)
|
|
| Growth of $10,000 investment as of June 30, 20195 |
|
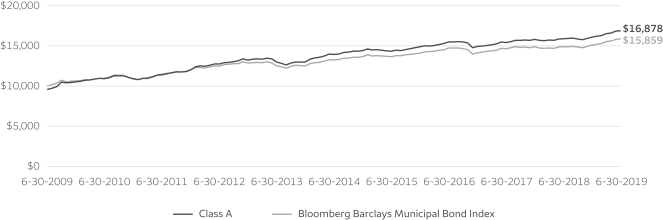
|
| ‡ | Ms. Casetta and Mr. Goode became portfolio managers of the Fund on March 28, 2019. |
| 1 | Reflects the expense ratios as stated in the most recent prospectuses. The expense ratios shown are subject to change and may differ from the annualized expense ratios shown in the financial highlights of this report. |
| 2 | The manager has contractually committed through October 31, 2020, to waive fees and/or reimburse expenses to the extent necessary to cap the expenses of each class after fee waivers at 0.75% for Class A, 1.50% for Class C, 0.43% for Class R6, 0.60% for Administrator Class, and 0.48% for Institutional Class. Brokerage commissions, stamp duty fees, interest, taxes, acquired fund fees and expenses (if any), and extraordinary expenses are excluded from the expense cap. Prior to or after the commitment expiration date, the cap may be increased or the commitment to maintain the cap may be terminated only with the approval of the Board of Trustees. Without this cap, the Fund’s returns would have been lower. The expense ratio paid by an investor is the net expense ratio (the total annual fund operating expenses after fee waivers) as stated in the prospectuses. |
| 3 | Historical performance shown for Class R6 shares prior to their inception reflects the performance of the Institutional Class shares, and includes the higher expenses applicable to Institutional Class shares. If these expenses had not been included, returns for Class R6 shares would be higher. |
| 4 | The Bloomberg Barclays Municipal Bond Index is an unmanaged index composed of long-term tax-exempt bonds with a minimum credit rating of Baa. You cannot invest directly in an index. |
| 5 | The chart compares the performance of Class A shares for the most recent ten years with the Bloomberg Barclays Municipal Bond Index. The chart assumes a hypothetical $10,000 investment in Class A shares and reflects all operating expenses and assumes the maximum initial sales charge of 4.50%. |
| 6 | Amounts are calculated based on the long-term total investments of the Fund. These amounts are subject to change and may have changed since the date specified. |
| 7 | The credit quality distribution of portfolio holdings reflected in the chart is based on ratings from Standard & Poor’s, Moody’s Investors Service, and/or Fitch Ratings Ltd. Credit quality ratings apply to the underlying holdings of the Fund and not to the Fund itself. The percentages of the Fund’s portfolio with the ratings depicted in the chart are calculated based on the total market value of fixed income securities held by the Fund. If a security was rated by all three rating agencies, the middle rating was utilized. If rated by two of three rating agencies, the lower rating was utilized, and if rated by one of the rating agencies, that rating was utilized. Standard & Poor’s rates the creditworthiness of bonds, ranging from AAA (highest) to D (lowest). Ratings from A to CCC may be modified by the addition of a plus (+) or minus (-) sign to show relative standing within the rating categories. Standard & Poor’s rates the creditworthiness of short-term notes from SP-1 (highest) to SP-3 (lowest). Moody’s rates the creditworthiness of bonds, ranging from Aaa (highest) to C (lowest). Ratings Aa to B may be modified by the addition of a number 1 (highest) to 3 (lowest) to show relative standing within the ratings categories. Moody’s rates the creditworthiness of short-term U.S. tax-exempt municipal securities from MIG 1/VMIG 1 (highest) to SG (lowest). Fitch rates the creditworthiness of bonds, ranging from AAA (highest) to D (lowest). Credit quality distribution is subject to change and may have changed since the date specified. |
Wells Fargo Municipal Bond Fund | 7
Performance highlights (unaudited)
MANAGER’S DISCUSSION
Fund highlights
| ∎ | | The Fund (Class A, excluding sales charges) underperformed its benchmark, the Bloomberg Barclays Municipal Bond Index, during the 12-month period that ended June 30, 2019. |
| ∎ | | Our conservative duration position dampened volatility early in the period but was a drag on performance as the market rallied. |
| ∎ | | Issue selection was also a key driver of performance, especially in the local general obligation (GO), transportation, education, and leasing sectors. An underweight to the strong-performing health care sector detracted from overall results. |
| ∎ | | Credit positioning was the biggest driver of performance, and our overweight to lower-investment-grade credits (A-rated and BBB-rated bonds) as well as a modest allocation to high-yield bonds positively influenced returns as these types of bonds benefited from a growing economy and a strong demand for income. |
| ∎ | | Our bias toward a flatter curve aided performance as the curve flattened over the period. |
|
|
| Effective maturity distribution as of June 30, 20196 |
|
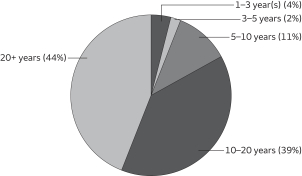 |
The Fed abruptly changed course from raising rates to a potential rate cut over the period.
Throughout most of 2018, the fixed-income markets expected the U.S. Federal Reserve (Fed) to continue the path to normalize monetary policy. Moderate economic growth, stronger employment data, and inflation near its 2% target enabled the Fed to increase the federal funds rate four times in the calendar year. Despite a Fed rate hike in December, the Treasury market rallied in the fourth quarter of 2018 as the market lowered expectations for further rate hikes amid slower global growth, trade tariffs, and uncertainty concerning Britain’s departure from the European Union. These concerns only increased as we moved
into the first half of 2019, and discussions changed from when the Fed might hike to when it might cut the federal funds rate. As a result, fixed-income markets rallied, pushing the benchmark 10-year Treasury yield from a 3.23% peak in November 2018 to 2.00% by the end of June 2019.
Specific to the municipal bond market, the beginning of the reporting period was marked with significant outflows due to a general risk-on sentiment in equity markets and the fear of rising interest rates. Short municipals slightly underperformed Treasuries over the period. As the calendar turned, so did market sentiment. Flows into municipal mutual funds not only turned positive, but record inflows were reported as investor opinion toward fixed income, particularity municipals, improved due to investor expectations that interest rates would remain stable. While new-issue supply was higher than it was a year earlier, it was still much lower than a typical year due to tax reform that eliminated the ability of issuers to advance refund outstanding, higher-cost debt on a tax-exempt basis. Technicals drove the market as overall reduced supply, state and local sales tax caps for individuals, and lower interest rates fueled demand and thus returns for municipal bonds over the period.
Factors across the market influenced Fund performance.
An overweight to credit and individual security selection were the two main drivers of performance. Yield-curve and sector positioning also aided performance, while duration positioning was a drag on performance.
Please see footnotes on page 7.
8 | Wells Fargo Municipal Bond Fund
Performance highlights (unaudited)
|
|
| Credit quality as of June 30, 20197 |
|
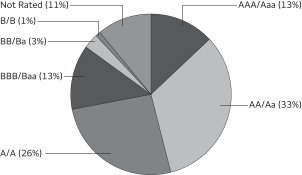 |
Demand for income remained strong during the period as overall interest rates remained low by historical standards. This demand combined with positive fund flows, low supply, and slowing but steady economic growth helped lower-investment-grade bonds (A-rated and BBB-rated bonds) as well as high-yield bonds outperform bonds in other rating categories. The Fund was overweight these rating categories and benefited as prices rose.
We have been cautious on credit for some time as yields on lower-investment-grade and high-yield bonds remain near historical lows. While an improving economy typically helps credit, we believe much of the credit rally has been driven by technicals rather than fundamentals. Consequently, we have implemented an up-in-quality trade approach by selling
specific credits and rating categories into strength and purchasing higher-grade bonds with proceeds and incremental cash flows, thereby increasing the average credit quality of the portfolio. Even so, we purposefully maintain a modest overweight to seasoned lower-quality investment-grade bonds as well as a small allocation to high-yield bonds, which enhance the income component of total return.
We maintained duration short to the benchmark, which reduced volatility but detracted from performance as the market rallied over the period. We altered the magnitude of the short duration position to tactically take advantage of market peaks and troughs. The Fund’s duration ranged from a low of 4.80 years to a high of 6.48 years. We began the period at about 89% of the benchmark’s duration and ended at roughly 95% of benchmark. We began extending duration in the third quarter of 2018 and continued into the fourth quarter, as supply increased and valuations were attractive. During the first quarter of 2019, we allowed duration to drift down as seasonal market factors took hold, with the intention of extending around tax time, when technical strength typically subsides. Fund flows and lower-than-expected supply delayed and shortened the typical window, but we took the opportunity to get duration closer to neutral by buying bonds in the 15- to 22-year part of the curve and added higher-quality bonds.
We were underweight state GO bonds, as these bonds typically represent poor relative value, as well as local GO bonds. Despite the underweights, we outperformed compared with those sectors in the index, indicating good selection within both sectors. Within revenue bond subsectors, overweights to industrial development revenue/pollution control revenue, water and sewer, and special tax bonds were positive as these sectors outperformed. We were neutral weight the leasing sector but outperformed by a wide margin, indicating favorable selection within the sector. Underweights to housing and hospital bonds were a drag on performance as these sectors outperformed. In addition, underweights to the electric, transportation, and education sectors weighed on performance as these sectors outperformed. However, despite the underweights to these sectors, we outperformed them, indicating strong selection within each sector. Our overweight to Illinois credits was positive as it was one of the top-performing states in the index. Underweights to specialty states New York and California were positive as both underperformed the index. Fortunately, the Fund had a limited number of poor-performing securities, most of which were higher-quality names purchased as part of our up-in-quality trade approach. We believe these will outperform over time as technicals unwind. A couple of our prepaid gas bonds also underperformed, detracting from overall performance.
As the expansion appears to be in the rearview mirror, a transition away from risk may be warranted.
The economic expansion started in June 2009 and is the longest since the Great Depression. Low-quality bonds and equities have performed well with both near records—highs on stocks and bonds marching to record-low yields. We believe we are late-cycle, and although economic strength remains, the trend is negative and we expect growth to slow throughout the rest of the year. Our base case does not include a recession but rather suboptimal growth with little risk of an upside surprise to inflation at this point. Global economic growth is anemic at best, with trade issues and Brexit concerns adding to a weakening economic environment. Fed rhetoric is dovish, and as of June 30, 2019, the bond market was pricing in multiple rate cuts by year-end, the effect of which would likely serve to inflate asset prices rather than provide any real economic stimulus. Slow economic growth bodes well for bonds but not necessarily for credit spreads, as slower economic growth typically weighs on credit quality.
Overall, technicals remain strong in the municipal bond market. Bond valuations in the medium term are supported by strong technicals, such as record levels of municipal debt maturities and calls, limited availability of gross municipal bond supply, and continued flows into the asset class.
The Fund is structured for a slower-growth environment, with duration close to neutral, curve positioning based largely on a key rate structure as we transition to a rate-cutting cycle, a higher credit-quality bias, and a focus on sectors that should perform well as economic growth slows.
Please see footnotes on page 7.
Wells Fargo Municipal Bond Fund | 9
Fund expenses (unaudited)
As a shareholder of the Fund, you incur two types of costs: (1) transaction costs, including sales charges (loads) on purchase payments and contingent deferred sales charges (if any) on redemptions and (2) ongoing costs, including management fees, distribution (12b-1) and/or shareholder servicing fees, and other Fund expenses. This example is intended to help you understand your ongoing costs (in dollars) of investing in the Fund and to compare these costs with the ongoing costs of investing in other mutual funds.
The example is based on an investment of $1,000 invested at the beginning of the six-month period and held for the entire period from January 1, 2019 to June 30, 2019.
Actual expenses
The “Actual” line of the table below provides information about actual account values and actual expenses. You may use the information in this line, together with the amount you invested, to estimate the expenses that you paid over the period. Simply divide your account value by $1,000 (for example, an $8,600 account value divided by $1,000 = 8.6), then multiply the result by the number in the “Actual” line under the heading entitled “Expenses paid during period” for your applicable class of shares to estimate the expenses you paid on your account during this period.
Hypothetical example for comparison purposes
The “Hypothetical” line of the table below provides information about hypothetical account values and hypothetical expenses based on the Fund’s actual expense ratio and an assumed rate of return of 5% per year before expenses, which is not the Fund’s actual return. The hypothetical account values and expenses may not be used to estimate the actual ending account balance or expenses you paid for the period. You may use this information to compare the ongoing costs of investing in the Fund and other funds. To do so, compare this 5% hypothetical example with the 5% hypothetical examples that appear in the shareholder reports of the other funds.
Please note that the expenses shown in the table are meant to highlight your ongoing costs only and do not reflect any transactional costs, such as sales charges (loads) and contingent deferred sales charges. Therefore, the “Hypothetical” line of the table is useful in comparing ongoing costs only and will not help you determine the relative total costs of owning different funds. In addition, if these transactional costs were included, your costs would have been higher.
| | | | | | | | | | | | | | | | |
| | | Beginning
account value
1-1-2019 | | | Ending
account value
6-30-2019 | | | Expenses
paid during
the period¹ | | | Annualized net
expense ratio | |
| | | | | |
Class A | | | | | | | | | | | | | | | | |
| | | | |
Actual | | $ | 1,000.00 | | | $ | 1,049.73 | | | $ | 3.81 | | | | 0.75 | % |
| | | | |
Hypothetical (5% return before expenses) | | $ | 1,000.00 | | | $ | 1,021.07 | | | $ | 3.76 | | | | 0.75 | % |
| | | | | |
Class C | | | | | | | | | | | | | | | | |
| | | | |
Actual | | $ | 1,000.00 | | | $ | 1,045.85 | | | $ | 7.61 | | | | 1.50 | % |
| | | | |
Hypothetical (5% return before expenses) | | $ | 1,000.00 | | | $ | 1,017.35 | | | $ | 7.50 | | | | 1.50 | % |
| | | | | |
Class R6 | | | | | | | | | | | | | | | | |
| | | | |
Actual | | $ | 1,000.00 | | | $ | 1,051.55 | | | $ | 2.02 | | | | 0.40 | % |
| | | | |
Hypothetical (5% return before expenses) | | $ | 1,000.00 | | | $ | 1,022.83 | | | $ | 1.99 | | | | 0.40 | % |
| | | | | |
Administrator Class | | | | | | | | | | | | | | | | |
| | | | |
Actual | | $ | 1,000.00 | | | $ | 1,050.50 | | | $ | 3.05 | | | | 0.60 | % |
| | | | |
Hypothetical (5% return before expenses) | | $ | 1,000.00 | | | $ | 1,021.82 | | | $ | 3.01 | | | | 0.60 | % |
| | | | | |
Institutional Class | | | | | | | | | | | | | | | | |
| | | | |
Actual | | $ | 1,000.00 | | | $ | 1,051.30 | | | $ | 2.27 | | | | 0.45 | % |
| | | | |
Hypothetical (5% return before expenses) | | $ | 1,000.00 | | | $ | 1,022.58 | | | $ | 2.24 | | | | 0.45 | % |
| 1 | Expenses paid is equal to the annualized net expense ratio of each class multiplied by the average account value over the period, multiplied by the number of days in the most recent fiscal half-year divided by the number of days in the fiscal year (to reflect the one-half-year period). |
10 | Wells Fargo Municipal Bond Fund
Portfolio of investments—June 30, 2019
| | | | | | | | | | | | | | | | |
| Security name | | | | | | | | Shares | | | Value | |
| Exchange-Traded Funds: 4.50% | | | | | | | | | | | | | | | | |
| | | | |
iShares National AMT-Free Municipal Bond ETF | | | | | | | | | | | 2,018,606 | | | $ | 228,284,153 | |
| | | | | | | | | | | | | | | | |
| |
Total Exchange-Traded Funds (Cost $224,710,227) | | | | 228,284,153 | |
| | | | | | | | | | | | | | | | |
| | | | |
| | | | | | | | | | | | | | | | |
| | | Interest
rate | | | Maturity
date | | | Principal | | | Value | |
| Municipal Obligations: 94.38% | | | | | | | | | | | | |
| | | | |
Alabama: 1.69% | | | | | | | | | | | | | | | | |
| | | | |
| GO Revenue: 0.07% | | | | | | | | | | | | |
| | | | |
Birmingham AL CAB Series A1 | | | 5.00 | % | | | 3-1-2045 | | | $ | 3,000,000 | | | | 3,391,560 | |
| | | | | | | | | | | | | | | | |
| | | | |
| Health Revenue: 0.30% | | | | | | | | | | | | |
| | | | |
Alabama Health Care Authority for Baptist Health Series B ø | | | 2.37 | | | | 11-1-2042 | | | | 12,600,000 | | | | 12,600,000 | |
| | | | |
UAB Medicine Finance Authority Series B | | | 5.00 | | | | 9-1-2034 | | | | 1,000,000 | | | | 1,242,830 | |
| | | | |
UAB Medicine Finance Authority Series B | | | 5.00 | | | | 9-1-2035 | | | | 1,000,000 | | | | 1,238,080 | |
| |
| | | | 15,080,910 | |
| | | | | | | | | | | | | | | | |
| | | | |
| Miscellaneous Revenue: 0.78% | | | | | | | | | | | | |
| | | | |
Alabama Federal Aid Highway Finance Authority Series A | | | 5.00 | | | | 6-1-2037 | | | | 14,000,000 | | | | 16,922,920 | |
| | | | |
Alabama Federal Aid Highway Finance Authority Series A | | | 5.00 | | | | 9-1-2035 | | | | 19,000,000 | | | | 22,629,380 | |
| |
| | | | 39,552,300 | |
| | | | | | | | | | | | | | | | |
| | | | |
| Utilities Revenue: 0.43% | | | | | | | | | | | | |
| | | | |
Southeast Alabama Gas Supply District Project #1 Series A | | | 4.00 | | | | 4-1-2049 | | | | 1,410,000 | | | | 1,528,835 | |
| | | | |
Southeast Alabama Gas Supply District Project #2 Series A | | | 4.00 | | | | 6-1-2049 | | | | 18,900,000 | | | | 20,573,217 | |
| |
| | | | 22,102,052 | |
| | | | | | | | | | | | | | | | |
| | | | |
| Water & Sewer Revenue: 0.11% | | | | | | | | | | | | |
| | | | |
Jefferson County AL CAB Series B (AGM Insured) ¤ | | | 0.00 | | | | 10-1-2025 | | | | 710,000 | | | | 602,059 | |
| | | | |
Jefferson County AL CAB Series B (AGM Insured) ¤ | | | 0.00 | | | | 10-1-2026 | | | | 3,000,000 | | | | 2,378,160 | |
| | | | |
Jefferson County AL CAB Series B (AGM Insured) ¤ | | | 0.00 | | | | 10-1-2029 | | | | 4,115,000 | | | | 2,669,154 | |
| |
| | | | 5,649,373 | |
| | | | | | | | | | | | | | | | |
| |
| | | | 85,776,195 | |
| | | | | | | | | | | | | | | | |
| | | | |
Alaska: 0.22% | | | | | | | | | | | | | | | | |
| | | | |
| Health Revenue: 0.22% | | | | | | | | | | | | |
| | | | |
Alaska IDA Loan Anticipation YKHC Project | | | 3.50 | | | | 12-1-2020 | | | | 11,300,000 | | | | 11,362,715 | |
| | | | | | | | | | | | | | | | |
| | | | |
Arizona: 1.49% | | | | | | | | | | | | | | | | |
| | | | |
| Education Revenue: 0.49% | | | | | | | | | | | | |
| | | | |
La Paz County AZ IDA Educational Facility Imagine Schools West Middle Project Series A 144A | | | 5.75 | | | | 6-15-2038 | | | | 1,085,000 | | | | 1,119,156 | |
| | | | |
La Paz County AZ IDA Educational Facility Imagine Schools West Middle Project Series A 144A | | | 5.88 | | | | 6-15-2048 | | | | 2,435,000 | | | | 2,511,289 | |
| | | | |
Phoenix AZ IDA Legacy Traditional Schools Project Series A 144A | | | 6.50 | | | | 7-1-2034 | | | | 2,000,000 | | | | 2,292,620 | |
| | | | |
Phoenix AZ IDA Rowan University Project Series 2012 | | | 5.25 | | | | 6-1-2034 | | | | 1,000,000 | | | | 1,088,680 | |
| | | | |
Pima County AZ IDA New Plan Learning Project Series A | | | 7.75 | | | | 7-1-2035 | | | | 7,390,000 | | | | 7,484,814 | |
| | | | |
Pima County AZ IDA New Plan Learning Project Series A | | | 8.13 | | | | 7-1-2041 | | | | 6,395,000 | | | | 6,477,240 | |
| | | | |
Pima County AZ IDA Noah Webster Schools-Pima Project | | | 7.00 | | | | 12-15-2043 | | | | 3,225,000 | | | | 3,607,614 | |
| |
| | | | 24,581,413 | |
| | | | | | | | | | | | | | | | |
Wells Fargo Municipal Bond Fund | 11
Portfolio of investments—June 30, 2019
| | | | | | | | | | | | | | | | |
| | | Interest
rate | | | Maturity
date | | | Principal | | | Value | |
| | | | |
| Health Revenue: 0.18% | | | | | | | | | | | | |
| | | | |
Arizona Health Facilities Authority Revenue Bond Banner Health Series 2012A | | | 4.00 | % | | | 1-1-2043 | | | $ | 5,565,000 | | | $ | 5,754,154 | |
| | | | |
Tempe AZ IDA Friendship Village Project Series A | | | 5.25 | | | | 12-1-2020 | | | | 1,000,000 | | | | 1,041,500 | |
| | | | |
Tempe AZ IDA Friendship Village Project Series A | | | 5.38 | | | | 12-1-2021 | | | | 1,000,000 | | | | 1,067,650 | |
| | | | |
Tempe AZ IDA Friendship Village Project Series A | | | 5.50 | | | | 12-1-2022 | | | | 1,000,000 | | | | 1,067,160 | |
| | | | |
| | | | | | | | | | | | | | | 8,930,464 | |
| | | | | | | | | | | | | | | | |
| | | | |
| Miscellaneous Revenue: 0.23% | | | | | | | | | | | | |
| | | | |
Arizona Board Regents Certificates Refunding University Arizona Series C | | | 5.00 | | | | 6-1-2028 | | | | 3,250,000 | | | | 3,554,948 | |
| | | | |
Navajo Nation AZ Refunding Bond Series A 144A | | | 5.50 | | | | 12-1-2030 | | | | 7,275,000 | | | | 8,197,616 | |
| | | | |
| | | | | | | | | | | | | | | 11,752,564 | |
| | | | | | | | | | | | | | | | |
| | | | |
| Resource Recovery Revenue: 0.06% | | | | | | | | | | | | |
| | | | |
Yavapai County AZ IDA Waste Management Incorporated Project | | | 2.80 | | | | 6-1-2027 | | | | 3,200,000 | | | | 3,257,568 | |
| | | | | | | | | | | | | | | | |
| | | | |
| Tax Revenue: 0.32% | | | | | | | | | | | | |
| | | | |
Phoenix AZ Civic Improvement Corporation Series A | | | 5.00 | | | | 7-1-2034 | | | | 13,875,000 | | | | 16,269,409 | |
| | | | | | | | | | | | | | | | |
| | | | |
| Utilities Revenue: 0.00% | | | | | | | | | | | | |
| | | | |
Maricopa County AZ PCR Public Service Company of New Mexico Palo Verde Project Series B | | | 5.20 | | | | 6-1-2043 | | | | 100,000 | | | | 102,993 | |
| | | | | | | | | | | | | | | | |
| | | | |
| Water & Sewer Revenue: 0.21% | | | | | | | | | | | | |
| | | | |
Phoenix AZ Civic Improvement Corporation Junior Lien Refunding Bond | | | 5.00 | | | | 7-1-2034 | | | | 8,805,000 | | | | 10,529,371 | |
| | | | | | | | | | | | | | | | |
| | | | |
| | | | | | | | | | | | | | | 75,423,782 | |
| | | | | | | | | | | | | | | | |
| | | | |
California: 4.20% | | | | | | | | | | | | | | | | |
| | | | |
| Airport Revenue: 1.12% | | | | | | | | | | | | |
| | | | |
Los Angeles CA Department Airports AMT Subordinate Revenue Bond | | | 5.00 | | | | 5-15-2034 | | | | 1,750,000 | | | | 2,056,950 | |
| | | | |
Los Angeles CA Department of Airports Subordinate Revenue Bonds | | | 4.00 | | | | 5-15-2036 | | | | 2,000,000 | | | | 2,182,640 | |
| | | | |
Los Angeles CA Department of Airports Subordinate Revenue Bonds Series A | | | 5.25 | | | | 5-15-2048 | | | | 15,000,000 | | | | 18,080,100 | |
| | | | |
San Francisco CA City & County Airport Commission San Francisco International Airport Series B | | | 5.00 | | | | 5-1-2046 | | | | 30,000,000 | | | | 34,471,200 | |
| | | | |
| | | | | | | | | | | | | | | 56,790,890 | |
| | | | | | | | | | | | | | | | |
| | | | |
| Education Revenue: 0.13% | | | | | | | | | | | | |
| | | | |
California Municipal Finance Authority Charter School Albert Einstein Academies Project Series A | | | 7.13 | | | | 8-1-2043 | | | | 2,230,000 | | | | 2,486,316 | |
| | | | |
University of California Series K | | | 4.00 | | | | 5-15-2046 | | | | 3,880,000 | | | | 4,172,979 | |
| | | | |
| | | | | | | | | | | | | | | 6,659,295 | |
| | | | | | | | | | | | | | | | |
| | | | |
| GO Revenue: 1.03% | | | | | | | | | | | | |
| | | | |
Alhambra CA Unified School District CAB Election of 2008 Series B (AGC Insured) ¤ | | | 0.00 | | | | 8-1-2031 | | | | 7,500,000 | | | | 5,555,175 | |
| | | | |
Alhambra CA Unified School District CAB Election of 2008 Series B (AGM Insured) ¤ | | | 0.00 | | | | 8-1-2031 | | | | 2,175,000 | | | | 1,611,001 | |
| | | | |
Alhambra CA Unified School District CAB Election of 2008 Series B (AGM Insured) ¤ | | | 0.00 | | | | 8-1-2032 | | | | 3,795,000 | | | | 2,700,674 | |
| | | | |
Alhambra CA Unified School District CAB Election of 2008 Series B (AGM Insured) ¤ | | | 0.00 | | | | 8-1-2034 | | | | 5,000,000 | | | | 3,306,100 | |
| | | | |
Alhambra CA Unified School District CAB Election of 2008 Series B (AGM Insured) ¤ | | | 0.00 | | | | 8-1-2035 | | | | 6,700,000 | | | | 4,258,118 | |
| | | | |
Anaheim CA Union High School District Election Series 2014 | | | 4.00 | | | | 8-1-2042 | | | | 4,000,000 | | | | 4,362,640 | |
12 | Wells Fargo Municipal Bond Fund
Portfolio of investments—June 30, 2019
| | | | | | | | | | | | | | | | |
| | | Interest
rate | | | Maturity
date | | | Principal | | | Value | |
| | | | |
| GO Revenue (continued) | | | | | | | | | | | | |
| | | | |
California Tender Option Bond Trust Receipts/Certificates Santa Clara County CA San Jose Unified School District Series 2015 (JPMorgan Chase & Company LIQ) 144Aø | | | 2.05 | % | | | 8-1-2022 | | | $ | 2,050,000 | | | $ | 2,050,000 | |
| | | | |
Colton CA Unified School District CAB Series B (AGM Insured) ¤ | | | 0.00 | | | | 8-1-2031 | | | | 1,000,000 | | | | 737,170 | |
| | | | |
Colton CA Unified School District CAB Series B (AGM Insured) ¤ | | | 0.00 | | | | 8-1-2032 | | | | 1,000,000 | | | | 711,640 | |
| | | | |
Colton CA Unified School District CAB Series B (AGM Insured) ¤ | | | 0.00 | | | | 8-1-2033 | | | | 1,000,000 | | | | 687,460 | |
| | | | |
Compton CA Community College District CAB Election of 2002 Series C ¤ | | | 0.00 | | | | 8-1-2032 | | | | 2,515,000 | | | | 1,717,393 | |
| | | | |
Compton CA Community College District CAB Election of 2002 Series C ¤ | | | 0.00 | | | | 8-1-2033 | | | | 2,000,000 | | | | 1,315,160 | |
| | | | |
El Monte CA Union High School District CAB Election of 2008 (AGM Insured) ¤ | | | 0.00 | | | | 6-1-2030 | | | | 2,000,000 | | | | 1,525,640 | |
| | | | |
El Monte CA Union High School District CAB Election of 2008 (AGM Insured) ¤ | | | 0.00 | | | | 6-1-2031 | | | | 2,000,000 | | | | 1,468,520 | |
| | | | |
El Monte CA Union High School District CAB Election of 2008 (AGM Insured) ¤ | | | 0.00 | | | | 6-1-2032 | | | | 1,660,000 | | | | 1,175,512 | |
| | | | |
El Monte CA Union High School District CAB Election of 2008 (AGM Insured) ¤ | | | 0.00 | | | | 6-1-2033 | | | | 1,230,000 | | | | 840,963 | |
| | | | |
Ontario Montclair CA School District CAB (AGC Insured) ¤ | | | 0.00 | | | | 8-1-2028 | | | | 1,500,000 | | | | 1,230,810 | |
| | | | |
Ontario Montclair CA School District CAB (AGC Insured) ¤ | | | 0.00 | | | | 8-1-2030 | | | | 2,000,000 | | | | 1,493,900 | |
| | | | |
San Diego CA Unified School District CAB Series C ¤ | | | 0.00 | | | | 7-1-2031 | | | | 2,000,000 | | | | 1,486,920 | |
| | | | |
San Diego CA Unified School District CAB Series C ¤ | | | 0.00 | | | | 7-1-2033 | | | | 1,000,000 | | | | 696,100 | |
| | | | |
San Diego CA Unified School District CAB Series C ¤ | | | 0.00 | | | | 7-1-2034 | | | | 2,000,000 | | | | 1,342,020 | |
| | | | |
State of California Series A4 (Citibank NA LOC) ø | | | 1.92 | | | | 5-1-2034 | | | | 10,460,000 | | | | 10,460,000 | |
| | | | |
Wiseburn CA School District CAB Election of 2010 Series B (AGM Insured) ¤ | | | 0.00 | | | | 8-1-2034 | | | | 2,530,000 | | | | 1,706,384 | |
| | | | |
| | | | | | | | | | | | | | | 52,439,300 | |
| | | | | | | | | | | | | | | | |
| | | | |
| Health Revenue: 0.25% | | | | | | | | | | | | |
| | | | |
California Statewide CDA Sutter Health Series A | | | 6.00 | | | | 8-15-2042 | | | | 4,900,000 | | | | 5,164,649 | |
| | | | |
San Buenaventura CA Community Mental Health System | | | 6.00 | | | | 12-1-2019 | | | | 1,040,000 | | | | 1,057,295 | |
| | | | |
San Buenaventura CA Community Mental Health System | | | 6.25 | | | | 12-1-2020 | | | | 2,000,000 | | | | 2,119,540 | |
| | | | |
University of California Regents University Medical Center Pooled Revenue Bonds 2016 Series L | | | 5.00 | | | | 5-15-2047 | | | | 3,885,000 | | | | 4,486,748 | |
| | | | |
| | | | | | | | | | | | | | | 12,828,232 | |
| | | | | | | | | | | | | | | | |
| | | | |
| Industrial Development Revenue: 0.07% | | | | | | | | | | | | |
| | | | |
California PCFA Solid Waste Disposal AMT Green Bond Calplant I Project 144A | | | 8.00 | | | | 7-1-2039 | | | | 3,270,000 | | | | 3,550,958 | |
| | | | | | | | | | | | | | | | |
| | | | |
| Miscellaneous Revenue: 0.67% | | | | | | | | | | | | |
| | | | |
Anaheim CA PFA Convention Center Expansion Project Series A | | | 5.00 | | | | 5-1-2046 | | | | 8,500,000 | | | | 9,637,470 | |
| | | | |
California Public Works Board Judicial Council Project Series A | | | 5.00 | | | | 3-1-2031 | | | | 3,260,000 | | | | 3,664,305 | |
| | | | |
Pasadena CA PFA CAB Rose Bowl Series A ¤ | | | 0.00 | | | | 3-1-2027 | | | | 2,095,000 | | | | 1,799,500 | |
| | | | |
Pasadena CA PFA CAB Rose Bowl Series A ¤ | | | 0.00 | | | | 3-1-2028 | | | | 4,450,000 | | | | 3,714,326 | |
| | | | |
Pasadena CA PFA CAB Rose Bowl Series A ¤ | | | 0.00 | | | | 3-1-2029 | | | | 4,520,000 | | | | 3,666,714 | |
| | | | |
Pasadena CA PFA CAB Rose Bowl Series A ¤ | | | 0.00 | | | | 3-1-2031 | | | | 2,185,000 | | | | 1,631,758 | |
| | | | |
Pasadena CA PFA CAB Rose Bowl Series A ¤ | | | 0.00 | | | | 3-1-2032 | | | | 2,000,000 | | | | 1,435,080 | |
| | | | |
Pasadena CA PFA CAB Rose Bowl Series A ¤ | | | 0.00 | | | | 3-1-2033 | | | | 4,295,000 | | | | 2,980,730 | |
| | | | |
Richmond CA Joint Powers Financing Authority Civic Center Project Series A (AGC Insured) | | | 5.88 | | | | 8-1-2037 | | | | 25,000 | | | | 25,086 | |
| | | | |
Richmond CA Joint Powers Financing Authority Point Potrero Series A | | | 6.25 | | | | 7-1-2024 | | | | 5,420,000 | | | | 5,441,138 | |
| | | | |
| | | | | | | | | | | | | | | 33,996,107 | |
| | | | | | | | | | | | | | | | |
Wells Fargo Municipal Bond Fund | 13
Portfolio of investments—June 30, 2019
| | | | | | | | | | | | | | | | |
| | | Interest rate | | | Maturity date | | | Principal | | | Value | |
| Tax Revenue: 0.05% | | | | | | | | | | | | |
| | | | |
Norco CA Redevelopment Agency Tax Refunding Redevelopment Bond Project Area #1 | | | 6.00 | % | | | 3-1-2036 | | | $ | 1,120,000 | | | $ | 1,155,650 | |
| | | | |
San Diego County CA Regional Transportation Commission Limited Tax Series A | | | 5.00 | | | | 4-1-2048 | | | | 915,000 | | | | 1,072,581 | |
| | | | |
| | | | | | | | | | | | | | | 2,228,231 | |
| | | | | | | | | | | | | | | | |
| | | | |
| Transportation Revenue: 0.48% | | | | | | | | | | | | |
| | | | |
Bay Area CA Toll Authority Toll Bridge Series A (SIFMA Municipal Swap +1.25%)± | | | 3.15 | | | | 4-1-2036 | | | | 23,545,000 | | | | 24,284,784 | |
| | | | | | | | | | | | | | | | |
| | | | |
| Utilities Revenue: 0.40% | | | | | | | | | | | | |
| | | | |
M-S-R California Energy Authority Gas Series B | | | 6.13 | | | | 11-1-2029 | | | | 15,925,000 | | | | 20,238,923 | |
| | | | | | | | | | | | | | | | |
| | | | |
| | | | | | | | | | | | | | | 213,016,720 | |
| | | | | | | | | | | | | | | | |
| | | | |
Colorado: 4.28% | | | | | | | | | | | | | | | | |
| | | | |
| Airport Revenue: 0.12% | | | | | | | | | | | | |
| | | | |
Denver CO City & County Airport System Revenue Series 2012A | | | 5.00 | | | | 12-1-2037 | | | | 3,130,000 | | | | 3,738,754 | |
| | | | |
Denver CO City & County Airport System Revenue Series 2012B | | | 5.00 | | | | 11-15-2030 | | | | 2,000,000 | | | | 2,218,080 | |
| | | | |
| | | | | | | | | | | | | | | 5,956,834 | |
| | | | | | | | | | | | | | | | |
| | | | |
| Education Revenue: 0.95% | | | | | | | | | | | | |
| | | | |
Colorado Board of Governors State University Enterprise System Revenue Bonds Series 2013C | | | 5.25 | | | | 3-1-2033 | | | | 725,000 | | | | 827,965 | |
| | | | |
Colorado Board of Governors State University Enterprise System Revenue Prerefunded Bond Series 2018 E-1 | | | 5.00 | | | | 3-1-2040 | | | | 555,000 | | | | 661,416 | |
| | | | |
Colorado Board of Governors State University Enterprise System Revenue Prerefunded Bond Series E-1 | | | 5.00 | | | | 3-1-2040 | | | | 390,000 | | | | 464,779 | |
| | | | |
Colorado Board of Governors State University Enterprise System Revenue Unrefunded Bond Series 2018 E-1 | | | 5.00 | | | | 3-1-2040 | | | | 1,055,000 | | | | 1,204,947 | |
| | | | |
Colorado ECFA Alexander Dawson School LLC Project | | | 5.00 | | | | 2-15-2040 | | | | 1,000,000 | | | | 1,018,540 | |
| | | | |
Colorado ECFA Charter School Aspen Ridge School Project Series 2015A 144A | | | 4.13 | | | | 7-1-2026 | | | | 515,000 | | | | 531,150 | |
| | | | |
Colorado ECFA Charter School Banning Lewis Ranch Academy Project Series A | | | 6.00 | | | | 12-15-2037 | | | | 3,400,000 | | | | 3,542,732 | |
| | | | |
Colorado ECFA Charter School Banning Lewis Ranch Academy Project Series B-2 | | | 7.00 | | | | 12-15-2046 | | | | 3,940,000 | | | | 4,267,847 | |
| | | | |
Colorado ECFA Charter School Ben Franklin Academy Project | | | 5.00 | | | | 7-1-2036 | | | | 750,000 | | | | 846,788 | |
| | | | |
Colorado ECFA Charter School Collegiate Project (Syncora Guarantee Incorporated Insured) | | | 5.25 | | | | 6-15-2024 | | | | 1,140,000 | | | | 1,142,440 | |
| | | | |
Colorado ECFA Charter School Community Leadership Academy | | | 5.75 | | | | 7-1-2019 | | | | 195,000 | | | | 195,000 | |
| | | | |
Colorado ECFA Charter School Community Leadership Academy Second Campus Project | | | 7.00 | | | | 8-1-2033 | | | | 1,240,000 | | | | 1,399,625 | |
| | | | |
Colorado ECFA Charter School District Montessori Charter School Project | | | 5.00 | | | | 7-15-2037 | | | | 1,150,000 | | | | 1,243,783 | |
| | | | |
Colorado ECFA Charter School Pinnacle High School Project Series 2009 | | | 5.13 | | | | 12-1-2039 | | | | 500,000 | | | | 502,440 | |
| | | | |
Colorado ECFA Charter School Refunding and Improvement Bonds Skyview Academy Project 2014 144A | | | 4.13 | | | | 7-1-2024 | | | | 500,000 | | | | 509,875 | |
| | | | |
Colorado ECFA Charter School Refunding and Improvement Bonds University Laboratory School Project 2015 | | | 5.00 | | | | 12-15-2028 | | | | 600,000 | | | | 657,012 | |
| | | | |
Colorado ECFA Charter School Rocky Mountain Classical Academy Project Series A | | | 7.50 | | | | 9-1-2033 | | | | 5,015,000 | | | | 6,248,038 | |
| | | | |
Colorado ECFA Charter School Rocky Mountain Classical Academy Project Series A | | | 8.00 | | | | 9-1-2043 | | | | 5,930,000 | | | | 7,493,800 | |
14 | Wells Fargo Municipal Bond Fund
Portfolio of investments—June 30, 2019
| | | | | | | | | | | | | | | | |
| | | Interest rate | | | Maturity date | | | Principal | | | Value | |
| | | | |
| Education Revenue (continued) | | | | | | | | | | | | |
| | | | |
Colorado ECFA Charter School Rocky Mountain Classical Academy Project Series A | | | 8.13 | % | | | 9-1-2048 | | | $ | 3,795,000 | | | $ | 4,814,868 | |
| | | | |
Colorado ECFA Charter School Twin Peaks Charter Academy | | | 6.50 | | | | 3-15-2043 | | | | 1,290,000 | | | | 1,354,874 | |
| | | | |
Colorado ECFA Refunding Bonds The University Corporation for Atmosphere Research Project Series 2010 | | | 5.00 | | | | 9-1-2032 | | | | 1,265,000 | | | | 1,317,966 | |
| | | | |
Colorado ECFA Refunding Bonds The University Corporation for Atmosphere Research Project Series B | | | 5.00 | | | | 9-1-2030 | | | | 1,770,000 | | | | 1,939,832 | |
| | | | |
Colorado ECFA Union Colony School Project Revenue Bond Series 2018 | | | 5.00 | | | | 4-1-2048 | | | | 715,000 | | | | 823,945 | |
| | | | |
Colorado PFA Charter School Highline Academy Project | | | 6.25 | | | | 12-15-2020 | | | | 150,000 | | | | 156,104 | |
| | | | |
Colorado PFA Charter School Highline Academy Project | | | 6.75 | | | | 12-15-2025 | | | | 455,000 | | | | 490,090 | |
| | | | |
Colorado PFA Charter School Highline Academy Project | | | 7.38 | | | | 12-15-2040 | | | | 4,010,000 | | | | 4,352,735 | |
| | | | |
| | | | | | | | | | | | | | | 48,008,591 | |
| | | | | | | | | | | | | | | | |
| | | | |
| GO Revenue: 0.37% | | | | | | | | | | | | |
| | | | |
Arapahoe County CO Copperleaf Metropolitan District #2 | | | 5.75 | | | | 12-1-2045 | | | | 500,000 | | | | 524,300 | |
| | | | |
Arapahoe County CO Littleton Metropolitan School District #6 | | | 5.50 | | | | 12-1-2043 | | | | 9,900,000 | | | | 12,496,077 | |
| | | | |
Aurora CO Cornerstar Metropolitan District Refunding Bond Series A | | | 5.25 | | | | 12-1-2047 | | | | 1,000,000 | | | | 1,048,150 | |
| | | | |
Aurora CO Park 70 Metropolitan District | | | 5.00 | | | | 12-1-2046 | | | | 1,000,000 | | | | 1,097,020 | |
| | | | |
Colorado International Center Metropolitan District #3 Refunding Bonds | | | 4.63 | | | | 12-1-2031 | | | | 635,000 | | | | 640,880 | |
| | | | |
Colorado Parker Homestead Metropolitan District Refunding and Improvement Bonds Series 2016 | | | 5.63 | | | | 12-1-2044 | | | | 1,000,000 | | | | 1,057,340 | |
| | | | |
Weld County CO Eaton Area Park & Recreation District Series 2015 | | | 5.50 | | | | 12-1-2038 | | | | 1,075,000 | | | | 1,140,382 | |
| | | | |
Wheatlands CO Metropolitan District #2 Refunding Bond (Build America Mutual Assurance Company Insured) | | | 5.00 | | | | 12-1-2030 | | | | 500,000 | | | | 588,940 | |
| | | | |
| | | | | | | | | | | | | | | 18,593,089 | |
| | | | | | | | | | | | | | | | |
| | | | |
| Health Revenue: 0.52% | | | | | | | | | | | | |
| | | | |
Aspen Valley Hospital District Refunding Bonds Series 2012 | | | 5.00 | | | | 10-15-2033 | | | | 600,000 | | | | 642,498 | |
| | | | |
Colorado Health Facilities Authority Catholic Health Initiatives Series A | | | 5.00 | | | | 7-1-2039 | | | | 14,260,000 | | | | 14,298,787 | |
| | | | |
Colorado Health Facilities Authority Catholic Health Initiatives Series D-1 | | | 6.25 | | | | 10-1-2033 | | | | 5,000,000 | | | | 5,035,700 | |
| | | | |
Colorado Health Facilities Authority Evangelical Lutheran Good Samaritan Society Series 2015A | | | 5.00 | | | | 6-1-2040 | | | | 1,000,000 | | | | 1,114,150 | |
| | | | |
Colorado Health Facilities Authority Frasier Meadows Retirement Community Project Series 2017A | | | 5.25 | | | | 5-15-2047 | | | | 1,000,000 | | | | 1,110,710 | |
| | | | |
Colorado Health Facilities Authority Sisters of Charity Leavenworth Health System Series 2013A | | | 5.50 | | | | 1-1-2035 | | | | 1,000,000 | | | | 1,142,330 | |
| | | | |
Colorado Health Facilities Authority Sunny Vista Living Center Series 2015A 144A | | | 5.00 | | | | 12-1-2025 | | | | 670,000 | | | | 692,257 | |
| | | | |
Denver CO Health & Hospital Authority Refunding Bonds Series 2017A 144A | | | 5.00 | | | | 12-1-2034 | | | | 500,000 | | | | 580,000 | |
| | | | |
University of Colorado Hospital Authority Series A | | | 6.00 | | | | 11-15-2029 | | | | 2,000,000 | | | | 2,034,480 | |
| | | | |
| | | | | | | | | | | | | | | 26,650,912 | |
| | | | | | | | | | | | | | | | |
| | | | |
| Miscellaneous Revenue: 0.57% | | | | | | | | | | | | |
| | | | |
Aurora CO Certificate of Participation Refunding Bonds Series 2009A | | | 5.00 | | | | 12-1-2027 | | | | 2,000,000 | | | | 2,029,320 | |
| | | | |
Aurora CO E-470 Public Highway Authority CAB Series A (National Insured) ¤ | | | 0.00 | | | | 9-1-2034 | | | | 4,000,000 | | | | 2,480,560 | |
| | | | |
Colorado Bridge Enterprise Revenue | | | 4.00 | | | | 12-31-2029 | | | | 2,705,000 | | | | 3,031,818 | |
| | | | |
Colorado Bridge Enterprise Revenue | | | 4.00 | | | | 6-30-2030 | | | | 3,115,000 | | | | 3,479,922 | |
| | | | |
Colorado Bridge Enterprise Revenue | | | 4.00 | | | | 6-30-2031 | | | | 665,000 | | | | 738,449 | |
| | | | |
Colorado Regional Transportation District Certificate of Participation Series 2010A | | | 5.38 | | | | 6-1-2031 | | | | 2,500,000 | | | | 2,583,150 | |
Wells Fargo Municipal Bond Fund | 15
Portfolio of investments—June 30, 2019
| | | | | | | | | | | | | | | | |
| | | Interest rate | | | Maturity date | | | Principal | | | Value | |
| | | | |
| Miscellaneous Revenue (continued) | | | | | | | | | | | | |
| | | | |
Colorado Regional Transportation District Certificate of Participation Series 2014A | | | 5.00 | % | | | 6-1-2044 | | | $ | 2,000,000 | | | $ | 2,214,820 | |
| | | | |
Denver CO School District #1 Certificate of Participation Series B | | | 5.00 | | | | 12-15-2035 | | | | 1,000,000 | | | | 1,173,830 | |
| | | | |
Denver CO School District #1 Certificate of Participation Series B | | | 5.00 | | | | 12-15-2045 | | | | 1,200,000 | | | | 1,384,860 | |
| | | | |
Fremont County CO Finance Corporation Certificate of Participation Series 2013 | | | 5.25 | | | | 12-15-2038 | | | | 1,265,000 | | | | 1,366,681 | |
| | | | |
Garfield County CO Public Library District Lease Purchase Financing Program Series 2009 | | | 5.00 | | | | 12-1-2026 | | | | 715,000 | | | | 725,875 | |
| | | | |
Longmont CO Certificate of Participation Series 2014 | | | 5.00 | | | | 12-1-2034 | | | | 1,000,000 | | | | 1,125,740 | |
| | | | |
Platte Valley CO Fire Protection District Series 2012 | | | 5.00 | | | | 12-1-2036 | | | | 325,000 | | | | 345,420 | |
| | | | |
Westminster CO Certificate of Participation Series 2015A | | | 5.00 | | | | 12-1-2035 | | | | 2,000,000 | | | | 2,355,120 | |
| | | | |
Westminster CO Public Schools Certificate of Participation Series 2019 (AGM Insured) | | | 5.00 | | | | 12-1-2048 | | | | 3,500,000 | | | | 4,140,220 | |
| | | | |
| | | | | | | | | | | | | | | 29,175,785 | |
| | | | | | | | | | | | | | | | |
| | | | |
| Tax Revenue: 1.39% | | | | | | | | | | | | |
| | | | |
City of Commerce City CO Sales and Use Tax Revenue Bonds Series 2014 (AGM Insured) | | | 5.00 | | | | 8-1-2044 | | | | 1,250,000 | | | | 1,405,100 | |
| | | | |
Colorado Park Creek Metropolitan District Refunding Bonds Series A | | | 5.00 | | | | 12-1-2045 | | | | 500,000 | | | | 557,715 | |
| | | | |
Colorado Regional Transportation District Fastracks Project Revenue Bonds Series 2013A | | | 5.00 | | | | 11-1-2031 | | | | 1,000,000 | | | | 1,110,950 | |
| | | | |
Denver CO City & County Excise Tax Series A (AGC Insured) | | | 6.00 | | | | 9-1-2021 | | | | 2,000,000 | | | | 2,015,460 | |
| | | | |
Denver CO City & County Refunding and Improvement Bonds Series A | | | 5.00 | | | | 8-1-2044 | | | | 3,000,000 | | | | 3,506,880 | |
| | | | |
Regional Transportation District Colorado Fastracks Project Series A | | | 5.00 | | | | 11-1-2041 | | | | 50,945,000 | | | | 60,223,613 | |
| | | | |
Thornton CO Development Authority East 144th Avenue and I-25 Project Series B | | | 5.00 | | | | 12-1-2034 | | | | 1,375,000 | | | | 1,585,815 | |
| | | | |
| | | | | | | | | | | | | | | 70,405,533 | |
| | | | | | | | | | | | | | | | |
| | | | |
| Transportation Revenue: 0.16% | | | | | | | | | | | | |
| | | | |
Colorado E-470 Public Highway Authority CAB Series B (National Insured) ¤ | | | 0.00 | | | | 9-1-2022 | | | | 4,600,000 | | | | 4,350,220 | |
| | | | |
Colorado High Performance Transportation Enterprise US 36 & I-25 Managed Lanes | | | 5.75 | | | | 1-1-2044 | | | | 3,360,000 | | | | 3,675,134 | |
| | | | |
| | | | | | | | | | | | | | | 8,025,354 | |
| | | | | | | | | | | | | | | | |
| | | | |
| Utilities Revenue: 0.07% | | | | | | | | | | | | |
| | | | |
Colorado Springs CO Utilities System Improvement Bonds Series 2013 B-2 | | | 5.00 | | | | 11-15-2038 | | | | 3,000,000 | | | | 3,383,100 | |
| | | | | | | | | | | | | | | | |
| | | | |
| Water & Sewer Revenue: 0.13% | | | | | | | | | | | | |
| | | | |
Aurora CO Water Revenue Refunding Bond First Lien | | | 5.00 | | | | 8-1-2046 | | | | 5,000,000 | | | | 5,871,150 | |
| | | | |
East Cherry Creek Valley CO Water and Sanitation District | | | 5.00 | | | | 11-15-2032 | | | | 750,000 | | | | 887,880 | |
| | | | |
| | | | | | | | | | | | | | | 6,759,030 | |
| | | | | | | | | | | | | | | | |
| | | | |
| | | | | | | | | | | | | | | 216,958,228 | |
| | | | | | | | | | | | | | | | |
| | | | |
Connecticut: 0.81% | | | | | | | | | | | | | | | | |
| | | | |
| GO Revenue: 0.18% | | | | | | | | | | | | |
| | | | |
Hamden CT BAN | | | 5.00 | | | | 8-15-2026 | | | | 1,235,000 | | | | 1,373,431 | |
| | | | |
Hartford CT Series A | | | 5.00 | | | | 4-1-2028 | | | | 3,165,000 | | | | 3,510,808 | |
| | | | |
Hartford CT Series B | | | 5.00 | | | | 4-1-2025 | | | | 1,220,000 | | | | 1,362,606 | |
| | | | |
Hartford CT Series B | | | 5.00 | | | �� | 4-1-2026 | | | | 1,470,000 | | | | 1,638,315 | |
| | | | |
Hartford CT Series B | | | 5.00 | | | | 4-1-2027 | | | | 1,000,000 | | | | 1,111,250 | |
| | | | |
| | | | | | | | | | | | | | | 8,996,410 | |
| | | | | | | | | | | | | | | | |
16 | Wells Fargo Municipal Bond Fund
Portfolio of investments—June 30, 2019
| | | | | | | | | | | | | | | | |
| | | Interest rate | | | Maturity date | | | Principal | | | Value | |
| Miscellaneous Revenue: 0.10% | | | | | | | | | | | | |
| | | | |
Connecticut General Obligation Bonds 2012 Series E | | | 5.00 | % | | | 9-15-2032 | | | $ | 4,860,000 | | | $ | 5,295,359 | |
| | | | | | | | | | | | | | | | |
| | | | |
| Tax Revenue: 0.53% | | | | | | | | | | | | |
| | | | |
Connecticut Special Tax Obligation Revenue Transportation Infrastructure Purpose Series 2014A | | | 5.00 | | | | 9-1-2028 | | | | 10,105,000 | | | | 11,661,877 | |
| | | | |
Connecticut Special Tax Obligation Revenue Transportation Infrastructure Purpose Series 2018B | | | 5.00 | | | | 10-1-2036 | | | | 5,000,000 | | | | 6,007,850 | |
| | | | |
Connecticut Special Tax Obligation Revenue Transportation Infrastructure Purpose Series 2018B | | | 5.00 | | | | 10-1-2037 | | | | 7,500,000 | | | | 8,980,650 | |
| | | | |
| | | | | | | | | | | | | | | 26,650,377 | |
| | | | | | | | | | | | | | | | |
| | | | |
| | | | | | | | | | | | | | | 40,942,146 | |
| | | | | | | | | | | | | | | | |
| | | | |
Delaware: 0.29% | | | | | | | | | | | | | | | | |
| | | | |
| Education Revenue: 0.20% | | | | | | | | | | | | |
| | | | |
Delaware EDA Odyssey Charter School Incorporated Project Series A 144A | | | 7.00 | | | | 9-1-2045 | | | | 7,500,000 | | | | 8,070,600 | |
| | | | |
Kent County DE Charter School Incorporated Project | | | 7.38 | | | | 5-1-2037 | | | | 2,110,000 | | | | 2,232,422 | |
| | | | |
| | | | | | | | | | | | | | | 10,303,022 | |
| | | | | | | | | | | | | | | | |
| | | | |
| Transportation Revenue: 0.09% | | | | | | | | | | | | |
| | | | |
Delaware Transportation Authority US 301 Project | | | 5.00 | | | | 6-1-2055 | | | | 3,950,000 | | | | 4,459,985 | |
| | | | | | | | | | | | | | | | |
| | | | |
| | | | | | | | | | | | | | | 14,763,007 | |
| | | | | | | | | | | | | | | | |
| | | | |
District of Columbia: 0.93% | | | | | | | | | | | | | | | | |
| | | | |
| Education Revenue: 0.04% | | | | | | | | | | | | |
| | | | |
District of Columbia Cesar Chavez Public Charter School | | | 6.50 | | | | 11-15-2021 | | | | 2,265,000 | | | | 2,301,761 | |
| | | | | | | | | | | | | | | | |
| | | | |
| GO Revenue: 0.12% | | | | | | | | | | | | |
| | | | |
District of Columbia | | | 5.00 | | | | 6-1-2037 | | | | 5,000,000 | | | | 6,014,650 | |
| | | | | | | | | | | | | | | | |
| | | | |
| Miscellaneous Revenue: 0.45% | | | | | | | | | | | | |
| | | | |
District of Columbia | | | 5.00 | | | | 10-15-2044 | | | | 10,000,000 | | | | 12,193,300 | |
| | | | |
Tender Option Bond Trust Receipts/Floater Certificates Series 2019-BAML8002 (Bank of America NA LOC, Bank of America NA LIQ) 144Aø | | | 1.98 | | | | 3-1-2052 | | | | 10,450,000 | | | | 10,450,000 | |
| | | | |
| | | | | | | | | | | | | | | 22,643,300 | |
| | | | | | | | | | | | | | | | |
| | | | |
| Tax Revenue: 0.32% | | | | | | | | | | | | |
| | | | |
District of Columbia Income Tax Secured Series G | | | 5.00 | | | | 12-1-2036 | | | | 15,000,000 | | | | 16,191,450 | |
| | | | | | | | | | | | | | | | |
| | | | |
| | | | | | | | | | | | | | | 47,151,161 | |
| | | | | | | | | | | | | | | | |
| | | | |
Florida: 4.99% | | | | | | | | | | | | | | | | |
| | | | |
| Airport Revenue: 1.51% | | | | | | | | | | | | |
| | | | |
Broward County FL Airport System Revenue Bond AMT Series 2015A | | | 5.00 | | | | 10-1-2036 | | | | 12,440,000 | | | | 14,228,001 | |
| | | | |
Greater Orlando FL Aviation Authority Series A | | | 5.00 | | | | 10-1-2046 | | | | 3,000,000 | | | | 3,468,420 | |
| | | | |
Hillsborough County FL Aviation Authority Revenue Tampa International Airport Series A | | | 5.00 | | | | 10-1-2048 | | | | 7,000,000 | | | | 8,218,700 | |
| | | | |
Hillsborough County FL Aviation Authority Revenue Tampa International Airport Series B | | | 5.00 | | | | 10-1-2040 | | | | 1,000,000 | | | | 1,141,370 | |
| | | | |
Hillsborough County FL Aviation Authority Revenue Tampa International Airport Series E | | | 5.00 | | | | 10-1-2048 | | | | 10,000,000 | | | | 11,785,500 | |
Wells Fargo Municipal Bond Fund | 17
Portfolio of investments—June 30, 2019
| | | | | | | | | | | | | | | | |
| | | Interest rate | | | Maturity date | | | Principal | | | Value | |
| | | | |
| Airport Revenue (continued) | | | | | | | | | | | | |
| | | | |
Hillsborough County FL Aviation Authority Revenue Tampa International Airport Series F | | | 5.00 | % | | | 10-1-2048 | | | $ | 17,000,000 | | | $ | 20,403,400 | |
| | | | |
Jacksonville FL Port Authority Series B | | | 5.00 | | | | 11-1-2044 | | | | 4,080,000 | | | | 4,873,805 | |
| | | | |
Jacksonville FL Port Authority Series B | | | 5.00 | | | | 11-1-2048 | | | | 9,870,000 | | | | 11,734,048 | |
| | | | |
Miami-Dade County FL Seaport AMT Series B | | | 6.00 | | | | 10-1-2033 | | | | 500,000 | | | | 576,220 | |
| | | | |
| | | | | | | | | | | | | | | 76,429,464 | |
| | | | | | | | | | | | | | | | |
| | | | |
| Education Revenue: 0.60% | | | | | | | | | | | | |
| | | | |
Capital Trust Agency Florida Educational Facilities Revenue Renaissance Charter School Incorporated 144A | | | 5.00 | | | | 6-15-2039 | | | | 3,610,000 | | | | 3,740,646 | |
| | | | |
Florida Development Finance Corporation Educational Facilities Renaissance Charter School Project Series A | | | 8.50 | | | | 6-15-2044 | | | | 13,290,000 | | | | 15,257,186 | |
| | | | |
Florida Higher Educational Facilities Authority Jacksonville University Project Series A-1 144A | | | 5.00 | | | | 6-1-2048 | | | | 2,000,000 | | | | 2,168,940 | |
| | | | |
Lakeland FL Educational Facilities Authority Florida Southern College Project Series A | | | 5.00 | | | | 9-1-2025 | | | | 530,000 | | | | 579,672 | |
| | | | |
Lakeland FL Educational Facilities Authority Florida Southern College Project Series A | | | 5.00 | | | | 9-1-2028 | | | | 1,195,000 | | | | 1,300,638 | |
| | | | |
Pinellas County FL Educational Facilities Authority Barry University Project | | | 5.00 | | | | 10-1-2027 | | | | 1,600,000 | | | | 1,704,064 | |
| | | | |
Seminole County FL IDA Choices in Learning Series A | | | 6.20 | | | | 11-15-2026 | | | | 1,535,000 | | | | 1,622,142 | |
| | | | |
Seminole County FL IDA Choices in Learning Series A | | | 7.38 | | | | 11-15-2041 | | | | 3,525,000 | | | | 3,801,572 | |
| | | | |
| | | | | | | | | | | | | | | 30,174,860 | |
| | | | | | | | | | | | | | | | |
| | | | |
| GO Revenue: 0.64% | | | | | | | | | | | | |
| | | | |
Miami-Dade County FL School District | | | 5.00 | | | | 3-15-2046 | | | | 15,000,000 | | | | 17,368,950 | |
| | | | |
Miami-Dade County FL Series 2014-A | | | 5.00 | | | | 7-1-2043 | | | | 12,935,000 | | | | 15,034,609 | |
| | | | |
| | | | | | | | | | | | | | | 32,403,559 | |
| | | | | | | | | | | | | | | | |
| | | | |
| Health Revenue: 0.84% | | | | | | | | | | | | |
| | | | |
ACTS Retirement Life Communities Incorporated Obligated Group Escambia County Health Facilities Authority Refunding Bonds Series 2003B (AGC Insured, TD Bank NA SPA) ø | | | 2.05 | | | | 11-15-2029 | | | | 1,475,000 | | | | 1,475,000 | |
| | | | |
Atlantic Beach FL Health Care Facilities Fleet Landing Project Series B | | | 5.63 | | | | 11-15-2043 | | | | 5,000,000 | | | | 5,569,450 | |
| | | | |
Collier County FL IDA NCH Healthcare System Project | | | 6.25 | | | | 10-1-2039 | | | | 17,015,000 | | | | 18,324,985 | |
| | | | |
Holmes County FL Hospital Corporation Doctors Memorial Hospital Project | | | 6.00 | | | | 11-1-2038 | | | | 2,500,000 | | | | 2,500,350 | |
| | | | |
Lee County FL IDA Shell Point Alliance %% | | | 5.00 | | | | 11-15-2049 | | | | 6,350,000 | | | | 7,283,260 | |
| | | | |
Lee Memorial Health System Series B ø | | | 2.13 | | | | 4-1-2049 | | | | 2,000,000 | | | | 2,000,000 | |
| | | | |
St. Petersburg FL Health Facilities Authority All Children’s Project Series A | | | 6.50 | | | | 11-15-2039 | | | | 5,500,000 | | | | 5,603,675 | |
| | | | |
| | | | | | | | | | | | | | | 42,756,720 | |
| | | | | | | | | | | | | | | | |
| | | | |
| Housing Revenue: 0.07% | | | | | | | | | | | | |
| | | | |
Florida Housing Finance Corporation Journet Place Apartments Series 1 | | | 7.60 | | | | 12-15-2047 | | | | 790,000 | | | | 960,198 | |
| | | | |
Florida Housing Finance Corporation Villa Capri Phase III | | | 7.60 | | | | 12-15-2042 | | | | 2,615,000 | | | | 2,745,384 | |
| | | | |
| | | | | | | | | | | | | | | 3,705,582 | |
| | | | | | | | | | | | | | | | |
| | | | |
| Industrial Development Revenue: 0.04% | | | | | | | | | | | | |
| | | | |
Florida Development Finance Corporation 144A | | | 5.00 | | | | 5-1-2029 | | | | 2,000,000 | | | | 2,182,220 | |
| | | | | | | | | | | | | | | | |
| | | | |
| Miscellaneous Revenue: 0.43% | | | | | | | | | | | | |
| | | | |
CityPlace Florida Community Development District | | | 5.00 | | | | 5-1-2022 | | | | 1,000,000 | | | | 1,088,620 | |
| | | | |
Collier County FL School Board Refunding Bond Certificate of Participation (AGM Insured) | | | 5.25 | | | | 2-15-2021 | | | | 1,000,000 | | | | 1,062,580 | |
18 | Wells Fargo Municipal Bond Fund
Portfolio of investments—June 30, 2019
| | | | | | | | | | | | | | | | |
| | | Interest rate | | | Maturity date | | | Principal | | | Value | |
| | | | |
| Miscellaneous Revenue (continued) | | | | | | | | | | | | |
| | | | |
Hillsborough County FL | | | 5.00 | % | | | 10-1-2038 | | | $ | 8,000,000 | | | $ | 9,325,440 | |
| | | | |
Indigo FL Community Development District Series C †† | | | 1.40 | | | | 5-1-2030 | | | | 2,248,150 | | | | 1,573,705 | |
| | | | |
Lakeside Plantation FL Community Development District Series A | | | 6.95 | | | | 5-1-2031 | | | | 1,041,000 | | | | 1,042,228 | |
| | | | |
Marshall Creek Florida Community Development District †† | | | 5.00 | | | | 5-1-2032 | | | | 1,870,000 | | | | 1,809,655 | |
| | | | |
Marshall Creek Florida Community Development District | | | 6.32 | | | | 5-1-2045 | | | | 125,000 | | | | 120,076 | |
| | | | |
Orlando FL Capital Improvement Special Revenue Series B | | | 5.00 | | | | 10-1-2033 | | | | 1,525,000 | | | | 1,766,758 | |
| | | | |
Orlando FL Capital Improvement Special Revenue Series B | | | 5.00 | | | | 10-1-2035 | | | | 1,680,000 | | | | 1,946,532 | |
| | | | |
Orlando FL Capital Improvement Special Revenue Series B | | | 5.00 | | | | 10-1-2036 | | | | 1,765,000 | | | | 2,039,846 | |
| | | | |
| | | | | | | | | | | | | | | 21,775,440 | |
| | | | | | | | | | | | | | | | |
| | | | |
| Resource Recovery Revenue: 0.08% | | | | | | | | | | | | |
| | | | |
Florida Development Finance Corporation Solid Waste AMT Pro USA Incorporated 144A | | | 5.00 | | | | 8-1-2029 | | | | 4,000,000 | | | | 4,237,280 | |
| | | | | | | | | | | | | | | | |
| | | | |
| Tax Revenue: 0.40% | | | | | | | | | | | | |
| | | | |
Florida Board of Education Public Education Refunding Capital Outlay Series D | | | 4.00 | | | | 6-1-2031 | | | | 8,000,000 | | | | 8,499,760 | |
| | | | |
Florida Board of Education Series E | | | 5.00 | | | | 6-1-2031 | | | | 10,065,000 | | | | 11,995,064 | |
| | | | |
| | | | | | | | | | | | | | | 20,494,824 | |
| | | | | | | | | | | | | | | | |
| | | | |
| Utilities Revenue: 0.10% | | | | | | | | | | | | |
| | | | |
Jacksonville FL Electric Authority Subordinate Revenue Bonds 2012 Series A | | | 4.00 | | | | 10-1-2031 | | | | 5,040,000 | | | | 5,158,037 | |
| | | | | | | | | | | | | | | | |
| | | | |
| Water & Sewer Revenue: 0.28% | | | | | | | | | | | | |
| | | | |
Charlotte County FL IDA 144A | | | 5.00 | | | | 10-1-2034 | | | | 1,000,000 | | | | 1,073,240 | |
| | | | |
Daytona Beach FL Refunding & Improvement Bonds Project (AGM Insured) | | | 5.00 | | | | 11-1-2031 | | | | 1,155,000 | | | | 1,275,813 | |
| | | | |
Daytona Beach FL Refunding & Improvement Bonds Project (AGM Insured) | | | 5.00 | | | | 11-1-2032 | | | | 1,465,000 | | | | 1,614,972 | |
| | | | |
Florida Keys Aqueduct Authority Series A | | | 5.00 | | | | 9-1-2041 | | | | 2,750,000 | | | | 3,173,775 | |
| | | | |
Viera East Florida Community Development District Water Management Project (National Insured) | | | 5.75 | | | | 5-1-2020 | | | | 2,020,000 | | | | 2,075,914 | |
| | | | |
Viera East Florida Community Development District Water Management Project (National Insured) | | | 5.75 | | | | 5-1-2021 | | | | 2,140,000 | | | | 2,269,534 | |
| | | | |
Viera East Florida Community Development District Water Management Project (National Insured) | | | 5.75 | | | | 5-1-2022 | | | | 2,265,000 | | | | 2,478,839 | |
| | | | |
| | | | | | | | | | | | | | | 13,962,087 | |
| | | | | | | | | | | | | | | | |
| | | | |
| | | | | | | | | | | | | | | 253,280,073 | |
| | | | | | | | | | | | | | | | |
| | | | |
| Georgia: 3.06% | | | | | | | | | | | | |
| | | | |
| Education Revenue: 0.20% | | | | | | | | | | | | |
| | | | |
Cobb County GA Development Authority Charter Learning Center Foundation Central Project Series A †† | | | 4.38 | | | | 7-1-2025 | | | | 1,705,000 | | | | 1,468,380 | |
| | | | |
Georgia Private Colleges & Universities Authority Mercer University Project | | | 5.00 | | | | 10-1-2040 | | | | 5,000,000 | | | | 5,543,350 | |
| | | | |
Georgia Private Colleges & Universities Authority Series A | | | 5.25 | | | | 10-1-2027 | | | | 2,655,000 | | | | 2,856,010 | |
| | | | |
| | | | | | | | | | | | | | | 9,867,740 | |
| | | | | | | | | | | | | | | | |
| | | | |
| Health Revenue: 0.37% | | | | | | | | | | | | |
| | | | |
Fulton County GA Development Authority Hospital Revenue Bond Series A | | | 5.00 | | | | 4-1-2047 | | | | 2,250,000 | | | | 2,591,280 | |
| | | | |
Gainesville & Hall Counties GA Development Authority Senior Living Facilities Lanier Village Series B (AGC Insured, TD Bank NA SPA) ø | | | 2.05 | | | | 11-15-2033 | | | | 6,825,000 | | | | 6,825,000 | |
Wells Fargo Municipal Bond Fund | 19
Portfolio of investments—June 30, 2019
| | | | | | | | | | | | | | | | |
| | | Interest rate | | | Maturity date | | | Principal | | | Value | |
| | | | |
| Health Revenue (continued) | | | | | | | | | | | | |
| | | | |
Gainesville GA Hospital Authority Series C ø | | | 2.12 | % | | | 2-15-2047 | | | $ | 6,645,000 | | | $ | 6,645,000 | |
| | | | |
The Glynn-Brunswick Memorial Hospital Authority Revenue Anticipation Certificates Series 2015 | | | 5.00 | | | | 8-1-2034 | | | | 2,580,000 | | | | 2,913,439 | |
| | | | |
| | | | | | | | | | | | | | | 18,974,719 | |
| | | | | | | | | | | | | | | | |
| | | | |
| Transportation Revenue: 0.11% | | | | | | | | | | | | |
| | | | |
Georgia Road & Tollway Authority CAB I-75 South Expressway Lanes Project Series A 144A¤ | | | 0.00 | | | | 6-1-2034 | | | | 3,750,000 | | | | 1,466,063 | |
| | | | |
Georgia Road & Tollway Authority CCAB I-75 South Expressway Lanes Project Series B 144A¤ | |
| 0.00
|
| | | 6-1-2049 | | | | 5,600,000 | | | | 4,168,248 | |
| | | | |
| | | | | | | | | | | | | | | 5,634,311 | |
| | | | | | | | | | | | | | | | |
| | | | |
| Utilities Revenue: 2.38% | | | | | | | | | | | | |
| | | | |
Appling County GA Development Authority Oglethorpe Power Corporation Hatch Project | | | 2.40 | | | | 1-1-2038 | | | | 16,530,000 | | | | 16,620,217 | |
| | | | |
Bartow County GA Development Authority | | | 2.75 | | | | 12-1-2032 | | | | 20,000,000 | | | | 20,511,800 | |
| | | | |
Burke County GA Development Authority | | | 2.93 | | | | 11-1-2053 | | | | 14,750,000 | | | | 15,280,263 | |
| | | | |
Burke County GA Development Authority Georgia Power Company Plant Vogtle Project Series 2 | | | 2.93 | | | | 11-1-2048 | | | | 10,000,000 | | | | 10,359,500 | |
| | | | |
Burke County GA Development Authority Oglethorpe Power Corporation Vogtle Project Series F | | | 3.00 | | | | 11-1-2045 | | | | 5,000,000 | | | | 5,094,550 | |
| | | | |
Georgia Municipal Electric Authority Power Series EE (Ambac Insured) | | | 7.25 | | | | 1-1-2024 | | | | 400,000 | | | | 490,456 | |
| | | | |
Main Street Natural Gas Incorporated Georgia Gas Project Series A (Royal Bank of Canada LIQ) | | | 4.00 | | | | 3-1-2023 | | | | 1,000,000 | | | | 1,084,780 | |
| | | | |
Main Street Natural Gas Incorporated Georgia Gas Project Series A | | | 5.00 | | | | 5-15-2032 | | | | 3,745,000 | | | | 4,505,422 | |
| | | | |
Main Street Natural Gas Incorporated Georgia Gas Project Series B | | | 4.00 | | | | 8-1-2049 | | | | 20,000,000 | | | | 22,186,200 | |
| | | | |
Main Street Natural Gas Incorporated Georgia Gas Project Series C | | | 4.00 | | | | 8-1-2048 | | | | 15,000,000 | | | | 16,387,950 | |
| | | | |
Main Street Natural Gas Incorporated Georgia Gas Project Subordinate Bond Series A (Royal Bank of Canada LIQ) | | | 4.00 | | | | 4-1-2048 | | | | 2,900,000 | | | | 3,158,158 | |
| | | | |
Main Street Natural Gas Incorporated Georgia Gas Project Subordinate Bond Series B (1 Month LIBOR +0.75%)± | | | 2.39 | | | | 4-1-2048 | | | | 5,100,000 | | | | 5,044,461 | |
| | | | |
| | | | | | | | | | | | | | | 120,723,757 | |
| | | | | | | | | | | | | | | | |
| | | | |
| | | | | | | | | | | | | | | 155,200,527 | |
| | | | | | | | | | | | | | | | |
| | | | |
Guam: 0.13% | | | | | | | | | | | | | | | | |
| | | | |
| Airport Revenue: 0.01% | | | | | | | | | | | | |
| | | | |
Guam Port Authority Private Activity-AMT Bond Series 2018B | | | 5.00 | | | | 7-1-2030 | | | | 500,000 | | | | 585,070 | |
| | | | | | | | | | | | | | | | |
| | | | |
| Housing Revenue: 0.00% | | | | | | | | | | | | |
| | | | |
Guam Housing Corporation Guaranteed Mortgage-Backed Securities Series A (FHLMC Insured) | | | 5.75 | | | | 9-1-2031 | | | | 60,000 | | | | 61,180 | |
| | | | | | | | | | | | | | | | |
| | | | |
| Miscellaneous Revenue: 0.08% | | | | | | | | | | | | |
| | | | |
Guam Government Limited Obligation Bonds Section 30 Series A | | | 5.38 | | | | 12-1-2024 | | | | 3,195,000 | | | | 3,249,603 | |
| | | | |
Guam Government Limited Obligation Bonds Section 30 Series A | | | 5.75 | | | | 12-1-2034 | | | | 500,000 | | | | 509,315 | |
| | | | |
| | | | | | | | | | | | | | | 3,758,918 | |
| | | | | | | | | | | | | | | | |
| | | | |
| Tax Revenue: 0.02% | | | | | | | | | | | | |
| | | | |
Guam Government Business Privilege Tax Series A | | | 5.00 | | | | 1-1-2031 | | | | 1,000,000 | | | | 1,050,110 | |
| | | | | | | | | | | | | | | | |
| | | | |
| Water & Sewer Revenue: 0.02% | | | | | | | | | | | | |
| | | | |
Guam Government Waterworks Authority Series 2013 | | | 5.25 | | | | 7-1-2023 | | | | 1,000,000 | | | | 1,117,830 | |
| | | | | | | | | | | | | | | | |
| | | | |
| | | | | | | | | | | | | | | 6,573,108 | |
| | | | | | | | | | | | | | | | |
20 | Wells Fargo Municipal Bond Fund
Portfolio of investments—June 30, 2019
| | | | | | | | | | | | | | | | |
| | | Interest rate | | | Maturity date | | | Principal | | | Value | |
Hawaii: 0.43% | | | | | | | | | | | | | | | | |
| | | | |
| Airport Revenue: 0.37% | | | | | | | | | | | | |
| | | | |
Hawaii Airports System Revenue Series A | | | 5.00 | % | | | 7-1-2048 | | | $ | 7,000,000 | | | $ | 8,235,430 | |
| | | | |
Hawaii AMT Series A | | | 5.00 | | | | 7-1-2041 | | | | 9,500,000 | | | | 10,775,470 | |
| | | | |
| | | | | | | | | | | | | | | 19,010,900 | |
| | | | | | | | | | | | | | | | |
| | | | |
| GO Revenue: 0.06% | | | | | | | | | | | | |
| | | | |
Hawaii Prerefunded Bond Series DZ | | | 5.00 | | | | 12-1-2031 | | | | 1,670,000 | | | | 1,815,106 | |
| | | | |
Hawaii Unrefunded Bond Series DZ | | | 5.00 | | | | 12-1-2031 | | | | 1,030,000 | | | | 1,120,774 | |
| | | | |
| | | | | | | | | | | | | | | 2,935,880 | |
| | | | | | | | | | | | | | | | |
| | | | |
| | | | | | | | | | | | | | | 21,946,780 | |
| | | | | | | | | | | | | | | | |
| | | | |
Idaho: 0.10% | | | | | | | | | | | | | | | | |
| | | | |
| Education Revenue: 0.10% | | | | | | | | | | | | |
| | | | |
Idaho Housing & Finance Association Idaho Arts Charter School Incorporated Project Series A | | | 5.75 | | | | 12-1-2032 | | | | 500,000 | | | | 544,455 | |
| | | | |
Idaho Housing & Finance Association Legacy Public Charter School Incorporated Project Series A | | | 5.85 | | | | 5-1-2033 | | | | 670,000 | | | | 701,932 | |
| | | | |
Idaho Housing & Finance Association Legacy Public Charter School Incorporated Project Series A | | | 6.25 | | | | 5-1-2043 | | | | 1,365,000 | | | | 1,430,479 | |
| | | | |
Idaho Housing & Finance Association Liberty Charter School Series A | | | 6.00 | | | | 6-1-2038 | | | | 500,000 | | | | 500,890 | |
| | | | |
Idaho Housing & Finance Association Nonprofit CAB North Star Charter School Series B 144A¤ | | | 0.00 | | | | 7-1-2049 | | | | 1,276,564 | | | | 225,735 | |
| | | | |
Idaho Housing & Finance Association Nonprofit North Star Charter School Series A | | | 6.75 | | | | 7-1-2048 | | | | 1,322,876 | | | | 1,433,032 | |
| | | | |
| | | | | | | | | | | | | | | 4,836,523 | |
| | | | | | | | | | | | | | | | |
| | | | |
Illinois: 12.85% | | | | | | | | | | | | | | | | |
| | | | |
| Airport Revenue: 0.60% | | | | | | | | | | | | |
| | | | |
Chicago IL O’Hare International Airport AMT Passenger Facility Charge Series B | | | 5.00 | | | | 1-1-2026 | | | | 5,000,000 | | | | 5,405,400 | |
| | | | |
Chicago IL O’Hare International Airport AMT Senior Lien Series C | | | 5.50 | | | | 1-1-2044 | | | | 4,000,000 | | | | 4,435,960 | |
| | | | |
Chicago IL O’Hare International Airport Customer Facility Charge Senior Lien (AGM Insured) | | | 5.50 | | | | 1-1-2043 | | | | 4,530,000 | | | | 5,070,746 | |
| | | | |
Chicago IL O’Hare International Airport Customer Facility Charge Senior Lien Series D | | | 5.75 | | | | 1-1-2043 | | | | 4,500,000 | | | | 5,075,010 | |
| | | | |
Chicago IL O’Hare International Airport Senior Lien Series B | | | 5.00 | | | | 1-1-2039 | | | | 8,000,000 | | | | 9,342,000 | |
| | | | |
Chicago IL O’Hare International Airport Transportation Infrastructure Properties Obligated Group | | | 5.00 | | | | 7-1-2038 | | | | 1,000,000 | | | | 1,157,320 | |
| | | | |
| | | | | | | | | | | | | | | 30,486,436 | |
| | | | | | | | | | | | | | | | |
| | | | |
| Education Revenue: 0.46% | | | | | | | | | | | | |
| | | | |
Illinois Finance Authority Charter Schools Project Series A | | | 6.25 | | | | 9-1-2039 | | | | 7,955,000 | | | | 8,873,087 | |
| | | | |
Illinois Finance Authority Charter Schools Refunding & Improvement Bonds Series A | | | 6.88 | | | | 10-1-2031 | | | | 1,655,000 | | | | 1,777,553 | |
| | | | |
Illinois Finance Authority Student Housing Illinois State University | | | 6.75 | | | | 4-1-2031 | | | | 8,000,000 | | | | 8,740,320 | |
| | | | |
University of Illinois Auxiliary Facilities Systems CAB Series A (National Insured) ¤ | | | 0.00 | | | | 4-1-2026 | | | | 2,355,000 | | | | 2,013,666 | |
| | | | |
University of Illinois Auxiliary Facilities Systems CAB Series A (National Insured) ¤ | | | 0.00 | | | | 4-1-2027 | | | | 2,435,000 | | | | 2,016,545 | |
| | | | |
| | | | | | | | | | | | | | | 23,421,171 | |
| | | | | | | | | | | | | | | | |
Wells Fargo Municipal Bond Fund | 21
Portfolio of investments—June 30, 2019
| | | | | | | | | | | | | | | | |
| | | Interest rate | | | Maturity date | | | Principal | | | Value | |
| GO Revenue: 3.79% | | | | | | | | | | | | |
| | | | |
Champaign & Piatt Counties IL School Series A (AGM Insured) | | | 5.00 | % | | | 10-1-2021 | | | $ | 1,890,000 | | | $ | 2,028,254 | |
| | | | |
Chicago IL Board of Education CAB City Colleges (National Insured) ¤ | | | 0.00 | | | | 1-1-2025 | | | | 9,935,000 | | | | 8,513,103 | |
| | | | |
Chicago IL Board of Education CAB School Reform Series A (National Insured) ¤ | | | 0.00 | | | | 12-1-2020 | | | | 1,000,000 | | | | 964,100 | |
| | | | |
Chicago IL Board of Education CAB School Reform Series B-1 (National Insured) ¤ | | | 0.00 | | | | 12-1-2023 | | | | 2,930,000 | | | | 2,596,273 | |
| | | | |
Chicago IL Board of Education CAB School Reform Series B-1 (National Insured) ¤ | | | 0.00 | | | | 12-1-2026 | | | | 4,245,000 | | | | 3,416,801 | |
| | | | |
Chicago IL CAB City Colleges (National Insured) ¤ | | | 0.00 | | | | 1-1-2030 | | | | 5,995,000 | | | | 4,270,059 | |
| | | | |
Chicago IL CAB Project & Refunding Bond Series C (AGM Insured) ¤ | | | 0.00 | | | | 1-1-2026 | | | | 7,360,000 | | | | 6,145,747 | |
| | | | |
Chicago IL Neighborhoods Alive 21 Program Series B | | | 5.50 | | | | 1-1-2032 | | | | 1,285,000 | | | | 1,426,350 | |
| | | | |
Chicago IL Neighborhoods Alive 21 Program Series B | | | 5.50 | | | | 1-1-2034 | | | | 1,500,000 | | | | 1,657,920 | |
| | | | |
Chicago IL Series A (National Insured) | | | 5.00 | | | | 1-1-2029 | | | | 3,835,000 | | | | 3,846,620 | |
| | | | |
Chicago IL Series A | | | 5.50 | | | | 1-1-2034 | | | | 7,175,000 | | | | 7,930,384 | |
| | | | |
Chicago IL Series A | | | 5.50 | | | | 1-1-2035 | | | | 1,715,000 | | | | 1,891,662 | |
| | | | |
Chicago IL Series A (AGM Insured) | | | 5.00 | | | | 1-1-2028 | | | | 9,550,000 | | | | 9,742,910 | |
| | | | |
Chicago IL Series A | | | 5.50 | | | | 1-1-2033 | | | | 12,730,000 | | | | 14,101,912 | |
| | | | |
Cook County IL Series A | | | 5.25 | | | | 11-15-2022 | | | | 3,000,000 | | | | 3,145,200 | |
| | | | |
Cook County IL Series C (AGM Insured) | | | 5.00 | | | | 11-15-2024 | | | | 4,240,000 | | | | 4,694,316 | |
| | | | |
Cook County IL Series C | | | 5.00 | | | | 11-15-2025 | | | | 2,140,000 | | | | 2,340,668 | |
| | | | |
Cook County IL Series C | | | 5.00 | | | | 11-15-2027 | | | | 325,000 | | | | 353,886 | |
| | | | |
Cook County IL Series G | | | 5.00 | | | | 11-15-2028 | | | | 27,000,000 | | | | 28,091,880 | |
| | | | |
Illinois (AGM Insured) | | | 5.00 | | | | 4-1-2026 | | | | 3,000,000 | | | | 3,380,310 | |
| | | | |
Illinois | | | 5.50 | | | | 1-1-2030 | | | | 2,900,000 | | | | 3,471,126 | |
| | | | |
Illinois Series 1 (National Insured) | | | 6.00 | | | | 11-1-2026 | | | | 3,200,000 | | | | 3,753,376 | |
| | | | |
Illinois Series A (AGM Insured) | | | 5.00 | | | | 4-1-2024 | | | | 3,000,000 | | | | 3,320,130 | |
| | | | |
Kane, Cook & DuPage Counties IL Refunding Bond Series D | | | 5.00 | | | | 1-1-2033 | | | | 2,000,000 | | | | 2,222,720 | |
| | | | |
Kane, Cook & DuPage Counties IL Refunding Bond Series D | | | 5.00 | | | | 1-1-2028 | | | | 800,000 | | | | 902,056 | |
| | | | |
Kane, Cook & DuPage Counties IL School District #46 CAB Series B (Ambac Insured) ¤ | | | 0.00 | | | | 1-1-2023 | | | | 8,215,000 | | | | 7,775,087 | |
| | | | |
Kane, Cook & DuPage Counties IL School District #46 CAB Series B (Ambac Insured) ¤ | | | 0.00 | | | | 1-1-2023 | | | | 16,725,000 | | | | 15,615,464 | |
| | | | |
Kane, Cook & DuPage Counties IL School District #46 Elgin Refunding Bond Series D | | | 5.00 | | | | 1-1-2035 | | | | 1,850,000 | | | | 2,045,434 | |
| | | | |
Kendall, Kane & Will Counties IL CAB School District #308 (AGM Insured) ¤ | | | 0.00 | | | | 2-1-2025 | | | | 805,000 | | | | 712,723 | |
| | | | |
Kendall, Kane & Will Counties IL CAB School District #308 (AGM Insured) ¤ | | | 0.00 | | | | 2-1-2026 | | | | 5,050,000 | | | | 4,347,949 | |
| | | | |
Kendall, Kane & Will Counties IL CAB School District #308 (AGM Insured) ¤ | | | 0.00 | | | | 2-1-2027 | | | | 12,050,000 | | | | 10,064,883 | |
| | | | |
Lake County IL School District #24 Millburn CAB (National Insured) ¤ | | | 0.00 | | | | 1-1-2024 | | | | 2,000,000 | | | | 1,775,060 | |
| | | | |
Lake County IL School District #38 Big Hollow CAB (Ambac Insured) ¤ | | | 0.00 | | | | 2-1-2020 | | | | 1,250,000 | | | | 1,232,875 | |
| | | | |
Lake County IL School District #38 Big Hollow CAB (Ambac Insured) ¤ | | | 0.00 | | | | 2-1-2021 | | | | 1,325,000 | | | | 1,273,908 | |
| | | | |
Lake County IL School District #38 Big Hollow CAB (Ambac Insured) ¤ | | | 0.00 | | | | 2-1-2024 | | | | 5,385,000 | | | | 4,729,699 | |
| | | | |
Lake County IL Township High School District #126 Zion-Benton CAB (National Insured) ¤ | | | 0.00 | | | | 2-1-2020 | | | | 910,000 | | | | 900,172 | |
| | | | |
McHenry & Kane Counties IL Community Consolidated School District #158 | | | 5.63 | | | | 1-15-2032 | | | | 2,500,000 | | | | 2,722,850 | |
| | | | |
McHenry & Kane Counties IL Community Consolidated School District #158 CAB (AGM/FGIC Insured) ¤ | | | 0.00 | | | | 1-1-2023 | | | | 805,000 | | | | 747,966 | |
| | | | |
Metropolitan Water Reclamation District of Greater Chicago Refunding Bond Series C | | | 5.25 | | | | 12-1-2032 | | | | 1,500,000 | | | | 1,941,540 | |
| | | | |
Tazewell County IL School District #51 (National Insured) | | | 9.00 | | | | 12-1-2023 | | | | 350,000 | | | | 449,946 | |
| | | | |
Will & Cook Counties IL Lincoln-Way Community High School District #210 CAB Series B ¤ | | | 0.00 | | | | 1-1-2032 | | | | 400,000 | | | | 247,748 | |
22 | Wells Fargo Municipal Bond Fund
Portfolio of investments—June 30, 2019
| | | | | | | | | | | | | | | | |
| | | Interest rate | | | Maturity date | | | Principal | | | Value | |
| | | | |
| GO Revenue (continued) | | | | | | | | | | | | |
| | | | |
Will & Cook Counties IL Lincoln-Way Community High School District #210 Refunding Bond Series A | | | 5.00 | % | | | 1-1-2028 | | | $ | 500,000 | | | $ | 527,715 | |
| | | | |
Will County IL Community Unit School (National Insured) ¤ | | | 0.00 | | | | 11-1-2020 | | | | 2,110,000 | | | | 2,058,326 | |
| | | | |
Will County IL Community Unit School District #201 Crete-Monee Prerefunded Bond CAB (National Insured) ¤ | | | 0.00 | | | | 11-1-2023 | | | | 430,000 | | | | 399,436 | |
| | | | |
Will County IL Community Unit School District #201 Crete-Monee Unrefunded Bond CAB (National Insured) ¤ | | | 0.00 | | | | 11-1-2023 | | | | 1,070,000 | | | | 971,763 | |
| | | | |
Will County IL Lincoln-Way Community High School District #210 CAB Series B ¤ | | | 0.00 | | | | 1-1-2033 | | | | 2,830,000 | | | | 1,668,172 | |
| | | | |
Will County IL Lincoln-Way Community High School District #210 Unrefunded CAB (AGM Insured) ¤ | | | 0.00 | | | | 1-1-2026 | | | | 7,000,000 | | | | 5,848,920 | |
| | | | |
| | | | | | | | | | | | | | | 192,265,399 | |
| | | | | | | | | | | | | | | | |
| | | | |
| Health Revenue: 0.22% | | | | | | | | | | | | |
| | | | |
Illinois Finance Authority Advocate Health Care | | | 4.00 | | | | 6-1-2047 | | | | 3,000,000 | | | | 3,081,390 | |
| | | | |
Illinois Finance Authority Centegra Health System Project | | | 5.00 | | | | 9-1-2020 | | | | 1,465,000 | | | | 1,525,475 | |
| | | | |
Illinois Finance Authority Friendship Village of Schaumberg | | | 5.00 | | | | 2-15-2022 | | | | 1,680,000 | | | | 1,702,109 | |
| | | | |
Illinois Finance Authority Northwestern Memorial Hospital Project Series A | | | 6.00 | | | | 8-15-2039 | | | | 5,000,000 | | | | 5,027,550 | |
| | | | |
| | | | | | | | | | | | | | | 11,336,524 | |
| | | | | | | | | | | | | | | | |
| | | | |
| Miscellaneous Revenue: 0.89% | | | | | | | | | | | | |
| | | | |
Chicago IL Board Education Series C | | | 5.00 | | | | 12-1-2020 | | | | 4,600,000 | | | | 4,766,106 | |
| | | | |
Chicago IL Board of Education Series C | | | 5.00 | | | | 12-1-2021 | | | | 7,240,000 | | | | 7,617,494 | |
| | | | |
Chicago IL Certificate of Participation River Point Plaza Redevelopment Project Series A 144A | | | 4.84 | | | | 4-15-2028 | | | | 5,250,000 | | | | 5,297,355 | |
| | | | |
Illinois | | | 5.00 | | | | 8-1-2024 | | | | 2,000,000 | | | | 2,151,120 | |
| | | | |
Illinois | | | 5.00 | | | | 8-1-2025 | | | | 6,165,000 | | | | 6,619,484 | |
| | | | |
Illinois | | | 5.25 | | | | 7-1-2030 | | | | 2,500,000 | | | | 2,723,825 | |
| | | | |
Illinois | | | 5.50 | | | | 7-1-2025 | | | | 6,000,000 | | | | 6,662,640 | |
| | | | |
Illinois | | | 5.50 | | | | 7-1-2026 | | | | 4,450,000 | | | | 4,939,767 | |
| | | | |
Illinois Series 2013 | | | 5.50 | | | | 7-1-2038 | | | | 4,000,000 | | | | 4,364,200 | |
| | | | |
| | | | | | | | | | | | | | | 45,141,991 | |
| | | | | | | | | | | | | | | | |
| | | | |
| Tax Revenue: 5.52% | | | | | | | | | | | | |
| | | | |
Chicago IL Motor Fuel Refunding Bond | | | 5.00 | | | | 1-1-2026 | | | | 4,000,000 | | | | 4,293,360 | |
| | | | |
Chicago IL Motor Fuel Refunding Bond | | | 5.00 | | | | 1-1-2028 | | | | 1,000,000 | | | | 1,067,760 | |
| | | | |
Chicago IL Motor Fuel Tax Refunding Bonds Series 2013 | | | 5.00 | | | | 1-1-2024 | | | | 680,000 | | | | 738,310 | |
| | | | |
Chicago IL Motor Fuel Tax Refunding Bonds Series 2013 | | | 5.00 | | | | 1-1-2025 | | | | 2,595,000 | | | | 2,799,797 | |
| | | | |
Chicago IL Refunding Bonds Series 2002 | | | 5.00 | | | | 1-1-2028 | | | | 4,430,000 | | | | 5,255,486 | |
| | | | |
Chicago IL Refunding Bonds Series 2002 | | | 5.00 | | | | 1-1-2029 | | | | 1,500,000 | | | | 1,779,510 | |
| | | | |
Chicago IL Series A | | | 5.25 | | | | 1-1-2038 | | | | 6,000,000 | | | | 6,569,580 | |
| | | | |
Chicago IL Transit Authority Sales Tax Receipts Bonds (AGM Insured) | | | 5.00 | | | | 12-1-2044 | | | | 4,000,000 | | | | 4,467,920 | |
| | | | |
Chicago IL Transit Authority Sales Tax Receipts Bonds | | | 5.00 | | | | 12-1-2046 | | | | 18,250,000 | | | | 20,463,360 | |
| | | | |
Cook County IL Sales Tax Revenue Bonds Series 2012 | | | 5.00 | | | | 11-15-2037 | | | | 2,500,000 | | | | 2,683,100 | |
| | | | |
Illinois Regional Transportation Authority (AGM Insured) | | | 5.75 | | | | 6-1-2023 | | | | 400,000 | | | | 450,684 | |
| | | | |
Illinois Regional Transportation Authority Series A | | | 5.00 | | | | 6-1-2044 | | | | 22,840,000 | | | | 25,330,702 | |
| | | | |
Illinois Regional Transportation Authority Series A (National Insured) | | | 6.00 | | | | 7-1-2027 | | | | 10,620,000 | | | | 13,375,465 | |
| | | | |
Illinois Regional Transportation Authority Series A (National Insured) | | | 6.00 | | | | 7-1-2033 | | | | 5,000,000 | | | | 6,860,600 | |
| | | | |
Illinois Regional Transportation Authority Series B (National Insured) | | | 5.50 | | | | 6-1-2027 | | | | 16,455,000 | | | | 19,818,567 | |
| | | | |
Illinois Sales Tax Revenue Build Illinois Bond | | | 5.00 | | | | 6-15-2029 | | | | 3,000,000 | | | | 3,147,390 | |
| | | | |
Illinois Sales Tax Revenue Build Illinois Bonds Junior Obligation Series C | | | 4.00 | | | | 6-15-2029 | | | | 10,580,000 | | | | 11,238,922 | |
| | | | |
Illinois Sales Tax Securitization Series C | | | 5.00 | | | | 1-1-2022 | | | | 2,000,000 | | | | 2,143,420 | |
Wells Fargo Municipal Bond Fund | 23
Portfolio of investments—June 30, 2019
| | | | | | | | | | | | | | | | |
| | | Interest rate | | | Maturity date | | | Principal | | | Value | |
| | | | |
| Tax Revenue (continued) | | | | | | | | | | | | |
| | | | |
Illinois Sales Tax Securitization Series C | | | 5.00 | % | | | 1-1-2023 | | | $ | 2,500,000 | | | $ | 2,742,350 | |
| | | | |
Illinois Sales Tax Securitization Series C | | | 5.00 | | | | 1-1-2024 | | | | 2,500,000 | | | | 2,805,000 | |
| | | | |
Illinois Sales Tax Series C | | | 4.00 | | | | 6-15-2031 | | | | 5,000,000 | | | | 5,225,300 | |
| | | | |
Illinois Sports Facilities Authority State Tax Supported CAB (Ambac Insured) ¤ | | | 0.00 | | | | 6-15-2021 | | | | 7,705,000 | | | | 7,316,745 | |
| | | | |
Illinois Sports Facilities Authority State Tax Supported CAB (Ambac Insured) ¤ | | | 0.00 | | | | 6-15-2022 | | | | 2,295,000 | | | | 2,114,292 | |
| | | | |
Illinois Sports Facilities Authority State Tax Supported CAB (Ambac Insured) ¤ | | | 0.00 | | | | 6-15-2024 | | | | 17,570,000 | | | | 15,158,518 | |
| | | | |
Illinois Sports Facilities Authority State Tax Supported CAB (Ambac Insured) ¤ | | | 0.00 | | | | 6-15-2025 | | | | 2,575,000 | | | | 2,142,529 | |
| | | | |
Illinois Sports Facilities Authority State Tax Supported CAB (Ambac Insured) ¤ | | | 0.00 | | | | 6-15-2026 | | | | 2,030,000 | | | | 1,628,771 | |
| | | | |
Illinois Sports Facilities Authority State Tax Supported Refunding Bond (AGM Insured) | | | 5.00 | | | | 6-15-2025 | | | | 3,745,000 | | | | 4,230,240 | |
| | | | |
Illinois Sports Facilities Authority State Tax Supported Refunding Bond (AGM Insured) | | | 5.00 | | | | 6-15-2026 | | | | 4,775,000 | | | | 5,374,597 | |
| | | | |
Illinois Sports Facilities Authority State Tax Supported Refunding Bond (AGM Insured) | | | 5.00 | | | | 6-15-2027 | | | | 8,845,000 | | | | 9,916,660 | |
| | | | |
Illinois Sports Facilities Authority State Tax Supported Refunding Bond (AGM Insured) | | | 5.00 | | | | 6-15-2028 | | | | 4,030,000 | | | | 4,506,265 | |
| | | | |
Illinois Sports Facilities Authority State Tax Supported Refunding Bond (AGM Insured) | | | 5.25 | | | | 6-15-2032 | | | | 3,500,000 | | | | 3,903,830 | |
| | | | |
Illinois State Sales Tax Revenue Bond Junior Obligation Tax Exempt Series A (Build America Mutual Assurance Company Insured) | | | 4.00 | | | | 6-15-2034 | | | | 2,000,000 | | | | 2,144,800 | |
| | | | |
Illinois State Sales Tax Revenue Bond Junior Obligation Tax Exempt Series A (Build America Mutual Assurance Company Insured) | | | 4.13 | | | | 6-15-2037 | | | | 1,945,000 | | | | 2,083,290 | |
| | | | |
Illinois Tender Option Bond Trust Receipts/Floater Certificates Series 2017-XG0108 (Barclays Bank plc LOC, Barclays Bank plc LIQ) 144Aø | | | 2.08 | | | | 4-1-2046 | | | | 10,000,000 | | | | 10,000,000 | |
| | | | |
Metropolitan Pier & Exposition Authority CAB McCormick Place Expansion Project Series A (National Insured) ¤ | | | 0.00 | | | | 12-15-2026 | | | | 12,245,000 | | | | 10,055,104 | |
| | | | |
Metropolitan Pier & Exposition Authority CAB McCormick Place Expansion Project Series A (National Insured) ¤ | | | 0.00 | | | | 12-15-2030 | | | | 25,700,000 | | | | 18,086,118 | |
| | | | |
Metropolitan Pier & Exposition Authority CAB McCormick Place Expansion Project Series A (National Insured) ¤ | | | 0.00 | | | | 6-15-2031 | | | | 10,035,000 | | | | 6,912,509 | |
| | | | |
Metropolitan Pier & Exposition Authority CAB McCormick Place Expansion Project Series A (National Insured) ¤ | | | 0.00 | | | | 12-15-2031 | | | | 9,800,000 | | | | 6,609,414 | |
| | | | |
Metropolitan Pier & Exposition Authority CAB McCormick Place Expansion Project Series B (National Insured) ¤ | | | 0.00 | | | | 6-15-2029 | | | | 12,085,000 | | | | 9,064,959 | |
| | | | |
Metropolitan Pier & Exposition Authority McCormick Place Expansion Project Series B | | | 5.00 | | | | 12-15-2028 | | | | 5,000,000 | | | | 5,328,600 | |
| | | | |
Southwestern Illinois Development Authority Local Government Program Collinsville Limited | | | 5.00 | | | | 3-1-2025 | | | | 2,400,000 | | | | 1,973,040 | |
| | | | |
Tender Option Bond Trust Receipts/Floater Certificates Series 2019-XF0779 (Build America Mutual Assurance Company Insured, TD Bank NA LIQ) 144Aø | | | 1.98 | | | | 1-1-2048 | | | | 8,000,000 | | | | 8,000,000 | |
| | | | |
| | | | | | | | | | | | | | | 279,806,864 | |
| | | | | | | | | | | | | | | | |
| | | | |
| Tobacco Revenue: 0.07% | | | | | | | | | | | | |
| | | | |
Railsplitter IL Tobacco Settlement Authority | | | 5.00 | | | | 6-1-2024 | | | | 3,000,000 | | | | 3,449,220 | |
| | | | | | | | | | | | | | | | |
| | | | |
| Transportation Revenue: 0.18% | | | | | | | | | | | | |
| | | | |
Chicago IL Public Building Commission Transit Authority (Ambac Insured) | | | 5.25 | | | | 3-1-2025 | | | | 2,960,000 | | | | 3,396,067 | |
| | | | |
Chicago IL Public Building Commission Transit Authority (Ambac Insured) | | | 5.25 | | | | 3-1-2027 | | | | 3,400,000 | | | | 3,990,342 | |
24 | Wells Fargo Municipal Bond Fund
Portfolio of investments—June 30, 2019
| | | | | | | | | | | | | | | | |
| | | Interest rate | | | Maturity date | | | Principal | | | Value | |
| | | | |
| Transportation Revenue (continued) | | | | | | | | | | | | |
| | | | |
Illinois Toll Highway Authority Toll Senior Series B | | | 5.00 | % | | | 1-1-2039 | | | $ | 1,500,000 | | | $ | 1,660,635 | |
| | | | |
| | | | | | | | | | | | | | | 9,047,044 | |
| | | | | | | | | | | | | | | | |
| | | | |
| Utilities Revenue: 0.45% | | | | | | | | | | | | |
| | | | |
Illinois Finance Authority Clean Water Initiative | | | 4.00 | | | | 7-1-2038 | | | | 5,000,000 | | | | 5,569,650 | |
| | | | |
Illinois Municipal Electric Agency Power Supply System Series A | | | 5.00 | | | | 2-1-2030 | | | | 7,000,000 | | | | 8,167,810 | |
| | | | |
Illinois Municipal Electric Agency Power Supply System Series A | | | 5.00 | | | | 2-1-2031 | | | | 8,000,000 | | | | 9,316,800 | |
| | | | |
| | | | | | | | | | | | | | | 23,054,260 | |
| | | | | | | | | | | | | | | | |
| | | | |
| Water & Sewer Revenue: 0.67% | | | | | | | | | | | | |
| | | | |
Chicago IL Second Lien | | | 5.00 | | | | 11-1-2029 | | | | 4,600,000 | | | | 4,992,242 | |
| | | | |
Chicago IL Wastewater Refunding Second Lien Series C | | | 5.00 | | | | 1-1-2039 | | | | 5,000,000 | | | | 5,508,750 | |
| | | | |
Chicago IL Wastewater Transmission Second Lien Series 2012 | | | 5.00 | | | | 1-1-2027 | | | | 5,000,000 | | | | 5,355,550 | |
| | | | |
Chicago IL Wastewater Transmission Second Lien Series 2014 | | | 5.00 | | | | 1-1-2039 | | | | 11,525,000 | | | | 12,447,922 | |
| | | | |
Chicago IL Waterworks Second Lien Series 2012 | | | 5.00 | | | | 11-1-2030 | | | | 5,000,000 | | | | 5,421,750 | |
| | | | |
| | | | | | | | | | | | | | | 33,726,214 | |
| | | | | | | | | | | | | | | | |
| | | | |
| | | | | | | | | | | | | | | 651,735,123 | |
| | | | | | | | | | | | | | | | |
| | | | |
Indiana: 0.89% | | | | | | | | | | | | | | | | |
| | | | |
| Health Revenue: 0.34% | | | | | | | | | | | | |
| | | | |
Indiana Finance Authority Health System Revenue Bonds Franciscan Alliance Incorporated Obligated Group Series C | | | 4.00 | | | | 11-1-2033 | | | | 12,885,000 | | | | 14,144,251 | |
| | | | |
Indiana Health Facility Financing Authority Ascension Health Credit Group | | | 5.00 | | | | 11-15-2034 | | | | 2,750,000 | | | | 3,200,670 | |
| | | | |
| | | | | | | | | | | | | | | 17,344,921 | |
| | | | | | | | | | | | | | | | |
| | | | |
| Industrial Development Revenue: 0.34% | | | | | | | | | | | | |
| | | | |
Indiana Finance Authority Ohio River Bridges East End Crossing Project Series A | | | 5.00 | | | | 7-1-2035 | | | | 9,970,000 | | | | 10,934,298 | |
| | | | |
Indiana Finance Authority Ohio River Bridges East End Crossing Project Series A | | | 5.00 | | | | 7-1-2040 | | | | 2,470,000 | | | | 2,688,916 | |
| | | | |
Valparaiso IN Pratt Paper LLC Project | | | 5.88 | | | | 1-1-2024 | | | | 825,000 | | | | 900,215 | |
| | | | |
Whiting IN | | | 5.00 | | | | 3-1-2046 | | | | 2,500,000 | | | | 2,776,625 | |
| | | | |
| | | | | | | | | | | | | | | 17,300,054 | |
| | | | | | | | | | | | | | | | |
| | | | |
| Miscellaneous Revenue: 0.14% | | | | | | | | | | | | |
| | | | |
Carmel IN Local Public Improvement Multipurpose Bonds | | | 5.00 | | | | 7-15-2031 | | | | 6,000,000 | | | | 7,129,020 | |
| | | | | | | | | | | | | | | | |
| | | | |
| Utilities Revenue: 0.07% | | | | | | | | | | | | |
| | | | |
Tender Option Bond Trust Receipts/Floater CertificatesSeries 2015-XF0115 (JPMorgan Chase & Company LIQ) 144Aø | | | 2.15 | | | | 10-15-2019 | | | | 3,500,000 | | | | 3,500,000 | |
| | | | | | | | | | | | | | | | |
| | | | |
| | | | | | | | | | | | | | | 45,273,995 | |
| | | | | | | | | | | | | | | | |
| | | | |
Iowa: 0.32% | | | | | | | | | | | | | | | | |
| | | | |
| GO Revenue: 0.04% | | | | | | | | | | | | |
| | | | |
Altoona IA Annual Appropriation Urban Renewal Series C | | | 5.00 | | | | 6-1-2031 | | | | 1,805,000 | | | | 2,107,356 | |
| | | | | | | | | | | | | | | | |
| | | | |
| Housing Revenue: 0.20% | | | | | | | | | | | | |
| | | | |
Iowa Finance Authority Single Family Mortgage Revenue Series B (GNMA/FNMA/FHLMC Insured, U.S. Bank NA SPA) ø | | | 1.88 | | | | 7-1-2047 | | | | 10,000,000 | | | | 10,000,000 | |
| | | | | | | | | | | | | | | | |
Wells Fargo Municipal Bond Fund | 25
Portfolio of investments—June 30, 2019
| | | | | | | | | | | | | | | | |
| | | Interest rate | | | Maturity date | | | Principal | | | Value | |
| Industrial Development Revenue: 0.08% | | | | | | | | | | | | |
| | | | |
Iowa Finance Authority Midwestern Disaster Area Project (Korea Development Bank LOC) ø | | | 2.40 | % | | | 4-1-2022 | | | $ | 4,000,000 | | | $ | 4,000,000 | |
| | | | | | | | | | | | | | | | |
| | | | |
| | | | | | | | | | | | | | | 16,107,356 | |
| | | | | | | | | | | | | | | | |
| | | | |
Kansas: 0.79% | | | | | | | | | | | | | | | | |
| | | | |
| Tax Revenue: 0.79% | | | | | | | | | | | | |
| | | | |
Kansas Department of Transportation Series C | | | 4.00 | | | | 9-1-2030 | | | | 6,650,000 | | | | 7,134,519 | |
| | | | |
Kansas Department of Transportation Series C | | | 4.00 | | | | 9-1-2031 | | | | 10,000,000 | | | | 10,713,600 | |
| | | | |
Kansas Department of Transportation Series C | | | 4.00 | | | | 9-1-2032 | | | | 7,500,000 | | | | 8,031,150 | |
| | | | |
Wyandotte County & Kansas City KS Special Obligation Vacation Village Project Area 4 Major Multi-Sport Athletic Complex Project CAB Series 2015 144A¤ | | | 0.00 | | | | 9-1-2034 | | | | 35,400,000 | | | | 14,037,162 | |
| | | | |
| | | | | | | | | | | | | | | 39,916,431 | |
| | | | | | | | | | | | | | | | |
| | | | |
Kentucky: 1.38% | | | | | | | | | | | | | | | | |
| | | | |
| Health Revenue: 0.24% | | | | | | | | | | | | |
| | | | |
Kentucky EDFA Norton Healthcare Incorporated Series B (National Insured) ¤ | | | 0.00 | | | | 10-1-2024 | | | | 9,260,000 | | | | 8,167,505 | |
| | | | |
Kentucky EDFA Norton Healthcare Incorporated Series B (National Insured) ¤ | | | 0.00 | | | | 10-1-2028 | | | | 5,140,000 | | | | 4,013,415 | |
| | | | |
| | | | | | | | | | | | | | | 12,180,920 | |
| | | | | | | | | | | | | | | | |
| | | | |
| Transportation Revenue: 0.13% | | | | | | | | | | | | |
| | | | |
Kentucky Public Transportation Infrastructure Authority Downtown Crossing Project CAB Series B ¤ | | | 0.00 | | | | 7-1-2030 | | | | 2,000,000 | | | | 1,265,360 | |
| | | | |
Kentucky Public Transportation Infrastructure Authority Downtown Crossing Project CAB Series B ¤ | | | 0.00 | | | | 7-1-2031 | | | | 2,780,000 | | | | 1,628,302 | |
| | | | |
Kentucky Public Transportation Infrastructure Authority Downtown Crossing Project CAB Series B ¤ | | | 0.00 | | | | 7-1-2032 | | | | 2,500,000 | | | | 1,359,475 | |
| | | | |
Kentucky Public Transportation Infrastructure Authority Downtown Crossing Project CAB Series C ¤ | | | 0.00 | | | | 7-1-2033 | | | | 1,000,000 | | | | 1,057,310 | |
| | | | |
Kentucky Public Transportation Infrastructure Authority Downtown Crossing Project CAB Series C ¤ | | | 0.00 | | | | 7-1-2034 | | | | 1,505,000 | | | | 1,585,939 | |
| | | | |
| | | | | | | | | | | | | | | 6,896,386 | |
| | | | | | | | | | | | | | | | |
| | | | |
| Utilities Revenue: 1.01% | | | | | | | | | | | | |
| | | | |
Kentucky Public Energy Authority Gas Supply Series A-1 | | | 4.00 | | | | 12-1-2049 | | | | 7,750,000 | | | | 8,546,158 | |
| | | | |
Kentucky Public Energy Authority Gas Supply Series A-2 | | | 4.00 | | | | 4-1-2048 | | | | 8,000,000 | | | | 8,696,240 | |
| | | | |
Kentucky Public Energy Authority Gas Supply Series B | | | 4.00 | | | | 1-1-2049 | | | | 15,750,000 | | | | 17,379,180 | |
| | | | |
Kentucky Public Energy Authority Gas Supply Series C | | | 4.00 | | | | 12-1-2049 | | | | 15,000,000 | | | | 16,527,600 | |
| | | | |
| | | | | | | | | | | | | | | 51,149,178 | |
| | | | | | | | | | | | | | | | |
| | | | |
| | | | | | | | | | | | | | | 70,226,484 | |
| | | | | | | | | | | | | | | | |
| | | | |
Louisiana: 0.53% | | | | | | | | | | | | | | | | |
| | | | |
| Airport Revenue: 0.30% | | | | | | | | | | | | |
| | | | |
New Orleans LA Aviation Board AMT Series B (AGM Insured) | | | 5.00 | | | | 1-1-2033 | | | | 3,000,000 | | | | 3,397,050 | |
| | | | |
New Orleans LA Aviation Board AMT Series B | | | 5.00 | | | | 1-1-2034 | | | | 4,500,000 | | | | 5,071,635 | |
| | | | |
New Orleans LA Aviation Board General Airport North Terminal Project Series 2017B | | | 5.00 | | | | 1-1-2048 | | | | 1,145,000 | | | | 1,300,148 | |
| | | | |
New Orleans LA Aviation Board Gulf Opportunity Zone Consolidated Rental Car Project (AGM Insured) | | | 5.00 | | | | 1-1-2036 | | | | 1,250,000 | | | | 1,481,950 | |
26 | Wells Fargo Municipal Bond Fund
Portfolio of investments—June 30, 2019
| | | | | | | | | | | | | | | | |
| | | Interest rate | | | Maturity date | | | Principal | | | Value | |
| | | | |
| Airport Revenue (continued) | | | | | | | | | | | | |
| | | | |
New Orleans LA Aviation Board Gulf Opportunity Zone Consolidated Rental Car Project (AGM Insured) | | | 5.00 | % | | | 1-1-2037 | | | $ | 1,750,000 | | | $ | 2,065,123 | |
| | | | |
New Orleans LA Aviation Board Gulf Opportunity Zone Consolidated Rental Car Project (AGM Insured) | | | 5.00 | | | | 1-1-2038 | | | | 1,500,000 | | | | 1,766,055 | |
| | | | |
| | | | | | | | | | | | | | | 15,081,961 | |
| | | | | | | | | | | | | | | | |
| | | | |
| GO Revenue: 0.04% | | | | | | | | | | | | |
| | | | |
New Orleans LA (FGIC Insured) | | | 5.50 | | | | 12-1-2021 | | | | 2,050,000 | | | | 2,155,821 | |
| | | | | | | | | | | | | | | | |
| | | | |
| Miscellaneous Revenue: 0.15% | | | | | | | | | | | | |
| | | | |
Louisiana Series D | | | 4.00 | | | | 9-1-2032 | | | | 7,005,000 | | | | 7,762,311 | |
| | | | | | | | | | | | | | | | |
| | | | |
| Water & Sewer Revenue: 0.04% | | | | | | | | | | | | |
| | | | |
Shreveport LA Series B (AGM Insured) | | | 4.00 | | | | 12-1-2036 | | | | 730,000 | | | | 809,811 | |
| | | | |
Shreveport LA Series B (AGM Insured) | | | 4.00 | | | | 12-1-2044 | | | | 1,000,000 | | | | 1,087,040 | |
| | | | |
| | | | | | | | | | | | | | | 1,896,851 | |
| | | | | | | | | | | | | | | | |
| | | | |
| | | | | | | | | | | | | | | 26,896,944 | |
| | | | | | | | | | | | | | | | |
| | | | |
Maine: 0.24% | | | | | | | | | | | | | | | | |
| | | | |
| Resource Recovery Revenue: 0.24% | | | | | | | | | | | | |
| | | | |
Old Town ME Georgia-Pacific Corporation Project 144Aø | | | 2.11 | | | | 12-1-2024 | | | | 11,930,000 | | | | 11,930,000 | |
| | | | | | | | | | | | | | | | |
| | | | |
Maryland: 0.94% | | | | | | | | | | | | | | | | |
| | | | |
| Education Revenue: 0.35% | | | | | | | | | | | | |
| | | | |
Maryland Economic Development Corporation Salisbury University Project | | | 5.00 | | | | 6-1-2027 | | | | 235,000 | | | | 248,891 | |
| | | | |
Maryland Economic Development Corporation Salisbury University Project | | | 5.00 | | | | 6-1-2030 | | | | 200,000 | | | | 210,448 | |
| | | | |
Prince George’s County MD Chesapeake Lighthouse Charter School Project Series 2016-A | | | 5.75 | | | | 8-1-2033 | | | | 1,585,000 | | | | 1,653,821 | |
| | | | |
Prince George’s County MD Chesapeake Lighthouse Charter School Project Series 2016-A 144A | | | 6.90 | | | | 8-1-2041 | | | | 8,480,000 | | | | 9,172,392 | |
| | | | |
Prince George’s County MD Chesapeake Lighthouse Charter School Project Series 2016-A | | | 7.00 | | | | 8-1-2046 | | | | 6,085,000 | | | | 6,618,655 | |
| | | | |
| | | | | | | | | | | | | | | 17,904,207 | |
| | | | | | | | | | | | | | | | |
| | | | |
| Housing Revenue: 0.47% | | | | | | | | | | | | |
| | | | |
Maryland CDA Department of Housing & Community Multifamily Development Bay Country Apartments 144A | | | 2.52 | | | | 2-1-2021 | | | | 9,000,000 | | | | 9,046,710 | |
| | | | |
Maryland CDA Department of Housing & Community Multifamily Development Huntington Apartments Series C 144A | | | 2.34 | | | | 4-1-2021 | | | | 7,000,000 | | | | 7,026,880 | |
| | | | |
Maryland CDA Department of Housing & Community Multifamily Development Park View Woodlawn Series E | | | 2.41 | | | | 5-1-2021 | | | | 7,450,000 | | | | 7,479,875 | |
| | | | |
| | | | | | | | | | | | | | | 23,553,465 | |
| | | | | | | | | | | | | | | | |
| | | | |
| Miscellaneous Revenue: 0.12% | | | | | | | | | | | | |
| | | | |
Howard County MD Certificate of Participation Agricultural Land Preservation #90-23 Series A | | | 8.00 | | | | 8-15-2020 | | | | 290,000 | | | | 308,722 | |
| | | | |
Maryland State and Local Facilities Loan Series A | | | 4.00 | | | | 8-1-2030 | | | | 5,000,000 | | | | 5,762,650 | |
| | | | |
| | | | | | | | | | | | | | | 6,071,372 | |
| | | | | | | | | | | | | | | | |
| | | | |
| | | | | | | | | | | | | | | 47,529,044 | |
| | | | | | | | | | | | | | | | |
Wells Fargo Municipal Bond Fund | 27
Portfolio of investments—June 30, 2019
| | | | | | | | | | | | | | | | |
| | | Interest rate | | | Maturity date | | | Principal | | | Value | |
Massachusetts: 2.01% | | | | | | | | | | | | | | | | |
| | | | |
| Education Revenue: 0.14% | | | | | | | | | | | | |
| | | | |
Massachusetts Development Finance Agency Sabis International Charter Series A | | | 8.00 | % | | | 4-15-2031 | | | $ | 2,150,000 | | | $ | 2,190,743 | |
| | | | |
Massachusetts Development Finance Agency Sabis International Charter Series A | | | 8.00 | | | | 4-15-2039 | | | | 3,900,000 | | | | 3,973,905 | |
| | | | |
Massachusetts Educational Financing Authority AMT Series B | | | 5.38 | | | | 1-1-2020 | | | | 75,000 | | | | 76,097 | |
| | | | |
Massachusetts Educational Financing Authority Series I | | | 6.00 | | | | 1-1-2028 | | | | 685,000 | | | | 696,782 | |
| | | | |
| | | | | | | | | | | | | | | 6,937,527 | |
| | | | | | | | | | | | | | | | |
| | | | |
| GO Revenue: 0.21% | | | | | | | | | | | | |
| | | | |
Massachusetts | | | 5.00 | | | | 3-1-2041 | | | | 7,500,000 | | | | 8,474,475 | |
| | | | |
Massachusetts Series E | | | 5.25 | | | | 9-1-2048 | | | | 1,765,000 | | | | 2,171,074 | |
| | | | |
| | | | | | | | | | | | | | | 10,645,549 | |
| | | | | | | | | | | | | | | | |
| | | | |
| Health Revenue: 0.05% | | | | | | | | | | | | |
| | | | |
Massachusetts Development Finance Agency Atrius Health Series A | | | 4.00 | | | | 6-1-2049 | | | | 2,500,000 | | | | 2,634,450 | |
| | | | | | | | | | | | | | | | |
| | | | |
| Miscellaneous Revenue: 0.23% | | | | | | | | | | | | |
| | | | |
Massachusetts Series A | | | 5.00 | | | | 12-1-2036 | | | | 10,850,000 | | | | 11,687,620 | |
| | | | | | | | | | | | | | | | |
| | | | |
| Tax Revenue: 1.23% | | | | | | | | | | | | |
| | | | |
Massachusetts Series D | | | 4.00 | | | | 5-1-2036 | | | | 15,000,000 | | | | 16,834,950 | |
| | | | |
Massachusetts Series F | | | 5.00 | | | | 11-1-2041 | | | | 5,000,000 | | | | 5,973,300 | |
| | | | |
Massachusetts Transportation Fund | | | 5.00 | | | | 6-1-2048 | | | | 33,010,000 | | | | 39,570,738 | |
| | | | |
| | | | | | | | | | | | | | | 62,378,988 | |
| | | | | | | | | | | | | | | | |
| | | | |
| Transportation Revenue: 0.15% | | | | | | | | | | | | |
| | | | |
Massachusetts Transportation Fund Revenue Rail Enhancement & Accelerated Bridge Programs Series A | | | 5.00 | | | | 6-1-2047 | | | | 6,485,000 | | | | 7,652,819 | |
| | | | | | | | | | | | | | | | |
| | | | |
| | | | | | | | | | | | | | | 101,936,953 | |
| | | | | | | | | | | | | | | | |
| | | | |
Michigan: 4.88% | | | | | | | | | | | | | | | | |
| | | | |
| Education Revenue: 0.39% | | | | | | | | | | | | |
| | | | |
Michigan Finance Authority Limited Obligation Public School Holly Academy | | | 6.50 | | | | 10-1-2020 | | | | 70,000 | | | | 71,768 | |
| | | | |
Michigan Finance Authority Limited Obligation Public School Holly Academy | | | 8.00 | | | | 10-1-2040 | | | | 1,350,000 | | | | 1,441,760 | |
| | | | |
Michigan Public Educational Facilities Authority Limited Obligation Bradford Academy Project 144A | | | 6.50 | | | | 9-1-2037 | | | | 3,565,000 | | | | 2,710,790 | |
| | | | |
Michigan Public Educational Facilities Authority Limited Obligation Bradford Academy Project | | | 8.50 | | | | 9-1-2029 | | | | 1,500,000 | | | | 1,281,480 | |
| | | | |
Michigan Public Educational Facilities Authority Limited Obligation Bradford Academy Project | | | 8.75 | | | | 9-1-2039 | | | | 3,500,000 | | | | 2,758,945 | |
| | | | |
Michigan Public Educational Facilities Authority Limited Obligation Crescent Academy Project | | | 7.00 | | | | 10-1-2036 | | | | 1,082,500 | | | | 1,083,453 | |
| | | | |
Michigan Public Educational Facilities Authority Limited Obligation Madison Academy Project | | | 8.38 | | | | 12-1-2030 | | | | 2,085,000 | | | | 2,173,967 | |
| | | | |
Michigan Public Educational Facilities Authority Limited Obligation Madison Academy Project | | | 8.63 | | | | 12-1-2039 | | | | 4,170,000 | | | | 4,341,179 | |
| | | | |
Oakland County MI Economic Development Corporation The Academy of The Sacred Heart Project Series A | | | 6.50 | | | | 12-15-2036 | | | | 4,350,000 | | | | 3,697,500 | |
| | | | |
| | | | | | | | | | | | | | | 19,560,842 | |
| | | | | | | | | | | | | | | | |
28 | Wells Fargo Municipal Bond Fund
Portfolio of investments—June 30, 2019
| | | | | | | | | | | | | | | | |
| | | Interest rate | | | Maturity date | | | Principal | | | Value | |
| GO Revenue: 0.32% | | | | | | | | | | | | |
| | | | |
Livonia MI Public Schools School District Building & Site Series I | | | 5.00 | % | | | 5-1-2026 | | | $ | 1,075,000 | | | $ | 1,191,337 | |
| | | | |
Livonia MI Public Schools School District Building & Site Series I | | | 5.00 | | | | 5-1-2028 | | | | 1,450,000 | | | | 1,600,293 | |
| | | | |
Livonia MI Public Schools School District Building & Site Series I | | | 5.00 | | | | 5-1-2029 | | | | 1,350,000 | | | | 1,489,145 | |
| | | | |
Livonia MI Public Schools School District Building & Site Series I | | | 5.00 | | | | 5-1-2030 | | | | 1,775,000 | | | | 1,951,861 | |
| | | | |
Livonia MI Public Schools School District Building & Site Series I | | | 5.00 | | | | 5-1-2031 | | | | 1,425,000 | | | | 1,562,370 | |
| | | | |
Wayne County MI Building Improvement Series A | | | 6.75 | | | | 11-1-2039 | | | | 8,345,000 | | | | 8,408,505 | |
| | | | |
| | | | | | | | | | | | | | | 16,203,511 | |
| | | | | | | | | | | | | | | | |
| | | | |
| Health Revenue: 0.53% | | | | | | | | | | | | |
| | | | |
Michigan Finance Authority Trinity Health Credit Group Series A | | | 5.00 | | | | 12-1-2047 | | | | 24,620,000 | | | | 26,756,524 | |
| | | | | | | | | | | | | | | | |
| | | | |
| Housing Revenue: 0.19% | | | | | | | | | | | | |
| | | | |
Michigan Housing Development Authority Multifamily Housing Revenue Bonds Renaissance Estates of Ecorse Phase II Project | | | 1.78 | | | | 11-1-2020 | | | | 9,800,000 | | | | 9,801,568 | |
| | | | | | | | | | | | | | | | |
| | | | |
| Miscellaneous Revenue: 0.61% | | | | | | | | | | | | |
| | | | |
Michigan Building Authority Refunding Facilities Program Series I | | | 5.00 | | | | 4-15-2041 | | | | 13,000,000 | | | | 15,156,310 | |
| | | | |
Michigan Finance Authority Charter Company Wayne Criminal Justice Center Project | | | 4.00 | | | | 11-1-2048 | | | | 6,000,000 | | | | 6,517,260 | |
| | | | |
Michigan Finance Authority Limited Obligation Public School Madison Academy Project Series A | | | 7.50 | | | | 12-1-2020 | | | | 140,000 | | | | 143,373 | |
| | | | |
Michigan Finance Authority Limited Obligation Public School Madison Academy Project Series A | | | 8.00 | | | | 12-1-2030 | | | | 1,135,000 | | | | 1,177,710 | |
| | | | |
Michigan Finance Authority Limited Obligation Public School Madison Academy Project Series A | | | 8.25 | | | | 12-1-2039 | | | | 2,220,000 | | | | 2,299,964 | |
| | | | |
Michigan Municipal Bond Authority Local Government Loan Program CAB Series G (Ambac Insured) ¤ | | | 0.00 | | | | 5-1-2020 | | | | 205,000 | | | | 201,210 | |
| | | | |
Michigan Municipal Bond Authority Local Government Loan Program Series A (Ambac Insured) | | | 4.00 | | | | 11-1-2021 | | | | 80,000 | | | | 80,133 | |
| | | | |
Michigan Municipal Bond Authority Local Government Loan Program Series B Group A (Ambac Insured) | | | 5.25 | | | | 12-1-2023 | | | | 920,000 | | | | 921,435 | |
| | | | |
Michigan Municipal Bond Authority Local Government Loan Program Series C (Ambac Insured) | | | 4.75 | | | | 5-1-2027 | | | | 4,610,000 | | | | 4,612,075 | |
| | | | |
| | | | | | | | | | | | | | | 31,109,470 | |
| | | | | | | | | | | | | | | | |
| | | | |
| Tax Revenue: 1.26% | | | | | | | | | | | | |
| | | | |
Detroit MI Downtown Development Authority CAB ¤ | | | 0.00 | | | | 7-1-2019 | | | | 3,050,000 | | | | 3,050,000 | |
| | | | |
Detroit MI Downtown Development Authority CAB ¤ | | | 0.00 | | | | 7-1-2020 | | | | 2,070,000 | | | | 1,989,456 | |
| | | | |
Detroit MI Downtown Development Authority Tax Increment Revenue Refunding Catalyst Development Project Series A (AGM Insured) | | | 5.00 | | | | 7-1-2021 | | | | 400,000 | | | | 425,604 | |
| | | | |
Michigan Finance Authority Local Government Loan Program City of Detroit Financial Recovery Refunding Bond Series F | | | 4.50 | | | | 10-1-2029 | | | | 7,000,000 | | | | 7,560,420 | |
| | | | |
Michigan Finance Authority Local Government Loan Program Public Lighting Authority Refunding Bond Series B | | | 5.00 | | | | 7-1-2044 | | | | 16,845,000 | | | | 18,242,630 | |
| | | | |
Michigan Finance Authority Local Government Loan Program Series H-1 | | | 5.00 | | | | 10-1-2031 | | | | 1,340,000 | | | | 1,525,778 | |
| | | | |
Michigan Finance Authority Local Government Loan Program Series H-1 | | | 5.00 | | | | 10-1-2032 | | | | 2,000,000 | | | | 2,275,560 | |
| | | | |
Michigan Finance Authority Local Government Loan Program Series H-1 | | | 5.00 | | | | 10-1-2033 | | | | 2,975,000 | | | | 3,382,694 | |
| | | | |
Michigan Finance Authority Local Government Loan Program Series H-1 | | | 5.00 | | | | 10-1-2034 | | | | 6,615,000 | | | | 7,513,912 | |
| | | | |
Michigan Finance Authority Local Government Loan Program Series H-1 | | | 5.00 | | | | 10-1-2039 | | | | 7,955,000 | | | | 9,038,312 | |
Wells Fargo Municipal Bond Fund | 29
Portfolio of investments—June 30, 2019
| | | | | | | | | | | | | | | | |
| | | Interest rate | | | Maturity date | | | Principal | | | Value | |
| | | | |
| Tax Revenue (continued) | | | | | | | | | | | | |
| | | | |
Michigan Finance Authority Refunding Bond Local Government Loan Program Public Lighting Authority Series B | | | 5.00 | % | | | 7-1-2039 | | | $ | 7,895,000 | | | $ | 8,585,813 | |
| | | | |
| | | | | | | | | | | | | | | 63,590,179 | |
| | | | | | | | | | | | | | | | |
| | | | |
| Utilities Revenue: 0.09% | | | | | | | | | | | | |
| | | | |
Michigan Strategic Fund Limited Obligation Detroit Edison Company Exempt Facilities Project | | | 1.45 | | | | 8-1-2029 | | | | 3,500,000 | | | | 3,486,070 | |
| | | | |
Michigan Strategic Fund Limited Obligation Detroit Edison Company Exempt Facilities Project Series KT | | | 5.63 | | | | 7-1-2020 | | | | 1,200,000 | | | | 1,246,740 | |
| | | | |
| | | | | | | | | | | | | | | 4,732,810 | |
| | | | | | | | | | | | | | | | |
| | | | |
| Water & Sewer Revenue: 1.49% | | | | | | | | | | | | |
| | | | |
Detroit MI Water Supply System Second Lien Series B (AGM Insured) | | | 7.00 | | | | 7-1-2036 | | | | 9,675,000 | | | | 9,675,000 | |
| | | | |
Great Lakes Michigan Water Authority Sewage Disposal SystemSeries 2016-C | | | 5.00 | | | | 7-1-2036 | | | | 8,500,000 | | | | 9,881,335 | |
| | | | |
Great Lakes Michigan Water Authority Water Supply System Series 2016-D | | | 4.00 | | | | 7-1-2032 | | | | 11,000,000 | | | | 11,910,360 | |
| | | | |
Great Lakes Michigan Water Authority Water Supply System Series 2016-D (AGM Insured) | | | 4.00 | | | | 7-1-2033 | | | | 11,000,000 | | | | 11,909,920 | |
| | | | |
Michigan Finance Authority Local Government Loan Program Detroit Refunding Bond Series D-4 | | | 5.00 | | | | 7-1-2031 | | | | 6,500,000 | | | | 7,424,235 | |
| | | | |
Michigan Finance Authority Local Government Loan Program Detroit Refunding Bond Series D-6 (National Insured) | | | 5.00 | | | | 7-1-2036 | | | | 3,250,000 | | | | 3,667,268 | |
| | | | |
Michigan Finance Authority Local Government Loan Program Series C (National Insured) | | | 5.00 | | | | 7-1-2025 | | | | 2,000,000 | | | | 2,320,680 | |
| | | | |
Michigan Finance Authority Local Government Loan Program Series C (National Insured) | | | 5.00 | | | | 7-1-2026 | | | | 1,945,000 | | | | 2,232,724 | |
| | | | |
Michigan Finance Authority Local Government Loan Program Series C (National Insured) | | | 5.00 | | | | 7-1-2027 | | | | 2,260,000 | | | | 2,610,752 | |
| | | | |
Michigan Finance Authority Local Government Loan Program Series C (National Insured) | | | 5.00 | | | | 7-1-2028 | | | | 3,480,000 | | | | 4,011,083 | |
| | | | |
Michigan Finance Authority Local Government Loan Program Series C (National Insured) | | | 5.00 | | | | 7-1-2032 | | | | 5,750,000 | | | | 6,538,843 | |
| | | | |
Michigan Finance Authority Local Government Loan Program Series C | | | 5.00 | | | | 7-1-2035 | | | | 2,000,000 | | | | 2,296,640 | |
| | | | |
Michigan Finance Authority Refunding Bond Local Government Loan Program Detroit Series D-6 (National Insured) | | | 5.00 | | | | 7-1-2027 | | | | 1,000,000 | | | | 1,155,720 | |
| | | | |
| | | | | | | | | | | | | | | 75,634,560 | |
| | | | | | | | | | | | | | | | |
| | | | |
| | | | | | | | | | | | | | | 247,389,464 | |
| | | | | | | | | | | | | | | | |
| | | | |
Minnesota: 0.20% | | | | | | | | | | | | | | | | |
| | | | |
| Health Revenue: 0.11% | | | | | | | | | | | | |
| | | | |
Minneapolis MN Fairview Health Services Series 2018A | | | 4.00 | | | | 11-15-2048 | | | | 2,315,000 | | | | 2,477,907 | |
| | | | |
Shakopee MN Senior Housing Revenue 144A | | | 5.85 | | | | 11-1-2058 | | | | 3,000,000 | | | | 3,149,010 | |
| | | | |
| | | | | | | | | | | | | | | 5,626,917 | |
| | | | | | | | | | | | | | | | |
| | | | |
| Utilities Revenue: 0.09% | | | | | | | | | | | | |
| | | | |
Rochester MN Electric Utility Revenue Refunding Series A | | | 5.00 | | | | 12-1-2042 | | | | 3,895,000 | | | | 4,568,952 | |
| | | | | | | | | | | | | | | | |
| | | | |
| | | | | | | | | | | | | | | 10,195,869 | |
| | | | | | | | | | | | | | | | |
| | | | |
Mississippi: 0.38% | | | | | | | | | | | | | | | | |
| | | | |
| Industrial Development Revenue: 0.21% | | | | | | | | | | | | |
| | | | |
Perry County MS PCR Leaf River Forest Products Incorporated Project (Georgia-Pacific LLC LOC) 144Aø | | | 2.16 | | | | 2-1-2022 | | | | 10,575,000 | | | | 10,575,000 | |
| | | | | | | | | | | | | | | | |
30 | Wells Fargo Municipal Bond Fund
Portfolio of investments—June 30, 2019
| | | | | | | | | | | | | | | | |
| | | Interest rate | | | Maturity date | | | Principal | | | Value | |
| Miscellaneous Revenue: 0.17% | | | | | | | | | | | | |
| | | | |
Mississippi Development Bank Special Obligation Jackson Water & Sewer System Project Series A (AGM Insured) | | | 5.00 | % | | | 9-1-2030 | | | $ | 8,155,000 | | | $ | 8,882,263 | |
| | | | | | | | | | | | | | | | |
| | | | |
| | | | | | | | | | | | | | | 19,457,263 | |
| | | | | | | | | | | | | | | | |
| | | | |
Missouri: 0.46% | | | | | | | | | | | | | | | | |
| | | | |
| Airport Revenue: 0.04% | | | | | | | | | | | | |
| | | | |
St. Louis MO Lambert St. Louis International Airport Series A-1 | | | 6.25 | | | | 7-1-2029 | | | | 2,000,000 | | | | 2,000,000 | |
| | | | | | | | | | | | | | | | |
| | | | |
| GO Revenue: 0.10% | | | | | | | | | | | | |
| | | | |
St. Louis MO Special Administrative Board of The St. Louis School District | | | 4.00 | | | | 4-1-2030 | | | | 4,840,000 | | | | 5,415,282 | |
| | | | | | | | | | | | | | | | |
| | | | |
| Miscellaneous Revenue: 0.20% | | | | | | | | | | | | |
| | | | |
Kansas City MO IDA Kansas City International Airport Project | | | 5.00 | | | | 3-1-2039 | | | | 3,000,000 | | | | 3,590,370 | |
| | | | |
Missouri Development Finance Board Kauffman Center For The Performing Arts Series A (PNC Bank NA SPA) ø | | | 1.94 | | | | 6-1-2037 | | | | 4,000,000 | | | | 4,000,000 | |
| | | | |
St. Louis MO IDA Convention Center Hotel (Ambac Insured) ¤ | | | 0.00 | | | | 7-15-2019 | | | | 2,475,000 | | | | 2,473,020 | |
| | | | |
| | | | | | | | | | | | | | | 10,063,390 | |
| | | | | | | | | | | | | | | | |
| | | | |
| Tax Revenue: 0.12% | | | | | | | | | | | | |
| | | | |
Blue Springs MO Special Obligation Tax Refunding & Improvement Bonds Adams Farm Project Series A | | | 4.00 | | | | 6-1-2026 | | | | 5,870,000 | | | | 5,945,664 | |
| | | | |
Manchester MO Highway 141 Manchester Road Project | | | 6.00 | | | | 11-1-2025 | | | | 75,000 | | | | 75,074 | |
| | | | |
| | | | | | | | | | | | | | | 6,020,738 | |
| | | | | | | | | | | | | | | | |
| | | | |
| | | | | | | | | | | | | | | 23,499,410 | |
| | | | | | | | | | | | | | | | |
| | | | |
Nebraska: 0.24% | | | | | | | | | | | | | | | | |
| | | | |
| Utilities Revenue: 0.24% | | | | | | | | | | | | |
| | | | |
Central Plains Energy Project Nebraska Refunding Project #3 Series 2012 | | | 5.00 | | | | 9-1-2042 | | | | 1,265,000 | | | | 1,371,437 | |
| | | | |
Central Plains Energy Project Nebraska Refunding Project #3 Series 2012 | | | 5.25 | | | | 9-1-2037 | | | | 1,800,000 | | | | 1,965,114 | |
| | | | |
Central Plains Energy Project Nebraska Refunding Project #3 Series A | | | 5.00 | | | | 9-1-2033 | | | | 6,000,000 | | | | 7,571,640 | |
| | | | |
Central Plains NE Energy Gas Project #3 | | | 5.00 | | | | 9-1-2027 | | | | 1,020,000 | | | | 1,105,823 | |
| | | | |
| | | | | | | | | | | | | | | 12,014,014 | |
| | | | | | | | | | | | | | | | |
| | | | |
| Nevada: 1.43% | | | | | | | | | | | | |
| | | | |
| GO Revenue: 1.41% | | | | | | | | | | | | |
| | | | |
Clark County NV Refunding Limited Tax | | | 4.00 | | | | 7-1-2032 | | | | 6,000,000 | | | | 6,757,920 | |
| | | | |
Clark County NV Series A | | | 5.00 | | | | 6-1-2043 | | | | 4,360,000 | | | | 5,214,604 | |
| | | | |
Clark County NV Series A | | | 5.00 | | | | 5-1-2048 | | | | 50,115,000 | | | | 59,641,360 | |
| | | | |
| | | | | | | | | | | | | | | 71,613,884 | |
| | | | | | | | | | | | | | | | |
| | | | |
| Miscellaneous Revenue: 0.02% | | | | | | | | | | | | |
| | | | |
Las Vegas NV Special Improvement District #60 Local Improvement | | | 5.00 | | | | 6-1-2022 | | | | 405,000 | | | | 430,697 | |
| | | | |
Las Vegas NV Special Improvement District #60 Local Improvement | | | 5.00 | | | | 6-1-2023 | | | | 325,000 | | | | 350,737 | |
| | | | |
Las Vegas NV Special Improvement District #60 Local Improvement | | | 5.00 | | | | 6-1-2024 | | | | 195,000 | | | | 212,589 | |
| | | | |
| | | | | | | | | | | | | | | 994,023 | |
| | | | | | | | | | | | | | | | |
| | | | |
| | | | | | | | | | | | | | | 72,607,907 | |
| | | | | | | | | | | | | | | | |
Wells Fargo Municipal Bond Fund | 31
Portfolio of investments—June 30, 2019
| | | | | | | | | | | | | | | | |
| | | Interest rate | | | Maturity date | | | Principal | | | Value | |
New Jersey: 2.90% | | | | | | | | | | | | | | | | |
| | | | |
| Airport Revenue: 0.03% | | | | | | | | | | | | |
| | | | |
South Jersey Port Corporation Marine Terminal Refunding Bond Series 2016S | | | 5.00 | % | | | 1-1-2039 | | | $ | 1,350,000 | | | $ | 1,504,980 | |
| | | | | | | | | | | | | | | | |
| | | | |
| Education Revenue: 0.21% | | | | | | | | | | | | |
| | | | |
New Jersey Educational Facilities Authority Higher Education Facilities Trust Fund | | | 5.00 | | | | 6-15-2025 | | | | 5,830,000 | | | | 6,579,505 | |
| | | | |
Rutgers NJ State University Series L | | | 5.00 | | | | 5-1-2033 | | | | 3,560,000 | | | | 3,973,814 | |
| | | | |
| | | | | | | | | | | | | | | 10,553,319 | |
| | | | | | | | | | | | | | | | |
| | | | |
| GO Revenue: 0.40% | | | | | | | | | | | | |
| | | | |
Bayonne NJ School Refunding Bonds (AGM Insured) | | | 5.00 | | | | 7-15-2023 | | | | 2,505,000 | | | | 2,835,710 | |
| | | | |
Newark NJ Qualified General Improvement Series A | | | 5.00 | | | | 7-15-2025 | | | | 5,000,000 | | | | 5,500,100 | |
| | | | |
Newark NJ Qualified General Improvement Series A | | | 5.00 | | | | 7-15-2026 | | | | 2,205,000 | | | | 2,424,243 | |
| | | | |
Newark NJ Qualified General Improvement Series A | | | 5.00 | | | | 7-15-2027 | | | | 6,035,000 | | | | 6,621,481 | |
| | | | |
Newark NJ Qualified General Improvement Series A | | | 5.25 | | | | 7-15-2024 | | | | 1,325,000 | | | | 1,455,817 | |
| | | | |
Newark NJ Qualified General Improvement Series B | | | 5.00 | | | | 7-15-2025 | | | | 385,000 | | | | 423,508 | |
| | | | |
Newark NJ Qualified General Improvement Series B | | | 5.00 | | | | 7-15-2026 | | | | 395,000 | | | | 433,592 | |
| | | | |
Newark NJ Qualified General Improvement Series B | | | 5.00 | | | | 7-15-2027 | | | | 405,000 | | | | 443,430 | |
| | | | |
Newark NJ Qualified General Improvement Series B | | | 5.25 | | | | 7-15-2024 | | | | 375,000 | | | | 412,943 | |
| | | | |
| | | | | | | | | | | | | | | 20,550,824 | |
| | | | | | | | | | | | | | | | |
| | | | |
| Health Revenue: 0.02% | | | | | | | | | | | | |
| | | | |
Tender Option Bond Trust Receipts/Floater CertificatesSeries 2016-XG0047 (AGC Insured, Deutsche Bank LIQ) 144Aø | | | 2.00 | | | | 7-1-2038 | | | | 1,024,575 | | | | 1,024,575 | |
| | | | | | | | | | | | | | | | |
| | | | |
| Housing Revenue: 0.18% | | | | | | | | | | | | |
| | | | |
New Jersey Housing & Mortgage Finance Agency Villa Victoria Apartments Project Series F | | | 2.43 | | | | 11-1-2021 | | | | 9,000,000 | | | | 9,089,280 | |
| | | | | | | | | | | | | | | | |
| | | | |
| Miscellaneous Revenue: 1.02% | | | | | | | | | | | | |
| | | | |
New Jersey EDA Motor Vehicle Surcharge Revenue Refunding Bond Series A | | | 3.13 | | | | 7-1-2029 | | | | 5,905,000 | | | | 5,952,535 | |
| | | | |
New Jersey EDA School Facilities Construction Refunding Bond Project Series II | | | 5.00 | | | | 3-1-2026 | | | | 4,225,000 | | | | 4,538,326 | |
| | | | |
New Jersey EDA School Facilities Construction Refunding Bond Series NN | | | 5.00 | | | | 3-1-2026 | | | | 15,000,000 | | | | 16,403,250 | |
| | | | |
New Jersey TTFA Series A (National Insured) | | | 5.75 | | | | 6-15-2023 | | | | 2,000,000 | | | | 2,293,820 | |
| | | | |
New Jersey TTFA Series A (National Insured) | | | 5.75 | | | | 6-15-2025 | | | | 10,000,000 | | | | 12,005,900 | |
| | | | |
Newark NJ Housing Authority Port Authority Port Newark Marine Terminal Rental Refunding Bond Newark Redevelopment Project (National Insured) | | | 5.25 | | | | 1-1-2024 | | | | 1,000,000 | | | | 1,131,260 | |
| | | | |
Newark NJ Housing Authority Port Newark Marine Terminal Rental (National Insured) | | | 5.00 | | | | 1-1-2032 | | | | 7,620,000 | | | | 9,404,452 | |
| | | | |
| | | | | | | | | | | | | | | 51,729,543 | |
| | | | | | | | | | | | | | | | |
| | | | |
| Transportation Revenue: 1.04% | | | | | | | | | | | | |
| | | | |
New Jersey TTFA CAB Series A ¤ | | | 0.00 | | | | 12-15-2028 | | | | 10,100,000 | | | | 7,565,607 | |
| | | | |
New Jersey TTFA CAB Series A ¤ | | | 0.00 | | | | 12-15-2029 | | | | 11,875,000 | | | | 8,552,613 | |
| | | | |
New Jersey TTFA CAB Series A ¤ | | | 0.00 | | | | 12-15-2031 | | | | 4,500,000 | | | | 2,986,965 | |
| | | | |
New Jersey TTFA CAB Series A ¤ | | | 0.00 | | | | 12-15-2026 | | | | 1,150,000 | | | | 932,604 | |
| | | | |
New Jersey TTFA Series A | | | 5.00 | | | | 6-15-2042 | | | | 5,540,000 | | | | 5,870,184 | |
| | | | |
New Jersey TTFA Series AA | | | 5.00 | | | | 6-15-2044 | | | | 1,000,000 | | | | 1,084,680 | |
| | | | |
New Jersey TTFA Series AA | | | 5.25 | | | | 6-15-2033 | | | | 10,000,000 | | | | 10,956,500 | |
32 | Wells Fargo Municipal Bond Fund
Portfolio of investments—June 30, 2019
| | | | | | | | | | | | | | | | |
| | | Interest rate | | | Maturity date | | | Principal | | | Value | |
| | | | |
| Transportation Revenue (continued) | | | | | | | | | | | | |
| | | | |
New Jersey TTFA Series B | | | 5.25 | % | | | 6-15-2036 | | | $ | 5,575,000 | | | $ | 5,867,966 | |
| | | | |
New Jersey TTFA Series C | | | 5.25 | | | | 6-15-2032 | | | | 8,000,000 | | | | 9,009,520 | |
| | | | |
| | | | | | | | | | | | | | | 52,826,639 | |
| | | | | | | | | | | | | | | | |
| | | | |
| | | | | | | | | | | | | | | 147,279,160 | |
| | | | | | | | | | | | | | | | |
| | | | |
New Mexico: 0.01% | | | | | | | | | | | | | | | | |
| | | | |
| Housing Revenue: 0.01% | | | | | | | | | | | | |
| | | | |
New Mexico Mortgage Finance Authority SFMR Class I (GNMA/FNMA/FHLMC Insured) | | | 5.35 | | | | 3-1-2030 | | | | 420,000 | | | | 431,323 | |
| | | | | | | | | | | | | | | | |
| | | | |
New York: 8.19% | | | | | | | | | | | | | | | | |
| | | | |
| Airport Revenue: 0.40% | | | | | | | | | | | | |
| | | | |
Port Authority of New York & New Jersey Series 205 | | | 5.25 | | | | 11-15-2039 | | | | 16,580,000 | | | | 20,499,346 | |
| | | | | | | | | | | | | | | | |
| | | | |
| Education Revenue: 0.36% | | | | | | | | | | | | |
| | | | |
Hempstead Town NY Local Development Corporation The Academy Charter School Project Series A | | | 7.65 | | | | 2-1-2044 | | | | 3,480,000 | | | | 3,606,498 | |
| | | | |
Hempstead Town NY Local Development Corporation The Academy Charter School Project Series A | | | 8.25 | | | | 2-1-2041 | | | | 9,375,000 | | | | 9,829,031 | |
| | | | |
Westchester County NY Local Development Pace University Series B | | | 2.27 | | | | 5-1-2044 | | | | 5,000,000 | | | | 5,000,000 | |
| | | | |
| | | | | | | | | | | | | | | 18,435,529 | |
| | | | | | | | | | | | | | | | |
| | | | |
| GO Revenue: 0.07% | | | | | | | | | | | | |
| | | | |
New York NY Series F-1 | | | 5.00 | | | | 3-1-2032 | | | | 3,000,000 | | | | 3,349,200 | |
| | | | | | | | | | | | | | | | |
| | | | |
| Health Revenue: 0.15% | | | | | | | | | | | | |
| | | | |
Nassau County NY Local Economic Catholic Health Services | | | 5.00 | | | | 7-1-2021 | | | | 7,000,000 | | | | 7,456,610 | |
| | | | | | | | | | | | | | | | |
| | | | |
| Industrial Development Revenue: 0.11% | | | | | | | | | | | | |
| | | | |
New York Transportation Development Corporation Special Facilities Revenue AMT | | | 5.00 | | | | 1-1-2036 | | | | 5,000,000 | | | | 5,873,600 | |
| | | | | | | | | | | | | | | | |
| | | | |
| Miscellaneous Revenue: 0.93% | | | | | | | | | | | | |
| | | | |
New York Environmental Facilities Corporation Municipal Water Trust | | | 5.00 | | | | 6-15-2048 | | | | 10,035,000 | | | | 12,090,168 | |
| | | | |
New York Tender Option Bond Trust Receipts/Floater Certificates Series 2019-BAML3002 (Bank of America NA LIQ) 144Aø | | | 1.98 | | | | 1-15-2056 | | | | 35,000,000 | | | | 35,000,000 | |
| | | | |
| | | | | | | | | | | | | | | 47,090,168 | |
| | | | | | | | | | | | | | | | |
| | | | |
| Tax Revenue: 1.99% | | | | | | | | | | | | |
| | | | |
New York Dormitory Authority Personal Income Tax Series B | | | 5.00 | | | | 3-15-2042 | | | | 1,500,000 | | | | 1,626,675 | |
| | | | |
New York Dormitory Authority Series A | | | 5.00 | | | | 2-15-2034 | | | | 3,790,000 | | | | 4,549,743 | |
| | | | |
New York Dormitory Authority Series B Group C | | | 5.00 | | | | 2-15-2044 | | | | 14,860,000 | | | | 17,033,424 | |
| | | | |
New York Dormitory Authority Series B Group C | | | 5.00 | | | | 2-15-2045 | | | | 7,330,000 | | | | 8,402,013 | |
| | | | |
New York Dormitory Authority Series E | | | 5.00 | | | | 2-15-2044 | | | | 9,600,000 | | | | 11,004,096 | |
| | | | |
New York NY Transitional Finance Authority Building Aid Revenue Fiscal 2019 Subordinate Bond Series S 3 A | | | 4.00 | | | | 7-15-2038 | | | | 4,500,000 | | | | 5,006,745 | |
| | | | |
New York NY Transitional Finance Authority Building Aid Revenue Fiscal Year 2015 Series S1 | | | 5.00 | | | | 7-15-2040 | | | | 3,155,000 | | | | 3,616,671 | |
| | | | |
New York NY Transitional Finance Authority Future Tax Secured Revenue Series A2 | | | 5.00 | | | | 8-1-2037 | | | | 12,140,000 | | | | 14,544,691 | |
| | | | |
New York NY Transitional Future Tax Secured Subordinate Bond Series F 1 | | | 5.00 | | | | 5-1-2042 | | | | 2,390,000 | | | | 2,824,191 | |
| | | | |
New York NY Transitional Finance Authority Future Tax Secured Revenue Series I | | | 5.00 | | | | 5-1-2033 | | | | 5,395,000 | | | | 6,048,550 | |
Wells Fargo Municipal Bond Fund | 33
Portfolio of investments—June 30, 2019
| | | | | | | | | | | | | | | | |
| | | Interest rate | | | Maturity date | | | Principal | | | Value | |
| | | | |
| Tax Revenue (continued) | | | | | | | | | | | | |
| | | | |
New York NY Transitional Finance Authority Future Tax Secured Subordinate Bond Series A | | | 5.00 | % | | | 8-1-2031 | | | $ | 17,075,000 | | | $ | 19,878,374 | |
| | | | |
New York NY Transitional Finance Authority Subordinate Series 2-E (Dexia Credit Local SPA) ø | | | 2.02 | | | | 11-1-2022 | | | | 6,390,000 | | | | 6,390,000 | |
| | | | |
| | | | | | | | | | | | | | | 100,925,173 | |
| | | | | | | | | | | | | | | | |
| | | | |
| Tobacco Revenue: 0.01% | | | | | | | | | | | | |
| | | | |
Suffolk NY Tobacco Securitization Corporation Series B | | | 4.50 | | | | 6-1-2026 | | | | 520,000 | | | | 543,374 | |
| | | | | | | | | | | | | | | | |
| | | | |
| Transportation Revenue: 1.12% | | | | | | | | | | | | |
| | | | |
New York Metropolitan Transportation Authority | | | 5.00 | | | | 11-15-2048 | | | | 7,300,000 | | | | 8,533,846 | |
| | | | |
New York Metropolitan Transportation Authority Series A | | | 5.00 | | | | 11-15-2030 | | | | 11,000,000 | | | | 12,143,780 | |
| | | | |
New York Metropolitan Transportation Authority Subordinate Bond Series D (1 Month LIBOR +0.65%)± | | | 2.29 | | | | 11-1-2035 | | | | 28,000,000 | | | | 28,019,320 | |
| | | | |
Niagara Falls NY Bridge Commission (National Insured) | | | 6.25 | | | | 10-1-2021 | | | | 7,230,000 | | | | 7,984,451 | |
| | | | |
| | | | | | | | | | | | | | | 56,681,397 | |
| | | | | | | | | | | | | | | | |
| | | | |
| Utilities Revenue: 0.69% | | | | | | | | | | | | |
| | | | |
New York Utility Debt Securitization Authority Restructuring Bonds | | | 5.00 | | | | 12-15-2037 | | | | 3,655,000 | | | | 4,317,359 | |
| | | | |
New York Utility Debt Securitization Authority Restructuring Bonds | | | 5.00 | | | | 12-15-2032 | | | | 22,785,000 | | | | 27,419,241 | |
| | | | |
New York Utility Debt Securitization Authority Restructuring Bonds | | | 5.00 | | | | 12-15-2040 | | | | 2,870,000 | | | | 3,494,541 | |
| | | | |
| | | | | | | | | | | | | | | 35,231,141 | |
| | | | | | | | | | | | | | | | |
| | | | |
| Water & Sewer Revenue: 2.36% | | | | | | | | | | | | |
| | | | |
New York NY Municipal Water Finance Authority 2nd General Resolution Series AA | | | 5.00 | | | | 6-15-2035 | | | | 25,000,000 | | | | 31,395,750 | |
| | | | |
New York NY Municipal Water Finance Authority 2nd General Resolution Series AA | | | 5.00 | | | | 6-15-2044 | | | | 17,400,000 | | | | 18,703,782 | |
| | | | |
New York NY Municipal Water Finance Authority 2nd General Resolution Series AA | | | 5.25 | | | | 6-15-2049 | | | | 5,000,000 | | | | 6,124,550 | |
| | | | |
New York NY Municipal Water Finance Authority 2nd General Resolution Series BB | | | 5.00 | | | | 6-15-2044 | | | | 30,265,000 | | | | 32,631,118 | |
| | | | |
New York NY Municipal Water Finance Authority 2nd General Resolution Series BB | | | 5.00 | | | | 6-15-2047 | | | | 2,330,000 | | | | 2,570,246 | |
| | | | |
New York NY Municipal Water Finance Authority 2nd General Resolution Series BB | | | 5.25 | | | | 6-15-2044 | | | | 9,800,000 | | | | 10,776,472 | |
| | | | |
New York NY Municipal Water Finance Authority Water & Sewer System Series DD | | | 5.00 | | | | 6-15-2026 | | | | 3,255,000 | | | | 3,488,058 | |
| | | | |
New York NY Water Finance Authority Series DD | | | 5.25 | | | | 6-15-2047 | | | | 11,490,000 | | | | 13,877,622 | |
| | | | |
| | | | | | | | | | | | | | | 119,567,598 | |
| | | | | | | | | | | | | | | | |
| | | | |
| | | | | | | | | | | | | | | 415,653,136 | |
| | | | | | | | | | | | | | | | |
| | | | |
North Carolina: 1.31% | | | | | | | | | | | | | | | | |
| | | | |
| Airport Revenue: 0.07% | | | | | | | | | | | | |
| | | | |
Charlotte NC Airport Series A | | | 5.50 | | | | 7-1-2034 | | | | 2,500,000 | | | | 2,599,625 | |
| | | | |
North Carolina Port Authority Series B | | | 5.00 | | | | 2-1-2025 | | | | 1,000,000 | | | | 1,020,940 | |
| | | | |
| | | | | | | | | | | | | | | 3,620,565 | |
| | | | | | | | | | | | | | | | |
| | | | |
| Education Revenue: 0.13% | | | | | | | | | | | | |
| | | | |
North Carolina Capital Facilities Finance Agency Forest University series 2016 | | | 5.00 | | | | 1-1-2033 | | | | 1,000,000 | | | | 1,204,800 | |
| | | | |
North Carolina Capital Facilities Finance Agency Meredith College Series 2018 | | | 5.00 | | | | 6-1-2038 | | | | 500,000 | | | | 568,040 | |
34 | Wells Fargo Municipal Bond Fund
Portfolio of investments—June 30, 2019
| | | | | | | | | | | | | | | | |
| | | Interest rate | | | Maturity date | | | Principal | | | Value | |
| | | | |
| Education Revenue (continued) | | | | | | | | | | | | |
| | | | |
University of North Carolina at Ashville Series 2017 | | | 5.00 | % | | | 6-1-2042 | | | $ | 625,000 | | | $ | 718,975 | |
| | | | |
University of North Carolina at Greensboro Series 2014 | | | 5.00 | | | | 4-1-2033 | | | | 2,000,000 | | | | 2,285,520 | |
| | | | |
University of North Carolina at Greensboro Series 2014 | | | 5.00 | | | | 4-1-2039 | | | | 1,620,000 | | | | 1,838,376 | |
| | | | |
| | | | | | | | | | | | | | | 6,615,711 | |
| | | | | | | | | | | | | | | | |
| | | | |
| Health Revenue: 0.86% | | | | | | | | | | | | |
| | | | |
Charlotte Mecklenburg Hospital Authority Health Care Refunding Bonds Series 2018 | | | 5.00 | | | | 1-15-2036 | | | | 500,000 | | | | 607,445 | |
| | | | |
Charlotte Mecklenburg NC Hospital Authority Atrium Health Series B | | | 5.00 | | | | 1-15-2048 | | | | 10,000,000 | | | | 10,895,800 | |
| | | | |
Charlotte Mecklenburg NC Hospital Authority Atrium Health Series C | | | 5.00 | | | | 1-15-2048 | | | | 20,000,000 | | | | 22,396,800 | |
| | | | |
New Hanover County NC New Hanover Regional Medical Center | | | 5.00 | | | | 10-1-2047 | | | | 1,000,000 | | | | 1,156,530 | |
| | | | |
New Hanover County NC New Hanover Regional Medical Center Series 2011 | | | 5.00 | | | | 10-1-2028 | | | | 2,000,000 | | | | 2,143,560 | |
| | | | |
North Carolina Medical Care Commission Baptist Hospital Project Series 2017 | | | 5.25 | | | | 6-1-2029 | | | | 2,000,000 | | | | 2,068,540 | |
| | | | |
North Carolina Medical Care Commission Deerfield Episcopal Retirement Community Project Series 2016 | | | 5.00 | | | | 11-1-2031 | | | | 1,500,000 | | | | 1,765,950 | |
| | | | |
North Carolina Medical Care Commission Presbyterian Homes Project Series 2016C | | | 4.00 | | | | 10-1-2031 | | | | 1,500,000 | | | | 1,646,580 | |
| | | | |
North Carolina Medical Care Commission Southeastern Regional Medical Center Series 2012 | | | 5.00 | | | | 6-1-2026 | | | | 385,000 | | | | 420,894 | |
| | | | |
North Carolina Medical Care Commission Southeastern Regional Medical Center Series 2012 | | | 5.00 | | | | 6-1-2032 | | | | 500,000 | | | | 542,895 | |
| | | | |
| | | | | | | | | | | | | | | 43,644,994 | |
| | | | | | | | | | | | | | | | |
| | | | |
| Housing Revenue: 0.06% | | | | | | | | | | | | |
| | | | |
North Carolina Facilities Finance Agency The Arc of North Carolina Project Series 2017A (HUD Insured) | | | 5.00 | | | | 10-1-2034 | | | | 1,000,000 | | | | 1,154,610 | |
| | | | |
North Carolina Facilities Finance Agency The NCA&T University Foundation LLC Project Series 2015A (AGC Insured) | | | 5.00 | | | | 6-1-2027 | | | | 1,000,000 | | | | 1,162,250 | |
| | | | |
North Carolina HFA Series 2 | | | 4.25 | | | | 1-1-2028 | | | | 555,000 | | | | 566,483 | |
| | | | |
| | | | | | | | | | | | | | | 2,883,343 | |
| | | | | | | | | | | | | | | | |
| | | | |
| Miscellaneous Revenue: 0.12% | | | | | | | | | | | | |
| | | | |
Cabarrus County NC Limited Obligation Installment Financing Contract Series 2017 | | | 5.00 | | | | 6-1-2031 | | | | 500,000 | | | | 613,400 | |
| | | | |
Charlotte NC Certificate of Participation Equipment Acquisition and Public Facilities Series A | | | 5.00 | | | | 12-1-2026 | | | | 1,160,000 | | | | 1,257,022 | |
| | | | |
Charlotte NC Certificate of Participation Transit Projects Series C | | | 5.00 | | | | 6-1-2030 | | | | 1,000,000 | | | | 1,125,040 | |
| | | | |
Henderson County NC Limited Obligation Series A | | | 5.00 | | | | 10-1-2030 | | | | 500,000 | | | | 602,050 | |
| | | | |
Orange County NC Limited Obligation Series 2018 | | | 5.00 | | | | 10-1-2032 | | | | 215,000 | | | | 270,143 | |
| | | | |
Orange County NC Limited Obligation Series 2018 | | | 5.00 | | | | 10-1-2033 | | | | 220,000 | | | | 275,711 | |
| | | | |
Orange County NC Limited Obligation Series 2018 | | | 5.00 | | | | 10-1-2034 | | | | 65,000 | | | | 81,138 | |
| | | | |
Raleigh NC Limited Obligation Series A | | | 5.00 | | | | 10-1-2033 | | | | 1,000,000 | | | | 1,160,700 | |
| | | | |
Wilmington NC Limited Obligation Series A | | | 5.00 | | | | 6-1-2030 | | | | 400,000 | | | | 484,420 | |
| | | | |
| | | | | | | | | | | | | | | 5,869,624 | |
| | | | | | | | | | | | | | | | |
| | | | |
| Transportation Revenue: 0.04% | | | | | | | | | | | | |
| | | | |
North Carolina Department of Transportation I-77 Hot lanes Project Series 2015 | | | 5.00 | | | | 6-30-2028 | | | | 1,275,000 | | | | 1,450,402 | |
| | | | |
North Carolina Turnpike Authority Monroe Expressway toll Revenue Bond Series 2016A | | | 5.00 | | | | 7-1-2042 | | | | 500,000 | | | | 565,035 | |
| | | | |
| | | | | | | | | | | | | | | 2,015,437 | |
| | | | | | | | | | | | | | | | |
Wells Fargo Municipal Bond Fund | 35
Portfolio of investments—June 30, 2019
| | | | | | | | | | | | | | | | |
| | | Interest rate | | | Maturity date | | | Principal | | | Value | |
| Utilities Revenue: 0.03% | | | | | | | | | | | | |
| | | | |
North Carolina Municipal Power Agency #1 Catawba Nuclear Power Project Series A | | | 5.00 | % | | | 1-1-2021 | | | $ | 1,500,000 | | | $ | 1,526,895 | |
| | | | | | | | | | | | | | | | |
| | | | |
| | | | | | | | | | | | | | | 66,176,569 | |
| | | | | | | | | | | | | | | | |
| | | | |
North Dakota: 0.29% | | | | | | | | | | | | | | | | |
| | | | |
| Miscellaneous Revenue: 0.20% | | | | | | | | | | | | |
| | | | |
University of North Dakota Infrastructure Energy Improvement Project Green Certificates Series A | | | 5.00 | | | | 4-1-2057 | | | | 9,000,000 | | | | 10,288,710 | |
| | | | | | | | | | | | | | | | |
| | | | |
| Water & Sewer Revenue: 0.09% | | | | | | | | | | | | |
| | | | |
North Dakota PFA Revolving Fund Program Series A | | | 5.00 | | | | 10-1-2038 | | | | 3,780,000 | | | | 4,646,527 | |
| | | | | | | | | | | | | | | | |
| | | | |
| | | | | | | | | | | | | | | 14,935,237 | |
| | | | | | | | | | | | | | | | |
| | | | |
Ohio: 2.52% | | | | | | | | | | | | | | | | |
| | | | |
| Airport Revenue: 0.16% | | | | | | | | | | | | |
| | | | |
Cleveland OH Airport System Revenue Series A | | | 5.00 | | | | 1-1-2025 | | | | 4,015,000 | | | | 4,359,045 | |
| | | | |
Cleveland OH Airport System Revenue Series A (AGM Insured) | | | 5.00 | | | | 1-1-2031 | | | | 3,600,000 | | | | 3,879,036 | |
| | | | |
| | | | | | | | | | | | | | | 8,238,081 | |
| | | | | | | | | | | | | | | | |
| | | | |
| Education Revenue: 0.08% | | | | | | | | | | | | |
| | | | |
Ohio State University Series E ø | | | 1.85 | | | | 6-1-2035 | | | | 3,735,000 | | | | 3,735,000 | |
| | | | | | | | | | | | | | | | |
| | | | |
| GO Revenue: 0.24% | | | | | | | | | | | | |
| | | | |
Highland OH Local School District Medina County School Improvement Series A | | | 5.25 | | | | 12-1-2048 | | | | 9,435,000 | | | | 10,608,337 | |
| | | | |
Highland OH Local School District Medina County School Improvement Series A | | | 5.25 | | | | 12-1-2054 | | | | 1,500,000 | | | | 1,676,325 | |
| | | | |
| | | | | | | | | | | | | | | 12,284,662 | |
| | | | | | | | | | | | | | | | |
| | | | |
| Health Revenue: 0.66% | | | | | | | | | | | | |
| | | | |
Allen County OH Catholic Healthcare Series B | | | 5.25 | | | | 9-1-2027 | | | | 3,825,000 | | | | 3,993,874 | |
| | | | |
Allen County OH Hospital Facilities Revenue Bonds Series B | | | 5.00 | | | | 8-1-2047 | | | | 5,000,000 | | | | 5,479,800 | |
| | | | |
Cleveland Cuyahoga County OH Facilities Improvement Centers for Dialysis | | | 5.00 | | | | 12-1-2047 | | | | 5,205,000 | | | | 5,589,389 | |
| | | | |
Lucas County OH Hospital Revenue Promedica Healthcare Obligation | | | 5.25 | | | | 11-15-2048 | | | | 15,000,000 | | | | 17,621,400 | |
| | | | |
Montgomery County OH Hospital Kettering Medical Center (National Insured) | | | 6.25 | | | | 4-1-2020 | | | | 685,000 | | | | 708,180 | |
| | | | |
| | | | | | | | | | | | | | | 33,392,643 | |
| | | | | | | | | | | | | | | | |
| | | | |
| Miscellaneous Revenue: 0.63% | | | | | | | | | | | | |
| | | | |
Ohio Private Activity Bond AMT Portsmouth Bypass Project (AGM Insured) | | | 5.00 | | | | 12-31-2026 | | | | 2,030,000 | | | | 2,359,469 | |
| | | | |
Ohio Private Activity Bond AMT Portsmouth Bypass Project (AGM Insured) | | | 5.00 | | | | 12-31-2028 | | | | 1,600,000 | | | | 1,847,056 | |
| | | | |
Ohio Private Activity Bond AMT Portsmouth Bypass Project (AGM Insured) | | | 5.00 | | | | 12-31-2030 | | | | 2,250,000 | | | | 2,580,885 | |
| | | | |
Ohio Private Activity Bond AMT Portsmouth Bypass Project (AGM Insured) | | | 5.00 | | | | 12-31-2035 | | | | 12,000,000 | | | | 13,612,920 | |
| | | | |
Ohio Private Activity Bond AMT Portsmouth Bypass Project (AGM Insured) | | | 5.00 | | | | 12-31-2039 | | | | 2,500,000 | | | | 2,808,525 | |
| | | | |
Ohio Series A | | | 5.00 | | | | 2-1-2036 | | | | 4,265,000 | | | | 5,047,286 | |
| | | | |
RiverSouth OH Lazarus Building Redevelopment Series A | | | 5.75 | | | | 12-1-2027 | | | | 3,415,000 | | | | 3,422,957 | |
| | | | |
| | | | | | | | | | | | | | | 31,679,098 | |
| | | | | | | | | | | | | | | | |
36 | Wells Fargo Municipal Bond Fund
Portfolio of investments—June 30, 2019
| | | | | | | | | | | | | | | | |
| | | Interest rate | | | Maturity date | | | Principal | | | Value | |
| Resource Recovery Revenue: 0.00% | | | | | | | | | | | | |
| | | | |
Ohio Air Quality Development Authority Ohio Valley Electric Corporation Series E | | | 5.63 | % | | | 10-1-2019 | | | $ | 100,000 | | | $ | 100,558 | |
| | | | | | | | | | | | | | | | |
| | | | |
| Tax Revenue: 0.12% | | | | | | | | | | | | |
| | | | |
Franklin County OH | | | 5.00 | | | | 6-1-2048 | | | | 5,000,000 | | | | 6,020,350 | |
| | | | | | | | | | | | | | | | |
| | | | |
| Transportation Revenue: 0.18% | | | | | | | | | | | | |
| | | | |
Ohio Turnpike Commission CAB Series A-4 ¤ | | | 0.00 | | | | 2-15-2034 | | | | 8,500,000 | | | | 9,303,845 | |
| | | | | | | | | | | | | | | | |
| | | | |
| Utilities Revenue: 0.23% | | | | | | | | | | | | |
| | | | |
Lancaster OH Port Authority Gas Supply | | | 5.00 | | | | 8-1-2049 | | | | 10,000,000 | | | | 11,636,500 | |
| | | | | | | | | | | | | | | | |
| | | | |
| Water & Sewer Revenue: 0.22% | | | | | | | | | | | | |
| | | | |
Ohio Water Development Authority Drinking Water Assistance Fund | | | 5.00 | | | | 12-1-2035 | | | | 5,390,000 | | | | 6,477,163 | |
| | | | |
Ohio Water Development Authority Drinking Water Assistance Fund | | | 5.00 | | | | 12-1-2036 | | | | 2,000,000 | | | | 2,396,520 | |
| | | | |
Ohio Water Development Authority Fresh Water Series B | | | 5.00 | | | | 12-1-2034 | | | | 1,895,000 | | | | 2,283,759 | |
| | | | |
| | | | | | | | | | | | | | | 11,157,442 | |
| | | | | | | | | | | | | | | | |
| | | | |
| | | | | | | | | | | | | | | 127,548,179 | |
| | | | | | | | | | | | | | | | |
| | | | |
Oklahoma: 0.83% | | | | | | | | | | | | | | | | |
| | | | |
| Airport Revenue: 0.69% | | | | | | | | | | | | |
| | | | |
Oklahoma City OK Airport Trust Series 33 | | | 5.00 | | | | 7-1-2043 | | | | 9,000,000 | | | | 10,541,250 | |
| | | | |
Oklahoma City OK Airport Trust Series 33 | | | 5.00 | | | | 7-1-2047 | | | | 11,500,000 | | | | 13,419,350 | |
| | | | |
Tulsa OK Airports Improvement Trust AMT Series A (Build America Mutual Assurance Company Insured) | | | 5.00 | | | | 6-1-2035 | | | | 1,055,000 | | | | 1,169,953 | |
| | | | |
Tulsa OK Airports Improvement Trust Series A (AGM Insured) | | | 5.00 | | | | 6-1-2043 | | | | 4,485,000 | | | | 5,204,843 | |
| | | | |
Tulsa OK Airports Improvement Trust Series A (AGM Insured) | | | 5.25 | | | | 6-1-2048 | | | | 3,770,000 | | | | 4,455,348 | |
| | | | |
| | | | | | | | | | | | | | | 34,790,744 | |
| | | | | | | | | | | | | | | | |
| | | | |
| Miscellaneous Revenue: 0.07% | | | | | | | | | | | | |
| | | | |
Garfield County OK Educational Facilities Authority Enid Public Schools Project Series A | | | 5.00 | | | | 9-1-2030 | | | | 2,000,000 | | | | 2,379,840 | |
| | | | |
Garfield County OK Educational Facilities Authority Enid Public Schools Project Series A | | | 5.00 | | | | 9-1-2031 | | | | 1,145,000 | | | | 1,356,035 | |
| | | | |
| | | | | | | | | | | | | | | 3,735,875 | |
| | | | | | | | | | | | | | | | |
| | | | |
| Transportation Revenue: 0.02% | | | | | | | | | | | | |
| | | | |
Oklahoma Turnpike Authority Revenue Series A | | | 5.00 | | | | 1-1-2042 | | | | 1,000,000 | | | | 1,160,760 | |
| | | | | | | | | | | | | | | | |
| | | | |
| Water & Sewer Revenue: 0.05% | | | | | | | | | | | | |
| | | | |
McGee Creek Authority Oklahoma Water Revenue (National Insured) | | | 6.00 | | | | 1-1-2023 | | | | 2,360,000 | | | | 2,550,523 | |
| | | | | | | | | | | | | | | | |
| | | | |
| | | | | | | | | | | | | | | 42,237,902 | |
| | | | | | | | | | | | | | | | |
| | | | |
Oregon: 0.18% | | | | | | | | | | | | | | | | |
| | | | |
| GO Revenue: 0.18% | | | | | | | | | | | | |
| | | | |
Jackson County OR School District #005 (AGM Insured) | | | 5.00 | | | | 6-15-2030 | | | | 2,560,000 | | | | 3,303,450 | |
| | | | |
Jackson County OR School District #005 (AGM Insured) | | | 5.00 | | | | 6-15-2031 | | | | 2,125,000 | | | | 2,723,591 | |
| | | | |
Jackson County OR School District #005 (AGM Insured) | | | 5.00 | | | | 6-15-2032 | | | | 2,350,000 | | | | 2,992,537 | |
| | | | |
| | | | | | | | | | | | | | | 9,019,578 | |
| | | | | | | | | | | | | | | | |
Wells Fargo Municipal Bond Fund | 37
Portfolio of investments—June 30, 2019
| | | | | | | | | | | | | | | | |
| | | Interest rate | | | Maturity date | | | Principal | | | Value | |
Pennsylvania: 5.03% | | | | | | | | | | | | | | | | |
| | | | |
| Airport Revenue: 0.29% | | | | | | | | | | | | |
| | | | |
Philadelphia PA Airport Series A | | | 5.00 | % | | | 7-1-2047 | | | $ | 7,300,000 | | | $ | 8,403,541 | |
| | | | |
Philadelphia PA Airport Series B | | | 5.00 | | | | 7-1-2042 | | | | 5,500,000 | | | | 6,361,410 | |
| | | | |
| | | | | | | | | | | | | | | 14,764,951 | |
| | | | | | | | | | | | | | | | |
| | | | |
| Education Revenue: 0.15% | | | | | | | | | | | | |
| | | | |
East Hempfield Township PA IDA Student Services Incorporated Student Housing Project of Millersville University | | | 5.00 | | | | 7-1-2029 | | | | 500,000 | | | | 546,330 | |
| | | | |
Montgomery County PA Higher Education & Health Authority Arcadia University | | | 5.00 | | | | 4-1-2024 | | | | 1,540,000 | | | | 1,726,124 | |
| | | | |
Montgomery County PA Higher Education & Health Authority Arcadia University | | | 5.00 | | | | 4-1-2025 | | | | 1,625,000 | | | | 1,851,233 | |
| | | | |
Pennsylvania HEFAR Indiana University Student Housing Project Series A | | | 5.00 | | | | 7-1-2032 | | | | 1,000,000 | | | | 1,104,690 | |
| | | | |
Philadelphia PA IDA 1st Philadelphia Preparatory Charter School Project Series A | | | 7.00 | | | | 6-15-2033 | | | | 2,000,000 | | | | 2,318,700 | |
| | | | |
Philadelphia PA IDA New Foundations Charter School Project | | | 6.00 | | | | 12-15-2027 | | | | 280,000 | | | | 320,174 | |
| | | | |
| | | | | | | | | | | | | | | 7,867,251 | |
| | | | | | | | | | | | | | | | |
| | | | |
| GO Revenue: 0.51% | | | | | | | | | | | | |
| | | | |
Allegheny County PA West Mifflin Area School District (AGM Insured) | | | 5.00 | | | | 4-1-2025 | | | | 1,180,000 | | | | 1,361,413 | |
| | | | |
Allegheny County PA West Mifflin Area School District (AGM Insured) | | | 5.00 | | | | 4-1-2026 | | | | 1,200,000 | | | | 1,411,692 | |
| | | | |
Allegheny County PA West Mifflin Area School District (AGM Insured) | | | 5.00 | | | | 4-1-2027 | | | | 1,000,000 | | | | 1,181,540 | |
| | | | |
Chester County PA | | | 4.00 | | | | 11-15-2032 | | | | 3,000,000 | | | | 3,440,430 | |
| | | | |
Luzerne County PA Series E (AGM Insured) | | | 8.00 | | | | 11-1-2027 | | | | 135,000 | | | | 135,651 | |
| | | | |
Philadelphia PA School District Series A | | | 5.00 | | | | 9-1-2024 | | | | 2,075,000 | | | | 2,400,692 | |
| | | | |
Philadelphia PA School District Series D | | | 5.00 | | | | 9-1-2021 | | | | 5,000,000 | | | | 5,353,700 | |
| | | | |
Philadelphia PA School District Series F | | | 5.00 | | | | 9-1-2035 | | | | 3,820,000 | | | | 4,420,351 | |
| | | | |
Williamsport PA Area School District (AGM Insured) | | | 4.00 | | | | 3-1-2032 | | | | 1,440,000 | | | | 1,575,547 | |
| | | | |
Williamsport PA Area School District (AGM Insured) | | | 4.00 | | | | 3-1-2033 | | | | 1,490,000 | | | | 1,625,441 | |
| | | | |
Williamsport PA Area School District (AGM Insured) | | | 4.00 | | | | 3-1-2034 | | | | 1,555,000 | | | | 1,692,446 | |
| | | | |
Williamsport PA Area School District (AGM Insured) | | | 4.00 | | | | 3-1-2035 | | | | 1,205,000 | | | | 1,309,100 | |
| | | | |
| | | | | | | | | | | | | | | 25,908,003 | |
| | | | | | | | | | | | | | | | |
| | | | |
| Health Revenue: 0.95% | | | | | | | | | | | | |
| | | | |
Allegheny County PA Hospital Development Authority University of Pittsburgh Medical Center Series A | | | 5.00 | | | | 7-15-2025 | | | | 5,900,000 | | | | 7,051,208 | |
| | | | |
Allegheny County PA Hospital Development Authority University of Pittsburgh Medical Center Series A | | | 5.63 | | | | 8-15-2039 | | | | 5,130,000 | | | | 5,156,266 | |
| | | | |
Berks County PA Municipal Authority Reading Hospital & Medical Center Project Series B (SIFMA Municipal Swap +1.50%)± | | | 3.40 | | | | 11-1-2039 | | | | 20,000,000 | | | | 20,204,400 | |
| | | | |
Montgomery County PA HEFA Thomas Jefferson University | | | 4.00 | | | | 9-1-2035 | | | | 2,750,000 | | | | 3,018,923 | |
| | | | |
Montgomery County PA HEFA Thomas Jefferson University | | | 4.00 | | | | 9-1-2038 | | | | 1,000,000 | | | | 1,080,750 | |
| | | | |
Montgomery County PA HEFA Thomas Jefferson University | | | 5.00 | | | | 9-1-2031 | | | | 4,100,000 | | | | 5,071,167 | |
| | | | |
Pennsylvania Tender Option Bond Trust Receipts/Floater Certificates Berks County IDA Health Series 2018-XM0594 (Barclays Bank plc LIQ) 144Aø | | | 2.02 | | | | 11-1-2050 | | | | 4,625,000 | | | | 4,625,000 | |
| | | | |
Quakertown PA General Authority Health LifeQuest Obligated Group Series C | | | 4.50 | | | | 7-1-2027 | | | | 750,000 | | | | 751,253 | |
| | | | |
Quakertown PA General Authority Health LifeQuest Obligated Group Series C | | | 5.00 | | | | 7-1-2032 | | | | 1,000,000 | | | | 1,006,070 | |
| | | | |
| | | | | | | | | | | | | | | 47,965,037 | |
| | | | | | | | | | | | | | | | |
38 | Wells Fargo Municipal Bond Fund
Portfolio of investments—June 30, 2019
| | | | | | | | | | | | | | | | |
| | | Interest rate | | | Maturity date | | | Principal | | | Value | |
| Industrial Development Revenue: 0.61% | | | | | | | | | | | | |
| | | | |
Montgomery County PA IDA Exelon Generation Company LLC Project Series A | | | 2.55 | % | | | 12-1-2029 | | | $ | 11,530,000 | | | $ | 11,579,694 | |
| | | | |
Pennsylvania Bridges Finco LP EDFA | | | 5.00 | | | | 12-31-2030 | | | | 600,000 | | | | 690,102 | |
| | | | |
Pennsylvania Bridges Finco LP EDFA | | | 5.00 | | | | 12-31-2034 | | | | 14,275,000 | | | | 16,236,242 | |
| | | | |
Pennsylvania Bridges Finco LP EDFA | | | 5.00 | | | | 12-31-2038 | | | | 2,100,000 | | | | 2,378,859 | |
| | | | |
| | | | | | | | | | | | | | | 30,884,897 | |
| | | | | | | | | | | | | | | | |
| | | | |
| Miscellaneous Revenue: 1.30% | | | | | | | | | | | | |
| | | | |
Delaware Valley PA Regional Finance Authority Local Government Public Improvements Project | | | 5.75 | | | | 7-1-2032 | | | | 5,000,000 | | | | 6,837,700 | |
| | | | |
Delaware Valley PA Regional Finance Authority Local Government Series A (Ambac Insured) | | | 5.50 | | | | 8-1-2028 | | | | 16,420,000 | | | | 20,950,771 | |
| | | | |
Delaware Valley PA Regional Finance Authority Local Government Series C (Ambac Insured) | | | 7.75 | | | | 7-1-2027 | | | | 4,025,000 | | | | 5,704,391 | |
| | | | |
Pennsylvania Finance Authority Pennsylvania Hills Project Series B (National Insured) ¤ | | | 0.00 | | | | 12-1-2025 | | | | 1,110,000 | | | | 956,676 | |
| | | | |
Pennsylvania Public School Building Authority Philadelphia School District Project | | | 5.00 | | | | 4-1-2024 | | | | 3,960,000 | | | | 4,305,035 | |
| | | | |
State Public School Building Authority Pennsylvania Philadelphia School District Project | | | 5.00 | | | | 4-1-2022 | | | | 2,635,000 | | | | 2,870,016 | |
| | | | |
State Public School Building Authority Pennsylvania Philadelphia School District Project Series A | | | 5.00 | | | | 6-1-2034 | | | | 1,915,000 | | | | 2,218,355 | |
| | | | |
State Public School Building Authority Pennsylvania Philadelphia School District Project Series A | | | 5.00 | | | | 6-1-2024 | | | | 2,250,000 | | | | 2,593,778 | |
| | | | |
State Public School Building Authority Pennsylvania Philadelphia School District Project Series A | | | 5.00 | | | | 6-1-2035 | | | | 16,715,000 | | | | 19,304,655 | |
| | | | |
| | | | | | | | | | | | | | | 65,741,377 | |
| | | | | | | | | | | | | | | | |
| | | | |
| Resource Recovery Revenue: 0.26% | | | | | | | | | | | | |
| | | | |
Delaware County PA IDA Resource Recovery Facility Series A | | | 6.20 | | | | 7-1-2019 | | | | 80,000 | | | | 80,000 | |
| | | | |
Pennsylvania EDFA Solid Waste Disposal Waste Management Incorporated Project | | | 1.95 | | | | 8-1-2045 | | | | 13,000,000 | | | | 13,004,290 | |
| | | | |
| | | | | | | | | | | | | | | 13,084,290 | |
| | | | | | | | | | | | | | | | |
| | | | |
| Tobacco Revenue: 0.05% | | | | | | | | | | | | |
| | | | |
Commonwealth Financing Authority Tobacco Master Settlement Payment Revenue Bonds | | | 5.00 | | | | 6-1-2035 | | | | 2,000,000 | | | | 2,382,940 | |
| | | | | | | | | | | | | | | | |
| | | | |
| Transportation Revenue: 0.73% | | | | | | | | | | | | |
| | | | |
Pennsylvania Turnpike Commission Motor License Series B-1 | | | 5.00 | | | | 12-1-2040 | | | | 12,410,000 | | | | 13,049,239 | |
| | | | |
Pennsylvania Turnpike Commission Motor License Series B-2 | | | 5.00 | | | | 12-1-2035 | | | | 9,900,000 | | | | 11,690,811 | |
| | | | |
Pennsylvania Turnpike Commission Series A-1 | | | 5.00 | | | | 12-1-2047 | | | | 1,750,000 | | | | 2,052,680 | |
| | | | |
Pennsylvania Turnpike Commission Subordinate Bond Series B-1 | | | 5.00 | | | | 6-1-2027 | | | | 1,000,000 | | | | 1,215,400 | |
| | | | |
Pennsylvania Turnpike Commission Subordinate Bond Series B-1 | | | 5.00 | | | | 6-1-2028 | | | | 1,450,000 | | | | 1,744,669 | |
| | | | |
Pennsylvania Turnpike Commission Subordinate Bond Series B-2 | | | 5.00 | | | | 6-1-2027 | | | | 1,200,000 | | | | 1,456,524 | |
| | | | |
Pennsylvania Turnpike Commission Subordinate Bond Series B-2 | | | 5.00 | | | | 6-1-2028 | | | | 5,000,000 | | | | 6,016,100 | |
| | | | |
| | | | | | | | | | | | | | | 37,225,423 | |
| | | | | | | | | | | | | | | | |
| | | | |
| Water & Sewer Revenue: 0.18% | | | | | | | | | | | | |
| | | | |
Philadelphia PA Series B | | | 5.00 | | | | 7-1-2033 | | | | 8,000,000 | | | | 9,293,600 | |
| | | | | | | | | | | | | | | | |
| | | | |
| | | | | | | | | | | | | | | 255,117,769 | |
| | | | | | | | | | | | | | | | |
Wells Fargo Municipal Bond Fund | 39
Portfolio of investments—June 30, 2019
| | | | | | | | | | | | | | | | |
| | | Interest rate | | | Maturity date | | | Principal | | | Value | |
Puerto Rico: 0.06% | | | | | | | | | | | | | | | | |
| | | | |
| Transportation Revenue: 0.06% | | | | | | | | | | | | |
| | | | |
Puerto Rico Highway & Transportation Authority Series AA (National Insured) | | | 5.50 | % | | | 7-1-2020 | | | $ | 3,015,000 | | | $ | 3,078,647 | |
| | | | | | | | | | | | | | | | |
| | | | |
Rhode Island: 0.05% | | | | | | | | | | | | | | | | |
| | | | |
| Airport Revenue: 0.05% | | | | | | | | | | | | |
| | | | |
Rhode Island Commerce Corporation First Lien Special Facility Airport Corporation Intermodal Facility Project Series 2018 | | | 5.00 | | | | 7-1-2031 | | | | 2,115,000 | | | | 2,531,845 | |
| | | | | | | | | | | | | | | | |
| | | | |
South Carolina: 1.12% | | | | | | | | | | | | | | | | |
| | | | |
| Education Revenue: 0.24% | | | | | | | | | | | | |
| | | | |
South Carolina Education Assistance Authority Student Loan Series I | | | 5.10 | | | | 10-1-2029 | | | | 1,050,000 | | | | 1,058,001 | |
| | | | |
South Carolina Jobs EDA York Preparatory Academy Project Series A | | | 7.25 | | | | 11-1-2045 | | | | 1,500,000 | | | | 1,654,605 | |
| | | | |
University of South Carolina Athletic Facilities Series A | | | 5.00 | | | | 5-1-2043 | | | | 8,155,000 | | | | 9,597,212 | |
| | | | |
| | | | | | | | | | | | | | | 12,309,818 | |
| | | | | | | | | | | | | | | | |
| | | | |
| Resource Recovery Revenue: 0.10% | | | | | | | | | | | | |
| | | | |
South Carolina Jobs EDA Solid Waste Disposal AMT RePower South Berkeley LLC Project Green Bond 144A | | | 6.00 | | | | 2-1-2035 | | | | 1,880,000 | | | | 1,954,053 | |
| | | | |
South Carolina Jobs EDA Solid Waste Disposal AMT RePower South Berkeley LLC Project Green Bond 144A | | | 6.25 | | | | 2-1-2045 | | | | 2,750,000 | | | | 2,862,475 | |
| | | | |
| | | | | | | | | | | | | | | 4,816,528 | |
| | | | | | | | | | | | | | | | |
| | | | |
| Utilities Revenue: 0.56% | | | | | | | | | | | | |
| | | | |
Patriots Energy Group Financing Agency South Carolina Series A | | | 4.00 | | | | 10-1-2048 | | | | 26,000,000 | | | | 28,472,340 | |
| | | | | | | | | | | | | | | | |
| | | | |
| Water & Sewer Revenue: 0.22% | | | | | | | | | | | | |
| | | | |
Columbia SC Waterworks & Sewer System | | | 5.00 | | | | 2-1-2043 | | | | 10,380,000 | | | | 11,388,521 | |
| | | | | | | | | | | | | | | | |
| | | | |
| | | | | | | | | | | | | | | 56,987,207 | |
| | | | | | | | | | | | | | | | |
| | | | |
South Dakota: 0.57% | | | | | | | | | | | | | | | | |
| | | | |
| Airport Revenue: 0.04% | | | | | | | | | | | | |
| | | | |
Rapid City SD Series A | | | 6.75 | | | | 12-1-2031 | | | | 1,020,000 | | | | 1,042,787 | |
| | | | |
Rapid City SD Series A | | | 7.00 | | | | 12-1-2035 | | | | 750,000 | | | | 767,468 | |
| | | | |
| | | | | | | | | | | | | | | 1,810,255 | |
| | | | | | | | | | | | | | | | |
| | | | |
| Health Revenue: 0.38% | | | | | | | | | | | | |
| | | | |
South Dakota HEFA Sanford Health Project | | | 5.50 | | | | 11-1-2040 | | | | 5,000,000 | | | | 5,060,350 | |
| | | | |
South Dakota HEFA Sanford Health Project Series E | | | 5.00 | | | | 11-1-2042 | | | | 13,125,000 | | | | 14,242,463 | |
| | | | |
| | | | | | | | | | | | | | | 19,302,813 | |
| | | | | | | | | | | | | | | | |
| | | | |
| Housing Revenue: 0.15% | | | | | | | | | | | | |
| | | | |
South Dakota Board of Regents Housing & Auxiliary Facilities System | | | 5.00 | | | | 4-1-2023 | | | | 750,000 | | | | 842,955 | |
| | | | |
South Dakota Board of Regents Housing & Auxiliary Facilities System | | | 5.00 | | | | 4-1-2024 | | | | 1,100,000 | | | | 1,269,884 | |
| | | | |
South Dakota Board of Regents Housing & Auxiliary Facilities System | | | 5.00 | | | | 4-1-2025 | | | | 1,000,000 | | | | 1,182,810 | |
| | | | |
South Dakota Board of Regents Housing & Auxiliary Facilities System | | | 5.00 | | | | 4-1-2026 | | | | 1,540,000 | | | | 1,859,981 | |
| | | | |
South Dakota Board of Regents Housing & Auxiliary Facilities System | | | 5.00 | | | | 4-1-2032 | | | | 1,010,000 | | | | 1,222,009 | |
| | | | |
South Dakota Board of Regents Housing & Auxiliary Facilities System | | | 5.00 | | | | 4-1-2033 | | | | 1,250,000 | | | | 1,507,950 | |
| | | | |
| | | | | | | | | | | | | | | 7,885,589 | |
| | | | | | | | | | | | | | | | |
| | | | |
| | | | | | | | | | | | | | | 28,998,657 | |
| | | | | | | | | | | | | | | | |
40 | Wells Fargo Municipal Bond Fund
Portfolio of investments—June 30, 2019
| | | | | | | | | | | | | | | | |
| | | Interest rate | | | Maturity date | | | Principal | | | Value | |
Tennessee: 0.99% | | | | | | | | | | | | | | | | |
| | | | |
| Utilities Revenue: 0.99% | | | | | | | | | | | | |
| | | | |
Tennessee Energy Acquisition Corporation Gas Project | | | 4.00 | % | | | 11-1-2049 | | | $ | 20,000,000 | | | $ | 22,038,400 | |
| | | | |
Tennessee Energy Acquisition Corporation Series A | | | 4.00 | | | | 5-1-2048 | | | | 24,155,000 | | | | 25,893,194 | |
| | | | |
Tennessee Energy Acquisition Corporation Series A | | | 5.25 | | | | 9-1-2026 | | | | 1,020,000 | | | | 1,219,583 | |
| | | | |
Tennessee Energy Acquisition Corporation Series C | | | 5.00 | | | | 2-1-2021 | | | | 1,000,000 | | | | 1,047,340 | |
| | | | |
| | | | | | | | | | | | | | | 50,198,517 | |
| | | | | | | | | | | | | | | | |
| | | | |
Texas: 11.08% | | | | | | | | | | | | | | | | |
| | | | |
| Airport Revenue: 1.08% | | | | | | | | | | | | |
| | | | |
Austin TX Airport System AMT | | | 5.00 | | | | 11-15-2039 | | | | 8,000,000 | | | | 9,044,720 | |
| | | | |
Austin TX Airport System AMT | | | 5.00 | | | | 11-15-2044 | | | | 3,500,000 | | | | 3,943,905 | |
| | | | |
Dallas-Fort Worth TX International Airport AMT Series D | | | 5.00 | | | | 11-1-2038 | | | | 13,250,000 | | | | 14,069,513 | |
| | | | |
Dallas-Fort Worth TX International Airport Series H | | | 5.00 | | | | 11-1-2042 | | | | 20,765,000 | | | | 22,020,037 | |
| | | | |
Houston TX Airport System Subordinate Bond Lien AMT Series A | | | 5.00 | | | | 7-1-2041 | | | | 4,750,000 | | | | 5,613,360 | |
| | | | |
| | | | | | | | | | | | | | | 54,691,535 | |
| | | | | | | | | | | | | | | | |
| | | | |
| Education Revenue: 0.64% | | | | | | | | | | | | |
| | | | |
Beasley TX Higher Education Finance Corporation Focus Learning Academy Series A †† | | | 7.75 | | | | 8-15-2041 | | | | 2,000,000 | | | | 1,320,000 | |
| | | | |
Clifton TX Higher Education Finance Corporation International Leadership Texas Series D | | | 6.00 | | | | 8-15-2038 | | | | 6,000,000 | | | | 6,570,360 | |
| | | | |
Clifton TX Higher Education Finance Corporation International Leadership Texas Series D | | | 6.13 | | | | 8-15-2048 | | | | 6,750,000 | | | | 7,354,733 | |
| | | | |
Clifton TX Higher Educational Finance Corporation International Leadership Series A | | | 5.75 | | | | 8-15-2038 | | | | 2,000,000 | | | | 2,163,420 | |
| | | | |
La Vernia TX Higher Education Finance Corporation Lifeschool of Dallas Series A | | | 6.25 | | | | 8-15-2021 | | | | 2,000,000 | | | | 2,011,860 | |
| | | | |
La Vernia TX Higher Education Finance Corporation Lifeschool of Dallas Series A | | | 7.50 | | | | 8-15-2041 | | | | 6,500,000 | | | | 6,547,775 | |
| | | | |
Newark TX Higher Education Finance Corporation Austin Achieve Public Schools Incorporated | | | 5.00 | | | | 6-15-2048 | | | | 750,000 | | | | 766,275 | |
| | | | |
Southwest Texas Higher Education Authority Incorporated Southern Methodist University Project | | | 5.00 | | | | 10-1-2030 | | | | 1,460,000 | | | | 1,800,910 | |
| | | | |
Southwest Texas Higher Education Authority Incorporated Southern Methodist University Project | | | 5.00 | | | | 10-1-2032 | | | | 650,000 | | | | 792,350 | |
| | | | |
Southwest Texas Higher Education Authority Incorporated Southern Methodist University Project | | | 5.00 | | | | 10-1-2039 | | | | 750,000 | | | | 895,433 | |
| | | | |
Southwest Texas Higher Education Authority Incorporated Southern Methodist University Project | | | 5.00 | | | | 10-1-2040 | | | | 1,000,000 | | | | 1,191,470 | |
| | | | |
Southwest Texas Higher Education Authority Incorporated Southern Methodist University Project | | | 5.00 | | | | 10-1-2041 | | | | 900,000 | | | | 1,070,028 | |
| | | | |
| | | | | | | | | | | | | | | 32,484,614 | |
| | | | | | | | | | | | | | | | |
| | | | |
| GO Revenue: 2.16% | | | | | | | | | | | | |
| | | | |
El Paso TX | | | 4.00 | | | | 8-15-2031 | | | | 6,500,000 | | | | 7,216,235 | |
| | | | |
Houston TX Public Improvement Refunding Bonds Series A | | | 4.00 | | | | 3-1-2034 | | | | 1,000,000 | | | | 1,102,510 | |
| | | | |
Houston TX Public Improvement Refunding Bonds Series A | | | 5.00 | | | | 3-1-2029 | | | | 2,000,000 | | | | 2,445,500 | |
| | | | |
Lewisville TX Independent School District Unlimited Tax Refunding Bonds Series A | | | 5.00 | | | | 8-15-2022 | | | | 2,640,000 | | | | 2,938,399 | |
| | | | |
Lone Star College System Texas Refunding Limited Tax | | | 5.00 | | | | 2-15-2028 | | | | 4,055,000 | | | | 4,904,969 | |
| | | | |
Nacogdoches TX Independent School District | | | 5.00 | | | | 2-15-2049 | | | | 8,560,000 | | | | 10,164,572 | |
| | | | |
North East Independent School District | | | 4.00 | | | | 8-1-2048 | | | | 10,450,000 | | | | 11,404,921 | |
| | | | |
Port Isabel TX 144A | | | 5.10 | | | | 2-15-2049 | | | | 1,000,000 | | | | 1,063,890 | |
| | | | |
Royse City TX Independent School District | | | 5.00 | | | | 8-15-2034 | | | | 3,025,000 | | | | 3,548,265 | |
Wells Fargo Municipal Bond Fund | 41
Portfolio of investments—June 30, 2019
| | | | | | | | | | | | | | | | |
| | | Interest rate | | | Maturity date | | | Principal | | | Value | |
| | | | |
| GO Revenue (continued) | | | | | | | | | | | | |
| | | | |
Salado TX Independent School District | | | 5.00 | % | | | 2-15-2049 | | | $ | 1,605,000 | | | $ | 1,908,586 | |
| | | | |
San Antonio TX Independent School District | | | 5.00 | | | | 8-15-2048 | | | | 13,000,000 | | | | 15,038,790 | |
| | | | |
Sugar Land TX Refunding Bonds | | | 5.00 | | | | 2-15-2030 | | | | 1,250,000 | | | | 1,526,613 | |
| | | | |
Temple TX | | | 5.00 | | | | 8-1-2032 | | | | 1,070,000 | | | | 1,249,728 | |
| | | | |
Texas Refunding Bond Series B | | | 5.00 | | | | 10-1-2036 | | | | 24,500,000 | | | | 28,890,155 | |
| | | | |
Travis County TX | | | 5.00 | | | | 3-1-2036 | | | | 1,380,000 | | | | 1,716,927 | |
| | | | |
Travis County TX | | | 5.00 | | | | 3-1-2039 | | | | 6,250,000 | | | | 7,689,313 | |
| | | | |
Williamson County TX | | | 4.00 | | | | 2-15-2031 | | | | 6,195,000 | | | | 6,653,368 | |
| | | | |
| | | | | | | | | | | | | | | 109,462,741 | |
| | | | | | | | | | | | | | | | |
| | | | |
| Health Revenue: 0.36% | | | | | | | | | | | | |
| | | | |
Harris County TX Methodist Hospital System Series A1 ø | | | 1.95 | | | | 12-1-2041 | | | | 10,000,000 | | | | 10,000,000 | |
| | | | |
Harris County TX Texas Childrens Hospital Series A %% | | | 4.00 | | | | 10-1-2037 | | | | 3,000,000 | | | | 3,347,610 | |
| | | | |
Harris County TX Texas Childrens Hospital Series A %% | | | 4.00 | | | | 10-1-2038 | | | | 2,300,000 | | | | 2,558,773 | |
| | | | |
New Hope ECFA Children’s Health System of Texas Project Series A | | | 4.00 | | | | 8-15-2033 | | | | 2,000,000 | | | | 2,209,660 | |
| | | | |
| | | | | | | | | | | | | | | 18,116,043 | |
| | | | | | | | | | | | | | | | |
| | | | |
| Housing Revenue: 0.34% | | | | | | | | | | | | |
| | | | |
Alamito TX Public Facility Corporation Cramer Three Apartments Project | | | 2.50 | | | | 11-1-2021 | | | | 7,000,000 | | | | 7,109,410 | |
| | | | |
Austin TX Affordable Public Facility Corporation Incorporated Commons at Goodnight Apartments | | | 1.85 | | | | 1-1-2021 | | | | 10,000,000 | | | | 10,028,300 | |
| | | | |
| | | | | | | | | | | | | | | 17,137,710 | |
| | | | | | | | | | | | | | | | |
| | | | |
| Miscellaneous Revenue: 3.52% | | | | | | | | | | | | |
| | | | |
Lewisville TX Combination Contract Special Assessment Capital Improvement District #4 | | | 6.75 | | | | 10-1-2032 | | | | 100,000 | | | | 100,153 | |
| | | | |
Lewisville TX Combination Contract Castle Hills Public Improvement Bonds District #5 144A | | | 6.50 | | | | 9-1-2034 | | | | 2,045,000 | | | | 2,052,321 | |
| | | | |
Lewisville TX Combination Contract Castle Hills Public Improvement Bonds District #5 144A | | | 6.50 | | | | 9-1-2034 | | | | 4,075,000 | | | | 4,089,589 | |
| | | | |
Lewisville TX Combination Contract Castle Hills Public Improvement Bonds District #6 144A | | | 6.00 | | | | 9-1-2037 | | | | 9,300,000 | | | | 9,776,067 | |
| | | | |
Lewisville TX Combination Contract Castle Hills Public Improvement Bonds District #6 144A | | | 5.50 | | | | 9-1-2039 | | | | 2,500,000 | | | | 2,516,500 | |
| | | | |
Lewisville TX Combination Contract Castle Hills Public Improvement Bonds District #6 144A | | | 6.00 | | | | 9-1-2037 | | | | 3,940,000 | | | | 4,141,689 | |
| | | | |
Lower Colorado TX River Authority Series A | | | 5.00 | | | | 5-15-2033 | | | | 2,475,000 | | | | 2,758,932 | |
| | | | |
Texas PFA | | | 4.00 | | | | 2-1-2034 | | | | 5,000,000 | | | | 5,682,850 | |
| | | | |
Texas PFA | | | 4.00 | | | | 2-1-2035 | | | | 2,000,000 | | | | 2,260,400 | |
| | | | |
Texas PFA | | | 4.00 | | | | 2-1-2036 | | | | 2,175,000 | | | | 2,447,441 | |
| | | | |
Texas Series A | | | 4.00 | | | | 10-15-2036 | | | | 5,000,000 | | | | 5,577,050 | |
| | | | |
Texas Series B | | | 5.00 | | | | 4-15-2049 | | | | 40,000,000 | | | | 48,220,800 | |
| | | | |
Texas Transportation Commission Highway Improvement Series A | | | 5.00 | | | | 4-1-2042 | | | | 70,000,000 | | | | 76,066,200 | |
| | | | |
Texas Water Development Board Series A | | | 4.00 | | | | 10-15-2037 | | | | 11,650,000 | | | | 12,952,936 | |
| | | | |
| | | | | | | | | | | | | | | 178,642,928 | |
| | | | | | | | | | | | | | | | |
| | | | |
| Resource Recovery Revenue: 0.19% | | | | | | | | | | | | |
| | | | |
Port Arthur TX Navigation District Jefferson County Environmental Facilities Motiva Enterprises LLC Project Series B ø | | | 2.07 | | | | 4-1-2040 | | | | 4,750,000 | | | | 4,750,000 | |
| | | | |
Port Arthur TX Navigation District Jefferson County Environmental Facilities Motiva Enterprises LLC Project Series E ø | | | 2.05 | | | | 11-1-2040 | | | | 5,000,000 | | | | 5,000,000 | |
| | | | |
| | | | | | | | | | | | | | | 9,750,000 | |
| | | | | | | | | | | | | | | | |
42 | Wells Fargo Municipal Bond Fund
Portfolio of investments—June 30, 2019
| | | | | | | | | | | | | | | | |
| | | Interest rate | | | Maturity date | | | Principal | | | Value | |
| Tax Revenue: 0.76% | | | | | | | | | | | | |
| | | | |
Dallas TX Area Rapid Transit Sales Tax Revenue Series A | | | 5.00 | % | | | 12-1-2048 | | | $ | 5,000,000 | | | $ | 5,762,650 | |
| | | | |
Dallas TX Area Rapid Transit Sales Tax Revenue Series A | | | 5.00 | | | | 12-1-2046 | | | | 28,430,000 | | | | 32,831,817 | |
| | | | |
| | | | | | | | | | | | | | | 38,594,467 | |
| | | | | | | | | | | | | | | | |
| | | | |
| Transportation Revenue: 0.74% | | | | | | | | | | | | |
| | | | |
Central Texas Regional Mobility Authority Senior Lien | | | 5.75 | | | | 1-1-2025 | | | | 2,000,000 | | | | 2,043,460 | |
| | | | |
Central Texas Regional Mobility Authority Senior Lien Series A | | | 5.00 | | | | 1-1-2033 | | | | 3,740,000 | | | | 4,090,027 | |
| | | | |
Grand Parkway Transportation Corporation Texas CAB Series B | | | 0.00 | | | | 10-1-2029 | | | | 1,015,000 | | | | 1,070,835 | |
| | | | |
Grand Parkway Transportation Corporation Texas Series B | | | 0.00 | | | | 10-1-2030 | | | | 2,000,000 | | | | 2,102,580 | |
| | | | |
North Texas Tollway Authority Series A | | | 5.00 | | | | 1-1-2033 | | | | 3,600,000 | | | | 4,150,548 | |
| | | | |
North Texas Tollway Authority Series A | | | 5.00 | | | | 1-1-2035 | | | | 4,000,000 | | | | 4,589,960 | |
| | | | |
Texas Private Activity Bond Surface Transportation Corporation Project NTE Mobility Partners Segments LLC | | | 6.75 | | | | 6-30-2043 | | | | 4,000,000 | | | | 4,644,040 | |
| | | | |
Texas Private Activity Bond Surface Transportation Corporation Project NTE Mobility Partners Segments LLC | | | 7.00 | | | | 12-31-2038 | | | | 12,500,000 | | | | 14,689,125 | |
| | | | |
| | | | | | | | | | | | | | | 37,380,575 | |
| | | | | | | | | | | | | | | | |
| | | | |
| Utilities Revenue: 0.44% | | | | | | | | | | | | |
| | | | |
San Antonio TX Electric & Gas Systems Junior Lien Refunding Bond | | | 2.75 | | | | 2-1-2048 | | | | 11,000,000 | | | | 11,363,000 | |
| | | | |
Texas Municipal Gas Acquisition & Supply Corporation III | | | 5.00 | | | | 12-15-2029 | | | | 5,115,000 | | | | 5,600,311 | |
| | | | |
Texas Municipal Gas Acquisition & Supply Corporation III | | | 5.00 | | | | 12-15-2031 | | | | 5,000,000 | | | | 5,447,650 | |
| | | | |
| | | | | | | | | | | | | | | 22,410,961 | |
| | | | | | | | | | | | | | | | |
| | | | |
| Water & Sewer Revenue: 0.85% | | | | | | | | | | | | |
| | | | |
Austin TX Water & Wastewater Refunding Bond | | | 5.00 | | | | 11-15-2045 | | | | 15,065,000 | | | | 17,644,128 | |
| | | | |
Dallas TX Waterworks & Sewer System Refunding Series A | | | 5.00 | | | | 10-1-2030 | | | | 3,810,000 | | | | 4,543,577 | |
| | | | |
Tarrant TX Regional Water District | | | 5.00 | | | | 9-1-2034 | | | | 3,500,000 | | | | 4,030,075 | |
| | | | |
Tarrant TX Regional Water District | | | 5.00 | | | | 3-1-2049 | | | | 15,000,000 | | | | 16,906,350 | |
| | | | |
| | | | | | | | | | | | | | | 43,124,130 | |
| | | | | | | | | | | | | | | | |
| | | | |
| | | | | | | | | | | | | | | 561,795,704 | |
| | | | | | | | | | | | | | | | |
| | | | |
Utah: 1.18% | | | | | | | | | | | | | | | | |
| | | | |
| Airport Revenue: 0.42% | | | | | | | | | | | | |
| | | | |
Salt Lake City UT Series A | | | 5.00 | | | | 7-1-2036 | | | | 2,500,000 | | | | 2,992,375 | |
| | | | |
Salt Lake City UT Series A | | | 5.00 | | | | 7-1-2043 | | | | 2,500,000 | | | | 2,947,700 | |
| | | | |
Salt Lake City UT Series A | | | 5.00 | | | | 7-1-2043 | | | | 1,500,000 | | | | 1,801,725 | |
| | | | |
Salt Lake City UT Series A | | | 5.00 | | | | 7-1-2048 | | | | 5,500,000 | | | | 6,451,555 | |
| | | | |
Salt Lake City UT Series A | | | 5.00 | | | | 7-1-2048 | | | | 3,000,000 | | | | 3,584,850 | |
| | | | |
Salt Lake City UT Series A | | | 5.25 | | | | 7-1-2048 | | | | 3,000,000 | | | | 3,594,120 | |
| | | | |
| | | | | | | | | | | | | | | 21,372,325 | |
| | | | | | | | | | | | | | | | |
| | | | |
| Health Revenue: 0.67% | | | | | | | | | | | | |
| | | | |
Utah County UT Hospital Revenue Bond IHC Health Services Incorporated Series 2012 | | | 5.00 | | | | 5-15-2043 | | | | 32,000,000 | | | | 33,833,920 | |
| | | | | | | | | | | | | | | | |
| | | | |
| Tax Revenue: 0.09% | | | | | | | | | | | | |
| | | | |
Utah Transit Authority Series A | | | 5.00 | | | | 6-15-2030 | | | | 4,000,000 | | | | 4,741,840 | |
| | | | | | | | | | | | | | | | |
| | | | |
| | | | | | | | | | | | | | | 59,948,085 | |
| | | | | | | | | | | | | | | | |
| | | | |
Vermont: 0.28% | | | | | | | | | | | | | | | | |
| | | | |
| Education Revenue: 0.28% | | | | | | | | | | | | |
| | | | |
Vermont Student Assistance Corporation Series B (1 Month LIBOR +1.00%)± | | | 3.44 | | | | 6-2-2042 | | | | 14,515,325 | | | | 14,391,945 | |
| | | | | | | | | | | | | | | | |
Wells Fargo Municipal Bond Fund | 43
Portfolio of investments—June 30, 2019
| | | | | | | | | | | | | | | | |
| | | Interest rate | | | Maturity date | | | Principal | | | Value | |
Virginia: 0.46% | | | | | | | | | | | | | | | | |
| | | | |
| GO Revenue: 0.31% | | | | | | | | | | | | |
| | | | |
Fairfax County VA Series A | | | 4.00 | % | | | 10-1-2034 | | | $ | 8,450,000 | | | $ | 9,261,200 | |
| | | | |
Norfolk VA Series C | | | 4.00 | | | | 9-1-2032 | | | | 5,810,000 | | | | 6,525,850 | |
| | | | |
| | | | | | | | | | | | | | | 15,787,050 | |
| | | | | | | | | | | | | | | | |
| | | | |
| Housing Revenue: 0.04% | | | | | | | | | | | | |
| | | | |
Newport News VA Redevelopment & Housing Authority Multifamily Housing Series A | | | 1.82 | | | | 11-1-2020 | | | | 2,010,000 | | | | 2,011,548 | |
| | | | | | | | | | | | | | | | |
| | | | |
| Miscellaneous Revenue: 0.00% | | | | | | | | | | | | |
| | | | |
Watkins Centre VA CDA | | | 5.40 | | | | 3-1-2020 | | | | 172,000 | | | | 172,236 | |
| | | | | | | | | | | | | | | | |
| | | | |
| Tax Revenue: 0.03% | | | | | | | | | | | | |
| | | | |
Marquis VA CDA CAB Series 2015 144A ¤ | | | 0.00 | | | | 9-1-2045 | | | | 397,000 | | | | 292,343 | |
| | | | |
Marquis VA CDA CAB Series C ¤ | | | 0.00 | | | | 9-1-2041 | | | | 1,824,000 | | | | 103,348 | |
| | | | |
Marquis VA CDA Series B | | | 5.63 | | | | 9-1-2041 | | | | 1,310,000 | | | | 870,954 | |
| | | | |
| | | | | | | | | | | | | | | 1,266,645 | |
| | | | | | | | | | | | | | | | |
| | | | |
| Transportation Revenue: 0.08% | | | | | | | | | | | | |
| | | | |
Virginia Small Business Financing Authority Senior Lien 95 Express Lanes LLC Project | | | 5.00 | | | | 7-1-2034 | | | | 4,000,000 | | | | 4,254,240 | |
| | | | | | | | | | | | | | | | |
| | | | |
| | | | | | | | | | | | | | | 23,491,719 | |
| | | | | | | | | | | | | | | | |
| | | | |
Washington: 3.03% | | | | | | | | | | | | | | | | |
| | | | |
| GO Revenue: 1.52% | | | | | | | | | | | | |
| | | | |
Clark County WA School District #114 (AGM Insured) | | | 4.00 | | | | 12-1-2031 | | | | 9,000,000 | | | | 10,229,490 | |
| | | | |
Clark County WA School District #114 (AGM Insured) | | | 4.00 | | | | 12-1-2034 | | | | 2,500,000 | | | | 2,806,925 | |
| | | | |
King County WA Public Hospital District #1 Valley Medical Center Refunding Bond | | | 5.00 | | | | 12-1-2029 | | | | 8,940,000 | | | | 10,703,773 | |
| | | | |
King County WA Public Hospital District #1 Valley Medical Center Refunding Bond | | | 5.00 | | | | 12-1-2035 | | | | 9,430,000 | | | | 11,048,942 | |
| | | | |
King County WA School District #210 (AGM Insured) | | | 4.00 | | | | 12-1-2033 | | | | 10,000,000 | | | | 11,287,800 | |
| | | | |
King County WA School District No. 414 Lake Washington (AGM Insured) | | | 5.00 | | | | 12-1-2033 | | | | 570,000 | | | | 708,596 | |
| | | | |
King County WA School District No. 414 Lake Washington (AGM Insured) | | | 5.00 | | | | 12-1-2034 | | | | 1,000,000 | | | | 1,233,910 | |
| | | | |
Snohomish County WA School District (AGM Insured) | | | 5.00 | | | | 12-1-2031 | | | | 1,500,000 | | | | 1,763,850 | |
| | | | |
Washington Motor Vehicle Fuel Tax Series B | | | 5.00 | | | | 8-1-2032 | | | | 8,545,000 | | | | 10,060,541 | |
| | | | |
Washington Series 2017-A | | | 5.00 | | | | 8-1-2040 | | | | 3,500,000 | | | | 4,114,040 | |
| | | | |
Washington Series 2017-A | | | 5.00 | | | | 8-1-2041 | | | | 2,500,000 | | | | 2,934,825 | |
| | | | |
Washington Series 2017-A | | | 5.00 | | | | 8-1-2033 | | | | 1,500,000 | | | | 1,794,675 | |
| | | | |
Washington Series RA | | | 4.00 | | | | 7-1-2030 | | | | 7,950,000 | | | | 8,466,830 | |
| | | | |
| | | | | | | | | | | | | | | 77,154,197 | |
| | | | | | | | | | | | | | | | |
| | | | |
| Health Revenue: 0.25% | | | | | | | | | | | | |
| | | | |
Spokane WA Housing Finance Commission Riverview Retirement Community Project | | | 5.00 | | | | 1-1-2023 | | | | 945,000 | | | | 994,820 | |
| | | | |
Washington HCFR Central Washington Health Service Association | | | 7.00 | | | | 7-1-2039 | | | | 5,000,000 | | | | 5,000,000 | |
| | | | |
Washington HCFR Providence Health & Services Series 2012A | | | 4.25 | | | | 10-1-2040 | | | | 3,000,000 | | | | 3,109,050 | |
| | | | |
Washington HCFR Providence Health & Services Series 2012A | | | 5.00 | | | | 10-1-2042 | | | | 2,160,000 | | | | 2,361,636 | |
| | | | |
Washington HCFR Providence Health & Services Series 2015A | | | 4.00 | | | | 10-1-2045 | | | | 1,150,000 | | | | 1,224,164 | |
| | | | |
| | | | | | | | | | | | | | | 12,689,670 | |
| | | | | | | | | | | | | | | | |
44 | Wells Fargo Municipal Bond Fund
Portfolio of investments—June 30, 2019
| | | | | | | | | | | | | | | | |
| | | Interest rate | | | Maturity date | | | Principal | | | Value | |
| Miscellaneous Revenue: 0.23% | | | | | | | | | | | | |
| | | | |
Washington Certificate of Participation | | | 5.00 | % | | | 7-1-2038 | | | $ | 1,660,000 | | | $ | 2,041,169 | |
| | | | |
Washington Certificate of Participation | | | 5.00 | | | | 7-1-2039 | | | | 1,745,000 | | | | 2,143,279 | |
| | | | |
Washington Certificate of Participation | | | 5.00 | | | | 7-1-2040 | | | | 1,480,000 | | | | 1,811,564 | |
| | | | |
Washington Certificate of Participation | | | 5.00 | | | | 7-1-2041 | | | | 1,555,000 | | | | 1,895,467 | |
| | | | |
Washington Certificate of Participation Series A | | | 5.00 | | | | 7-1-2038 | | | | 3,265,000 | | | | 3,889,170 | |
| | | | |
| | | | | | | | | | | | | | | 11,780,649 | |
| | | | | | | | | | | | | | | | |
| | | | |
| Tax Revenue: 0.37% | | | | | | | | | | | | |
| | | | |
Central Puget Sound WA Regional Transportation Authority Series S1 | | | 5.00 | | | | 11-1-2035 | | | | 9,485,000 | | | | 11,169,157 | |
| | | | |
Washington Series B | | | 5.00 | | | | 8-1-2037 | | | | 6,400,000 | | | | 7,569,088 | |
| | | | |
| | | | | | | | | | | | | | | 18,738,245 | |
| | | | | | | | | | | | | | | | |
| | | | |
| Water & Sewer Revenue: 0.66% | | | | | | | | | | | | |
| | | | |
King County WA | | | 5.00 | | | | 7-1-2047 | | | | 7,510,000 | | | | 8,517,917 | |
| | | | |
King County WA | | | 2.60 | | | | 1-1-2043 | | | | 19,000,000 | | | | 19,262,390 | |
| | | | |
King County WA | | | 5.00 | | | | 7-1-2042 | | | | 4,660,000 | | | | 5,529,230 | |
| | | | |
| | | | | | | | | | | | | | | 33,309,537 | |
| | | | | | | | | | | | | | | | |
| | | | |
| | | | | | | | | | | | | | | 153,672,298 | |
| | | | | | | | | | | | | | | | |
| | | | |
West Virginia: 0.15% | | | | | | | | | | | | | | | | |
| | | | |
| GO Revenue: 0.08% | | | | | | | | | | | | |
| | | | |
Ohio County WV Board of Education | | | 3.00 | | | | 6-1-2025 | | | | 1,205,000 | | | | 1,293,435 | |
| | | | |
Ohio County WV Board of Education | | | 3.00 | | | | 6-1-2026 | | | | 2,680,000 | | | | 2,882,608 | |
| | | | |
| | | | | | | | | | | | | | | 4,176,043 | |
| | | | | | | | | | | | | | | | |
| | | | |
| Tax Revenue: 0.07% | | | | | | | | | | | | |
| | | | |
Monongalia County WV Commission Refunding & Improvement Bonds University Town Center Series A 144A | | | 5.50 | | | | 6-1-2037 | | | | 2,500,000 | | | | 2,701,075 | |
| | | | |
Monongalia County WV Commission Refunding & Improvement Bonds University Town Center Series A 144A | | | 5.75 | | | | 6-1-2043 | | | | 675,000 | | | | 730,627 | |
| | | | |
| | | | | | | | | | | | | | | 3,431,702 | |
| | | | | | | | | | | | | | | | |
| | | | |
| | | | | | | | | | | | | | | 7,607,745 | |
| | | | | | | | | | | | | | | | |
| | | | |
Wisconsin: 3.95% | | | | | | | | | | | | | | | | |
| | | | |
| Education Revenue: 0.37% | | | | | | | | | | | | |
| | | | |
Milwaukee WI RDA Science Education Consortium Incorporated Project Series A | | | 6.00 | | | | 8-1-2033 | | | | 2,120,000 | | | | 2,315,634 | |
| | | | |
Milwaukee WI RDA Science Education Consortium Incorporated Project Series A | | | 6.25 | | | | 8-1-2043 | | | | 4,650,000 | | | | 5,084,078 | |
| | | | |
Public Finance Authority Wisland Revenue Northwest Nazarene University | | | 4.25 | | | | 10-1-2049 | | | | 5,410,000 | | | | 5,446,788 | |
| | | | |
Wisconsin PFA Carolina International School Series A 144A | | | 6.00 | | | | 8-1-2023 | | | | 375,000 | | | | 395,396 | |
| | | | |
Wisconsin PFA Carolina International School Series A 144A | | | 6.75 | | | | 8-1-2033 | | | | 2,430,000 | | | | 2,729,765 | |
| | | | |
Wisconsin PFA Carolina International School Series A 144A | | | 7.00 | | | | 8-1-2043 | | | | 1,575,000 | | | | 1,763,150 | |
| | | | |
Wisconsin PFA Carolina International School Series A 144A | | | 7.20 | | | | 8-1-2048 | | | | 940,000 | | | | 1,057,444 | |
| | | | |
| | | | | | | | | | | | | | | 18,792,255 | |
| | | | | | | | | | | | | | | | |
| | | | |
| GO Revenue: 0.69% | | | | | | | | | | | | |
| | | | |
Verona WI Area School District Building & Improvement Bonds | | | 4.00 | | | | 4-1-2027 | | | | 3,385,000 | | | | 3,860,999 | |
| | | | |
Verona WI Area School District Building & Improvement Bonds | | | 4.00 | | | | 4-1-2028 | | | | 1,380,000 | | | | 1,569,157 | |
| | | | |
Verona WI Area School District Building & Improvement Bonds | | | 5.00 | | | | 4-1-2026 | | | | 3,310,000 | | | | 4,047,336 | |
Wells Fargo Municipal Bond Fund | 45
Portfolio of investments—June 30, 2019
| | | | | | | | | | | | | | | | |
| | | Interest rate | | | Maturity date | | | Principal | | | Value | |
| | | | |
| GO Revenue (continued) | | | | | | | | | | | | |
| | | | |
Wisconsin Series A | | | 4.00 | % | | | 5-1-2032 | | | $ | 13,000,000 | | | $ | 13,772,070 | |
| | | | |
Wisconsin Series A | | | 5.00 | | | | 5-1-2032 | | | | 10,000,000 | | | | 11,747,500 | |
| | | | |
| | | | | | | | | | | | | | | 34,997,062 | |
| | | | | | | | | | | | | | | | |
| | | | |
| Health Revenue: 1.18% | | | | | | | | | | | | |
| | | | |
University of Wisconsin Hospitals & Clinics Authority Refunding Bond Series B (JPMorgan Chase & Company SPA) ø | | | 1.93 | | | | 4-1-2048 | | | | 18,415,000 | | | | 18,415,000 | |
| | | | |
Wisconsin HEFA Ascension Senior Credit Group Series A | | | 5.00 | | | | 11-15-2035 | | | | 12,000,000 | | | | 14,046,600 | |
| | | | |
Wisconsin HEFA Aurora Health Care Incorporated Series A | | | 5.25 | | | | 4-15-2024 | | | | 1,025,000 | | | | 1,056,129 | |
| | | | |
Wisconsin PFA Series A | | | 4.00 | | | | 10-1-2049 | | | | 24,500,000 | | | | 26,317,165 | |
| | | | |
| | | | | | | | | | | | | | | 59,834,894 | |
| | | | | | | | | | | | | | | | |
| | | | |
| Housing Revenue: 0.81% | | | | | | | | | | | | |
| | | | |
Wisconsin HSG & EDA Series B (FNMA Insured, FHLB SPA) ø | | | 1.90 | | | | 3-1-2043 | | | | 6,000,000 | | | | 6,000,000 | |
| | | | |
Wisconsin PFA Student Housing Revenue (AGM Insured) | | | 4.00 | | | | 7-1-2023 | | | | 350,000 | | | | 379,183 | |
| | | | |
Wisconsin PFA Student Housing Revenue (AGM Insured) | | | 4.00 | | | | 7-1-2024 | | | | 800,000 | | | | 879,960 | |
| | | | |
Wisconsin PFA Student Housing Revenue (AGM Insured) | | | 4.00 | | | | 7-1-2025 | | | | 920,000 | | | | 1,024,346 | |
| | | | |
Wisconsin PFA Student Housing Revenue (AGM Insured) | | | 5.00 | | | | 7-1-2026 | | | | 1,360,000 | | | | 1,634,598 | |
| | | | |
Wisconsin PFA Student Housing Revenue (AGM Insured) | | | 5.00 | | | | 7-1-2027 | | | | 1,675,000 | | | | 2,049,714 | |
| | | | |
Wisconsin PFA Student Housing Revenue (AGM Insured) | | | 5.00 | | | | 7-1-2028 | | | | 2,025,000 | | | | 2,479,349 | |
| | | | |
Wisconsin PFA Student Housing Revenue (AGM Insured) | | | 5.00 | | | | 7-1-2029 | | | | 2,190,000 | | | | 2,665,427 | |
| | | | |
Wisconsin PFA Student Housing Revenue (AGM Insured) | | | 5.00 | | | | 7-1-2030 | | | | 2,300,000 | | | | 2,780,608 | |
| | | | |
Wisconsin PFA Student Housing Revenue (AGM Insured) | | | 5.00 | | | | 7-1-2031 | | | | 1,415,000 | | | | 1,700,179 | |
| | | | |
Wisconsin PFA Student Housing Revenue (AGM Insured) | | | 5.00 | | | | 7-1-2048 | | | | 16,775,000 | | | | 19,345,769 | |
| | | | |
| | | | | | | | | | | | | | | 40,939,133 | |
| | | | | | | | | | | | | | | | |
| | | | |
| Miscellaneous Revenue: 0.12% | | | | | | | | | | | | |
| | | | |
Wisconsin Series 1 | | | 4.50 | | | | 7-1-2033 | | | | 2,085,000 | | | | 2,243,168 | |
| | | | |
Wisconsin Series A | | | 5.00 | | | | 6-1-2033 | | | | 3,420,000 | | | | 4,049,964 | |
| | | | |
| | | | | | | | | | | | | | | 6,293,132 | |
| | | | | | | | | | | | | | | | |
| | | | |
| Tax Revenue: 0.78% | | | | | | | | | | | | |
| | | | |
Mount Pleasant WI Series A | | | 5.00 | | | | 4-1-2038 | | | | 5,495,000 | | | | 6,571,196 | |
| | | | |
Mount Pleasant WI Series A | | | 5.00 | | | | 4-1-2043 | | | | 20,205,000 | | | | 23,858,468 | |
| | | | |
Mount Pleasant WI Series A | | | 5.00 | | | | 4-1-2048 | | | | 7,855,000 | | | | 9,203,468 | |
| | | | |
| | | | | | | | | | | | | | | 39,633,132 | |
| | | | | | | | | | | | | | | | |
| | | | |
| | | | | | | | | | | | | | | 200,489,608 | |
| | | | | | | | | | | | | | | | |
| | | | |
Wyoming: 0.04% | | | | | | | | | | | | | | | | |
| | | | |
| Education Revenue: 0.03% | | | | | | | | | | | | |
| | | | |
Wyoming CDA | | | 6.50 | | | | 7-1-2043 | | | | 1,600,000 | | | | 1,684,528 | |
| | | | | | | | | | | | | | | | |
| | | | |
| Health Revenue: 0.01% | | | | | | | | | | | | |
| | | | |
West Park Hospital District Wyoming Series B | | | 6.50 | | | | 6-1-2027 | | | | 500,000 | | | | 534,625 | |
| | | | | | | | | | | | | | | | |
| | | | |
| | | | | | | | | | | | | | | 2,219,153 | |
| | | | | | | | | | | | | | | | |
| | | | |
Total Municipal Obligations (Cost $4,552,443,574) | | | | | | | | | | | | | | | 4,787,757,205 | |
| | | | | | | | | | | | | | | | |
46 | Wells Fargo Municipal Bond Fund
Portfolio of investments—June 30, 2019
| | | | | | | | | | | | | | | | |
| | | | | | | | | Shares | | | Value | |
| Closed End Municipal Bond Funds | | | | | | | | | | | | |
| | | | |
| California: 0.21% | | | | | | | | | | | | |
| | | | |
Nuveen California AMT-Free Quality Municipal Income Fund Variable Rate Demand Preferred Shares Series A 2.20% 144A | | | | | | | | | | | 10,600,000 | | | $ | 10,600,000 | |
| | | | | | | | | | | | | | | | |
| | | | |
Total Closed End Municipal Bond Funds (Cost $10,600,000) | | | | | | | | | | | | | | | 10,600,000 | |
| | | | | | | | | | | | | | | | |
| | | | |
| | | | | | | | | | | | | | | | |
| | | Yield | | | | | | | | | | |
| Short-Term Investments: 0.48% | |
|
| Investment Companies: 0.48% | |
| | | | |
Wells Fargo Municipal Cash Management Money Market Fund Institutional Class (l)(u)## | | | 1.82 | % | | | | | | | 24,261,736 | | | | 24,276,293 | |
| | | | | | | | | | | | | | | | |
| | | | |
Total Short-Term Investments (Cost $24,275,636) | | | | | | | | | | | | | | | 24,276,293 | |
| | | | | | | | | | | | | | | | |
| | | | | | | | |
| Total investments in securities (Cost $4,812,029,437) | | | 99.57 | % | | | 5,050,917,651 | |
| | |
Other assets and liabilities, net | | | 0.43 | | | | 21,771,259 | |
| | | | | | | | |
| Total net assets | | | 100.00 | % | | $ | 5,072,688,910 | |
| | | | | | | | |
| ø | Variable rate demand notes are subject to a demand feature which reduces the effective maturity. The maturity date shown represents the final maturity date of the security. The interest rate is determined and reset by the issuer daily, weekly, or monthly depending upon the terms of the security. The rate shown is the rate in effect at period end. |
| ¤ | The security is issued in zero coupon form with no periodic interest payments. |
| 144A | The security may be resold in transactions exempt from registration, normally to qualified institutional buyers, pursuant to Rule 144A under the Securities Act of 1933. |
| ± | Variable rate investment. The rate shown is the rate in effect at period end. |
| %% | The security is purchased on a when-issued basis. |
| †† | On the last interest date, partial interest was paid. |
| (l) | The issuer of the security is an affiliated person of the Fund as defined in the Investment Company Act of 1940. |
| (u) | The rate represents the 7-day annualized yield at period end. |
| ## | All or a portion of this security is segregated for when-issued securities. |
Abbreviations:
| AGC | Assured Guaranty Corporation |
| AGM | Assured Guaranty Municipal |
| Ambac | Ambac Financial Group Incorporated |
| AMT | Alternative minimum tax |
| BAN | Bond anticipation notes |
| CAB | Capital appreciation bond |
| CCAB | Convertible capital appreciation bond |
| CDA | Community Development Authority |
| ECFA | Educational & Cultural Facilities Authority |
| EDA | Economic Development Authority |
| EDFA | Economic Development Finance Authority |
| FGIC | Financial Guaranty Insurance Corporation |
| FHLMC | Federal Home Loan Mortgage Corporation |
| FNMA | Federal National Mortgage Association |
| GNMA | Government National Mortgage Association |
| HCFR | Healthcare facilities revenue |
| HEFA | Health & Educational Facilities Authority |
| HEFAR | Higher Education Facilities Authority Revenue |
| HFA | Housing Finance Authority |
| HUD | Department of Housing and Urban Development |
Wells Fargo Municipal Bond Fund | 47
Portfolio of investments—June 30, 2019
| IDA | Industrial Development Authority |
| LIBOR | London Interbank Offered Rate |
| National | National Public Finance Guarantee Corporation |
| PCFA | Pollution Control Financing Authority |
| PCR | Pollution control revenue |
| PFA | Public Finance Authority |
| RDA | Redevelopment Authority |
| SFMR | Single-family mortgage revenue |
| SIFMA | Securities Industry and Financial Markets Association |
| SPA | Standby purchase agreement |
| TTFA | Transportation Trust Fund Authority |
Investments in Affiliates
An affiliated investment is an investment in which the Fund owns at least 5% of the outstanding voting shares of the issuer or as a result of other relationships, such as the Fund and the issuer having the same investment manager. Transactions with issuers that were either affiliated persons of the Fund at the beginning of the period or the end of the period were as follows:
| | | | | | | | | | | | | | | | | | | | | | | | | | | | | | | | | | | | |
| | | Shares,
beginning of
period | | | Shares
purchased | | | Shares sold | | | Shares,
end of
period | | | Net
realized
gains
(losses) | | | Net
change in
unrealized
gains
(losses) | | | Income
from
affiliated
securities | | | Value, end
of period | | | % of
net
assets | |
Short-Term Investments | | | | | | | | | | | | | | | | | | | | | | | | | | | | | | | | | | | | |
Investment Companies | | | | | | | | | | | | | | | | | | | | | | | | | | | | | | | | | | | | |
Wells Fargo Municipal Cash Management Money Market Fund Institutional Class | | | 10,597,584 | | | | 1,250,041,596 | | | | 1,236,377,444 | | | | 24,261,736 | | | $ | (1,695 | ) | | $ | 485 | | | $ | 336,680 | | | $ | 24,276,293 | | | | 0.48 | % |
48 | Wells Fargo Municipal Bond Fund
Statement of assets and liabilities—June 30, 2019
| | | | |
| | | | |
| |
Assets | | | | |
Investments in unaffiliated securities, at value (cost $4,787,753,801) | | $ | 5,026,641,358 | |
Investments in affiliated securities, at value (cost $24,275,636) | | | 24,276,293 | |
Cash | | | 1,909 | |
Receivable for investments sold | | | 5,430,175 | |
Receivable for Fund shares sold | | | 6,485,553 | |
Receivable for interest | | | 48,317,375 | |
Prepaid expenses and other assets | | | 623,968 | |
| | | | |
Total assets | | | 5,111,776,631 | |
| | | | |
| |
Liabilities | | | | |
Payable for investments purchased | | | 28,328,553 | |
Payable for Fund shares redeemed | | | 7,060,779 | |
Dividends payable | | | 1,398,382 | |
Management fee payable | | | 1,321,432 | |
Administration fees payable | | | 432,780 | |
Distribution fee payable | | | 60,667 | |
Trustees’ fees and expenses payable | | | 1,284 | |
Accrued expenses and other liabilities | | | 483,844 | |
| | | | |
Total liabilities | | | 39,087,721 | |
| | | | |
Total net assets | | $ | 5,072,688,910 | |
| | | | |
| |
Net assets consist of | | | | |
Paid-in capital | | $ | 4,834,500,859 | |
Total distributable earnings | | | 238,188,051 | |
| | | | |
Total net assets | | $ | 5,072,688,910 | |
| | | | |
| |
Computation of net asset value and offering price per share | | | | |
Net assets – Class A | | $ | 1,206,717,195 | |
Shares outstanding – Class A1 | | | 114,374,117 | |
Net asset value per share – Class A | | | $10.55 | |
Maximum offering price per share – Class A2 | | | $11.05 | |
Net assets – Class C | | $ | 98,410,945 | |
Shares outstanding – Class C1 | | | 9,331,126 | |
Net asset value per share – Class C | | | $10.55 | |
Net assets – Class R6 | | $ | 72,654,501 | |
Shares outstanding – Class R61 | | | 6,885,512 | |
Net asset value per share – Class R6 | | | $10.55 | |
Net assets – Administrator Class | | $ | 832,318,275 | |
Shares outstanding – Administrator Class1 | | | 78,862,042 | |
Net asset value per share – Administrator Class | | | $10.55 | |
Net assets – Institutional Class | | $ | 2,862,587,994 | |
Shares outstanding – Institutional Class1 | | | 271,340,121 | |
Net asset value per share – Institutional Class | | | $10.55 | |
| 1 | The Fund has an unlimited number of authorized shares. |
| 2 | Maximum offering price is computed as 100/95.50 of net asset value. On investments of $50,000 or more, the offering price is reduced. |
The accompanying notes are an integral part of these financial statements.
Wells Fargo Municipal Bond Fund | 49
Statement of operations—year ended June 30, 2019
| | | | |
| | | | |
| |
Investment income | | | | |
Interest | | $ | 132,506,569 | |
Dividends | | | 759,151 | |
Income from affiliated securities | | | 336,680 | |
| | | | |
Total investment income | | | 133,602,400 | |
| | | | |
| |
Expenses | | | | |
Management fee | | | 13,118,637 | |
Administration fees | | | | |
Class A | | | 1,856,012 | |
Class C | | | 182,434 | |
Class R6 | | | 9,575 | 1 |
Administrator Class | | | 615,583 | |
Institutional Class | | | 1,416,098 | |
Shareholder servicing fees | | | | |
Class A | | | 2,900,018 | |
Class C | | | 285,053 | |
Administrator Class | | | 1,537,650 | |
Distribution fee | | | | |
Class C | | | 855,159 | |
Custody and accounting fees | | | 126,170 | |
Professional fees | | | 86,068 | |
Registration fees | | | 194,674 | |
Shareholder report expenses | | | 140,819 | |
Trustees’ fees and expenses | | | 21,275 | |
Other fees and expenses | | | 40,603 | |
| | | | |
Total expenses | | | 23,385,828 | |
Less: Fee waivers and/or expense reimbursements | | | (1,162,873 | ) |
| | | | |
Net expenses | | | 22,222,955 | |
| | | | |
Net investment income | | | 111,379,445 | |
| | | | |
| |
Realized and unrealized gains (losses) on investments | | | | |
Net realized gains (losses) on: | | | | |
Unaffiliated securities | | | 5,841,114 | |
Affiliated securities | | | (1,695 | ) |
Futures contracts | | | 2,262,804 | |
| | | | |
Net realized gains on investments | | | 8,102,223 | |
| | | | |
| |
Net change in unrealized gains (losses) on: | | | | |
Unaffiliated securities | | | 141,180,688 | |
Affiliated securities | | | 485 | |
| | | | |
Net change in unrealized gains (losses) on investments | | | 141,181,173 | |
| | | | |
Net realized and unrealized gains (losses) on investments | | | 149,283,396 | |
| | | | |
Net increase in net assets resulting from operations | | $ | 260,662,841 | |
| | | | |
| 1 | For the period from July 31, 2018 (commencement of class operations) to June 30, 2019 |
The accompanying notes are an integral part of these financial statements.
50 | Wells Fargo Municipal Bond Fund
Statement of changes in net assets
| | | | | | | | | | | | | | | | |
| | | Year ended June 30, 2019 | | | Year ended June 30, 20181 | |
| | | | |
Operations | | | | | | | | | | | | | | | | |
Net investment income | | | | | | $ | 111,379,445 | | | | | | | $ | 88,997,373 | |
Net realized gains on investments | | | | | | | 8,102,223 | | | | | | | | 1,726,727 | |
Net change in unrealized gains (losses) on investments | | | | | | | 141,181,173 | | | | | | | | (5,965,184 | ) |
| | | | |
Net increase in net assets resulting from operations | | | | | | | 260,662,841 | | | | | | | | 84,758,916 | |
| | | | |
| | | | |
Distributions to shareholders from net investment income and net realized gains | | | | | | | | | | | | | | | | |
Class A | | | | | | | (33,496,628 | ) | | | | | | | (40,706,034 | ) |
Class C | | | | | | | (2,452,735 | ) | | | | | | | (3,631,086 | ) |
Class R6 | | | | | | | (1,008,740 | )2 | | | | | | | N/A | |
Administrator Class | | | | | | | (18,574,895 | ) | | | | | | | (4,561,156 | ) |
Institutional Class | | | | | | | (55,765,959 | ) | | | | | | | (46,129,775 | ) |
| | | | |
Total distributions to shareholders | | | | | | | (111,298,957 | ) | | | | | | | (95,028,051 | ) |
| | | | |
| | | | |
Capital share transactions | | | Shares | | | | | | | | Shares | | | | | |
Proceeds from shares sold | | | | | | | | | | | | | | | | |
Class A | | | 10,207,001 | | | | 104,731,394 | | | | 9,607,411 | | | | 98,713,016 | |
Class C | | | 1,091,183 | | | | 11,211,311 | | | | 1,091,279 | | | | 11,235,517 | |
Class R6 | | | 7,773,111 | 2 | | | 79,416,075 | 2 | | | N/A | | | | N/A | |
Administrator Class | | | 65,531,996 | | | | 662,326,993 | | | | 14,191,031 | | | | 144,623,050 | |
Institutional Class | | | 182,281,519 | | | | 1,881,539,606 | | | | 56,339,637 | | | | 577,870,177 | |
| | | | |
| | | | | | | 2,739,225,379 | | | | | | | | 832,441,760 | |
| | | | |
Reinvestment of distributions | | | | | | | | | | | | | | | | |
Class A | | | 2,863,370 | | | | 29,385,655 | | | | 3,487,196 | | | | 35,780,840 | |
Class C | | | 214,607 | | | | 2,196,994 | | | | 317,077 | | | | 3,252,773 | |
Class R6 | | | 53 | 2 | | | 556 | 2 | | | N/A | | | | N/A | |
Administrator Class | | | 1,744,840 | | | | 17,964,156 | | | | 402,677 | | | | 4,127,649 | |
Institutional Class | | | 4,420,261 | | | | 45,500,840 | | | | 3,728,548 | | | | 38,233,492 | |
| | | | |
| | | | | | | 95,048,201 | | | | | | | | 81,394,754 | |
| | | | |
Payment for shares redeemed | | | | | | | | | | | | | | | | |
Class A | | | (19,298,194 | ) | | | (197,545,478 | ) | | | (18,978,396 | ) | | | (194,665,238 | ) |
Class C | | | (5,723,382 | ) | | | (58,571,623 | ) | | | (2,964,994 | ) | | | (30,428,033 | ) |
Class R6 | | | (887,652 | )2 | | | (9,156,468 | )2 | | | N/A | | | | N/A | |
Administrator Class | | | (12,413,823 | ) | | | (127,080,850 | ) | | | (2,961,504 | ) | | | (30,373,516 | ) |
Institutional Class | | | (58,145,370 | ) | | | (593,888,764 | ) | | | (32,651,728 | ) | | | (334,789,494 | ) |
| | | | |
| | | | | | | (986,243,183 | ) | | | | | | | (590,256,281 | ) |
| | | | |
Net asset value of shares issued in acquisition | | | | | | | | | | | | | | | | |
Class A | | | 5,041,496 | | | | 51,955,343 | | | | 0 | | | | 0 | |
Class C | | | 764,390 | | | | 7,874,457 | | | | 0 | | | | 0 | |
Administrator Class | | | 1,758,364 | | | | 18,126,777 | | | | 0 | | | | 0 | |
Institutional Class | | | 3,124,015 | | | | 32,190,161 | | | | 0 | | | | 0 | |
| | | | |
| | | | | | | 110,146,738 | | | | | | | | 0 | |
| | | | |
Net increase in net assets resulting from capital share transactions | | | | | | | 1,958,177,135 | | | | | | | | 323,580,233 | |
| | | | |
Total increase in net assets | | | | | | | 2,107,541,019 | | | | | | | | 313,311,098 | |
| | | | |
| | | | |
Net assets | | | | | | | | | | | | | | | | |
Beginning of period | | | | | | | 2,965,147,891 | | | | | | | | 2,651,836,793 | |
| | | | |
End of period | | | | | | $ | 5,072,688,910 | | | | | | | $ | 2,965,147,891 | |
| | | | |
| 1 | Effective for all filings after November 4, 2018, the SEC prospectively eliminated the requirement to parenthetically disclose undistributed net investment income at the end of the period and permitted the aggregation of distributions, with the exception of tax basis returns of capital. Overdistributed net investment income at June 30, 2018 was $845,178. The disaggregated distributions information for the year ended June 30, 2018 is included in Note 9,Distributions to Shareholders, in the notes to the financial statements. |
| 2 | For the period from July 31, 2018 (commencement of class operations) to June 30, 2019 |
The accompanying notes are an integral part of these financial statements.
Wells Fargo Municipal Bond Fund | 51
Financial highlights
(For a share outstanding throughout each period)
| | | | | | | | | | | | | | | | | | | | |
| | | Year ended June 30 | |
| CLASS A | | 2019 | | | 2018 | | | 2017 | | | 2016 | | | 2015 | |
Net asset value, beginning of period | | | $10.21 | | | | $10.25 | | | | $10.70 | | | | $10.25 | | | | $10.33 | |
Net investment income | | | 0.30 | 1 | | | 0.32 | | | | 0.33 | | | | 0.31 | | | | 0.28 | |
Net realized and unrealized gains (losses) on investments | | | 0.34 | | | | (0.02 | ) | | | (0.38 | ) | | | 0.50 | | | | 0.01 | |
| | | | | | | | | | | | | | | | | | | | |
Total from investment operations | | | 0.64 | | | | 0.30 | | | | (0.05 | ) | | | 0.81 | | | | 0.29 | |
Distributions to shareholders from | | | | | | | | | | | | | | | | | | | | |
Net investment income | | | (0.30 | ) | | | (0.32 | ) | | | (0.33 | ) | | | (0.31 | ) | | | (0.28 | ) |
Net realized gains | | | 0.00 | | | | (0.02 | ) | | | (0.07 | ) | | | (0.05 | ) | | | (0.09 | ) |
| | | | | | | | | | | | | | | | | | | | |
Total distributions to shareholders | | | (0.30 | ) | | | (0.34 | ) | | | (0.40 | ) | | | (0.36 | ) | | | (0.37 | ) |
Net asset value, end of period | | | $10.55 | | | | $10.21 | | | | $10.25 | | | | $10.70 | | | | $10.25 | |
Total return2 | | | 6.35 | % | | | 2.97 | % | | | (0.47 | )% | | | 8.04 | % | | | 2.81 | % |
Ratios to average net assets (annualized) | | | | | | | | | | | | | | | | | | | | |
Gross expenses | | | 0.78 | % | | | 0.79 | % | | | 0.79 | % | | | 0.79 | % | | | 0.80 | % |
Net expenses | | | 0.75 | % | | | 0.75 | % | | | 0.75 | % | | | 0.75 | % | | | 0.75 | % |
Net investment income | | | 2.89 | % | | | 3.10 | % | | | 3.13 | % | | | 2.99 | % | | | 2.71 | % |
Supplemental data | | | | | | | | | | | | | | | | | | | | |
Portfolio turnover rate | | | 20 | % | | | 19 | % | | | 24 | % | | | 16 | % | | | 27 | % |
Net assets, end of period (000s omitted) | | | $1,206,717 | | | | $1,179,800 | | | | $1,244,267 | | | | $1,529,884 | | | | $1,612,212 | |
| 1 | Calculated based upon average shares outstanding |
| 2 | Total return calculations do not include any sales charges. |
The accompanying notes are an integral part of these financial statements.
52 | Wells Fargo Municipal Bond Fund
Financial highlights
(For a share outstanding throughout each period)
| | | | | | | | | | | | | | | | | | | | |
| | | Year ended June 30 | |
| CLASS C | | 2019 | | | 2018 | | | 2017 | | | 2016 | | | 2015 | |
Net asset value, beginning of period | | | $10.21 | | | | $10.24 | | | | $10.69 | | | | $10.25 | | | | $10.33 | |
Net investment income | | | 0.22 | | | | 0.24 | | | | 0.25 | | | | 0.23 | | | | 0.20 | |
Net realized and unrealized gains (losses) on investments | | | 0.34 | | | | (0.01 | ) | | | (0.38 | ) | | | 0.49 | | | | 0.01 | |
| | | | | | | | | | | | | | | | | | | | |
Total from investment operations | | | 0.56 | | | | 0.23 | | | | (0.13 | ) | | | 0.72 | | | | 0.21 | |
Distributions to shareholders from | | | | | | | | | | | | | | | | | | | | |
Net investment income | | | (0.22 | ) | | | (0.24 | ) | | | (0.25 | ) | | | (0.23 | ) | | | (0.20 | ) |
Net realized gains | | | 0.00 | | | | (0.02 | ) | | | (0.07 | ) | | | (0.05 | ) | | | (0.09 | ) |
| | | | | | | | | | | | | | | | | | | | |
Total distributions to shareholders | | | (0.22 | ) | | | (0.26 | ) | | | (0.32 | ) | | | (0.28 | ) | | | (0.29 | ) |
Net asset value, end of period | | | $10.55 | | | | $10.21 | | | | $10.24 | | | | $10.69 | | | | $10.25 | |
Total return1 | | | 5.56 | % | | | 2.30 | % | | | (1.21 | )% | | | 7.14 | % | | | 2.05 | % |
Ratios to average net assets (annualized) | | | | | | | | | | | | | | | | | | | | |
Gross expenses | | | 1.53 | % | | | 1.54 | % | | | 1.54 | % | | | 1.54 | % | | | 1.55 | % |
Net expenses | | | 1.50 | % | | | 1.50 | % | | | 1.50 | % | | | 1.50 | % | | | 1.50 | % |
Net investment income | | | 2.15 | % | | | 2.35 | % | | | 2.38 | % | | | 2.24 | % | | | 1.97 | % |
Supplemental data | | | | | | | | | | | | | | | | | | | | |
Portfolio turnover rate | | | 20 | % | | | 19 | % | | | 24 | % | | | 16 | % | | | 27 | % |
Net assets, end of period (000s omitted) | | | $98,411 | | | | $132,529 | | | | $148,944 | | | | $186,036 | | | | $164,703 | |
| 1 | Total return calculations do not include any sales charges. |
The accompanying notes are an integral part of these financial statements.
Wells Fargo Municipal Bond Fund | 53
Financial highlights
(For a share outstanding throughout the period)
| | | | |
| CLASS R6 | | Year ended
June 30 20191 | |
Net asset value, beginning of period | | | $10.21 | |
Net investment income | | | 0.30 | |
Net realized and unrealized gains (losses) on investments | | | 0.34 | |
| | | | |
Total from investment operations | | | 0.64 | |
Distributions to shareholders from | | | | |
Net investment income | | | (0.30 | ) |
Net asset value, end of period | | | $10.55 | |
Total return2 | | | 6.43 | % |
Ratios to average net assets (annualized) | | | | |
Gross expenses | | | 0.40 | % |
Net expenses | | | 0.40 | % |
Net investment income | | | 3.16 | % |
Supplemental data | | | | |
Portfolio turnover rate | | | 20 | % |
Net assets, end of period (000s omitted) | | | $72,655 | |
| 1 | For the period from July 31, 2018 (commencement of class operations) to June 30, 2019. |
| 2 | Returns for periods of less than one year are not annualized. |
The accompanying notes are an integral part of these financial statements.
54 | Wells Fargo Municipal Bond Fund
Financial highlights
(For a share outstanding throughout each period)
| | | | | | | | | | | | | | | | | | | | |
| | | Year ended June 30 | |
| ADMINISTRATOR CLASS | | 2019 | | | 2018 | | | 2017 | | | 2016 | | | 2015 | |
Net asset value, beginning of period | | | $10.21 | | | | $10.25 | | | | $10.70 | | | | $10.26 | | | | $10.34 | |
Net investment income | | | 0.31 | 1 | | | 0.33 | 1 | | | 0.34 | | | | 0.33 | | | | 0.30 | |
Net realized and unrealized gains (losses) on investments | | | 0.34 | | | | (0.02 | ) | | | (0.38 | ) | | | 0.49 | | | | 0.01 | |
| | | | | | | | | | | | | | | | | | | | |
Total from investment operations | | | 0.65 | | | | 0.31 | | | | (0.04 | ) | | | 0.82 | | | | 0.31 | |
Distributions to shareholders from | | | | | | | | | | | | | | | | | | | | |
Net investment income | | | (0.31 | ) | | | (0.33 | ) | | | (0.34 | ) | | | (0.33 | ) | | | (0.30 | ) |
Net realized gains | | | 0.00 | | | | (0.02 | ) | | | (0.07 | ) | | | (0.05 | ) | | | (0.09 | ) |
| | | | | | | | | | | | | | | | | | | | |
Total distributions to shareholders | | | (0.31 | ) | | | (0.35 | ) | | | (0.41 | ) | | | (0.38 | ) | | | (0.39 | ) |
Net asset value, end of period | | | $10.55 | | | | $10.21 | | | | $10.25 | | | | $10.70 | | | | $10.26 | |
Total return | | | 6.51 | % | | | 3.13 | % | | | (0.32 | )% | | | 8.10 | % | | | 2.97 | % |
Ratios to average net assets (annualized) | | | | | | | | | | | | | | | | | | | | |
Gross expenses | | | 0.72 | % | | | 0.73 | % | | | 0.73 | % | | | 0.73 | % | | | 0.73 | % |
Net expenses | | | 0.60 | % | | | 0.60 | % | | | 0.60 | % | | | 0.60 | % | | | 0.60 | % |
Net investment income | | | 3.02 | % | | | 3.27 | % | | | 3.18 | % | | | 3.15 | % | | | 2.86 | % |
Supplemental data | | | | | | | | | | | | | | | | | | | | |
Portfolio turnover rate | | | 20 | % | | | 19 | % | | | 24 | % | | | 16 | % | | | 27 | % |
Net assets, end of period (000s omitted) | | | $832,318 | | | | $227,116 | | | | $108,715 | | | | $270,304 | | | | $384,884 | |
| 1 | Calculated based upon average shares outstanding |
The accompanying notes are an integral part of these financial statements.
Wells Fargo Municipal Bond Fund | 55
Financial highlights
(For a share outstanding throughout each period)
| | | | | | | | | | | | | | | | | | | | |
| | | Year ended June 30 | |
| INSTITUTIONAL CLASS | | 2019 | | | 2018 | | | 2017 | | | 2016 | | | 2015 | |
Net asset value, beginning of period | | | $10.21 | | | | $10.24 | | | | $10.70 | | | | $10.25 | | | | $10.33 | |
Net investment income | | | 0.33 | | | | 0.35 | | | | 0.36 | | | | 0.34 | | | | 0.31 | |
Net realized and unrealized gains (losses) on investments | | | 0.34 | | | | (0.01 | ) | | | (0.39 | ) | | | 0.50 | | | | 0.01 | |
| | | | | | | | | | | | | | | | | | | | |
Total from investment operations | | | 0.67 | | | | 0.34 | | | | (0.03 | ) | | | 0.84 | | | | 0.32 | |
Distributions to shareholders from | | | | | | | | | | | | | | | | | | | | |
Net investment income | | | (0.33 | ) | | | (0.35 | ) | | | (0.36 | ) | | | (0.34 | ) | | | (0.31 | ) |
Net realized gains | | | 0.00 | | | | (0.02 | ) | | | (0.07 | ) | | | (0.05 | ) | | | (0.09 | ) |
| | | | | | | | | | | | | | | | | | | | |
Total distributions to shareholders | | | (0.33 | ) | | | (0.37 | ) | | | (0.43 | ) | | | (0.39 | ) | | | (0.40 | ) |
Net asset value, end of period | | | $10.55 | | | | $10.21 | | | | $10.24 | | | | $10.70 | | | | $10.25 | |
Total return | | | 6.67 | % | | | 3.37 | % | | | (0.28 | )% | | | 8.35 | % | | | 3.11 | % |
Ratios to average net assets (annualized) | | | | | | | | | | | | | | | | | | | | |
Gross expenses | | | 0.45 | % | | | 0.46 | % | | | 0.46 | % | | | 0.46 | % | | | 0.47 | % |
Net expenses | | | 0.45 | % | | | 0.46 | % | | | 0.46 | % | | | 0.46 | % | | | 0.47 | % |
Net investment income | | | 3.15 | % | | | 3.40 | % | | | 3.44 | % | | | 3.27 | % | | | 3.02 | % |
Supplemental data | | | | | | | | | | | | | | | | | | | | |
Portfolio turnover rate | | | 20 | % | | | 19 | % | | | 24 | % | | | 16 | % | | | 27 | % |
Net assets, end of period (000s omitted) | | | $2,862,588 | | | | $1,425,703 | | | | $1,149,911 | | | | $961,289 | | | | $523,736 | |
The accompanying notes are an integral part of these financial statements.
56 | Wells Fargo Municipal Bond Fund
Notes to financial statements
1. ORGANIZATION
Wells Fargo Funds Trust (the “Trust”), a Delaware statutory trust organized on March 10, 1999, is an open-end management investment company registered under the Investment Company Act of 1940, as amended (the “1940 Act”). As an investment company, the Trust follows the accounting and reporting guidance in Financial Accounting Standards Board (“FASB”) Accounting Standards Codification Topic 946, Financial Services – Investment Companies. These financial statements report on the Wells Fargo Municipal Bond Fund (the “Fund”) which is a diversified series of the Trust.
2. SIGNIFICANT ACCOUNTING POLICIES
The following significant accounting policies, which are consistently followed in the preparation of the financial statements of the Fund, are in conformity with U.S. generally accepted accounting principles which require management to make estimates and assumptions that affect the reported amounts of assets and liabilities, disclosure of contingent assets and liabilities at the date of the financial statements, and the reported amounts of revenues and expenses during the reporting period. Actual results could differ from those estimates.
Securities valuation
All investments are valued each business day as of the close of regular trading on the New York Stock Exchange (generally 4 p.m. Eastern Time), although the Fund may deviate from this calculation time under unusual or unexpected circumstances.
Debt securities are valued at the evaluated bid price provided by an independent pricing service (e.g. taking into account various factors, including yields, maturities, or credit ratings) or, if a reliable price is not available, the quoted bid price from an independent broker-dealer.
Equity securities and futures contracts that are listed on a foreign or domestic exchange or market are valued at the official closing price or, if none, the last sales price. If no sale occurs on the principal exchange or market that day, a fair value price will be determined in accordance with the Fund’s Valuation Procedures.
Swap contracts are valued at the evaluated price provided by an independent pricing service or, if a reliable price is not available, the quoted bid price from an independent broker-dealer.
Investments in registered open-end investment companies are valued at net asset value.
Investments which are not valued using any of the methods discussed above are valued at their fair value, as determined in good faith by the Board of Trustees of the Fund. The Board of Trustees has established a Valuation Committee comprised of the Trustees and has delegated to it the authority to take any actions regarding the valuation of portfolio securities that the Valuation Committee deems necessary or appropriate, including determining the fair value of portfolio securities, unless the determination has been delegated to the Wells Fargo Asset Management Pricing Committee at Wells Fargo Funds Management, LLC (“Funds Management”). The Board of Trustees retains the authority to make or ratify any valuation decisions or approve any changes to the Valuation Procedures as it deems appropriate. On a quarterly basis, the Board of Trustees receives reports on any valuation actions taken by the Valuation Committee or the Wells Fargo Asset Management Pricing Committee which may include items for ratification.
When-issued transactions
The Fund may purchase securities on a forward commitment or when-issued basis. The Fund records a when-issued transaction on the trade date and will segregate assets in an amount at least equal in value to the Fund’s commitment to purchase when-issued securities. Securities purchased on a when-issued basis are marked-to-market daily and the Fund begins earning interest on the settlement date. Losses may arise due to changes in the market value of the underlying securities or if the counterparty does not perform under the contract.
Futures contracts
Futures contracts are agreements between the Fund and a counterparty to buy or sell a specific amount of a commodity, financial instrument or currency at a specified price and on a specified date. The Fund may buy and sell futures contracts in order to gain exposure to, or protect against, changes in interest rates and is subject to interest rate risk. The primary risks associated with the use of futures contracts are the imperfect correlation between changes in market values of securities held by the Fund and the prices of futures contracts, and the possibility of an illiquid market. Futures contracts are generally entered into on a regulated futures exchange and cleared through a clearinghouse associated with the exchange. With futures contracts, there is minimal counterparty risk to the Fund since futures contracts are exchange traded and the exchange’s clearinghouse, as the counterparty to all exchange traded futures, guarantees the futures contracts against default.
Upon entering into a futures contracts, the Fund is required to deposit either cash or securities (initial margin) with the broker in an amount equal to a certain percentage of the contract value. Subsequent payments (variation margin) are paid to or from the broker each day equal to the daily changes in the contract value. Such payments are recorded as unrealized gains or losses
Wells Fargo Municipal Bond Fund | 57
Notes to financial statements
and, if any, shown as variation margin receivable (payable) in the Statement of Assets and Liabilities. Should the Fund fail to make requested variation margin payments, the broker can gain access to the initial margin to satisfy the Fund’s payment obligations. When the contracts are closed, a realized gain or loss is recorded in the Statement of Operations.
Swap contracts
Swap contracts are agreements between the Fund and a counterparty to exchange a series of cash flows over a specified period. Swap agreements are privately negotiated contracts between the Fund and a counterparty in the OTC market and may be entered into as a bilateral contract (“OTC swaps”) or centrally cleared (“centrally cleared swaps”) with a central clearinghouse.
For OTC swaps, any upfront premiums paid and any upfront fees received are shown as swap premiums paid and swap premiums received, respectively, in the Statement of Assets and Liabilities and amortized over the term of the contract. The daily fluctuations in market value are recorded as unrealized gains or losses on OTC swaps in the Statement of Assets and Liabilities. Payments received or paid are recorded in the Statement of Operations as realized gains or losses, respectively. When an OTC swap is terminated, a realized gain or loss is recorded in the Statement of Operations equal to the difference between the proceeds from (or cost of) the closing transaction and the Fund’s basis in the contract, if any. Generally, the basis of the contract is the premium received or paid.
In a centrally cleared swap, immediately following execution of the swap contract, the swap contract is novated to a central counterparty (the “CCP”) and the Fund’s counterparty on the swap agreement becomes the CCP. Upon entering into a centrally cleared swap, the Fund is required to deposit an initial margin with the broker in the form of cash or securities. Securities deposited as initial margin are designated in the Portfolio of Investments and cash deposited is shown as cash segregated for centrally cleared swaps in the Statement of Assets and Liabilities. Pursuant to the contract, the Fund agrees to receive from or pay to the broker an amount of cash equal to the daily fluctuation in market value of the contract (“variation margin”). The variation margin is recorded as an unrealized gain (or loss) and shown as variation margin receivable (or payable) on centrally cleared swaps in the Statement of Assets and Liabilities. Payments received from (paid to) the counterparty, including at termination, are recorded as realized gains (losses) in the Statement of Operations.
Credit default swaps
The Fund may enter into credit default swaps for hedging or speculative purposes to provide or receive a measure of protection against default on a referenced entity, obligation or index or a basket of single-name issuers or traded indexes. An index credit default swap references all the names in the index, and if a credit event is triggered, the credit event is settled based on that name’s weight in the index. Credit default swaps are agreements in which the protection buyer pays fixed periodic payments to the protection seller in consideration for a promise from the protection seller to make a specific payment should a negative credit event take place with respect to the referenced entity (e.g., bankruptcy, failure to pay, obligation acceleration, repudiation, moratorium or restructuring).
The Fund may enter into credit default swaps as either the seller of protection or the buyer of protection. If the Fund is the buyer of protection and a credit event occurs, the Fund will either receive from the seller an amount equal to the notional amount of the swap and deliver the referenced security or underlying securities comprising the index, or receive a net settlement of cash equal to the notional amount of the swap less the recovery value of the security or underlying securities comprising the index. If the Fund is the seller of protection and a credit event occurs, the Fund will either pay the buyer an amount equal to the notional amount of the swap and take delivery of the referenced security or underlying securities comprising the index or pay a net settlement of cash equal to the notional amount of the swap less the recovery value of the security or underlying securities comprising the index.
As the seller of protection, the Fund is subject to investment exposure on the notional amount of the swap and has assumed the risk of default of the underlying security or index. As the buyer of protection, the Fund could be exposed to risks if the seller of the protection defaults on its obligation to perform, or if there are unfavorable changes in the fluctuation of interest rates.
By entering into credit default swap contracts, the Fund is exposed to credit risk. In addition, certain credit default swap contracts entered into by the Fund provide for conditions that result in events of default or termination that enable the counterparty to the agreement to cause an early termination of the transactions under those agreements.
Security transactions and income recognition
Securities transactions are recorded on a trade date basis. Realized gains or losses are recorded on the basis of identified cost.
58 | Wells Fargo Municipal Bond Fund
Notes to financial statements
Interest income is accrued daily and bond discounts are accreted and premiums are amortized daily. To the extent debt obligations are placed on non-accrual status, any related interest income may be reduced by writing off interest receivables when the collection of all or a portion of interest has been determined to be doubtful based on consistently applied procedures and the fair value has decreased. If the issuer subsequently resumes interest payments or when the collectability of interest is reasonably assured, the debt obligation is removed from non-accrual status.
Distributions to shareholders
Distributions to shareholders from net investment income are declared daily and paid monthly. Distributions from net realized gains, if any, are recorded on the ex-dividend date and paid at least annually. Such distributions are determined in accordance with income tax regulations and may differ from U.S. generally accepted accounting principles. Dividend sources are estimated at the time of declaration. The tax character of distributions is determined as of the Fund’s fiscal year end. Therefore, a portion of the Fund’s distributions made prior to the Fund’s fiscal year end may be categorized as a tax return of capital at year end.
Federal and other taxes
The Fund intends to continue to qualify as a regulated investment company by distributing substantially all of its investment company taxable and tax-exempt income and any net realized capital gains (after reduction for capital loss carryforwards) sufficient to relieve it from all, or substantially all, federal income taxes. Accordingly, no provision for federal income taxes was required.
The Fund’s income and federal excise tax returns and all financial records supporting those returns for the prior three fiscal years are subject to examination by the federal and Delaware revenue authorities. Management has analyzed the Fund’s tax positions taken on federal, state, and foreign tax returns for all open tax years and does not believe that there are any uncertain tax positions that require recognition of a tax liability.
As of June 30, 2019, the aggregate cost of all investments for federal income tax purposes was $4,813,037,558 and the unrealized gains (losses) consisted of:
| | | | |
| |
Gross unrealized gains | | $ | 243,144,032 | |
| |
Gross unrealized losses | | | (5,263,939 | ) |
| |
Net unrealized gains | | $ | 237,880,093 | |
As of June 30, 2019, the Fund had capital loss carryforwards which consist of $788,407 in short-term capital losses.
Class allocations
The separate classes of shares offered by the Fund differ principally in applicable sales charges, distribution, shareholder servicing, and administration fees. Class specific expenses are charged directly to that share class. Investment income, common fund-level expenses, and realized and unrealized gains (losses) on investments are allocated daily to each class of shares based on the relative proportion of net assets of each class.
3. FAIR VALUATION MEASUREMENTS
Fair value measurements of investments are determined within a framework that has established a fair value hierarchy based upon the various data inputs utilized in determining the value of the Fund’s investments. The three-level hierarchy gives the highest priority to unadjusted quoted prices in active markets for identical assets or liabilities (Level 1) and the lowest priority to unobservable inputs (Level 3). The Fund’s investments are classified within the fair value hierarchy based on the lowest level of input that is significant to the fair value measurement. The inputs are summarized into three broad levels as follows:
| ∎ | | Level 1 – quoted prices in active markets for identical securities |
| ∎ | | Level 2 – other significant observable inputs (including quoted prices for similar securities, interest rates, prepayment speeds, credit risk, etc.) |
| ∎ | | Level 3 – significant unobservable inputs (including the Fund’s own assumptions in determining the fair value of investments) |
The inputs or methodologies used for valuing investments in securities are not necessarily an indication of the risk associated with investing in those securities.
Wells Fargo Municipal Bond Fund | 59
Notes to financial statements
The following is a summary of the inputs used in valuing the Fund’s assets and liabilities as of June 30, 2019:
| | | | | | | | | | | | | | | | |
| | | | |
| | | Quoted prices
(Level 1) | | | Other significant
observable inputs
(Level 2) | | | Significant
unobservable inputs (Level 3) | | | Total | |
| | | | |
Assets | | | | | | | | | | | | | | | | |
Investments in: | | | | | | | | | | | | | | | | |
| | | | |
Exchange-traded funds | | $ | 228,284,153 | | | $ | 0 | | | $ | 0 | | | $ | 228,284,153 | |
| | | | |
Municipal obligations | | | 0 | | | | 4,787,757,205 | | | | 0 | | | | 4,787,757,205 | |
| | | | |
Closed end municipal bond funds | | | 0 | | | | 10,600,000 | | | | 0 | | | | 10,600,000 | |
| | | | |
Short-term investments | | | | | | | | | | | | | | | | |
| | | | |
Investment companies | | | 24,276,293 | | | | 0 | | | | 0 | | | | 24,276,293 | |
| | | | |
Total assets | | $ | 252,560,446 | | | $ | 4,798,357,205 | | | $ | 0 | | | $ | 5,050,917,651 | |
Additional sector, industry or geographic detail is included in the Portfolio of Investments.
At June 30, 2019, the Fund did not have any transfers into/out of Level 3.
4. TRANSACTIONS WITH AFFILIATES AND OTHER EXPENSES
Management fee
Funds Management, an indirect wholly owned subsidiary of Wells Fargo & Company (“Wells Fargo”), is the manager of the Fund and provides advisory and fund-level administrative services under an investment management agreement. Under the investment management agreement, Funds Management is responsible for, among other services, implementing the investment objectives and strategies of the Fund, supervising the subadviser and providing fund-level administrative services in connection with the Fund’s operations. As compensation for its services under the investment management agreement, Funds Management is entitled to receive a management fee at the following annual rate based on the Fund’s average daily net assets:
| | | | |
| |
| Average daily net assets | | Management fee | |
| |
First $500 million | | | 0.400 | % |
| |
Next $500 million | | | 0.375 | |
| |
Next $2 billion | | | 0.350 | |
| |
Next $2 billion | | | 0.325 | |
| |
Next $5 million | | | 0.290 | |
| |
Over $10 billion | | | 0.280 | |
For the year ended June 30, 2019, the management fee was equivalent to an annual rate of 0.36% of the Fund’s average daily net assets.
Funds Management has retained the services of a subadviser to provide daily portfolio management to the Fund. The fee for subadvisory services is borne by Funds Management. Wells Capital Management Incorporated, an affiliate of Funds Management and an indirect wholly owned subsidiary of Wells Fargo, is the subadviser to the Fund and is entitled to receive a fee from Funds Management at an annual rate starting at 0.20% and declining to 0.10% as the average daily net assets of the Fund increase.
60 | Wells Fargo Municipal Bond Fund
Notes to financial statements
Administration fees
Under a class-level administration agreement, Funds Management provides class-level administrative services to the Fund, which includes paying fees and expenses for services provided by the transfer agent, sub-transfer agents, omnibus account servicers and record-keepers. As compensation for its services under the class-level administration agreement, Funds Management receives an annual fee which is calculated based on the average daily net assets of each class as follows:
| | |
| |
| | | Class-level
administration fee |
| |
Class A, Class C | | 0.16% |
| |
Class R6 | | 0.03 |
| |
Administrator Class | | 0.10 |
| |
Institutional Class | | 0.08 |
Funds Management has contractually waived and/or reimbursed management and administration fees to the extent necessary to maintain certain net operating expense ratios for the Fund. When each class of the Fund has exceeded its expense cap, Funds Management has waived fees and/or reimbursed expenses from fund-level expenses on a proportionate basis and then from class specific expenses. When only certain classes exceed their expense caps, waivers and/or reimbursements are applied against class specific expenses before fund-level expenses. Funds Management has committed through October 31, 2020 to waive fees and/or reimburse expenses to the extent necessary to cap the Fund’s expenses at 0.75% for Class A shares, 1.50% for Class C shares, 0.43% for Class R6 shares, 0.60% for Administrator Class Shares and 0.48% for Institutional Class shares. Prior to or after the commitment expiration date, the cap may be increased or the commitment to maintain the cap may be terminated only with the approval of the Board of Trustees.
Distribution fee
The Trust has adopted a distribution plan for Class C shares of the Fund pursuant to Rule 12b-1 under the 1940 Act. A distribution fee is charged to Class C shares and paid to Wells Fargo Funds Distributor, LLC (“Funds Distributor”), the principal underwriter, at an annual rate of 0.75% of the average daily net assets of Class C shares.
In addition, Funds Distributor is entitled to receive the front-end sales charge from the purchase of Class A shares and a contingent deferred sales charge on the redemption of certain Class A shares. Funds Distributor is also entitled to receive the contingent deferred sales charges from redemptions of Class C shares. For the year ended June 30, 2019, Funds Distributor received $27,027 from the sale of Class A shares and $431 in contingent deferred sales charges from redemptions of Class A shares. No contingent deferred sales charges were incurred by Class A shares for the year ended June 30, 2019.
Shareholder servicing fees
The Trust has entered into contracts with one or more shareholder servicing agents, whereby Class A, Class C, Administrator Class of the Fund are charged a fee at an annual rate of 0.25% of the average daily net assets of each respective class. A portion of these total shareholder servicing fees were paid to affiliates of Wells Fargo.
Interfund transactions
The Fund may purchase or sell portfolio investment securities to certain other Wells Fargo affiliates pursuant to Rule 17a-7 under the 1940 Act and under procedures adopted by the Board of Trustees. The procedures have been designed to ensure that these interfund transactions, which do not incur broker commissions, are effected at current market prices. Pursuant to these procedures, the Fund had $490,860,000 and $316,190,000 in interfund purchases and sales, respectively, during the year ended June 30, 2019.
5. INVESTMENT PORTFOLIO TRANSACTIONS
Purchases and sales of investments, excluding U.S. government obligations (if any) and short-term securities, for the year ended June 30, 2019 were $2,551,888,316 and $708,819,043, respectively.
6. DERIVATIVE TRANSACTIONS
During the year ended June 30, 2019, the Fund entered into futures contracts to take advantage of the differences between municipal and treasury yields and to help manage the duration of the portfolio. The Fund had an average notional amount of $54,583,106 in long futures contracts and $1,009,233 in short futures contracts during the year ended June 30, 2019.
The fair value, realized gains or losses and change in unrealized gains or losses, if any, on derivative instruments are reflected in the corresponding financial statement captions.
Wells Fargo Municipal Bond Fund | 61
Notes to financial statements
7. ACQUISTIONS
After the close of business on March 15, 2019, the Fund acquired the net assets of Wells Fargo Colorado Tax-Free Fund and Wells Fargo North Carolina Tax-Free Fund (collectively, the “Acquired Funds”). The purpose of the transactions was to combine three funds with similar investment objectives and strategies. The Fund became the accounting and performance survivor in the transaction. The acquisitions were accomplished by a tax-free exchange of all of the shares of the Acquired Funds for shares of the Fund. Shareholders holding Class A, Class C and Institutional Class shares of each Acquired Funds received Class A, Class C and Institutional Class shares, respectively, of the Fund in the reorganizations. Administrator Class shares of Wells Fargo Colorado Tax-Free Fund received Administrator Class shares of the Fund. The investment portfolio of Wells Fargo Colorado Tax-Free Fund and Wells Fargo North Carolina Tax-Free Fund with fair values of $67,159,606, and $39,269,320, respectively, and identified costs of $63,687,809, and $37,881,620, respectively, at March 15, 2019 were the principal assets acquired by the Fund. For financial reporting purposes, assets received and shares issued by the Fund were recorded at fair value; however, the cost basis of the investments received from the Acquired Funds were carried forward to align with ongoing reporting of the Fund’s realized and unrealized gains and losses with amounts distributable to shareholders for tax purposes. The value of net assets acquired, unrealized gains acquired, exchange ratio and number of shares issued were as follows:
| | | | | | | | | | | | | | | | | | |
| | | | |
| Acquired fund | | Value of net
assets
acquired | | | Unrealized
gains | | | Exchange
ratio | | | Number of shares issued |
Wells Fargo Colorado Tax-Free Fund | | $ | 69,585,137 | | | $ | 3,471,797 | | | | 1.04 | | | | 2,805,719 | | | Class A |
| | | | | | | | | | | 1.05 | | | | 578,776 | | | Class C |
| | | | | | | | | | | 1.04 | | | | 1,758,364 | | | Administrator Class |
| | | | | | | | | | | 1.05 | | | | 1,609,227 | | | Institutional Class |
Wells Fargo North Carolina Tax-Free Fund | | | 40,561,601 | | | | 1,387,700 | | | | 0.97 | | | | 2,235,777 | | | Class A |
| | | | | | | | | | | 0.97 | | | | 185,614 | | | Class C |
| | | | | | | | | | | 0.97 | | | | 1,514,788 | | | Institutional Class |
The aggregate net assets of the Fund immediately before and after the acquisitions were $3,786,391,719 and $3,896,538,457, respectively.
Assuming the acquisitions had been completed July 1, 2018, the beginning of the annual reporting period for the Fund, the pro forma results of operations for the year ended June 30, 2019 would have been as follows (unaudited):
| | | | |
| |
Net investment income | | $ | 114,397,248 | |
| |
Net realized and unrealized gains on investments | | $ | 149,990,955 | |
| |
Net increase in net assets resulting from operations | | $ | 264,388,203 | |
Because the combined investment portfolios have been managed as a single integrated portfolio since the acquisition was completed, it is not practicable to separate the amounts of revenue and earnings of the Acquired Funds that have been included in the Fund’s Statement of Operations since March 16, 2019.
8. BANK BORROWINGS
The Trust (excluding the money market funds), Wells Fargo Master Trust and Wells Fargo Variable Trust are parties to a $280,000,000 revolving credit agreement whereby the Fund is permitted to use bank borrowings for temporary or emergency purposes, such as to fund shareholder redemption requests. Interest under the credit agreement is charged to the Fund based on a borrowing rate equal to the higher of the Federal Funds rate in effect on that day plus 1.25% or the overnight LIBOR rate in effect on that day plus 1.25%. In addition, an annual commitment fee equal to 0.25% of the unused balance is allocated to each participating fund.
For the year ended June 30, 2019, there were no borrowings by the Fund under the agreement.
9. DISTRIBUTIONS TO SHAREHOLDERS
The tax character of distributions paid during the years ended June 30, 2019 and June 30, 2018 were as follows:
| | | | | | | | |
| | | Year ended June 30 | |
| | |
| | | 2019 | | | 2018 | |
| | |
Tax-exempt income | | $ | 111,298,957 | | | $ | 89,128,966 | |
| | |
Long-term capital gain | | | 0 | | | | 5,899,085 | |
62 | Wells Fargo Municipal Bond Fund
Notes to financial statements
As of June 30, 2019, the components of distributable earnings on a tax basis were as follows:
| | | | | | |
Undistributed ordinary income | | Undistributed tax-exempt income | | Unrealized gains | | Capital loss
carryforward |
| | | |
| $1,577,042 | | $1,018,256 | | $237,880,093 | | $(788,407) |
Effective for all filings after November 4, 2018, the Securities and Exchange Commission eliminated the requirement to separately state the components of distributions to shareholders under U.S. generally accepted accounting principles. The amounts of distributions to shareholders for the year ended June 30, 2018 were as follows:
| | | | | | | | |
| | |
| | | Net
investment income | | | Net
realized gains | |
| | |
Class A | | | $37,790,314 | | | | $2,915,720 | |
| | |
Class C | | | 3,290,591 | | | | 340,495 | |
| | |
Administrator Class | | | 4,313,164 | | | | 247,992 | |
| | |
Institutional Class | | | 43,127,825 | | | | 3,001,950 | |
10. INDEMNIFICATION
Under the Trust’s organizational documents, the officers and Trustees have been granted certain indemnification rights against certain liabilities that may arise out of performance of their duties to the Trust. Additionally, in the normal course of business, the Trust may enter into contracts with service providers that contain a variety of indemnification clauses. The Trust’s maximum exposure under these arrangements is dependent on future claims that may be made against the Fund and, therefore, cannot be estimated.
11. NEW ACCOUNTING PRONOUNCEMENTS
In August 2018, FASB issued Accounting Standards Update (“ASU”) No. 2018-13, Fair Value Measurement (Topic 820)Disclosure Framework—Changes to the Disclosure Requirements for Fair Value Measurement. ASU 2018-13 updates the disclosure requirements for fair value measurements by modifying or removing certain disclosures and adding certain new disclosures. The amendments are effective for fiscal years, and interim periods within those fiscal years, beginning after December 15, 2019. Early adoption is permitted. Management has adopted the removal and modification of disclosures early, as permitted, and will adopt the additional new disclosures at the effective date.
In March 2017, FASB issued ASU No. 2017-08,Premium Amortization on Purchased Callable Debt Securities. ASU 2017-08 shortens the amortization period for certain callable debt securities held at a premium and requires the premium to be amortized to the earliest call date. The amendments do not require an accounting change for securities held at a discount; and discounts will continue to be accreted to the maturity of the security. ASU 2017-08 is effective for fiscal years beginning after December 15, 2018 and for interim periods within those fiscal years. During the current reporting period, management of the Fund adopted the change in accounting policy which did not have a material impact to the Fund’s financial statements.
Wells Fargo Municipal Bond Fund | 63
Report of independent registered public accounting firm
TO THE SHAREHOLDERS OF THE FUND AND BOARD OF TRUSTEES OF WELLS FARGO FUNDS TRUST:
Opinion on the Financial Statements
We have audited the accompanying statement of assets and liabilities of Wells Fargo Municipal Bond Fund (the Fund), one of the funds constituting Wells Fargo Funds Trust, including the portfolio of investments, as of June 30, 2019, the related statement of operations for the year then ended, the statements of changes in net assets for each of the years in the two year period then ended, and the related notes (collectively, the financial statements) and the financial highlights for each of the years or periods in the five year period then ended. In our opinion, the financial statements and financial highlights present fairly, in all material respects, the financial position of the Fund as of June 30, 2019, the results of its operations for the year then ended, the changes in its net assets for each of the years in the two year period then ended, and the financial highlights for each of the years or periods in the five year period then ended, in conformity with U.S. generally accepted accounting principles.
Basis for Opinion
These financial statements and financial highlights are the responsibility of the Fund’s management. Our responsibility is to express an opinion on these financial statements and financial highlights based on our audits. We are a public accounting firm registered with the Public Company Accounting Oversight Board (United States) (PCAOB) and are required to be independent with respect to the Fund in accordance with the U.S. federal securities laws and the applicable rules and regulations of the Securities and Exchange Commission and the PCAOB.
We conducted our audits in accordance with the standards of the PCAOB. Those standards require that we plan and perform the audit to obtain reasonable assurance about whether the financial statements and financial highlights are free of material misstatement, whether due to error or fraud. Our audits included performing procedures to assess the risks of material misstatement of the financial statements and financial highlights, whether due to error or fraud, and performing procedures that respond to those risks. Such procedures included examining, on a test basis, evidence regarding the amounts and disclosures in the financial statements and financial highlights. Such procedures also included confirmation of securities owned as of June 30, 2019, by correspondence with the custodian and brokers, or by other appropriate auditing procedures. Our audits also included evaluating the accounting principles used and significant estimates made by management, as well as evaluating the overall presentation of the financial statements and financial highlights. We believe that our audits provide a reasonable basis for our opinion.

We have not been able to determine the specific year that we began serving as the auditor of one or more Wells Fargo Funds investment companies; however we are aware that we have served as the auditor of one or more Wells Fargo Funds investment companies since at least 1955.
Boston, Massachusetts
August 26, 2019
64 | Wells Fargo Municipal Bond Fund
Other information (unaudited)
TAX INFORMATION
For the fiscal year ended June 30, 2019, $128,005 has been designated as interest-related dividends for nonresident alien shareholders pursuant to Section 871 of the Internal Revenue Code.
Pursuant to Section 852 of the Internal Revenue Code, 100% of distributions paid from net investment income is designated as exempt-interest dividends for the fiscal year ended June 30, 2019.
PROXY VOTING INFORMATION
A description of the policies and procedures used to determine how to vote proxies relating to portfolio securities is available, upon request, by calling1-800-222-8222, visiting our website atwfam.com, or visiting the SEC website at sec.gov. Information regarding how the proxies related to portfolio securities were voted during the most recent 12-month period ended June 30 is available on the website atwfam.comor by visiting the SEC website at sec.gov.
QUARTERLY PORTFOLIO HOLDINGS INFORMATION
The Fund files its complete schedule of portfolio holdings with the SEC for the first and third quarters of each fiscal year on Form N-Q or Form N-PORT, which is available by visiting the SEC website at sec.gov. Those forms may be reviewed and copied at the SEC’s Public Reference Room in Washington, DC. Information on the operation of the Public Reference Room may be obtained by calling 1-800-SEC-0330.
Wells Fargo Municipal Bond Fund | 65
Other information (unaudited)
BOARD OF TRUSTEES AND OFFICERS
Each of the Trustees and Officers1 listed in the table below acts in identical capacities for each fund in the Wells Fargo family of funds, which consists of 152 mutual funds comprising the Wells Fargo Funds Trust, Wells Fargo Variable Trust, Wells Fargo Master Trust and four closed-end funds (collectively the “Fund Complex”). This table should be read in conjunction with the Prospectus and the Statement of Additional Information2. The mailing address of each Trustee and Officer is 525 Market Street, 12th Floor, San Francisco, CA 94105. Each Trustee and Officer serves an indefinite term, however, each Trustee serves such term until reaching the mandatory retirement age established by the Trustees.
Independent Trustees
| | | | | | |
Name and year of birth | | Position held and
length of service* | | Principal occupations during past five years or longer | | Current other
public company or
investment
company
directorships |
| | | |
William R. Ebsworth (Born 1957) | | Trustee, since 2015 | | Retired. From 1984 to 2013, equities analyst, portfolio manager, research director and chief investment officer at Fidelity Management and Research Company in Boston, Tokyo, and Hong Kong, and retired in 2013 as Chief Investment Officer of Fidelity Strategic Advisers, Inc. where he led a team of investment professionals managing client assets. Prior thereto, Board member of Hong Kong Securities Clearing Co., Hong Kong Options Clearing Corp., the Thailand International Fund, Ltd., Fidelity Investments Life Insurance Company, and Empire Fidelity Investments Life Insurance Company. Audit Committee Chair and Investment Committee Chair of the Vincent Memorial Hospital Endowment (non-profit organization). Mr. Ebsworth is a CFA® charterholder. | | N/A |
| | | |
| Jane A. Freeman (Born 1953) | | Trustee, since 2015; Chair Liaison, since 2018 | | Retired. From 2012 to 2014 and 1999 to 2008, Chief Financial Officer of Scientific Learning Corporation. From 2008 to 2012, Ms. Freeman provided consulting services related to strategic business projects. Prior to 1999, Portfolio Manager at Rockefeller & Co. and Scudder, Stevens & Clark. Board member of the Harding Loevner Funds from 1996 to 2014, serving as both Lead Independent Director and chair of the Audit Committee. Board member of the Russell Exchange Traded Funds Trust from 2011 to 2012 and the chair of the Audit Committee. Ms. Freeman is a Board Member of The Ruth Bancroft Garden (non-profit organization). She is also an inactive Chartered Financial Analyst. | | N/A |
| | | |
| Isaiah Harris, Jr. (Born 1952) | | Trustee, since 2009; Audit Committee Chairman, since 2019 | | Retired. Chairman of the Board of CIGNA Corporation since 2009, and Director since 2005. From 2003 to 2011, Director of Deluxe Corporation. Prior thereto, President and CEO of BellSouth Advertising and Publishing Corp. from 2005 to 2007, President and CEO of BellSouth Enterprises from 2004 to 2005 and President of BellSouth Consumer Services from 2000 to 2003. Emeritus member of the Iowa State University Foundation Board of Governors. Emeritus Member of the Advisory Board of Iowa State University School of Business. Advisory Board Member, Palm Harbor Academy (private school). Advisory Board Member, Child Evangelism Fellowship (non-profit). Mr. Harris is a certified public accountant (inactive status). | | CIGNA Corporation |
| | | |
| Judith M. Johnson (Born 1949) | | Trustee, since 2008; Audit Committee Chairman, from 2009 to 2018 | | Retired. Prior thereto, Chief Executive Officer and Chief Investment Officer of Minneapolis Employees Retirement Fund from 1996 to 2008. Ms. Johnson is an attorney, certified public accountant and a certified managerial accountant. | | N/A |
66 | Wells Fargo Municipal Bond Fund
Other information (unaudited)
| | | | | | |
Name and year of birth | | Position held and
length of service* | | Principal occupations during past five years or longer | | Current other
public company or
investment
company
directorships |
| | | |
| David F. Larcker (Born 1950) | | Trustee, since 2009 | | James Irvin Miller Professor of Accounting at the Graduate School of Business, Stanford University, Director of the Corporate Governance Research Initiative and Senior Faculty of The Rock Center for Corporate Governance since 2006. From 2005 to 2008, Professor of Accounting at the Graduate School of Business, Stanford University. Prior thereto, Ernst & Young Professor of Accounting at The Wharton School, University of Pennsylvania from 1985 to 2005. | | N/A |
| | | |
Olivia S. Mitchell (Born 1953) | | Trustee, since 2006; Nominating and Governance Committee Chairman, since 2018 | | International Foundation of Employee Benefit Plans Professor, Wharton School of the University of Pennsylvania since 1993. Director of Wharton’s Pension Research Council and Boettner Center on Pensions & Retirement Research, and Research Associate at the National Bureau of Economic Research. Previously, Cornell University Professor from 1978 to 1993. | | N/A |
| | | |
Timothy J. Penny (Born 1951) | | Trustee, since 1996; Chairman, since 2018 | | President and Chief Executive Officer of Southern Minnesota Initiative Foundation, a non-profit organization, since 2007. Member of the Board of Trustees of NorthStar Education Finance, Inc., a non-profit organization, since 2007. | | N/A |
| | | |
James G. Polisson (Born 1959) | | Trustee, since 2018 | | Retired. Chief Marketing Officer, Source (ETF) UK Services, Ltd, from 2015 to 2017. From 2012 to 2015, Principal of The Polisson Group, LLC, a management consulting, corporate advisory and principal investing company. Chief Executive Officer and Managing Director at Russell Investments, Global Exchange Traded Funds from 2010 to 2012. Managing Director of Barclays Global Investors from 1998 to 2010 and Global Chief Marketing Officer for iShares and Barclays Global Investors from 2000 to 2010. Trustee of the San Francisco Mechanics’ Institute, a non-profit organization, from 2013 to 2015. Board member of the Russell Exchange Traded Fund Trust from 2011 to 2012. Director of Barclays Global Investors Holdings Deutschland GmbH from 2006 to 2009. Mr. Polisson is an attorney and has a retired status with the Massachusetts and District of Columbia Bar Associations. | | N/A |
| * | Length of service dates reflect the Trustee’s commencement of service with the Trust’s predecessor entities, where applicable. |
Wells Fargo Municipal Bond Fund | 67
Other information (unaudited)
Officers
| | | | |
Name and year of birth | | Position held and
length of service | | Principal occupations during past five years or longer |
| | |
Andrew Owen (Born 1960) | | President, since 2017 | | Executive Vice President of Wells Fargo & Company and Head of Affiliated Managers, Wells Fargo Asset Management, since 2014. In addition, Mr. Owen is currently President, Chief Executive Officer and Director of Wells Fargo Funds Management, LLC since 2017. Prior thereto, Executive Vice President responsible for marketing, investments and product development for Wells Fargo Funds Management, LLC, from 2009 to 2014. |
| | |
Nancy Wiser1 (Born 1967) | | Treasurer, since 2012 | | Executive Vice President of Wells Fargo Funds Management, LLC since 2011. Chief Operating Officer and Chief Compliance Officer at LightBox Capital Management LLC, from 2008 to 2011. |
| | |
Alexander Kymn (Born 1973) | | Secretary and Chief Legal Officer, since 2018 | | Senior Company Counsel of Wells Fargo Bank, N.A. since 2018 (previously Senior Counsel from 2007 to 2018). Vice President of Wells Fargo Funds Management, LLC from 2008 to 2014. |
| | |
Michael H. Whitaker (Born 1967) | | Chief Compliance Officer, since 2016 | | Senior Vice President and Chief Compliance Officer since 2016. Senior Vice President and Chief Compliance Officer for Fidelity Investments from 2007 to 2016. |
| | |
David Berardi (Born 1975) | | Assistant Treasurer, since 2009 | | Vice President of Wells Fargo Funds Management, LLC since 2009. Vice President of Evergreen Investment Management Company, LLC from 2008 to 2010. Manager of Fund Reporting and Control for Evergreen Investment Management Company, LLC from 2004 to 2010. |
| | |
Jeremy DePalma1 (Born 1974) | | Assistant Treasurer, since 2009 | | Senior Vice President of Wells Fargo Funds Management, LLC since 2009. Senior Vice President of Evergreen Investment Management Company, LLC from 2008 to 2010 and head of the Fund Reporting and Control Team within Fund Administration from 2005 to 2010. |
| 1 | Nancy Wiser acts as Treasurer of 65 funds in the Fund Complex. Jeremy DePalma acts as Treasurer of 87 funds and Assistant Treasurer of 65 funds in the Fund Complex. |
| 2 | The Statement of Additional Information includes additional information about the Trustees and is available, without charge, upon request, by calling1-800-222-8222 or by visiting the website atwfam.com. |
68 | Wells Fargo Municipal Bond Fund
Other information (unaudited)
BOARD CONSIDERATION OF INVESTMENT MANAGEMENT AND SUB-ADVISORY AGREEMENTS:
Wells Fargo Municipal Bond Fund
Under the Investment Company Act of 1940 (the “1940 Act”), the Board of Trustees (the “Board”) of Wells Fargo Funds Trust (the “Trust”) must determine annually whether to approve the continuation of the Trust’s investment management and sub-advisory agreements. In this regard, at an in-person meeting held on May 21-22, 2019 (the “Meeting”), the Board, all the members of which have no direct or indirect interest in the investment management and sub-advisory agreements and are not “interested persons” of the Trust, as defined in the 1940 Act (the “Independent Trustees”), reviewed and approved for Wells Fargo Municipal Bond Fund (the “Fund”): (i) an investment management agreement (the “Management Agreement”) with Wells Fargo Funds Management, LLC (“Funds Management”); and (ii) an investment sub-advisory agreement (the “Sub-Advisory Agreement”) with Wells Capital Management Incorporated (the “Sub-Adviser”), an affiliate of Funds Management. The Management Agreement and the Sub-Advisory Agreement are collectively referred to as the “Advisory Agreements.”
At the Meeting, the Board considered the factors and reached the conclusions described below relating to the selection of Funds Management and the Sub-Adviser and the approval of the Advisory Agreements. Prior to the Meeting, including at an in-person meeting in April 2019, the Trustees conferred extensively among themselves and with representatives of Funds Management about these matters. Also, the Board has adopted a team-based approach, with each team consisting of a sub-set of Trustees, to assist the full Board in the discharge of its duties in reviewing investment performance and other matters throughout the year. The Independent Trustees were assisted in their evaluation of the Advisory Agreements by independent legal counsel, from whom they received separate legal advice and with whom they met separately.
In providing information to the Board, Funds Management and the Sub-Adviser were guided by a detailed set of requests for information submitted to them by independent legal counsel on behalf of the Independent Trustees at the start of the Board’s annual contract renewal process earlier in 2019. In considering and approving the Advisory Agreements, the Trustees considered the information they believed relevant, including but not limited to the information discussed below. The Board considered not only the specific information presented in connection with the Meeting, but also the knowledge gained over time through interaction with Funds Management and the Sub-Adviser about various topics. In this regard, the Board reviewed reports of Funds Management at each of its quarterly meetings, which included, among other things, portfolio reviews and investment performance reports. In addition, the Board and the teams mentioned above confer with portfolio managers at various times throughout the year. The Board did not identify any particular information or consideration that was all-important or controlling, and each individual Trustee may have attributed different weights to various factors.
After its deliberations, the Board unanimously approved the continuation of the Advisory Agreements for a one-year term and determined that the compensation payable to Funds Management and the Sub-Adviser under each of the Advisory Agreements was reasonable. The Board considered the approval of the Advisory Agreements for the Fund as part of its consideration of agreements for funds across the complex, but its approvals were made on a fund-by-fund basis. The following summarizes a number of important, but not necessarily all, factors considered by the Board in support of its approvals.
Nature, extent and quality of services
The Board received and considered various information regarding the nature, extent and quality of services provided to the Fund by Funds Management and the Sub-Adviser under the Advisory Agreements. This information included a description of the investment advisory services and Fund-level administrative services covered by the Management Agreement, as well as, among other things, a summary of the background and experience of senior management of Wells Fargo Asset Management (“WFAM”), of which Funds Management and the Sub-Adviser are a part, a summary of investments made in the business of WFAM, a summary of certain organizational and personnel changes involving Funds Management and the Sub-Adviser, and a description of Funds Management’s and the Sub-Adviser’s business continuity planning programs and of their approaches to data privacy and cybersecurity. The Board received and reviewed information about Funds Management’s role as administrator of the Fund’s liquidity risk management program. The Board also considered the qualifications, background, tenure and responsibilities of each of the portfolio managers primarily responsible for the day-to-day portfolio management of the Fund.
The Board evaluated the ability of Funds Management and the Sub-Adviser to attract and retain qualified investment professionals, including research, advisory and supervisory personnel. The Board further considered the compliance programs and compliance records of Funds Management and the Sub-Adviser. In addition, the Board took into account the full range of services provided to the Fund by Funds Management and its affiliates.
Wells Fargo Municipal Bond Fund | 69
Other information (unaudited)
Fund investment performance and expenses
The Board considered the investment performance results for the Fund over various time periods ended December 31, 2018. The Board considered these results in comparison to the investment performance of funds in a universe that was determined by Broadridge Inc. (“Broadridge”) to be similar to the Fund (the “Universe”), and in comparison to the Fund’s benchmark index and to other comparative data. Broadridge is an independent provider of investment company data. The Board received a description of the methodology used by Broadridge to select the mutual funds in the performance Universe. The Board noted that the investment performance of the Fund (Administrator Class) was higher than the average investment performance of the Universe for all periods under review. The Board also noted that the investment performance of the Fund was higher than its benchmark index, the Bloomberg Barclays Municipal Bond Index, for all periods under review.
The Board also received and considered information regarding the Fund’s net operating expense ratios and their various components, including actual management fees, custodian and other non-management fees, and Rule 12b-1 and non-Rule 12b-1 shareholder service fees. The Board considered these ratios in comparison to the median ratios of funds in class-specific expense groups that were determined by Broadridge to be similar to the Fund (the “Groups”). The Board received a description of the methodology used by Broadridge to select the mutual funds in the expense Groups and an explanation of how funds comprising expense groups and their expense ratios may vary from year-to-year. Based on the Broadridge reports, the Board noted that the net operating expense ratios of the Fund were lower than or in range of the median net operating expense ratios of the expense Groups for each share class.
The Board took into account the Fund’s investment performance and expense information provided to it among the factors considered in deciding to re-approve the Advisory Agreements.
Investment management and sub-advisory fee rates
The Board reviewed and considered the contractual fee rates payable by the Fund to Funds Management under the Management Agreement, as well as the contractual fee rates payable by the Fund to Funds Management for class-level administrative services under a Class-Level Administration Agreement, which include, among other things, class-level transfer agency and sub-transfer agency costs (collectively, the “Management Rates”). The Board also reviewed and considered the contractual investment sub-advisory fee rates that are payable by Funds Management to the Sub-Adviser for investment sub-advisory services.
Among other information reviewed by the Board was a comparison of the Fund’s Management Rates with the average contractual investment management fee rates of funds in the expense Groups at a common asset level as well as transfer agency costs of the funds in the expense Groups. The Board noted that the Management Rates of the Fund were lower than or in range of the sum of these average rates for the Fund’s expense Groups for all share classes.
The Board also received and considered information about the portion of the total management fee that was retained by Funds Management after payment of the fee to the Sub-Adviser for sub-advisory services. In assessing the reasonableness of this amount, the Board received and evaluated information about the nature and extent of responsibilities retained and risks assumed by Funds Management and not delegated to or assumed by the Sub-Adviser, and about Funds Management’s on-going oversight services. Given the affiliation between Funds Management and the Sub-Adviser, the Board ascribed limited relevance to the allocation of fees between them.
The Board also received and considered information about the nature and extent of services offered and fee rates charged by Funds Management and the Sub-Adviser to other types of clients with investment strategies similar to those of the Fund. In this regard, the Board received information about the significantly greater scope of services, and compliance, reporting and other legal burdens and risks of managing proprietary mutual funds compared with those associated with managing assets of other types of clients, including third-party sub-advised fund clients and non-mutual fund clients such as institutional separate accounts.
Based on its consideration of the factors and information it deemed relevant, including those described here, the Board determined that the compensation payable to Funds Management under the Management Agreement and to the Sub-Adviser under the Sub-Advisory Agreement was reasonable.
Profitability
The Board received and considered information concerning the profitability of Funds Management, as well as the profitability of both WFAM and Wells Fargo & Co. (“Wells Fargo”) from providing services to the fund family as a whole. The Board noted that the Sub-Adviser’s profitability information with respect to providing services to the Fund and other funds in the family was subsumed in the WFAM and Wells Fargo profitability analysis.
70 | Wells Fargo Municipal Bond Fund
Other information (unaudited)
Funds Management reported on the methodologies and estimates used in calculating profitability, including a description of the methodology used to allocate certain expenses. Among other things, the Board noted that the levels of profitability reported on a fund-by-fund basis varied widely, depending on factors such as the size, type and age of fund. Based on its review, the Board did not deem the profits reported by Funds Management, WFAM or Wells Fargo from services provided to the Fund to be at a level that would prevent it from approving the continuation of the Advisory Agreements.
Economies of scale
The Board received and considered information about the potential for Funds Management to experience economies of scale in the provision of management services to the Fund, the difficulties of calculating economies of scale at an individual fund level, and the extent to which potential scale benefits are shared with shareholders. The Board noted the existence of breakpoints in the Fund’s management fee structure, which operate generally to reduce the Fund’s expense ratios as the Fund grows in size. The Board considered that in addition to management fee breakpoints, Funds Management shares potential economies of scale from its management business in a variety of ways, including through fee waiver and expense reimbursement arrangements, services that benefit shareholders, competitive management fee rates set at the outset without regard to breakpoints, and investments in the business intended to enhance services available to shareholders.
The Board concluded that Funds Management’s arrangements with respect to the Fund, including contractual breakpoints, constituted a reasonable approach to sharing potential economies of scale with the Fund and its shareholders.
Other benefits to Funds Management and the Sub-Adviser
The Board received and considered information regarding potential “fall-out” or ancillary benefits received by Funds Management and its affiliates, including the Sub-Adviser, as a result of their relationships with the Fund. Ancillary benefits could include, among others, benefits directly attributable to other relationships with the Fund and benefits potentially derived from an increase in Funds Management’s and the Sub-Adviser’s business as a result of their relationships with the Fund. The Board noted that various affiliates of Funds Management may receive distribution-related fees, shareholder servicing payments and sub-transfer agency fees in respect of shares sold or held through them and services provided.
The Board also reviewed information about soft dollar credits earned and utilized by the Sub-Adviser, fees earned by Funds Management and the Sub-Adviser from managing a private investment vehicle for the fund family’s securities lending collateral, and commissions earned by an affiliated broker from portfolio transactions.
Based on its consideration of the factors and information it deemed relevant, including those described here, the Board did not find that any ancillary benefits received by Funds Management and its affiliates, including the Sub-Adviser, were unreasonable.
Conclusion
At the Meeting, after considering the above-described factors and based on its deliberations and its evaluation of the information described above, the Board unanimously approved the continuation of the Advisory Agreements for a one-year term and determined that the compensation payable to Funds Management and the Sub-Adviser under each of the Advisory Agreements was reasonable.
Wells Fargo Municipal Bond Fund | 71
This page is intentionally left blank.

For more information
More information about Wells Fargo Funds is available free upon request. To obtain literature, please write, visit the Fund’s website, or call:
Wells Fargo Funds
P.O. Box 219967
Kansas City, MO 64121-9967
Website:wfam.com
Individual investors:1-800-222-8222
Retail investment professionals:1-888-877-9275
Institutional investment professionals:1-866-765-0778

This report and the financial statements contained herein are submitted for the general information of the shareholders of the Fund. If this report is used for promotional purposes, distribution of the report must be accompanied or preceded by a current prospectus. Before investing, please consider the investment objectives, risks, charges, and expenses of the investment. For a current prospectus and, if available, a summary prospectus, containing this information, call1-800-222-8222 or visit the Fund’s website atwfam.com. Read the prospectus carefully before you invest or send money.
Wells Fargo Asset Management (WFAM) is the trade name for certain investment advisory/management firms owned by Wells Fargo & Company. These firms include but are not limited to Wells Capital Management Incorporated and Wells Fargo Funds Management, LLC. Certain products managed by WFAM entities are distributed by Wells Fargo Funds Distributor, LLC (a broker-dealer and Member FINRA).
This material is for general informational and educational purposes only and is NOT intended to provide investment advice or a recommendation of any kind—including a recommendation for any specific investment, strategy, or plan.
INVESTMENT PRODUCTS: NOT FDIC INSURED ◾ NO BANK GUARANTEE ◾ MAY LOSE VALUE
© 2019 Wells Fargo Funds Management, LLC. All rights reserved.
404825 08-19
A253/AR253 06-19
Annual Report
June 30, 2019
Wells Fargo
Short-Term Municipal Bond Fund
Beginning on January 1, 2021, as permitted by new regulations adopted by the Securities and Exchange Commission, paper copies of the Wells Fargo Funds’ annual and semi-annual shareholder reports issued after this date will no longer be sent by mail, unless you specifically request paper copies of the reports. Instead, the reports will be made available on the Funds’ website, and you will be notified by mail each time a report is posted and provided with a website address to access the report.
If you already elected to receive shareholder reports electronically, you will not be affected by this change and you need not take any action. You may elect to receive shareholder reports and other communications from the Fund electronically at any time by contacting your financial intermediary (such as a broker-dealer or bank) or, if you are a direct investor, by calling1-800-222-8222 or by enrolling at wellsfargo.com/advantagedelivery.
You may elect to receive all future reports in paper free of charge. If you invest through a financial intermediary, you can contact your financial intermediary to request that you continue to receive paper copies of your shareholder reports; if you invest directly with the Fund, you can call 1-800-222-8222. Your election to receive reports in paper will apply to all Wells Fargo Funds held in your account with your financial intermediary or, if you are a direct investor, to all Wells Fargo Funds that you hold.
|
|
|
Reduce clutter. Save trees. |
Sign up for electronic delivery of prospectuses and shareholder reports atwellsfargo.com/advantagedelivery |
The views expressed and any forward-looking statements are as of June 30, 2019, unless otherwise noted, and are those of the Fund managers and/or Wells Fargo Asset Management. Discussions of individual securities, or the markets generally, or any Wells Fargo Fund are not intended as individual recommendations. Future events or results may vary significantly from those expressed in any forward-looking statements. The views expressed are subject to change at any time in response to changing circumstances in the market. Wells Fargo Asset Management and the Fund disclaim any obligation to publicly update or revise any views expressed or forward-looking statements.
INVESTMENT PRODUCTS: NOT FDIC INSURED ◾ NO BANK GUARANTEE ◾ MAY LOSE VALUE
Wells Fargo Short-Term Municipal Bond Fund | 1
Letter to shareholders (unaudited)

Andrew Owen
President
Wells Fargo Funds
Dear Shareholder:
We are pleased to offer you this annual report for the Wells Fargo Short-Term Municipal Bond Fund for the 12-month period that ended June 30, 2019. After the first six months of the period yielded either low-single-digit or negative investment returns, stock and bond investors enjoyed a recovery during the final six months. The gains came amid continued concerns about global economic growth, international trade, geopolitical tensions, and bouts of market volatility.
For the period, U.S. stocks, based on the S&P 500 Index,1 gained 10.42% and international stocks, as measured by the MSCI ACWI ex USA Index (Net),2 rose 1.29%. The MSCI EM Index (Net)3 added 1.21%. For bond investors, the Bloomberg Barclays U.S. Aggregate Bond Index4 added 7.87%, the Bloomberg Barclays Global Aggregate ex-USD Index5 rose 4.10%, the Bloomberg Barclays Municipal Bond Index6 gained 6.71%, and the ICE BofAML U.S. High Yield Index7 added 7.58%.
U.S. and international markets diverged during the third quarter of 2018.
Domestic equity investors received encouraging news during the third quarter of 2018. The U.S. Bureau of Economic Analysis reported second-quarter annualized gross domestic product (GDP) growth of 4.2%. Hiring improved. Unemployment declined. Consumer confidence and spending increased. Third-quarter corporate earnings reports were generally positive. U.S. trade negotiations with Mexico and Canada progressed. The U.S. Federal Reserve (Fed) raised the federal funds rate by 25 basis points (bps; 100 bps equal 1.00%) to a target range of between 2.00% and 2.25% in September, one of four rate increases implemented during 2018, expressing confidence in the strength of the U.S. economic expansion’s durability.
Investors in international markets were not as confident. Tensions between the U.S. and China increased. The U.S. imposed $200 billion in tariffs on Chinese goods. China reacted with $60 billion in tariffs on U.S. goods. Economic growth in China caused concern. During the quarter, the MSCI ACWI ex USA Index (Net) gained 0.71%. The MSCI EM Index (Net) declined 1.09%. In fixed-income markets, U.S. bonds were flat, as measured by the Bloomberg Barclays U.S. Aggregate Bond Index. The Bloomberg Barclays Global Aggregate ex-USD Index fell 1.74%.
| 1 | The S&P 500 Index consists of 500 stocks chosen for market size, liquidity, and industry group representation. It is a market-value-weighted index with each stock’s weight in the index proportionate to its market value. You cannot invest directly in an index. |
| 2 | The Morgan Stanley Capital International (MSCI) All Country World Index (ACWI) ex USA Index (Net) is a free-float-adjusted market-capitalization weighted index that is designed to measure the equity market performance of developed and emerging markets, excluding the U.S. Source: MSCI. MSCI makes no express or implied warranties or representations and shall have no liability whatsoever with respect to any MSCI data contained herein. The MSCI data may not be further redistributed or used as a basis for other indices or any securities or financial products. This report is not approved, reviewed, or produced by MSCI. You cannot invest directly in an index. |
| 3 | The MSCI Emerging Markets (EM) Index (Net) is a free-float-adjusted market-capitalization-weighted index that is designed to measure the equity market performance of emerging markets. You cannot invest directly in an index. |
| 4 | The Bloomberg Barclays U.S. Aggregate Bond Index is a broad-based benchmark that measures the investment-grade, U.S. dollar-denominated, fixed-rate taxable bond market, including Treasuries, government-related and corporate securities, mortgage-backed securities (agency fixed-rate and hybrid adjustable-rate mortgage pass-throughs), asset-backed securities, and commercial mortgage-backed securities. You cannot invest directly in an index. |
| 5 | The Bloomberg Barclays Global Aggregate ex-USD Index is an unmanaged index that provides a broad-based measure of the global investment-grade fixed-income markets excluding the U.S. dollar-denominated debt market. You cannot invest directly in an index. |
| 6 | The Bloomberg Barclays Municipal Bond Index is an unmanaged index composed of long-term tax-exempt bonds with a minimum credit rating of Baa. You cannot invest directly in an index. |
| 7 | The ICE BofAML U.S. High Yield Index is a market-capitalization-weighted index of domestic and Yankee high-yield bonds. The index tracks the performance of high-yield securities traded in the U.S. bond market. You cannot invest directly in an index. Copyright 2019. ICE Data Indices, LLC. All rights reserved. |
2 | Wells Fargo Short-Term Municipal Bond Fund
Letter to shareholders (unaudited)
Global markets suffered during the fourth quarter of 2018.
November’s U.S. midterm elections shifted control of the House of Representatives from Republicans to Democrats, presaging partisan clashes that followed and caused uncertainty among investors. Third-quarter U.S. GDP was announced at an annualized 3.4% rate, lower than the second-quarter rate. Brexit efforts stalled ahead of the March 2019 deadline. The People’s Bank of China cut reserve requirement ratios, accelerated infrastructure spending, and cut taxes even as the value of the yuan declined to low levels last seen in 2008. A partial U.S. government shutdown driven by partisan policy disputes extended into January.
The combination of news in the U.S. and generally weak economic indicators outside of the U.S. caused investors to seek safe havens. December’s S&P 500 Index performance was the worst since 1931. Globally, fixed-income investments fared better than stocks during the last two months of the year. The Fed increased the federal funds rate by 25 bps in December to a target range of between 2.25% and 2.50%.
The market climbs a wall of worry.
Investors entered 2019 with reasons to be concerned. Investment returns appeared to reaffirm the adage that markets climb a wall of worry. The S&P 500 Index gained 8.01% for the month of January, the best monthly performance in 30 years. Returns for the MSCI ACWI ex USA Index (Net), the Bloomberg Barclays U.S. Aggregate Bond Index, and the Bloomberg Barclays Global Aggregate ex-USD Index also were positive. The Fed indicated that it would pause its program of regular rate increases during 2019 as inflation remained low.
In February 2019, concerns over slowing global growth persisted. The Bureau of Economic Analysis announced fourth-quarter 2018 GDP grew at an annualized 2.2% rate, down from the levels of the prior two quarters. In a February report, the Bank of England forecast the slowest growth since the financial crisis for 2019. China and the U.S. continued to wrangle over trade issues.
By the end of March 2019, the combination of dovish Fed sentiment and steady, if not spectacular, economic and business metrics reinforced investors’ confidence. Monthly job creation data and corporate profits, while less consistent than during 2018, were solid. China announced a roughly $300 billion stimulus package through tax and fee cuts intended to reinvigorate economic growth.
During April 2019, investors drew confidence from favorable economic projections, sustained low inflation, and solid employment data. First-quarter GDP showed the economy grew at an annualized rate of 3.2% on improvement in business investment and exports. Favorable sentiment extended to foreign markets as the MSCI ACWI ex USA Index (Net) gained 2.64% and the MSCI EM Index (Net) added 2.11% for the month.
During May 2019, investing signals were mixed. In the U.S., partisan wrangling ramped up as Democrats and Republicans set their sights on 2020 presidential politics. The U.K.’s Brexit caused Prime Minister Theresa May to resign. The European Commission downgraded the 2019 growth forecast to 1.2%. The U.S. increased tariffs on products from China, China responded, and then talks broke down. President Donald Trump threatened to turn his foreign policy tariff tool to Mexico over immigration issues. Markets tumbled.
As had been the case during most of 2019 to date, just as the investment horizon appeared to darken, sentiment turned and markets gained. The gains, primarily driven by geopolitical and monetary policy events, drove equity markets to new highs. President Trump dropped his threats of new tariffs on Mexico after talks and further tariffs on China after meeting with China’s President Xi Jinping at the G-20 summit. President Mario Draghi of the European Central Bank said that if the outlook doesn’t
“December’s S&P 500 Index performance was the worst since 1931.”
“The S&P 500 Index gained 8.01% for the month of January, the best monthly performance in 30 years.”
Wells Fargo Short-Term Municipal Bond Fund | 3
Letter to shareholders (unaudited)
improve, the bank will cut rates or buy more assets to prop up inflation. In the U.S., the Fed said growth shifted from “solid” to “moderate” and indicated a willingness to cut rates.
Don’t let short-term uncertainty derail long-term investment goals.
Periods of investment uncertainty can present challenges, but experience has taught us that maintaining long-term investment goals can be an effective way to plan for the future. To help you create a sound strategy based on your personal goals and risk tolerance, Wells Fargo Funds offers more than 100 mutual funds spanning a wide range of asset classes and investment styles. Although diversification cannot guarantee an investment profit or prevent losses, we believe it can be an effective way to manage investment risk and potentially smooth out overall portfolio performance. We encourage investors to know their investments and to understand that appropriate levels of risk-taking may unlock opportunities.
Thank you for choosing to invest with Wells Fargo Funds. We appreciate your confidence in us and remain committed to helping you meet your financial needs.
Sincerely,

Andrew Owen
President
Wells Fargo Funds
|
|
|
For further information about your Fund, contact your investment professional, visit our website at wfam.com, or call us directly at1-800-222-8222. |
4 | Wells Fargo Short-Term Municipal Bond Fund
This page is intentionally left blank.
Performance highlights (unaudited)
Investment objective
The Fund seeks current income exempt from federal income tax consistent with capital preservation.
Manager
Wells Fargo Funds Management, LLC
Subadviser
Wells Capital Management Incorporated
Portfolio managers
Wendy Casetta
Bruce R. Johns‡
Average annual total returns (%) as of June 30, 2019
| | | | | | | | | | | | | | | | | | | | | | | | | | | | | | | | | | |
| | | | |
| | | | | Including sales charge | | | Excluding sales charge | | | Expense
ratios1 (%) | |
| | | | | | | | | |
| | | Inception date | | 1 year | | | 5 year | | | 10 year | | | 1 year | | | 5 year | | | 10 year | | | Gross | | | Net2 | |
| | | | | | | | | | |
| Class A (WSMAX) | | 7-18-2008 | | | 0.52 | | | | 0.71 | | | | 1.74 | | | | 2.57 | | | | 1.12 | | | | 1.95 | | | | 0.77 | | | | 0.63 | |
| | | | | | | | | | |
| Class C (WSSCX) | | 1-31-2003 | | | 0.81 | | | | 0.37 | | | | 1.19 | | | | 1.81 | | | | 0.37 | | | | 1.19 | | | | 1.52 | | | | 1.38 | |
| | | | | | | | | | |
| Class R6 (WSSRX)3 | | 7-31-2018 | | | – | | | | – | | | | – | | | | 2.86 | | | | 1.36 | | | | 2.17 | | | | 0.39 | | | | 0.35 | |
| | | | | | | | | | |
| Administrator Class (WSTMX)4 | | 7-30-2010 | | | – | | | | – | | | | – | | | | 2.60 | | | | 1.11 | | | | 1.95 | | | | 0.71 | | | | 0.60 | |
| | | | | | | | | | |
| Institutional Class (WSBIX) | | 3-31-2008 | | | | | | | | | | | | | | | 2.81 | | | | 1.35 | | | | 2.16 | | | | 0.44 | | | | 0.40 | |
| | | | | | | | | | |
| Bloomberg Barclays 1-3 Year Composite Municipal Bond Index5 | | – | | | – | | | | – | | | | – | | | | 2.91 | | | | 1.25 | | | | 1.56 | | | | | | | | | |
Figures quoted represent past performance, which is no guarantee of future results, and do not reflect taxes that a shareholder may pay on fund distributions or the redemption of fund shares. Investment return and principal value of an investment will fluctuate so that an investor’s shares, when redeemed, may be worth more or less than their original cost. Performance shown without sales charges would be lower if sales charges were reflected. Current performance may be lower or higher than the performance data quoted, which assumes the reinvestment of dividends and capital gains. Current month-end performance is available on the Fund’s website,wfam.com.
Index returns do not include transaction costs associated with buying and selling securities, any mutual fund fees or expenses, or any taxes. It is not possible to invest directly in an index.
For Class A shares, the maximum front-end sales charge is 2.00%. For Class C shares, the maximum contingent deferred sales charge is 1.00%. Performance including a contingent deferred sales charge assumes the sales charge for the corresponding time period. Class R6, Administrator Class, and Institutional Class shares are sold without a front-end sales charge or contingent deferred sales charge.
Bond values fluctuate in response to the financial condition of individual issuers, general market and economic conditions, and changes in interest rates. Changes in market conditions and government policies may lead to periods of heightened volatility in the bond market and reduced liquidity for certain bonds held by the Fund. In general, when interest rates rise, bond values fall and investors may lose principal value. Interest rate changes and their impact on the Fund and its share price can be sudden and unpredictable. The use of derivatives may reduce returns and/or increase volatility. Certain investment strategies tend to increase the total risk of an investment (relative to the broader market). The Fund is exposed to high-yield securities risk and municipal securities risk. Consult the Fund’s prospectus for additional information on these and other risks. A portion of the Fund’s income may be subject to federal, state, and/or local income taxes or the Alternative Minimum Tax (AMT). Any capital gains distributions may be taxable.
Please see footnotes on page 7.
6 | Wells Fargo Short-Term Municipal Bond Fund
Performance highlights (unaudited)
|
|
| Growth of $10,000 investment as of June 30, 20196 |
|
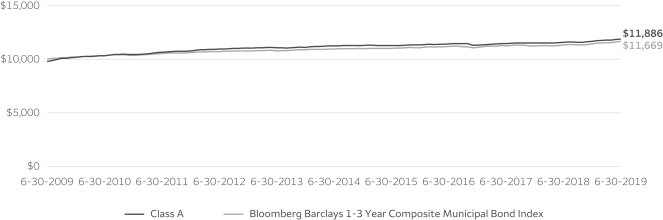
|
| ‡ | Mr. Johns became a portfolio manager of the Fund on March 28, 2019. |
| 1 | Reflects the expense ratios as stated in the most recent prospectuses. The expense ratios shown are subject to change and may differ from the annualized expense ratios shown in the financial highlights of this report. |
| 2 | The manager has contractually committed through October 31, 2019, to waive fees and/or reimburse expenses to the extent necessary to cap the expenses of each class after fee waivers at the amounts shown. Brokerage commissions, stamp duty fees, interest, taxes, acquired fund fees and expenses (if any), and extraordinary expenses are excluded from the expense cap. Prior to or after the commitment expiration date, the cap may be increased or the commitment to maintain the cap may be terminated only with the approval of the Board of Trustees. Without this cap, the Fund’s returns would have been lower. The expense ratio paid by an investor is the net expense ratio (the total annual fund operating expenses after fee waivers) as stated in the prospectuses. |
| 3 | Historical performance shown for Class R6 shares prior to their inception reflects the performance of the Institutional Class shares, and includes the higher expenses applicable to Institutional Class shares. If these expenses had not been included, returns for Class R6 shares would be higher. |
| 4 | Historical performance shown for Administrator Class shares prior to their inception reflects the performance of Institutional Class shares, adjusted to reflect the higher expenses applicable to Administrator Class shares. |
| 5 | The Bloomberg Barclays 1-3 Year Composite Municipal Bond Index is a blended index weighted 50% in the Bloomberg Barclays 1-Year Municipal Bond Index and 50% in the Barclays 3-Year Municipal Bond Index. You cannot invest directly in an index. |
| 6 | The chart compares the performance of Class A shares for the most recent ten years with the Bloomberg Barclays 1-3 Year Composite Municipal Bond Index. The chart assumes a hypothetical $10,000 investment in Class A shares and reflects all operating expenses and assumes the maximum initial sales charge of 2.00%. |
| 7 | Amounts are calculated based on the total long-term investments of the Fund. These amounts are subject to change and may have changed since the date specified. |
| 8 | The credit quality distribution of portfolio holdings reflected in the chart is based on ratings from Standard & Poor’s, Moody’s Investors Service, and/or Fitch Ratings Ltd. Credit quality ratings apply to the underlying holdings of the Fund and not to the Fund itself. The percentages of the Fund’s portfolio with the ratings depicted in the chart are calculated based on the total market value of fixed income securities held by the Fund. If a security was rated by all three rating agencies, the middle rating was utilized. If rated by two of three rating agencies, the lower rating was utilized, and if rated by one of the rating agencies, that rating was utilized. Standard & Poor’s rates the creditworthiness of bonds, ranging from AAA (highest) to D (lowest). Ratings from A to CCC may be modified by the addition of a plus (+) or minus (-) sign to show relative standing within the rating categories. Standard & Poor’s rates the creditworthiness of short-term notes from SP-1 (highest) to SP-3 (lowest). Moody’s rates the creditworthiness of bonds, ranging from Aaa (highest) to C (lowest). Ratings Aa to B may be modified by the addition of a number 1 (highest) to 3 (lowest) to show relative standing within the ratings categories. Moody’s rates the creditworthiness of short-term U.S. tax-exempt municipal securities from MIG 1/VMIG 1 (highest) to SG (lowest). Fitch rates the creditworthiness of bonds, ranging from AAA (highest) to D (lowest). Credit quality distribution is subject to change and may have changed since the date specified. |
Wells Fargo Short-Term Municipal Bond Fund | 7
Performance highlights (unaudited)
MANAGER’S DISCUSSION
Fund highlights
| ∎ | | The Fund underperformed its benchmark, the Bloomberg Barclays 1–3 Year Composite Municipal Bond Index, for the12-month period that ended June 30, 2019. |
| ∎ | | An underweight to state of Connecticut bonds detracted, while overweight exposures to Illinois- and New Jersey-related debt added to performance. Lower-rated securities continued to perform well as investors searched for yield on the short end of the curve. |
| ∎ | | The Fund’s short duration throughout the year contributed to performance. The barbell duration positioning benefited performance as bonds on the very short end of the curve and bonds in the six- to seven-year maturity range contributed to overall portfolio performance as the yield curve flattened. |
|
|
| Effective maturity distribution as of June 30, 20197 |
|
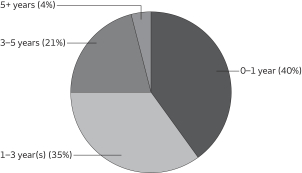 |
The Fed abruptly changed course from raising rates to a potential rate cut.
Throughout most of 2018, the fixed-income markets expected the U.S. Federal Reserve (Fed) to continue the path to normalize monetary policy. Moderate economic growth, stronger employment data, and inflation near its 2% target enabled the Fed to increase the federal funds rate four times in the calendar year. Despite a Fed rate hike in December, the Treasury market rallied in the fourth quarter of 2018 as the market lowered expectations for further rate hikes amid slower global growth, trade tariffs, and uncertainty concerning Britain’s departure from the European Union. These concerns only increased as we moved
into the first half of 2019, and discussions changed from when the Fed might hike to when it might cut the federal funds rate. As a result, fixed-income markets rallied, pushing the benchmark 10-year Treasury yield from a 3.23% peak in November 2018 to 2.00% by the end of June 2019.
|
|
| Credit quality as of June 30, 20198 |
|
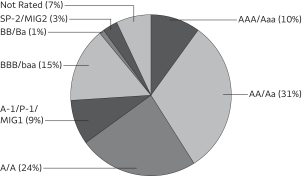 |
Specific to the municipal bond market, the beginning of the reporting period was marked with significant outflows due to a general risk-on sentiment in equity markets and the fear of rising interest rates. Short municipals slightly underperformed Treasuries over the period. As the calendar turned, so did market sentiment. Flows into municipal mutual funds not only turned positive, but record inflows were reported as investor opinion toward fixed income, particularly municipals, improved due to investor expectations that interest rates would remain stable. While new-issue supply was higher than it was a year earlier, it was still much lower than a typical year due to tax reform that eliminated the ability of issuers to advance refund outstanding, higher-cost debt. Overall reduced supply, state and local sales tax caps for individuals, and lower interest rates fueled demand and thus returns for municipal bonds over the period.
Lower credit quality continued to drive returns.
As the period began, the Fund modestly increased interest rate exposure into market weakness. Yields on the 5-year Treasury peaked in November at over 3%. We took advantage of market weakness and seasonally high issuance at year-end to get closer to neutral duration positioning. Also, as credit spreads continued to tighten, we began buying higher-quality bonds but maintained an overweight to BBB-rated bonds. The Fund’s overweight to BBB-rated debt contributed to performance as lower-rated bonds outperformed higher-quality bonds during the period. In addition, the Fund’s overweight to lower-quality bonds with relatively short maturities allowed a competitive yield without significant duration risk. Sector positioning detracted from performance during the period due to underweights to state general obligation bonds and lease-backed bonds. Also, as the
Please see footnotes on page 7.
8 | Wells Fargo Short-Term Municipal Bond Fund
Performance highlights (unaudited)
expectation grew for rates to move lower, our exposure to floating-rate notes underperformed. However, overweights to Illinois and New Jersey bonds and industrial development revenue (IDR) and hospital bonds positively affected performance over the period. We also added to our alternative minimum tax (AMT) exposure, specifically airport and IDR bonds, as bonds subject to the AMT provided additional incremental yield.
Our outlook is for lower rates.
Overall, technicals remain strong in the municipal bond market and we expect municipal bond valuations in the medium term to be helped by high state income tax rates, record levels of municipal debt maturities and calls, and limited availability of gross municipal bond supply. However, we believe overall economic growth in this cycle has neared its peak, and as a result, the Fed may lower rates before the end of the year. Therefore, we will look to maintain a neutral duration positioning and an up-in-quality trade approach.
Wells Fargo Short-Term Municipal Bond Fund | 9
Fund expenses (unaudited)
As a shareholder of the Fund, you incur two types of costs: (1) transaction costs, including sales charges (loads) on purchase payments and contingent deferred sales charges (if any) on redemptions and (2) ongoing costs, including management fees, distribution (12b-1) and/or shareholder servicing fees, and other Fund expenses. This example is intended to help you understand your ongoing costs (in dollars) of investing in the Fund and to compare these costs with the ongoing costs of investing in other mutual funds.
The example is based on an investment of $1,000 invested at the beginning of the six-month period and held for the entire period from January 1, 2019 to June 30, 2019.
Actual expenses
The “Actual” line of the table below provides information about actual account values and actual expenses. You may use the information in this line, together with the amount you invested, to estimate the expenses that you paid over the period. Simply divide your account value by $1,000 (for example, an $8,600 account value divided by $1,000 = 8.6), then multiply the result by the number in the “Actual” line under the heading entitled “Expenses paid during period” for your applicable class of shares to estimate the expenses you paid on your account during this period.
Hypothetical example for comparison purposes
The “Hypothetical” line of the table below provides information about hypothetical account values and hypothetical expenses based on the Fund’s actual expense ratio and an assumed rate of return of 5% per year before expenses, which is not the Fund’s actual return. The hypothetical account values and expenses may not be used to estimate the actual ending account balance or expenses you paid for the period. You may use this information to compare the ongoing costs of investing in the Fund and other funds. To do so, compare this 5% hypothetical example with the 5% hypothetical examples that appear in the shareholder reports of the other funds.
Please note that the expenses shown in the table are meant to highlight your ongoing costs only and do not reflect any transactional costs, such as sales charges (loads) and contingent deferred sales charges. Therefore, the “Hypothetical” line of the table is useful in comparing ongoing costs only and will not help you determine the relative total costs of owning different funds. In addition, if these transactional costs were included, your costs would have been higher.
| | | | | | | | | | | | | | | | |
| | | Beginning
account value
1-1-2019 | | | Ending
account value
6-30-2019 | | | Expenses
paid during
the period¹ | | | Annualized net
expense ratio | |
| | | | | |
Class A | | | | | | | | | | | | | | | | |
| | | | |
Actual | | $ | 1,000.00 | | | $ | 1,017.71 | | | $ | 3.15 | | | | 0.63 | % |
| | | | |
Hypothetical (5% return before expenses) | | $ | 1,000.00 | | | $ | 1,021.67 | | | $ | 3.16 | | | | 0.63 | % |
| | | | | |
Class C | | | | | | | | | | | | | | | | |
| | | | |
Actual | | $ | 1,000.00 | | | $ | 1,013.93 | | | $ | 6.89 | | | | 1.38 | % |
| | | | |
Hypothetical (5% return before expenses) | | $ | 1,000.00 | | | $ | 1,017.95 | | | $ | 6.90 | | | | 1.38 | % |
| | | | | |
Class R6 | | | | | | | | | | | | | | | | |
| | | | |
Actual | | $ | 1,000.00 | | | $ | 1,019.10 | | | $ | 1.75 | | | | 0.35 | % |
| | | | |
Hypothetical (5% return before expenses) | | $ | 1,000.00 | | | $ | 1,023.06 | | | $ | 1.76 | | | | 0.35 | % |
| | | | | |
Administrator Class | | | | | | | | | | | | | | | | |
| | | | |
Actual | | $ | 1,000.00 | | | $ | 1,017.85 | | | $ | 3.00 | | | | 0.60 | % |
| | | | |
Hypothetical (5% return before expenses) | | $ | 1,000.00 | | | $ | 1,021.82 | | | $ | 3.01 | | | | 0.60 | % |
| | | | | |
Institutional Class | | | | | | | | | | | | | | | | |
| | | | |
Actual | | $ | 1,000.00 | | | $ | 1,018.84 | | | $ | 2.00 | | | | 0.40 | % |
| | | | |
Hypothetical (5% return before expenses) | | $ | 1,000.00 | | | $ | 1,022.81 | | | $ | 2.01 | | | | 0.40 | % |
| 1 | Expenses paid is equal to the annualized net expense ratio of each class multiplied by the average account value over the period, multiplied by the number of days in the most recent fiscal half-year divided by the number of days in the fiscal year (to reflect the one-half-year period). |
10 | Wells Fargo Short-Term Municipal Bond Fund
Portfolio of investments—June 30, 2019
| | | | | | | | | | | | | | | | |
| | | Interest rate | | | Maturity date | | | Principal | | | Value | |
| Municipal Obligations: 98.91% | |
| | | | |
Alabama: 0.43% | | | | | | | | | | | | | | | | |
| | | | |
| Tax Revenue: 0.01% | | | | | | | | | | | | |
| | | | |
Board of Education of Shelby County AL Public School Series 2016 | | | 4.00 | % | | | 2-1-2020 | | | $ | 410,000 | | | $ | 416,380 | |
| | | | | | | | | | | | | | | | |
| | | | |
| Utilities Revenue: 0.42% | | | | | | | | | | | | |
| | | | |
Alabama Black Belt Energy Gas District Series A | | | 4.00 | | | | 12-1-2048 | | | | 8,000,000 | | | | 8,646,160 | |
| | | | |
Alabama Black Belt Energy Gas District Series A | | | 4.00 | | | | 6-1-2024 | | | | 3,640,000 | | | | 3,998,431 | |
| | | | |
Alabama Black Belt Energy Gas District Series A (Royal Bank of Canada LIQ) | | | 4.00 | | | | 8-1-2047 | | | | 3,880,000 | | | | 4,138,369 | |
| |
| | | | 16,782,960 | |
| | | | | | | | | | | | | | | | |
| |
| | | | 17,199,340 | |
| | | | | | | | | | | | | | | | |
| | | | |
Alaska: 0.66% | | | | | | | | | | | | | | | | |
| | | | |
| Health Revenue: 0.56% | | | | | | | | | | | | |
| | | | |
Alaska IDA Loan Anticipation YKHC Project | | | 3.50 | | | | 12-1-2020 | | | | 22,300,000 | | | | 22,423,765 | |
| | | | | | | | | | | | | | | | |
| | | | |
| Utilities Revenue: 0.04% | | | | | | | | | | | | |
| | | | |
Alaska IDA Snettisham Hydroelectric Project | | | 5.00 | | | | 1-1-2021 | | | | 1,400,000 | | | | 1,449,868 | |
| | | | | | | | | | | | | | | | |
| | | | |
| Water & Sewer Revenue: 0.06% | | | | | | | | | | | | |
| | | | |
North Slope Borough Service Area Water & Wastewater Facilities | | | 5.25 | | | | 6-30-2034 | | | | 2,445,000 | | | | 2,624,047 | |
| | | | | | | | | | | | | | | | |
| |
| | | | 26,497,680 | |
| | | | | | | | | | | | | | | | |
| | | | |
Arizona: 2.41% | | | | | | | | | | | | | | | | |
| | | | |
| Education Revenue: 0.08% | | | | | | | | | | | | |
| | | | |
Cochise County AZ Community College District of Cochise County Series 2016A (Build America Mutual Assurance Company Insured) | | | 5.00 | | | | 7-1-2020 | | | | 405,000 | | | | 419,349 | |
| | | | |
Cochise County AZ Community College District of Cochise County Series 2016A (Build America Mutual Assurance Company Insured) | | | 5.00 | | | | 7-1-2021 | | | | 425,000 | | | | 454,946 | |
| | | | |
PIMA County AZ IDA Education Facility Odyssey Preparatory Academy Goodyear Project | | | 7.00 | | | | 6-1-2034 | | | | 312,000 | | | | 344,292 | |
| | | | |
PIMA County AZ IDA Education Facility Odyssey Preparatory Academy Goodyear Project | | | 7.13 | | | | 6-1-2049 | | | | 1,950,000 | | | | 2,156,427 | |
| |
| | | | 3,375,014 | |
| | | | | | | | | | | | | | | | |
| | | | |
| GO Revenue: 0.06% | | | | | | | | | | | | |
| | | | |
Maricopa County AZ Unified School District #89 Refunding Bond Series 2016 (Build America Mutual Assurance Company Insured) | | | 2.00 | | | | 7-1-2019 | | | | 2,265,000 | | | | 2,265,000 | |
| | | | | | | | | | | | | | | | |
| | | | |
| Health Revenue: 0.59% | | | | | | | | | | | | |
| | | | |
Maricopa County AZ IDA Series 2019C (SIFMA Municipal Swap +0.57%)± | | | 2.47 | | | | 1-1-2035 | | | | 5,000,000 | | | | 5,000,000 | |
| | | | |
Maricopa County AZ IDA Series 2019C (SIFMA Municipal Swap +0.80%)± | | | 2.70 | | | | 9-1-2048 | | | | 9,000,000 | | | | 9,002,520 | |
| | | | |
Maricopa County AZ IDA Series 2019E ø | | | 1.90 | | | | 1-1-2049 | | | | 3,500,000 | | | | 3,500,000 | |
| | | | |
Tempe AZ IDA Mirabella Arizona State University Project Series B1 144A | | | 4.00 | | | | 10-1-2023 | | | | 6,000,000 | | | | 6,065,340 | |
| |
| | | | 23,567,860 | |
| | | | | | | | | | | | | | | | |
| | | | |
| Industrial Development Revenue: 1.02% | | | | | | | | | | | | |
| | | | |
Chandler AZ IDA Intel Corporation Project | | | 2.40 | | | | 12-1-2035 | | | | 32,885,000 | | | | 33,821,894 | |
| | | | |
Coconino County AZ Pollution Control Corporation Series A | | | 1.80 | | | | 9-1-2032 | | | | 7,100,000 | | | | 7,112,425 | |
| |
| | | | 40,934,319 | |
| | | | | | | | | | | | | | | | |
Wells Fargo Short-Term Municipal Bond Fund | 11
Portfolio of investments—June 30, 2019
| | | | | | | | | | | | | | | | |
| | | Interest rate | | | Maturity date | | | Principal | | | Value | |
| Miscellaneous Revenue: 0.35% | | | | | | | | | | | | |
| | | | |
Arizona Board of Regents Certificate of Participation Series A | | | 5.00 | % | | | 6-1-2021 | | | $ | 3,000,000 | | | $ | 3,206,760 | |
| | | | |
Navajo Nation AZ Refunding Bond Series A 144A | | | 2.90 | | | | 12-1-2020 | | | | 5,965,000 | | | | 6,014,450 | |
| | | | |
Navajo Nation AZ Tribal Utility Authority (Municipal Government Guaranty Insured) | | | 4.00 | | | | 1-1-2021 | | | | 4,768,000 | | | | 4,803,283 | |
| |
| | | | 14,024,493 | |
| | | | | | | | | | | | | | | | |
| | | | |
| Utilities Revenue: 0.31% | | | | | | | | | | | | |
| | | | |
Maricopa County AZ PCR Public Service Company of New Mexico Palo Verde Project Series B | | | 5.20 | | | | 6-1-2043 | | | | 2,500,000 | | | | 2,574,825 | |
| | | | |
Maricopa County AZ PCR Series A | | | 2.40 | | | | 6-1-2043 | | | | 9,800,000 | | | | 9,845,864 | |
| |
| | | | 12,420,689 | |
| | | | | | | | | | | | | | | | |
| |
| | | | 96,587,375 | |
| | | | | | | | | | | | | | | | |
| | | | |
Arkansas: 0.13% | | | | | | | | | | | | | | | | |
| | | | |
| Housing Revenue: 0.13% | | | | | | | | | | | | |
| | | | |
Arkansas Development Finance Authority Multifamily Housing Texarkana Rental Assistance Demonstration Convertible Bond Series A | | | 2.10 | | | | 6-1-2022 | | | | 5,100,000 | | | | 5,144,319 | |
| | | | | | | | | | | | | | | | |
| | | | |
California: 5.26% | | | | | | | | | | | | | | | | |
| | | | |
| Education Revenue: 0.65% | | | | | | | | | | | | |
| | | | |
California Infrastructure & Economic Development Bank Series A (SIFMA Municipal Swap +1.00%)± | | | 2.90 | | | | 8-1-2037 | | | | 26,185,000 | | | | 26,259,627 | |
| | | | | | | | | | | | | | | | |
| | | | |
| GO Revenue: 1.49% | | | | | | | | | | | | |
| | | | |
California Refunding Bond Series A (SIFMA Municipal Swap +0.25%)± | | | 2.15 | | | | 5-1-2033 | | | | 26,000,000 | | | | 25,983,620 | |
| | | | |
California Series B (SIFMA Municipal Swap +0.38%)± | | | 2.28 | | | | 12-1-2027 | | | | 20,000,000 | | | | 20,016,600 | |
| | | | |
Oakland CA Unified School District Alameda County Election of 2012 | | | 5.00 | | | | 8-1-2019 | | | | 1,000,000 | | | | 1,002,960 | |
| | | | |
Palomar CA Pomerado Health CAB Election of 2004 Series A (National Insured) ¤ | | | 0.00 | | | | 8-1-2019 | | | | 2,215,000 | | | | 2,212,320 | |
| | | | |
San Ysidro CA School District (AGM Insured) ¤ | | | 0.00 | | | | 8-1-2047 | | | | 3,610,000 | | | | 500,238 | |
| | | | |
State of California Series A4 (Citibank NA LOC) ø | | | 1.31 | | | | 5-1-2034 | | | | 10,000,000 | | | | 10,000,000 | |
| |
| | | | 59,715,738 | |
| | | | | | | | | | | | | | | | |
| | | | |
| Health Revenue: 0.77% | | | | | | | | | | | | |
| | | | |
California HFFA Providence St. Joseph Series B1 | | | 1.25 | | | | 10-1-2036 | | | | 5,755,000 | | | | 5,737,965 | |
| | | | |
California Statewide CDA Health Facilities Catholic Series E (AGM Insured) (m) | | | 2.29 | | | | 7-1-2040 | | | | 23,350,000 | | | | 23,350,000 | |
| | | | |
Palomar CA Pomerado Health Care District Certificate of Participation Series C (AGM Insured) (m) | | | 2.45 | | | | 11-1-2036 | | | | 1,150,000 | | | | 1,150,000 | |
| | | | |
Washington Township CA Health Care District Series B | | | 5.00 | | | | 7-1-2020 | | | | 600,000 | | | | 621,192 | |
| |
| | | | 30,859,157 | |
| | | | | | | | | | | | | | | | |
| | | | |
| Industrial Development Revenue: 0.09% | | | | | | | | | | | | |
| | | | |
California PCFA AMT Calplant I Project 144A | | | 7.00 | | | | 7-1-2022 | | | | 3,505,000 | | | | 3,613,830 | |
| | | | | | | | | | | | | | | | |
| | | | |
| Miscellaneous Revenue: 0.67% | | | | | | | | | | | | |
| | | | |
California Infrastructure & Economic Development Bank The J. Paul Getty Trust Series A-1 (1 Month LIBOR +0.33%)± | | | 2.04 | | | | 10-1-2047 | | | | 19,000,000 | | | | 18,964,850 | |
| | | | |
California Infrastructure & Economic Development Bank The J. Paul Getty Trust Series B-2 (1 Month LIBOR +0.20%)± | | | 1.91 | | �� | | 10-1-2047 | | | | 8,000,000 | | | | 7,987,280 | |
| |
| | | | 26,952,130 | |
| | | | | | | | | | | | | | | | |
12 | Wells Fargo Short-Term Municipal Bond Fund
Portfolio of investments—June 30, 2019
| | | | | | | | | | | | | | | | |
| | | Interest rate | | | Maturity date | | | Principal | | | Value | |
| Tax Revenue: 0.05% | | | | | | | | | | | | |
| | | | |
Commerce CA RDA CAB Project #1 ¤ | | | 0.00 | % | | | 8-1-2021 | | | $ | 2,245,000 | | | $ | 2,037,046 | |
| | | | | | | | | | | | | | | | |
| | | | |
| Transportation Revenue: 0.65% | | | | | | | | | | | | |
| | | | |
Bay Area Toll Authority San Francisco Bay Area Series C-1 (SIFMA Municipal Swap +0.90%)± | | | 2.80 | | | | 4-1-2045 | | | | 25,500,000 | | | | 25,862,610 | |
| | | | | | | | | | | | | | | | |
| | | | |
| Water & Sewer Revenue: 0.89% | | | | | | | | | | | | |
| | | | |
California Department of Water Resources Central Valley Project Series AT (SIFMA Municipal Swap +0.37%)± | | | 2.27 | | | | 12-1-2035 | | | | 35,500,000 | | | | 35,498,580 | |
| | | | | | | | | | | | | | | | |
| |
| | | | 210,798,718 | |
| | | | | | | | | | | | | | | | |
| | | | |
Colorado: 1.39% | | | | | | | | | | | | | | | | |
| | | | |
| GO Revenue: 0.27% | | | | | | | | | | | | |
| | | | |
Dawson Ridge Metropolitan District # 1 CO ¤ | | | 0.00 | | | | 10-1-2022 | | | | 8,445,000 | | | | 8,047,578 | |
| | | | |
Grand River CO Hospital District (AGM Insured) | | | 5.00 | | | | 12-1-2022 | | | | 1,450,000 | | | | 1,617,751 | |
| | | | |
Grand River CO Hospital District (AGM Insured) | | | 5.00 | | | | 12-1-2024 | | | | 1,140,000 | | | | 1,332,147 | |
| |
| | | | 10,997,476 | |
| | | | | | | | | | | | | | | | |
| | | | |
| Health Revenue: 0.93% | | | | | | | | | | | | |
| | | | |
Colorado HCFR Catholic Health Initiatives Series C2 (1 Month LIBOR +1.25%)± | | | 2.91 | | | | 10-1-2039 | | | | 8,500,000 | | | | 8,537,740 | |
| | | | |
Colorado HCFR Catholic Health Initiatives Series C4 (1 Month LIBOR +1.25%)± | | | 2.91 | | | | 10-1-2039 | | | | 3,495,000 | | | | 3,510,518 | |
| | | | |
University of Colorado Hospital Authority Series 2017C-1 | | | 5.00 | | | | 11-15-2038 | | | | 23,630,000 | | | | 25,385,236 | |
| |
| | | | 37,433,494 | |
| | | | | | | | | | | | | | | | |
| | | | |
| Housing Revenue: 0.15% | | | | | | | | | | | | |
| | | | |
Colorado HSG Finance Authority Multifamily Housing Bonds South Range Crossings Project Series 2017 | | | 2.15 | | | | 1-1-2038 | | | | 6,000,000 | | | | 6,014,280 | |
| | | | | | | | | | | | | | | | |
| | | | |
| Miscellaneous Revenue: 0.04% | | | | | | | | | | | | |
| | | | |
Colorado Bridge Enterprise Central 70 Project | | | 4.00 | | | | 12-31-2023 | | | | 1,285,000 | | | | 1,397,270 | |
| | | | | | | | | | | | | | | | |
| |
| | | | 55,842,520 | |
| | | | | | | | | | | | | | | | |
| | | | |
Connecticut: 2.06% | | | | | | | | | | | | | | | | |
| | | | |
| Education Revenue: 0.67% | | | | | | | | | | | | |
| | | | |
Connecticut HEFAR Yale University Issue Series A | | | 2.05 | | | | 7-1-2035 | | | | 25,000,000 | | | | 25,366,000 | |
| | | | |
Connecticut HEFAR Yale University Issue Series A-1 ø | | | 1.00 | | | | 7-1-2042 | | | | 100,000 | | | | 100,000 | |
| | | | |
Connecticut Higher Education Supplemental Loan Authority Refunding Bonds Chelsea Loan Program Series A | | | 3.60 | | | | 11-15-2023 | | | | 1,265,000 | | | | 1,342,317 | |
| |
| | | | 26,808,317 | |
| | | | | | | | | | | | | | | | |
| | | | |
| GO Revenue: 0.46% | | | | | | | | | | | | |
| | | | |
Connecticut Refunding Bond Series B | | | 4.00 | | | | 5-15-2021 | | | | 11,190,000 | | | | 11,727,008 | |
| | | | |
Hartford CT Series A (AGM Insured) | | | 5.00 | | | | 7-1-2019 | | | | 700,000 | | | | 700,000 | |
| | | | |
New Haven CT Prerefunded Bond Series A (AGM Insured) | | | 3.00 | | | | 11-1-2019 | | | | 80,000 | | | | 80,433 | |
| | | | |
New Haven CT Series A | | | 5.25 | | | | 8-1-2021 | | | | 1,830,000 | | | | 1,952,647 | |
| | | | |
New Haven CT Unrefunded Balance Refunding Bond Series A (AGM Insured) | | | 3.00 | | | | 11-1-2019 | | | | 3,325,000 | | | | 3,340,328 | |
| | | | |
West Haven CT Series A | | | 3.00 | | | | 11-1-2019 | | | | 300,000 | | | | 300,360 | |
| | | | |
West Haven CT Series B | | | 3.00 | | | | 11-1-2019 | | | | 210,000 | | | | 210,252 | |
| |
| | | | 18,311,028 | |
| | | | | | | | | | | | | | | | |
Wells Fargo Short-Term Municipal Bond Fund | 13
Portfolio of investments—June 30, 2019
| | | | | | | | | | | | | | | | |
| | | Interest rate | | | Maturity date | | | Principal | | | Value | |
| Health Revenue: 0.47% | | | | | | | | | | | | |
| | | | |
Connecticut HEFAR Hartford Healthcare Series G (1 Month LIBOR +0.95%)± | | | 2.61 | % | | | 7-1-2049 | | | $ | 10,000,000 | | | $ | 10,018,800 | |
| | | | |
Connecticut HEFAR Yale New Haven Hospital Series O ø | | | 1.95 | | | | 7-1-2053 | | | | 9,000,000 | | | | 9,000,000 | |
| |
| | | | 19,018,800 | |
| | | | | | | | | | | | | | | | |
| | | | |
| Housing Revenue: 0.25% | | | | | | | | | | | | |
| | | | |
Meriden CT Multifamily Housing Yale Acres Project | | | 1.73 | | | | 8-1-2022 | | | | 10,000,000 | | | | 10,017,000 | |
| | | | | | | | | | | | | | | | |
| | | | |
| Miscellaneous Revenue: 0.21% | | | | | | | | | | | | |
| | | | |
Connecticut Series A (SIFMA Municipal Swap +0.65%)± | | | 2.55 | | | | 3-1-2020 | | | | 8,385,000 | | | | 8,405,711 | |
| | | | | | | | | | | | | | | | |
| |
| | | | 82,560,856 | |
| | | | | | | | | | | | | | | | |
| | | | |
District of Columbia: 0.62% | | | | | | | | | | | | | | | | |
| | | | |
| Airport Revenue: 0.09% | | | | | | | | | | | | |
| | | | |
Metropolitan Washington DC Airport Authority Series A | | | 5.00 | | | | 10-1-2024 | | | | 3,450,000 | | | | 3,829,500 | |
| | | | | | | | | | | | | | | | |
| | | | |
| Housing Revenue: 0.53% | | | | | | | | | | | | |
| | | | |
District of Columbia HFA Multifamily Housing Liberty Place Apartments Project | | | 2.13 | | | | 6-1-2021 | | | | 9,800,000 | | | | 9,874,284 | |
| | | | |
District of Columbia HFA Multifamily Housing Maplewood Courts Apartments Project | | | 1.80 | | | | 2-1-2020 | | | | 11,310,000 | | | | 11,312,036 | |
| |
| | | | 21,186,320 | |
| | | | | | | | | | | | | | | | |
| |
| | | | 25,015,820 | |
| | | | | | | | | | | | | | | | |
| | | | |
Florida: 2.15% | | | | | | | | | | | | | | | | |
| | | | |
| Education Revenue: 0.23% | | | | | | | | | | | | |
| | | | |
Florida Gulf Coast University Financing Corporation Housing Project Series A | | | 5.00 | | | | 8-1-2020 | | | | 2,055,000 | | | | 2,127,953 | |
| | | | |
University of North Florida Financing Corporation Capital Housing Project (AGM Insured) | | | 5.00 | | | | 11-1-2020 | | | | 3,125,000 | | | | 3,261,313 | |
| | | | |
University of North Florida Financing Corporation Capital Housing Project (AGM Insured) | | | 5.00 | | | | 11-1-2021 | | | | 3,440,000 | | | | 3,701,543 | |
| |
| | | | 9,090,809 | |
| | | | | | | | | | | | | | | | |
| | | | |
| Health Revenue: 0.67% | | | | | | | | | | | | |
| | | | |
Highlands County FL Health Facilities Authority Adventist Health System Series A ø | | | 1.85 | | | | 11-15-2037 | | | | 9,300,000 | | | | 9,300,000 | |
| | | | |
North Broward FL Hospital District Series B | | | 5.00 | | | | 1-1-2022 | | | | 1,255,000 | | | | 1,348,447 | |
| | | | |
North Broward FL Hospital District Series B | | | 5.00 | | | | 1-1-2023 | | | | 1,700,000 | | | | 1,871,292 | |
| | | | |
North Broward FL Hospital District Series B | | | 5.00 | | | | 1-1-2024 | | | | 2,000,000 | | | | 2,249,420 | |
| | | | |
Palm Beach County FL HCFR ACTS Retirement Life Communities Series 2016 | | | 5.00 | | | | 11-15-2021 | | | | 3,515,000 | | | | 3,795,146 | |
| | | | |
Tampa FL BayCare Health System Prefunded Bond | | | 5.00 | | | | 11-15-2023 | | | | 4,140,000 | | | | 4,270,120 | |
| | | | |
Tampa FL BayCare Health System Unrefunded Bond | | | 5.00 | | | | 11-15-2023 | | | | 3,940,000 | | | | 4,063,480 | |
| |
| | | | 26,897,905 | |
| | | | | | | | | | | | | | | | |
|
| Housing Revenue: 0.13% | |
| | | | |
Florida Housing Finance Corporation Logan Heights Apartments Series F | | | 1.90 | | | | 2-1-2020 | | | | 5,280,000 | | | | 5,286,336 | |
| | | | | | | | | | | | | | | | |
| | | | |
| Miscellaneous Revenue: 0.41% | | | | | | | | | | | | |
| | | | |
Manatee County FL School Board Certificate of Participation Series A | | | 5.00 | | | | 7-1-2020 | | | | 1,225,000 | | | | 1,265,180 | |
| | | | |
Miami-Dade County FL School Board Certificate of Participation Series A | | | 5.00 | | | | 5-1-2031 | | | | 10,000,000 | | | | 11,484,100 | |
| | | | |
St. Johns County FL School Board Refunding Bond Certificate of Participation | | | 5.00 | | | | 7-1-2020 | | | | 2,010,000 | | | | 2,082,842 | |
| | | | |
St. Johns County FL School Board Refunding Bond Certificate of Participation | | | 5.00 | | | | 7-1-2021 | | | | 1,670,000 | | | | 1,788,153 | |
| |
| | | | 16,620,275 | |
| | | | | | | | | | | | | | | | |
14 | Wells Fargo Short-Term Municipal Bond Fund
Portfolio of investments—June 30, 2019
| | | | | | | | | | | | | | | | |
| | | Interest rate | | | Maturity date | | | Principal | | | Value | |
| Resource Recovery Revenue: 0.05% | | | | | | | | | | | | |
| | | | |
Lee County FL Solid Waste System Refunding Bond | | | 5.00 | % | | | 10-1-2023 | | | $ | 1,750,000 | | | $ | 1,954,068 | |
| | | | | | | | | | | | | | | | |
| | | | |
| Tax Revenue: 0.21% | | | | | | | | | | | | |
| | | | |
Florida Department of Environmental Protection Florida Forever Series A | | | 5.00 | | | | 7-1-2023 | | | | 7,720,000 | | | | 8,545,654 | |
| | | | | | | | | | | | | | | | |
| | | | |
| Transportation Revenue: 0.40% | | | | | | | | | | | | |
| | | | |
Florida Development Finance Corporation Surface Series T | | | 1.90 | | | | 1-1-2049 | | | | 14,400,000 | | | | 14,401,872 | |
| | | | |
Florida Mid-Bay Bridge Authority Series C | | | 5.00 | | | | 10-1-2019 | | | | 675,000 | | | | 680,501 | |
| | | | |
Florida Mid-Bay Bridge Authority Series C | | | 5.00 | | | | 10-1-2020 | | | | 785,000 | | | | 816,400 | |
| |
| | | | 15,898,773 | |
| | | | | | | | | | | | | | | | |
| | | | |
| Utilities Revenue: 0.05% | | | | | | | | | | | | |
| | | | |
JEA Bulk Power Supply System Scherer 4 Project Series A | | | 3.00 | | | | 10-1-2022 | | | | 1,800,000 | | | | 1,801,530 | |
| | | | | | | | | | | | | | | | |
| |
| | | | 86,095,350 | |
| | | | | | | | | | | | | | | | |
| | | | |
Georgia: 4.08% | | | | | | | | | | | | | | | | |
| | | | |
| Education Revenue: 0.18% | | | | | | | | | | | | |
| | | | |
Walesa GA Downtown Development Authority Reinhardt University Project | | | 2.00 | | | | 8-1-2019 | | | | 7,000,000 | | | | 7,000,840 | |
| | | | | | | | | | | | | | | | |
| | | | |
| Health Revenue: 0.57% | | | | | | | | | | | | |
| | | | |
Gainesville & Hall Counties GA Hospital Authority Health System Project Series B (SIFMA Municipal Swap +0.95%)± | | | 2.85 | | | | 8-15-2035 | | | | 23,000,000 | | | | 23,005,980 | |
| | | | | | | | | | | | | | | | |
| | | | |
| Housing Revenue: 0.66% | | | | | | | | | | | | |
| | | | |
Atlanta GA Urban Residential Finance Authority Multifamily Housing City Lights II Family Apartments Project | | | 1.86 | | | | 12-1-2020 | | | | 11,500,000 | | | | 11,501,610 | |
| | | | |
Macon-Bibb County GA Housing Authority Hallmark Portfolio | | | 2.04 | | | | 4-1-2021 | | | | 15,000,000 | | | | 15,054,900 | |
| |
| | | | 26,556,510 | |
| | | | | | | | | | | | | | | | |
| | | | |
| Industrial Development Revenue: 0.41% | | | | | | | | | | | | |
| | | | |
Monroe County GA PCR Georgia Power Company Plant Scherer Project | | | 2.35 | | | | 10-1-2048 | | | | 16,360,000 | | | | 16,520,001 | |
| | | | | | | | | | | | | | | | |
| | | | |
| Utilities Revenue: 2.26% | | | | | | | | | | | | |
| | | | |
Bartow County GA Development Authority Georgia Power Company Bowen Project | | | 2.05 | | | | 9-1-2029 | | | | 4,100,000 | | | | 4,110,414 | |
| | | | |
Burke County GA Development Authority Georgia Power Company Plant Vogtle Project | | | 1.85 | | | | 12-1-2049 | | | | 17,300,000 | | | | 17,303,633 | |
| | | | |
Burke County GA Development Authority Oglethorpe Power Corporation Vogtle Project Series A | | | 2.40 | | | | 1-1-2040 | | | | 15,995,000 | | | | 16,082,333 | |
| | | | |
Burke County GA Development Authority Oglethorpe Power Corporation Vogtle Project Series F | | | 3.00 | | | | 11-1-2045 | | | | 22,050,000 | | | | 22,466,966 | |
| | | | |
Floyd County GA PCR Georgia Power Company Plant Hammond Project | | | 2.35 | | | | 7-1-2022 | | | | 11,250,000 | | | | 11,360,025 | |
| | | | |
Main Street Natural Gas Incorporated Georgia Gas Project Series B | | | 5.00 | | | | 3-15-2021 | | | | 2,600,000 | | | | 2,738,658 | |
| | | | |
Main Street Natural Gas Incorporated Georgia Gas Project Series C | | | 4.00 | | | | 8-1-2048 | | | | 6,120,000 | | | | 6,686,284 | |
| | | | |
Monroe County GA Development Authority PCR Oglethorpe Power Corporation Scherer Project Series A | | | 2.40 | | | | 1-1-2039 | | | | 9,545,000 | | | | 9,597,116 | |
| |
| | | | 90,345,429 | |
| | | | | | | | | | | | | | | | |
| |
| | | | 163,428,760 | |
| | | | | | | | | | | | | | | | |
| | | | |
Guam: 0.01% | | | | | | | | | | | | | | | | |
| | | | |
| Airport Revenue: 0.01% | | | | | | | | | | | | |
| | | | |
Guam International Airport Authority Series A | | | 5.00 | | | | 10-1-2019 | | | | 450,000 | | | | 453,101 | |
| | | | | | | | | | | | | | | | |
Wells Fargo Short-Term Municipal Bond Fund | 15
Portfolio of investments—June 30, 2019
| | | | | | | | | | | | | | | | |
| | | Interest rate | | | Maturity date | | | Principal | | | Value | |
Hawaii: 0.49% | | | | | | | | | | | | | | | | |
| | | | |
| GO Revenue: 0.31% | | | | | | | | | | | | |
| | | | |
Honolulu HI Rail Transit Project Series H (SIFMA Municipal Swap +0.32%)± | | | 2.22 | % | | | 9-1-2027 | | | $ | 7,600,000 | | | $ | 7,598,480 | |
| | | | |
Honolulu HI Rail Transit Project Series H (SIFMA Municipal Swap +0.32%)± | | | 2.22 | | | | 9-1-2028 | | | | 5,000,000 | | | | 4,999,000 | |
| |
| | | | 12,597,480 | |
| | | | | | | | | | | | | | | | |
| | | | |
| Housing Revenue: 0.18% | | | | | | | | | | | | |
| | | | |
Hawaii Housing Finance & Development Corporation Multifamily Housing Hale Kewalo Apartments Series A (GNMA Insured) | | | 1.90 | | | | 1-1-2021 | | | | 7,160,000 | | | | 7,176,182 | |
| | | | | | | | | | | | | | | | |
| |
| | | | 19,773,662 | |
| | | | | | | | | | | | | | | | |
| | | | |
Illinois: 10.74% | | | | | | | | | | | | | | | | |
| | | | |
| Airport Revenue: 0.92% | | | | | | | | | | | | |
| | | | |
Chicago IL Midway Airport Refunding Bond Second Lien Series A | | | 5.00 | | | | 1-1-2022 | | | | 6,100,000 | | | | 6,599,285 | |
| | | | |
Chicago IL Midway Airport Refunding Bond Second Lien Series A | | | 5.00 | | | | 1-1-2025 | | | | 5,000,000 | | | | 5,681,100 | |
| | | | |
Chicago IL O’Hare International Airport Customer Facility Series 2013 | | | 5.00 | | | | 1-1-2020 | | | | 890,000 | | | | 904,925 | |
| | | | |
Chicago IL O’Hare International Airport Refunding Bond General Senior Lien Series B | | | 5.00 | | | | 1-1-2023 | | | | 5,000,000 | | | | 5,428,450 | |
| | | | |
Chicago IL O’Hare International Airport Refunding Bond General Senior Lien Series B | | | 5.00 | | | | 1-1-2024 | | | | 1,550,000 | | | | 1,680,433 | |
| | | | |
Chicago IL O’Hare International Airport Refunding Bond Passenger Facility | | | 5.00 | | | | 1-1-2023 | | | | 13,720,000 | | | | 14,895,667 | |
| | | | |
Chicago IL O’Hare International Airport Refunding Bond Passenger Facility | | | 5.00 | | | | 1-1-2024 | | | | 1,335,000 | | | | 1,519,337 | |
| |
| | | | 36,709,197 | |
| | | | | | | | | | | | | | | | |
| | | | |
| Education Revenue: 0.36% | | | | | | | | | | | | |
| | | | |
Illinois Finance Authority St. Ignatius College (PNC Bank NA LOC) ø | | | 1.89 | | | | 12-1-2036 | | | | 13,000,000 | | | | 13,000,000 | |
| | | | |
Western Illinois University Auxiliary Facilities System | | | 4.00 | | | | 4-1-2020 | | | | 1,480,000 | | | | 1,479,704 | |
| |
| | | | 14,479,704 | |
| | | | | | | | | | | | | | | | |
| | | | |
| GO Revenue: 2.74% | | | | | | | | | | | | |
| | | | |
Chicago IL Board of Education Refunding Bond Series A (AGM Insured) | | | 5.00 | | | | 12-1-2022 | | | | 500,000 | | | | 545,280 | |
| | | | |
Chicago IL Board of Education Refunding Bond Series A (AGM Insured) | | | 5.00 | | | | 12-1-2023 | | | | 2,000,000 | | | | 2,229,080 | |
| | | | |
Chicago IL Board of Education Series A (National Insured) | | | 5.00 | | | | 12-1-2019 | | | | 895,000 | | | | 905,991 | |
| | | | |
Chicago IL Emergency Telephone System Refunding Bond (National Insured) | | | 5.25 | | | | 1-1-2020 | | | | 3,765,000 | | | | 3,829,946 | |
| | | | |
Chicago IL Park District Harbor Facility Series C | | | 5.00 | | | | 1-1-2022 | | | | 3,155,000 | | | | 3,297,259 | |
| | | | |
Chicago IL Park District Refunding Bonds Series D | | | 5.00 | | | | 1-1-2020 | | | | 1,290,000 | | | | 1,310,021 | |
| | | | |
Chicago IL Park District Refunding Bonds Series D | | | 5.00 | | | | 1-1-2021 | | | | 1,000,000 | | | | 1,044,730 | |
| | | | |
Chicago IL Park District Series A | | | 4.50 | | | | 1-1-2023 | | | | 250,000 | | | | 256,115 | |
| | | | |
Chicago IL Refunding Bond Series B (Ambac Insured) | | | 5.13 | | | | 1-1-2022 | | | | 2,610,000 | | | | 2,684,698 | |
| | | | |
Chicago IL Series C | | | 5.00 | | | | 1-1-2021 | | | | 3,000,000 | | | | 3,159,000 | |
| | | | |
Chicago IL Series C | | | 5.00 | | | | 1-1-2022 | | | | 15,845,000 | | | | 16,768,605 | |
| | | | |
Chicago IL Series C | | | 5.00 | | | | 1-1-2023 | | | | 4,750,000 | | | | 5,109,005 | |
| | | | |
Cook County IL Refunding Bond Series 2016 A | | | 5.00 | | | | 11-15-2020 | | | | 5,430,000 | | | | 5,677,445 | |
| | | | |
Cook County IL Series 2009D | | | 5.00 | | | | 11-15-2020 | | | | 2,220,000 | | | | 2,247,728 | |
| | | | |
Cook County IL Series A | | | 5.00 | | | | 11-15-2019 | | | | 2,275,000 | | | | 2,304,006 | |
| | | | |
Cook County IL Series C | | | 5.00 | | | | 11-15-2020 | | | | 21,615,000 | | | | 21,884,971 | |
| | | | |
Illinois | | | 4.00 | | | | 2-1-2020 | | | | 1,750,000 | | | | 1,773,135 | |
| | | | |
Illinois | | | 5.00 | | | | 2-1-2020 | | | | 2,520,000 | | | | 2,567,804 | |
| | | | |
Illinois | | | 5.00 | | | | 11-1-2021 | | | | 5,000,000 | | | | 5,348,100 | |
| | | | |
Illinois | | | 5.00 | | | | 4-1-2022 | | | | 3,000,000 | | | | 3,235,620 | |
| | | | |
Illinois Refunding Bond | | | 5.00 | | | | 1-1-2020 | | | | 13,515,000 | | | | 13,734,889 | |
| | | | |
Kane County IL School District Series B | | | 2.00 | | | | 2-1-2021 | | | | 880,000 | | | | 887,533 | |
16 | Wells Fargo Short-Term Municipal Bond Fund
Portfolio of investments—June 30, 2019
| | | | | | | | | | | | | | | | |
| | | Interest rate | | | Maturity date | | | Principal | | | Value | |
| | | | |
| GO Revenue (continued) | | | | | | | | | | | | |
| | | | |
Kane, McHenry, Cook & Dekalb Counties IL Community Unit School District #300 | | | 4.25 | % | | | 1-1-2023 | | | $ | 1,000,000 | | | $ | 1,034,190 | |
| | | | |
Kendall, Kane, & Will Counties IL Community Unit School District #308 CAB (AGM Insured) ¤ | | | 0.00 | | | | 2-1-2020 | | | | 1,000,000 | | | | 990,900 | |
| | | | |
McHenry & Kane Counties IL Community Consolidated School District #158 CAB (National Insured) ¤ | | | 0.00 | | | | 1-1-2021 | | | | 1,130,000 | | | | 1,104,835 | |
| | | | |
Waukegan IL Series B (AGM Insured) | | | 4.00 | | | | 12-30-2023 | | | | 500,000 | | | | 545,015 | |
| | | | |
Whiteside & Lee Counties IL Community Unit School District Series A (Build America Mutual Assurance Company Insured) | | | 4.00 | | | | 12-1-2024 | | | | 1,490,000 | | | | 1,637,719 | |
| | | | |
Will County IL Community High School District #210 | | | 5.00 | | | | 1-1-2021 | | | | 1,165,000 | | | | 1,166,538 | |
| | | | |
Will County IL Community School District #161 | | | 4.00 | | | | 1-1-2024 | | | | 2,000,000 | | | | 2,175,640 | |
| | | | |
Winnebago Boone County IL Community College District Rock Valley College Series A (AGM Insured) | | | 5.00 | | | | 1-1-2022 | | | | 500,000 | | | | 539,010 | |
| |
| | | | 109,994,808 | |
| | | | | | | | | | | | | | | | |
| | | | |
| Health Revenue: 1.72% | | | | | | | | | | | | |
| | | | |
Illinois Finance Authority Ascension Health Alliance Senior Credit Group Series E-2 | | | 1.75 | | | | 11-15-2042 | | | | 2,000,000 | | | | 2,008,220 | |
| | | | |
Illinois Finance Authority Centigram Health System Project | | | 5.00 | | | | 9-1-2019 | | | | 2,265,000 | | | | 2,278,590 | |
| | | | |
Illinois Finance Authority Friendship Village of Schaumburg | | | 4.00 | | | | 2-15-2020 | | | | 1,230,000 | | | | 1,227,503 | |
| | | | |
Illinois Finance Authority OSF Healthcare System Prerefunded Bond Series A | | | 6.00 | | | | 5-15-2039 | | | | 14,630,000 | | | | 15,209,202 | |
| | | | |
Illinois Finance Authority Swedish Covenant Hospital Series A | | | 6.00 | | | | 8-15-2038 | | | | 3,460,000 | | | | 3,558,852 | |
| | | | |
Illinois Finance Authority The Admiral at the Lake Project Series A | | | 7.75 | | | | 5-15-2030 | | | | 2,015,000 | | | | 2,124,233 | |
| | | | |
Illinois Finance Authority The Admiral at the Lake Project Series A | | | 8.00 | | | | 5-15-2040 | | | | 20,755,000 | | | | 21,919,148 | |
| | | | |
Illinois Finance Authority The Admiral at the Lake Project Series A | | | 8.00 | | | | 5-15-2046 | | | | 17,295,000 | | | | 18,265,077 | |
| | | | |
Southwestern IL Development Authority Health Facility Memorial Group Incorporated | | | 6.38 | | | | 11-1-2023 | | | | 1,950,000 | | | | 2,202,837 | |
| |
| | | | 68,793,662 | |
| | | | | | | | | | | | | | | | |
| | | | |
| Housing Revenue: 0.62% | | | | | | | | | | | | |
| | | | |
Chicago IL Multifamily Housing Mark Twain Apartments Project | | | 2.20 | | | | 6-1-2021 | | | | 17,000,000 | | | | 17,076,670 | |
| | | | |
Illinois Housing Development Authority (SIFMA Municipal Swap +1.00%) (FNMA LOC, FNMA LIQ)± | | | 2.90 | | | | 5-15-2050 | | | | 7,500,000 | | | | 7,535,100 | |
| | | | |
Illinois Housing Development Authority (GNMA Insured) | | | 5.00 | | | | 8-1-2028 | | | | 350,000 | | | | 357,497 | |
| |
| | | | 24,969,267 | |
| | | | | | | | | | | | | | | | |
| | | | |
| Miscellaneous Revenue: 0.93% | | | | | | | | | | | | |
| | | | |
Chicago IL Board of Education Lease Certificates Refunding Bond Series A (National Insured) | | | 6.00 | | | | 1-1-2020 | | | | 3,260,000 | | | | 3,314,246 | |
| | | | |
Chicago IL Board of Education Series 2018C | | | 5.00 | | | | 12-1-2019 | | | | 4,035,000 | | | | 4,077,004 | |
| | | | |
Illinois Refunding Bond (Build America Mutual Assurance Company Insured) | | | 5.00 | | | | 8-1-2020 | | | | 9,175,000 | | | | 9,505,759 | |
| | | | |
Illinois Refunding Bond | | | 5.00 | | | | 2-1-2022 | | | | 4,375,000 | | | | 4,698,575 | |
| | | | |
Illinois Refunding Bond | | | 5.00 | | | | 2-1-2023 | | | | 6,040,000 | | | | 6,604,982 | |
| | | | |
Illinois Refunding Bond Series 2012 (AGM Insured) | | | 5.00 | | | | 8-1-2020 | | | | 5,000,000 | | | | 5,181,350 | |
| | | | |
Illinois Series 2014 | | | 5.00 | | | | 5-1-2021 | | | | 2,000,000 | | | | 2,110,600 | |
| | | | |
University of Illinois Board of Trustees Certificate of Participation Series A | | | 4.00 | | | | 8-15-2019 | | | | 1,900,000 | | | | 1,905,643 | |
| |
| | | | 37,398,159 | |
| | | | | | | | | | | | | | | | |
| | | | |
| Tax Revenue: 3.10% | | | | | | | | | | | | |
| | | | |
Build Illinois Bonds Junior Obligation Series C | | | 5.00 | | | | 6-15-2022 | | | | 1,940,000 | | | | 2,097,043 | |
| | | | |
Chicago IL Motor Fuel Tax Refunding Bonds Series 2013 | | | 5.00 | | | | 1-1-2020 | | | | 1,120,000 | | | | 1,133,418 | |
| | | | |
Chicago IL Motor Fuel Tax Refunding Bonds Series 2013 | | | 5.00 | | | | 1-1-2021 | | | | 380,000 | | | | 393,137 | |
| | | | |
Chicago IL Motor Fuel Tax Refunding Bonds Series 2013 | | | 5.00 | | | | 1-1-2022 | | | | 955,000 | | | | 1,005,806 | |
Wells Fargo Short-Term Municipal Bond Fund | 17
Portfolio of investments—June 30, 2019
| | | | | | | | | | | | | | | | |
| | | Interest rate | | | Maturity date | | | Principal | | | Value | |
| | | | |
| Tax Revenue (continued) | | | | | | | | | | | | |
| | | | |
Chicago Il Transit Authority Sales Tax Receipts | | | 5.25 | % | | | 12-1-2024 | | | $ | 6,705,000 | | | $ | 7,261,314 | |
| | | | |
Hillside IL Refunding Bond Series 2018 | | | 5.00 | | | | 1-1-2024 | | | | 1,475,000 | | | | 1,526,197 | |
| | | | |
Huntley IL Special Service Area No 6 Special Tax Refunding Bond (Build America Mutual Assurance Company Insured) | | | 2.20 | | | | 3-1-2024 | | | | 1,865,000 | | | | 1,882,699 | |
| | | | |
Illinois Refunding Bond | | | 5.00 | | | | 1-1-2021 | | | | 1,760,000 | | | | 1,839,886 | |
| | | | |
Illinois Regional Transportation Authority Refunding Bond (AGM Insured) | | | 5.75 | | | | 6-1-2021 | | | | 3,000,000 | | | | 3,242,580 | |
| | | | |
Illinois Sales Tax Revenue Junior Obligation Series A | | | 5.00 | | | | 6-15-2023 | | | | 5,825,000 | | | | 6,382,220 | |
| | | | |
Illinois Sales Tax Revenue Refunding Bond Series C | | | 4.00 | | | | 6-15-2023 | | | | 3,315,000 | | | | 3,507,933 | |
| | | | |
Illinois Series 2013 | | | 5.00 | | | | 6-15-2024 | | | | 485,000 | | | | 529,746 | |
| | | | |
Illinois Series A | | | 4.00 | | | | 1-1-2020 | | | | 12,265,000 | | | | 12,404,085 | |
| | | | |
Illinois Series A | | | 4.00 | | | | 1-1-2021 | | | | 2,715,000 | | | | 2,798,351 | |
| | | | |
Illinois Tender Option Bond Trust Receipts/Floater Certificates Series 2017-XG0108 (Barclays Bank plc LOC, Barclays Bank plc LIQ) 144Aø | | | 2.08 | | | | 4-1-2046 | | | | 27,210,000 | | | | 27,210,000 | |
| | | | |
Illinois Tender Option Bond Trust Receipts/Floater Certificates Series 2018-XL0093 (Barclays Bank plc LIQ) 144Aø | | | 2.10 | | | | 1-1-2048 | | | | 10,000,000 | | | | 10,000,000 | |
| | | | |
Metropolitan Pier & Exposition Authority CAB McCormick Place Project Series A (National Insured) ¤ | | | 0.00 | | | | 12-15-2021 | | | | 920,000 | | | | 873,181 | |
| | | | |
Metropolitan Pier & Exposition Authority McCormick Place Project Callable Bond Series B | | | 5.00 | | | | 12-15-2022 | | | | 1,260,000 | | | | 1,264,183 | |
| | | | |
Metropolitan Pier & Exposition Authority McCormick Place Project Non-Callable Bond Series B | | | 5.00 | | | | 12-15-2022 | | | | 7,000,000 | | | | 7,613,130 | |
| | | | |
Metropolitan Pier & Exposition Authority McCormick Place Project Series B | | | 5.00 | | | | 12-15-2020 | | | | 1,845,000 | | | | 1,923,579 | |
| | | | |
Regional Transportation Authority IL Series B-RMKT 1 | | | 1.67 | | | | 6-1-2025 | | | | 18,015,000 | | | | 18,015,000 | |
| | | | |
Sales Tax Securitization Corporation Series A | | | 5.00 | | | | 1-1-2024 | | | | 10,200,000 | | | | 11,444,400 | |
| |
| | | | 124,347,888 | |
| | | | | | | | | | | | | | | | |
| | | | |
| Tobacco Revenue: 0.33% | | | | | | | | | | | | |
| | | | |
Illinois Railsplitter Tobacco Settlement Authority | | | 5.00 | | | | 6-1-2022 | | | | 12,000,000 | | | | 13,125,960 | |
| | | | | | | | | | | | | | | | |
| | | | |
| Water & Sewer Revenue: 0.02% | | | | | | | | | | | | |
| | | | |
Chicago IL Second Lien | | | 5.00 | | | | 11-1-2020 | | | | 740,000 | | | | 771,679 | |
| | | | | | | | | | | | | | | | |
| |
| | | | 430,590,324 | |
| | | | | | | | | | | | | | | | |
| | | | |
Indiana: 1.75% | | | | | | | | | | | | | | | | |
| | | | |
| Health Revenue: 1.25% | | | | | | | | | | | | |
| | | | |
Indiana Finance Authority Health System Franciscan Alliance Incorporated Series B | | | 5.00 | | | | 11-1-2022 | | | | 1,000,000 | | | | 1,113,710 | |
| | | | |
Indiana Finance Authority Health System Franciscan Alliance Incorporated Series B | | | 5.00 | | | | 11-1-2023 | | | | 1,270,000 | | | | 1,453,591 | |
| | | | |
Indiana Finance Authority Health System Franciscan Alliance Incorporated Series B | | | 5.00 | | | | 11-1-2024 | | | | 3,000,000 | | | | 3,520,620 | |
| | | | |
Indiana Finance Authority Health System Franciscan Alliance Incorporated Series C | | | 5.00 | | | | 11-1-2021 | | | | 1,000,000 | | | | 1,081,060 | |
| | | | |
Indiana Finance Authority Health System Franciscan Alliance Incorporated Series C | | | 5.00 | | | | 11-1-2023 | | | | 800,000 | | | | 915,648 | |
| | | | |
Indiana Finance Authority Health System Franciscan Alliance Incorporated Series C | | | 5.00 | | | | 11-1-2024 | | | | 1,000,000 | | | | 1,173,540 | |
| | | | |
Indiana Finance Authority Parkview Health Series A | | | 5.00 | | | | 5-1-2021 | | | | 1,020,000 | | | | 1,083,628 | |
| | | | |
Indiana Finance Authority Parkview Health Series A | | | 5.00 | | | | 5-1-2023 | | | | 1,010,000 | | | | 1,139,795 | |
| | | | |
Indiana Finance Authority Refunding Bond University Health Obligated Group Series B %% | | | 1.65 | | | | 12-1-2042 | | | | 5,000,000 | | | | 5,008,350 | |
| | | | |
Indiana Finance Authority Senior Living Series A | | | 5.00 | | | | 11-15-2022 | | | | 500,000 | | | | 544,050 | |
| | | | |
Indiana Finance Authority Senior Living Series A | | | 5.00 | | | | 11-15-2023 | | | | 500,000 | | | | 555,420 | |
18 | Wells Fargo Short-Term Municipal Bond Fund
Portfolio of investments—June 30, 2019
| | | | | | | | | | | | | | | | |
| | | Interest rate | | | Maturity date | | | Principal | | | Value | |
| | | | |
| Health Revenue (continued) | | | | | | | | | | | | |
| | | | |
Indiana Health & Educational Facility Financing Authority Series 2006B | | | 1.75 | % | | | 11-15-2031 | | | $ | 11,915,000 | | | $ | 12,010,439 | |
| | | | |
Indiana HFFA Ascension Health Series A7 | | | 2.00 | | | | 10-1-2026 | | | | 8,100,000 | | | | 8,103,402 | |
| | | | |
Indiana HFFA Ascension Health Subordinate Bond Credit Group Series A-1 | | | 2.80 | | | | 11-1-2027 | | | | 9,095,000 | | | | 9,104,641 | |
| | | | |
Indiana HFFA Ascension Health Subordinate Bond Credit Group Series A-8 | | | 1.25 | | | | 11-1-2027 | | | | 1,285,000 | | | | 1,282,777 | |
| | | | |
Indiana HFFA Ascension Health Subordinate Credit Group Series 2015 A4 | | | 1.50 | | | | 10-1-2027 | | | | 2,055,000 | | | | 2,055,658 | |
| |
| | | | 50,146,329 | |
| | | | | | | | | | | | | | | | |
| | | | |
| Housing Revenue: 0.28% | | | | | | | | | | | | |
| | | | |
Evansville IN Multifamily Housing Series A | | | 1.85 | | | | 6-1-2020 | | | | 7,400,000 | | | | 7,407,252 | |
| | | | |
Indianapolis IN Multifamily Housing Bethel Townhomes Project Series A | | | 2.30 | | | | 3-1-2021 | | | | 3,795,000 | | | | 3,811,850 | |
| |
| | | | 11,219,102 | |
| | | | | | | | | | | | | | | | |
| | | | |
| Miscellaneous Revenue: 0.06% | | | | | | | | | | | | |
| | | | |
Indiana Bond Bank Special Program Series A | | | 5.25 | | | | 10-15-2021 | | | | 2,000,000 | | | | 2,154,780 | |
| | | | | | | | | | | | | | | | |
| | | | |
| Utilities Revenue: 0.16% | | | | | | | | | | | | |
| | | | |
Warrick County IN Environment Import Vectra Energy Delivery of Indiana Incorporated | | | 2.38 | | | | 9-1-2055 | | | | 6,550,000 | | | | 6,549,542 | |
| | | | | | | | | | | | | | | | |
| |
| | | | 70,069,753 | |
| | | | | | | | | | | | | | | | |
| | | | |
Iowa: 0.76% | | | | | | | | | | | | | | | | |
| | | | |
| Education Revenue: 0.02% | | | | | | | | | | | | |
| | | | |
Iowa Student Loan Liquidity Corporation Series 2011A-1 | | | 4.63 | | | | 12-1-2019 | | | | 760,000 | | | | 766,931 | |
| | | | | | | | | | | | | | | | |
| | | | |
| Health Revenue: 0.55% | | | | | | | | | | | | |
| | | | |
Iowa Finance Authority Revenue Bonds Series E (JPMorgan Chase & Company LOC) ø | | | 1.92 | | | | 2-15-2041 | | | | 22,200,000 | | | | 22,200,000 | |
| | | | | | | | | | | | | | | | |
| | | | |
| Housing Revenue: 0.19% | | | | | | | | | | | | |
| | | | |
Iowa Finance Authority SFMR Series D (1 Month LIBOR +0.35%) (GNMA/FNMA/FHLMC Insured)± | | | 2.03 | | | | 7-1-2048 | | | | 7,500,000 | | | | 7,499,550 | |
| | | | | | | | | | | | | | | | |
| |
| | | | 30,466,481 | |
| | | | | | | | | | | | | | | | |
| | | | |
Kentucky: 3.27% | | | | | | | | | | | | | | | | |
| | | | |
| Health Revenue: 0.77% | | | | | | | | | | | | |
| | | | |
Kentucky EDFA Catholic Health Initiative Series B1 (1 Month LIBOR +0.90%)± | | | 2.56 | | | | 2-1-2046 | | | | 10,720,000 | | | | 10,720,965 | |
| | | | |
Kentucky EDFA Catholic Health Initiative Series B2 (1 Month LIBOR +0.90%)± | | | 2.56 | | | | 2-1-2046 | | | | 11,220,000 | | | | 11,221,010 | |
| | | | |
Louisville & Jefferson Counties KY Catholic Health Initiatives Series A | | | 5.00 | | | | 12-1-2021 | | | | 8,210,000 | | | | 8,829,691 | |
| |
| | | | 30,771,666 | |
| | | | | | | | | | | | | | | | |
| | | | |
| Housing Revenue: 0.64% | | | | | | | | | | | | |
| | | | |
Kentucky Housing Corporation Beecher Phase I Project | | | 2.00 | | | | 3-1-2022 | | | | 5,500,000 | | | | 5,538,665 | |
| | | | |
Kentucky Housing Corporation Jefferson Green Apartments Project | | | 2.20 | | | | 9-1-2022 | | | | 20,000,000 | | | | 20,185,000 | |
| |
| | | | 25,723,665 | |
| | | | | | | | | | | | | | | | |
| | | | |
| Miscellaneous Revenue: 0.06% | | | | | | | | | | | | |
| | | | |
Hopkins County KY Public Properties Corporation Judicial Center Project | | | 3.63 | | | | 6-1-2025 | | | | 1,000,000 | | | | 1,019,670 | |
| | | | |
Pendleton County KY School District Finance Corporation | | | 2.00 | | | | 2-1-2021 | | | | 1,200,000 | | | | 1,208,016 | |
| |
| | | | 2,227,686 | |
| | | | | | | | | | | | | | | | |
| | | | |
| Utilities Revenue: 1.80% | | | | | | | | | | | | |
| | | | |
Kentucky Public Energy Authority Gas Supply Series A-1 | | | 4.00 | | | | 12-1-2049 | | | | 15,490,000 | | | | 17,081,288 | |
| | | | |
Kentucky Public Energy Authority Gas Supply Series B | | | 4.00 | | | | 1-1-2049 | | | | 24,085,000 | | | | 26,576,352 | |
Wells Fargo Short-Term Municipal Bond Fund | 19
Portfolio of investments—June 30, 2019
| | | | | | | | | | | | | | | | |
| | | Interest rate | | | Maturity date | | | Principal | | | Value | |
| | | | |
| Utilities Revenue (continued) | | | | | | | | | | | | |
| | | | |
Kentucky Public Energy Authority Gas Supply Series C | | | 4.00 | % | | | 12-1-2049 | | | $ | 20,000,000 | | | $ | 22,036,800 | |
| | | | |
Louisville & Jefferson Counties KY Metro Government PCR Series A | | | 2.20 | | | | 2-1-2035 | | | | 1,000,000 | | | | 1,000,590 | |
| | | | |
Louisville & Jefferson Counties KY Metro Government PCR Series B | | | 2.55 | | | | 11-1-2027 | | | | 5,500,000 | | | | 5,603,125 | |
| |
| | | | 72,298,155 | |
| | | | | | | | | | | | | | | | |
| |
| | | | 131,021,172 | |
| | | | | | | | | | | | | | | | |
| | | | |
Louisiana: 1.01% | | | | | | | | | | | | | | | | |
| | | | |
| Housing Revenue: 0.08% | | | | | | | | | | | | |
| | | | |
Louisiana Housing Corporation Pine Trace Homes Project | | | 2.40 | | | | 5-1-2021 | | | | 3,000,000 | | | | 3,020,820 | |
| | | | | | | | | | | | | | | | |
| | | | |
| Industrial Development Revenue: 0.75% | | | | | | | | | | | | |
| | | | |
St. James Parish LA Nucor Steel LLC Project Gulf Opportunity Zone Series A-1 ø | | | 2.09 | | | | 11-1-2040 | | | | 30,000,000 | | | | 30,000,000 | |
| | | | | | | | | | | | | | | | |
| | | | |
| Tax Revenue: 0.08% | | | | | | | | | | | | |
| | | | |
Louisiana Local Government Environmental Facilities & CDA Series 2015 (Build America Mutual Assurance Company Insured) | | | 5.00 | | | | 12-1-2020 | | | | 1,135,000 | | | | 1,191,500 | |
| | | | |
Louisiana Regional Transit Authority CAB (National Insured) ¤ | | | 0.00 | | | | 12-1-2021 | | | | 2,360,000 | | | | 2,118,430 | |
| |
| | | | 3,309,930 | |
| | | | | | | | | | | | | | | | |
| | | | |
| Utilities Revenue: 0.10% | | | | | | | | | | | | |
| | | | |
Lafayette LA Refunding Bond | | | 5.00 | | | | 11-1-2023 | | | | 3,680,000 | | | | 4,108,646 | |
| | | | | | | | | | | | | | | | |
| |
| | | | 40,439,396 | |
| | | | | | | | | | | | | | | | |
| | | | |
Maine: 0.01% | | | | | | | | | | | | | | | | |
| | | | |
| Education Revenue: 0.01% | | | | | | | | | | | | |
| | | | |
Maine Finance Authority Supplemental Education Loan Program Class A Series A-1 (AGM Insured) | | | 5.00 | | | | 12-1-2025 | | | | 425,000 | | | | 498,283 | |
| | | | | | | | | | | | | | | | |
| | | | |
Maryland: 2.23% | | | | | | | | | | | | | | | | |
| | | | |
| GO Revenue: 0.65% | | | | | | | | | | | | |
| | | | |
Maryland State & Local Facilities Loan of 2015 Series A | | | 5.00 | | | | 3-1-2024 | | | | 23,060,000 | | | | 26,085,011 | |
| | | | | | | | | | | | | | | | |
|
| Health Revenue: 0.02% | |
| | | | |
Rockville MD Mayor and Council Economic Development Ingleside King Farm Project Series A-1 | | | 5.00 | | | | 11-1-2020 | | | | 850,000 | | | | 879,427 | |
| | | | | | | | | | | | | | | | |
| | | | |
| Housing Revenue: 1.04% | | | | | | | | | | | | |
| | | | |
Maryland CDA Department of Housing & Community Multifamily Development Huntington Apartments Series C 144A | | | 2.34 | | | | 4-1-2021 | | | | 7,500,000 | | | | 7,528,800 | |
| | | | |
Maryland CDA Department of Housing & Community Multifamily Development Lakeview Victoria Park Series H | | | 3.00 | | | | 11-1-2020 | | | | 9,000,000 | | | | 9,095,850 | |
| | | | |
Maryland CDA Department of Housing & Community Multifamily Development Orchard Park Series F | | | 2.52 | | | | 8-1-2020 | | | | 15,000,000 | | | | 15,055,500 | |
| | | | |
Maryland CDA Department of Housing & Community Multifamily Development Zions Towers Series A (FHA Insured) | | | 2.44 | | | | 3-1-2020 | | | | 10,000,000 | | | | 10,020,200 | |
| |
| | | | 41,700,350 | |
| | | | | | | | | | | | | | | | |
| | | | |
| Industrial Development Revenue: 0.33% | | | | | | | | | | | | |
| | | | |
Maryland Economic Development Corporation PCR Potomac Electric Power Company Project | | | 1.70 | | | | 9-1-2022 | | | | 13,250,000 | | | | 13,301,940 | |
| | | | | | | | | | | | | | | | |
20 | Wells Fargo Short-Term Municipal Bond Fund
Portfolio of investments—June 30, 2019
| | | | | | | | | | | | | | | | |
| | | Interest rate | | | Maturity date | | | Principal | | | Value | |
| Miscellaneous Revenue: 0.19% | | | | | | | | | | | | |
| | | | |
Maryland CDA Department of Housing & Community Multifamily Development Park Square Homes Series E | | | 2.53 | % | | | 8-1-2020 | | | $ | 7,500,000 | | | $ | 7,528,575 | |
| | | | | | | | | | | | | | | | |
| |
| | | | 89,495,303 | |
| | | | | | | | | | | | | | | | |
| | | | |
Massachusetts: 3.14% | | | | | | | | | | | | | | | | |
| | | | |
| Education Revenue: 0.30% | | | | | | | | | | | | |
| | | | |
Massachusetts Educational Financing Authority AMT Issue J | | | 5.00 | | | | 7-1-2021 | | | | 1,280,000 | | | | 1,363,238 | |
| | | | |
Massachusetts Educational Financing Authority AMT Issue K Series A | | | 5.00 | | | | 7-1-2022 | | | | 1,000,000 | | | | 1,094,890 | |
| | | | |
Massachusetts Educational Financing Authority Series A | | | 5.00 | | | | 1-1-2020 | | | | 3,000,000 | | | | 3,050,010 | |
| | | | |
Massachusetts Educational Financing Authority Series A | | | 5.00 | | | | 1-1-2022 | | | | 4,115,000 | | | | 4,442,348 | |
| | | | |
Massachusetts Educational Financing Authority Series K | | | 5.00 | | | | 7-1-2019 | | | | 2,000,000 | | | | 2,000,000 | |
| |
| | | | 11,950,486 | |
| | | | | | | | | | | | | | | | |
| | | | |
| Health Revenue: 0.40% | | | | | | | | | | | | |
| | | | |
Massachusetts Development Finance Agency Partners Healthcare System Issue Series S-3 (SIFMA Municipal Swap +0.50%)± | | | 2.40 | | | | 7-1-2038 | | | | 5,000,000 | | | | 5,002,400 | |
| | | | |
Massachusetts Development Finance Agency Partners Healthcare System Series S-5 (SIFMA Municipal Swap +0.42%)± | | | 2.32 | | | | 7-1-2044 | | | | 11,230,000 | | | | 11,227,193 | |
| |
| | | | 16,229,593 | |
| | | | | | | | | | | | | | | | |
| | | | |
| Housing Revenue: 1.18% | | | | | | | | | | | | |
| | | | |
Massachusetts HFA Construction Loan Notes Series A | | | 1.85 | | | | 6-1-2020 | | | | 5,750,000 | | | | 5,750,978 | |
| | | | |
Massachusetts HFA Construction Loan Notes Series B | | | 2.05 | | | | 12-1-2021 | | | | 26,875,000 | | | | 26,937,619 | |
| | | | |
Massachusetts HFA Multifamily Conduit Van Brodie Mill Series A (TD Bank NA LOC) | | | 2.00 | | | | 7-1-2020 | | | | 7,000,000 | | | | 7,001,610 | |
| | | | |
Massachusetts HFA Single Family Series 200 (1 Month LIBOR +0.38%)± | | | 2.09 | | | | 12-1-2048 | | | | 7,500,000 | | | | 7,500,000 | |
| |
| | | | 47,190,207 | |
| | | | | | | | | | | | | | | | |
| | | | |
| Miscellaneous Revenue: 0.94% | | | | | | | | | | | | |
| | | | |
Massachusetts Consolidated Loan Series D | | | 1.05 | | | | 8-1-2043 | | | | 12,860,000 | | | | 12,811,775 | |
| | | | |
Massachusetts Consolidated Loan Subordinate Bond Series D-2 | | | 1.70 | | | | 8-1-2043 | | | | 24,550,000 | | | | 24,689,935 | |
| |
| | | | 37,501,710 | |
| | | | | | | | | | | | | | | | |
|
| Transportation Revenue: 0.32% | |
| | | | |
Massachusetts Department of Transportation Refunding Bond | | | 5.00 | | | | 1-1-2039 | | | | 11,500,000 | | | | 12,861,255 | |
| | | | | | | | | | | | | | | | |
| |
| | | | 125,733,251 | |
| | | | | | | | | | | | | | | | |
| | | | |
Michigan: 2.26% | | | | | | | | | | | | | | | | |
| | | | |
| Airport Revenue: 0.24% | | | | | | | | | | | | |
| | | | |
Wayne County MI Airport Authority Refunding Bond Series A | | | 5.00 | | | | 12-1-2019 | | | | 9,405,000 | | | | 9,538,175 | |
| | | | | | | | | | | | | | | | |
| | | | |
| Education Revenue: 0.02% | | | | | | | | | | | | |
| | | | |
Western Michigan University Refunding Bond | | | 5.00 | | | | 11-15-2020 | | | | 1,000,000 | | | | 1,048,370 | |
| | | | | | | | | | | | | | | | |
| | | | |
| GO Revenue: 0.61% | | | | | | | | | | | | |
| | | | |
Allendale MI Public School District Series A (Qualified School Board Loan Fund Insured) | | | 3.00 | | | | 11-1-2021 | | | | 895,000 | | | | 927,095 | |
| | | | |
Birmingham MI City School District | | | 5.00 | | | | 11-1-2019 | | | | 5,970,000 | | | | 6,043,073 | |
| | | | |
Caledonia MI Community Schools (Qualified School Board Loan Fund Insured) | | | 5.00 | | | | 5-1-2020 | | | | 500,000 | | | | 515,310 | |
| | | | |
Caledonia MI Community Schools (Qualified School Board Loan Fund Insured) | | | 5.00 | | | | 5-1-2021 | | | | 1,140,000 | | | | 1,216,471 | |
| | | | |
Detroit MI Series 2018 | | | 5.00 | | | | 4-1-2021 | | | | 620,000 | | | | 643,678 | |
Wells Fargo Short-Term Municipal Bond Fund | 21
Portfolio of investments—June 30, 2019
| | | | | | | | | | | | | | | | |
| | | Interest rate | | | Maturity date | | | Principal | | | Value | |
| | | | |
| GO Revenue (continued) | | | | | | | | | | | | |
| | | | |
Flushing MI Community School District (Qualified School Board Loan Fund Insured) | | | 4.00 | % | | | 5-1-2021 | | | $ | 1,135,000 | | | $ | 1,186,234 | |
| | | | |
Gibraltar MI School District (Qualified School Board Loan Fund Insured) | | | 5.00 | | | | 5-1-2020 | | | | 1,100,000 | | | | 1,133,869 | |
| | | | |
Gibraltar MI School District (Qualified School Board Loan Fund Insured) | | | 5.00 | | | | 5-1-2021 | | | | 1,185,000 | | | | 1,264,928 | |
| | | | |
Grand Ledge MI Public School District (Qualified School Board Loan Fund Insured) | | | 5.00 | | | | 5-1-2020 | | | | 2,680,000 | | | | 2,760,695 | |
| | | | |
Haslett MI Public Schools (Qualified School Board Loan Fund Insured) | | | 4.00 | | | | 5-1-2020 | | | | 370,000 | | | | 378,033 | |
| | | | |
Haslett MI Public Schools (Qualified School Board Loan Fund Insured) | | | 5.00 | | | | 5-1-2021 | | | | 500,000 | | | | 532,785 | |
| | | | |
Lake Orion MI Community School District 2015 Refunding Bond (Qualified School Board Loan Fund Insured) | | | 5.00 | | | | 5-1-2020 | | | | 1,550,000 | | | | 1,596,671 | |
| | | | |
Lake Orion MI Community School District 2016 Refunding Bond (Qualified School Board Loan Fund Insured) | | | 5.00 | | | | 5-1-2020 | | | | 1,390,000 | | | | 1,431,853 | |
| | | | |
Lake Orion MI Community School District 2016 Refunding Bond (Qualified School Board Loan Fund Insured) | | | 5.00 | | | | 5-1-2021 | | | | 1,385,000 | | | | 1,476,341 | |
| | | | |
South Lyon MI Community School District | | | 4.00 | | | | 5-1-2020 | | | | 1,425,000 | | | | 1,456,664 | |
| | | | |
Southgate MI Community School District (Build America Mutual Assurance Company Insured) | | | 5.00 | | | | 5-1-2020 | | | | 500,000 | | | | 515,395 | |
| | | | |
Warren Woods MI Public Schools (Qualified School Board Loan Fund Insured) | | | 5.00 | | | | 5-1-2020 | | | | 1,445,000 | | | | 1,488,509 | |
| |
| | | | 24,567,604 | |
| | | | | | | | | | | | | | | | |
| | | | |
| Health Revenue: 0.21% | | | | | | | | | | | | |
| | | | |
Michigan Finance Authority Crittenden Hospital Medical Center Series A | | | 4.13 | | | | 6-1-2032 | | | | 4,290,000 | | | | 4,626,422 | |
| | | | |
Michigan Hospital Finance Authority Ascension Health Subordinate Credit Group Series 2005 A-4 | | | 1.63 | | | | 11-1-2027 | | | | 3,660,000 | | | | 3,661,940 | |
| |
| | | | 8,288,362 | |
| | | | | | | | | | | | | | | | |
| | | | |
| Miscellaneous Revenue: 0.41% | | | | | | | | | | | | |
| | | | |
Michigan Finance Authority Senior Lien Distributable State Aid Charter County of Wayne Criminal Justice Center Project | | | 5.00 | | | | 11-1-2022 | | | | 1,150,000 | | | | 1,283,147 | |
| | | | |
Michigan Finance Authority Unemployment Obligation Assessment Series B | | | 5.00 | | | | 1-1-2020 | | | | 15,000,000 | | | | 15,026,850 | |
| |
| | | | 16,309,997 | |
| | | | | | | | | | | | | | | | |
|
| Tax Revenue: 0.03% | |
| | | | |
Michigan Finance Authority Local Government Loan Program Series 2014H-1 | | | 5.00 | | | | 10-1-2022 | | | | 1,075,000 | | | | 1,156,367 | |
| | | | | | | | | | | | | | | | |
| | | | |
| Water & Sewer Revenue: 0.74% | | | | | | | | | | | | |
| | | | |
Detroit MI Sewage Disposal System Series A (AGM Insured) | | | 5.25 | | | | 7-1-2019 | | | | 2,615,000 | | | | 2,615,000 | |
| | | | |
Michigan Finance Authority Refunding Bond Local Government Loan Program Detroit Water & Sewer Series D-3 (National Insured) | | | 5.00 | | | | 7-1-2019 | | | | 7,000,000 | | | | 7,000,000 | |
| | | | |
Michigan Finance Authority Refunding Bond Local Government Loan Program Detroit Water & Sewer Series D-6 (National Insured) | | | 5.00 | | | | 7-1-2019 | | | | 1,500,000 | | | | 1,500,000 | |
| | | | |
Michigan Finance Authority Refunding Bond Local Government Loan Program Detroit Water & Sewer Series D-6 (National Insured) | | | 5.00 | | | | 7-1-2020 | | | | 1,800,000 | | | | 1,862,856 | |
| | | | |
Michigan Finance Authority Refunding Bond Second Lien Detroit Water & Sewer Series C-5 (National Insured) | | | 5.00 | | | | 7-1-2019 | | | | 7,000,000 | | | | 7,000,000 | |
| | | | |
Michigan Finance Authority Refunding Bond Second Lien Detroit Water & Sewer Series C-7 (National Insured) | | | 5.00 | | | | 7-1-2019 | | | | 2,500,000 | | | | 2,500,000 | |
| | | | |
Michigan Finance Authority Refunding Bond Second Lien Detroit Water & Sewer Series C-7 (National Insured) | | | 5.00 | | | | 7-1-2020 | | | | 3,835,000 | | | | 3,968,918 | |
| | | | |
Michigan Finance Authority Refunding Bond Second Lien Detroit Water & Sewer Series C-7 (National Insured) | | | 5.00 | | | | 7-1-2021 | | | | 3,095,000 | | | | 3,300,044 | |
| |
| | | | 29,746,818 | |
| | | | | | | | | | | | | | | | |
| |
| | | | 90,655,693 | |
| | | | | | | | | | | | | | | | |
22 | Wells Fargo Short-Term Municipal Bond Fund
Portfolio of investments—June 30, 2019
| | | | | | | | | | | | | | | | |
| | | Interest rate | | | Maturity date | | | Principal | | | Value | |
Minnesota: 0.89% | | | | | | | | | | | | | | | | |
| | | | |
| GO Revenue: 0.04% | | | | | | | | | | | | |
| | | | |
Hastings MN Independent School District #200 Series A (South Dakota Credit Program Insured) ¤ | | | 0.00 | % | | | 2-1-2023 | | | $ | 815,000 | | | $ | 769,116 | |
| | | | |
Hastings MN Independent School District #200 Series A (South Dakota Credit Program Insured) ¤ | | | 0.00 | | | | 2-1-2024 | | | | 1,015,000 | | | | 936,591 | |
| |
| | | | 1,705,707 | |
| | | | | | | | | | | | | | | | |
| | | | |
| Health Revenue: 0.17% | | | | | | | | | | | | |
| | | | |
Kanabec County MN Firstlight Health Kanabec Hospital | | | 2.75 | | | | 12-1-2019 | | | | 7,000,000 | | | | 7,002,310 | |
| | | | | | | | | | | | | | | | |
| | | | |
| Housing Revenue: 0.59% | | | | | | | | | | | | |
| | | | |
Dakota County Community Development Agency Senior Multifamily Housing West St. Paul Apartments Project Series A | | | 2.25 | | | | 1-1-2022 | | | | 6,285,000 | | | | 6,325,161 | |
| | | | |
Dakota County Community Development Agency Senior Multifamily Housing West St. Paul Apartments Project Series B | | | 3.80 | | | | 7-1-2022 | | | | 6,325,000 | | | | 6,361,938 | |
| | | | |
Minnesota HFA Series D (SIFMA Municipal Swap +0.43%) (GNMA/FNMA/FHLMC Insured)± | | | 2.33 | | | | 1-1-2045 | | | | 11,000,000 | | | | 10,941,700 | |
| |
| | | | 23,628,799 | |
| | | | | | | | | | | | | | | | |
| | | | |
| Miscellaneous Revenue: 0.09% | | | | | | | | | | | | |
| | | | |
Duluth MN Independent School District Certificates of Participation Series B (South Dakota Credit Program Insured) | | | 5.00 | | | | 2-1-2024 | | | | 425,000 | | | | 485,078 | |
| | | | |
Duluth MN Independent School District Certificates of Participation Series B (South Dakota Credit Program Insured) | | | 5.00 | | | | 2-1-2025 | | | | 375,000 | | | | 437,704 | |
| | | | |
Minneapolis & St. Paul MN Housing & RDA Children’s Hospital Clinics Series A (AGM Insured, U.S. Bank NA SPA) ø | | | 1.33 | | | | 8-15-2037 | | | | 2,600,000 | | | | 2,600,000 | |
| |
| | | | 3,522,782 | |
| | | | | | | | | | | | | | | | |
| |
| | | | 35,859,598 | |
| | | | | | | | | | | | | | | | |
|
Mississippi: 0.71% | |
| | | | |
| Housing Revenue: 0.54% | | | | | | | | | | | | |
| | | | |
Mississippi Home Corporation Multifamily Vicksburg Housing Authority RAD Project (GNMA/FNMA/FHLMC Insured) | | | 1.91 | | | | 12-1-2020 | | | | 21,500,000 | | | | 21,527,950 | |
| | | | | | | | | | | | | | | | |
| | | | |
| Utilities Revenue: 0.17% | | | | | | | | | | | | |
| | | | |
Mississippi Business Finance Corporation Mississippi Power Company Project Series 2010 | | | 2.75 | | | | 12-1-2040 | | | | 6,750,000 | | | | 6,824,723 | |
| | | | | | | | | | | | | | | | |
| |
| | | | 28,352,673 | |
| | | | | | | | | | | | | | | | |
| | | | |
Missouri: 1.19% | | | | | | | | | | | | | | | | |
| | | | |
| GO Revenue: 0.17% | | | | | | | | | | | | |
| | | | |
Kansas City MO Series A | | | 5.00 | | | | 2-1-2020 | | | | 1,495,000 | | | | 1,527,232 | |
| | | | |
St. Louis MO Special Administrative Board The Transitional School Direct Deposit Program | | | 4.00 | | | | 4-1-2022 | | | | 5,030,000 | | | | 5,384,816 | |
| |
| | | | 6,912,048 | |
| | | | | | | | | | | | | | | | |
| | | | |
| Health Revenue: 0.08% | | | | | | | | | | | | |
| | | | |
Kirkwood MO IDA Retirement Community Series A | | | 8.25 | | | | 5-15-2045 | | | | 3,000,000 | | | | 3,174,720 | |
| | | | | | | | | | | | | | | | |
| | | | |
| Industrial Development Revenue: 0.60% | | | | | | | | | | | | |
| | | | |
Missouri Environmental Improvement and Energy Resources Authority Kansas City Power And Light Company Project | | | 2.75 | | | | 5-1-2038 | | | | 23,400,000 | | | | 23,827,752 | |
| | | | | | | | | | | | | | | | |
Wells Fargo Short-Term Municipal Bond Fund | 23
Portfolio of investments—June 30, 2019
| | | | | | | | | | | | | | | | |
| | | Interest rate | | | Maturity date | | | Principal | | | Value | |
| Miscellaneous Revenue: 0.30% | | | | | | | | | | | | |
| | | | |
Missouri Development Finance Board Kauffman Center For The Performing Arts Series A (PNC Bank NA SPA) ø | | | 1.94 | % | | | 6-1-2037 | | | $ | 12,000,000 | | | $ | 12,000,000 | |
| | | | | | | | | | | | | | | | |
| | | | |
| Tax Revenue: 0.04% | | | | | | | | | | | | |
| | | | |
Arnold MO Real Property Arnold Triangle Redevelopment Project Series A | | | 3.75 | | | | 5-1-2023 | | | | 1,620,000 | | | | 1,646,552 | |
| | | | | | | | | | | | | | | | |
| |
| | | | 47,561,072 | |
| | | | | | | | | | | | | | | | |
| | | | |
Nebraska: 0.15% | | | | | | | | | | | | | | | | |
| | | | |
| Housing Revenue: 0.12% | | | | | | | | | | | | |
| | | | |
Douglas Country NE Housing Authority Sorensen Senior Residences Project Series A | | | 2.05 | | | | 3-1-2020 | | | | 5,000,000 | | | | 5,003,000 | |
| | | | | | | | | | | | | | | | |
| | | | |
| Utilities Revenue: 0.03% | | | | | | | | | | | | |
| | | | |
Nebraska Public Power Generation Agency Whelan Energy Center Unit 2 Series A | | | 5.00 | | | | 1-1-2020 | | | | 1,000,000 | | | | 1,017,880 | |
| | | | | | | | | | | | | | | | |
| |
| | | | 6,020,880 | |
| | | | | | | | | | | | | | | | |
| | | | |
Nevada: 0.26% | | | | | | | | | | | | | | | | |
| | | | |
| Airport Revenue: 0.05% | | | | | | | | | | | | |
| | | | |
Clark County NV Airport Jet Aviation Fuel Tax Series A | | | 5.00 | | | | 7-1-2019 | | | | 1,000,000 | | | | 1,000,000 | |
| | | | |
Clark County NV Airport Jet Aviation Fuel Tax Series A | | | 5.00 | | | | 7-1-2020 | | | | 1,000,000 | | | | 1,032,590 | |
| |
| | | | 2,032,590 | |
| | | | | | | | | | | | | | | | |
| | | | |
| GO Revenue: 0.12% | | | | | | | | | | | | |
| | | | |
Clark County NV School District Series C | | | 5.00 | | | | 6-15-2022 | | | | 2,000,000 | | | | 2,205,300 | |
| | | | |
Clark County NV School District Series D | | | 5.00 | | | | 6-15-2021 | | | | 2,395,000 | | | | 2,561,932 | |
| |
| | | | 4,767,232 | |
| | | | | | | | | | | | | | | | |
|
| Industrial Development Revenue: 0.02% | |
| | | | |
Clark County NV PCR | | | 1.88 | | | | 6-1-2031 | | | | 880,000 | | | | 877,800 | |
| | | | | | | | | | | | | | | | |
| | | | |
| Utilities Revenue: 0.07% | | | | | | | | | | | | |
| | | | |
Washoe County NV Sierra Pacific Power Series B | | | 3.00 | | | | 3-1-2036 | | | | 520,000 | | | | 541,455 | |
| | | | |
Washoe County NV Water Facility Refunding Bond Series F | | | 2.05 | | | | 3-1-2036 | | | | 2,000,000 | | | | 2,017,060 | |
| |
| | | | 2,558,515 | |
| | | | | | | | | | | | | | | | |
| |
| | | | 10,236,137 | |
| | | | | | | | | | | | | | | | |
| | | | |
New Hampshire: 0.13% | | | | | | | | | | | | | | | | |
| | | | |
| Health Revenue: 0.07% | | | | | | | | | | | | |
| | | | |
New Hampshire HEFA Catholic Medical Center | | | 4.00 | | | | 7-1-2019 | | | | 2,635,000 | | | | 2,635,000 | |
| | | | | | | | | | | | | | | | |
| | | | |
| Housing Revenue: 0.06% | | | | | | | | | | | | |
| | | | |
New Hampshire HFA Multifamily Housing Series 1 (FHA Insured) | | | 1.75 | | | | 1-1-2020 | | | | 2,455,000 | | | | 2,459,124 | |
| | | | | | | | | | | | | | | | |
| |
| | | | 5,094,124 | |
| | | | | | | | | | | | | | | | |
| | | | |
New Jersey: 6.49% | | | | | | | | | | | | | | | | |
| | | | |
| Education Revenue: 0.28% | | | | | | | | | | | | |
| | | | |
New Jersey EDA Student Loan Series 1 | | | 5.50 | | | | 12-1-2021 | | | | 1,000,000 | | | | 1,087,980 | |
| | | | |
New Jersey Higher Education Assistance Authority Series A1 | | | 5.00 | | | | 12-1-2020 | | | | 9,775,000 | | | | 10,223,282 | |
| |
| | | | 11,311,262 | |
| | | | | | | | | | | | | | | | |
24 | Wells Fargo Short-Term Municipal Bond Fund
Portfolio of investments—June 30, 2019
| | | | | | | | | | | | | | | | |
| | | Interest rate | | | Maturity date | | | Principal | | | Value | |
| GO Revenue: 0.22% | | | | | | | | | | | | |
| | | | |
Andover NJ Regional School District Refunding School Bond Series 2014 (Build America Mutual Assurance Company Insured) | | | 3.00 | % | | | 2-15-2020 | | | $ | 515,000 | | | $ | 520,315 | |
| | | | |
New Jersey TTFA Transit System Series A | | | 5.75 | | | | 6-15-2020 | | | | 2,275,000 | | | | 2,361,245 | |
| | | | |
Trenton City NJ Refunding Bond | | | 4.00 | | | | 7-15-2019 | | | | 1,905,000 | | | | 1,906,372 | |
| | | | |
Trenton City NJ Refunding Bond | | | 4.00 | | | | 7-15-2020 | | | | 1,685,000 | | | | 1,713,106 | |
| | | | |
Trenton City NJ Refunding Bond (Build America Mutual Assurance Company Insured) | | | 5.00 | | | | 12-1-2020 | | | | 1,675,000 | | | | 1,755,718 | |
| | | | |
Winslow Township NJ Board of Education Refunding Bond | | | 4.00 | | | | 8-1-2019 | | | | 525,000 | | | | 526,129 | |
| |
| | | | 8,782,885 | |
| | | | | | | | | | | | | | | | |
| | | | |
| Housing Revenue: 2.21% | | | | | | | | | | | | |
| | | | |
New Jersey Housing & Mortgage Finance Agency Multifamily Series A | | | 2.00 | | | | 11-1-2021 | | | | 325,000 | | | | 327,740 | |
| | | | |
New Jersey Housing & Mortgage Finance Agency Multifamily Series B | | | 1.65 | | | | 5-1-2020 | | | | 4,605,000 | | | | 4,611,401 | |
| | | | |
New Jersey Housing & Mortgage Finance Agency Multifamily Series B | | | 2.00 | | | | 5-1-2021 | | | | 14,335,000 | | | | 14,444,519 | |
| | | | |
New Jersey Housing & Mortgage Finance Agency Multifamily Series C | | | 2.41 | | | | 10-1-2021 | | | | 27,500,000 | | | | 27,777,475 | |
| | | | |
New Jersey Housing & Mortgage Finance Agency Single Family Housing Series B | | | 2.60 | | | | 10-1-2021 | | | | 5,930,000 | | | | 6,002,702 | |
| | | | |
New Jersey Housing & Mortgage Finance Agency Single Family Housing Series B | | | 2.70 | | | | 4-1-2022 | | | | 6,060,000 | | | | 6,162,293 | |
| | | | |
New Jersey Housing & Mortgage Finance Agency Single Family Housing Series B | | | 2.80 | | | | 10-1-2022 | | | | 5,655,000 | | | | 5,772,285 | |
| | | | |
New Jersey Housing & Mortgage Finance Agency Single Family Housing Series B | | | 2.90 | | | | 4-1-2023 | | | | 6,235,000 | | | | 6,400,103 | |
| | | | |
New Jersey Housing & Mortgage Finance Agency Single Family Housing Series B | | | 2.95 | | | | 10-1-2023 | | | | 5,840,000 | | | | 6,022,792 | |
| | | | |
New Jersey Housing & Mortgage Finance Agency Single Family Housing Series B | | | 3.10 | | | | 4-1-2024 | | | | 2,760,000 | | | | 2,871,670 | |
| | | | |
New Jersey Housing & Mortgage Finance Agency Single Family Housing Series B | | | 3.25 | | | | 4-1-2025 | | | | 3,140,000 | | | | 3,290,657 | |
| | | | |
New Jersey Housing & Mortgage Finance Agency Villa Victoria Apartments Project Series F | | | 2.43 | | | | 11-1-2021 | | | | 5,000,000 | | | | 5,049,600 | |
| |
| | | | 88,733,237 | |
| | | | | | | | | | | | | | | | |
| | | | |
| Miscellaneous Revenue: 1.99% | | | | | | | | | | | | |
| | | | |
New Jersey EDA Prerefunded Bond | | | 5.00 | | | | 12-15-2019 | | | | 285,000 | | | | 289,677 | |
| | | | |
New Jersey EDA Unrefunded Bond | | | 5.00 | | | | 12-15-2019 | | | | 715,000 | | | | 726,047 | |
| | | | |
New Jersey EDA School Facilities Construction Bond Series DDD | | | 5.00 | | | | 6-15-2023 | | | | 3,000,000 | | | | 3,340,860 | |
| | | | |
New Jersey EDA School Facilities Construction Bond Series DDD | | | 5.00 | | | | 6-15-2024 | | | | 2,605,000 | | | | 2,964,751 | |
| | | | |
New Jersey EDA School Facilities Construction Bonds Series K (National Insured) | | | 5.25 | | | | 12-15-2021 | | | | 1,040,000 | | | | 1,126,726 | |
| | | | |
New Jersey EDA School Facilities Construction Bonds Series NN | | | 5.00 | | | | 3-1-2022 | | | | 405,000 | | | | 437,635 | |
| | | | |
New Jersey EDA School Facilities Construction Refunding Bond Series NN | | | 5.00 | | | | 3-1-2021 | | | | 5,020,000 | | | | 5,267,637 | |
| | | | |
New Jersey EDA Series BBB | | | 5.00 | | | | 6-15-2022 | | | | 6,000,000 | | | | 6,534,000 | |
| | | | |
New Jersey EDA Series BBB | | | 5.00 | | | | 6-15-2023 | | | | 4,000,000 | | | | 4,454,480 | |
| | | | |
New Jersey EDA Series XX | | | 5.00 | | | | 6-15-2022 | | | | 7,500,000 | | | | 8,167,500 | |
| | | | |
New Jersey EDA Transportation Project New Jersey Transit Corporation Project Series B | | | 5.00 | | | | 11-1-2021 | | | | 2,490,000 | | | | 2,675,181 | |
| | | | |
New Jersey EDA Transportation Project New Jersey Transit Corporation Project Series B | | | 5.00 | | | | 11-1-2022 | | | | 26,000,000 | | | | 28,635,360 | |
| | | | |
New Jersey HFFA Greystone Park Psychiatric Hospital Project Series B | | | 5.00 | | | | 9-15-2019 | | | | 2,135,000 | | | | 2,148,728 | |
| | | | |
New Jersey School Facilities Construction Prerefunded Bond Series EE | | | 5.00 | | | | 9-1-2020 | | | | 1,650,000 | | | | 1,718,112 | |
| | | | |
New Jersey TTFA Series A | | | 5.00 | | | | 12-15-2019 | | | | 3,000,000 | | | | 3,046,350 | |
| | | | |
New Jersey TTFA Series A | | | 5.00 | | | | 6-15-2020 | | | | 1,000,000 | | | | 1,030,860 | |
Wells Fargo Short-Term Municipal Bond Fund | 25
Portfolio of investments—June 30, 2019
| | | | | | | | | | | | | | | | |
| | | Interest rate | | | Maturity date | | | Principal | | | Value | |
| | | | |
| Miscellaneous Revenue (continued) | | | | | | | | | | | | |
| | | | |
Newark NJ Housing Authority Newark Redevelopment Project Refunding Bond (National Insured) | | | 5.25 | % | | | 1-1-2020 | | | $ | 2,170,000 | | | $ | 2,210,492 | |
| | | | |
Newark NJ Housing Authority Newark Redevelopment Project Refunding Bond (National Insured) | | | 5.25 | | | | 1-1-2021 | | | | 4,570,000 | | | | 4,814,906 | |
| |
| | | | 79,589,302 | |
| | | | | | | | | | | | | | | | |
| | | | |
| Tax Revenue: 0.05% | | | | | | | | | | | | |
| | | | |
New Jersey Casino Reinvestment Development Authority | | | 4.00 | | | | 11-1-2019 | | | | 1,425,000 | | | | 1,434,391 | |
| | | | |
New Jersey EDA School Facilities Construction Unrefunded Bond Series EE | | | 5.00 | | | | 9-1-2020 | | | | 610,000 | | | | 632,802 | |
| |
| | | | 2,067,193 | |
| | | | | | | | | | | | | | | | |
| | | | |
| Transportation Revenue: 1.74% | | | | | | | | | | | | |
| | | | |
New Jersey TTFA Series A | | | 5.25 | | | | 12-15-2020 | | | | 33,465,000 | | | | 35,152,305 | |
| | | | |
New Jersey TTFA Series A1 | | | 5.00 | | | | 6-15-2020 | | | | 7,000,000 | | | | 7,222,040 | |
| | | | |
New Jersey TTFA Series A1 | | | 5.00 | | | | 6-15-2021 | | | | 5,000,000 | | | | 5,311,600 | |
| | | | |
New Jersey Turnpike Authority Series C-6 (1 Month LIBOR +0.75%)± | | | 2.46 | | | | 1-1-2030 | | | | 21,820,000 | | | | 21,951,793 | |
| |
| | | | 69,637,738 | |
| | | | | | | | | | | | | | | | |
| |
| | | | 260,121,617 | |
| | | | | | | | | | | | | | | | |
| | | | |
New Mexico: 0.79% | | | | | | | | | | | | | | | | |
| | | | |
| Utilities Revenue: 0.79% | | | | | | | | | | | | |
| | | | |
Farmington NM PCR Southern California Edison Company Four Corners Project Series 2011 | | | 1.88 | | | | 4-1-2029 | | | | 5,000,000 | | | | 4,987,500 | |
| | | | |
Farmington NM PCR Southern California Edison Company Four Corners Project Series A | | | 1.88 | | | | 4-1-2029 | | | | 4,950,000 | | | | 4,937,625 | |
| | | | |
New Mexico Municipal Energy Acquisition Authority Gas Supply Subordinate Bond Series B (1 Month LIBOR +0.75%) (Royal Bank of Canada SPA)± | | | 2.39 | | | | 11-1-2039 | | | | 21,725,000 | | | | 21,725,000 | |
| |
| | | | 31,650,125 | |
| | | | | | | | | | | | | | | | |
| | | | |
New York: 7.06% | | | | | | | | | | | | | | | | |
| | | | |
| GO Revenue: 1.10% | | | | | | | | | | | | |
| | | | |
Nassau County NY Prerefunded Bond Series C | | | 5.00 | | | | 10-1-2020 | | | | 3,020,000 | | | | 3,048,086 | |
| | | | |
Nassau County NY Series A | | | 5.00 | | | | 1-1-2020 | | | | 4,000,000 | | | | 4,073,920 | |
| | | | |
Nassau County NY Series F | | | 5.00 | | | | 10-1-2020 | | | | 1,780,000 | | | | 1,796,554 | |
| | | | |
Nassau County NY Unrefunded Bond Series C | | | 5.00 | | | | 10-1-2020 | | | | 45,000 | | | | 45,419 | |
| | | | |
New York NY Series J Subordinate Bond Series J-3 (AGM Insured) (m) | | | 2.34 | | | | 6-1-2036 | | | | 22,125,000 | | | | 22,125,000 | |
| | | | |
Oyster Bay NY Public Improvement | | | 4.00 | | | | 2-15-2020 | | | | 1,000,000 | | | | 1,013,480 | |
| | | | |
Rockland County NY Public Improvement Series C (AGM Insured) | | | 3.00 | | | | 5-1-2020 | | | | 1,390,000 | | | | 1,410,600 | |
| | | | |
Rockland County NY Refunding Bond (Build America Mutual Assurance Company Insured) | | | 3.00 | | | | 2-15-2020 | | | | 630,000 | | | | 636,974 | |
| | | | |
Suffolk County NY TAN | | | 5.00 | | | | 7-24-2019 | | | | 10,000,000 | | | | 10,020,800 | |
| |
| | | | 44,170,833 | |
| | | | | | | | | | | | | | | | |
| | | | |
| Health Revenue: 0.14% | | | | | | | | | | | | |
| | | | |
New York NY Health & Hospital Corporation Health System Series A | | | 5.50 | | | | 2-15-2020 | | | | 5,755,000 | | | | 5,773,128 | |
| | | | | | | | | | | | | | | | |
| | | | |
| Housing Revenue: 0.62% | | | | | | | | | | | | |
| | | | |
New York HFA Affordable Housing Series L (GNMA/FNMA/FHLMC Insured) | | | 1.65 | | | | 5-1-2021 | | | | 6,400,000 | | | | 6,415,552 | |
| | | | |
New York HFA Affordable Housing Series M-1 (GNMA/FNMA/FHLMC Insured) | | | 1.80 | | | | 5-1-2020 | | | | 1,200,000 | | | | 1,203,252 | |
26 | Wells Fargo Short-Term Municipal Bond Fund
Portfolio of investments—June 30, 2019
| | | | | | | | | | | | | | | | |
| | | Interest rate | | | Maturity date | | | Principal | | | Value | |
| | | | |
| Housing Revenue (continued) | | | | | | | | | | | | |
| | | | |
New York HFA Affordable Housing Series M-1 (GNMA/FNMA/FHLMC Insured) | | | 2.00 | % | | | 5-1-2021 | | | $ | 5,000,000 | | | $ | 5,038,200 | |
| | | | |
New York NY Housing Development Corporation Sustainable Neighborhood Bonds Series I2B | | | 2.00 | | | | 5-1-2021 | | | | 12,000,000 | | | | 12,000,000 | |
| |
| | | | 24,657,004 | |
| | | | | | | | | | | | | | | | |
| | | | |
| Industrial Development Revenue: 1.05% | | | | | | | | | | | | |
| | | | |
New York Transportation Development Corporation American Airlines Incorporated John F. Kennedy International Airport Project Series 2016 | | | 5.00 | | | | 8-1-2019 | | | | 8,000,000 | | | | 8,018,720 | |
| | | | |
New York Transportation Development Corporation Special Facilities Revenue Delta Airlines Incorporated LaGuardia Airport Terminals C&D Redevelopment | | | 5.00 | | | | 1-1-2024 | | | | 30,130,000 | | | | 33,984,230 | |
| |
| | | | 42,002,950 | |
| | | | | | | | | | | | | | | | |
| | | | |
| Miscellaneous Revenue: 0.15% | | | | | | | | | | | | |
| | | | |
Suffolk County NY Judicial Facilities Agency Leases H. Lee Dennison Building | | | 5.00 | | | | 11-1-2019 | | | | 2,775,000 | | | | 2,805,719 | |
| | | | |
Suffolk County NY Judicial Facilities Agency Leases H. Lee Dennison Building | | | 5.00 | | | | 11-1-2020 | | | | 2,915,000 | | | | 3,044,105 | |
| |
| | | | 5,849,824 | |
| | | | | | | | | | | | | | | | |
| | | | |
| Tax Revenue: 0.64% | | | | | | | | | | | | |
| | | | |
New York Metropolitan Transportation Authority Subordinate Bond Series A2A (SIFMA Municipal Swap +0.45%)± | | | 2.35 | | | | 11-1-2026 | | | | 6,980,000 | | | | 6,967,506 | |
| | | | |
New York NY Transitional Finance Authority Subordinate Bond Series 1-B (SIFMA Municipal Swap +0.80%)± | | | 2.70 | | | | 11-1-2022 | | | | 18,500,000 | | | | 18,608,410 | |
| |
| | | | 25,575,916 | |
| | | | | | | | | | | | | | | | |
| | | | |
| Transportation Revenue: 2.85% | | | | | | | | | | | | |
| | | | |
New York Metropolitan Transportation Authority Subordinate Bond Series A2 (SIFMA Municipal Swap +0.58%)± | | | 2.48 | | | | 11-15-2039 | | | | 2,000,000 | | | | 2,001,960 | |
| | | | |
New York Metropolitan Transportation Authority Subordinate Bond Series B4 | | | 5.00 | | | | 11-15-2030 | | | | 13,835,000 | | | | 14,007,246 | |
| | | | |
New York Metropolitan Transportation Authority Subordinate Bond Series C2 | | | 4.00 | | | | 11-15-2033 | | | | 8,330,000 | | | | 8,550,828 | |
| | | | |
New York Metropolitan Transportation Authority Subordinate Bond Series D-2 (SIFMA Municipal Swap +0.45%)± | | | 2.35 | | | | 11-15-2044 | | | | 22,545,000 | | | | 22,496,303 | |
| | | | |
New York Metropolitan Transportation Authority Subordinate Bond Series D-2A-1 (1 Month LIBOR +0.57%) (AGM Insured)± | | | 2.25 | | | | 11-1-2032 | | | | 7,500,000 | | | | 7,509,900 | |
| | | | |
New York Metropolitan Transportation Authority Subordinate Bond Series D-2A-2 (1 Month LIBOR +0.68%) (AGM Insured)± | | | 2.36 | | | | 11-1-2032 | | | | 20,000,000 | | | | 20,071,000 | |
| | | | |
New York Metropolitan Transportation Authority Subordinate Bond Series D-2B (1 Month LIBOR +0.30%) (AGM Insured)± | | | 1.98 | | | | 11-1-2032 | | | | 6,000,000 | | | | 5,982,180 | |
| | | | |
Niagara Falls NY Board Community Toll (National Insured) | | | 6.25 | | | | 10-1-2020 | | | | 8,685,000 | | | | 9,206,013 | |
| | | | |
Triborough Bridge & Tunnel Authority New York Series B (U.S. SOFR +0.43%) ± | | | 2.05 | | | | 1-1-2032 | | | | 24,590,000 | | | | 24,597,131 | |
| |
| | | | 114,422,561 | |
| | | | | | | | | | | | | | | | |
| | | | |
| Utilities Revenue: 0.51% | | | | | | | | | | | | |
| | | | |
Long Island NY Power Authority Electric System Series C (1 Month LIBOR +0.75%)± | | | 2.46 | | | | 5-1-2033 | | | | 20,550,000 | | | | 20,562,947 | |
| | | | | | | | | | | | | | | | |
| |
| | | | 283,015,163 | |
| | | | | | | | | | | | | | | | |
| | | | |
North Carolina: 0.19% | | | | | | | | | | | | | | | | |
| | | | |
| Health Revenue: 0.19% | | | | | | | | | | | | |
| | | | |
Charlotte Mecklenburg NC Hospital Authority Atrium Health Series B | | | 5.00 | | | | 1-15-2048 | | | | 7,000,000 | | | | 7,627,060 | |
| | | | | | | | | | | | | | | | |
Wells Fargo Short-Term Municipal Bond Fund | 27
Portfolio of investments—June 30, 2019
| | | | | | | | | | | | | | | | |
| | | Interest rate | | | Maturity date | | | Principal | | | Value | |
Ohio: 1.81% | | | | | | | | | | | | | | | | |
| | | | |
| GO Revenue: 0.01% | | | | | | | | | | | | |
| | | | |
Springfield OH Refunding Bond (AGC Insured) | | | 4.00 | % | | | 12-1-2020 | | | $ | 440,000 | | | $ | 440,757 | |
| | | | | | | | | | | | | | | | |
| | | | |
| Health Revenue: 0.08% | | | | | | | | | | | | |
| | | | |
Lake County OH Lake Hospital System Incorporated | | | 5.00 | | | | 8-15-2020 | | | | 905,000 | | | | 938,268 | |
| | | | |
Warren County OH HCFR Otterbein Homes Series A | | | 5.00 | | | | 7-1-2019 | | | | 2,215,000 | | | | 2,215,000 | |
| |
| | | | 3,153,268 | |
| | | | | | | | | | | | | | | | |
| | | | |
| Housing Revenue: 0.82% | | | | | | | | | | | | |
| | | | |
Cuyahoga OH Metropolitan Housing Authority Headquarters Project | | | 1.75 | | | | 3-1-2020 | | | | 5,510,000 | | | | 5,512,810 | |
| | | | |
Lucas OH Metropolitan Housing Authority Certificate of Participation | | | 2.25 | | | | 11-1-2020 | | | | 530,000 | | | | 531,304 | |
| | | | |
Lucas Plaza OH Housing Development Corporation Refunding Bond (FHA Insured) ¤ | | | 0.00 | | | | 6-1-2024 | | | | 15,800,000 | | | | 14,503,452 | |
| | | | |
Ohio HFA Cambridge Village Apartments Project (HUD Insured) | | | 2.40 | | | | 4-1-2021 | | | | 3,200,000 | | | | 3,219,040 | |
| | | | |
Trumbull Metropolitan Housing Authority Multifamily Housing Apartments Project Series A | | | 1.70 | | | | 6-1-2022 | | | | 9,250,000 | | | | 9,261,193 | |
| |
| | | | 33,027,799 | |
| | | | | | | | | | | | | | | | |
| | | | |
| Miscellaneous Revenue: 0.07% | | | | | | | | | | | | |
| | | | |
Ohio Portsmouth Bypass Project | | | 5.00 | | | | 12-31-2020 | | | | 1,320,000 | | | | 1,375,282 | |
| | | | |
Ohio Portsmouth Bypass Project | | | 5.00 | | | | 12-31-2021 | | | | 1,205,000 | | | | 1,285,590 | |
| |
| | | | 2,660,872 | |
| | | | | | | | | | | | | | | | |
| | | | |
| Resource Recovery Revenue: 0.26% | | | | | | | | | | | | |
| | | | |
Ohio Air Quality Development Authority Ohio Valley Electric Corporation Series E | | | 5.63 | | | | 10-1-2019 | | | | 10,200,000 | | | | 10,256,916 | |
| | | | | | | | | | | | | | | | |
| | | | |
| Utilities Revenue: 0.57% | | | | | | | | | | | | |
| | | | |
American Municipal Power Ohio Incorporated Refunding Bond | | | 2.30 | | | | 2-15-2038 | | | | 8,750,000 | | | | 8,882,038 | |
| | | | |
Lancaster OH Port Authority Gas Supply | | | 5.00 | | | | 8-1-2049 | | | | 12,000,000 | | | | 13,963,800 | |
| |
| | | | 22,845,838 | |
| | | | | | | | | | | | | | | | |
| |
| | | | 72,385,450 | |
| | | | | | | | | | | | | | | | |
| | | | |
Oklahoma: 0.71% | | | | | | | | | | | | | | | | |
| | | | |
| Airport Revenue: 0.06% | | | | | | | | | | | | |
| | | | |
Tulsa OK Airports Improvement Trust Series 2013A (Build America Mutual Assurance Company Insured) | | | 5.00 | | | | 6-1-2020 | | | | 695,000 | | | | 716,024 | |
| | | | |
Tulsa OK Airports Improvement Trust Series 2015A (Build America Mutual Assurance Company Insured) | | | 5.00 | | | | 6-1-2020 | | | | 1,710,000 | | | | 1,761,728 | |
| |
| | | | 2,477,752 | |
| | | | | | | | | | | | | | | | |
| | | | |
| GO Revenue: 0.37% | | | | | | | | | | | | |
| | | | |
Oklahoma County OK Independent School District #52 Series A | | | 2.50 | | | | 1-1-2021 | | | | 3,535,000 | | | | 3,593,999 | |
| | | | |
Oklahoma County OK Independent School District #52 Series A | | | 3.00 | | | | 1-1-2022 | | | | 3,535,000 | | | | 3,674,102 | |
| | | | |
Oklahoma County OK Independent School District #52 Series A | | | 3.00 | | | | 1-1-2023 | | | | 3,135,000 | | | | 3,306,453 | |
| | | | |
Oklahoma County OK Independent School District #52 Series A | | | 3.50 | | | | 1-1-2020 | | | | 2,840,000 | | | | 2,870,019 | |
| | | | |
Woodward County OK Independent School District #1 Board of Education | | | 2.30 | | | | 6-1-2020 | | | | 1,435,000 | | | | 1,441,834 | |
| |
| | | | 14,886,407 | |
| | | | | | | | | | | | | | | | |
28 | Wells Fargo Short-Term Municipal Bond Fund
Portfolio of investments—June 30, 2019
| | | | | | | | | | | | | | | | |
| | | Interest rate | | | Maturity date | | | Principal | | | Value | |
| Health Revenue: 0.05% | | | | | | | | | | | | |
| | | | |
Oklahoma Development Finance Authority Oklahoma University Medicine Project Series B | | | 5.00 | % | | | 8-15-2022 | | | $ | 500,000 | | | $ | 544,010 | |
| | | | |
Oklahoma Development Finance Authority Oklahoma University Medicine Project Series B | | | 5.00 | | | | 8-15-2023 | | | | 500,000 | | | | 556,910 | |
| | | | |
Oklahoma Development Finance Authority Oklahoma University Medicine Project Series B | | | 5.00 | | | | 8-15-2024 | | | | 600,000 | | | | 683,076 | |
| |
| | | | 1,783,996 | |
| | | | | | | | | | | | | | | | |
| | | | |
| Miscellaneous Revenue: 0.22% | | | | | | | | | | | | |
| | | | |
Blaine County OK Educational Facilities Authority Watonga Public Schools Project | | | 5.00 | | | | 12-1-2020 | | | | 750,000 | | | | 784,748 | |
| | | | |
Blaine County OK Educational Facilities Authority Watonga Public Schools Project | | | 5.00 | | | | 12-1-2021 | | | | 945,000 | | | | 1,019,362 | |
| | | | |
Cleveland County OK Educational Facilities Authority Norman Public Schools Project | | | 5.00 | | | | 7-1-2019 | | | | 2,000,000 | | | | 2,000,000 | |
| | | | |
Creek County OK Educational Facilities Authority Sapulpa Public School Project | | | 5.00 | | | | 9-1-2020 | | | | 2,550,000 | | | | 2,655,570 | |
| | | | |
Grady County OK School Finance Authority Tuttle Public School Project | | | 5.00 | | | | 9-1-2019 | | | | 1,000,000 | | | | 1,005,850 | |
| | | | |
Grady County OK School Finance Authority Tuttle Public School Project | | | 5.00 | | | | 9-1-2021 | | | | 1,065,000 | | | | 1,142,692 | |
| |
| | | | 8,608,222 | |
| | | | | | | | | | | | | | | | |
|
| Tax Revenue: 0.01% | |
| | | | |
Cleveland County OK Justice Authority Detention Facility Project | | | 4.00 | | | | 3-1-2020 | | | | 500,000 | | | | 500,935 | |
| | | | | | | | | | | | | | | | |
| |
| | | | 28,257,312 | |
| | | | | | | | | | | | | | | | |
| | | | |
Other: 0.97% | | | | | | | | | | | | | | | | |
| | | | |
| Miscellaneous Revenue: 0.97% | | | | | | | | | | | | |
| | | | |
Branch Banking & Trust Municipal Investment Trust Various States Class C (SIFMA Municipal Swap +1.05%) (Rabobank LOC) 144A± | | | 2.95 | | | | 12-31-2019 | | | | 3,021,812 | | | | 3,021,812 | |
| | | | |
FHLMC Multiclass Mortgage Certificate of Participation Series M012 Class A1A øø | | | 1.60 | | | | 8-15-2051 | | | | 983,499 | | | | 986,715 | |
| | | | |
FHLMC Multiclass Mortgage Certificate of Participation Series M012 Class A1B1 øø | | | 2.25 | | | | 8-15-2051 | | | | 18,194,730 | | | | 18,468,561 | |
| | | | |
FHLMC Multifamily Certificates Series M042 Class A (SIFMA Municipal Swap +0.25%) ø | | | 2.15 | | | | 9-15-2033 | | | | 10,870,000 | | | | 10,870,000 | |
| | | | |
Public Housing Capital Fund Trust I (HUD Insured) 144A | | | 4.50 | | | | 7-1-2022 | | | | 4,353,995 | | | | 4,396,316 | |
| | | | |
Public Housing Capital Fund Trust II (HUD Insured) 144A | | | 4.50 | | | | 7-1-2022 | | | | 973,212 | | | | 980,044 | |
| |
| | | | 38,723,448 | |
| | | | | | | | | | | | | | | | |
| | | | |
Pennsylvania: 6.92% | | | | | | | | | | | | | | | | |
| | | | |
| Education Revenue: 0.92% | | | | | | | | | | | | |
| | | | |
Lehigh County PA General Purpose Authority (SIFMA Municipal Swap +0.58%)± | | | 2.48 | | | | 11-1-2037 | | | | 11,500,000 | | | | 11,502,185 | |
| | | | |
Philadelphia PA IDA Thomas Jefferson University Series B ø | | | 2.13 | | | | 9-1-2050 | | | | 25,210,000 | | | | 25,210,000 | |
| |
| | | | 36,712,185 | |
| | | | | | | | | | | | | | | | |
| | | | |
| GO Revenue: 1.42% | | | | | | | | | | | | |
| | | | |
Butler PA Area School District (AGM Insured) | | | 5.00 | | | | 10-1-2023 | | | | 1,280,000 | | | | 1,454,362 | |
| | | | |
Butler PA Area School District (AGM Insured) | | | 5.00 | | | | 10-1-2024 | | | | 2,965,000 | | | | 3,453,009 | |
| | | | |
Butler PA Area School District (AGM Insured) | | | 5.00 | | | | 10-1-2025 | | | | 4,695,000 | | | | 5,586,627 | |
| | | | |
Coatesville PA Area School District (AGM Insured) | | | 5.00 | | | | 8-1-2023 | | | | 1,000,000 | | | | 1,123,260 | |
| | | | |
Lackawanna County PA Riverside School District Project (Build America Mutual Assurance Company Insured) | | | 4.00 | | | | 10-15-2019 | | | | 1,400,000 | | | | 1,409,268 | |
Wells Fargo Short-Term Municipal Bond Fund | 29
Portfolio of investments—June 30, 2019
| | | | | | | | | | | | | | | | |
| | | Interest rate | | | Maturity date | | | Principal | | | Value | |
| | | | |
| GO Revenue (continued) | | | | | | | | | | | | |
| | | | |
Lackawanna County PA Riverside School District Project (Build America Mutual Assurance Company Insured) | | | 4.00 | % | | | 10-15-2020 | | | $ | 1,455,000 | | | $ | 1,495,667 | |
| | | | |
Manheim Township PA School District Series A (1 Month LIBOR +0.47%)± | | | 2.13 | | | | 5-1-2025 | | | | 3,760,000 | | | | 3,767,031 | |
| | | | |
Penn Hills PA School District (Build America Mutual Assurance Company Insured) | | | 5.00 | | | | 11-15-2020 | | | | 825,000 | | | | 864,328 | |
| | | | |
Penn Hills PA School District (Build America Mutual Assurance Company Insured) | | | 5.00 | | | | 11-15-2021 | | | | 1,275,000 | | | | 1,375,687 | |
| | | | |
Philadelphia PA School District Series A | | | 5.00 | | | | 9-1-2022 | | | | 1,000,000 | | | | 1,102,110 | |
| | | | |
Philadelphia PA School District Series A | | | 5.00 | | | | 9-1-2024 | | | | 800,000 | | | | 925,568 | |
| | | | |
Philadelphia PA School District Series C | | | 5.00 | | | | 9-1-2020 | | | | 1,125,000 | | | | 1,168,245 | |
| | | | |
Philadelphia PA School District Series D | | | 5.00 | | | | 9-1-2020 | | | | 1,500,000 | | | | 1,557,660 | |
| | | | |
Philadelphia PA School District Series D | | | 5.00 | | | | 9-1-2021 | | | | 1,750,000 | | | | 1,873,795 | |
| | | | |
Philadelphia PA School District Series E (State Aid Withholding Insured) | | | 5.00 | | | | 9-1-2020 | | | | 2,225,000 | | | | 2,310,529 | |
| | | | |
Philadelphia PA School District Series E | | | 5.25 | | | | 9-1-2023 | | | | 7,000,000 | | | | 7,289,800 | |
| | | | |
Philadelphia PA School District Series F | | | 5.00 | | | | 9-1-2020 | | | | 2,750,000 | | | | 2,855,710 | |
| | | | |
Philadelphia PA School District Series F | | | 5.00 | | | | 9-1-2021 | | | | 3,580,000 | | | | 3,833,249 | |
| | | | |
Philadelphia PA Unrefunded Bond Series A (AGM Insured) | | | 5.00 | | | | 8-1-2019 | | | | 3,420,000 | | | | 3,429,234 | |
| | | | |
Scranton PA 144A | | | 5.00 | | | | 9-1-2020 | | | | 2,205,000 | | | | 2,272,627 | |
| | | | |
Scranton PA School District Series A | | | 5.00 | | | | 6-1-2021 | | | | 680,000 | | | | 719,426 | |
| | | | |
Scranton PA School District Series A | | | 5.00 | | | | 6-1-2022 | | | | 730,000 | | | | 789,174 | |
| | | | |
Scranton PA School District Series A | | | 5.00 | | | | 6-1-2023 | | | | 835,000 | | | | 929,004 | |
| | | | |
Scranton PA School District Series B | | | 5.00 | | | | 6-1-2021 | | | | 580,000 | | | | 613,628 | |
| | | | |
Scranton PA School District Series B (National Insured) | | | 5.00 | | | | 6-1-2022 | | | | 870,000 | | | | 945,673 | |
| | | | |
Scranton PA School District Series B (National Insured) | | | 5.00 | | | | 6-1-2023 | | | | 615,000 | | | | 684,237 | |
| | | | |
Scranton PA School District Series C | | | 5.00 | | | | 6-1-2020 | | | | 585,000 | | | | 600,643 | |
| | | | |
Scranton PA School District Series C | | | 5.00 | | | | 6-1-2021 | | | | 590,000 | | | | 624,208 | |
| | | | |
Warwick PA School District | | | 4.00 | | | | 2-15-2020 | | | | 1,000,000 | | | | 1,016,590 | |
| | | | |
West Mifflin PA School District (AGM Insured) | | | 5.00 | | | | 10-1-2019 | | | | 750,000 | | | | 756,863 | |
| |
| | | | 56,827,212 | |
| | | | | | | | | | | | | | | | |
| | | | |
| Health Revenue: 1.42% | | | | | | | | | | | | |
| | | | |
Allegheny County PA Hospital Development Authority University of Pittsburgh Medical Center Series A-1 (3 Month LIBOR +0.72%)± | | | 2.45 | | | | 2-1-2021 | | | | 1,345,000 | | | | 1,346,668 | |
| | | | |
Berks County PA IDA Health System Tower Health Project | | | 5.00 | | | | 11-1-2023 | | | | 1,000,000 | | | | 1,137,360 | |
| | | | |
Berks County PA IDA Health System Tower Health Project | | | 5.00 | | | | 11-1-2024 | | | | 1,000,000 | | | | 1,165,750 | |
| | | | |
Franklin County PA IDA Menno-Haven Incorporated Project | | | 4.00 | | | | 12-1-2019 | | | | 500,000 | | | | 503,160 | |
| | | | |
Franklin County PA IDA Menno-Haven Incorporated Project | | | 5.00 | | | | 12-1-2021 | | | | 230,000 | | | | 242,443 | |
| | | | |
Lancaster County PA Hospital Authority Healthcare Facilities Moravian Manors Incorporated Project | | | 2.88 | | | | 12-15-2023 | | | | 1,200,000 | | | | 1,200,492 | |
| | | | |
Montgomery County PA Higher Education & Health Authority Series 2018D ø | | | 2.13 | | | | 9-1-2050 | | | | 12,000,000 | | | | 12,000,000 | |
| | | | |
Montgomery County PA Higher Education & Health Authority Thomas Jefferson University Series A | | | 5.00 | | | | 9-1-2023 | | | | 1,050,000 | | | | 1,196,328 | |
| | | | |
Montgomery County PA Higher Education & Health Authority Thomas Jefferson University Series C (SIFMA Municipal Swap +0.72%)± | | | 2.62 | | | | 9-1-2051 | | | | 10,000,000 | | | | 10,000,200 | |
| | | | |
Montgomery County PA IDA Albert Einstein Healthcare Network Issue Series A | | | 5.00 | | | | 1-15-2020 | | | | 1,315,000 | | | | 1,335,422 | |
| | | | |
Philadelphia PA Hospitals & HEFAR Temple University Health System | | | 5.00 | | | | 7-1-2021 | | | | 1,250,000 | | | | 1,315,875 | |
| | | | |
Philadelphia PA Hospitals & HEFAR Temple University Health System | | | 5.00 | | | | 7-1-2022 | | | | 2,000,000 | | | | 2,156,300 | |
| | | | |
Quakertown PA Health Facilities Authority Series A | | | 3.13 | | | | 7-1-2021 | | | | 3,250,000 | | | | 3,235,375 | |
| | | | |
South Central General Authority WellSpan Health Obliged Group Revenue Bond Series 2019E (U.S. Bank NA LIQ) ø | | | 1.92 | | | | 6-1-2035 | | | | 20,000,000 | | | | 20,000,000 | |
| |
| | | | 56,835,373 | |
| | | | | | | | | | | | | | | | |
30 | Wells Fargo Short-Term Municipal Bond Fund
Portfolio of investments—June 30, 2019
| | | | | | | | | | | | | | | | |
| | | Interest rate | | | Maturity date | | | Principal | | | Value | |
| Housing Revenue: 0.82% | | | | | | | | | | | | |
| | | | |
Pennsylvania HFA Single Family Series 125A | | | 2.38 | % | | | 10-1-2025 | | | $ | 19,945,000 | | | $ | 20,175,365 | |
| | | | |
Pennsylvania HFA Single Family Series 128A | | | 4.75 | | | | 4-1-2033 | | | | 8,745,000 | | | | 9,501,443 | |
| | | | |
Pittsburgh PA Urban RDA Crawford Square Apartments Project | | | 2.25 | | | | 12-1-2020 | | | | 3,300,000 | | | | 3,308,052 | |
| |
| | | | 32,984,860 | |
| | | | | | | | | | | | | | | | |
| | | | |
| Industrial Development Revenue: 0.59% | | | | | | | | | | | | |
| | | | |
Lehigh County PA IDA Electric Utilities Corporation Series B | | | 1.80 | | | | 2-15-2027 | | | | 2,500,000 | | | | 2,515,050 | |
| | | | |
Montgomery County PA IDA Exelon Generation Company LLC | | | 2.50 | | | | 10-1-2030 | | | | 15,795,000 | | | | 15,850,756 | |
| | | | |
Montgomery County PA IDA Peco Energy Company Project Series A | | | 2.60 | | | | 3-1-2034 | | | | 2,125,000 | | | | 2,136,624 | |
| | | | |
Pennsylvania EDFA Bridges Finco LP | | | 5.00 | | | | 12-31-2020 | | | | 1,850,000 | | | | 1,928,866 | |
| | | | |
Pennsylvania EDFA Bridges Finco LP | | | 5.00 | | | | 12-31-2021 | | | | 1,095,000 | | | | 1,170,172 | |
| |
| | | | 23,601,468 | |
| | | | | | | | | | | | | | | | |
| | | | |
| Miscellaneous Revenue: 0.39% | | | | | | | | | | | | |
| | | | |
Bethlehem PA Area School District Authority Bethlehem Area School District Refunding Bond Project (1 Month LIBOR +0.49%)± | | | 2.17 | | | | 1-1-2030 | | | | 4,980,000 | | | | 4,980,000 | |
| | | | |
Butler County General Authority Hampton Township School District Project Series 2007 (AGM Insured, PNC Bank NA SPA) ø | | | 1.90 | | | | 9-1-2027 | | | | 2,000,000 | | | | 2,000,000 | |
| | | | |
Delaware County PA Authority Neumann University | | | 4.00 | | | | 10-1-2021 | | | | 2,005,000 | | | | 2,062,403 | |
| | | | |
Pennsylvania Certificate of Participation (AGM Insured) | | | 2.00 | | | | 11-1-2019 | | | | 1,100,000 | | | | 1,099,978 | |
| | | | |
Pennsylvania Certificate of Participation (AGM Insured) | | | 4.00 | | | | 11-1-2019 | | | | 1,005,000 | | | | 1,011,593 | |
| | | | |
Philadelphia PA RDA Transformation Initiative Series B | | | 5.00 | | | | 4-15-2020 | | | | 1,870,000 | | | | 1,916,900 | |
| | | | |
Scranton PA RDA Series A (Municipal Government Guaranty Insured) | | | 5.00 | | | | 11-15-2021 | | | | 2,580,000 | | | | 2,657,684 | |
| |
| | | | 15,728,558 | |
| | | | | | | | | | | | | | | | |
|
| Resource Recovery Revenue: 0.55% | |
| | | | |
Delaware County PA IDA Resource Recovery Facility Series A | | | 6.20 | | | | 7-1-2019 | | | | 145,000 | | | | 145,000 | |
| | | | |
Pennsylvania EDFA Solid Waste Disposal Series A | | | 1.70 | | | | 8-1-2037 | | | | 9,420,000 | | | | 9,412,935 | |
| | | | |
Pennsylvania EDFA Solid Waste Disposal Waste Management Incorporated Project | | | 1.95 | | | | 8-1-2045 | | | | 12,500,000 | | | | 12,504,125 | |
| |
| | | | 22,062,060 | |
| | | | | | | | | | | | | | | | |
| | | | |
| Transportation Revenue: 0.38% | | | | | | | | | | | | |
| | | | |
Pennsylvania Turnpike Commission Series B (SIFMA Municipal Swap +1.27%)± | | | 3.17 | | | | 12-1-2020 | | | | 11,300,000 | | | | 11,390,287 | |
| | | | |
Pennsylvania Turnpike Commission Series B (SIFMA Municipal Swap +0.70%)± | | | 2.60 | | | | 12-1-2023 | | | | 2,880,000 | | | | 2,897,798 | |
| | | | |
Reading PA Parking Authority CAB (National Insured) ¤ | | | 0.00 | | | | 11-15-2019 | | | | 1,000,000 | | | | 991,650 | |
| |
| | | | 15,279,735 | |
| | | | | | | | | | | | | | | | |
| | | | |
| Utilities Revenue: 0.06% | | | | | | | | | | | | |
| | | | |
Philadelphia PA Gas Works Series 1998 General Ordinance (AGM Insured) | | | 5.00 | | | | 7-1-2019 | | | | 2,500,000 | | | | 2,500,000 | |
| | | | | | | | | | | | | | | | |
| | | | |
| Water & Sewer Revenue: 0.37% | | | | | | | | | | | | |
| | | | |
Pittsburgh PA Water & Sewer Authority Series C (1 Month LIBOR +0.64%) (AGM Insured)± | | | 2.39 | | | | 9-1-2040 | | | | 15,000,000 | | | | 15,005,850 | |
| | | | | | | | | | | | | | | | |
| |
| | | | 277,537,301 | |
| | | | | | | | | | | | | | | | |
| | | | |
Rhode Island: 0.35% | | | | | | | | | | | | | | | | |
| | | | |
| Education Revenue: 0.05% | | | | | | | | | | | | |
| | | | |
Rhode Island Student Loan Authority AMT Series A | | | 5.00 | | | | 12-1-2019 | | | | 450,000 | | | | 456,107 | |
| | | | |
Rhode Island Student Loan Authority AMT Series A | | | 5.00 | | | | 12-1-2023 | | | | 1,175,000 | | | | 1,326,458 | |
| |
| | | | 1,782,565 | |
| | | | | | | | | | | | | | | | |
Wells Fargo Short-Term Municipal Bond Fund | 31
Portfolio of investments—June 30, 2019
| | | | | | | | | | | | | | | | |
| | | Interest rate | | | Maturity date | | | Principal | | | Value | |
| Health Revenue: 0.08% | | | | | | | | | | | | |
| | | | |
Rhode Island Health & Educational Building Corporation Tockwotton Home Series 2011 | | | 8.38 | % | | | 1-1-2046 | | | $ | 3,000,000 | | | $ | 3,309,450 | |
| | | | | | | | | | | | | | | | |
| | | | |
| Miscellaneous Revenue: 0.22% | | | | | | | | | | | | |
| | | | |
Rhode Island & Providence Plantations Consolidated Capital Development Series A | | | 5.00 | | | | 8-1-2023 | | | | 8,045,000 | | | | 8,925,525 | |
| | | | | | | | | | | | | | | | |
| |
| | | | 14,017,540 | |
| | | | | | | | | | | | | | | | |
| | | | |
South Carolina: 0.78% | | | | | | | | | | | | | | | | |
| | | | |
| Health Revenue: 0.40% | | | | | | | | | | | | |
| | | | |
Greenville SC Health System Hospital Series 2014-B Tender Option Bond Trust Receipts/Certificates Series 2015-XF0145 (TD Bank NA LIQ) 144Aø | | | 2.00 | | | | 5-30-2022 | | | | 8,020,000 | | | | 8,020,000 | |
| | | | |
South Carolina Jobs EDA Prisma Health Obligated Group Series C ø | | | 2.12 | | | | 5-1-2048 | | | | 8,000,000 | | | | 8,000,000 | |
| |
| | | | 16,020,000 | |
| | | | | | | | | | | | | | | | |
| | | | |
| Transportation Revenue: 0.24% | | | | | | | | | | | | |
| | | | |
South Carolina Transportation Infrastructure Bank Refunding Bond Series B (1 Month LIBOR +0.45%)± | | | 2.05 | | | | 10-1-2031 | | | | 9,800,000 | | | | 9,787,946 | |
| | | | | | | | | | | | | | | | |
| | | | |
| Utilities Revenue: 0.14% | | | | | | | | | | | | |
| | | | |
Piedmont SC Municipal Power Agency (National Insured) | | | 5.38 | | | | 1-1-2025 | | | | 4,760,000 | | | | 5,609,422 | |
| | | | | | | | | | | | | | | | |
| |
| | | | 31,417,368 | |
| | | | | | | | | | | | | | | | |
|
Tennessee: 1.72% | |
| | | | |
| Airport Revenue: 0.08% | | | | | | | | | | | | |
| | | | |
Memphis-Shelby County TN Airport Authority Series A1 | | | 5.75 | | | | 7-1-2019 | | | | 1,500,000 | | | | 1,500,000 | |
| | | | |
Memphis-Shelby County TN Airport Authority Series B | | | 5.50 | | | | 7-1-2019 | | | | 1,505,000 | | | | 1,505,000 | |
| |
| | | | 3,005,000 | |
| | | | | | | | | | | | | | | | |
| | | | |
| Health Revenue: 0.04% | | | | | | | | | | | | |
| | | | |
Greeneville TN Health and Educational Ballad Health Series A | | | 5.00 | | | | 7-1-2023 | | | | 1,600,000 | | | | 1,800,080 | |
| | | | | | | | | | | | | | | | |
| | | | |
| Housing Revenue: 0.17% | | | | | | | | | | | | |
| | | | |
Kingsport TN Housing & RDA Collateralized Multifamily Housing Series B | | | 2.22 | | | | 1-1-2022 | | | | 6,700,000 | | | | 6,767,402 | |
| | | | | | | | | | | | | | | | |
| | | | |
| Utilities Revenue: 1.43% | | | | | | | | | | | | |
| | | | |
Tennessee Energy Acquisition Corporation Gas Project | | | 4.00 | | | | 11-1-2049 | | | | 7,500,000 | | | | 8,264,400 | |
| | | | |
Tennessee Energy Acquisition Corporation Series A | | | 4.00 | | | | 5-1-2048 | | | | 45,840,000 | | | | 49,138,646 | |
| |
| | | | 57,403,046 | |
| | | | | | | | | | | | | | | | |
| |
| | | | 68,975,528 | |
| | | | | | | | | | | | | | | | |
| | | | |
Texas: 15.02% | | | | | | | | | | | | | | | | |
| | | | |
| Airport Revenue: 0.21% | | | | | | | | | | | | |
| | | | |
Dallas-Fort Worth TX International Airport Series B | | | 5.00 | | | | 11-1-2023 | | | | 500,000 | | | | 553,240 | |
| | | | |
El Paso TX Airport Series 2018 | | | 5.00 | | | | 8-15-2025 | | | | 3,110,000 | | | | 3,623,461 | |
| | | | |
Houston TX Airport System Refunding Bond Subordinate Lien Series A | | | 5.00 | | | | 7-1-2024 | | | | 3,620,000 | | | | 3,979,104 | |
| |
| | | | 8,155,805 | |
| | | | | | | | | | | | | | | | |
| | | | |
| Education Revenue: 0.56% | | | | | | | | | | | | |
| | | | |
Clifton TX Higher Education Finance Corporation Education International Leadership Series D | | | 5.00 | | | | 8-15-2021 | | | | 665,000 | | | | 688,627 | |
| | | | |
Clifton TX Higher Education Finance Corporation Education International Leadership Series D | | | 5.00 | | | | 8-15-2022 | | | | 1,000,000 | | | | 1,049,060 | |
32 | Wells Fargo Short-Term Municipal Bond Fund
Portfolio of investments—June 30, 2019
| | | | | | | | | | | | | | | | |
| | | Interest rate | | | Maturity date | | | Principal | | | Value | |
| | | | |
| Education Revenue (continued) | | | | | | | | | | | | |
| | | | |
Clifton TX Higher Education Finance Corporation Education International Leadership Series D | | | 5.00 | % | | | 8-15-2023 | | | $ | 1,510,000 | | | $ | 1,601,491 | |
| | | | |
Clifton TX Higher Education Finance Corporation Education International Leadership Series D | | | 5.00 | | | | 8-15-2024 | | | | 3,125,000 | | | | 3,347,375 | |
| | | | |
North Texas Higher Education Authority Incorporated Student Loan Series 2 Class A (3 Month LIBOR +1.00%)± | | | 3.59 | | | | 4-1-2037 | | | | 4,585,000 | | | | 4,593,253 | |
| | | | |
Texas A&M University System Permanent University Series A | | | 5.00 | | | | 7-1-2021 | | | | 4,870,000 | | | | 5,226,094 | |
| | | | |
Texas PFA Southern University Financing System (Build America Mutual Assurance Company Insured) | | | 5.00 | | | | 11-1-2019 | | | | 2,375,000 | | | | 2,399,866 | |
| | | | |
University of Texas Financing System Refunding Bonds Series C | | | 5.00 | | | | 8-15-2022 | | | | 3,000,000 | | | | 3,342,030 | |
| |
| | | | 22,247,796 | |
| | | | | | | | | | | | | | | | |
| | | | |
| GO Revenue: 8.52% | | | | | | | | | | | | |
| | | | |
Brownsville TX Independent School District Maintenance Tax Notes | | | 4.00 | | | | 8-15-2019 | | | | 7,905,000 | | | | 7,930,296 | |
| | | | |
Clear Creek TX Independent School District Series B | | | 3.00 | | | | 2-15-2032 | | | | 4,945,000 | | | | 4,953,753 | |
| | | | |
Cypress-Fairbanks TX Independent School District Series B-2 | | | 2.13 | | | | 2-15-2040 | | | | 17,000,000 | | | | 17,179,350 | |
| | | | |
Dallas TX Unrefunded Balance Refunding Bond | | | 5.00 | | | | 2-15-2021 | | | | 3,580,000 | | | | 3,790,934 | |
| | | | |
Eagle Mountain & Saginaw TX Independent School District | | | 2.00 | | | | 8-1-2050 | | | | 12,150,000 | | | | 12,155,103 | |
| | | | |
El Paso County TX Hospital District Refunding Bond | | | 5.00 | | | | 8-15-2019 | | | | 4,035,000 | | | | 4,050,373 | |
| | | | |
Fort Bend TX Independent School District Series C | | | 1.35 | | | | 8-1-2042 | | | | 4,525,000 | | | | 4,521,606 | |
| | | | |
Fort Bend TX independent School District Series D | | | 1.50 | | | | 8-1-2042 | | | | 10,530,000 | | | | 10,498,515 | |
| | | | |
Harris County TX Refunding Bonds Series A | | | 5.00 | | | | 10-1-2021 | | | | 10,000,000 | | | | 10,091,300 | |
| | | | |
Hays TX Consolidated Independent School District Building Bonds Series B | | | 2.70 | | | | 8-15-2042 | | | | 7,370,000 | | | | 7,594,932 | |
| | | | |
Houston TX Independent School District | | | 1.45 | | | | 6-1-2029 | | | | 8,385,000 | | | | 8,382,652 | |
| | | | |
Houston TX Independent School District Limited Tax Schoolhouse Series B | | | 2.40 | | | | 6-1-2036 | | | | 5,000,000 | | | | 5,082,650 | |
| | | | |
Houston TX Public Improvement Series A | | | 5.00 | | | | 3-1-2020 | | | | 4,000,000 | | | | 4,098,240 | |
| | | | |
Houston TX Public Improvement Series A | | | 5.00 | | | | 3-1-2021 | | | | 4,000,000 | | | | 4,242,080 | |
| | | | |
Houston TX Public Improvement Series A | | | 5.00 | | | | 3-1-2022 | | | | 5,000,000 | | | | 5,474,000 | |
| | | | |
Houston TX Public Improvement Series A | | | 5.00 | | | | 3-1-2023 | | | | 3,500,000 | | | | 3,943,415 | |
| | | | |
Hurst Euless Bedford TX Independent School District Prerefunded Bond | | | 5.00 | | | | 8-15-2022 | | | | 2,140,000 | | | | 2,225,001 | |
| | | | |
Hutto TX Independent School District Series 2015 | | | 3.00 | | | | 2-1-2055 | | | | 23,425,000 | | | | 23,820,414 | |
| | | | |
Lake Travis TX Independent School District Prefunded Series B | | | 2.63 | | | | 2-15-2048 | | | | 1,010,000 | | | | 1,042,229 | |
| | | | |
Lake Travis TX Independent School District Unrefunded Bond | | | 2.63 | | | | 2-15-2048 | | | | 8,990,000 | | | | 9,215,379 | |
| | | | |
Leander TX Independent School District Unrefunded Bond ¤ | | | 0.00 | | | | 8-15-2044 | | | | 8,500,000 | | | | 2,674,950 | |
| | | | |
Leander TX Independent School District Refunding CAB ¤ | | | 0.00 | | | | 8-15-2023 | | | | 1,065,000 | | | | 996,893 | |
| | | | |
Mansfield TX Independent School District | | | 2.50 | | | | 8-1-2042 | | | | 8,250,000 | | | | 8,403,533 | |
| | | | |
McAllen TX Independent School District Series A | | | 5.00 | | | | 2-15-2024 | | | | 2,620,000 | | | | 2,949,334 | |
| | | | |
New Caney TX Independent School District Building Bonds | | | 3.00 | | | | 2-15-2050 | | | | 1,100,000 | | | | 1,131,559 | |
| | | | |
North East TX Independent School District | | | 2.20 | | | | 8-1-2049 | | | | 4,800,000 | | | | 4,923,744 | |
| | | | |
North East TX Independent School District | | | 2.00 | | | | 8-1-2044 | | | | 9,320,000 | | | | 9,323,914 | |
| | | | |
North East TX Independent School District | | | 2.38 | | | | 8-1-2047 | | | | 7,135,000 | | | | 7,302,744 | |
| | | | |
Northside TX Independent School District Building Bonds Series 2018 | | | 2.75 | | | | 8-1-2048 | | | | 18,975,000 | | | | 19,818,439 | |
| | | | |
Northside TX Independent School District Building Project | | | 1.75 | | | | 6-1-2032 | | | | 6,045,000 | | | | 6,045,907 | |
| | | | |
Northside TX Independent School District Building Project | | | 2.00 | | | | 8-1-2044 | | | | 21,330,000 | | | | 21,338,959 | |
| | | | |
Northside TX Independent School District Building Project | | | 2.00 | | | | 6-1-2046 | | | | 8,600,000 | | | | 8,677,572 | |
| | | | |
Pflugerville TX Independent School District Prerefunded Bond School Building Series 2017 | | | 2.00 | | | | 8-15-2039 | | | | 7,665,000 | | | | 7,671,132 | |
| | | | |
Pflugerville TX Independent School District Prerefunded Bond School Building Series A | | | 2.00 | | | | 8-15-2039 | | | | 4,830,000 | | | | 4,833,864 | |
| | | | |
Texas Anticipation Notes Series 2018 | | | 4.00 | | | | 8-29-2019 | | | | 50,000,000 | | | | 50,193,500 | |
| | | | |
Texas Northside Independent School District | | | 1.45 | | | | 6-1-2047 | | | | 4,000,000 | | | | 4,001,080 | |
Wells Fargo Short-Term Municipal Bond Fund | 33
Portfolio of investments—June 30, 2019
| | | | | | | | | | | | | | | | |
| | | Interest rate | | | Maturity date | | | Principal | | | Value | |
| | | | |
| GO Revenue (continued) | | | | | | | | | | | | |
| | | | |
Texas Transportation Commission Mobility Fund Series B (SIFMA Municipal Swap +0.30%)± | | | 2.20 | % | | | 10-1-2041 | | | $ | 24,500,000 | | | $ | 24,440,465 | |
| | | | |
Tomball TX Independent School District Series B2 | | | 2.13 | | | | 2-15-2039 | | | | 6,500,000 | | | | 6,572,605 | |
| |
| | | | 341,592,416 | |
| | | | | | | | | | | | | | | | |
| | | | |
| Health Revenue: 0.59% | | | | | | | | | | | | |
| | | | |
Harris County TX Methodist Hospital System Series A1 ø | | | 1.95 | | | | 12-1-2041 | | | | 10,000,000 | | | | 10,000,000 | |
| | | | |
Residual Interest Bond Floater Trust Certificates Series 2019-010 (Barclays Bank plc LOC, Barclays Bank plc LIQ) 144Aø | | | 2.05 | | | | 11-15-2046 | | | | 10,000,000 | | | | 10,000,000 | |
| | | | |
Tarrant County TX ECFA Hendrick Medical Center Group | | | 5.00 | | | | 9-1-2019 | | | | 655,000 | | | | 658,806 | |
| | | | |
Tarrant County TX ECFA Hendrick Medical Center Group | | | 5.00 | | | | 9-1-2020 | | | | 920,000 | | | | 957,867 | |
| | | | |
Tarrant County TX ECFA Hendrick Medical Center Group | | | 5.00 | | | | 11-15-2020 | | | | 1,045,000 | | | | 1,064,751 | |
| | | | |
Travis County TX Health Facilities Development Corporation Longhorn Village Project Series A | | | 7.13 | | | | 1-1-2046 | | | | 845,000 | | | | 915,642 | |
| |
| | | | 23,597,066 | |
| | | | | | | | | | | | | | | | |
| | | | |
| Housing Revenue: 2.12% | | | | | | | | | | | | |
| | | | |
Alamito TX Public Facility Corporation Cramer Three Apartments Project | | | 2.50 | | | | 11-1-2021 | | | | 20,000,000 | | | | 20,312,600 | |
| | | | |
Austin TX Affordable PFC Incorporated Multifamily Housing Bridge Cameron Apartments | | | 1.86 | | | | 12-1-2021 | | | | 25,000,000 | | | | 25,033,750 | |
| | | | |
Bexar County TX Housing Finance Corporation Medio Springs Apartments Project | | | 2.00 | | | | 11-1-2020 | | | | 26,500,000 | | | | 26,577,645 | |
| | | | |
New Hope TX Cultural Education Facilities Finance Corporation Student Housing Project Series A | | | 3.25 | | | | 8-1-2019 | | | | 13,000,000 | | | | 13,000,520 | |
| |
| | | | 84,924,515 | |
| | | | | | | | | | | | | | | | |
|
Resource Recovery Revenue: 0.31% | |
| | | | |
Mission TX Economic Development Corporation Waste Management Project | | | 2.50 | | | | 8-1-2020 | | | | 11,000,000 | | | | 11,008,140 | |
| | | | |
Port Arthur TX Navigation District Jefferson County Environmental Facilities Motiva Enterprises LLC Project Series A ø | | | 2.07 | | | | 4-1-2040 | | | | 1,550,000 | | | | 1,550,000 | |
| |
| | | | 12,558,140 | |
| | | | | | | | | | | | | | | | |
| | | | |
| Transportation Revenue: 0.71% | | | | | | | | | | | | |
| | | | |
Central Texas Regional Mobility Authority Series B | | | 5.00 | | | | 1-1-2045 | | | | 310,000 | | | | 320,159 | |
| | | | |
Central Texas Regional Mobility Authority Subordinate Lien Bond | | | 4.00 | | | | 1-1-2022 | | | | 6,000,000 | | | | 6,257,640 | |
| | | | |
North Texas Tollway Authority Series A | | | 5.00 | | | | 1-1-2020 | | | | 1,050,000 | | | | 1,068,984 | |
| | | | |
North Texas Tollway Authority Series A | | | 5.00 | | | | 1-1-2021 | | | | 1,860,000 | | | | 1,960,570 | |
| | | | |
North Texas Tollway Authority Special Projects System Series A | | | 6.00 | | | | 9-1-2041 | | | | 3,500,000 | | | | 3,845,065 | |
| | | | |
North Texas Tollway Authority Special Projects System Series D | | | 5.00 | | | | 9-1-2024 | | | | 1,790,000 | | | | 1,928,439 | |
| | | | |
North Texas Tollway Authority Special Projects System Series D | | | 5.00 | | | | 9-1-2028 | | | | 4,335,000 | | | | 4,670,269 | |
| | | | |
North Texas Tollway Authority Special Projects System Series D | | | 5.25 | | | | 9-1-2025 | | | | 3,840,000 | | | | 4,157,376 | |
| | | | |
North Texas Tollway Authority Special Projects System Series D | | | 5.25 | | | | 9-1-2026 | | | | 3,980,000 | | | | 4,308,947 | |
| |
| | | | 28,517,449 | |
| | | | | | | | | | | | | | | | |
| | | | |
| Utilities Revenue: 1.53% | | | | | | | | | | | | |
| | | | |
San Antonio TX Electric & Gas Systems Junior Lien Refunding Bond | | | 2.75 | | | | 2-1-2048 | | | | 6,000,000 | | | | 6,198,000 | |
| | | | |
San Antonio TX Junior Lien Series D | | | 3.00 | | | | 12-1-2045 | | | | 12,325,000 | | | | 12,566,940 | |
| | | | |
San Antonio TX Series A | | | 2.25 | | | | 2-1-2033 | | | | 24,550,000 | | | | 24,615,303 | |
| | | | |
Texas Municipal Gas Acquisition & Supply Corporation III | | | 5.00 | | | | 12-15-2019 | | | | 7,000,000 | | | | 7,104,930 | |
| | | | |
Texas Municipal Gas Acquisition & Supply Corporation Series A (SIFMA Municipal Swap +0.55%)± | | | 2.45 | | | | 9-15-2027 | | | | 11,135,000 | | | | 10,973,431 | |
| |
| | | | 61,458,604 | |
| | | | | | | | | | | | | | | | |
34 | Wells Fargo Short-Term Municipal Bond Fund
Portfolio of investments—June 30, 2019
| | | | | | | | | | | | | | | | |
| | | Interest rate | | | Maturity date | | | Principal | | | Value | |
| Water & Sewer Revenue: 0.47% | | | | | | | | | | | | |
| | | | |
San Antonio TX Water System Junior Lien Series A | | | 2.63 | % | | | 5-1-2049 | | | $ | 12,250,000 | | | $ | 12,790,838 | |
| | | | |
San Antonio TX Water System Junior Lien Series B | | | 2.00 | | | | 5-1-2044 | | | | 5,605,000 | | | | 5,668,729 | |
| | | | |
Walnut Creek TX Special Utility District (Build America Mutual Assurance Company Insured) | | | 4.00 | | | | 1-10-2020 | | | | 500,000 | | | | 506,845 | |
| |
| | | | 18,966,412 | |
| | | | | | | | | | | | | | | | |
| |
| | | | 602,018,203 | |
| | | | | | | | | | | | | | | | |
| | | | |
Utah: 0.20% | | | | | | | | | | | | | | | | |
| | | | |
| Airport Revenue: 0.20% | | | | | | | | | | | | |
| | | | |
Salt Lake City UT International Airport Series A | | | 5.00 | | | | 7-1-2023 | | | | 2,500,000 | | | | 2,818,825 | |
| | | | |
Salt Lake City UT International Airport Series A | | | 5.00 | | | | 7-1-2024 | | | | 2,000,000 | | | | 2,311,360 | |
| | | | |
Salt Lake City UT International Airport Series A | | | 5.00 | | | | 7-1-2025 | | | | 2,300,000 | | | | 2,715,955 | |
| |
| | | | 7,846,140 | |
| | | | | | | | | | | | | | | | |
| | | | |
Virginia: 2.17% | | | | | | | | | | | | | | | | |
| | | | |
| Health Revenue: 0.05% | | | | | | | | | | | | |
| | | | |
Lexington VA IDA Residential Care Facility Kendal at Lexington Refunding Bond | | | 3.00 | | | | 1-1-2020 | | | | 450,000 | | | | 451,926 | |
| | | | |
Lexington VA IDA Residential Care Facility Kendal at Lexington Refunding Bond | | | 4.00 | | | | 1-1-2021 | | | | 440,000 | | | | 451,145 | |
| | | | |
Lexington VA IDA Residential Care Facility Kendal at Lexington Refunding Bond | | | 4.00 | | | | 1-1-2022 | | | | 525,000 | | | | 544,856 | |
| | | | |
Washington County VA IDA Mountain States Health Alliance Series C | | | 7.25 | | | | 7-1-2019 | | | | 690,000 | | | | 690,000 | |
| |
| | | | 2,137,927 | |
| | | | | | | | | | | | | | | | |
| | | | |
| Housing Revenue: 0.61% | | | | | | | | | | | | |
| | | | |
Fairfax County VA Redevelopment & Housing Authority Parkwood Project | | | 2.21 | | | | 2-1-2021 | | | | 15,000,000 | | | | 15,087,750 | |
| | | | |
Newport News VA Redevelopment & Housing Authority Multifamily Housing Series A | | | 1.82 | | | | 11-1-2020 | | | | 9,500,000 | | | | 9,507,315 | |
| |
| | | | 24,595,065 | |
| | | | | | | | | | | | | | | | |
| | | | |
| Miscellaneous Revenue: 0.08% | | | | | | | | | | | | |
| | | | |
Franklin County VA IDA BAN | | | 3.00 | | | | 10-15-2023 | | | | 3,000,000 | | | | 3,052,620 | |
| | | | | | | | | | | | | | | | |
| | | | |
| Tax Revenue: 0.08% | | | | | | | | | | | | |
| | | | |
Greater Richmond VA Convention Center Authority | | | 5.00 | | | | 6-15-2020 | | | | 1,000,000 | | | | 1,034,820 | |
| | | | |
Marquis VA CDA CAB Series 2015 144A¤ | | | 0.00 | | | | 9-1-2045 | | | | 680,000 | | | | 500,738 | |
| | | | |
Marquis VA CDA CAB Series A | | | 5.10 | | | | 9-1-2036 | | | | 2,169,000 | | | | 1,443,036 | |
| | | | |
Marquis VA CDA CAB Series C ¤ | | | 0.00 | | | | 9-1-2041 | | | | 3,493,000 | | | | 197,913 | |
| |
| | | | 3,176,507 | |
| | | | | | | | | | | | | | | | |
| | | | |
| Transportation Revenue: 0.04% | | | | | | | | | | | | |
| | | | |
Virginia Commonwealth Transportation Board Refunding Bonds Series A | | | 5.00 | | | | 5-15-2023 | | | | 1,500,000 | | | | 1,710,975 | |
| | | | | | | | | | | | | | | | |
| | | | |
| Utilities Revenue: 1.31% | | | | | | | | | | | | |
| | | | |
Halifax County VA IDA | | | 2.15 | | | | 12-1-2041 | | | | 44,450,000 | | | | 44,766,484 | |
| | | | |
York County VA EDA PCR Virginia Electric And Power Company Project Series A | | | 1.90 | | | | 5-1-2033 | | | | 7,500,000 | | | | 7,557,075 | |
| |
| | | | 52,323,559 | |
| | | | | | | | | | | | | | | | |
| |
| | | | 86,996,653 | |
| | | | | | | | | | | | | | | | |
Wells Fargo Short-Term Municipal Bond Fund | 35
Portfolio of investments—June 30, 2019
| | | | | | | | | | | | | | | | |
| | | Interest rate | | | Maturity date | | | Principal | | | Value | |
Washington: 3.87% | | | | | | | | | | | | | | | | |
| | | | |
| Airport Revenue: 0.28% | | | | | | | | | | | | |
| | | | |
Metropolitan Washington Airports Authority Refunding Bond Series 2014A | | | 3.00 | % | | | 10-1-2022 | | | $ | 6,500,000 | | | $ | 6,781,515 | |
| | | | |
Port of Seattle WA Refunding Bond Series B | | | 5.00 | | | | 8-1-2023 | | | | 4,155,000 | | | | 4,575,320 | |
| |
| | | | 11,356,835 | |
| | | | | | | | | | | | | | | | |
| | | | |
| Education Revenue: 0.55% | | | | | | | | | | | | |
| | | | |
University of Washington Series A | | | 5.00 | | | | 5-1-2048 | | | | 20,500,000 | | | | 22,142,050 | |
| | | | | | | | | | | | | | | | |
| | | | |
| GO Revenue: 0.13% | | | | | | | | | | | | |
| | | | |
Washington Series A | | | 5.00 | | | | 8-1-2022 | | | | 4,800,000 | | | | 5,336,112 | |
| | | | | | | | | | | | | | | | |
| | | | |
| Health Revenue: 0.51% | | | | | | | | | | | | |
| | | | |
Washington HCFR Catholic Health Initiatives Series B (SIFMA Municipal Swap +1.00%)± | | | 2.90 | | | | 1-1-2035 | | | | 8,650,000 | | | | 8,665,484 | |
| | | | |
Washington Health Care Facilities Authority Catholic Health Initiatives Series A | | | 5.00 | | | | 2-1-2023 | | | | 1,025,000 | | | | 1,081,724 | |
| | | | |
Washington Health Care Facilities Authority Fred Hutchinson Cancer Research (1 Month LIBOR +1.10%)± | | | 2.71 | | | | 1-1-2042 | | | | 9,500,000 | | | | 9,586,925 | |
| | | | |
Washington Health Care Facilities Authority Series 2015 | | | 5.00 | | | | 7-1-2020 | | | | 850,000 | | | | 875,568 | |
| |
| | | | 20,209,701 | |
| | | | | | | | | | | | | | | | |
|
| Housing Revenue: 0.65% | |
| | | | |
Snohomish County WA Housing Authority Carvel Apartments Project | | | 5.00 | | | | 4-1-2025 | | | | 500,000 | | | | 584,235 | |
| | | | |
Snohomish County WA Housing Authority Carvel Apartments Project | | | 5.00 | | | | 4-1-2026 | | | | 730,000 | | | | 868,364 | |
| | | | |
Washington Housing Finance Commission Multifamily Housing Sanford Hildebrandt Towers Project | | | 2.25 | | | | 7-1-2021 | | | | 16,900,000 | | | | 17,041,115 | |
| | | | |
Washington Housing Finance Commission Multifamily Housing Series A | | | 1.80 | | | | 7-1-2020 | | | | 7,350,000 | | | | 7,357,938 | |
| |
| | | | 25,851,652 | |
| | | | | | | | | | | | | | | | |
| | | | |
| Tax Revenue: 0.43% | | | | | | | | | | | | |
| | | | |
Central Puget Sound WA Regional Transit Authority Sales Series S2B (SIFMA Municipal Swap +0.45%)± | | | 2.35 | | | | 11-1-2045 | | | | 17,250,000 | | | | 17,255,520 | |
| | | | | | | | | | | | | | | | |
| | | | |
| Utilities Revenue: 0.89% | | | | | | | | | | | | |
| | | | |
Seattle WA Municipal Light & Power Refunding Bond Series B-2 (SIFMA Municipal Swap +0.29%)± | | | 2.19 | | | | 5-1-2045 | | | | 12,635,000 | | | | 12,601,517 | |
| | | | |
Seattle WA Municipal Light & Power Refunding Bond Series C-1 (SIFMA Municipal Swap +0.49%)± | | | 2.39 | | | | 11-1-2046 | | | | 23,190,000 | | | | 23,193,247 | |
| |
| | | | 35,794,764 | |
| | | | | | | | | | | | | | | | |
| | | | |
| Water & Sewer Revenue: 0.43% | | | | | | | | | | | | |
| | | | |
King County WA Junior Lien Series 2011 | | | 2.45 | | | | 1-1-2042 | | | | 17,000,000 | | | | 17,110,330 | |
| | | | | | | | | | | | | | | | |
| |
| | | | 155,056,964 | |
| | | | | | | | | | | | | | | | |
| | | | |
West Virginia: 0.21% | | | | | | | | | | | | | | | | |
| | | | |
| Utilities Revenue: 0.21% | | | | | | | | | | | | |
| | | | |
West Virginia EDA Solid Waste Disposal Facilities Wheeling Power Company Mitchell Project Series A | | | 3.00 | | | | 6-1-2037 | | | | 8,300,000 | | | | 8,418,192 | |
| | | | | | | | | | | | | | | | |
| | | | |
Wisconsin: 1.29% | | | | | | | | | | | | | | | | |
| | | | |
| Airport Revenue: 0.20% | | | | | | | | | | | | |
| | | | |
Wisconsin Airport Facilities PFA Senior Obligation Group Series B | | | 5.00 | | | | 7-1-2022 | | | | 7,470,000 | | | | 7,816,309 | |
| | | | | | | | | | | | | | | | |
36 | Wells Fargo Short-Term Municipal Bond Fund
Portfolio of investments—June 30, 2019
| | | | | | | | | | | | | | | | |
| | | Interest rate | | | Maturity date | | | Principal | | | Value | |
| Education Revenue: 0.13% | | | | | | | | | | | | |
| | | | |
Wisconsin PFA Guilford College | | | 5.00 | % | | | 1-1-2021 | | | $ | 650,000 | | | $ | 674,778 | |
| | | | |
Wisconsin PFA Guilford College | | | 5.00 | | | | 1-1-2022 | | | | 625,000 | | | | 663,513 | |
| | | | |
Wisconsin PFA Loan Anticipation Notes Lake Oconee Academy Foundation Incorporated Project | | | 2.30 | | | | 10-1-2019 | | | | 4,000,000 | | | | 3,999,440 | |
| |
| | | | 5,337,731 | |
| | | | | | | | | | | | | | | | |
| | | | |
| Health Revenue: 0.14% | | | | | | | | | | | | |
| | | | |
Wisconsin HEFA Advocate Aurora Health Credit Group Series C-4 (SIFMA Municipal Swap +0.65%)± | | | 2.55 | | | | 8-15-2054 | | | | 4,200,000 | | | | 4,215,288 | |
| | | | |
Wisconsin HEFA Benevolent Corporation Cedar Community | | | 5.00 | | | | 6-1-2020 | | | | 880,000 | | | | 899,818 | |
| | | | |
Wisconsin HEFA Vernon Memorial Healthcare Incorporated | | | 5.00 | | | | 3-1-2020 | | | | 375,000 | | | | 379,260 | |
| |
| | | | 5,494,366 | |
| | | | | | | | | | | | | | | | |
| | | | |
| Miscellaneous Revenue: 0.82% | | | | | | | | | | | | |
| | | | |
Waukesha County WI Anticipation Notes Series C | | | 3.00 | | | | 5-1-2022 | | | | 3,035,000 | | | | 3,038,854 | |
| | | | |
Waukesha County WI Series B | | | 3.00 | | | | 5-1-2021 | | | | 11,890,000 | | | | 11,904,744 | |
| | | | |
Wisconsin State Refunding Bond Series A | | | 5.00 | | | | 5-1-2022 | | | | 8,040,000 | | | | 8,865,065 | |
| | | | |
Wisconsin State Refunding Bond Series A | | | 5.00 | | | | 5-1-2023 | | | | 8,015,000 | | | | 9,112,254 | |
| |
| | | | 32,920,917 | |
| | | | | | | | | | | | | | | | |
| |
| | | | 51,569,323 | |
| | | | | | | | | | | | | | | | |
| | | | |
Wyoming: 0.17% | | | | | | | | | | | | | | | | |
| | | | |
| Industrial Development Revenue: 0.17% | | | | | | | | | | | | |
| | | | |
Sweetwater County WY Pacificorp Project ø | | | 2.05 | | | | 11-1-2024 | | | | 7,000,000 | | | | 7,000,000 | |
| | | | | | | | | | | | | | | | |
| |
Total Municipal Obligations (Cost $3,928,111,936) | | | | 3,964,125,028 | |
| | | | | | | | | | | | | | | | |
| | | | |
| | | | | | | | | | | | | | | | |
| | | | | | | | | Shares | | | | |
| | | | |
Closed End Municipal Bond Funds: 0.83% | | | | | | | | | | | | | | | | |
| | | | |
| California: 0.63% | | | | | | | | | | | | |
| | | | |
Nuveen California AMT-Free Quality Municipal Income Fund Variable Rate Demand Preferred Shares Series A 2.20% 144A | | | | | | | | | | | 25,400,000 | | | | 25,400,000 | |
| | | | | | | | | | | | | | | | |
| | | | |
| Massachusetts: 0.20% | | | | | | | | | | | | |
| | | | |
Nuveen Massachusetts AMT-Free Municipal Income Fund Variable Rate Demand Preferred Shares 2.25% 144A | | | | | | | | | | | 3,000,000 | | | | 3,000,000 | |
| | | | |
Nuveen Massachusetts Dividend Advantage Municipal Income Fund Variable Rate Demand Preferred Shares 2.25% 144A | | | | | | | | | | | 5,000,000 | | | | 5,000,000 | |
| | | | |
| | | | | | | | | | | | | | | 8,000,000 | |
| | | | | | | | | | | | | | | | |
| | | | |
Total Closed End Municipal Bond Funds (Cost $33,400,000) | | | | | | | | | | | | | | | 33,400,000 | |
| | | | | | | | | | | | | | | | |
| | | Yield | | | | | | | | | | |
| Short-Term Investments: 0.25% | |
| | | | |
| Investment Companies: 0.25% | | | | | | | | | | | | |
| | | | |
Wells Fargo Municipal Cash Management Money Market Fund Institutional Class (l)(u)## | | | 1.82 | | | | | | | | 9,941,476 | | | | 9,947,441 | |
| | | | | | | | | | | | | | | | |
| |
Total Short-Term Investments (Cost $9,947,441) | | | | 9,947,441 | |
| | | | | | | | | | | | | | | | |
| | | | | | | | |
| Total investments in securities (Cost $3,971,459,377) | | | 99.99 | % | | | 4,007,472,469 | |
| | |
Other assets and liabilities, net | | | 0.01 | | | | 577,250 | |
| | | | | | | | |
| Total net assets | | | 100.00 | % | | $ | 4,008,049,719 | |
| | | | | | | | |
Wells Fargo Short-Term Municipal Bond Fund | 37
Portfolio of investments—June 30, 2019
| ± | Variable rate investment. The rate shown is the rate in effect at period end. |
| ø | Variable rate demand notes are subject to a demand feature which reduces the effective maturity. The maturity date shown represents the final maturity date of the security. The interest rate is determined and reset by the issuer daily, weekly, or monthly depending upon the terms of the security. The rate shown is the rate in effect at period end. |
| 144A | The security may be resold in transactions exempt from registration, normally to qualified institutional buyers, pursuant to Rule 144A under the Securities Act of 1933. |
| ¤ | The security is issued in zero coupon form with no periodic interest payments. |
| (m) | The security is an auction-rate security which has an interest rate that resets at predetermined short-term intervals through a Dutch auction. The rate shown is the rate in effect at period end. |
| øø | The interest rate is determined and reset by the issuer periodically depending upon the terms of the security. The rate shown is the rate in effect at period end. |
| %% | The security is purchased on a when-issued basis. |
| (l) | The issuer of the security is an affiliated person of the Fund as defined in the Investment Company Act of 1940. |
| (u) | The rate represents the 7-day annualized yield at period end. |
| ## | All or a portion of this security is segregated for when-issued securities. |
Abbreviations:
| AGC | Assured Guaranty Corporation |
| AGM | Assured Guaranty Municipal |
| Ambac | Ambac Financial Group Incorporated |
| AMT | Alternative minimum tax |
| BAN | Bond anticipation notes |
| CAB | Capital appreciation bond |
| CDA | Community Development Authority |
| ECFA | Educational & Cultural Facilities Authority |
| EDA | Economic Development Authority |
| EDFA | Economic Development Finance Authority |
| FHA | Federal Housing Administration |
| FHLMC | Federal Home Loan Mortgage Corporation |
| FNMA | Federal National Mortgage Association |
| GNMA | Government National Mortgage Association |
| HCFR | Healthcare facilities revenue |
| HEFA | Health & Educational Facilities Authority |
| HEFAR | Higher Education Facilities Authority Revenue |
| HFA | Housing Finance Authority |
| HFFA | Health Facilities Financing Authority |
| HUD | Department of Housing and Urban Development |
| IDA | Industrial Development Authority |
| LIBOR | London Interbank Offered Rate |
| National | National Public Finance Guarantee Corporation |
| PCFA | Pollution Control Financing Authority |
| PCR | Pollution control revenue |
| PFA | Public Finance Authority |
| RDA | Redevelopment Authority |
| SFMR | Single-family mortgage revenue |
| SIFMA | Securities Industry and Financial Markets Association |
| SOFR | Secured Overnight Financing Rate |
| SPA | Standby purchase agreement |
| TAN | Tax anticipation notes |
| TTFA | Transportation Trust Fund Authority |
38 | Wells Fargo Short-Term Municipal Bond Fund
Portfolio of investments—June 30, 2019
Investments in Affiliates
An affiliated investment is an investment in which the Fund owns at least 5% of the outstanding voting shares of the issuer or as a result of other relationships, such as the Fund and the issuer having the same investment manager. Transactions with issuers that were either affiliated persons of the Fund at the beginning of the period or the end of the period were as follows:
| | | | | | | | | | | | | | | | | | | | | | | | | | | | | | | | | | | | |
| | | Shares,
beginning of
period | | | Shares
purchased | | | Shares
sold | | | Shares,
end of
period | | | Net
realized
gains
(losses) | | | Net
change in
unrealized
gains
(losses) | | | Income
from
affiliated
securities | | | Value,
end
of period | | | % of
net
assets | |
Short-Term Investments | | | | | | | | | | | | | | | | | | | | | | | | | | | | | | | | | | | | |
Investment Companies | | | | | | | | | | | | | | | | | | | | | | | | | | | | | | | | | | | | |
Wells Fargo Municipal Cash Management Money Market Fund Institutional Class | | | 11,091,809 | | | | 1,242,034,328 | | | | 1,243,184,661 | | | | 9,941,476 | | | $ | (28,833 | ) | | $ | 0 | | | $ | 400,008 | | | $ | 9,947,441 | | | | 0.25 | % |
Wells Fargo Short-Term Municipal Bond Fund | 39
Statement of assets and liabilities—June 30, 2019
| | | | |
| | | | |
| |
Assets | | | | |
Investments in unaffiliated securities, at value (cost $3,961,511,936) | | $ | 3,997,525,028 | |
Investments in affiliated securities, at value (cost $9,947,441) | | | 9,947,441 | |
Cash | | | 1,134 | |
Receivable for investments sold | | | 4,835,130 | |
Receivable for Fund shares sold | | | 2,850,360 | |
Receivable for interest | | | 31,495,989 | |
| | | | |
Total assets | | | 4,046,655,082 | |
| | | | |
| |
Liabilities | | | | |
Payable for investments purchased | | | 28,000,000 | |
Payable for Fund shares redeemed | | | 7,478,953 | |
Dividends payable | | | 1,011,396 | |
Management fee payable | | | 925,466 | |
Administration fees payable | | | 300,274 | |
Distribution fee payable | | | 21,431 | |
Trustees’ fees and expenses payable | | | 1,302 | |
Accrued expenses and other liabilities | | | 866,541 | |
| | | | |
Total liabilities | | | 38,605,363 | |
| | | | |
Total net assets | | $ | 4,008,049,719 | |
| | | | |
| |
Net assets consist of | | | | |
Paid-in capital | | $ | 4,016,732,930 | |
Total distributable loss | | | (8,683,211 | ) |
| | | | |
Total net assets | | $ | 4,008,049,719 | |
| | | | |
| |
Computation of net asset value and offering price per share | | | | |
Net assets – Class A | | $ | 991,514,290 | |
Shares outstanding – Class A1 | | | 99,960,299 | |
Net asset value per share – Class A | | | $9.92 | |
Maximum offering price per share – Class A2 | | | $10.12 | |
Net assets – Class C | | $ | 34,381,370 | |
Shares outstanding – Class C1 | | | 3,465,911 | |
Net asset value per share – Class C | | | $9.92 | |
Net assets – Class R6 | | $ | 787,523,618 | |
Shares outstanding – Class R61 | | | 79,241,631 | |
Net asset value per share – Class R6 | | | $9.94 | |
Net assets – Administrator Class | | $ | 35,517,193 | |
Shares outstanding – Administrator Class1 | | | 3,578,385 | |
Net asset value per share – Administrator Class | | | $9.93 | |
Net assets – Institutional Class | | $ | 2,159,113,248 | |
Shares outstanding – Institutional Class1 | | | 217,277,940 | |
Net asset value per share – Institutional Class | | | $9.94 | |
| 1 | The Fund has an unlimited number of authorized shares. |
| 2 | Maximum offering price is computed as 100/98 of net asset value. On investments of $50,000 or more, the offering price is reduced. |
The accompanying notes are an integral part of these financial statements.
40 | Wells Fargo Short-Term Municipal Bond Fund
Statement of operations—year ended June 30, 2019
| | | | |
| | | | |
| |
Investment income | | | | |
Interest | | $ | 95,434,492 | |
Income from affiliated securities | | | 400,008 | |
| | | | |
Total investment income | | | 95,834,500 | |
| | | | |
| |
Expenses | | | | |
Management fee | | | 14,299,673 | |
Administration fees | | | | |
Class A | | | 1,714,489 | |
Class C | | | 65,773 | |
Class R6 | | | 151,189 | 1 |
Administrator Class | | | 38,063 | |
Institutional Class | | | 2,134,798 | |
Shareholder servicing fees | | | | |
Class A | | | 2,678,889 | |
Class C | | | 102,770 | |
Administrator Class | | | 94,650 | |
Distribution fee | | | | |
Class C | | | 308,308 | |
Custody and accounting fees | | | 142,215 | |
Professional fees | | | 67,924 | |
Registration fees | | | 273,912 | |
Shareholder report expenses | | | 172,405 | |
Trustees’ fees and expenses | | | 21,374 | |
Other fees and expenses | | | 64,930 | |
| | | | |
Total expenses | | | 22,331,362 | |
Less: Fee waivers and/or expense reimbursements | | | (2,347,029 | ) |
| | | | |
Net expenses | | | 19,984,333 | |
| | | | |
Net investment income | | | 75,850,167 | |
| | | | |
| |
Realized and unrealized gains (losses) on investments | | | | |
Net realized gains (losses) on: | | | | |
Unaffiliated securities | | | (4,227,683 | ) |
Affiliated securities | | | (28,833 | ) |
Futures contracts | | | 2,762,893 | |
| | | | |
Net realized losses on investments | | | (1,493,623 | ) |
Net change in unrealized gains (losses) on investments | | | 38,387,952 | |
| | | | |
Net realized and unrealized gains (losses) on investments | | | 36,894,329 | |
| | | | |
Net increase in net assets resulting from operations | | $ | 112,744,496 | |
| | | | |
| 1 | For the period from July 31, 2018 (commencement of class operations) to June 30, 2019 |
The accompanying notes are an integral part of these financial statements.
Wells Fargo Short-Term Municipal Bond Fund | 41
Statement of changes in net assets
| | | | | | | | | | | | | | | | |
| | | Year ended June 30, 2019 | | | Year ended June 30, 20181 | |
| | | | |
Operations | | | | | | | | | | | | | | | | |
Net investment income | | | | | | $ | 75,850,167 | | | | | | | $ | 76,005,326 | |
Net realized losses on investments | | | | | | | (1,493,623 | ) | | | | | | | (37,212,436 | ) |
Net change in unrealized gains (losses) on investments | | | | | | | 38,387,952 | | | | | | | | 26,940,201 | |
| | | | |
Net increase in net assets resulting from operations | | | | | | | 112,744,496 | | | | | | | | 65,733,091 | |
| | | | |
| | | | |
Distributions to shareholders from | | | | | | | | | | | | | | | | |
Net investment income and net realized gains | | | | | | | | | | | | | | | | |
Class A | | | | | | | (17,363,867 | ) | | | | | | | (18,913,250 | ) |
Class C | | | | | | | (356,754 | ) | | | | | | | (329,883 | ) |
Class R6 | | | | | | | (9,948,747 | )2 | | | | | | | N/A | |
Administrator Class | | | | | | | (627,989 | ) | | | | | | | (776,666 | ) |
Institutional Class | | | | | | | (48,911,304 | ) | | | | | | | (55,986,581 | ) |
Tax basis return of capital | | | | | | | | | | | | | | | | |
Class A | | | | | | | (55,677 | ) | | | | | | | 0 | |
Class C | | | | | | | (2,136 | ) | | | | | | | 0 | |
Class R6 | | | | | | | (28,538 | )2 | | | | | | | N/A | |
Administrator Class | | | | | | | (1,978 | ) | | | | | | | 0 | |
Institutional Class | | | | | | | (138,654 | ) | | | | | | | 0 | |
| | | | |
Total distributions to shareholders | | | | | | | (77,435,644 | ) | | | | | | | (76,006,380 | ) |
| | | | |
| | | | |
Capital share transactions | | | Shares | | | | | | | | Shares | | | | | |
Proceeds from shares sold | | | | | | | | | | | | | | | | |
Class A | | | 15,173,031 | | | | 149,334,296 | | | | 18,297,636 | | | | 180,213,329 | |
Class C | | | 326,154 | | | | 3,208,375 | | | | 182,051 | | | | 1,795,631 | |
Class R6 | | | 115,656,991 | 2 | | | 1,137,354,364 | 2 | | | N/A | | | | N/A | |
Administrator Class | | | 1,329,160 | | | | 13,078,968 | | | | 1,971,304 | | | | 19,431,959 | |
Institutional Class | | | 96,293,045 | | | | 949,084,420 | | | | 141,398,279 | | | | 1,395,926,490 | |
| | | | |
| | | | | | | 2,252,060,423 | | | | | | | | 1,597,367,409 | |
| | | | |
Reinvestment of distributions | | | | | | | | | | | | | | | | |
Class A | | | 1,662,426 | | | | 16,372,098 | | | | 1,836,651 | | | | 18,081,160 | |
Class C | | | 32,936 | | | | 324,400 | | | | 30,273 | | | | 297,962 | |
Class R6 | | | 693,507 | 2 | | | 6,860,337 | 2 | | | N/A | | | | N/A | |
Administrator Class | | | 62,343 | | | | 614,431 | | | | 77,693 | | | | 765,617 | |
Institutional Class | | | 4,066,630 | | | | 40,106,697 | | | | 4,344,070 | | | | 42,840,075 | |
| | | | |
| | | | | | | 64,277,963 | | | | | | | | 61,984,814 | |
| | | | |
Payment for shares redeemed | | | | | | | | | | | | | | | | |
Class A | | | (39,869,171 | ) | | | (392,102,587 | ) | | | (61,621,053 | ) | | | (606,889,814 | ) |
Class C | | | (1,785,847 | ) | | | (17,588,416 | ) | | | (1,695,155 | ) | | | (16,694,825 | ) |
Class R6 | | | (37,108,867 | )2 | | | (367,046,299 | )2 | | | N/A | | | | N/A | |
Administrator Class | | | (2,304,976 | ) | | | (22,689,537 | ) | | | (4,519,762 | ) | | | (44,536,175 | ) |
Institutional Class | | | (230,454,242 | ) | | | (2,266,785,603 | ) | | | (145,674,086 | ) | | | (1,436,794,551 | ) |
| | | | |
| | | | | | | (3,066,212,442 | ) | | | | | | | (2,104,915,365 | ) |
| | | | |
Net decrease in net assets resulting from capital share transactions | | | | | | | (749,874,056 | ) | | | | | | | (445,563,142 | ) |
| | | | |
Total decrease in net assets | | | | | | | (714,565,204 | ) | | | | | | | (455,836,431 | ) |
| | | | |
| | | | |
Net assets | | | | | | | | | | | | | | | | |
Beginning of period | | | | | | | 4,722,614,923 | | | | | | | | 5,178,451,354 | |
| | | | |
End of period | | | | | | $ | 4,008,049,719 | | | | | | | $ | 4,722,614,923 | |
| | | | |
| 1 | Effective for all filings after November 4, 2018, the SEC prospectively eliminated the requirement to parenthetically disclose undistributed net investment income at the end of the period and permitted the aggregation of distributions, with the exception of tax basis returns of capital. Undistributed net investment income at June 30, 2018 was $287,138. The disaggregated distributions information for the year ended June 30, 2018 is included in Note 8,Distributions to Shareholders, in the notes to the financial statements. |
| 2 | For the period from July 31, 2018 (commencement of class operations) to June 30, 2019 |
The accompanying notes are an integral part of these financial statements.
42 | Wells Fargo Short-Term Municipal Bond Fund
Financial highlights
(For a share outstanding throughout each period)
| | | | | | | | | | | | | | | | | | | | |
| | | Year ended June 30 | |
| CLASS A | | 2019 | | | 2018 | | | 2017 | | | 2016 | | | 2015 | |
Net asset value, beginning of period | | | $9.83 | | | | $9.85 | | | | $9.96 | | | | $9.93 | | | | $10.00 | |
Net investment income | | | 0.15 | | | | 0.13 | | | | 0.12 | | | | 0.11 | | | | 0.09 | |
Net realized and unrealized gains (losses) on investments | | | 0.10 | | | | (0.02 | ) | | | (0.11 | ) | | | 0.04 | | | | (0.06 | ) |
| | | | | | | | | | | | | | | | | | | | |
Total from investment operations | | | 0.25 | | | | 0.11 | | | | 0.01 | | | | 0.15 | | | | 0.03 | |
Distributions to shareholders from | | | | | | | | | | | | | | | | | | | | |
Net investment income | | | (0.16 | ) | | | (0.13 | ) | | | (0.12 | ) | | | (0.11 | ) | | | (0.09 | ) |
Net realized gains | | | 0.00 | | | | 0.00 | | | | 0.00 | | | | (0.01 | ) | | | (0.01 | ) |
Tax basis return of capital | | | (0.00 | )1 | | | 0.00 | | | | 0.00 | | | | 0.00 | | | | 0.00 | |
| | | | | | | | | | | | | | | | | | | | |
Total distributions to shareholders | | | (0.16 | ) | | | (0.13 | ) | | | (0.12 | ) | | | (0.12 | ) | | | (0.10 | ) |
Net asset value, end of period | | | $9.92 | | | | $9.83 | | | | $9.85 | | | | $9.96 | | | | $9.93 | |
Total return2 | | | 2.57 | % | | | 1.15 | % | | | 0.14 | % | | | 1.49 | % | | | 0.27 | % |
Ratios to average net assets (annualized) | | | | | | | | | | | | | | | | | | | | |
Gross expenses | | | 0.76 | % | | | 0.77 | % | | | 0.76 | % | | | 0.75 | % | | | 0.75 | % |
Net expenses | | | 0.63 | % | | | 0.63 | % | | | 0.63 | % | | | 0.62 | % | | | 0.60 | % |
Net investment income | | | 1.59 | % | | | 1.34 | % | | | 1.23 | % | | | 1.11 | % | | | 0.89 | % |
Supplemental data | | | | | | | | | | | | | | | | | | | | |
Portfolio turnover rate | | | 33 | % | | | 31 | % | | | 23 | % | | | 16 | % | | | 24 | % |
Net assets, end of period (000s omitted) | | | $991,514 | | | | $1,209,079 | | | | $1,619,974 | | | | $3,362,147 | | | | $2,228,977 | |
| 1 | Amount is less than $0.005. |
| 2 | Total return calculations do not include any sales charges. |
The accompanying notes are an integral part of these financial statements.
Wells Fargo Short-Term Municipal Bond Fund | 43
Financial highlights
(For a share outstanding throughout each period)
| | | | | | | | | | | | | | | | | | | | |
| | | Year ended June 30 | |
| CLASS C | | 2019 | | | 2018 | | | 2017 | | | 2016 | | | 2015 | |
Net asset value, beginning of period | | | $9.83 | | | | $9.85 | | | | $9.96 | | | | $9.93 | | | | $10.00 | |
Net investment income | | | 0.08 | | | | 0.06 | | | | 0.05 | | | | 0.04 | | | | 0.01 | |
Net realized and unrealized gains (losses) on investments | | | 0.10 | | | | (0.02 | ) | | | (0.11 | ) | | | 0.04 | | | | (0.06 | ) |
| | | | | | | | | | | | | | | | | | | | |
Total from investment operations | | | 0.18 | | | | 0.04 | | | | (0.06 | ) | | | 0.08 | | | | (0.05 | ) |
Distributions to shareholders from | | | | | | | | | | | | | | | | | | | | |
Net investment income | | | (0.09 | ) | | | (0.06 | ) | | | (0.05 | ) | | | (0.04 | ) | | | (0.01 | ) |
Net realized gains | | | 0.00 | | | | 0.00 | | | | 0.00 | | | | (0.01 | ) | | | (0.01 | ) |
Tax basis return of capital | | | (0.00 | )1 | | | 0.00 | | | | 0.00 | | | | 0.00 | | | | 0.00 | |
| | | | | | | | | | | | | | | | | | | | |
Total distributions to shareholders | | | (0.09 | ) | | | (0.06 | ) | | | (0.05 | ) | | | (0.05 | ) | | | (0.02 | ) |
Net asset value, end of period | | | $9.92 | | | | $9.83 | | | | $9.85 | | | | $9.96 | | | | $9.93 | |
Total return2 | | | 1.81 | % | | | 0.40 | % | | | (0.61 | )% | | | 0.73 | % | | | (0.48 | )% |
Ratios to average net assets (annualized) | | | | | | | | | | | | | | | | | | | | |
Gross expenses | | | 1.51 | % | | | 1.52 | % | | | 1.51 | % | | | 1.50 | % | | | 1.50 | % |
Net expenses | | | 1.38 | % | | | 1.38 | % | | | 1.38 | % | | | 1.37 | % | | | 1.35 | % |
Net investment income | | | 0.84 | % | | | 0.59 | % | | | 0.49 | % | | | 0.35 | % | | | 0.14 | % |
Supplemental data | | | | | | | | | | | | | | | | | | | | |
Portfolio turnover rate | | | 33 | % | | | 31 | % | | | 23 | % | | | 16 | % | | | 24 | % |
Net assets, end of period (000s omitted) | | | $34,381 | | | | $48,101 | | | | $62,796 | | | | $82,111 | | | | $103,146 | |
| 1 | Amount is less than $0.005. |
| 2 | Total return calculations do not include any sales charges. |
The accompanying notes are an integral part of these financial statements.
44 | Wells Fargo Short-Term Municipal Bond Fund
Financial highlights
(For a share outstanding throughout the period)
| | | | |
| CLASS R6 | | Year ended
June 30, 20191 | |
Net asset value, beginning of period | | $ | 9.86 | |
Net investment income | | | 0.17 | |
Net realized and unrealized gains (losses) on investments | | | 0.08 | |
| | | | |
Total from investment operations | | | 0.25 | |
Distributions to shareholders from | | | | |
Net investment income | | | (0.17 | ) |
Tax basis return of capital | | | (0.00 | )2 |
| | | | |
Total distributions to shareholders | | | (0.17 | ) |
Net asset value, end of period | | $ | 9.94 | |
Total return3 | | | 2.60 | % |
Ratios to average net assets (annualized) | | | | |
Gross expenses | | | 0.38 | % |
Net expenses | | | 0.35 | % |
Net investment income | | | 1.94 | % |
Supplemental data | | | | |
Portfolio turnover rate | | | 33 | % |
Net assets, end of period (000s omitted) | | $ | 787,524 | |
| 1 | For the period from July 31, 2018 (commencement of class operations) to June 30, 2019 |
| 2 | Amount is less than $0.005. |
| 3 | Returns for periods of less than one year are not annualized. |
The accompanying notes are an integral part of these financial statements.
Wells Fargo Short-Term Municipal Bond Fund | 45
Financial highlights
(For a share outstanding throughout each period)
| | | | | | | | | | | | | | | | | | | | |
| | | Year ended June 30 | |
| ADMINISTRATOR CLASS | | 2019 | | | 2018 | | | 2017 | | | 2016 | | | 2015 | |
Net asset value, beginning of period | | | $9.84 | | | | $9.86 | | | | $9.97 | | | | $9.95 | | | | $10.03 | |
Net investment income | | | 0.16 | | | | 0.14 | | | | 0.13 | | | | 0.11 | 1 | | | 0.09 | |
Net realized and unrealized gains (losses) on investments | | | 0.09 | | | | (0.02 | ) | | | (0.11 | ) | | | 0.03 | | | | (0.07 | ) |
| | | | | | | | | | | | | | | | | | | | |
Total from investment operations | | | 0.25 | | | | 0.12 | | | | 0.02 | | | | 0.14 | | | | 0.02 | |
Distributions to shareholders from | | | | | | | | | | | | | | | | | | | | |
Net investment income | | | (0.16 | ) | | | (0.14 | ) | | | (0.13 | ) | | | (0.11 | ) | | | (0.09 | ) |
Net realized gains | | | 0.00 | | | | 0.00 | | | | 0.00 | | | | (0.01 | ) | | | (0.01 | ) |
Tax basis return of capital | | | (0.00 | )2 | | | 0.00 | | | | 0.00 | | | | 0.00 | | | | 0.00 | |
| | | | | | | | | | | | | | | | | | | | |
Total distributions to shareholders | | | (0.16 | ) | | | (0.14 | ) | | | (0.13 | ) | | | (0.12 | ) | | | (0.10 | ) |
Net asset value, end of period | | | $9.93 | | | | $9.84 | | | | $9.86 | | | | $9.97 | | | | $9.95 | |
Total return | | | 2.60 | % | | | 1.18 | % | | | 0.17 | % | | | 1.42 | % | | | 0.17 | % |
Ratios to average net assets (annualized) | | | | | | | | | | | | | | | | | | | | |
Gross expenses | | | 0.70 | % | | | 0.71 | % | | | 0.70 | % | | | 0.66 | % | | | 0.68 | % |
Net expenses | | | 0.60 | % | | | 0.60 | % | | | 0.60 | % | | | 0.59 | % | | | 0.60 | % |
Net investment income | | | 1.62 | % | | | 1.36 | % | | | 1.27 | % | | | 1.08 | % | | | 0.89 | % |
Supplemental data | | | | | | | | | | | | | | | | | | | | |
Portfolio turnover rate | | | 33 | % | | | 31 | % | | | 23 | % | | | 16 | % | | | 24 | % |
Net assets, end of period (000s omitted) | | | $35,517 | | | | $44,186 | | | | $68,621 | | | | $95,121 | | | | $511,894 | |
| 1 | Calculated based upon average shares outstanding |
| 2 | Amount is less than $0.005. |
The accompanying notes are an integral part of these financial statements.
46 | Wells Fargo Short-Term Municipal Bond Fund
Financial highlights
(For a share outstanding throughout each period)
| | | | | | | | | | | | | | | | | | | | |
| | | Year ended June 30 | |
| INSTITUTIONAL CLASS | | 2019 | | | 2018 | | | 2017 | | | 2016 | | | 2015 | |
Net asset value, beginning of period | | | $9.85 | | | | $9.87 | | | | $9.98 | | | | $9.95 | | | | $10.02 | |
Net investment income | | | 0.18 | | | | 0.16 | | | | 0.15 | | | | 0.13 | | | | 0.11 | |
Net realized and unrealized gains (losses) on investments | | | 0.09 | | | | (0.02 | ) | | | (0.11 | ) | | | 0.04 | | | | (0.06 | ) |
| | | | | | | | | | | | | | | | | | | | |
Total from investment operations | | | 0.27 | | | | 0.14 | | | | 0.04 | | | | 0.17 | | | | 0.05 | |
Distributions to shareholders from | | | | | | | | | | | | | | | | | | | | |
Net investment income | | | (0.18 | ) | | | (0.16 | ) | | | (0.15 | ) | | | (0.13 | ) | | | (0.11 | ) |
Net realized gains | | | 0.00 | | | | 0.00 | | | | 0.00 | | | | (0.01 | ) | | | (0.01 | ) |
Tax basis return of capital | | | (0.00 | )1 | | | 0.00 | | | | 0.00 | | | | 0.00 | | | | 0.00 | |
| | | | | | | | | | | | | | | | | | | | |
Total distributions to shareholders | | | (0.18 | ) | | | (0.16 | ) | | | (0.15 | ) | | | (0.14 | ) | | | (0.12 | ) |
Net asset value, end of period | | | $9.94 | | | | $9.85 | | | | $9.87 | | | | $9.98 | | | | $9.95 | |
Total return | | | 2.81 | % | | | 1.39 | % | | | 0.37 | % | | | 1.71 | % | | | 0.47 | % |
Ratios to average net assets (annualized) | | | | | | | | | | | | | | | | | | | | |
Gross expenses | | | 0.43 | % | | | 0.44 | % | | | 0.43 | % | | | 0.42 | % | | | 0.42 | % |
Net expenses | | | 0.40 | % | | | 0.40 | % | | | 0.40 | % | | | 0.40 | % | | | 0.40 | % |
Net investment income | | | 1.80 | % | | | 1.58 | % | | | 1.48 | % | | | 1.33 | % | | | 1.09 | % |
Supplemental data | | | | | | | | | | | | | | | | | | | | |
Portfolio turnover rate | | | 33 | % | | | 31 | % | | | 23 | % | | | 16 | % | | | 24 | % |
Net assets, end of period (000s omitted) | | | $2,159,113 | | | | $3,421,249 | | | | $3,427,060 | | | | $2,261,092 | | | | $1,895,713 | |
| 1 | Amount is less than $0.005. |
The accompanying notes are an integral part of these financial statements.
Wells Fargo Short-Term Municipal Bond Fund | 47
Notes to financial statements
1. ORGANIZATION
Wells Fargo Funds Trust (the “Trust”), a Delaware statutory trust organized on March 10, 1999, is an open-end management investment company registered under the Investment Company Act of 1940, as amended (the “1940 Act”). As an investment company, the Trust follows the accounting and reporting guidance in Financial Accounting Standards Board (“FASB”) Accounting Standards Codification Topic 946, Financial Services – Investment Companies. These financial statements report on the Wells Fargo Short-Term Municipal Bond Fund (the “Fund”) which is a diversified series of the Trust.
2. SIGNIFICANT ACCOUNTING POLICIES
The following significant accounting policies, which are consistently followed in the preparation of the financial statements of the Fund, are in conformity with U.S. generally accepted accounting principles which require management to make estimates and assumptions that affect the reported amounts of assets and liabilities, disclosure of contingent assets and liabilities at the date of the financial statements, and the reported amounts of revenues and expenses during the reporting period. Actual results could differ from those estimates.
Securities valuation
All investments are valued each business day as of the close of regular trading on the New York Stock Exchange (generally 4 p.m. Eastern Time), although the Fund may deviate from this calculation time under unusual or unexpected circumstances.
Debt securities are valued at the evaluated bid price provided by an independent pricing service (e.g. taking into account various factors, including yields, maturities, or credit ratings) or, if a reliable price is not available, the quoted bid price from an independent broker-dealer.
Futures contracts that are listed on a foreign or domestic exchange or market are valued at the official closing price or, if none, the last sales price.
Investments in registered open-end investment companies are valued at net asset value.
Investments which are not valued using any of the methods discussed above are valued at their fair value, as determined in good faith by the Board of Trustees of the Fund. The Board of Trustees has established a Valuation Committee comprised of the Trustees and has delegated to it the authority to take any actions regarding the valuation of portfolio securities that the Valuation Committee deems necessary or appropriate, including determining the fair value of portfolio securities, unless the determination has been delegated to the Wells Fargo Asset Management Pricing Committee at Wells Fargo Funds Management, LLC (“Funds Management”). The Board of Trustees retains the authority to make or ratify any valuation decisions or approve any changes to the Valuation Procedures as it deems appropriate. On a quarterly basis, the Board of Trustees receives reports on any valuation actions taken by the Valuation Committee or the Wells Fargo Asset Management Pricing Committee which may include items for ratification.
When-issued transactions
The Fund may purchase securities on a forward commitment or when-issued basis. The Fund records a when-issued transaction on the trade date and will segregate assets in an amount at least equal in value to the Fund’s commitment to purchase when-issued securities. Securities purchased on a when-issued basis are marked-to-market daily and the Fund begins earning interest on the settlement date. Losses may arise due to changes in the market value of the underlying securities or if the counterparty does not perform under the contract.
Futures contracts
Futures contracts are agreements between the Fund and a counterparty to buy or sell a specific amount of a commodity, financial instrument or currency at specified price and on a specified date. The Fund may buy and sell futures contracts in order to gain exposure to, or protect against, changes in interest rates and is subject to interest rate risk. The primary risks associated with the use of futures contracts are the imperfect correlation between changes in market values of securities held by the Fund and the prices of futures contracts, and the possibility of an illiquid market. Futures contracts are generally entered into on a regulated futures exchange and cleared through a clearinghouse associated with the exchange. With futures contracts, there is minimal counterparty risk to the Fund since futures contracts are exchange traded and the exchange’s clearinghouse, as counterparty to all exchange traded futures, guarantees the futures contracts against default.
Upon entering into a futures contracts, the Fund is required to deposit either cash or securities (initial margin) with the broker in an amount equal to a certain percentage of the contract value. Subsequent payments (variation margin) are paid to or from the broker each day equal to the daily changes in the contract value. Such payments are recorded as unrealized gains or losses and, if any, shown as variation margin receivable (payable) in the Statement of Assets and Liabilities. Should the Fund fail to make requested variation margin payments, the broker can gain access to the initial margin to satisfy the Fund’s payment obligations. When the contracts are closed, a realized gain or loss is recorded in the Statement of Operations.
48 | Wells Fargo Short-Term Municipal Bond Fund
Notes to financial statements
Security transactions and income recognition
Securities transactions are recorded on a trade date basis. Realized gains or losses are recorded on the basis of identified cost.
Interest income is accrued daily and bond discounts are accreted and premiums are amortized daily. To the extent debt obligations are placed on non-accrual status, any related interest income may be reduced by writing off interest receivables when the collection of all or a portion of interest has been determined to be doubtful based on consistently applied procedures and the fair value has decreased. If the issuer subsequently resumes interest payments or when the collectability of interest is reasonably assured, the debt obligation is removed from non-accrual status.
Distributions to shareholders
Distributions to shareholders from net investment income are declared daily and paid monthly. Distributions from net realized gains, if any, are recorded on the ex-dividend date and paid at least annually. Such distributions are determined in accordance with income tax regulations and may differ from U.S. generally accepted accounting principles. Dividend sources are estimated at the time of declaration. The tax character of distributions is determined as of the Fund’s fiscal year end. Therefore, a portion of the Fund’s distributions made prior to the Fund��s fiscal year end may be categorized as a tax return of capital at year end.
Federal and other taxes
The Fund intends to continue to qualify as a regulated investment company by distributing substantially all of its investment company taxable and tax-exempt income and any net realized capital gains (after reduction for capital loss carryforwards) sufficient to relieve it from all, or substantially all, federal income taxes. Accordingly, no provision for federal income taxes was required.
The Fund’s income and federal excise tax returns and all financial records supporting those returns for the prior three fiscal years are subject to examination by the federal and Delaware revenue authorities. Management has analyzed the Fund’s tax positions taken on federal, state, and foreign tax returns for all open tax years and does not believe that there are any uncertain tax positions that require recognition of a tax liability.
As of June 30, 2019, the aggregate cost of all investments for federal income tax purposes was $3,971,869,937 and the unrealized gains (losses) consisted of:
| | | | |
| |
Gross unrealized gains | | $ | 40,240,288 | |
| |
Gross unrealized losses | | | (4,637,756 | ) |
| |
Net unrealized gains | | $ | 35,602,532 | |
As of June 30, 2019, the Fund had capital loss carryforwards which consist of $43,260,519 in long-term capital losses.
Class allocations
The separate classes of shares offered by the Fund differ principally in applicable sales charges, distribution, shareholder servicing, and administration fees. Class specific expenses are charged directly to that share class. Investment income, common fund-level expenses, and realized and unrealized gains (losses) on investments are allocated daily to each class of shares based on the relative proportion of net assets of each class.
3. FAIR VALUATION MEASUREMENTS
Fair value measurements of investments are determined within a framework that has established a fair value hierarchy based upon the various data inputs utilized in determining the value of the Fund’s investments. The three-level hierarchy gives the highest priority to unadjusted quoted prices in active markets for identical assets or liabilities (Level 1) and the lowest priority to unobservable inputs (Level 3). The Fund’s investments are classified within the fair value hierarchy based on the lowest level of input that is significant to the fair value measurement. The inputs are summarized into three broad levels as follows:
| ∎ | | Level 1 – quoted prices in active markets for identical securities |
| ∎ | | Level 2 – other significant observable inputs (including quoted prices for similar securities, interest rates, prepayment speeds, credit risk, etc.) |
| ∎ | | Level 3 – significant unobservable inputs (including the Fund’s own assumptions in determining the fair value of investments) |
The inputs or methodologies used for valuing investments in securities are not necessarily an indication of the risk associated with investing in those securities.
Wells Fargo Short-Term Municipal Bond Fund | 49
Notes to financial statements
The following is a summary of the inputs used in valuing the Fund’s assets and liabilities as of June 30, 2019:
| | | | | | | | | | | | | | | | |
| | | | |
| | | Quoted prices
(Level 1) | | | Other significant
observable inputs
(Level 2) | | | Significant
unobservable inputs (Level 3) | | | Total | |
| | | | |
Assets | | | | | | | | | | | | | | | | |
Investments in: | | | | | | | | | | | | | | | | |
| | | | |
Municipal obligations | | $ | 0 | | | $ | 3,964,125,028 | | | $ | 0 | | | $ | 3,964,125,028 | |
| | | | |
Closed end municipal bond funds | | | 0 | | | | 33,400,000 | | | | 0 | | | | 33,400,000 | |
| | | | |
Short-term investments | | | | | | | | | | | | | | | | |
| | | | |
Investment companies | | | 9,947,441 | | | | 0 | | | | 0 | | | | 9,947,441 | |
| | | | |
Total assets | | $ | 9,947,441 | | | $ | 3,997,525,028 | | | $ | 0 | | | $ | 4,007,472,469 | |
Additional sector, industry or geographic detail is included in the Portfolio of Investments.
At June 30, 2019, the Fund did not have any transfers into/out of Level 3.
4. TRANSACTIONS WITH AFFILIATES
Management fee
Funds Management, an indirect wholly owned subsidiary of Wells Fargo & Company (“Wells Fargo”), is the manager of the Fund and provides advisory and fund-level administrative services under an investment management agreement. Under the investment management agreement, Funds Management is responsible for, among other services, implementing the investment objectives and strategies of the Fund, supervising the subadviser and providing fund-level administrative services in connection with the Fund’s operations. As compensation for its services under the investment management agreement, Funds Management is entitled to receive a management fee at the following annual rate based on the Fund’s average daily net assets:
| | | | |
| |
| Average daily net assets | | Management fee | |
| |
First $1 billion | | | 0.350 | % |
| |
Next $4 billion | | | 0.325 | |
| |
Next $3 billion | | | 0.290 | |
| |
Next $2 billion | | | 0.265 | |
| |
Over $10 billion | | | 0.255 | |
For the year ended June 30, 2019, the management fee was equivalent to an annual rate of 0.33% of the Fund’s average daily net assets.
Funds Management has retained the services of a subadviser to provide daily portfolio management to the Fund. The fee for subadvisory services is borne by Funds Management. Wells Capital Management Incorporated, an affiliate of Funds Management and an indirect wholly owned subsidiary of Wells Fargo, is the subadviser to the Fund and is entitled to receive a fee from Funds Management at an annual rate starting at 0.15% and declining to 0.05% as the average daily net assets of the Fund increase.
Administration fees
Under a class-level administration agreement, Funds Management provides class-level administrative services to the Fund, which includes paying fees and expenses for services provided by the transfer agent, sub-transfer agents, omnibus account servicers and record-keepers. As compensation for its services under the class-level administration agreement, Funds Management receives an annual fee which is calculated based on the average daily net assets of each class as follows:
| | |
| |
| | | Class-level
administration fee |
| |
Class A, Class C | | 0.16% |
| |
Class R6 | | 0.03 |
| |
Administrator Class | | 0.10 |
| |
Institutional Class | | 0.08 |
50 | Wells Fargo Short-Term Municipal Bond Fund
Notes to financial statements
Funds Management has contractually waived and/or reimbursed management and administration fees to the extent necessary to maintain certain net operating expense ratios for the Fund. When each class of the Fund has exceeded its expense cap, Funds Management has waived fees and/or reimbursed expenses from fund-level expenses on a proportionate basis and then from class specific expenses. When only certain classes exceed their expense caps, waivers and/or reimbursements are applied against class specific expenses before fund-level expenses. Funds Management has committed through October 31, 2019 to waive fees and/or reimburse expenses to the extent necessary to cap the Fund’s expenses at 0.63% for Class A shares, 1.38% for Class C shares, 0.35% for Class R6 shares, 0.60% for Administrator Class shares, and 0.40% for Institutional Class shares. Prior to or after the commitment expiration date, the cap may be increased or the commitment to maintain the cap may be terminated only with the approval of the Board of Trustees.
Distribution fee
The Trust has adopted a distribution plan for Class C shares of the Fund pursuant to Rule 12b-1 under the 1940 Act. A distribution fee is charged to Class C shares and paid to Wells Fargo Funds Distributor, LLC (“Funds Distributor”), the principal underwriter, at an annual rate of 0.75% of the average daily net assets of Class C shares.
In addition, Funds Distributor is entitled to receive the front-end sales charge from the purchase of Class A shares and a contingent deferred sales charge on the redemption of certain Class A shares. Funds Distributor is also entitled to receive the contingent deferred sales charges from redemptions of Class C shares. For the year ended June 30, 2019, Funds Distributor received $1,305 from the sale of Class A shares. No contingent deferred sales charges were incurred by Class A and Class C shares for the year ended June 30, 2019.
Shareholder servicing fees
The Trust has entered into contracts with one or more shareholder servicing agents, whereby Class A, Class C, and Administrator Class of the Fund are charged a fee at an annual rate of 0.25% of the average daily net assets of each respective class. A portion of these total shareholder servicing fees were paid to affiliates of Wells Fargo.
Interfund transactions
The Fund may purchase or sell portfolio investment securities to certain other Wells Fargo affiliates pursuant to Rule 17a-7 under the 1940 Act and under procedures adopted by the Board of Trustees. The procedures have been designed to ensure that these interfund transactions, which do not incur broker commissions, are effected at current market prices. Pursuant to these procedures, the Fund had $336,095,000 and $217,685,000 in interfund purchases and sales, respectively, during the year ended June 30, 2019.
5. INVESTMENT PORTFOLIO TRANSACTIONS
Purchases and sales of investments, excluding U.S. government obligations (if any) and short-term securities, for the year ended June 30, 2019 were $1,354,155,742 and $1,610,715,132, respectively.
6. DERIVATIVE TRANSACTIONS
During the year ended June 30, 2019, the Fund entered into futures contracts to take advantage of the differences between municipal and treasury yields and to help manage the duration of the portfolio. The Fund had an average notional amount of $155,421,706 in long futures contracts during the year ended June 30, 2019.
The fair value, realized gains or losses and change in unrealized gains or losses, if any, on derivative instruments are reflected in the corresponding financial statement captions.
7. BANK BORROWINGS
The Trust (excluding the money market funds), Wells Fargo Master Trust and Wells Fargo Variable Trust are parties to a $280,000,000 revolving credit agreement whereby the Fund is permitted to use bank borrowings for temporary or emergency purposes, such as to fund shareholder redemption requests. Interest under the credit agreement is charged to the Fund based on a borrowing rate equal to the higher of the Federal Funds rate in effect on that day plus 1.25% or the overnight LIBOR rate in effect on that day plus 1.25%. In addition, an annual commitment fee equal to 0.25% of the unused balance is allocated to each participating fund.
For the year ended June 30, 2019, there were no borrowings by the Fund under the agreement.
Wells Fargo Short-Term Municipal Bond Fund | 51
Notes to financial statements
8. DISTRIBUTIONS TO SHAREHOLDERS
The tax character of distributions paid during the years ended June 30, 2019 and June 30, 2018 were as follows:
| | | | | | | | |
| | | Year ended June 30 | |
| | |
| | | 2019 | | | 2018 | |
| | |
Tax-exempt income | | $ | 77,208,661 | | | $ | 76,006,380 | |
| | |
Tax basis return of capital | | | 226,983 | | | | 0 | |
As of June 30, 2019, the components of distributable earnings on a tax basis were as follows:
| | |
Unrealized gains | | Capital loss carryforward |
| |
| $35,602,532 | | $(43,260,519) |
Effective for all filings after November 4, 2018, the Securities and Exchange Commission eliminated the requirement to separately state the components of distributions to shareholders under U.S. generally accepted accounting principles. The amounts of distributions to shareholders for the year ended June 30, 2018 were as follows:
| | | | |
| |
| | | Net investment
income | |
| |
Class A | | $ | 18,913,250 | |
| |
Class C | | | 329,883 | |
| |
Administrator Class | | | 776,666 | |
| |
Institutional Class | | | 55,986,581 | |
9. INDEMNIFICATION
Under the Trust’s organizational documents, the officers and Trustees have been granted certain indemnification rights against certain liabilities that may arise out of performance of their duties to the Trust. Additionally, in the normal course of business, the Trust may enter into contracts with service providers that contain a variety of indemnification clauses. The Trust’s maximum exposure under these arrangements is dependent on future claims that may be made against the Fund and, therefore, cannot be estimated.
10. NEW ACCOUNTING PRONOUNCEMENTS
In August 2018, FASB issued Accounting Standards Update (“ASU”) No. 2018-13, Fair Value Measurement (Topic 820)Disclosure Framework—Changes to the Disclosure Requirements for Fair Value Measurement. ASU 2018-13 updates the disclosure requirements for fair value measurements by modifying or removing certain disclosures and adding certain new disclosures. The amendments are effective for fiscal years, and interim periods within those fiscal years, beginning after December 15, 2019. Early adoption is permitted. Management has adopted the removal and modification of disclosures early, as permitted, and will adopt the additional new disclosures at the effective date.
In March 2017, FASB issued ASU No. 2017-08,Premium Amortization on Purchased Callable Debt Securities. ASU 2017-08 shortens the amortization period for certain callable debt securities held at a premium and requires the premium to be amortized to the earliest call date. The amendments do not require an accounting change for securities held at a discount and discounts will continue to be accreted to the maturity date of the security. ASU 2017-08 is effective for fiscal years beginning after December 15, 2018 and for interim periods within those fiscal years. During the current reporting period, management of the Fund adopted the change in accounting policy which did not have a material impact to the Fund’s financial statements.
52 | Wells Fargo Short-Term Municipal Bond Fund
Report of independent registered public accounting firm
TO THE SHAREHOLDERS OF THE FUND AND BOARD OF TRUSTEES OF WELLS FARGO FUNDS TRUST:
Opinion on the Financial Statements
We have audited the accompanying statement of assets and liabilities of Wells Fargo Short-Term Municipal Bond Fund (the Fund), one of the funds constituting Wells Fargo Funds Trust, including the portfolio of investments, as of June 30, 2019, the related statement of operations for the year then ended, the statements of changes in net assets for each of the years in the two year period then ended, and the related notes (collectively, the financial statements) and the financial highlights for each of the years or periods in the five year period then ended. In our opinion, the financial statements and financial highlights present fairly, in all material respects, the financial position of the Fund as of June 30, 2019, the results of its operations for the year then ended, the changes in its net assets for each of the years in the two year period then ended, and the financial highlights for each of the years or periods in the five year period then ended, in conformity with U.S. generally accepted accounting principles.
Basis for Opinion
These financial statements and financial highlights are the responsibility of the Fund’s management. Our responsibility is to express an opinion on these financial statements and financial highlights based on our audits. We are a public accounting firm registered with the Public Company Accounting Oversight Board (United States) (PCAOB) and are required to be independent with respect to the Fund in accordance with the U.S. federal securities laws and the applicable rules and regulations of the Securities and Exchange Commission and the PCAOB.
We conducted our audits in accordance with the standards of the PCAOB. Those standards require that we plan and perform the audit to obtain reasonable assurance about whether the financial statements and financial highlights are free of material misstatement, whether due to error or fraud. Our audits included performing procedures to assess the risks of material misstatement of the financial statements and financial highlights, whether due to error or fraud, and performing procedures that respond to those risks. Such procedures included examining, on a test basis, evidence regarding the amounts and disclosures in the financial statements and financial highlights. Such procedures also included confirmation of securities owned as of June 30, 2019, by correspondence with the custodian and brokers, or by other appropriate auditing procedures. Our audits also included evaluating the accounting principles used and significant estimates made by management, as well as evaluating the overall presentation of the financial statements and financial highlights. We believe that our audits provide a reasonable basis for our opinion.

We have not been able to determine the specific year that we began serving as the auditor of one or more Wells Fargo Funds investment companies; however we are aware that we have served as the auditor of one or more Wells Fargo Funds investment companies since at least 1955.
Boston, Massachusetts
August 26, 2019
Wells Fargo Short-Term Municipal Bond Fund | 53
Other information (unaudited)
TAX INFORMATION
Pursuant to Section 852 of the Internal Revenue Code, 100% of distributions paid from net investment income is designated as exempt-interest dividends for the fiscal year ended June 30, 2019.
PROXY VOTING INFORMATION
A description of the policies and procedures used to determine how to vote proxies relating to portfolio securities is available, upon request, by calling1-800-222-8222, visiting our website atwfam.com, or visiting the SEC website at sec.gov. Information regarding how the proxies related to portfolio securities were voted during the most recent 12-month period ended June 30 is available on the website atwfam.comor by visiting the SEC website at sec.gov.
QUARTERLY PORTFOLIO HOLDINGS INFORMATION
The Fund files its complete schedule of portfolio holdings with the SEC for the first and third quarters of each fiscal year on Form N-Q or Form N-PORT, which is available by visiting the SEC website at sec.gov. Those forms may be reviewed and copied at the SEC’s Public Reference Room in Washington, DC. Information on the operation of the Public Reference Room may be obtained by calling 1-800-SEC-0330.
54 | Wells Fargo Short-Term Municipal Bond Fund
Other information (unaudited)
BOARD OF TRUSTEES AND OFFICERS
Each of the Trustees and Officers1 listed in the table below acts in identical capacities for each fund in the Wells Fargo family of funds, which consists of 152 mutual funds comprising the Wells Fargo Funds Trust, Wells Fargo Variable Trust, Wells Fargo Master Trust and four closed-end funds (collectively the “Fund Complex”). This table should be read in conjunction with the Prospectus and the Statement of Additional Information2. The mailing address of each Trustee and Officer is 525 Market Street, 12th Floor, San Francisco, CA 94105. Each Trustee and Officer serves an indefinite term, however, each Trustee serves such term until reaching the mandatory retirement age established by the Trustees.
Independent Trustees
| | | | | | |
Name and year of birth | | Position held and length of service* | | Principal occupations during past five years or longer | | Current other public company or investment company directorships |
| | | |
| William R. Ebsworth (Born 1957) | | Trustee, since 2015 | | Retired. From 1984 to 2013, equities analyst, portfolio manager, research director and chief investment officer at Fidelity Management and Research Company in Boston, Tokyo, and Hong Kong, and retired in 2013 as Chief Investment Officer of Fidelity Strategic Advisers, Inc. where he led a team of investment professionals managing client assets. Prior thereto, Board member of Hong Kong Securities Clearing Co., Hong Kong Options Clearing Corp., the Thailand International Fund, Ltd., Fidelity Investments Life Insurance Company, and Empire Fidelity Investments Life Insurance Company. Audit Committee Chair and Investment Committee Chair of the Vincent Memorial Hospital Endowment (non-profit organization). Mr. Ebsworth is a CFA® charterholder. | | N/A |
| | | |
| Jane A. Freeman (Born 1953) | | Trustee, since 2015; Chair Liaison, since 2018 | | Retired. From 2012 to 2014 and 1999 to 2008, Chief Financial Officer of Scientific Learning Corporation. From 2008 to 2012, Ms. Freeman provided consulting services related to strategic business projects. Prior to 1999, Portfolio Manager at Rockefeller & Co. and Scudder, Stevens & Clark. Board member of the Harding Loevner Funds from 1996 to 2014, serving as both Lead Independent Director and chair of the Audit Committee. Board member of the Russell Exchange Traded Funds Trust from 2011 to 2012 and the chair of the Audit Committee. Ms. Freeman is a Board Member of The Ruth Bancroft Garden (non-profit organization). She is also an inactive Chartered Financial Analyst. | | N/A |
| | | |
| Isaiah Harris, Jr. (Born 1952) | | Trustee, since 2009; Audit Committee Chairman, since 2019 | | Retired. Chairman of the Board of CIGNA Corporation since 2009, and Director since 2005. From 2003 to 2011, Director of Deluxe Corporation. Prior thereto, President and CEO of BellSouth Advertising and Publishing Corp. from 2005 to 2007, President and CEO of BellSouth Enterprises from 2004 to 2005 and President of BellSouth Consumer Services from 2000 to 2003. Emeritus member of the Iowa State University Foundation Board of Governors. Emeritus Member of the Advisory Board of Iowa State University School of Business. Advisory Board Member, Palm Harbor Academy (private school). Advisory Board Member, Child Evangelism Fellowship (non-profit). Mr. Harris is a certified public accountant (inactive status). | | CIGNA Corporation |
| | | |
| Judith M. Johnson (Born 1949) | | Trustee, since 2008; Audit Committee Chairman, from 2009 to 2018 | | Retired. Prior thereto, Chief Executive Officer and Chief Investment Officer of Minneapolis Employees Retirement Fund from 1996 to 2008. Ms. Johnson is an attorney, certified public accountant and a certified managerial accountant. | | N/A |
Wells Fargo Short-Term Municipal Bond Fund | 55
Other information (unaudited)
| | | | | | |
Name and year of birth | | Position held and length of service* | | Principal occupations during past five years or longer | | Current other public company or investment company directorships |
| | | |
| David F. Larcker (Born 1950) | | Trustee, since 2009 | | James Irvin Miller Professor of Accounting at the Graduate School of Business, Stanford University, Director of the Corporate Governance Research Initiative and Senior Faculty of The Rock Center for Corporate Governance since 2006. From 2005 to 2008, Professor of Accounting at the Graduate School of Business, Stanford University. Prior thereto, Ernst & Young Professor of Accounting at The Wharton School, University of Pennsylvania from 1985 to 2005. | | N/A |
| | | |
| Olivia S. Mitchell (Born 1953) | | Trustee, since 2006; Nominating and Governance Committee Chairman, since 2018 | | International Foundation of Employee Benefit Plans Professor, Wharton School of the University of Pennsylvania since 1993. Director of Wharton’s Pension Research Council and Boettner Center on Pensions & Retirement Research, and Research Associate at the National Bureau of Economic Research. Previously, Cornell University Professor from 1978 to 1993. | | N/A |
| | | |
| Timothy J. Penny (Born 1951) | | Trustee, since 1996; Chairman, since 2018 | | President and Chief Executive Officer of Southern Minnesota Initiative Foundation, a non-profit organization, since 2007. Member of the Board of Trustees of NorthStar Education Finance, Inc., a non-profit organization, since 2007. | | N/A |
| | | |
| James G. Polisson (Born 1959) | | Trustee, since 2018 | | Retired. Chief Marketing Officer, Source (ETF) UK Services, Ltd, from 2015 to 2017. From 2012 to 2015, Principal of The Polisson Group, LLC, a management consulting, corporate advisory and principal investing company. Chief Executive Officer and Managing Director at Russell Investments, Global Exchange Traded Funds from 2010 to 2012. Managing Director of Barclays Global Investors from 1998 to 2010 and Global Chief Marketing Officer for iShares and Barclays Global Investors from 2000 to 2010. Trustee of the San Francisco Mechanics’ Institute, a non-profit organization, from 2013 to 2015. Board member of the Russell Exchange Traded Fund Trust from 2011 to 2012. Director of Barclays Global Investors Holdings Deutschland GmbH from 2006 to 2009. Mr. Polisson is an attorney and has a retired status with the Massachusetts and District of Columbia Bar Associations. | | N/A |
| * | Length of service dates reflect the Trustee’s commencement of service with the Trust’s predecessor entities, where applicable. |
56 | Wells Fargo Short-Term Municipal Bond Fund
Other information (unaudited)
Officers
| | | | |
Name and year of birth | | Position held and length of service | | Principal occupations during past five years or longer |
| | |
| Andrew Owen (Born 1960) | | President, since 2017 | | Executive Vice President of Wells Fargo & Company and Head of Affiliated Managers, Wells Fargo Asset Management, since 2014. In addition, Mr. Owen is currently President, Chief Executive Officer and Director of Wells Fargo Funds Management, LLC since 2017. Prior thereto, Executive Vice President responsible for marketing, investments and product development for Wells Fargo Funds Management, LLC, from 2009 to 2014. |
| | |
| Nancy Wiser1 (Born 1967) | | Treasurer, since 2012 | | Executive Vice President of Wells Fargo Funds Management, LLC since 2011. Chief Operating Officer and Chief Compliance Officer at LightBox Capital Management LLC, from 2008 to 2011. |
| | |
| Alexander Kymn (Born 1973) | | Secretary and Chief Legal Officer, since 2018 | | Senior Company Counsel of Wells Fargo Bank, N.A. since 2018 (previously Senior Counsel from 2007 to 2018). Vice President of Wells Fargo Funds Management, LLC from 2008 to 2014. |
| | |
| Michael H. Whitaker (Born 1967) | | Chief Compliance Officer, since 2016 | | Senior Vice President and Chief Compliance Officer since 2016. Senior Vice President and Chief Compliance Officer for Fidelity Investments from 2007 to 2016. |
| | |
| David Berardi (Born 1975) | | Assistant Treasurer, since 2009 | | Vice President of Wells Fargo Funds Management, LLC since 2009. Vice President of Evergreen Investment Management Company, LLC from 2008 to 2010. Manager of Fund Reporting and Control for Evergreen Investment Management Company, LLC from 2004 to 2010. |
| | |
| Jeremy DePalma1 (Born 1974) | | Assistant Treasurer, since 2009 | | Senior Vice President of Wells Fargo Funds Management, LLC since 2009. Senior Vice President of Evergreen Investment Management Company, LLC from 2008 to 2010 and head of the Fund Reporting and Control Team within Fund Administration from 2005 to 2010. |
| 1 | Nancy Wiser acts as Treasurer of 65 funds in the Fund Complex. Jeremy DePalma acts as Treasurer of 87 funds and Assistant Treasurer of 65 funds in the Fund Complex. |
| 2 | The Statement of Additional Information includes additional information about the Trustees and is available, without charge, upon request, by calling1-800-222-8222 or by visiting the website atwfam.com. |
Wells Fargo Short-Term Municipal Bond Fund | 57
Other information (unaudited)
BOARD CONSIDERATION OF INVESTMENT MANAGEMENT AND SUB-ADVISORY AGREEMENTS:
Wells Fargo Short-Term Municipal Bond Fund
Under the Investment Company Act of 1940 (the “1940 Act”), the Board of Trustees (the “Board”) of Wells Fargo Funds Trust (the “Trust”) must determine annually whether to approve the continuation of the Trust’s investment management and sub-advisory agreements. In this regard, at an in-person meeting held on May 21-22, 2019 (the “Meeting”), the Board, all the members of which have no direct or indirect interest in the investment management and sub-advisory agreements and are not “interested persons” of the Trust, as defined in the 1940 Act (the “Independent Trustees”), reviewed and approved for Wells Fargo Short-Term Municipal Bond Fund (the “Fund”): (i) an investment management agreement (the “Management Agreement”) with Wells Fargo Funds Management, LLC (“Funds Management”); and (ii) an investment sub-advisory agreement (the “Sub-Advisory Agreement”) with Wells Capital Management Incorporated (the “Sub-Adviser”), an affiliate of Funds Management. The Management Agreement and the Sub-Advisory Agreement are collectively referred to as the “Advisory Agreements.”
At the Meeting, the Board considered the factors and reached the conclusions described below relating to the selection of Funds Management and the Sub-Adviser and the approval of the Advisory Agreements. Prior to the Meeting, including at an in-person meeting in April 2019, the Trustees conferred extensively among themselves and with representatives of Funds Management about these matters. Also, the Board has adopted a team-based approach, with each team consisting of a sub-set of Trustees, to assist the full Board in the discharge of its duties in reviewing investment performance and other matters throughout the year. The Independent Trustees were assisted in their evaluation of the Advisory Agreements by independent legal counsel, from whom they received separate legal advice and with whom they met separately.
In providing information to the Board, Funds Management and the Sub-Adviser were guided by a detailed set of requests for information submitted to them by independent legal counsel on behalf of the Independent Trustees at the start of the Board’s annual contract renewal process earlier in 2019. In considering and approving the Advisory Agreements, the Trustees considered the information they believed relevant, including but not limited to the information discussed below. The Board considered not only the specific information presented in connection with the Meeting, but also the knowledge gained over time through interaction with Funds Management and the Sub-Adviser about various topics. In this regard, the Board reviewed reports of Funds Management at each of its quarterly meetings, which included, among other things, portfolio reviews and investment performance reports. In addition, the Board and the teams mentioned above confer with portfolio managers at various times throughout the year. The Board did not identify any particular information or consideration that was all-important or controlling, and each individual Trustee may have attributed different weights to various factors.
After its deliberations, the Board unanimously approved the continuation of the Advisory Agreements for a one-year term and determined that the compensation payable to Funds Management and the Sub-Adviser under each of the Advisory Agreements was reasonable. The Board considered the approval of the Advisory Agreements for the Fund as part of its consideration of agreements for funds across the complex, but its approvals were made on a fund-by-fund basis. The following summarizes a number of important, but not necessarily all, factors considered by the Board in support of its approvals.
Nature, extent and quality of services
The Board received and considered various information regarding the nature, extent and quality of services provided to the Fund by Funds Management and the Sub-Adviser under the Advisory Agreements. This information included a description of the investment advisory services and Fund-level administrative services covered by the Management Agreement, as well as, among other things, a summary of the background and experience of senior management of Wells Fargo Asset Management (“WFAM”), of which Funds Management and the Sub-Adviser are a part, a summary of investments made in the business of WFAM, a summary of certain organizational and personnel changes involving Funds Management and the Sub-Adviser, and a description of Funds Management’s and the Sub-Adviser’s business continuity planning programs and of their approaches to data privacy and cybersecurity. The Board received and reviewed information about Funds Management’s role as administrator of the Fund’s liquidity risk management program. The Board also considered the qualifications, background, tenure and responsibilities of each of the portfolio managers primarily responsible for the day-to-day portfolio management of the Fund.
The Board evaluated the ability of Funds Management and the Sub-Adviser to attract and retain qualified investment professionals, including research, advisory and supervisory personnel. The Board further considered the compliance programs and compliance records of Funds Management and the Sub-Adviser. In addition, the Board took into account the full range of services provided to the Fund by Funds Management and its affiliates.
58 | Wells Fargo Short-Term Municipal Bond Fund
Other information (unaudited)
Fund investment performance and expenses
The Board considered the investment performance results for the Fund over various time periods ended December 31, 2018. The Board considered these results in comparison to the investment performance of funds in a universe that was determined by Broadridge Inc. (“Broadridge”) to be similar to the Fund (the “Universe”), and in comparison to the Fund’s benchmark index and to other comparative data. Broadridge is an independent provider of investment company data. The Board received a description of the methodology used by Broadridge to select the mutual funds in the performance Universe. The Board noted that the investment performance of the Fund (Class A) was higher than the average investment performance of the Universe for all periods under review. The Board also noted that the investment performance of the Fund was lower than its benchmark index, the Bloomberg Barclays 1-3 Year Composite Municipal Bond Index, for the one-year period under review, in range of its benchmark for the three-year period under review, equal to its benchmark for the five-year period under review, but higher than its benchmark for the ten-year period under review.
The Board also received and considered information regarding the Fund’s net operating expense ratios and their various components, including actual management fees, custodian and other non-management fees, and Rule 12b-1 and non-Rule 12b-1 shareholder service fees. The Board considered these ratios in comparison to the median ratios of funds in class-specific expense groups that were determined by Broadridge to be similar to the Fund (the “Groups”). The Board received a description of the methodology used by Broadridge to select the mutual funds in the expense Groups and an explanation of how funds comprising expense groups and their expense ratios may vary from year-to-year. Based on the Broadridge reports, the Board noted that the net operating expense ratios of the Fund were lower than the median net operating expense ratios of the expense Groups for each share class.
The Board took into account the Fund’s investment performance and expense information provided to it among the factors considered in deciding to re-approve the Advisory Agreements.
Investment management and sub-advisory fee rates
The Board reviewed and considered the contractual fee rates payable by the Fund to Funds Management under the Management Agreement, as well as the contractual fee rates payable by the Fund to Funds Management for class-level administrative services under a Class-Level Administration Agreement, which include, among other things, class-level transfer agency and sub-transfer agency costs (collectively, the “Management Rates”). The Board also reviewed and considered the contractual investment sub-advisory fee rates that are payable by Funds Management to the Sub-Adviser for investment sub-advisory services.
Among other information reviewed by the Board was a comparison of the Fund’s Management Rates with the average contractual investment management fee rates of funds in the expense Groups at a common asset level as well as transfer agency costs of the funds in the expense Groups. The Board noted that the Management Rates of the Fund were lower than or in range of the sum of these average rates for the Fund’s expense Groups for all share classes.
The Board also received and considered information about the portion of the total management fee that was retained by Funds Management after payment of the fee to the Sub-Adviser for sub-advisory services. In assessing the reasonableness of this amount, the Board received and evaluated information about the nature and extent of responsibilities retained and risks assumed by Funds Management and not delegated to or assumed by the Sub-Adviser, and about Funds Management’s on-going oversight services. Given the affiliation between Funds Management and the Sub-Adviser, the Board ascribed limited relevance to the allocation of fees between them.
The Board also received and considered information about the nature and extent of services offered and fee rates charged by Funds Management and the Sub-Adviser to other types of clients with investment strategies similar to those of the Fund. In this regard, the Board received information about the significantly greater scope of services, and compliance, reporting and other legal burdens and risks of managing proprietary mutual funds compared with those associated with managing assets of other types of clients, including third-party sub-advised fund clients and non-mutual fund clients such as institutional separate accounts.
Based on its consideration of the factors and information it deemed relevant, including those described here, the Board determined that the compensation payable to Funds Management under the Management Agreement and to the Sub-Adviser under the Sub-Advisory Agreement was reasonable.
Profitability
The Board received and considered information concerning the profitability of Funds Management, as well as the profitability of both WFAM and Wells Fargo & Co. (“Wells Fargo”) from providing services to the fund family as a whole. The Board noted that the Sub-Adviser’s profitability information with respect to providing services to the Fund and other funds in the family was subsumed in the WFAM and Wells Fargo profitability analysis.
Wells Fargo Short-Term Municipal Bond Fund | 59
Other information (unaudited)
Funds Management reported on the methodologies and estimates used in calculating profitability, including a description of the methodology used to allocate certain expenses. Among other things, the Board noted that the levels of profitability reported on a fund-by-fund basis varied widely, depending on factors such as the size, type and age of fund. Based on its review, the Board did not deem the profits reported by Funds Management, WFAM or Wells Fargo from services provided to the Fund to be at a level that would prevent it from approving the continuation of the Advisory Agreements.
Economies of scale
The Board received and considered information about the potential for Funds Management to experience economies of scale in the provision of management services to the Fund, the difficulties of calculating economies of scale at an individual fund level, and the extent to which potential scale benefits are shared with shareholders. The Board noted the existence of breakpoints in the Fund’s management fee structure, which operate generally to reduce the Fund’s expense ratios as the Fund grows in size. The Board considered that in addition to management fee breakpoints, Funds Management shares potential economies of scale from its management business in a variety of ways, including through fee waiver and expense reimbursement arrangements, services that benefit shareholders, competitive management fee rates set at the outset without regard to breakpoints, and investments in the business intended to enhance services available to shareholders.
The Board concluded that Funds Management’s arrangements with respect to the Fund, including contractual breakpoints, constituted a reasonable approach to sharing potential economies of scale with the Fund and its shareholders.
Other benefits to Funds Management and the Sub-Adviser
The Board received and considered information regarding potential “fall-out” or ancillary benefits received by Funds Management and its affiliates, including the Sub-Adviser, as a result of their relationships with the Fund. Ancillary benefits could include, among others, benefits directly attributable to other relationships with the Fund and benefits potentially derived from an increase in Funds Management’s and the Sub-Adviser’s business as a result of their relationships with the Fund. The Board noted that various affiliates of Funds Management may receive distribution-related fees, shareholder servicing payments and sub-transfer agency fees in respect of shares sold or held through them and services provided.
The Board also reviewed information about soft dollar credits earned and utilized by the Sub-Adviser, fees earned by Funds Management and the Sub-Adviser from managing a private investment vehicle for the fund family’s securities lending collateral, and commissions earned by an affiliated broker from portfolio transactions.
Based on its consideration of the factors and information it deemed relevant, including those described here, the Board did not find that any ancillary benefits received by Funds Management and its affiliates, including the Sub-Adviser, were unreasonable.
Conclusion
At the Meeting, after considering the above-described factors and based on its deliberations and its evaluation of the information described above, the Board unanimously approved the continuation of the Advisory Agreements for a one-year term and determined that the compensation payable to Funds Management and the Sub-Adviser under each of the Advisory Agreements was reasonable.
60 | Wells Fargo Short-Term Municipal Bond Fund

For more information
More information about Wells Fargo Funds is available free upon request. To obtain literature, please write, visit the Fund’s website, or call:
Wells Fargo Funds
P.O. Box 219967
Kansas City, MO 64121-9967
Website:wfam.com
Individual investors:1-800-222-8222
Retail investment professionals:1-888-877-9275
Institutional investment professionals:1-866-765-0778

This report and the financial statements contained herein are submitted for the general information of the shareholders of the Fund. If this report is used for promotional purposes, distribution of the report must be accompanied or preceded by a current prospectus. Before investing, please consider the investment objectives, risks, charges, and expenses of the investment. For a current prospectus and, if available, a summary prospectus, containing this information, call1-800-222-8222 or visit the Fund’s website atwfam.com. Read the prospectus carefully before you invest or send money.
Wells Fargo Asset Management (WFAM) is the trade name for certain investment advisory/management firms owned by Wells Fargo & Company. These firms include but are not limited to Wells Capital Management Incorporated and Wells Fargo Funds Management, LLC. Certain products managed by WFAM entities are distributed by Wells Fargo Funds Distributor, LLC (a broker-dealer and Member FINRA).
This material is for general informational and educational purposes only and is NOT intended to provide investment advice or a recommendation of any kind—including a recommendation for any specific investment, strategy, or plan.
INVESTMENT PRODUCTS: NOT FDIC INSURED ◾ NO BANK GUARANTEE ◾ MAY LOSE VALUE
© 2019 Wells Fargo Funds Management, LLC. All rights reserved.
404827 08-19
A256/AR256 06-19
Annual Report
June 30, 2019
Wells Fargo
Ultra Short-Term Municipal Income Fund
Beginning on January 1, 2021, as permitted by new regulations adopted by the Securities and Exchange Commission, paper copies of the Wells Fargo Funds’ annual and semi-annual shareholder reports issued after this date will no longer be sent by mail, unless you specifically request paper copies of the reports. Instead, the reports will be made available on the Funds’ website, and you will be notified by mail each time a report is posted and provided with a website address to access the report.
If you already elected to receive shareholder reports electronically, you will not be affected by this change and you need not take any action. You may elect to receive shareholder reports and other communications from the Fund electronically at any time by contacting your financial intermediary (such as a broker-dealer or bank) or, if you are a direct investor, by calling1-800-222-8222 or by enrolling at wellsfargo.com/advantagedelivery.
You may elect to receive all future reports in paper free of charge. If you invest through a financial intermediary, you can contact your financial intermediary to request that you continue to receive paper copies of your shareholder reports; if you invest directly with the Fund, you can call 1-800-222-8222. Your election to receive reports in paper will apply to all Wells Fargo Funds held in your account with your financial intermediary or, if you are a direct investor, to all Wells Fargo Funds that you hold.
|
|
|
Reduce clutter. Save trees. |
Sign up for electronic delivery of prospectuses and shareholder reports atwellsfargo.com/advantagedelivery |
The views expressed and any forward-looking statements are as of June 30, 2019, unless otherwise noted, and are those of the Fund managers and/or Wells Fargo Asset Management. Discussions of individual securities, or the markets generally, or any Wells Fargo Fund are not intended as individual recommendations. Future events or results may vary significantly from those expressed in any forward-looking statements. The views expressed are subject to change at any time in response to changing circumstances in the market. Wells Fargo Asset Management and the Fund disclaim any obligation to publicly update or revise any views expressed or forward-looking statements.
INVESTMENT PRODUCTS: NOT FDIC INSURED ◾ NO BANK GUARANTEE ◾ MAY LOSE VALUE
Wells Fargo Ultra Short-Term Municipal Income Fund | 1
Letter to shareholders (unaudited)

Andrew Owen
President
Wells Fargo Funds
Dear Shareholder:
We are pleased to offer you this annual report for the Wells Fargo Ultra Short-Term Municipal Income Fund for the 12-month period that ended June 30, 2019. After the first six months of the period yielded either low-single-digit or negative investment returns, stock and bond investors enjoyed a recovery during the final six months. The gains came amid continued concerns about global economic growth, international trade, geopolitical tensions, and bouts of market volatility.
For the period, U.S. stocks, based on the S&P 500 Index,1 gained 10.42% and international stocks, as measured by the MSCI ACWI ex USA Index (Net),2 rose 1.29%. The MSCI EM Index (Net)3 added 1.21%. For bond investors, the Bloomberg Barclays U.S. Aggregate Bond Index4 added 7.87%, the Bloomberg Barclays Global Aggregate ex-USD Index5 rose 4.10%, the Bloomberg Barclays Municipal Bond Index6 gained 6.71%, and the ICE BofAML U.S. High Yield Index7 added 7.58%.
U.S. and international markets diverged during the third quarter of 2018.
Domestic equity investors received encouraging news during the third quarter of 2018. The U.S. Bureau of Economic Analysis reported second-quarter annualized gross domestic product (GDP) growth of 4.2%. Hiring improved. Unemployment declined. Consumer confidence and spending increased. Third-quarter corporate earnings reports were generally positive. U.S. trade negotiations with Mexico and Canada progressed. The U.S. Federal Reserve (Fed) raised the federal funds rate by 25 basis points (bps; 100 bps equal 1.00%) to a target range of between 2.00% and 2.25% in September, one of four rate increases implemented during 2018, expressing confidence in the strength of the U.S. economic expansion’s durability.
Investors in international markets were not as confident. Tensions between the U.S. and China increased. The U.S. imposed $200 billion in tariffs on Chinese goods. China reacted with $60 billion in tariffs on U.S. goods. Economic growth in China caused concern. During the quarter, the MSCI ACWI ex USA Index (Net) gained 0.71%. The MSCI EM Index (Net) declined 1.09%. In fixed-income markets, U.S. bonds were flat, as measured by the Bloomberg Barclays U.S. Aggregate Bond Index. The Bloomberg Barclays Global Aggregate ex-USD Index fell 1.74%.
| 1 | The S&P 500 Index consists of 500 stocks chosen for market size, liquidity, and industry group representation. It is a market-value-weighted index with each stock’s weight in the index proportionate to its market value. You cannot invest directly in an index. |
| 2 | The Morgan Stanley Capital International (MSCI) All Country World Index (ACWI) ex USA Index (Net) is a free-float-adjusted market-capitalization weighted index that is designed to measure the equity market performance of developed and emerging markets, excluding the U.S. Source: MSCI. MSCI makes no express or implied warranties or representations and shall have no liability whatsoever with respect to any MSCI data contained herein. The MSCI data may not be further redistributed or used as a basis for other indices or any securities or financial products. This report is not approved, reviewed, or produced by MSCI. You cannot invest directly in an index. |
| 3 | The MSCI Emerging Markets (EM) Index (Net) is a free-float-adjusted market-capitalization-weighted index that is designed to measure the equity market performance of emerging markets. You cannot invest directly in an index. |
| 4 | The Bloomberg Barclays U.S. Aggregate Bond Index is a broad-based benchmark that measures the investment-grade, U.S. dollar-denominated, fixed-rate taxable bond market, including Treasuries, government-related and corporate securities, mortgage-backed securities (agency fixed-rate and hybrid adjustable-rate mortgage pass-throughs), asset-backed securities, and commercial mortgage-backed securities. You cannot invest directly in an index. |
| 5 | The Bloomberg Barclays Global Aggregate ex-USD Index is an unmanaged index that provides a broad-based measure of the global investment-grade fixed-income markets excluding the U.S. dollar-denominated debt market. You cannot invest directly in an index. |
| 6 | The Bloomberg Barclays Municipal Bond Index is an unmanaged index composed of long-term tax-exempt bonds with a minimum credit rating of Baa. You cannot invest directly in an index. |
| 7 | The ICE BofAML U.S. High Yield Index is a market-capitalization-weighted index of domestic and Yankee high-yield bonds. The index tracks the performance of high-yield securities traded in the U.S. bond market. You cannot invest directly in an index. Copyright 2019. ICE Data Indices, LLC. All rights reserved. |
2 | Wells Fargo Ultra Short-Term Municipal Income Fund
Letter to shareholders (unaudited)
Global markets suffered during the fourth quarter of 2018.
November’s U.S. midterm elections shifted control of the House of Representatives from Republicans to Democrats, presaging partisan clashes that followed and caused uncertainty among investors. Third-quarter U.S. GDP was announced at an annualized 3.4% rate, lower than the second-quarter rate. Brexit efforts stalled ahead of the March 2019 deadline. The People’s Bank of China cut reserve requirement ratios, accelerated infrastructure spending, and cut taxes even as the value of the yuan declined to low levels last seen in 2008. A partial U.S. government shutdown driven by partisan policy disputes extended into January.
The combination of news in the U.S. and generally weak economic indicators outside of the U.S. caused investors to seek safe havens. December’s S&P 500 Index performance was the worst since 1931. Globally, fixed-income investments fared better than stocks during the last two months of the year. The Fed increased the federal funds rate by 25 bps in December to a target range of between 2.25% and 2.50%.
The market climbs a wall of worry.
Investors entered 2019 with reasons to be concerned. Investment returns appeared to reaffirm the adage that markets climb a wall of worry. The S&P 500 Index gained 8.01% for the month of January, the best monthly performance in 30 years. Returns for the MSCI ACWI ex USA Index (Net), the Bloomberg Barclays U.S. Aggregate Bond Index, and the Bloomberg Barclays Global Aggregate ex-USD Index also were positive. The Fed indicated that it would pause its program of regular rate increases during 2019 as inflation remained low.
In February 2019, concerns over slowing global growth persisted. The Bureau of Economic Analysis announced fourth-quarter 2018 GDP grew at an annualized 2.2% rate, down from the levels of the prior two quarters. In a February report, the Bank of England forecast the slowest growth since the financial crisis for 2019. China and the U.S. continued to wrangle over trade issues.
By the end of March 2019, the combination of dovish Fed sentiment and steady, if not spectacular, economic and business metrics reinforced investors’ confidence. Monthly job creation data and corporate profits, while less consistent than during 2018, were solid. China announced a roughly $300 billion stimulus package through tax and fee cuts intended to reinvigorate economic growth.
During April 2019, investors drew confidence from favorable economic projections, sustained low inflation, and solid employment data. First-quarter GDP showed the economy grew at an annualized rate of 3.2% on improvement in business investment and exports. Favorable sentiment extended to foreign markets as the MSCI ACWI ex USA Index (Net) gained 2.64% and the MSCI EM Index (Net) added 2.11% for the month.
During May 2019, investing signals were mixed. In the U.S., partisan wrangling ramped up as Democrats and Republicans set their sights on 2020 presidential politics. The U.K.’s Brexit caused Prime Minister Theresa May to resign. The European Commission downgraded the 2019 growth forecast to 1.2%. The U.S. increased tariffs on products from China, China responded, and then talks broke down. President Donald Trump threatened to turn his foreign policy tariff tool to Mexico over immigration issues. Markets tumbled.
As had been the case during most of 2019 to date, just as the investment horizon appeared to darken, sentiment turned and markets gained. The gains, primarily driven by geopolitical and monetary policy events, drove equity markets to new highs. President Trump dropped his threats of new tariffs on Mexico after talks and further tariffs on China after meeting with China’s President Xi Jinping at the G-20 summit. President Mario Draghi of the European Central Bank said that if the outlook doesn’t
“December’s S&P 500 Index performance was the worst since 1931.”
“The S&P 500 Index gained 8.01% for the month of January, the best monthly performance in 30 years.”
Wells Fargo Ultra Short-Term Municipal Income Fund | 3
Letter to shareholders (unaudited)
improve, the bank will cut rates or buy more assets to prop up inflation. In the U.S., the Fed said growth shifted from “solid” to “moderate” and indicated a willingness to cut rates.
Don’t let short-term uncertainty derail long-term investment goals.
Periods of investment uncertainty can present challenges, but experience has taught us that maintaining long-term investment goals can be an effective way to plan for the future. To help you create a sound strategy based on your personal goals and risk tolerance, Wells Fargo Funds offers more than 100 mutual funds spanning a wide range of asset classes and investment styles. Although diversification cannot guarantee an investment profit or prevent losses, we believe it can be an effective way to manage investment risk and potentially smooth out overall portfolio performance. We encourage investors to know their investments and to understand that appropriate levels of risk-taking may unlock opportunities.
Thank you for choosing to invest with Wells Fargo Funds. We appreciate your confidence in us and remain committed to helping you meet your financial needs.
Sincerely,

Andrew Owen
President
Wells Fargo Funds
|
|
|
For further information about your Fund, contact your investment professional, visit our website at wfam.com, or call us directly at1-800-222-8222. |
4 | Wells Fargo Ultra Short-Term Municipal Income Fund
This page is intentionally left blank.
Performance highlights (unaudited)
Investment objective
The Fund seeks current income exempt from federal income tax, consistent with capital preservation.
Manager
Wells Fargo Funds Management, LLC
Subadviser
Wells Capital Management Incorporated
Portfolio managers
Wendy Casetta
Bruce R. Johns
James Randazzo‡
Average annual total returns (%) as of June 30, 2019
| | | | | | | | | | | | | | | | | | | | | | | | | | | | | | | | | | |
| | | | |
| | | | | Including sales charge | | | Excluding sales charge | | | Expense
ratios1 (%) | |
| | | | | | | | | |
| | | Inception date | | 1 year | | | 5 year | | | 10 year | | | 1 year | | | 5 year | | | 10 year | | | Gross | | | Net2 | |
| | | | | | | | | | |
| Class A (SMAVX) | | 10-2-2000 | | | -0.41 | | | | 0.19 | | | | 0.62 | | | | 1.63 | | | | 0.60 | | | | 0.83 | | | | 0.77 | | | | 0.67 | |
| | | | | | | | | | |
| Class C (WFUSX) | | 3-31-2008 | | | -0.13 | | | | -0.17 | | | | 0.09 | | | | 0.87 | | | | -0.17 | | | | 0.09 | | | | 1.52 | | | | 1.42 | |
| | | | | | | | | | |
| Class R6 (WUSRX)3 | | 7-31-2018 | | | – | | | | – | | | | – | | | | 1.98 | | | | 0.91 | | | | 1.13 | | | | 0.39 | | | | 0.32 | |
| | | | | | | | | | |
| Administrator Class (WUSMX)4 | | 7-30-2010 | | | – | | | | – | | | | – | | | | 1.70 | | | | 0.67 | | | | 0.90 | | | | 0.71 | | | | 0.60 | |
| | | | | | | | | | |
| Institutional Class (SMAIX) | | 7-31-2000 | | | – | | | | – | | | | – | | | | 1.93 | | | | 0.90 | | | | 1.13 | | | | 0.44 | | | | 0.37 | |
| | | | | | | | | | |
| Ultra Short-Term Municipal Income Blended Index5 | | – | | | – | | | | – | | | | – | | | | 2.05 | | | | 0.84 | | | | 0.75 | | | | – | | | | – | |
| | | | | | | | | | |
| Bloomberg Barclays1-Year Municipal Bond Index6 | | – | | | – | | | | – | | | | – | | | | 2.35 | | | | 1.05 | | | | 1.17 | | | | – | | | | – | |
| | | | | | | | | | |
| iMoneyNetTax-Free National Institutional Money Market Funds Average7 | | – | | | – | | | | – | | | | – | | | | 1.76 | | | | 0.63 | | | | 0.33 | | | | – | | | | – | |
Figures quoted represent past performance, which is no guarantee of future results, and do not reflect taxes that a shareholder may pay on fund distributions or the redemption of fund shares. Investment return and principal value of an investment will fluctuate so that an investor’s shares, when redeemed, may be worth more or less than their original cost. Performance shown without sales charges would be lower if sales charges were reflected. Current performance may be lower or higher than the performance data quoted, which assumes the reinvestment of dividends and capital gains. Currentmonth-end performance is available on the Fund’s website,wfam.com.
Index returns do not include transaction costs associated with buying and selling securities, any mutual fund fees or expenses, or any taxes. It is not possible to invest directly in an index.
For Class A shares, the maximumfront-end sales charge is 2.00%. For Class C shares, the maximum contingent deferred sales charge is 1.00%. Performance including a contingent deferred sales charge assumes the sales charge for the corresponding time period. Class R6, Administrator Class, and Institutional Class shares are sold without afront-end sales charge or contingent deferred sales charge.
Bond values fluctuate in response to the financial condition of individual issuers, general market and economic conditions, and changes in interest rates. Changes in market conditions and government policies may lead to periods of heightened volatility in the bond market and reduced liquidity for certain bonds held by the Fund. In general, when interest rates rise, bond values fall and investors may lose principal value. Interest rate changes and their impact on the Fund and its share price can be sudden and unpredictable. The use of derivatives may reduce returns and/or increase volatility. Certain investment strategies tend to increase the total risk of an investment (relative to the broader market). The Fund is exposed to high-yield securities risk and municipal securities risk. Consult the Fund’s prospectus for additional information on these and other risks. A portion of the Fund’s income may be subject to federal, state, and/ or local income taxes or the Alternative Minimum Tax (AMT). Any capital gains distributions may be taxable.
Please see footnotes on page 7.
6 | Wells Fargo Ultra Short-Term Municipal Income Fund
Performance highlights (unaudited)
|
|
| Growth of $10,000 investment as of June 30, 20198 |
|
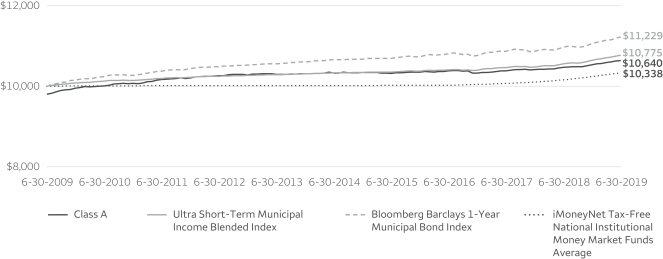
|
| ‡ | Mr. Randazzo became a portfolio manager of the Fund on March 28, 2019. |
| 1 | Reflects the expense ratios as stated in the most recent prospectuses. The expense ratios shown are subject to change and may differ from the annualized expense ratios shown in the financial highlights of this report. |
| 2 | The manager has contractually committed through October 31, 2019, to waive fees and/or reimburse expenses to the extent necessary to cap the expenses of each class after fee waivers at the amounts shown. Brokerage commissions, stamp duty fees, interest, taxes, acquired fund fees and expenses (if any), and extraordinary expenses are excluded from the expense cap. Prior to or after the commitment expiration date, the cap may be increased or the commitment to maintain the cap may be terminated only with the approval of the Board of Trustees. Without this cap, the Fund’s returns would have been lower. The expense ratio paid by an investor is the net expense ratio (the total annual fund operating expenses after fee waivers) as stated in the prospectuses. |
| 3 | Historical performance shown for Class R6 shares prior to their inception reflects the performance of the Institutional Class shares, and includes the higher expenses applicable to Institutional Class shares. If these expenses had not been included, returns for Class R6 shares would be higher. |
| 4 | Historical performance shown for Administrator Class shares prior to their inception reflects the performance of Institutional Class shares, adjusted to reflect the higher expenses applicable to Administrator Class shares. |
| 5 | Source: Wells Fargo Funds Management LLC. The Ultra Short-Term Municipal Income Blended Index is composed 50% of the Bloomberg Barclays1-Year Municipal Bond Index and 50% of the iMoneyNetTax-Free National Institutional Money Market Funds Average. You cannot invest directly in an index. |
| 6 | The Bloomberg Barclays1-Year Municipal Bond Index is theone-year component of the Bloomberg Barclays Municipal Bond Index, which is an unmanaged index composed of long-termtax-exempt bonds with a minimum credit rating of Baa. You cannot invest directly in an index. |
| 7 | iMoneyNetTax-Free National Institutional Money Market Funds Average is the return of an unmanaged group of money market funds. You cannot invest directly in this average. |
| 8 | The chart compares the performance of Class A shares for the most recent ten years with the Ultra Short-Term Municipal Income Blended Index, Bloomberg Barclays1- Year Municipal Bond Index, and the iMoneyNetTax-Free National Institutional Money Markets Funds Average. The chart assumes a hypothetical $10,000 investment in Class A shares and reflects all operating expenses and assumes the maximum initial sales charge of 2.00%. |
| 9 | Amounts are calculated based on the long-term total investments of the Fund. These amounts are subject to change and may have changed since the date specified. |
| 10 | The credit quality distribution of portfolio holdings reflected in the chart is based on ratings from Standard & Poor’s, Moody’s Investors Service, and/or Fitch Ratings Ltd. Credit quality ratings apply to the underlying holdings of the Fund and not to the Fund itself. The percentages of the Fund’s portfolio with the ratings depicted in the chart are calculated based on the total market value of fixed income securities held by the Fund. If a security was rated by all three rating agencies, the middle rating was utilized. If rated by two of three rating agencies, the lower rating was utilized, and if rated by one of the rating agencies, that rating was utilized. Standard & Poor’s rates the creditworthiness of bonds, ranging from AAA (highest) to D (lowest). Ratings from A to CCC may be modified by the addition of a plus (+) or minus (-) sign to show relative standing within the rating categories. Standard & Poor’s rates the creditworthiness of short-term notes fromSP-1 (highest) toSP-3 (lowest). Moody’s rates the creditworthiness of bonds, ranging from Aaa (highest) to C (lowest). Ratings Aa to B may be modified by the addition of a number 1 (highest) to 3 (lowest) to show relative standing within the ratings categories. Moody’s rates the creditworthiness of short-term U.S.tax-exempt municipal securities from MIG 1/VMIG 1 (highest) to SG (lowest). Fitch rates the creditworthiness of bonds, ranging from AAA (highest) to D (lowest). Credit quality distribution is subject to change and may have changed since the date specified. |
Wells Fargo Ultra Short-Term Municipal Income Fund | 7
Performance highlights (unaudited)
MANAGER’S DISCUSSION
Fund highlights
| ∎ | | The Fund (Class A shares, excluding sales charges) underperformed its benchmarks, the Ultra Short-Term Municipal Income Blended Index, the Bloomberg Barclays1-Year Municipal Bond Index, and the iMoneyNetTax-Free National Institutional Money Market Funds Average, for the12-month period that ended June 30, 2019. |
| ∎ | | The Fund’s overweight toBBB-rated bonds, combined with underweights to higher-rated and prerefunded bonds, contributed to performance. However, an overweight to floating-rate bonds and underweights toA-rated, state general obligation (GO), and lease revenue bonds detracted from performance. |
| ∎ | | The Fund’s duration was shorter than the Bloomberg Barclays1-Year Municipal Bond Index, and despite rates declining across the yield curve over the past year, our short duration contributed to performance as the bonds on the very short end outperformed. |
| ∎ | | Yield-curve positioning also contributed to performance over the period. While this Fund will invest only in securities with a maturity of five years or shorter, as the curve flattened, those slightly longer maturities outperformed. |
|
|
| Effective maturity distribution as of June 30, 20199 |
|
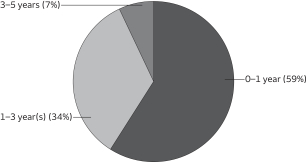 |
The Fed abruptly changed course from raising rates to a potential rate cut.
Throughout most of 2018, the fixed-income markets expected the U.S. Federal Reserve (Fed) to continue the path to normalize monetary policy. Moderate economic growth, stronger employment data, and inflation near its 2% target enabled the Fed to increase the federal funds rate four times in the calendar year. Despite a Fed rate hike in December, the Treasury market rallied in the fourth quarter of 2018 as the market lowered expectations for further rate hikes amid slower global growth, trade tariffs, and uncertainty concerning Britain’s departure from the European Union.
These concerns only increased as we moved into the first half of 2019, and discussions changed from when the Fed might hike to when it might cut the federal funds rate. As a result, fixed-income markets rallied, pushing the benchmark10-year Treasury yield from a 3.23% peak in November 2018 to 2.00% by the end of June 2019.
|
|
| Credit quality as of June 30, 201910 |
|
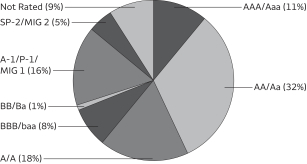 |
Specific to the municipal bond market, the beginning of the reporting period was marked with significant outflows due to a generalrisk-on sentiment in equity markets and the fear of rising interest rates. Short municipals slightly underperformed Treasuries over the period. As the calendar turned, so did market sentiment. Flows into municipal mutual funds not only turned positive, but record inflows were reported as investor opinion toward fixed income, particularly municipals, improved due to investor expectations that interest rates would remain stable. Whilenew-issue supply was higher than it was a year earlier, it was still much lower than a typical year due to tax reform that
eliminated the ability of issuers to advance refund outstanding, higher-cost debt. Overall reduced supply, state and local sales tax caps for individuals, and lower interest rates fueled demand and thus returns for municipal bonds over the period.
Please see footnotes on page 7.
8 | Wells Fargo Ultra Short-Term Municipal Income Fund
Performance highlights (unaudited)
Lower credit quality continued to drive returns.
As the period began, the Fund began to modestly increase interest rate exposure into market weakness. Yields on the five-year Treasury peaked in November at over 3%. We took advantage of market weakness and seasonally high issuance atyear-end to get closer to neutral duration positioning. Also, as credit spreads continued to tighten, we began buying higher-quality bonds but maintained an overweight toBBB-rated bonds. The Fund’s overweight toBBB-rated debt contributed to performance as lower-rated bonds outperformed higher-quality bonds during the period. In addition, the Fund’s overweight to lower-quality bonds with relatively short maturities allowed a competitive yield without significant duration risk. Sector positioning detracted from performance during the period due to an underweight to state GO and lease-backed bonds. Also, as the expectation for future rates to move lower increased, our exposure to floating-rate notes underperformed. However, overweights to Illinois and New Jersey bonds positively affected performance over the period.
Our outlook is for lower rates.
Overall, technicals remain strong in the municipal bond market and we expect municipal bond valuations in the medium term to be helped by high state income tax rates, record levels of municipal debt maturities and calls, and limited availability of gross municipal bond supply. However, we believe overall economic growth in this cycle has neared its peak, and as a result, the Fed may lower rates before the end of the year. Therefore, we will look to maintain a neutral duration positioning and anup-in-quality trade approach.
Please see footnotes on page 7.
Wells Fargo Ultra Short-Term Municipal Income Fund | 9
Fund expenses (unaudited)
As a shareholder of the Fund, you incur two types of costs: (1) transaction costs, including sales charges (loads) on purchase payments and contingent deferred sales charges (if any) on redemptions and (2) ongoing costs, including management fees, distribution(12b-1) and/or shareholder servicing fees, and other Fund expenses. This example is intended to help you understand your ongoing costs (in dollars) of investing in the Fund and to compare these costs with the ongoing costs of investing in other mutual funds.
The example is based on an investment of $1,000 invested at the beginning of thesix-month period and held for the entire period from January 1, 2019 to June 30, 2019.
Actual expenses
The “Actual” line of the table below provides information about actual account values and actual expenses. You may use the information in this line, together with the amount you invested, to estimate the expenses that you paid over the period. Simply divide your account value by $1,000 (for example, an $8,600 account value divided by $1,000 = 8.6), then multiply the result by the number in the “Actual” line under the heading entitled “Expenses paid during period” for your applicable class of shares to estimate the expenses you paid on your account during this period.
Hypothetical example for comparison purposes
The “Hypothetical” line of the table below provides information about hypothetical account values and hypothetical expenses based on the Fund’s actual expense ratio and an assumed rate of return of 5% per year before expenses, which is not the Fund’s actual return. The hypothetical account values and expenses may not be used to estimate the actual ending account balance or expenses you paid for the period. You may use this information to compare the ongoing costs of investing in the Fund and other funds. To do so, compare this 5% hypothetical example with the 5% hypothetical examples that appear in the shareholder reports of the other funds.
Please note that the expenses shown in the table are meant to highlight your ongoing costs only and do not reflect any transactional costs, such as sales charges (loads) and contingent deferred sales charges. Therefore, the “Hypothetical” line of the table is useful in comparing ongoing costs only and will not help you determine the relative total costs of owning different funds. In addition, if these transactional costs were included, your costs would have been higher.
| | | | | | | | | | | | | | | | |
| | | Beginning
account value
12-1-2018 | | | Ending
account value
6-30-2019 | | | Expenses
paid during
the period¹ | | | Annualized net
expense ratio | |
| | | | | |
Class A | | | | | | | | | | | | | | | | |
| | | | |
Actual | | $ | 1,000.00 | | | $ | 1,010.05 | | | $ | 3.34 | | | | 0.67 | % |
| | | | |
Hypothetical (5% return before expenses) | | $ | 1,000.00 | | | $ | 1,021.47 | | | $ | 3.36 | | | | 0.67 | % |
| | | | | |
Class C | | | | | | | | | | | | | | | | |
| | | | |
Actual | | $ | 1,000.00 | | | $ | 1,007.41 | | | $ | 7.07 | | | | 1.42 | % |
| | | | |
Hypothetical (5% return before expenses) | | $ | 1,000.00 | | | $ | 1,017.75 | | | $ | 7.10 | | | | 1.42 | % |
| | | | | |
Class R6 | | | | | | | | | | | | | | | | |
| | | | |
Actual | | $ | 1,000.00 | | | $ | 1,011.80 | | | $ | 1.60 | | | | 0.32 | % |
| | | | |
Hypothetical (5% return before expenses) | | $ | 1,000.00 | | | $ | 1,023.21 | | | $ | 1.61 | | | | 0.32 | % |
| | | | | |
Administrator Class | | | | | | | | | | | | | | | | |
| | | | |
Actual | | $ | 1,000.00 | | | $ | 1,010.40 | | | $ | 2.99 | | | | 0.60 | % |
| | | | |
Hypothetical (5% return before expenses) | | $ | 1,000.00 | | | $ | 1,021.82 | | | $ | 3.01 | | | | 0.60 | % |
| | | | | |
Institutional Class | | | | | | | | | | | | | | | | |
| | | | |
Actual | | $ | 1,000.00 | | | $ | 1,011.56 | | | $ | 1.85 | | | | 0.37 | % |
| | | | |
Hypothetical (5% return before expenses) | | $ | 1,000.00 | | | $ | 1,022.96 | | | $ | 1.86 | | | | 0.37 | % |
| 1 | Expenses paid is equal to the annualized net expense ratio of each class multiplied by the average account value over the period, multiplied by the number of days in the most recent fiscal half-year divided by the number of days in the fiscal year (to reflect theone-half-year period). |
10 | Wells Fargo Ultra Short-Term Municipal Income Fund
Portfolio of investments—June 30, 2019
| | | | | | | | | | | | | | | | |
| | | Interest
rate | | | Maturity
date | | | Principal | | | Value | |
| Municipal Obligations: 99.81% | |
|
Alabama: 1.86% | |
|
| Health Revenue: 0.15% | |
| | | | |
Alabama Health Care Authority for Baptist Health Series B (AGC Insured) (m) | | | 2.15 | % | | | 11-15-2037 | | | $ | 2,900,000 | | | $ | 2,900,000 | |
| | | | | | | | | | | | | | | | |
|
| Utilities Revenue: 1.71% | |
| | | | |
Alabama Black Belt Energy Gas District Series A (Royal Bank of Canada LIQ) | | | 4.00 | | | | 7-1-2046 | | | | 18,635,000 | | | | 19,461,462 | |
| | | | |
Alabama Black Belt Energy Gas District Series A (Royal Bank of Canada LIQ) | | | 4.00 | | | | 8-1-2047 | | | | 4,280,000 | | | | 4,565,005 | |
| | | | |
Black Belt Energy Gas District Project 4 SeriesA-1 | | | 4.00 | | | | 6-1-2020 | | | | 1,855,000 | | | | 1,895,383 | |
| | | | |
Black Belt Energy Gas District Project 4 SeriesA-1 | | | 4.00 | | | | 6-1-2022 | | | | 500,000 | | | | 532,315 | |
| | | | |
Chatom AL Industrial Development Board Alabama Electric Series A (National Rural Utilities Cooperative Finance SPA) øø | | | 1.85 | | | | 8-1-2037 | | | | 5,945,000 | | | | 5,946,011 | |
| |
| | | | 32,400,176 | |
| | | | | |
|
Alaska: 0.11% | |
|
| Health Revenue: 0.11% | |
| | | | |
Alaska IDA Loan Anticipation YKHC Project | | | 3.50 | | | | 12-1-2020 | | | | 2,000,000 | | | | 2,011,100 | |
| | | | | | | | | | | | | | | | |
|
Arizona: 2.31% | |
|
| Education Revenue: 0.09% | |
| | | | |
Phoenix AZ IDA BASIS Schools Incorporated Project Series A 144A | | | 3.00 | | | | 7-1-2020 | | | | 790,000 | | | | 791,003 | |
| | | | |
Pima County AZ IDA Charter Schools Refunding Bond Project Series Q | | | 4.00 | | | | 7-1-2019 | | | | 945,000 | | | | 945,000 | |
| |
| | | | 1,736,003 | |
| | | | | |
|
| GO Revenue: 0.16% | |
| | | | |
Maricopa County AZ Gilbert Unified School District #41 (Build America Mutual Assurance Company Insured) | | | 3.00 | | | | 7-1-2019 | | | | 3,005,000 | | | | 3,005,000 | |
| | | | | | | | | | | | | | | | |
|
| Health Revenue: 1.15% | |
| | | | |
Maricopa County AZ IDA Series A | | | 5.00 | | | | 1-1-2048 | | | | 3,910,000 | | | | 4,344,675 | |
| | | | |
Scottsdale AZ IDA Healthcare Series F (AGM Insured) (m) | | | 1.99 | | | | 9-1-2045 | | | | 17,350,000 | | | | 17,350,000 | |
| |
| | | | 21,694,675 | |
| | | | | |
|
| Industrial Development Revenue: 0.91% | |
| | | | |
Chandler AZ IDA Intel Corporation Project | | | 2.70 | | | | 12-1-2037 | | | | 3,200,000 | | | | 3,307,232 | |
| | | | |
Phoenix AZ IDA Various Republic Services Incorporated Projects | | | 1.90 | | | | 12-1-2035 | | | | 14,000,000 | | | | 14,004,060 | |
| |
| | | | 17,311,292 | |
| | | | | |
| |
| | | | 43,746,970 | |
| | | | | |
|
Arkansas: 0.39% | |
|
| Housing Revenue: 0.39% | |
| | | | |
Arkansas Development Finance Authority Pine Bluff Conversion Project | | | 1.69 | | | | 11-1-2021 | | | | 7,430,000 | | | | 7,433,566 | |
| | | | | | | | | | | | | | | | |
|
California: 6.41% | |
|
| GO Revenue: 2.38% | |
| | | | |
California Refunding Bond Series A (SIFMA Municipal Swap +0.25%)± | | | 2.15 | | | | 5-1-2033 | | | | 21,505,000 | | | | 21,491,452 | |
| | | | |
California Series B (SIFMA Municipal Swap +0.38%)± | | | 2.28 | | | | 12-1-2027 | | | | 6,730,000 | | | | 6,735,586 | |
| | | | |
California Series D (SIFMA Municipal Swap +0.29%)± | | | 2.19 | | | | 12-1-2028 | | | | 16,910,000 | | | | 16,913,044 | |
| |
| | | | 45,140,082 | |
| | | | | |
Wells Fargo Ultra Short-Term Municipal Income Fund | 11
Portfolio of investments—June 30, 2019
| | | | | | | | | | | | | | | | |
| | | Interest
rate | | | Maturity
date | | | Principal | | | Value | |
| Health Revenue: 2.15% | |
| | | | |
California Statewide CDA Health Facilities Catholic Series D (AGM Insured) (m) | | | 1.88 | % | | | 7-1-2041 | | | $ | 13,550,000 | | | $ | 13,550,000 | |
| | | | |
California Statewide CDA Health Facilities Catholic Series F (AGM Insured) (m) | | | 2.00 | | | | 7-1-2040 | | | | 15,075,000 | | | | 15,075,000 | |
| | | | |
Palomar CA Pomerado Health Care District Certificate of Participation Series A (AGM Insured) (m) | | | 2.44 | | | | 11-1-2036 | | | | 10,125,000 | | | | 10,125,000 | |
| | | | |
Palomar CA Pomerado Health Care District Certificate of Participation Series B (AGM Insured) (m) | | | 2.50 | | | | 11-1-2036 | | | | 1,000,000 | | | | 1,000,000 | |
| | | | |
Palomar CA Pomerado Health Care District Certificate of Participation Series C (AGM Insured) (m) | | | 2.45 | | | | 11-1-2036 | | | | 850,000 | | | | 850,000 | |
| |
| | | | 40,600,000 | |
| | | | | |
|
| Miscellaneous Revenue: 1.88% | |
| | | | |
California Infrastructure & Economic Development Bank The J. Paul Getty Trust SeriesA-1 (1 Month LIBOR +0.33%)± | | | 2.04 | | | | 10-1-2047 | | | | 5,000,000 | | | | 4,990,750 | |
| | | | |
California Infrastructure & Economic Development Bank The J. Paul Getty Trust SeriesA-2 (3 Month LIBOR +0.37%)± | | | 2.13 | | | | 4-1-2038 | | | | 25,640,000 | | | | 25,672,050 | |
| | | | |
California Infrastructure & Economic Development Bank The J. Paul Getty Trust SeriesB-2 (1 Month LIBOR +0.20%)± | | | 1.91 | | | | 10-1-2047 | | | | 5,000,000 | | | | 4,992,050 | |
| |
| | | | 35,654,850 | |
| | | | | |
| |
| | | | 121,394,932 | |
| | | | | |
|
Colorado: 0.94% | |
|
| Airport Revenue: 0.04% | |
| | | | |
Denver CO City & County Airport Subordinate Bond SeriesF-2 (AGC Insured) (m) | | | 1.80 | | | | 11-15-2025 | | | | 725,000 | | | | 725,000 | |
| | | | | | | | | | | | | | | | |
|
| Health Revenue: 0.57% | |
| | | | |
Colorado Health Facilities Authority Catholic Health Initiatives SeriesB-3 | | | 1.88 | | | | 7-1-2039 | | | | 360,000 | | | | 359,950 | |
| | | | |
Denver CO Health & Hospital Authority Refunding Bond Series A 144A | | | 5.00 | | | | 12-1-2019 | | | | 1,355,000 | | | | 1,373,455 | |
| | | | |
Denver CO Health & Hospital Authority Refunding Bond Series A 144A | | | 5.00 | | | | 12-1-2020 | | | | 1,175,000 | | | | 1,229,050 | |
| | | | |
University of Colorado Hospital Authority SeriesC-1 | | | 4.00 | | | | 11-15-2047 | | | | 7,775,000 | | | | 7,805,089 | |
| |
| | | | 10,767,544 | |
| | | | | |
|
| Housing Revenue: 0.06% | |
| | | | |
Colorado HFA Park Terrace Project (HUD Insured) | | | 1.85 | | | | 4-1-2020 | | | | 1,250,000 | | | | 1,251,338 | |
| | | | | | | | | | | | | | | | |
|
| Tax Revenue: 0.03% | |
| | | | |
Pueblo CO Urban Renewal Authority Regional Tourism Act Project | | | 2.75 | | | | 6-1-2020 | | | | 545,000 | | | | 546,657 | |
| | | | | | | | | | | | | | | | |
|
| Transportation Revenue: 0.24% | |
| | | | |
ColoradoE-470 Public Highway Authority Series A (1 Month LIBOR +0.42%)± | | | 2.02 | | | | 9-1-2039 | | | | 4,500,000 | | | | 4,499,100 | |
| | | | | | | | | | | | | | | | |
| |
| | | | 17,789,639 | |
| | | | | |
|
Connecticut: 1.14% | |
|
| Education Revenue: 0.72% | |
| | | | |
Connecticut HEFAR Yale University Issue Series A | | | 1.00 | | | | 7-1-2042 | | | | 11,730,000 | | | | 11,730,000 | |
| | | | |
Connecticut Higher Education Supplemental Loan Authority Chesla Loan Program Series B | | | 4.00 | | | | 11-15-2019 | | | | 935,000 | | | | 942,555 | |
| | | | |
Connecticut Higher Education Supplemental Loan Authority Chesla Loan Program Series B | | | 5.00 | | | | 11-15-2021 | | | | 545,000 | | | | 584,082 | |
| | | | |
Connecticut Higher Education Supplemental Loan Authority Chesla Loan Program Series B | | | 5.00 | | | | 11-15-2023 | | | | 440,000 | | | | 494,419 | |
| |
| | | | 13,751,056 | |
| | | | | |
12 | Wells Fargo Ultra Short-Term Municipal Income Fund
Portfolio of investments—June 30, 2019
| | | | | | | | | | | | | | | | |
| | | Interest
rate | | | Maturity
date | | | Principal | | | Value | |
| GO Revenue: 0.03% | |
| | | | |
New Haven CT Series A | | | 5.25 | % | | | 8-1-2019 | | | $ | 575,000 | | | $ | 576,581 | |
| | | | | | | | | | | | | | | | |
|
| Housing Revenue: 0.39% | |
| | | | |
Connecticut HFA Housing Mortgage Finance Program Series A | | | 2.40 | | | | 11-15-2020 | | | | 980,000 | | | | 991,603 | |
| | | | |
Connecticut HFA Housing Mortgage Finance Program Series F | | | 1.55 | | | | 5-15-2020 | | | | 800,000 | | | | 798,824 | |
| | | | |
Connecticut HFA Series 25 | | | 2.10 | | | | 6-15-2020 | | | | 930,000 | | | | 932,269 | |
| | | | |
Connecticut HFA Series 25 | | | 2.30 | | | | 6-15-2021 | | | | 950,000 | | | | 957,334 | |
| | | | |
Connecticut HFA Series 25 | | | 2.50 | | | | 6-15-2022 | | | | 840,000 | | | | 853,751 | |
| | | | |
Connecticut HFA Subordinate Bond SeriesE-3 (GNMA/FNMA/FHLMC Insured) | | | 1.50 | | | | 11-15-2047 | | | | 2,800,000 | | | | 2,800,056 | |
| |
| | | | 7,333,837 | |
| | | | | |
| |
| | | | 21,661,474 | |
| | | | | |
|
Florida: 2.49% | |
|
| Education Revenue: 0.13% | |
| | | | |
University of North Florida Financing Corporation Housing Project (AGM Insured) | | | 5.00 | | | | 11-1-2019 | | | | 2,510,000 | | | | 2,537,359 | |
| | | | | | | | | | | | | | | | |
|
| Health Revenue: 0.45% | |
| | | | |
Hillsborough County FL IDA University Community Hospital Series B | | | 8.00 | | | | 8-15-2032 | | | | 3,830,000 | | | | 3,898,289 | |
| | | | |
Miami FL HFFA Miami Jewish Health Systems Incorporate Project | | | 5.00 | | | | 7-1-2020 | | | | 390,000 | | | | 400,674 | |
| | | | |
Miami-Dade County FL Health Facilities Authority Miami Children’s Hospital Project Series A | | | 5.25 | | | | 8-1-2021 | | | | 425,000 | | | | 442,450 | |
| | | | |
North Broward FL Hospital District Series B | | | 5.00 | | | | 1-1-2020 | | | | 780,000 | | | | 792,418 | |
| | | | |
North Broward FL Hospital District Series B | | | 5.00 | | | | 1-1-2021 | | | | 925,000 | | | | 967,513 | |
| | | | |
Palm Beach County FL Health Facilities Authority Retirement Life Communities Project | | | 4.00 | | | | 11-15-2019 | | | | 2,090,000 | | | | 2,109,458 | |
| |
| | | | 8,610,802 | |
| | | | | |
|
| Housing Revenue: 1.09% | |
| | | | |
Florida Housing Finance Corporation Series 1 (GNMA/FNMA/FHLMC Insured) | | | 1.95 | | | | 1-1-2021 | | | | 1,565,000 | | | | 1,576,941 | |
| | | | |
Florida Housing Finance Corporation Series 1 (GNMA/FNMA/FHLMC Insured) | | | 2.00 | | | | 7-1-2021 | | | | 1,365,000 | | | | 1,380,111 | |
| | | | |
Florida Housing Finance Corporation Series 1 (GNMA/FNMA/FHLMC Insured) | | | 2.05 | | | | 1-1-2022 | | | | 1,010,000 | | | | 1,025,271 | |
| | | | |
Jacksonville FL HFA Desert-Silver LLC Project | | | 2.25 | | | | 12-1-2021 | | | | 7,250,000 | | | | 7,301,113 | |
| | | | |
Miami-Dade County FL HFA St. John Plaza Apartments | | | 2.00 | | | | 8-1-2019 | | | | 7,625,000 | | | | 7,625,534 | |
| | | | |
Pinellas County FL HFA | | | 1.85 | | | | 1-1-2022 | | | | 1,640,000 | | | | 1,641,706 | |
| |
| | | | 20,550,676 | |
| | | | | |
|
| Miscellaneous Revenue: 0.41% | |
| | | | |
Pasco County FL School Board Certificate of Participation Series B (Ambac Insured) (m) | | | 2.34 | | | | 8-1-2030 | | | | 7,825,000 | | | | 7,825,000 | |
| | | | | | | | | | | | | | | | |
|
| Resource Recovery Revenue: 0.03% | |
| | | | |
Lee County FL Solid Waste System | | | 5.00 | | | | 10-1-2020 | | | | 470,000 | | | | 487,733 | |
| | | | | | | | | | | | | | | | |
|
| Transportation Revenue: 0.38% | |
| | | | |
Florida Development Finance Corporation Surface Series T | | | 1.90 | | | | 1-1-2049 | | | | 7,200,000 | | | | 7,200,936 | |
| | | | | | | | | | | | | | | | |
| |
| | | | 47,212,506 | |
| | | | | |
Wells Fargo Ultra Short-Term Municipal Income Fund | 13
Portfolio of investments—June 30, 2019
| | | | | | | | | | | | | | | | |
| | | Interest
rate | | | Maturity
date | | | Principal | | | Value | |
Georgia: 4.42% | |
|
| Housing Revenue: 2.77% | |
| | | | |
Atlanta GA Urban Residential Finance Authority Bethel Towers I LP Apartments Project | | | 2.07 | % | | | 7-1-2021 | | | $ | 3,500,000 | | | $ | 3,517,395 | |
| | | | |
Clayton County GA Housing Authority Renaissance at Garden Walk Apartments Project | | | 2.30 | | | | 6-1-2022 | | | | 13,000,000 | | | | 13,147,420 | |
| | | | |
DeKalb County GA Housing Authority Sterling at Candler Village Project | | | 2.15 | | | | 1-1-2021 | | | | 5,630,000 | | | | 5,630,000 | |
| | | | |
Douglas County GA Housing Authority Douglass Village Apartments Project | | | 2.25 | | | | 12-1-2021 | | | | 9,500,000 | | | | 9,576,285 | |
| | | | |
Fulton County GA Housing Authority Residences Maggie Capitol Series A | | | 2.00 | | | | 3-1-2021 | | | | 8,735,000 | | | | 8,762,865 | |
| | | | |
Macon-Bibb County GA Housing Authority Hallmark Portfolio | | | 2.04 | | | | 4-1-2021 | | | | 11,765,000 | | | | 11,808,060 | |
| |
| | | | 52,442,025 | |
| | | | | |
|
| Industrial Development Revenue: 0.39% | |
| | | | |
Monroe County GA PCR Georgia Power Company Plant Scherer Project | | | 2.35 | | | | 10-1-2048 | | | | 7,430,000 | | | | 7,502,665 | |
| | | | | | | | | | | | | | | | |
|
| Utilities Revenue: 1.26% | |
| | | | |
Burke County GA Development Authority Georgia Power Company Plant Vogtle Project Fifth Series 1995 | | | 2.05 | | | | 10-1-2032 | | | | 1,850,000 | | | | 1,854,699 | |
| | | | |
Burke County GA Development Authority Georgia Power Company Plant Vogtle Project First Series 1996 | | | 2.35 | | | | 10-1-2032 | | | | 5,315,000 | | | | 5,366,981 | |
| | | | |
Burke County GA Development Authority Georgia Power Company Plant Vogtle Project First Series 2008 | | | 1.65 | | | | 11-1-2048 | | | | 1,955,000 | | | | 1,952,752 | |
| | | | |
Burke County GA Development Authority Georgia Power Company Plant Vogtle Project First Series 2012 | | | 1.85 | | | | 12-1-2049 | | | | 12,120,000 | | | | 12,122,545 | |
| | | | |
Monroe County GA Development Authority Power Company Plant Scherer Project | | | 2.05 | | | | 7-1-2049 | | | | 2,545,000 | | | | 2,551,464 | |
| |
| | | | 23,848,441 | |
| | | | | |
| |
| | | | 83,793,131 | |
| | | | | |
|
Hawaii: 1.06% | |
|
| GO Revenue: 0.95% | |
| | | | |
Honolulu HI Rail Transit Project Series H (SIFMA Municipal Swap +0.31%)± | | | 2.21 | | | | 9-1-2024 | | | | 7,820,000 | | | | 7,818,436 | |
| | | | |
Honolulu HI Rail Transit Project Series H (SIFMA Municipal Swap +0.32%)± | | | 2.22 | | | | 9-1-2025 | | | | 7,035,000 | | | | 7,033,593 | |
| | | | |
Honolulu HI Rail Transit Project Series H (SIFMA Municipal Swap +0.32%)± | | | 2.22 | | | | 9-1-2026 | | | | 3,125,000 | | | | 3,124,375 | |
| |
| | | | 17,976,404 | |
| | | | | |
|
| Health Revenue: 0.11% | |
| | | | |
Hawaii Department of Budget & Finance Queens Health System Series B (SIFMA Municipal Swap +0.45%)± | | | 2.35 | | | | 7-1-2039 | | | | 2,070,000 | | | | 2,070,000 | |
| | | | | | | | | | | | | | | | |
| |
| | | | 20,046,404 | |
| | | | | |
|
Idaho: 0.33% | |
|
| Housing Revenue: 0.33% | |
| | | | |
Idaho Housing & Finance Association Series A (FNMA LOC) ø | | | 2.10 | | | | 1-1-2038 | | | | 6,265,000 | | | | 6,265,000 | |
| | | | | | | | | | | | | | | | |
|
Illinois: 7.01% | |
|
| Education Revenue: 0.90% | |
| | | | |
Illinois Educational Facilities Authority University of Chicago Series B | | | 1.88 | | | | 7-1-2025 | | | | 2,000,000 | | | | 2,004,440 | |
| | | | |
Illinois Tender Option Bond Trust Receipts/Floater Certificates Series 2018-XF1077 (Deutsche Bank LOC, Deutsche Bank LIQ) 144Aø | | | 2.30 | | | | 4-1-2058 | | | | 15,000,000 | | | | 15,000,000 | |
| |
| | | | 17,004,440 | |
| | | | | |
14 | Wells Fargo Ultra Short-Term Municipal Income Fund
Portfolio of investments—June 30, 2019
| | | | | | | | | | | | | | | | |
| | | Interest
rate | | | Maturity
date | | | Principal | | | Value | |
| GO Revenue: 2.15% | |
| | | | |
Chicago IL Refunding Bond Project Series B | | | 5.00 | % | | | 1-1-2020 | | | $ | 2,575,000 | | | $ | 2,610,973 | |
| | | | |
Chicago IL Series A | | | 5.00 | | | | 12-1-2019 | | | | 780,000 | | | | 789,056 | |
| | | | |
Chicago IL Series C | | | 5.00 | | | | 1-1-2020 | | | | 1,005,000 | | | | 1,019,040 | |
| | | | |
Chicago IL Series C | | | 5.00 | | | | 1-1-2021 | | | | 1,565,000 | | | | 1,647,945 | |
| | | | |
Grundy, Kendall & Will Counties IL Community School District #201 (AGC Insured) | | | 5.75 | | | | 10-15-2019 | | | | 420,000 | | | | 421,449 | |
| | | | |
Illinois | | | 5.00 | | | | 1-1-2020 | | | | 6,315,000 | | | | 6,417,745 | |
| | | | |
Illinois | | | 5.00 | | | | 2-1-2020 | | | | 2,375,000 | | | | 2,420,054 | |
| | | | |
Illinois | | | 5.00 | | | | 2-1-2021 | | | | 3,115,000 | | | | 3,264,115 | |
| | | | |
Illinois | | | 5.00 | | | | 11-1-2021 | | | | 5,380,000 | | | | 5,754,556 | |
| | | | |
Illinois | | | 5.00 | | | | 1-1-2022 | | | | 5,915,000 | | | | 6,338,987 | |
| | | | |
Lake County IL Water Sewerage System Grainger Incorporated Project (Northern Trust Company LIQ) ø | | | 2.10 | | | | 4-1-2021 | | | | 1,500,000 | | | | 1,500,000 | |
| | | | |
Waukegan IL Series 2018B (AGM Insured) | | | 3.00 | | | | 12-30-2020 | | | | 2,340,000 | | | | 2,390,989 | |
| | | | |
Waukegan IL Series 2018B (AGM Insured) | | | 4.00 | | | | 12-30-2021 | | | | 800,000 | | | | 847,144 | |
| | | | |
Whiteside & Lee County IL Community Unit School District 5 Series A (Build America Mutual Assurance Company Insured) | | | 4.00 | | | | 12-1-2022 | | | | 1,375,000 | | | | 1,469,064 | |
| | | | |
Whiteside & Lee County IL Community Unit School District 5 Series A (Build America Mutual Assurance Company Insured) | | | 4.00 | | | | 12-1-2023 | | | | 1,435,000 | | | | 1,554,478 | |
| | | | |
Winnebago, Boone & Ogle Counties IL Rockford Park District Series 2018B | | | 2.31 | | | | 12-15-2019 | | | | 2,280,000 | | | | 2,285,198 | |
| |
| | | | 40,730,793 | |
| | | | | |
|
| Health Revenue: 0.23% | |
| | | | |
Illinois Finance Authority Presbyterian Homes Obligated Group Series A | | | 4.00 | | | | 11-1-2019 | | | | 390,000 | | | | 392,933 | |
| | | | |
Illinois Finance Authority Presbyterian Homes Obligated Group Series B (1 Month LIBOR +1.35%)± | | | 3.06 | | | | 5-1-2036 | | | | 3,910,000 | | | | 3,919,814 | |
| |
| | | | 4,312,747 | |
| | | | | |
|
| Housing Revenue: 0.55% | |
| | | | |
Chicago IL Multifamily Housing Mark Twain Apartments Project | | | 2.20 | | | | 6-1-2021 | | | | 10,325,000 | | | | 10,371,566 | |
| | | | | | | | | | | | | | | | |
|
| Miscellaneous Revenue: 1.01% | |
| | | | |
Illinois | | | 5.00 | | | | 8-1-2019 | | | | 7,925,000 | | | | 7,945,843 | |
| | | | |
Illinois Refunding Bond | | | 5.00 | | | | 8-1-2022 | | | | 2,290,000 | | | | 2,490,650 | |
| | | | |
Illinois Series D | | | 5.00 | | | | 11-1-2021 | | | | 7,820,000 | | | | 8,364,428 | |
| | | | |
Minooka IL Special Assessment Refunding & Improvement Bond (AGM Insured) | | | 3.50 | | | | 12-1-2019 | | | | 428,000 | | | | 430,589 | |
| |
| | | | 19,231,510 | |
| | | | | |
|
| Tax Revenue: 2.07% | |
| | | | |
Illinois Series A | | | 5.00 | | | | 6-1-2021 | | | | 1,455,000 | | | | 1,539,070 | |
| | | | |
Metropolitan Pier & Exposition Authority McCormick Place ProjectNon-Callable Bond Series B | | | 5.00 | | | | 12-15-2022 | | | | 5,925,000 | | | | 6,443,971 | |
| | | | |
Regional Transportation Authority Illinois SeriesB-RMKT 1 | | | 1.67 | | | | 6-1-2025 | | | | 31,155,000 | | | | 31,155,000 | |
| |
| | | | 39,138,041 | |
| | | | | |
|
| Water & Sewer Revenue: 0.10% | |
| | | | |
Chicago IL Refunding Bond | | | 5.00 | | | | 11-1-2019 | | | | 1,955,000 | | | | 1,976,173 | |
| | | | | | | | | | | | | | | | |
| |
| | | | 132,765,270 | |
| | | | | |
Wells Fargo Ultra Short-Term Municipal Income Fund | 15
Portfolio of investments—June 30, 2019
| | | | | | | | | | | | | | | | |
| | | Interest
rate | | | Maturity
date | | | Principal | | | Value | |
Indiana: 2.09% | |
|
| Health Revenue: 1.33% | |
| | | | |
Indiana HFFA Ascension Health Subordinate Bond Credit Group SeriesA-1 | | | 2.80 | % | | | 11-1-2027 | | | $ | 1,395,000 | | | $ | 1,396,479 | |
| | | | |
Indiana HFFA Ascension Health Subordinate Bond Credit Group SeriesA-3 | | | 1.35 | | | | 11-1-2027 | | | | 655,000 | | | | 654,221 | |
| | | | |
Indiana HFFA Ascension Health Subordinate Bond Credit Group SeriesA-5 | | | 1.35 | | | | 11-1-2027 | | | | 6,590,000 | | | | 6,582,158 | |
| | | | |
Indiana HFFA Ascension Health Subordinate Bond Credit Group SeriesA-8 | | | 1.25 | | | | 11-1-2027 | | | | 1,150,000 | | | | 1,148,011 | |
| | | | |
Indiana HFFA Ascension Health Subordinate Bond Credit Group SeriesE-7 | | | 1.90 | | | | 11-15-2033 | | | | 11,870,000 | | | | 11,870,000 | |
| | | | |
Indiana HFFA Ascension Health Subordinate Unrefunded Bond Credit Group SeriesA-9 | | | 1.38 | | | | 10-1-2027 | | | | 3,530,000 | | | | 3,527,529 | |
| |
| | | | 25,178,398 | |
| | | | | |
|
| Housing Revenue: 0.18% | |
| | | | |
Indiana Housing Authority Cass Plaza Apartments Project | | | 1.85 | | | | 3-1-2020 | | | | 3,400,000 | | | | 3,401,224 | |
| | | | | | | | | | | | | | | | |
|
| Industrial Development Revenue: 0.05% | |
| | | | |
Whiting IN BP Products North America Incorporated Project | | | 1.85 | | | | 6-1-2044 | | | | 1,000,000 | | | | 1,000,770 | |
| | | | | | | | | | | | | | | | |
|
| Miscellaneous Revenue: 0.53% | |
| | | | |
Clark Pleasant Middle School Corporation Series B %% | | | 2.50 | | | | 7-16-2020 | | | | 3,000,000 | | | | 3,014,880 | |
| | | | |
Indiana Bond Bank Advance Funding Program Series A | | | 4.00 | | | | 1-3-2020 | | | | 7,000,000 | | | | 7,089,250 | |
| |
| | | | 10,104,130 | |
| | | | | |
| |
| | | | 39,684,522 | |
| | | | | |
|
Iowa: 0.71% | |
|
| Health Revenue: 0.22% | |
| | | | |
Iowa Finance Authority Health Care Genesis Health System Obligated Group | | | 5.00 | | | | 7-1-2019 | | | | 4,075,000 | | | | 4,075,000 | |
| | | | | | | | | | | | | | | | |
|
| Industrial Development Revenue: 0.49% | |
| | | | |
Iowa Finance Authority Midwestern Disaster Area Project (Korea Development Bank LOC) ø | | | 2.40 | | | | 4-1-2022 | | | | 9,300,000 | | | | 9,300,000 | |
| | | | | | | | | | | | | | | | |
| |
| | | | 13,375,000 | |
| | | | | |
|
Kansas: 1.05% | |
|
| Health Revenue: 0.05% | |
| | | | |
Wichita KS HCFR Series I | | | 3.75 | | | | 5-15-2023 | | | | 925,000 | | | | 936,498 | |
| | | | | | | | | | | | | | | | |
|
| Housing Revenue: 0.44% | |
| | | | |
Kansas HFA Forest Glen Apartments Project Series B %% | | | 1.66 | | | | 7-1-2022 | | | | 8,300,000 | | | | 8,297,427 | |
| | | | | | | | | | | | | | | | |
|
| Tax Revenue: 0.25% | |
| | | | |
Kansas Department of Transportation Highway SeriesB-5 (1 Month LIBOR +0.40%)± | | | 2.04 | | | | 9-1-2019 | | | | 4,690,000 | | | | 4,692,486 | |
| | | | | | | | | | | | | | | | |
|
| Utilities Revenue: 0.31% | |
| | | | |
Burlington KS Environmental Impact Series A ø | | | 2.13 | | | | 9-1-2035 | | | | 3,000,000 | | | | 3,000,000 | |
| | | | |
Burlington KS Environmental Impact Series B ø | | | 2.13 | | | | 9-1-2035 | | | | 3,000,000 | | | | 3,000,000 | |
| |
| | | | 6,000,000 | |
| | | | | |
| |
| | | | 19,926,411 | |
| | | | | |
16 | Wells Fargo Ultra Short-Term Municipal Income Fund
Portfolio of investments—June 30, 2019
| | | | | | | | | | | | | | | | |
| | | Interest
rate | | | Maturity
date | | | Principal | | | Value | |
|
Kentucky: 0.76% | |
|
| Health Revenue: 0.38% | |
| | | | |
Kentucky EDFA Catholic Health Initiative Series B1 (1 Month LIBOR +0.90%)± | | | 2.56 | % | | | 2-1-2046 | | | $ | 5,470,000 | | | $ | 5,470,492 | |
| | | | |
Kentucky EDFA Owensboro Health Incorporated Series A | | | 5.00 | | | | 6-1-2020 | | | | 890,000 | | | | 912,490 | |
| | | | |
Kentucky EDFA Owensboro Health Incorporated Series A | | | 5.00 | | | | 6-1-2021 | | | | 825,000 | | | | 867,488 | |
| |
| | | | 7,250,470 | |
| | | | | |
|
| Utilities Revenue: 0.38% | |
| | | | |
Louisville & Jefferson Counties KY Metro Government PCR Series A | | | 2.20 | | | | 2-1-2035 | | | | 1,000,000 | | | | 1,000,590 | |
| | | | |
Louisville & Jefferson Counties KY Metro Government PCR Series B | | | 2.55 | | | | 11-1-2027 | | | | 6,000,000 | | | | 6,112,500 | |
| |
| | | | 7,113,090 | |
| | | | | |
| |
| | | | 14,363,560 | |
| | | | | |
|
Louisiana: 1.10% | |
|
| Airport Revenue: 0.23% | |
| | | | |
Louisiana Offshore Terminal Authority Deepwater Loop LLC ProjectSeries B-1A | | | 2.00 | | | | 10-1-2040 | | | | 2,935,000 | | | | 2,936,438 | |
| | | | |
New Orleans LA Aviation Board SeriesD-1 | | | 5.00 | | | | 1-1-2020 | | | | 780,000 | | | | 793,907 | |
| | | | |
New Orleans LA Aviation Board SeriesD-2 | | | 5.00 | | | | 1-1-2021 | | | | 590,000 | | | | 618,391 | |
| |
| | | | 4,348,736 | |
| | | | | |
|
| Health Revenue: 0.53% | |
| | | | |
Louisiana Tender Option Bond Trust Receipts/Floater Certificates Series 2018-BAML7002 (Bank of America NA LOC, Bank of America NA LIQ) 144Aø | | | 1.94 | | | | 9-1-2057 | | | | 10,000,000 | | | | 10,000,000 | |
| | | | | | | | | | | | | | | | |
|
| Housing Revenue: 0.16% | |
| | | | |
Louisiana Housing Corporation Pine Trace Homes Project | | | 2.40 | | | | 5-1-2021 | | | | 3,000,000 | | | | 3,020,820 | |
| | | | | | | | | | | | | | | | |
|
| Miscellaneous Revenue: 0.18% | |
| | | | |
Louisiana PFFA Department of Public Safety Project | | | 4.00 | | | | 8-1-2019 | | | | 3,375,000 | | | | 3,381,649 | |
| | | | | | | | | | | | | | | | |
| |
| | | | 20,751,205 | |
| | | | | |
|
Maine: 0.05% | |
|
| Education Revenue: 0.05% | |
| | | | |
Maine Student Loan Authority AMT Refunding Student Loan Revenue Bond Class A Series2019A-1 (AGM Insured) | | | 5.00 | | | | 12-1-2020 | | | | 200,000 | | | | 209,114 | |
| | | | |
Maine Student Loan Authority AMT Refunding Student Loan Revenue Bond Class A Series2019A-1 (AGM Insured) | | | 5.00 | | | | 12-1-2021 | | | | 300,000 | | | | 322,719 | |
| | | | |
Maine Student Loan Authority AMT Refunding Student Loan Revenue Bond Class A Series2019A-1 (AGM Insured) | | | 5.00 | | | | 12-1-2022 | | | | 370,000 | | | | 408,254 | |
| |
| | | | 940,087 | |
| | | | | |
|
Maryland: 2.64% | |
|
| Housing Revenue: 2.51% | |
| | | | |
Maryland CDA Department of Housing & Community Multifamily Development Orchard Park Series F | | | 2.52 | | | | 8-1-2020 | | | | 6,000,000 | | | | 6,022,200 | |
| | | | |
Maryland CDA Department of Housing & Community Multifamily Development Zions Towers Series A (FHA Insured) | | | 2.44 | | | | 3-1-2020 | | | | 6,000,000 | | | | 6,012,120 | |
| | | | |
Maryland Community Development Administration Heritage Crossing II Series G | | | 2.93 | | | | 11-1-2020 | | | | 7,600,000 | | | | 7,676,000 | |
Wells Fargo Ultra Short-Term Municipal Income Fund | 17
Portfolio of investments—June 30, 2019
| | | | | | | | | | | | | | | | |
| | | Interest
rate | | | Maturity
date | | | Principal | | | Value | |
|
| Housing Revenue (continued) | |
| | | | |
Maryland Community Development Administration Village At Lakeview Series 2018C 144A | | | 2.76 | % | | | 5-1-2020 | | | $ | 17,700,000 | | | $ | 17,786,730 | |
| | | | |
Maryland Community Development Administration Willow Manor At Fairland Series I | | | 2.93 | | | | 11-1-2020 | | | | 10,000,000 | | | | 10,097,400 | |
| |
| | | | 47,594,450 | |
| | | | | |
|
| Water & Sewer Revenue: 0.13% | |
| | | | |
Baltimore MD Series A (National Insured) | | | 5.65 | | | | 7-1-2020 | | | | 2,400,000 | | | | 2,452,128 | |
| | | | | | | | | | | | | | | | |
| |
| | | | 50,046,578 | |
| | | | | |
|
Massachusetts: 0.37% | |
|
| Health Revenue: 0.06% | |
| | | | |
Massachusetts HEFA Partners Healthcare SeriesG-2 (AGM Insured) (m) | | | 2.01 | | | | 7-1-2042 | | | | 1,105,000 | | | | 1,105,000 | |
| | | | | | | | | | | | | | | | |
|
| Housing Revenue: 0.31% | |
| | | | |
Massachusetts HFA Conduit-Oaks Woods Project | | | 2.40 | | | | 6-1-2021 | | | | 4,660,000 | | | | 4,690,290 | |
| | | | |
Massachusetts HFA Series 187 (FNMA Insured) | | | 1.50 | | | | 12-1-2047 | | | | 1,210,000 | | | | 1,210,472 | |
| |
| | | | 5,900,762 | |
| | | | | |
| |
| | | | 7,005,762 | |
| | | | | |
|
Michigan: 1.55% | |
|
| Education Revenue: 1.10% | |
| | | | |
University of Michigan Series E REMK (SIFMA Municipal Swap +0.27%) ± | | | 1.59 | | | | 4-1-2033 | | | | 20,820,000 | | | | 20,763,370 | |
| | | | | | | | | | | | | | | | |
|
| Health Revenue: 0.24% | |
| | | | |
Michigan Hospital Finance Authority Ascension Health Group ProjectSeries A-2 | | | 1.50 | | | | 11-1-2027 | | | | 1,210,000 | | | | 1,210,387 | |
| | | | |
Michigan Hospital Finance Authority Ascension Health Group ProjectSeries E-1 | | | 1.10 | | | | 11-15-2046 | | | | 3,325,000 | | | | 3,323,537 | |
| |
| | | | 4,533,924 | |
| | | | | |
|
| Housing Revenue: 0.21% | |
| | | | |
Michigan Housing Development Authority Series A | | | 2.30 | | | | 10-1-2021 | | | | 4,000,000 | | | | 4,006,320 | |
| | | | | | | | | | | | | | | | |
| |
| | | | 29,303,614 | |
| | | | | |
|
Minnesota: 1.17% | |
|
| Health Revenue: 0.34% | |
| | | | |
Apple Valley MN Senior Living LLC Project Series B | | | 3.00 | | | | 1-1-2020 | | | | 525,000 | | | | 525,488 | |
| | | | |
Apple Valley MN Senior Living LLC Project Series B | | | 4.00 | | | | 1-1-2021 | | | | 545,000 | | | | 553,862 | |
| | | | |
Apple Valley MN Senior Living LLC Project Series B | | | 4.00 | | | | 1-1-2022 | | | | 565,000 | | | | 579,300 | |
| | | | |
Kanabec County MN Firstlight Health Kanabec Hospital | | | 2.75 | | | | 12-1-2019 | | | | 3,125,000 | | | | 3,126,031 | |
| | | | |
Minnesota HCFR Maple Grove Hospital Corporation | | | 4.00 | | | | 5-1-2020 | | | | 390,000 | | | | 397,523 | |
| | | | |
Minnesota HCFR Maple Grove Hospital Corporation | | | 4.00 | | | | 5-1-2021 | | | | 390,000 | | | | 406,563 | |
| | | | |
Minnesota HCFR Maple Grove Hospital Corporation | | | 4.00 | | | | 5-1-2022 | | | | 390,000 | | | | 414,843 | |
| | | | |
Minnesota HCFR Maple Grove Hospital Corporation | | | 5.00 | | | | 5-1-2023 | | | | 390,000 | | | | 437,334 | |
| |
| | | | 6,440,944 | |
| | | | | |
|
| Housing Revenue: 0.18% | |
| | | | |
Minneapolis & St. Paul MN Housing & RDA Union Flats Apartments Project Series B | | | 2.75 | | | | 2-1-2022 | | | | 3,520,000 | | | | 3,515,952 | |
| | | | | | | | | | | | | | | | |
18 | Wells Fargo Ultra Short-Term Municipal Income Fund
Portfolio of investments—June 30, 2019
| | | | | | | | | | | | | | | | |
| | | Interest
rate | | | Maturity
date | | | Principal | | | Value | |
| Miscellaneous Revenue: 0.65% | |
| | | | |
Minneapolis & St. Paul MN Housing & RDA Children’s Hospital Clinics Series A (AGM Insured, U.S. Bank NA SPA) | | | 1.33 | % | | | 8-15-2037 | | | $ | 12,275,000 | | | $ | 12,275,000 | |
| | | | | | | | | | | | | | | | |
| |
| | | | 22,231,896 | |
| | | | | |
|
Mississippi: 0.65% | |
|
| Health Revenue: 0.07% | |
| | | | |
Mississippi Hospital Equipment & Facilities Authority Baptist Memorial Health Series B2 | | | 1.80 | | | | 9-1-2022 | | | | 1,250,000 | | | | 1,250,300 | |
| | | | | | | | | | | | | | | | |
|
| Housing Revenue: 0.58% | |
| | | | |
Mississippi Home Corporation Jackson Housing Authority Project (HUD Insured) | | | 2.21 | | | | 2-1-2022 | | | | 11,000,000 | | | | 11,071,940 | |
| | | | | | | | | | | | | | | | |
| |
| | | | 12,322,240 | |
| | | | | |
|
Missouri: 0.73% | |
|
| Housing Revenue: 0.39% | |
| | | | |
Kansas City MO IDA Gothan Apartments Project | | | 1.81 | | | | 2-1-2021 | | | | 7,500,000 | | | | 7,501,875 | |
| | | | | | | | | | | | | | | | |
|
| Miscellaneous Revenue: 0.34% | |
| | | | |
Bridgeton MO IDA Mestek Machinery Incorporated (Santander Bank NA LOC) ø | | | 2.44 | | | | 7-1-2030 | | | | 2,425,000 | | | | 2,425,000 | |
| | | | |
Missouri Development Finance Board Kauffman Center For The Performing Arts Series A (PNC Bank NA SPA) ø | | | 1.94 | | | | 6-1-2037 | | | | 4,000,000 | | | | 4,000,000 | |
| |
| | | | 6,425,000 | |
| | | | | |
| |
| | | | 13,926,875 | |
| | | | | |
|
Nebraska: 0.49% | |
|
| Housing Revenue: 0.43% | |
| | | | |
Douglas Country NE Housing Authority Sorensen Senior Residences Project Series A | | | 2.05 | | | | 3-1-2020 | | | | 4,000,000 | | | | 4,002,400 | |
| | | | |
Nebraska Investment Finance Authority Series D (GNMA/FNMA/FHLMC Insured) | | | 3.30 | | | | 9-1-2020 | | | | 1,345,000 | | | | 1,367,004 | |
| | | | |
Nebraska Investment Finance Authority Series D (GNMA/FNMA/FHLMC Insured) | | | 3.65 | | | | 3-1-2021 | | | | 1,265,000 | | | | 1,300,572 | |
| | | | |
Nebraska Investment Finance Authority Series D (GNMA/FNMA/FHLMC Insured) | | | 3.65 | | | | 9-1-2021 | | | | 1,390,000 | | | | 1,438,984 | |
| |
| | | | 8,108,960 | |
| | | | | |
|
| Utilities Revenue: 0.06% | |
| | | | |
Nebraska Central Plains Energy Project Refunding Bond (Royal Bank of Canada SPA) | | | 5.00 | | | | 8-1-2039 | | | | 1,130,000 | | | | 1,146,001 | |
| | | | | | | | | | | | | | | | |
| |
| | | | 9,254,961 | |
| | | | | |
|
Nevada: 0.55% | |
|
| GO Revenue: 0.23% | |
| | | | |
Clark County Refunding Bond Series C | | | 5.00 | | | | 6-15-2020 | | | | 3,325,000 | | | | 3,438,848 | |
| | | | |
Clark County Refunding Bond Series D | | | 5.00 | | | | 6-15-2020 | | | | 810,000 | | | | 837,734 | |
| |
| | | | 4,276,582 | |
| | | | | |
Wells Fargo Ultra Short-Term Municipal Income Fund | 19
Portfolio of investments—June 30, 2019
| | | | | | | | | | | | | | | | |
| | | Interest
rate | | | Maturity
date | | | Principal | | | Value | |
| Utilities Revenue: 0.32% | |
| | | | |
Washoe County NV Water Facility Refunding Bond Series F | | | 2.05 | % | | | 3-1-2036 | | | $ | 6,000,000 | | | $ | 6,051,180 | |
| | | | | | | | | | | | | | | | |
| |
| | | | 10,327,762 | |
| | | | | |
|
New Jersey: 5.00% | |
|
| Education Revenue: 0.11% | |
| | | | |
New Jersey Higher Education Assistance Authority Series B | | | 5.00 | | | | 12-1-2021 | | | | 2,000,000 | | | | 2,152,440 | |
| | | | | | | | | | | | | | | | |
|
| GO Revenue: 1.24% | |
| | | | |
Lyndhurst Township NJ BAN | | | 2.75 | | | | 9-12-2019 | | | | 9,000,000 | | | | 9,020,250 | |
| | | | |
New Providence NJ BAN | | | 3.00 | | | | 10-30-2019 | | | | 5,400,000 | | | | 5,424,516 | |
| | | | |
Sea Isle City NJ | | | 3.50 | | | | 9-12-2019 | | | | 9,015,000 | | | | 9,048,896 | |
| |
| | | | 23,493,662 | |
| | | | | |
|
| Health Revenue: 0.33% | |
| | | | |
New Jersey HFFA St. Joseph’s Healthcare System Group | | | 4.00 | | | | 7-1-2019 | | | | 935,000 | | | | 935,000 | |
| | | | |
New Jersey HFFA St. Joseph’s Healthcare System Group | | | 4.00 | | | | 7-1-2020 | | | | 1,540,000 | | | | 1,572,109 | |
| | | | |
New Jersey HFFA St. Joseph’s Healthcare System Group | | | 5.00 | | | | 7-1-2021 | | | | 780,000 | | | | 827,081 | |
| | | | |
Tender Option Bond Trust Receipts/Floater Certificates Series 2016-XG0047 (AGC Insured, Deutsche Bank LIQ) 144Aø | | | 2.00 | | | | 7-1-2038 | | | | 2,871,074 | | | | 2,871,074 | |
| |
| | | | 6,205,264 | |
| | | | | |
|
| Housing Revenue: 1.05% | |
| | | | |
New Jersey Housing & Mortgage Finance Agency Series A | | | 1.50 | | | | 11-1-2019 | | | | 470,000 | | | | 470,042 | |
| | | | |
New Jersey Housing & Mortgage Finance Agency Series A | | | 1.75 | | | | 11-1-2020 | | | | 6,455,000 | | | | 6,474,300 | |
| | | | |
New Jersey Housing & Mortgage Finance Agency Series E | | | 2.15 | | | | 11-1-2019 | | | | 520,000 | | | | 520,723 | |
| | | | |
New Jersey Housing & Mortgage Finance Agency Series E | | | 2.20 | | | | 5-1-2020 | | | | 1,200,000 | | | | 1,204,416 | |
| | | | |
New Jersey Housing & Mortgage Finance Agency Series E | | | 2.30 | | | | 11-1-2020 | | | | 1,040,000 | | | | 1,046,906 | |
| | | | |
New Jersey Housing & Mortgage Finance Agency Villa Victoria Apartments Project Series F | | | 2.43 | | | | 11-1-2021 | | | | 10,000,000 | | | | 10,099,200 | |
| |
| | | | 19,815,587 | |
| | | | | |
|
| Miscellaneous Revenue: 1.20% | |
| | | | |
New Jersey EDA School Facilities Construction Notes Series BBB | | | 5.00 | | | | 6-15-2021 | | | | 3,910,000 | | | | 4,152,889 | |
| | | | |
New Jersey EDA School Facilities Construction Notes Series DDD | | | 5.00 | | | | 6-15-2022 | | | | 780,000 | | | | 849,420 | |
| | | | |
New Jersey EDA Transportation Project Series B | | | 5.00 | | | | 11-1-2019 | | | | 3,910,000 | | | | 3,954,066 | |
| | | | |
New Jersey EDA Transportation Project Series B | | | 5.00 | | | | 11-1-2020 | | | | 7,820,000 | | | | 8,153,679 | |
| | | | |
New Jersey EDA Unrefunded Bond Series NN | | | 5.00 | | | | 3-1-2020 | | | | 895,000 | | | | 914,153 | |
| | | | |
New Jersey TTFA Series A | | | 5.00 | | | | 12-15-2019 | | | | 3,445,000 | | | | 3,498,225 | |
| | | | |
New Jersey TTFA Series AA | | | 5.00 | | | | 6-15-2020 | | | | 1,250,000 | | | | 1,288,575 | |
| |
| | | | 22,811,007 | |
| | | | | |
|
| Transportation Revenue: 1.07% | |
| | | | |
New Jersey Turnpike Authority SeriesC-5 (1 Month LIBOR +0.46%)± | | | 2.17 | | | | 1-1-2028 | | | | 20,330,000 | | | | 20,354,396 | |
| | | | | | | | | | | | | | | | |
| |
| | | | 94,832,356 | |
| | | | | |
|
New Mexico: 1.07% | |
|
| Utilities Revenue: 1.07% | |
| | | | |
Farmington NM Public Service Company of New Mexico San Juan Project Series A | | | 5.20 | | | | 6-1-2040 | | | | 780,000 | | | | 803,345 | |
| | | | |
New Mexico Municipal Energy Acquisition Authority Gas Supply Subordinate Bond Series B (1 Month LIBOR +0.75%) (Royal Bank of Canada SPA)± | | | 2.39 | | | | 11-1-2039 | | | | 19,430,000 | | | | 19,430,000 | |
| |
| | | | 20,233,345 | |
| | | | | |
20 | Wells Fargo Ultra Short-Term Municipal Income Fund
Portfolio of investments—June 30, 2019
| | | | | | | | | | | | | | | | |
| | | Interest
rate | | | Maturity
date | | | Principal | | | Value | |
New York: 8.45% | |
|
| GO Revenue: 1.89% | |
| | | | |
New York NY Adjusted Fiscal 2008 Subordinate Bond SeriesA-4 (AGM Insured) (m) | | | 2.15 | % | | | 8-1-2026 | | | $ | 8,600,000 | | | $ | 8,600,000 | |
| | | | |
New York NY Adjusted Fiscal 2008 Subordinate Bond SeriesC-4 (AGC Insured) (m) | | | 2.25 | | | | 10-1-2027 | | | | 17,250,000 | | | | 17,250,000 | |
| | | | |
New York NY Subordinate Bond SeriesC-4 (AGM Insured) (m) | | | 2.34 | | | | 1-1-2032 | | | | 800,000 | | | | 800,000 | |
| | | | |
Suffolk County NY Public Improvement Serial Bonds Series B (Build America Mutual Assurance Company Insured) | | | 2.00 | | | | 10-15-2019 | | | | 685,000 | | | | 686,452 | |
| | | | |
Suffolk County NY TAN | | | 5.00 | | | | 7-24-2019 | | | | 8,500,000 | | | | 8,517,680 | |
| |
| | | | 35,854,132 | |
| | | | | |
|
| Health Revenue: 0.11% | |
| | | | |
New York Dormitory Authority Orange Regional Medical Center 144A | | | 4.00 | | | | 12-1-2019 | | | | 1,200,000 | | | | 1,210,116 | |
| | | | |
New York Dormitory Authority Orange Regional Medical Center 144A | | | 4.00 | | | | 12-1-2020 | | | | 800,000 | | | | 822,608 | |
| |
| | | | 2,032,724 | |
| | | | | |
|
| Housing Revenue: 1.55% | |
| | | | |
New York City NY Housing Development Corporation Bond Series A | | | 1.15 | | | | 11-1-2019 | | | | 5,000,000 | | | | 4,989,600 | |
| | | | |
New York City NY Housing Development Corporation Bond SeriesG-2 | | | 2.00 | | | | 11-1-2057 | | | | 7,970,000 | | | | 8,006,423 | |
| | | | |
New York City NY Housing Development Corporation Bond SeriesI-2-B | | | 1.85 | | | | 5-1-2021 | | | | 12,550,000 | | | | 12,551,631 | |
| | | | |
New York Mortgage Agency Homeowner Revenue Series 183 | | | 2.30 | | | | 10-1-2019 | | | | 2,535,000 | | | | 2,538,879 | |
| | | | |
New York Mortgage Agency Homeowner Revenue Series 183 | | | 3.50 | | | | 4-1-2022 | | | | 1,200,000 | | | | 1,246,740 | |
| |
| | | | 29,333,273 | |
| | | | | |
|
| Industrial Development Revenue: 1.21% | |
| | | | |
New York Energy R&D Authority PCR Keyspan Generation Series A (Ambac Insured) (m) | | | 2.93 | | | | 10-1-2028 | | | | 900,000 | | | | 900,000 | |
| | | | |
New York Transportation Development Corporation Series 2018 | | | 5.00 | | | | 1-1-2022 | | | | 2,000,000 | | | | 2,151,960 | |
| | | | |
New York Transportation Development Corporation Series 2018 | | | 5.00 | | | | 1-1-2023 | | | | 18,000,000 | | | | 19,826,460 | |
| |
| | | | 22,878,420 | |
| | | | | |
|
| Miscellaneous Revenue: 0.21% | |
| | | | |
BB&T Municipal Trust Class B (SIFMA Municipal Swap +0.55%) (Rabobank LOC) 144A± | | | 2.14 | | | | 11-30-2019 | | | | 4,000,000 | | | | 4,000,000 | |
| | | | | | | | | | | | | | | | |
|
| Tax Revenue: 0.69% | |
| | | | |
New York NY Transitional Finance Authority Subordinate Bond Series1-B (SIFMA Municipal Swap +0.80%)± | | | 2.70 | | | | 11-1-2022 | | | | 13,100,000 | | | | 13,176,766 | |
| | | | | | | | | | | | | | | | |
|
| Transportation Revenue: 2.79% | |
| | | | |
New York Metropolitan Transportation Authority Series B (1 Month LIBOR +0.55%) ± | | | 2.19 | | | | 11-1-2041 | | | | 6,255,000 | | | | 6,217,533 | |
| | | | |
New York Metropolitan Transportation Authority Subordinate BondSeries D-2 (SIFMA Municipal Swap +0.45%)± | | | 2.35 | | | | 11-15-2044 | | | | 18,460,000 | | | | 18,420,126 | |
| | | | |
New York Metropolitan Transportation Authority Subordinate BondSeries G-1F (1 Month LIBOR +0.65%)± | | | 2.29 | | | | 11-1-2026 | | | | 28,270,000 | | | | 28,289,789 | |
| |
| | | | 52,927,448 | |
| | | | | |
| |
| | | | 160,202,763 | |
| | | | | |
|
North Carolina: 2.82% | |
|
| Housing Revenue: 1.83% | |
| | | | |
Charlotte NC Housing Authority West Tyvola Seniors LLC | | | 2.23 | | | | 12-1-2021 | | | | 6,000,000 | | | | 6,044,820 | |
| | | | |
Durham NC Housing Authority Morreene Road Apartments Project | | | 1.85 | | | | 1-1-2021 | | | | 3,125,000 | | | | 3,130,031 | |
Wells Fargo Ultra Short-Term Municipal Income Fund | 21
Portfolio of investments—June 30, 2019
| | | | | | | | | | | | | | | | |
| | | Interest
rate | | | Maturity
date | | | Principal | | | Value | |
|
| Housing Revenue (continued) | |
| | | | |
Gastonia NC Housing Authority Cameron Courts & Weldon Heights Apartments | | | 1.78 | % | | | 11-1-2020 | | | $ | 8,215,000 | | | $ | 8,220,751 | |
| | | | |
Gastonia NC Housing Authority Linwood Terrace Apartments | | | 1.78 | | | | 11-1-2020 | | | | 3,910,000 | | | | 3,912,737 | |
| | | | |
Gastonia NC Housing Authority Mountain View Apartments | | | 1.78 | | | | 11-1-2020 | | | | 3,715,000 | | | | 3,717,601 | |
| | | | |
Raleigh NC Housing Authority Sir Walter Apartments Project Series A | | | 2.15 | | | | 7-1-2021 | | | | 9,600,000 | | | | 9,651,072 | |
| |
| | | | 34,677,012 | |
| | | | | |
|
| Tax Revenue: 0.99% | |
| | | | |
Montgomery County NC BAN | | | 3.00 | | | | 9-1-2020 | | | | 18,500,000 | | | | 18,681,115 | |
| | | | | | | | | | | | | | | | |
| |
| | | | 53,358,127 | |
| | | | | |
|
North Dakota: 0.71% | |
|
| Housing Revenue: 0.71% | |
| | | | |
North Dakota HFA Community Homes (HUD Insured) | | | 2.13 | | | | 8-1-2020 | | | | 5,015,000 | | | | 5,028,641 | |
| | | | |
North Dakota Housing Finance Agency Home Mortgage Finance Program Series B (SIFMA Municipal Swap +0.40%)± | | | 2.30 | | | | 1-1-2043 | | | | 8,500,000 | | | | 8,497,790 | |
| |
| | | | 13,526,431 | |
| | | | | |
|
Ohio: 4.24% | |
|
| GO Revenue: 1.06% | |
| | | | |
East Clinton OH Local School District BAN | | | 2.80 | | | | 12-3-2019 | | | | 2,000,000 | | | | 2,010,040 | |
| | | | |
East Clinton OH Local School District BAN | | | 3.00 | | | | 12-17-2019 | | | | 1,800,000 | | | | 1,810,692 | |
| | | | |
Fairborn OH | | | 2.75 | | | | 9-6-2019 | | | | 2,795,000 | | | | 2,800,730 | |
| | | | |
Firelands OH Local School District BAN | | | 3.00 | | | | 8-22-2019 | | | | 2,460,000 | | | | 2,464,182 | |
| | | | |
Lorain County OH BAN Series 2019 | | | 3.00 | | | | 2-7-2020 | | | | 1,725,000 | | | | 1,740,801 | |
| | | | |
Mahoning County OH | | | 3.00 | | | | 9-19-2019 | | | | 5,245,000 | | | | 5,261,836 | |
| | | | |
Newark OH BAN Street Sidewalk & Parking Lot Improvement | | | 3.00 | | | | 8-13-2019 | | | | 1,120,000 | | | | 1,121,344 | |
| | | | |
Tipp City OH BAN Series 2019 | | | 3.00 | | | | 2-12-2020 | | | | 2,750,000 | | | | 2,773,732 | |
| |
| | | | 19,983,357 | |
| | | | | |
|
| Health Revenue: 2.14% | |
| | | | |
Allen County OH Catholic Healthcare Series C (Union Bank NA LOC) ø | | | 1.80 | | | | 6-1-2034 | | | | 34,640,000 | | | | 34,640,000 | |
| | | | |
Allen County OH Mercy Health Hospital Series A | | | 5.00 | | | | 8-1-2021 | | | | 2,795,000 | | | | 2,991,852 | |
| | | | |
Hamilton County OH HFFA Cincinnati Children’s Hospital Medical Center Series AA ø | | | 1.00 | | | | 5-15-2037 | | | | 3,000,000 | | | | 3,000,000 | |
| |
| | | | 40,631,852 | |
| | | | | |
|
| Housing Revenue: 0.58% | |
| | | | |
Cuyahoga OH Metropolitan Housing Authority Multifamily Housing Riverside Park Phase 2 Project | | | 2.00 | | | | 4-1-2022 | | | | 4,750,000 | | | | 4,773,228 | |
| | | | |
Franklin County OH Sawyer & Trevitt Project | | | 1.77 | | | | 6-1-2020 | | | | 6,250,000 | | | | 6,250,313 | |
| |
| | | | 11,023,541 | |
| | | | | |
|
| Miscellaneous Revenue: 0.30% | |
| | | | |
American Municipal Power Incorporated BAN | | | 2.50 | | | | 6-25-2020 | | | | 3,125,000 | | | | 3,153,844 | |
| | | | |
Orange Village OH Recreational Trail Special Assessment | | | 3.00 | | | | 8-29-2019 | | | | 2,500,000 | | | | 2,504,775 | |
| |
| | | | 5,658,619 | |
| | | | | |
|
| Water & Sewer Revenue: 0.16% | |
| | | | |
Ohio Water Development Authority Series B (SIFMA Municipal Swap +0.22%) ± | | | 2.12 | | | | 12-1-2020 | | | | 3,090,000 | | | | 3,087,404 | |
| | | | | | | | | | | | | | | | |
| |
| | | | 80,384,773 | |
| | | | | |
22 | Wells Fargo Ultra Short-Term Municipal Income Fund
Portfolio of investments—June 30, 2019
| | | | | | | | | | | | | | | | |
| | | Interest
rate | | | Maturity
date | | | Principal | | | Value | |
Oklahoma: 0.22% | |
|
| GO Revenue: 0.22% | |
| | | | |
Oklahoma County OK Independent School District #53 | | | 1.75 | % | | | 7-1-2019 | | | $ | 870,000 | | | $ | 870,000 | |
| | | | |
Oklahoma County OK Independent School District #53 | | | 1.75 | | | | 7-1-2020 | | | | 950,000 | | | | 949,440 | |
| | | | |
Oklahoma County OK Independent School District #52 Series A | | | 2.50 | | | | 1-1-2020 | | | | 2,375,000 | | | | 2,388,371 | |
| |
| | | | 4,207,811 | |
| | | | | |
|
Oregon: 0.54% | |
|
| Industrial Development Revenue: 0.54% | |
| | | | |
Oregon Business Development Commission Intel Corporation Project Series 232 | | | 2.40 | | | | 12-1-2040 | | | | 10,000,000 | | | | 10,276,800 | |
| | | | | | | | | | | | | | | | |
|
Other: 0.06% | |
|
| Miscellaneous Revenue: 0.06% | |
| | | | |
Branch Banking & Trust Municipal Investment Trust Various States Class C (SIFMA Municipal Swap +1.05%) (Rabobank LOC) 144A± | | | 2.95 | | | | 12-31-2019 | | | | 1,146,022 | | | | 1,146,022 | |
| | | | | | | | | | | | | | | | |
|
Pennsylvania: 7.18% | |
|
| Education Revenue: 0.90% | |
| | | | |
Chester County PA HEFA Immaculata University Project | | | 4.00 | | | | 11-1-2019 | | | | 510,000 | | | | 511,938 | |
| | | | |
Chester County PA HEFA Immaculata University Project | | | 5.00 | | | | 11-1-2020 | | | | 550,000 | | | | 564,658 | |
| | | | |
Chester County PA HEFA Immaculata University Project | | | 5.00 | | | | 11-1-2021 | | | | 580,000 | | | | 605,764 | |
| | | | |
Cumberland County PA Authority Association of Independent Colleges & Universities of Pennsylvania Financing Program SeriesT-1 ø | | | 2.00 | | | | 5-1-2044 | | | | 1,200,000 | | | | 1,196,664 | |
| | | | |
Lycoming County PA Authority Association of Independent Colleges & Universities of Pennsylvania Financing Program | | | 1.85 | | | | 11-1-2035 | | | | 1,565,000 | | | | 1,565,000 | |
| | | | |
Pennsylvania HEFA Association of Independent Colleges & Universities of Pennsylvania Financing Program SeriesT-3 øø | | | 2.25 | | | | 5-1-2033 | | | | 3,575,000 | | | | 3,586,082 | |
| | | | |
Pennsylvania HEFA Independent Colleges Series I4 | | | 2.72 | | | | 11-1-2031 | | | | 3,000,000 | | | | 3,007,110 | |
| | | | |
Pennsylvania HEFA Wilkes University Project Series A | | | 4.00 | | | | 3-1-2020 | | | | 575,000 | | | | 581,313 | |
| | | | |
Pennsylvania HEFA Wilkes University Project Series A | | | 5.00 | | | | 3-1-2021 | | | | 390,000 | | | | 406,146 | |
| | | | |
Pennsylvania HEFAR Association of Independent Colleges and Universities of Pennsylvania Financing Program Mount Aloysius College ProjectSeries R-1 | | | 2.25 | | | | 11-1-2041 | | | | 5,000,000 | | | | 5,006,650 | |
| |
| | | | 17,031,325 | |
| | | | | |
|
| GO Revenue: 1.40% | |
| | | | |
Allentown PA City School District TRAN %% | | | 2.05 | | | | 1-2-2020 | | | | 3,000,000 | | | | 2,999,910 | |
| | | | |
Pennsylvania | | | 5.00 | | | | 1-15-2020 | | | | 12,845,000 | | | | 13,100,872 | |
| | | | |
Philadelphia PA School District Refunding Bond Series C | | | 5.00 | | | | 9-1-2019 | | | | 5,990,000 | | | | 6,022,526 | |
| | | | |
Philadelphia PA School District Series D | | | 5.00 | | | | 9-1-2019 | | | | 980,000 | | | | 985,321 | |
| | | | |
Philadelphia PA School District Series F | | | 5.00 | | | | 9-1-2019 | | | | 780,000 | | | | 784,235 | |
| | | | |
Scranton PA 144A | | | 5.00 | | | | 9-1-2019 | | | | 1,640,000 | | | | 1,647,134 | |
| | | | |
Scranton PA School District Series A | | | 5.00 | | | | 6-1-2020 | | | | 500,000 | | | | 513,370 | |
| | | | |
Scranton PA School District Series B | | | 5.00 | | | | 6-1-2020 | | | | 420,000 | | | | 431,231 | |
| |
| | | | 26,484,599 | |
| | | | | |
|
| Health Revenue: 1.84% | |
| | | | |
Montgomery County PA Higher Education & Health Authority Presbytery Homes Incorporated Project | | | 2.00 | | | | 12-1-2019 | | | | 575,000 | | | | 574,281 | |
| | | | |
Montgomery County PA Higher Education & Health Authority Presbytery Homes Incorporated Project | | | 2.00 | | | | 12-1-2020 | | | | 505,000 | | | | 500,798 | |
Wells Fargo Ultra Short-Term Municipal Income Fund | 23
Portfolio of investments—June 30, 2019
| | | | | | | | | | | | | | | | |
| | | Interest
rate | | | Maturity
date | | | Principal | | | Value | |
|
| Health Revenue (continued) | |
| | | | |
Montgomery County PA Higher Education & Health Authority Presbytery Homes Incorporated Project | | | 3.00 | % | | | 12-1-2021 | | | $ | 560,000 | | | $ | 564,407 | |
| | | | |
Montgomery County PA Higher Education & Health Authority Series 2018A | | | 5.00 | | | | 9-1-2022 | | | | 1,250,000 | | | | 1,386,625 | |
| | | | |
Philadelphia PA Hospital & Higher Education Facilities Authority | | | 5.00 | | | | 7-1-2019 | | | | 780,000 | | | | 780,000 | |
| | | | |
Philadelphia PA Hospital & Higher Education Facilities Authority | | | 5.00 | | | | 7-1-2020 | | | | 780,000 | | | | 800,803 | |
| | | | |
Quakertown PA Health Facilities Authority Series A | | | 3.13 | | | | 7-1-2021 | | | | 2,545,000 | | | | 2,533,547 | |
| | | | |
Southcentral Pennsylvania General Authority WellSpan Health Obliged Group Revenue Bond Series 2019E (U.S. Bank NA LIQ) ø | | | 1.92 | | | | 6-1-2035 | | | | 27,690,000 | | | | 27,690,000 | |
| |
| | | | 34,830,461 | |
| | | | | |
|
| Housing Revenue: 0.67% | |
| | | | |
Pennsylvania HFA Series 114A | | | 2.90 | | | | 10-1-2021 | | | | 3,000,000 | | | | 3,061,740 | |
| | | | |
Pennsylvania Housing Finance Agency Multifamily Housing Development Blumberg Senior Apartments Project | | | 1.65 | | | | 11-1-2020 | | | | 4,500,000 | | | | 4,499,595 | |
| | | | |
Pennsylvania Housing Finance Agency Sharpsburg Towers Series B | | | 2.40 | | | | 12-1-2021 | | | | 2,500,000 | | | | 2,524,250 | |
| | | | |
Pittsburgh PA Housing Authority East Liberty Phase II Apartments | | | 1.40 | | | | 10-1-2021 | | | | 2,735,000 | | | | 2,732,538 | |
| |
| | | | 12,818,123 | |
| | | | | |
|
| Industrial Development Revenue: 0.42% | |
| | | | |
Beaver County PA IDA Pollution Control FirstEnergy Generation Project Series B †† | | | 4.25 | | | | 10-1-2047 | | | | 3,910,000 | | | | 3,968,650 | |
| | | | |
Montgomery County PA IDA Peco Energy Company Project Series A | | | 2.60 | | | | 3-1-2034 | | | | 3,910,000 | | | | 3,931,388 | |
| |
| | | | 7,900,038 | |
| | | | | |
|
| Miscellaneous Revenue: 1.09% | |
| | | | |
Bethlehem PA School District Revenue (1 Month LIBOR +0.48%)± | | | 2.16 | | | | 7-1-2031 | | | | 9,985,000 | | | | 9,982,703 | |
| | | | |
Butler County General Authority Hampton Township School District Project Series 2007 (AGM Insured, PNC Bank NA SPA) ø | | | 1.00 | | | | 9-1-2027 | | | | 10,625,000 | | | | 10,625,000 | |
| |
| | | | 20,607,703 | |
| | | | | |
|
| Water & Sewer Revenue: 0.86% | |
| | | | |
North Pennsylvania Water Authority (1 Month LIBOR +0.41%)± | | | 2.05 | | | | 11-1-2019 | | | | 780,000 | | | | 780,031 | |
| | | | |
North Pennsylvania Water Authority (1 Month LIBOR +0.50%)± | | | 2.14 | | | | 11-1-2024 | | | | 3,910,000 | | | | 3,910,313 | |
| | | | |
Pittsburgh PA Water & Sewer Authority Series C (1 Month LIBOR +0.64%) (AGM Insured)± | | | 2.39 | | | | 9-1-2040 | | | | 11,730,000 | | | | 11,734,575 | |
| |
| | | | 16,424,919 | |
| | | | | |
| |
| | | | 136,097,168 | |
| | | | | |
|
Rhode Island: 0.03% | |
|
| Education Revenue: 0.03% | |
| | | | |
Rhode Island Student Loan Authority AMT Program Senior Series A | | | 5.00 | | | | 12-1-2019 | | | | 590,000 | | | | 598,006 | |
| | | | | | | | | | | | | | | | |
|
South Carolina: 0.45% | |
|
| Health Revenue: 0.05% | |
| | | | |
South Carolina Jobs EDA Episcopal Home at Still Hopes Series A | | | 5.00 | | | | 4-1-2021 | | | | 425,000 | | | | 442,072 | |
| | | | |
South Carolina Jobs EDA Episcopal Home at Still Hopes Series A | | | 5.00 | | | | 4-1-2022 | | | | 455,000 | | | | 482,141 | |
| |
| | | | 924,213 | |
| | | | | |
|
| Housing Revenue: 0.40% | |
| | | | |
South Carolina Housing Finance & Development Authority Lorick Place Apartments Project | | | 2.43 | | | | 11-1-2021 | | | | 7,500,000 | | | | 7,574,400 | |
| | | | | | | | | | | | | | | | |
| |
| | | | 8,498,613 | |
| | | | | |
24 | Wells Fargo Ultra Short-Term Municipal Income Fund
Portfolio of investments—June 30, 2019
| | | | | | | | | | | | | | | | |
| | | Interest
rate | | | Maturity
date | | | Principal | | | Value | |
South Dakota: 0.07% | |
|
| Housing Revenue: 0.07% | |
| | | | |
South Dakota Housing Development Authority Homeownership Mortgage Bond AMT Series E (GNMA/FNMA/FHLMC Insured) | | | 1.90 | % | | | 5-1-2020 | | | $ | 1,285,000 | | | $ | 1,284,987 | |
| | | | | | | | | | | | | | | | |
|
Tennessee: 0.95% | |
|
| Health Revenue: 0.08% | |
| | | | |
Greeneville TN HEFA Board Series 2018A | | | 5.00 | | | | 7-1-2022 | | | | 1,280,000 | | | | 1,404,211 | |
| | | | | | | | | | | | | | | | |
|
| Housing Revenue: 0.75% | |
| | | | |
Memphis TN Health Educational & Housing Facility Board Keystone Landing & Pendleton Place Apartments | | | 2.03 | | | | 8-1-2021 | | | | 8,000,000 | | | | 8,036,960 | |
| | | | |
Murfreesboro TN Housing Authority Westbrook Towers II LP Project | | | 2.13 | | | | 9-1-2021 | | | | 5,000,000 | | | | 5,021,400 | |
| | | | |
Nashville & Davidson County TN HEFA Twelfth & Wedgewood Apartments Project (HUD Insured) | | | 1.80 | | | | 12-1-2020 | | | | 1,175,000 | | | | 1,176,386 | |
| |
| | | | 14,234,746 | |
| | | | | |
|
| Utilities Revenue: 0.12% | |
| | | | |
Tennessee Energy Acquisition Corporation Series A | | | 4.00 | | | | 5-1-2048 | | | | 2,190,000 | | | | 2,347,592 | |
| | | | | | | | | | | | | | | | |
| |
| | | | 17,986,549 | |
| | | | | |
|
Texas: 17.89% | |
|
| Airport Revenue: 0.12% | |
| | | | |
Houston TX Airport System Revenue Series A | | | 5.00 | | | | 7-1-2019 | | | | 1,000,000 | | | | 1,000,000 | |
| | | | |
Houston TX Airport System Revenue Series B | | | 5.00 | | | | 7-1-2019 | | | | 1,250,000 | | | | 1,250,000 | |
| |
| | | | 2,250,000 | |
| | | | | |
|
| Education Revenue: 0.38% | |
| | | | |
Alamo TX Community College District | | | 3.00 | | | | 11-1-2046 | | | | 3,200,000 | | | | 3,213,376 | |
| | | | |
University of Texas Board of Regents Series C | | | 5.00 | | | | 8-15-2020 | | | | 3,910,000 | | | | 4,073,790 | |
| |
| | | | 7,287,166 | |
| | | | | |
|
| GO Revenue: 9.10% | |
| | | | |
Burleson TX Independent School District | | | 2.50 | | | | 2-1-2047 | | | | 7,885,000 | | | | 8,075,896 | |
| | | | |
Cypress-Fairbanks TX Independent School District SeriesA-1 | | | 2.13 | | | | 2-15-2027 | | | | 4,800,000 | | | | 4,844,592 | |
| | | | |
Cypress-Fairbanks TX Independent School District SeriesA-2 | | | 2.50 | | | | 2-15-2036 | | | | 13,295,000 | | | | 13,311,220 | |
| | | | |
Cypress-Fairbanks TX Independent School District SeriesA-3 | | | 3.00 | | | | 2-15-2043 | | | | 2,470,000 | | | | 2,513,373 | |
| | | | |
Cypress-Fairbanks TX Independent School District SeriesB-2 | | | 2.13 | | | | 2-15-2040 | | | | 7,015,000 | | | | 7,089,008 | |
| | | | |
Fort Bend TX Independent School District Series A | | | 1.75 | | | | 8-1-2040 | | | | 11,690,000 | | | | 11,692,572 | |
| | | | |
Fort Bend TX Independent School District Series B | | | 1.35 | | | | 8-1-2040 | | | | 1,475,000 | | | | 1,474,853 | |
| | | | |
Galveston TX Dickinson Independent High School District | | | 1.35 | | | | 8-1-2037 | | | | 3,585,000 | | | | 3,584,642 | |
| | | | |
Goose Creek TX Independent School District Series B | | | 1.18 | | | | 2-15-2035 | | | | 7,820,000 | | | | 7,817,341 | |
| | | | |
Grapevine-Colleyville TX Independent School District Prerefunded Bond Series B | | | 2.00 | | | | 8-1-2036 | | | | 3,150,000 | | | | 3,166,128 | |
| | | | |
Grapevine-Colleyville TX Independent School District Unrefunded Bond Series B | | | 2.00 | | | | 8-1-2036 | | | | 3,495,000 | | | | 3,516,634 | |
| | | | |
Harlandale TX Independent School District | | | 3.00 | | | | 8-15-2045 | | | | 8,775,000 | | | | 8,903,729 | |
| | | | |
Harris County TX Cypress-Fairbanks Independent High School Series2014B-2 | | | 1.40 | | | | 2-15-2040 | | | | 4,070,000 | | | | 4,069,064 | |
| | | | |
Houston TX Independent School District | | | 1.45 | | | | 6-1-2029 | | | | 16,305,000 | | | | 16,300,435 | |
| | | | |
Houston TX Independent School District Series2014A-1B | | | 2.20 | | | | 6-1-2039 | | | | 9,000,000 | | | | 9,058,590 | |
| | | | |
North East TX Independent School District Series B | | | 1.42 | | | | 8-1-2040 | | | | 1,090,000 | | | | 1,084,299 | |
| | | | |
Northside TX Independent School District Building Project | | | 2.00 | | | | 8-1-2044 | | | | 2,820,000 | | | | 2,821,184 | |
Wells Fargo Ultra Short-Term Municipal Income Fund | 25
Portfolio of investments—June 30, 2019
| | | | | | | | | | | | | | | | |
| | | Interest
rate | | | Maturity
date | | | Principal | | | Value | |
|
| GO Revenue (continued) | |
| | | | |
Northside TX Independent School District Building Project | | | 2.00 | % | | | 6-1-2046 | | | $ | 2,135,000 | | | $ | 2,154,258 | |
| | | | |
Northside TX Independent School District Building Project | | | 2.13 | | | | 8-1-2040 | | | | 1,425,000 | | | | 1,425,741 | |
| | | | |
Sherman TX Independent School District Prerefunded Bond Series B | | | 3.00 | | | | 8-1-2048 | | | | 265,000 | | | | 269,500 | |
| | | | |
Sherman TX Independent School District Unrefunded Bond Series B | | | 3.00 | | | | 8-1-2048 | | | | 13,735,000 | | | | 13,966,847 | |
| | | | |
Texas Anticipation Notes Series 2018 | | | 4.00 | | | | 8-29-2019 | | | | 40,000,000 | | | | 40,154,800 | |
| | | | |
Texas Northside Independent School District | | | 1.45 | | | | 6-1-2047 | | | | 3,825,000 | | | | 3,826,033 | |
| | | | |
Williamson County TX | | | 1.85 | | | | 8-15-2034 | | | | 1,340,000 | | | | 1,340,214 | |
| |
| | | | 172,460,953 | |
| | | | | |
|
| Health Revenue: 0.99% | |
| | | | |
Coastal Bend TX Health Facilities Development Corporation (AGM Insured) (m) | | | 2.15 | | | | 7-1-2031 | | | | 9,250,000 | | | | 9,250,000 | |
| | | | |
Harris County TX Health Facilities Development Corporation Series A3 (AGM Insured) (m) | | | 2.15 | | | | 7-1-2031 | | | | 8,300,000 | | | | 8,300,000 | |
| | | | |
Tarrant County TX Cultural Education Facilities Finance Corporation Edgemere Project Refunding Bond Series A | | | 4.00 | | | | 11-15-2019 | | | | 400,000 | | | | 401,116 | |
| | | | |
Tarrant County TX Cultural Education Facilities Finance Corporation Edgemere Project Series B | | | 4.00 | | | | 11-15-2019 | | | | 705,000 | | | | 706,967 | |
| |
| | | | 18,658,083 | |
| | | | | |
|
| Housing Revenue: 3.81% | |
| | | | |
Alamito TX Public Facilities Corporation Multifamily Housing Series 2018 | | | 2.25 | | | | 6-1-2021 | | | | 16,300,000 | | | | 16,391,932 | |
| | | | |
Alamito TX Public Facilities Corporation Cramer Three Apartments Project | | | 2.50 | | | | 11-1-2021 | | | | 2,000,000 | | | | 2,031,260 | |
| | | | |
Capital Area Housing Finance Corporation TX Hills Leander Apartments | | | 2.05 | | | | 8-1-2021 | | | | 7,000,000 | | | | 7,034,300 | |
| | | | |
New Hope TX Cultural Education Facilities Finance Corporation Student Housing – Blinn College Properties LLC Project Series A ## | | | 3.25 | | | | 8-1-2019 | | | | 12,295,000 | | | | 12,295,492 | |
| | | | |
Southeast Texas Housing Finance Corporation Bayshore Towers Apartments (HUD Insured) | | | 2.20 | | | | 1-1-2022 | | | | 8,025,000 | | | | 8,066,088 | |
| | | | |
Texas Capital Area Housing Finance Agency Multifamily Housing Mission Trail at El Camino Real Apartments | | | 2.10 | | | | 9-1-2037 | | | | 9,750,000 | | | | 9,840,870 | |
| | | | |
Texas Department of Housing & Community Affairs Multifamily Housing | | | 1.80 | | | | 12-1-2020 | | | | 1,955,000 | | | | 1,956,193 | |
| | | | |
Texas Department of Housing & Community Affairs Multifamily Housing | | | 2.20 | | | | 5-1-2021 | | | | 8,500,000 | | | | 8,536,210 | |
| | | | |
Texas Department of Housing & Community Affairs Multifamily Housing Series 2018 (FHA Insured) | | | 2.23 | | | | 5-1-2021 | | | | 6,000,000 | | | | 6,025,560 | |
| |
| | | | 72,177,905 | |
| | | | | |
|
| Industrial Development Revenue: 0.75% | |
| | | | |
Matagorda County TX Navigation District Central Power & Light Company Project | | | 1.75 | | | | 5-1-2030 | | | | 5,280,000 | | | | 5,256,398 | |
| | | | |
Port of Port Arthur TX Navigation District Exempt Facilities AMT Emerald Renewable Diesel LLC Project REMK 144A | | | 1.90 | | | | 6-1-2049 | | | | 9,000,000 | | | | 9,000,000 | |
| |
| | | | 14,256,398 | |
| | | | | |
|
| Resource Recovery Revenue: 1.09% | |
| | | | |
Harris County TX Industrial Development Corporation Solid Waste Disposal Series 2006 | | | 5.00 | | | | 2-1-2023 | | | | 13,500,000 | | | | 13,702,500 | |
| | | | |
Port Arthur TX Navigation District Jefferson County Environmental Facilities Motiva Enterprises LLC Project Subordinate Bond Series D ø | | | 2.05 | | | | 11-1-2040 | | | | 7,000,000 | | | | 7,000,000 | |
| |
| | | | 20,702,500 | |
| | | | | |
|
| Utilities Revenue: 1.44% | |
| | | | |
San Antonio TX Electric & Gas Systems Refunding Bond Series B | | | 2.00 | | | | 2-1-2033 | | | | 11,440,000 | | | | 11,516,076 | |
| | | | |
San Antonio TX Series A | | | 2.25 | | | | 2-1-2033 | | | | 15,640,000 | | | | 15,681,602 | |
| |
| | | | 27,197,678 | |
| | | | | |
26 | Wells Fargo Ultra Short-Term Municipal Income Fund
Portfolio of investments—June 30, 2019
| | | | | | | | | | | | | | | | |
| | | Interest
rate | | | Maturity
date | | | Principal | | | Value | |
| Water & Sewer Revenue: 0.21% | |
| | | | |
Houston TX Combined Utility System Revenue Series C (1 Month LIBOR +0.36%)± | | | 2.04 | % | | | 5-15-2034 | | | $ | 4,000,000 | | | $ | 3,992,160 | |
| | | | | | | | | | | | | | | | |
| |
| | | | 338,982,843 | |
| | | | | |
|
Virginia: 1.94% | |
|
| Housing Revenue: 1.51% | |
| | | | |
Colonial Heights VA EDA Colonial Ridge Apartments Series A | | | 1.80 | | | | 1-1-2020 | | | | 7,820,000 | | | | 7,820,000 | |
| | | | |
Fairfax County VA Redevelopment & Housing Authority Murraygate Village Apartment Project | | | 2.26 | | | | 2-1-2021 | | | | 12,500,000 | | | | 12,573,125 | |
| | | | |
Fairfax County VA Redevelopment & Housing Authority Parkwood Project | | | 2.21 | | | | 2-1-2021 | | | | 5,500,000 | | | | 5,532,175 | |
| | | | |
Newport News VA Redevelopment & Housing Authority Soundview Townhouses | | | 2.05 | | | | 8-1-2021 | | | | 2,690,000 | | | | 2,704,445 | |
| |
| | | | 28,629,745 | |
| | | | | |
|
| Industrial Development Revenue: 0.22% | |
| | | | |
Louisa VA IDA Pollution Control Series 2008A | | | 1.90 | | | | 11-1-2035 | | | | 4,000,000 | | | | 4,043,880 | |
| | | | | | | | | | | | | | | | |
|
| Utilities Revenue: 0.21% | |
| | | | |
Halifax County VA IDA | | | 2.15 | | | | 12-1-2041 | | | | 2,000,000 | | | | 2,014,240 | |
| | | | |
Wise County IDA Virginia Electric & Power Company Series A REMK | | | 1.88 | | | | 11-1-2040 | | | | 2,000,000 | | | | 2,006,220 | |
| |
| | | | 4,020,460 | |
| | | | | |
| |
| | | | 36,694,085 | |
| | | | | |
|
Washington: 2.01% | |
|
| Health Revenue: 1.04% | |
| | | | |
Grays Harbor County WA Public Hospital District 1 ## | | | 3.00 | | | | 8-1-2019 | | | | 5,965,000 | | | | 5,965,716 | |
| | | | |
Washington HCFR Central Washington Health Service Association | | | 7.00 | | | | 7-1-2039 | | | | 2,345,000 | | | | 2,345,000 | |
| | | | |
Washington HCFR Series XF2035 (Morgan Stanley Bank LIQ) 144Aø | | | 2.30 | | | | 10-1-2036 | | | | 11,280,000 | | | | 11,280,000 | |
| |
| | | | 19,590,716 | |
| | | | | |
|
| Housing Revenue: 0.33% | |
| | | | |
Washington Housing Finance Commission SAG Portfolio Project | | | 2.55 | | | | 7-1-2022 | | | | 6,250,000 | | | | 6,323,625 | |
| | | | | | | | | | | | | | | | |
|
| Utilities Revenue: 0.64% | |
| | | | |
Seattle WA Municipal Light & Power Refunding Bond SeriesB-2 (SIFMA Municipal Swap +0.29%)± | | | 2.19 | | | | 5-1-2045 | | | | 10,000,000 | | | | 9,973,500 | |
| | | | |
Seattle WA Municipal Light & Power Series C1 (SIFMA Municipal Swap +0.25%) ± | | | 2.15 | | | | 11-1-2021 | | | | 1,055,000 | | | | 1,052,436 | |
| | | | |
Seattle WA Municipal Light & Power Series C2 (SIFMA Municipal Swap +0.25%) ± | | | 2.15 | | | | 11-1-2021 | | | | 1,055,000 | | | | 1,052,436 | |
| |
| | | | 12,078,372 | |
| | | | | |
| |
| | | | 37,992,713 | |
| | | | | |
|
West Virginia: 0.45% | |
|
| Housing Revenue: 0.26% | |
| | | | |
West Virginia Housing Development Brookpark Place Project %% | | | 1.65 | | | | 8-1-2022 | | | | 5,000,000 | | | | 4,998,300 | |
| | | | | | | | | | | | | | | | |
|
| Utilities Revenue: 0.19% | |
| | | | |
West Virginia EDA Solid Waste Disposal Facilities Appalachian Power Company Series A | | | 1.70 | | | | 1-1-2041 | | | | 3,520,000 | | | | 3,515,917 | |
| | | | | | | | | | | | | | | | |
| |
| | | | 8,514,217 | |
| | | | | |
Wells Fargo Ultra Short-Term Municipal Income Fund | 27
Portfolio of investments—June 30, 2019
| | | | | | | | | | | | | | | | |
| | | Interest
rate | | | Maturity
date | | | Principal | | | Value | |
Wisconsin: 3.27% | |
|
| Education Revenue: 0.10% | |
| | | | |
Wisconsin PFA Gardner Webb University 144A | | | 5.00 | % | | | 7-1-2021 | | | $ | 1,360,000 | | | $ | 1,403,806 | |
| | | | |
Wisconsin PFA Guilford College | | | 5.00 | | | | 1-1-2020 | | | | 490,000 | | | | 496,502 | |
| |
| | | | 1,900,308 | |
| | | | | |
|
| GO Revenue: 0.15% | |
| | | | |
Dane County WI AMT Promissory Notes Apartment Project Series D | | | 2.50 | | | | 6-1-2022 | | | | 445,000 | | | | 450,945 | |
| | | | |
Dane County WI AMT Promissory Notes Apartment Project Series D | | | 2.63 | | | | 6-1-2023 | | | | 980,000 | | | | 993,563 | |
| | | | |
Dane County WI AMT Promissory Notes Apartment Project Series D | | | 3.50 | | | | 6-1-2020 | | | | 600,000 | | | | 611,286 | |
| | | | |
Dane County WI AMT Promissory Notes Apartment Project Series D | | | 3.50 | | | | 6-1-2021 | | | | 735,000 | | | | 763,761 | |
| |
| | | | 2,819,555 | |
| | | | | |
|
| Health Revenue: 1.29% | |
| | | | |
Wisconsin HEFA Advocate Aurora Health Credit Group Series C3 (SIFMA Municipal Swap +0.55%)± | | | 2.45 | | | | 8-15-2054 | | | | 20,065,000 | | | | 20,078,042 | |
| | | | |
Wisconsin HEFA Ascension Senior Credit Group SeriesB-5 | | | 1.38 | | | | 11-15-2038 | | | | 1,220,000 | | | | 1,219,561 | |
| | | | |
Wisconsin HEFA Tomah Memorial Hospital Series A | | | 2.65 | | | | 11-1-2020 | | | | 3,125,000 | | | | 3,129,812 | |
| |
| | | | 24,427,415 | |
| | | | | |
|
| Housing Revenue: 0.32% | |
| | | | |
Wisconsin Housing & EDA Series A | | | 1.95 | | | | 11-1-2047 | | | | 4,865,000 | | | | 4,868,649 | |
| | | | |
Wisconsin Housing & EDA Series A | | | 2.80 | | | | 3-1-2022 | | | | 1,070,000 | | | | 1,094,792 | |
| |
| | | | 5,963,441 | |
| | | | | |
|
| Miscellaneous Revenue: 0.50% | |
| | | | |
Deforest WI Area School District ## | | | 3.00 | | | | 12-18-2019 | | | | 4,500,000 | | | | 4,507,965 | |
| | | | |
Sun Prairie WI Area School District %% | | | 3.00 | | | | 12-31-2019 | | | | 5,000,000 | | | | 5,012,000 | |
| |
| | | | 9,519,965 | |
| | | | | |
|
| Resource Recovery Revenue: 0.80% | |
| | | | |
Wisconsin PFA SeriesA-2 | | | 1.95 | | | | 10-1-2025 | | | | 15,235,000 | | | | 15,240,028 | |
| | | | | | | | | | | | | | | | |
|
| Tax Revenue: 0.11% | |
| | | | |
Oconto Falls WI Public School District ## | | | 3.00 | | | | 10-1-2019 | | | | 2,150,000 | | | | 2,156,987 | |
| | | | | | | | | | | | | | | | |
| |
| | | | 62,027,699 | |
| | | | | |
|
Wyoming: 0.08% | |
|
| Utilities Revenue: 0.08% | |
| | | | |
Converse County WY Pollution Control PacifiCorp Projects ø | | | 2.00 | | | | 12-1-2020 | | | | 1,485,000 | | | | 1,485,000 | |
| | | | | | | | | | | | | | | | |
| |
Total Municipal Obligations (Cost $1,884,548,869) | | | | 1,891,210,949 | |
| | | | | |
| | | | |
| | | | | | | | | | | | | | | | |
| | | | | | | | | Shares | | | | |
| | | | |
Closed End Municipal Bond Funds: 1.54% | | | | | | | | | | | | | | | | |
| | | | |
| Massachusetts: 0.26% | | | | | | | | | | | | |
| | | | |
Nuveen Massachusetts Dividend Advantage Municipal Income Fund Variable Rate Demand Preferred Shares 2.25% 144A | | | | | | | | | | | 5,000,000 | | | | 5,000,000 | |
| | | | | | | | | | | | | | | | |
| | | | |
| New York: 1.28% | | | | | | | | | | | | |
| | | | |
Nuveen New York Quality Municipal Income Fund Institutional MuniFund Term Variable Rate Demand Preferred Shares Series A 2.20% 144A | | | | | | | | | | | 24,200,000 | | | | 24,200,000 | |
| | | | | | | | | | | | | | | | |
| |
Total Closed End Municipal Bond Funds (Cost $29,200,000) | | | | 29,200,000 | |
| | | | | |
28 | Wells Fargo Ultra Short-Term Municipal Income Fund
Portfolio of investments—June 30, 2019
| | | | | | | | | | | | | | | | |
| | | Yield | | | | | | Shares | | | Value | |
Short-Term Investments: 0.24% | |
|
| Investment Companies: 0.24% | |
| | | | |
Wells Fargo Municipal Cash Management Money Market Fund Institutional Class (l)(u) ## | | | 1.82 | % | | | | | | | 4,468,777 | | | $ | 4,471,458 | |
| | | | | | | | | | | | | | | | |
| |
Total Short-Term Investments (Cost $4,471,458) | | | | 4,471,458 | |
| | | | | |
| | | | | | | | |
| Total investments in securities (Cost $1,918,220,327) | | | 101.59 | % | | | 1,924,882,407 | |
| | |
Other assets and liabilities, net | | | (1.59 | ) | | | (30,121,220 | ) |
| | | | | | | | |
| Total net assets | | | 100.00 | % | | $ | 1,894,761,187 | |
| | | | | | | | |
| (m) | The security is an auction-rate security which has an interest rate that resets at predetermined short-term intervals through a Dutch auction. The rate shown is the rate in effect at period end. |
| øø | The interest rate is determined and reset by the issuer periodically depending upon the terms of the security. The rate shown is the rate in effect at period end. |
| 144A | The security may be resold in transactions exempt from registration, normally to qualified institutional buyers, pursuant to Rule 144A under the Securities Act of 1933. |
| ± | Variable rate investment. The rate shown is the rate in effect at period end. |
| ø | Variable rate demand notes are subject to a demand feature which reduces the effective maturity. The maturity date shown represents the final maturity date of the security. The interest rate is determined and reset by the issuer daily, weekly, or monthly depending upon the terms of the security. The rate shown is the rate in effect at period end. |
| %% | The security is purchased on a when-issued basis. |
| ## | All or a portion of this security is segregated for when-issued securities. |
| (l) | The issuer of the security is an affiliated person of the Fund as defined in the Investment Company Act of 1940. |
| (u) | The rate represents the7-day annualized yield at period end. |
Abbreviations:
| AGC | Assured Guaranty Corporation |
| AGM | Assured Guaranty Municipal |
| Ambac | Ambac Financial Group Incorporated |
| AMT | Alternative minimum tax |
| BAN | Bond anticipation notes |
| CDA | Community Development Authority |
| EDA | Economic Development Authority |
| EDFA | Economic Development Finance Authority |
| FHA | Federal Housing Administration |
| FHLMC | Federal Home Loan Mortgage Corporation |
| FNMA | Federal National Mortgage Association |
| GNMA | Government National Mortgage Association |
| HCFR | Healthcare facilities revenue |
| HEFA | Health & Educational Facilities Authority |
| HEFAR | Higher Education Facilities Authority Revenue |
| HFA | Housing Finance Authority |
| HFFA | Health Facilities Financing Authority |
| HUD | Department of Housing and Urban Development |
| IDA | Industrial Development Authority |
| LIBOR | London Interbank Offered Rate |
| National | National Public Finance Guarantee Corporation |
| PCR | Pollution control revenue |
| PFA | Public Finance Authority |
| PFFA | Public Facilities Financing Authority |
| R&D | Research & development |
Wells Fargo Ultra Short-Term Municipal Income Fund | 29
Portfolio of investments—June 30, 2019
| RDA | Redevelopment Authority |
| SIFMA | Securities Industry and Financial Markets Association |
| SPA | Standby purchase agreement |
| TAN | Tax anticipation notes |
| TRAN | Tax revenue anticipation notes |
| TTFA | Transportation Trust Fund Authority |
Investments in Affiliates
An affiliated investment is an investment in which the Fund owns at least 5% of the outstanding voting shares of the issuer or as a result of other relationships, such as the Fund and the issuer having the same investment manager. Transactions with issuers that were either affiliates of the Fund at the beginning of the period or the end of the period were as follows:
| | | | | | | | | | | | | | | | | | | | | | | | | | | | | | | | | | | | |
| | | Shares,
beginning of
period | | | Shares
purchased | | | Shares
sold | | | Shares,
end of
period | | | Net
realized
gains
(losses) | | | Net
change in
unrealized
gains
(losses) | | | Income
from
affiliated
securities | | | Value,
end
of period | | | % of
net
assets | |
Short-Term Investments | | | | | | | | | | | | | | | | | | | | | | | | | | | | | | | | | | | | |
Investment Companies | | | | | | | | | | | | | | | | | | | | | | | | | | | | | | | | | | | | |
Wells Fargo Municipal Cash Management Money Market Fund Institutional Class | | | 48,291,197 | | | | 1,149,713,406 | | | | 1,193,535,826 | | | | 4,468,777 | | | $ | (43,035 | ) | | $ | 0 | | | $ | 398,710 | | | $ | 4,471,458 | | | | 0.24 | % |
30 | Wells Fargo Ultra Short-Term Municipal Income Fund
Statement of assets and liabilities—June 30, 2019
| | | | |
| | | | |
| |
Assets | | | | |
Investments in unaffiliated securities, at value (cost $1,913,748,869) | | $ | 1,920,410,949 | |
Investments in affiliated securities, at value (cost $4,471,458) | | | 4,471,458 | |
Cash | | | 736 | |
Receivable for investments sold | | | 10,551,772 | |
Receivable for Fund shares sold | | | 2,826,477 | |
Receivable for interest | | | 12,871,663 | |
| | | | |
Total assets | | | 1,951,133,055 | |
| | | | |
| |
Liabilities | | | | |
Payable for investments purchased | | | 49,401,902 | |
Payable for Fund shares redeemed | | | 4,542,144 | |
Dividends payable | | | 1,162,414 | |
Management fee payable | | | 407,679 | |
Administration fees payable | | | 124,984 | |
Distribution fee payable | | | 6,379 | |
Trustees’ fees and expenses payable | | | 1,377 | |
Accrued expenses and other liabilities | | | 724,989 | |
| | | | |
Total liabilities | | | 56,371,868 | |
| | | | |
Total net assets | | $ | 1,894,761,187 | |
| | | | |
| |
Net assets consist of | | | | |
Paid-in capital | | $ | 1,915,119,167 | |
Total distributable loss | | | (20,357,980 | ) |
| | | | |
Total net assets | | $ | 1,894,761,187 | |
| | | | |
| |
Computation of net asset value and offering price per share | | | | |
Net assets – Class A | | $ | 444,580,717 | |
Shares outstanding – Class A1 | | | 46,296,914 | |
Net asset value per share – Class A | | | $9.60 | |
Maximum offering price per share – Class A2 | | | $9.80 | |
Net assets – Class C | | $ | 10,134,871 | |
Shares outstanding – Class C1 | | | 1,074,874 | |
Net asset value per share – Class C | | | $9.43 | |
Net assets – Class R6 | | $ | 770,634,034 | |
Shares outstanding – Class R61 | | | 80,254,524 | |
Net asset value per share – Class R6 | | | $9.60 | |
Net assets – Administrator Class | | $ | 25,649,358 | |
Shares outstanding – Administrator Class1 | | | 2,670,759 | |
Net asset value per share – Administrator Class | | | $9.60 | |
Net assets – Institutional Class | | $ | 643,762,207 | |
Shares outstanding – Institutional Class1 | | | 67,026,798 | |
Net asset value per share – Institutional Class | | | $9.60 | |
| 1 | The Fund has an unlimited number of authorized shares. |
| 2 | Maximum offering price is computed as 100/98 of net asset value. On investments of $50,000 or more, the offering price is reduced. |
The accompanying notes are an integral part of these financial statements.
Wells Fargo Ultra Short-Term Municipal Income Fund | 31
Statement of operations—year ended June 30, 2019
| | | | |
| | | | |
| |
Investment income | | | | |
Interest | | $ | 50,569,822 | |
Income from affiliated securities | | | 398,710 | |
| | | | |
Total investment income | | | 50,968,532 | |
| | | | |
| |
Expenses | | | | |
Management fee | | | 8,696,635 | |
Administration fees | |
Class A | | | 896,742 | |
Class C | | | 24,344 | |
Class R6 | | | 159,555 | 1 |
Administrator Class | | | 36,486 | |
Institutional Class | | | 1,164,129 | |
Shareholder servicing fees | |
Class A | | | 1,401,159 | |
Class C | | | 38,038 | |
Administrator Class | | | 90,670 | |
Distribution fee | |
Class C | | | 114,114 | |
Custody and accounting fees | | | 201,523 | |
Professional fees | | | 48,473 | |
Registration fees | | | 107,724 | |
Shareholder report expenses | | | 99,650 | |
Trustees’ fees and expenses | | | 22,142 | |
Other fees and expenses | | | 86,755 | |
| | | | |
Total expenses | | | 13,188,139 | |
Less: Fee waivers and/or expense reimbursements | | | (1,912,081 | ) |
| | | | |
Net expenses | | | 11,276,058 | |
| | | | |
Net investment income | | | 39,692,474 | |
| | | | |
| |
Realized and unrealized gains (losses) on investments | | | | |
Net realized losses on: | |
Unaffiliated securities | | | (429,622 | ) |
Affiliated securities | | | (43,035 | ) |
| | | | |
Net realized losses on investments | | | (472,657 | ) |
Net change in unrealized gains (losses) on investments | | | 8,239,186 | |
| | | | |
Net realized and unrealized gains (losses) on investments | | | 7,766,529 | |
| | | | |
Net increase in net assets resulting from operations | | $ | 47,459,003 | |
| | | | |
| 1 | For the period from July 31, 2018 (commencement of class operations) to June 30, 2019 |
The accompanying notes are an integral part of these financial statements.
32 | Wells Fargo Ultra Short-Term Municipal Income Fund
Statement of changes in net assets
| | | | | | | | | | | | | | | | |
| | | Year ended
June 30, 2019 | | | Year ended
June 30, 2018¹ | |
| |
Operations | | | | | |
Net investment income | | | | | | $ | 39,692,474 | | | | | | | $ | 45,974,475 | |
Net realized losses on investments | | | | | | | (472,657 | ) | | | | | | | (18,767,051 | ) |
Net change in unrealized gains (losses) on investments | | | | | | | 8,239,186 | | | | | | | | 15,359,294 | |
| | | | |
Net increase in net assets resulting from operations | | | | | | | 47,459,003 | | | | | | | | 42,566,718 | |
| | | | |
| | | |
Distributions to shareholders from net investment income and net realized gains | | | | | | | | | | | | |
Class A | | | | | | | (7,184,383 | ) | | | | | | | (7,085,882 | ) |
Class C | | | | | | | (81,918 | ) | | | | | | | (29,395 | ) |
Class R6 | | | | | | | (9,194,218 | )² | | | | | | | N/A | |
Administrator Class | | | | | | | (489,384 | ) | | | | | | | (10,119,588 | ) |
Institutional Class | | | | | | | (22,722,426 | ) | | | | | | | (28,738,290 | ) |
| | | | |
Total distributions to shareholders | | | | | | | (39,672,329 | ) | | | | | | | (45,973,155 | ) |
| | | | |
| | | | |
Capital share transactions | | | Shares | | | | | | | | Shares | | | | | |
Proceeds from shares sold | |
Class A | | | 5,347,278 | | | | 51,171,356 | | | | 20,676,172 | | | | 197,898,705 | |
Class C | | | 391,712 | | | | 3,675,907 | | | | 46,196 | | | | 434,035 | |
Class R6 | | | 172,266,423 | 2 | | | 1,647,488,263 | 2 | | | N/A | | | | N/A | |
Administrator Class | | | 951,130 | | | | 9,106,545 | | | | 180,310,370 | | | | 1,725,053,645 | |
Institutional Class | | | 124,072,823 | | | | 1,187,607,605 | | | | 236,575,489 | | | | 2,265,282,906 | |
| | | | |
| | | | | | | 2,899,049,676 | | | | | | | | 4,188,669,291 | |
| | | | |
Reinvestment of distributions | |
Class A | | | 715,680 | | | | 6,852,879 | | | | 714,776 | | | | 6,840,532 | |
Class C | | | 7,174 | | | | 67,438 | | | | 2,611 | | | | 24,514 | |
Class R6 | | | 12,244 | 2 | | | 117,351 | 2 | | | N/A | | | | N/A | |
Administrator Class | | | 49,856 | | | | 477,408 | | | | 1,054,198 | | | | 10,092,519 | |
Institutional Class | | | 1,731,479 | | | | 16,580,749 | | | | 1,693,421 | | | | 16,209,226 | |
| | | | |
| | | | | | | 24,095,825 | | | | | | | | 33,166,791 | |
| | | | |
Payment for shares redeemed | |
Class A | | | (33,178,529 | ) | | | (317,470,659 | ) | | | (49,417,914 | ) | | | (473,112,170 | ) |
Class C | | | (1,149,710 | ) | | | (10,810,966 | ) | | | (738,395 | ) | | | (6,941,123 | ) |
Class R6 | | | (92,024,143 | )2 | | | (881,492,500 | )2 | | | N/A | | | | N/A | |
Administrator Class | | | (3,945,902 | ) | | | (37,776,949 | ) | | | (379,152,798 | ) | | | (3,626,561,750 | ) |
Institutional Class | | | (282,486,053 | ) | | | (2,703,286,719 | ) | | | (297,934,058 | ) | | | (2,852,291,197 | ) |
| | | | |
| | | | | | | (3,950,837,793 | ) | | | | | | | (6,958,906,240 | ) |
| | | | |
Net decrease in net assets resulting from capital share transactions | | | | | | �� | (1,027,692,292 | ) | | | | | | | (2,737,070,158 | ) |
| | | | |
Total decrease in net assets | | | | | | | (1,019,905,618 | ) | | | | | | | (2,740,476,595 | ) |
| | | | |
| | |
Net assets | | | | | | | | |
Beginning of period | | | | | | | 2,914,666,805 | | | | | | | | 5,655,143,400 | |
| | | | |
End of period | | | | | | $ | 1,894,761,187 | | | | | | | $ | 2,914,666,805 | |
| | | | |
| 1 | Effective for all filings after November 4, 2018, the SEC prospectively eliminated the requirement to parenthetically disclose undistributed net investment income at the end of the period and permitted the aggregation of distributions, with the exception of tax basis returns of capital. Overdistributed net investment income at June 30, 2018 was $484,384. The disaggregated distributions information for the year ended June 30, 2018 is included in Note 7,Distributions to Shareholders,in the notes to the financial statements. |
| 2 | For the period from July 31, 2018 (commencement of class operations) to June 30, 2019 |
The accompanying notes are an integral part of these financial statements.
Wells Fargo Ultra Short-Term Municipal Income Fund | 33
Financial highlights
(For a share outstanding throughout each period)
| | | | | | | | | | | | | | | | | | | | |
| | | Year ended June 30 | |
| CLASS A | | 2019 | | | 2018 | | | 2017 | | | 2016 | | | 20151 | |
Net asset value, beginning of period | | | $9.57 | | | | $9.57 | | | | $9.63 | | | | $9.61 | | | | $9.64 | |
Net investment income | | | 0.12 | 2 | | | 0.08 | | | | 0.06 | | | | 0.04 | | | | 0.02 | |
Net realized and unrealized gains (losses) on investments | | | 0.03 | | | | 0.00 | 3 | | | (0.06 | ) | | | 0.02 | | | | (0.03 | ) |
| | | | | | | | | | | | | | | | | | | | |
Total from investment operations | | | 0.15 | | | | 0.08 | | | | 0.00 | | | | 0.06 | | | | (0.01 | ) |
Distributions to shareholders from | | | | | | | | | | | | | | | | | | | | |
Net investment income | | | (0.12 | ) | | | (0.08 | ) | | | (0.06 | ) | | | (0.04 | ) | | | (0.02 | ) |
Net realized gains | | | 0.00 | | | | 0.00 | | | | (0.00 | )3 | | | (0.00 | )3 | | | (0.00 | )3 |
| | | | | | | | | | | | | | | | | | | | |
Total distributions to shareholders | | | (0.12 | ) | | | (0.08 | ) | | | (0.06 | ) | | | (0.04 | ) | | | (0.02 | ) |
Net asset value, end of period | | | $9.60 | | | | $9.57 | | | | $9.57 | | | | $9.63 | | | | $9.61 | |
Total return4 | | | 1.63 | % | | | 0.88 | % | | | (0.04 | )% | | | 0.61 | % | | | (0.07 | )% |
Ratios to average net assets (annualized) | | | | | | | | | | | | | | | | | | | | |
Gross expenses | | | 0.77 | % | | | 0.77 | % | | | 0.75 | % | | | 0.75 | % | | | 0.75 | % |
Net expenses | | | 0.67 | % | | | 0.67 | % | | | 0.67 | % | | | 0.67 | % | | | 0.67 | % |
Net investment income | | | 1.28 | % | | | 0.86 | % | | | 0.57 | % | | | 0.38 | % | | | 0.23 | % |
Supplemental data | | | | | | | | | | | | | | | | | | | | |
Portfolio turnover rate | | | 55 | % | | | 50 | % | | | 56 | % | | | 41 | % | | | 44 | % |
Net assets, end of period (000s omitted) | | | $444,581 | | | | $702,570 | | | | $971,189 | | | | $1,209,818 | | | | $961,485 | |
| 1 | Aone-for-two share split took place after the close of business on June 12, 2015 for all classes of the Fund. The per share information has been adjusted to give effect to this transaction. |
| 2 | Calculated based upon average shares outstanding |
| 3 | Amount is less than $0.005. |
| 4 | Total return calculations do not include any sales charges. |
The accompanying notes are an integral part of these financial statements.
34 | Wells Fargo Ultra Short-Term Municipal Income Fund
Financial highlights
(For a share outstanding throughout each period)
| | | | | | | | | | | | | | | | | | | | |
| | | Year ended June 30 | |
| CLASS C | | 2019 | | | 2018 | | | 2017 | | | 2016 | | | 20151 | |
Net asset value, beginning of period | | | $9.40 | | | | $9.40 | | | | $9.47 | | | | $9.49 | | | | $9.58 | |
Net investment income (loss) | | | 0.05 | 2 | | | 0.01 | 2 | | | (0.02 | )2 | | | (0.04 | )2 | | | (0.11 | ) |
Net realized and unrealized gains (losses) on investments | | | 0.03 | | | | 0.00 | 3 | | | (0.05 | ) | | | 0.02 | | | | 0.02 | |
| | | | | | | | | | | | | | | | | | | | |
Total from investment operations | | | 0.08 | | | | 0.01 | | | | (0.07 | ) | | | (0.02 | ) | | | (0.09 | ) |
Distributions to shareholders from | | | | | | | | | | | | | | | | | | | | |
Net investment income | | | (0.05 | ) | | | (0.01 | ) | | | (0.00 | )3 | | | 0.00 | | | | 0.00 | |
Net realized gains | | | 0.00 | | | | 0.00 | | | | (0.00 | )3 | | | (0.00 | )3 | | | (0.00 | )3 |
| | | | | | | | | | | | | | | | | | | | |
Total distributions to shareholders | | | (0.05 | ) | | | (0.01 | ) | | | (0.00 | )3 | | | (0.00 | )3 | | | (0.00 | )3 |
Net asset value, end of period | | | $9.43 | | | | $9.40 | | | | $9.40 | | | | $9.47 | | | | $9.49 | |
Total return4 | | | 0.87 | % | | | 0.16 | % | | | (0.73 | )% | | | (0.19 | )% | | | (0.93 | )% |
Ratios to average net assets (annualized) | | | | | | | | | | | | | | | | | | | | |
Gross expenses | | | 1.52 | % | | | 1.52 | % | | | 1.50 | % | | | 1.50 | % | | | 1.50 | % |
Net expenses | | | 1.42 | % | | | 1.42 | % | | | 1.42 | % | | | 1.42 | % | | | 1.42 | % |
Net investment income (loss) | | | 0.54 | % | | | 0.11 | % | | | (0.18 | )% | | | (0.37 | )% | | | (0.52 | )% |
Supplemental data | | | | | | | | | | | | | | | | | | | | |
Portfolio turnover rate | | | 55 | % | | | 50 | % | | | 56 | % | | | 41 | % | | | 44 | % |
Net assets, end of period (000s omitted) | | | $10,135 | | | | $17,154 | | | | $23,650 | | | | $31,837 | | | | $42,289 | |
| 1 | Aone-for-two share split took place after the close of business on June 12, 2015 for all classes of the Fund. The per share information has been adjusted to give effect to this transaction. |
| 2 | Calculated based upon average shares outstanding |
| 3 | Amount is less than $0.005. |
| 4 | Total return calculations do not include any sales charges. |
The accompanying notes are an integral part of these financial statements.
Wells Fargo Ultra Short-Term Municipal Income Fund | 35
Financial highlights
(For a share outstanding throughout each period)
| | | | |
| | | Year ended | |
| CLASS R6 | | June 30, 20191 | |
Net asset value, beginning of period | | | $9.58 | |
Net investment income | | | 0.15 | 2 |
Net realized and unrealized gains (losses) on investments | | | 0.02 | |
| | | | |
Total from investment operations | | | 0.17 | |
Distributions to shareholders from | | | | |
Net investment income | | | (0.15 | ) |
Net asset value, end of period | | | $9.60 | |
Total return3 | | | 1.76 | % |
Ratios to average net assets (annualized) | | | | |
Gross expenses | | | 0.39 | % |
Net expenses | | | 0.32 | % |
Net investment income | | | 1.73 | % |
Supplemental data | | | | |
Portfolio turnover rate | | | 55 | % |
Net assets, end of period (000s omitted) | | | $770,634 | |
| 1 | For the period from July 31, 2018 (commencement of class operations) to June 30, 2019 |
| 2 | Calculated based upon average shares outstanding |
| 3 | Returns for periods of less than one year are not annualized. |
The accompanying notes are an integral part of these financial statements.
36 | Wells Fargo Ultra Short-Term Municipal Income Fund
Financial highlights
(For a share outstanding throughout each period)
| | | | | | | | | | | | | | | | | | | | |
| | | Year ended June 30 | |
| ADMINISTRATOR CLASS | | 2019 | | | 2018 | | | 2017 | | | 2016 | | | 20151 | |
Net asset value, beginning of period | | | $9.57 | | | | $9.57 | | | | $9.63 | | | | $9.61 | | | | $9.64 | |
Net investment income | | | 0.13 | 2 | | | 0.08 | 2 | | | 0.06 | | | | 0.04 | | | | 0.03 | |
Net realized and unrealized gains (losses) on investments | | | 0.03 | | | | 0.01 | | | | (0.06 | ) | | | 0.02 | | | | (0.03 | ) |
| | | | | | | | | | | | | | | | | | | | |
Total from investment operations | | | 0.16 | | | | 0.09 | | | | 0.00 | | | | 0.06 | | | | 0.00 | |
Distributions to shareholders from | | | | | | | | | | | | | | | | | | | | |
Net investment income | | | (0.13 | ) | | | (0.09 | ) | | | (0.06 | ) | | | (0.04 | ) | | | (0.03 | ) |
Net realized gains | | | 0.00 | | | | 0.00 | | | | (0.00 | )3 | | | (0.00 | )3 | | | (0.00 | )3 |
| | | | | | | | | | | | | | | | | | | | |
Total distributions to shareholders | | | (0.13 | ) | | | (0.09 | ) | | | (0.06 | ) | | | (0.04 | ) | | | (0.03 | ) |
Net asset value, end of period | | | $9.60 | | | | $9.57 | | | | $9.57 | | | | $9.63 | | | | $9.61 | |
Total return | | | 1.70 | % | | | 0.95 | % | | | 0.03 | % | | | 0.68 | % | | | 0.00 | % |
Ratios to average net assets (annualized) | | | | | | | | | | | | | | | | | | | | |
Gross expenses | | | 0.70 | % | | | 0.70 | % | | | 0.70 | % | | | 0.68 | % | | | 0.69 | % |
Net expenses | | | 0.60 | % | | | 0.60 | % | | | 0.60 | % | | | 0.60 | % | | | 0.60 | % |
Net investment income | | | 1.34 | % | | | 0.82 | % | | | 0.69 | % | | | 0.45 | % | | | 0.30 | % |
Supplemental data | | | | | | | | | | | | | | | | | | | | |
Portfolio turnover rate | | | 55 | % | | | 50 | % | | | 56 | % | | | 41 | % | | | 44 | % |
Net assets, end of period (000s omitted) | | | $25,649 | | | | $53,746 | | | | $1,946,987 | | | | $226,125 | | | | $328,134 | |
| 1 | Aone-for-two share split took place after the close of business on June 12, 2015 for all classes of the Fund. The per share information has been adjusted to give effect to this transaction. |
| 2 | Calculated based upon average shares outstanding |
| 3 | Amount is less than $0.005. |
The accompanying notes are an integral part of these financial statements.
Wells Fargo Ultra Short-Term Municipal Income Fund | 37
Financial highlights
(For a share outstanding throughout each period)
| | | | | | | | | | | | | | | | | | | | |
| | | Year ended June 30 | |
| INSTITUTIONAL CLASS | | 2019 | | | 2018 | | | 2017 | | | 2016 | | | 20151 | |
Net asset value, beginning of period | | | $9.57 | | | | $9.58 | | | | $9.63 | | | | $9.61 | | | | $9.64 | |
Net investment income | | | 0.15 | 2 | | | 0.11 | | | | 0.08 | 2 | | | 0.07 | | | | 0.05 | |
Net realized and unrealized gains (losses) on investments | | | 0.03 | | | | (0.01 | ) | | | (0.05 | ) | | | 0.02 | | | | (0.03 | ) |
| | | | | | | | | | | | | | | | | | | | |
Total from investment operations | | | 0.18 | | | | 0.10 | | | | 0.03 | | | | 0.09 | | | | 0.02 | |
Distributions to shareholders from | | | | | | | | | | | | | | | | | | | | |
Net investment income | | | (0.15 | ) | | | (0.11 | ) | | | (0.08 | ) | | | (0.07 | ) | | | (0.05 | ) |
Net realized gains | | | 0.00 | | | | 0.00 | | | | (0.00 | )3 | | | (0.00 | )3 | | | (0.00 | )3 |
| | | | | | | | | | | | | | | | | | | | |
Total distributions to shareholders | | | (0.15 | ) | | | (0.11 | ) | | | (0.08 | ) | | | (0.07 | ) | | | (0.05 | ) |
Net asset value, end of period | | | $9.60 | | | | $9.57 | | | | $9.58 | | | | $9.63 | | | | $9.61 | |
Total return | | | 1.93 | % | | | 1.07 | % | | | 0.36 | % | | | 0.91 | % | | | 0.23 | % |
Ratios to average net assets (annualized) | | | | | | | | | | | | | | | | | | | | |
Gross expenses | | | 0.44 | % | | | 0.44 | % | | | 0.42 | % | | | 0.42 | % | | | 0.42 | % |
Net expenses | | | 0.37 | % | | | 0.37 | % | | | 0.37 | % | | | 0.37 | % | | | 0.37 | % |
Net investment income | | | 1.56 | % | | | 1.16 | % | | | 0.86 | % | | | 0.68 | % | | | 0.54 | % |
Supplemental data | | | | | | | | | | | | | | | | | | | | |
Portfolio turnover rate | | | 55 | % | | | 50 | % | | | 56 | % | | | 41 | % | | | 44 | % |
Net assets, end of period (000s omitted) | | | $643,762 | | | | $2,141,197 | | | | $2,713,317 | | | | $4,061,647 | | | | $3,930,234 | |
| 1 | Aone-for-two share split took place after the close of business on June 12, 2015 for all classes of the Fund. The per share information has been adjusted to give effect to this transaction. |
| 2 | Calculated based upon average shares outstanding |
| 3 | Amount is less than $0.005. |
The accompanying notes are an integral part of these financial statements.
38 | Wells Fargo Ultra Short-Term Municipal Income Fund
Notes to financial statements
1. ORGANIZATION
Wells Fargo Funds Trust (the “Trust”), a Delaware statutory trust organized on March 10, 1999, is anopen-end management investment company registered under the Investment Company Act of 1940, as amended (the “1940 Act”). As an investment company, the Trust follows the accounting and reporting guidance in Financial Accounting Standards Board (“FASB”)Accounting Standards Codification Topic 946, Financial Services – Investment Companies. These financial statements report on the Wells Fargo Ultra Short-Term Municipal Income Fund (the “Fund”) which is a diversified series of the Trust.
2. SIGNIFICANT ACCOUNTING POLICIES
The following significant accounting policies, which are consistently followed in the preparation of the financial statements of the Fund, are in conformity with U.S. generally accepted accounting principles which require management to make estimates and assumptions that affect the reported amounts of assets and liabilities, disclosure of contingent assets and liabilities at the date of the financial statements, and the reported amounts of revenues and expenses during the reporting period. Actual results could differ from those estimates.
Securities valuation
All investments are valued each business day as of the close of regular trading on the New York Stock Exchange (generally 4 p.m. Eastern Time), although the Fund may deviate from this calculation time under unusual or unexpected circumstances.
Debt securities are valued at the evaluated bid price provided by an independent pricing service (e.g. taking into account various factors, including yields, maturities, or credit ratings) or, if a reliable price is not available, the quoted bid price from an independent broker-dealer.
Investments in registeredopen-end investment companies are valued at net asset value.
Investments which are not valued using any of the methods discussed above are valued at their fair value, as determined in good faith by the Board of Trustees of the Fund. The Board of Trustees has established a Valuation Committee comprised of the Trustees and has delegated to it the authority to take any actions regarding the valuation of portfolio securities that the Valuation Committee deems necessary or appropriate, including determining the fair value of portfolio securities, unless the determination has been delegated to the Wells Fargo Asset Management Pricing Committee at Wells Fargo Funds Management, LLC (“Funds Management”). The Board of Trustees retains the authority to make or ratify any valuation decisions or approve any changes to the Valuation Procedures as it deems appropriate. On a quarterly basis, the Board of Trustees receives reports on any valuation actions taken by the Valuation Committee or the Wells Fargo Asset Management Pricing Committee which may include items for ratification.
When-issued transactions
The Fund may purchase securities on a forward commitment or when-issued basis. The Fund records a when-issued transaction on the trade date and will segregate assets in an amount at least equal in value to the Fund’s commitment to purchase when-issued securities. Securities purchased on a when-issued basis aremarked-to-market daily and the Fund begins earning interest on the settlement date. Losses may arise due to changes in the market value of the underlying securities or if the counterparty does not perform under the contract.
Security transactions and income recognition
Securities transactions are recorded on a trade date basis. Realized gains or losses are recorded on the basis of identified cost.
Interest income is accrued daily and bond discounts are accreted and premiums are amortized daily. To the extent debt obligations are placed onnon-accrual status, any related interest income may be reduced by writing off interest receivables when the collection of all or a portion of interest has been determined to be doubtful based on consistently applied procedures and the fair value has decreased. If the issuer subsequently resumes interest payments or when the collectability of interest is reasonably assured, the debt obligation is removed fromnon-accrual status.
Distributions to shareholders
Distributions to shareholders from net investment income are declared daily and paid monthly. Distributions from net realized gains, if any, are recorded on theex-dividend date and paid at least annually. Such distributions are determined in accordance with income tax regulations and may differ from U.S. generally accepted accounting principles. Dividend sources are estimated at the time of declaration. The tax character of distributions is determined as of the Fund’s fiscal year end. Therefore, a portion of the Fund’s distributions made prior to the Fund’s fiscal year end may be categorized as a tax return of capital at year end.
Federal and other taxes
The Fund intends to continue to qualify as a regulated investment company by distributing substantially all of its investment company taxable andtax-exempt income and any net realized capital gains (after reduction for capital loss carryforwards) sufficient to relieve it from all, or substantially all, federal income taxes. Accordingly, no provision for federal income taxes was required.
Wells Fargo Ultra Short-Term Municipal Income Fund | 39
Notes to financial statements
The Fund’s income and federal excise tax returns and all financial records supporting those returns for the prior three fiscal years are subject to examination by the federal and Delaware revenue authorities. Management has analyzed the Fund’s tax positions taken on federal, state, and foreign tax returns for all open tax years and does not believe that there are any uncertain tax positions that require recognition of a tax liability.
As of June 30, 2019, the aggregate cost of all investments for federal income tax purposes was $1,918,267,441 and the unrealized gains (losses) consisted of:
| | | | |
| |
Gross unrealized gains | | $ | 7,172,593 | |
| |
Gross unrealized losses | | | (557,627 | ) |
| |
Net unrealized gains | | $ | 6,614,966 | |
As of June 30, 2019, the Fund had capital loss carryforwards which consist of $2,919,850 in short-term capital losses and $23,588,856 in long-term capital losses.
Class allocations
The separate classes of shares offered by the Fund differ principally in applicable sales charges, distribution, shareholder servicing, and administration fees. Class specific expenses are charged directly to that share class. Investment income, common fund-level expenses, and realized and unrealized gains (losses) on investments are allocated daily to each class of shares based on the relative proportion of net assets of each class.
3. FAIR VALUATION MEASUREMENTS
Fair value measurements of investments are determined within a framework that has established a fair value hierarchy based upon the various data inputs utilized in determining the value of the Fund’s investments. The three-level hierarchy gives the highest priority to unadjusted quoted prices in active markets for identical assets or liabilities (Level 1) and the lowest priority to unobservable inputs (Level 3). The Fund’s investments are classified within the fair value hierarchy based on the lowest level of input that is significant to the fair value measurement. The inputs are summarized into three broad levels as follows:
| ∎ | | Level 1 – quoted prices in active markets for identical securities |
| ∎ | | Level 2 – other significant observable inputs (including quoted prices for similar securities, interest rates, prepayment speeds, credit risk, etc.) |
| ∎ | | Level 3 – significant unobservable inputs (including the Fund’s own assumptions in determining the fair value of investments) |
The inputs or methodologies used for valuing investments in securities are not necessarily an indication of the risk associated with investing in those securities.
The following is a summary of the inputs used in valuing the Fund’s assets and liabilities as of June 30, 2019:
| | | | | | | | | | | | | | | | |
| | | | |
| | | Quoted prices
(Level 1) | | | Other significant
observable inputs
(Level 2) | | | Significant
unobservable inputs (Level 3) | | | Total | |
| | | | |
Assets | | | | | | | | | | | | | | | | |
Investments in: | | | | | | | | | | | | | | | | |
| | | | |
Municipal obligations | | $ | 0 | | | $ | 1,891,210,949 | | | $ | 0 | | | $ | 1,891,210,949 | |
| | | | |
Closed end municipal bond funds | | | 0 | | | | 29,200,000 | | | | 0 | | | | 29,200,000 | |
| | | | |
Short-term investments | | | | | | | | | | | | | | | | |
| | | | |
Investment companies | | | 4,471,458 | | | | 0 | | | | 0 | | | | 4,471,458 | |
| | | | |
Total assets | | $ | 4,471,458 | | | $ | 1,920,410,949 | | | $ | 0 | | | $ | 1,924,882,407 | |
Additional sector, industry or geographic detail is included in the Portfolio of Investments.
At June 30, 2019, the Fund did not have any transfers into/out of Level 3.
40 | Wells Fargo Ultra Short-Term Municipal Income Fund
Notes to financial statements
4. TRANSACTIONS WITH AFFILIATES
Management fee
Funds Management, an indirect wholly owned subsidiary of Wells Fargo & Company (“Wells Fargo”), is the manager of the Fund and provides advisory and fund-level administrative services under an investment management agreement. Under the investment management agreement, Funds Management is responsible for, among other services, implementing the investment objectives and strategies of the Fund, supervising the subadviser and providing fund-level administrative services in connection with the Fund’s operations. As compensation for its services under the investment management agreement, Funds Management is entitled to receive a management fee at the following annual rate based on the Fund’s average daily net assets:
| | | | |
| |
| Average daily net assets | | Management fee | |
| |
First $1 billion | | | 0.350 | % |
| |
Next $4 billion | | | 0.325 | |
| |
Next $3 billion | | | 0.290 | |
| |
Next $2 billion | | | 0.265 | |
| |
Over $10 billion | | | 0.255 | |
For the year ended June 30, 2019, the management fee was equivalent to an annual rate of 0.33% of the Fund’s average daily net assets.
Funds Management has retained the services of a subadviser to provide daily portfolio management to the Fund. The fee for subadvisory services is borne by Funds Management. Wells Capital Management Incorporated, an affiliate of Funds Management and an indirect wholly owned subsidiary of Wells Fargo, is the subadviser to the Fund and is entitled to receive a fee from Funds Management at an annual rate starting at 0.15% and declining to 0.05% as the average daily net assets of the Fund increase.
Administration fees
Under a class-level administration agreement, Funds Management provides class-level administrative services to the Fund, which includes paying fees and expenses for services provided by the transfer agent,sub-transfer agents, omnibus account servicers and record-keepers. As compensation for its services under the class-level administration agreement, Funds Management receives an annual fee which is calculated based on the average daily net assets of each class as follows:
| | | | |
| |
| | | Class-level
administration fee | |
| |
Class A, Class C | | | 0.16 | % |
| |
Class R6 | | | 0.03 | |
| |
Administrator Class | | | 0.10 | |
| |
Institutional Class | | | 0.08 | |
Funds Management has contractually waived and/or reimbursed management and administration fees to the extent necessary to maintain certain net operating expense ratios for the Fund. When each class of the Fund has exceeded its expense cap, Funds Management has waived fees and/or reimbursed expenses from fund-level expenses on a proportionate basis and then from class specific expenses. When only certain classes exceed their expense caps, waivers and/or reimbursements are applied against class specific expenses before fund-level expenses. Funds Management has committed through October 31, 2019 to waive fees and/or reimburse expenses to the extent necessary to cap the Fund’s expenses at 0.67% for Class A shares, 1.42% for Class C shares, 0.32% for Class R6 shares, and 0.60% for Administrator Class shares, and 0.37% for Institutional Class shares. Prior to or after the commitment expiration date, the cap may be increased or the commitment to maintain the cap may be terminated only with the approval of the Board of Trustees.
Distribution fee
The Trust has adopted a distribution plan for Class C shares of the Fund pursuant to Rule12b-1 under the 1940 Act. A distribution fee is charged to Class C shares and paid to Wells Fargo Funds Distributor, LLC (“Funds Distributor”), the principal underwriter, at an annual rate of 0.75% of the average daily net assets of Class C shares.
In addition, Funds Distributor is entitled to receive thefront-end sales charge from the purchase of Class A shares and a contingent deferred sales charge on the redemption of certain Class A shares. Funds Distributor is also entitled to receive the contingent deferred sales charges from redemptions of Class C shares. For the year ended June 30, 2019, Funds Distributor received $1,942 from the sale of Class A shares. No contingent deferred sales charges were incurred by Class A and Class C shares for the year ended June 30, 2019.
Wells Fargo Ultra Short-Term Municipal Income Fund | 41
Notes to financial statements
Shareholder servicing fees
The Trust has entered into contracts with one or more shareholder servicing agents, whereby Class A, Class C, and Administrator Class of the Fund are charged a fee at an annual rate of 0.25% of the average daily net assets of each respective class. A portion of these total shareholder servicing fees were paid to affiliates of Wells Fargo.
Interfund transactions
The Fund may purchase or sell portfolio investment securities to certain other Wells Fargo affiliates pursuant to Rule17a-7 under the 1940 Act and under procedures adopted by the Board of Trustees. The procedures have been designed to ensure that these interfund transactions, which do not incur broker commissions, are effected at current market prices. Pursuant to these procedures, the Fund had $338,580,000 and $705,880,000 in interfund purchases and sales, respectively, during the year ended June 30, 2019.
5. INVESTMENT PORTFOLIO TRANSACTIONS
Purchases and sales of investments, excluding U.S. government obligations (if any) and short-term securities, for the year ended June 30, 2019 were $1,199,511,476 and $1,281,540,850, respectively.
6. BANK BORROWINGS
The Trust (excluding the money market funds), Wells Fargo Master Trust and Wells Fargo Variable Trust are parties to a $280,000,000 revolving credit agreement whereby the Fund is permitted to use bank borrowings for temporary or emergency purposes, such as to fund shareholder redemption requests. Interest under the credit agreement is charged to the Fund based on a borrowing rate equal to the higher of the Federal Funds rate in effect on that day plus 1.25% or the overnight LIBOR rate in effect on that day plus 1.25%. In addition, an annual commitment fee equal to 0.25% of the unused balance is allocated to each participating fund.
For the year ended June 30, 2019, there were no borrowings by the Fund under the agreement.
7. DISTRIBUTIONS TO SHAREHOLDERS
The tax character of distributions paid was $39,672,329 and $45,973,155 oftax-exempt income for the years ended June 30, 2019 and June 30, 2018, respectively.
As of June 30, 2019, the components of distributable earnings on a tax basis were as follows:
| | | | |
Undistributed tax-exempt income | | Unrealized gains | | Capital loss carryforward |
| | |
| $698,174 | | $6,614,966 | | $(26,508,706) |
Effective for all filings after November 4, 2018, the Securities and Exchange Commission eliminated the requirement to separately state the components of distributions to shareholders under U.S. generally accepted accounting principles. The amounts of distributions to shareholders for the year ended June 30, 2018 were as follows:
| | | | |
| |
| | | Net investment
income | |
| |
Class A | | $ | 7,085,882 | |
| |
Class C | | | 29,395 | |
| |
Administrator Class | | | 10,119,588 | |
| |
Institutional Class | | | 28,738,290 | |
8. INDEMNIFICATION
Under the Trust’s organizational documents, the officers and Trustees have been granted certain indemnification rights against certain liabilities that may arise out of performance of their duties to the Trust. Additionally, in the normal course of business, the Trust may enter into contracts with service providers that contain a variety of indemnification clauses. The Trust’s maximum exposure under these arrangements is dependent on future claims that may be made against the Fund and, therefore, cannot be estimated.
42 | Wells Fargo Ultra Short-Term Municipal Income Fund
Notes to financial statements
9. REDEMPTIONSIN-KIND
During the year ended June 30, 2018, the Fund redeemed assets throughin-kind redemptions. These transactions are reflected on the Statement of Changes in Net Assets. The date of the redemption transaction, value of securities issued from the redemption, cash paid, realized gains (losses) and the percentage of the Fund redeemed by the shareholder in the Administrator Class was as follows:
| | | | | | | | | | | | | | | | |
| | | | |
| Date | | Value of
securities issued | | | Cash | | | Realized losses | | | % of Fund | |
| | | | |
| 2-2-2018 | | | $579,567,077 | | | | $20,646,313 | | | | $(907,398 | ) | | | 13 | % |
| | | | |
| 2-9-2018 | | | 404,757,400 | | | | 13,121,572 | | | | (645,597 | ) | | | 10 | |
10. NEW ACCOUNTING PRONOUNCEMENTS
In August 2018, FASB issued Accounting Standards Update (“ASU”)No. 2018-13, Fair Value Measurement (Topic 820)Disclosure Framework—Changes to the Disclosure Requirements for Fair Value Measurement. ASU2018-13 updates the disclosure requirements for fair value measurements by modifying or removing certain disclosures and adding certain new disclosures. The amendments are effective for fiscal years, and interim periods within those fiscal years, beginning after December 15, 2019. Early adoption is permitted. Management has adopted the removal and modification of disclosures early, as permitted, and will adopt the additional new disclosures at the effective date.
In March 2017, FASB issued ASU No. 2017-08,Premium Amortization on Purchased Callable Debt Securities. ASU 2017-08 shortens the amortization period for certain callable debt securities held at a premium and requires the premium to be amortized to the earliest call date. The amendments do not require an accounting change for securities held at a discount and discounts will continue to be accreted to the maturity of the security. ASU 2017-08 is effective for fiscal years beginning after December 15, 2018 and for interim periods within those fiscal years. During the current reporting period, management of the Fund adopted the change in accounting policy which did not have a material impact to the Fund’s financial statements.
Wells Fargo Ultra Short-Term Municipal Income Fund | 43
Report of independent registered public accounting firm
TO THE SHAREHOLDERS OF THE FUND AND BOARD OF TRUSTEES OF WELLS FARGO FUNDS TRUST:
Opinion on the Financial Statements
We have audited the accompanying statement of assets and liabilities of Wells Fargo Ultra Short-Term Municipal Income Fund (the Fund), one of the funds constituting Wells Fargo Funds Trust, including the portfolio of investments, as of June 30, 2019, the related statement of operations for the year then ended, the statements of changes in net assets for each of the years in the two year period then ended, and the related notes (collectively, the financial statements) and the financial highlights for each of the years or periods in the five year period then ended. In our opinion, the financial statements and financial highlights present fairly, in all material respects, the financial position of the Fund as of June 30, 2019, the results of its operations for the year then ended, the changes in its net assets for each of the years in the two year period then ended, and the financial highlights for each of the years or periods in the five year period then ended, in conformity with U.S. generally accepted accounting principles.
Basis for Opinion
These financial statements and financial highlights are the responsibility of the Fund’s management. Our responsibility is to express an opinion on these financial statements and financial highlights based on our audits. We are a public accounting firm registered with the Public Company Accounting Oversight Board (United States) (PCAOB) and are required to be independent with respect to the Fund in accordance with the U.S. federal securities laws and the applicable rules and regulations of the Securities and Exchange Commission and the PCAOB.
We conducted our audits in accordance with the standards of the PCAOB. Those standards require that we plan and perform the audit to obtain reasonable assurance about whether the financial statements and financial highlights are free of material misstatement, whether due to error or fraud. Our audits included performing procedures to assess the risks of material misstatement of the financial statements and financial highlights, whether due to error or fraud, and performing procedures that respond to those risks. Such procedures included examining, on a test basis, evidence regarding the amounts and disclosures in the financial statements and financial highlights. Such procedures also included confirmation of securities owned as of June 30, 2019, by correspondence with the custodian and brokers, or by other appropriate auditing procedures. Our audits also included evaluating the accounting principles used and significant estimates made by management, as well as evaluating the overall presentation of the financial statements and financial highlights. We believe that our audits provide a reasonable basis for our opinion.

We have not been able to determine the specific year that we began serving as the auditor of one or more Wells Fargo Funds investment companies; however we are aware that we have served as the auditor of one or more Wells Fargo Funds investment companies since at least 1955.
Boston, Massachusetts
August 26, 2019
44 | Wells Fargo Ultra Short-Term Municipal Income Fund
Other information (unaudited)
TAX INFORMATION
Pursuant to Section 852 of the Internal Revenue Code, 100% of distributions paid from net investment income is designated as exempt-interest dividends for the fiscal year ended June 30, 2019.
PROXY VOTING INFORMATION
A description of the policies and procedures used to determine how to vote proxies relating to portfolio securities is available, upon request, by calling1-800-222-8222, visiting our website atwfam.com, or visiting the SEC website at sec.gov. Information regarding how the proxies related to portfolio securities were voted during the most recent12-month period ended June 30 is available on the website atwfam.com or by visiting the SEC website at sec.gov.
QUARTERLY PORTFOLIO HOLDINGS INFORMATION
The Fund files its complete schedule of portfolio holdings with the SEC for the first and third quarters of each fiscal year on Form N-Q or FormN-PORT, which is available by visiting the SEC website at sec.gov. Those forms may be reviewed and copied at the SEC’s Public Reference Room in Washington, DC. Information on the operation of the Public Reference Room may be obtained by calling1-800-SEC-0330.
Wells Fargo Ultra Short-Term Municipal Income Fund | 45
Other information (unaudited)
BOARD OF TRUSTEES AND OFFICERS
Each of the Trustees and Officers1 listed in the table below acts in identical capacities for each fund in the Wells Fargo family of funds, which consists of 152 mutual funds comprising the Wells Fargo Funds Trust, Wells Fargo Variable Trust, Wells Fargo Master Trust and fourclosed-end funds (collectively the “Fund Complex”). This table should be read in conjunction with the Prospectus and the Statement of Additional Information2. The mailing address of each Trustee and Officer is 525 Market Street, 12th Floor, San Francisco, CA 94105. Each Trustee and Officer serves an indefinite term, however, each Trustee serves such term until reaching the mandatory retirement age established by the Trustees.
Independent Trustees
| | | | | | |
Name and year of birth | | Position held and length of service* | | Principal occupations during past five years or longer | | Current other
public company or
investment company directorships |
| | | |
William R. Ebsworth (Born 1957) | | Trustee, since 2015 | | Retired. From 1984 to 2013, equities analyst, portfolio manager, research director and chief investment officer at Fidelity Management and Research Company in Boston, Tokyo, and Hong Kong, and retired in 2013 as Chief Investment Officer of Fidelity Strategic Advisers, Inc. where he led a team of investment professionals managing client assets. Prior thereto, Board member of Hong Kong Securities Clearing Co., Hong Kong Options Clearing Corp., the Thailand International Fund, Ltd., Fidelity Investments Life Insurance Company, and Empire Fidelity Investments Life Insurance Company. Audit Committee Chair and Investment Committee Chair of the Vincent Memorial Hospital Endowment(non-profit organization). Mr. Ebsworth is a CFA® charterholder. | | N/A |
| | | |
Jane A. Freeman (Born 1953) | | Trustee, since 2015; Chair Liaison, since 2018 | | Retired. From 2012 to 2014 and 1999 to 2008, Chief Financial Officer of Scientific Learning Corporation. From 2008 to 2012, Ms. Freeman provided consulting services related to strategic business projects. Prior to 1999, Portfolio Manager at Rockefeller & Co. and Scudder, Stevens & Clark. Board member of the Harding Loevner Funds from 1996 to 2014, serving as both Lead Independent Director and chair of the Audit Committee. Board member of the Russell Exchange Traded Funds Trust from 2011 to 2012 and the chair of the Audit Committee. Ms. Freeman is a Board Member of The Ruth Bancroft Garden(non-profit organization). She is also an inactive Chartered Financial Analyst. | | N/A |
| | | |
Isaiah Harris, Jr. (Born 1952) | | Trustee, since 2009; Audit Committee Chairman, since 2019 | | Retired. Chairman of the Board of CIGNA Corporation since 2009, and Director since 2005. From 2003 to 2011, Director of Deluxe Corporation. Prior thereto, President and CEO of BellSouth Advertising and Publishing Corp. from 2005 to 2007, President and CEO of BellSouth Enterprises from 2004 to 2005 and President of BellSouth Consumer Services from 2000 to 2003. Emeritus member of the Iowa State University Foundation Board of Governors. Emeritus Member of the Advisory Board of Iowa State University School of Business. Advisory Board Member, Palm Harbor Academy (private school). Advisory Board Member, Child Evangelism Fellowship(non-profit). Mr. Harris is a certified public accountant (inactive status). | | CIGNA Corporation |
| | | |
Judith M. Johnson (Born 1949) | | Trustee, since 2008; Audit Committee Chairman, from 2009 to 2018 | | Retired. Prior thereto, Chief Executive Officer and Chief Investment Officer of Minneapolis Employees Retirement Fund from 1996 to 2008. Ms. Johnson is an attorney, certified public accountant and a certified managerial accountant. | | N/A |
46 | Wells Fargo Ultra Short-Term Municipal Income Fund
Other information (unaudited)
| | | | | | |
Name and year of birth | | Position held and length of service* | | Principal occupations during past five years or longer | | Current other
public company or
investment company directorships |
| | | |
David F. Larcker (Born 1950) | | Trustee, since 2009 | | James Irvin Miller Professor of Accounting at the Graduate School of Business, Stanford University, Director of the Corporate Governance Research Initiative and Senior Faculty of The Rock Center for Corporate Governance since 2006. From 2005 to 2008, Professor of Accounting at the Graduate School of Business, Stanford University. Prior thereto, Ernst & Young Professor of Accounting at The Wharton School, University of Pennsylvania from 1985 to 2005. | | N/A |
| | | |
Olivia S. Mitchell (Born 1953) | | Trustee, since 2006; Nominating and Governance Committee Chairman, since 2018 | | International Foundation of Employee Benefit Plans Professor, Wharton School of the University of Pennsylvania since 1993. Director of Wharton’s Pension Research Council and Boettner Center on Pensions & Retirement Research, and Research Associate at the National Bureau of Economic Research. Previously, Cornell University Professor from 1978 to 1993. | | N/A |
| | | |
Timothy J. Penny (Born 1951) | | Trustee, since 1996; Chairman, since 2018 | | President and Chief Executive Officer of Southern Minnesota Initiative Foundation, anon-profit organization, since 2007. Member of the Board of Trustees of NorthStar Education Finance, Inc., anon-profit organization, since 2007. | | N/A |
| | | |
James G. Polisson (Born 1959) | | Trustee, since 2018 | | Retired. Chief Marketing Officer, Source (ETF) UK Services, Ltd, from 2015 to 2017. From 2012 to 2015, Principal of The Polisson Group, LLC, a management consulting, corporate advisory and principal investing company. Chief Executive Officer and Managing Director at Russell Investments, Global Exchange Traded Funds from 2010 to 2012. Managing Director of Barclays Global Investors from 1998 to 2010 and Global Chief Marketing Officer for iShares and Barclays Global Investors from 2000 to 2010. Trustee of the San Francisco Mechanics’ Institute, anon-profit organization, from 2013 to 2015. Board member of the Russell Exchange Traded Fund Trust from 2011 to 2012. Director of Barclays Global Investors Holdings Deutschland GmbH from 2006 to 2009. Mr. Polisson is an attorney and has a retired status with the Massachusetts and District of Columbia Bar Associations. | | N/A |
| * | Length of service dates reflect the Trustee’s commencement of service with the Trust’s predecessor entities, where applicable. |
Wells Fargo Ultra Short-Term Municipal Income Fund | 47
Other information (unaudited)
Officers
| | | | |
Name and year of birth | | Position held and
length of service | | Principal occupations during past five years or longer |
| | |
Andrew Owen (Born 1960) | | President, since 2017 | | Executive Vice President of Wells Fargo & Company and Head of Affiliated Managers, Wells Fargo Asset Management, since 2014. In addition, Mr. Owen is currently President, Chief Executive Officer and Director of Wells Fargo Funds Management, LLC since 2017. Prior thereto, Executive Vice President responsible for marketing, investments and product development for Wells Fargo Funds Management, LLC, from 2009 to 2014. |
| | |
Nancy Wiser1 (Born 1967) | | Treasurer, since 2012 | | Executive Vice President of Wells Fargo Funds Management, LLC since 2011. Chief Operating Officer and Chief Compliance Officer at LightBox Capital Management LLC, from 2008 to 2011. |
| | |
Alexander Kymn (Born 1973) | | Secretary and Chief Legal Officer, since 2018 | | Senior Company Counsel of Wells Fargo Bank, N.A. since 2018 (previously Senior Counsel from 2007 to 2018). Vice President of Wells Fargo Funds Management, LLC from 2008 to 2014. |
| | |
Michael H. Whitaker (Born 1967) | | Chief Compliance Officer, since 2016 | | Senior Vice President and Chief Compliance Officer since 2016. Senior Vice President and Chief Compliance Officer for Fidelity Investments from 2007 to 2016. |
| | |
David Berardi (Born 1975) | | Assistant Treasurer, since 2009 | | Vice President of Wells Fargo Funds Management, LLC since 2009. Vice President of Evergreen Investment Management Company, LLC from 2008 to 2010. Manager of Fund Reporting and Control for Evergreen Investment Management Company, LLC from 2004 to 2010. |
| | |
Jeremy DePalma1 (Born 1974) | | Assistant Treasurer, since 2009 | | Senior Vice President of Wells Fargo Funds Management, LLC since 2009. Senior Vice President of Evergreen Investment Management Company, LLC from 2008 to 2010 and head of the Fund Reporting and Control Team within Fund Administration from 2005 to 2010. |
| 1 | Nancy Wiser acts as Treasurer of 65 funds in the Fund Complex. Jeremy DePalma acts as Treasurer of 87 funds and Assistant Treasurer of 65 funds in the Fund Complex. |
| 2 | The Statement of Additional Information includes additional information about the Trustees and is available, without charge, upon request, by calling1-800-222-8222 or by visiting the website atwfam.com. |
48 | Wells Fargo Ultra Short-Term Municipal Income Fund
Other information (unaudited)
BOARD CONSIDERATION OF INVESTMENT MANAGEMENT ANDSUB-ADVISORY AGREEMENTS:
Wells Fargo Ultra Short-Term Municipal Income Fund
Under the Investment Company Act of 1940 (the “1940 Act”), the Board of Trustees (the “Board”) of Wells Fargo Funds Trust (the “Trust”) must determine annually whether to approve the continuation of the Trust’s investment management andsub-advisory agreements. In this regard, at anin-person meeting held on May21-22, 2019 (the “Meeting”), the Board, all the members of which have no direct or indirect interest in the investment management andsub-advisory agreements and are not “interested persons” of the Trust, as defined in the 1940 Act (the “Independent Trustees”), reviewed and approved for Wells Fargo Ultra Short-Term Municipal Income Fund(the “Fund”): (i) an investment management agreement (the “Management Agreement”) with Wells Fargo Funds Management, LLC (“Funds Management”); and (ii) an investmentsub-advisory agreement (the“Sub-Advisory Agreement”) with Wells Capital Management Incorporated (the“Sub-Adviser”), an affiliate of Funds Management. The Management Agreement and theSub-Advisory Agreement are collectively referred to as the “Advisory Agreements.”
At the Meeting, the Board considered the factors and reached the conclusions described below relating to the selection of Funds Management and theSub-Adviser and the approval of the Advisory Agreements. Prior to the Meeting, including at anin-person meeting in April 2019, the Trustees conferred extensively among themselves and with representatives of Funds Management about these matters. Also, the Board has adopted a team-based approach, with each team consisting of asub-set of Trustees, to assist the full Board in the discharge of its duties in reviewing investment performance and other matters throughout the year. The Independent Trustees were assisted in their evaluation of the Advisory Agreements by independent legal counsel, from whom they received separate legal advice and with whom they met separately.
In providing information to the Board, Funds Management and theSub-Adviser were guided by a detailed set of requests for information submitted to them by independent legal counsel on behalf of the Independent Trustees at the start of the Board’s annual contract renewal process earlier in 2019. In considering and approving the Advisory Agreements, the Trustees considered the information they believed relevant, including but not limited to the information discussed below. The Board considered not only the specific information presented in connection with the Meeting, but also the knowledge gained over time through interaction with Funds Management and theSub-Adviser about various topics. In this regard, the Board reviewed reports of Funds Management at each of its quarterly meetings, which included, among other things, portfolio reviews and investment performance reports. In addition, the Board and the teams mentioned above confer with portfolio managers at various times throughout the year. The Board did not identify any particular information or consideration that wasall-important or controlling, and each individual Trustee may have attributed different weights to various factors.
After its deliberations, the Board unanimously approved the continuation of the Advisory Agreements for aone-year term and determined that the compensation payable to Funds Management and theSub-Adviser under each of the Advisory Agreements was reasonable. The Board considered the approval of the Advisory Agreements for the Fund as part of its consideration of agreements for funds across the complex, but its approvals were made on afund-by-fund basis. The following summarizes a number of important, but not necessarily all, factors considered by the Board in support of its approvals.
Nature, extent and quality of services
The Board received and considered various information regarding the nature, extent and quality of services provided to the Fund by Funds Management and theSub-Adviser under the Advisory Agreements. This information included a description of the investment advisory services and Fund-level administrative services covered by the Management Agreement, as well as, among other things, a summary of the background and experience of senior management of Wells Fargo Asset Management (“WFAM”), of which Funds Management and theSub-Adviser are a part, a summary of investments made in the business of WFAM, a summary of certain organizational and personnel changes involving Funds Management and theSub-Adviser, and a description of Funds Management’s and theSub-Adviser’s business continuity planning programs and of their approaches to data privacy and cybersecurity. The Board received and reviewed information about Funds Management’s role as administrator of the Fund’s liquidity risk management program. The Board also considered the qualifications, background, tenure and responsibilities of each of the portfolio managers primarily responsible for theday-to-day portfolio management of the Fund.
The Board evaluated the ability of Funds Management and theSub-Adviser to attract and retain qualified investment professionals, including research, advisory and supervisory personnel. The Board further considered the compliance programs and compliance records of Funds Management and theSub-Adviser. In addition, the Board took into account the full range of services provided to the Fund by Funds Management and its affiliates.
Wells Fargo Ultra Short-Term Municipal Income Fund | 49
Other information (unaudited)
Fund investment performance and expenses
The Board considered the investment performance results for the Fund over various time periods ended December 31, 2018. The Board considered these results in comparison to the investment performance of funds in a universe that was determined by Broadridge Inc. (“Broadridge”) to be similar to the Fund (the “Universe”), and in comparison to the Fund’s benchmark index and to other comparative data. Broadridge is an independent provider of investment company data. The Board received a description of the methodology used by Broadridge to select the mutual funds in the performance Universe. The Board noted that the investment performance of the Fund (Class A) was in range of the average investment performance of the Universe for theone-year period under review, but lower than the average investment performance of the Universe for the three-, five- andten-year periods under review. The Board also noted that the investment performance of the Fund was lower than its benchmark index, the Bloomberg Barclays 1 Year Municipal Bond Index, for theone-, three- and five-year periods under review, but in range of its benchmark for theten-year period under review.
The Board received information concerning, and discussed factors contributing to, the underperformance of the Fund relative to the Universe and benchmark for the periods identified above. The Board took note of the explanations for the relative underperformance during these periods, including with respect to investment decisions and market factors that affected the Fund’s investment performance. The Board also took note of the Fund’s outperformance relative to the Universe and benchmark over the longer time periods under review.
The Board also received and considered information regarding the Fund’s net operating expense ratios and their various components, including actual management fees, custodian and othernon-management fees, and Rule12b-1 andnon-Rule12b-1 shareholder service fees. The Board considered these ratios in comparison to the median ratios of funds in class-specific expense groups that were determined by Broadridge to be similar to the Fund (the “Groups”). The Board received a description of the methodology used by Broadridge to select the mutual funds in the expense Groups and an explanation of how funds comprising expense groups and their expense ratios may vary fromyear-to-year. Based on the Broadridge reports, the Board noted that the net operating expense ratios of the Fund were lower than or equal to the median net operating expense ratios of the expense Groups for each share class.
The Board took into account the Fund’s investment performance and expense information provided to it among the factors considered in deciding tore-approve the Advisory Agreements.
Investment management andsub-advisory fee rates
The Board reviewed and considered the contractual fee rates payable by the Fund to Funds Management under the Management Agreement, as well as the contractual fee rates payable by the Fund to Funds Management for class-level administrative services under a Class-Level Administration Agreement, which include, among other things, class-level transfer agency andsub-transfer agency costs (collectively, the “Management Rates”). The Board also reviewed and considered the contractual investmentsub-advisory fee rates that are payable by Funds Management to theSub-Adviser for investmentsub-advisory services.
Among other information reviewed by the Board was a comparison of the Fund’s Management Rates with the average contractual investment management fee rates of funds in the expense Groups at a common asset level as well as transfer agency costs of the funds in the expense Groups. The Board noted that the Management Rates of the Fund were lower than or in range of the sum of these average rates for the Fund’s expense Groups for all share classes.
The Board also received and considered information about the portion of the total management fee that was retained by Funds Management after payment of the fee to theSub-Adviser forsub-advisory services. In assessing the reasonableness of this amount, the Board received and evaluated information about the nature and extent of responsibilities retained and risks assumed by Funds Management and not delegated to or assumed by theSub-Adviser, and about Funds Management’son-going oversight services. Given the affiliation between Funds Management and theSub-Adviser, the Board ascribed limited relevance to the allocation of fees between them.
The Board also received and considered information about the nature and extent of services offered and fee rates charged by Funds Management and theSub-Adviser to other types of clients with investment strategies similar to those of the Fund. In this regard, the Board received information about the significantly greater scope of services, and compliance, reporting and other legal burdens and risks of managing proprietary mutual funds compared with those associated with managing assets of other types of clients, including third-partysub-advised fund clients andnon-mutual fund clients such as institutional separate accounts.
Based on its consideration of the factors and information it deemed relevant, including those described here, the Board determined that the compensation payable to Funds Management under the Management Agreement and to theSub-Adviser under theSub-Advisory Agreement was reasonable.
50 | Wells Fargo Ultra Short-Term Municipal Income Fund
Other information (unaudited)
Profitability
The Board received and considered information concerning the profitability of Funds Management, as well as the profitability of both WFAM and Wells Fargo & Co. (“Wells Fargo”) from providing services to the fund family as a whole. The Board noted that theSub-Adviser’s profitability information with respect to providing services to the Fund and other funds in the family was subsumed in the WFAM and Wells Fargo profitability analysis.
Funds Management reported on the methodologies and estimates used in calculating profitability, including a description of the methodology used to allocate certain expenses. Among other things, the Board noted that the levels of profitability reported on afund-by-fund basis varied widely, depending on factors such as the size, type and age of fund. Based on its review, the Board did not deem the profits reported by Funds Management, WFAM or Wells Fargo from services provided to the Fund to be at a level that would prevent it from approving the continuation of the Advisory Agreements.
Economies of scale
The Board received and considered information about the potential for Funds Management to experience economies of scale in the provision of management services to the Fund, the difficulties of calculating economies of scale at an individual fund level, and the extent to which potential scale benefits are shared with shareholders. The Board noted the existence of breakpoints in the Fund’s management fee structure, which operate generally to reduce the Fund’s expense ratios as the Fund grows in size. The Board considered that in addition to management fee breakpoints, Funds Management shares potential economies of scale from its management business in a variety of ways, including through fee waiver and expense reimbursement arrangements, services that benefit shareholders, competitive management fee rates set at the outset without regard to breakpoints, and investments in the business intended to enhance services available to shareholders.
The Board concluded that Funds Management’s arrangements with respect to the Fund, including contractual breakpoints, constituted a reasonable approach to sharing potential economies of scale with the Fund and its shareholders.
Other benefits to Funds Management and theSub-Adviser
The Board received and considered information regarding potential“fall-out” or ancillary benefits received by Funds Management and its affiliates, including theSub-Adviser, as a result of their relationships with the Fund. Ancillary benefits could include, among others, benefits directly attributable to other relationships with the Fund and benefits potentially derived from an increase in Funds Management’s and theSub-Adviser’s business as a result of their relationships with the Fund. The Board noted that various affiliates of Funds Management may receive distribution-related fees, shareholder servicing payments andsub-transfer agency fees in respect of shares sold or held through them and services provided.
The Board also reviewed information about soft dollar credits earned and utilized by theSub-Adviser, fees earned by Funds Management and theSub-Adviser from managing a private investment vehicle for the fund family’s securities lending collateral, and commissions earned by an affiliated broker from portfolio transactions.
Based on its consideration of the factors and information it deemed relevant, including those described here, the Board did not find that any ancillary benefits received by Funds Management and its affiliates, including theSub-Adviser, were unreasonable.
Conclusion
At the Meeting, after considering the above-described factors and based on its deliberations and its evaluation of the information described above, the Board unanimously approved the continuation of the Advisory Agreements for aone-year term and determined that the compensation payable to Funds Management and theSub-Adviser under each of the Advisory Agreements was reasonable.
Wells Fargo Ultra Short-Term Municipal Income Fund | 51
This page is intentionally left blank.

For more information
More information about Wells Fargo Funds is available free upon request. To obtain literature, please write, visit the Fund’s website, or call:
Wells Fargo Funds
P.O. Box 219967
Kansas City, MO 64121-9967
Website:wfam.com
Individual investors:1-800-222-8222
Retail investment professionals:1-888-877-9275
Institutional investment professionals:1-866-765-0778

This report and the financial statements contained herein are submitted for the general information of the shareholders of the Fund. If this report is used for promotional purposes, distribution of the report must be accompanied or preceded by a current prospectus. Before investing, please consider the investment objectives, risks, charges, and expenses of the investment. For a current prospectus and, if available, a summary prospectus, containing this information, call1-800-222-8222 or visit the Fund’s website atwfam.com. Read the prospectus carefully before you invest or send money.
Wells Fargo Asset Management (WFAM) is the trade name for certain investment advisory/management firms owned by Wells Fargo & Company. These firms include but are not limited to Wells Capital Management Incorporated and Wells Fargo Funds Management, LLC. Certain products managed by WFAM entities are distributed by Wells Fargo Funds Distributor, LLC (a broker-dealer and Member FINRA).
This material is for general informational and educational purposes only and is NOT intended to provide investment advice or a recommendation of any kind—including a recommendation for any specific investment, strategy, or plan.
INVESTMENT PRODUCTS: NOT FDIC INSURED ◾ NO BANK GUARANTEE ◾ MAY LOSE VALUE
© 2019 Wells Fargo Funds Management, LLC. All rights reserved.
404829 08-19
A258/AR258 06-19
Annual Report
June 30, 2019
Wells Fargo
Wisconsin Tax-Free Fund
Beginning on January 1, 2021, as permitted by new regulations adopted by the Securities and Exchange Commission, paper copies of the Wells Fargo Funds’ annual and semi-annual shareholder reports issued after this date will no longer be sent by mail, unless you specifically request paper copies of the reports. Instead, the reports will be made available on the Funds’ website, and you will be notified by mail each time a report is posted and provided with a website address to access the report.
If you already elected to receive shareholder reports electronically, you will not be affected by this change and you need not take any action. You may elect to receive shareholder reports and other communications from the Fund electronically at any time by contacting your financial intermediary (such as a broker-dealer or bank) or, if you are a direct investor, by calling1-800-222-8222 or by enrolling at wellsfargo.com/advantagedelivery.
You may elect to receive all future reports in paper free of charge. If you invest through a financial intermediary, you can contact your financial intermediary to request that you continue to receive paper copies of your shareholder reports; if you invest directly with the Fund, you can call 1-800-222-8222. Your election to receive reports in paper will apply to all Wells Fargo Funds held in your account with your financial intermediary or, if you are a direct investor, to all Wells Fargo Funds that you hold.
|
|
|
Reduce clutter. Save trees. |
Sign up for electronic delivery of prospectuses and shareholder reports atwellsfargo.com/advantagedelivery |
The views expressed and any forward-looking statements are as of June 30, 2019, unless otherwise noted, and are those of the Fund managers and/or Wells Fargo Asset Management. Discussions of individual securities, or the markets generally, or any Wells Fargo Fund are not intended as individual recommendations. Future events or results may vary significantly from those expressed in any forward-looking statements. The views expressed are subject to change at any time in response to changing circumstances in the market. Wells Fargo Asset Management and the Fund disclaim any obligation to publicly update or revise any views expressed or forward-looking statements.
INVESTMENT PRODUCTS: NOT FDIC INSURED ◾ NO BANK GUARANTEE ◾ MAY LOSE VALUE
Wells Fargo Wisconsin Tax-Free Fund | 1
Letter to shareholders (unaudited)

Andrew Owen
President
Wells Fargo Funds
Dear Shareholder:
We are pleased to offer you this annual report for the Wells Fargo Wisconsin Tax-Free Fund for the 12-month period that ended June 30, 2019. After the first six months of the period yielded either low-single-digit or negative investment returns, stock and bond investors enjoyed a recovery during the final six months. The gains came amid continued concerns about global economic growth, international trade, geopolitical tensions, and bouts of market volatility.
For the period, U.S. stocks, based on the S&P 500 Index,1 gained 10.42% and international stocks, as measured by the MSCI ACWI ex USA Index (Net),2 rose 1.29%. The MSCI EM Index (Net)3 added 1.21%. For bond investors, the Bloomberg Barclays U.S. Aggregate Bond Index4 added 7.87%, the Bloomberg Barclays Global Aggregate ex-USD Index5 rose 4.10%, the Bloomberg Barclays Municipal Bond Index6 gained 6.71%, and the ICE BofAML U.S. High Yield Index7 added 7.58%.
U.S. and international markets diverged during the third quarter of 2018.
Domestic equity investors received encouraging news during the third quarter of 2018. The U.S. Bureau of Economic Analysis reported second-quarter annualized gross domestic product (GDP) growth of 4.2%. Hiring improved. Unemployment declined. Consumer confidence and spending increased. Third-quarter corporate earnings reports were generally positive. U.S. trade negotiations with Mexico and Canada progressed. The U.S. Federal Reserve (Fed) raised the federal funds rate by 25 basis points (bps; 100 bps equal 1.00%) to a target range of between 2.00% and 2.25% in September, one of four rate increases implemented during 2018, expressing confidence in the strength of the U.S. economic expansion’s durability.
Investors in international markets were not as confident. Tensions between the U.S. and China increased. The U.S. imposed $200 billion in tariffs on Chinese goods. China reacted with $60 billion in tariffs on U.S. goods. Economic growth in China caused concern. During the quarter, the MSCI ACWI ex USA Index (Net) gained 0.71%. The MSCI EM Index (Net) declined 1.09%. In fixed-income markets, U.S. bonds were flat, as measured by the Bloomberg Barclays U.S. Aggregate Bond Index. The Bloomberg Barclays Global Aggregate ex-USD Index fell 1.74%.
| 1 | The S&P 500 Index consists of 500 stocks chosen for market size, liquidity, and industry group representation. It is a market-value-weighted index with each stock’s weight in the index proportionate to its market value. You cannot invest directly in an index. |
| 2 | The Morgan Stanley Capital International (MSCI) All Country World Index (ACWI) ex USA Index (Net) is a free-float-adjusted market-capitalization weighted index that is designed to measure the equity market performance of developed and emerging markets, excluding the U.S. Source: MSCI. MSCI makes no express or implied warranties or representations and shall have no liability whatsoever with respect to any MSCI data contained herein. The MSCI data may not be further redistributed or used as a basis for other indices or any securities or financial products. This report is not approved, reviewed, or produced by MSCI. You cannot invest directly in an index. |
| 3 | The MSCI Emerging Markets (EM) Index (Net) is a free-float-adjusted market-capitalization-weighted index that is designed to measure the equity market performance of emerging markets. You cannot invest directly in an index. |
| 4 | The Bloomberg Barclays U.S. Aggregate Bond Index is a broad-based benchmark that measures the investment-grade, U.S. dollar-denominated, fixed-rate taxable bond market, including Treasuries, government-related and corporate securities, mortgage-backed securities (agency fixed-rate and hybrid adjustable-rate mortgage pass-throughs), asset-backed securities, and commercial mortgage-backed securities. You cannot invest directly in an index. |
| 5 | The Bloomberg Barclays Global Aggregate ex-USD Index is an unmanaged index that provides a broad-based measure of the global investment-grade fixed-income markets excluding the U.S. dollar-denominated debt market. You cannot invest directly in an index. |
| 6 | The Bloomberg Barclays Municipal Bond Index is an unmanaged index composed of long-term tax-exempt bonds with a minimum credit rating of Baa. You cannot invest directly in an index. |
| 7 | The ICE BofAML U.S. High Yield Index is a market-capitalization-weighted index of domestic and Yankee high-yield bonds. The index tracks the performance of high-yield securities traded in the U.S. bond market. You cannot invest directly in an index. Copyright 2019. ICE Data Indices, LLC. All rights reserved. |
2 | Wells Fargo Wisconsin Tax-Free Fund
Letter to shareholders (unaudited)
Global markets suffered during the fourth quarter of 2018.
November’s U.S. midterm elections shifted control of the House of Representatives from Republicans to Democrats, presaging partisan clashes that followed and caused uncertainty among investors. Third-quarter U.S. GDP was announced at an annualized 3.4% rate, lower than the second-quarter rate. Brexit efforts stalled ahead of the March 2019 deadline. The People’s Bank of China cut reserve requirement ratios, accelerated infrastructure spending, and cut taxes even as the value of the yuan declined to low levels last seen in 2008. A partial U.S. government shutdown driven by partisan policy disputes extended into January.
The combination of news in the U.S. and generally weak economic indicators outside of the U.S. caused investors to seek safe havens. December’s S&P 500 Index performance was the worst since 1931. Globally, fixed-income investments fared better than stocks during the last two months of the year. The Fed increased the federal funds rate by 25 bps in December to a target range of between 2.25% and 2.50%.
The market climbs a wall of worry.
Investors entered 2019 with reasons to be concerned. Investment returns appeared to reaffirm the adage that markets climb a wall of worry. The S&P 500 Index gained 8.01% for the month of January, the best monthly performance in 30 years. Returns for the MSCI ACWI ex USA Index (Net), the Bloomberg Barclays U.S. Aggregate Bond Index, and the Bloomberg Barclays Global Aggregate ex-USD Index also were positive. The Fed indicated that it would pause its program of regular rate increases during 2019 as inflation remained low.
In February 2019, concerns over slowing global growth persisted. The Bureau of Economic Analysis announced fourth-quarter 2018 GDP grew at an annualized 2.2% rate, down from the levels of the prior two quarters. In a February report, the Bank of England forecast the slowest growth since the financial crisis for 2019. China and the U.S. continued to wrangle over trade issues.
By the end of March 2019, the combination of dovish Fed sentiment and steady, if not spectacular, economic and business metrics reinforced investors’ confidence. Monthly job creation data and corporate profits, while less consistent than during 2018, were solid. China announced a roughly $300 billion stimulus package through tax and fee cuts intended to reinvigorate economic growth.
During April 2019, investors drew confidence from favorable economic projections, sustained low inflation, and solid employment data. First-quarter GDP showed the economy grew at an annualized rate of 3.2% on improvement in business investment and exports. Favorable sentiment extended to foreign markets as the MSCI ACWI ex USA Index (Net) gained 2.64% and the MSCI EM Index (Net) added 2.11% for the month.
During May 2019, investing signals were mixed. In the U.S., partisan wrangling ramped up as Democrats and Republicans set their sights on 2020 presidential politics. The U.K.’s Brexit caused Prime Minister Theresa May to resign. The European Commission downgraded the 2019 growth forecast to 1.2%. The U.S. increased tariffs on products from China, China responded, and then talks broke down. President Donald Trump threatened to turn his foreign policy tariff tool to Mexico over immigration issues. Markets tumbled.
As had been the case during most of 2019 to date, just as the investment horizon appeared to darken, sentiment turned and markets gained. The gains, primarily driven by geopolitical and monetary policy events, drove equity markets to new highs. President Trump dropped his threats of new tariffs on Mexico after talks and further tariffs on China after meeting with China’s President Xi Jinping at the G-20 summit. President Mario Draghi of the European Central Bank said that if the outlook doesn’t
“December’s S&P 500 Index performance was the worst since 1931.”
“The S&P 500 Index gained 8.01% for the month of January, the best monthly performance in 30 years.”
Wells Fargo Wisconsin Tax-Free Fund | 3
Letter to shareholders (unaudited)
improve, the bank will cut rates or buy more assets to prop up inflation. In the U.S., the Fed said growth shifted from “solid” to “moderate” and indicated a willingness to cut rates.
Don’t let short-term uncertainty derail long-term investment goals.
Periods of investment uncertainty can present challenges, but experience has taught us that maintaining long-term investment goals can be an effective way to plan for the future. To help you create a sound strategy based on your personal goals and risk tolerance, Wells Fargo Funds offers more than 100 mutual funds spanning a wide range of asset classes and investment styles. Although diversification cannot guarantee an investment profit or prevent losses, we believe it can be an effective way to manage investment risk and potentially smooth out overall portfolio performance. We encourage investors to know their investments and to understand that appropriate levels of risk-taking may unlock opportunities.
Thank you for choosing to invest with Wells Fargo Funds. We appreciate your confidence in us and remain committed to helping you meet your financial needs.
Sincerely,

Andrew Owen
President
Wells Fargo Funds
|
|
|
For further information about your Fund, contact your investment professional, visit our website at wfam.com, or call us directly at1-800-222-8222. |
4 | Wells Fargo Wisconsin Tax-Free Fund
This page is intentionally left blank.
Performance highlights (unaudited)
Investment objective
The Fund seeks current income exempt from federal income tax and Wisconsin individual income tax.
Manager
Wells Fargo Funds Management, LLC
Subadviser
Wells Capital Management Incorporated
Portfolio managers
Wendy Casetta‡
Bruce R. Johns
Thomas Stoeckmann
Average annual total returns (%) as of June 30, 2019
| | | | | | | | | | | | | | | | | | | | | | | | | | | | | | | | | | |
| | | | |
| | | | | Including sales charge | | | Excluding sales charge | | | Expense
ratios1(%) | |
| | | | | | | | | |
| | | Inception date | | 1 year | | | 5 year | | | 10 year | | | 1 year | | | 5 year | | | 10 year | | | Gross | | | Net2 | |
| | | | | | | | | | |
| Class A (WWTFX) | | 3-31-2008 | | | 0.78 | | | | 1.90 | | | | 3.18 | | | | 5.56 | | | | 2.85 | | | | 3.66 | | | | 0.88 | | | | 0.70 | |
| | | | | | | | | | |
| Class C (WWTCX) | | 12-26-2002 | | | 3.78 | | | | 2.08 | | | | 2.87 | | | | 4.78 | | | | 2.08 | | | | 2.87 | | | | 1.63 | | | | 1.45 | |
| | | | | | | | | | |
| Institutional Class (WWTIX)3 | | 10-31-2016 | | | – | | | | – | | | | – | | | | 5.75 | | | | 2.95 | | | | 3.71 | | | | 0.55 | | | | 0.52 | |
| | | | | | | | | | |
| Bloomberg Barclays Municipal Bond Index4 | | – | | | – | | | | – | | | | – | | | | 6.71 | | | | 3.64 | | | | 4.72 | | | | – | | | | – | |
| | | | | | | | | | |
| Bloomberg Barclays Wisconsin Municipal Bond Index5 | | – | | | – | | | | – | | | | – | | | | 6.17 | | | | 3.28 | | | | 4.30 | | | | – | | | | – | |
Figures quoted represent past performance, which is no guarantee of future results, and do not reflect taxes that a shareholder may pay on fund distributions or the redemption of fund shares. Investment return and principal value of an investment will fluctuate so that an investor’s shares, when redeemed, may be worth more or less than their original cost. Performance shown without sales charges would be lower if sales charges were reflected. Current performance may be lower or higher than the performance data quoted, which assumes the reinvestment of dividends and capital gains. Current month-end performance is available on the Fund’s website,wfam.com
Index returns do not include transaction costs associated with buying and selling securities, any mutual fund fees or expenses, or any taxes. It is not possible to invest directly in an index.
For Class A shares, the maximum front-end sales charge is 4.50%. For Class C shares, the maximum contingent deferred sales charge is 1.00%. Performance including a contingent deferred sales charge assumes the sales charge for the corresponding time period. Institutional Class shares are sold without a front-end sales charge or contingent deferred sales charge.
Bond values fluctuate in response to the financial condition of individual issuers, general market and economic conditions, and changes in interest rates. Changes in market conditions and government policies may lead to periods of heightened volatility in the bond market and reduced liquidity for certain bonds held by the Fund. In general, when interest rates rise, bond values fall and investors may lose principal value. Interest rate changes and their impact on the Fund and its share price can be sudden and unpredictable. The use of derivatives may reduce returns and/or increase volatility. Certain investment strategies tend to increase the total risk of an investment (relative to the broader market). The Fund is exposed to Wisconsin and Puerto Rico municipal securities risk, high-yield securities risk, and nondiversification funds risk. Consult the Fund’s prospectus for additional information on these and other risks. A portion of the fund’s income may be subject to federal, state, and/or local income taxes or the Alternative Minimum Tax (AMT). Any capital gains distributions may be taxable.
Please see footnotes on page 7.
6 | Wells Fargo Wisconsin Tax-Free Fund
Performance highlights (unaudited)
|
|
| Growth of $10,000 investment as of June 30, 20196 |
|
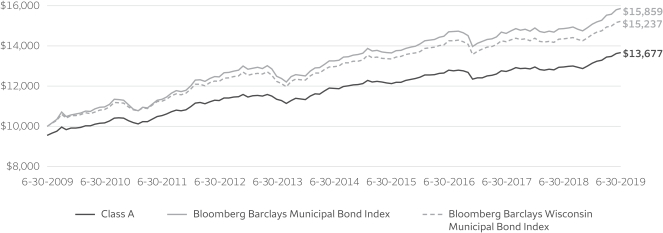
|
| ‡ | Ms. Casetta became a portfolio manager of the Fund on March 28, 2019. |
| 1 | Reflects the expense ratios as stated in the most recent prospectuses. The expense ratios shown are subject to change and may differ from the annualized expense ratios shown in the financial highlights of this report. |
| 2 | The manager has contractually committed through October 31, 2019, to waive fees and/or reimburse expenses to the extent necessary to cap the expenses of each class after fee waivers at the amounts shown. Brokerage commissions, stamp duty fees, interest, taxes, acquired fund fees and expenses (if any), and extraordinary expenses are excluded from the expense cap. Prior to or after the commitment expiration date, the cap may be increased or the commitment to maintain the cap may be terminated only with the approval of the Board of Trustees. Without this cap, the Fund’s returns would have been lower. The expense ratio paid by an investor is the net expense ratio (the total annual fund operating expenses after fee waivers) as stated in the prospectuses. |
| 3 | Historical performance shown for the Institutional Class shares prior to their inception reflects the performance of the Class A shares, and is not adjusted to reflect Institutional Class expenses. If these expenses had been included, returns for Institutional Class would be higher. |
| 4 | The Bloomberg Barclays Municipal Bond Index is an unmanaged index composed of long-term tax-exempt bonds with a minimum credit rating of Baa. You cannot invest directly in an index. |
| 5 | The Bloomberg Barclays Wisconsin Municipal Bond Index is the Wisconsin component of the Bloomberg Barclays Municipal Bond Index. You cannot invest directly in an index. |
| 6 | The chart compares the performance of Class A shares for the most recent ten years with the Bloomberg Barclays Municipal Bond Index and the Bloomberg Barclays Wisconsin Municipal Bond Index. The chart assumes a hypothetical $10,000 investment in Class A shares and reflects all operating expenses and assumes the maximum initial sales charge of 4.50%. |
| 7 | Amounts are calculated based on the long-term total investments of the Fund. These amounts are subject to change and may have changed since the date specified. |
| 8 | The credit quality distribution of portfolio holdings reflected in the chart is based on ratings from Standard & Poor’s, Moody’s Investors Service, and/or Fitch Ratings Ltd. Credit quality ratings apply to the underlying holdings of the Fund and not to the Fund itself. The percentages of the Fund’s portfolio with the ratings depicted in the chart are calculated based on the total market value of fixed income securities held by the Fund. If a security was rated by all three rating agencies, the middle rating was utilized. If rated by two of three rating agencies, the lower rating was utilized, and if rated by one of the rating agencies, that rating was utilized. Standard & Poor’s rates the creditworthiness of bonds, ranging from AAA (highest) to D (lowest). Ratings from A to CCC may be modified by the addition of a plus (+) or minus (-) sign to show relative standing within the rating categories. Standard & Poor’s rates the creditworthiness of short-term notes from SP-1 (highest) to SP-3 (lowest). Moody’s rates the creditworthiness of bonds, ranging from Aaa (highest) to C (lowest). Ratings Aa to B may be modified by the addition of a number 1 (highest) to 3 (lowest) to show relative standing within the ratings categories. Moody’s rates the creditworthiness of short-term U.S. tax-exempt municipal securities from MIG 1/VMIG 1 (highest) to SG (lowest). Fitch rates the creditworthiness of bonds, ranging from AAA (highest) to D (lowest). Credit quality distribution is subject to change and may have changed since the date specified. |
Wells Fargo Wisconsin Tax-Free Fund | 7
Performance highlights (unaudited)
MANAGER’S DISCUSSION
Fund highlights
| ∎ | | The Fund underperformed its primary benchmark, the Bloomberg Barclays Municipal Bond Index, and its secondary benchmark, the Bloomberg Barclays Wisconsin Municipal Bond Index, for the 12-month period that ended June 30, 2019. |
| ∎ | | The Fund’s conservative short duration positioning was a detractor from performance as all rates rallied and declined across the yield curve. Additionally, sector allocations had a negative effect on performance. |
| ∎ | | The Fund’s overweight to bonds rated A and BBB was a driver of performance, as lower-rated investment-grade bonds outperformed higher-rated bonds. The Fund’s overweight to housing and leasing bonds was also a positive contributor to performance. |
| ∎ | | Yield-curve positioning added to performance. We were overweight intermediate- to longer-term bonds, which outperformed, and underweight shorter-term bonds, which underperformed. |
|
|
| Effective maturity distribution as of June 30, 20197 |
|
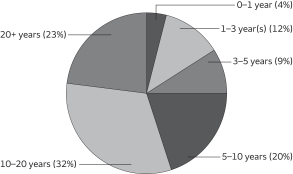 |
The Fed abruptly changed course from raising rates to a potential rate cut on fading growth expectations.
Throughout most of 2018, the fixed-income markets expected the U.S. Federal Reserve (Fed) to continue the path to normalize monetary policy. Moderate economic growth, stronger employment data, and inflation near its 2% target enabled the Fed to increase the federal funds rate four times in the calendar year. Despite a Fed rate hike in December, the Treasury market rallied in the fourth quarter of 2018 as the market lowered expectations for further rate hikes amid slower global growth, trade tariffs, and uncertainty concerning Britain’s departure from the European Union.
These concerns only increased as we moved into the first half of 2019, and discussions changed from when the Fed might hike to when it might cut the federal funds rate. As a result, fixed-income markets rallied, pushing the benchmark 10-year Treasury yield from a 3.23% peak in November 2018 to 2.00% by the end of June. The municipal market mutual fund bond flows in the first half of 2019 were in excess of $42 billion, a number not seen since 1992. With this strong technical backdrop for the municipal bonds market and the Fed possibly cutting rates, bonds rallied in the first half of 2019. The intermediate and longer bonds along the yield curve outperformed shorter bonds. With all these factors at play, we see strong support for the municipal market over the short to intermediate term.
Wisconsin offers municipal bond investing opportunities.
Wisconsin is the 21st-largest state by gross domestic product (GDP) and 20th by population, rated AA (stable) by Standard & Poor’s Financial Services LLC and Aa1 (stable) by Moody’s Investors Service, Inc. While the state’s GDP grew at a slower pace than the national level in 2018, the labor market remains tighter, with a 2018 year-end unemployment rate of 2.8% and labor force participation rate of 65.3%. The state’s largest employment sector is manufacturing, although it has been successful at diversifying away that exposure, mainly into the health care industry. Based on solid economic performance, the state has done well financially with an upside surprise in tax collections, which has led to the state’s strongest-ever budget stabilization fund balance at $320.1 million. Debt levels remain modestly elevated, although the state benefits from having a fully funded pension plan. Tony Evers was elected governor in 2018, unseating eight-year incumbent Scott Walker. Evers has significant budget initiatives, including K–12, juvenile, and university system funding increases. However, given a Republican legislature, there will most likely be some sort of compromise for the fiscal-year 2019–2021 budget, which was signed into law on July 3. In addition, the state continues to be in the headlines related to uncertainty regarding the Foxconn Technology Group development, although it appears that some construction has started on the facility.
Credit quality, yield-curve positioning, and security selection drove positive performance; duration positioning and sector allocation detracted.
In anticipation of the Fed continuing to normalize rates, we kept the Fund’s duration short relative to its primary benchmark in the first half of the year and started extending duration in the latter part of 2018 as growth faded for the economy. The Fund
Please see footnotes on page 7.
8 | Wells Fargo Wisconsin Tax-Free Fund
Performance highlights (unaudited)
was still short to its primary benchmark at the end of the period, which detracted from performance. As the Fed moved to the sidelines in the early part of 2019 and further positioned itself to cut rates, we continued to buy bonds of higher quality further out the yield curve. The Fund’s yield-curve positioning was a slight contributor to performance. We were overweight intermediate- and longer-term bonds, which outperformed, and underweight shorter bonds, which underperformed.
|
|
| Credit quality as of June 30, 20198 |
|
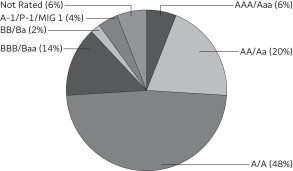 |
The credit-quality allocation was the largest driver of performance along with individual security selection. The Fund’s overweight to bonds rated A and BBB was a significant driver of performance, as lower-rated investment-grade bonds outperformed higher-rated bonds. We’ve purchased many state issuers over the year—including Ashwaubenon, WI, Community Development Authority lease bonds and Milwaukee, WI, Redevelopment Authority bonds—Summerfest Project, but with the limited supply of double-tax-exempt bonds, we’ve found some opportunities in other states as a relative-value opportunity. We purchased state of Illinois general obligation bonds and Denton, TX, Independent School District bonds, which were
some of the better-performing bonds of the year. Sector allocation was a detractor from performance overall, as we were overweight prerefunded bonds, which underperformed, and underweight revenue bonds, which outperformed. However, being overweight leasing and housing bonds within the revenue bond sector, which outperformed other bonds in the sector, and selecting bonds like Wisconsin Center District Bonds—Milwaukee Arena Project and Wisconsin Housing and Economic Development bonds (Madison Pool Project), which were some of the best-performing bonds, added to performance.
Slowing growth supports credit fundamentals, but market technicals are driving performance and issue selection remains key in state-specific funds.
We believe U.S. economic growth is slowing but still continues at a modest pace. Wisconsin’s economy is slightly trailing the national average. However, its solid economic base and prudent debt issuance discipline could lead to modestly higher revenues for many municipalities along with improved credit fundamentals. We view the Fed becoming more dovish and potentially cutting rates in the latter half of 2019 as supportive of GDP growth. Some municipalities may do well and others may continue to struggle. That is why we feel credit selection will remain important. We expect to remain overweight lower-quality investment-grade bonds, though we believe investors currently are not being compensated sufficiently for making new investments in some of these areas. In our view, the long-term drivers of valuations will be supply and demand trends, absolute yield levels, the shape of the yield curve, and credit fundamentals. We will continue to extend the Fund’s duration slightly. While we will continue our bias to overweighting lower-quality investment-grade bonds, it will be to a lesser degree, and we will add some higher-quality bonds in the AAA and AA areas as opportunities arise. We will monitor economic growth, the technical market, and fundamental credit quality to see if any changes are warranted in duration, yield-curve positioning, or credit-quality selections over the next year.
Please see footnotes on page 7.
Wells Fargo Wisconsin Tax-Free Fund | 9
Fund expenses (unaudited)
As a shareholder of the Fund, you incur two types of costs: (1) transaction costs, including sales charges (loads) on purchase payments and contingent deferred sales charges (if any) on redemptions and (2) ongoing costs, including management fees, distribution (12b-1) and/or shareholder servicing fees, and other Fund expenses. This example is intended to help you understand your ongoing costs (in dollars) of investing in the Fund and to compare these costs with the ongoing costs of investing in other mutual funds.
The example is based on an investment of $1,000 invested at the beginning of the six-month period and held for the entire period from January 1, 2019 to June 30, 2019.
Actual expenses
The “Actual” line of the table below provides information about actual account values and actual expenses. You may use the information in this line, together with the amount you invested, to estimate the expenses that you paid over the period. Simply divide your account value by $1,000 (for example, an $8,600 account value divided by $1,000 = 8.6), then multiply the result by the number in the “Actual” line under the heading entitled “Expenses paid during period” for your applicable class of shares to estimate the expenses you paid on your account during this period.
Hypothetical example for comparison purposes
The “Hypothetical” line of the table below provides information about hypothetical account values and hypothetical expenses based on the Fund’s actual expense ratio and an assumed rate of return of 5% per year before expenses, which is not the Fund’s actual return. The hypothetical account values and expenses may not be used to estimate the actual ending account balance or expenses you paid for the period. You may use this information to compare the ongoing costs of investing in the Fund and other funds. To do so, compare this 5% hypothetical example with the 5% hypothetical examples that appear in the shareholder reports of the other funds.
Please note that the expenses shown in the table are meant to highlight your ongoing costs only and do not reflect any transactional costs, such as sales charges (loads) and contingent deferred sales charges. Therefore, the “Hypothetical” line of the table is useful in comparing ongoing costs only and will not help you determine the relative total costs of owning different funds. In addition, if these transactional costs were included, your costs would have been higher.
| | | | | | | | | | | | | | | | |
| | | Beginning
account value
1-1-2019 | | | Ending
account value
6-30-2019 | | | Expenses
paid during
the period¹ | | | Annualized net
expense ratio | |
| | | | | |
Class A | | | | | | | | | | | | | | | | |
| | | | |
Actual | | $ | 1,000.00 | | | $ | 1,040.53 | | | $ | 3.54 | | | | 0.70 | % |
| | | | |
Hypothetical (5% return before expenses) | | $ | 1,000.00 | | | $ | 1,021.32 | | | $ | 3.51 | | | | 0.70 | % |
| | | | | |
Class C | | | | | | | | | | | | | | | | |
| | | | |
Actual | | $ | 1,000.00 | | | $ | 1,036.68 | | | $ | 7.32 | | | | 1.45 | % |
| | | | |
Hypothetical (5% return before expenses) | | $ | 1,000.00 | | | $ | 1,017.60 | | | $ | 7.25 | | | | 1.45 | % |
| | | | | |
Institutional Class | | | | | | | | | | | | | | | | |
| | | | |
Actual | | $ | 1,000.00 | | | $ | 1,041.46 | | | $ | 2.63 | | | | 0.52 | % |
| | | | |
Hypothetical (5% return before expenses) | | $ | 1,000.00 | | | $ | 1,022.22 | | | $ | 2.61 | | | | 0.52 | % |
| 1 | Expenses paid is equal to the annualized net expense ratio of each class multiplied by the average account value over the period, multiplied by the number of days in the most recent fiscal half-year divided by the number of days in the fiscal year (to reflect the one-half-year period). |
10 | Wells Fargo Wisconsin Tax-Free Fund
Portfolio of investments—June 30, 2019
| | | | | | | | | | | | | | | | |
| | | Interest
rate | | | Maturity date | | | Principal | | | Value | |
| Municipal Obligations: 98.63% | | | | | | | | | | | | | | | | |
| | | | |
Guam: 6.17% | | | | | | | | | | | | | | | | |
| | | | |
| Airport Revenue: 2.51% | | | | | | | | | | | | |
| | | | |
Guam International Airport Authority Series C (AGM Insured) | | | 6.13 | % | | | 10-1-2043 | | | $ | 1,500,000 | | | $ | 1,743,157 | |
| | | | |
Guam Port Authority AMT Series A | | | 5.00 | | | | 7-1-2048 | | | | 1,000,000 | | | | 1,146,470 | |
| | | | |
Guam Port Authority AMT Series B | | | 5.00 | | | | 7-1-2034 | | | | 445,000 | | | | 511,390 | |
| | | | |
| | | | | | | | | | | | | | | 3,401,017 | |
| | | | | | | | | | | | | | | | |
| | | | |
| Miscellaneous Revenue: 2.62% | | | | | | | | | | | | |
| | | | |
Guam Education Financing Foundation Refunding Bond Certificates of Participation Series 2016A | | | 5.00 | | | | 10-1-2022 | | | | 1,400,000 | | | | 1,513,246 | |
| | | | |
Guam Government Limited Obligation Bonds Section 30 Series A | | | 5.38 | | | | 12-1-2024 | | | | 1,000,000 | | | | 1,017,090 | |
| | | | |
Guam Government Limited Obligation Bonds Section 30 Series A | | | 5.50 | | | | 12-1-2019 | | | | 1,000,000 | | | | 1,017,600 | |
| | | | |
| | | | | | | | | | | | | | | 3,547,936 | |
| | | | | | | | | | | | | | | | |
| | | | |
| Tax Revenue: 0.66% | | | | | | | | | | | | |
| | | | |
Guam Government Business Privilage Tax Revenue Series 2011A | | | 5.00 | | | | 1-1-2021 | | | | 250,000 | | | | 260,433 | |
| | | | |
Guam Government Limited Obligation Bonds Section 30 Series A | | | 5.00 | | | | 12-1-2021 | | | | 600,000 | | | | 639,852 | |
| | | | |
| | | | | | | | | | | | | | | 900,285 | |
| | | | | | | | | | | | | | | | |
| | | | |
| Utilities Revenue: 0.38% | | | | | | | | | | | | |
| | | | |
Guam Power Authority Series A (AGM Insured) | | | 5.00 | | | | 10-1-2020 | | | | 500,000 | | | | 520,960 | |
| | | | | | | | | | | | | | | | |
| | | | |
| | | | | | | | | | | | | | | 8,370,198 | |
| | | | | | | | | | | | | | | | |
| | | | |
Illinois: 2.88% | | | | | | | | | | | | | | | | |
| | | | |
| GO Revenue: 1.85% | | | | | | | | | | | | |
| | | | |
Chicago IL CAB City Colleges (National Insured) ¤ | | | 0.00 | | | | 1-1-2027 | | | | 1,000,000 | | | | 798,510 | |
| | | | |
Chicago IL Park District Special Recreation Activity Series E | | | 5.00 | | | | 11-15-2027 | | | | 1,000,000 | | | | 1,173,760 | |
| | | | |
Illinois Refunding Bond Series 2018A | | | 5.00 | | | | 10-1-2021 | | | | 500,000 | | | | 533,600 | |
| | | | |
| | | | | | | | | | | | | | | 2,505,870 | |
| | | | | | | | | | | | | | | | |
| | | | |
| Miscellaneous Revenue: 0.20% | | | | | | | | | | | | |
| | | | |
Illinois | | | 5.50 | | | | 7-1-2026 | | | | 250,000 | | | | 277,515 | |
| | | | | | | | | | | | | | | | |
| | | | |
| Tax Revenue: 0.76% | | | | | | | | | | | | |
| | | | |
Metropolitan Pier & Exposition Authority McCormick Place Expansion Project Series B | | | 5.00 | | | | 12-15-2028 | | | | 970,000 | | | | 1,033,748 | |
| | | | | | | | | | | | | | | | |
| | | | |
| Water & Sewer Revenue: 0.07% | | | | | | | | | | | | |
| | | | |
Chicago IL Waterworks Unrefunded Bond (AGM Insured) | | | 5.00 | | | | 11-1-2020 | | | | 95,000 | | | | 95,282 | |
| | | | | | | | | | | | | | | | |
| | | | |
| | | | | | | | | | | | | | | 3,912,415 | |
| | | | | | | | | | | | | | | | |
| | | | |
Michigan: 0.08% | | | | | | | | | | | | | | | | |
| | | | |
| Miscellaneous Revenue: 0.08% | | | | | | | | | | | | |
| | | | |
Michigan Municipal Bond Authority Local Government Loan Program Series A (Ambac Insured) | | | 4.00 | | | | 11-1-2021 | | | | 110,000 | | | | 110,183 | |
| | | | | | | | | | | | | | | | |
| | | | |
New Jersey: 1.81% | | | | | | | | | | | | | | | | |
| | | | |
| Miscellaneous Revenue: 0.83% | | | | | | | | | | | | |
| | | | |
New Jersey EDA Series EE | | | 5.00 | | | | 9-1-2023 | | | | 1,070,000 | | | | 1,128,572 | |
| | | | | | | | | | | | | | | | |
| | | | |
| Transportation Revenue: 0.98% | | | | | | | | | | | | |
| | | | |
New Jersey TTFA CAB Series A ¤ | | | 0.00 | | | | 12-15-2031 | | | | 2,000,000 | | | | 1,327,540 | |
| | | | | | | | | | | | | | | | |
| | | | |
| | | | | | | | | | | | | | | 2,456,112 | |
| | | | | | | | | | | | | | | | |
Wells Fargo Wisconsin Tax-Free Fund | 11
Portfolio of investments—June 30, 2019
| | | | | | | | | | | | | | | | |
| | | Interest
rate | | | Maturity date | | | Principal | | | Value | |
New York: 0.77% | | | | | | | | | | | | | | | | |
| | | | |
| Education Revenue: 0.77% | | | | | | | | | | | | |
| | | | |
Hempstead NY Local Development Corporation The Academy Charter School Project Series A | | | 6.24 | % | | | 2-1-2047 | | | $ | 1,000,000 | | | $ | 1,038,410 | |
| | | | | | | | | | | | | | | | |
| | | | |
Puerto Rico: 0.97% | | | | | | | | | | | | | | | | |
| | | | |
| Transportation Revenue: 0.97% | | | | | | | | | | | | |
| | | | |
Puerto Rico Highway & Transportation Authority Refunding Bond Series L (AGC Insured) | | | 5.25 | | | | 7-1-2019 | | | | 1,000,000 | | | | 1,000,000 | |
| | | | |
Puerto Rico Highway & Transportation Authority Refunding Bond Series L (BHAC/FGIC Insured) | | | 5.25 | | | | 7-1-2021 | | | | 300,000 | | | | 315,882 | |
| | | | |
| | | | | | | | | | | | | | | 1,315,882 | |
| | | | | | | | | | | | | | | | |
| | | | |
Texas: 1.62% | | | | | | | | | | | | | | | | |
| | | | |
| GO Revenue: 1.62% | | | | | | | | | | | | |
| | | | |
Denton TX Independent School District School Building | | | 4.00 | | | | 8-15-2048 | | | | 2,000,000 | | | | 2,191,500 | |
| | | | | | | | | | | | | | | | |
| | | | |
Virgin Islands: 3.66% | | | | | | | | | | | | | | | | |
| | | | |
| Miscellaneous Revenue: 2.17% | | | | | | | | | | | | |
| | | | |
Virgin Islands PFA 144A | | | 5.00 | | | | 9-1-2020 | | | | 750,000 | | | | 771,690 | |
| | | | |
Virgin Islands PFA Gross Receipts Taxes Loan Notes (National Insured) | | | 4.00 | | | | 10-1-2020 | | | | 450,000 | | | | 452,795 | |
| | | | |
Virgin Islands PFA Gross Receipts Taxes Loan Notes (AGM Insured) | | | 4.00 | | | | 10-1-2022 | | | | 1,690,000 | | | | 1,715,418 | |
| | | | |
| | | | | | | | | | | | | | | 2,939,903 | |
| | | | | | | | | | | | | | | | |
| | | | |
| Tax Revenue: 1.49% | | | | | | | | | | | | |
| | | | |
Virgin Islands PFA Matching Fund Loan Notes Senior Lien Series B (AGM Insured) | | | 5.00 | | | | 10-1-2025 | | | | 2,000,000 | | | | 2,018,080 | |
| | | | | | | | | | | | | | | | |
| | | | |
| | | | | | | | | | | | | | | 4,957,983 | |
| | | | | | | | | | | | | | | | |
| | | | |
Wisconsin: 80.67% | | | | | | | | | | | | | | | | |
| | | | |
| Education Revenue: 10.93% | | | | | | | | | | | | |
| | | | |
Green Bay WI Housing Authority University Village Housing Incorporated | | | 4.38 | | | | 4-1-2022 | | | | 200,000 | | | | 201,060 | |
| | | | |
Green Bay WI Housing Authority University Village Housing Incorporated | | | 5.00 | | | | 4-1-2030 | | | | 1,410,000 | | | | 1,421,280 | |
| | | | |
Madison WI CDA Wisconsin Alumni Research Foundation | | | 5.00 | | | | 10-1-2023 | | | | 150,000 | | | | 151,380 | |
| | | | |
Madison WI CDA Wisconsin Alumni Research Foundation | | | 5.00 | | | | 10-1-2025 | | | | 475,000 | | | | 479,337 | |
| | | | |
Madison WI CDA Wisconsin Alumni Research Foundation | | | 5.00 | | | | 10-1-2039 | | | | 5,000,000 | | | | 5,042,100 | |
| | | | |
Milwaukee WI RDA Milwaukee School of Engineering Project (AGM Insured) | | | 2.75 | | | | 4-1-2021 | | | | 1,080,000 | | | | 1,107,518 | |
| | | | |
Milwaukee WI RDA Milwaukee School of Engineering Project (AGM Insured) | | | 4.10 | | | | 4-1-2032 | | | | 1,500,000 | | | | 1,574,205 | |
| | | | |
Milwaukee WI RDA Science Education Consortium Incorporated Project Series A | | | 6.25 | | | | 8-1-2043 | | | | 2,100,000 | | | | 2,296,035 | |
| | | | |
Platteville WI RDA University of Wisconsin Platteville Real Estate Foundation Incorporated | | | 5.00 | | | | 7-1-2022 | | | | 950,000 | | | | 984,495 | |
| | | | |
Platteville WI RDA University of Wisconsin Platteville Real Estate Foundation Incorporated | | | 5.00 | | | | 7-1-2032 | | | | 1,500,000 | | | | 1,563,060 | |
| | | | |
| | | | | | | | | | | | | | | 14,820,470 | |
| | | | | | | | | | | | | | | | |
| | | | |
| GO Revenue: 1.84% | | | | | | | | | | | | |
| | | | |
Milwaukee WI Series B6 | | | 2.00 | | | | 4-1-2021 | | | | 175,000 | | | | 177,200 | |
| | | | |
Milwaukee WI Series B6 | | | 3.00 | | | | 4-1-2024 | | | | 570,000 | | | | 612,898 | |
| | | | |
Milwaukee WI Series B6 | | | 5.00 | | | | 4-1-2022 | | | | 350,000 | | | | 384,990 | |
| | | | |
Milwaukee WI Series B6 | | | 5.00 | | | | 4-1-2023 | | | | 580,000 | | | | 658,004 | |
| | | | |
Milwaukee WI Series B6 | | | 5.00 | | | | 4-1-2025 | | | | 550,000 | | | | 656,876 | |
| | | | |
| | | | | | | | | | | | | | | 2,489,968 | |
| | | | | | | | | | | | | | | | |
12 | Wells Fargo Wisconsin Tax-Free Fund
Portfolio of investments—June 30, 2019
| | | | | | | | | | | | | | | | |
| | | Interest
rate | | | Maturity date | | | Principal | | | Value | |
| Health Revenue: 12.55% | | | | | | | | | | | | |
| | | | |
University of Wisconsin Hospitals & Clinics Authority Refunding Bond Series B (JPMorgan Chase & Company SPA) ø | | | 1.93 | % | | | 4-1-2048 | | | $ | 700,000 | | | $ | 700,000 | |
| | | | |
University of Wisconsin Hospitals and Clinics Authority Revenue Various Refunding Bond Series C (BMO Harris Bank NA SPA) ø | | | 1.97 | | | | 4-1-2048 | | | | 900,000 | | | | 900,000 | |
| | | | |
Wisconsin HEFA Bellin Memorial Hospital Obligated Group | | | 4.00 | | | | 12-1-2035 | | | | 1,000,000 | | | | 1,065,460 | |
| | | | |
Wisconsin HEFA Bellin Memorial Hospital Obligated Group | | | 5.00 | | | | 12-1-2025 | | | | 1,500,000 | | | | 1,720,860 | |
| | | | |
Wisconsin HEFA Bellin Memorial Hospital Obligated Group | | | 5.00 | | | | 12-1-2026 | | | | 1,740,000 | | | | 1,994,614 | |
| | | | |
Wisconsin HEFA Marshfield Clinic Health System Obligated Group Series C | | | 5.00 | | | | 2-15-2020 | | | | 850,000 | | | | 867,995 | |
| | | | |
Wisconsin HEFA Marshfield Clinic Health System Obligated Group Series C | | | 5.00 | | | | 2-15-2027 | | | | 400,000 | | | | 484,988 | |
| | | | |
Wisconsin HEFA Marshfield Clinic Health System Obligated Group Series C | | | 5.00 | | | | 2-15-2028 | | | | 650,000 | | | | 780,319 | |
| | | | |
Wisconsin HEFA Marshfield Clinic Health System Obligated Group Series C | | | 5.00 | | | | 2-15-2029 | | | | 500,000 | | | | 596,020 | |
| | | | |
Wisconsin HEFA Monroe Clinic Incorporated | | | 4.00 | | | | 2-15-2031 | | | | 900,000 | | | | 1,025,991 | |
| | | | |
Wisconsin HEFA Monroe Clinic Incorporated | | | 4.00 | | | | 2-15-2033 | | | | 550,000 | | | | 626,995 | |
| | | | |
Wisconsin HEFA Monroe Clinic Incorporated | | | 5.00 | | | | 2-15-2028 | | | | 900,000 | | | | 1,078,272 | |
| | | | |
Wisconsin HEFA Monroe Clinic Incorporated | | | 5.00 | | | | 2-15-2029 | | | | 575,000 | | | | 688,896 | |
| | | | |
Wisconsin HEFA Monroe Clinic Incorporated | | | 3.00 | | | | 2-15-2035 | | | | 520,000 | | | | 561,642 | |
| | | | |
Wisconsin HEFA Monroe Clinic Incorporated | | | 5.00 | | | | 2-15-2030 | | | | 300,000 | | | | 359,424 | |
| | | | |
Wisconsin HEFA Rogers Memorial Hospital Incorporated Series B | | | 5.00 | | | | 7-1-2044 | | | | 3,250,000 | | | | 3,563,690 | |
| | | | |
| | | | | | | | | | | | | | | 17,015,166 | |
| | | | | | | | | | | | | | | | |
| | | | |
| Housing Revenue: 14.58% | | | | | | | | | | | | |
| | | | |
Wisconsin HEFA Aspirus Wausau Hospital Incorporated Obligated Group Series 2004B (JPMorgan Chase & Company LOC) ø | | | 1.95 | | | | 8-15-2034 | | | | 4,000,000 | | | | 4,000,000 | |
| | | | |
Wisconsin Housing & EDA AMT Series A | | | 4.63 | | | | 11-1-2037 | | | | 25,000 | | | | 25,027 | |
| | | | |
Wisconsin Housing & EDA Madison Pool Project Series A | | | 4.55 | | | | 7-1-2037 | | | | 165,000 | | | | 178,485 | |
| | | | |
Wisconsin Housing & EDA Madison Pool Project Series A | | | 4.70 | | | | 7-1-2047 | | | | 2,300,000 | | | | 2,484,920 | |
| | | | |
Wisconsin Housing & EDA Madison Pool Project Series A | | | 4.85 | | | | 7-1-2052 | | | | 3,000,000 | | | | 3,232,410 | |
| | | | |
Wisconsin Housing & EDA Series A | | | 1.55 | | | | 12-1-2019 | | | | 55,000 | | | | 55,063 | |
| | | | |
Wisconsin Housing & EDA Series A | | | 1.95 | | | | 12-1-2020 | | | | 55,000 | | | | 55,420 | |
| | | | |
Wisconsin Housing & EDA Series A | | | 3.00 | | | | 5-1-2022 | | | | 100,000 | | | | 103,590 | |
| | | | |
Wisconsin Housing & EDA Series A | | | 3.00 | | | | 11-1-2022 | | | | 125,000 | | | | 130,291 | |
| | | | |
Wisconsin Housing & EDA Series A | | | 3.40 | | | | 11-1-2032 | | | | 2,450,000 | | | | 2,583,721 | |
| | | | |
Wisconsin Housing & EDA Series A | | | 4.05 | | | | 12-1-2049 | | | | 800,000 | | | | 825,328 | |
| | | | |
Wisconsin Housing & EDA Series A | | | 5.75 | | | | 11-1-2043 | | | | 2,835,000 | | | | 2,897,540 | |
| | | | |
Wisconsin Housing & EDA Series A | | | 3.95 | | | | 11-1-2038 | | | | 2,000,000 | | | | 2,150,700 | |
| | | | |
Wisconsin Housing & EDA Series C | | | 3.88 | | | | 11-1-2035 | | | | 1,000,000 | | | | 1,053,060 | |
| | | | |
| | | | | | | | | | | | | | | 19,775,555 | |
| | | | | | | | | | | | | | | | |
| | | | |
| Miscellaneous Revenue: 22.30% | | | | | | | | | | | | |
| | | | |
Ashwaubenon WI CDA Lease Revenue CAB Brown County Expo Center ¤ | | | 0.00 | | | | 6-1-2049 | | | | 8,000,000 | | | | 2,656,400 | |
| | | | |
Glendale WI CDA Bayshore Public Parking | | | 1.50 | | | | 10-1-2019 | | | | 375,000 | | | | 375,068 | |
| | | | |
Kaukauna WI RDA | | | 3.75 | | | | 6-1-2032 | | | | 850,000 | | | | 897,022 | |
| | | | |
Kaukauna WI RDA | | | 4.00 | | | | 6-1-2020 | | | | 100,000 | | | | 102,379 | |
| | | | |
Kaukauna WI RDA | | | 4.00 | | | | 6-1-2021 | | | | 310,000 | | | | 324,145 | |
| | | | |
Kaukauna WI RDA | | | 4.00 | | | | 6-1-2022 | | | | 235,000 | | | | 250,534 | |
| | | | |
Kaukauna WI RDA | | | 4.00 | | | | 6-1-2023 | | | | 200,000 | | | | 217,148 | |
| | | | |
Kaukauna WI RDA | | | 4.00 | | | | 6-1-2025 | | | | 425,000 | | | | 473,926 | |
| | | | |
Kaukauna WI RDA | | | 4.00 | | | | 6-1-2028 | | | | 425,000 | | | | 468,461 | |
| | | | |
Kaukauna WI RDA | | | 4.00 | | | | 6-1-2035 | | | | 900,000 | | | | 965,511 | |
| | | | |
Milwaukee WI RDA Lease Public Schools Series A | | | 5.00 | | | | 11-15-2026 | | | | 220,000 | | | | 268,440 | |
| | | | |
Milwaukee WI RDA Lease Revenue Public Schools | | | 5.00 | | | | 11-15-2033 | | | | 750,000 | | | | 882,368 | |
| | | | |
Milwaukee WI RDA Milwaukee Public Schools | | | 5.00 | | | | 11-15-2034 | | | | 675,000 | | | | 791,593 | |
| | | | |
Milwaukee WI RDA Milwaukee Public Schools | | | 5.00 | | | | 11-15-2035 | | | | 1,000,000 | | | | 1,170,860 | |
| | | | |
Milwaukee WI RDA Milwaukee Public Schools | | | 5.00 | | | | 11-15-2036 | | | | 500,000 | | | | 584,150 | |
Wells Fargo Wisconsin Tax-Free Fund | 13
Portfolio of investments—June 30, 2019
| | | | | | | | | | | | | | | | |
| | | Interest
rate | | | Maturity date | | | Principal | | | Value | |
| | | | |
| Miscellaneous Revenue (continued) | | | | | | | | | | | | |
| | | | |
Milwaukee WI RDA Milwaukee Public Schools Series A | | | 5.00 | % | | | 11-15-2027 | | | $ | 1,020,000 | | | $ | 1,235,516 | |
| | | | |
Milwaukee WI RDA Milwaukee Public Schools Series A | | | 5.00 | | | | 11-15-2028 | | | | 1,000,000 | | | | 1,206,610 | |
| | | | |
Milwaukee WI RDA Milwaukee Public Schools Series A | | | 5.00 | | | | 11-15-2031 | | | | 750,000 | | | | 889,643 | |
| | | | |
Milwaukee WI RDA Public Schools Series A | | | 5.00 | | | | 8-1-2019 | | | | 915,000 | | | | 917,654 | |
| | | | |
Milwaukee WI RDA Public Schools Series A | | | 5.00 | | | | 8-1-2020 | | | | 1,100,000 | | | | 1,142,669 | |
| | | | |
Milwaukee WI RDA Public Schools Series A | | | 5.00 | | | | 8-1-2021 | | | | 3,330,000 | | | | 3,567,362 | |
| | | | |
Milwaukee WI RDA Summer Festival Project | | | 4.60 | | | | 8-1-2024 | | | | 870,000 | | | | 871,923 | |
| | | | |
Milwaukee WI RDA Summer Festival Project | | | 4.70 | | | | 8-1-2025 | | | | 110,000 | | | | 110,254 | |
| | | | |
Milwaukee WI RDA Summer Festival Project | | | 5.00 | | | | 8-1-2030 | | | | 5,000,000 | | | | 5,012,900 | |
| | | | |
Prairie du Chien WI RDA Series B | | | 1.65 | | | | 9-1-2020 | | | | 200,000 | | | | 200,412 | |
| | | | |
Warrens WI CDA Economic Improvements | | | 5.10 | | | | 11-1-2020 | | | | 70,000 | | | | 67,019 | |
| | | | |
Weston WI CDA Series A | | | 1.40 | | | | 10-1-2019 | | | | 625,000 | | | | 624,356 | |
| | | | |
Weston WI CDA Series A | | | 1.50 | | | | 10-1-2020 | | | | 500,000 | | | | 498,950 | |
| | | | |
Weston WI CDA Series A | | | 1.60 | | | | 10-1-2021 | | | | 340,000 | | | | 339,487 | |
| | | | |
Weston WI CDA Series A | | | 1.75 | | | | 10-1-2022 | | | | 200,000 | | | | 200,220 | |
| | | | |
Weston WI CDA Series A | | | 1.90 | | | | 10-1-2023 | | | | 100,000 | | | | 100,881 | |
| | | | |
Weston WI CDA Series A | | | 2.00 | | | | 10-1-2024 | | | | 625,000 | | | | 634,150 | |
| | | | |
Weston WI CDA Series A | | | 2.15 | | | | 10-1-2025 | | | | 615,000 | | | | 629,692 | |
| | | | |
Weston WI CDA Series A | | | 2.25 | | | | 10-1-2026 | | | | 940,000 | | | | 971,123 | |
| | | | |
Weston WI CDA Series A | | | 2.40 | | | | 10-1-2027 | | | | 570,000 | | | | 588,206 | |
| | | | |
| | | | | | | | | | | | | | | 30,237,032 | |
| | | | | | | | | | | | | | | | |
| | | | |
| Tax Revenue: 18.47% | | | | | | | | | | | | |
| | | | |
Mount Pleasant WI Tax Increment Series 2018A | | | 4.00 | | | | 4-1-2035 | | | | 1,295,000 | | | | 1,439,898 | |
| | | | |
Mount Pleasant WI Tax Increment Series 2018A | | | 5.00 | | | | 4-1-2034 | | | | 1,000,000 | | | | 1,215,910 | |
| | | | |
Southeast Wisconsin Professional Baseball Park District Series A (National Insured) | | | 5.50 | | | | 12-15-2019 | | | | 100,000 | | | | 101,912 | |
| | | | |
Southeast Wisconsin Professional Baseball Park District Series A (National Insured) | | | 5.50 | | | | 12-15-2021 | | | | 2,000,000 | | | | 2,201,100 | |
| | | | |
Southeast Wisconsin Professional Baseball Park District Series A (National Insured) | | | 5.50 | | | | 12-15-2023 | | | | 1,600,000 | | | | 1,870,928 | |
| | | | |
Southeast Wisconsin Professional Baseball Park District Series A (National Insured) | | | 5.50 | | | | 12-15-2026 | | | | 2,435,000 | | | | 2,986,333 | |
| | | | |
Warrens WI CDA Interim Workout Extension | | | 3.70 | | | | 11-1-2029 | | | | 155,045 | | | | 97,900 | |
| | | | |
Wisconsin Center District CAB (AGM Insured) ¤ | | | 0.00 | | | | 12-15-2030 | | | | 295,000 | | | | 222,917 | |
| | | | |
Wisconsin Center District CAB Senior Dedicated Milwaukee Arena Project Series A (Build America Mutual Assurance Company Insured) ¤ | | | 0.00 | | | | 12-15-2033 | | | | 2,985,000 | | | | 1,916,728 | |
| | | | |
Wisconsin Center District CAB Series A (National Insured) ¤ | | | 0.00 | | | | 12-15-2019 | | | | 275,000 | | | | 273,169 | |
| | | | |
Wisconsin Center District CAB Series A (National Insured) ¤ | | | 0.00 | | | | 12-15-2027 | | | | 100,000 | | | | 83,699 | |
| | | | |
Wisconsin Center District Junior Dedicated Bond (AGM Insured) | | | 5.25 | | | | 12-15-2019 | | | | 500,000 | | | | 508,605 | |
| | | | |
Wisconsin Center District Junior Dedicated Bond (AGM Insured) | | | 5.25 | | | | 12-15-2023 | | | | 2,150,000 | | | | 2,378,696 | |
| | | | |
Wisconsin Center District Junior Dedicated Bond (AGM Insured) | | | 5.25 | | | | 12-15-2027 | | | | 1,005,000 | | | | 1,205,005 | |
| | | | |
Wisconsin Center District Junior Dedicated Bond Series A | | | 5.00 | | | | 12-15-2022 | | | | 730,000 | | | | 807,314 | |
| | | | |
Wisconsin Center District Junior Dedicated Bond Series A | | | 5.00 | | | | 12-15-2030 | | | | 2,100,000 | | | | 2,316,447 | |
| | | | |
Wisconsin Center District Milwaukee Arena Project | | | 4.00 | | | | 12-15-2032 | | | | 1,100,000 | | | | 1,220,054 | |
| | | | |
Wisconsin Center District Milwaukee Arena Project | | | 4.00 | | | | 12-15-2033 | | | | 920,000 | | | | 1,017,511 | |
| | | | |
Wisconsin Center District Milwaukee Arena Project | | | 4.00 | | | | 12-15-2034 | | | | 2,000,000 | | | | 2,198,440 | |
| | | | |
Wisconsin Oneida Tribe of Indians 144A | | | 5.50 | | | | 2-1-2021 | | | | 965,000 | | | | 984,406 | |
| | | | |
| | | | | | | | | | | | | | | 25,046,972 | |
| | | | | | | | | | | | | | | | |
| | | | |
| | | | | | | | | | | | | | | 109,385,163 | |
| | | | | | | | | | | | | | | | |
| | | | |
Total Municipal Obligations (Cost $128,236,135) | | | | | | | | | | | | | | | 133,737,846 | |
| | | | | | | | | | | | | | | | |
| | | | | | | | |
| Total investments in securities (Cost $128,236,135) | | | 98.63 | % | | | 133,737,846 | |
| | |
Other assets and liabilities, net | | | 1.37 | | | | 1,851,664 | |
| | | | | | | | |
| Total net assets | | | 100.00 | % | | $ | 135,589,510 | |
| | | | | | | | |
14 | Wells Fargo Wisconsin Tax-Free Fund
Portfolio of investments—June 30, 2019
| ¤ | The security is issued in zero coupon form with no periodic interest payments. |
| 144A | The security may be resold in transactions exempt from registration, normally to qualified institutional buyers, pursuant to Rule 144A under the Securities Act of 1933. |
| ø | Variable rate demand notes are subject to a demand feature which reduces the effective maturity. The maturity date shown represents the final maturity date of the security. The interest rate is determined and reset by the issuer daily, weekly, or monthly depending upon the terms of the security. The rate shown is the rate in effect at period end. |
Abbreviations:
| AGC | Assured Guaranty Corporation |
| AGM | Assured Guaranty Municipal |
| Ambac | Ambac Financial Group Incorporated |
| AMT | Alternative minimum tax |
| BHAC | Berkshire Hathaway Assurance Corporation |
| CAB | Capital appreciation bond |
| CDA | Community Development Authority |
| EDA | Economic Development Authority |
| FGIC | Financial Guaranty Insurance Corporation |
| HEFA | Health & Educational Facilities Authority |
| National | National Public Finance Guarantee Corporation |
| PFA | Public Finance Authority |
| RDA | Redevelopment Authority |
| TTFA | Transportation Trust Fund Authority |
Wells Fargo Wisconsin Tax-Free Fund | 15
Statement of assets and liabilities—June 30, 2019
| | | | |
| | | | |
| |
Assets | | | | |
Investments in unaffiliated securities, at value (cost $128,236,135) | | $ | 133,737,846 | |
Cash | | | 315,056 | |
Receivable for investments sold | | | 240,000 | |
Receivable for Fund shares sold | | | 31,207 | |
Receivable for interest | | | 1,351,176 | |
Prepaid expenses and other assets | | | 86,402 | |
| | | | |
Total assets | | | 135,761,687 | |
| | | | |
| |
Liabilities | | | | |
Payable for Fund shares redeemed | | | 83,862 | |
Dividends payable | | | 28,346 | |
Management fee payable | | | 20,711 | |
Administration fees payable | | | 14,952 | |
Distribution fee payable | | | 4,144 | |
Trustees’ fees and expenses payable | | | 1,306 | |
Shareholder servicing fees payable | | | 18,856 | |
| | | | |
Total liabilities | | | 172,177 | |
| | | | |
Total net assets | | $ | 135,589,510 | |
| | | | |
| |
Net assets consist of | | | | |
Paid-in capital | | $ | 130,125,746 | |
Total distributable earnings | | | 5,463,764 | |
| | | | |
Total net assets | | $ | 135,589,510 | |
| | | | |
| |
Computation of net asset value and offering price per share | | | | |
Net assets – Class A | | $ | 84,924,387 | |
Shares outstanding – Class A1 | | | 7,690,536 | |
Net asset value per share – Class A | | | $11.04 | |
Maximum offering price per share – Class A2 | | | $11.56 | |
Net assets – Class C | | $ | 6,686,698 | |
Shares outstanding – Class C1 | | | 605,516 | |
Net asset value per share – Class C | | | $11.04 | |
Net assets – Institutional Class | | $ | 43,978,425 | |
Shares outstanding – Institutional Class1 | | | 3,982,127 | |
Net asset value per share – Institutional Class | | | $11.04 | |
| 1 | The Fund has an unlimited number of authorized shares. |
| 2 | Maximum offering price is computed as 100/95.50 of net asset value. On investments of $50,000 or more, the offering price is reduced. |
The accompanying notes are an integral part of these financial statements.
16 | Wells Fargo Wisconsin Tax-Free Fund
Statement of operations—year ended June 30, 2019
| | | | |
| | | | |
| |
Investment income | | | | |
Interest | | $ | 4,419,857 | |
| | | | |
| |
Expenses | | | | |
Management fee | | | 525,245 | |
Administration fees | | | | |
Class A | | | 134,401 | |
Class C | | | 11,945 | |
Institutional Class | | | 31,876 | |
Shareholder servicing fees | | | | |
Class A | | | 210,002 | |
Class C | | | 18,665 | |
Distribution fee | | | | |
Class C | | | 55,994 | |
Custody and accounting fees | | | 4,073 | |
Professional fees | | | 52,536 | |
Registration fees | | | 77,057 | |
Shareholder report expenses | | | 7,946 | |
Trustees’ fees and expenses | | | 21,457 | |
Other fees and expenses | | | 10,446 | |
| | | | |
Total expenses | | | 1,161,643 | |
Less: Fee waivers and/or expense reimbursements | | | (258,189 | ) |
| | | | |
Net expenses | | | 903,454 | |
| | | | |
Net investment income | | | 3,516,403 | |
| | | | |
| |
Realized and unrealized gains (losses) on investments | | | | |
Net realized gains (losses) on: | | | | |
Unaffiliated securities | | | (2,960 | ) |
Futures contracts | | | 129,518 | |
| | | | |
Net realized gains on investments | | | 126,558 | |
Net change in unrealized gains (losses) on investments | | | 3,483,261 | |
| | | | |
Net realized and unrealized gains (losses) on investments | | | 3,609,819 | |
| | | | |
Net increase in net assets resulting from operations | | $ | 7,126,222 | |
| | | | |
The accompanying notes are an integral part of these financial statements.
Wells Fargo Wisconsin Tax-Free Fund | 17
Statement of changes in net assets
| | | | | | | | | | | | | | | | |
| | | Year ended
June 30, 2019 | | | Year ended
June 30, 20181 | |
| | | |
Operations | | | | | | | | | | | | |
Net investment income | | | | | | $ | 3,516,403 | | | | | | | $ | 3,599,283 | |
Net realized gains on investments | | | | | | | 126,558 | | | | | | | | 438,289 | |
Net change in unrealized gains (losses) on investments | | | | | | | 3,483,261 | | | | | | | | (1,547,565 | ) |
| | | | |
Net increase in net assets resulting from operations | | | | | | | 7,126,222 | | | | | | | | 2,490,007 | |
| | | | |
| | | | |
Distributions to shareholders from net investment income and net realized gains | | | | | | | | | | | | | | | | |
Class A | | | | | | | (2,238,227 | ) | | | | | | | (2,888,504 | ) |
Class C | | | | | | | (143,110 | ) | | | | | | | (159,161 | ) |
Institutional Class | | | | | | | (1,134,640 | ) | | | | | | | (551,618 | ) |
| | | | |
Total distributions to shareholders | | | | | | | (3,515,977 | ) | | | | | | | (3,599,283 | ) |
| | | | |
| | | | |
Capital share transactions | | | Shares | | | | | | | | Shares | | | | | |
Proceeds from shares sold | | | | | | | | | | | | | | | | |
Class A | | | 1,158,956 | | | | 12,526,702 | | | | 1,129,437 | | | | 12,227,348 | |
Class C | | | 74,617 | | | | 800,958 | | | | 97,473 | | | | 1,053,625 | |
Institutional Class | | | 1,478,452 | | | | 15,865,780 | | | | 2,428,890 | | | | 26,124,983 | |
| | | | |
| | | | | | | 29,193,440 | | | | | | | | 39,405,956 | |
| | | | |
Reinvestment of distributions | | | | | | | | | | | | | | | | |
Class A | | | 172,502 | | | | 1,862,955 | | | | 237,522 | | | | 2,567,343 | |
Class C | | | 13,234 | | | | 142,770 | | | | 14,637 | | | | 158,123 | |
Institutional Class | | | 104,377 | | | | 1,127,881 | | | | 51,060 | | | | 550,646 | |
| | | | |
| | | | | | | 3,133,606 | | | | | | | | 3,276,112 | |
| | | | |
Payment for shares redeemed | | | | | | | | | | | | | | | | |
Class A | | | (1,815,160 | ) | | | (19,476,467 | ) | | | (5,332,606 | ) | | | (57,620,587 | ) |
Class C | | | (236,996 | ) | | | (2,549,096 | ) | | | (229,697 | ) | | | (2,483,639 | ) |
Institutional Class | | | (969,212 | ) | | | (10,399,087 | ) | | | (364,389 | ) | | | (3,932,185 | ) |
| | | | |
| | | | | | | (32,424,650 | ) | | | | | | | (64,036,411 | ) |
| | | | |
Net decrease in net assets resulting from capital share transactions | | | | | | | (97,604 | ) | | | | | | | (21,354,343 | ) |
| | | | |
Total increase (decrease) in net assets | | | | | | | 3,512,641 | | | | | | | | (22,463,619 | ) |
| | | | |
| | | | |
Net assets | | | | | | | | | | | | | | | | |
Beginning of period | | | | | | | 132,076,869 | | | | | | | | 154,540,488 | |
| | | | |
End of period | | | | | | $ | 135,589,510 | | | | | | | $ | 132,076,869 | |
| | | | |
| 1 | Effective for all filings after November 4, 2018, the SEC prospectively eliminated the requirement to parenthetically disclose undistributed net investment income at the end of the period and permitted the aggregation of distributions, with the exception of tax basis returns of capital. Overdistributed net investment income at June 30, 2018 was $10,724. The disaggregated distributions information for the year ended June 30, 2018 is included in Note 8,Distributions to Shareholders, in the notes to the financial statements. |
The accompanying notes are an integral part of these financial statements.
18 | Wells Fargo Wisconsin Tax-Free Fund
Financial highlights
(For a share outstanding throughout each period)
| | | | | | | | | | | | | | | | | | | | |
| | | Year ended June 30 | |
| CLASS A | | 2019 | | | 2018 | | | 2017 | | | 2016 | | | 2015 | |
Net asset value, beginning of period | | | $10.74 | | | | $10.83 | | | | $11.16 | | | | $10.83 | | | | $10.96 | |
Net investment income | | | 0.29 | | | | 0.28 | | | | 0.26 | | | | 0.25 | | | | 0.24 | |
Net realized and unrealized gains (losses) on investments | | | 0.30 | | | | (0.09 | ) | | | (0.32 | ) | | | 0.33 | | | | (0.02 | ) |
| | | | | | | | | | | | | | | | | | | | |
Total from investment operations | | | 0.59 | | | | 0.19 | | | | (0.06 | ) | | | 0.58 | | | | 0.22 | |
Distributions to shareholders from | | | | | | | | | | | | | | | | | | | | |
Net investment income | | | (0.29 | ) | | | (0.28 | ) | | | (0.26 | ) | | | (0.25 | ) | | | (0.24 | ) |
Net realized gains | | | 0.00 | | | | 0.00 | | | | (0.01 | ) | | | (0.00 | )1 | | | (0.11 | ) |
| | | | | | | | | | | | | | | | | | | | |
Total distributions to shareholders | | | (0.29 | ) | | | (0.28 | ) | | | (0.27 | ) | | | (0.25 | ) | | | (0.35 | ) |
Net asset value, end of period | | | $11.04 | | | | $10.74 | | | | $10.83 | | | | $11.16 | | | | $10.83 | |
Total return2 | | | 5.56 | % | | | 1.76 | % | | | (0.48 | )% | | | 5.44 | % | | | 2.07 | % |
Ratios to average net assets (annualized) | | | | | | | | | | | | | | | | | | | | |
Gross expenses | | | 0.94 | % | | | 0.88 | % | | | 0.93 | % | | | 0.94 | % | | | 0.90 | % |
Net expenses | | | 0.70 | % | | | 0.70 | % | | | 0.70 | % | | | 0.70 | % | | | 0.70 | % |
Net investment income | | | 2.66 | % | | | 2.57 | % | | | 2.41 | % | | | 2.26 | % | | | 2.22 | % |
Supplemental data | | | | | | | | | | | | | | | | | | | | |
Portfolio turnover rate | | | 8 | % | | | 11 | % | | | 27 | % | | | 16 | % | | | 28 | % |
Net assets, end of period (000s omitted) | | | $84,924 | | | | $87,790 | | | | $131,518 | | | | $160,480 | | | | $23,824 | |
| 1 | Amount is less than $0.005. |
| 2 | Total return calculations do not include any sales charges. |
The accompanying notes are an integral part of these financial statements.
Wells Fargo Wisconsin Tax-Free Fund | 19
Financial highlights
(For a share outstanding throughout each period)
| | | | | | | | | | | | | | | | | | | | |
| | | Year ended June 30 | |
| CLASS C | | 2019 | | | 2018 | | | 2017 | | | 2016 | | | 2015 | |
Net asset value, beginning of period | | | $10.74 | | | | $10.83 | | | | $11.16 | | | | $10.83 | | | | $10.96 | |
Net investment income | | | 0.21 | | | | 0.20 | | | | 0.18 | | | | 0.17 | | | | 0.16 | |
Net realized and unrealized gains (losses) on investments | | | 0.30 | | | | (0.09 | ) | | | (0.32 | ) | | | 0.33 | | | | (0.02 | ) |
| | | | | | | | | | | | | | | | | | | | |
Total from investment operations | | | 0.51 | | | | 0.11 | | | | (0.14 | ) | | | 0.50 | | | | 0.14 | |
Distributions to shareholders from | | | | | | | | | | | | | | | | | | | | |
Net investment income | | | (0.21 | ) | | | (0.20 | ) | | | (0.18 | ) | | | (0.17 | ) | | | (0.16 | ) |
Net realized gains | | | 0.00 | | | | 0.00 | | | | (0.01 | ) | | | (0.00 | )1 | | | (0.11 | ) |
| | | | | | | | | | | | | | | | | | | | |
Total distributions to shareholders | | | (0.21 | ) | | | (0.20 | ) | | | (0.19 | ) | | | (0.17 | ) | | | (0.27 | ) |
Net asset value, end of period | | | $11.04 | | | | $10.74 | | | | $10.83 | | | | $11.16 | | | | $10.83 | |
Total return2 | | | 4.78 | % | | | 1.01 | % | | | (1.22 | )% | | | 4.66 | % | | | 1.31 | % |
Ratios to average net assets (annualized) | | | | | | | | | | | | | | | | | | | | |
Gross expenses | | | 1.69 | % | | | 1.63 | % | | | 1.68 | % | | | 1.68 | % | | | 1.65 | % |
Net expenses | | | 1.45 | % | | | 1.45 | % | | | 1.45 | % | | | 1.45 | % | | | 1.45 | % |
Net investment income | | | 1.92 | % | | | 1.83 | % | | | 1.67 | % | | | 1.52 | % | | | 1.47 | % |
Supplemental data | | | | | | | | | | | | | | | | | | | | |
Portfolio turnover rate | | | 8 | % | | | 11 | % | | | 27 | % | | | 16 | % | | | 28 | % |
Net assets, end of period (000s omitted) | | | $6,687 | | | | $8,105 | | | | $9,449 | | | | $10,949 | | | | $10,923 | |
| 1 | Amount is less than $0.005. |
| 2 | Total return calculations do not include any sales charges. |
The accompanying notes are an integral part of these financial statements.
20 | Wells Fargo Wisconsin Tax-Free Fund
Financial highlights
(For a share outstanding throughout each period)
| | | | | | | | | | | | |
| | | Year ended June 30 | |
| INSTITUTIONAL CLASS | | 2019 | | | 2018 | | | 20171 | |
Net asset value, beginning of period | | | $10.74 | | | | $10.83 | | | | $10.99 | |
Net investment income | | | 0.31 | | | | 0.30 | | | | 0.20 | |
Net realized and unrealized gains (losses) on investments | | | 0.30 | | | | (0.09 | ) | | | (0.15 | ) |
| | | | | | | | | | | | |
Total from investment operations | | | 0.61 | | | | 0.21 | | | | 0.05 | |
Distributions to shareholders from | | | | | | | | | | | | |
Net investment income | | | (0.31 | ) | | | (0.30 | ) | | | (0.20 | ) |
Net realized gains | | | 0.00 | | | | 0.00 | | | | (0.01 | ) |
| | | | | | | | | | | | |
Total distributions to shareholders | | | (0.31 | ) | | | (0.30 | ) | | | (0.21 | ) |
Net asset value, end of period | | | $11.04 | | | | $10.74 | | | | $10.83 | |
Total return2 | | | 5.75 | % | | | 1.95 | % | | | 0.44 | % |
Ratios to average net assets (annualized) | | | | | | | | | | | | |
Gross expenses | | | 0.61 | % | | | 0.55 | % | | | 0.54 | % |
Net expenses | | | 0.52 | % | | | 0.52 | % | | | 0.52 | % |
Net investment income | | | 2.85 | % | | | 2.79 | % | | | 2.74 | % |
Supplemental data | | | | | | | | | | | | |
Portfolio turnover rate | | | 8 | % | | | 11 | % | | | 27 | % |
Net assets, end of period (000s omitted) | | | $43,978 | | | | $36,181 | | | | $13,573 | |
| 1 | For the period from October 31, 2016 (commencement of class operations) to June 30, 2017 |
| 2 | Returns for periods of less than one year are not annualized. |
The accompanying notes are an integral part of these financial statements.
Wells Fargo Wisconsin Tax-Free Fund | 21
Notes to financial statements
1. ORGANIZATION
Wells Fargo Funds Trust (the “Trust”), a Delaware statutory trust organized on March 10, 1999, is an open-end management investment company registered under the Investment Company Act of 1940, as amended (the “1940 Act”). As an investment company, the Trust follows the accounting and reporting guidance in Financial Accounting Standards Board (“FASB”) Accounting Standards Codification Topic 946, Financial Services – Investment Companies. These financial statements report on the Wells Fargo Wisconsin Tax-Free Fund (the “Fund”) which is a non-diversified series of the Trust.
2. SIGNIFICANT ACCOUNTING POLICIES
The following significant accounting policies, which are consistently followed in the preparation of the financial statements of the Fund, are in conformity with U.S. generally accepted accounting principles which require management to make estimates and assumptions that affect the reported amounts of assets and liabilities, disclosure of contingent assets and liabilities at the date of the financial statements, and the reported amounts of revenues and expenses during the reporting period. Actual results could differ from those estimates.
Securities valuation
All investments are valued each business day as of the close of regular trading on the New York Stock Exchange (generally 4 p.m. Eastern Time), although the Fund may deviate from this calculation time under unusual or unexpected circumstances.
Debt securities are valued at the evaluated bid price provided by an independent pricing service (e.g. taking into account various factors, including yields, maturities, or credit ratings) or, if a reliable price is not available, the quoted bid price from an independent broker-dealer.
Futures contracts that are listed on a foreign or domestic exchange or market are valued at the official closing price or, if none, the last sales price.
Investments which are not valued using any of the methods discussed above are valued at their fair value, as determined in good faith by the Board of Trustees of the Fund. The Board of Trustees has established a Valuation Committee comprised of the Trustees and has delegated to it the authority to take any actions regarding the valuation of portfolio securities that the Valuation Committee deems necessary or appropriate, including determining the fair value of portfolio securities, unless the determination has been delegated to the Wells Fargo Asset Management Pricing Committee at Wells Fargo Funds Management, LLC (“Funds Management”). The Board of Trustees retains the authority to make or ratify any valuation decisions or approve any changes to the Valuation Procedures as it deems appropriate. On a quarterly basis, the Board of Trustees receives reports on any valuation actions taken by the Valuation Committee or the Wells Fargo Asset Management Pricing Committee which may include items for ratification.
When-issued transactions
The Fund may purchase securities on a forward commitment or when-issued basis. The Fund records a when-issued transaction on the trade date and will segregate assets in an amount at least equal in value to the Fund’s commitment to purchase when-issued securities. Securities purchased on a when-issued basis are marked-to-market daily and the Fund begins earning interest on the settlement date. Losses may arise due to changes in the market value of the underlying securities or if the counterparty does not perform under the contract.
Futures contracts
Futures contracts are agreements between the Fund and a counterparty to buy or sell a specific amount of a commodity, financial instrument or currency at specified price and on a specified date. The Fund may buy and sell futures contracts in order to gain exposure to, or protect against, changes in interest rates and is subject to interest rate risk. The primary risks associated with the use of futures contracts are the imperfect correlation between changes in market values of securities held by the Fund and the prices of futures contracts, and the possibility of an illiquid market. Futures contracts are generally entered into on a regulated futures exchange and cleared through a clearinghouse associated with the exchange. With futures contracts, there is minimal counterparty risk to the Fund since futures contracts are exchange traded and the exchange’s clearinghouse, as counterparty to all exchange traded futures, guarantees the futures contracts against default.
Upon entering into a futures contracts, the Fund is required to deposit either cash or securities (initial margin) with the broker in an amount equal to a certain percentage of the contract value. Subsequent payments (variation margin) are paid to or from the broker each day equal to the daily changes in the contract value. Such payments are recorded as unrealized gains or losses and, if any, shown as variation margin receivable (payable) in the Statement of Assets and Liabilities. Should the Fund fail to make requested variation margin payments, the broker can gain access to the initial margin to satisfy the Fund’s payment obligations. When the contracts are closed, a realized gain or loss is recorded in the Statement of Operations.
22 | Wells Fargo Wisconsin Tax-Free Fund
Notes to financial statements
Security transactions and income recognition
Securities transactions are recorded on a trade date basis. Realized gains or losses are recorded on the basis of identified cost.
Interest income is accrued daily and bond discounts are accreted and premiums are amortized daily. To the extent debt obligations are placed on non-accrual status, any related interest income may be reduced by writing off interest receivables when the collection of all or a portion of interest has been determined to be doubtful based on consistently applied procedures and the fair value has decreased. If the issuer subsequently resumes interest payments or when the collectability of interest is reasonably assured, the debt obligation is removed from non-accrual status.
Distributions to shareholders
Distributions to shareholders from net investment income are declared daily and paid monthly. Distributions from net realized gains, if any, are recorded on the ex-dividend date and paid at least annually. Such distributions are determined in accordance with income tax regulations and may differ from U.S. generally accepted accounting principles. Dividend sources are estimated at the time of declaration. The tax character of distributions is determined as of the Fund’s fiscal year end. Therefore, a portion of the Fund’s distributions made prior to the Fund’s fiscal year end may be categorized as a tax return of capital at year end.
Federal and other taxes
The Fund intends to continue to qualify as a regulated investment company by distributing substantially all of its investment company taxable and tax-exempt income and any net realized capital gains (after reduction for capital loss carryforwards) sufficient to relieve it from all, or substantially all, federal income taxes. Accordingly, no provision for federal income taxes was required.
The Fund’s income and federal excise tax returns and all financial records supporting those returns for the prior three fiscal years are subject to examination by the federal and Delaware revenue authorities. Management has analyzed the Fund’s tax positions taken on federal, state, and foreign tax returns for all open tax years and does not believe that there are any uncertain tax positions that require recognition of a tax liability.
As of June 30, 2019, the aggregate cost of all investments for federal income tax purposes was $128,235,650 and the unrealized gains (losses) consisted of:
| | | | |
| |
Gross unrealized gains | | $ | 5,532,939 | |
| |
Gross unrealized losses | | | (30,743 | ) |
| |
Net unrealized gains | | $ | 5,502,196 | |
As of June 30, 2019, the Fund had capital loss carryforwards which consisted of $28,128 in short-term capital losses.
Class allocations
The separate classes of shares offered by the Fund differ principally in applicable sales charges, distribution, shareholder servicing, and administration fees. Class specific expenses are charged directly to that share class. Investment income, common fund-level expenses, and realized and unrealized gains (losses) on investments are allocated daily to each class of shares based on the relative proportion of net assets of each class.
3. FAIR VALUATION MEASUREMENTS
Fair value measurements of investments are determined within a framework that has established a fair value hierarchy based upon the various data inputs utilized in determining the value of the Fund’s investments. The three-level hierarchy gives the highest priority to unadjusted quoted prices in active markets for identical assets or liabilities (Level 1) and the lowest priority to unobservable inputs (Level 3). The Fund’s investments are classified within the fair value hierarchy based on the lowest level of input that is significant to the fair value measurement. The inputs are summarized into three broad levels as follows:
| ∎ | | Level 1 – quoted prices in active markets for identical securities |
| ∎ | | Level 2 – other significant observable inputs (including quoted prices for similar securities, interest rates, prepayment speeds, credit risk, etc.) |
| ∎ | | Level 3 – significant unobservable inputs (including the Fund’s own assumptions in determining the fair value of investments) |
The inputs or methodologies used for valuing investments in securities are not necessarily an indication of the risk associated with investing in those securities.
Wells Fargo Wisconsin Tax-Free Fund | 23
Notes to financial statements
The following is a summary of the inputs used in valuing the Fund’s assets and liabilities as of June 30, 2019:
| | | | | | | | | | | | | | | | |
| | | | |
| | | Quoted prices
(Level 1) | | | Other significant
observable inputs
(Level 2) | | | Significant
unobservable inputs (Level 3) | | | Total | |
| | | | |
Assets | | | | | | | | | | | | | | | | |
Investments in: | | | | | | | | | | | | | | | | |
| | | | |
Municipal obligations | | $ | 0 | | | $ | 133,737,846 | | | $ | 0 | | | $ | 133,737,846 | |
Additional sector, industry or geographic detail is included in the Portfolio of Investments.
At June 30, 2019, the Fund did not have any transfers into/out of Level 3.
4. TRANSACTIONS WITH AFFILIATES
Management fee
Funds Management, an indirect wholly owned subsidiary of Wells Fargo & Company (“Wells Fargo”), is the manager of the Fund and provides advisory and fund-level administrative services under an investment management agreement. Under the investment management agreement, Funds Management is responsible for, among other services, implementing the investment objectives and strategies of the Fund, supervising the subadviser and providing fund-level administrative services in connection with the Fund’s operations. As compensation for its services under the investment management agreement, Funds Management is entitled to receive a management fee at the following annual rate based on the Fund’s average daily net assets:
| | | | |
| |
| Average daily net assets | | Management fee | |
| |
First $500 million | | | 0.400 | % |
| |
Next $500 million | | | 0.375 | |
| |
Next $2 billion | | | 0.350 | |
| |
Next $2 billion | | | 0.325 | |
| |
Next $5 billion | | | 0.290 | |
| |
Over $10 billion | | | 0.280 | |
For the year ended June 30, 2019, the management fee was equivalent to an annual rate of 0.40% of the Fund’s average daily net assets.
Funds Management has retained the services of a subadviser to provide daily portfolio management to the Fund. The fee for subadvisory services is borne by Funds Management. Wells Capital Management Incorporated, an affiliate of Funds Management and an indirect wholly owned subsidiary of Wells Fargo is the subadviser to the Fund and is entitled to receive a fee from Funds Management at an annual rate starting at 0.20% and declining to 0.10% as the average daily net assets of the Fund increase.
Administration fees
Under a class-level administration agreement, Funds Management provides class-level administrative services to the Fund, which includes paying fees and expenses for services provided by the transfer agent, sub-transfer agents, omnibus account servicers and record-keepers. As compensation for its services under the class-level administration agreement, Funds Management receives an annual fee which is calculated based on the average daily net assets of each class as follows:
| | |
| |
| | | Class-level
administration fee |
| |
Class A, Class C | | 0.16% |
| |
Institutional Class | | 0.08 |
Funds Management has contractually waived and/or reimbursed management and administration fees to the extent necessary to maintain certain net operating expense ratios for the Fund. When each class of the Fund has exceeded its expense cap, Funds Management has waived fees and/or reimbursed expenses from fund-level expenses on a proportionate basis and then from class specific expenses. When only certain classes exceed their expense caps, waivers and/or reimbursements are applied against class specific expenses before fund-level expenses. Funds Management has committed through October 31, 2019 to
24 | Wells Fargo Wisconsin Tax-Free Fund
Notes to financial statements
waive fees and/or reimburse expenses to the extent necessary to cap the Fund’s expenses at 0.70% for Class A shares, 1.45% for Class C shares, and 0.52% for Institutional Class shares. Prior to or after the commitment expiration date, the cap may be increased or the commitment to maintain the cap may be terminated only with the approval of the Board of Trustees.
Distribution fee
The Trust has adopted a distribution plan for Class C shares of the Fund pursuant to Rule 12b-1 under the 1940 Act. A distribution fee is charged to Class C shares and paid to Wells Fargo Funds Distributor, LLC (“Funds Distributor”), the principal underwriter, at an annual rate of 0.75% of the average daily net assets of Class C shares.
In addition, Funds Distributor is entitled to receive the front-end sales charge from the purchase of Class A shares and a contingent deferred sales charge on the redemption of certain Class A shares. Funds Distributor is also entitled to receive the contingent deferred sales charges from redemptions of Class C shares. For the year ended June 30, 2019, Funds Distributor received $5,475 from the sale of Class A shares. No contingent deferred sales charges were incurred by Class A and Class C shares for the year ended June 30, 2019.
Shareholder servicing fees
The Trust has entered into contracts with one or more shareholder servicing agents, whereby Class A and Class C of the Fund are charged a fee at an annual rate of 0.25% of the average daily net assets of each respective class. A portion of these total shareholder servicing fees were paid to affiliates of Wells Fargo.
Interfund transactions
The Fund may purchase or sell portfolio investment securities to certain other Wells Fargo affiliates pursuant to Rule 17a-7 under the 1940 Act and under procedures adopted by the Board of Trustees. The procedures have been designed to ensure that these interfund transactions, which do not incur broker commissions, are effected at current market prices. Pursuant to these procedures, the Fund had $3,600,000 and $3,985,000 in interfund purchases and sales, respectively, during the year ended June 30, 2019.
5. INVESTMENT PORTFOLIO TRANSACTIONS
Purchases and sales of investments, excluding U.S. government obligations (if any) and short-term securities, for the year ended June 30, 2019 were $10,788,645 and $18,481,600, respectively.
6. DERIVATIVE TRANSACTIONS
During the year ended June 30, 2019 the Fund entered into futures contracts to gain market exposure. The Fund had an average notional amount of $1,551,019 in long futures contracts during the year ended June 30, 2019.
The fair value, realized gains or losses and change in unrealized gains or losses, if any, on derivative instruments are reflected in the corresponding financial statement captions.
7. BANK BORROWINGS
The Trust (excluding the money market funds), Wells Fargo Master Trust and Wells Fargo Variable Trust are parties to a $280,000,000 revolving credit agreement whereby the Fund is permitted to use bank borrowings for temporary or emergency purposes, such as to fund shareholder redemption requests. Interest under the credit agreement is charged to the Fund based on a borrowing rate equal to the higher of the Federal Funds rate in effect on that day plus 1.25% or the overnight LIBOR rate in effect on that day plus 1.25%. In addition, an annual commitment fee equal to 0.25% of the unused balance is allocated to each participating fund.
For the year ended June 30, 2019, there were no borrowings by the Fund under the agreement.
8. DISTRIBUTIONS TO SHAREHOLDERS
The tax character of distributions paid was $3,515,977 and $3,599,283 of tax-exempt income for the years ended June 30, 2019 and June 30, 2018, respectively.
As of June 30, 2019, the components of distributable earnings on a tax basis were as follows:
| | | | |
Undistributed
tax-exempt
income | | Unrealized
gains | | Capital loss carryforward |
| | |
| $18,042 | | $5,502,196 | | $(28,128) |
Wells Fargo Wisconsin Tax-Free Fund | 25
Notes to financial statements
Effective for all filings after November 4, 2018, the Securities and Exchange Commission eliminated the requirement to separately state the components of distributions to shareholders under U.S. generally accepted accounting principles. The amounts of distributions to shareholders for the year ended June 30, 2018 were as follows:
| | | | |
| |
| | | Net investment income | |
| |
Class A | | | $2,888,504 | |
| |
Class C | | | 159,161 | |
| |
Institutional Class | | | 551,618 | |
9. CONCENTRATION RISK
The Fund invests a substantial portion of its assets in issuers of municipal debt securities located in a single state or territory of the U.S. Therefore, it may be more affected by economic and political developments in that state or region than would be a comparable general tax-exempt fund.
10. INDEMNIFICATION
Under the Trust’s organizational documents, the officers and Trustees have been granted certain indemnification rights against certain liabilities that may arise out of performance of their duties to the Trust. Additionally, in the normal course of business, the Trust may enter into contracts with service providers that contain a variety of indemnification clauses. The Trust’s maximum exposure under these arrangements is dependent on future claims that may be made against the Fund and, therefore, cannot be estimated.
11. NEW ACCOUNTING PRONOUNCEMENTS
In August 2018, FASB issued Accounting Standards Update (“ASU”) No. 2018-13, Fair Value Measurement (Topic 820)Disclosure Framework—Changes to the Disclosure Requirements for Fair Value Measurement. ASU 2018-13 updates the disclosure requirements for fair value measurements by modifying or removing certain disclosures and adding certain new disclosures. The amendments are effective for fiscal years, and interim periods within those fiscal years, beginning after December 15, 2019. Early adoption is permitted. Management has adopted the removal and modification of disclosures early, as permitted, and will adopt the additional new disclosures at the effective date.
In March 2017, FASB issued ASU No. 2017-08,Premium Amortization on Purchased Callable Debt Securities. ASU 2017-08 shortens the amortization period for certain callable debt securities held at a premium and requires the premium to be amortized to the earliest call date. The amendments do not require an accounting change for securities held at a discount and discounts will continue to be accreted to the maturity date of the security. ASU 2017-08 is effective for fiscal years beginning after December 15, 2018 and for interim periods within those fiscal years. During the current reporting period, management of the Fund adopted the change in accounting policy which did not have a material impact to the Fund’s financial statements.
26 | Wells Fargo Wisconsin Tax-Free Fund
Report of independent registered public accounting firm
TO THE SHAREHOLDERS OF THE FUND AND BOARD OF TRUSTEES OF WELLS FARGO FUNDS TRUST:
Opinion on the Financial Statements
We have audited the accompanying statement of assets and liabilities of Wells Fargo Wisconsin Tax-Free Fund (the Fund), one of the funds constituting Wells Fargo Funds Trust, including the portfolio of investments, as of June 30, 2019, the related statement of operations for the year then ended, the statements of changes in net assets for each of the years in the two year period then ended, and the related notes (collectively, the financial statements) and the financial highlights for each of the years or periods in the five year period then ended. In our opinion, the financial statements and financial highlights present fairly, in all material respects, the financial position of the Fund as of June 30, 2019, the results of its operations for the year then ended, the changes in its net assets for each of the years in the two year period then ended, and the financial highlights for each of the years or periods in the five year period then ended, in conformity with U.S. generally accepted accounting principles.
Basis for Opinion
These financial statements and financial highlights are the responsibility of the Fund’s management. Our responsibility is to express an opinion on these financial statements and financial highlights based on our audits. We are a public accounting firm registered with the Public Company Accounting Oversight Board (United States) (PCAOB) and are required to be independent with respect to the Fund in accordance with the U.S. federal securities laws and the applicable rules and regulations of the Securities and Exchange Commission and the PCAOB.
We conducted our audits in accordance with the standards of the PCAOB. Those standards require that we plan and perform the audit to obtain reasonable assurance about whether the financial statements and financial highlights are free of material misstatement, whether due to error or fraud. Our audits included performing procedures to assess the risks of material misstatement of the financial statements and financial highlights, whether due to error or fraud, and performing procedures that respond to those risks. Such procedures included examining, on a test basis, evidence regarding the amounts and disclosures in the financial statements and financial highlights. Such procedures also included confirmation of securities owned as of June 30, 2019, by correspondence with the custodian or by other appropriate auditing procedures. Our audits also included evaluating the accounting principles used and significant estimates made by management, as well as evaluating the overall presentation of the financial statements and financial highlights. We believe that our audits provide a reasonable basis for our opinion.

We have not been able to determine the specific year that we began serving as the auditor of one or more Wells Fargo Funds investment companies; however we are aware that we have served as the auditor of one or more Wells Fargo Funds investment companies since at least 1955.
Boston, Massachusetts
August 26, 2019
Wells Fargo Wisconsin Tax-Free Fund | 27
Other information (unaudited)
TAX INFORMATION
Pursuant to Section 852 of the Internal Revenue Code, 100% of distributions paid from net investment income is designated as exempt-interest dividends for the fiscal year ended June 30, 2019.
PROXY VOTING INFORMATION
A description of the policies and procedures used to determine how to vote proxies relating to portfolio securities is available, upon request, by calling1-800-222-8222, visiting our website atwfam.com, or visiting the SEC website at sec.gov. Information regarding how the proxies related to portfolio securities were voted during the most recent 12-month period ended June 30 is available on the website atwfam.com or by visiting the SEC website at sec.gov.
QUARTERLY PORTFOLIO HOLDINGS INFORMATION
The Fund files its complete schedule of portfolio holdings with the SEC for the first and third quarters of each fiscal year on Form N-Q or Form N-PORT, which is available by visiting the SEC website at sec.gov. Those forms may be reviewed and copied at the SEC’s Public Reference Room in Washington, DC. Information on the operation of the Public Reference Room may be obtained by calling 1-800-SEC-0330.
28 | Wells Fargo Wisconsin Tax-Free Fund
Other information (unaudited)
BOARD OF TRUSTEES AND OFFICERS
Each of the Trustees and Officers1 listed in the table below acts in identical capacities for each fund in the Wells Fargo family of funds, which consists of 152 mutual funds comprising the Wells Fargo Funds Trust, Wells Fargo Variable Trust, Wells Fargo Master Trust and four closed-end funds (collectively the “Fund Complex”). This table should be read in conjunction with the Prospectus and the Statement of Additional Information2. The mailing address of each Trustee and Officer is 525 Market Street, 12th Floor, San Francisco, CA 94105. Each Trustee and Officer serves an indefinite term, however, each Trustee serves such term until reaching the mandatory retirement age established by the Trustees.
Independent Trustees
| | | | | | |
Name and year of birth | | Position held and
length of service* | | Principal occupations during past five years or longer | | Current other
public company or
investment
company
directorships |
| | | |
William R. Ebsworth (Born 1957) | | Trustee, since 2015 | | Retired. From 1984 to 2013, equities analyst, portfolio manager, research director and chief investment officer at Fidelity Management and Research Company in Boston, Tokyo, and Hong Kong, and retired in 2013 as Chief Investment Officer of Fidelity Strategic Advisers, Inc. where he led a team of investment professionals managing client assets. Prior thereto, Board member of Hong Kong Securities Clearing Co., Hong Kong Options Clearing Corp., the Thailand International Fund, Ltd., Fidelity Investments Life Insurance Company, and Empire Fidelity Investments Life Insurance Company. Audit Committee Chair and Investment Committee Chair of the Vincent Memorial Hospital Endowment (non-profit organization). Mr. Ebsworth is a CFA® charterholder. | | N/A |
| | | |
Jane A. Freeman (Born 1953) | | Trustee, since 2015; Chair Liaison, since 2018 | | Retired. From 2012 to 2014 and 1999 to 2008, Chief Financial Officer of Scientific Learning Corporation. From 2008 to 2012, Ms. Freeman provided consulting services related to strategic business projects. Prior to 1999, Portfolio Manager at Rockefeller & Co. and Scudder, Stevens & Clark. Board member of the Harding Loevner Funds from 1996 to 2014, serving as both Lead Independent Director and chair of the Audit Committee. Board member of the Russell Exchange Traded Funds Trust from 2011 to 2012 and the chair of the Audit Committee. Ms. Freeman is a Board Member of The Ruth Bancroft Garden (non-profit organization). She is also an inactive Chartered Financial Analyst. | | N/A |
| | | |
Isaiah Harris, Jr. (Born 1952) | | Trustee, since 2009; Audit Committee Chairman, since 2019 | | Retired. Chairman of the Board of CIGNA Corporation since 2009, and Director since 2005. From 2003 to 2011, Director of Deluxe Corporation. Prior thereto, President and CEO of BellSouth Advertising and Publishing Corp. from 2005 to 2007, President and CEO of BellSouth Enterprises from 2004 to 2005 and President of BellSouth Consumer Services from 2000 to 2003. Emeritus member of the Iowa State University Foundation Board of Governors. Emeritus Member of the Advisory Board of Iowa State University School of Business. Advisory Board Member, Palm Harbor Academy (private school). Advisory Board Member, Child Evangelism Fellowship (non-profit). Mr. Harris is a certified public accountant (inactive status). | | CIGNA Corporation |
| | | |
Judith M. Johnson (Born 1949) | | Trustee, since 2008; Audit Committee Chairman, from 2009 to 2018 | | Retired. Prior thereto, Chief Executive Officer and Chief Investment Officer of Minneapolis Employees Retirement Fund from 1996 to 2008. Ms. Johnson is an attorney, certified public accountant and a certified managerial accountant. | | N/A |
Wells Fargo Wisconsin Tax-Free Fund | 29
Other information (unaudited)
| | | | | | |
Name and year of birth | | Position held and
length of service* | | Principal occupations during past five years or longer | | Current other
public company or
investment
company
directorships |
| | | |
David F. Larcker (Born 1950) | | Trustee, since 2009 | | James Irvin Miller Professor of Accounting at the Graduate School of Business, Stanford University, Director of the Corporate Governance Research Initiative and Senior Faculty of The Rock Center for Corporate Governance since 2006. From 2005 to 2008, Professor of Accounting at the Graduate School of Business, Stanford University. Prior thereto, Ernst & Young Professor of Accounting at The Wharton School, University of Pennsylvania from 1985 to 2005. | | N/A |
| | | |
Olivia S. Mitchell (Born 1953) | | Trustee, since 2006; Nominating and Governance Committee Chairman, since 2018 | | International Foundation of Employee Benefit Plans Professor, Wharton School of the University of Pennsylvania since 1993. Director of Wharton’s Pension Research Council and Boettner Center on Pensions & Retirement Research, and Research Associate at the National Bureau of Economic Research. Previously, Cornell University Professor from 1978 to 1993. | | N/A |
| | | |
Timothy J. Penny (Born 1951) | | Trustee, since 1996; Chairman, since 2018 | | President and Chief Executive Officer of Southern Minnesota Initiative Foundation, a non-profit organization, since 2007. Member of the Board of Trustees of NorthStar Education Finance, Inc., a non-profit organization, since 2007. | | N/A |
| | | |
James G. Polisson (Born 1959) | | Trustee, since 2018 | | Retired. Chief Marketing Officer, Source (ETF) UK Services, Ltd, from 2015 to 2017. From 2012 to 2015, Principal of The Polisson Group, LLC, a management consulting, corporate advisory and principal investing company. Chief Executive Officer and Managing Director at Russell Investments, Global Exchange Traded Funds from 2010 to 2012. Managing Director of Barclays Global Investors from 1998 to 2010 and Global Chief Marketing Officer for iShares and Barclays Global Investors from 2000 to 2010. Trustee of the San Francisco Mechanics’ Institute, a non-profit organization, from 2013 to 2015. Board member of the Russell Exchange Traded Fund Trust from 2011 to 2012. Director of Barclays Global Investors Holdings Deutschland GmbH from 2006 to 2009. Mr. Polisson is an attorney and has a retired status with the Massachusetts and District of Columbia Bar Associations. | | N/A |
| * | Length of service dates reflect the Trustee’s commencement of service with the Trust’s predecessor entities, where applicable. |
30 | Wells Fargo Wisconsin Tax-Free Fund
Other information (unaudited)
Officers
| | | | |
Name and year of birth | | Position held and
length of service | | Principal occupations during past five years or longer |
| | |
Andrew Owen (Born 1960) | | President, since 2017 | | Executive Vice President of Wells Fargo & Company and Head of Affiliated Managers, Wells Fargo Asset Management, since 2014. In addition, Mr. Owen is currently President, Chief Executive Officer and Director of Wells Fargo Funds Management, LLC since 2017. Prior thereto, Executive Vice President responsible for marketing, investments and product development for Wells Fargo Funds Management, LLC, from 2009 to 2014. |
| | |
Nancy Wiser1 (Born 1967) | | Treasurer, since 2012 | | Executive Vice President of Wells Fargo Funds Management, LLC since 2011. Chief Operating Officer and Chief Compliance Officer at LightBox Capital Management LLC, from 2008 to 2011. |
| | |
Alexander Kymn (Born 1973) | | Secretary and Chief Legal Officer, since 2018 | | Senior Company Counsel of Wells Fargo Bank, N.A. since 2018 (previously Senior Counsel from 2007 to 2018). Vice President of Wells Fargo Funds Management, LLC from 2008 to 2014. |
| | |
| Michael H. Whitaker (Born 1967) | | Chief Compliance Officer, since 2016 | | Senior Vice President and Chief Compliance Officer since 2016. Senior Vice President and Chief Compliance Officer for Fidelity Investments from 2007 to 2016. |
| | |
David Berardi (Born 1975) | | Assistant Treasurer, since 2009 | | Vice President of Wells Fargo Funds Management, LLC since 2009. Vice President of Evergreen Investment Management Company, LLC from 2008 to 2010. Manager of Fund Reporting and Control for Evergreen Investment Management Company, LLC from 2004 to 2010. |
| | |
Jeremy DePalma1 (Born 1974) | | Assistant Treasurer, since 2009 | | Senior Vice President of Wells Fargo Funds Management, LLC since 2009. Senior Vice President of Evergreen Investment Management Company, LLC from 2008 to 2010 and head of the Fund Reporting and Control Team within Fund Administration from 2005 to 2010. |
| 1 | Nancy Wiser acts as Treasurer of 65 funds in the Fund Complex. Jeremy DePalma acts as Treasurer of 87 funds and Assistant Treasurer of 65 funds in the Fund Complex. |
| 2 | The Statement of Additional Information includes additional information about the Trustees and is available, without charge, upon request, by calling 1-800-222-8222 or by visiting the website atwfam.com. |
Wells Fargo Wisconsin Tax-Free Fund | 31
Other information (unaudited)
BOARD CONSIDERATION OF INVESTMENT MANAGEMENT AND SUB-ADVISORY AGREEMENTS:
Wells Fargo Wisconsin Tax-Free Fund
Under the Investment Company Act of 1940 (the “1940 Act”), the Board of Trustees (the “Board”) of Wells Fargo Funds Trust (the “Trust”) must determine annually whether to approve the continuation of the Trust’s investment management and sub-advisory agreements. In this regard, at an in-person meeting held on May 21-22, 2019 (the “Meeting”), the Board, all the members of which have no direct or indirect interest in the investment management and sub-advisory agreements and are not “interested persons” of the Trust, as defined in the 1940 Act (the “Independent Trustees”), reviewed and approved for Wells Fargo Wisconsin Tax-Free Fund (the “Fund”): (i) an investment management agreement (the “Management Agreement”) with Wells Fargo Funds Management, LLC (“Funds Management”); and (ii) an investment sub-advisory agreement (the “Sub-Advisory Agreement”) with Wells Capital Management Incorporated (the “Sub-Adviser”), an affiliate of Funds Management. The Management Agreement and the Sub-Advisory Agreement are collectively referred to as the “Advisory Agreements.”
At the Meeting, the Board considered the factors and reached the conclusions described below relating to the selection of Funds Management and the Sub-Adviser and the approval of the Advisory Agreements. Prior to the Meeting, including at an in-person meeting in April 2019, the Trustees conferred extensively among themselves and with representatives of Funds Management about these matters. Also, the Board has adopted a team-based approach, with each team consisting of a sub-set of Trustees, to assist the full Board in the discharge of its duties in reviewing investment performance and other matters throughout the year. The Independent Trustees were assisted in their evaluation of the Advisory Agreements by independent legal counsel, from whom they received separate legal advice and with whom they met separately.
In providing information to the Board, Funds Management and the Sub-Adviser were guided by a detailed set of requests for information submitted to them by independent legal counsel on behalf of the Independent Trustees at the start of the Board’s annual contract renewal process earlier in 2019. In considering and approving the Advisory Agreements, the Trustees considered the information they believed relevant, including but not limited to the information discussed below. The Board considered not only the specific information presented in connection with the Meeting, but also the knowledge gained over time through interaction with Funds Management and the Sub-Adviser about various topics. In this regard, the Board reviewed reports of Funds Management at each of its quarterly meetings, which included, among other things, portfolio reviews and investment performance reports. In addition, the Board and the teams mentioned above confer with portfolio managers at various times throughout the year. The Board did not identify any particular information or consideration that was all-important or controlling, and each individual Trustee may have attributed different weights to various factors.
After its deliberations, the Board unanimously approved the continuation of the Advisory Agreements for a one-year term and determined that the compensation payable to Funds Management and the Sub-Adviser under each of the Advisory Agreements was reasonable. The Board considered the approval of the Advisory Agreements for the Fund as part of its consideration of agreements for funds across the complex, but its approvals were made on a fund-by-fund basis. The following summarizes a number of important, but not necessarily all, factors considered by the Board in support of its approvals.
Nature, extent and quality of services
The Board received and considered various information regarding the nature, extent and quality of services provided to the Fund by Funds Management and the Sub-Adviser under the Advisory Agreements. This information included a description of the investment advisory services and Fund-level administrative services covered by the Management Agreement, as well as, among other things, a summary of the background and experience of senior management of Wells Fargo Asset Management (“WFAM”), of which Funds Management and the Sub-Adviser are a part, a summary of investments made in the business of WFAM, a summary of certain organizational and personnel changes involving Funds Management and the Sub-Adviser, and a description of Funds Management’s and the Sub-Adviser’s business continuity planning programs and of their approaches to data privacy and cybersecurity. The Board received and reviewed information about Funds Management’s role as administrator of the Fund’s liquidity risk management program. The Board also considered the qualifications, background, tenure and responsibilities of each of the portfolio managers primarily responsible for the day-to-day portfolio management of the Fund.
The Board evaluated the ability of Funds Management and the Sub-Adviser to attract and retain qualified investment professionals, including research, advisory and supervisory personnel. The Board further considered the compliance programs and compliance records of Funds Management and the Sub-Adviser. In addition, the Board took into account the full range of services provided to the Fund by Funds Management and its affiliates.
Fund investment performance and expenses
The Board considered the investment performance results for the Fund over various time periods ended December 31, 2018. The Board considered these results in comparison to the investment performance of funds in a universe that was determined by
32 | Wells Fargo Wisconsin Tax-Free Fund
Other information (unaudited)
Broadridge Inc. (“Broadridge”) to be similar to the Fund (the “Universe”), and in comparison to the Fund’s benchmark index and to other comparative data. Broadridge is an independent provider of investment company data. The Board received a description of the methodology used by Broadridge to select the mutual funds in the performance Universe. The Board noted that the investment performance of the Fund (Class A) was higher than the average investment performance of the Universe for the one- and three-year periods under review, and lower than the average investment performance of the Universe for the five- and ten-year periods under review. The Board also noted that the investment performance of the Fund was lower than its benchmark index, the Bloomberg Barclays Municipal Bond Index, for the three-, five- and ten-year periods under review, but higher than its benchmark for the one-year period under review.
The Board received information concerning, and discussed factors contributing to, the underperformance of the Fund relative to the Universe and benchmark index for the periods identified above. The Board took note of the explanations for the relative underperformance during these periods, including with respect to investment decisions and market factors that affected the Fund’s investment performance.
The Board also received and considered information regarding the Fund’s net operating expense ratios and their various components, including actual management fees, custodian and other non-management fees, and Rule 12b-1 and non-Rule 12b-1 shareholder service fees. The Board considered these ratios in comparison to the median ratios of funds in class-specific expense groups that were determined by Broadridge to be similar to the Fund (the “Groups”). The Board received a description of the methodology used by Broadridge to select the mutual funds in the expense Groups and an explanation of how funds comprising expense groups and their expense ratios may vary from year-to-year. Based on the Broadridge reports, the Board noted that the net operating expense ratios of the Fund were lower than the median net operating expense ratios of the expense Groups for each share class.
The Board took into account the Fund’s investment performance and expense information provided to it among the factors considered in deciding to re-approve the Advisory Agreements.
Investment management and sub-advisory fee rates
The Board reviewed and considered the contractual fee rates payable by the Fund to Funds Management under the Management Agreement, as well as the contractual fee rates payable by the Fund to Funds Management for class-level administrative services under a Class-Level Administration Agreement, which include, among other things, class-level transfer agency and sub-transfer agency costs (collectively, the “Management Rates”). The Board also reviewed and considered the contractual investment sub-advisory fee rates that are payable by Funds Management to the Sub-Adviser for investment sub-advisory services.
Among other information reviewed by the Board was a comparison of the Fund’s Management Rates with the average contractual investment management fee rates of funds in the expense Groups at a common asset level as well as transfer agency costs of the funds in the expense Groups. The Board noted that the Management Rates of the Fund were lower than or equal to the sum of these average rates for the Fund’s expense Groups for all share classes.
The Board also received and considered information about the portion of the total management fee that was retained by Funds Management after payment of the fee to the Sub-Adviser for sub-advisory services. In assessing the reasonableness of this amount, the Board received and evaluated information about the nature and extent of responsibilities retained and risks assumed by Funds Management and not delegated to or assumed by the Sub-Adviser, and about Funds Management’s on-going oversight services. Given the affiliation between Funds Management and the Sub-Adviser, the Board ascribed limited relevance to the allocation of fees between them.
The Board also received and considered information about the nature and extent of services offered and fee rates charged by Funds Management and the Sub-Adviser to other types of clients with investment strategies similar to those of the Fund. In this regard, the Board received information about the significantly greater scope of services, and compliance, reporting and other legal burdens and risks of managing proprietary mutual funds compared with those associated with managing assets of other types of clients, including third-party sub-advised fund clients and non-mutual fund clients such as institutional separate accounts.
Based on its consideration of the factors and information it deemed relevant, including those described here, the Board determined that the compensation payable to Funds Management under the Management Agreement and to the Sub-Adviser under the Sub-Advisory Agreement was reasonable.
Profitability
The Board received and considered information concerning the profitability of Funds Management, as well as the profitability of both WFAM and Wells Fargo & Co. (“Wells Fargo”) from providing services to the fund family as a whole. The Board noted that the Sub-Adviser’s profitability information with respect to providing services to the Fund and other funds in the family was subsumed in the WFAM and Wells Fargo profitability analysis.
Wells Fargo Wisconsin Tax-Free Fund | 33
Other information (unaudited)
Funds Management reported on the methodologies and estimates used in calculating profitability, including a description of the methodology used to allocate certain expenses. Among other things, the Board noted that the levels of profitability reported on a fund-by-fund basis varied widely, depending on factors such as the size, type and age of fund. Based on its review, the Board did not deem the profits reported by Funds Management, WFAM or Wells Fargo from services provided to the Fund to be at a level that would prevent it from approving the continuation of the Advisory Agreements.
Economies of scale
The Board received and considered information about the potential for Funds Management to experience economies of scale in the provision of management services to the Fund, the difficulties of calculating economies of scale at an individual fund level, and the extent to which potential scale benefits are shared with shareholders. The Board noted the existence of breakpoints in the Fund’s management fee structure, which operate generally to reduce the Fund’s expense ratios as the Fund grows in size. The Board considered that in addition to management fee breakpoints, Funds Management shares potential economies of scale from its management business in a variety of ways, including through fee waiver and expense reimbursement arrangements, services that benefit shareholders, competitive management fee rates set at the outset without regard to breakpoints, and investments in the business intended to enhance services available to shareholders.
The Board concluded that Funds Management’s arrangements with respect to the Fund, including contractual breakpoints, constituted a reasonable approach to sharing potential economies of scale with the Fund and its shareholders.
Other benefits to Funds Management and the Sub-Adviser
The Board received and considered information regarding potential “fall-out” or ancillary benefits received by Funds Management and its affiliates, including the Sub-Adviser, as a result of their relationships with the Fund. Ancillary benefits could include, among others, benefits directly attributable to other relationships with the Fund and benefits potentially derived from an increase in Funds Management’s and the Sub-Adviser’s business as a result of their relationships with the Fund. The Board noted that various affiliates of Funds Management may receive distribution-related fees, shareholder servicing payments and sub-transfer agency fees in respect of shares sold or held through them and services provided.
The Board also reviewed information about soft dollar credits earned and utilized by the Sub-Adviser, fees earned by Funds Management and the Sub-Adviser from managing a private investment vehicle for the fund family’s securities lending collateral, and commissions earned by an affiliated broker from portfolio transactions.
Based on its consideration of the factors and information it deemed relevant, including those described here, the Board did not find that any ancillary benefits received by Funds Management and its affiliates, including the Sub-Adviser, were unreasonable.
Conclusion
At the Meeting, after considering the above-described factors and based on its deliberations and its evaluation of the information described above, the Board unanimously approved the continuation of the Advisory Agreements for a one-year term and determined that the compensation payable to Funds Management and the Sub-Adviser under each of the Advisory Agreements was reasonable.
34 | Wells Fargo Wisconsin Tax-Free Fund
This page is intentionally left blank.
This page is intentionally left blank.

For more information
More information about Wells Fargo Funds is available free upon request. To obtain literature, please write, visit the Fund’s website, or call:
Wells Fargo Funds
P.O. Box 219967
Kansas City, MO 64121-9967
Website:wfam.com
Individual investors:1-800-222-8222
Retail investment professionals:1-888-877-9275
Institutional investment professionals:1-866-765-0778

This report and the financial statements contained herein are submitted for the general information of the shareholders of the Fund. If this report is used for promotional purposes, distribution of the report must be accompanied or preceded by a current prospectus. Before investing, please consider the investment objectives, risks, charges, and expenses of the investment. For a current prospectus and, if available, a summary prospectus, containing this information, call1-800-222-8222 or visit the Fund’s website atwfam.com. Read the prospectus carefully before you invest or send money.
Wells Fargo Asset Management (WFAM) is the trade name for certain investment advisory/management firms owned by Wells Fargo & Company. These firms include but are not limited to Wells Capital Management Incorporated and Wells Fargo Funds Management, LLC. Certain products managed by WFAM entities are distributed by Wells Fargo Funds Distributor, LLC (a broker-dealer and Member FINRA).
This material is for general informational and educational purposes only and is NOT intended to provide investment advice or a recommendation of any kind—including a recommendation for any specific investment, strategy, or plan.
INVESTMENT PRODUCTS: NOT FDIC INSURED ◾ NO BANK GUARANTEE ◾ MAY LOSE VALUE
© 2019 Wells Fargo Funds Management, LLC. All rights reserved.
404830 08-19
A259/AR259 06-19
Annual Report
June 30, 2019
Wells Fargo
Pennsylvania Tax-Free Fund
Beginning on January 1, 2021, as permitted by new regulations adopted by the Securities and Exchange Commission, paper copies of the Wells Fargo Funds’ annual and semi-annual shareholder reports issued after this date will no longer be sent by mail, unless you specifically request paper copies of the reports. Instead, the reports will be made available on the Funds’ website, and you will be notified by mail each time a report is posted and provided with a website address to access the report.
If you already elected to receive shareholder reports electronically, you will not be affected by this change and you need not take any action. You may elect to receive shareholder reports and other communications from the Fund electronically at any time by contacting your financial intermediary (such as a broker-dealer or bank) or, if you are a direct investor, by calling1-800-222-8222 or by enrolling at wellsfargo.com/advantagedelivery.
You may elect to receive all future reports in paper free of charge. If you invest through a financial intermediary, you can contact your financial intermediary to request that you continue to receive paper copies of your shareholder reports; if you invest directly with the Fund, you can call 1-800-222-8222. Your election to receive reports in paper will apply to all Wells Fargo Funds held in your account with your financial intermediary or, if you are a direct investor, to all Wells Fargo Funds that you hold.
|
|
|
Reduce clutter. Save trees. |
Sign up for electronic delivery of prospectuses and shareholder reports atwellsfargo.com/advantagedelivery |
The views expressed and any forward-looking statements are as of June 30, 2019, unless otherwise noted, and are those of the Fund managers and/or Wells Fargo Asset Management. Discussions of individual securities, or the markets generally, or any Wells Fargo Fund are not intended as individual recommendations. Future events or results may vary significantly from those expressed in any forward-looking statements. The views expressed are subject to change at any time in response to changing circumstances in the market. Wells Fargo Asset Management and the Fund disclaim any obligation to publicly update or revise any views expressed or forward-looking statements.
INVESTMENT PRODUCTS: NOT FDIC INSURED ◾ NO BANK GUARANTEE ◾ MAY LOSE VALUE
Wells Fargo Pennsylvania Tax-Free Fund | 1
Letter to shareholders (unaudited)

Andrew Owen
President
Wells Fargo Funds
Dear Shareholder:
We are pleased to offer you this annual report for the Wells Fargo PennsylvaniaTax-Free Fund for the12-month period that ended June 30, 2019. After the first six months of the period yielded eitherlow-single-digit or negative investment returns, stock and bond investors enjoyed a recovery during the final six months. The gains came amid continued concerns about global economic growth, international trade, geopolitical tensions, and bouts of market volatility.
For the period, U.S. stocks, based on the S&P 500 Index,1 gained 10.42% and international stocks, as measured by the MSCI ACWI ex USA Index (Net),2 rose 1.29%. The MSCI EM Index (Net)3 added 1.21%. For bond investors, the Bloomberg Barclays U.S. Aggregate Bond Index4 added 7.87%, the Bloomberg Barclays Global Aggregateex-USD Index5 rose 4.10%, the Bloomberg Barclays Municipal Bond Index6 gained 6.71%, and the ICE BofAML U.S. High Yield Index7 added 7.58%.
U.S. and international markets diverged during the third quarter of 2018.
Domestic equity investors received encouraging news during the third quarter of 2018. The U.S. Bureau of Economic Analysis reported second-quarter annualized gross domestic product (GDP) growth of 4.2%. Hiring improved. Unemployment declined. Consumer confidence and spending increased. Third-quarter corporate earnings reports were generally positive. U.S. trade negotiations with Mexico and Canada progressed. The U.S. Federal Reserve (Fed) raised the federal funds rate by 25 basis points (bps; 100 bps equal 1.00%) to a target range of between 2.00% and 2.25% in September, one of four rate increases implemented during 2018, expressing confidence in the strength of the U.S. economic expansion’s durability.
Investors in international markets were not as confident. Tensions between the U.S. and China increased. The U.S. imposed $200 billion in tariffs on Chinese goods. China reacted with $60 billion in tariffs on U.S. goods. Economic growth in China caused concern. During the quarter, the MSCI ACWI ex USA Index (Net) gained 0.71%. The MSCI EM Index (Net) declined 1.09%. In fixed-income markets, U.S. bonds were flat, as measured by the Bloomberg Barclays U.S. Aggregate Bond Index. The Bloomberg Barclays Global Aggregateex-USD Index fell 1.74%.
| 1 | The S&P 500 Index consists of 500 stocks chosen for market size, liquidity, and industry group representation. It is a market-value-weighted index with each stock’s weight in the index proportionate to its market value. You cannot invest directly in an index. |
| 2 | The Morgan Stanley Capital International (MSCI) All Country World Index (ACWI) ex USA Index (Net) is a free-float-adjusted market-capitalization weighted index that is designed to measure the equity market performance of developed and emerging markets, excluding the U.S. Source: MSCI. MSCI makes no express or implied warranties or representations and shall have no liability whatsoever with respect to any MSCI data contained herein. The MSCI data may not be further redistributed or used as a basis for other indices or any securities or financial products. This report is not approved, reviewed, or produced by MSCI. You cannot invest directly in an index. |
| 3 | The MSCI Emerging Markets (EM) Index (Net) is a free-float-adjusted market-capitalization-weighted index that is designed to measure the equity market performance of emerging markets. You cannot invest directly in an index. |
| 4 | The Bloomberg Barclays U.S. Aggregate Bond Index is a broad-based benchmark that measures the investment-grade, U.S. dollar-denominated, fixed-rate taxable bond market, including Treasuries, government-related and corporate securities, mortgage-backed securities (agency fixed-rate and hybrid adjustable-rate mortgage pass-throughs), asset-backed securities, and commercial mortgage-backed securities. You cannot invest directly in an index. |
| 5 | The Bloomberg Barclays Global Aggregateex-USD Index is an unmanaged index that provides a broad-based measure of the global investment-grade fixed-income markets excluding the U.S. dollar-denominated debt market. You cannot invest directly in an index. |
| 6 | The Bloomberg Barclays Municipal Bond Index is an unmanaged index composed of long-termtax-exempt bonds with a minimum credit rating of Baa. You cannot invest directly in an index. |
| 7 | The ICE BofAML U.S. High Yield Index is a market-capitalization-weighted index of domestic and Yankee high-yield bonds. The index tracks the performance of high-yield securities traded in the U.S. bond market. You cannot invest directly in an index. Copyright 2019. ICE Data Indices, LLC. All rights reserved. |
2 | Wells Fargo Pennsylvania Tax-Free Fund
Letter to shareholders (unaudited)
Global markets suffered during the fourth quarter of 2018.
November’s U.S. midterm elections shifted control of the House of Representatives from Republicans to Democrats, presaging partisan clashes that followed and caused uncertainty among investors. Third-quarter U.S. GDP was announced at an annualized 3.4% rate, lower than the second-quarter rate. Brexit efforts stalled ahead of the March 2019 deadline. The People’s Bank of China cut reserve requirement ratios, accelerated infrastructure spending, and cut taxes even as the value of the yuan declined to low levels last seen in 2008. A partial U.S. government shutdown driven by partisan policy disputes extended into January.
The combination of news in the U.S. and generally weak economic indicators outside of the U.S. caused investors to seek safe havens. December’s S&P 500 Index performance was the worst since 1931. Globally, fixed-income investments fared better than stocks during the last two months of the year. The Fed increased the federal funds rate by 25 bps in December to a target range of between 2.25% and 2.50%.
The market climbs a wall of worry.
Investors entered 2019 with reasons to be concerned. Investment returns appeared to reaffirm the adage that markets climb a wall of worry. The S&P 500 Index gained 8.01% for the month of January, the best monthly performance in 30 years. Returns for the MSCI ACWI ex USA Index (Net), the Bloomberg Barclays U.S. Aggregate Bond Index, and the Bloomberg Barclays Global Aggregateex-USD Index also were positive. The Fed indicated that it would pause its program of regular rate increases during 2019 as inflation remained low.
In February 2019, concerns over slowing global growth persisted. The Bureau of Economic Analysis announced fourth-quarter 2018 GDP grew at an annualized 2.2% rate, down from the levels of the prior two quarters. In a February report, the Bank of England forecast the slowest growth since the financial crisis for 2019. China and the U.S. continued to wrangle over trade issues.
By the end of March 2019, the combination of dovish Fed sentiment and steady, if not spectacular, economic and business metrics reinforced investors’ confidence. Monthly job creation data and corporate profits, while less consistent than during 2018, were solid. China announced a roughly $300 billion stimulus package through tax and fee cuts intended to reinvigorate economic growth.
During April 2019, investors drew confidence from favorable economic projections, sustained low inflation, and solid employment data. First-quarter GDP showed the economy grew at an annualized rate of 3.2% on improvement in business investment and exports. Favorable sentiment extended to foreign markets as the MSCI ACWI ex USA Index (Net) gained 2.64% and the MSCI EM Index (Net) added 2.11% for the month.
During May 2019, investing signals were mixed. In the U.S., partisan wrangling ramped up as Democrats and Republicans set their sights on 2020 presidential politics. The U.K.’s Brexit caused Prime Minister Theresa May to resign. The European Commission downgraded the 2019 growth forecast to 1.2%. The U.S. increased tariffs on products from China, China responded, and then talks broke down. President Donald Trump threatened to turn his foreign policy tariff tool to Mexico over immigration issues. Markets tumbled.
As had been the case during most of 2019 to date, just as the investment horizon appeared to darken, sentiment turned and markets gained. The gains, primarily driven by geopolitical and monetary policy events, drove equity markets to new highs. President Trump dropped his threats of new tariffs on Mexico after talks and further tariffs on China after meeting with China’s President Xi Jinping at theG-20 summit. President Mario Draghi of the European Central Bank said that if the outlook doesn’t
“December’s S&P 500 Index performance was the worst since 1931.”
“The S&P 500 Index gained 8.01% for the month of January, the best monthly performance in 30 years.”
Wells Fargo Pennsylvania Tax-Free Fund | 3
Letter to shareholders (unaudited)
improve, the bank will cut rates or buy more assets to prop up inflation. In the U.S., the Fed said growth shifted from “solid” to “moderate” and indicated a willingness to cut rates.
Don’t let short-term uncertainty derail long-term investment goals.
Periods of investment uncertainty can present challenges, but experience has taught us that maintaining long-term investment goals can be an effective way to plan for the future. To help you create a sound strategy based on your personal goals and risk tolerance, Wells Fargo Funds offers more than 100 mutual funds spanning a wide range of asset classes and investment styles. Although diversification cannot guarantee an investment profit or prevent losses, we believe it can be an effective way to manage investment risk and potentially smooth out overall portfolio performance. We encourage investors to know their investments and to understand that appropriate levels of risk-taking may unlock opportunities.
Thank you for choosing to invest with Wells Fargo Funds. We appreciate your confidence in us and remain committed to helping you meet your financial needs.
Sincerely,

Andrew Owen
President
Wells Fargo Funds
|
|
|
For further information about your Fund, contact your investment professional, visit our website at wfam.com, or call us directly at1-800-222-8222. |
4 | Wells Fargo Pennsylvania Tax-Free Fund
This page is intentionally left blank.
Performance highlights (unaudited)
Investment objective
The Fund seeks current income exempt from federal income tax and Pennsylvania individual income tax.
Manager
Wells Fargo Funds Management, LLC
Subadviser
Wells Capital Management Incorporated
Portfolio managers
Bruce R. Johns
Robert J. Miller
Average annual total returns (%) as of June 30, 2019
| | | | | | | | | | | | | | | | | | | | | | | | | | | | | | | | | | |
| | | | |
| | | | | Including sales charge | | | Excluding sales charge | | | Expense
ratios1 (%) | |
| | | | | | | | | |
| | | Inception date | | 1 year | | | 5 year | | | 10 year | | | 1 year | | | 5 year | | | 10 year | | | Gross | | | Net2 | |
| | | | | | | | | | |
| Class A (EKVAX)3 | | 12-27-1990 | | | 1.24 | | | | 2.58 | | | | 4.58 | | | | 6.00 | | | | 3.53 | | | | 5.06 | | | | 0.91 | | | | 0.74 | |
| | | | | | | | | | |
| Class C (EKVCX)3 | | 2-1-1993 | | | 4.31 | | | | 2.76 | | | | 4.27 | | | | 5.31 | | | | 2.76 | | | | 4.27 | | | | 1.66 | | | | 1.49 | |
| | | | | | | | | | |
| Institutional Class (EKVYX)3 | | 11-24-1997 | | | – | | | | – | | | | – | | | | 6.27 | | | | 3.79 | | | | 5.32 | | | | 0.58 | | | | 0.49 | |
| | | | | | | | | | |
| Bloomberg Barclays Municipal Bond Index4 | | – | | | – | | | | – | | | | – | | | | 6.71 | | | | 3.64 | | | | 4.72 | | | | – | | | | – | |
| | | | | | | | | | |
| Bloomberg Barclays Pennsylvania Municipal Bond Index5 | | – | | | – | | | | – | | | | – | | | | 7.41 | | | | 3.97 | | | | 4.80 | | | | – | | | | – | |
Figures quoted represent past performance, which is no guarantee of future results,and do not reflect taxes that a shareholder may pay on fund distributions or the redemption of fund shares. Investment return and principal value of an investment will fluctuate so that an investor’s shares, when redeemed, may be worth more or less than their original cost. Performance shown without sales charges would be lower if sales charges were reflected. Current performance may be lower or higher than the performance data quoted, which assumes the reinvestment of dividends and capital gains. Currentmonth-end performance is available on the Fund’s website,wfam.com.
Index returns do not include transaction costs associated with buying and selling securities, any mutual fund fees or expenses, or any taxes. It is not possible to invest directly in an index.
For Class A shares, the maximumfront-end sales charge is 4.50%. For Class C shares, the maximum contingent deferred sales charge is 1.00%. Performance including a contingent deferred sales charge assumes the sales charge for the corresponding time period. Institutional Class shares are sold without afront-end sales charge or contingent deferred sales charge.
Bond values fluctuate in response to the financial condition of individual issuers, general market and economic conditions, and changes in interest rates. Changes in market conditions and government policies may lead to periods of heightened volatility in the bond market and reduced liquidity for certain bonds held by the Fund. In general, when interest rates rise, bond values fall and investors may lose principal value. Interest rate changes and their impact on the Fund and its share price can be sudden and unpredictable. The use of derivatives may reduce returns and/or increase volatility. Certain investment strategies tend to increase the total risk of an investment (relative to the broader market). The Fund is exposed to Pennsylvania municipal securities risk and high-yield securities risk. Consult the Fund’s prospectus for additional information on these and other risks. A portion of the Fund’s income may be subject to federal, state, and/or local income taxes or the Alternative Minimum Tax (AMT). Any capital gains distributions may be taxable.
Please see footnotes on page 7.
6 | Wells Fargo Pennsylvania Tax-Free Fund
Performance highlights (unaudited)
|
|
| Growth of $10,000 investment as of June 30, 20196 |
|
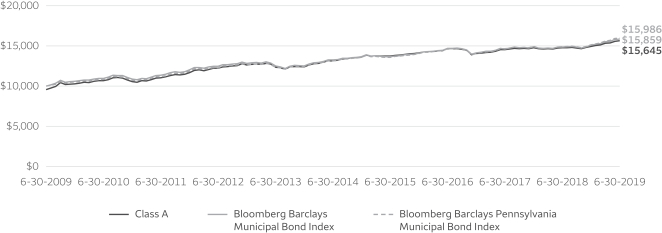 |
| 1 | Reflects the expense ratios as stated in the most recent prospectuses. The expense ratios shown are subject to change and may differ from the annualized expense ratios shown in the financial highlights of this report. |
| 2 | The manager has contractually committed through October 31, 2019, to waive fees and/or reimburse expenses to the extent necessary to cap the expenses of each class after fee waivers at the amounts shown. Brokerage commissions, stamp duty fees, interest, taxes, acquired fund fees and expenses (if any), and extraordinary expenses are excluded from the expense cap. Prior to or after the commitment expiration date, the cap may be increased or the commitment to maintain the cap may be terminated only with the approval of the Board of Trustees. Without this cap, the Fund’s returns would have been lower. The expense ratio paid by an investor is the net expense ratio (the total annual fund operating expenses after fee waivers) as stated in the prospectuses. |
| 3 | Historical performance shown prior to July 12, 2010, is based on the performance of the Fund’s predecessor, Evergreen Pennsylvania Municipal Bond Fund. |
| 4 | The Bloomberg Barclays Municipal Bond Index is an unmanaged index composed of long-termtax-exempt bonds with a minimum credit rating of Baa. You cannot invest directly in an index. |
| 5 | The Bloomberg Barclays Pennsylvania Municipal Bond Index is a Pennsylvania-specific total return index. The index is composed of Pennsylvania bonds. The bonds are all investment-grade, fixed-rate, long-term maturities (greater than two years) and are selected from issues larger than $50 million dated since January 1984. Bonds are added to the index and weighted and updated monthly, with aone-month lag. You cannot invest directly in an index. |
| 6 | The chart compares the performance of Class A shares for the most recent ten years with the Bloomberg Barclays Municipal Bond Index and the Bloomberg Barclays Pennsylvania Municipal Bond Index. The chart assumes a hypothetical $10,000 investment in Class A shares and reflects all operating expenses and assumes the maximum initial sales charge of 4.50%. |
| 7 | Amounts are calculated based on the long-term total investments of the Fund. These amounts are subject to change and may have changed since the date specified. |
| 8 | The credit quality distribution of portfolio holdings reflected in the chart is based on ratings from Standard & Poor’s, Moody’s Investors Service, and/or Fitch Ratings Ltd. Credit quality ratings apply to the underlying holdings of the Fund and not to the Fund itself. The percentages of the Fund’s portfolio with the ratings depicted in the chart are calculated based on the total market value of fixed income securities held by the Fund. If a security was rated by all three rating agencies, the middle rating was utilized. If rated by two of three rating agencies, the lower rating was utilized, and if rated by one of the rating agencies, that rating was utilized. Standard & Poor’s rates the creditworthiness of bonds, ranging from AAA (highest) to D (lowest). Ratings from A to CCC may be modified by the addition of a plus (+) or minus (-) sign to show relative standing within the rating categories. Standard & Poor’s rates the creditworthiness of short-term notes fromSP-1 (highest) toSP-3 (lowest). Moody’s rates the creditworthiness of bonds, ranging from Aaa (highest) to C (lowest). Ratings Aa to B may be modified by the addition of a number 1 (highest) to 3 (lowest) to show relative standing within the ratings categories. Moody’s rates the creditworthiness of short-term U.S.tax-exempt municipal securities from MIG 1/VMIG 1 (highest) to SG (lowest). Fitch rates the creditworthiness of bonds, ranging from AAA (highest) to D (lowest). Credit quality distribution is subject to change and may have changed since the date specified. |
Wells Fargo Pennsylvania Tax-Free Fund | 7
Performance highlights (unaudited)
MANAGER’S DISCUSSION
Fund highlights
| ∎ | | The Fund underperformed the Bloomberg Barclays Municipal Bond Index and the Bloomberg Barclays Pennsylvania Municipal Bond Index for the 12-month period that ended June 30, 2019. |
| ∎ | | The Fund’s conservative duration positioning was a detractor from performance as rates rallied across the curve. We were overweightAAA-rated andBBB-rated bonds, which underperformed, and underweightAA-rated andA-rated bonds, which outperformed. |
| ∎ | | The Fund’s overweights to local general obligation (GO), water and sewer, and leasing bonds, which outperformed bonds in other sectors, were positive contributors to performance. Yield-curve positioning was a modest contributor to performance as we were underweight shorter bonds, which underperformed, and overweight intermediate bonds, the best-performing part of the market. |
|
|
| Effective maturity distribution as of June 30, 20197 |
|
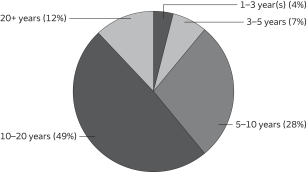
|
The state of Pennsylvania offers municipal bond investing opportunities.
The Commonwealth of Pennsylvania is rated Aa3 (stable), A+ (stable), andAA- (neutral) by Moody’s Investors Service, Inc.; Standard & Poor’s Financial Services LLC; and Fitch Ratings Inc., respectively. With 12.8 million people, Pennsylvania is the sixth-largest state by population, according to the U.S. Census Bureau, as well as by gross domestic product, which was $788 billion in 2018. The commonwealth’s economy is diverse and stable in health care and higher education sectors, primarily in the cities of Philadelphia and Pittsburgh, which account for 40% of the state’s total population. We note that the state’s population, revenue, and employment growth have consistently lagged
national growth averages, although the growth gap has narrowed over the past couple of years. The commonwealth ended fiscal-year 2018 with a small operating surplus, which has reduced the structural imbalance. Preliminary results for fiscal-year 2019 portray another surplus and a planned deposit into the state’srainy-day fund. While the state’s unassigned general fund balance still remains in a deficit position, the state historically has maintained significant liquidity sources outside of the general fund that can be used during periods of cash-flow shortages. Over the past several years, the commonwealth has steadily increased its pension contributions in order to address growing unfunded pension liabilities. The state passed anon-time budget two years in a row, which we view as a positive credit factor.
The Fed abruptly changed course from raising rates to a potential rate cut on fading growth expectations.
Throughout most of 2018, the fixed-income markets expected the U.S. Federal Reserve (Fed) to continue the path to normalize monetary policy. Moderate economic growth, stronger employment data, and inflation near its 2% target enabled the Fed to increase the federal funds rate four times in the calendar year. Despite a Fed rate hike in December, the Treasury market rallied in the fourth quarter of 2018 as the market lowered expectations for further rate hikes amid slower global growth, trade tariffs, and uncertainty concerning Britain’s departure from the European Union. These concerns only increased as we moved into the first half of 2019, and discussions changed from when the Fed might hike to when it might cut the federal funds rate. As a result, fixed-income markets rallied, pushing the benchmark10-year Treasury yield from a 3.23% peak in November 2018 to 2.00% by the end of June 2019. The municipal market mutual fund bond flows in the first half of 2019 were in excess of $42 billion, a number not seen since 1992. With this strong technical back drop for the municipal bond market and the Fed possibly cutting rates, bonds rallied in the first half of 2019, posting strong performance. The intermediate- and longer-maturity bonds along the yield curve outperformed shorter-term bonds. With all these factors at play, we see strong support for the municipal market over the short to intermediate term.
As the Fed moved to the sidelines in 2019 after normalizing rates throughout 2018, we started extending the Fund’s duration for the next macro move in rates. However, we ended the year shorter than the Fund’s benchmark duration, which was a detractor from performance. Credit spreads have contracted significantly, and we feel investors are not being fully compensated for lower-rated investment-grade bonds (bonds rated A and BBB). Consequently, we have migrated up in credit quality with purchases of higher-grade bonds. In general, we rely on a seasoned credit team and have a bias to lower-quality
Please see footnotes on page 7.
8 | Wells Fargo Pennsylvania Tax-Free Fund
Performance highlights (unaudited)
investment-grade bonds, and while this bias remains, we are adding higher-quality bonds in the AAA and AA range as opportunities arise. This tactical move is based on where we are in the credit cycle and the technical market we are experiencing, with municipal mutual fund bond flows that are reaching stretched valuations for lower-rated credits.
Credit-quality and sector allocation and yield-curve positioning benefited performance, duration detracted.
|
|
| Credit quality as of June 30, 20198 |
|
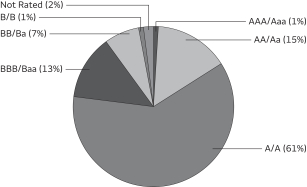 |
Credit-quality allocation, sector allocation, and yield-curve positioning were positive drivers of performance. Although we extended duration over the year, the Fund’s short duration position detracted from performance.
The Fund was overweightAAA-rated andBBB-rated bonds and had a modest allocation toout-of-benchmarknon-investment-grade bonds. WhileAAA-rated andBBB-rated bonds underperformed in general, our selectivity in this category was above average and drove positive performance within these categories. We were underweightAA-rated andA-rated bonds, which outperformed and detracted from performance. We were overweight leasing and water and sewer bonds, which outperformed. Some of thebest-performing bonds in the portfolio were the
Delaware Valley Regional Finance Authority, PA, (lease) bonds and the Philadelphia Water and Wastewater revenue bonds. Local GO bonds outperformed, and the Fund was overweight local GOs, such as the Central Dauphin School District and West School District bonds, both of which outperformed. While we didn’t purchase any prerefunded bonds, many bonds that we held within the Fund were refunded, leading to an overweight in this category. Prerefunded bonds are at a premium with the 2018 tax law changes that disallowed certain refundings on atax-exempt basis, and with the irreplaceable large book yields on some of these bonds, we will maintain those positions that are driving income to the Fund.
We were short duration at the beginning of the year, taking a defensive stance as the Fed was expected to move rates in late 2018 and in 2019, but as growth slowed, the Fed became more dovish. We began extending duration but were still short atyear-end, which significantly detracted from performance. Yield-curve positioning was a modest contributor to performance as we were underweight shorter maturities, which underperformed, and overweight intermediate maturities, the best-performing part of the curve on a risk-adjusted basis.
Going forward, we like lower-investment-grade and certain higher-yielding bonds, but we don’t think investors are currently compensated for owning such bonds. We became cautious early in the period and remain so today. We do expect to find better entry points once technicals unwind, but right now, we believe there is better value in high-quality investment-grade bonds and are consequently implementing anup-in-quality trade approach as we continue to extend duration with the expectation that the Fed will cut rates over the next year. We will look to add credit in lower-rated(A-rated andBBB-rated) bonds tactically if the market were to reprice these bonds to sufficient credit-spread levels that warrant their purchase.
Slowing growth supports credit fundamentals, but market technicals are driving performance and issue selection remains key in state-specific funds.
We believe U.S. economic growth is slowing but still continues at a modest pace. Pennsylvania has a large diverse economy that slightly lags the national average and should continue to show modest growth. Many municipalities have taken the opportunity during this growth cycle to improve credit fundamentals. We view the Fed becoming more dovish, potentially cutting rates in the latter half of 2019 to continue to support economic growth. Some municipalities may do well and others may continue to struggle. That is why we feel credit selection is critically important. We will continue to remain overweight seasoned lower-quality investment-grade bonds in the portfolio, notwithstanding the fact that we believe investors currently are not being compensated sufficiently for making new investments in some of these areas. In our view, the long-term drivers of valuations will be supply and demand trends, absolute yield levels, the shape of the yield curve, and credit fundamentals. We will continue to extend the Fund’s duration toward its benchmark as the cycle unfolds. We will monitor economic growth, the technical market, and fundamental credit quality to see if any changes are warranted in duration, yield-curve positioning, or credit-quality selections over the next year.
Please see footnotes on page 7.
Wells Fargo Pennsylvania Tax-Free Fund | 9
Fund expenses (unaudited)
As a shareholder of the Fund, you incur two types of costs: (1) transaction costs, including sales charges (loads) on purchase payments and contingent deferred sales charges (if any) on redemptions and (2) ongoing costs, including management fees, distribution(12b-1) and/or shareholder servicing fees, and other Fund expenses. This example is intended to help you understand your ongoing costs (in dollars) of investing in the Fund and to compare these costs with the ongoing costs of investing in other mutual funds.
The example is based on an investment of $1,000 invested at the beginning of thesix-month period and held for the entire period from January 1, 2019 to June 30, 2019.
Actual expenses
The “Actual” line of the table below provides information about actual account values and actual expenses. You may use the information in this line, together with the amount you invested, to estimate the expenses that you paid over the period. Simply divide your account value by $1,000 (for example, an $8,600 account value divided by $1,000 = 8.6), then multiply the result by the number in the “Actual” line under the heading entitled “Expenses paid during period” for your applicable class of shares to estimate the expenses you paid on your account during this period.
Hypothetical example for comparison purposes
The “Hypothetical” line of the table below provides information about hypothetical account values and hypothetical expenses based on the Fund’s actual expense ratio and an assumed rate of return of 5% per year before expenses, which is not the Fund’s actual return. The hypothetical account values and expenses may not be used to estimate the actual ending account balance or expenses you paid for the period. You may use this information to compare the ongoing costs of investing in the Fund and other funds. To do so, compare this 5% hypothetical example with the 5% hypothetical examples that appear in the shareholder reports of the other funds.
Please note that the expenses shown in the table are meant to highlight your ongoing costs only and do not reflect any transactional costs, such as sales charges (loads) and contingent deferred sales charges. Therefore, the “Hypothetical” line of the table is useful in comparing ongoing costs only and will not help you determine the relative total costs of owning different funds. In addition, if these transactional costs were included, your costs would have been higher.
| | | | | | | | | | | | | | | | |
| | | Beginning
account value
1-1-2019 | | | Ending
account value
6-30-2019 | | | Expenses
paid during
the period¹ | | | Annualized net
expense ratio | |
| | | | | |
Class A | | | | | | | | | | | | | | | | |
| | | | |
Actual | | $ | 1,000.00 | | | $ | 1,046.24 | | | $ | 3.75 | | | | 0.74 | % |
| | | | |
Hypothetical (5% return before expenses) | | $ | 1,000.00 | | | $ | 1,021.13 | | | $ | 3.71 | | | | 0.74 | % |
| | | | | |
Class C | | | | | | | | | | | | | | | | |
| | | | |
Actual | | $ | 1,000.00 | | | $ | 1,042.42 | | | $ | 7.55 | | | | 1.49 | % |
| | | | |
Hypothetical (5% return before expenses) | | $ | 1,000.00 | | | $ | 1,017.41 | | | $ | 7.45 | | | | 1.49 | % |
| | | | | |
Institutional Class | | | | | | | | | | | | | | | | |
| | | | |
Actual | | $ | 1,000.00 | | | $ | 1,047.53 | | | $ | 2.48 | | | | 0.49 | % |
| | | | |
Hypothetical (5% return before expenses) | | $ | 1,000.00 | | | $ | 1,022.37 | | | $ | 2.45 | | | | 0.49 | % |
| 1 | Expenses paid is equal to the annualized net expense ratio of each class multiplied by the average account value over the period, multiplied by the number of days in the most recent fiscal half-year divided by the number of days in the fiscal year (to reflect theone-half-year period). |
10 | Wells Fargo Pennsylvania Tax-Free Fund
Portfolio of investments—June 30, 2019
| | | | | | | | | | | | | | | | |
| | | Interest
rate | | | Maturity
date | | | Principal | | | Value | |
| Municipal Obligations: 98.33% | | | | | | | | | | | | | | | | |
| | | | |
Florida: 0.78% | | | | | | | | | | | | | | | | |
| | | | |
| Industrial Development Revenue: 0.78% | | | | | | | | | | | | |
| | | | |
Jacksonville FL Economic Development AMT Metropolitan Parking Solutions Project (ACA Insured) | | | 5.50 | % | | | 10-1-2030 | | | $ | 1,000,000 | | | $ | 1,001,840 | |
| | | | | | | | | | | | | | | | |
| | | | |
Guam: 0.49% | | | | | | | | | | | | | | | | |
| | | | |
| Airport Revenue: 0.49% | | | | | | | | | | | | |
| | | | |
Guam Port Authority AMT Series B | | | 5.00 | | | | 7-1-2032 | | | | 550,000 | | | | 636,444 | |
| | | | | | | | | | | | | | | | |
| | | | |
Pennsylvania: 97.06% | | | | | | | | | | | | | | | | |
| | | | |
| Airport Revenue: 1.34% | | | | | | | | | | | | |
| | | | |
Philadelphia PA Airport Refunding Bond AMT Series A | | | 5.00 | | | | 6-15-2030 | | | | 1,500,000 | | | | 1,729,530 | |
| | | | | | | | | | | | | | | | |
| | | | |
| Education Revenue: 27.93% | | | | | | | | | | | | |
| | | | |
Allegheny County PA Higher Education Building Authority Refunding Bond Duquesne University of The Holy Spirit Series A | | | 5.00 | | | | 3-1-2029 | | | | 1,135,000 | | | | 1,316,668 | |
| | | | |
Chester County PA IDA Avon Grove Charter School Project Refunding Bond Series A | | | 5.00 | | | | 12-15-2047 | | | | 1,160,000 | | | | 1,263,310 | |
| | | | |
Chester County PA IDA Collegium Charter School Project Refunding Bond Series A | | | 5.00 | | | | 10-15-2022 | | | | 1,390,000 | | | | 1,432,965 | |
| | | | |
Chester County PA IDA Collegium Charter School Project Series A | | | 5.13 | | | | 10-15-2037 | | | | 1,000,000 | | | | 1,071,110 | |
| | | | |
Chester County PA IDA Renaissance Academy Charter School Project | | | 3.75 | | | | 10-1-2024 | | | | 705,000 | | | | 725,015 | |
| | | | |
Delaware County PA IDA Chester Community Charter School Series A | | | 5.00 | | | | 8-15-2020 | | | | 1,230,000 | | | | 1,222,682 | |
| | | | |
General Authority of South Central Pennsylvania Association of Independent Colleges & Universities | | | 6.00 | | | | 11-1-2031 | | | | 2,500,000 | | | | 2,708,973 | |
| | | | |
Lycoming County PA Authority Pennsylvania College of Technology | | | 5.50 | | | | 7-1-2026 | | | | 3,000,000 | | | | 3,228,118 | |
| | | | |
Montgomery County PA Higher Education & Health Authority Refunding Bond Arcadia University | | | 5.00 | | | | 4-1-2030 | | | | 1,500,000 | | | | 1,684,920 | |
| | | | |
North Eastern PA Hospital & Education Authority Refunding Bond Wilkes University Project Series B | | | 5.25 | | | | 3-1-2037 | | | | 1,000,000 | | | | 1,116,000 | |
| | | | |
Pennsylvania HEFAR Shippensburg University Project | | | 6.00 | | | | 10-1-2031 | | | | 1,500,000 | | | | 1,653,135 | |
| | | | |
Pennsylvania HEFAR Temple University First Series | | | 5.00 | | | | 4-1-2032 | | | | 1,000,000 | | | | 1,080,210 | |
| | | | |
Pennsylvania Public School Building Authority Northampton County Area Community College Project | | | 5.50 | | | | 3-1-2031 | | | | 5,000,000 | | | | 5,296,400 | |
| | | | |
Pennsylvania Public School Building Authority Northampton County Area Community College Project Series A (Build America Mutual Assurance Company Insured) | | | 5.00 | | | | 6-15-2027 | | | | 1,610,000 | | | | 1,758,619 | |
| | | | |
Pennsylvania State University Refunding Bond Series B | | | 5.00 | | | | 9-1-2034 | | | | 2,175,000 | | | | 2,613,915 | |
| | | | |
Philadelphia PA IDA 1st Philadelphia Preparatory Charter School Project Series A | | | 7.00 | | | | 6-15-2033 | | | | 1,000,000 | | | | 1,159,350 | |
| | | | |
Philadelphia PA IDA Global Leadership Academy Project | | | 5.13 | | | | 11-15-2020 | | | | 525,000 | | | | 533,069 | |
| | | | |
Philadelphia PA IDA Global Leadership Academy Project | | | 5.75 | | | | 11-15-2030 | | | | 1,000,000 | | | | 1,026,140 | |
| | | | |
Philadelphia PA IDA La Salle University | | | 5.00 | | | | 5-1-2036 | | | | 1,355,000 | | | | 1,519,362 | |
| | | | |
Philadelphia PA IDA Tacony Academy Charter School Project | | | 6.88 | | | | 6-15-2033 | | | | 1,000,000 | | | | 1,113,790 | |
| | | | |
Philadelphia PA IDA Temple University 1st Series 2016 | | | 5.00 | | | | 4-1-2029 | | | | 1,000,000 | | | | 1,166,020 | |
| | | | |
Philadelphia PA IDA West Philadelphia Achievement Charter Elementary School Project | | | 7.50 | | | | 5-1-2031 | | | | 1,285,000 | | | | 1,376,466 | |
| | | | |
| | | | | | | | | | | | | | | 36,066,237 | |
| | | | | | | | | | | | | | | | |
| | | | |
| GO Revenue: 17.02% | | | | | | | | | | | | |
| | | | |
Allegheny County PA SeriesC-65 | | | 5.50 | | | | 5-1-2024 | | | | 1,000,000 | | | | 1,076,470 | |
| | | | |
Allegheny County PA Shaler Area School District (Build America Mutual Assurance Company Insured) | | | 5.00 | | | | 9-1-2038 | | | | 1,000,000 | | | | 1,216,290 | |
| | | | |
Central Dauphin PA School District | | | 5.00 | | | | 2-1-2037 | | | | 2,075,000 | | | | 2,382,474 | |
Wells Fargo Pennsylvania Tax-Free Fund | 11
Portfolio of investments—June 30, 2019
| | | | | | | | | | | | | | | | |
| | | Interest
rate | | | Maturity
date | | | Principal | | | Value | |
| | | | |
| GO Revenue(continued) | | | | | | | | | | | | |
| | | | |
Downingtown PA Area School District Series C | | | 5.00 | % | | | 8-1-2032 | | | $ | 1,000,000 | | | $ | 1,212,740 | |
| | | | |
Erie PA City School District Limited Tax Series A (AGM Insured) | | | 5.00 | | | | 4-1-2034 | | | | 515,000 | | | | 626,503 | |
| | | | |
North Allegheny PA School District | | | 5.00 | | | | 5-1-2030 | | | | 100,000 | | | | 127,691 | |
| | | | |
North Allegheny PA School District | | | 5.00 | | | | 5-1-2031 | | | | 290,000 | | | | 368,097 | |
| | | | |
Philadelphia PA Refunding Bond Series A | | | 5.25 | | | | 7-15-2033 | | | | 1,500,000 | | | | 1,695,285 | |
| | | | |
Philadelphia PA School District Refunding Bond Series A (AGM/FGIC Insured) | | | 5.00 | | | | 6-1-2024 | | | | 1,415,000 | | | | 1,590,149 | |
| | | | |
Philadelphia PA School District Refunding Bond Series C | | | 5.00 | | | | 9-1-2021 | | | | 1,395,000 | | | | 1,493,682 | |
| | | | |
Philadelphia PA School District Series B | | | 5.00 | | | | 9-1-2043 | | | | 1,235,000 | | | | 1,441,023 | |
| | | | |
Philadelphia PA Series A | | | 5.00 | | | | 8-1-2036 | | | | 1,250,000 | | | | 1,465,175 | |
| | | | |
Pittsburgh PA (Build America Mutual Assurance Company Insured) | | | 5.00 | | | | 9-1-2030 | | | | 500,000 | | | | 575,425 | |
| | | | |
Pittsburgh PA Moon Area School District Series A | | | 5.00 | | | | 11-15-2029 | | | | 1,445,000 | | | | 1,650,609 | |
| | | | |
Reading PA School District Series A (AGM Insured) | | | 5.00 | | | | 2-1-2033 | | | | 1,500,000 | | | | 1,724,685 | |
| | | | |
West Mifflin PA Area School District (AGM Insured) | | | 5.00 | | | | 4-1-2028 | | | | 1,000,000 | | | | 1,177,740 | |
| | | | |
West Shore PA School District | | | 5.00 | | | | 11-15-2048 | | | | 1,500,000 | | | | 1,743,390 | |
| | | | |
Wilkes-Barre School District Luzerne County PA General Obligation Bond Series 2019 (Build America Mutual Assurance Company Insured) | | | 5.00 | | | | 4-15-2027 | | | | 100,000 | | | | 121,518 | |
| | | | |
Wilkes-Barre School District Luzerne County PA General Obligation Bond Series 2019 (Build America Mutual Assurance Company Insured) | | | 5.00 | | | | 4-15-2028 | | | | 120,000 | | | | 148,079 | |
| | | | |
Wilkes-Barre School District Luzerne County PA General Obligation Bond Series 2019 (Build America Mutual Assurance Company Insured) | | | 5.00 | | | | 4-15-2029 | | | | 50,000 | | | | 62,531 | |
| | | | |
Wilkes-Barre School District Luzerne County PA General Obligation Bond Series 2019 (Build America Mutual Assurance Company Insured) | | | 5.00 | | | | 4-15-2030 | | | | 70,000 | | | | 86,927 | |
| | | | |
| | | | | | | | | | | | | | | 21,986,483 | |
| | | | | | | | | | | | | | | | |
| | | | |
| Health Revenue: 12.70% | | | | | | | | | | | | |
| | | | |
Allegheny County PA Hospital Development Authority Health Center Series B (National Insured) | | | 6.00 | | | | 7-1-2027 | | | | 1,800,000 | | | | 2,358,630 | |
| | | | |
Allegheny County PA Hospital Development Authority Series A | | | 4.00 | | | | 7-15-2035 | | | | 1,000,000 | | | | 1,111,110 | |
| | | | |
Berks County PA IDA Tower Health Project | | | 5.00 | | | | 11-1-2037 | | | | 1,625,000 | | | | 1,893,060 | |
| | | | |
Cumberland County PA Municipal Authority Diakon Lutheran Ministries Project | | | 5.00 | | | | 1-1-2028 | | | | 2,090,000 | | | | 2,339,901 | |
| | | | |
Dauphin County PA General Authority Pinnacle Health System Project | | | 5.00 | | | | 6-1-2042 | | | | 500,000 | | | | 538,030 | |
| | | | |
Dauphin County PA General Authority Pinnacle Health System Project Series A | | | 5.00 | | | | 6-1-2035 | | | | 1,000,000 | | | | 1,165,310 | |
| | | | |
East Hempfield Township PA IDA Willow Valley Communities Project Refunding Bond | | | 5.00 | | | | 12-1-2028 | | | | 450,000 | | | | 522,446 | |
| | | | |
East Hempfield Township PA IDA Willow Valley Communities Project Refunding Bond | | | 5.00 | | | | 12-1-2029 | | | | 375,000 | | | | 433,575 | |
| | | | |
Lancaster County PA Hospital Authority Healthcare Facilities Moravian Manors Incorporated Project | | | 2.88 | | | | 12-15-2023 | | | | 500,000 | | | | 500,205 | |
| | | | |
Montgomery County PA IDA Jefferson Health System Series A | | | 5.00 | | | | 10-1-2027 | | | | 1,000,000 | | | | 1,083,850 | |
| | | | |
Montgomery County PA IDA Waverly Heights Limited Project | | | 5.00 | | | | 12-1-2049 | | | | 1,000,000 | | | | 1,136,040 | |
| | | | |
Northampton County PA St. Luke’s Hospital of Bethlehem Series A | | | 5.00 | | | | 8-15-2033 | | | | 1,435,000 | | | | 1,568,053 | |
| | | | |
Pennsylvania Higher Educational University Pennsylvania Health System Series A | | | 5.00 | | | | 8-15-2047 | | | | 1,500,000 | | | | 1,756,755 | |
| | | | |
| | | | | | | | | | | | | | | 16,406,965 | |
| | | | | | | | | | | | | | | | |
| | | | |
| Housing Revenue: 0.78% | | | | | | | | | | | | |
| | | | |
Chester County PA IDA University Student Housing LLC Project Series A | | | 5.00 | | | | 8-1-2030 | | | | 555,000 | | | | 599,755 | |
| | | | |
Pennsylvania Housing Finance Agency SFMR Series 112 | | | 5.00 | | | | 4-1-2028 | | | | 395,000 | | | | 405,566 | |
| | | | |
| | | | | | | | | | | | | | | 1,005,321 | |
| | | | | | | | | | | | | | | | |
| | | | |
| Miscellaneous Revenue: 19.40% | | | | | | | | | | | | |
| | | | |
Delaware County PA Authority Neumann University Refunding Bond | | | 5.00 | | | | 10-1-2031 | | | | 1,500,000 | | | | 1,671,645 | |
| | | | |
Delaware County PA Vocational & Technical School Authority (Build America Mutual Assurance Company Insured) | | | 5.25 | | | | 11-1-2033 | | | | 1,000,000 | | | | 1,126,500 | |
| | | | |
Delaware Valley PA Regional Finance Authority Local Government Series A (Ambac Insured) | | | 5.50 | | | | 8-1-2028 | | | | 4,390,000 | | | | 5,601,333 | |
12 | Wells Fargo Pennsylvania Tax-Free Fund
Portfolio of investments—June 30, 2019
| | | | | | | | | | | | | | | | |
| | | Interest
rate | | | Maturity
date | | | Principal | | | Value | |
| | | | |
| Miscellaneous Revenue(continued) | | | | | | | | | | | | |
| | | | |
Pennsylvania Certificate of Participation Series A | | | 5.00 | % | | | 7-1-2038 | | | $ | 1,000,000 | | | $ | 1,183,230 | |
| | | | |
Pennsylvania Financing Authority Pennsylvania Hills Project CAB Series B (National Insured) ¤ | | | 0.00 | | | | 12-1-2022 | | | | 1,200,000 | | | | 1,115,148 | |
| | | | |
Pennsylvania Financing Authority Pennsylvania Hills Project CAB Series B (National Insured) ¤ | | | 0.00 | | | | 12-1-2023 | | | | 3,790,000 | | | | 3,438,326 | |
| | | | |
Pennsylvania Public School Building Authority Chester Upland School District Project Series B | | | 5.25 | | | | 9-15-2030 | | | | 540,000 | | | | 657,509 | |
| | | | |
Pennsylvania Public School Building Authority Chester Upland School District Project Series C (AGM Insured) | | | 5.00 | | | | 9-15-2026 | | | | 875,000 | | | | 931,333 | |
| | | | |
Pennsylvania Public School Building Authority SeriesB-2 (Build America Mutual Assurance Company Insured) | | | 5.00 | | | | 12-1-2027 | | | | 1,010,000 | | | | 1,163,369 | |
| | | | |
Pennsylvania Turnpike Commission Series A (AGM Insured) | | | 5.25 | | | | 7-15-2021 | | | | 2,000,000 | | | | 2,157,960 | |
| | | | |
Philadelphia PA Authority for Industrial Development City Agreement Green Bond Museum Art Energy Saving Program Series A | | | 5.00 | | | | 2-15-2038 | | | | 785,000 | | | | 923,710 | |
| | | | |
Philadelphia PA IDA Refunding Bond Cultural & Commercial Corridors Program Series A | | | 5.00 | | | | 12-1-2028 | | | | 2,500,000 | | | | 2,953,150 | |
| | | | |
Southeastern Pennsylvania Transportation Authority | | | 5.00 | | | | 6-1-2028 | | | | 2,000,000 | | | | 2,139,020 | |
| | | | |
| | | | | | | | | | | | | | | 25,062,233 | |
| | | | | | | | | | | | | | | | |
| | | | |
| Tax Revenue: 4.89% | | | | | | | | | | | | |
| | | | |
Allegheny County PA Port Authority Refunding Bond | | | 5.75 | | | | 3-1-2029 | | | | 3,000,000 | | | | 3,211,050 | |
| | | | |
Pittsburgh & Allegheny Counties PA Sports & Exhibition Authority (AGM Insured) | | | 5.00 | | | | 2-1-2031 | | | | 3,000,000 | | | | 3,101,520 | |
| | | | |
| | | | | | | | | | | | | | | 6,312,570 | |
| | | | | | | | | | | | | | | | |
| | | | |
| Transportation Revenue: 6.05% | | | | | | | | | | | | |
| | | | |
Delaware River PA Joint Toll Bridge Commission | | | 5.00 | | | | 7-1-2042 | | | | 580,000 | | | | 685,879 | |
| | | | |
Pennsylvania Turnpike Commission SeriesA-1 | | | 5.00 | | | | 12-1-2047 | | | | 1,000,000 | | | | 1,172,960 | |
| | | | |
Pennsylvania Turnpike Commission SeriesA-2 | | | 5.00 | | | | 12-1-2048 | | | | 2,000,000 | | | | 2,376,780 | |
| | | | |
Pennsylvania Turnpike Commission Subordinate Bond Series A | | | 5.50 | | | | 12-1-2042 | | | | 3,000,000 | | | | 3,577,650 | |
| | | | |
| | | | | | | | | | | | | | | 7,813,269 | |
| | | | | | | | | | | | | | | | |
| | | | |
| Water & Sewer Revenue: 6.95% | | | | | | | | | | | | |
| | | | |
Capital Region Pennsylvania Water and Sewer System Refunding Bond | | | 5.00 | | | | 7-15-2037 | | | | 1,000,000 | | | | 1,179,540 | |
| | | | |
Lehigh County PA General Purpose Authority CAB Allentown Project ¤ | | | 0.00 | | | | 12-1-2030 | | | | 2,000,000 | | | | 1,458,080 | |
| | | | |
McKeesport PA Municipal Authority (AGM Insured) | | | 5.50 | | | | 12-15-2027 | | | | 1,200,000 | | | | 1,320,660 | |
| | | | |
Pennsylvania Commonwealth Financing Authority Refunding Bond Series B | | | 5.00 | | | | 6-1-2031 | | | | 250,000 | | | | 318,203 | |
| | | | |
Pennsylvania Commonwealth Financing Authority Series B | | | 5.00 | | | | 6-1-2026 | | | | 1,000,000 | | | | 1,091,300 | |
| | | | |
Philadelphia PA Water & Wastewater Refunding Bond | | | 5.00 | | | | 10-1-2030 | | | | 1,000,000 | | | | 1,201,110 | |
| | | | |
Philadelphia PA Water & Wastewater Refunding Bond Series A | | | 5.00 | | | | 10-1-2038 | | | | 2,000,000 | | | | 2,408,440 | |
| | | | |
| | | | | | | | | | | | | | | 8,977,333 | |
| | | | | | | | | | | | | | | | |
| | | | |
| | | | | | | | | | | | | | | 125,359,941 | |
| | | | | | | | | | | | | | | | |
| | | | |
Total Municipal Obligations (Cost $118,702,614) | | | | | | | | | | | | | | | 126,998,225 | |
| | | | | | | | | | | | | | | | |
| | | | |
| | | | | | | | | | | | | | | | |
| | | Yield | | | | | | Shares | | | | |
| Short-Term Investments: 0.72% | |
|
| Investment Companies: 0.72% | |
| | | | |
Wells Fargo Municipal Cash Management Money Market Fund Institutional Class (l)(u) | | | 1.82 | | | | | | | | 928,745 | | | | 929,302 | |
| | | | | | | | | | | | | | | | |
| | | | |
Total Short-Term Investments (Cost $929,300) | | | | | | | | | | | | | | | 929,302 | |
| | | | | | | | | | | | | | | | |
| | | | | | | | |
| Total investments in securities (Cost $119,631,914) | | | 99.05 | % | | $ | 127,927,527 | |
| | |
Other assets and liabilities, net | | | 0.95 | | | | 1,223,366 | |
| | | | | | | | |
| Total net assets | | | 100.00 | % | | $ | 129,150,893 | |
| | | | | | | | |
Wells Fargo Pennsylvania Tax-Free Fund | 13
Portfolio of investments—June 30, 2019
| ¤ | The security is issued in zero coupon form with no periodic interest payments. |
| (l) | The issuer of the security is an affiliated person of the Fund as defined in the Investment Company Act of 1940. |
| (u) | The rate represents the7-day annualized yield at period end. |
Abbreviations:
| ACA | ACA Financial Guaranty Corporation |
| AGM | Assured Guaranty Municipal |
| Ambac | Ambac Financial Group Incorporated |
| AMT | Alternative minimum tax |
| CAB | Capital appreciation bond |
| FGIC | Financial Guaranty Insurance Corporation |
| HEFAR | Higher Education Facilities Authority Revenue |
| IDA | Industrial Development Authority |
| National | National Public Finance Guarantee Corporation |
| SFMR | Single-family mortgage revenue |
Investments in Affiliates
An affiliated investment is an investment in which the Fund owns at least 5% of the outstanding voting shares of the issuer or as a result of other relationships, such as the Fund and the issuer having the same investment manager. Transactions with issuers that were either affiliated persons of the Fund at the beginning of the period or the end of the period were as follows:
| | | | | | | | | | | | | | | | | | | | | | | | | | | | | | | | | | | | |
| | | Shares,
beginning of
priod | | | Shares
purchased | | | Shares
sold | | | Shares,
end of
period | | | Net
realized
gains
(losses) | | | Net
change in
unrealized
gains
(losses) | | | Income
from
affiliated
securities | | | Value,
end
of period | | | % of
net
assets | |
Short-Term Investments | | | | | | | | | | | | | | | | | | | | | | | | | | | | | | | | | | | | |
Investment Companies | | | | | | | | | | | | | | | | | | | | | | | | | | | | | | | | | | | | |
Wells Fargo Municipal Cash Management Money Market Fund Institutional Class | | | 610,062 | | | | 30,697,997 | | | | 30,379,314 | | | | 928,745 | | | $ | (353 | ) | | $ | 2 | | | $ | 13,244 | | | $ | 929,302 | | | | 0.72 | % |
| | | | | | | | | | | | | | | | | | | | | | | | | | | | | | | | | | | | |
The accompanying notes are an integral part of these financial statements.
14 | Wells Fargo Pennsylvania Tax-Free Fund
Statement of assets and liabilities—June 30, 2019
| | | | |
| | | | |
| |
Assets | | | | |
Investments in unaffiliated securities, at value (cost $118,702,614) | | $ | 126,998,225 | |
Investments in affiliated securities, at value (cost $929,300) | | | 929,302 | |
Receivable for Fund shares sold | | | 3,725 | |
Receivable for interest | | | 1,453,556 | |
Prepaid expenses and other assets | | | 26,867 | |
| | | | |
Total assets | | | 129,411,675 | |
| | | | |
| |
Liabilities | | | | |
Dividends payable | | | 131,715 | |
Payable for Fund shares redeemed | | | 80,319 | |
Management fee payable | | | 22,717 | |
Administration fees payable | | | 11,748 | |
Distribution fee payable | | | 5,398 | |
Trustees’ fees and expenses payable | | | 1,364 | |
Accrued expenses and other liabilities | | | 7,521 | |
| | | | |
Total liabilities | | | 260,782 | |
| | | | |
Total net assets | | $ | 129,150,893 | |
| | | | |
| |
Net assets consist of | | | | |
Paid-in capital | | $ | 121,472,274 | |
Total distributable earnings | | | 7,678,619 | |
| | | | |
Total net assets | | $ | 129,150,893 | |
| | | | |
| |
Computation of net asset value and offering price per share | | | | |
Net assets – Class A | | $ | 41,255,206 | |
Shares outstanding – Class A1 | | | 3,500,859 | |
Net asset value per share – Class A | | | $11.78 | |
Maximum offering price per share – Class A2 | | | $12.34 | |
Net assets – Class C | | $ | 8,768,129 | |
Shares outstanding – Class C1 | | | 745,351 | |
Net asset value per share – Class C | | | $11.76 | |
Net assets – Institutional Class | | $ | 79,127,558 | |
Shares outstanding – Institutional Class1 | | | 6,714,375 | |
Net asset value per share – Institutional Class | | | $11.78 | |
| 1 | The Fund has an unlimited number of authorized shares. |
| 2 | Maximum offering price is computed as 100/95.50 of net asset value. On investments of $50,000 or more, the offering price is reduced. |
The accompanying notes are an integral part of these financial statements.
Wells Fargo Pennsylvania Tax-Free Fund | 15
Statement of operations—year ended June 30, 2019
| | | | |
| | | | |
| |
Investment income | | | | |
Interest | | $ | 5,016,504 | |
Income from affiliated securities | | | 13,244 | |
| | | | |
Total investment income | | | 5,029,748 | |
| | | | |
| |
Expenses | | | | |
Management fee | | | 528,840 | |
Administration fees | | | | |
Class A | | | 63,544 | |
Class C | | | 17,532 | |
Institutional Class | | | 65,231 | |
Shareholder servicing fees | | | | |
Class A | | | 99,287 | |
Class C | | | 27,394 | |
Distribution fee | | | | |
Class C | | | 82,163 | |
Custody and accounting fees | | | 11,282 | |
Professional fees | | | 53,677 | |
Registration fees | | | 74,791 | |
Shareholder report expenses | | | 15,705 | |
Trustees’ fees and expenses | | | 21,302 | |
Other fees and expenses | | | 14,200 | |
| | | | |
Total expenses | | | 1,074,948 | |
Less: Fee waivers and/or expense reimbursements | | | (218,589 | ) |
| | | | |
Net expenses | | | 856,359 | |
| | | | |
Net investment income | | | 4,173,389 | |
| | | | |
| |
Realized and unrealized gains (losses) on investments | | | | |
Net realized gains (losses) on: | | | | |
Unaffiliated securities | | | 922,896 | |
Affiliated securities | | | (353 | ) |
| | | | |
Net realized gains on investments | | | 922,543 | |
| | | | |
| |
Net change in unrealized gains (losses) on: | | | | |
Unaffiliated securities | | | 2,670,918 | |
Affiiliated securities | | | 2 | |
| | | | |
Net change in unrealized gains (losses) on investments | | | 2,670,920 | |
| | | | |
Net realized and unrealized gains (losses) on investments | | | 3,593,463 | |
| | | | |
Net increase in net assets resulting from operations | | $ | 7,766,852 | |
| | | | |
The accompanying notes are an integral part of these financial statements.
16 | Wells Fargo Pennsylvania Tax-Free Fund
Statement of changes in net assets
| | | | | | | | | | | | | | | | |
| | | Year ended
June 30, 2019 | | | Year ended
June 30, 20181 | |
| |
Operations | | | | | |
Net investment income | | | | | | $ | 4,173,389 | | | | | | | $ | 5,180,475 | |
Net realized gains (losses) on investments | | | | | | | 922,543 | | | | | | | | (508,073 | ) |
Net change in unrealized gains (losses) on investments | | | | | | | 2,670,920 | | | | | | | | (2,064,312 | ) |
| | | | |
Net increase in net assets resulting from operations | | | | | | | 7,766,852 | | | | | | | | 2,608,090 | |
| | | | |
| | | | |
Distributions to shareholders from | | | | | | | | | | | | | | | | |
Net investment income and net realized gains | | | | | | | | | | | | | | | | |
Class A | | | | | | | (1,201,265 | ) | | | | | | | (1,414,368 | ) |
Class C | | | | | | | (249,698 | ) | | | | | | | (375,013 | ) |
Institutional Class | | | | | | | (2,668,988 | ) | | | | | | | (3,391,139 | ) |
Tax basis return of capital | | | | | | | | | | | | | | | | |
Class A | | | | | | | (93,277 | ) | | | | | | | 0 | |
Class C | | | | | | | (25,736 | ) | | | | | | | 0 | |
Institutional Class | | | | | | | (191,507 | ) | | | | | | | 0 | |
| | | | |
Total distributions to shareholders | | | | | | | (4,430,471 | ) | | | | | | | (5,180,520 | ) |
| | | | |
| | | | |
Capital share transactions | | | Shares | | | | | | | | Shares | | | | | |
Proceeds from shares sold | | | | | | | | | | | | | | | | |
Class A | | | 523,363 | | | | 6,021,000 | | | | 118,953 | | | | 1,379,864 | |
Class C | | | 72,566 | | | | 834,358 | | | | 82,087 | | | | 955,484 | |
Institutional Class | | | 483,892 | | | | 5,555,083 | | | | 744,498 | | | | 8,653,257 | |
| | | | |
| | | | | | | 12,410,441 | | | | | | | | 10,988,605 | |
| | | | |
Reinvestment of distributions | | | | | | | | | | | | | | | | |
Class A | | | 104,956 | | | | 1,208,144 | | | | 114,924 | | | | 1,331,480 | |
Class C | | | 22,977 | | | | 263,459 | | | | 30,457 | | | | 352,246 | |
Institutional Class | | | 94,002 | | | | 1,081,975 | | | | 97,749 | | | | 1,132,476 | |
| | | | |
| | | | | | | 2,553,578 | | | | | | | | 2,816,202 | |
| | | | |
Payment for shares redeemed | | | | | | | | | | | | | | | | |
Class A | | | (670,936 | ) | | | (7,708,019 | ) | | | (579,470 | ) | | | (6,706,633 | ) |
Class C | | | (523,498 | ) | | | (5,993,137 | ) | | | (340,707 | ) | | | (3,941,718 | ) |
Institutional Class | | | (1,589,650 | ) | | | (18,215,765 | ) | | | (1,914,913 | ) | | | (22,193,663 | ) |
| | | | |
| | | | | | | (31,916,921 | ) | | | | | | | (32,842,014 | ) |
| | | | |
Net decrease in net assets resulting from capital share transactions | | | | | | | (16,952,902 | ) | | | | | | | (19,037,207 | ) |
| | | | |
Total decrease in net assets | | | | | | | (13,616,521 | ) | | | | | | | (21,609,637 | ) |
| | | | |
| | | | |
Net assets | | | | | | | | | | | | | | | | |
Beginning of period | | | | | | | 142,767,414 | | | | | | | | 164,377,051 | |
| | | | |
End of period | | | | | | $ | 129,150,893 | | | | | | | $ | 142,767,414 | |
| | | | |
| 1 | Effective for all filings after November 4, 2018, the SEC prospectively eliminated the requirement to parenthetically disclose undistributed net investment income at the end of the period and permitted the aggregation of distributions, with the exception of tax basis returns of capital. Overdistributed net investment income at June 30, 2018 was $200,538. The disaggregated distributions information for the year ended June 30, 2018 is included in Note 7,Distributions to Shareholders,in the notes to the financial statements. |
The accompanying notes are an integral part of these financial statements.
Wells Fargo Pennsylvania Tax-Free Fund | 17
Financial highlights
(For a share outstanding throughout each period)
| | | | | | | | | | | | | | | | | | | | |
| | | Year ended June 30 | |
| CLASS A | | 2019 | | | 2018 | | | 2017 | | | 2016 | | | 2015 | |
Net asset value, beginning of period | | | $11.48 | | | | $11.67 | | | | $12.13 | | | | $11.75 | | | | $11.65 | |
Net investment income | | | 0.35 | | | | 0.38 | | | | 0.36 | | | | 0.38 | | | | 0.42 | |
Net realized and unrealized gains (losses) on investments | | | 0.32 | | | | (0.19 | ) | | | (0.46 | ) | | | 0.38 | | | | 0.09 | |
| | | | | | | | | | | | | | | | | | | | |
Total from investment operations | | | 0.67 | | | | 0.19 | | | | (0.10 | ) | | | 0.76 | | | | 0.51 | |
Distributions to shareholders from | | | | | | | | | | | | | | | | | | | | |
Net investment income | | | (0.34 | ) | | | (0.38 | ) | | | (0.36 | ) | | | (0.38 | ) | | | (0.41 | ) |
Tax basis return of capital | | | (0.03 | ) | | | 0.00 | | | | 0.00 | | | | 0.00 | | | | 0.00 | |
| | | | | | | | | | | | | | | | | | | | |
Total distributions to shareholders | | | (0.37 | ) | | | (0.38 | ) | | | (0.36 | ) | | | (0.38 | ) | | | (0.41 | ) |
Net asset value, end of period | | | $11.78 | | | | $11.48 | | | | $11.67 | | | | $12.13 | | | | $11.75 | |
Total return1 | | | 6.00 | % | | | 1.62 | % | | | (0.83 | )% | | | 6.62 | % | | | 4.44 | % |
Ratios to average net assets (annualized) | | | | | | | | | | | | | | | | | | | | |
Gross expenses | | | 0.96 | % | | | 0.91 | % | | | 0.90 | % | | | 0.90 | % | | | 0.90 | % |
Net expenses | | | 0.74 | % | | | 0.74 | % | | | 0.74 | % | | | 0.74 | % | | | 0.74 | % |
Net investment income | | | 3.07 | % | | | 3.25 | % | | | 3.02 | % | | | 3.23 | % | | | 3.54 | % |
Supplemental data | | | | | | | | | | | | | | | | | | | | |
Portfolio turnover rate | | | 9 | % | | | 10 | % | | | 20 | % | | | 13 | % | | | 15 | % |
Net assets, end of period (000s omitted) | | | $41,255 | | | | $40,664 | | | | $45,381 | | | | $55,352 | | | | $47,323 | |
| 1 | Total return calculations do not include any sales charges. |
The accompanying notes are an integral part of these financial statements.
18 | Wells Fargo Pennsylvania Tax-Free Fund
Financial highlights
(For a share outstanding throughout each period)
| | | | | | | | | | | | | | | | | | | | |
| | | Year ended June 30 | |
| CLASS C | | 2019 | | | 2018 | | | 2017 | | | 2016 | | | 2015 | |
Net asset value, beginning of period | | | $11.45 | | | | $11.65 | | | | $12.11 | | | | $11.73 | | | | $11.63 | |
Net investment income | | | 0.26 | 1 | | | 0.29 | 1 | | | 0.27 | 1 | | | 0.29 | 1 | | | 0.33 | |
Net realized and unrealized gains (losses) on investments | | | 0.34 | | | | (0.20 | ) | | | (0.46 | ) | | | 0.38 | | | | 0.09 | |
| | | | | | | | | | | | | | | | | | | | |
Total from investment operations | | | 0.60 | | | | 0.09 | | | | (0.19 | ) | | | 0.67 | | | | 0.42 | |
Distributions to shareholders from | | | | | | | | | | | | | | | | | | | | |
Net investment income | | | (0.26 | ) | | | (0.29 | ) | | | (0.27 | ) | | | (0.29 | ) | | | (0.32 | ) |
Tax basis return of capital | | | (0.03 | ) | | | 0.00 | | | | 0.00 | | | | 0.00 | | | | 0.00 | |
| | | | | | | | | | | | | | | | | | | | |
Total distributions to shareholders | | | (0.29 | ) | | | (0.29 | ) | | | (0.27 | ) | | | (0.29 | ) | | | (0.32 | ) |
Net asset value, end of period | | | $11.76 | | | | $11.45 | | | | $11.65 | | | | $12.11 | | | | $11.73 | |
Total return2 | | | 5.31 | % | | | 0.77 | % | | | (1.58 | )% | | | 5.83 | % | | | 3.66 | % |
Ratios to average net assets (annualized) | | | | | | | | | | | | | | | | | | | | |
Gross expenses | | | 1.70 | % | | | 1.66 | % | | | 1.65 | % | | | 1.65 | % | | | 1.65 | % |
Net expenses | | | 1.49 | % | | | 1.49 | % | | | 1.49 | % | | | 1.49 | % | | | 1.49 | % |
Net investment income | | | 2.32 | % | | | 2.50 | % | | | 2.27 | % | | | 2.46 | % | | | 2.78 | % |
Supplemental data | | | | | | | | | | | | | | | | | | | | |
Portfolio turnover rate | | | 9 | % | | | 10 | % | | | 20 | % | | | 13 | % | | | 15 | % |
Net assets, end of period (000s omitted) | | | $8,768 | | | | $13,440 | | | | $16,323 | | | | $19,493 | | | | $13,062 | |
| 1 | Calculated based upon average shares outstanding |
| 2 | Total return calculations do not include any sales charges. |
The accompanying notes are an integral part of these financial statements.
Wells Fargo Pennsylvania Tax-Free Fund | 19
Financial highlights
(For a share outstanding throughout each period)
| | | | | | | | | | | | | | | | | | | | |
| | | Year ended June 30 | |
| INSTITUTIONAL CLASS | | 2019 | | | 2018 | | | 2017 | | | 2016 | | | 2015 | |
Net asset value, beginning of period | | | $11.48 | | | | $11.67 | | | | $12.13 | | | | $11.75 | | | | $11.65 | |
Net investment income | | | 0.38 | | | | 0.40 | | | | 0.39 | 1 | | | 0.41 | 1 | | | 0.44 | |
Net realized and unrealized gains (losses) on investments | | | 0.32 | | | | (0.18 | ) | | | (0.46 | ) | | | 0.38 | | | | 0.10 | |
| | | | | | | | | | | | | | | | | | | | |
Total from investment operations | | | 0.70 | | | | 0.22 | | | | (0.07 | ) | | | 0.79 | | | | 0.54 | |
Distributions to shareholders from | | | | | | | | | | | | | | | | | | | | |
Net investment income | | | (0.37 | ) | | | (0.41 | ) | | | (0.39 | ) | | | (0.41 | ) | | | (0.44 | ) |
Tax basis return of capital | | | (0.03 | ) | | | 0.00 | | | | 0.00 | | | | 0.00 | | | | 0.00 | |
| | | | | | | | | | | | | | | | | | | | |
Total distributions to shareholders | | | (0.40 | ) | | | (0.41 | ) | | | (0.39 | ) | | | (0.41 | ) | | | (0.44 | ) |
Net asset value, end of period | | | $11.78 | | | | $11.48 | | | | $11.67 | | | | $12.13 | | | | $11.75 | |
Total return | | | 6.27 | % | | | 1.88 | % | | | (0.58 | )% | | | 6.88 | % | | | 4.70 | % |
Ratios to average net assets (annualized) | | | | | | | | | | | | | | | | | | | | |
Gross expenses | | | 0.62 | % | | | 0.58 | % | | | 0.57 | % | | | 0.57 | % | | | 0.57 | % |
Net expenses | | | 0.49 | % | | | 0.49 | % | | | 0.49 | % | | | 0.49 | % | | | 0.49 | % |
Net investment income | | | 3.31 | % | | | 3.50 | % | | | 3.27 | % | | | 3.47 | % | | | 3.78 | % |
Supplemental data | | | | | | | | | | | | | | | | | | | | |
Portfolio turnover rate | | | 9 | % | | | 10 | % | | | 20 | % | | | 13 | % | | | 15 | % |
Net assets, end of period (000s omitted) | | | $79,128 | | | | $88,663 | | | | $102,672 | | | | $132,844 | | | | $106,769 | |
| 1 | Calculated based upon average shares outstanding |
The accompanying notes are an integral part of these financial statements.
20 | Wells Fargo Pennsylvania Tax-Free Fund
Notes to financial statements
1. ORGANIZATION
Wells Fargo Funds Trust (the “Trust”), a Delaware statutory trust organized on March 10, 1999, is anopen-end management investment company registered under the Investment Company Act of 1940, as amended (the “1940 Act”). As an investment company, the Trust follows the accounting and reporting guidance in Financial Accounting Standards Board (“FASB”)Accounting Standards Codification Topic 946, Financial Services – Investment Companies. These financial statements report on the Wells Fargo PennsylvaniaTax-Free Fund (the “Fund”) which is a diversified series of the Trust.
2. SIGNIFICANT ACCOUNTING POLICIES
The following significant accounting policies, which are consistently followed in the preparation of the financial statements of the Fund, are in conformity with U.S. generally accepted accounting principles which require management to make estimates and assumptions that affect the reported amounts of assets and liabilities, disclosure of contingent assets and liabilities at the date of the financial statements, and the reported amounts of revenues and expenses during the reporting period. Actual results could differ from those estimates.
Securities valuation
All investments are valued each business day as of the close of regular trading on the New York Stock Exchange (generally 4 p.m. Eastern Time), although the Fund may deviate from this calculation time under unusual or unexpected circumstances.
Debt securities are valued at the evaluated bid price provided by an independent pricing service (e.g. taking into account various factors, including yields, maturities, or credit ratings) or, if a reliable price is not available, the quoted bid price from an independent broker-dealer.
Investments in registeredopen-end investment companies are valued at net asset value.
Investments which are not valued using any of the methods discussed above are valued at their fair value, as determined in good faith by the Board of Trustees of the Fund. The Board of Trustees has established a Valuation Committee comprised of the Trustees and has delegated to it the authority to take any actions regarding the valuation of portfolio securities that the Valuation Committee deems necessary or appropriate, including determining the fair value of portfolio securities, unless the determination has been delegated to the Wells Fargo Asset Management Pricing Committee at Wells Fargo Funds Management, LLC (“Funds Management”). The Board of Trustees retains the authority to make or ratify any valuation decisions or approve any changes to the Valuation Procedures as it deems appropriate. On a quarterly basis, the Board of Trustees receives reports on any valuation actions taken by the Valuation Committee or the Wells Fargo Asset Management Pricing Committee which may include items for ratification.
When-issued transactions
The Fund may purchase securities on a forward commitment or when-issued basis. The Fund records a when-issued transaction on the trade date and will segregate assets in an amount at least equal in value to the Fund’s commitment to purchase when-issued securities. Securities purchased on a when-issued basis aremarked-to-market daily and the Fund begins earning interest on the settlement date. Losses may arise due to changes in the market value of the underlying securities or if the counterparty does not perform under the contract.
Security transactions and income recognition
Securities transactions are recorded on a trade date basis. Realized gains or losses are recorded on the basis of identified cost.
Interest income is accrued daily and bond discounts are accreted and premiums are amortized daily. To the extent debt obligations are placed onnon-accrual status, any related interest income may be reduced by writing off interest receivables when the collection of all or a portion of interest has been determined to be doubtful based on consistently applied procedures and the fair value has decreased. If the issuer subsequently resumes interest payments or when the collectability of interest is reasonably assured, the debt obligation is removed fromnon-accrual status.
Distributions to shareholders
Distributions to shareholders from net investment income are declared daily and paid monthly. Distributions from net realized gains, if any, are recorded on theex-dividend date and paid at least annually. Such distributions are determined in accordance with income tax regulations and may differ from U.S. generally accepted accounting principles. Dividend sources are estimated at the time of declaration. The tax character of distributions is determined as of the Fund’s fiscal year end. Therefore, a portion of the Fund’s distributions made prior to the Fund’s fiscal year end may be categorized as a tax return of capital at year end.
Wells Fargo Pennsylvania Tax-Free Fund | 21
Notes to financial statements
Federal and other taxes
The Fund intends to continue to qualify as a regulated investment company by distributing substantially all of its investment company taxable andtax-exempt income and any net realized capital gains (after reduction for capital loss carryforwards) sufficient to relieve it from all, or substantially all, federal income taxes. Accordingly, no provision for federal income taxes was required.
The Fund’s income and federal excise tax returns and all financial records supporting those returns for the prior three fiscal years are subject to examination by the federal and Delaware revenue authorities. Management has analyzed the Fund’s tax positions taken on federal, state, and foreign tax returns for all open tax years and does not believe that there are any uncertain tax positions that require recognition of a tax liability.
As of June 30, 2019, the aggregate cost of all investments for federal income tax purposes was $119,631,914 and the unrealized gains (losses) consisted of:
| | | | |
| |
Gross unrealized gains | | $ | 8,302,931 | |
| |
Gross unrealized losses | | | (7,318 | ) |
| |
Net unrealized gains | | $ | 8,295,613 | |
As of June 30, 2019, the Fund had capital loss carryforwards which consist of $469,893 in short-term capital losses.
Class allocations
The separate classes of shares offered by the Fund differ principally in applicable sales charges, distribution, shareholder servicing, and administration fees. Class specific expenses are charged directly to that share class. Investment income, common fund-level expenses, and realized and unrealized gains (losses) on investments are allocated daily to each class of shares based on the relative proportion of net assets of each class.
3. FAIR VALUATION MEASUREMENTS
Fair value measurements of investments are determined within a framework that has established a fair value hierarchy based upon the various data inputs utilized in determining the value of the Fund’s investments. The three-level hierarchy gives the highest priority to unadjusted quoted prices in active markets for identical assets or liabilities (Level 1) and the lowest priority to unobservable inputs (Level 3). The Fund’s investments are classified within the fair value hierarchy based on the lowest level of input that is significant to the fair value measurement. The inputs are summarized into three broad levels as follows:
| ∎ | | Level 1 – quoted prices in active markets for identical securities |
| ∎ | | Level 2 – other significant observable inputs (including quoted prices for similar securities, interest rates, prepayment speeds, credit risk, etc.) |
| ∎ | | Level 3 – significant unobservable inputs (including the Fund’s own assumptions in determining the fair value of investments) |
The inputs or methodologies used for valuing investments in securities are not necessarily an indication of the risk associated with investing in those securities.
The following is a summary of the inputs used in valuing the Fund’s assets and liabilities as of June 30, 2019:
| | | | | | | | | | | | | | | | |
| | | | |
| | | Quoted prices (Level 1) | | | Other significant
observable inputs
(Level 2) | | | Significant
unobservable inputs (Level 3) | | | Total | |
| | | | |
Assets | | | | | | | | | | | | | | | | |
Investments in: | | | | | | | | | | | | | | | | |
| | | | |
Municipal obligations | | $ | 0 | | | $ | 126,998,225 | | | $ | 0 | | | $ | 126,998,225 | |
| | | | |
Short-term investments | | | | | | | | | | | | | | | | |
| | | | |
Investment companies | | | 929,302 | | | | 0 | | | | 0 | | | | 929,302 | |
| | | | |
Total assets | | $ | 929,302 | | | $ | 126,998,225 | | | $ | 0 | | | $ | 127,927,527 | |
Additional sector, industry or geographic detail is included in the Portfolio of Investments.
At June 30, 2019, the Fund did not have any transfers into/out of Level 3.
22 | Wells Fargo Pennsylvania Tax-Free Fund
Notes to financial statements
4. TRANSACTIONS WITH AFFILIATES
Management fee
Funds Management, an indirect wholly owned subsidiary of Wells Fargo & Company (“Wells Fargo”), is the manager of the Fund and provides advisory and fund-level administrative services under an investment management agreement. Under the investment management agreement, Funds Management is responsible for, among other services, implementing the investment objectives and strategies of the Fund, supervising the subadviser and providing fund-level administrative services in connection with the Fund’s operations. As compensation for its services under the investment management agreement, Funds Management is entitled to receive a management fee at the following annual rate based on the Fund’s average daily net assets:
| | | | |
| |
| Average daily net assets | | Management fee | |
| |
First $500 million | | | 0.400 | % |
| |
Next $500 million | | | 0.375 | |
| |
Next $2 billion | | | 0.350 | |
| |
Next $2 billion | | | 0.325 | |
| |
Next $5 billion | | | 0.290 | |
| |
Over $10 billion | | | 0.280 | |
For the year ended June 30, 2019, the management fee was equivalent to an annual rate of 0.40% of the Fund’s average daily net assets.
Funds Management has retained the services of a subadviser to provide daily portfolio management to the Fund. The fee for subadvisory services is borne by Funds Management. Wells Capital Management Incorporated, an affiliate of Funds Management and an indirect wholly owned subsidiary of Wells Fargo, is the subadviser to the Fund and is entitled to receive a fee from Funds Management at an annual rate starting at 0.20% and declining to 0.10% as the average daily net assets of the Fund increase.
Administration fees
Under a class-level administration agreement, Funds Management provides class-level administrative services to the Fund, which includes paying fees and expenses for services provided by the transfer agent,sub-transfer agents, omnibus account servicers and record-keepers. As compensation for its services under the class-level administration agreement, Funds Management receives an annual fee which is calculated based on the average daily net assets of each class as follows:
| | | | |
| |
| | | Class-level
administration fee | |
| |
Class A, Class C | | | 0.16 | % |
| |
Institutional Class | | | 0.08 | |
Funds Management has contractually waived and/or reimbursed management and administration fees to the extent necessary to maintain certain net operating expense ratios for the Fund. When each class of the Fund has exceeded its expense cap, Funds Management has waived fees and/or reimbursed expenses from fund-level expenses on a proportionate basis and then from class specific expenses. When only certain classes exceed their expense caps, waivers and/or reimbursements are applied against class specific expenses before fund-level expenses. Funds Management has committed through October 31, 2019 to waive fees and/or reimburse expenses to the extent necessary to cap the Fund’s expenses at 0.74% for Class A shares, 1.49% for Class C shares, and 0.49% for Institutional Class shares. Prior to or after the commitment expiration date, the cap may be increased or the commitment to maintain the cap may be terminated only with the approval of the Board of Trustees.
Distribution fee
The Trust has adopted a distribution plan for Class C shares of the Fund pursuant to Rule12b-1 under the 1940 Act. A distribution fee is charged to Class C shares and paid to Wells Fargo Funds Distributor, LLC (“Funds Distributor”), the principal underwriter, at an annual rate of 0.75% of the average daily net assets of Class C shares.
In addition, Funds Distributor is entitled to receive thefront-end sales charge from the purchase of Class A shares and a contingent deferred sales charge on the redemption of certain Class A shares. Funds Distributor is also entitled to receive the contingent deferred sales charges from redemptions of Class C shares. For the year ended June 30, 2019, Funds Distributor received $4,375 from the sale of Class A shares. No contingent deferred sales charges were incurred by Class A and Class C shares for the year ended June 30, 2019.
Wells Fargo Pennsylvania Tax-Free Fund | 23
Notes to financial statements
Shareholder servicing fees
The Trust has entered into contracts with one or more shareholder servicing agents, whereby Class A and Class C of the Fund are charged a fee at an annual rate of 0.25% of the average daily net assets of each respective class. A portion of these total shareholder servicing fees were paid to affiliates of Wells Fargo.
Interfund transactions
The Fund may purchase or sell portfolio investment securities to certain other Wells Fargo affiliates pursuant to Rule17a-7 under the 1940 Act and under procedures adopted by the Board of Trustees. The procedures have been designed to ensure that these interfund transactions, which do not incur broker commissions, are effected at current market prices. Pursuant to these procedures, the Fund had $1,000,000 and $3,000,000 in interfund purchases and sales, respectively, during the year ended June 30, 2019.
5. INVESTMENT PORTFOLIO TRANSACTIONS
Purchases and sales of investments, excluding U.S. government obligations (if any) and short-term securities, for the year ended June 30, 2019 were $12,347,939 and $29,523,877, respectively.
6. BANK BORROWINGS
The Trust (excluding the money market funds), Wells Fargo Master Trust and Wells Fargo Variable Trust are parties to a $280,000,000 revolving credit agreement whereby the Fund is permitted to use bank borrowings for temporary or emergency purposes, such as to fund shareholder redemption requests. Interest under the credit agreement is charged to the Fund based on a borrowing rate equal to the higher of the Federal Funds rate in effect on that day plus 1.25% or the overnight LIBOR rate in effect on that day plus 1.25%. In addition, an annual commitment fee equal to 0.25% of the unused balance is allocated to each participating fund.
For the year ended June 30, 2019, there were no borrowings by the Fund under the agreement.
7. DISTRIBUTIONS TO SHAREHOLDERS
The tax character of distributions paid during the years ended June 30, 2019 and June 30, 2018 were as follows:
| | | | | | | | |
| | | Year ended June 30 | |
| | |
| | | 2019 | | | 2018 | |
| | |
Tax-exempt income | | $ | 4,119,951 | | | $ | 5,180,520 | |
| | |
Tax basis return of capital | | | 310,520 | | | | 0 | |
As of June 30, 2019, the components of distributable earnings on a tax basis were as follows:
| | |
Unrealized gains | | Capital loss carryforward |
| |
| $8,295,613 | | $(469,893) |
Effective for all filings after November 4, 2018, the Securities and Exchange Commission eliminated the requirement to separately state the components of distributions to shareholders under U.S. generally accepted accounting principles. The amounts of distributions to shareholders for the year ended June 30, 2018 were as follows:
| | | | |
| |
| | | Net
investment
income | |
| |
Class A | | | $1,414,368 | |
| |
Class C | | | 375,013 | |
| |
Institutional Class | | | 3,391,139 | |
8. CONCENTRATION RISK
The Fund invests a substantial portion of its assets in issuers of municipal debt securities located in a single state or territory of the U.S. Therefore, it may be more affected by economic and political developments in that state or region than would be a comparable generaltax-exempt fund.
24 | Wells Fargo Pennsylvania Tax-Free Fund
Notes to financial statements
9. INDEMNIFICATION
Under the Trust’s organizational documents, the officers and Trustees have been granted certain indemnification rights against certain liabilities that may arise out of performance of their duties to the Trust. Additionally, in the normal course of business, the Trust may enter into contracts with service providers that contain a variety of indemnification clauses. The Trust’s maximum exposure under these arrangements is dependent on future claims that may be made against the Fund and, therefore, cannot be estimated.
10. NEW ACCOUNTING PRONOUNCEMENTS
In August 2018, FASB issued Accounting Standards Update (“ASU”)No. 2018-13, Fair Value Measurement (Topic 820)Disclosure Framework—Changes to the Disclosure Requirements for Fair Value Measurement.ASU2018-13 updates the disclosure requirements for fair value measurements by modifying or removing certain disclosures and adding certain new disclosures. The amendments are effective for fiscal years, and interim periods within those fiscal years, beginning after December 15, 2019. Early adoption is permitted. Management has adopted the removal and modification of disclosures early, as permitted, and will adopt the additional new disclosures at the effective date.
In March 2017, FASB issued ASU No. 2017-08,Premium Amortization on Purchased Callable Debt Securities. ASU 2017-08 shortens the amortization period for certain callable debt securities held at a premium and requires the premium to be amortized to the earliest call date. The amendments do not require an accounting change for securities held at a discount; and discounts will continue to be accreted to the maturity date of the security. ASU 2017-08 is effective for fiscal years beginning after December 15, 2018 and for interim periods within those fiscal years. During the current reporting period, management of the Fund adopted the change in accounting policy which did not have a material impact to the Fund’s financial statements.
Wells Fargo Pennsylvania Tax-Free Fund | 25
Report of independent registered public accounting firm
TO THE SHAREHOLDERS OF THE FUND AND BOARD OF TRUSTEES OF WELLS FARGO FUNDS TRUST:
Opinion on the Financial Statements
We have audited the accompanying statement of assets and liabilities of Wells Fargo Pennsylvania Tax-Free Fund (the Fund), one of the funds constituting Wells Fargo Funds Trust, including the portfolio of investments, as of June 30, 2019, the related statement of operations for the year then ended, the statements of changes in net assets for each of the years in the two year period then ended, and the related notes (collectively, the financial statements) and the financial highlights for each of the years in the five year period then ended. In our opinion, the financial statements and financial highlights present fairly, in all material respects, the financial position of the Fund as of June 30, 2019, the results of its operations for the year then ended, the changes in its net assets for each of the years in the two year period then ended, and the financial highlights for each of the years in the five year period then ended, in conformity with U.S. generally accepted accounting principles.
Basis for Opinion
These financial statements and financial highlights are the responsibility of the Fund’s management. Our responsibility is to express an opinion on these financial statements and financial highlights based on our audits. We are a public accounting firm registered with the Public Company Accounting Oversight Board (United States) (PCAOB) and are required to be independent with respect to the Fund in accordance with the U.S. federal securities laws and the applicable rules and regulations of the Securities and Exchange Commission and the PCAOB.
We conducted our audits in accordance with the standards of the PCAOB. Those standards require that we plan and perform the audit to obtain reasonable assurance about whether the financial statements and financial highlights are free of material misstatement, whether due to error or fraud. Our audits included performing procedures to assess the risks of material misstatement of the financial statements and financial highlights, whether due to error or fraud, and performing procedures that respond to those risks. Such procedures included examining, on a test basis, evidence regarding the amounts and disclosures in the financial statements and financial highlights. Such procedures also included confirmation of securities owned as of June 30, 2019, by correspondence with the custodian or by other appropriate auditing procedures. Our audits also included evaluating the accounting principles used and significant estimates made by management, as well as evaluating the overall presentation of the financial statements and financial highlights. We believe that our audits provide a reasonable basis for our opinion.

We have not been able to determine the specific year that we began serving as the auditor of one or more Wells Fargo Funds investment companies; however we are aware that we have served as the auditor of one or more Wells Fargo Funds investment companies since at least 1955.
Boston, Massachusetts
August 26, 2019
26 | Wells Fargo Pennsylvania Tax-Free Fund
Other information (unaudited)
TAX INFORMATION
Pursuant to Section 852 of the Internal Revenue Code, 100% of distributions paid from net investment income is designated as exempt-interest dividends for the fiscal year ended June 30, 2019.
PROXY VOTING INFORMATION
A description of the policies and procedures used to determine how to vote proxies relating to portfolio securities is available, upon request, by calling1-800-222-8222, visiting our website atwfam.com, or visiting the SEC website at sec.gov. Information regarding how the proxies related to portfolio securities were voted during the most recent12-month period ended June 30 is available on the website atwfam.com or by visiting the SEC website at sec.gov
QUARTERLY PORTFOLIO HOLDINGS INFORMATION
The Fund files its complete schedule of portfolio holdings with the SEC for the first and third quarters of each fiscal year on FormN-Q or FormN-PORT, which is available by visiting the SEC website at sec.gov. Those forms may be reviewed and copied at the SEC’s Public Reference Room in Washington, DC. Information on the operation of the Public Reference Room may be obtained by calling1-800-SEC-0330.
Wells Fargo Pennsylvania Tax-Free Fund | 27
Other information (unaudited)
BOARD OF TRUSTEES AND OFFICERS
Each of the Trustees and Officers1 listed in the table below acts in identical capacities for each fund in the Wells Fargo family of funds, which consists of 152 mutual funds comprising the Wells Fargo Funds Trust, Wells Fargo Variable Trust, Wells Fargo Master Trust and fourclosed-end funds (collectively the “Fund Complex”). This table should be read in conjunction with the Prospectus and the Statement of Additional Information2. The mailing address of each Trustee and Officer is 525 Market Street, 12th Floor, San Francisco, CA 94105. Each Trustee and Officer serves an indefinite term, however, each Trustee serves such term until reaching the mandatory retirement age established by the Trustees.
Independent Trustees
| | | | | | |
Name and year of birth | | Position held and
length of service* | | Principal occupations during past five years or longer | | Current other
public company or
investment
company
directorships |
| | | |
William R. Ebsworth
(Born 1957) | | Trustee,
since 2015 | | Retired. From 1984 to 2013, equities analyst, portfolio manager, research director and chief investment officer at Fidelity Management and Research Company in Boston, Tokyo, and Hong Kong, and retired in 2013 as Chief Investment Officer of Fidelity Strategic Advisers, Inc. where he led a team of investment professionals managing client assets. Prior thereto, Board member of Hong Kong Securities Clearing Co., Hong Kong Options Clearing Corp., the Thailand International Fund, Ltd., Fidelity Investments Life Insurance Company, and Empire Fidelity Investments Life Insurance Company. Audit Committee Chair and Investment Committee Chair of the Vincent Memorial Hospital Endowment(non-profit organization). Mr. Ebsworth is a CFA® charterholder. | | N/A |
| | | |
Jane A. Freeman
(Born 1953) | | Trustee,
since 2015;
Chair Liaison,
since 2018 | | Retired. From 2012 to 2014 and 1999 to 2008, Chief Financial Officer of Scientific Learning Corporation. From 2008 to 2012, Ms. Freeman provided consulting services related to strategic business projects. Prior to 1999, Portfolio Manager at Rockefeller & Co. and Scudder, Stevens & Clark. Board member of the Harding Loevner Funds from 1996 to 2014, serving as both Lead Independent Director and chair of the Audit Committee. Board member of the Russell Exchange Traded Funds Trust from 2011 to 2012 and the chair of the Audit Committee. Ms. Freeman is a Board Member of The Ruth Bancroft Garden(non-profit organization). She is also an inactive Chartered Financial Analyst. | | N/A |
| | | |
| Isaiah Harris, Jr. (Born 1952) | | Trustee,
since 2009;
Audit Committee Chairman,
since 2019 | | Retired. Chairman of the Board of CIGNA Corporation since 2009, and Director since 2005. From 2003 to 2011, Director of Deluxe Corporation. Prior thereto, President and CEO of BellSouth Advertising and Publishing Corp. from 2005 to 2007, President and CEO of BellSouth Enterprises from 2004 to 2005 and President of BellSouth Consumer Services from 2000 to 2003. Emeritus member of the Iowa State University Foundation Board of Governors. Emeritus Member of the Advisory Board of Iowa State University School of Business. Advisory Board Member, Palm Harbor Academy (private school). Advisory Board Member, Child Evangelism Fellowship(non-profit). Mr. Harris is a certified public accountant (inactive status). | | CIGNA Corporation |
| | | |
| Judith M. Johnson (Born 1949) | | Trustee,
since 2008; Audit Committee
Chairman, from 2009 to 2018 | | Retired. Prior thereto, Chief Executive Officer and Chief Investment Officer of Minneapolis Employees Retirement Fund from 1996 to 2008. Ms. Johnson is an attorney, certified public accountant and a certified managerial accountant. | | N/A |
28 | Wells Fargo Pennsylvania Tax-Free Fund
Other information (unaudited)
| | | | | | |
Name and year of birth | | Position held and
length of service* | | Principal occupations during past five years or longer | | Current other
public company or
investment
company
directorships |
| | | |
David F. Larcker
(Born 1950) | | Trustee,
since 2009 | | James Irvin Miller Professor of Accounting at the Graduate School of Business, Stanford University, Director of the Corporate Governance Research Initiative and Senior Faculty of The Rock Center for Corporate Governance since 2006. From 2005 to 2008, Professor of Accounting at the Graduate School of Business, Stanford University. Prior thereto, Ernst & Young Professor of Accounting at The Wharton School, University of Pennsylvania from 1985 to 2005. | | N/A |
| | | |
Olivia S. Mitchell
(Born 1953) | | Trustee,
since 2006; Nominating and Governance Committee Chairman, since 2018 | | International Foundation of Employee Benefit Plans Professor, Wharton School of the University of Pennsylvania since 1993. Director of Wharton’s Pension Research Council and Boettner Center on Pensions & Retirement Research, and Research Associate at the National Bureau of Economic Research. Previously, Cornell University Professor from 1978 to 1993. | | N/A |
| | | |
Timothy J. Penny
(Born 1951) | | Trustee,
since 1996; Chairman, since 2018 | | President and Chief Executive Officer of Southern Minnesota Initiative Foundation, anon-profit organization, since 2007. Member of the Board of Trustees of NorthStar Education Finance, Inc., anon-profit organization, since 2007. | | N/A |
| | | |
James G. Polisson
(Born 1959) | | Trustee,
since 2018 | | Retired. Chief Marketing Officer, Source (ETF) UK Services, Ltd, from 2015 to 2017. From 2012 to 2015, Principal of The Polisson Group, LLC, a management consulting, corporate advisory and principal investing company. Chief Executive Officer and Managing Director at Russell Investments, Global Exchange Traded Funds from 2010 to 2012. Managing Director of Barclays Global Investors from 1998 to 2010 and Global Chief Marketing Officer for iShares and Barclays Global Investors from 2000 to 2010. Trustee of the San Francisco Mechanics’ Institute, anon-profit organization, from 2013 to 2015. Board member of the Russell Exchange Traded Fund Trust from 2011 to 2012. Director of Barclays Global Investors Holdings Deutschland GmbH from 2006 to 2009. Mr. Polisson is an attorney and has a retired status with the Massachusetts and District of Columbia Bar Associations. | | N/A |
| * | Length of service dates reflect the Trustee’s commencement of service with the Trust’s predecessor entities, where applicable. |
Wells Fargo Pennsylvania Tax-Free Fund | 29
Other information (unaudited)
Officers
| | | | |
Name and year of birth | | Position held and
length of service | | Principal occupations during past five years or longer |
| | |
Andrew Owen (Born 1960) | | President,
since 2017 | | Executive Vice President of Wells Fargo & Company and Head of Affiliated Managers, Wells Fargo Asset Management, since 2014. In addition, Mr. Owen is currently President, Chief Executive Officer and Director of Wells Fargo Funds Management, LLC since 2017. Prior thereto, Executive Vice President responsible for marketing, investments and product development for Wells Fargo Funds Management, LLC, from 2009 to 2014. |
| | |
Nancy Wiser1 (Born 1967) | | Treasurer,
since 2012 | | Executive Vice President of Wells Fargo Funds Management, LLC since 2011. Chief Operating Officer and Chief Compliance Officer at LightBox Capital Management LLC, from 2008 to 2011. |
| | |
| Alexander Kymn (Born 1973) | | Secretary
and Chief Legal Officer,
since 2018 | | Senior Company Counsel of Wells Fargo Bank, N.A. since 2018 (previously Senior Counsel from 2007 to 2018). Vice President of Wells Fargo Funds Management, LLC from 2008 to 2014. |
| | |
| Michael H. Whitaker(Born 1967) | | Chief Compliance Officer,
since 2016 | | Senior Vice President and Chief Compliance Officer since 2016. Senior Vice President and Chief Compliance Officer for Fidelity Investments from 2007 to 2016. |
| | |
David Berardi
(Born 1975) | | Assistant Treasurer,
since 2009 | | Vice President of Wells Fargo Funds Management, LLC since 2009. Vice President of Evergreen Investment Management Company, LLC from 2008 to 2010. Manager of Fund Reporting and Control for Evergreen Investment Management Company, LLC from 2004 to 2010. |
| | |
| Jeremy DePalma1 (Born 1974) | | Assistant Treasurer,
since 2009 | | Senior Vice President of Wells Fargo Funds Management, LLC since 2009. Senior Vice President of Evergreen Investment Management Company, LLC from 2008 to 2010 and head of the Fund Reporting and Control Team within Fund Administration from 2005 to 2010. |
| 1 | Nancy Wiser acts as Treasurer of 65 funds in the Fund Complex. Jeremy DePalma acts as Treasurer of 87 funds and Assistant Treasurer of 65 funds in the Fund Complex. |
| 2 | The Statement of Additional Information includes additional information about the Trustees and is available, without charge, upon request, by calling1-800-222-8222 or by visiting the website atwfam.com. |
30 | Wells Fargo Pennsylvania Tax-Free Fund
Other information (unaudited)
BOARD CONSIDERATION OF INVESTMENT MANAGEMENT ANDSUB-ADVISORY AGREEMENTS:
Wells Fargo PennsylvaniaTax-Free Fund
Under the Investment Company Act of 1940 (the “1940 Act”), the Board of Trustees (the “Board”) of Wells Fargo Funds Trust (the “Trust”) must determine annually whether to approve the continuation of the Trust’s investment management andsub-advisory agreements. In this regard, at anin-person meeting held on May21-22, 2019 (the “Meeting”), the Board, all the members of which have no direct or indirect interest in the investment management andsub-advisory agreements and are not “interested persons” of the Trust, as defined in the 1940 Act (the “Independent Trustees”), reviewed and approved for Wells Fargo PennsylvaniaTax-Free Fund(the “Fund”): (i) an investment management agreement (the “Management Agreement”) with Wells Fargo Funds Management, LLC (“Funds Management”); and (ii) an investmentsub-advisory agreement (the“Sub-Advisory Agreement”) with Wells Capital Management Incorporated (the“Sub-Adviser”), an affiliate of Funds Management. The Management Agreement and theSub-Advisory Agreement are collectively referred to as the “Advisory Agreements.”
At the Meeting, the Board considered the factors and reached the conclusions described below relating to the selection of Funds Management and theSub-Adviser and the approval of the Advisory Agreements. Prior to the Meeting, including at anin-person meeting in April 2019, the Trustees conferred extensively among themselves and with representatives of Funds Management about these matters. Also, the Board has adopted a team-based approach, with each team consisting of asub-set of Trustees, to assist the full Board in the discharge of its duties in reviewing investment performance and other matters throughout the year. The Independent Trustees were assisted in their evaluation of the Advisory Agreements by independent legal counsel, from whom they received separate legal advice and with whom they met separately.
In providing information to the Board, Funds Management and theSub-Adviser were guided by a detailed set of requests for information submitted to them by independent legal counsel on behalf of the Independent Trustees at the start of the Board’s annual contract renewal process earlier in 2019. In considering and approving the Advisory Agreements, the Trustees considered the information they believed relevant, including but not limited to the information discussed below. The Board considered not only the specific information presented in connection with the Meeting, but also the knowledge gained over time through interaction with Funds Management and theSub-Adviser about various topics. In this regard, the Board reviewed reports of Funds Management at each of its quarterly meetings, which included, among other things, portfolio reviews and investment performance reports. In addition, the Board and the teams mentioned above confer with portfolio managers at various times throughout the year. The Board did not identify any particular information or consideration that wasall-important or controlling, and each individual Trustee may have attributed different weights to various factors.
After its deliberations, the Board unanimously approved the continuation of the Advisory Agreements for aone-year term and determined that the compensation payable to Funds Management and theSub-Adviser under each of the Advisory Agreements was reasonable. The Board considered the approval of the Advisory Agreements for the Fund as part of its consideration of agreements for funds across the complex, but its approvals were made on afund-by-fund basis. The following summarizes a number of important, but not necessarily all, factors considered by the Board in support of its approvals.
Nature, extent and quality of services
The Board received and considered various information regarding the nature, extent and quality of services provided to the Fund by Funds Management and theSub-Adviser under the Advisory Agreements. This information included a description of the investment advisory services and Fund-level administrative services covered by the Management Agreement, as well as, among other things, a summary of the background and experience of senior management of Wells Fargo Asset Management (“WFAM”), of which Funds Management and theSub-Adviser are a part, a summary of investments made in the business of WFAM, a summary of certain organizational and personnel changes involving Funds Management and theSub-Adviser, and a description of Funds Management’s and theSub-Adviser’s business continuity planning programs and of their approaches to data privacy and cybersecurity. The Board received and reviewed information about Funds Management’s role as administrator of the Fund’s liquidity risk management program. The Board also considered the qualifications, background, tenure and responsibilities of each of the portfolio managers primarily responsible for theday-to-day portfolio management of the Fund.
The Board evaluated the ability of Funds Management and theSub-Adviser to attract and retain qualified investment professionals, including research, advisory and supervisory personnel. The Board further considered the compliance programs and compliance records of Funds Management and theSub-Adviser. In addition, the Board took into account the full range of services provided to the Fund by Funds Management and its affiliates.
Wells Fargo Pennsylvania Tax-Free Fund | 31
Other information (unaudited)
Fund investment performance and expenses
The Board considered the investment performance results for the Fund over various time periods ended December 31, 2018. The Board considered these results in comparison to the investment performance of funds in a universe that was determined by Broadridge Inc. (“Broadridge”) to be similar to the Fund (the “Universe”), and in comparison to the Fund’s benchmark index and to other comparative data. Broadridge is an independent provider of investment company data. The Board received a description of the methodology used by Broadridge to select the mutual funds in the performance Universe. The Board noted that the investment performance of the Fund (Administrator Class) was higher than the average investment performance of the Universe for theten-year period under review, equal to the average investment performance of the Universe for thefive-year period under review, and in range of the average investment performance of the Universe for theone- and three-year periods under review. The Board also noted that the investment performance of the Fund was lower than its benchmark index, the Bloomberg Barclays Municipal Bond Index, for the three-year period under review, in range of its benchmark for theone-year period under review, but higher than its benchmark for the five- andten-year periods under review.
The Board also received and considered information regarding the Fund’s net operating expense ratios and their various components, including actual management fees, custodian and othernon-management fees, and Rule12b-1 andnon-Rule12b-1 shareholder service fees. The Board considered these ratios in comparison to the median ratios of funds in class-specific expense groups that were determined by Broadridge to be similar to the Fund (the “Groups”). The Board received a description of the methodology used by Broadridge to select the mutual funds in the expense Groups and an explanation of how funds comprising expense groups and their expense ratios may vary fromyear-to-year. Based on the Broadridge reports, the Board noted that the net operating expense ratios of the Fund were lower than the median net operating expense ratios of the expense Groups for each share class.
The Board took into account the Fund’s investment performance and expense information provided to it among the factors considered in deciding tore-approve the Advisory Agreements.
Investment management andsub-advisory fee rates
The Board reviewed and considered the contractual fee rates payable by the Fund to Funds Management under the Management Agreement, as well as the contractual fee rates payable by the Fund to Funds Management for class-level administrative services under a Class-Level Administration Agreement, which include, among other things, class-level transfer agency andsub-transfer agency costs (collectively, the “Management Rates”). The Board also reviewed and considered the contractual investmentsub-advisory fee rates that are payable by Funds Management to theSub-Adviser for investmentsub-advisory services.
Among other information reviewed by the Board was a comparison of the Fund’s Management Rates with the average contractual investment management fee rates of funds in the expense Groups at a common asset level as well as transfer agency costs of the funds in the expense Groups. The Board noted that the Management Rates of the Fund were lower than or equal to the sum of these average rates for the Fund’s expense Groups for all share classes.
The Board also received and considered information about the portion of the total management fee that was retained by Funds Management after payment of the fee to theSub-Adviser forsub-advisory services. In assessing the reasonableness of this amount, the Board received and evaluated information about the nature and extent of responsibilities retained and risks assumed by Funds Management and not delegated to or assumed by theSub-Adviser, and about Funds Management’son-going oversight services. Given the affiliation between Funds Management and theSub-Adviser, the Board ascribed limited relevance to the allocation of fees between them.
The Board also received and considered information about the nature and extent of services offered and fee rates charged by Funds Management and theSub-Adviser to other types of clients with investment strategies similar to those of the Fund. In this regard, the Board received information about the significantly greater scope of services, and compliance, reporting and other legal burdens and risks of managing proprietary mutual funds compared with those associated with managing assets of other types of clients, including third-partysub-advised fund clients andnon-mutual fund clients such as institutional separate accounts.
Based on its consideration of the factors and information it deemed relevant, including those described here, the Board determined that the compensation payable to Funds Management under the Management Agreement and to theSub-Adviser under theSub-Advisory Agreement was reasonable.
32 | Wells Fargo Pennsylvania Tax-Free Fund
Other information (unaudited)
Profitability
The Board received and considered information concerning the profitability of Funds Management, as well as the profitability of both WFAM and Wells Fargo & Co. (“Wells Fargo”) from providing services to the fund family as a whole. The Board noted that theSub-Adviser’s profitability information with respect to providing services to the Fund and other funds in the family was subsumed in the WFAM and Wells Fargo profitability analysis.
Funds Management reported on the methodologies and estimates used in calculating profitability, including a description of the methodology used to allocate certain expenses. Among other things, the Board noted that the levels of profitability reported on afund-by-fund basis varied widely, depending on factors such as the size, type and age of fund. Based on its review, the Board did not deem the profits reported by Funds Management, WFAM or Wells Fargo from services provided to the Fund to be at a level that would prevent it from approving the continuation of the Advisory Agreements.
Economies of scale
The Board received and considered information about the potential for Funds Management to experience economies of scale in the provision of management services to the Fund, the difficulties of calculating economies of scale at an individual fund level, and the extent to which potential scale benefits are shared with shareholders. The Board noted the existence of breakpoints in the Fund’s management fee structure, which operate generally to reduce the Fund’s expense ratios as the Fund grows in size. The Board considered that in addition to management fee breakpoints, Funds Management shares potential economies of scale from its management business in a variety of ways, including through fee waiver and expense reimbursement arrangements, services that benefit shareholders, competitive management fee rates set at the outset without regard to breakpoints, and investments in the business intended to enhance services available to shareholders.
The Board concluded that Funds Management’s arrangements with respect to the Fund, including contractual breakpoints, constituted a reasonable approach to sharing potential economies of scale with the Fund and its shareholders.
Other benefits to Funds Management and theSub-Adviser
The Board received and considered information regarding potential“fall-out” or ancillary benefits received by Funds Management and its affiliates, including theSub-Adviser, as a result of their relationships with the Fund. Ancillary benefits could include, among others, benefits directly attributable to other relationships with the Fund and benefits potentially derived from an increase in Funds Management’s and theSub-Adviser’s business as a result of their relationships with the Fund. The Board noted that various affiliates of Funds Management may receive distribution-related fees, shareholder servicing payments andsub-transfer agency fees in respect of shares sold or held through them and services provided.
The Board also reviewed information about soft dollar credits earned and utilized by theSub-Adviser, fees earned by Funds Management and theSub-Adviser from managing a private investment vehicle for the fund family’s securities lending collateral, and commissions earned by an affiliated broker from portfolio transactions.
Based on its consideration of the factors and information it deemed relevant, including those described here, the Board did not find that any ancillary benefits received by Funds Management and its affiliates, including theSub-Adviser, were unreasonable.
Conclusion
At the Meeting, after considering the above-described factors and based on its deliberations and its evaluation of the information described above, the Board unanimously approved the continuation of the Advisory Agreements for aone-year term and determined that the compensation payable to Funds Management and theSub-Adviser under each of the Advisory Agreements was reasonable.
Wells Fargo Pennsylvania Tax-Free Fund | 33
This page is intentionally left blank.
This page is intentionally left blank.
This page is intentionally left blank.

For more information
More information about Wells Fargo Funds is available free upon request. To obtain literature, please write, visit the Fund’s website, or call:
Wells Fargo Funds
P.O. Box 219967
Kansas City, MO 64121-9967
Website:wfam.com
Individual investors:1-800-222-8222
Retail investment professionals:1-888-877-9275
Institutional investment professionals:1-866-765-0778

This report and the financial statements contained herein are submitted for the general information of the shareholders of the Fund. If this report is used for promotional purposes, distribution of the report must be accompanied or preceded by a current prospectus. Before investing, please consider the investment objectives, risks, charges, and expenses of the investment. For a current prospectus and, if available, a summary prospectus, containing this information, call1-800-222-8222 or visit the Fund’s website atwfam.com. Read the prospectus carefully before you invest or send money.
Wells Fargo Asset Management (WFAM) is the trade name for certain investment advisory/management firms owned by Wells Fargo & Company. These firms include but are not limited to Wells Capital Management Incorporated and Wells Fargo Funds Management, LLC. Certain products managed by WFAM entities are distributed by Wells Fargo Funds Distributor, LLC (a broker-dealer and Member FINRA).
This material is for general informational and educational purposes only and is NOT intended to provide investment advice or a recommendation of any kind— including a recommendation for any specific investment, strategy, or plan.
INVESTMENT PRODUCTS: NOT FDIC INSURED ◾ NO BANK GUARANTEE ◾ MAY LOSE VALUE
© 2019 Wells Fargo Funds Management, LLC. All rights reserved.
404826 08-19
A255/AR255 06-19
Annual Report
June 30, 2019
Wells Fargo
Strategic Municipal Bond Fund
Beginning on January 1, 2021, as permitted by new regulations adopted by the Securities and Exchange Commission, paper copies of the Wells Fargo Funds’ annual and semi-annual shareholder reports issued after this date will no longer be sent by mail, unless you specifically request paper copies of the reports. Instead, the reports will be made available on the Funds’ website, and you will be notified by mail each time a report is posted and provided with a website address to access the report.
If you already elected to receive shareholder reports electronically, you will not be affected by this change and you need not take any action. You may elect to receive shareholder reports and other communications from the Fund electronically at any time by contacting your financial intermediary (such as a broker-dealer or bank) or, if you are a direct investor, by calling1-800-222-8222 or by enrolling at wellsfargo.com/advantagedelivery.
You may elect to receive all future reports in paper free of charge. If you invest through a financial intermediary, you can contact your financial intermediary to request that you continue to receive paper copies of your shareholder reports; if you invest directly with the Fund, you can call 1-800-222-8222. Your election to receive reports in paper will apply to all Wells Fargo Funds held in your account with your financial intermediary or, if you are a direct investor, to all Wells Fargo Funds that you hold.
|
|
|
Reduce clutter. Save trees. |
Sign up for electronic delivery of prospectuses and shareholder reports atwellsfargo.com/advantagedelivery |
The views expressed and any forward-looking statements are as of June 30, 2019, unless otherwise noted, and are those of the Fund managers and/or Wells Fargo Asset Management. Discussions of individual securities, or the markets generally, or any Wells Fargo Fund are not intended as individual recommendations. Future events or results may vary significantly from those expressed in any forward-looking statements. The views expressed are subject to change at any time in response to changing circumstances in the market. Wells Fargo Asset Management and the Fund disclaim any obligation to publicly update or revise any views expressed or forward-looking statements.
INVESTMENT PRODUCTS: NOT FDIC INSURED ◾ NO BANK GUARANTEE ◾ MAY LOSE VALUE
Wells Fargo Strategic Municipal Bond Fund | 1
Letter to shareholders (unaudited)

Andrew Owen
President
Wells Fargo Funds
Dear Shareholder:
We are pleased to offer you this annual report for the Wells Fargo Strategic Municipal Bond Fund for the 12-month period that ended June 30, 2019. After the first six months of the period yielded either low-single-digit or negative investment returns, stock and bond investors enjoyed a recovery during the final six months. The gains came amid continued concerns about global economic growth, international trade, geopolitical tensions, and bouts of market volatility.
For the period, U.S. stocks, based on the S&P 500 Index,1 gained 10.42% and international stocks, as measured by the MSCI ACWI ex USA Index (Net),2 rose 1.29%. The MSCI EM Index (Net)3 added 1.21%. For bond investors, the Bloomberg Barclays U.S. Aggregate Bond Index4 added 7.87%, the Bloomberg Barclays Global Aggregate ex-USD Index5 rose 4.10%, the Bloomberg Barclays Municipal Bond Index6 gained 6.71%, and the ICE BofAML U.S. High Yield Index7 added 7.58%.
U.S. and international markets diverged during the third quarter of 2018.
Domestic equity investors received encouraging news during the third quarter of 2018. The U.S. Bureau of Economic Analysis reported second-quarter annualized gross domestic product (GDP) growth of 4.2%. Hiring improved. Unemployment declined. Consumer confidence and spending increased. Third-quarter corporate earnings reports were generally positive. U.S. trade negotiations with Mexico and Canada progressed. The U.S. Federal Reserve (Fed) raised the federal funds rate by 25 basis points (bps; 100 bps equal 1.00%) to a target range of between 2.00% and 2.25% in September, one of four rate increases implemented during 2018, expressing confidence in the strength of the U.S. economic expansion’s durability.
Investors in international markets were not as confident. Tensions between the U.S. and China increased. The U.S. imposed $200 billion in tariffs on Chinese goods. China reacted with $60 billion in tariffs on U.S. goods. Economic growth in China caused concern. During the quarter, the MSCI ACWI ex USA Index (Net) gained 0.71%. The MSCI EM Index (Net) declined 1.09%. In fixed-income markets, U.S. bonds were flat, as measured by the Bloomberg Barclays U.S. Aggregate Bond Index. The Bloomberg Barclays Global Aggregate ex-USD Index fell 1.74%.
| 1 | The S&P 500 Index consists of 500 stocks chosen for market size, liquidity, and industry group representation. It is a market-value-weighted index with each stock’s weight in the index proportionate to its market value. You cannot invest directly in an index. |
| 2 | The Morgan Stanley Capital International (MSCI) All Country World Index (ACWI) ex USA Index (Net) is a free-float-adjusted market-capitalization weighted index that is designed to measure the equity market performance of developed and emerging markets, excluding the U.S. Source: MSCI. MSCI makes no express or implied warranties or representations and shall have no liability whatsoever with respect to any MSCI data contained herein. The MSCI data may not be further redistributed or used as a basis for other indices or any securities or financial products. This report is not approved, reviewed, or produced by MSCI. You cannot invest directly in an index. |
| 3 | The MSCI Emerging Markets (EM) Index (Net) is a free-float-adjusted market-capitalization-weighted index that is designed to measure the equity market performance of emerging markets. You cannot invest directly in an index. |
| 4 | The Bloomberg Barclays U.S. Aggregate Bond Index is a broad-based benchmark that measures the investment-grade, U.S. dollar-denominated, fixed-rate taxable bond market, including Treasuries, government-related and corporate securities, mortgage-backed securities (agency fixed-rate and hybrid adjustable-rate mortgage pass-throughs), asset-backed securities, and commercial mortgage-backed securities. You cannot invest directly in an index. |
| 5 | The Bloomberg Barclays Global Aggregate ex-USD Index is an unmanaged index that provides a broad-based measure of the global investment-grade fixed-income markets excluding the U.S. dollar-denominated debt market. You cannot invest directly in an index. |
| 6 | The Bloomberg Barclays Municipal Bond Index is an unmanaged index composed of long-term tax-exempt bonds with a minimum credit rating of Baa. You cannot invest directly in an index. |
| 7 | The ICE BofAML U.S. High Yield Index is a market-capitalization-weighted index of domestic and Yankee high-yield bonds. The index tracks the performance of high-yield securities traded in the U.S. bond market. You cannot invest directly in an index. Copyright 2019. ICE Data Indices, LLC. All rights reserved. |
2 | Wells Fargo Strategic Municipal Bond Fund
Letter to shareholders (unaudited)
Global markets suffered during the fourth quarter of 2018.
November’s U.S. midterm elections shifted control of the House of Representatives from Republicans to Democrats, presaging partisan clashes that followed and caused uncertainty among investors. Third-quarter U.S. GDP was announced at an annualized 3.4% rate, lower than the second-quarter rate. Brexit efforts stalled ahead of the March 2019 deadline. The People’s Bank of China cut reserve requirement ratios, accelerated infrastructure spending, and cut taxes even as the value of the yuan declined to low levels last seen in 2008. A partial U.S. government shutdown driven by partisan policy disputes extended into January.
The combination of news in the U.S. and generally weak economic indicators outside of the U.S. caused investors to seek safe havens. December’s S&P 500 Index performance was the worst since 1931. Globally, fixed-income investments fared better than stocks during the last two months of the year. The Fed increased the federal funds rate by 25 bps in December to a target range of between 2.25% and 2.50%.
The market climbs a wall of worry.
Investors entered 2019 with reasons to be concerned. Investment returns appeared to reaffirm the adage that markets climb a wall of worry. The S&P 500 Index gained 8.01% for the month of January, the best monthly performance in 30 years. Returns for the MSCI ACWI ex USA Index (Net), the Bloomberg Barclays U.S. Aggregate Bond Index, and the Bloomberg Barclays Global Aggregate ex-USD Index also were positive. The Fed indicated that it would pause its program of regular rate increases during 2019 as inflation remained low.
In February 2019, concerns over slowing global growth persisted. The Bureau of Economic Analysis announced fourth-quarter 2018 GDP grew at an annualized 2.2% rate, down from the levels of the prior two quarters. In a February report, the Bank of England forecast the slowest growth since the financial crisis for 2019. China and the U.S. continued to wrangle over trade issues.
By the end of March 2019, the combination of dovish Fed sentiment and steady, if not spectacular, economic and business metrics reinforced investors’ confidence. Monthly job creation data and corporate profits, while less consistent than during 2018, were solid. China announced a roughly $300 billion stimulus package through tax and fee cuts intended to reinvigorate economic growth.
During April 2019, investors drew confidence from favorable economic projections, sustained low inflation, and solid employment data. First-quarter GDP showed the economy grew at an annualized rate of 3.2% on improvement in business investment and exports. Favorable sentiment extended to foreign markets as the MSCI ACWI ex USA Index (Net) gained 2.64% and the MSCI EM Index (Net) added 2.11% for the month.
During May 2019, investing signals were mixed. In the U.S., partisan wrangling ramped up as Democrats and Republicans set their sights on 2020 presidential politics. The U.K.’s Brexit caused Prime Minister Theresa May to resign. The European Commission downgraded the 2019 growth forecast to 1.2%. The U.S. increased tariffs on products from China, China responded, and then talks broke down. President Donald Trump threatened to turn his foreign policy tariff tool to Mexico over immigration issues. Markets tumbled.
As had been the case during most of 2019 to date, just as the investment horizon appeared to darken, sentiment turned and markets gained. The gains, primarily driven by geopolitical and monetary policy events, drove equity markets to new highs. President Trump dropped his threats of new tariffs on Mexico after talks and further tariffs on China after meeting with China’s President Xi Jinping at the G-20 summit. President Mario Draghi of the European Central Bank said that if the outlook doesn’t
“December’s S&P 500 Index performance was the worst since 1931.”
“The S&P 500 Index gained 8.01% for the month of January, the best monthly performance in 30 years.”
Wells Fargo Strategic Municipal Bond Fund | 3
Letter to shareholders (unaudited)
improve, the bank will cut rates or buy more assets to prop up inflation. In the U.S., the Fed said growth shifted from “solid” to “moderate” and indicated a willingness to cut rates.
Don’t let short-term uncertainty derail long-term investment goals.
Periods of investment uncertainty can present challenges, but experience has taught us that maintaining long-term investment goals can be an effective way to plan for the future. To help you create a sound strategy based on your personal goals and risk tolerance, Wells Fargo Funds offers more than 100 mutual funds spanning a wide range of asset classes and investment styles. Although diversification cannot guarantee an investment profit or prevent losses, we believe it can be an effective way to manage investment risk and potentially smooth out overall portfolio performance. We encourage investors to know their investments and to understand that appropriate levels of risk-taking may unlock opportunities.
Thank you for choosing to invest with Wells Fargo Funds. We appreciate your confidence in us and remain committed to helping you meet your financial needs.
Sincerely,

Andrew Owen
President
Wells Fargo Funds
|
|
|
For further information about your Fund, contact your investment professional, visit our website at wfam.com, or call us directly at1-800-222-8222. |
4 | Wells Fargo Strategic Municipal Bond Fund
This page is intentionally left blank.
Performance highlights (unaudited)
Investment objective
The Fund seeks current income exempt from regular federal income tax.
Manager
Wells Fargo Funds Management, LLC
Subadviser
Wells Capital Management Incorporated
Portfolio managers
Wendy Casetta
Terry J. Goode‡
Robert J. Miller
Average annual total returns (%) as of June 30, 2019
| | | | | | | | | | | | | | | | | | | | | | | | | | | | | | | | | | |
| | | | |
| | | | | Including sales charge | | | Excluding sales charge | | | Expense ratios1 (%) | |
| | | | | | | | | |
| | | Inception date | | 1 year | | | 5 year | | | 10 year | | | 1 year | | | 5 year | | | 10 year | | | Gross | | | Net2 | |
| | | | | | | | | | |
| Class A (VMPAX)3 | | 12-1-1994 | | | 0.26 | | | | 1.37 | | | | 2.56 | | | | 4.41 | | | | 2.21 | | | | 2.99 | | | | 0.82 | | | | 0.82 | |
| | | | | | | | | | |
| Class C (DHICX)3 | | 8-18-1997 | | | 2.62 | | | | 1.45 | | | | 2.21 | | | | 3.62 | | | | 1.45 | | | | 2.21 | | | | 1.57 | | | | 1.57 | |
| | | | | | | | | | |
| Class R6 (VMPRX)3,4 | | 7-31-2018 | | | – | | | | – | | | | – | | | | 4.77 | | | | 2.41 | | | | 3.16 | | | | 0.44 | | | | 0.43 | |
| | | | | | | | | | |
| Administrator Class (VMPYX)3 | | 10-6-1997 | | | – | | | | – | | | | – | | | | 4.53 | | | | 2.36 | | | | 3.14 | | | | 0.76 | | | | 0.68 | |
| | | | | | | | | | |
| Institutional Class (STRIX)3,5 | | 11-30-2012 | | | – | | | | – | | | | – | | | | 4.75 | | | | 2.55 | | | | 3.28 | | | | 0.49 | | | | 0.48 | |
| | | | | | | | | | |
| Bloomberg Barclays Short-Intermediate Municipal Bond Index6 | | – | | �� | – | | | | – | | | | – | | | | 5.12 | | | | 2.30 | | | | 3.06 | | | | – | | | | – | |
Figures quoted represent past performance, which is no guarantee of future results, and do not reflect taxes that a shareholder may pay on fund distributions or the redemption of fund shares. Investment return and principal value of an investment will fluctuate so that an investor’s shares, when redeemed, may be worth more or less than their original cost. Performance shown without sales charges would be lower if sales charges were reflected. Current performance may be lower or higher than the performance data quoted, which assumes the reinvestment of dividends and capital gains. Current month-end performance is available on the Fund’s website,wfam.com.
Index returns do not include transaction costs associated with buying and selling securities, any mutual fund fees or expenses, or any taxes. It is not possible to invest directly in an index.
For Class A shares, the maximum front-end sales charge is 4.00%. For Class C shares, the maximum contingent deferred sales charge is 1.00%. Performance including a contingent deferred sales charge assumes the sales charge for the corresponding time period. Class R6, Administrator Class, and Institutional Class shares are sold without a front-end sales charge or contingent deferred sales charge.
Bond values fluctuate in response to the financial condition of individual issuers, general market and economic conditions, and changes in interest rates. Changes in market conditions and government policies may lead to periods of heightened volatility in the bond market and reduced liquidity for certain bonds held by the Fund. In general, when interest rates rise, bond values fall and investors may lose principal value. Interest rate changes and their impact on the Fund and its share price can be sudden and unpredictable. High-yield securities have a greater risk of default and tend to be more volatile than higher-rated debt securities. The use of derivatives may reduce returns and/or increase volatility. Certain investment strategies tend to increase the total risk of an investment (relative to the broader market). The Fund is exposed to municipal securities risk. Consult the Fund’s prospectus for additional information on these and other risks. A portion of the Fund’s income may be subject to federal, state, and/or local income taxes or the Alternative Minimum Tax (AMT). Any capital gains distributions may be taxable.
Please see footnotes on page 7.
6 | Wells Fargo Strategic Municipal Bond Fund
Performance highlights (unaudited)
|
|
| Growth of $10,000 investment as of June 30, 20196 |
|
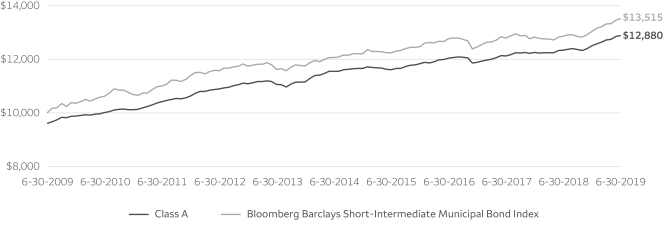
|
| ‡ | Mr. Goode became a portfolio manager of the Fund on March 28, 2019. |
| 1 | Reflects the expense ratios as stated in the most recent prospectuses. The expense ratios shown are subject to change and may differ from the annualized expense ratios shown in the financial highlights of this report. |
| 2 | The manager has contractually committed through October 31, 2019, to waive fees and/or reimburse expenses to the extent necessary to cap the expenses of each class after fee waivers at the amounts shown. Brokerage commissions, stamp duty fees, interest, taxes, acquired fund fees and expenses (if any), and extraordinary expenses are excluded from the expense cap. Prior to or after the commitment expiration date, the cap may be increased or the commitment to maintain the cap may be terminated only with the approval of the Board of Trustees. Without this cap, the Fund’s returns would have been lower. The expense ratio paid by an investor is the net expense ratio (the total annual fund operating expenses after fee waivers) as stated in the prospectuses. |
| 3 | Historical performance shown prior to July 12, 2010, is based on the performance of the Fund’s predecessor, Evergreen Strategic Municipal Bond Fund. |
| 4 | Historical performance shown for Class R6 shares prior to their inception reflects the performance of the Institutional Class shares, and includes the higher expenses applicable to Institutional Class shares. If these expenses had not been included, returns for Class R6 shares would be higher. |
| 5 | Historical performance shown for the Institutional Class shares prior to their inception reflects the performance of the Administrator Class shares, and includes the higher expenses applicable to the Administrator Class shares. If these expenses had not been included, returns for Institutional Class shares would be higher. |
| 6 | The Bloomberg Barclays Short-Intermediate Municipal Bond Index is a rules-based, market-value-weighted index composed of publicly traded municipal bonds that cover the U.S. dollar-denominated short-term tax-exempt bond market, including state and local general obligation bonds, revenue bonds, insured bonds, and prefunded bonds. You cannot invest directly in an index. |
| 7 | The chart compares the performance of Class A shares for the most recent ten years with the Bloomberg Barclays Short-Intermediate Municipal Bond Index. The chart assumes a hypothetical $10,000 investment in Class A shares and reflects all operating expenses and assumes the maximum initial sales charge of 4.00%. |
| 8 | Amounts are calculated based on the long-term total investments of the Fund. These amounts are subject to change and may have changed since the date specified. |
| 9 | The credit quality distribution of portfolio holdings reflected in the chart is based on ratings from Standard & Poor’s, Moody’s Investors Service, and/or Fitch Ratings Ltd. Credit quality ratings apply to the underlying holdings of the Fund and not to the Fund itself. The percentages of the Fund’s portfolio with the ratings depicted in the chart are calculated based on the total market value of fixed income securities held by the Fund. If a security was rated by all three rating agencies, the middle rating was utilized. If rated by two of three rating agencies, the lower rating was utilized, and if rated by one of the rating agencies, that rating was utilized. Standard & Poor’s rates the creditworthiness of bonds, ranging from AAA (highest) to D (lowest). Ratings from A to CCC may be modified by the addition of a plus (+) or minus (-) sign to show relative standing within the rating categories. Standard & Poor’s rates the creditworthiness of short-term notes from SP-1 (highest) to SP-3 (lowest). Moody’s rates the creditworthiness of bonds, ranging from Aaa (highest) to C (lowest). Ratings Aa to B may be modified by the addition of a number 1 (highest) to 3 (lowest) to show relative standing within the ratings categories. Moody’s rates the creditworthiness of short-term U.S. tax-exempt municipal securities from MIG 1/VMIG 1 (highest) to SG (lowest). Fitch rates the creditworthiness of bonds, ranging from AAA (highest) to D (lowest). Credit quality distribution is subject to change and may have changed since the date specified. |
Wells Fargo Strategic Municipal Bond Fund | 7
Performance highlights (unaudited)
MANAGER’S DISCUSSION
Fund highlights
| ∎ | | The Fund underperformed its benchmark, the Bloomberg Barclays Short-Intermediate Municipal Bond Index, for the12-month period that ended June 30, 2019. |
| ∎ | | The Fund’s conservative duration positioning detracted from performance as yields moved considerably lower over the period. However, yield-curve positioning modestly contributed to performance. |
| ∎ | | The Fund’s overweight to lower-quality credits was a positive contributor. Economic growth, while modest, generally has helped municipal credit quality improve, causing BBB-rated and other high-yield bonds to be some of the best performers. |
| ∎ | | The Fund’s underweight to prerefunded bonds and overweight to revenue bonds positively affected performance, while the underweight to state general obligation bonds detracted from performance. Specifically, within the revenue bond sector, hospital and industrial development revenue were the best-performing bonds in the index. The Fund’s overweight to those sectors contributed to performance over the period. |
|
|
| Effective maturity distribution as of June 30, 20198 |
|
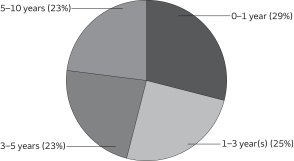 |
The Fed abruptly changed course from raising rates to a potential rate cut over the period.
Throughout most of 2018, the fixed-income markets expected the U.S. Federal Reserve (Fed) to continue the path to normalize monetary policy. Moderate economic growth, stronger employment data, and inflation near its 2% target enabled the Fed to increase the federal funds rate four times in the calendar year. Despite a Fed rate hike in December, the Treasury market rallied in the fourth quarter of 2018 as the market lowered expectations for further rate hikes amid slower global growth, trade tariffs, and
uncertainty concerning Britain’s departure from the European Union. These concerns only increased as we moved into the first half of 2019, and discussions changed from when the Fed might hike to when it might cut the federal funds rate. As a result, fixed-income markets rallied, pushing the benchmark 10-year Treasury yield from a 3.23% peak in November 2018 to 2.00% by the end of June 2019.
Specific to the municipal bond market, the beginning of the reporting period was marked with significant outflows due to a general risk-on sentiment in equity markets and the fear of rising interest rates. Short municipals slightly underperformed Treasuries over the period. As the calendar turned, so did market sentiment. Flows into municipal mutual funds not only turned positive, but record inflows were reported as investor opinion toward fixed income, particularly municipals, improved due to investor expectations that interest rates would remain stable. While new-issue supply was higher than it was a year earlier, it was still much lower than a typical year due to tax reform that eliminated the ability of issuers to advance refund outstanding, higher-cost debt. Overall reduced supply, state and local sales tax caps for individuals, and lower interest rates fueled demand and thus returns for municipal bonds over the period.
Security selection and sector exposure combined with an overweight to credit were the main drivers of performance.
As the period began, the Fund began to increase its interest rate exposure into relative market weakness. Yields on 10-year Treasury bonds peaked in November but consistently moved lower over the second half of the period. While the duration of the Fund extended slightly, it was still short versus the benchmark and thus not enough to overcome the subsequent rally in rates over the next seven months. Therefore, duration positioning detracted from performance over the period. However, the yield-curve positioning of the Fund contributed to performance as the yield curve flattened considerably. As a result, recent purchases into the Fund have been more focused on the steepest parts of the yield curve. We have also taken up the percentage of bonds subject to the alternative minimum tax as the number of individual investors subject to the tax has declined considerably. Going forward, we will look to extend the duration at times of weakness in the market.
Please see footnotes on page 7.
8 | Wells Fargo Strategic Municipal Bond Fund
Performance highlights (unaudited)
|
|
| Credit quality as of June 30, 20199 |
|
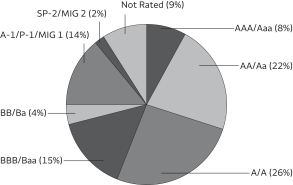
|
Municipal credit spreads continued to decline as demand remained robust. The Fund has gradually reduced its exposure to bonds rated A and below and added exposure to higher-rated bonds. Lower-quality bonds performed well during the period, and the Fund’s above-benchmark exposure was the largest contributor to our positive performance.
Illinois, New Jersey, and Connecticut bonds were the best-performing states in the index. While the Fund was overweight Illinois bonds, security selection was negative and the portfolio underperformed. In addition, as spreads on New Jersey paper continued to tighten over the period, we sold into the strength of the market, subsequently moving to an underweight position. As a result, the Fund’s underweight to New Jersey was also a detractor from performance. A slight overweight to Connecticut and good security selection within the state were positive for performance.
Fortunately, the Fund had a limited number of poor-performing securities. Bonds that performed poorly tended to be select prepaid gas bonds. As corporate spreads have been volatile, corporate-backed prepaid gas bond issuers have found the strong technical backdrop of the municipal market an attractive alternative to issuing debt over the period. As the market tried to digest increased issuance in specific names, we saw spreads on existing issues widen slightly, thus underperforming.
As the expansion appears to be in the rearview mirror, a transition away from risk may be warranted.
The economic expansion started in June 2009 and is the longest since the Great Depression. Low-quality bonds and equities have generally performed well. However, volatility has recently increased year to date. Overall, technicals remain strong in the municipal market. We expect municipal bond valuations in the medium term to be bolstered by high state income tax rates, record levels of municipal debt maturities and calls, and limited availability of gross municipal bond supply. Therefore, while the Fund currently has less interest rate exposure and more credit exposure than the benchmark, our strategy over the next 6 to 12 months will be to reduce these mismatches as we start to prepare for the next cycle.
Please see footnotes on page 7.
Wells Fargo Strategic Municipal Bond Fund | 9
Fund expenses (unaudited)
As a shareholder of the Fund, you incur two types of costs: (1) transaction costs, including sales charges (loads) on purchase payments and contingent deferred sales charges (if any) on redemptions and (2) ongoing costs, including management fees, distribution (12b-1) and/or shareholder servicing fees, and other Fund expenses. This example is intended to help you understand your ongoing costs (in dollars) of investing in the Fund and to compare these costs with the ongoing costs of investing in other mutual funds.
The example is based on an investment of $1,000 invested at the beginning of the six-month period and held for the entire period from January 1, 2019 to June 30, 2019.
Actual expenses
The “Actual” line of the table below provides information about actual account values and actual expenses. You may use the information in this line, together with the amount you invested, to estimate the expenses that you paid over the period. Simply divide your account value by $1,000 (for example, an $8,600 account value divided by $1,000 = 8.6), then multiply the result by the number in the “Actual” line under the heading entitled “Expenses paid during period” for your applicable class of shares to estimate the expenses you paid on your account during this period.
Hypothetical example for comparison purposes
The “Hypothetical” line of the table below provides information about hypothetical account values and hypothetical expenses based on the Fund’s actual expense ratio and an assumed rate of return of 5% per year before expenses, which is not the Fund’s actual return. The hypothetical account values and expenses may not be used to estimate the actual ending account balance or expenses you paid for the period. You may use this information to compare the ongoing costs of investing in the Fund and other funds. To do so, compare this 5% hypothetical example with the 5% hypothetical examples that appear in the shareholder reports of the other funds.
Please note that the expenses shown in the table are meant to highlight your ongoing costs only and do not reflect any transactional costs, such as sales charges (loads) and contingent deferred sales charges. Therefore, the “Hypothetical” line of the table is useful in comparing ongoing costs only and will not help you determine the relative total costs of owning different funds. In addition, if these transactional costs were included, your costs would have been higher.
| | | | | | | | | | | | | | | | |
| | | Beginning
account value
1-1-2019 | | | Ending
account value
6-30-2019 | | | Expenses
paid during
the period¹ | | | Annualized net
expense ratio | |
| | | | | |
Class A | | | | | | | | | | | | | | | | |
| | | | |
Actual | | $ | 1,000.00 | | | $ | 1,030.42 | | | $ | 3.99 | | | | 0.79 | % |
| | | | |
Hypothetical (5% return before expenses) | | $ | 1,000.00 | | | $ | 1,020.87 | | | $ | 3.97 | | | | 0.79 | % |
| | | | | |
Class C | | | | | | | | | | | | | | | | |
| | | | |
Actual | | $ | 1,000.00 | | | $ | 1,026.53 | | | $ | 7.75 | | | | 1.54 | % |
| | | | |
Hypothetical (5% return before expenses) | | $ | 1,000.00 | | | $ | 1,017.15 | | | $ | 7.71 | | | | 1.54 | % |
| | | | | |
Class R6 | | | | | | | | | | | | | | | | |
| | | | |
Actual | | $ | 1,000.00 | | | $ | 1,033.48 | | | $ | 2.07 | | | | 0.41 | % |
| | | | |
Hypothetical (5% return before expenses) | | $ | 1,000.00 | | | $ | 1,022.76 | | | $ | 2.06 | | | | 0.41 | % |
| | | | | |
Administrator Class | | | | | | | | | | | | | | | | |
| | | | |
Actual | | $ | 1,000.00 | | | $ | 1,032.14 | | | $ | 3.43 | | | | 0.68 | % |
| | | | |
Hypothetical (5% return before expenses) | | $ | 1,000.00 | | | $ | 1,021.42 | | | $ | 3.41 | | | | 0.68 | % |
| | | | | |
Institutional Class | | | | | | | | | | | | | | | | |
| | | | |
Actual | | $ | 1,000.00 | | | $ | 1,032.10 | | | $ | 2.33 | | | | 0.46 | % |
| | | | |
Hypothetical (5% return before expenses) | | $ | 1,000.00 | | | $ | 1,022.50 | | | $ | 2.32 | | | | 0.46 | % |
| 1 | Expenses paid is equal to the annualized net expense ratio of each class multiplied by the average account value over the period, multiplied by the number of days in the most recent fiscal half-year divided by the number of days in the fiscal year (to reflect the one-half-year period). |
10 | Wells Fargo Strategic Municipal Bond Fund
Portfolio of investments—June 30, 2019
| | | | | | | | | | | | | | | | |
| | | Interest rate | | | Maturity date | | | Principal | | | Value | |
| Municipal Obligations: 99.19% | |
| | | | |
Alabama: 2.26% | | | | | | | | | | | | | | | | |
| | | | |
| Health Revenue: 0.22% | | | | | | | | | | | | |
| | | | |
Birmingham AL Special Care Facilities Ascension Senior Credit GroupSeries C-1 | | | 1.85 | % | | | 11-15-2046 | | | $ | 5,250,000 | | | $ | 5,275,778 | |
| | | | | | | | | | | | | | | | |
| | | | |
Utilities Revenue: 2.04% | | | | | | | | | | | | | | | | |
| | | | |
Alabama Black Belt Energy Gas District Series A | | | 4.00 | | | | 12-1-2048 | | | | 2,000,000 | | | | 2,161,540 | |
| | | | |
Southeast Alabama Gas Supply District Project #1 Series A | | | 4.00 | | | | 4-1-2049 | | | | 4,410,000 | | | | 4,781,675 | |
| | | | |
Southeast Alabama Gas Supply District Project #2 Series A | | | 4.00 | | | | 6-1-2049 | | | | 16,505,000 | | | | 17,966,188 | |
| | | | |
Tender Option Bond Trust Receipts/Floater Certificates Series 2016-XM0184 (Morgan Stanley Bank LIQ) 144Aø | | | 2.30 | | | | 9-1-2046 | | | | 24,555,000 | | | | 24,555,000 | |
| |
| | | | 49,464,403 | |
| | | | | | | | | | | | | | | | |
| |
| | | | 54,740,181 | |
| | | | | | | | | | | | | | | | |
| | | | |
Alaska: 0.62% | | | | | | | | | | | | | | | | |
| | | | |
| Health Revenue: 0.25% | | | | | | | | | | | | |
| | | | |
Alaska IDA Loan Anticipation YKHC Project | | | 3.50 | | | | 12-1-2020 | | | | 6,000,000 | | | | 6,033,300 | |
| | | | | | | | | | | | | | | | |
| | | | |
| Industrial Development Revenue: 0.17% | | | | | | | | | | | | |
| | | | |
Valdez AK Marine Terminal BP Pipelines Project Series B | | | 5.00 | | | | 1-1-2021 | | | | 4,000,000 | | | | 4,207,120 | |
| | | | | | | | | | | | | | | | |
| | | | |
| Utilities Revenue: 0.20% | | | | | | | | | | | | |
| | | | |
Alaska Industrial Development & Export Authority Power Refunding Bonds Snettisham Hydroelectric Project Series 2015 | | | 5.00 | | | | 1-1-2022 | | | | 1,735,000 | | | | 1,834,190 | |
| | | | |
Alaska Industrial Development & Export Authority Power Refunding Bonds Snettisham Hydroelectric Project Series 2015 | | | 5.00 | | | | 1-1-2023 | | | | 2,835,000 | | | | 3,052,189 | |
| |
| | | | 4,886,379 | |
| | | | | | | | | | | | | | | | |
| |
| | | | 15,126,799 | |
| | | | | | | | | | | | | | | | |
| | | | |
Arizona: 1.72% | | | | | | | | | | | | | | | | |
| | | | |
| Education Revenue: 0.55% | | | | | | | | | | | | |
| | | | |
Arizona IDA Agribusiness & Equine Center Incorporated Project Series 2017B 144A | | | 4.00 | | | | 3-1-2027 | | | | 1,210,000 | | | | 1,255,932 | |
| | | | |
Maricopa County AZ IDA Educational Horizon Community Learning Center Project | | | 2.63 | | | | 7-1-2021 | | | | 1,085,000 | | | | 1,073,434 | |
| | | | |
Phoenix AZ IDA BASIS Schools Incorporated Project Series A 144A | | | 3.00 | | | | 7-1-2020 | | | | 790,000 | | | | 791,003 | |
| | | | |
Phoenix AZ IDA Great Hearts Academies Project | | | 5.20 | | | | 7-1-2022 | | | | 345,000 | | | | 360,729 | |
| | | | |
Phoenix AZ IDA Legacy Traditional School Project Series 2015 144A | | | 3.00 | | | | 7-1-2020 | | | | 305,000 | | | | 304,820 | |
| | | | |
Pima County AZ IDA American Leadership Academy Project Series 2015 144A | | | 4.60 | | | | 6-15-2025 | | | | 1,095,000 | | | | 1,149,520 | |
| | | | |
Pima County AZ IDA Charter Schools Project Series 2013 | | | 4.50 | | | | 7-1-2020 | | | | 530,000 | | | | 541,432 | |
| | | | |
Pima County AZ IDA Charter Schools Project Series 2013 | | | 4.50 | | | | 7-1-2021 | | | | 1,300,000 | | | | 1,355,510 | |
| | | | |
Pima County AZ IDA Charter Schools Project Series 2013 | | | 4.50 | | | | 7-1-2022 | | | | 1,355,000 | | | | 1,423,116 | |
| | | | |
Pima County AZ IDA New Plan Learning Project Series A | | | 7.75 | | | | 7-1-2035 | | | | 985,000 | | | | 997,638 | |
| | | | |
Pima County AZ IDA New Plan Learning Project Series A | | | 8.13 | | | | 7-1-2041 | | | | 2,950,000 | | | | 2,987,937 | |
| | | | |
Pima County AZ IDA Noah Webster Schools Project Series A | | | 5.50 | | | | 12-15-2023 | | | | 955,000 | | | | 1,009,655 | |
| |
| | | | 13,250,726 | |
| | | | | | | | | | | | | | | | |
| | | | |
| GO Revenue: 0.10% | | | | | | | | | | | | |
| | | | |
Verrado AZ Community Facilities District #1 Series A 144A | | | 4.25 | | | | 7-15-2019 | | | | 1,320,000 | | | | 1,320,607 | |
| | | | |
Verrado AZ Community Facilities District #1 Series A 144A | | | 5.00 | | | | 7-15-2020 | | | | 700,000 | | | | 712,089 | |
| | | | |
Verrado AZ Community Facilities District #1 Series A 144A | | | 5.00 | | | | 7-15-2021 | | | | 500,000 | | | | 514,810 | |
| |
| | | | 2,547,506 | |
| | | | | | | | | | | | | | | | |
Wells Fargo Strategic Municipal Bond Fund | 11
Portfolio of investments—June 30, 2019
| | | | | | | | | | | | | | | | |
| | | Interest rate | | | Maturity date | | | Principal | | | Value | |
| Health Revenue: 0.56% | | | | | | | | | | | | |
| | | | |
Maricopa County AZ IDA Senior Living Facilities Christian Care Retirement Apartments Incorporated Project | | | 5.00 | % | | | 1-1-2022 | | | $ | 1,065,000 | | | $ | 1,160,381 | |
| | | | |
Maricopa County AZ IDA Senior Living Facilities Christian Care Retirement Apartments Incorporated Project | | | 5.00 | | | | 1-1-2023 | | | | 1,120,000 | | | | 1,255,822 | |
| | | | |
Maricopa County AZ IDA Senior Living Facilities Christian Care Surprise Incorporated Project 144A | | | 5.00 | | | | 1-1-2026 | | | | 3,205,000 | | | | 3,263,107 | |
| | | | |
Maricopa County AZ IDA Series 2019C (SIFMA Municipal Swap +0.57%)± | | | 2.47 | | | | 1-1-2035 | | | | 6,000,000 | | | | 6,000,000 | |
| | | | |
Tempe AZ IDA Mirabella Arizona State University Project Series B1 144A | | | 4.00 | | | | 10-1-2023 | | | | 1,810,000 | | | | 1,829,711 | |
| |
| | | | 13,509,021 | |
| | | | | | | | | | | | | | | | |
| | | | |
| Miscellaneous Revenue: 0.51% | | | | | | | | | | | | |
| | | | |
Navajo Nation AZ Series A 144A | | | 4.00 | | | | 12-1-2022 | | | | 6,345,000 | | | | 6,591,694 | |
| | | | |
Navajo Nation AZ Series A 144A | | | 5.00 | | | | 12-1-2025 | | | | 4,110,000 | | | | 4,544,920 | |
| | | | |
Navajo Nation AZ Tribal Utility Authority (Municipal Government Guaranty Insured) | | | 4.00 | | | | 1-1-2021 | | | | 1,192,000 | | | | 1,200,821 | |
| |
| | | | 12,337,435 | |
| | | | | | | | | | | | | | | | |
| |
| | | | 41,644,688 | |
| | | | | | | | | | | | | | | | |
| | | | |
Arkansas: 0.19% | | | | | | | | | | | | | | | | |
| | | | |
| Health Revenue: 0.19% | | | | | | | | | | | | |
| | | | |
Boone County AR Hospital Construction Series 2006 (BOKF NA LOC) ø | | | 3.00 | | | | 5-1-2037 | | | | 4,700,000 | | | | 4,700,000 | |
| | | | | | | | | | | | | | | | |
| | | | |
California: 1.63% | | | | | | | | | | | | | | | | |
| | | | |
| Education Revenue: 0.05% | | | | | | | | | | | | |
| | | | |
California Municipal Finance Authority Charter School Nova Academy Project Series 2016A 144A | | | 4.00 | | | | 6-15-2026 | | | | 825,000 | | | | 882,486 | |
| | | | |
California School Finance Authority Charter School Rocketship Education Obligated Group Series 2017A 144A | | | 4.50 | | | | 6-1-2027 | | | | 250,000 | | | | 266,970 | |
| |
| | | | 1,149,456 | |
| | | | | | | | | | | | | | | | |
| | | | |
| GO Revenue: 0.43% | | | | | | | | | | | | |
| | | | |
Delhi CA Unified School District CAB (Ambac Insured) ¤ | | | 0.00 | | | | 8-1-2019 | | | | 475,000 | | | | 474,501 | |
| | | | |
State of California Series A4 (Citibank NA LOC) ø | | | 1.00 | | | | 5-1-2034 | | | | 10,000,000 | | | | 10,000,000 | |
| |
| | | | 10,474,501 | |
| | | | | | | | | | | | | | | | |
| | | | |
| Health Revenue: 0.41% | | | | | | | | | | | | |
| | | | |
California Statewide CDA Health Facilities Catholic Series D (AGM Insured) (m) | | | 1.88 | | | | 7-1-2041 | | | | 8,700,000 | | | | 8,700,000 | |
| | | | |
Palomar CA Health Refunding Bond Series 2016 | | | 4.00 | | | | 11-1-2019 | | | | 1,250,000 | | | | 1,257,950 | |
| |
| | | | 9,957,950 | |
| | | | | | | | | | | | | | | | |
| | | | |
| Industrial Development Revenue: 0.15% | | | | | | | | | | | | |
| | | | |
California PCFA AMT Calplant I Project 144A | | | 7.50 | | | | 7-1-2032 | | | | 3,500,000 | | | | 3,676,120 | |
| | | | | | | | | | | | | | | | |
| | | | |
| Miscellaneous Revenue: 0.19% | | | | | | | | | | | | |
| | | | |
Compton CA PFA Lease 144A | | | 4.00 | | | | 9-1-2022 | | | | 4,440,000 | | | | 4,527,646 | |
| | | | | | | | | | | | | | | | |
|
| Water & Sewer Revenue: 0.40% | |
| | | | |
California Tender Option Bond Trust Receipts/Certificates for Semitropic Improvement District Water Storage Series A (JPMorgan Chase & Company LIQ) 144Aø | | | 2.05 | | | | 12-1-2019 | | | | 9,595,000 | | | | 9,595,000 | |
| | | | | | | | | | | | | | | | |
| |
| | | | 39,380,673 | |
| | | | | | | | | | | | | | | | |
12 | Wells Fargo Strategic Municipal Bond Fund
Portfolio of investments—June 30, 2019
| | | | | | | | | | | | | | | | |
| | | Interest rate | | | Maturity date | | | Principal | | | Value | |
| Colorado: 1.52% | | | | | | | | | | | | | | | | |
| | | | |
| Education Revenue: 0.48% | | | | | | | | | | | | |
| | | | |
Colorado ECFA Eagle Ridge Academy Project 144A | | | 3.63 | % | | | 11-1-2026 | | | $ | 2,260,000 | | | $ | 2,278,803 | |
| | | | |
Colorado ECFA Rocky Mountain Classical Academy Project | | | 6.38 | | | | 9-1-2023 | | | | 1,445,000 | | | | 1,593,387 | |
| | | | |
Colorado ECFA Vanguard School Project | | | 4.00 | | | | 6-15-2021 | | | | 250,000 | | | | 261,560 | |
| | | | |
Colorado ECFA Vanguard School Project | | | 4.00 | | | | 6-15-2022 | | | | 515,000 | | | | 549,170 | |
| | | | |
Colorado ECFA Windsor Charter Academy 144A | | | 3.88 | | | | 9-1-2026 | | | | 1,140,000 | | | | 1,143,591 | |
| | | | |
Colorado School of Mines Institutional Enterprise Refunding Bonds Series 2018A (1 Month LIBOR +0.50%)± | | | 2.14 | | | | 2-1-2023 | | | | 5,915,000 | | | | 5,912,811 | |
| |
| | | | 11,739,322 | |
| | | | | | | | | | | | | | | | |
| | | | |
| GO Revenue: 0.08% | | | | | | | | | | | | |
| | | | |
Centennial CO Southglenn Metropolitan District | | | 3.00 | | | | 12-1-2021 | | | | 668,000 | | | | 667,065 | |
| | | | |
Grand River CO Hospital District (AGM Insured) | | | 5.00 | | | | 12-1-2025 | | | | 1,000,000 | | | | 1,191,600 | |
| |
| | | | 1,858,665 | |
| | | | | | | | | | | | | | | | |
| | | | |
| Health Revenue: 0.81% | | | | | | | | | | | | |
| | | | |
Colorado Health Facilities Authority Catholic Health Initiatives Series 2009A | | | 5.50 | | | | 7-1-2034 | | | | 10,000,000 | | | | 10,031,500 | |
| | | | |
Colorado Health Facilities Authority Catholic Health Initiatives Series 2011A | | | 5.00 | | | | 2-1-2022 | | | | 3,415,000 | | | | 3,604,703 | |
| | | | |
Colorado Health Facilities Authority Catholic Health Initiatives Series 2011A | | | 5.25 | | | | 2-1-2031 | | | | 5,150,000 | | | | 5,436,186 | |
| | | | |
Colorado Health Facilities Authority Christian Living Neighborhoods Project | | | 4.00 | | | | 1-1-2020 | | | | 450,000 | | | | 454,095 | |
| |
| | | | 19,526,484 | |
| | | | | | | | | | | | | | | | |
| | | | |
| Tax Revenue: 0.15% | | | | | | | | | | | | |
| | | | |
Centerra CO Metropolitan District #1 Series 2017 144A | | | 5.00 | | | | 12-1-2021 | | | | 1,440,000 | | | | 1,519,286 | |
| | | | |
Centerra CO Metropolitan District #1 Series 2017 144A | | | 5.00 | | | | 12-1-2022 | | | | 1,940,000 | | | | 2,079,292 | |
| |
| | | | 3,598,578 | |
| | | | | | | | | | | | | | | | |
| |
| | | | 36,723,049 | |
| | | | | | | | | | | | | | | | |
| | | | |
Connecticut: 3.00% | | | | | | | | | | | | | | | | |
| | | | |
| Education Revenue: 0.42% | | | | | | | | | | | | |
| | | | |
Connecticut HEFAR Yale University Issue Series A | | | 2.05 | | | | 7-1-2035 | | | | 7,000,000 | | | | 7,102,480 | |
| | | | |
Connecticut HEFAR Yale University Issue Series A-2 | | | 2.00 | | | | 7-1-2042 | | | | 1,500,000 | | | | 1,521,570 | |
| | | | |
Connecticut State Higher Education Supplemental Loan Authority AMT Chelsea Loan Progam Series B | | | 5.00 | | | | 11-15-2026 | | | | 750,000 | | | | 891,203 | |
| | | | |
Connecticut State Higher Education Supplemental Loan Authority AMT Chelsea Loan Progam Series B | | | 5.00 | | | | 11-15-2027 | | | | 500,000 | | | | 602,565 | |
| |
| | | | 10,117,818 | |
| | | | | | | | | | | | | | | | |
| | | | |
| GO Revenue: 0.40% | | | | | | | | | | | | |
| | | | |
Connecticut Series D (SIFMA Municipal Swap +0.92%)± | | | 2.82 | | | | 9-15-2019 | | | | 3,345,000 | | | | 3,349,415 | |
| | | | |
Hamden CT Refunding Bond | | | 5.00 | | | | 8-15-2019 | | | | 1,835,000 | | | | 1,842,927 | |
| | | | |
Hartford CT Series A | | | 5.00 | | | | 4-1-2027 | | | | 1,650,000 | | | | 1,835,460 | |
| | | | |
Hartford CT Series A | | | 5.00 | | | | 4-1-2025 | | | | 2,500,000 | | | | 2,792,225 | |
| |
| | | | 9,820,027 | |
| | | | | | | | | | | | | | | | |
| | | | |
| Health Revenue: 0.02% | | | | | | | | | | | | |
| | | | |
Connecticut HEFA Bridgeport Hospital Series D | | | 5.00 | | | | 7-1-2020 | | | | 500,000 | | | | 519,030 | |
| | | | | | | | | | | | | | | | |
| | | | |
| Housing Revenue: 0.40% | | | | | | | | | | | | |
| | | | |
Meriden CT Multifamily Housing Yale Acres Project | | | 1.73 | | | | 8-1-2022 | | | | 9,635,000 | | | | 9,651,380 | |
| | | | | | | | | | | | | | | | |
Wells Fargo Strategic Municipal Bond Fund | 13
Portfolio of investments—June 30, 2019
| | | | | | | | | | | | | | | | |
| | | Interest rate | | | Maturity date | | | Principal | | | Value | |
| Miscellaneous Revenue: 0.11% | | | | | | | | | | | | |
| | | | |
Connecticut Series A (SIFMA Municipal Swap +0.75%)± | | | 2.65 | % | | | 3-1-2021 | | | $ | 2,700,000 | | | $ | 2,711,610 | |
| | | | | | | | | | | | | | | | |
| | | | |
| Tax Revenue: 1.65% | | | | | | | | | | | | |
| | | | |
Connecticut State Special Tax Obligation Revenue Transportation Infrastructure Purpose | | | 5.00 | | | | 10-1-2030 | | | | 3,000,000 | | | | 3,689,640 | |
| | | | |
Connecticut State Special Tax Obligation Revenue Transportation Infrastructure Purpose | | | 5.00 | | | | 10-1-2031 | | | | 9,000,000 | | | | 11,006,550 | |
| | | | |
Connecticut State Special Tax Obligation Revenue Transportation Infrastructure Purpose | | | 5.00 | | | | 10-1-2032 | | | | 5,000,000 | | | | 6,093,300 | |
| | | | |
Connecticut State Special Tax Obligation Revenue Transportation Infrastructure Purpose Series A | | | 5.00 | | | | 8-1-2029 | | | | 16,280,000 | | | | 19,082,276 | |
| |
| | | | 39,871,766 | |
| | | | | | | | | | | | | | | | |
| |
| | | | 72,691,631 | |
| | | | | | | | | | | | | | | | |
| | | | |
Delaware: 0.09% | | | | | | | | | | | | | | | | |
| | | | |
| Education Revenue: 0.09% | | | | | | | | | | | | |
| | | | |
Delaware EDA Odyssey Charter School Project Series A 144A | | | 6.25 | | | | 9-1-2025 | | | | 1,960,000 | | | | 2,081,990 | |
| | | | | | | | | | | | | | | | |
| | | | |
District of Columbia: 0.24% | | | | | | | | | | | | | | | | |
| | | | |
| Housing Revenue: 0.24% | | | | | | | | | | | | |
| | | | |
District of Columbia HFA Hilltop Apartments Project Series 2017 | | | 1.94 | | | | 1-1-2021 | | | | 5,850,000 | | | | 5,860,881 | |
| | | | | | | | | | | | | | | | |
| | | | |
Florida: 3.25% | | | | | | | | | | | | | | | | |
| | | | |
| Education Revenue: 0.20% | | | | | | | | | | | | |
| | | | |
Capital Trust Agency Educational Facilities Renaissance Charter School Incorporated Projects Series 2017A 144A | | | 4.38 | | | | 6-15-2027 | | | | 1,345,000 | | | | 1,380,885 | |
| | | | |
Capital Trust Agency Educational Facilities Renaissance Charter School Incorporated Projects Series A 144A | | | 4.00 | | | | 6-15-2029 | | | | 2,410,000 | | | | 2,442,125 | |
| | | | |
Miami-Dade County FL IDA Youth Charter Schools Project Series 2015A 144A | | | 5.00 | | | | 9-15-2025 | | | | 900,000 | | | | 934,425 | |
| |
| | | | 4,757,435 | |
| | | | | | | | | | | | | | | | |
| | | | |
| Health Revenue: 2.01% | | | | | | | | | | | | |
| | | | |
Florida Tender Option Bond Trust Receipts/Certificates Series 2018-XG0173 (Credit Suisse LIQ) 144Aø | | | 2.00 | | | | 10-1-2025 | | | | 5,000,000 | | | | 5,000,000 | |
| | | | |
Highlands County FL Health Facilities Authority Adventist Health System Series A ø | | | 1.85 | | | | 11-15-2037 | | | | 10,000,000 | | | | 10,000,000 | |
| | | | |
Jacksonville FL HCFR Baptist Health Series D ø | | | 1.85 | | | | 8-1-2036 | | | | 3,615,000 | | | | 3,615,000 | |
| | | | |
Jacksonville FL HCFR Baptist Health Series E ø | | | 1.85 | | | | 8-1-2036 | | | | 4,455,000 | | | | 4,455,000 | |
| | | | |
Lakeland FL Hospital System Lakeland Regional Health System | | | 5.00 | | | | 11-15-2022 | | | | 4,495,000 | | | | 4,845,610 | |
| | | | |
Orange County FL Health Facilities Authority Nemours Foundaton Series B (Northern Trust Company LOC) ø | | | 1.83 | | | | 1-1-2039 | | | | 19,325,000 | | | | 19,325,000 | |
| | | | |
Sarasota County FL Health Facilities Authority Village on the Isle Project | | | 4.00 | | | | 1-1-2020 | | | | 1,485,000 | | | | 1,497,489 | |
| |
| | | | 48,738,099 | |
| | | | | | | | | | | | | | | | |
| Housing Revenue: 0.26% | |
| | | | |
Palm Beach County FL Atlantic University Housing Series A 144A | | | 5.00 | | | | 4-1-2029 | | | | 740,000 | | | | 834,875 | |
| | | | |
University of West Florida Foundation Incorporated Dormitory Series A | | | 5.00 | | | | 6-1-2020 | | | | 1,210,000 | | | | 1,246,373 | |
| | | | |
University of West Florida Foundation Incorporated Dormitory Series A | | | 5.00 | | | | 6-1-2021 | | | | 1,265,000 | | | | 1,344,746 | |
| | | | |
University of West Florida Foundation Incorporated Dormitory Series A | | | 5.00 | | | | 6-1-2022 | | | | 1,325,000 | | | | 1,450,120 | |
| | | | |
University of West Florida Foundation Incorporated Dormitory Series A | | | 5.00 | | | | 6-1-2023 | | | | 1,190,000 | | | | 1,338,322 | |
| |
| | | | 6,214,436 | |
| | | | | | | | | | | | | | | | |
14 | Wells Fargo Strategic Municipal Bond Fund
Portfolio of investments—June 30, 2019
| | | | | | | | | | | | | | | | |
| | | Interest rate | | | Maturity date | | | Principal | | | Value | |
| Industrial Development Revenue: 0.09% | | | | | | | | | | | | |
| | | | |
Florida Development Finance Corporation 144A | | | 5.00 | % | | | 5-1-2029 | | | $ | 2,000,000 | | | $ | 2,182,220 | |
| | | | | | | | | | | | | | | | |
| | | | |
| Miscellaneous Revenue: 0.13% | | | | | | | | | | | | |
| | | | |
Florida Village Community Development District #10 Special Assignment | | | 5.13 | | | | 5-1-2024 | | | | 2,275,000 | | | | 2,447,536 | |
| | | | |
Wildwood FL Village Community Development District #12 Series 2016 | | | 2.88 | | | | 5-1-2021 | | | | 660,000 | | | | 665,920 | |
| |
| | | | 3,113,456 | |
| | | | | | | | | | | | | | | | |
| | | | |
| Resource Recovery Revenue: 0.15% | | | | | | | | | | | | |
| | | | |
Florida Development Finance Corporation Solid Waste AMT Pro USA Incorporated 144A | | | 5.00 | | | | 8-1-2029 | | | | 3,500,000 | | | | 3,707,620 | |
| | | | | | | | | | | | | | | | |
| | | | |
| Transportation Revenue: 0.39% | | | | | | | | | | | | |
| | | | |
Florida Development Finance Corporation Surface Series T | | | 1.90 | | | | 1-1-2049 | | | | 8,400,000 | | | | 8,401,092 | |
| | | | |
Miami-Dade County FL Expressway Authority Toll System (AGM Insured, Citibank NA LIQ) 144Aø | | | 2.10 | | | | 2-1-2020 | | | | 1,050,000 | | | | 1,050,000 | |
| |
| | | | 9,451,092 | |
| | | | | | | | | | | | | | | | |
| | | | |
| Water & Sewer Revenue: 0.02% | | | | | | | | | | | | |
| | | | |
Charlotte County FL Industrial Development Authority Town & Country Utilities System Project 144A | | | 5.00 | | | | 10-1-2029 | | | | 500,000 | | | | 539,905 | |
| | | | | | | | | | | | | | | | |
| |
| | | | 78,704,263 | |
| | | | | | | | | | | | | | | | |
| | | | |
Georgia: 4.09% | | | | | | | | | | | | | | | | |
| | | | |
| Education Revenue: 0.06% | | | | | | | | | | | | |
| | | | |
Georgia Private Colleges & Universities Authority | | | 5.00 | | | | 10-1-2019 | | | | 1,325,000 | | | | 1,335,468 | |
| | | | | | | | | | | | | | | | |
| | | | |
| Health Revenue: 0.87% | | | | | | | | | | | | |
| | | | |
Gainesville & Hall Counties GA Development Authority Senior Living Facilities Lanier Village Series B (AGC Insured, TD Bank NA SPA) ø | | | 2.05 | | | | 11-15-2033 | | | | 15,000,000 | | | | 15,000,000 | |
| | | | |
Gainesville & Hall Counties GA Hospital Authority Health System Project Series B (SIFMA Municipal Swap +0.95%)± | | | 2.85 | | | | 8-15-2035 | | | | 6,000,000 | | | | 6,001,560 | |
| |
| | | | 21,001,560 | |
| | | | | | | | | | | | | | | | |
| | | | |
| Transportation Revenue: 0.08% | | | | | | | | | | | | |
| | | | |
Georgia Road & Tollway Authority I-75 S Express Lanes Project Series A 144A¤ | | | 0.00 | | | | 6-1-2024 | | | | 2,500,000 | | | | 1,901,200 | |
| | | | | | | | | | | | | | | | |
| | | | |
| Utilities Revenue: 3.08% | | | | | | | | | | | | |
| | | | |
Bartow County GA Development Authority | | | 2.75 | | | | 12-1-2032 | | | | 4,500,000 | | | | 4,615,155 | |
| | | | |
Burke County GA Development Authority Georgia Power Company Plant Vogtle Project | | | 2.25 | | | | 10-1-2032 | | | | 1,500,000 | | | | 1,513,170 | |
| | | | |
Burke County GA Development Authority Georgia Power Company Plant Vogtle Project First Series 2012 | | | 1.85 | | | | 12-1-2049 | | | | 3,000,000 | | | | 3,000,630 | |
| | | | |
Burke County GA Development Authority Oglethorpe Power Corporation Vogtle Project Series E | | | 3.25 | | | | 11-1-2045 | | | | 3,000,000 | | | | 3,106,410 | |
| | | | |
Burke County GA Development Authority Oglethorpe Power Corporation Vogtle Project Series F | | | 3.00 | | | | 11-1-2045 | | | | 14,955,000 | | | | 15,237,799 | |
| | | | |
Floyd County GA PCR Georgia Power Company Plant Hammond Project | | | 2.35 | | | | 7-1-2022 | | | | 8,875,000 | | | | 8,961,798 | |
| | | | |
Main Street Natural Gas Incorporated Georgia Gas Project Series B | | | 4.00 | | | | 8-1-2049 | | | | 10,000,000 | | | | 11,093,100 | |
| | | | |
Main Street Natural Gas Incorporated Georgia Gas Project Series C | | | 4.00 | | | | 8-1-2048 | | | | 14,485,000 | | | | 15,825,297 | |
| | | | |
Main Street Natural Gas Incorporated Georgia Gas Project Subordinate Bond Series A (Royal Bank of Canada LIQ) | | | 4.00 | | | | 4-1-2048 | | | | 2,640,000 | | | | 2,875,013 | |
| | | | |
Main Street Natural Gas Incorporated Georgia Gas Project Subordinate Bond Series B (1 Month LIBOR +0.75%)± | | | 2.39 | | | | 4-1-2048 | | | | 4,700,000 | | | | 4,648,817 | |
Wells Fargo Strategic Municipal Bond Fund | 15
Portfolio of investments—June 30, 2019
| | | | | | | | | | | | | | | | |
| | | Interest rate | | | Maturity date | | | Principal | | | Value | |
| Utilities Revenue (continued) | | | | | | | | | | | | |
| | | | |
Monroe County GA Development Authority Pollution Control Gulf Power Company Plant Scherer Project | | | 1.40 | % | | | 6-1-2049 | | | $ | 3,750,000 | | | $ | 3,747,638 | |
| |
| | | | 74,624,827 | |
| | | | | | | | | | | | | | | | |
| |
| | | | 98,863,055 | |
| | | | | | | | | | | | | | | | |
| | | | |
Guam: 0.04% | | | | | | | | | | | | | | | | |
| | | | |
| Water & Sewer Revenue: 0.04% | | | | | | | | | | | | |
| | | | |
Guam Government Waterworks Authority Water & Wastewater System Series 2014A | | | 5.00 | | | | 7-1-2020 | | | | 1,000,000 | | | | 1,028,470 | |
| | | | | | | | | | | | | | | | |
| | | | |
Hawaii: 0.39% | | | | | | | | | | | | | | | | |
| | | | |
| Health Revenue: 0.39% | | | | | | | | | | | | |
| | | | |
Hawaii Department of Budget & Finance Queens Health System Series B (SIFMA Municipal Swap +0.45%)± | | | 2.35 | | | | 7-1-2039 | | | | 9,325,000 | | | | 9,325,000 | |
| | | | | | | | | | | | | | | | |
| | | | |
Illinois: 17.12% | | | | | | | | | | | | | | | | |
| | | | |
| Airport Revenue: 1.84% | | | | | | | | | | | | |
| | | | |
Chicago IL Midway Airport Second Lien Refunding Bonds Series 2013A | | | 5.50 | | | | 1-1-2027 | | | | 3,925,000 | | | | 4,429,009 | |
| | | | |
Chicago IL Midway Airport Second Lien Refunding Bonds Series 2014A | | | 5.00 | | | | 1-1-2026 | | | | 7,000,000 | | | | 7,943,810 | |
| | | | |
Chicago IL Midway Airport Second Lien Refunding Bonds Series 2014A | | | 5.00 | | | | 1-1-2030 | | | | 4,925,000 | | | | 5,532,450 | |
| | | | |
Chicago IL O’Hare International Airport AMT Passenger Facility Charge Refunding Bonds Series B | | | 5.00 | | | | 1-1-2032 | | | | 5,125,000 | | | | 5,500,099 | |
| | | | |
Chicago IL O’Hare International Airport Senior Lien Bonds Series 2015 C | | | 5.00 | | | | 1-1-2022 | | | | 695,000 | | | | 751,705 | |
| | | | |
Chicago IL O’Hare International Airport Senior Lien Bonds Series 2015 D | | | 5.00 | | | | 1-1-2021 | | | | 500,000 | | | | 526,425 | |
| | | | |
Chicago IL O’Hare International Airport Senior Lien Refunding Bonds Series 2013A | | | 5.00 | | | | 1-1-2026 | | | | 2,690,000 | | | | 2,983,156 | |
| | | | |
Chicago IL O’Hare International Airport Senior Lien Refunding Bonds Series 2015A | | | 5.00 | | | | 1-1-2028 | | | | 10,000,000 | | | | 11,510,300 | |
| | | | |
Chicago IL O’Hare International Airport Senior Lien Refunding Bonds Series 2017D | | | 5.00 | | | | 1-1-2025 | | | | 1,700,000 | | | | 1,977,763 | |
| | | | |
Chicago IL O’Hare International Airport Customer Facility Charge | | | 5.25 | | | | 1-1-2023 | | | | 1,350,000 | | | | 1,513,890 | |
| | | | |
Chicago IL O’Hare International Airport Customer Facility Charge | | | 5.25 | | | | 1-1-2024 | | | | 1,665,000 | | | | 1,883,498 | |
| |
| | | | 44,552,105 | |
| | | | | | | | | | | | | | | | |
| | | | |
| GO Revenue: 6.00% | | | | | | | | | | | | |
| | | | |
Bensenville IL Series B (AGM Insured) | | | 5.00 | | | | 12-30-2025 | | | | 435,000 | | | | 467,986 | |
| | | | |
Berwyn IL Series A | | | 5.00 | | | | 12-1-2028 | | | | 3,000,000 | | | | 3,360,810 | |
| | | | |
Chicago IL Board of Education Unlimited Tax General Obligation Refunding Bonds Series 2018A (AGM Insured) | | | 5.00 | | | | 12-1-2024 | | | | 3,000,000 | | | | 3,410,820 | |
| | | | |
Chicago IL CAB City Colleges (National Insured) ¤ | | | 0.00 | | | | 1-1-2027 | | | | 7,720,000 | | | | 6,164,497 | |
| | | | |
Chicago IL CAB City Colleges (National Insured) ¤ | | | 0.00 | | | | 1-1-2024 | | | | 9,800,000 | | | | 8,682,408 | |
| | | | |
Chicago IL Park District General Obligation Limited Series A | | | 5.00 | | | | 1-1-2022 | | | | 400,000 | | | | 427,376 | |
| | | | |
Chicago IL Park District General Obligation Limited Series A | | | 5.00 | | | | 1-1-2023 | | | | 800,000 | | | | 875,328 | |
| | | | |
Chicago IL Park District General Obligation Limited Series A | | | 5.00 | | | | 1-1-2024 | | | | 550,000 | | | | 615,439 | |
| | | | |
Chicago IL Park District General Obligation Limited Series A | | | 5.00 | | | | 1-1-2025 | | | | 625,000 | | | | 707,206 | |
| | | | |
Chicago IL Park District General Obligation Limited Series C | | | 5.00 | | | | 1-1-2022 | | | | 1,000,000 | | | | 1,068,440 | |
| | | | |
Chicago IL Park District General Obligation Limited Series C | | | 5.00 | | | | 1-1-2023 | | | | 1,000,000 | | | | 1,094,160 | |
| | | | |
Chicago IL Park District General Obligation Limited Series C | | | 5.00 | | | | 1-1-2024 | | | | 410,000 | | | | 458,782 | |
| | | | |
Chicago IL Park District Harbor Facilities Series D | | | 5.00 | | | | 1-1-2022 | | | | 1,645,000 | | | | 1,757,584 | |
| | | | |
Chicago IL Park District Harbor Facilities Series D | | | 5.00 | | | | 1-1-2023 | | | | 1,175,000 | | | | 1,285,638 | |
| | | | |
Chicago IL Park District Limited Tax Series B | | | 5.00 | | | | 1-1-2022 | | | | 4,675,000 | | | | 4,994,957 | |
| | | | |
Chicago IL Park District Unlimited Tax Series E | | | 5.00 | | | | 11-15-2022 | | | | 1,235,000 | | | | 1,347,299 | |
16 | Wells Fargo Strategic Municipal Bond Fund
Portfolio of investments—June 30, 2019
| | | | | | | | | | | | | | | | |
| | | Interest rate | | | Maturity date | | | Principal | | | Value | |
| GO Revenue (continued) | | | | | | | | | | | | |
| | | | |
Chicago IL Park District Unlimited Tax Series E | | | 5.00 | % | | | 11-15-2023 | | | $ | 1,295,000 | | | $ | 1,445,013 | |
| | | | |
Chicago IL Series C | | | 5.00 | | | | 1-1-2021 | | | | 1,000,000 | | | | 1,053,000 | |
| | | | |
Chicago IL Series C | | | 5.00 | | | | 1-1-2022 | | | | 2,250,000 | | | | 2,381,153 | |
| | | | |
Chicago IL Series C | | | 5.00 | | | | 1-1-2023 | | | | 2,500,000 | | | | 2,688,950 | |
| | | | |
Chicago IL Series G (Ambac Insured) | | | 5.00 | | | | 12-1-2024 | | | | 910,000 | | | | 913,576 | |
| | | | |
Cook County IL Community Consolidated School District #15 Palatine | | | 5.00 | | | | 12-1-2026 | | | | 2,040,000 | | | | 2,425,417 | |
| | | | |
Cook County IL Refunding Bonds Series 2010 G | | | 5.00 | | | | 11-15-2026 | | | | 1,000,000 | | | | 1,042,070 | |
| | | | |
Cook County IL School District #123 Oak Lawn CAB (National Insured) ¤ | | | 0.00 | | | | 12-1-2021 | | | | 1,090,000 | | | | 1,040,111 | |
| | | | |
Cook County IL School District #153 Homewood Series A (AGM Insured) ¤ | | | 0.00 | | | | 12-15-2023 | | | | 1,225,000 | | | | 1,111,798 | |
| | | | |
Cook County IL School District #227 Rich Township Refunding School Bonds Series 2015 | | | 3.00 | | | | 12-1-2024 | | | | 965,000 | | | | 999,923 | |
| | | | |
Cook County IL School District #99 Cicero Limited Tax (Build America Mutual Assurance Company Insured) %% | | | 5.00 | | | | 12-1-2026 | | | | 3,030,000 | | | | 3,585,793 | |
| | | | |
Cook County IL School District #99 Cicero Limited Tax (Build America Mutual Assurance Company Insured) %% | | | 5.00 | | | | 12-1-2027 | | | | 2,950,000 | | | | 3,526,401 | |
| | | | |
Cook County IL School District #99 Cicero Limited Tax (Build America Mutual Assurance Company Insured) %% | | | 5.00 | | | | 12-1-2028 | | | | 2,285,000 | | | | 2,759,160 | |
| | | | |
Cook County IL Series A | | | 5.00 | | | | 11-15-2021 | | | | 2,250,000 | | | | 2,417,310 | |
| | | | |
Cook County IL Series A | | | 5.25 | | | | 11-15-2022 | | | | 10,040,000 | | | | 10,525,936 | |
| | | | |
Cook County IL Series A | | | 5.25 | | | | 11-15-2022 | | | | 1,000,000 | | | | 1,090,660 | |
| | | | |
DeKalb & Kane Counties IL Community Unit School District #427 Sycamore Prerefunded Bond Balance CAB (AGM Insured) ¤ | | | 0.00 | | | | 1-1-2024 | | | | 455,000 | | | | 422,963 | |
| | | | |
DeKalb & Kane Counties IL Community Unit School District #427 Sycamore Unrefunded Bond Balance CAB (AGM Insured) ¤ | | | 0.00 | | | | 1-1-2024 | | | | 5,175,000 | | | | 4,654,550 | |
| | | | |
Decatur IL Macon County General Obligation Refunding Bonds Series 2013 | | | 5.00 | | | | 3-1-2024 | | | | 1,405,000 | | | | 1,541,931 | |
| | | | |
Decatur IL Macon County School District #061 Series 2011A (AGM Insured) | | | 5.25 | | | | 1-1-2026 | | | | 715,000 | | | | 752,337 | |
| | | | |
Decatur IL Macon County School District #061 Series 2011A (AGM Insured) | | | 5.25 | | | | 1-1-2027 | | | | 1,495,000 | | | | 1,572,351 | |
| | | | |
DuPage & Cook Counties IL Township High School District #86 Hinsdale %% | | | 4.00 | | | | 1-15-2034 | | | | 2,815,000 | | | | 3,137,993 | |
| | | | |
Grundy, Kendall & Will Counties IL Community School District Number 201 Series 2010B | | | 5.25 | | | | 10-15-2026 | | | | 2,000,000 | | | | 2,020,520 | |
| | | | |
Illinois State Series 2012 | | | 5.00 | | | | 3-1-2028 | | | | 6,000,000 | | | | 6,363,840 | |
| | | | |
Illinois State Series A | | | 5.00 | | | | 4-1-2023 | | | | 3,500,000 | | | | 3,841,285 | |
| | | | |
Kane, Cook & DuPage Counties IL School District #46 Elgin Series 2015A | | | 5.00 | | | | 1-1-2028 | | | | 1,555,000 | | | | 1,755,517 | |
| | | | |
Kane, Cook & DuPage Counties IL School District #46 Elgin Series 2015D | | | 5.00 | | | | 1-1-2032 | | | | 1,025,000 | | | | 1,145,376 | |
| | | | |
Kane, Cook & DuPage Counties IL School District #46 Elgin Unrefunded Bond Balance Series 2012B | | | 4.50 | | | | 1-1-2025 | | | | 4,295,000 | | | | 4,558,584 | |
| | | | |
Kane, Cook & DuPage Counties IL School District #46 Prerefunded CAB Series B (Ambac Insured) ¤ | | | 0.00 | | | | 1-1-2021 | | | | 510,000 | | | | 498,642 | |
| | | | |
Kane, Cook & DuPage Counties IL School District #46 Unrefunded CAB Series B (Ambac Insured) ¤ | | | 0.00 | | | | 1-1-2021 | | | | 595,000 | | | | 579,828 | |
| | | | |
Madison-Macoupin Etc Counties IL Community College District #536 Series A (Build America Mutual Assurance Company Insured) | | | 5.00 | | | | 11-1-2025 | | | | 1,620,000 | | | | 1,849,748 | |
| | | | |
Madison-Macoupin Etc Counties IL Community College District #536 Series A (Build America Mutual Assurance Company Insured) | | | 5.00 | | | | 11-1-2026 | | | | 1,410,000 | | | | 1,605,680 | |
| | | | |
Rockford IL Waterworks System Series B (Build America Mutual Assurance Company Insured) | | | 5.00 | | | | 12-15-2020 | | | | 1,000,000 | | | | 1,047,590 | |
| | | | |
Rockford IL Waterworks System Series B (Build America Mutual Assurance Company Insured) | | | 5.00 | | | | 12-15-2021 | | | | 1,015,000 | | | | 1,088,760 | |
| | | | |
Rockford IL Waterworks System Series B (Build America Mutual Assurance Company Insured) | | | 5.00 | | | | 12-15-2022 | | | | 1,065,000 | | | | 1,172,150 | |
| | | | |
Waukegan IL Series 2015A (AGM Insured) | | | 5.00 | | | | 12-30-2031 | | | | 1,000,000 | | | | 1,137,500 | |
| | | | |
Will County IL Lincoln-Way Community High School District #210 | | | 4.00 | | | | 1-1-2022 | | | | 1,630,000 | | | | 1,630,880 | |
| | | | |
Will County IL Lincoln-Way Community High School District #210 Unrefunded CAB (AGM Insured) ¤ | | | 0.00 | | | | 1-1-2021 | | | | 2,185,000 | | | | 2,108,547 | |
Wells Fargo Strategic Municipal Bond Fund | 17
Portfolio of investments—June 30, 2019
| | | | | | | | | | | | | | | | |
| | | Interest rate | | | Maturity date | | | Principal | | | Value | |
| GO Revenue (continued) | | | | | | | | | | | | |
| | | | |
Will County IL Lincoln-Way Community High School District #210 Unrefunded CAB (AGM Insured) ¤ | | | 0.00 | % | | | 1-1-2025 | | | $ | 14,385,000 | | | $ | 12,426,914 | |
| | | | |
Will County IL Lincoln-Way Community High School District #210 Unrefunded CAB (AGM Insured) ¤ | | | 0.00 | | | | 1-1-2026 | | | | 8,295,000 | | | | 6,930,970 | |
| | | | |
Will County IL School District #114 Manhattan CAB Series C (National Insured) ¤ | | | 0.00 | | | | 12-1-2021 | | | | 1,055,000 | | | | 998,325 | |
| | | | |
Winnebago & Boone Counties IL School District #205 Series A ¤ | | | 0.00 | | | | 2-1-2021 | | | | 1,305,000 | | | | 1,262,744 | |
| | | | |
Winnebago & Boone Counties IL School District #205 Series B ¤ | | | 0.00 | | | | 2-1-2021 | | | | 3,400,000 | | | | 3,289,908 | |
| |
| | | | 145,120,434 | |
| | | | | | | | | | | | | | | | |
| | | | |
| Health Revenue: 0.24% | | | | | | | | | | | | |
| | | | |
Illinois Finance Authority Ascension Health Alliance Senior Credit Group Bonds Series A | | | 5.00 | | | | 11-15-2027 | | | | 1,000,000 | | | | 1,078,970 | |
| | | | |
Illinois Finance Authority Friendship Village of Schaumburg Series 2017 | | | 5.00 | | | | 2-15-2021 | | | | 2,555,000 | | | | 2,578,583 | |
| | | | |
Illinois Finance Authority Rosalind Franklin University of Medicine & Science Series A | | | 3.25 | | | | 2-15-2022 | | | | 380,000 | | | | 382,291 | |
| | | | |
Illinois State Finance Authority Revenue Bonds Series 2014 | | | 5.00 | | | | 8-1-2038 | | | | 1,520,000 | | | | 1,692,900 | |
| |
| | | | 5,732,744 | |
| | | | | | | | | | | | | | | | |
| | | | |
| Housing Revenue: 0.04% | | | | | | | | | | | | |
| | | | |
Housing Development Authority Illinois Homeowner Mortgage 2016 Series C | | | 2.90 | | | | 8-1-2031 | | | | 1,000,000 | | | | 1,017,400 | |
| | | | | | | | | | | | | | | | |
| | | | |
| Miscellaneous Revenue: 1.21% | | | | | | | | | | | | |
| | | | |
Chicago IL Transit Authority Capital Grant Receipts Refunding Bond Series 2011 (AGM Insured) | | | 5.25 | | | | 6-1-2024 | | | | 4,450,000 | | | | 4,753,001 | |
| | | | |
Illinois Refunding Bonds Series 2012 (AGM Insured) | | | 5.00 | | | | 8-1-2020 | | | | 5,050,000 | | | | 5,233,164 | |
| | | | |
Illinois Refunding Bonds Series 2016 | | | 5.00 | | | | 2-1-2026 | | | | 7,000,000 | | | | 7,956,620 | |
| | | | |
Illinois State Series 2012 | | | 5.00 | | | | 8-1-2021 | | | | 5,620,000 | | | | 5,970,519 | |
| | | | |
Illinois State Series 2013 (AGM Insured) | | | 5.00 | | | | 7-1-2023 | | | | 4,875,000 | | | | 5,410,909 | |
| |
| | | | 29,324,213 | |
| | | | | | | | | | | | | | | | |
| | | | |
| Tax Revenue: 6.54% | | | | | | | | | | | | |
| | | | |
Chicago IL Motor Fuel Tax Refunding Bonds Series 2013 | | | 5.00 | | | | 1-1-2021 | | | | 1,450,000 | | | | 1,500,127 | |
| | | | |
Chicago IL Motor Fuel Tax Refunding Bonds Series 2013 | | | 5.00 | | | | 1-1-2022 | | | | 1,810,000 | | | | 1,906,292 | |
| | | | |
Chicago IL Motor Fuel Tax Refunding Bonds Series 2013 | | | 5.00 | | | | 1-1-2023 | | | | 2,400,000 | | | | 2,565,648 | |
| | | | |
Chicago IL Motor Fuel Tax Refunding Bonds Series 2013 | | | 5.00 | | | | 1-1-2024 | | | | 2,475,000 | | | | 2,687,231 | |
| | | | |
Chicago IL Motor Fuel Tax Refunding Bonds Series 2013 | | | 5.00 | | | | 1-1-2025 | | | | 1,000,000 | | | | 1,078,920 | |
| | | | |
Chicago IL Series A | | | 5.00 | | | | 1-1-2029 | | | | 5,000,000 | | | | 5,090,150 | |
| | | | |
Chicago IL Tax Increment Bond Pilson Redevelopment Project Series A | | | 5.00 | | | | 6-1-2022 | | | | 1,635,000 | | | | 1,782,886 | |
| | | | |
Chicago IL Transit Authority Sales Tax Receipts Series 2011 | | | 5.25 | | | | 12-1-2036 | | | | 17,415,000 | | | | 18,484,107 | |
| | | | |
Chicago lL Series A | | | 5.00 | | | | 1-1-2022 | | | | 3,000,000 | | | | 3,054,090 | |
| | | | |
Illinois Regional Transportation Authority Series A (AGM Insured) | | | 5.25 | | | | 6-1-2024 | | | | 9,995,000 | | | | 11,649,572 | |
| | | | |
Illinois Sales Tax First Series (National Insured) | | | 6.00 | | | | 6-15-2024 | | | | 515,000 | | | | 597,251 | |
| | | | |
Illinois Sales Tax First Series (National Insured) | | | 6.00 | | | | 6-15-2025 | | | | 8,165,000 | | | | 9,701,245 | |
| | | | |
Illinois Sales Tax Series of June 2013 | | | 5.00 | | | | 6-15-2026 | | | | 9,100,000 | | | | 9,926,007 | |
| | | | |
Illinois Sports Facilities Authority Series 2014 | | | 5.00 | | | | 6-15-2022 | | | | 3,395,000 | | | | 3,578,873 | |
| | | | |
Illinois Sports Facilities Authority Series 2014 | | | 5.00 | | | | 6-15-2023 | | | | 3,220,000 | | | | 3,448,845 | |
| | | | |
Illinois Sports Facilities Authority Series 2014 | | | 5.00 | | | | 6-15-2024 | | | | 4,130,000 | | | | 4,481,133 | |
| | | | |
Illinois Sports Facilities Authority State Tax Supported CAB (Ambac Insured) ¤ | | | 0.00 | | | | 6-15-2022 | | | | 3,795,000 | | | | 3,496,182 | |
| | | | |
Illinois Sports Facilities Authority State Tax Supported CAB (Ambac Insured) ¤ | | | 0.00 | | | | 6-15-2026 | | | | 1,740,000 | | | | 1,396,089 | |
| | | | |
Metropolitan Pier & Exposition Authority CAB McCormick Place Project Series A (National Insured) ¤ | | | 0.00 | | | | 12-15-2022 | | | | 1,390,000 | | | | 1,286,181 | |
18 | Wells Fargo Strategic Municipal Bond Fund
Portfolio of investments—June 30, 2019
| | | | | | | | | | | | | | | | |
| | | Interest rate | | | Maturity date | | | Principal | | | Value | |
| Tax Revenue (continued) | | | | | | | | | | | | |
| | | | |
Metropolitan Pier & Exposition Authority McCormick Place Expansion Project Series B | | | 5.00 | % | | | 12-15-2028 | | | $ | 19,090,000 | | | $ | 20,344,595 | |
| | | | |
Metropolitan Pier & Exposition Authority McCormick Place Project Callable Bond Series B | | | 5.00 | | | | 12-15-2022 | | | | 11,520,000 | | | | 11,558,246 | |
| | | | |
Metropolitan Pier & Exposition Authority Prerefunded Bond (National Insured) ¤ | | | 0.00 | | | | 12-15-2023 | | | | 20,000 | | | | 18,622 | |
| | | | |
Metropolitan Pier & Exposition Authority Prerefunded Bond (National Insured) | | | 5.70 | | | | 6-15-2025 | | | | 220,000 | | | | 249,586 | |
| | | | |
Metropolitan Pier & Exposition Authority Unrefunded Bond (National Insured) ¤ | | | 0.00 | | | | 12-15-2023 | | | | 845,000 | | | | 760,525 | |
| | | | |
Metropolitan Pier & Exposition Authority Unrefunded Bond (National Insured) | | | 5.70 | | | | 6-15-2025 | | | | 780,000 | | | | 861,799 | |
| | | | |
Sales Tax Securitization Corporation Series 2017A | | | 5.00 | | | | 1-1-2026 | | | | 4,815,000 | | | | 5,601,193 | |
| | | | |
Sales Tax Securitization Corporation Series 2017A | | | 5.00 | | | | 1-1-2028 | | | | 4,015,000 | | | | 4,799,089 | |
| | | | |
St. Charles, Kane & DuPage Counties IL Series 2016 | | | 4.00 | | | | 1-1-2020 | | | | 760,000 | | | | 763,868 | |
| | | | |
St. Charles, Kane & DuPage Counties IL Series 2016 | | | 4.00 | | | | 1-1-2021 | | | | 790,000 | | | | 800,902 | |
| | | | |
St. Charles, Kane & DuPage Counties IL Series 2016 | | | 4.00 | | | | 1-1-2022 | | | | 820,000 | | | | 831,488 | |
| | | | |
St. Charles, Kane & DuPage Counties IL Series 2016 | | | 4.00 | | | | 1-1-2023 | | | | 855,000 | | | | 868,116 | |
| | | | |
St. Charles, Kane & DuPage Counties IL Series 2016 | | | 4.00 | | | | 1-1-2024 | | | | 885,000 | | | | 898,638 | |
| | | | |
St. Charles, Kane & DuPage Counties IL Series 2016 | | | 4.00 | | | | 1-1-2025 | | | | 925,000 | | | | 935,471 | |
| | | | |
Tender Option Bond Trust Receipts/Certificates Series 2018-YX1099 (Barclays Bank plc LIQ) 144Aø | | | 2.10 | | | | 1-1-2035 | | | | 21,365,000 | | | | 21,365,000 | |
| |
| | | | 158,367,967 | |
| | | | | | | | | | | | | | | | |
| | | | |
| Tobacco Revenue: 0.84% | | | | | | | | | | | | |
| | | | |
Railsplitter Tobacco Settlement Authority | | | 5.00 | | | | 6-1-2023 | | | | 18,000,000 | | | | 20,207,160 | |
| | | | | | | | | | | | | | | | |
| | | | |
| Water & Sewer Revenue: 0.41% | | | | | | | | | | | | |
| | | | |
Chicago IL Wastewater Transmission Series B (AGM Insured) | | | 5.00 | | | | 1-1-2031 | | | | 3,140,000 | | | | 3,703,002 | |
| | | | |
Chicago IL Waterworks Second Lien | | | 5.00 | | | | 11-1-2028 | | | | 2,560,000 | | | | 3,012,403 | |
| | | | |
Chicago IL Waterworks Second Lien Series 2017-2 (AGM Insured) | | | 5.00 | | | | 11-1-2030 | | | | 2,620,000 | | | | 3,131,241 | |
| |
| | | | 9,846,646 | |
| | | | | | | | | | | | | | | | |
| |
| | | | 414,168,669 | |
| | | | | | | | | | | | | | | | |
| | | | |
Indiana: 0.98% | | | | | | | | | | | | | | | | |
| | | | |
| Health Revenue: 0.01% | | | | | | | | | | | | |
| | | | |
Indiana HFFA Ancilla System Incorporated (National Insured) | | | 5.25 | | | | 7-1-2022 | | | | 240,000 | | | | 240,643 | |
| | | | | | | | | | | | | | | | |
| | | | |
| Housing Revenue: 0.70% | | | | | | | | | | | | |
| | | | |
Indiana Housing and CDA Affordable Assisted Living Project Series 2017 | | | 1.80 | | | | 12-1-2019 | | | | 17,030,000 | | | | 17,030,000 | |
| | | | | | | | | | | | | | | | |
| | | | |
| Industrial Development Revenue: 0.13% | | | | | | | | | | | | |
| | | | |
Whiting IN BP Products North America Incorporated Project | | | 1.85 | | | | 6-1-2044 | | | | 3,000,000 | | | | 3,002,310 | |
| | | | | | | | | | | | | | | | |
| | | | |
| Miscellaneous Revenue: 0.14% | | | | | | | | | | | | |
| | | | |
Michigan IN City School Building Corporation Series 2016A | | | 5.00 | | | | 1-15-2025 | | | | 1,000,000 | | | | 1,157,750 | |
| | | | |
Westfield-Washington IN Multi-School Building Corporation First Mortgage Series B 144A | | | 1.50 | | | | 1-15-2022 | | | | 2,250,000 | | | | 2,229,908 | |
| |
| | | | 3,387,658 | |
| | | | | | | | | | | | | | | | |
| |
| | | | 23,660,611 | |
| | | | | | | | | | | | | | | | |
Wells Fargo Strategic Municipal Bond Fund | 19
Portfolio of investments—June 30, 2019
| | | | | | | | | | | | | | | | |
| | | Interest rate | | | Maturity date | | | Principal | | | Value | |
Iowa: 0.41% | |
| | | | |
| GO Revenue: 0.37% | | | | | | | | | | | | |
| | | | |
Coralville IA Taxable-Annual Appropriation Series 2018E | | | 7.00 | % | | | 6-1-2025 | | | $ | 8,485,000 | | | $ | 8,905,941 | |
| | | | | | | | | | | | | | | | |
| | | | |
| Industrial Development Revenue: 0.04% | | | | | | | | | | | | |
| | | | |
Iowa Finance Authority Midwestern Disaster Area Project (Korea Development Bank LOC) ø | | | 2.40 | | | | 4-1-2022 | | | | 1,000,000 | | | | 1,000,000 | |
| | | | | | | | | | | | | | | | |
| |
| | | | 9,905,941 | |
| | | | | | | | | | | | | | | | |
| | | | |
Kansas: 0.44% | | | | | | | | | | | | | | | | |
| | | | |
| Tax Revenue: 0.44% | | | | | | | | | | | | |
| | | | |
Wyandotte County & Kansas City KS Special Obligation Refunding & Improvement Bonds Plaza Redevelopment Project | | | 4.00 | | | | 12-1-2028 | | | | 725,000 | | | | 742,719 | |
| | | | |
Wyandotte County & Kansas City KS Special Obligation Vacation Village Project Area 4 Major Multi-Sport Athletic Complex Project CAB Series 2015 144A¤ | | | 0.00 | | | | 9-1-2034 | | | | 25,070,000 | | | | 9,941,007 | |
| |
| | | | 10,683,726 | |
| | | | | | | | | | | | | | | | |
| | | | |
Kentucky: 0.96% | | | | | | | | | | | | | | | | |
| | | | |
| Education Revenue: 0.19% | | | | | | | | | | | | |
| | | | |
Columbia KY Educational Development Lindsey Wilson College Incorporated Project | | | 3.00 | | | | 12-1-2024 | | | | 4,530,000 | | | | 4,532,174 | |
| | | | | | | | | | | | | | | | |
| | | | |
| Health Revenue: 0.13% | | | | | | | | | | | | |
| | | | |
Kentucky EDFA Healthcare Facilities Rosedale Green Project Series 2015 | | | 3.00 | | | | 11-15-2019 | | | | 350,000 | | | | 349,703 | |
| | | | |
Kentucky EDFA Healthcare Facilities Rosedale Green Project Series 2015 | | | 3.35 | | | | 11-15-2020 | | | | 335,000 | | | | 334,678 | |
| | | | |
Kentucky EDFA Healthcare Facilities Rosedale Green Project Series 2015 | | | 5.00 | | | | 11-15-2025 | | | | 1,500,000 | | | | 1,568,310 | |
| | | | |
Kentucky EDFA Norton Healthcare Incorporated Series B (National Insured) ¤ | | | 0.00 | | | | 10-1-2022 | | | | 1,000,000 | | | | 930,670 | |
| |
| | | | 3,183,361 | |
| | | | | | | | | | | | | | | | |
| | | | |
| Utilities Revenue: 0.64% | | | | | | | | | | | | |
| | | | |
Kentucky Public Energy Authority Gas Supply Series A-1 | | | 4.00 | | | | 12-1-2049 | | | | 3,870,000 | | | | 4,267,565 | |
| | | | |
Kentucky Public Energy Authority Gas Supply Series B | | | 4.00 | | | | 1-1-2049 | | | | 10,200,000 | | | | 11,255,088 | |
| |
| | | | 15,522,653 | |
| | | | | | | | | | | | | | | | |
| |
| | | | 23,238,188 | |
| | | | | | | | | | | | | | | | |
| | | | |
Louisiana: 2.12% | | | | | | | | | | | | | | | | |
| | | | |
| Airport Revenue: 0.21% | | | | | | | | | | | | |
| | | | |
New Orleans LA Aviation Board General North Terminal Project Series A | | | 5.00 | | | | 1-1-2032 | | | | 1,000,000 | | | | 1,145,890 | |
| | | | |
New Orleans LA Aviation Board Gulf Opportunity Zone Controlled Foreign Corporation Revenue Refunding Consolidated Rental Car Project (AGM Insured) | | | 5.00 | | | | 1-1-2031 | | | | 1,250,000 | | | | 1,509,688 | |
| | | | |
New Orleans LA Aviation Board Gulf Opportunity Zone Controlled Foreign Corporation Revenue Refunding Consolidated Rental Car Project (AGM Insured) | | | 5.00 | | | | 1-1-2032 | | | | 2,000,000 | | | | 2,402,620 | |
| |
| | | | 5,058,198 | |
| | | | | | | | | | | | | | | | |
| Education Revenue: 0.30% | |
| | | | |
Louisiana Public Facilities Authority Loyola University Project Series 2011 | | | 5.25 | | | | 10-1-2025 | | | | 2,815,000 | | | | 3,004,421 | |
| | | | |
Louisiana Public Facilities Authority Loyola University Project Series 2017 ¤ | | | 0.00 | | | | 10-1-2020 | | | | 1,000,000 | | | | 971,140 | |
| | | | |
Louisiana Public Facilities Authority Loyola University Project Series 2017 ¤ | | | 0.00 | | | | 10-1-2021 | | | | 1,950,000 | | | | 1,845,812 | |
| | | | |
Louisiana Public Facilities Authority Loyola University Project Series 2017 ¤ | | | 0.00 | | | | 10-1-2022 | | | | 1,500,000 | | | | 1,399,605 | |
| |
| | | | 7,220,978 | |
| | | | | | | | | | | | | | | | |
20 | Wells Fargo Strategic Municipal Bond Fund
Portfolio of investments—June 30, 2019
| | | | | | | | | | | | | | | | |
| | | Interest rate | | | Maturity date | | | Principal | | | Value | |
| Health Revenue: 0.41% | | | | | | | | | | | | |
| | | | |
Louisiana Tender Option Bond Trust Receipts/Floater Certificates Series 2018-BAML7002 (Bank of America NA LOC, Bank of America NA LIQ) 144Aø | | | 1.94 | % | | | 9-1-2057 | | | $ | 10,000,000 | | | $ | 10,000,000 | |
| | | | | | | | | | | | | | | | |
| | | | |
| Housing Revenue: 1.20% | | | | | | | | | | | | |
| | | | |
Louisiana Housing Corporation Harmony Garden Estates Project Series 2017 %% | | | 1.86 | | | | 12-1-2020 | | | | 13,500,000 | | | | 13,500,000 | |
| | | | |
Louisiana Housing Corporation The Meadows at Nicholson Project Series 2017 | | | 1.83 | | | | 5-1-2020 | | | | 15,500,000 | | | | 15,516,120 | |
| |
| | | | 29,016,120 | |
| | | | | | | | | | | | | | | | |
| |
| | | | 51,295,296 | |
| | | | | | | | | | | | | | | | |
| | | | |
Maryland: 3.51% | | | | | | | | | | | | | | | | |
| | | | |
| Education Revenue: 0.12% | | | | | | | | | | | | |
| | | | |
Prince George’s County MD Chesapeake Lighthouse Charter School Project Series 2015 144A | | | 5.25 | | | | 8-1-2022 | | | | 1,465,000 | | | | 1,499,178 | |
| | | | |
Prince George’s County MD Chesapeake Lighthouse Charter School Project Series 2016 | | | 5.00 | | | | 8-1-2026 | | | | 1,335,000 | | | | 1,370,151 | |
| |
| | | | 2,869,329 | |
| | | | | | | | | | | | | | | | |
| | | | |
| GO Revenue: 0.76% | | | | | | | | | | | | |
| | | | |
Prince George’s County MD Consolidated Public Improvement Bonds Series C | | | 4.00 | | | | 8-1-2027 | | | | 3,890,000 | | | | 4,267,408 | |
| | | | |
Prince George’s County MD Consolidated Public Improvement Bonds Series C | | | 4.00 | | | | 8-1-2028 | | | | 12,960,000 | | | | 14,189,126 | |
| |
| | | | 18,456,534 | |
| | | | | | | | | | | | | | | | |
| | | | |
| Health Revenue: 0.16% | | | | | | | | | | | | |
| | | | |
Rockville MD Mayor & Council Economic Development Ingleside King Farm Project #45 Series C-3 | | | 2.50 | | | | 11-1-2024 | | | | 4,000,000 | | | | 4,000,920 | |
| | | | | | | | | | | | | | | | |
| | | | |
| Housing Revenue: 1.76% | | | | | | | | | | | | |
| | | | |
Maryland CDA Department of Housing & Community Multifamily Development Headen House Series B | | | 2.45 | | | | 3-1-2021 | | | | 19,500,000 | | | | 19,603,155 | |
| | | | |
Maryland CDA Department of Housing & Community Multifamily Development Huntington Apartments Series C 144A | | | 2.34 | | | | 4-1-2021 | | | | 5,000,000 | | | | 5,019,200 | |
| | | | |
Maryland CDA Department of Housing & Community Multifamily Development Zions Towers Series A (FHA Insured) | | | 2.44 | | | | 3-1-2020 | | | | 9,000,000 | | | | 9,018,180 | |
| | | | |
Maryland State Administration Department of Housing & Community Development Park View at Taylor Series D | | | 2.45 | | | | 4-1-2021 | | | | 8,820,000 | | | | 8,864,365 | |
| |
| | | | 42,504,900 | |
| | | | | | | | | | | | | | | | |
| | | | |
| Miscellaneous Revenue: 0.24% | | | | | | | | | | | | |
| | | | |
Maryland State and Local Facilities Loan Series A | | | 4.00 | | | | 8-1-2030 | | | | 5,000,000 | | | | 5,762,650 | |
| | | | | | | | | | | | | | | | |
|
| Tax Revenue: 0.42% | |
| | | | |
Maryland State Department of Transportation | | | 4.00 | | | | 12-15-2027 | | | | 9,260,000 | | | | 10,276,192 | |
| | | | | | | | | | | | | | | | |
| | | | |
| Water & Sewer Revenue: 0.05% | | | | | | | | | | | | |
| | | | |
Baltimore MD Series A (National Insured) | | | 5.65 | | | | 7-1-2020 | | | | 1,100,000 | | | | 1,123,892 | |
| | | | | | | | | | | | | | | | |
| |
| | | | 84,994,417 | |
| | | | | | | | | | | | | | | | |
Massachusetts: 4.35% | | | | | | | | | | | | | | | | |
| | | | |
| Education Revenue: 1.25% | | | | | | | | | | | | |
| | | | |
Massachusetts Development Finance Agency Harvard University Series A | | | 5.00 | | | | 7-15-2033 | | | | 21,715,000 | | | | 26,356,581 | |
| | | | |
Massachusetts Development Finance Agency Sabis International Charter School Series 2015 | | | 5.00 | | | | 4-15-2025 | | | | 1,000,000 | | | | 1,090,780 | |
| | | | |
Massachusetts Educational Financing Authority Series B | | | 5.00 | | | | 7-1-2023 | | | | 2,460,000 | | | | 2,761,547 | |
| |
| | | | 30,208,908 | |
| | | | | | | | | | | | | | | | |
Wells Fargo Strategic Municipal Bond Fund | 21
Portfolio of investments—June 30, 2019
| | | | | | | | | | | | | | | | |
| | | Interest rate | | | Maturity date | | | Principal | | | Value | |
| Health Revenue: 0.67% | | | | | | | | | | | | |
| | | | |
Massachusetts Development Finance Agency Linden Ponds Incorporated Facility 144A | | | 4.00 | % | | | 11-15-2023 | | | $ | 1,335,000 | | | $ | 1,367,521 | |
| | | | |
Massachusetts Development Finance Agency Partners Healthcare System Issue Series S-3 (SIFMA Municipal Swap +0.50%)± | | | 2.40 | | | | 7-1-2038 | | | | 14,870,000 | | | | 14,877,138 | |
| |
| | | | 16,244,659 | |
| | | | | | | | | | | | | | | | |
| | | | |
| Miscellaneous Revenue: 2.04% | | | | | | | | | | | | |
| | | | |
Massachusetts Series A (3 Month LIBOR +0.55%)± | | | 2.28 | | | | 11-1-2025 | | | | 15,800,000 | | | | 15,754,022 | |
| | | | |
Massachusetts Water Pollution Abatement Trust Series 17 | | | 5.00 | | | | 2-1-2031 | | | | 10,000,000 | | | | 11,195,200 | |
| | | | |
Massachusetts Water Pollution Abatement Trust Series 17 | | | 5.00 | | | | 2-1-2032 | | | | 10,000,000 | | | | 11,173,000 | |
| | | | |
Massachusetts Water Pollution Abatement Trust Series 17 | | | 5.00 | | | | 2-1-2033 | | | | 10,000,000 | | | | 11,158,200 | |
| |
| | | | 49,280,422 | |
| | | | | | | | | | | | | | | | |
| | | | |
| Tax Revenue: 0.39% | | | | | | | | | | | | |
| | | | |
Massachusetts Bay Transportation Authority Assessment Bonds Series A | | | 4.00 | | | | 7-1-2037 | | | | 9,000,000 | | | | 9,454,950 | |
| | | | | | | | | | | | | | | | |
| |
| | | | 105,188,939 | |
| | | | | | | | | | | | | | | | |
| | | | |
Michigan: 2.68% | | | | | | | | | | | | | | | | |
| | | | |
| Airport Revenue: 0.04% | | | | | | | | | | | | |
| | | | |
Wayne County MI Airport Authority AMT Detroit Metropolitan Airport Series C | | | 5.00 | | | | 12-1-2022 | | | | 1,000,000 | | | | 1,052,780 | |
| | | | | | | | | | | | | | | | |
| | | | |
| Education Revenue: 0.06% | | | | | | | | | | | | |
| | | | |
Michigan Finance Authority Series 25-A | | | 5.00 | | | | 11-1-2019 | | | | 1,500,000 | | | | 1,515,795 | |
| | | | | | | | | | | | | | | | |
| | | | |
| GO Revenue: 0.44% | | | | | | | | | | | | |
| | | | |
Constantine MI Public Schools (Qualified School Board Loan Fund Insured) | | | 5.00 | | | | 5-1-2020 | | | | 350,000 | | | | 360,539 | |
| | | | |
Constantine MI Public Schools (Qualified School Board Loan Fund Insured) | | | 5.00 | | | | 5-1-2021 | | | | 1,200,000 | | | | 1,279,140 | |
| | | | |
Forest Hills MI Public Schools | | | 5.00 | | | | 5-1-2020 | | | | 1,600,000 | | | | 1,648,992 | |
| | | | |
Forest Hills MI Public Schools | | | 5.00 | | | | 5-1-2021 | | | | 1,600,000 | | | | 1,707,328 | |
| | | | |
Fraser MI Public Schools District (Qualified School Board Loan Fund Insured) | | | 5.00 | | | | 5-1-2021 | | | | 1,000,000 | | | | 1,065,570 | |
| | | | |
Fraser MI Public Schools District (Qualified School Board Loan Fund Insured) | | | 5.00 | | | | 5-1-2022 | | | | 610,000 | | | | 670,274 | |
| | | | |
Hudsonville MI Public Schools (Qualified School Board Loan Fund Insured) | | | 5.00 | | | | 5-1-2021 | | | | 1,465,000 | | | | 1,561,617 | |
| | | | |
Ingham County MI Williamston Community Schools Series A (Qualified School Board Loan Fund Insured) | | | 4.00 | | | | 5-1-2024 | | | | 1,025,000 | | | | 1,117,465 | |
| | | | |
Ingham County MI Williamston Community Schools Series A (Qualified School Board Loan Fund Insured) | | | 4.00 | | | | 5-1-2025 | | | | 1,000,000 | | | | 1,101,630 | |
| |
| | | | 10,512,555 | |
| | | | | | | | | | | | | | | | |
| | | | |
| Housing Revenue: 0.39% | | | | | | | | | | | | |
| | | | |
Michigan Housing Development Authority Series E (3 Month LIBOR +1.00%)± | | | 2.81 | | | | 4-1-2042 | | | | 9,295,000 | | | | 9,369,267 | |
| | | | | | | | | | | | | | | | |
| | | | |
| Miscellaneous Revenue: 0.29% | | | | | | | | | | | | |
| | | | |
Michigan Finance Authority Senior Lien Distributable State Aid | | | 5.00 | | | | 11-1-2028 | | | | 865,000 | | | | 1,093,256 | |
| | | | |
Michigan Finance Authority Senior Lien Distributable State Aid | | | 5.00 | | | | 11-1-2029 | | | | 1,500,000 | | | | 1,880,745 | |
| | | | |
Michigan Municipal Bond Authority Local Government Loan Program Series A (Ambac Insured) | | | 4.00 | | | | 11-1-2019 | | | | 55,000 | | | | 55,132 | |
| | | | |
Michigan Municipal Bond Authority Local Government Loan Program Series C (Ambac Insured) | | | 4.13 | | | | 5-1-2020 | | | | 500,000 | | | | 500,455 | |
| | | | |
Michigan Municipal Bond Authority Local Government Loan Program Series C (Ambac Insured) | | | 5.00 | | | | 5-1-2023 | | | | 1,900,000 | | | | 1,901,995 | |
| | | | |
Michigan Public Educational Facilities Authority Chandler Park Academy | | | 6.35 | | | | 11-1-2028 | | | | 1,500,000 | | | | 1,502,715 | |
| |
| | | | 6,934,298 | |
| | | | | | | | | | | | | | | | |
22 | Wells Fargo Strategic Municipal Bond Fund
Portfolio of investments—June 30, 2019
| | | | | | | | | | | | | | | | |
| | | Interest rate | | | Maturity date | | | Principal | | | Value | |
| Tax Revenue: 0.60% | | | | | | | | | | | | |
| | | | |
Michigan Finance Authority Detroit Recovery Project Series 2014F | | | 3.40 | % | | | 10-1-2020 | | | $ | 500,000 | | | $ | 506,360 | |
| | | | |
Michigan Finance Authority Detroit Recovery Project Series 2014F | | | 3.60 | | | | 10-1-2021 | | | | 500,000 | | | | 512,720 | |
| | | | |
Michigan Finance Authority Detroit Recovery Project Series 2014F | | | 3.80 | | | | 10-1-2022 | | | | 500,000 | | | | 521,175 | |
| | | | |
Michigan Finance Authority Detroit Recovery Project Series 2014F | | | 3.88 | | | | 10-1-2023 | | | | 2,500,000 | | | | 2,640,300 | |
| | | | |
Michigan Finance Authority Local Government Loan Program City of Detroit Financial Recovery Refunding Bond Series F | | | 4.50 | | | | 10-1-2029 | | | | 5,015,000 | | | | 5,416,501 | |
| | | | |
Michigan Finance Authority Series 2014B | | | 5.00 | | | | 7-1-2032 | | | | 3,000,000 | | | | 3,306,630 | |
| | | | |
Michigan Finance Authority Series H-1 | | | 5.00 | | | | 10-1-2021 | | | | 1,565,000 | | | | 1,631,763 | |
| |
| | | | 14,535,449 | |
| | | | | | | | | | | | | | | | |
| | | | |
| Water & Sewer Revenue: 0.86% | | | | | | | | | | | | |
| | | | |
Detroit MI Water & Sewage Department Series A | | | 5.00 | | | | 7-1-2022 | | | | 1,000,000 | | | | 1,097,960 | |
| | | | |
Michigan Financial Authority Local Government Loan Program Series C7 (National Insured) | | | 5.00 | | | | 7-1-2022 | | | | 2,000,000 | | | | 2,193,460 | |
| | | | |
Michigan Financial Authority Local Government Loan Program Series D1 (AGM Insured) | | | 5.00 | | | | 7-1-2022 | | | | 2,700,000 | | | | 2,983,716 | |
| | | | |
Michigan Financial Authority Local Government Loan Program Series D1 (AGM Insured) | | | 5.00 | | | | 7-1-2023 | | | | 2,000,000 | | | | 2,275,820 | |
| | | | |
Michigan Financial Authority Local Government Loan Program Series D6 (National Insured) | | | 5.00 | | | | 7-1-2022 | | | | 2,080,000 | | | | 2,281,198 | |
| | | | |
Michigan Financial Authority Local Government Loan Program Series D6 (National Insured) | | | 5.00 | | | | 7-1-2023 | | | | 3,670,000 | | | | 4,136,494 | |
| | | | |
Michigan Financial Authority Local Government Loan Program Series D6 (National Insured) | | | 5.00 | | | | 7-1-2024 | | | | 2,130,000 | | | | 2,456,082 | |
| | | | |
Michigan State Financial Authority Great Lakes Water Authority Series C-3 (AGM Insured) | | | 5.00 | | | | 7-1-2031 | | | | 3,000,000 | | | | 3,437,310 | |
| |
| | | | 20,862,040 | |
| | | | | | | | | | | | | | | | |
| |
| | | | 64,782,184 | |
| | | | | | | | | | | | | | | | |
| | | | |
Minnesota: 0.44% | | | | | | | | | | | | | | | | |
| | | | |
| Education Revenue: 0.08% | | | | | | | | | | | | |
| | | | |
Cologne MN Charter School Lease Academy Project Series 2014A | | | 4.00 | | | | 7-1-2019 | | | | 170,000 | | | | 170,000 | |
| | | | |
Cologne MN Charter School Lease Academy Project Series 2014A | | | 4.00 | | | | 7-1-2023 | | | | 260,000 | | | | 269,724 | |
| | | | |
St. Paul MN Housing & RDA Charter School Hmong College Preparatory Academy Project Series A | | | 4.75 | | | | 9-1-2022 | | | | 500,000 | | | | 514,515 | |
| | | | |
St. Paul MN Housing & RDA Charter School Hmong College Preparatory Academy Project Series A | | | 5.00 | | | | 9-1-2026 | | | | 1,000,000 | | | | 1,086,180 | |
| |
| | | | 2,040,419 | |
| | | | | | | | | | | | | | | | |
| | | | |
| Health Revenue: 0.36% | | | | | | | | | | | | |
| | | | |
Kanabec County MN Firstlight Health Kanabec Hospital | | | 2.75 | | | | 12-1-2019 | | | | 2,000,000 | | | | 2,000,660 | |
| | | | |
Shakopee MN Senior Housing Revenue Benedictine Living Community LLC Project 144A | | | 5.85 | | | | 11-1-2058 | | | | 2,000,000 | | | | 2,099,340 | |
| | | | |
St. Paul MN Housing & RDA HealthEast Care System Project Series 2015A | | | 5.25 | | | | 11-15-2028 | | | | 1,505,000 | | | | 1,584,133 | |
| | | | |
St. Paul MN Housing & RDA HealthEast Care System Project Series 2015A | | | 5.25 | | | | 11-15-2035 | | | | 2,850,000 | | | | 2,999,853 | |
| |
| | | | 8,683,986 | |
| | | | | | | | | | | | | | | | |
| |
| | | | 10,724,405 | |
| | | | | | | | | | | | | | | | |
| | | | |
Mississippi: 2.20% | | | | | | | | | | | | | | | | |
| | | | |
| Health Revenue: 0.21% | | | | | | | | | | | | |
| | | | |
Mississippi HFFA Baptist Health System Series A (SIFMA Municipal Swap +1.30%) ± | | | 3.20 | | | | 8-15-2036 | | | | 5,000,000 | | | | 5,019,250 | |
| | | | | | | | | | | | | | | | |
Wells Fargo Strategic Municipal Bond Fund | 23
Portfolio of investments—June 30, 2019
| | | | | | | | | | | | | | | | |
| | | Interest rate | | | Maturity date | | | Principal | | | Value | |
| Industrial Development Revenue: 1.99% | | | | | | | | | | | | |
| | | | |
Mississippi Business Finance Commission Gulf Opportunity Zone Chevron USA Incorporated Project Series D ø | | | 2.00 | % | | | 12-1-2030 | | | $ | 20,000,000 | | | $ | 20,000,000 | |
| | | | |
Mississippi Business Finance Commission Gulf Opportunity Zone Chevron USA Incorporated Project Series E ø | | | 2.00 | | | | 12-1-2030 | | | | 14,110,000 | | | | 14,110,000 | |
| | | | |
Mississippi Business Finance Commission Gulf Opportunity Zone Chevron USA Incorporated Project Series H ø | | | 2.00 | | | | 11-1-2035 | | | | 14,000,000 | | | | 14,000,000 | |
| |
| | | | 48,110,000 | |
| | | | | | | | | | | | | | | | |
| |
| | | | 53,129,250 | |
| | | | | | | | | | | | | | | | |
| | | | |
Missouri: 1.02% | | | | | | | | | | | | | | | | |
| | | | |
| Health Revenue: 0.09% | | | | | | | | | | | | |
| | | | |
Lees Summit MO IDA Senior Living Facilities Revenue Series A | | | 5.00 | | | | 8-15-2019 | | | | 1,000,000 | | | | 1,003,040 | |
| | | | |
Lees Summit MO IDA Senior Living Facilities Revenue Series A | | | 5.00 | | | | 8-15-2020 | | | | 1,075,000 | | | | 1,103,853 | |
| |
| | | | 2,106,893 | |
| | | | | | | | | | | | | | | | |
| | | | |
| Miscellaneous Revenue: 0.64% | | | | | | | | | | | | |
| | | | |
Branson MO IDA Branson Shoppes Series A | | | 3.00 | | | | 11-1-2019 | | | | 800,000 | | | | 801,592 | |
| | | | |
Branson MO IDA Branson Shoppes Series A | | | 3.00 | | | | 11-1-2021 | | | | 1,055,000 | | | | 1,063,029 | |
| | | | |
Branson MO IDA Branson Shoppes Series A | | | 4.00 | | | | 11-1-2022 | | | | 350,000 | | | | 362,691 | |
| | | | |
Branson MO IDA Branson Shoppes Series A | | | 4.00 | | | | 11-1-2023 | | | | 750,000 | | | | 780,533 | |
| | | | |
Kansas City MO IDA International Airport Terminal Modernization Project Series B | | | 5.00 | | | | 3-1-2028 | | | | 3,000,000 | | | | 3,705,420 | |
| | | | |
Kansas City MO IDA International Airport Terminal Modernization Project Series B | | | 5.00 | | | | 3-1-2030 | | | | 2,000,000 | | | | 2,482,420 | |
| | | | |
Platte County MO Riverside-Quindaro Bend Levee District Project L-385 | | | 3.00 | | | | 3-1-2020 | | | | 900,000 | | | | 906,723 | |
| | | | |
Platte County MO Riverside-Quindaro Bend Levee District Project L-385 | | | 4.00 | | | | 3-1-2021 | | | | 930,000 | | | | 959,128 | |
| | | | |
Platte County MO Riverside-Quindaro Bend Levee District Project L-385 | | | 4.00 | | | | 3-1-2022 | | | | 970,000 | | | | 1,015,086 | |
| | | | |
Platte County MO Riverside-Quindaro Bend Levee District Project L-385 | | | 4.00 | | | | 3-1-2023 | | | | 1,010,000 | | | | 1,068,247 | |
| | | | |
Platte County MO Riverside-Quindaro Bend Levee District Project L-385 | | | 5.00 | | | | 3-1-2024 | | | | 1,000,000 | | | | 1,109,140 | |
| | | | |
Platte County MO Riverside-Quindaro Bend Levee District Project L-385 | | | 5.00 | | | | 3-1-2025 | | | | 1,105,000 | | | | 1,238,981 | |
| |
| | | | 15,492,990 | |
| | | | | | | | | | | | | | | | |
| | | | |
| Tax Revenue: 0.12% | | | | | | | | | | | | |
| | | | |
Arnold MO Real Property Arnold Triangle Redevelopment Project Series A | | | 3.75 | | | | 5-1-2023 | | | | 1,080,000 | | | | 1,097,701 | |
| | | | |
Lees Summit MO Summit Fair Project Series 2017 144A | | | 3.50 | | | | 11-1-2023 | | | | 480,000 | | | | 481,997 | |
| | | | |
Richmond Heights MO Francis Place Redevelopment Project | | | 5.63 | | | | 11-1-2025 | | | | 1,375,000 | | | | 1,375,536 | |
| |
| | | | 2,955,234 | |
| | | | | | | | | | | | | | | | |
| | | | |
| Water & Sewer Revenue: 0.17% | | | | | | | | | | | | |
| | | | |
Kansas City MO Sanitation Sewer System Revenue Series B | | | 5.00 | | | | 1-1-2020 | | | | 400,000 | | | | 407,392 | |
| | | | |
Kansas City MO Sanitation Sewer System Revenue Series B | | | 5.00 | | | | 1-1-2021 | | | | 575,000 | | | | 606,711 | |
| | | | |
Kansas City MO Sanitation Sewer System Revenue Series B | | | 5.00 | | | | 1-1-2023 | | | | 805,000 | | | | 904,973 | |
| | | | |
Kansas City MO Sanitation Sewer System Revenue Series B | | | 5.00 | | | | 1-1-2025 | | | | 810,000 | | | | 961,438 | |
| | | | |
Kansas City MO Sanitation Sewer System Revenue Series B | | | 5.00 | | | | 1-1-2027 | | | | 700,000 | | | | 867,300 | |
| | | | |
Kansas City MO Sanitation Sewer System Revenue Series B | | | 5.00 | | | | 1-1-2028 | | | | 275,000 | | | | 346,561 | |
| |
| | | | 4,094,375 | |
| | | | | | | | | | | | | | | | |
| |
| | | | 24,649,492 | |
| | | | | | | | | | | | | | | | |
| | | | |
Nebraska: 0.39% | | | | | | | | | | | | | | | | |
| | | | |
| Utilities Revenue: 0.39% | | | | | | | | | | | | |
| | | | |
Central Plains Energy Nebraska Gas Project #3 | | | 5.00 | | | | 9-1-2025 | | | | 3,290,000 | | | | 3,815,874 | |
24 | Wells Fargo Strategic Municipal Bond Fund
Portfolio of investments—June 30, 2019
| | | | | | | | | | | | | | | | |
| | | Interest rate | | | Maturity date | | | Principal | | | Value | |
| Utilities Revenue (continued) | | | | | | | | | | | | |
| | | | |
Central Plains Energy Nebraska Gas Project #3 | | | 5.00 | % | | | 9-1-2026 | | | $ | 3,750,000 | | | $ | 4,422,113 | |
| | | | |
Central Plains Energy Nebraska Gas Project #3 | | | 5.00 | | | | 9-1-2027 | | | | 1,000,000 | | | | 1,197,270 | |
| |
| | | | 9,435,257 | |
| | | | | | | | | | | | | | | | |
| | | | |
New Hampshire: 0.40% | | | | | | | | | | | | | | | | |
| | | | |
| Health Revenue: 0.40% | | | | | | | | | | | | |
| | | | |
New Hampshire Covenant Health Systems Series B | | | 5.00 | | | | 7-1-2028 | | | | 6,400,000 | | | | 6,446,592 | |
| | | | |
New Hampshire HEFA Hillside Village Issue Series 2017C 144A | | | 3.50 | | | | 7-1-2022 | | | | 3,350,000 | | | | 3,353,216 | |
| |
| | | | 9,799,808 | |
| | | | | | | | | | | | | | | | |
| | | | |
New Jersey: 4.27% | | | | | | | | | | | | | | | | |
| | | | |
| Airport Revenue: 0.22% | | | | | | | | | | | | |
| | | | |
South Jersey NJ Port Corporation Marine Terminal Series R | | | 4.00 | | | | 1-1-2022 | | | | 1,600,000 | | | | 1,663,616 | |
| | | | |
South Jersey NJ Port Corporation Marine Terminal Series S-2 | | | 5.00 | | | | 1-1-2023 | | | | 1,665,000 | | | | 1,813,918 | |
| | | | |
South Jersey NJ Port Corporation Marine Terminal Series S-2 | | | 5.00 | | | | 1-1-2024 | | | | 1,750,000 | | | | 1,943,603 | |
| |
| | | | 5,421,137 | |
| | | | | | | | | | | | | | | | |
| | | | |
| Education Revenue: 0.32% | | | | | | | | | | | | |
| | | | |
New Jersey Higher Education Student Assistance Authority Series 2014-1A-1 | | | 5.00 | | | | 12-1-2021 | | | | 2,250,000 | | | | 2,421,495 | |
| | | | |
New Jersey Higher Education Student Assistance Authority Series 2017-1B | | | 5.00 | | | | 12-1-2020 | | | | 2,250,000 | | | | 2,353,185 | |
| | | | |
New Jersey Higher Education Student Assistance Authority Series 2017-1B | | | 5.00 | | | | 12-1-2021 | | | | 2,815,000 | | | | 3,029,559 | |
| |
| | | | 7,804,239 | |
| | | | | | | | | | | | | | | | |
| | | | |
| GO Revenue: 0.02% | | | | | | | | | | | | |
| | | | |
Paterson NJ General Improvement (AGM Insured) | | | 5.00 | | | | 6-15-2020 | | | | 400,000 | | | | 400,848 | |
| | | | | | | | | | | | | | | | |
| | | | |
| Health Revenue: 0.41% | | | | | | | | | | | | |
| | | | |
Tender Option Bond Trust Receipts/Floater Certificates Series 2016-XG0047 (AGC Insured, Deutsche Bank LIQ) 144Aø | | | 2.00 | | | | 7-1-2038 | | | | 10,000,000 | | | | 10,000,000 | |
| | | | | | | | | | | | | | | | |
| | | | |
| Housing Revenue: 0.42% | | | | | | | | | | | | |
| | | | |
New Jersey Housing & Mortgage Finance Agency Multifamily Series C | | | 2.41 | | | | 10-1-2021 | | | | 10,000,000 | | | | 10,100,900 | |
| | | | | | | | | | | | | | | | |
| | | | |
| Industrial Development Revenue: 0.12% | | | | | | | | | | | | |
| | | | |
New Jersey EDA Elite Pharmaceuticals Project Series A | | | 6.50 | | | | 9-1-2030 | | | | 375,000 | | | | 345,428 | |
| | | | |
New Jersey EDA The Goethals Bridge Replacement Project | | | 5.00 | | | | 7-1-2020 | | | | 500,000 | | | | 515,795 | |
| | | | |
New Jersey EDA The Goethals Bridge Replacement Project | | | 5.00 | | | | 1-1-2021 | | | | 585,000 | | | | 612,179 | |
| | | | |
New Jersey EDA The Goethals Bridge Replacement Project | | | 5.00 | | | | 7-1-2021 | | | | 900,000 | | | | 955,341 | |
| | | | |
New Jersey EDA The Goethals Bridge Replacement Project | | | 5.00 | | | | 1-1-2023 | | | | 400,000 | | | | 441,888 | |
| |
| | | | 2,870,631 | |
| | | | | | | | | | | | | | | | |
| | | | |
| Miscellaneous Revenue: 1.43% | | | | | | | | | | | | |
| | | | |
New Jersey EDA Motor Vehicle Surcharge Revenue Refunding Bond Series A | | | 3.13 | | | | 7-1-2029 | | | | 6,000,000 | | | | 6,048,300 | |
| | | | |
New Jersey EDA Motor Vehicle Surcharge Revenue Refunding Bond Series A | | | 3.38 | | | | 7-1-2030 | | | | 9,705,000 | | | | 9,838,638 | |
| | | | |
New Jersey EDA School Facilities Construction Project Prerefunded Bond Series EE | | | 5.50 | | | | 9-1-2021 | | | | 2,025,000 | | | | 2,160,695 | |
| | | | |
New Jersey EDA School Facilities Construction Project Series EE | | | 5.25 | | | | 9-1-2025 | | | | 1,800,000 | | | | 1,905,264 | |
| | | | |
New Jersey EDA School Facilities Construction Project Series K (Ambac Insured) | | | 5.25 | | | | 12-15-2020 | | | | 3,000,000 | | | | 3,150,390 | |
| | | | |
New Jersey EDA School Facilities Construction Project Series NN (AGM Insured) | | | 5.00 | | | | 3-1-2024 | | | | 1,645,000 | | | | 1,816,310 | |
| | | | |
New Jersey EDA School Facilities Construction Refunding Bond Project Series I (SIFMA Municipal Swap +1.25%)± | | | 3.15 | | | | 9-1-2025 | | | | 4,500,000 | | | | 4,437,360 | |
Wells Fargo Strategic Municipal Bond Fund | 25
Portfolio of investments—June 30, 2019
| | | | | | | | | | | | | | | | |
| | | Interest rate | | | Maturity date | | | Principal | | | Value | |
| Miscellaneous Revenue (continued) | | | | | | | | | | | | |
| | | | |
New Jersey TTFA Series A | | | 5.00 | % | | | 6-15-2022 | | | $ | 4,815,000 | | | $ | 5,115,360 | |
| |
| | | | 34,472,317 | |
| | | | | | | | | | | | | | | | |
| | | | |
| Tax Revenue: 0.03% | | | | | | | | | | | | |
| | | | |
New Jersey EDA School Facilities Construction Project Unrefunded Bond Series EE | | | 5.50 | | | | 9-1-2021 | | | | 750,000 | | | | 795,810 | |
| | | | | | | | | | | | | | | | |
| | | | |
| Transportation Revenue: 1.30% | | | | | | | | | | | | |
| | | | |
New Jersey TTFA CAB Series A ¤ | | | 0.00 | | | | 12-15-2026 | | | | 12,000,000 | | | | 9,731,520 | |
| | | | |
New Jersey TTFA Series A | | | 5.25 | | | | 12-15-2020 | | | | 1,900,000 | | | | 1,995,798 | |
| | | | |
New Jersey TTFA Series A | | | 5.25 | | | | 6-15-2022 | | | | 2,785,000 | | | | 2,972,041 | |
| | | | |
New Jersey TTFA Series AA | | | 5.00 | | | | 6-15-2023 | | | | 4,665,000 | | | | 5,208,193 | |
| | | | |
New Jersey TTFA Series AA | | | 5.00 | | | | 6-15-2023 | | | | 1,350,000 | | | | 1,467,734 | |
| | | | |
New Jersey TTFA Series B | | | 5.00 | | | | 6-15-2020 | | | | 2,150,000 | | | | 2,216,349 | |
| | | | |
New Jersey TTFA Series D | | | 5.00 | | | | 12-15-2023 | | | | 6,960,000 | | | | 7,864,382 | |
| |
| | | | 31,456,017 | |
| | | | | | | | | | | | | | | | |
| |
| | | | 103,321,899 | |
| | | | | | | | | | | | | | | | |
|
New Mexico: 0.71% | |
| | | | |
| Utilities Revenue: 0.71% | | | | | | | | | | | | |
| | | | |
New Mexico Municipal Energy Acquisition Authority Gas Supply Subordinate Bond Series B (1 Month LIBOR +0.75%) (Royal Bank of Canada SPA)± | | | 2.39 | | | | 11-1-2039 | | | | 17,100,000 | | | | 17,100,000 | |
| | | | | | | | | | | | | | | | |
| | | | |
New York: 7.33% | | | | | | | | | | | | | | | | |
| | | | |
| Airport Revenue: 1.56% | | | | | | | | | | | | |
| | | | |
Port Authority of New York & New Jersey Consolidated Bonds 172 Series | | | 5.00 | | | | 10-1-2027 | | | | 5,000,000 | | | | 5,457,000 | |
| | | | |
Port Authority of New York & New Jersey Consolidated Bonds 185 Series | | | 5.00 | | | | 9-1-2028 | | | | 5,000,000 | | | | 5,821,250 | |
| | | | |
Port Authority of New York & New Jersey Consolidated Bonds 207 Series | | | 5.00 | | | | 9-15-2027 | | | | 21,270,000 | | | | 26,596,859 | |
| |
| | | | 37,875,109 | |
| | | | | | | | | | | | | | | | |
| | | | |
| Education Revenue: 0.33% | | | | | | | | | | | | |
| | | | |
Albany NY IDA Foundation State University Project Series A ø | | | 2.30 | | | | 7-1-2032 | | | | 2,520,000 | | | | 2,520,000 | |
| | | | |
Build New York City Resource Corporation Bronx Charter School for International Cultures & Arts Series A | | | 3.88 | | | | 4-15-2023 | | | | 800,000 | | | | 820,912 | |
| | | | |
Hempstead Town NY Local Development Corporation Academy Charter School Project Series A | | | 5.45 | | | | 2-1-2027 | | | | 2,880,000 | | | | 2,992,090 | |
| | | | |
Hempstead Town NY Local Development Corporation Academy Charter School Project Series A | | | 6.47 | | | | 2-1-2033 | | | | 1,435,000 | | | | 1,555,655 | |
| |
| | | | 7,888,657 | |
| | | | | | | | | | | | | | | | |
| | | | |
| Health Revenue: 0.30% | | | | | | | | | | | | |
| | | | |
Monroe County NY Industrial Development Corporation Unity Hospital Rochester Project (FHA Insured) | | | 4.20 | | | | 8-15-2025 | | | | 7,195,000 | | | | 7,209,390 | |
| | | | | | | | | | | | | | | | |
| | | | |
| Housing Revenue: 0.59% | | | | | | | | | | | | |
| | | | |
East Rochester NY Housing Authority Home Good Sheperd Project Series A (Royal Bank of Scotland LOC) ø | | | 2.05 | | | | 12-1-2036 | | | | 2,480,000 | | | | 2,480,000 | |
| | | | |
New York HFA Affordable Housing Project Series M (GNMA/FNMA/FHLMC Insured) | | | 2.00 | | | | 5-1-2021 | | | | 9,375,000 | | | | 9,446,625 | |
| | | | |
New York HFA Affordable Housing Project Series M (GNMA/FNMA/FHLMC Insured) | | | 2.00 | | | | 5-1-2021 | | | | 2,250,000 | | | | 2,271,263 | |
| |
| | | | 14,197,888 | |
| | | | | | | | | | | | | | | | |
26 | Wells Fargo Strategic Municipal Bond Fund
Portfolio of investments—June 30, 2019
| | | | | | | | | | | | | | | | |
| | | Interest rate | | | Maturity date | | | Principal | | | Value | |
| Industrial Development Revenue: 0.53% | | | | | | | | | | | | |
| | | | |
New York Transportation Development Corporation Special Facilities Bonds Series 2018 | | | 5.00 | % | | | 1-1-2025 | | | $ | 11,030,000 | | | $ | 12,713,730 | |
| | | | | | | | | | | | | | | | |
| | | | |
| Miscellaneous Revenue: 1.03% | | | | | | | | | | | | |
| | | | |
New York Tender Option Bond Trust Receipts/Floater CertificatesSeries 2019-BAML3002 (Bank of America NA LIQ) 144Aø | | | 1.98 | | | | 1-15-2056 | | | | 25,000,000 | | | | 25,000,000 | |
| | | | | | | | | | | | | | | | |
| | | | |
| Tax Revenue: 0.74% | | | | | | | | | | | | |
| | | | |
New York NY Transitional Finance Authority Future Tax Secured Fiscal 2019 Subordinate Series A-4 (JPMorgan Chase & Company SPA) ø | | | 1.95 | | | | 8-1-2045 | | | | 10,490,000 | | | | 10,490,000 | |
| | | | |
New York Metropolitan Transportation Authority Dedicated Tax Fund (SIFMA Municipal Swap +0.95%)± | | | 2.85 | | | | 11-1-2019 | | | | 7,500,000 | | | | 7,520,775 | |
| |
| | | | 18,010,775 | |
| | | | | | | | | | | | | | | | |
| | | | |
| Tobacco Revenue: 0.03% | | | | | | | | | | | | |
| | | | |
Suffolk County NY Tobacco Asset Securitization Corporation | | | 5.00 | | | | 6-1-2020 | | | | 625,000 | | | | 640,450 | |
| | | | | | | | | | | | | | | | |
|
| Transportation Revenue: 1.34% | |
| | | | |
New York Metropolitan Transportation Authority Subordinate Bond Series D (1 Month LIBOR +0.65%)± | | | 2.29 | | | | 11-1-2035 | | | | 18,000,000 | | | | 18,012,420 | |
| | | | |
New York Triborough Bridge & Tunnel Authority Series B (U.S. SOFR +0.50%) ± | | | 2.12 | | | | 11-15-2038 | | | | 14,500,000 | | | | 14,503,045 | |
| |
| | | | 32,515,465 | |
| | | | | | | | | | | | | | | | |
| | | | |
| Utilities Revenue: 0.62% | | | | | | | | | | | | |
| | | | |
Long Island NY Power Authority Electric System Series C (1 Month LIBOR +0.75%) ± | | | 2.46 | | | | 5-1-2033 | | | | 15,000,000 | | | | 15,009,450 | |
| | | | | | | | | | | | | | | | |
| | | | |
| Water & Sewer Revenue: 0.26% | | | | | | | | | | | | |
| | | | |
New York NY Municipal Water Finance Authority Water & Sewer System 2nd Generation Resolution Fiscal 2015 Subordinate Series BB-1 (Bank of America NA SPA) ø | | | 1.98 | | | | 6-15-2049 | | | | 6,200,000 | | | | 6,200,000 | |
| | | | | | | | | | | | | | | | |
| |
| | | | 177,260,914 | |
| | | | | | | | | | | | | | | | |
| | | | |
Ohio: 0.80% | | | | | | | | | | | | | | | | |
| | | | |
| Education Revenue: 0.09% | | | | | | | | | | | | |
| | | | |
Portage County OH Port Authority Northeast Ohio Medical University Project | | | 5.00 | | | | 12-1-2026 | | | | 1,980,000 | | | | 2,113,690 | |
| | | | | | | | | | | | | | | | |
| | | | |
| Health Revenue: 0.23% | | | | | | | | | | | | |
| | | | |
Akron OH Bath and Copley Joint Township Hospital District | | | 5.00 | | | | 1-1-2031 | | | | 2,000,000 | | | | 2,167,360 | |
| | | | |
Allen County OH Hospital Facilities Revenue Bonds Series B | | | 5.00 | | | | 8-1-2047 | | | | 2,500,000 | | | | 2,739,900 | |
| | | | |
Hamilton County OH Healthcare Series 2017 | | | 3.00 | | | | 1-1-2022 | | | | 690,000 | | | | 700,316 | |
| |
| | | | 5,607,576 | |
| | | | | | | | | | | | | | | | |
| | | | |
| Resource Recovery Revenue: 0.20% | | | | | | | | | | | | |
| | | | |
Ohio Air Quality Development Authority Ohio Valley Electric Corporation Series E | | | 5.63 | | | | 10-1-2019 | | | | 4,850,000 | | | | 4,877,063 | |
| | | | | | | | | | | | | | | | |
| | | | |
| Water & Sewer Revenue: 0.28% | | | | | | | | | | | | |
| | | | |
Columbus OH Sewerage System | | | 5.00 | | | | 6-1-2031 | | | | 5,825,000 | | | | 6,802,144 | |
| | | | | | | | | | | | | | | | |
| |
| | | | 19,400,473 | |
| | | | | | | | | | | | | | | | |
| | | | |
Oklahoma: 0.19% | | | | | | | | | | | | | | | | |
| | | | |
| Tax Revenue: 0.19% | | | | | | | | | | | | |
| | | | |
Tulsa OK Public Facilities Authority Capital Improvements | | | 4.00 | | | | 10-1-2027 | | | | 4,050,000 | | | | 4,618,499 | |
| | | | | | | | | | | | | | | | |
Wells Fargo Strategic Municipal Bond Fund | 27
Portfolio of investments—June 30, 2019
| | | | | | | | | | | | | | | | |
| | | Interest rate | | | Maturity date | | | Principal | | | Value | |
Other: 0.17% | | | | | | | | | | | | | | | | |
| | | | |
| Miscellaneous Revenue: 0.17% | | | | | | | | | | | | |
| | | | |
FHLMC Multiclass Mortgage Participation Certificates Series M012 Class A1A øø | | | 1.60 | % | | | 8-15-2051 | | | $ | 3,495,716 | | | $ | 3,507,147 | |
| | | | |
Public Housing Capital Fund Trust II (HUD Insured) 144A | | | 4.50 | | | | 7-1-2022 | | | | 707,791 | | | | 712,759 | |
| |
| | | | 4,219,906 | |
| | | | | | | | | | | | | | | | |
| | | | |
Pennsylvania: 6.22% | | | | | | | | | | | | | | | | |
| | | | |
| Education Revenue: 0.96% | | | | | | | | | | | | |
| | | | |
Chester County PA IDA Avon Grove Charter School Project Series 2017A | | | 4.00 | | | | 12-15-2027 | | | | 2,110,000 | | | | 2,204,760 | |
| | | | |
Chester County PA IDA Collegium Charter School Project Series A | | | 3.70 | | | | 10-15-2022 | | | | 1,150,000 | | | | 1,159,856 | |
| | | | |
Montgomery County PA HEFAR Arcadia University | | | 5.00 | | | | 4-1-2022 | | | | 1,575,000 | | | | 1,696,511 | |
| | | | |
Montgomery County PA HEFAR Arcadia University | | | 5.00 | | | | 4-1-2023 | | | | 1,555,000 | | | | 1,711,340 | |
| | | | |
Pennsylvania HEFAR Thomas Jefferson University Series B ø | | | 2.13 | | | | 9-1-2045 | | | | 9,440,000 | | | | 9,440,000 | |
| | | | |
Philadelphia PA IDA Charter School Project Series 2016B | | | 4.88 | | | | 8-1-2026 | | | | 1,960,000 | | | | 2,045,123 | |
| | | | |
Philadelphia PA IDA Charter School Project Series A | | | 4.50 | | | | 8-1-2026 | | | | 3,005,000 | | | | 3,142,028 | |
| | | | |
Philadelphia PA IDA Tacony Academy Christian School Project Series A-1 | | | 6.25 | | | | 6-15-2023 | | | | 520,000 | | | | 557,768 | |
| | | | |
Philadelphia PA IDA University of the Arts Series 2017 144A | | | 5.00 | | | | 3-15-2021 | | | | 1,205,000 | | | | 1,237,788 | |
| |
| | | | 23,195,174 | |
| | | | | | | | | | | | | | | | |
| | | | |
| GO Revenue: 1.46% | | | | | | | | | | | | |
| | | | |
Allegheny County PA Penn Hills Schools District Series 2015 (Build America Mutual Assurance Company Insured) | | | 5.00 | | | | 11-15-2022 | | | | 340,000 | | | | 375,074 | |
| | | | |
Allegheny County PA Penn Hills Schools District Series 2015 (Build America Mutual Assurance Company Insured) | | | 5.00 | | | | 11-15-2023 | | | | 1,025,000 | | | | 1,159,562 | |
| | | | |
Bristol Township PA School District | | | 5.25 | | | | 6-1-2031 | | | | 6,990,000 | | | | 7,821,530 | |
| | | | |
Philadelphia PA School District Series B | | | 3.13 | | | | 9-1-2020 | | | | 200,000 | | | | 203,384 | |
| | | | |
Philadelphia PA School District Series D | | | 5.00 | | | | 9-1-2021 | | | | 2,000,000 | | | | 2,141,480 | |
| | | | |
Philadelphia PA School District Series D | | | 5.00 | | | | 9-1-2022 | | | | 3,565,000 | | | | 3,929,022 | |
| | | | |
Philadelphia PA School District Series E | | | 5.25 | | | | 9-1-2022 | | | | 2,995,000 | | | | 3,120,041 | |
| | | | |
Philadelphia PA School District Series E | | | 5.25 | | | | 9-1-2023 | | | | 5,770,000 | | | | 6,008,878 | |
| | | | |
Philadelphia PA School District Series F | | | 5.00 | | | | 9-1-2022 | | | | 5,000,000 | | | | 5,510,550 | |
| | | | |
Scranton PA School District Series A | | | 5.00 | | | | 6-1-2024 | | | | 750,000 | | | | 853,973 | |
| | | | |
Scranton PA School District Series A | | | 5.00 | | | | 6-1-2025 | | | | 1,000,000 | | | | 1,162,250 | |
| | | | |
Scranton PA School District Series B (National Insured) | | | 5.00 | | | | 6-1-2024 | | | | 665,000 | | | | 757,189 | |
| | | | |
Scranton PA School District Series B (National Insured) | | | 5.00 | | | | 6-1-2025 | | | | 710,000 | | | | 825,198 | |
| | | | |
Scranton PA Series 2017 144A | | | 5.00 | | | | 9-1-2023 | | | | 1,355,000 | | | | 1,481,286 | |
| |
| | | | 35,349,417 | |
| | | | | | | | | | | | | | | | |
| | | | |
| Health Revenue: 1.85% | | | | | | | | | | | | |
| | | | |
Berks County PA Municipal Authority Reading Hospital & Medical Center Project Series B (SIFMA Municipal Swap +1.50%) ± | | | 3.40 | | | | 11-1-2039 | | | | 8,850,000 | | | | 8,940,447 | |
| | | | |
Fulton County PA IDA Medical Center Project | | | 2.40 | | | | 7-1-2020 | | | | 810,000 | | | | 810,203 | |
| | | | |
Montgomery County PA Higher Education & Health Authority Series 2018D ø | | | 2.13 | | | | 9-1-2050 | | | | 10,200,000 | | | | 10,200,000 | |
| | | | |
Montgomery County PA Higher Education & Health Authority Thomas Jefferson University Series C (SIFMA Municipal Swap +0.72%)± | | | 2.62 | | | | 9-1-2051 | | | | 3,500,000 | | | | 3,500,070 | |
| | | | |
Quakertown PA Health Facilities Authority Series A | | | 3.13 | | | | 7-1-2021 | | | | 1,500,000 | | | | 1,493,250 | |
| | | | |
RIB Floater Trust Series 2019-003 (Barclays Bank plc LOC, Barclays Bank plc LIQ) 144Aø | | | 2.05 | | | | 8-15-2038 | | | | 19,920,000 | | | | 19,920,000 | |
| |
| | | | 44,863,970 | |
| | | | | | | | | | | | | | | | |
| | | | |
| Housing Revenue: 0.09% | | | | | | | | | | | | |
| | | | |
Pennsylvania HFA Single Family Series 128A | | | 4.75 | | | | 4-1-2033 | | | | 1,945,000 | | | | 2,113,243 | |
| | | | | | | | | | | | | | | | |
28 | Wells Fargo Strategic Municipal Bond Fund
Portfolio of investments—June 30, 2019
| | | | | | | | | | | | | | | | |
| | | Interest rate | | | Maturity date | | | Principal | | | Value | |
| Industrial Development Revenue: 0.82% | | | | | | | | | | | | |
| | | | |
Montgomery County PA IDA Peco Energy Company Project Series A | | | 2.60 | % | | | 3-1-2034 | | | $ | 8,500,000 | | | $ | 8,546,495 | |
| | | | |
Montgomery County PA IDA Peco Energy Company Project Series B | | | 2.55 | | | | 6-1-2029 | | | | 10,340,000 | | | | 10,384,565 | |
| | | | |
Pennsylvania State Economic Development Financial Authority Solid Waste Disposal CarbonLite P LLC Project 144A%% | | | 5.25 | | | | 6-1-2026 | | | | 1,000,000 | | | | 1,023,510 | |
| |
| | | | 19,954,570 | |
| | | | | | | | | | | | | | | | |
| | | | |
| Miscellaneous Revenue: 0.21% | | | | | | | | | | | | |
| | | | |
Pennsylvania Public School Building Authority Series A (AGM Insured, Citibank NA LIQ) 144Aø | | | 2.05 | | | | 12-1-2023 | | | | 5,000,000 | | | | 5,000,000 | |
| | | | | | | | | | | | | | | | |
|
| Transportation Revenue: 0.42% | |
| | | | |
Pennsylvania Turnpike Commission Series B (SIFMA Municipal Swap +1.27%) ± | | | 3.17 | | | | 12-1-2020 | | | | 10,000,000 | | | | 10,079,900 | |
| | | | | | | | | | | | | | | | |
| | | | |
| Water & Sewer Revenue: 0.41% | | | | | | | | | | | | |
| | | | |
Pittsburgh PA Water & Sewer Authority Series C (1 Month LIBOR +0.64%) (AGM Insured)± | | | 2.39 | | | | 9-1-2040 | | | | 10,000,000 | | | | 10,003,900 | |
| | | | | | | | | | | | | | | | |
| |
| | | | 150,560,174 | |
| | | | | | | | | | | | | | | | |
| | | | |
Rhode Island: 0.09% | | | | | | | | | | | | | | | | |
| | | | |
| Housing Revenue: 0.00% | | | | | | | | | | | | |
| | | | |
Rhode Island Housing & Mortgage Finance | | | 6.50 | | | | 4-1-2027 | | | | 15,000 | | | | 15,113 | |
| | | | | | | | | | | | | | | | |
| | | | |
| Miscellaneous Revenue: 0.09% | | | | | | | | | | | | |
| | | | |
Providence RI RDA Series A | | | 5.00 | | | | 4-1-2022 | | | | 1,940,000 | | | | 2,093,454 | |
| | | | | | | | | | | | | | | | |
| |
| | | | 2,108,567 | |
| | | | | | | | | | | | | | | | |
| | | | |
South Carolina: 1.47% | | | | | | | | | | | | | | | | |
| | | | |
| Education Revenue: 0.03% | | | | | | | | | | | | |
| | | | |
South Carolina Jobs EDA York Preparatory Academy Project Series A | | | 5.75 | | | | 11-1-2023 | | | | 710,000 | | | | 735,489 | |
| | | | | | | | | | | | | | | | |
| | | | |
| Health Revenue: 0.99% | | | | | | | | | | | | |
| | | | |
South Carolina Jobs EDA Prisma Health Obligated Group Series C ø | | | 2.12 | | | | 5-1-2048 | | | | 24,000,000 | | | | 24,000,000 | |
| | | | | | | | | | | | | | | | |
| | | | |
| Miscellaneous Revenue: 0.22% | | | | | | | | | | | | |
| | | | |
Lee County SC School Facilities Incorporated (AGM Insured) | | | 2.00 | | | | 6-1-2020 | | | | 185,000 | | | | 185,635 | |
| | | | |
Lee County SC School Facilities Incorporated (AGM Insured) | | | 4.00 | | | | 12-1-2019 | | | | 560,000 | | | | 565,466 | |
| | | | |
Lee County SC School Facilities Incorporated (AGM Insured) | | | 4.00 | | | | 12-1-2020 | | | | 375,000 | | | | 387,420 | |
| | | | |
South Carolina Transportation Infrastructure Refunding Bonds Series A | | | 5.00 | | | | 10-1-2032 | | | | 4,025,000 | | | | 4,298,257 | |
| |
| | | | 5,436,778 | |
| | | | | | | | | | | | | | | | |
| | | | |
| Resource Recovery Revenue: 0.14% | | | | | | | | | | | | |
| | | | |
South Carolina Jobs EDA Solid Waste Disposal RePower South Berkeley LLC 144A | | | 5.25 | | | | 2-1-2027 | | | | 3,310,000 | | | | 3,350,183 | |
| | | | | | | | | | | | | | | | |
| | | | |
| Utilities Revenue: 0.09% | | | | | | | | | | | | |
| | | | |
Patriots Energy Group Financing Agency South Carolina Series A | | | 4.00 | | | | 10-1-2048 | | | | 1,895,000 | | | | 2,075,196 | |
| | | | | | | | | | | | | | | | |
| |
| | | | 35,597,646 | |
| | | | | | | | | | | | | | | | |
| | | | |
South Dakota: 0.04% | | | | | | | | | | | | | | | | |
| | | | |
| Health Revenue: 0.04% | | | | | | | | | | | | |
| | | | |
South Dakota HEFA | | | 4.50 | | | | 9-1-2019 | | | | 990,000 | | | | 995,198 | |
| | | | | | | | | | | | | | | | |
Wells Fargo Strategic Municipal Bond Fund | 29
Portfolio of investments—June 30, 2019
| | | | | | | | | | | | | | | | |
| | | Interest rate | | | Maturity date | | | Principal | | | Value | |
Tennessee: 0.67% | | | | | | | | | | | | | | | | |
| | | | |
| Utilities Revenue: 0.67% | | | | | | | | | | | | |
| | | | |
Tennessee Energy Acquisition Corporation Gas Project | | | 4.00 | % | | | 11-1-2049 | | | $ | 2,000,000 | | | $ | 2,203,840 | |
| | | | |
Tennessee Energy Acquisition Corporation Series A | | | 4.00 | | | | 5-1-2048 | | | | 12,140,000 | | | | 13,013,594 | |
| | | | |
Tennessee Energy Acquisition Corporation Series B | | | 5.63 | | | | 9-1-2026 | | | | 925,000 | | | | 1,124,032 | |
| |
| | | | 16,341,466 | |
| | | | | | | | | | | | | | | | |
|
Texas: 11.82% | |
| | | | |
Airport Revenue: 1.73% | | | | | | | | | | | | | | | | |
| | | | |
Dallas Fort Worth TX International Airport AMT Series E | | | 5.00 | | | | 11-1-2032 | | | | 1,970,000 | | | | 2,050,829 | |
| | | | |
Dallas Fort Worth TX International Airport Improvement Bonds AMT Series H | | | 5.00 | | | | 11-1-2032 | | | | 9,175,000 | | | | 9,783,394 | |
| | | | |
Dallas Fort Worth TX International Airport Improvement Bonds AMT Series H | | | 5.00 | | | | 11-1-2037 | | | | 22,000,000 | | | | 23,371,040 | |
| | | | |
Dallas Fort Worth TX International Airport Refunding Bonds AMT Series A | | | 5.00 | | | | 11-1-2032 | | | | 3,375,000 | | | | 3,749,018 | |
| | | | |
Houston TX Airport System Subordinate Refunding Bonds AMT Series A | | | 5.00 | | | | 7-1-2031 | | | | 2,750,000 | | | | 2,990,763 | |
| |
| | | | 41,945,044 | |
| | | | | | | | | | | | | | | | |
| | | | |
| Education Revenue: 1.16% | | | | | | | | | | | | |
| | | | |
Arlington TX Higher Education Finance Corporate Education Series A | | | 4.00 | | | | 6-15-2026 | | | | 530,000 | | | | 536,355 | |
| | | | |
Austin TX Community College District Series A | | | 4.00 | | | | 2-1-2023 | | | | 320,000 | | | | 346,678 | |
| | | | |
Clifton TX Higher Education Finance Corporation International Leadership Series 2015A | | | 4.63 | | | | 8-15-2025 | | | | 8,905,000 | | | | 9,406,975 | |
| | | | |
Clifton TX Higher Education Finance Corporation Uplift Education Series 2018D | | | 5.00 | | | | 8-15-2025 | | | | 6,565,000 | | | | 7,087,968 | |
| | | | |
Clifton TX Higher Education Finance Corporation Uplift Education Series A | | | 4.00 | | | | 12-1-2025 | | | | 3,245,000 | | | | 3,412,702 | |
| | | | |
New Hope TX Cultural Education Facilities Finance Corporation Jubilee Academic Center 144A | | | 3.38 | | | | 8-15-2021 | | | | 1,070,000 | | | | 1,075,746 | |
| | | | |
Newark TX Higher Educational Finance Corporation Charter Schools Incorporated Series 2015 A 144A | | | 4.63 | | | | 8-15-2025 | | | | 1,485,000 | | | | 1,566,942 | |
| | | | |
North Texas Higher Education Authority Incorporated Student Loan Series 2 Class A (3 Month LIBOR +1.00%)± | | | 3.59 | | | | 4-1-2037 | | | | 1,335,000 | | | | 1,337,403 | |
| | | | |
Texas PFA Southern University Financing System (Build America Mutual Assurance Company Insured) | | | 5.00 | | | | 11-1-2020 | | | | 1,715,000 | | | | 1,787,030 | |
| | | | |
Texas PFA Southern University Financing System (Build America Mutual Assurance Company Insured) | | | 5.00 | | | | 11-1-2021 | | | | 1,275,000 | | | | 1,366,481 | |
| |
| | | | 27,924,280 | |
| | | | | | | | | | | | | | | | |
| | | | |
| GO Revenue: 4.62% | | | | | | | | | | | | |
| | | | |
Denton TX Independent School District Refunding Bonds Series B | | | 5.00 | | | | 8-15-2032 | | | | 5,000,000 | | | | 5,518,250 | |
| | | | |
Houston TX Public Improvement Refunding Bonds Series A | | | 4.00 | | | | 3-1-2031 | | | | 10,110,000 | | | | 10,917,385 | |
| | | | |
Katy TX Independent School District Series 2016A | | | 5.00 | | | | 2-15-2023 | | | | 1,415,000 | | | | 1,597,026 | |
| | | | |
Leander TX Independent School District CAB Bonds Series 2014C ¤ | | | 0.00 | | | | 8-15-2035 | | | | 2,975,000 | | | | 1,577,643 | |
| | | | |
Northside TX Independent School District Building Bonds Series 2018 | | | 2.75 | | | | 8-1-2048 | | | | 11,275,000 | | | | 11,776,174 | |
| | | | |
Pearland TX Permanent Improvement Series 2015 | | | 5.00 | | | | 3-1-2021 | | | | 1,000,000 | | | | 1,060,350 | |
| | | | |
Texas Anticipation Notes Series 2018 | | | 4.00 | | | | 8-29-2019 | | | | 16,810,000 | | | | 16,875,055 | |
| | | | |
Texas Transportation Commission Mobility Fund Refunding Bonds Series A ## | | | 5.00 | | | | 10-1-2030 | | | | 40,760,000 | | | | 47,541,220 | |
| | | | |
Texas Transportation Commission Mobility Fund Series B (SIFMA Municipal Swap +0.30%)± | | | 2.20 | | | | 10-1-2041 | | | | 15,000,000 | | | | 14,963,550 | |
| |
| | | | 111,826,653 | |
| | | | | | | | | | | | | | | | |
| | | | |
| Health Revenue: 1.00% | | | | | | | | | | | | |
| | | | |
Mesquite TX Health Facilities Development Corporation Christian Care Centers Incorporated Project Series 2016 | | | 5.00 | | | | 2-15-2020 | | | | 810,000 | | | | 819,493 | |
| | | | |
Mesquite TX Health Facilities Development Corporation Christian Care Centers Incorporated Project Series 2016 | | | 5.00 | | | | 2-15-2021 | | | | 560,000 | | | | 575,764 | |
30 | Wells Fargo Strategic Municipal Bond Fund
Portfolio of investments—June 30, 2019
| | | | | | | | | | | | | | | | |
| | | Interest rate | | | Maturity date | | | Principal | | | Value | |
| Health Revenue (continued) | | | | | | | | | | | | |
| | | | |
New Hope TX Cultural Education Facilities Finance Corporation Hospital Series 2017A | | | 5.00 | % | | | 8-15-2024 | | | $ | 1,000,000 | | | $ | 1,169,660 | |
| | | | |
New Hope TX Cultural Education Facilities Finance Corporation Hospital Series 2017A | | | 5.00 | | | | 8-15-2026 | | | | 2,000,000 | | | | 2,443,520 | |
| | | | |
New Hope TX Cultural Education Facilities Finance Corporation Presbyterian Village North Project | | | 5.00 | | | | 10-1-2019 | | | | 405,000 | | | | 407,272 | |
| | | | |
New Hope TX Cultural Education Facilities Finance Corporation Presbyterian Village North Project | | | 5.00 | | | | 10-1-2020 | | | | 680,000 | | | | 696,667 | |
| | | | |
New Hope TX Cultural Education Facilities Finance Corporation Presbyterian Village North Project | | | 5.00 | | | | 10-1-2023 | | | | 1,570,000 | | | | 1,678,738 | |
| | | | |
RIB Floater Trust Certificates Series 2019-010 (Barclays Bank plc LOC, Barclays Bank plc LIQ) 144Aø | | | 2.05 | | | | 11-15-2046 | | | | 12,120,000 | | | | 12,120,000 | |
| | | | |
Tarrant County TX Cultural Education Facilities Finance Corporation Buckner Senior Living-Ventana Project | | | 3.88 | | | | 11-15-2022 | | | | 4,315,000 | | | | 4,316,855 | |
| |
| | | | 24,227,969 | |
| | | | | | | | | | | | | | | | |
| | | | |
| Housing Revenue: 0.37% | | | | | | | | | | | | |
| | | | |
New Hope TX Cultural Education Facilities Finance Corporation Student Housing NCCD - Blinn College Properties LLC Project Series A | | | 3.25 | | | | 8-1-2019 | | | | 5,000,000 | | | | 5,000,200 | |
| | | | |
New Hope TX Cultural Education Facilities Finance Corporation Student Housing Tarleton State University Project | | | 5.38 | | | | 4-1-2028 | | | | 1,845,000 | | | | 2,008,006 | |
| | | | |
Texas New Hope ECFA Collegiate Housing Tarleton State University Series A | | | 4.00 | | | | 4-1-2020 | | | | 185,000 | | | | 187,214 | |
| | | | |
Texas New Hope ECFA Collegiate Housing Tarleton State University Series A | | | 4.00 | | | | 4-1-2021 | | | | 310,000 | | | | 317,998 | |
| | | | |
Texas New Hope ECFA Collegiate Housing Tarleton State University Series A | | | 4.00 | | | | 4-1-2022 | | | | 870,000 | | | | 904,652 | |
| | | | |
Texas New Hope ECFA Collegiate Housing Tarleton State University Series A | | | 5.00 | | | | 4-1-2025 | | | | 480,000 | | | | 537,034 | |
| |
| | | | 8,955,104 | |
| | | | | | | | | | | | | | | | |
| | | | |
| Industrial Development Revenue: 0.39% | | | | | | | | | | | | |
| | | | |
Austin Convention Enterprises Incorporated Series 2017B | | | 5.00 | | | | 1-1-2020 | | | | 500,000 | | | | 508,610 | |
| | | | |
Austin Convention Enterprises Incorporated Series 2017B | | | 5.00 | | | | 1-1-2021 | | | | 500,000 | | | | 524,365 | |
| | | | |
Houston TX Airport System Refunding Bond United Airlines Incorporated Terminal E Project | | | 4.50 | | | | 7-1-2020 | | | | 8,150,000 | | | | 8,352,609 | |
| |
| | | | 9,385,584 | |
| | | | | | | | | | | | | | | | |
| | | | |
| Miscellaneous Revenue: 0.10% | | | | | | | | | | | | |
| | | | |
Wood Glen TX Housing Finance Corporation Mortgage Copperwood Project Series A (National/FHA Insured) | | | 7.65 | | | | 7-1-2022 | | | | 2,125,000 | | | | 2,373,859 | |
| | | | | | | | | | | | | | | | |
| | | | |
| Resource Recovery Revenue: 0.43% | | | | | | | | | | | | |
| | | | |
Port Arthur TX Navigation District Jefferson County Environmental Facilities Motiva Enterprises LLC Project Series B ø | | | 2.07 | | | | 4-1-2040 | | | | 4,100,000 | | | | 4,100,000 | |
| | | | |
Port Arthur TX Navigation District Jefferson County Environmental Facilities Motiva Enterprises LLC Project Series C ø | | | 2.06 | | | | 4-1-2040 | | | | 400,000 | | | | 400,000 | |
| | | | |
Port Arthur TX Navigation District Jefferson County Environmental Facilities Motiva Enterprises LLC Project Series E ø | | | 2.05 | | | | 11-1-2040 | | | | 6,000,000 | | | | 6,000,000 | |
| |
| | | | 10,500,000 | |
| | | | | | | | | | | | | | | | |
| | | | |
| Transportation Revenue: 1.00% | | | | | | | | | | | | |
| | | | |
Central Texas Regional Mobility Authority Senior Lien Series A | | | 5.00 | | | | 1-1-2021 | | | | 1,000,000 | | | | 1,048,080 | |
| | | | |
Central Texas Regional Mobility Authority Senior Lien Series A | | | 5.00 | | | | 1-1-2023 | | | | 500,000 | | | | 553,955 | |
| | | | |
North Texas Tollway Authority System Refunding Bonds Series C (SIFMA Municipal Swap +0.67%)± | | | 2.57 | | | | 1-1-2038 | | | | 3,850,000 | | | | 3,849,115 | |
| | | | |
Texas Private Activity Bond Surface Transportation Corporation | | | 7.00 | | | | 6-30-2040 | | | | 1,250,000 | | | | 1,315,813 | |
| | | | |
Texas Tender Option Bond Trust Receipts/Floater CertificatesSeries 2015-XM0085 (Barclays Bank plc LIQ) 144Aø | | | 2.10 | | | | 7-1-2021 | | | | 17,500,000 | | | | 17,500,000 | |
| |
| | | | 24,266,963 | |
| | | | | | | | | | | | | | | | |
Wells Fargo Strategic Municipal Bond Fund | 31
Portfolio of investments—June 30, 2019
| | | | | | | | | | | | | | | | |
| | | Interest rate | | | Maturity date | | | Principal | | | Value | |
| Utilities Revenue: 0.26% | | | | | | | | | | | | |
| | | | |
San Antonio TX Electric & Gas Systems Junior Lien Refunding Bond | | | 2.75 | % | | | 2-1-2048 | | | $ | 6,000,000 | | | $ | 6,198,000 | |
| | | | | | | | | | | | | | | | |
|
| Water & Sewer Revenue: 0.76% | |
| | | | |
Dallas TX Waterworks Refunding Bonds Series A | | | 5.00 | | | | 10-1-2029 | | | | 15,000,000 | | | | 18,320,250 | |
| | | | | | | | | | | | | | | | |
| |
| | | | 285,923,706 | |
| | | | | | | | | | | | | | | | |
| | | | |
Utah: 1.30% | | | | | | | | | | | | | | | | |
| | | | |
| Airport Revenue: 0.18% | | | | | | | | | | | | |
| | | | |
Salt Lake City UT Airport Revenue Bonds AMT Series 2018A | | | 5.00 | | | | 7-1-2029 | | | | 1,000,000 | | | | 1,236,310 | |
| | | | |
Salt Lake City UT Airport Revenue Bonds AMT Series 2018A | | | 5.00 | | | | 7-1-2031 | | | | 2,500,000 | | | | 3,046,625 | |
| |
| | | | 4,282,935 | |
| | | | | | | | | | | | | | | | |
| | | | |
| Education Revenue: 0.06% | | | | | | | | | | | | |
| | | | |
Utah Charter School Finance Authority Ronald Wilson Reagan Academy Project Series A 144A | | | 3.50 | | | | 2-15-2026 | | | | 1,445,000 | | | | 1,459,450 | |
| | | | | | | | | | | | | | | | |
| | | | |
| Health Revenue: 1.03% | | | | | | | | | | | | |
| | | | |
Utah County UT IHC Health Services Series D (U.S. Bank NA SPA) ø | | | 1.90 | | | | 5-15-2049 | | | | 25,000,000 | | | | 25,000,000 | |
| | | | | | | | | | | | | | | | |
| | | | |
| Miscellaneous Revenue: 0.03% | | | | | | | | | | | | |
| | | | |
Utah Infrastructure Agency Telecommunications Series 2017 | | | 2.00 | | | | 10-15-2019 | | | | 625,000 | | | | 624,769 | |
| | | | | | | | | | | | | | | | |
| |
| | | | 31,367,154 | |
| | | | | | | | | | | | | | | | |
| | | | |
Vermont: 0.45% | | | | | | | | | | | | | | | | |
| | | | |
| Education Revenue: 0.45% | | | | | | | | | | | | |
| | | | |
Vermont Student Assistance Corporation Series A | | | 5.00 | | | | 6-15-2021 | | | | 1,800,000 | | | | 1,910,196 | |
| | | | |
Vermont Student Assistance Corporation Series A | | | 5.00 | | | | 6-15-2022 | | | | 550,000 | | | | 599,445 | |
| | | | |
Vermont Student Assistance Corporation Series A | | | 5.00 | | | | 6-15-2023 | | | | 1,200,000 | | | | 1,339,248 | |
| | | | |
Vermont Student Assistance Corporation Series B (1 Month LIBOR +1.00%)± | | | 3.44 | | | | 6-2-2042 | | | | 7,149,339 | | | | 7,088,569 | |
| |
| | | | 10,937,458 | |
| | | | | | | | | | | | | | | | |
| | | | |
Virginia: 1.26% | | | | | | | | | | | | | | | | |
| | | | |
| Health Revenue: 0.04% | | | | | | | | | | | | |
| | | | |
Prince William County VA IDA Westminster at Lake Ridge Series 2016 | | | 2.25 | | | | 1-1-2020 | | | | 910,000 | | | | 910,983 | |
| | | | | | | | | | | | | | | | |
| | | | |
| Transportation Revenue: 0.25% | | | | | | | | | | | | |
| | | | |
Toll Road Investors Partnership II LP Series 1999B 144A¤ | | | 0.00 | | | | 2-15-2029 | | | | 10,000,000 | | | | 6,054,397 | |
| | | | | | | | | | | | | | | | |
| | | | |
| Utilities Revenue: 0.97% | | | | | | | | | | | | |
| | | | |
Chesapeake VA EDA Poll Control Electric & Power Company Series 2008A± | | | 1.90 | | | | 2-1-2032 | | | | 4,250,000 | | | | 4,284,553 | |
| | | | |
Louisa VA Electric and Power IDA Series 2008B | | | 2.15 | | | | 11-1-2035 | | | | 19,050,000 | | | | 19,185,636 | |
| |
| | | | 23,470,189 | |
| | | | | | | | | | | | | | | | |
| |
| | | | 30,435,569 | |
| | | | | | | | | | | | | | | | |
| | | | |
Washington: 1.57% | | | | | | | | | | | | | | | | |
| | | | |
| Airport Revenue: 0.08% | | | | | | | | | | | | |
| | | | |
Port of Seattle WA Intermediate Lien Revenue Bonds AMT Series 2018A | | | 5.00 | | | | 5-1-2036 | | | | 1,710,000 | | | | 2,009,507 | |
| | | | | | | | | | | | | | | | |
|
| Education Revenue: 0.45% | |
| | | | |
University of Washington Series A | | | 5.00 | | | | 5-1-2048 | | | | 10,000,000 | | | | 10,801,000 | |
| | | | | | | | | | | | | | | | |
32 | Wells Fargo Strategic Municipal Bond Fund
Portfolio of investments—June 30, 2019
| | | | | | | | | | | | | | | | |
| | | Interest rate | | | Maturity date | | | Principal | | | Value | |
| Health Revenue: 0.72% | | | | | | | | | | | | |
| | | | |
Washington HCFR Catholic Health Initiatives Series B (SIFMA Municipal Swap +1.40%)± | | | 3.30 | % | | | 1-1-2035 | | | $ | 11,000,000 | | | $ | 11,187,330 | |
| | | | |
Washington Health Care Facilities Authority Fred Hutchinson Cancer Research (1 Month LIBOR +1.10%)± | | | 2.71 | | | | 1-1-2042 | | | | 6,050,000 | | | | 6,105,358 | |
| |
| | | | 17,292,688 | |
| | | | | | | | | | | | | | | | |
| | | | |
| Housing Revenue: 0.22% | | | | | | | | | | | | |
| | | | |
Snohomish County WA Housing Authority | | | 5.00 | | | | 4-1-2027 | | | | 1,130,000 | | | | 1,363,243 | |
| | | | |
Snohomish County WA Housing Authority | | | 5.00 | | | | 4-1-2028 | | | | 1,610,000 | | | | 1,965,327 | |
| | | | |
Snohomish County WA Housing Authority | | | 5.00 | | | | 4-1-2029 | | | | 1,690,000 | | | | 2,090,784 | |
| |
| | | | 5,419,354 | |
| | | | | | | | | | | | | | | | |
| | | | |
| Resource Recovery Revenue: 0.10% | | | | | | | | | | | | |
| | | | |
Washington State EDFA Waste Management 144A | | | 2.13 | | | | 6-1-2020 | | | | 2,500,000 | | | | 2,502,300 | |
| | | | | | | | | | | | | | | | |
| |
| | | | 38,024,849 | |
| | | | | | | | | | | | | | | | |
| | | | |
West Virginia: 0.28% | | | | | | | | | | | | | | | | |
| | | | |
| Tax Revenue: 0.05% | | | | | | | | | | | | |
| | | | |
Monongalia County WV Commission Special District University Town Center Series A 144A | | | 4.50 | | | | 6-1-2027 | | | | 1,195,000 | | | | 1,246,170 | |
| | | | | | | | | | | | | | | | |
| | | | |
| Utilities Revenue: 0.23% | | | | | | | | | | | | |
| | | | |
West Virginia EDA Solid Waste Disposal Facilities Wheeling Power Company Mitchell Project Series A | | | 3.00 | | | | 6-1-2037 | | | | 5,450,000 | | | | 5,527,608 | |
| | | | | | | | | | | | | | | | |
| |
| | | | 6,773,778 | |
| | | | | | | | | | | | | | | | |
| | | | |
Wisconsin: 4.49% | | | | | | | | | | | | | | | | |
| | | | |
| Airport Revenue: 0.07% | | | | | | | | | | | | |
| | | | |
Wisconsin PFA Airport Series C | | | 5.00 | | | | 7-1-2022 | | | | 1,605,000 | | | | 1,692,376 | |
| | | | | | | | | | | | | | | | |
| | | | |
| Education Revenue: 0.21% | | | | | | | | | | | | |
| | | | |
Corvian County WI Community School Revenue 144A | | | 4.25 | | | | 6-15-2029 | | | | 1,085,000 | | | | 1,113,243 | |
| | | | |
Milwaukee WI RDA Science Education Consortium Incorporated Project Series A | | | 4.75 | | | | 8-1-2023 | | | | 830,000 | | | | 862,644 | |
| | | | |
Pine Lake WI PFA Preparatory Series 2015 144A | | | 4.35 | | | | 3-1-2025 | | | | 2,120,000 | | | | 2,194,115 | |
| | | | |
Wisconsin PFA Roseman University of Health Sciences Project Series 2012 | | | 5.00 | | | | 4-1-2022 | | | | 890,000 | | | | 923,740 | |
| |
| | | | 5,093,742 | |
| | | | | | | | | | | | | | | | |
| | | | |
| GO Revenue: 1.60% | | | | | | | | | | | | |
| | | | |
Eau Claire WI Area School District Refunding Bonds | | | 5.00 | | | | 4-1-2022 | | | | 1,245,000 | | | | 1,364,495 | |
| | | | |
Eau Claire WI Area School District Refunding Bonds | | | 5.00 | | | | 4-1-2023 | | | | 1,860,000 | | | | 2,098,489 | |
| | | | |
Eau Claire WI Area School District Refunding Bonds | | | 5.00 | | | | 4-1-2024 | | | | 1,000,000 | | | | 1,159,910 | |
| | | | |
Wisconsin State Series A | | | 4.00 | | | | 5-1-2030 | | | | 12,720,000 | | | | 13,525,430 | |
| | | | |
Wisconsin State Series B | | | 5.00 | | | | 5-1-2031 | | | | 12,230,000 | | | | 14,723,452 | |
| | | | |
Wisconsin State Series B | | | 5.00 | | | | 5-1-2034 | | | | 5,000,000 | | | | 5,863,800 | |
| |
| | | | 38,735,576 | |
| | | | | | | | | | | | | | | | |
| | | | |
| Health Revenue: 0.85% | | | | | | | | | | | | |
| | | | |
Wisconsin HEFA Bellin Memorial Hospital Series 2015 | | | 3.00 | | | | 12-1-2020 | | | | 745,000 | | | | 759,624 | |
| | | | |
Wisconsin HEFA Bellin Memorial Hospital Series 2015 | | | 5.00 | | | | 12-1-2022 | | | | 755,000 | | | | 839,152 | |
| | | | |
Wisconsin HEFA Health Care Series 2010A | | | 5.00 | | | | 6-1-2030 | | | | 14,330,000 | | | | 14,803,320 | |
| | | | |
Wisconsin PFA Bancroft Neurohealth Project Series A 144A | | | 4.00 | | | | 6-1-2020 | | | | 635,000 | | | | 643,026 | |
Wells Fargo Strategic Municipal Bond Fund | 33
Portfolio of investments—June 30, 2019
| | | | | | | | | | | | | | | | |
| | | Interest rate | | | Maturity date | | | Principal | | | Value | |
| | | | |
| Health Revenue (continued) | | | | | | | | | | | | |
| | | | |
Wisconsin PFA Bancroft Neurohealth Project Series A 144A | | | 4.00 | % | | | 6-1-2021 | | | $ | 1,370,000 | | | $ | 1,399,113 | |
| | | | |
Wisconsin State HEFA Ascension Health Credit Group Series A | | | 4.00 | | | | 11-15-2034 | | | | 2,000,000 | | | | 2,183,520 | |
| |
| | | | 20,627,755 | |
| | | | | | | | | | | | | | | | |
| | | | |
| Housing Revenue: 0.07% | | | | | | | | | | | | |
| | | | |
Wisconsin Housing & EDA President House Project (Associated Trust Company NA LOC) ø | | | 2.00 | | | | 8-1-2046 | | | | 1,585,000 | | | | 1,585,000 | |
| | | | | | | | | | | | | | | | |
| | | | |
| Miscellaneous Revenue: 0.23% | | | | | | | | | | | | |
| | | | |
Monona WI Anticipation Notes Series D | | | 3.63 | | | | 9-1-2022 | | | | 1,925,000 | | | | 1,963,635 | |
| | | | |
Wisconsin State Series 2 | | | 5.00 | | | | 11-1-2029 | | | | 3,000,000 | | | | 3,641,550 | |
| |
| | | | 5,605,185 | |
| | | | | | | | | | | | | | | | |
| | | | |
| Tax Revenue: 1.12% | | | | | | | | | | | | |
| | | | |
Wisconsin State General Fund Annual Appropriations Series A | | | 5.00 | | | | 5-1-2028 | | | | 11,775,000 | | | | 14,695,553 | |
| | | | |
Wisconsin State General Fund Annual Appropriations Series A | | | 5.00 | | | | 5-1-2029 | | | | 10,000,000 | | | | 12,409,700 | |
| |
| | | | 27,105,253 | |
| | | | | | | | | | | | | | | | |
| | | | |
| Water & Sewer Revenue: 0.34% | | | | | | | | | | | | |
| | | | |
Wisconsin Clean Water Refunding Bonds Series 2012 | | | 5.00 | | | | 6-1-2023 | | | | 310,000 | | | | 353,245 | |
| | | | |
Wisconsin Clean Water Refunding Bonds Series 2013 | | | 5.00 | | | | 6-1-2024 | | | | 2,285,000 | | | | 2,603,758 | |
| | | | |
Wisconsin Clean Water Refunding Bonds Series 2015 | | | 5.00 | | | | 6-1-2025 | | | | 3,045,000 | | | | 3,568,496 | |
| | | | |
Wisconsin Clean Water Refunding Bonds Series 2015 | | | 5.00 | | | | 6-1-2026 | | | | 1,525,000 | | | | 1,787,178 | |
| |
| | | | 8,312,677 | |
| | | | | | | | | | | | | | | | |
| |
| | | | 108,757,564 | |
| | | | | | | | | | | | | | | | |
| |
Total Municipal Obligations (Cost $2,344,250,018) | | | | 2,400,271,683 | |
| | | | | | | | | | | | | | | | |
| | | | |
| | | | | | | | | | | | | | | | |
| | | | | | | | | Shares | | | | |
Closed End Municipal Bond Funds: 0.41% | | | | | | | | | | | | | | | | |
| | | | |
| California: 0.41% | | | | | | | | | | | | |
| | | | |
Nuveen California AMT-Free Quality Municipal Income Fund Variable Rate Demand Preferred Shares Series A 2.20% 144A | | | | | | | | | | | 10,000,000 | | | | 10,000,000 | |
| | | | | | | | | | | | | | | | |
| |
Total Closed End Municipal Bond Funds (Cost $10,000,000) | | | | 10,000,000 | |
| | | | | | | | | | | | | | | | |
| | | | |
| | | | | | | | | | | | | | | | |
| | | Yield | | | | | | | | | | |
Short-Term Investments: 0.09% | | | | | | | | | | | | | | | | |
| | | | |
| Investment Companies: 0.04% | | | | | | | | | | | | |
| | | | |
Wells Fargo Municipal Cash Management Money Market Fund Institutional Class (l)(u) | | | 1.82 | | | | | | | | 836,527 | | | | 837,029 | |
| | | | | | | | | | | | | | | | |
| | | | |
| | | | | | | | | | | | | | | | |
| | | Interest rate | | | | | | Principal | | | | |
| U.S. Treasury Securities: 0.05% | | | | | | | | | | | | |
| | | | |
U.S. Treasury Bill (z) | | | 2.18 | | | | 9-12-2019 | | | $ | 1,215,000 | | | | 1,209,912 | |
| | | | | | | | | | | | | | | | |
| |
Total Short-Term Investments (Cost $2,046,429) | | | | 2,046,941 | |
| | | | | | | | | | | | | | | | |
| | | | | | | | |
| Total investments in securities (Cost $2,356,296,447) | | | 99.69 | % | | | 2,412,318,624 | |
| | |
Other assets and liabilities, net | | | 0.31 | | | | 7,497,347 | |
| | | | | | | | |
| Total net assets | | | 100.00 | % | | $ | 2,419,815,971 | |
| | | | | | | | |
34 | Wells Fargo Strategic Municipal Bond Fund
Portfolio of investments—June 30, 2019
| 144A | The security may be resold in transactions exempt from registration, normally to qualified institutional buyers, pursuant to Rule 144A under the Securities Act of 1933. |
| ø | Variable rate demand notes are subject to a demand feature which reduces the effective maturity. The maturity date shown represents the final maturity date of the security. The interest rate is determined and reset by the issuer daily, weekly, or monthly depending upon the terms of the security. The rate shown is the rate in effect at period end. |
| ± | Variable rate investment. The rate shown is the rate in effect at period end. |
| ¤ | The security is issued in zero coupon form with no periodic interest payments. |
| (m) | The security is an auction-rate security which has an interest rate that resets at predetermined short-term intervals through a Dutch auction. The rate shown is the rate in effect at period end. |
| %% | The security is purchased on a when-issued basis. |
| øø | The interest rate is determined and reset by the issuer periodically depending upon the terms of the security. The rate shown is the rate in effect at period end. |
| ## | All or a portion of this security is segregated for when-issued securities. |
| (l) | The issuer of the security is an affiliated person of the Fund as defined in the Investment Company Act of 1940. |
| (u) | The rate represents the 7-day annualized yield at period end. |
| (z) | Zero coupon security. The rate represents the current yield to maturity. |
Abbreviations:
| AGC | Assured Guaranty Corporation |
| AGM | Assured Guaranty Municipal |
| Ambac | Ambac Financial Group Incorporated |
| AMT | Alternative minimum tax |
| CAB | Capital appreciation bond |
| CDA | Community Development Authority |
| ECFA | Educational & Cultural Facilities Authority |
| EDA | Economic Development Authority |
| EDFA | Economic Development Finance Authority |
| FHA | Federal Housing Administration |
| FHLMC | Federal Home Loan Mortgage Corporation |
| FNMA | Federal National Mortgage Association |
| GNMA | Government National Mortgage Association |
| HCFR | Healthcare facilities revenue |
| HEFA | Health & Educational Facilities Authority |
| HEFAR | Higher Education Facilities Authority Revenue |
| HFA | Housing Finance Authority |
| HFFA | Health Facilities Financing Authority |
| HUD | Department of Housing and Urban Development |
| IDA | Industrial Development Authority |
| LIBOR | London Interbank Offered Rate |
| National | National Public Finance Guarantee Corporation |
| PCFA | Pollution Control Financing Authority |
| PCR | Pollution control revenue |
| PFA | Public Finance Authority |
| RDA | Redevelopment Authority |
| RIB | Residual Interest Bond |
| SIFMA | Securities Industry and Financial Markets Association |
| SOFR | Secured Overnight Financing Rate |
| SPA | Standby purchase agreement |
| TTFA | Transportation Trust Fund Authority |
Wells Fargo Strategic Municipal Bond Fund | 35
Portfolio of investments—June 30, 2019
Investments in Affiliates
An affiliated investment is an investment in which the Fund owns at least 5% of the outstanding voting shares of the issuer or as a result of other relationships, such as the Fund and the issuer having the same investment manager. Transactions with issuers that were either affiliated persons of the Fund at the beginning of the period or the end of the period were as follows:
| | | | | | | | | | | | | | | | | | | | | | | | | | | | | | | | | | | | |
| | | Shares,
beginning of
period | | | Shares
purchased | | | Shares sold | | | Shares,
end of
period | | | Net
realized
gains
(losses) | | | Net
change in
unrealized
gains
(losses) | | | Income
from
affiliated
securities | | | Value,
end of period | | | % of net
assets | |
Short-Term Investments | | | | | | | | | | | | | | | | | | | | | | | | | | | | | | | | | | | | |
Investment Companies | | | | | | | | | | | | | | | | | | | | | | | | | | | | | | | | | | | | |
Wells Fargo Municipal Cash Management Money Market Fund Institutional Class | | | 10,804,761 | | | | 662,118,561 | | | | 672,086,795 | | | | 836,527 | | | $ | (7,099 | ) | | $ | 167 | | | $ | 264,018 | | | $ | 837,029 | | | | 0.04 | % |
36 | Wells Fargo Strategic Municipal Bond Fund
Statement of assets and liabilities—June 30, 2019
| | | | |
| | | | |
| |
Assets | | | | |
Investments in unaffiliated securities, at value (cost $2,355,459,585) | | $ | 2,411,481,595 | |
Investments in affiliated securities, at value (cost $836,862) | | | 837,029 | |
Receivable for investments sold | | | 11,680,724 | |
Receivable for Fund shares sold | | | 4,606,806 | |
Receivable for interest | | | 20,514,332 | |
Prepaid expenses and other assets | | | 30,719 | |
| | | | |
Total assets | | | 2,449,151,205 | |
| | | | |
| |
Liabilities | | | | |
Payable for investments purchased | | | 23,976,015 | |
Payable for Fund shares redeemed | | | 3,343,548 | |
Management fee payable | | | 710,892 | |
Dividends payable | | | 634,774 | |
Administration fees payable | | | 198,636 | |
Distribution fee payable | | | 50,979 | |
Trustees’ fees and expenses payable | | | 1,369 | |
Accrued expenses and other liabilities | | | 419,021 | |
| | | | |
Total liabilities | | | 29,335,234 | |
| | | | |
Total net assets | | $ | 2,419,815,971 | |
| | | | |
| |
Net assets consist of | | | | |
Paid-in capital | | $ | 2,361,965,882 | |
Total distributable earnings | | | 57,850,089 | |
| | | | |
Total net assets | | $ | 2,419,815,971 | |
| | | | |
| |
Computation of net asset value and offering price per share | | | | |
Net assets – Class A | | $ | 528,004,192 | |
Shares outstanding – Class A1 | | | 57,751,657 | |
Net asset value per share – Class A | | | $9.14 | |
Maximum offering price per share – Class A2 | | | $9.52 | |
Net assets – Class C | | $ | 82,330,817 | |
Shares outstanding – Class C1 | | | 8,973,753 | |
Net asset value per share – Class C | | | $9.17 | |
Net assets – Class R6 | | $ | 13,290,939 | |
Shares outstanding – Class R61 | | | 1,453,320 | |
Net asset value per share – Class R6 | | | $9.15 | |
Net assets – Administrator Class | | $ | 149,096,979 | |
Shares outstanding – Administrator Class1 | | | 16,316,828 | |
Net asset value per share – Administrator Class | | | $9.14 | |
Net assets – Institutional Class | | $ | 1,647,093,044 | |
Shares outstanding – Institutional Class1 | | | 180,198,017 | |
Net asset value per share – Institutional Class | | | $9.14 | |
| 1 | The Fund has an unlimited number of authorized shares. |
| 2 | Maximum offering price is computed as 100/96 of net asset value. On investments of $50,000 or more, the offering price is reduced. |
The accompanying notes are an integral part of these financial statements.
Wells Fargo Strategic Municipal Bond Fund | 37
Statement of operations—year ended June 30, 2019
| | | | |
| | | | |
| |
Investment income | | | | |
Interest | | $ | 59,219,957 | |
Income from affiliated securities | | | 264,018 | |
| | | | |
Total investment income | | | 59,483,975 | |
| | | | |
| |
Expenses | | | | |
Management fee | | | 7,822,246 | |
Administration fees | | | | |
Class A | | | 783,119 | |
Class C | | | 160,863 | |
Class R6 | | | 2,420 | 1 |
Administrator Class | | | 163,737 | |
Institutional Class | | | 1,093,028 | |
Shareholder servicing fees | | | | |
Class A | | | 1,223,623 | |
Class C | | | 251,348 | |
Administrator Class | | | 403,596 | |
Distribution fee | | | | |
Class C | | | 754,045 | |
Custody and accounting fees | | | 90,057 | |
Professional fees | | | 58,172 | |
Registration fees | | | 158,108 | |
Shareholder report expenses | | | 67,610 | |
Trustees’ fees and expenses | | | 21,894 | |
Other fees and expenses | | | 34,815 | |
| | | | |
Total expenses | | | 13,088,681 | |
Less: Fee waivers and/or expense reimbursements | | | (92,378 | ) |
| | | | |
Net expenses | | | 12,996,303 | |
| | | | |
Net investment income | | | 46,487,672 | |
| | | | |
| |
Realized and unrealized gains (losses) on investments | | | | |
Net realized gains (losses) on: | | | | |
Unaffiliated securities | | | 4,302,860 | |
Affiliated securities | | | (7,099 | ) |
Futures contracts | | | 1,680,192 | |
| | | | |
Net realized gains on investments | | | 5,975,953 | |
| | | | |
| |
Net change in unrealized gains (losses) on: | | | | |
Unaffiliated securities | | | 45,705,442 | |
Affiiliated securities | | | 167 | |
| | | | |
Net change in unrealized gains (losses) on investments | | | 45,705,609 | |
| | | | |
Net realized and unrealized gains (losses) on investments | | | 51,681,562 | |
| | | | |
Net increase in net assets resulting from operations | | $ | 98,169,234 | |
| | | | |
| 1 | For the period from July 31, 2018 (commencement of class operations) to June 30, 2019 |
The accompanying notes are an integral part of these financial statements.
38 | Wells Fargo Strategic Municipal Bond Fund
Statement of changes in net assets
| | | | | | | | | | | | | | | | |
| | | Year ended June 30, 2019 | | | Year ended June 30, 20181 | |
| | | | |
Operations | | | | | | | | | | | | | | | | |
Net investment income | | | | | | $ | 46,487,672 | | | | | | | $ | 36,723,411 | |
Net realized gains (losses) on investments | | | | | | | 5,975,953 | | | | | | | | (1,654,315 | ) |
Net change in unrealized gains (losses) on investments | | | | | | | 45,705,609 | | | | | | | | 4,181,203 | |
| | | | |
Net increase in net assets resulting from operations | | | | | | | 98,169,234 | | | | | | | | 39,250,299 | |
| | | | |
| | | | |
Distributions to shareholders from net investment income and net realized gains | | | | | | | | | | | | | | | | |
Class A | | | | | | | (9,763,010 | ) | | | | | | | (10,041,868 | ) |
Class C | | | | | | | (1,245,785 | ) | | | | | | | (1,478,818 | ) |
Class R6 | | | | | | | (193,619 | )2 | | | | | | | N/A | |
Administrator Class | | | | | | | (3,446,885 | ) | | | | | | | (4,161,841 | ) |
Institutional Class | | | | | | | (31,841,170 | ) | | | | | | | (25,473,493 | ) |
| | | | |
Total distributions to shareholders | | | | | | | (46,490,469 | ) | | | | | | | (41,156,020 | ) |
| | | | |
| | | | |
Capital share transactions | | | Shares | | | | | | | | Shares | | | | | |
Proceeds from shares sold | | | | | | | | | | | | | | | | |
Class A | | | 19,706,942 | | | | 177,435,241 | | | | 14,183,216 | | | | 126,858,667 | |
Class C | | | 1,344,541 | | | | 12,107,980 | | | | 1,262,039 | | | | 11,336,254 | |
Class R6 | | | 2,320,780 | 2 | | | 20,830,779 | 2 | | | N/A | | | | N/A | |
Administrator Class | | | 5,609,233 | | | | 50,252,974 | | | | 8,016,839 | | | | 71,728,421 | |
Institutional Class | | | 100,346,510 | | | | 902,217,837 | | | | 65,554,521 | | | | 586,336,407 | |
| | | | |
| | | | | | | 1,162,844,811 | | | | | | | | 796,259,749 | |
| | | | |
Reinvestment of distributions | | | | | | | | | | | | | | | | |
Class A | | | 995,585 | | | | 8,956,377 | | | | 1,025,264 | | | | 9,170,102 | |
Class C | | | 120,097 | | | | 1,082,404 | | | | 145,058 | | | | 1,302,030 | |
Administrator Class | | | 373,089 | | | | 3,350,926 | | | | 455,559 | | | | 4,072,557 | |
Institutional Class | | | 2,885,056 | | | | 25,969,024 | | | | 2,335,413 | | | | 20,883,398 | |
| | | | |
| | | | | | | 39,358,731 | | | | | | | | 35,428,087 | |
| | | | |
Payment for shares redeemed | | | | | | | | | | | | | | | | |
Class A | | | (17,937,947 | ) | | | (161,039,725 | ) | | | (21,867,476 | ) | | | (195,482,366 | ) |
Class C | | | (5,379,557 | ) | | | (48,528,767 | ) | | | (3,900,702 | ) | | | (35,016,106 | ) |
Class R6 | | | (867,460 | )2 | | | (7,804,378 | )2 | | | N/A | | | | N/A | |
Administrator Class | | | (11,142,539 | ) | | | (99,719,756 | ) | | | (8,841,309 | ) | | | (78,960,801 | ) |
Institutional Class | | | (60,128,198 | ) | | | (539,512,255 | ) | | | (46,407,316 | ) | | | (414,849,938 | ) |
| | | | |
| | | | | | | (856,604,881 | ) | | | | | | | (724,309,211 | ) |
| | | | |
Net increase in net assets resulting from capital share transactions | | | | | | | 345,598,661 | | | | | | | | 107,378,625 | |
| | | | |
Total increase in net assets | | | | | | | 397,277,426 | | | | | | | | 105,472,904 | |
| | | | |
| | | | |
Net assets | | | | | | | | | | | | | | | | |
Beginning of period | | | | | | | 2,022,538,545 | | | | | | | | 1,917,065,641 | |
| | | | |
End of period | | | | | | $ | 2,419,815,971 | | | | | | | $ | 2,022,538,545 | |
| | | | |
| 1 | Effective for all filings after November 4, 2018, the SEC prospectively eliminated the requirement to parenthetically disclose undistributed net investment income at the end of the period and permitted the aggregation of distributions, with the exception of tax basis returns of capital. Overdistributed net investment income at June 30, 2018 was $260,353. The disaggregated distributions information for the year ended June 30, 2018 is included in Note 8,Distributions to Shareholders, in the notes to the financial statements. |
| 2 | For the period from July 31, 2018 (commencement of class operations) to June 30, 2019 |
The accompanying notes are an integral part of these financial statements.
Wells Fargo Strategic Municipal Bond Fund | 39
Financial highlights
(For a share outstanding throughout each period)
| | | | | | | | | | | | | | | | | | | | |
| | | Year ended June 30 | |
| CLASS A | | 2019 | | | 2018 | | | 2017 | | | 2016 | | | 2015 | |
Net asset value, beginning of period | | | $8.93 | | | | $8.94 | | | | $9.06 | | | | $8.90 | | | | $9.03 | |
Net investment income | | | 0.18 | | | | 0.15 | | | | 0.13 | | | | 0.14 | | | | 0.10 | |
Net realized and unrealized gains (losses) on investments | | | 0.21 | | | | 0.01 | | | | (0.07 | ) | | | 0.18 | | | | (0.05 | ) |
| | | | | | | | | | | | | | | | | | | | |
Total from investment operations | | | 0.39 | | | | 0.16 | | | | 0.06 | | | | 0.32 | | | | 0.05 | |
Distributions to shareholders from | | | | | | | | | | | | | | | | | | | | |
Net investment income | | | (0.18 | ) | | | (0.15 | ) | | | (0.13 | ) | | | (0.14 | ) | | | (0.10 | ) |
Net realized gains | | | 0.00 | | | | (0.02 | ) | | | (0.05 | ) | | | (0.02 | ) | | | (0.08 | ) |
| | | | | | | | | | | | | | | | | | | | |
Total distributions to shareholders | | | (0.18 | ) | | | (0.17 | ) | | | (0.18 | ) | | | (0.16 | ) | | | (0.18 | ) |
Net asset value, end of period | | | $9.14 | | | | $8.93 | | | | $8.94 | | | | $9.06 | | | | $8.90 | |
Total return1 | | | 4.41 | % | | | 1.82 | % | | | 0.65 | % | | | 3.67 | % | | | 0.56 | % |
Ratios to average net assets (annualized) | | | | | | | | | | | | | | | | | | | | |
Gross expenses | | | 0.80 | % | | | 0.82 | % | | | 0.81 | % | | | 0.81 | % | | | 0.81 | % |
Net expenses | | | 0.80 | % | | | 0.82 | % | | | 0.81 | % | | | 0.81 | % | | | 0.81 | % |
Net investment income | | | 1.99 | % | | | 1.69 | % | | | 1.45 | % | | | 1.53 | % | | | 1.16 | % |
Supplemental data | | | | | | | | | | | | | | | | | | | | |
Portfolio turnover rate | | | 29 | % | | | 33 | % | | | 31 | % | | | 53 | % | | | 39 | % |
Net assets, end of period (000s omitted) | | | $528,004 | | | | $491,128 | | | | $550,965 | | | | $726,135 | | | | $635,610 | |
| 1 | Total return calculations do not include any sales charges. |
The accompanying notes are an integral part of these financial statements.
40 | Wells Fargo Strategic Municipal Bond Fund
Financial highlights
(For a share outstanding throughout each period)
| | | | | | | | | | | | | | | | | | | | |
| | | Year ended June 30 | |
| CLASS C | | 2019 | | | 2018 | | | 2017 | | | 2016 | | | 2015 | |
Net asset value, beginning of period | | | $8.96 | | | | $8.97 | | | | $9.09 | | | | $8.94 | | | | $9.06 | |
Net investment income | | | 0.11 | 1 | | | 0.08 | 1 | | | 0.07 | | | | 0.07 | | | | 0.04 | |
Net realized and unrealized gains (losses) on investments | | | 0.21 | | | | 0.01 | | | | (0.07 | ) | | | 0.17 | | | | (0.04 | ) |
| | | | | | | | | | | | | | | | | | | | |
Total from investment operations | | | 0.32 | | | | 0.09 | | | | 0.00 | | | | 0.24 | | | | 0.00 | |
Distributions to shareholders from | | | | | | | | | | | | | | | | | | | | |
Net investment income | | | (0.11 | ) | | | (0.08 | ) | | | (0.07 | ) | | | (0.07 | ) | | | (0.04 | ) |
Net realized gains | | | 0.00 | | | | (0.02 | ) | | | (0.05 | ) | | | (0.02 | ) | | | (0.08 | ) |
| | | | | | | | | | | | | | | | | | | | |
Total distributions to shareholders | | | (0.11 | ) | | | (0.10 | ) | | | (0.12 | ) | | | (0.09 | ) | | | (0.12 | ) |
Net asset value, end of period | | | $9.17 | | | | $8.96 | | | | $8.97 | | | | $9.09 | | | | $8.94 | |
Total return2 | | | 3.62 | % | | | 1.06 | % | | | (0.10 | )% | | | 2.78 | % | | | (0.08 | )% |
Ratios to average net assets (annualized) | | | | | | | | | | | | | | | | | | | | |
Gross expenses | | | 1.55 | % | | | 1.57 | % | | | 1.56 | % | | | 1.56 | % | | | 1.56 | % |
Net expenses | | | 1.55 | % | | | 1.57 | % | | | 1.56 | % | | | 1.56 | % | | | 1.56 | % |
Net investment income | | | 1.24 | % | | | 0.94 | % | | | 0.72 | % | | | 0.78 | % | | | 0.40 | % |
Supplemental data | | | | | | | | | | | | | | | | | | | | |
Portfolio turnover rate | | | 29 | % | | | 33 | % | | | 31 | % | | | 53 | % | | | 39 | % |
Net assets, end of period (000s omitted) | | | $82,331 | | | | $115,518 | | | | $137,955 | | | | $156,560 | | | | $152,882 | |
| 1 | Calculated based upon average shares outstanding |
| 2 | Total return calculations do not include any sales charges. |
The accompanying notes are an integral part of these financial statements.
Wells Fargo Strategic Municipal Bond Fund | 41
Financial highlights
(For a share outstanding throughout the period)
| | | | |
| CLASS R6 | | Year ended
June 30, 20191 | |
Net asset value, beginning of period | | | $8.94 | |
Net investment income | | | 0.20 | |
Net realized and unrealized gains on investments | | | 0.21 | |
| | | | |
Total from investment operations | | | 0.41 | |
Distributions to shareholders from | | | | |
Net investment income | | | (0.20 | ) |
Net asset value, end of period | | | $9.15 | |
Total return2 | | | 4.61 | % |
Ratios to average net assets (annualized) | | | | |
Gross expenses | | | 0.41 | % |
Net expenses | | | 0.41 | % |
Net investment income | | | 2.39 | % |
Supplemental data | | | | |
Portfolio turnover rate | | | 29 | % |
Net assets, end of period (000s omitted) | | | $13,291 | |
| 1 | For the period from July 31, 2018 (commencement of class operations) to June 30, 2019 |
| 2 | Returns for periods of less than one year are not annualized. |
The accompanying notes are an integral part of these financial statements.
42 | Wells Fargo Strategic Municipal Bond Fund
Financial highlights
(For a share outstanding throughout each period)
| | | | | | | | | | | | | | | | | | | | |
| | | Year ended June 30 | |
| ADMINISTRATOR CLASS | | 2019 | | | 2018 | | | 2017 | | | 2016 | | | 2015 | |
Net asset value, beginning of period | | | $8.93 | | | | $8.93 | | | | $9.06 | | | | $8.90 | | | | $9.02 | |
Net investment income | | | 0.19 | | | | 0.16 | | | | 0.14 | | | | 0.15 | | | | 0.12 | |
Net realized and unrealized gains (losses) on investments | | | 0.21 | | | | 0.02 | | | | (0.08 | ) | | | 0.18 | | | | (0.04 | ) |
| | | | | | | | | | | | | | | | | | | | |
Total from investment operations | | | 0.40 | | | | 0.18 | | | | 0.06 | | | | 0.33 | | | | 0.08 | |
Distributions to shareholders from | | | | | | | | | | | | | | | | | | | | |
Net investment income | | | (0.19 | ) | | | (0.16 | ) | | | (0.14 | ) | | | (0.15 | ) | | | (0.12 | ) |
Net realized gains | | | 0.00 | | | | (0.02 | ) | | | (0.05 | ) | | | (0.02 | ) | | | (0.08 | ) |
| | | | | | | | | | | | | | | | | | | | |
Total distributions to shareholders | | | (0.19 | ) | | | (0.18 | ) | | | (0.19 | ) | | | (0.17 | ) | | | (0.20 | ) |
Net asset value, end of period | | | $9.14 | | | | $8.93 | | | | $8.93 | | | | $9.06 | | | | $8.90 | |
Total return | | | 4.53 | % | | | 2.07 | % | | | 0.67 | % | | | 3.80 | % | | | 0.80 | % |
Ratios to average net assets (annualized) | | | | | | | | | | | | | | | | | | | | |
Gross expenses | | | 0.73 | % | | | 0.76 | % | | | 0.75 | % | | | 0.74 | % | | | 0.75 | % |
Net expenses | | | 0.68 | % | | | 0.68 | % | | | 0.68 | % | | | 0.68 | % | | | 0.68 | % |
Net investment income | | | 2.10 | % | | | 1.80 | % | | | 1.51 | % | | | 1.66 | % | | | 1.28 | % |
Supplemental data | | | | | | | | | | | | | | | | | | | | |
Portfolio turnover rate | | | 29 | % | | | 33 | % | | | 31 | % | | | 53 | % | | | 39 | % |
Net assets, end of period (000s omitted) | | | $149,097 | | | | $191,723 | | | | $195,138 | | | | $408,846 | | | | $529,945 | |
The accompanying notes are an integral part of these financial statements.
Wells Fargo Strategic Municipal Bond Fund | 43
Financial highlights
(For a share outstanding throughout each period)
| | | | | | | | | | | | | | | | | | | | |
| | | Year ended June 30 | |
| INSTITUTIONAL CLASS | | 2019 | | | 2018 | | | 2017 | | | 2016 | | | 2015 | |
Net asset value, beginning of period | | | $8.93 | | | | $8.94 | | | | $9.06 | | | | $8.90 | | | | $9.03 | |
Net investment income | | | 0.21 | | | | 0.18 | | | | 0.16 | | | | 0.17 | | | | 0.13 | |
Net realized and unrealized gains (losses) on investments | | | 0.21 | | | | 0.01 | | | | (0.07 | ) | | | 0.18 | | | | (0.05 | ) |
| | | | | | | | | | | | | | | | | | | | |
Total from investment operations | | | 0.42 | | | | 0.19 | | | | 0.09 | | | | 0.35 | | | | 0.08 | |
Distributions to shareholders from | | | | | | | | | | | | | | | | | | | | |
Net investment income | | | (0.21 | ) | | | (0.18 | ) | | | (0.16 | ) | | | (0.17 | ) | | | (0.13 | ) |
Net realized gains | | | 0.00 | | | | (0.02 | ) | | | (0.05 | ) | | | (0.02 | ) | | | (0.08 | ) |
| | | | | | | | | | | | | | | | | | | | |
Total distributions to shareholders | | | (0.21 | ) | | | (0.20 | ) | | | (0.21 | ) | | | (0.19 | ) | | | (0.21 | ) |
Net asset value, end of period | | | $9.14 | | | | $8.93 | | | | $8.94 | | | | $9.06 | | | | $8.90 | |
Total return | | | 4.75 | % | | | 2.16 | % | | | 0.99 | % | | | 4.02 | % | | | 0.89 | % |
Ratios to average net assets (annualized) | | | | | | | | | | | | | | | | | | | | |
Gross expenses | | | 0.47 | % | | | 0.49 | % | | | 0.48 | % | | | 0.48 | % | | | 0.48 | % |
Net expenses | | | 0.47 | % | | | 0.48 | % | | | 0.48 | % | | | 0.48 | % | | | 0.48 | % |
Net investment income | | | 2.32 | % | | | 2.05 | % | | | 1.85 | % | | | 1.85 | % | | | 1.49 | % |
Supplemental data | | | | | | | | | | | | | | | | | | | | |
Portfolio turnover rate | | | 29 | % | | | 33 | % | | | 31 | % | | | 53 | % | | | 39 | % |
Net assets, end of period (000s omitted) | | | $1,647,093 | | | | $1,224,170 | | | | $1,033,007 | | | | $608,995 | | | | $319,313 | |
The accompanying notes are an integral part of these financial statements.
44 | Wells Fargo Strategic Municipal Bond Fund
Notes to financial statements
1. ORGANIZATION
Wells Fargo Funds Trust (the “Trust”), a Delaware statutory trust organized on March 10, 1999, is an open-end management investment company registered under the Investment Company Act of 1940, as amended (the “1940 Act”). As an investment company, the Trust follows the accounting and reporting guidance in Financial Accounting Standards Board (“FASB”) Accounting Standards Codification Topic 946, Financial Services – Investment Companies. These financial statements report on the Wells Fargo Strategic Municipal Bond Fund (the “Fund”) which is a diversified series of the Trust.
2. SIGNIFICANT ACCOUNTING POLICIES
The following significant accounting policies, which are consistently followed in the preparation of the financial statements of the Fund, are in conformity with U.S. generally accepted accounting principles which require management to make estimates and assumptions that affect the reported amounts of assets and liabilities, disclosure of contingent assets and liabilities at the date of the financial statements, and the reported amounts of revenues and expenses during the reporting period. Actual results could differ from those estimates.
Securities valuation
All investments are valued each business day as of the close of regular trading on the New York Stock Exchange (generally 4 p.m. Eastern Time), although the Fund may deviate from this calculation time under unusual or unexpected circumstances.
Debt securities are valued at the evaluated bid price provided by an independent pricing service (e.g. taking into account various factors, including yields, maturities, or credit ratings) or, if a reliable price is not available, the quoted bid price from an independent broker-dealer.
Futures contracts that are listed on a foreign or domestic exchange or market are valued at the official closing price or, if none, the last sales price.
Swap contracts are valued at the evaluated price provided by an independent pricing service or, if a reliable price is not available, the quoted bid price from an independent broker-dealer.
Investments in registered open-end investment companies are valued at net asset value.
Investments which are not valued using any of the methods discussed above are valued at their fair value, as determined in good faith by the Board of Trustees of the Fund. The Board of Trustees has established a Valuation Committee comprised of the Trustees and has delegated to it the authority to take any actions regarding the valuation of portfolio securities that the Valuation Committee deems necessary or appropriate, including determining the fair value of portfolio securities, unless the determination has been delegated to the Wells Fargo Asset Management Pricing Committee at Wells Fargo Funds Management, LLC (“Funds Management”). The Board of Trustees retains the authority to make or ratify any valuation decisions or approve any changes to the Valuation Procedures as it deems appropriate. On a quarterly basis, the Board of Trustees receives reports on any valuation actions taken by the Valuation Committee or the Wells Fargo Asset Management Pricing Committee which may include items for ratification.
When-issued transactions
The Fund may purchase securities on a forward commitment or when-issued basis. The Fund records a when-issued transaction on the trade date and will segregate assets in an amount at least equal in value to the Fund’s commitment to purchase when-issued securities. Securities purchased on a when-issued basis are marked-to-market daily and the Fund begins earning interest on the settlement date. Losses may arise due to changes in the market value of the underlying securities or if the counterparty does not perform under the contract.
Futures contracts
Futures contracts are agreements between the Fund and a counterparty to buy or sell a specific amount of a commodity, financial instrument or currency at specified price and on a specified date. The Fund may buy and sell futures contracts in order to gain exposure to, or protect against, changes in interest rates and is subject to interest rate risk. The primary risks associated with the use of futures contracts are the imperfect correlation between changes in market values of securities held by the Fund and the prices of futures contracts, and the possibility of an illiquid market. Futures contracts are generally entered into on a regulated futures exchange and cleared through a clearinghouse associated with the exchange. With futures contracts, there is minimal counterparty risk to the Fund since futures contracts are exchange traded and the exchange’s clearinghouse, as counterparty to all exchange traded futures, guarantees the futures contracts against default.
Upon entering into a futures contracts, the Fund is required to deposit either cash or securities (initial margin) with the broker in an amount equal to a certain percentage of the contract value. Subsequent payments (variation margin) are paid to or from
Wells Fargo Strategic Municipal Bond Fund | 45
Notes to financial statements
the broker each day equal to the daily changes in the contract value. Such payments are recorded as unrealized gains or losses and, if any, shown as variation margin receivable (payable) in the Statement of Assets and Liabilities. Should the Fund fail to make requested variation margin payments, the broker can gain access to the initial margin to satisfy the Fund’s payment obligations. When the contracts are closed, a realized gain or loss is recorded in the Statement of Operations.
Swap contracts
Swap contracts are agreements between the Fund and a counterparty to exchange a series of cash flows over a specified period. Swap agreements are privately negotiated contracts between the Fund and a counterparty in the OTC market and may be entered into as a bilateral contract (“OTC swaps”) or centrally cleared (“centrally cleared swaps”) with a central clearinghouse.
For OTC swaps, any upfront premiums paid and any upfront fees received are shown as swap premiums paid and swap premiums received, respectively, in the Statement of Assets and Liabilities and amortized over the term of the contract. The daily fluctuations in market value are recorded as unrealized gains or losses on OTC swaps in the Statement of Assets and Liabilities. Payments received or paid are recorded in the Statement of Operations as realized gains or losses, respectively. When an OTC swap is terminated, a realized gain or loss is recorded in the Statement of Operations equal to the difference between the proceeds from (or cost of) the closing transaction and the Fund’s basis in the contract, if any. Generally, the basis of the contract is the premium received or paid.
In a centrally cleared swap, immediately following execution of the swap contract, the swap contract is novated to a central counterparty (the “CCP”) and the Fund’s counterparty on the swap agreement becomes the CCP. Upon entering into a centrally cleared swap, the Fund is required to deposit an initial margin with the broker in the form of cash or securities. Securities deposited as initial margin are designated in the Portfolio of Investments and cash deposited is shown as cash segregated for centrally cleared swaps in the Statement of Assets and Liabilities. Pursuant to the contract, the Fund agrees to receive from or pay to the broker an amount of cash equal to the daily fluctuation in market value of the contract (“variation margin”). The variation margin is recorded as an unrealized gain (or loss) and shown as variation margin receivable (or payable) on centrally cleared swaps in the Statement of Assets and Liabilities. Payments received from (paid to) the counterparty, including at termination, are recorded as realized gains (losses) in the Statement of Operations.
Credit default swaps
The Fund may enter into credit default swaps for hedging or speculative purposes to provide or receive a measure of protection against default on a referenced entity, obligation or index or a basket of single-name issuers or traded indexes. An index credit default swap references all the names in the index, and if a credit event is triggered, the credit event is settled based on that name’s weight in the index. Credit default swaps are agreements in which the protection buyer pays fixed periodic payments to the protection seller in consideration for a promise from the protection seller to make a specific payment should a negative credit event take place with respect to the referenced entity (e.g., bankruptcy, failure to pay, obligation acceleration, repudiation, moratorium or restructuring).
The Fund may enter into credit default swaps as either the seller of protection or the buyer of protection. If the Fund is the buyer of protection and a credit event occurs, the Fund will either receive from the seller an amount equal to the notional amount of the swap and deliver the referenced security or underlying securities comprising the index, or receive a net settlement of cash equal to the notional amount of the swap less the recovery value of the security or underlying securities comprising the index. If the Fund is the seller of protection and a credit event occurs, the Fund will either pay the buyer an amount equal to the notional amount of the swap and take delivery of the referenced security or underlying securities comprising the index or pay a net settlement of cash equal to the notional amount of the swap less the recovery value of the security or underlying securities comprising the index.
As the seller of protection, the Fund is subject to investment exposure on the notional amount of the swap and has assumed the risk of default of the underlying security or index. As the buyer of protection, the Fund could be exposed to risks if the seller of the protection defaults on its obligation to perform, or if there are unfavorable changes in the fluctuation of interest rates.
By entering into credit default swap contracts, the Fund is exposed to credit risk. In addition, certain credit default swap contracts entered into by the Fund provide for conditions that result in events of default or termination that enable the counterparty to the agreement to cause an early termination of the transactions under those agreements.
Security transactions and income recognition
Securities transactions are recorded on a trade date basis. Realized gains or losses are recorded on the basis of identified cost.
Interest income is accrued daily and bond discounts are accreted and premiums are amortized daily. To the extent debt obligations are placed on non-accrual status, any related interest income may be reduced by writing off interest receivables
46 | Wells Fargo Strategic Municipal Bond Fund
Notes to financial statements
when the collection of all or a portion of interest has been determined to be doubtful based on consistently applied procedures and the fair value has decreased. If the issuer subsequently resumes interest payments or when the collectability of interest is reasonably assured, the debt obligation is removed from non-accrual status.
Distributions to shareholders
Distributions to shareholders from net investment income are declared daily and paid monthly. Distributions from net realized gains, if any, are recorded on the ex-dividend date and paid at least annually. Such distributions are determined in accordance with income tax regulations and may differ from U.S. generally accepted accounting principles. Dividend sources are estimated at the time of declaration. The tax character of distributions is determined as of the Fund’s fiscal year end. Therefore, a portion of the Fund’s distributions made prior to the Fund’s fiscal year end may be categorized as a tax return of capital at year end.
Federal and other taxes
The Fund intends to continue to qualify as a regulated investment company by distributing substantially all of its investment company taxable and tax-exempt income and any net realized capital gains (after reduction for capital loss carryforwards) sufficient to relieve it from all, or substantially all, federal income taxes. Accordingly, no provision for federal income taxes was required.
The Fund’s income and federal excise tax returns and all financial records supporting those returns for the prior three fiscal years are subject to examination by the federal and Delaware revenue authorities. Management has analyzed the Fund’s tax positions taken on federal, state, and foreign tax returns for all open tax years and does not believe that there are any uncertain tax positions that require recognition of a tax liability.
As of June 30, 2019, the aggregate cost of all investments for federal income tax purposes was $2,356,296,445 and the unrealized gains (losses) consisted of:
| | | | |
| |
Gross unrealized gains | | $ | 56,297,999 | |
| |
Gross unrealized losses | | | (275,820 | ) |
| |
Net unrealized gains | | $ | 56,022,179 | |
Class allocations
The separate classes of shares offered by the Fund differ principally in applicable sales charges, distribution, shareholder servicing, and administration fees. Class specific expenses are charged directly to that share class. Investment income, common fund-level expenses, and realized and unrealized gains (losses) on investments are allocated daily to each class of shares based on the relative proportion of net assets of each class.
3. FAIR VALUATION MEASUREMENTS
Fair value measurements of investments are determined within a framework that has established a fair value hierarchy based upon the various data inputs utilized in determining the value of the Fund’s investments. The three-level hierarchy gives the highest priority to unadjusted quoted prices in active markets for identical assets or liabilities (Level 1) and the lowest priority to unobservable inputs (Level 3). The Fund’s investments are classified within the fair value hierarchy based on the lowest level of input that is significant to the fair value measurement. The inputs are summarized into three broad levels as follows:
| ∎ | | Level 1 – quoted prices in active markets for identical securities |
| ∎ | | Level 2 – other significant observable inputs (including quoted prices for similar securities, interest rates, prepayment speeds, credit risk, etc.) |
| ∎ | | Level 3 – significant unobservable inputs (including the Fund’s own assumptions in determining the fair value of investments) |
The inputs or methodologies used for valuing investments in securities are not necessarily an indication of the risk associated with investing in those securities.
Wells Fargo Strategic Municipal Bond Fund | 47
Notes to financial statements
The following is a summary of the inputs used in valuing the Fund’s assets and liabilities as of June 30, 2019:
| | | | | | | | | | | | | | | | |
| | | | |
| | | Quoted prices
(Level 1) | | | Other significant
observable inputs
(Level 2) | | | Significant
unobservable inputs (Level 3) | | | Total | |
| | | | |
Assets | | | | | | | | | | | | | | | | |
Investments in: | | | | | | | | | | | | | | | | |
| | | | |
Municipal obligations | | $ | 0 | | | $ | 2,400,271,683 | | | $ | 0 | | | $ | 2,400,271,683 | |
| | | | |
Closed end municipal bond funds | | | 0 | | | | 10,000,000 | | | | 0 | | | | 10,000,000 | |
| | | | |
Short-term investments | | | | | | | | | | | | | | | | |
| | | | |
Investment companies | | | 837,029 | | | | 0 | | | | 0 | | | | 837,029 | |
| | | | |
U.S. Treasury securities | | | 1,209,912 | | | | 0 | | | | 0 | | | | 1,209,912 | |
| | | | |
Total assets | | $ | 2,046,941 | | | $ | 2,410,271,683 | | | $ | 0 | | | $ | 2,412,318,624 | |
Additional sector, industry or geographic detail is included in the Portfolio of Investments.
At June 30, 2019, the Fund did not have any transfers into/out of Level 3.
4. TRANSACTIONS WITH AFFILIATES
Management fee
Funds Management, an indirect wholly owned subsidiary of Wells Fargo & Company (“Wells Fargo”), is the manager of the Fund and provides advisory and fund-level administrative services under an investment management agreement. Under the investment management agreement, Funds Management is responsible for, among other services, implementing the investment objectives and strategies of the Fund, supervising the subadviser and providing fund-level administrative services in connection with the Fund’s operations. As compensation for its services under the investment management agreement, Funds Management is entitled to receive a management fee at the following annual rate based on the Fund’s average daily net assets:
| | | | |
| |
| Average daily net assets | | Management fee | |
| |
First $500 million | | | 0.400 | % |
| |
Next $500 million | | | 0.375 | |
| |
Next $2 billion | | | 0.350 | |
| |
Next $2 billion | | | 0.325 | |
| |
Next $5 billion | | | 0.290 | |
| |
Over $10 billion | | | 0.280 | |
For the year ended June 30, 2019, the management fee was equivalent to an annual rate of 0.37% of the Fund’s average daily net assets.
Funds Management has retained the services of a subadviser to provide daily portfolio management to the Fund. The fee for subadvisory services is borne by Funds Management. Wells Capital Management Incorporated, an affiliate of Funds Management and an indirect wholly owned subsidiary of Wells Fargo, is the subadviser to the Fund and is entitled to receive a fee from Funds Management at an annual rate starting at 0.20% and declining to 0.10% as the average daily net assets of the Fund increase.
Administration fees
Under a class-level administration agreement, Funds Management provides class-level administrative services to the Fund, which includes paying fees and expenses for services provided by the transfer agent, sub-transfer agents, omnibus account servicers and record-keepers. As compensation for its services under the class-level administration agreement, Funds Management receives an annual fee which is calculated based on the average daily net assets of each class as follows:
| | |
| |
| | | Class-level
administration fee |
| |
Class A, Class C | | 0.16% |
| |
Class R6 | | 0.03 |
| |
Administrator Class | | 0.10 |
| |
Institutional Class | | 0.08 |
48 | Wells Fargo Strategic Municipal Bond Fund
Notes to financial statements
Funds Management has contractually waived and/or reimbursed management and administration fees to the extent necessary to maintain certain net operating expense ratios for the Fund. When each class of the Fund has exceeded its expense cap, Funds Management has waived fees and/or reimbursed expenses from fund-level expenses on a proportionate basis and then from class specific expenses. When only certain classes exceed their expense caps, waivers and/or reimbursements are applied against class specific expenses before fund-level expenses. Funds Management has committed through October 31, 2019 to waive fees and/or reimburse expenses to the extent necessary to cap the Fund’s expenses at 0.82% for Class A shares, 1.57% for Class C shares, 0.43% for Class R6 shares, 0.68% for Administrator Class shares, and 0.48% for Institutional Class shares. Prior to or after the commitment expiration date, the cap may be increased or the commitment to maintain the cap may be terminated only with the approval of the Board of Trustees.
Distribution fee
The Trust has adopted a distribution plan for Class C shares of the Fund pursuant to Rule 12b-1 under the 1940 Act. A distribution fee is charged to Class C shares and paid to Wells Fargo Funds Distributor, LLC (“Funds Distributor”), the principal underwriter, at an annual rate of 0.75% of the average daily net assets of Class C shares.
In addition, Funds Distributor is entitled to receive the front-end sales charge from the purchase of Class A shares and a contingent deferred sales charge on the redemption of certain Class A shares. Funds Distributor is also entitled to receive the contingent deferred sales charges from redemptions of Class C shares. For the year ended June 30, 2019, Funds Distributor received $11,025 from the sale of Class A shares. No contingent deferred sales charges were incurred by Class A and Class C shares for the year ended June 30, 2019.
Shareholder servicing fees
The Trust has entered into contracts with one or more shareholder servicing agents, whereby Class A, Class C, and Administrator Class of the Fund are charged a fee at an annual rate of 0.25% of the average daily net assets of each respective class. A portion of these total shareholder servicing fees were paid to affiliates of Wells Fargo.
Interfund transactions
The Fund may purchase or sell portfolio investment securities to certain other Wells Fargo affiliates pursuant to Rule 17a-7 under the 1940 Act and under procedures adopted by the Board of Trustees. The procedures have been designed to ensure that these interfund transactions, which do not incur broker commissions, are effected at current market prices. Pursuant to these procedures, the Fund had $267,691,908 and $235,845,000 in interfund purchases and sales, respectively, during the year ended June 30, 2019.
5. INVESTMENT PORTFOLIO TRANSACTIONS
Purchases and sales of investments, excluding U.S. government obligations (if any) and short-term securities, for the year ended June 30, 2019 were $1,040,961,696 and $553,933,544, respectively.
6. DERIVATIVE TRANSACTIONS
During the year ended June 30, 2019, the Fund entered into futures contracts for to take advantage of the differences between municipal and treasury yields and to help manage the duration of the portfolio. The Fund had an average notional amount of $81,191,327 in long futures contracts and $9,187,933 in short futures contracts during the year ended June 30, 2019.
The fair value, realized gains or losses and change in unrealized gains or losses, if any, on derivative instruments are reflected in the corresponding financial statement captions.
7. BANK BORROWINGS
The Trust (excluding the money market funds), Wells Fargo Master Trust and Wells Fargo Variable Trust are parties to a $280,000,000 revolving credit agreement whereby the Fund is permitted to use bank borrowings for temporary or emergency purposes, such as to fund shareholder redemption requests. Interest under the credit agreement is charged to the Fund based on a borrowing rate equal to the higher of the Federal Funds rate in effect on that day plus 1.25% or the overnight LIBOR rate in effect on that day plus 1.25%. In addition, an annual commitment fee equal to 0.25% of the unused balance is allocated to each participating fund.
For the year ended June 30, 2019, there were no borrowings by the Fund under the agreement.
Wells Fargo Strategic Municipal Bond Fund | 49
Notes to financial statements
8. DISTRIBUTIONS TO SHAREHOLDERS
The tax character of distributions paid during the years ended June 30, 2019 and June 30, 2018 were as follows:
| | | | | | | | |
| | | Year ended June 30 | |
| | |
| | | 2019 | | | 2018 | |
| | |
Ordinary income | | $ | 0 | | | $ | 2,201,445 | |
| | |
Tax-exempt income | | | 46,490,469 | | | | 36,383,521 | |
| | |
Long-term capital gain | | | 0 | | | | 2,571,054 | |
As of June 30, 2019, the components of distributable earnings on a tax basis were as follows:
| | | | |
Undistributed
ordinary
income | | Undistributed
tax-exempt
income | | Unrealized
gains |
| | |
$2,091,065 | | $384,421 | | $56,022,179 |
Effective for all filings after November 4, 2018, the Securities and Exchange Commission eliminated the requirement to separately state the components of distributions to shareholders under U.S. generally accepted accounting principles. The amounts of distributions to shareholders for the year ended June 30, 2018 were as follows:
| | | | | | | | |
| | |
| | | Net investment
income | | | Net realized
gains | |
| | |
Class A | | | $8,770,008 | | | | $1,271,860 | |
| | |
Class C | | | 1,173,934 | | | | 304,884 | |
| | |
Administrator Class | | | 3,668,568 | | | | 493,273 | |
| | |
Institutional Class | | | 22,770,948 | | | | 2,702,545 | |
9. INDEMNIFICATION
Under the Trust’s organizational documents, the officers and Trustees have been granted certain indemnification rights against certain liabilities that may arise out of performance of their duties to the Trust. Additionally, in the normal course of business, the Trust may enter into contracts with service providers that contain a variety of indemnification clauses. The Trust’s maximum exposure under these arrangements is dependent on future claims that may be made against the Fund and, therefore, cannot be estimated.
10. NEW ACCOUNTING PRONOUNCEMENTS
In August 2018, FASB issued Accounting Standards Update (“ASU”) No. 2018-13, Fair Value Measurement (Topic 820)Disclosure Framework—Changes to the Disclosure Requirements for Fair Value Measurement. ASU 2018-13 updates the disclosure requirements for fair value measurements by modifying or removing certain disclosures and adding certain new disclosures. The amendments are effective for fiscal years, and interim periods within those fiscal years, beginning after December 15, 2019. Early adoption is permitted. Management has adopted the removal and modification of disclosures early, as permitted, and will adopt the additional new disclosures at the effective date.
In March 2017, FASB issued ASU No. 2017-08,Premium Amortization on Purchased Callable Debt Securities. ASU 2017-08 shortens the amortization period for certain callable debt securities held at a premium and requires the premium to be amortized to the earliest call date. The amendments do not require an accounting change for securities held at a discount and discounts will continue to be accreted to the maturity date of the security. ASU 2017-08 is effective for fiscal years beginning after December 15, 2018 and for interim periods within those fiscal years. During the current reporting period, management of the Fund adopted the change in accounting policy which did not have a material impact to the Fund’s financial statements.
50 | Wells Fargo Strategic Municipal Bond Fund
Report of independent registered public accounting firm
TO THE SHAREHOLDERS OF THE FUND AND BOARD OF TRUSTEES OF WELLS FARGO FUNDS TRUST:
Opinion on the Financial Statements
We have audited the accompanying statement of assets and liabilities of Wells Fargo Strategic Municipal Bond Fund (the Fund), one of the funds constituting Wells Fargo Funds Trust, including the portfolio of investments, as of June 30, 2019, the related statement of operations for the year then ended, the statements of changes in net assets for each of the years in the two year period then ended, and the related notes (collectively, the financial statements) and the financial highlights for each of the years or periods in the five year period then ended. In our opinion, the financial statements and financial highlights present fairly, in all material respects, the financial position of the Fund as of June 30, 2019, the results of its operations for the year then ended, the changes in its net assets for each of the years in the two year period then ended, and the financial highlights for each of the years or periods in the five year period then ended, in conformity with U.S. generally accepted accounting principles.
Basis for Opinion
These financial statements and financial highlights are the responsibility of the Fund’s management. Our responsibility is to express an opinion on these financial statements and financial highlights based on our audits. We are a public accounting firm registered with the Public Company Accounting Oversight Board (United States) (PCAOB) and are required to be independent with respect to the Fund in accordance with the U.S. federal securities laws and the applicable rules and regulations of the Securities and Exchange Commission and the PCAOB.
We conducted our audits in accordance with the standards of the PCAOB. Those standards require that we plan and perform the audit to obtain reasonable assurance about whether the financial statements and financial highlights are free of material misstatement, whether due to error or fraud. Our audits included performing procedures to assess the risks of material misstatement of the financial statements and financial highlights, whether due to error or fraud, and performing procedures that respond to those risks. Such procedures included examining, on a test basis, evidence regarding the amounts and disclosures in the financial statements and financial highlights. Such procedures also included confirmation of securities owned as of June 30, 2019, by correspondence with the custodian and brokers, or by other appropriate auditing procedures. Our audits also included evaluating the accounting principles used and significant estimates made by management, as well as evaluating the overall presentation of the financial statements and financial highlights. We believe that our audits provide a reasonable basis for our opinion.

We have not been able to determine the specific year that we began serving as the auditor of one or more Wells Fargo Funds investment companies; however we are aware that we have served as the auditor of one or more Wells Fargo Funds investment companies since at least 1955.
Boston, Massachusetts
August 26, 2019
Wells Fargo Strategic Municipal Bond Fund | 51
Other information (unaudited)
TAX INFORMATION
Pursuant to Section 852 of the Internal Revenue Code, 100% of distributions paid from net investment income is designated as exempt-interest dividends for the fiscal year ended June 30, 2019.
PROXY VOTING INFORMATION
A description of the policies and procedures used to determine how to vote proxies relating to portfolio securities is available, upon request, by calling1-800-222-8222, visiting our website atwfam.com, or visiting the SEC website at sec.gov. Information regarding how the proxies related to portfolio securities were voted during the most recent 12-month period ended June 30 is available on the website atwfam.com or by visiting the SEC website at sec.gov.
QUARTERLY PORTFOLIO HOLDINGS INFORMATION
The Fund files its complete schedule of portfolio holdings with the SEC for the first and third quarters of each fiscal year on Form N-Q or Form N-PORT, which is available by visiting the SEC website at sec.gov. Those forms may be reviewed and copied at the SEC’s Public Reference Room in Washington, DC. Information on the operation of the Public Reference Room may be obtained by calling 1-800-SEC-0330.
52 | Wells Fargo Strategic Municipal Bond Fund
Other information (unaudited)
BOARD OF TRUSTEES AND OFFICERS
Each of the Trustees and Officers1 listed in the table below acts in identical capacities for each fund in the Wells Fargo family of funds, which consists of 152 mutual funds comprising the Wells Fargo Funds Trust, Wells Fargo Variable Trust, Wells Fargo Master Trust and four closed-end funds (collectively the “Fund Complex”). This table should be read in conjunction with the Prospectus and the Statement of Additional Information2. The mailing address of each Trustee and Officer is 525 Market Street, 12th Floor, San Francisco, CA 94105. Each Trustee and Officer serves an indefinite term, however, each Trustee serves such term until reaching the mandatory retirement age established by the Trustees.
Independent Trustees
| | | | | | |
Name and year of birth | | Position held and length of service* | | Principal occupations during past five years or longer | | Current other
public company or
investment
company
directorships |
| | | |
William R. Ebsworth (Born 1957) | | Trustee, since 2015 | | Retired. From 1984 to 2013, equities analyst, portfolio manager, research director and chief investment officer at Fidelity Management and Research Company in Boston, Tokyo, and Hong Kong, and retired in 2013 as Chief Investment Officer of Fidelity Strategic Advisers, Inc. where he led a team of investment professionals managing client assets. Prior thereto, Board member of Hong Kong Securities Clearing Co., Hong Kong Options Clearing Corp., the Thailand International Fund, Ltd., Fidelity Investments Life Insurance Company, and Empire Fidelity Investments Life Insurance Company. Audit Committee Chair and Investment Committee Chair of the Vincent Memorial Hospital Endowment (non-profit organization). Mr. Ebsworth is a CFA® charterholder. | | N/A |
| | | |
Jane A. Freeman (Born 1953) | | Trustee, since 2015; Chair Liaison, since 2018 | | Retired. From 2012 to 2014 and 1999 to 2008, Chief Financial Officer of Scientific Learning Corporation. From 2008 to 2012, Ms. Freeman provided consulting services related to strategic business projects. Prior to 1999, Portfolio Manager at Rockefeller & Co. and Scudder, Stevens & Clark. Board member of the Harding Loevner Funds from 1996 to 2014, serving as both Lead Independent Director and chair of the Audit Committee. Board member of the Russell Exchange Traded Funds Trust from 2011 to 2012 and the chair of the Audit Committee. Ms. Freeman is a Board Member of The Ruth Bancroft Garden (non-profit organization). She is also an inactive Chartered Financial Analyst. | | N/A |
| | | |
Isaiah Harris, Jr. (Born 1952) | | Trustee, since 2009; Audit Committee Chairman, since 2019 | | Retired. Chairman of the Board of CIGNA Corporation since 2009, and Director since 2005. From 2003 to 2011, Director of Deluxe Corporation. Prior thereto, President and CEO of BellSouth Advertising and Publishing Corp. from 2005 to 2007, President and CEO of BellSouth Enterprises from 2004 to 2005 and President of BellSouth Consumer Services from 2000 to 2003. Emeritus member of the Iowa State University Foundation Board of Governors. Emeritus Member of the Advisory Board of Iowa State University School of Business. Advisory Board Member, Palm Harbor Academy (private school). Advisory Board Member, Child Evangelism Fellowship (non-profit). Mr. Harris is a certified public accountant (inactive status). | | CIGNA Corporation |
| | | |
Judith M. Johnson (Born 1949) | | Trustee, since 2008; Audit Committee Chairman, from 2009 to 2018 | | Retired. Prior thereto, Chief Executive Officer and Chief Investment Officer of Minneapolis Employees Retirement Fund from 1996 to 2008. Ms. Johnson is an attorney, certified public accountant and a certified managerial accountant. | | N/A |
Wells Fargo Strategic Municipal Bond Fund | 53
Other information (unaudited)
| | | | | | |
Name and year of birth | | Position held and length of service* | | Principal occupations during past five years or longer | | Current other
public company or
investment
company
directorships |
| | | |
David F. Larcker (Born 1950) | | Trustee, since 2009 | | James Irvin Miller Professor of Accounting at the Graduate School of Business, Stanford University, Director of the Corporate Governance Research Initiative and Senior Faculty of The Rock Center for Corporate Governance since 2006. From 2005 to 2008, Professor of Accounting at the Graduate School of Business, Stanford University. Prior thereto, Ernst & Young Professor of Accounting at The Wharton School, University of Pennsylvania from 1985 to 2005. | | N/A |
| | | |
Olivia S. Mitchell (Born 1953) | | Trustee, since 2006; Nominating and Governance Committee Chairman, since 2018 | | International Foundation of Employee Benefit Plans Professor, Wharton School of the University of Pennsylvania since 1993. Director of Wharton’s Pension Research Council and Boettner Center on Pensions & Retirement Research, and Research Associate at the National Bureau of Economic Research. Previously, Cornell University Professor from 1978 to 1993. | | N/A |
| | | |
Timothy J. Penny (Born 1951) | | Trustee, since 1996; Chairman, since 2018 | | President and Chief Executive Officer of Southern Minnesota Initiative Foundation, a non-profit organization, since 2007. Member of the Board of Trustees of NorthStar Education Finance, Inc., a non-profit organization, since 2007. | | N/A |
| | | |
James G. Polisson (Born 1959) | | Trustee, since 2018 | | Retired. Chief Marketing Officer, Source (ETF) UK Services, Ltd, from 2015 to 2017. From 2012 to 2015, Principal of The Polisson Group, LLC, a management consulting, corporate advisory and principal investing company. Chief Executive Officer and Managing Director at Russell Investments, Global Exchange Traded Funds from 2010 to 2012. Managing Director of Barclays Global Investors from 1998 to 2010 and Global Chief Marketing Officer for iShares and Barclays Global Investors from 2000 to 2010. Trustee of the San Francisco Mechanics’ Institute, a non-profit organization, from 2013 to 2015. Board member of the Russell Exchange Traded Fund Trust from 2011 to 2012. Director of Barclays Global Investors Holdings Deutschland GmbH from 2006 to 2009. Mr. Polisson is an attorney and has a retired status with the Massachusetts and District of Columbia Bar Associations. | | N/A |
| * | Length of service dates reflect the Trustee’s commencement of service with the Trust’s predecessor entities, where applicable. |
54 | Wells Fargo Strategic Municipal Bond Fund
Other information (unaudited)
Officers
| | | | |
Name and year of birth | | Position held and length of service | | Principal occupations during past five years or longer |
| | |
Andrew Owen (Born 1960) | | President, since 2017 | | Executive Vice President of Wells Fargo & Company and Head of Affiliated Managers, Wells Fargo Asset Management, since 2014. In addition, Mr. Owen is currently President, Chief Executive Officer and Director of Wells Fargo Funds Management, LLC since 2017. Prior thereto, Executive Vice President responsible for marketing, investments and product development for Wells Fargo Funds Management, LLC, from 2009 to 2014. |
| | |
Nancy Wiser1 (Born 1967) | | Treasurer, since 2012 | | Executive Vice President of Wells Fargo Funds Management, LLC since 2011. Chief Operating Officer and Chief Compliance Officer at LightBox Capital Management LLC, from 2008 to 2011. |
| | |
Alexander Kymn (Born 1973) | | Secretary and Chief Legal Officer, since 2018 | | Senior Company Counsel of Wells Fargo Bank, N.A. since 2018 (previously Senior Counsel from 2007 to 2018). Vice President of Wells Fargo Funds Management, LLC from 2008 to 2014. |
| | |
Michael H. Whitaker (Born 1967) | | Chief Compliance Officer, since 2016 | | Senior Vice President and Chief Compliance Officer since 2016. Senior Vice President and Chief Compliance Officer for Fidelity Investments from 2007 to 2016. |
| | |
David Berardi (Born 1975) | | Assistant Treasurer, since 2009 | | Vice President of Wells Fargo Funds Management, LLC since 2009. Vice President of Evergreen Investment Management Company, LLC from 2008 to 2010. Manager of Fund Reporting and Control for Evergreen Investment Management Company, LLC from 2004 to 2010. |
| | |
Jeremy DePalma1 (Born 1974) | | Assistant Treasurer, since 2009 | | Senior Vice President of Wells Fargo Funds Management, LLC since 2009. Senior Vice President of Evergreen Investment Management Company, LLC from 2008 to 2010 and head of the Fund Reporting and Control Team within Fund Administration from 2005 to 2010. |
| 1 | Nancy Wiser acts as Treasurer of 65 funds in the Fund Complex. Jeremy DePalma acts as Treasurer of 87 funds and Assistant Treasurer of 65 funds in the Fund Complex. |
| 2 | The Statement of Additional Information includes additional information about the Trustees and is available, without charge, upon request, by calling 1-800-222-8222 or by visiting the website atwfam.com. |
Wells Fargo Strategic Municipal Bond Fund | 55
Other information (unaudited)
BOARD CONSIDERATION OF INVESTMENT MANAGEMENT AND SUB-ADVISORY AGREEMENTS:
Wells Fargo Strategic Municipal Bond Fund
Under the Investment Company Act of 1940 (the “1940 Act”), the Board of Trustees (the “Board”) of Wells Fargo Funds Trust (the “Trust”) must determine annually whether to approve the continuation of the Trust’s investment management and sub-advisory agreements. In this regard, at an in-person meeting held on May 21-22, 2019 (the “Meeting”), the Board, all the members of which have no direct or indirect interest in the investment management and sub-advisory agreements and are not “interested persons” of the Trust, as defined in the 1940 Act (the “Independent Trustees”), reviewed and approved for Wells Fargo Strategic Municipal Bond Fund (the “Fund”): (i) an investment management agreement (the “Management Agreement”) with Wells Fargo Funds Management, LLC (“Funds Management”); and (ii) an investment sub-advisory agreement (the “Sub-Advisory Agreement”) with Wells Capital Management Incorporated (the “Sub-Adviser”), an affiliate of Funds Management. The Management Agreement and the Sub-Advisory Agreement are collectively referred to as the “Advisory Agreements.”
At the Meeting, the Board considered the factors and reached the conclusions described below relating to the selection of Funds Management and the Sub-Adviser and the approval of the Advisory Agreements. Prior to the Meeting, including at an in-person meeting in April 2019, the Trustees conferred extensively among themselves and with representatives of Funds Management about these matters. Also, the Board has adopted a team-based approach, with each team consisting of a sub-set of Trustees, to assist the full Board in the discharge of its duties in reviewing investment performance and other matters throughout the year. The Independent Trustees were assisted in their evaluation of the Advisory Agreements by independent legal counsel, from whom they received separate legal advice and with whom they met separately.
In providing information to the Board, Funds Management and the Sub-Adviser were guided by a detailed set of requests for information submitted to them by independent legal counsel on behalf of the Independent Trustees at the start of the Board’s annual contract renewal process earlier in 2019. In considering and approving the Advisory Agreements, the Trustees considered the information they believed relevant, including but not limited to the information discussed below. The Board considered not only the specific information presented in connection with the Meeting, but also the knowledge gained over time through interaction with Funds Management and the Sub-Adviser about various topics. In this regard, the Board reviewed reports of Funds Management at each of its quarterly meetings, which included, among other things, portfolio reviews and investment performance reports. In addition, the Board and the teams mentioned above confer with portfolio managers at various times throughout the year. The Board did not identify any particular information or consideration that was all-important or controlling, and each individual Trustee may have attributed different weights to various factors.
After its deliberations, the Board unanimously approved the continuation of the Advisory Agreements for a one-year term and determined that the compensation payable to Funds Management and the Sub-Adviser under each of the Advisory Agreements was reasonable. The Board considered the approval of the Advisory Agreements for the Fund as part of its consideration of agreements for funds across the complex, but its approvals were made on a fund-by-fund basis. The following summarizes a number of important, but not necessarily all, factors considered by the Board in support of its approvals.
Nature, extent and quality of services
The Board received and considered various information regarding the nature, extent and quality of services provided to the Fund by Funds Management and the Sub-Adviser under the Advisory Agreements. This information included a description of the investment advisory services and Fund-level administrative services covered by the Management Agreement, as well as, among other things, a summary of the background and experience of senior management of Wells Fargo Asset Management (“WFAM”), of which Funds Management and the Sub-Adviser are a part, a summary of investments made in the business of WFAM, a summary of certain organizational and personnel changes involving Funds Management and the Sub-Adviser, and a description of Funds Management’s and the Sub-Adviser’s business continuity planning programs and of their approaches to data privacy and cybersecurity. The Board received and reviewed information about Funds Management’s role as administrator of the Fund’s liquidity risk management program. The Board also considered the qualifications, background, tenure and responsibilities of each of the portfolio managers primarily responsible for the day-to-day portfolio management of the Fund.
The Board evaluated the ability of Funds Management and the Sub-Adviser to attract and retain qualified investment professionals, including research, advisory and supervisory personnel. The Board further considered the compliance programs and compliance records of Funds Management and the Sub-Adviser. In addition, the Board took into account the full range of services provided to the Fund by Funds Management and its affiliates.
56 | Wells Fargo Strategic Municipal Bond Fund
Other information (unaudited)
Fund investment performance and expenses
The Board considered the investment performance results for the Fund over various time periods ended December 31, 2018. The Board considered these results in comparison to the investment performance of funds in a universe that was determined by Broadridge Inc. (“Broadridge”) to be similar to the Fund (the “Universe”), and in comparison to the Fund’s benchmark index and to other comparative data. Broadridge is an independent provider of investment company data. The Board received a description of the methodology used by Broadridge to select the mutual funds in the performance Universe. The Board noted that the investment performance of the Fund (Administrator Class) was higher than the average investment performance of the Universe for all periods under review. The Board also noted that the investment performance of the Fund was higher than its benchmark index, the Bloomberg Barclays Short-Intermediate Municipal Bond Index, for all periods under review.
The Board also received and considered information regarding the Fund’s net operating expense ratios and their various components, including actual management fees, custodian and other non-management fees, and Rule 12b-1 and non-Rule 12b-1 shareholder service fees. The Board considered these ratios in comparison to the median ratios of funds in class-specific expense groups that were determined by Broadridge to be similar to the Fund (the “Groups”). The Board received a description of the methodology used by Broadridge to select the mutual funds in the expense Groups and an explanation of how funds comprising expense groups and their expense ratios may vary from year-to-year. Based on the Broadridge reports, the Board noted that the net operating expense ratios of the Fund were lower than or in range of the median net operating expense ratios of the expense Groups for each share class.
The Board took into account the Fund’s investment performance and expense information provided to it among the factors considered in deciding to re-approve the Advisory Agreements.
Investment management and sub-advisory fee rates
The Board reviewed and considered the contractual fee rates payable by the Fund to Funds Management under the Management Agreement, as well as the contractual fee rates payable by the Fund to Funds Management for class-level administrative services under a Class-Level Administration Agreement, which include, among other things, class-level transfer agency and sub-transfer agency costs (collectively, the “Management Rates”). The Board also reviewed and considered the contractual investment sub-advisory fee rates that are payable by Funds Management to the Sub-Adviser for investment sub-advisory services.
Among other information reviewed by the Board was a comparison of the Fund’s Management Rates with the average contractual investment management fee rates of funds in the expense Groups at a common asset level as well as transfer agency costs of the funds in the expense Groups. The Board noted that the Management Rates of the Fund were lower than or in range of the sum of these average rates for the Fund’s expense Groups for all share classes.
The Board also received and considered information about the portion of the total management fee that was retained by Funds Management after payment of the fee to the Sub-Adviser for sub-advisory services. In assessing the reasonableness of this amount, the Board received and evaluated information about the nature and extent of responsibilities retained and risks assumed by Funds Management and not delegated to or assumed by the Sub-Adviser, and about Funds Management’s on-going oversight services. Given the affiliation between Funds Management and the Sub-Adviser, the Board ascribed limited relevance to the allocation of fees between them.
The Board also received and considered information about the nature and extent of services offered and fee rates charged by Funds Management and the Sub-Adviser to other types of clients with investment strategies similar to those of the Fund. In this regard, the Board received information about the significantly greater scope of services, and compliance, reporting and other legal burdens and risks of managing proprietary mutual funds compared with those associated with managing assets of other types of clients, including third-party sub-advised fund clients and non-mutual fund clients such as institutional separate accounts.
Based on its consideration of the factors and information it deemed relevant, including those described here, the Board determined that the compensation payable to Funds Management under the Management Agreement and to the Sub-Adviser under the Sub-Advisory Agreement was reasonable.
Profitability
The Board received and considered information concerning the profitability of Funds Management, as well as the profitability of both WFAM and Wells Fargo & Co. (“Wells Fargo”) from providing services to the fund family as a whole. The Board noted that the Sub-Adviser’s profitability information with respect to providing services to the Fund and other funds in the family was subsumed in the WFAM and Wells Fargo profitability analysis.
Funds Management reported on the methodologies and estimates used in calculating profitability, including a description of the methodology used to allocate certain expenses. Among other things, the Board noted that the levels of profitability
Wells Fargo Strategic Municipal Bond Fund | 57
Other information (unaudited)
reported on a fund-by-fund basis varied widely, depending on factors such as the size, type and age of fund. Based on its review, the Board did not deem the profits reported by Funds Management, WFAM or Wells Fargo from services provided to the Fund to be at a level that would prevent it from approving the continuation of the Advisory Agreements.
Economies of scale
The Board received and considered information about the potential for Funds Management to experience economies of scale in the provision of management services to the Fund, the difficulties of calculating economies of scale at an individual fund level, and the extent to which potential scale benefits are shared with shareholders. The Board noted the existence of breakpoints in the Fund’s management fee structure, which operate generally to reduce the Fund’s expense ratios as the Fund grows in size. The Board considered that in addition to management fee breakpoints, Funds Management shares potential economies of scale from its management business in a variety of ways, including through fee waiver and expense reimbursement arrangements, services that benefit shareholders, competitive management fee rates set at the outset without regard to breakpoints, and investments in the business intended to enhance services available to shareholders.
The Board concluded that Funds Management’s arrangements with respect to the Fund, including contractual breakpoints, constituted a reasonable approach to sharing potential economies of scale with the Fund and its shareholders.
Other benefits to Funds Management and the Sub-Adviser
The Board received and considered information regarding potential “fall-out” or ancillary benefits received by Funds Management and its affiliates, including the Sub-Adviser, as a result of their relationships with the Fund. Ancillary benefits could include, among others, benefits directly attributable to other relationships with the Fund and benefits potentially derived from an increase in Funds Management’s and the Sub-Adviser’s business as a result of their relationships with the Fund. The Board noted that various affiliates of Funds Management may receive distribution-related fees, shareholder servicing payments and sub-transfer agency fees in respect of shares sold or held through them and services provided.
The Board also reviewed information about soft dollar credits earned and utilized by the Sub-Adviser, fees earned by Funds Management and the Sub-Adviser from managing a private investment vehicle for the fund family’s securities lending collateral, and commissions earned by an affiliated broker from portfolio transactions.
Based on its consideration of the factors and information it deemed relevant, including those described here, the Board did not find that any ancillary benefits received by Funds Management and its affiliates, including the Sub-Adviser, were unreasonable.
Conclusion
At the Meeting, after considering the above-described factors and based on its deliberations and its evaluation of the information described above, the Board unanimously approved the continuation of the Advisory Agreements for a one-year term and determined that the compensation payable to Funds Management and the Sub-Adviser under each of the Advisory Agreements was reasonable.
58 | Wells Fargo Strategic Municipal Bond Fund
This page is intentionally left blank.
This page is intentionally left blank.

For more information
More information about Wells Fargo Funds is available free upon request. To obtain literature, please write, visit the Fund’s website, or call:
Wells Fargo Funds
P.O. Box 219967
Kansas City, MO 64121-9967
Website:wfam.com
Individual investors:1-800-222-8222
Retail investment professionals:1-888-877-9275
Institutional investment professionals:1-866-765-0778

This report and the financial statements contained herein are submitted for the general information of the shareholders of the Fund. If this report is used for promotional purposes, distribution of the report must be accompanied or preceded by a current prospectus. Before investing, please consider the investment objectives, risks, charges, and expenses of the investment. For a current prospectus and, if available, a summary prospectus, containing this information, call1-800-222-8222 or visit the Fund’s website atwfam.com. Read the prospectus carefully before you invest or send money.
Wells Fargo Asset Management (WFAM) is the trade name for certain investment advisory/management firms owned by Wells Fargo & Company. These firms include but are not limited to Wells Capital Management Incorporated and Wells Fargo Funds Management, LLC. Certain products managed by WFAM entities are distributed by Wells Fargo Funds Distributor, LLC (a broker-dealer and Member FINRA).
This material is for general informational and educational purposes only and is NOT intended to provide investment advice or a recommendation of any kind—including a recommendation for any specific investment, strategy, or plan.
INVESTMENT PRODUCTS: NOT FDIC INSURED ◾ NO BANK GUARANTEE ◾ MAY LOSE VALUE
© 2019 Wells Fargo Funds Management, LLC. All rights reserved.
404828 08-19
A257/AR257 06-19
Annual Report
June 30, 2019
Wells Fargo
High Yield Municipal Bond Fund
Beginning on January 1, 2021, as permitted by new regulations adopted by the Securities and Exchange Commission, paper copies of the Wells Fargo Funds’ annual and semi-annual shareholder reports issued after this date will no longer be sent by mail, unless you specifically request paper copies of the reports. Instead, the reports will be made available on the Funds’ website, and you will be notified by mail each time a report is posted and provided with a website address to access the report.
If you already elected to receive shareholder reports electronically, you will not be affected by this change and you need not take any action. You may elect to receive shareholder reports and other communications from the Fund electronically at any time by contacting your financial intermediary (such as a broker-dealer or bank) or, if you are a direct investor, by calling1-800-222-8222 or by enrolling at wellsfargo.com/advantagedelivery.
You may elect to receive all future reports in paper free of charge. If you invest through a financial intermediary, you can contact your financial intermediary to request that you continue to receive paper copies of your shareholder reports; if you invest directly with the Fund, you can call 1-800-222-8222. Your election to receive reports in paper will apply to all Wells Fargo Funds held in your account with your financial intermediary or, if you are a direct investor, to all Wells Fargo Funds that you hold.
|
|
|
Reduce clutter. Save trees. |
Sign up for electronic delivery of prospectuses and shareholder reports atwellsfargo.com/advantagedelivery |
The views expressed and any forward-looking statements are as of June 30, 2019, unless otherwise noted, and are those of the Fund managers and/or Wells Fargo Asset Management. Discussions of individual securities, or the markets generally, or any Wells Fargo Fund are not intended as individual recommendations. Future events or results may vary significantly from those expressed in any forward-looking statements. The views expressed are subject to change at any time in response to changing circumstances in the market. Wells Fargo Asset Management and the Fund disclaim any obligation to publicly update or revise any views expressed or forward-looking statements.
INVESTMENT PRODUCTS: NOT FDIC INSURED ◾ NO BANK GUARANTEE ◾ MAY LOSE VALUE
Wells Fargo High Yield Municipal Bond Fund | 1
Letter to shareholders (unaudited)

Andrew Owen
President
Wells Fargo Funds
Dear Shareholder:
We are pleased to offer you this annual report for the Wells Fargo High Yield Municipal Bond Fund for the12-month period that ended June 30, 2019. After the first six months of the period yielded eitherlow-single-digit or negative investment returns, stock and bond investors enjoyed a recovery during the final six months. The gains came amid continued concerns about global economic growth, international trade, geopolitical tensions, and bouts of market volatility.
For the period, U.S. stocks, based on the S&P 500 Index,1 gained 10.42% and international stocks, as measured by the MSCI ACWI ex USA Index (Net),2 rose 1.29%. The MSCI EM Index (Net)3 added 1.21%. For bond investors, the Bloomberg Barclays U.S. Aggregate Bond Index4 added 7.87%, the Bloomberg Barclays Global Aggregateex-USD Index5 rose 4.10%, the Bloomberg Barclays Municipal Bond Index6 gained 6.71%, and the ICE BofAML U.S. High Yield Index7 added 7.58%.
U.S. and international markets diverged during the third quarter of 2018.
Domestic equity investors received encouraging news during the third quarter of 2018. The U.S. Bureau of Economic Analysis reported second-quarter annualized gross domestic product (GDP) growth of 4.2%. Hiring improved. Unemployment declined. Consumer confidence and spending increased. Third-quarter corporate earnings reports were generally positive. U.S. trade negotiations with Mexico and Canada progressed. The U.S. Federal Reserve (Fed) raised the federal funds rate by 25 basis points (bps; 100 bps equal 1.00%) to a target range of between 2.00% and 2.25% in September, one of four rate increases implemented during 2018, expressing confidence in the strength of the U.S. economic expansion’s durability.
Investors in international markets were not as confident. Tensions between the U.S. and China increased. The U.S. imposed $200 billion in tariffs on Chinese goods. China reacted with $60 billion in tariffs on U.S. goods. Economic growth in China caused concern. During the quarter, the MSCI ACWI ex USA Index (Net) gained 0.71%. The MSCI EM Index (Net) declined 1.09%. In fixed-income markets, U.S. bonds were flat, as measured by the Bloomberg Barclays U.S. Aggregate Bond Index. The Bloomberg Barclays Global Aggregateex-USD Index fell 1.74%.
| 1 | The S&P 500 Index consists of 500 stocks chosen for market size, liquidity, and industry group representation. It is a market-value-weighted index with each stock’s weight in the index proportionate to its market value. You cannot invest directly in an index. |
| 2 | The Morgan Stanley Capital International (MSCI) All Country World Index (ACWI) ex USA Index (Net) is a free-float-adjusted market-capitalization weighted index that is designed to measure the equity market performance of developed and emerging markets, excluding the U.S. Source: MSCI. MSCI makes no express or implied warranties or representations and shall have no liability whatsoever with respect to any MSCI data contained herein. The MSCI data may not be further redistributed or used as a basis for other indices or any securities or financial products. This report is not approved, reviewed, or produced by MSCI. You cannot invest directly in an index. |
| 3 | The MSCI Emerging Markets (EM) Index (Net) is a free-float-adjusted market-capitalization-weighted index that is designed to measure the equity market performance of emerging markets. You cannot invest directly in an index. |
| 4 | The Bloomberg Barclays U.S. Aggregate Bond Index is a broad-based benchmark that measures the investment-grade, U.S. dollar-denominated, fixed-rate taxable bond market, including Treasuries, government-related and corporate securities, mortgage-backed securities (agency fixed-rate and hybrid adjustable-rate mortgage pass-throughs), asset-backed securities, and commercial mortgage-backed securities. You cannot invest directly in an index. |
| 5 | The Bloomberg Barclays Global Aggregateex-USD Index is an unmanaged index that provides a broad-based measure of the global investment-grade fixed-income markets excluding the U.S. dollar-denominated debt market. You cannot invest directly in an index. |
| 6 | The Bloomberg Barclays Municipal Bond Index is an unmanaged index composed of long-termtax-exempt bonds with a minimum credit rating of Baa. You cannot invest directly in an index. |
| 7 | The ICE BofAML U.S. High Yield Index is a market-capitalization-weighted index of domestic and Yankee high-yield bonds. The index tracks the performance of high-yield securities traded in the U.S. bond market. You cannot invest directly in an index. Copyright 2019. ICE Data Indices, LLC. All rights reserved. |
2 | Wells Fargo High Yield Municipal Bond Fund
Letter to shareholders (unaudited)
Global markets suffered during the fourth quarter of 2018.
November’s U.S. midterm elections shifted control of the House of Representatives from Republicans to Democrats, presaging partisan clashes that followed and caused uncertainty among investors. Third-quarter U.S. GDP was announced at an annualized 3.4% rate, lower than the second-quarter rate. Brexit efforts stalled ahead of the March 2019 deadline. The People’s Bank of China cut reserve requirement ratios, accelerated infrastructure spending, and cut taxes even as the value of the yuan declined to low levels last seen in 2008. A partial U.S. government shutdown driven by partisan policy disputes extended into January.
The combination of news in the U.S. and generally weak economic indicators outside of the U.S. caused investors to seek safe havens. December’s S&P 500 Index performance was the worst since 1931. Globally, fixed-income investments fared better than stocks during the last two months of the year. The Fed increased the federal funds rate by 25 bps in December to a target range of between 2.25% and 2.50%.
The market climbs a wall of worry.
Investors entered 2019 with reasons to be concerned. Investment returns appeared to reaffirm the adage that markets climb a wall of worry. The S&P 500 Index gained 8.01% for the month of January, the best monthly performance in 30 years. Returns for the MSCI ACWI ex USA Index (Net), the Bloomberg Barclays U.S. Aggregate Bond Index, and the Bloomberg Barclays Global Aggregateex-USD Index also were positive. The Fed indicated that it would pause its program of regular rate increases during 2019 as inflation remained low.
In February 2019, concerns over slowing global growth persisted. The Bureau of Economic Analysis announced fourth-quarter 2018 GDP grew at an annualized 2.2% rate, down from the levels of the prior two quarters. In a February report, the Bank of England forecast the slowest growth since the financial crisis for 2019. China and the U.S. continued to wrangle over trade issues.
By the end of March 2019, the combination of dovish Fed sentiment and steady, if not spectacular, economic and business metrics reinforced investors’ confidence. Monthly job creation data and corporate profits, while less consistent than during 2018, were solid. China announced a roughly $300 billion stimulus package through tax and fee cuts intended to reinvigorate economic growth.
During April 2019, investors drew confidence from favorable economic projections, sustained low inflation, and solid employment data. First-quarter GDP showed the economy grew at an annualized rate of 3.2% on improvement in business investment and exports. Favorable sentiment extended to foreign markets as the MSCI ACWI ex USA Index (Net) gained 2.64% and the MSCI EM Index (Net) added 2.11% for the month.
During May 2019, investing signals were mixed. In the U.S., partisan wrangling ramped up as Democrats and Republicans set their sights on 2020 presidential politics. The U.K.’s Brexit caused Prime Minister Theresa May to resign. The European Commission downgraded the 2019 growth forecast to 1.2%. The U.S. increased tariffs on products from China, China responded, and then talks broke down. President Donald Trump threatened to turn his foreign policy tariff tool to Mexico over immigration issues. Markets tumbled.
As had been the case during most of 2019 to date, just as the investment horizon appeared to darken, sentiment turned and markets gained. The gains, primarily driven by geopolitical and monetary policy events, drove equity markets to new highs. President Trump dropped his threats of new tariffs on Mexico after talks and further tariffs on China after meeting with China’s President Xi Jinping at theG-20 summit. President Mario Draghi of the European Central Bank said that if the outlook doesn’t
“December’s S&P 500 Index performance was the worst since 1931.”
“The S&P 500 Index gained 8.01% for the month of January, the best monthly performance in 30 years.”
Wells Fargo High Yield Municipal Bond Fund | 3
Letter to shareholders (unaudited)
improve, the bank will cut rates or buy more assets to prop up inflation. In the U.S., the Fed said growth shifted from “solid” to “moderate” and indicated a willingness to cut rates.
Don’t let short-term uncertainty derail long-term investment goals.
Periods of investment uncertainty can present challenges, but experience has taught us that maintaining long-term investment goals can be an effective way to plan for the future. To help you create a sound strategy based on your personal goals and risk tolerance, Wells Fargo Funds offers more than 100 mutual funds spanning a wide range of asset classes and investment styles. Although diversification cannot guarantee an investment profit or prevent losses, we believe it can be an effective way to manage investment risk and potentially smooth out overall portfolio performance. We encourage investors to know their investments and to understand that appropriate levels of risk-taking may unlock opportunities.
Thank you for choosing to invest with Wells Fargo Funds. We appreciate your confidence in us and remain committed to helping you meet your financial needs.
Sincerely,

Andrew Owen
President
Wells Fargo Funds
|
|
|
For further information about your Fund, contact your investment professional, visit our website at wfam.com, or call us directly at1-800-222-8222. |
4 | Wells Fargo High Yield Municipal Bond Fund
This page is intentionally left blank.
Performance highlights (unaudited)
Investment objective
The Fund seeks high current income exempt from federal income tax, and capital appreciation.
Manager
Wells Fargo Funds Management, LLC
Subadviser
Wells Capital Management Incorporated
Portfolio managers
Dennis Derby
Terry J. Goode
Average annual total returns (%) as of June 30, 2019
| | | | | | | | | | | | | | | | | | | | | | | | | | | | | | | | | | |
| | | | |
| | | | | Including sales charge | | | Excluding sales charge | | | Expense ratios1 (%) | |
| | | | | | | | | |
| | | Inception date | | 1 year | | | 5 year | | | Since
inception | | | 1 year | | | 5 year | | | Since
inception | | | Gross | | | Net2 | |
| | | | | | | | | | |
| Class A (WHYMX) | | 1-31-2013 | | | 2.59 | | | | 4.44 | | | | 4.75 | | | | 7.43 | | | | 5.40 | | | | 5.50 | | | | 1.07 | | | | 0.80 | |
| | | | | | | | | | |
| Class C (WHYCX) | | 1-31-2013 | | | 5.63 | | | | 4.61 | | | | 4.71 | | | | 6.63 | | | | 4.61 | | | | 4.71 | | | | 1.82 | | | | 1.55 | |
| | | | | | | | | | |
| Class R6 (EKHRX)3 | | 7-31-2018 | | | – | | | | – | | | | – | | | | 7.85 | | | | 5.69 | | | | 5.78 | | | | 0.69 | | | | 0.50 | |
| | | | | | | | | | |
| Administrator Class (WHYDX) | | 1-31-2013 | | | – | | | | – | | | | – | | | | 7.64 | | | | 5.50 | | | | 5.62 | | | | 1.01 | | | | 0.70 | |
| | | | | | | | | | |
| Institutional Class (WHYIX) | | 1-31-2013 | | | – | | | | – | | | | – | | | | 7.70 | | | | 5.66 | | | | 5.76 | | | | 0.74 | | | | 0.55 | |
| | | | | | | | | | |
| Bloomberg Barclays Municipal Bond Index4 | | – | | | – | | | | – | | | | – | | | | 6.71 | | | | 3.64 | | | | 3.28 | * | | | – | | | | – | |
| | | | | | | | | | |
| Bloomberg Barclays High Yield Municipal Bond Index5 | | – | | | – | | | | – | | | | – | | | | 7.79 | | | | 6.35 | | | | 5.00 | * | | | – | | | | – | |
| * | Return is based on the oldest Fund class. |
Figures quoted represent past performance, which is no guarantee of future results, and do not reflect taxes that a shareholder may pay on fund distributions or the redemption of fund shares. Investment return and principal value of an investment will fluctuate so that an investor’s shares, when redeemed, may be worth more or less than their original cost. Performance shown without sales charges would be lower if sales charges were reflected. Current performance may be lower or higher than the performance data quoted, which assumes the reinvestment of dividends and capital gains. Currentmonth-end performance is available on the Fund’s website, wfam.com.
Index returns do not include transaction costs associated with buying and selling securities, any mutual fund fees or expenses, or any taxes. It is not possible to invest directly in an index.
For Class A shares, the maximumfront-end sales charge is 4.50%. For Class C shares, the maximum contingent deferred sales charge is 1.00%. Performance including a contingent deferred sales charge assumes the sales charge for the corresponding time period. Class R6, Administrator Class, and Institutional Class shares are sold without afront-end sales charge or contingent deferred sales charge.
Bond values fluctuate in response to the financial condition of individual issuers, general market and economic conditions, and changes in interest rates. Changes in market conditions and government policies may lead to periods of heightened volatility in the bond market and reduced liquidity for certain bonds held by the Fund. In general, when interest rates rise, bond values fall and investors may lose principal value. Interest rate changes and their impact on the Fund and its share price can be sudden and unpredictable. High-yield securities have a greater risk of default and tend to be more volatile than higher-rated debt securities. The use of derivatives may reduce returns and/or increase volatility. Certain investment strategies tend to increase the total risk of an investment (relative to the broader market). The Fund is exposed to municipal securities risk. Consult the Fund’s prospectus for additional information on these and other risks. A portion of the Fund’s income may be subject to federal, state, and/or local income taxes or the Alternative Minimum Tax (AMT). Any capital gains distributions may be taxable.
Please see footnotes on page 7.
6 | Wells Fargo High Yield Municipal Bond Fund
Performance highlights (unaudited)
|
|
| Growth of $10,000 investment as of June 30, 20196 |
|
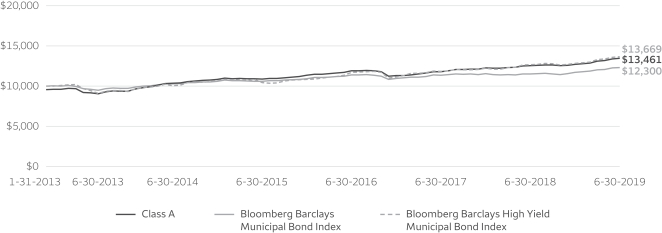
|
| 1 | Reflects the expense ratios as stated in the most recent prospectuses. The expense ratios shown are subject to change and may differ from the annualized expense ratios shown in the financial highlights of this report, which do not include acquired fund fees and expenses. |
| 2 | The manager has contractually committed through October 31, 2019, to waive fees and/or reimburse expenses to the extent necessary to cap the expenses of each class after fee waivers at the amounts shown. Brokerage commissions, stamp duty fees, interest, taxes, acquired fund fees and expenses (if any), and extraordinary expenses are excluded from the expense cap. Prior to or after the commitment expiration date, the cap may be increased or the commitment to maintain the cap may be terminated only with the approval of the Board of Trustees. Without this cap, the Fund’s returns would have been lower. The expense ratio paid by an investor is the net expense ratio (the total annual fund operating expenses after fee waivers) as stated in the prospectuses. |
| 3 | Historical performance shown for Class R6 shares prior to their inception reflects the performance of the Institutional Class shares, and includes the higher expenses applicable to Institutional Class shares. |
| 4 | The Bloomberg Barclays Municipal Bond Index is an unmanaged index composed of long-termtax-exempt bonds with a minimum credit rating of Baa. You cannot invest directly in an index. |
| 5 | The Bloomberg Barclays High Yield Municipal Bond Index measures thenon-investment-grade and nonrated U.S. dollar–denominated, fixed-rate,tax-exempt bond market within the 50 United States and four other qualifying regions (Washington, D.C.; Puerto Rico; Guam; and the Virgin Islands). The index allows state and local general obligation, revenue, insured, and prefunded bonds; however, historically the index has been composed of mostly revenue bonds. You cannot invest directly in an index. |
| 6 | The chart compares the performance of Class A shares since inception with the Bloomberg Barclays Municipal Bond Index and the Bloomberg Barclays High Yield Municipal Bond Index. The chart assumes a hypothetical $10,000 investment in Class A shares and reflects all operating expenses and assumes the maximum initial sales charge of 4.50%. |
| 7 | Amounts are calculated based on the long-term total investments of the Fund. These amounts are subject to change and may have changed since the date specified. |
| 8 | The credit quality distribution of portfolio holdings reflected in the chart is based on ratings from Standard & Poor’s, Moody’s Investors Service, and/or Fitch Ratings Ltd. Credit quality ratings apply to the underlying holdings of the Fund and not to the Fund itself. The percentages of the Fund’s portfolio with the ratings depicted in the chart are calculated based on the total market value of fixed income securities held by the Fund. If a security was rated by all three rating agencies, the middle rating was utilized. If rated by two of three rating agencies, the lower rating was utilized, and if rated by one of the rating agencies, that rating was utilized. Standard & Poor’s rates the creditworthiness of bonds, ranging from AAA (highest) to D (lowest). Ratings from A to CCC may be modified by the addition of a plus (+) or minus (-) sign to show relative standing within the rating categories. Standard & Poor’s rates the creditworthiness of short-term notes fromSP-1 (highest) toSP-3 (lowest). Moody’s rates the creditworthiness of bonds, ranging from Aaa (highest) to C (lowest). Ratings Aa to B may be modified by the addition of a number 1 (highest) to 3 (lowest) to show relative standing within the ratings categories. Moody’s rates the creditworthiness of short-term U.S.tax-exempt municipal securities from MIG 1/VMIG 1 (highest) to SG (lowest). Fitch rates the creditworthiness of bonds, ranging from AAA (highest) to D (lowest). Credit quality distribution is subject to change and may have changed since the date specified. |
Wells Fargo High Yield Municipal Bond Fund | 7
Performance highlights (unaudited)
MANAGER’S DISCUSSION
Fund highlights
| ∎ | | The Fund (Class A, excluding sales charges) outperformed its primary benchmark, the Bloomberg Barclays Municipal Bond Index, for the year that ended June 30, 2019. The Fund (Class A, excluding sales charges) underperformed its secondary benchmark, the Bloomberg Barclays High Yield Municipal Bond Index, over the same period. |
| ∎ | | Our conservative duration and yield-curve positioning relative to the benchmark were positive contributors. We started the period close to neutral and extended duration in early 2019 prior to the significant rally in rates. Security selection and credit positioning contributed to performance. High-yield credit spreads tightened across the board over the course of the year. |
| ∎ | | Security selection was the biggest driver of performance, and our overweight to selected high-yield bonds was accretive to returns. These bonds continued to benefit from strong technicals and demand from investors for higher-yielding municipal paper. |
| ∎ | | An overweight toBB-rated bonds andout-of-benchmark nonrated bonds were positive contributors to relative performance. The Fund’s more conservative credit positioning contributed to lower volatility but also was a detractor against the secondary benchmark performance asnon-investment-grade and lower-rated bonds performed the best. |
|
|
| Effective maturity distribution as of June 30, 20197 |
|
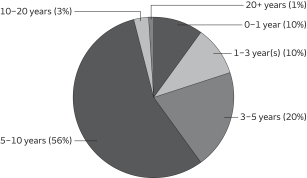 |
The Fed abruptly changed course from raising rates to a potential rate cut over the period.
Throughout most of 2018, the fixed-income markets expected the U.S. Federal Reserve (Fed) to continue the path to normalize monetary policy. Moderate economic growth, stronger employment data, and inflation near its 2% target enabled the Fed to increase the federal funds rate four times in the calendar year. Despite a Fed rate hike in December, the Treasury market rallied in the fourth quarter of 2018 as the market lowered expectations for further rate hikes amid slower global growth, trade tariffs, and uncertainty concerning Britain’s departure from the
European Union. These concerns only increased as we moved into the first half of 2019, and discussions changed from when the Fed might hike to when it might cut the federal funds rate. As a result, fixed-income markets rallied, pushing the benchmark10-year Treasury yield from a 3.23% peak in November 2018 to 2.00% by the end of June 2019.
Specific to the municipal bond market, the beginning of the reporting period was marked with significant outflows due to a generalrisk-on sentiment in equity markets and the fear of rising interest rates. As the calendar turned, so did market sentiment. Flows into municipal mutual funds not only turned positive, but record inflows were reported as investor opinion toward fixed income, particularly municipals, improved due to investor expectations that interest rates would remain stable. Whilenew-issue supply was higher than it was a year earlier, it was still much lower than a typical year due to tax reform that eliminated the ability of issuers to advance refund outstanding, higher-cost debt on atax-exempt basis. Technicals drove the market as overall reduced supply, state and local sales tax caps for individuals, and lower interest rates fueled demand and thus returns for municipal bonds over the period.
Please see footnotes on page 7.
8 | Wells Fargo High Yield Municipal Bond Fund
Performance highlights (unaudited)
|
|
| Credit quality as of June 30, 20198 |
|
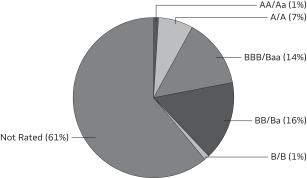 |
Security selection and credit positioning were the strongest performance drivers for the Fund.
Yield-curve positioning, particularly among20-year and longer bonds, was accretive to performance. Sector allocation also aided performance, while conservative duration positioning was somewhat offset by security selection. The largest individual contributors to performance included local Illinois general obligation (GO) bonds, New Jersey appropriation bonds, gas bonds, and industrial development revenue/pollution control revenue (IDR/PCR) project finance bonds. Detractors from performance were relatively few and small in size, including a distressed
hospital bond we sold and a bond issued by a financially weaker private school.
Demand for income remained strong during the period, as overall interest rates remained low by historical standards. This demand combined with positive fund flows, low supply, and slowing but steady economic growth fueled demand for high-yield bonds, which generally outperformed bonds in other rating categories. The Fund was overweight these rating categories and benefited as prices rose. We actively traded new issues, particularly in the IDR/PCR sector.
As the year progressed, we became increasingly cautious as spreads for lower-investment-grade and high-yield bonds continued to tighten. Again, while overall yields are very low in the high-yield universe, we have been seeing more signs of weakness in certain sectors of the market. Multifamily housing has seen a number of defaults over the past year, and there have been growing concerns about appropriation debt after a city in Missouri failed to appropriate for a shopping center issue over the past year. We have seen an increase in initial defaults in the Continuing Care Retirement Community space as well. We have largely been able to avoid these pitfalls through careful security selection.
Duration was a contributor to performance versus the primary benchmark but was a detractor from performance versus the secondary benchmark, the Bloomberg Barclays High Yield Municipal Bond Index. We started the period with a neutral duration position and extended duration in the first part of 2019 prior to the significant rally in rates. We let duration drift in toward the end of the period and ended slightly longer than the primary benchmark. We continued to be conservatively positioned relative to the secondary index as the period ended.
We remain underweight state GO bonds but have an overweight to local GO bonds, which were some of our better-performing issues for the year, especially those in lower-rated Illinois and New Jersey complexes. We remain overweight hospitals compared with the primary index, yet we remain underweight the sector versus the secondary index. Against both indices, we outperformed in the sector due to security selection. In IDR/PCRs, we saw a similar story, with an overweight compared with the primary index but an underweight compared with the secondary index. Again, credit and security selection led to outperformance against both indices. Our lack of exposure to Puerto Rico led to sector underperformance in GOs versus the high-yield GO sector as well as water and sewer, with Puerto Rico Electric Power Authority bonds rallying as the issuer moves closer to a potential restructuring. We would also note that Puerto Rico Corporación del Fondo de Interés Apremiante bonds performed in line with the secondary index. Our overweight to alternative minimum tax bonds was accretive to performance versus both indices.
As the expansion appears to be in the rearview mirror, a transition away from risk may be warranted.
The economic expansion started in June 2009 and is the longest since the Great Depression.Low-quality bonds and equities have performed well with both near records—highs on stocks andrecord-low yields for bonds. We believe we are late cycle, and although economic strength remains, the trend is negative and we expect growth to slow throughout the rest of the year. Our base case does not include a recession but rather suboptimal growth with little risk of an upside surprise to inflation at this point. Global economic growth is anemic at best, with trade issues and Brexit concerns adding to a weakening economic environment. Fed rhetoric is dovish, and as of June 30, 2019, the bond market was pricing in multiple rate cuts byyear-end, the effect of which would likely serve to inflate asset prices rather than provide any real economic stimulus. Slow economic growth bodes well for bonds but not necessarily credit spreads, as slower economic growth typically weighs on credit quality.
Please see footnotes on page 7.
Wells Fargo High Yield Municipal Bond Fund | 9
Performance highlights (unaudited)
Overall, technicals remain strong in the municipal bond market. Bond valuations in the medium term are supported by strong technicals, such as record levels of municipal debt maturities and calls, limited availability of gross municipal bond supply, and continued flows into the asset class. The Fund is structured for a slower-growth environment, with duration close to neutral and curve positioning based largely on a key rate structure as we transition to a rate-cutting cycle. We expect to maintain the Fund’s conservative positions in terms of credit and duration relative to the secondary index.
Please see footnotes on page 7.
10 | Wells Fargo High Yield Municipal Bond Fund
Fund expenses (unaudited)
As a shareholder of the Fund, you incur two types of costs: (1) transaction costs, including sales charges (loads) on purchase payments and contingent deferred sales charges (if any) on redemptions and (2) ongoing costs, including management fees, distribution(12b-1) and/or shareholder servicing fees, and other Fund expenses. This example is intended to help you understand your ongoing costs (in dollars) of investing in the Fund and to compare these costs with the ongoing costs of investing in other mutual funds.
The example is based on an investment of $1,000 invested at the beginning of thesix-month period and held for the entire period from January 1, 2019 to June 30, 2019.
Actual expenses
The “Actual” line of the table below provides information about actual account values and actual expenses. You may use the information in this line, together with the amount you invested, to estimate the expenses that you paid over the period. Simply divide your account value by $1,000 (for example, an $8,600 account value divided by $1,000 = 8.6), then multiply the result by the number in the “Actual” line under the heading entitled “Expenses paid during period” for your applicable class of shares to estimate the expenses you paid on your account during this period.
Hypothetical example for comparison purposes
The “Hypothetical” line of the table below provides information about hypothetical account values and hypothetical expenses based on the Fund’s actual expense ratio and an assumed rate of return of 5% per year before expenses, which is not the Fund’s actual return. The hypothetical account values and expenses may not be used to estimate the actual ending account balance or expenses you paid for the period. You may use this information to compare the ongoing costs of investing in the Fund and other funds. To do so, compare this 5% hypothetical example with the 5% hypothetical examples that appear in the shareholder reports of the other funds.
Please note that the expenses shown in the table are meant to highlight your ongoing costs only and do not reflect any transactional costs, such as sales charges (loads) and contingent deferred sales charges. Therefore, the “Hypothetical” line of the table is useful in comparing ongoing costs only and will not help you determine the relative total costs of owning different funds. In addition, if these transactional costs were included, your costs would have been higher.
| | | | | | | | | | | | | | | | |
| | | Beginning
account value
1-1-2019 | | | Ending
account value
6-30-2019 | | | Expenses
paid during
the period¹ | | | Annualized net
expense ratio | |
| | | | | |
Class A | | | | | | | | | | | | | | | | |
| | | | |
Actual | | $ | 1,000.00 | | | $ | 1,058.96 | | | $ | 4.08 | | | | 0.80 | % |
| | | | |
Hypothetical (5% return before expenses) | | $ | 1,000.00 | | | $ | 1,020.83 | | | $ | 4.01 | | | | 0.80 | % |
| | | | | |
Class C | | | | | | | | | | | | | | | | |
| | | | |
Actual | | $ | 1,000.00 | | | $ | 1,055.05 | | | $ | 7.90 | | | | 1.55 | % |
| | | | |
Hypothetical (5% return before expenses) | | $ | 1,000.00 | | | $ | 1,017.11 | | | $ | 7.75 | | | | 1.55 | % |
| | | | | |
Class R6 | | | | | | | | | | | | | | | | |
| | | | |
Actual | | $ | 1,000.00 | | | $ | 1,061.50 | | | $ | 2.55 | | | | 0.50 | % |
| | | | |
Hypothetical (5% return before expenses) | | $ | 1,000.00 | | | $ | 1,022.32 | | | $ | 2.50 | | | | 0.50 | % |
| | | | | |
Administrator Class | | | | | | | | | | | | | | | | |
| | | | |
Actual | | $ | 1,000.00 | | | $ | 1,060.44 | | | $ | 3.58 | | | | 0.70 | % |
| | | | |
Hypothetical (5% return before expenses) | | $ | 1,000.00 | | | $ | 1,021.32 | | | $ | 3.51 | | | | 0.70 | % |
| | | | | |
Institutional Class | | | | | | | | | | | | | | | | |
| | | | |
Actual | | $ | 1,000.00 | | | $ | 1,060.26 | | | $ | 2.81 | | | | 0.55 | % |
| | | | |
Hypothetical (5% return before expenses) | | $ | 1,000.00 | | | $ | 1,022.07 | | | $ | 2.76 | | | | 0.55 | % |
| 1 | Expenses paid is equal to the annualized net expense ratio of each class multiplied by the average account value over the period, multiplied by the number of days in the most recent fiscal half-year divided by the number of days in the fiscal year (to reflect theone-half-year period). |
Wells Fargo High Yield Municipal Bond Fund | 11
Portfolio of investments—June 30, 2019
| | | | | | | | | | | | | | | | |
| | | Interest
rate | | | Maturity
date | | | Principal | | | Value | |
| Municipal Obligations: 97.65% | | | | | | | | | | | | | | | | |
| | | | |
Alabama: 1.74% | | | | | | | | | | | | | | | | |
| | | | |
| Industrial Development Revenue: 1.23% | | | | | | | | | | | | |
| | | | |
Tuscaloosa County AL IDA Gulf Opportunity Zone Hunt Refining Company Refunding Bond Series A 144A | | | 5.25 | % | | | 5-1-2044 | | | $ | 1,500,000 | | | $ | 1,653,645 | |
| | | | | | | | | | | | | | | | |
|
| Water & Sewer Revenue: 0.51% | |
| | | | |
Jefferson County AL Warrants CAB Senior Lien Series B (AGM Insured) ¤ | | | 0.00 | | | | 10-1-2027 | | | | 920,000 | | | | 683,790 | |
| | | | | | | | | | | | | | | | |
| | | | |
| | | | | | | | | | | | | | | 2,337,435 | |
| | | | | | | | | | | | | | | | |
| | | | |
Arizona: 3.28% | | | | | | | | | | | | | | | | |
| | | | |
| Education Revenue: 1.33% | | | | | | | | | | | | |
| | | | |
Florence AZ IDA Legacy Traditional School Project Queen Creek & Casa Grande Campuses | | | 5.00 | | | | 7-1-2023 | | | | 205,000 | | | | 213,013 | |
| | | | |
Phoenix AZ IDA Great Hearts Academies Project | | | 5.20 | | | | 7-1-2022 | | | | 85,000 | | | | 88,875 | |
| | | | |
Phoenix AZ IDA Legacy Traditional Schools Project Series A 144A | | | 6.50 | | | | 7-1-2034 | | | | 500,000 | | | | 573,155 | |
| | | | |
Pima County AZ IDA Desert Heights Charter School Facility Refunding Bond | | | 6.00 | | | | 5-1-2024 | | | | 395,000 | | | | 418,416 | |
| | | | |
Pima County AZ IDA New Plan Learning Project Series A | | | 8.13 | | | | 7-1-2041 | | | | 495,000 | | | | 501,366 | |
| | | | |
| | | | | | | | | | | | | | | 1,794,825 | |
| | | | | | | | | | | | | | | | |
| | | | |
| Health Revenue: 1.95% | | | | | | | | | | | | |
| | | | |
Maricopa County AZ IDA Senior Living Facility Series 2016 144A | | | 6.00 | | | | 1-1-2048 | | | | 1,000,000 | | | | 1,044,730 | |
| | | | |
Tempe AZ IDA Mirabella at ASU Incorporated Project Series A 144A | | | 6.13 | | | | 10-1-2052 | | | | 1,400,000 | | | | 1,577,786 | |
| | | | |
| | | | | | | | | | | | | | | 2,622,516 | |
| | | | | | | | | | | | | | | | |
| | | | |
| | | | | | | | | | | | | | | 4,417,341 | |
| | | | | | | | | | | | | | | | |
California: 6.59% | | | | | | | | | | | | | | | | |
| | | | |
| Education Revenue: 0.21% | | | | | | | | | | | | |
| | | | |
California Municipal Finance Authority Charter School Albert Einstein Academies Project Series A | | | 7.13 | | | | 8-1-2043 | | | | 250,000 | | | | 278,735 | |
| | | | | | | | | | | | | | | | |
| | | | |
| Health Revenue: 0.82% | | | | | | | | | | | | |
| | | | |
California Statewide CDA Loma Linda University Medical Center Refunding Bond Series A | | | 5.25 | | | | 12-1-2044 | | | | 1,000,000 | | | | 1,102,450 | |
| | | | | | | | | | | | | | | | |
| | | | |
| Housing Revenue: 0.81% | | | | | | | | | | | | |
| | | | |
California Community Housing Agency Workforce Annadel Apartments Series A 144A | | | 5.00 | | | | 4-1-2049 | | | | 1,000,000 | | | | 1,097,790 | |
| | | | | | | | | | | | | | | | |
| | | | |
| Industrial Development Revenue: 0.81% | | | | | | | | | | | | |
| | | | |
California PCFA Solid Waste Disposal AMT Green Bond Calplant I Project 144A | | | 8.00 | | | | 7-1-2039 | | | | 1,000,000 | | | | 1,085,920 | |
| | | | | | | | | | | | | | | | |
| | | | |
| Miscellaneous Revenue: 1.64% | | | | | | | | | | | | |
| | | | |
Anaheim CA PFA Convention Center Expansion Project Series A | | | 5.00 | | | | 5-1-2046 | | | | 500,000 | | | | 566,910 | |
| | | | |
Compton CA PFA Refunding Bond 144A | | | 4.50 | | | | 9-1-2032 | | | | 1,585,000 | | | | 1,635,752 | |
| | | | |
| | | | | | | | | | | | | | | 2,202,662 | |
| | | | | | | | | | | | | | | | |
| | | | |
| Resource Recovery Revenue: 1.51% | | | | | | | | | | | | |
| | | | |
California Pollution Control Financing Authority AMT Rialto Bioenergy Facility
LLC 144A | | | 7.50 | | | | 12-1-2040 | | | | 2,000,000 | | | | 2,037,600 | |
| | | | | | | | | | | | | | | | |
12 | ��Wells Fargo High Yield Municipal Bond Fund
Portfolio of investments—June 30, 2019
| | | | | | | | | | | | | | | | |
| | | Interest
rate | | | Maturity
date | | | Principal | | | Value | |
| Tax Revenue: 0.79% | | | | | | | | | | | | |
| | | | |
Compton CA Community College RDA Project 2nd Lien Series A | | | 4.75 | % | | | 8-1-2019 | | | $ | 225,000 | | | $ | 225,486 | |
| | | | |
Compton CA Community College RDA Project 2nd Lien Series A | | | 5.00 | | | | 8-1-2020 | | | | 100,000 | | | | 103,211 | |
| | | | |
San Francisco City & County CA RDA CAB Mission Bay South Redevelopment Project Subordinate Bond Series D 144A ¤ | | | 0.00 | | | | 8-1-2026 | | | | 1,000,000 | | | | 735,710 | |
| | | | |
| | | | | | | | | | | | | | | 1,064,407 | |
| | | | | | | | | | | | | | | | |
| | | | |
| | | | | | | | | | | | | | | 8,869,564 | |
| | | | | | | | | | | | | | | | |
| | | | |
Colorado: 9.51% | | | | | | | | | | | | | | | | |
| | | | |
| GO Revenue: 7.54% | | | | | | | | | | | | |
| | | | |
Arapahoe County CO Copperleaf Metropolitan District #2 | | | 5.75 | | | | 12-1-2045 | | | | 500,000 | | | | 524,300 | |
| | | | |
Aurora CO Cornerstar Metropolitan District Refunding Bond Series A | | | 5.25 | | | | 12-1-2047 | | | | 1,000,000 | | | | 1,048,150 | |
| | | | |
Brighton CO Crossing Metropolitan District #4 Series A | | | 5.00 | | | | 12-1-2047 | | | | 1,220,000 | | | | 1,268,776 | |
| | | | |
Colorado Big Dry Creek Metropolitan District Refunding & Improvement Bonds Limited Tax Series A | | | 5.75 | | | | 12-1-2047 | | | | 1,000,000 | | | | 1,050,740 | |
| | | | |
Colorado Broadway Station Metropolitan District #2 Senior Series A | | | 5.13 | | | | 12-1-2048 | | | | 500,000 | | | | 520,595 | |
| | | | |
Colorado Copperleaf Metropolitan District #3 Series A | | | 5.13 | | | | 12-1-2047 | | | | 1,200,000 | | | | 1,235,268 | |
| | | | |
Colorado Cottonwood Highlands Metropolitan District #1 Limited Tax Series A 144A | | | 5.00 | | | | 12-1-2049 | | | | 900,000 | | | | 921,816 | |
| | | | |
Colorado Whispering Pines Metropolitan District #1 Series A | | | 5.00 | | | | 12-1-2047 | | | | 1,000,000 | | | | 1,024,190 | |
| | | | |
Denver CO International Business Center Metropolitan District #1 Series B | | | 6.00 | | | | 12-1-2048 | | | | 1,145,000 | | | | 1,181,915 | |
| | | | |
Eaton CO Area Park & Recreation District | | | 5.00 | | | | 12-1-2023 | | | | 810,000 | | | | 867,891 | |
| | | | |
Eaton CO Area Park & Recreation District | | | 5.50 | | | | 12-1-2030 | | | | 475,000 | | | | 508,782 | |
| | | | |
| | | | | | | | | | | | | | | 10,152,423 | |
| | | | | | | | | | | | | | | | |
| | | | |
| Tax Revenue: 1.56% | | | | | | | | | | | | |
| | | | |
Colorado Centerra Metropolitan District #1 Special Revenue Refunding & Improvement Bonds 144A | | | 5.00 | | | | 12-1-2029 | | | | 1,000,000 | | | | 1,076,180 | |
| | | | |
Pueblo CO Urban Renewal Authority Regional Tourism Act Project | | | 5.00 | | | | 6-1-2036 | | | | 1,000,000 | | | | 1,019,580 | |
| | | | |
| | | | | | | | | | | | | | | 2,095,760 | |
| | | | | | | | | | | | | | | | |
| | | | |
| Transportation Revenue: 0.41% | | | | | | | | | | | | |
| | | | |
Colorado High Performance Transportation Enterprise U.S. 36 &I-25 Managed Lanes | | | 5.75 | | | | 1-1-2044 | | | | 500,000 | | | | 546,895 | |
| | | | | | | | | | | | | | | | |
| | | | |
| | | | | | | | | | | | | | | 12,795,078 | |
| | | | | | | | | | | | | | | | |
| | | | |
Connecticut: 0.48% | | | | | | | | | | | | | | | | |
| | | | |
| GO Revenue: 0.48% | | | | | | | | | | | | |
| | | | |
Hartford CT Series A | | | 4.00 | | | | 4-1-2032 | | | | 325,000 | | | | 344,572 | |
| | | | |
Hartford CT Series A | | | 5.00 | | | | 4-1-2024 | | | | 105,000 | | | | 117,454 | |
| | | | |
Hartford CT Series B | | | 5.00 | | | | 4-1-2033 | | | | 50,000 | | | | 54,810 | |
| | | | |
Hartford CT Unrefunded Bond Series A | | | 5.00 | | | | 4-1-2029 | | | | 45,000 | | | | 48,674 | |
| | | | |
Hartford CT Unrefunded Bond Series A | | | 5.00 | | | | 4-1-2030 | | | | 70,000 | | | | 75,641 | |
| | | | |
| | | | | | | | | | | | | | | 641,151 | |
| | | | | | | | | | | | | | | | |
| | | | |
Delaware: 0.80% | | | | | | | | | | | | | | | | |
| | | | |
| Education Revenue: 0.80% | | | | | | | | | | | | |
| | | | |
Delaware EDA Odyssey Charter School Incorporated Project Series A 144A | | | 7.00 | | | | 9-1-2045 | | | | 1,000,000 | | | | 1,076,080 | |
| | | | | | | | | | | | | | | | |
District of Columbia: 0.33% | | | | | | | | | | | | | | | | |
| | | | |
| Tobacco Revenue: 0.33% | | | | | | | | | | | | |
| | | | |
District of Columbia Tobacco Settlement Financing Corporation | | | 6.75 | | | | 5-15-2040 | | | | 435,000 | | | | 449,159 | |
| | | | | | | | | | | | | | | | |
Wells Fargo High Yield Municipal Bond Fund | 13
Portfolio of investments—June 30, 2019
| | | | | | | | | | | | | | | | |
| | | Interest
rate | | | Maturity
date | | | Principal | | | Value | |
Florida: 3.44% | | | | | | | | | | | | | | | | |
| | | | |
| Education Revenue: 2.53% | | | | | | | | | | | | |
| | | | |
Florida Capital Trust Agency Educational Facilities Pineapple Cove Classical Academy Incorporated Project Series A 144A | | | 5.13 | % | | | 7-1-2039 | | | $ | 2,000,000 | | | $ | 2,072,260 | |
| | | | |
Florida Development Finance Corporation Educational Facilities Renaissance Charter School Project Series A | | | 8.50 | | | | 6-15-2044 | | | | 250,000 | | | | 287,005 | |
| | | | |
Miami-Dade County FL IDA YouthCo-Op Charter Schools Project Series A 144A | | | 6.00 | | | | 9-15-2045 | | | | 1,000,000 | | | | 1,042,620 | |
| | | | |
| | | | | | | | | | | | | | | 3,401,885 | |
| | | | | | | | | | | | | | | | |
| | | | |
| Health Revenue: 0.19% | | | | | | | | | | | | |
| | | | |
Holmes County FL Hospital Corporation Doctors Memorial Hospital Project | | | 6.00 | | | | 11-1-2038 | | | | 250,000 | | | | 250,035 | |
| | | | | | | | | | | | | | | | |
| | | | |
| Transportation Revenue: 0.72% | | | | | | | | | | | | |
| | | | |
Florida Development Finance Corporation Surface Virgin Trains USA Passenger Rail Project Series2019-A 144A | | | 6.50 | | | | 1-1-2049 | | | | 1,000,000 | | | | 971,250 | |
| | | | | | | | | | | | | | | | |
| | | | |
| | | | | | | | | | | | | | | 4,623,170 | |
| | | | | | | | | | | | | | | | |
| | | | |
Georgia: 1.22% | | | | | | | | | | | | | | | | |
| | | | |
| Housing Revenue: 0.67% | | | | | | | | | | | | |
| | | | |
Cobb County GA Development Authority Student Housing Kennesaw State University Foundation Project Refunding Bond Series C | | | 5.00 | | | | 7-15-2028 | | | | 800,000 | | | | 892,608 | |
| | | | | | | | | | | | | | | | |
| | | | |
| Transportation Revenue: 0.55% | | | | | | | | | | | | |
| | | | |
Georgia Road & Tollway Authority CCABI-75 South Expressway Lanes Project Series B 144A¤ | | | 0.00 | | | | 6-1-2049 | | | | 1,000,000 | | | | 744,330 | |
| | | | | | | | | | | | | | | | |
| | | | |
| | | | | | | | | | | | | | | 1,636,938 | |
| | | | | | | | | | | | | | | | |
| | | | |
Guam: 0.22% | | | | | | | | | | | | | | | | |
| | | | |
| Airport Revenue: 0.22% | | | | | | | | | | | | |
| | | | |
Guam International Airport Authority Series C | | | 6.38 | | | | 10-1-2043 | | | | 260,000 | | | | 301,220 | |
| | | | | | | | | | | | | | | | |
| | | | |
Idaho: 0.19% | | | | | | | | | | | | | | | | |
| | | | |
| Education Revenue: 0.19% | | | | | | | | | | | | |
| | | | |
Idaho Housing & Finance Association Legacy Public Charter School Incorporated Project Series A | | | 6.25 | | | | 5-1-2043 | | | | 250,000 | | | | 261,993 | |
| | | | | | | | | | | | | | | | |
| | | | |
Illinois: 18.15% | | | | | | | | | | | | | | | | |
| | | | |
| Airport Revenue: 0.95% | | | | | | | | | | | | |
| | | | |
Chicago IL Midway Airport Second Lien Refunding Bond Series A | | | 5.00 | | | | 1-1-2031 | | | | 1,000,000 | | | | 1,119,690 | |
| | | | |
Chicago IL O’Hare International Airport Revenue Bond Series B | | | 6.00 | | | | 1-1-2041 | | | | 150,000 | | | | 160,512 | |
| | | | |
| | | | | | | | | | | | | | | 1,280,202 | |
| | | | | | | | | | | | | | | | |
| | | | |
| Education Revenue: 1.14% | | | | | | | | | | | | |
| | | | |
Illinois Finance Authority Charter School Aid Intrinsic Schools Belmont School Project Series A 144A | | | 5.25 | | | | 12-1-2025 | | | | 800,000 | | | | 844,008 | |
| | | | |
Illinois Finance Authority Charter Schools Refunding & Improvement Bonds Series A | | | 6.88 | | | | 10-1-2031 | | | | 640,000 | | | | 687,392 | |
| | | | |
| | | | | | | | | | | | | | | 1,531,400 | |
| | | | | | | | | | | | | | | | |
| | | | |
| GO Revenue: 7.56% | | | | | | | | | | | | |
| | | | |
Chicago IL Board of Education CAB School Reform Series A (National Insured) ¤ | | | 0.00 | | | | 12-1-2025 | | | | 500,000 | | | | 415,660 | |
| | | | |
Chicago IL Neighborhoods Alive 21 Program Series B | | | 5.50 | | | | 1-1-2032 | | | | 700,000 | | | | 777,000 | |
| | | | |
Chicago IL Series A | | | 5.00 | | | | 1-1-2033 | | | | 310,000 | | | | 321,414 | |
| | | | |
Chicago IL Series A | | | 6.00 | | | | 1-1-2038 | | | | 1,500,000 | | | | 1,743,885 | |
14 | Wells Fargo High Yield Municipal Bond Fund
Portfolio of investments—June 30, 2019
| | | | | | | | | | | | | | | | |
| | | Interest
rate | | | Maturity
date | | | Principal | | | Value | |
| GO Revenue(continued) | | | | | | | | | | | | |
| | | | |
Cook County IL School District #144 Prairie Hills CAB Refunding Bond Series C (AGM Insured) ¤ | | | 0.00 | % | | | 12-1-2025 | | | $ | 730,000 | | | $ | 620,850 | |
| | | | |
Illinois | | | 5.00 | | | | 3-1-2033 | | | | 2,000,000 | | | | 2,103,100 | |
| | | | |
Illinois Series A (AGM Insured) | | | 5.00 | | | | 4-1-2024 | | | | 500,000 | | �� | | 553,355 | |
| | | | |
Lake County IL Community Unit School District #187 North Chicago Series A (AGM Insured) ¤ | | | 0.00 | | | | 1-1-2023 | | | | 590,000 | | | | 537,319 | |
| | | | |
Will County ILLincoln-Way Community High School District #210 | | | 4.00 | | | | 1-1-2022 | | | | 525,000 | | | | 525,284 | |
| | | | |
Will County ILLincoln-Way Community High School District #210 CAB Series B ¤ | | | 0.00 | | | | 1-1-2027 | | | | 685,000 | | | | 533,033 | |
| | | | |
Will County ILLincoln-Way Community High School District #210 CAB Series B ¤ | | | 0.00 | | | | 1-1-2033 | | | | 1,000,000 | | | | 589,460 | |
| | | | |
Will County ILLincoln-Way Community High School District #210 Series A | | | 3.25 | | | | 1-1-2030 | | | | 450,000 | | | | 407,628 | |
| | | | |
Will County ILLincoln-Way Community High School District #210 Series A | | | 5.00 | | | | 1-1-2030 | | | | 1,000,000 | | | | 1,050,700 | |
| | | | |
| | | | | | | | | | | | | | | 10,178,688 | |
| | | | | | | | | | | | | | | | |
| | | | |
| Health Revenue: 0.72% | | | | | | | | | | | | |
| | | | |
Friendship Village of Schaumburg Illinois Finance Authority Series 2017 | | | 5.00 | | | | 2-15-2037 | | | | 1,000,000 | | | | 966,970 | |
| | | | | | | | | | | | | | | | |
| | | | |
| Miscellaneous Revenue: 2.26% | | | | | | | | | | | | |
| | | | |
Chicago IL Certificate of Participation River Point Plaza Redevelopment Project Series A 144A | | | 4.84 | | | | 4-15-2028 | | | | 2,000,000 | | | | 2,018,040 | |
| | | | |
Illinois | | | 5.50 | | | | 7-1-2025 | | | | 250,000 | | | | 277,610 | |
| | | | |
Illinois Finance Authority Educational Facility Senior Rogers Park Montessori School | | | 6.00 | | | | 2-1-2034 | | | | 680,000 | | | | 743,519 | |
| | | | |
| | | | | | | | | | | | | | | 3,039,169 | |
| | | | | | | | | | | | | | | | |
| | | | |
| Tax Revenue: 5.52% | | | | | | | | | | | | |
| | | | |
Chicago IL Sales Tax | | | 5.00 | | | | 1-1-2032 | | | | 1,500,000 | | | | 1,779,510 | |
| | | | |
Chicago IL Sales Tax Series A | | | 5.00 | | | | 1-1-2041 | | | | 1,000,000 | | | | 1,088,820 | |
| | | | |
Chicago IL Transit Authority Sales Tax Receipts Bonds (AGM Insured) | | | 5.00 | | | | 12-1-2044 | | | | 1,000,000 | | | | 1,116,980 | |
| | | | |
Hillside IL Tax Increment Refunding Bond | | | 5.00 | | | | 1-1-2030 | | | | 1,345,000 | | | | 1,398,679 | |
| | | | |
Illinois Sports Facilities Authority State Tax Supported CAB (Ambac Insured) ¤ | | | 0.00 | | | | 6-15-2025 | | | | 1,140,000 | | | | 948,537 | |
| | | | |
Metropolitan Pier & Exposition Authority McCormick Place Expansion Project Series A | | | 5.00 | | | | 6-15-2057 | | | | 1,000,000 | | | | 1,097,410 | |
| | | | |
| | | | | | | | | | | | | | | 7,429,936 | |
| | | | | | | | | | | | | | | | |
| | | | |
| | | | | | | | | | | | | | | 24,426,365 | |
| | | | | | | | | | | | | | | | |
| | | | |
Iowa: 1.32% | | | | | | | | | | | | | | | | |
| | | | |
| Health Revenue: 1.32% | | | | | | | | | | | | |
| | | | |
Iowa Finance Authority Senior Housing Northcrest Incorporated Project Series A | | | 5.00 | | | | 3-1-2028 | | | | 1,615,000 | | | | 1,780,990 | |
| | | | | | | | | | | | | | | | |
| | | | |
Kansas: 2.22% | | | | | | | | | | | | | | | | |
| | | | |
| Health Revenue: 0.80% | | | | | | | | | | | | |
| | | | |
Kansas State Development Finance Authority Revenue Bond Series A | | | 5.25 | | | | 11-15-2033 | | | | 1,000,000 | | | | 1,076,930 | |
| | | | | | | | | | | | | | | | |
| | | | |
| Tax Revenue: 1.42% | | | | | | | | | | | | |
| | | | |
Wyandotte County & Kansas City KS Special Obligation Refunding & Improvement Bonds Plaza Redevelopment Project | | | 4.00 | | | | 12-1-2028 | | | | 725,000 | | | | 742,719 | |
| | | | |
Wyandotte County & Kansas City KS Special Obligation Vacation Village Project Area 4 Major Multi-Sport Athletic Complex Project CAB Series 2015 144A¤ | | | 0.00 | | | | 9-1-2034 | | | | 2,935,000 | | | | 1,163,816 | |
| | | | |
| | | | | | | | | | | | | | | 1,906,535 | |
| | | | | | | | | | | | | | | | |
| | | | |
| | | | | | | | | | | | | | | 2,983,465 | |
| | | | | | | | | | | | | | | | |
Wells Fargo High Yield Municipal Bond Fund | 15
Portfolio of investments—June 30, 2019
| | | | | | | | | | | | | | | | |
| | | Interest
rate | | | Maturity
date | | | Principal | | | Value | |
Kentucky: 0.79% | | | | | | | | | | | | | | | | |
| | | | |
| Health Revenue: 0.79% | | | | | | | | | | | | |
| | | | |
Kentucky EDFA Rosedale Green Project Refunding Bond | | | 5.50 | % | | | 11-15-2035 | | | $ | 1,000,000 | | | $ | 1,061,610 | |
| | | | | | | | | | | | | | | | |
| | | | |
Maryland: 0.80% | | | | | | | | | | | | | | | | |
| | | | |
| Education Revenue: 0.80% | | | | | | | | | | | | |
| | | | |
Prince George’s County MD Chesapeake Lighthouse Charter School Project Series2016-A 144A | | | 6.90 | | | | 8-1-2041 | | | | 1,000,000 | | | | 1,081,650 | |
| | | | | | | | | | | | | | | | |
| | | | |
Massachusetts: 1.02% | | | | | | | | | | | | | | | | |
| | | | |
| Health Revenue: 1.02% | | | | | | | | | | | | |
| | | | |
Massachusetts Development Finance Agency Linden Ponds Incorporated Facility 144A | | | 4.00 | | | | 11-15-2023 | | | | 1,335,000 | | | | 1,367,521 | |
| | | | | | | | | | | | | | | | |
| | | | |
Michigan: 6.77% | | | | | | | | | | | | | | | | |
| | | | |
| Education Revenue: 0.59% | | | | | | | | | | | | |
| | | | |
Michigan Finance Authority Limited Obligation Public School Academy Cesar Chavez Academy Project | | | 5.00 | | | | 2-1-2022 | | | | 155,000 | | | | 157,038 | |
| | | | |
Michigan Public Educational Facilities Authority Limited Obligation Bradford Academy Project 144A | | | 6.50 | | | | 9-1-2037 | | | | 190,000 | | | | 144,474 | |
| | | | |
Michigan Public Educational Facilities Authority Limited Obligation Crescent Academy Project | | | 7.00 | | | | 10-1-2036 | | | | 292,500 | | | | 292,757 | |
| | | | |
Oakland County MI Economic Development Corporation The Academy of The Sacred Heart Project Series A | | | 6.50 | | | | 12-15-2036 | | | | 235,000 | | | | 199,750 | |
| | | | |
| | | | | | | | | | | | | | | 794,019 | |
| | | | | | | | | | | | | | | | |
| | | | |
| GO Revenue: 1.09% | | | | | | | | | | | | |
| | | | |
Detroit MI | | | 5.00 | | | | 4-1-2027 | | | | 500,000 | | | | 560,615 | |
| | | | |
Wayne County MI Building Improvement Series A | | | 6.75 | | | | 11-1-2039 | | | | 900,000 | | | | 906,849 | |
| | | | |
| | | | | | | | | | | | | | | 1,467,464 | |
| | | | | | | | | | | | | | | | |
| | | | |
| Miscellaneous Revenue: 1.12% | | | | | | | | | | | | |
| | | | |
Charyl Stockwell Academy Michigan Public School Refunding Bond | | | 4.88 | | | | 10-1-2023 | | | | 330,000 | | | | 335,095 | |
| | | | |
Michigan Municipal Bond Authority Local Government Loan Program Series C (Ambac Insured) | | | 4.75 | | | | 5-1-2027 | | | | 950,000 | | | | 950,428 | |
| | | | |
Michigan Public Educational Facilities Authority Chandler Park Academy | | | 6.35 | | | | 11-1-2028 | | | | 225,000 | | | | 225,407 | |
| | | | |
| | | | | | | | | | | | | | | 1,510,930 | |
| | | | | | | | | | | | | | | | |
| | | | |
| Tax Revenue: 2.27% | | | | | | | | | | | | |
| | | | |
Detroit MI Downtown Development Authority CAB ¤ | | | 0.00 | | | | 7-1-2020 | | | | 285,000 | | | | 273,911 | |
| | | | |
Detroit MI Downtown Development Authority CAB ¤ | | | 0.00 | | | | 7-1-2021 | | | | 170,000 | | | | 156,519 | |
| | | | |
Detroit MI Downtown Development Authority CAB ¤ | | | 0.00 | | | | 7-1-2024 | | | | 20,000 | | | | 15,872 | |
| | | | |
Detroit MI Downtown Development Authority CAB ¤ | | | 0.00 | | | | 7-1-2025 | | | | 580,000 | | | | 436,404 | |
| | | | |
Michigan Finance Authority Local Government Loan Program City of Detroit Financial Recovery Refunding Bond Series F | | | 4.50 | | | | 10-1-2029 | | | | 1,000,000 | | | | 1,080,060 | |
| | | | |
Michigan Finance Authority Local Government Loan Program Public Lighting Authority Refunding Bond Series B | | | 5.00 | | | | 7-1-2044 | | | | 1,000,000 | | | | 1,082,970 | |
| | | | |
| | | | | | | | | | | | | | | 3,045,736 | |
| | | | | | | | | | | | | | | | |
| | | | |
| Water & Sewer Revenue: 1.70% | | | | | | | | | | | | |
| | | | |
Michigan Finance Authority Local Government Loan Program Detroit Refunding Bond SeriesD-4 | | | 5.00 | | | | 7-1-2031 | | | | 1,015,000 | | | | 1,159,323 | |
| | | | |
Michigan Finance Authority Local Government Loan Program Detroit Refunding Bond SeriesD-6 (National Insured) | | | 5.00 | | | | 7-1-2036 | | | | 1,000,000 | | | | 1,128,390 | |
| | | | |
| | | | | | | | | | | | | | | 2,287,713 | |
| | | | | | | | | | | | | | | | |
| | | | |
| | | | | | | | | | | | | | | 9,105,862 | |
| | | | | | | | | | | | | | | | |
16 | Wells Fargo High Yield Municipal Bond Fund
Portfolio of investments—June 30, 2019
| | | | | | | | | | | | | | | | |
| | | Interest
rate | | | Maturity
date | | | Principal | | | Value | |
Minnesota: 0.99% | | | | | | | | | | | | | | | | |
| | | | |
| Education Revenue: 0.41% | | | | | | | | | | | | |
| | | | |
Deephaven MN Charter School Eagle Ridge Academy Project Series A | | | 4.40 | % | | | 7-1-2025 | | | $ | 125,000 | | | $ | 129,901 | |
| | | | |
Deephaven MN Charter School Eagle Ridge Academy Project Series A | | | 5.00 | | | | 7-1-2030 | | | | 195,000 | | | | 211,908 | |
| | | | |
Deephaven MN Charter School Eagle Ridge Academy Project Series A | | | 5.25 | | | | 7-1-2037 | | | | 190,000 | | | | 205,498 | |
| | | | |
| | | | | | | | | | | | | | | 547,307 | |
| | | | | | | | | | | | | | | | |
| | | | |
| Housing Revenue: 0.58% | | | | | | | | | | | | |
| | | | |
Minneapolis MN Student Housing Riverton Community Housing Project Refunding Bond | | | 4.70 | | | | 8-1-2026 | | | | 335,000 | | | | 358,708 | |
| | | | |
Minneapolis MN Student Housing Riverton Community Housing Project Refunding Bond | | | 4.80 | | | | 8-1-2027 | | | | 400,000 | | | | 428,616 | |
| | | | |
| | | | | | | | | | | | | | | 787,324 | |
| | | | | | | | | | | | | | | | |
| | | | |
| | | | | | | | | | | | | | | 1,334,631 | |
| | | | | | | | | | | | | | | | |
Mississippi: 1.18% | | | | | | | | | | | | | | | | |
| | | | |
| Resource Recovery Revenue: 1.18% | | | | | | | | | | | | |
| | | | |
Mississippi Business Finance Corporation AMT Waste Pro USA Incorporated Project 144A | | | 5.00 | | | | 2-1-2036 | | | | 1,500,000 | | | | 1,588,980 | |
| | | | | | | | | | | | | | | | |
| | | | |
Missouri: 1.05% | | | | | | | | | | | | | | | | |
| | | | |
| Tax Revenue: 1.05% | | | | | | | | | | | | |
| | | | |
Blue Springs MO Special Obligation Tax Refunding & Improvement Bonds Adams Farm Project Series A | | | 4.00 | | | | 6-1-2026 | | | | 490,000 | | | | 496,316 | |
| | | | |
Richmond Heights MO Francis Place Redevelopment Project | | | 5.63 | | | | 11-1-2025 | | | | 920,000 | | | | 920,359 | |
| | | | |
| | | | | | | | | | | | | | | 1,416,675 | |
| | | | | | | | | | | | | | | | |
| | | | |
Nevada: 1.28% | | | | | | | | | | | | | | | | |
| | | | |
| Industrial Development Revenue: 1.28% | | | | | | | | | | | | |
| | | | |
Director of the State of Nevada Department of Business & Industry AMT Fulcrum Sierra Biofuels LLC Project 144A | | | 6.25 | | | | 12-15-2037 | | | | 1,500,000 | | | | 1,718,010 | |
| | | | | | | | | | | | | | | | |
| | | | |
New Jersey: 4.15% | | | | | | | | | | | | | | | | |
| | | | |
| GO Revenue: 0.82% | | | | | | | | | | | | |
| | | | |
Newark NJ Qualified General Improvement Series A | | | 5.00 | | | | 7-15-2027 | | | | 1,000,000 | | | | 1,097,180 | |
| | | | | | | | | | | | | | | | |
| | | | |
| Industrial Development Revenue: 0.20% | | | | | | | | | | | | |
| | | | |
New Jersey EDA Continental Airlines Incorporated Project | | | 5.25 | | | | 9-15-2029 | | | | 250,000 | | | | 273,995 | |
| | | | | | | | | | | | | | | | |
| | | | |
| Miscellaneous Revenue: 0.96% | | | | | | | | | | | | |
| | | | |
Essex County NJ Improvement Authority Lease Newark Project Series A | | | 6.25 | | | | 11-1-2030 | | | | 200,000 | | | | 212,710 | |
| | | | |
New Jersey EDA School Facilities Construction Project Series NN (National Insured) | | | 5.00 | | | | 3-1-2030 | | | | 1,000,000 | | | | 1,083,930 | |
| | | | |
| | | | | | | | | | | | | | | 1,296,640 | |
| | | | | | | | | | | | | | | | |
| | | | |
| Transportation Revenue: 2.17% | | | | | | | | | | | | |
| | | | |
New Jersey TTFA CAB Series A ¤ | | | 0.00 | | | | 12-15-2031 | | | | 1,000,000 | | | | 663,770 | |
| | | | |
New Jersey TTFA Series C | | | 5.25 | | | | 6-15-2032 | | | | 2,000,000 | | | | 2,252,377 | |
| | | | |
| | | | | | | | | | | | | | | 2,916,147 | |
| | | | | | | | | | | | | | | | |
| | | | |
| | | | | | | | | | | | | | | 5,583,962 | |
| | | | | | | | | | | | | | | | |
Wells Fargo High Yield Municipal Bond Fund | 17
Portfolio of investments—June 30, 2019
| | | | | | | | | | | | | | | | |
| | | Interest
rate | | | Maturity
date | | | Principal | | | Value | |
New York: 1.06% | | | | | | | | | | | | | | | | |
| | | | |
| Education Revenue: 0.77% | | | | | | | | | | | | |
| | | | |
Hempstead Town NY Local Development Corporation The Academy Charter School Project Series A | | | 7.65 | % | | | 2-1-2044 | | | $ | 995,000 | | | $ | 1,031,168 | |
| | | | | | | | | | | | | | | | |
| | | | |
| Utilities Revenue: 0.29% | | | | | | | | | | | | |
| | | | |
Green Island NY Power Authority Power System | | | 6.00 | | | | 12-15-2020 | | | | 385,000 | | | | 390,671 | |
| | | | | | | | | | | | | | | | |
| | | | |
| | | | | | | | | | | | | | | 1,421,839 | |
| | | | | | | | | | | | | | | | |
| | | | |
Ohio: 1.58% | | | | | | | | | | | | | | | | |
| | | | |
| Miscellaneous Revenue: 0.83% | | | | | | | | | | | | |
| | | | |
Ohio Private Activity Bond AMT Portsmouth Bypass Project (AGM Insured) | | | 5.00 | | | | 12-31-2039 | | | | 1,000,000 | | | | 1,123,410 | |
| | | | | | | | | | | | | | | | |
| | | | |
| Resource Recovery Revenue: 0.75% | | | | | | | | | | | | |
| | | | |
Ohio Air Quality Development Authority Ohio Valley Electric Corporation Series E | | | 5.63 | | | | 10-1-2019 | | | | 1,000,000 | | | | 1,005,580 | |
| | | | | | | | | | | | | | | | |
| | | | |
| | | | | | | | | | | | | | | 2,128,990 | |
| | | | | | | | | | | | | | | | |
| | | | |
Oklahoma: 0.44% | | | | | | | | | | | | | | | | |
| | | | |
| Health Revenue: 0.44% | | | | | | | | | | | | |
| | | | |
Oklahoma Development Finance Authority Oklahoma University Medicine Project Series B | | | 5.50 | | | | 8-15-2057 | | | | 500,000 | | | | 592,045 | |
| | | | | | | | | | | | | | | | |
| | | | |
Oregon: 0.54% | | | | | | | | | | | | | | | | |
| | | | |
| Health Revenue: 0.54% | | | | | | | | | | | | |
| | | | |
Multnomah County OR Hospital Facilities Authority Mirabella South Waterfront Project Refunding Bond Series A | | | 5.00 | | | | 10-1-2019 | | | | 120,000 | | | | 120,848 | |
| | | | |
Polk County OR Hospital Facility Authority Revenue Bond Dallas Retirement Village Project Series2015-A | | | 5.00 | | | | 7-1-2025 | | | | 550,000 | | | | 601,750 | |
| | | | |
| | | | | | | | | | | | | | | 722,598 | |
| | | | | | | | | | | | | | | | |
| | | | |
Pennsylvania: 6.23% | | | | | | | | | | | | | | | | |
| | | | |
| Education Revenue: 2.22% | | | | | | | | | | | | |
| | | | |
Allegheny County PA IDA Propel Charter School Sunrise Project | | | 5.25 | | | | 7-15-2023 | | | | 95,000 | | | | 98,373 | |
| | | | |
East Hempfield Township PA IDA Student Services Incorporated Student Housing Project of Millersville University | | | 5.00 | | | | 7-1-2029 | | | | 500,000 | | | | 546,330 | |
| | | | |
Montgomery County PA Higher Education & Health Authority Arcadia University | | | 5.00 | | | | 4-1-2026 | | | | 1,655,000 | | | | 1,915,464 | |
| | | | |
Philadelphia PA IDA Tacony Academy Charter School Project | | | 6.88 | | | | 6-15-2033 | | | | 375,000 | | | | 417,671 | |
| | | | |
| | | | | | | | | | | | | | | 2,977,838 | |
| | | | | | | | | | | | | | | | |
| | | | |
| Health Revenue: 0.75% | | | | | | | | | | | | |
| | | | |
Quakertown PA General Authority Health LifeQuest Obligated Group Refunding Bond Series C | | | 5.30 | | | | 7-1-2042 | | | | 1,000,000 | | | | 1,008,810 | |
| | | | | | | | | | | | | | | | |
| | | | |
| Industrial Development Revenue: 0.97% | | | | | | | | | | | | |
| | | | |
Pennsylvania EDFA Carbonlite P LLC Project 144A%% | | | 5.75 | | | | 6-1-2036 | | | | 1,250,000 | | | | 1,303,550 | |
| | | | | | | | | | | | | | | | |
| | | | |
| Miscellaneous Revenue: 2.29% | | | | | | | | | | | | |
| | | | |
Chester County PA IDA Woodlands at Graystone Project Series 2018 144A | | | 5.13 | | | | 3-1-2048 | | | | 1,050,000 | | | | 1,103,508 | |
| | | | |
Philadelphia PA State Public School Building Authority School District Project | | | 5.00 | | | | 4-1-2031 | | | | 1,000,000 | | | | 1,074,890 | |
| | | | |
Scranton PA RDA Series A (Municipal Government Guaranty Insured) | | | 5.00 | | | | 11-15-2021 | | | | 880,000 | | | | 906,497 | |
| | | | |
| | | | | | | | | | | | | | | 3,084,895 | |
| | | | | | | | | | | | | | | | |
| | | | |
| | | | | | | | | | | | | | | 8,375,093 | |
| | | | | | | | | | | | | | | | |
18 | Wells Fargo High Yield Municipal Bond Fund
Portfolio of investments—June 30, 2019
| | | | | | | | | | | | | | | | |
| | | Interest
rate | | | Maturity
date | | | Principal | | | Value | |
Puerto Rico: 0.74% | | | | | | | | | | | | | | | | |
| | | | |
| Tax Revenue: 0.74% | | | | | | | | | | | | |
| | | | |
Puerto Rico Sales Tax Financing Corporation SeriesA-1 | | | 5.00 | % | | | 7-1-2058 | | | $ | 1,000,000 | | | $ | 1,000,000 | |
| | | | | | | | | | | | | | | | |
| | | | |
South Carolina: 2.07% | | | | | | | | | | | | | | | | |
| | | | |
| Education Revenue: 0.51% | | | | | | | | | | | | |
| | | | |
South Carolina Jobs EDA York Preparatory Academy Project Series A | | | 5.75 | | | | 11-1-2023 | | | | 130,000 | | | | 134,667 | |
| | | | |
South Carolina Jobs EDA York Preparatory Academy Project Series A | | | 7.25 | | | | 11-1-2045 | | | | 500,000 | | | | 551,535 | |
| | | | |
| | | | | | | | | | | | | | | 686,202 | |
| | | | | | | | | | | | | | | | |
| | | | |
| Health Revenue: 0.79% | | | | | | | | | | | | |
| | | | |
South Carolina Jobs EDA Residential Facilities Revenue Episcopal Home Still Hopes Refunding Bond Series A | | | 5.00 | | | | 4-1-2048 | | | | 1,000,000 | | | | 1,057,800 | |
| | | | | | | | | | | | | | | | |
| | | | |
| Resource Recovery Revenue: 0.77% | | | | | | | | | | | | |
| | | | |
South Carolina Jobs EDA Solid Waste Disposal AMT RePower South Berkeley LLC Project Green Bond 144A | | | 6.25 | | | | 2-1-2045 | | | | 1,000,000 | | | | 1,040,900 | |
| | | | | | | | | | | | | | | | |
| | | | |
| | | | | | | | | | | | | | | 2,784,902 | |
| | | | | | | | | | | | | | | | |
| | | | |
Tennessee: 1.16% | | | | | | | | | | | | | | | | |
| | | | |
| Tax Revenue: 1.16% | | | | | | | | | | | | |
| | | | |
Bristol TN Industrial Development Board Sales Tax CAB Series B 144A¤ | | | 0.00 | | | | 12-1-2031 | | | | 2,000,000 | | | | 1,022,920 | |
| | | | |
Nashville TN Metropolitan Development & Housing Agency Tax Increment Fifth & Broadway Development Project 144A | | | 5.13 | | | | 6-1-2036 | | | | 500,000 | | | | 543,375 | |
| | | | | | | | | | | | | | | | |
| | | | |
| | | | | | | | | | | | | | | 1,566,295 | |
| | | | | | | | | | | | | | | | |
| | | | |
Texas: 7.97% | | | | | | | | | | | | | | | | |
| | | | |
| Education Revenue: 1.03% | | | | | | | | | | | | |
| | | | |
Arlington TX Higher Education Finance Corporation Universal Academy Series A | | | 7.00 | | | | 3-1-2034 | | | | 320,000 | | | | 334,134 | |
| | | | |
Pottsboro TX Higher Education Finance Corporation Imagine International Academy of North Texas Series A | | | 3.88 | | | | 8-15-2026 | | | | 1,015,000 | | | | 1,047,176 | |
| | | | |
| | | | | | | | | | | | | | | 1,381,310 | |
| | | | | | | | | | | | | | | | |
| | | | |
| GO Revenue: 0.79% | | | | | | | | | | | | |
| | | | |
Port Isabel TX 144A | | | 5.10 | | | | 2-15-2049 | | | | 1,000,000 | | | | 1,063,890 | |
| | | | | | | | | | | | | | | | |
| | | | |
| Health Revenue: 1.40% | | | | | | | | | | | | |
| | | | |
New Hope TX Cultural Education Facilities Finance Corporation Retirement Facility Presbyterian Village North Project Series 2018 | | | 5.00 | | | | 10-1-2025 | | | | 1,730,000 | | | | 1,887,568 | |
| | | | | | | | | | | | | | | | |
| | | | |
| Miscellaneous Revenue: 2.17% | | | | | | | | | | | | |
| | | | |
Hackberry TX Special Assessment Public Improvement District #3 Phase #13 | | | 6.00 | | | | 9-1-2026 | | | | 185,000 | | | | 191,395 | |
| | | | |
Lewisville TX Combination Contract Castle Hills Public Improvement Bonds District #5 144A | | | 6.50 | | | | 9-1-2034 | | | | 905,000 | | | | 908,240 | |
| | | | |
Lewisville TX Combination Contract Castle Hills Public Improvement Bonds District #6 144A | | | 5.50 | | | | 9-1-2039 | | | | 500,000 | | | | 503,300 | |
| | | | |
Lewisville TX Combination Contract Castle Hills Public Improvement Bonds District #6 144A | | | 6.00 | | | | 9-1-2037 | | | | 1,250,000 | | | | 1,313,988 | |
| | | | |
| | | | | | | | | | | | | | | 2,916,923 | |
| | | | | | | | | | | | | | | | |
| | | | |
| Resource Recovery Revenue: 2.23% | | | | | | | | | | | | |
| | | | |
Port Arthur TX Navigation District Jefferson County Environmental Facilities Motiva Enterprises LLC Project Series A ø | | | 2.07 | | | | 4-1-2040 | | | | 3,000,000 | | | | 3,000,000 | |
| | | | | | | | | | | | | | | | |
Wells Fargo High Yield Municipal Bond Fund | 19
Portfolio of investments—June 30, 2019
| | | | | | | | | | | | | | | | |
| | | Interest
rate | | | Maturity date | | | Principal | | | Value | |
| Transportation Revenue: 0.18% | | | | | | | | | | | | |
| | | | |
Texas Private Activity Bond Surface Transportation Corporation Project NTE Mobility Partners Segments LLC | | | 7.00 | % | | | 12-31-2038 | | | $ | 200,000 | | | $ | 235,026 | |
| | | | | | | | | | | | | | | | |
| | | | |
| Utilities Revenue: 0.17% | | | | | | | | | | | | |
| | | | |
Texas Gas Supply SA Energy Acquisition Public Facilities Corporation | | | 5.50 | | | | 8-1-2027 | | | | 190,000 | | | | 234,162 | |
| | | | | | | | | | | | | | | | |
| | | | |
| | | | | | | | | | | | | | | 10,718,879 | |
| | | | | | | | | | | | | | | | |
Utah: 0.75% | | | | | | | | | | | | | | | | |
| | | | |
| Education Revenue: 0.75% | | | | | | | | | | | | |
| | | | |
Utah Finance Authority Charter School Revenue Spectrum Academy Project 144A | | | 5.00 | | | | 4-15-2030 | | | | 1,000,000 | | | | 1,010,000 | |
| | | | | | | | | | | | | | | | |
| | | | |
Virginia: 1.83% | | | | | | | | | | | | | | | | |
| | | | |
| Health Revenue: 0.81% | | | | | | | | | | | | |
| | | | |
Henrico County VA EDA Residential Care Facilities Pinnacle Living Series A | | | 5.00 | | | | 6-1-2049 | | | | 1,000,000 | | | | 1,094,290 | |
| | | | | | | | | | | | | | | | |
| | | | |
| Miscellaneous Revenue: 1.02% | | | | | | | | | | | | |
| | | | |
Stafford County & Staunton VA IDA Community Services Boards League/Central Series B | | | 6.50 | | | | 8-1-2028 | | | | 1,370,000 | | | | 1,371,685 | |
| | | | | | | | | | | | | | | | |
| | | | |
| | | | | | | | | | | | | | | 2,465,975 | |
| | | | | | | | | | | | | | | | |
| | | | |
Washington: 0.75% | | | | | | | | | | | | | | | | |
| | | | |
| Health Revenue: 0.75% | | | | | | | | | | | | |
| | | | |
Skagit County WA Public Hospital District #1 Skagit Valley Hospital Project | | | 5.25 | | | | 12-1-2025 | | | | 250,000 | | | | 260,478 | |
| | | | |
Washington Housing Finance Commission Bayview Manor Homes Series A 144A | | | 4.00 | | | | 7-1-2026 | | | | 730,000 | | | | 752,769 | |
| | | | |
| | | | | | | | | | | | | | | 1,013,247 | |
| | | | | | | | | | | | | | | | |
| | | | |
West Virginia: 1.21% | | | | | | | | | | | | | | | | |
| | | | |
| Tax Revenue: 1.21% | | | | | | | | | | | | |
| | | | |
Monongalia County WV Commission Refunding & Improvement Bonds University Town Center Series A 144A | | | 5.75 | | | | 6-1-2043 | | | | 1,500,000 | | | | 1,623,615 | |
| | | | | | | | | | | | | | | | |
| | | | |
Wisconsin: 3.80% | | | | | | | | | | | | | | | | |
| | | | |
| Education Revenue: 2.64% | | | | | | | | | | | | |
| | | | |
Wisconsin PFA Charter School Voyager Funding Incorporated Project Series A | | | 4.13 | | | | 10-1-2024 | | | | 230,000 | | | | 239,356 | |
| | | | |
Wisconsin PFA Coral Academy Science Las Vegas Series A | | | 5.00 | | | | 7-1-2024 | | | | 370,000 | | | | 391,578 | |
| | | | |
Wisconsin PFA Research Triangle High School Project Series2015-A 144A | | | 5.63 | | | | 7-1-2045 | | | | 1,000,000 | | | | 1,036,230 | |
| | | | |
Wisconsin PFA Wilson Preparatory Academy Series A 144A | | | 4.13 | | | | 6-15-2029 | | | | 540,000 | | | | 555,784 | |
| | | | |
Wisconsin PFA Wilson Preparatory Academy Series A 144A | | | 5.00 | | | | 6-15-2039 | | | | 1,285,000 | | | | 1,332,288 | |
| | | | |
| | | | | | | | | | | | | | | 3,555,236 | |
| | | | | | | | | | | | | | | | |
| | | | |
| Health Revenue: 1.16% | | | | | | | | | | | | |
| | | | |
Wisconsin HEFA Wisconsin Illinois Senior Housing Incorporated Series2018-A | | | 5.25 | | | | 8-1-2048 | | | | 1,500,000 | | | | 1,552,500 | |
| | | | | | | | | | | | | | | | |
| | | | |
| | | | | | | | | | | | | | | 5,107,736 | |
| | | | | | | | | | | | | | | | |
| | | | |
Total Municipal Obligations (Cost $123,799,329) | | | | | | | | | | | | | | | 131,390,064 | |
| | | | | | | | | | | | | | | | |
20 | Wells Fargo High Yield Municipal Bond Fund
Portfolio of investments—June 30, 2019
| | | | | | | | | | | | | | | | | | | | |
| | | Yield | | | | | | | | | Shares | | | Value | |
| Short-Term Investments: 1.44% | |
|
| Investment Companies: 1.44% | |
| | | | | |
Wells Fargo Municipal Cash Management Money Market Fund Institutional Class (l)(u)## | | | 1.82 | % | | | | | | | | | | | 1,932,890 | | | $ | 1,934,050 | |
| | | | | | | | | | | | | | | | | | | | |
| | | | | |
Total Short-Term Investments (Cost $1,934,041) | | | | | | | | | | | | | | | | | | | 1,934,050 | |
| | | | | | | | | | | | | | | | | | | | |
| | | | | | | | |
| Total investments in securities (Cost $125,733,370) | | | 99.09 | % | | | 133,324,114 | |
| | |
Other assets and liabilities, net | | | 0.91 | | | | 1,222,212 | |
| | | | | | | | |
| Total net assets | | | 100.00 | % | | $ | 134,546,326 | |
| | | | | | | | |
| 144A | The security may be resold in transactions exempt from registration, normally to qualified institutional buyers, pursuant to Rule 144A under the Securities Act of 1933. |
| ¤ | The security is issued in zero coupon form with no periodic interest payments. |
| %% | The security is purchased on a when-issued basis. |
| ø | Variable rate demand notes are subject to a demand feature which reduces the effective maturity. The maturity date shown represents the final maturity date of the security. The interest rate is determined and reset by the issuer daily, weekly, or monthly depending upon the terms of the security. The rate shown is the rate in effect at period end. |
| (l) | The issuer of the security is an affiliated person of the Fund as defined in the Investment Company Act of 1940. |
| (u) | The rate represents the7-day annualized yield at period end. |
| ## | All or a portion of this security is segregated for when-issued securities. |
Abbreviations:
| AGM | Assured Guaranty Municipal |
| Ambac | Ambac Financial Group Incorporated |
| AMT | Alternative minimum tax |
| CAB | Capital appreciation bond |
| CCAB | Convertible capital appreciation bond |
| CDA | Community Development Authority |
| EDA | Economic Development Authority |
| EDFA | Economic Development Finance Authority |
| HEFA | Health & Educational Facilities Authority |
| IDA | Industrial Development Authority |
| National | National Public Finance Guarantee Corporation |
| PCFA | Pollution Control Financing Authority |
| PFA | Public Finance Authority |
| RDA | Redevelopment Authority |
| TTFA | Transportation Trust Fund Authority |
Investments in Affiliates
An affiliated investment is an investment in which the Fund owns at least 5% of the outstanding voting shares of the issuer or as a result of other relationships, such as the Fund and the issuer having the same investment manager. Transactions with issuers that were either affiliated persons of the Fund at the beginning of the period or the end of the period were as follows:
| | | | | | | | | | | | | | | | | | | | | | | | | | | | | | | | | | | | |
| | | Shares,
beginning of
period | | | Shares
purchased | | | Shares
sold | | | Shares,
end of
period | | | Net
realized
gains
(losses) | | | Net
change in
unrealized
gains
(losses) | | | Income
from
affiliated
securities | | | Value,
end
of period | | | % of
net
assets | |
Short-Term Investments | | | | | | | | | | | | | | | | | | | | | | | | | | | | | | | | | | | | |
Investment Companies | | | | | | | | | | | | | | | | | | | | | | | | | | | | | | | | | | | | |
Wells Fargo Municipal Cash Management Money Market Fund Institutional Class | | | 193,315 | | | | 49,892,422 | | | | 48,152,847 | | | | 1,932,890 | | | $ | 251 | | | $ | 9 | | | $ | 11,535 | | | $ | 1,934,050 | | | | 1.44 | % |
The accompanying notes are an integral part of these financial statements.
Wells Fargo High Yield Municipal Bond Fund | 21
Statement of assets and liabilities—June 30, 2019
| | | | |
| | | | |
| |
Assets | | | | |
Investments in unaffiliated securities, at value (cost $123,799,329) | | $ | 131,390,064 | |
Investments in affiliated securities, at value (cost $1,934,041) | | | 1,934,050 | |
Receivable for investments sold | | | 1,588,223 | |
Receivable for Fund shares sold | | | 53,126 | |
Receivable for interest | | | 1,670,294 | |
Prepaid expenses and other assets | | | 68,009 | |
| | | | |
Total assets | | | 136,703,766 | |
| | | | |
| |
Liabilities | | | | |
Payable for investments purchased | | | 1,778,965 | |
Payable for Fund shares redeemed | | | 254,194 | |
Management fee payable | | | 29,364 | |
Dividends payable | | | 26,490 | |
Administration fees payable | | | 11,322 | |
Distribution fee payable | | | 6,134 | |
Trustees’ fees and expenses payable | | | 1,381 | |
Accrued expenses and other liabilities | | | 49,590 | |
| | | | |
Total liabilities | | | 2,157,440 | |
| | | | |
Total net assets | | $ | 134,546,326 | |
| | | | |
| |
Net assets consist of | | | | |
Paid-in capital | | $ | 127,393,255 | |
Total distributable earnings | | | 7,153,071 | |
| | | | |
Total net assets | | $ | 134,546,326 | |
| | | | |
| |
Computation of net asset value and offering price per share | | | | |
Net assets – Class A | | $ | 23,674,078 | |
Shares outstanding – Class A1 | | | 2,157,531 | |
Net asset value per share – Class A | | | $10.97 | |
Maximum offering price per share – Class A2 | | | $11.49 | |
Net assets – Class C | | $ | 9,954,862 | |
Shares outstanding – Class C1 | | | 907,085 | |
Net asset value per share – Class C | | | $10.97 | |
Net assets – Class R6 | | $ | 25,867 | |
Shares outstanding – Class R61 | | | 2,356 | |
Net asset value per share – Class R6 | | | $10.98 | |
Net assets – Administrator Class | | $ | 15,704,264 | |
Shares outstanding – Administrator Class1 | | | 1,430,722 | |
Net asset value per share – Administrator Class | | | $10.98 | |
Net assets – Institutional Class | | $ | 85,187,255 | |
Shares outstanding – Institutional Class1 | | | 7,763,396 | |
Net asset value per share – Institutional Class | | | $10.97 | |
| 1 | The Fund has an unlimited number of authorized shares. |
| 2 | Maximum offering price is computed as 100/95.50 of net asset value. On investments of $50,000 or more, the offering price is reduced. |
The accompanying notes are an integral part of these financial statements.
22 | Wells Fargo High Yield Municipal Bond Fund
Statement of operations—year ended June 30, 2019
| | | | |
| | | | |
| |
Investment income | | | | |
Interest | | $ | 5,763,412 | |
Income from affiliated securities | | | 11,535 | |
| | | | |
Total investment income | | | 5,774,947 | |
| | | | |
| |
Expenses | | | | |
Management fee | | | 647,233 | |
Administration fees | | | | |
Class A | | | 32,520 | |
Class C | | | 14,727 | |
Class R6 | | | 7 | 1 |
Administrator Class | | | 19,457 | |
Institutional Class | | | 64,350 | |
Shareholder servicing fees | | | | |
Class A | | | 50,813 | |
Class C | | | 23,011 | |
Administrator Class | | | 48,429 | |
Distribution fee | | | | |
Class C | | | 69,034 | |
Custody and accounting fees | | | 17,505 | |
Professional fees | | | 58,701 | |
Registration fees | | | 101,898 | |
Shareholder report expenses | | | 28,722 | |
Trustees’ fees and expenses | | | 21,416 | |
Other fees and expenses | | | 10,741 | |
| | | | |
Total expenses | | | 1,208,564 | |
Less: Fee waivers and/or expense reimbursements | | | (319,341 | ) |
| | | | |
Net expenses | | | 889,223 | |
| | | | |
Net investment income | | | 4,885,724 | |
| | | | |
| |
Realized and unrealized gains (losses) on investments | | | | |
Net realized gains on: | | | | |
Unaffiliated securities | | | 723,760 | |
Affiliated securities | | | 251 | |
| | | | |
Net realized gains on investments | | | 724,011 | |
| | | | |
| |
Net change in unrealized gains (losses) on: | | | | |
Unaffiliated securities | | | 3,956,522 | |
Affiiliated securities | | | 9 | |
| | | | |
Net change in unrealized gains (losses) on investments | | | 3,956,531 | |
| | | | |
Net realized and unrealized gains (losses) on investments | | | 4,680,542 | |
| | | | |
Net increase in net assets resulting from operations | | $ | 9,566,266 | |
| | | | |
| 1 | For the period from July 31, 2018 (commencement of class operations) to June 30, 2019 |
The accompanying notes are an integral part of these financial statements.
Wells Fargo High Yield Municipal Bond Fund | 23
Statement of changes in net assets
| | | | | | | | | | | | | | | | |
| | | Year ended June 30, 2019 | | | Year ended June 30, 20181 | |
| | | | |
Operations | | | | | | | | | | | | | | | | |
Net investment income | | | | | | $ | 4,885,724 | | | | | | | $ | 4,902,547 | |
Net realized gains (losses) on investments | | | | | | | 724,011 | | | | | | | | (18,833 | ) |
Net change in unrealized gains (losses) on investments | | | | | | | 3,956,531 | | | | | | | | 2,722,837 | |
| | | | |
Net increase in net assets resulting from operations | | | | | | | 9,566,266 | | | | | | | | 7,606,551 | |
| | | | |
| | | | |
Distributions to shareholders from net investment income and net
realized gains | | | | | | | | | | | | | | | | |
Class A | | | | | | | (748,569 | ) | | | | | | | (674,381 | ) |
Class C | | | | | | | (267,644 | ) | | | | | | | (262,165 | ) |
Class R6 | | | | | | | (908 | )2 | | | | | | | N/A | |
Administrator Class | | | | | | | (717,353 | ) | | | | | | | (900,885 | ) |
Institutional Class | | | | | | | (3,150,417 | ) | | | | | | | (3,065,373 | ) |
| | | | |
Total distributions to shareholders | | | | | | | (4,884,891 | ) | | | | | | | (4,902,804 | ) |
| | | | |
| | | | |
Capital share transactions | | | Shares | | | | | | | | Shares | | | | | |
Proceeds from shares sold | | | | | | | | | | | | | | | | |
Class A | | | 891,097 | | | | 9,469,553 | | | | 523,458 | | | | 5,507,807 | |
Class C | | | 326,023 | | | | 3,467,080 | | | | 243,083 | | | | 2,563,225 | |
Class R6 | | | 2,356 | 2 | | | 25,000 | 2 | | | N/A | | | | N/A | |
Administrator Class | | | 509,916 | | | | 5,419,801 | | | | 823,935 | | | | 8,665,436 | |
Institutional Class | | | 3,781,572 | | | | 40,041,514 | | | | 2,688,557 | | | | 28,274,124 | |
| | | | |
| | | | | | | 58,422,948 | | | | | | | | 45,010,592 | |
| | | | |
Reinvestment of distributions | | | | | | | | | | | | | | | | |
Class A | | | 66,476 | | | | 710,565 | | | | 60,416 | | | | 635,499 | |
Class C | | | 24,085 | | | | 257,291 | | | | 23,038 | | | | 242,387 | |
Administrator Class | | | 53,338 | | | | 568,370 | | | | 72,339 | | | | 761,162 | |
Institutional Class | | | 280,408 | | | | 2,994,965 | | | | 267,171 | | | | 2,810,697 | |
| | | | |
| | | | | | | 4,531,191 | | | | | | | | 4,449,745 | |
| | | | |
Payment for shares redeemed | | | | | | | | | | | | | | | | |
Class A | | | (413,546 | ) | | | (4,406,588 | ) | | | (928,806 | ) | | | (9,778,906 | ) |
Class C | | | (282,977 | ) | | | (3,004,602 | ) | | | (265,986 | ) | | | (2,799,324 | ) |
Administrator Class | | | (1,457,134 | ) | | | (15,416,580 | ) | | | (773,657 | ) | | | (8,148,860 | ) |
Institutional Class | | | (3,433,887 | ) | | | (36,431,467 | ) | | | (2,956,600 | ) | | | (31,109,401 | ) |
| | | | |
| | | | | | | (59,259,237 | ) | | | | | | | (51,836,491 | ) |
| | | | |
Net increase (decrease) in net assets resulting from capital share transactions | | | | | | | 3,694,902 | | | | | | | | (2,376,154 | ) |
| | | | |
Total increase in net assets | | | | | | | 8,376,277 | | | | | | | | 327,593 | |
| | | | |
| | | | |
Net assets | | | | | | | | | | | | | | | | |
Beginning of period | | | | | | | 126,170,049 | | | | | | | | 125,842,456 | |
| | | | |
End of period | | | | | | $ | 134,546,326 | | | | | | | $ | 126,170,049 | |
| | | | |
| 1 | Effective for all filings after November 4, 2018, the SEC prospectively eliminated the requirement to parenthetically disclose undistributed net investment income at the end of the period and permitted the aggregation of distributions, with the exception of tax basis returns of capital. Overdistributed net investment income at June 30, 2018 was $5,672. The disaggregated distributions information for the year ended June 30, 2018 is included in Note 7,Distributions to Shareholders, in the notes to the financial statements. |
| 2 | For the period from July 31, 2018 (commencement of class operations) to June 30, 2019 |
The accompanying notes are an integral part of these financial statements.
24 | Wells Fargo High Yield Municipal Bond Fund
Financial highlights
(For a share outstanding throughout each period)
| | | | | | | | | | | | | | | | | | | | |
| | | Year ended June 30 | |
| CLASS A | | 2019 | | | 2018 | | | 2017 | | | 2016 | | | 2015 | |
Net asset value, beginning of period | | | $10.59 | | | | $10.37 | | | | $10.91 | | | | $10.34 | | | | $10.25 | |
Net investment income | | | 0.39 | | | | 0.40 | | | | 0.37 | | | | 0.35 | | | | 0.34 | |
Net realized and unrealized gains (losses) on investments | | | 0.38 | | | | 0.22 | | | | (0.46 | ) | | | 0.60 | | | | 0.18 | |
| | | | | | | | | | | | | | | | | | | | |
Total from investment operations | | | 0.77 | | | | 0.62 | | | | (0.09 | ) | | | 0.95 | | | | 0.52 | |
Distributions to shareholders from | | | | | | | | | | | | | | | | | | | | |
Net investment income | | | (0.39 | ) | | | (0.40 | ) | | | (0.37 | ) | | | (0.35 | ) | | | (0.34 | ) |
Net realized gains | | | 0.00 | | | | 0.00 | | | | (0.08 | ) | | | (0.03 | ) | | | (0.09 | ) |
| | | | | | | | | | | | | | | | | | | | |
Total distributions to shareholders | | | (0.39 | ) | | | (0.40 | ) | | | (0.45 | ) | | | (0.38 | ) | | | (0.43 | ) |
Net asset value, end of period | | | $10.97 | | | | $10.59 | | | | $10.37 | | | | $10.91 | | | | $10.34 | |
Total return1 | | | 7.43 | % | | | 6.11 | % | | | (0.76 | )% | | | 9.44 | % | | | 5.06 | % |
Ratios to average net assets (annualized) | | | | | | | | | | | | | | | | | | | | |
Gross expenses | | | 1.09 | % | | | 1.07 | % | | | 1.06 | % | | | 1.07 | % | | | 1.07 | % |
Net expenses | | | 0.80 | % | | | 0.85 | % | | | 0.85 | % | | | 0.85 | % | | | 0.85 | % |
Net investment income | | | 3.68 | % | | | 3.82 | % | | | 3.51 | % | | | 3.28 | % | | | 3.26 | % |
Supplemental data | | | | | | | | | | | | | | | | | | | | |
Portfolio turnover rate | | | 20 | % | | | 50 | % | | | 82 | % | | | 61 | % | | | 61 | % |
Net assets, end of period (000s omitted) | | | $23,674 | | | | $17,086 | | | | $20,305 | | | | $38,018 | | | | $21,100 | |
| 1 | Total return calculations do not include any sales charges. |
The accompanying notes are an integral part of these financial statements.
Wells Fargo High Yield Municipal Bond Fund | 25
Financial highlights
(For a share outstanding throughout each period)
| | | | | | | | | | | | | | | | | | | | |
| | | Year ended June 30 | |
| CLASS C | | 2019 | | | 2018 | | | 2017 | | | 2016 | | | 2015 | |
Net asset value, beginning of period | | | $10.59 | | | | $10.37 | | | | $10.91 | | | | $10.34 | | | | $10.25 | |
Net investment income | | | 0.31 | | | | 0.32 | | | | 0.29 | | | | 0.27 | | | | 0.26 | |
Net realized and unrealized gains (losses) on investments | | | 0.38 | | | | 0.22 | | | | (0.46 | ) | | | 0.60 | | | | 0.18 | |
| | | | | | | | | | | | | | | | | | | | |
Total from investment operations | | | 0.69 | | | | 0.54 | | | | (0.17 | ) | | | 0.87 | | | | 0.44 | |
Distributions to shareholders from | | | | | | | | | | | | | | | | | | | | |
Net investment income | | | (0.31 | ) | | | (0.32 | ) | | | (0.29 | ) | | | (0.27 | ) | | | (0.26 | ) |
Net realized gains | | | 0.00 | | | | 0.00 | | | | (0.08 | ) | | | (0.03 | ) | | | (0.09 | ) |
| | | | | | | | | | | | | | | | | | | | |
Total distributions to shareholders | | | (0.31 | ) | | | (0.32 | ) | | | (0.37 | ) | | | (0.30 | ) | | | (0.35 | ) |
Net asset value, end of period | | | $10.97 | | | | $10.59 | | | | $10.37 | | | | $10.91 | | | | $10.34 | |
Total return1 | | | 6.63 | % | | | 5.32 | % | | | (1.50 | )% | | | 8.62 | % | | | 4.28 | % |
Ratios to average net assets (annualized) | | | | | | | | | | | | | | | | | | | | |
Gross expenses | | | 1.84 | % | | | 1.82 | % | | | 1.81 | % | | | 1.82 | % | | | 1.82 | % |
Net expenses | | | 1.55 | % | | | 1.60 | % | | | 1.60 | % | | | 1.60 | % | | | 1.60 | % |
Net investment income | | | 2.91 | % | | | 3.09 | % | | | 2.79 | % | | | 2.49 | % | | | 2.50 | % |
Supplemental data | | | | | | | | | | | | | | | | | | | | |
Portfolio turnover rate | | | 20 | % | | | 50 | % | | | 82 | % | | | 61 | % | | | 62 | % |
Net assets, end of period (000s omitted) | | | $9,955 | | | | $8,896 | | | | $8,709 | | | | $10,573 | | | | $4,522 | |
| 1 | Total return calculations do not include any sales charges. |
The accompanying notes are an integral part of these financial statements.
26 | Wells Fargo High Yield Municipal Bond Fund
Financial highlights
(For a share outstanding throughout the period)
| | | | |
| CLASS R6 | | Year ended June 30, 20191 | |
Net asset value, beginning of period | | | $10.61 | |
Net investment income | | | 0.39 | |
Net realized and unrealized gains (losses) on investments | | | 0.37 | |
| | | | |
Total from investment operations | | | 0.76 | |
Distributions to shareholders from | | | | |
Net investment income | | | (0.39 | ) |
Net asset value, end of period | | | $10.98 | |
Total return2 | | | 7.29 | % |
Ratios to average net assets (annualized) | | | | |
Gross expenses | | | 0.71 | % |
Net expenses | | | 0.50 | % |
Net investment income | | | 3.96 | % |
Supplemental data | | | | |
Portfolio turnover rate | | | 20 | % |
Net assets, end of period (000s omitted) | | | $26 | |
| 1 | For the period from July, 31, 2018 (commencement of class operations) to June 30, 2019 |
| 2 | Returns for periods of less than one year are not annualized. |
The accompanying notes are an integral part of these financial statements.
Wells Fargo High Yield Municipal Bond Fund | 27
Financial highlights
(For a share outstanding throughout each period)
| | | | | | | | | | | | | | | | | | | | |
| | | Year ended June 30 | |
| ADMINISTRATOR CLASS | | 2019 | | | 2018 | | | 2017 | | | 2016 | | | 2015 | |
Net asset value, beginning of period | | | $10.59 | | | | $10.37 | | | | $10.92 | | | | $10.34 | | | | $10.26 | |
Net investment income | | | 0.40 | | | | 0.41 | | | | 0.38 | | | | 0.36 | | | | 0.35 | |
Net realized and unrealized gains (losses) on investments | | | 0.39 | | | | 0.22 | | | | (0.47 | ) | | | 0.61 | | | | 0.17 | |
| | | | | | | | | | | | | | | | | | | | |
Total from investment operations | | | 0.79 | | | | 0.63 | | | | (0.09 | ) | | | 0.97 | | | | 0.52 | |
Distributions to shareholders from | | | | | | | | | | | | | | | | | | | | |
Net investment income | | | (0.40 | ) | | | (0.41 | ) | | | (0.38 | ) | | | (0.36 | ) | | | (0.35 | ) |
Net realized gains | | | 0.00 | | | | 0.00 | | | | (0.08 | ) | | | (0.03 | ) | | | (0.09 | ) |
| | | | | | | | | | | | | | | | | | | | |
Total distributions to shareholders | | | (0.40 | ) | | | (0.41 | ) | | | (0.46 | ) | | | (0.39 | ) | | | (0.44 | ) |
Net asset value, end of period | | | $10.98 | | | | $10.59 | | | | $10.37 | | | | $10.92 | | | | $10.34 | |
Total return | | | 7.64 | % | | | 6.21 | % | | | (0.75 | )% | | | 9.65 | % | | | 5.07 | % |
Ratios to average net assets (annualized) | | | | | | | | | | | | | | | | | | | | |
Gross expenses | | | 1.03 | % | | | 1.01 | % | | | 1.00 | % | | | 1.00 | % | | | 1.00 | % |
Net expenses | | | 0.71 | % | | | 0.75 | % | | | 0.75 | % | | | 0.75 | % | | | 0.75 | % |
Net investment income | | | 3.69 | % | | | 3.93 | % | | | 3.60 | % | | | 3.39 | % | | | 3.35 | % |
Supplemental data | | | | | | | | | | | | | | | | | | | | |
Portfolio turnover rate | | | 20 | % | | | 50 | % | | | 82 | % | | | 61 | % | | | 62 | % |
Net assets, end of period (000s omitted) | | | $15,704 | | | | $24,627 | | | | $22,839 | | | | $25,179 | | | | $13,768 | |
The accompanying notes are an integral part of these financial statements.
28 | Wells Fargo High Yield Municipal Bond Fund
Financial highlights
(For a share outstanding throughout each period)
| | | | | | | | | | | | | | | | | | | | |
| | | Year ended June 30 | |
| INSTITUTIONAL CLASS | | 2019 | | | 2018 | | | 2017 | | | 2016 | | | 2015 | |
Net asset value, beginning of period | | | $10.59 | | | | $10.37 | | | | $10.91 | | | | $10.34 | | | | $10.25 | |
Net investment income | | | 0.42 | | | | 0.43 | | | | 0.40 | | | | 0.38 | | | | 0.37 | |
Net realized and unrealized gains (losses) on investments | | | 0.38 | | | | 0.22 | | | | (0.46 | ) | | | 0.60 | | | | 0.18 | |
| | | | | | | | | | | | | | | | | | | | |
Total from investment operations | | | 0.80 | | | | 0.65 | | | | (0.06 | ) | | | 0.98 | | | | 0.55 | |
Distributions to shareholders from | | | | | | | | | | | | | | | | | | | | |
Net investment income | | | (0.42 | ) | | | (0.43 | ) | | | (0.40 | ) | | | (0.38 | ) | | | (0.37 | ) |
Net realized gains | | | 0.00 | | | | 0.00 | | | | (0.08 | ) | | | (0.03 | ) | | | (0.09 | ) |
| | | | | | | | | | | | | | | | | | | | |
Total distributions to shareholders | | | (0.42 | ) | | | (0.43 | ) | | | (0.48 | ) | | | (0.41 | ) | | | (0.46 | ) |
Net asset value, end of period | | | $10.97 | | | | $10.59 | | | | $10.37 | | | | $10.91 | | | | $10.34 | |
Total return | | | 7.70 | % | | | 6.37 | % | | | (0.51 | )% | | | 9.71 | % | | | 5.33 | % |
Ratios to average net assets (annualized) | | | | | | | | | | | | | | | | | | | | |
Gross expenses | | | 0.76 | % | | | 0.74 | % | | | 0.73 | % | | | 0.74 | % | | | 0.74 | % |
Net expenses | | | 0.55 | % | | | 0.60 | % | | | 0.60 | % | | | 0.60 | % | | | 0.60 | % |
Net investment income | | | 3.92 | % | | | 4.09 | % | | | 3.82 | % | | | 3.58 | % | | | 3.51 | % |
Supplemental data | | | | | | | | | | | | | | | | | | | | |
Portfolio turnover rate | | | 20 | % | | | 50 | % | | | 82 | % | | | 61 | % | | | 62 | % |
Net assets, end of period (000s omitted) | | | $85,187 | | | | $75,560 | | | | $73,989 | | | | $67,867 | | | | $76,118 | |
The accompanying notes are an integral part of these financial statements.
Wells Fargo High Yield Municipal Bond Fund | 29
Notes to financial statements
1. ORGANIZATION
Wells Fargo Funds Trust (the “Trust”), a Delaware statutory trust organized on March 10, 1999, is anopen-end management investment company registered under the Investment Company Act of 1940, as amended (the “1940 Act”). As an investment company, the Trust follows the accounting and reporting guidance in Financial Accounting Standards Board (“FASB”)Accounting Standards Codification Topic 946, Financial Services – Investment Companies. These financial statements report on the Wells Fargo High Yield Municipal Bond Fund (the “Fund”) which is a diversified series of the Trust.
2. SIGNIFICANT ACCOUNTING POLICIES
The following significant accounting policies, which are consistently followed in the preparation of the financial statements of the Fund, are in conformity with U.S. generally accepted accounting principles which require management to make estimates and assumptions that affect the reported amounts of assets and liabilities, disclosure of contingent assets and liabilities at the date of the financial statements, and the reported amounts of revenues and expenses during the reporting period. Actual results could differ from those estimates.
Securities valuation
All investments are valued each business day as of the close of regular trading on the New York Stock Exchange (generally 4 p.m. Eastern Time), although the Fund may deviate from this calculation time under unusual or unexpected circumstances.
Debt securities are valued at the evaluated bid price provided by an independent pricing service (e.g. taking into account various factors, including yields, maturities, or credit ratings) or, if a reliable price is not available, the quoted bid price from an independent broker-dealer.
Investments in registeredopen-end investment companies are valued at net asset value.
Investments which are not valued using any of the methods discussed above are valued at their fair value, as determined in good faith by the Board of Trustees of the Fund. The Board of Trustees has established a Valuation Committee comprised of the Trustees and has delegated to it the authority to take any actions regarding the valuation of portfolio securities that the Valuation Committee deems necessary or appropriate, including determining the fair value of portfolio securities, unless the determination has been delegated to the Wells Fargo Asset Management Pricing Committee at Wells Fargo Funds Management, LLC (“Funds Management”). The Board of Trustees retains the authority to make or ratify any valuation decisions or approve any changes to the Valuation Procedures as it deems appropriate. On a quarterly basis, the Board of Trustees receives reports on any valuation actions taken by the Valuation Committee or the Wells Fargo Asset Management Pricing Committee which may include items for ratification.
When-issued transactions
The Fund may purchase securities on a forward commitment or when-issued basis. The Fund records a when-issued transaction on the trade date and will segregate assets in an amount at least equal in value to the Fund’s commitment to purchase when-issued securities. Securities purchased on a when-issued basis aremarked-to-market daily and the Fund begins earning interest on the settlement date. Losses may arise due to changes in the market value of the underlying securities or if the counterparty does not perform under the contract.
Security transactions and income recognition
Securities transactions are recorded on a trade date basis. Realized gains or losses are recorded on the basis of identified cost.
Interest income is accrued daily and bond discounts are accreted and premiums are amortized daily. To the extent debt obligations are placed onnon-accrual status, any related interest income may be reduced by writing off interest receivables when the collection of all or a portion of interest has been determined to be doubtful based on consistently applied procedures and the fair value has decreased. If the issuer subsequently resumes interest payments or when the collectability of interest is reasonably assured, the debt obligation is removed fromnon-accrual status.
Distributions to shareholders
Distributions to shareholders from net investment income are declared daily and paid monthly. Distributions from net realized gains, if any, are recorded on theex-dividend date and paid at least annually. Such distributions are determined in accordance with income tax regulations and may differ from U.S. generally accepted accounting principles. Dividend sources are estimated at the time of declaration. The tax character of distributions is determined as of the Fund’s fiscal year end. Therefore, a portion of the Fund’s distributions made prior to the Fund’s fiscal year end may be categorized as a tax return of capital at year end.
30 | Wells Fargo High Yield Municipal Bond Fund
Notes to financial statements
Federal and other taxes
The Fund intends to continue to qualify as a regulated investment company by distributing substantially all of its investment company taxable andtax-exempt income and any net realized capital gains (after reduction for capital loss carryforwards) sufficient to relieve it from all, or substantially all, federal income taxes. Accordingly, no provision for federal income taxes was required.
The Fund’s income and federal excise tax returns and all financial records supporting those returns for the prior three fiscal years are subject to examination by the federal and Delaware revenue authorities. Management has analyzed the Fund’s tax positions taken on federal, state, and foreign tax returns for all open tax years and does not believe that there are any uncertain tax positions that require recognition of a tax liability.
As of June 30, 2019, the aggregate cost of all investments for federal income tax purposes was $125,733,370 and the unrealized gains (losses) consisted of:
| | | | |
| |
Gross unrealized gains | | $ | 7,654,748 | |
| |
Gross unrealized losses | | | (64,004 | ) |
| |
Net unrealized gains | | $ | 7,590,744 | |
As of June 30, 2019, the Fund had capital loss carryforwards which consist of $432,834 in long-term capital losses.
Class allocations
The separate classes of shares offered by the Fund differ principally in applicable sales charges, distribution, shareholder servicing, and administration fees. Class specific expenses are charged directly to that share class. Investment income, common fund-level expenses, and realized and unrealized gains (losses) on investments are allocated daily to each class of shares based on the relative proportion of net assets of each class.
3. FAIR VALUATION MEASUREMENTS
Fair value measurements of investments are determined within a framework that has established a fair value hierarchy based upon the various data inputs utilized in determining the value of the Fund’s investments. The three-level hierarchy gives the highest priority to unadjusted quoted prices in active markets for identical assets or liabilities (Level 1) and the lowest priority to unobservable inputs (Level 3). The Fund’s investments are classified within the fair value hierarchy based on the lowest level of input that is significant to the fair value measurement. The inputs are summarized into three broad levels as follows:
| ∎ | | Level 1 – quoted prices in active markets for identical securities |
| ∎ | | Level 2 – other significant observable inputs (including quoted prices for similar securities, interest rates, prepayment speeds, credit risk, etc.) |
| ∎ | | Level 3 – significant unobservable inputs (including the Fund’s own assumptions in determining the fair value of investments) |
The inputs or methodologies used for valuing investments in securities are not necessarily an indication of the risk associated with investing in those securities.
The following is a summary of the inputs used in valuing the Fund’s assets and liabilities as of June 30, 2019:
| | | | | | | | | | | | | | | | |
| | | | |
| | | Quoted prices
(Level 1) | | | Other significant
observable inputs
(Level 2) | | | Significant
unobservable inputs (Level 3) | | | Total | |
| | | | |
Assets | | | | | | | | | | | | | | | | |
Investments in: | | | | | | | | | | | | | | | | |
| | | | |
Municipal obligations | | $ | 0 | | | $ | 131,390,064 | | | $ | 0 | | | $ | 131,390,064 | |
| | | | |
Short-term investments | | | | | | | | | | | | | | | | |
| | | | |
Investment companies | | | 1,934,050 | | | | 0 | | | | 0 | | | | 1,934,050 | |
| | | | |
Total assets | | $ | 1,934,050 | | | $ | 131,390,064 | | | $ | 0 | | | $ | 133,324,114 | |
Additional sector, industry or geographic detail is included in the Portfolio of Investments.
At June 30, 2019, the Fund did not have any transfers into/out of Level 3.
Wells Fargo High Yield Municipal Bond Fund | 31
Notes to financial statements
4. TRANSACTIONS WITH AFFILIATES
Management fee
Funds Management, an indirect wholly owned subsidiary of Wells Fargo & Company (“Wells Fargo”), is the manager of the Fund and provides advisory and fund-level administrative services under an investment management agreement. Under the investment management agreement, Funds Management is responsible for, among other services, implementing the investment objectives and strategies of the Fund, supervising the subadviser and providing fund-level administrative services in connection with the Fund’s operations. As compensation for its services under the investment management agreement, Funds Management is entitled to receive a management fee at the following annual rate based on the Fund’s average daily net assets:
| | |
| |
| Average daily net assets | | Management fee |
| |
First $500 million | | 0.500% |
| |
Next $500 million | | 0.475 |
| |
Next $2 billion | | 0.450 |
| |
Next $2 billion | | 0.425 |
| |
Next $5 million | | 0.390 |
| |
Over $10 billion | | 0.380 |
For the year ended June 30, 2019, the management fee was equivalent to an annual rate of 0.50% of the Fund’s average daily net assets.
Funds Management has retained the services of a subadviser to provide daily portfolio management to the Fund. The fee for subadvisory services is borne by Funds Management. Wells Capital Management Incorporated, an affiliate of Funds Management and an indirect wholly owned subsidiary of Wells Fargo, is the subadviser to the Fund and is entitled to receive a fee from Funds Management at an annual rate starting at 0.35% and declining to 0.20% as the average daily net assets of the Fund increase.
Administration fees
Under a class-level administration agreement, Funds Management provides class-level administrative services to the Fund, which includes paying fees and expenses for services provided by the transfer agent,sub-transfer agents, omnibus account servicers and record-keepers. As compensation for its services under the class-level administration agreement, Funds Management receives an annual fee which is calculated based on the average daily net assets of each class as follows:
| | |
| |
| | | Class-level
administration
fee |
| |
Class A, Class C | | 0.16% |
| |
Class R6 | | 0.03 |
| |
Administrator Class | | 0.10 |
| |
Institutional Class | | 0.08 |
Funds Management has contractually waived and/or reimbursed management and administration fees to the extent necessary to maintain certain net operating expense ratios for the Fund. When each class of the Fund has exceeded its expense cap, Funds Management has waived fees and/or reimbursed expenses from fund-level expenses on a proportionate basis and then from class specific expenses. When only certain classes exceed their expense caps, waivers and/or reimbursements are applied against class specific expenses before fund-level expenses. Funds Management has committed through October 31, 2019 to waive fees and/or reimburse expenses to the extent necessary to cap the Fund’s expenses at 0.80% for Class A shares, 1.55% for Class C shares, 0.50% for Class R6 shares, 0.70% for Administrator Class shares, and 0.55% for Institutional Class shares. Prior to or after the commitment expiration date, the cap may be increased or the commitment to maintain the cap may be terminated only with the approval of the Board of Trustees. Prior to August 1, 2018, the Fund’s expenses were capped at 0.85% for Class A shares, 1.60% for Class C shares, 0.75% for Administrator Class shares, and 0.60% for Institutional Class shares.
Distribution fee
The Trust has adopted a distribution plan for Class C shares of the Fund pursuant to Rule12b-1 under the 1940 Act. A distribution fee is charged to Class C shares and paid to Wells Fargo Funds Distributor, LLC (“Funds Distributor”), the principal underwriter, at an annual rate of 0.75% of the average daily net assets of Class C shares.
32 | Wells Fargo High Yield Municipal Bond Fund
Notes to financial statements
In addition, Funds Distributor is entitled to receive thefront-end sales charge from the purchase of Class A shares and a contingent deferred sales charge on the redemption of certain Class A shares. Funds Distributor is also entitled to receive the contingent deferred sales charges from redemptions of Class C shares. For the year ended June 30, 2019, Funds Distributor received $3,563 from the sale of Class A shares. No contingent deferred sales charges were incurred by Class A and Class C shares for the year ended June 30, 2019.
Shareholder servicing fees
The Trust has entered into contracts with one or more shareholder servicing agents, whereby Class A, Class C and Administrator Class of the Fund are charged a fee at an annual rate of 0.25% of the average daily net assets of each respective class. A portion of these total shareholder servicing fees were paid to affiliates of Wells Fargo.
Interfund transactions
The Fund may purchase or sell portfolio investment securities to certain other Wells Fargo affiliates pursuant to Rule17a-7 under the 1940 Act and under procedures adopted by the Board of Trustees. The procedures have been designed to ensure that these interfund transactions, which do not incur broker commissions, are effected at current market prices. Pursuant to these procedures, the Fund had $17,150,000 and $24,920,000 in interfund purchases and sales, respectively, during the year ended June 30, 2019.
5. INVESTMENT PORTFOLIO TRANSACTIONS
Purchases and sales of investments, excluding U.S. government obligations (if any) and short-term securities, for the year ended June 30, 2019 were $36,378,908 and $23,891,246, respectively.
6. BANK BORROWINGS
The Trust (excluding the money market funds), Wells Fargo Master Trust and Wells Fargo Variable Trust are parties to a $280,000,000 revolving credit agreement whereby the Fund is permitted to use bank borrowings for temporary or emergency purposes, such as to fund shareholder redemption requests. Interest under the credit agreement is charged to the Fund based on a borrowing rate equal to the higher of the Federal Funds rate in effect on that day plus 1.25% or the overnight LIBOR rate in effect on that day plus 1.25%. In addition, an annual commitment fee equal to 0.25% of the unused balance is allocated to each participating fund.
For the year ended June 30, 2019, there were no borrowings by the Fund under the agreement.
7. DISTRIBUTIONS TO SHAREHOLDERS
The tax character of distributions paid was $4,884,891 and $4,902,804 of tax-exempt income for the years ended June 30, 2019 and June 30, 2018, respectively.
As of June 30, 2019, the components of distributable earnings on a tax basis were as follows:
| | | | |
Undistributed tax-exempt
income | | Unrealized
gains | | Capital loss carryforward |
| | |
| $21,651 | | $7,590,744 | | $(432,834) |
Effective for all filings after November 4, 2018, the Securities and Exchange Commission eliminated the requirement to separately state the components of distributions to shareholders under U.S. generally accepted accounting principles. The amounts of distributions to shareholders for the year ended June 30, 2018 were as follows:
| | | | |
| |
| | | Net investment
income | |
| |
Class A | | $ | 674,381 | |
| |
Class C | | | 262,165 | |
| |
Administrator Class | | | 900,885 | |
| |
Institutional Class | | | 3,065,373 | |
Wells Fargo High Yield Municipal Bond Fund | 33
Notes to financial statements
8. INDEMNIFICATION
Under the Trust’s organizational documents, the officers and Trustees have been granted certain indemnification rights against certain liabilities that may arise out of performance of their duties to the Trust. Additionally, in the normal course of business, the Trust may enter into contracts with service providers that contain a variety of indemnification clauses. The Trust’s maximum exposure under these arrangements is dependent on future claims that may be made against the Fund and, therefore, cannot be estimated.
9. NEW ACCOUNTING PRONOUNCEMENTS
In August 2018, FASB issued Accounting Standards Update (“ASU”)No. 2018-13, Fair Value Measurement (Topic 820)Disclosure Framework—Changes to the Disclosure Requirements for Fair Value Measurement. ASU2018-13 updates the disclosure requirements for fair value measurements by modifying or removing certain disclosures and adding certain new disclosures. The amendments are effective for fiscal years, and interim periods within those fiscal years, beginning after December 15, 2019. Early adoption is permitted. Management has adopted the removal and modification of disclosures early, as permitted, and will adopt the additional new disclosures at the effective date.
In March 2017, FASB issued ASU No. 2017-08,Premium Amortization on Purchased Callable Debt Securities. ASU 2017-08 shortens the amortization period for certain callable debt securities held at a premium and requires the premium to be amortized to the earliest call date. The amendments do not require an accounting change for securities held at a discount and discounts will continue to be accreted to the maturity date of the security. ASU 2017-08 is effective for fiscal years beginning after December 15, 2018 and for interim periods within those fiscal years. During the current reporting period, management of the Fund adopted the change in accounting policy which did not have a material impact to the Fund’s financial statements.
34 | Wells Fargo High Yield Municipal Bond Fund
Report of independent registered public accounting firm
TO THE SHAREHOLDERS OF THE FUND AND BOARD OF TRUSTEES OF WELLS FARGO FUNDS TRUST:
Opinion on the Financial Statements
We have audited the accompanying statement of assets and liabilities of Wells Fargo High Yield Municipal Bond Fund (the Fund), one of the funds constituting Wells Fargo Funds Trust, including the portfolio of investments, as of June 30, 2019, the related statement of operations for the year then ended, the statements of changes in net assets for each of the years in the two year period then ended, and the related notes (collectively, the financial statements) and the financial highlights for each of the years or periods in the five year period then ended. In our opinion, the financial statements and financial highlights present fairly, in all material respects, the financial position of the Fund as of June 30, 2019, the results of its operations for the year then ended, the changes in its net assets for each of the years in the two year period then ended, and the financial highlights for each of the years or periods in the five year period then ended, in conformity with U.S. generally accepted accounting principles.
Basis for Opinion
These financial statements and financial highlights are the responsibility of the Fund’s management. Our responsibility is to express an opinion on these financial statements and financial highlights based on our audits. We are a public accounting firm registered with the Public Company Accounting Oversight Board (United States) (PCAOB) and are required to be independent with respect to the Fund in accordance with the U.S. federal securities laws and the applicable rules and regulations of the Securities and Exchange Commission and the PCAOB.
We conducted our audits in accordance with the standards of the PCAOB. Those standards require that we plan and perform the audit to obtain reasonable assurance about whether the financial statements and financial highlights are free of material misstatement, whether due to error or fraud. Our audits included performing procedures to assess the risks of material misstatement of the financial statements and financial highlights, whether due to error or fraud, and performing procedures that respond to those risks. Such procedures included examining, on a test basis, evidence regarding the amounts and disclosures in the financial statements and financial highlights. Such procedures also included confirmation of securities owned as of June 30, 2019, by correspondence with the custodian and brokers, or by other appropriate auditing procedures. Our audits also included evaluating the accounting principles used and significant estimates made by management, as well as evaluating the overall presentation of the financial statements and financial highlights. We believe that our audits provide a reasonable basis for our opinion.

We have not been able to determine the specific year that we began serving as the auditor of one or more Wells Fargo Funds investment companies; however we are aware that we have served as the auditor of one or more Wells Fargo Funds investment companies since at least 1955.
Boston, Massachusetts
August 26, 2019
Wells Fargo High Yield Municipal Bond Fund | 35
Other information (unaudited)
TAX INFORMATION
Pursuant to Section 852 of the Internal Revenue Code, 100% of distributions paid from net investment income is designated as exempt-interest dividends for the fiscal year ended June 30, 2019.
PROXY VOTING INFORMATION
A description of the policies and procedures used to determine how to vote proxies relating to portfolio securities is available, upon request, by calling1-800-222-8222, visiting our website atwfam.com, or visiting the SEC website at sec.gov. Information regarding how the proxies related to portfolio securities were voted during the most recent12-month period ended June 30 is available on the website atwfam.comor by visiting the SEC website at sec.gov.
QUARTERLY PORTFOLIO HOLDINGS INFORMATION
The Fund files its complete schedule of portfolio holdings with the SEC for the first and third quarters of each fiscal year on Form N-Q or FormN-PORT, which is available by visiting the SEC website at sec.gov. Those forms may be reviewed and copied at the SEC’s Public Reference Room in Washington, DC. Information on the operation of the Public Reference Room may be obtained by calling1-800-SEC-0330.
36 | Wells Fargo High Yield Municipal Bond Fund
Other information (unaudited)
BOARD OF TRUSTEES AND OFFICERS
Each of the Trustees and Officers1 listed in the table below acts in identical capacities for each fund in the Wells Fargo family of funds, which consists of 152 mutual funds comprising the Wells Fargo Funds Trust, Wells Fargo Variable Trust, Wells Fargo Master Trust and fourclosed-end funds (collectively the “Fund Complex”). This table should be read in conjunction with the Prospectus and the Statement of Additional Information2. The mailing address of each Trustee and Officer is 525 Market Street, 12th Floor, San Francisco, CA 94105. Each Trustee and Officer serves an indefinite term, however, each Trustee serves such term until reaching the mandatory retirement age established by the Trustees.
Independent Trustees
| | | | | | |
Name and
year of birth | | Position held and
length of service* | | Principal occupations during past five years or longer | | Current other
public company or
investment
company
directorships |
| | | |
| William R. Ebsworth (Born 1957) | | Trustee,
since 2015 | | Retired. From 1984 to 2013, equities analyst, portfolio manager, research director and chief investment officer at Fidelity Management and Research Company in Boston, Tokyo, and Hong Kong, and retired in 2013 as Chief Investment Officer of Fidelity Strategic Advisers, Inc. where he led a team of investment professionals managing client assets. Prior thereto, Board member of Hong Kong Securities Clearing Co., Hong Kong Options Clearing Corp., the Thailand International Fund, Ltd., Fidelity Investments Life Insurance Company, and Empire Fidelity Investments Life Insurance Company. Audit Committee Chair and Investment Committee Chair of the Vincent Memorial Hospital Endowment(non-profit organization). Mr. Ebsworth is a CFA® charterholder. | | N/A |
| | | |
| Jane A. Freeman (Born 1953) | | Trustee,
since 2015; Chair Liaison,
since 2018 | | Retired. From 2012 to 2014 and 1999 to 2008, Chief Financial Officer of Scientific Learning Corporation. From 2008 to 2012, Ms. Freeman provided consulting services related to strategic business projects. Prior to 1999, Portfolio Manager at Rockefeller & Co. and Scudder, Stevens & Clark. Board member of the Harding Loevner Funds from 1996 to 2014, serving as both Lead Independent Director and chair of the Audit Committee. Board member of the Russell Exchange Traded Funds Trust from 2011 to 2012 and the chair of the Audit Committee. Ms. Freeman is a Board Member of The Ruth Bancroft Garden(non-profit organization). She is also an inactive Chartered Financial Analyst. | | N/A |
| | | |
| Isaiah Harris, Jr. (Born 1952) | | Trustee,
since 2009; Audit Committee Chairman,
since 2019 | | Retired. Chairman of the Board of CIGNA Corporation since 2009, and Director since 2005. From 2003 to 2011, Director of Deluxe Corporation. Prior thereto, President and CEO of BellSouth Advertising and Publishing Corp. from 2005 to 2007, President and CEO of BellSouth Enterprises from 2004 to 2005 and President of BellSouth Consumer Services from 2000 to 2003. Emeritus member of the Iowa State University Foundation Board of Governors. Emeritus Member of the Advisory Board of Iowa State University School of Business. Advisory Board Member, Palm Harbor Academy (private school). Advisory Board Member, Child Evangelism Fellowship(non-profit). Mr. Harris is a certified public accountant (inactive status). | | CIGNA Corporation |
| | | |
| Judith M. Johnson (Born 1949) | | Trustee,
since 2008; Audit Committee Chairman, from 2009 to 2018 | | Retired. Prior thereto, Chief Executive Officer and Chief Investment Officer of Minneapolis Employees Retirement Fund from 1996 to 2008. Ms. Johnson is an attorney, certified public accountant and a certified managerial accountant. | | N/A |
Wells Fargo High Yield Municipal Bond Fund | 37
Other information (unaudited)
| | | | | | |
Name and
year of birth | | Position held and
length of service* | | Principal occupations during past five years or longer | | Current other
public company or
investment
company
directorships |
| | | |
| David F. Larcker (Born 1950) | | Trustee,
since 2009 | | James Irvin Miller Professor of Accounting at the Graduate School of Business, Stanford University, Director of the Corporate Governance Research Initiative and Senior Faculty of The Rock Center for Corporate Governance since 2006. From 2005 to 2008, Professor of Accounting at the Graduate School of Business, Stanford University. Prior thereto, Ernst & Young Professor of Accounting at The Wharton School, University of Pennsylvania from 1985 to 2005. | | N/A |
| | | |
| Olivia S. Mitchell (Born 1953) | | Trustee,
since 2006; Nominating and Governance Committee Chairman,
since 2018 | | International Foundation of Employee Benefit Plans Professor, Wharton School of the University of Pennsylvania since 1993. Director of Wharton’s Pension Research Council and Boettner Center on Pensions & Retirement Research, and Research Associate at the National Bureau of Economic Research. Previously, Cornell University Professor from 1978 to 1993. | | N/A |
| | | |
| Timothy J. Penny (Born 1951) | | Trustee,
since 1996; Chairman,
since 2018 | | President and Chief Executive Officer of Southern Minnesota Initiative Foundation, anon-profit organization, since 2007. Member of the Board of Trustees of NorthStar Education Finance, Inc., anon-profit organization, since 2007. | | N/A |
| | | |
| James G. Polisson (Born 1959) | | Trustee,
since 2018 | | Retired. Chief Marketing Officer, Source (ETF) UK Services, Ltd, from 2015 to 2017. From 2012 to 2015, Principal of The Polisson Group, LLC, a management consulting, corporate advisory and principal investing company. Chief Executive Officer and Managing Director at Russell Investments, Global Exchange Traded Funds from 2010 to 2012. Managing Director of Barclays Global Investors from 1998 to 2010 and Global Chief Marketing Officer for iShares and Barclays Global Investors from 2000 to 2010. Trustee of the San Francisco Mechanics’ Institute, anon-profit organization, from 2013 to 2015. Board member of the Russell Exchange Traded Fund Trust from 2011 to 2012. Director of Barclays Global Investors Holdings Deutschland GmbH from 2006 to 2009. Mr. Polisson is an attorney and has a retired status with the Massachusetts and District of Columbia Bar Associations. | | N/A |
| * | Length of service dates reflect the Trustee’s commencement of service with the Trust’s predecessor entities, where applicable. |
38 | Wells Fargo High Yield Municipal Bond Fund
Other information (unaudited)
Officers
| | | | |
Name and year of birth | | Position held and
length of service | | Principal occupations during past five years or longer |
| | |
Andrew Owen
(Born 1960) | | President,
since 2017 | | Executive Vice President of Wells Fargo & Company and Head of Affiliated Managers, Wells Fargo Asset Management, since 2014. In addition, Mr. Owen is currently President, Chief Executive Officer and Director of Wells Fargo Funds Management, LLC since 2017. Prior thereto, Executive Vice President responsible for marketing, investments and product development for Wells Fargo Funds Management, LLC, from 2009 to 2014. |
| | |
Nancy Wiser1
(Born 1967) | | Treasurer,
since 2012 | | Executive Vice President of Wells Fargo Funds Management, LLC since 2011. Chief Operating Officer and Chief Compliance Officer at LightBox Capital Management LLC, from 2008 to 2011. |
| | |
Alexander Kymn
(Born 1973) | | Secretary and Chief Legal Officer,
since 2018 | | Senior Company Counsel of Wells Fargo Bank, N.A. since 2018 (previously Senior Counsel from 2007 to 2018). Vice President of Wells Fargo Funds Management, LLC from 2008 to 2014. |
| | |
Michael H. Whitaker
(Born 1967) | | Chief Compliance Officer,
since 2016 | | Senior Vice President and Chief Compliance Officer since 2016. Senior Vice President and Chief Compliance Officer for Fidelity Investments from 2007 to 2016. |
| | |
David Berardi
(Born 1975) | | Assistant Treasurer,
since 2009 | | Vice President of Wells Fargo Funds Management, LLC since 2009. Vice President of Evergreen Investment Management Company, LLC from 2008 to 2010. Manager of Fund Reporting and Control for Evergreen Investment Management Company, LLC from 2004 to 2010. |
| | |
Jeremy DePalma1
(Born 1974) | | Assistant Treasurer, since 2009 | | Senior Vice President of Wells Fargo Funds Management, LLC since 2009. Senior Vice President of Evergreen Investment Management Company, LLC from 2008 to 2010 and head of the Fund Reporting and Control Team within Fund Administration from 2005 to 2010. |
| 1 | Nancy Wiser acts as Treasurer of 65 funds in the Fund Complex. Jeremy DePalma acts as Treasurer of 87 funds and Assistant Treasurer of 65 funds in the Fund Complex. |
| 2 | The Statement of Additional Information includes additional information about the Trustees and is available, without charge, upon request, by calling1-800-222-8222 or by visiting the website atwfam.com. |
Wells Fargo High Yield Municipal Bond Fund | 39
Other information (unaudited)
BOARD CONSIDERATION OF INVESTMENT MANAGEMENT ANDSUB-ADVISORY AGREEMENTS:
Wells Fargo High Yield Municipal Bond Fund
Under the Investment Company Act of 1940 (the “1940 Act”), the Board of Trustees (the “Board”) of Wells Fargo Funds Trust (the “Trust”) must determine annually whether to approve the continuation of the Trust’s investment management andsub-advisory agreements. In this regard, at anin-person meeting held on May21-22, 2019 (the “Meeting”), the Board, all the members of which have no direct or indirect interest in the investment management andsub-advisory agreements and are not “interested persons” of the Trust, as defined in the 1940 Act (the “Independent Trustees”), reviewed and approved for Wells Fargo High Yield Municipal Bond Fund(the “Fund”): (i) an investment management agreement (the “Management Agreement”) with Wells Fargo Funds Management, LLC (“Funds Management”); and (ii) an investmentsub-advisory agreement (the“Sub-Advisory Agreement”) with Wells Capital Management Incorporated (the“Sub-Adviser”), an affiliate of Funds Management. The Management Agreement and theSub-Advisory Agreement are collectively referred to as the “Advisory Agreements.”
At the Meeting, the Board considered the factors and reached the conclusions described below relating to the selection of Funds Management and theSub-Adviser and the approval of the Advisory Agreements. Prior to the Meeting, including at anin-person meeting in April 2019, the Trustees conferred extensively among themselves and with representatives of Funds Management about these matters. Also, the Board has adopted a team-based approach, with each team consisting of asub-set of Trustees, to assist the full Board in the discharge of its duties in reviewing investment performance and other matters throughout the year. The Independent Trustees were assisted in their evaluation of the Advisory Agreements by independent legal counsel, from whom they received separate legal advice and with whom they met separately.
In providing information to the Board, Funds Management and theSub-Adviser were guided by a detailed set of requests for information submitted to them by independent legal counsel on behalf of the Independent Trustees at the start of the Board’s annual contract renewal process earlier in 2019. In considering and approving the Advisory Agreements, the Trustees considered the information they believed relevant, including but not limited to the information discussed below. The Board considered not only the specific information presented in connection with the Meeting, but also the knowledge gained over time through interaction with Funds Management and theSub-Adviser about various topics. In this regard, the Board reviewed reports of Funds Management at each of its quarterly meetings, which included, among other things, portfolio reviews and investment performance reports. In addition, the Board and the teams mentioned above confer with portfolio managers at various times throughout the year. The Board did not identify any particular information or consideration that wasall-important or controlling, and each individual Trustee may have attributed different weights to various factors.
After its deliberations, the Board unanimously approved the continuation of the Advisory Agreements for aone-year term and determined that the compensation payable to Funds Management and theSub-Adviser under each of the Advisory Agreements was reasonable. The Board considered the approval of the Advisory Agreements for the Fund as part of its consideration of agreements for funds across the complex, but its approvals were made on afund-by-fund basis. The following summarizes a number of important, but not necessarily all, factors considered by the Board in support of its approvals.
Nature, extent and quality of services
The Board received and considered various information regarding the nature, extent and quality of services provided to the Fund by Funds Management and theSub-Adviser under the Advisory Agreements. This information included a description of the investment advisory services and Fund-level administrative services covered by the Management Agreement, as well as, among other things, a summary of the background and experience of senior management of Wells Fargo Asset Management (“WFAM”), of which Funds Management and theSub-Adviser are a part, a summary of investments made in the business of WFAM, a summary of certain organizational and personnel changes involving Funds Management and theSub-Adviser, and a description of Funds Management’s and theSub-Adviser’s business continuity planning programs and of their approaches to data privacy and cybersecurity. The Board received and reviewed information about Funds Management’s role as administrator of the Fund’s liquidity risk management program. The Board also considered the qualifications, background, tenure and responsibilities of each of the portfolio managers primarily responsible for theday-to-day portfolio management of the Fund.
The Board evaluated the ability of Funds Management and theSub-Adviser to attract and retain qualified investment professionals, including research, advisory and supervisory personnel. The Board further considered the compliance programs and compliance records of Funds Management and theSub-Adviser. In addition, the Board took into account the full range of services provided to the Fund by Funds Management and its affiliates.
40 | Wells Fargo High Yield Municipal Bond Fund
Other information (unaudited)
Fund investment performance and expenses
The Board considered the investment performance results for the Fund over various time periods ended December 31, 2018. The Board considered these results in comparison to the investment performance of funds in a universe that was determined by Broadridge Inc. (“Broadridge”) to be similar to the Fund (the “Universe”), and in comparison to the Fund’s benchmark index and to other comparative data. Broadridge is an independent provider of investment company data. The Board received a description of the methodology used by Broadridge to select the mutual funds in the performance Universe. The Board noted that the investment performance of the Fund (Administrator Class) was higher than the average investment performance of the Universe for all periods under review. The Board also noted that the investment performance of the Fund was higher than its benchmark index, the Bloomberg Barclays Municipal Bond Index, for all periods under review.
The Board also received and considered information regarding the Fund’s net operating expense ratios and their various components, including actual management fees, custodian and othernon-management fees, and Rule12b-1 andnon-Rule12b-1 shareholder service fees. The Board considered these ratios in comparison to the median ratios of funds in class-specific expense groups that were determined by Broadridge to be similar to the Fund (the “Groups”). The Board received a description of the methodology used by Broadridge to select the mutual funds in the expense Groups and an explanation of how funds comprising expense groups and their expense ratios may vary fromyear-to-year. Based on the Broadridge reports, the Board noted that the net operating expense ratios of the Fund were lower than the median net operating expense ratios of the expense Groups for each share class.
The Board took into account the Fund’s investment performance and expense information provided to it among the factors considered in deciding tore-approve the Advisory Agreements.
Investment management andsub-advisory fee rates
The Board reviewed and considered the contractual fee rates payable by the Fund to Funds Management under the Management Agreement, as well as the contractual fee rates payable by the Fund to Funds Management for class-level administrative services under a Class-Level Administration Agreement, which include, among other things, class-level transfer agency andsub-transfer agency costs (collectively, the “Management Rates”). The Board also reviewed and considered the contractual investmentsub-advisory fee rates that are payable by Funds Management to theSub-Adviser for investmentsub-advisory services.
Among other information reviewed by the Board was a comparison of the Fund’s Management Rates with the average contractual investment management fee rates of funds in the expense Groups at a common asset level as well as transfer agency costs of the funds in the expense Groups. The Board noted that the Management Rates of the Fund were lower than or equal to the sum of these average rates for the Fund’s expense Groups for all share classes.
The Board also received and considered information about the portion of the total management fee that was retained by Funds Management after payment of the fee to theSub-Adviser forsub-advisory services. In assessing the reasonableness of this amount, the Board received and evaluated information about the nature and extent of responsibilities retained and risks assumed by Funds Management and not delegated to or assumed by theSub-Adviser, and about Funds Management’son-going oversight services. Given the affiliation between Funds Management and theSub-Adviser, the Board ascribed limited relevance to the allocation of fees between them.
The Board also received and considered information about the nature and extent of services offered and fee rates charged by Funds Management and theSub-Adviser to other types of clients with investment strategies similar to those of the Fund. In this regard, the Board received information about the significantly greater scope of services, and compliance, reporting and other legal burdens and risks of managing proprietary mutual funds compared with those associated with managing assets of other types of clients, including third-partysub-advised fund clients andnon-mutual fund clients such as institutional separate accounts.
Based on its consideration of the factors and information it deemed relevant, including those described here, the Board determined that the compensation payable to Funds Management under the Management Agreement and to theSub-Adviser under theSub-Advisory Agreement was reasonable.
Profitability
The Board received and considered information concerning the profitability of Funds Management, as well as the profitability of both WFAM and Wells Fargo & Co. (“Wells Fargo”) from providing services to the fund family as a whole. The Board noted that theSub-Adviser’s profitability information with respect to providing services to the Fund and other funds in the family was subsumed in the WFAM and Wells Fargo profitability analysis.
Wells Fargo High Yield Municipal Bond Fund | 41
Other information (unaudited)
Funds Management reported on the methodologies and estimates used in calculating profitability, including a description of the methodology used to allocate certain expenses. Among other things, the Board noted that the levels of profitability reported on afund-by-fund basis varied widely, depending on factors such as the size, type and age of fund. Based on its review, the Board did not deem the profits reported by Funds Management, WFAM or Wells Fargo from services provided to the Fund to be at a level that would prevent it from approving the continuation of the Advisory Agreements.
Economies of scale
The Board received and considered information about the potential for Funds Management to experience economies of scale in the provision of management services to the Fund, the difficulties of calculating economies of scale at an individual fund level, and the extent to which potential scale benefits are shared with shareholders. The Board noted the existence of breakpoints in the Fund’s management fee structure, which operate generally to reduce the Fund’s expense ratios as the Fund grows in size. The Board considered that in addition to management fee breakpoints, Funds Management shares potential economies of scale from its management business in a variety of ways, including through fee waiver and expense reimbursement arrangements, services that benefit shareholders, competitive management fee rates set at the outset without regard to breakpoints, and investments in the business intended to enhance services available to shareholders.
The Board concluded that Funds Management’s arrangements with respect to the Fund, including contractual breakpoints, constituted a reasonable approach to sharing potential economies of scale with the Fund and its shareholders.
Other benefits to Funds Management and the Sub-Adviser
The Board received and considered information regarding potential“fall-out” or ancillary benefits received by Funds Management and its affiliates, including theSub-Adviser, as a result of their relationships with the Fund. Ancillary benefits could include, among others, benefits directly attributable to other relationships with the Fund and benefits potentially derived from an increase in Funds Management’s and theSub-Adviser’s business as a result of their relationships with the Fund. The Board noted that various affiliates of Funds Management may receive distribution-related fees, shareholder servicing payments andsub-transfer agency fees in respect of shares sold or held through them and services provided.
The Board also reviewed information about soft dollar credits earned and utilized by theSub-Adviser, fees earned by Funds Management and theSub-Adviser from managing a private investment vehicle for the fund family’s securities lending collateral, and commissions earned by an affiliated broker from portfolio transactions.
Based on its consideration of the factors and information it deemed relevant, including those described here, the Board did not find that any ancillary benefits received by Funds Management and its affiliates, including theSub-Adviser, were unreasonable.
Conclusion
At the Meeting, after considering the above-described factors and based on its deliberations and its evaluation of the information described above, the Board unanimously approved the continuation of the Advisory Agreements for aone-year term and determined that the compensation payable to Funds Management and theSub-Adviser under each of the Advisory Agreements was reasonable.
42 | Wells Fargo High Yield Municipal Bond Fund
This page is intentionally left blank.
This page is intentionally left blank.

For more information
More information about Wells Fargo Funds is available free upon request. To obtain literature, please write, visit the Fund’s website, or call:
Wells Fargo Funds
P.O. Box 219967
Kansas City, MO 64121-9967
Website:wfam.com
Individual investors:1-800-222-8222
Retail investment professionals:1-888-877-9275
Institutional investment professionals:1-866-765-0778

This report and the financial statements contained herein are submitted for the general information of the shareholders of the Fund. If this report is used for promotional purposes, distribution of the report must be accompanied or preceded by a current prospectus. Before investing, please consider the investment objectives, risks, charges, and expenses of the investment. For a current prospectus and, if available, a summary prospectus, containing this information, call1-800-222-8222 or visit the Fund’s website atwfam.com. Read the prospectus carefully before you invest or send money.
Wells Fargo Asset Management (WFAM) is the trade name for certain investment advisory/management firms owned by Wells Fargo & Company. These firms include but are not limited to Wells Capital Management Incorporated and Wells Fargo Funds Management, LLC. Certain products managed by WFAM entities are distributed by Wells Fargo Funds Distributor, LLC (a broker-dealer and Member FINRA).
This material is for general informational and educational purposes only and is NOT intended to provide investment advice or a recommendation of any kind—including a recommendation for any specific investment, strategy, or plan.
INVESTMENT PRODUCTS: NOT FDIC INSURED ◾ NO BANK GUARANTEE ◾ MAY LOSE VALUE
© 2019 Wells Fargo Funds Management, LLC. All rights reserved.
404822 08-19
A264/AR264 06-19
Annual Report
June 30, 2019
Wells Fargo
Alternative Risk Premia Fund
Beginning on January 1, 2021, as permitted by new regulations adopted by the Securities and Exchange Commission, paper copies of the Wells Fargo Funds’ annual and semi-annual shareholder reports issued after this date will no longer be sent by mail, unless you specifically request paper copies of the reports. Instead, the reports will be made available on the Funds’ website, and you will be notified by mail each time a report is posted and provided with a website address to access the report.
If you already elected to receive shareholder reports electronically, you will not be affected by this change and you need not take any action. You may elect to receive shareholder reports and other communications from the Fund electronically at any time by contacting your financial intermediary (such as a broker-dealer or bank) or, if you are a direct investor, by calling1-800-222-8222 or by enrolling at wellsfargo.com/advantagedelivery.
You may elect to receive all future reports in paper free of charge. If you invest through a financial intermediary, you can contact your financial intermediary to request that you continue to receive paper copies of your shareholder reports; if you invest directly with the Fund, you can call 1-800-222-8222. Your election to receive reports in paper will apply to all Wells Fargo Funds held in your account with your financial intermediary or, if you are a direct investor, to all Wells Fargo Funds that you hold.
|
|
|
Reduce clutter. Save trees. |
Sign up for electronic delivery of prospectuses and shareholder reports atwellsfargo.com/advantagedelivery |
The views expressed and any forward-looking statements are as of June 30, 2019, unless otherwise noted, and are those of the Fund managers and/or Wells Fargo Asset Management. Discussions of individual securities, or the markets generally, or any Wells Fargo Fund are not intended as individual recommendations. Future events or results may vary significantly from those expressed in any forward-looking statements. The views expressed are subject to change at any time in response to changing circumstances in the market. Wells Fargo Asset Management and the Fund disclaim any obligation to publicly update or revise any views expressed or forward-looking statements.
INVESTMENT PRODUCTS: NOT FDIC INSURED ◾ NO BANK GUARANTEE ◾ MAY LOSE VALUE
Wells Fargo Alternative Risk Premia Fund | 1
Performance highlights (unaudited)
Investment objective
The Fund seeks long-term capital appreciation.
Manager
Wells Fargo Funds Management, LLC
Subadvisers
Wells Capital Management Incorporated
Wells Fargo Asset Management (International) Limited
Portfolio managers
Petros N. Bocray, CFA®‡ , FRM
Eddie Cheng, CFA®‡
Monisha Jayakumar
Average annual total returns (%) as of June 30, 2019
| | | | | | | | | | | | | | |
| | | |
| | | | | | | | Expense ratios1 (%) | |
| | | | |
| | | Inception date | | Since
inception | | | Gross | | | Net2 | |
| | | | | |
| Class R6 (WRPRX)3 | | 1-29-2019 | | | -2.60 | * | | | 0.92 | | | | 0.62 | |
| | | | | |
| Institutional Class (WRPIX)3 | | 1-29-2019 | | | -2.60 | | | | 1.02 | | | | 0.72 | |
| | | | | |
| ICE BofAML U.S.3-Month Treasury Bill Index4 | | – | | | 1.05 | ** | | | – | | | | – | |
| * | Total return differs from the return in the Financial Highlights in this report. The total return presented is calculated based on the NAV at which the shareholder transactions were processed. The NAV and total return presented in the Financial Highlights reflects certain adjustments made to the net assets of the Fund that are necessary under U.S. generally accepted accounting principles. |
| ** | Return is based on Fund’s inception date. |
Figures quoted represent past performance, which is no guarantee of future results, and do not reflect taxes that a shareholder may pay on fund distributions or the redemption of fund shares. Investment return and principal value of an investment will fluctuate so that an investor’s shares, when redeemed, may be worth more or less than their original cost. Current performance may be lower or higher than the performance data quoted, which assumes the reinvestment of dividends and capital gains. Currentmonth-end performance is available on the Fund’s website, wfam.com.
Index returns do not include transaction costs associated with buying and selling securities, any mutual fund fees or expenses, or any taxes. It is not possible to invest directly in an index.
Class R6 and Institutional Class shares are sold without afront-end sales charge or contingent deferred sales charge.
Alternative risk premia investment risk is the Fund’s ability to achieve its investment objective depending largely upon the portfolio managers’ successful evaluation of the risks, potential returns, and correlation properties with respect to the various risk premia in which the Fund invests. Stock values fluctuate in response to the activities of individual companies and general market and economic conditions. Bond values fluctuate in response to the financial condition of individual issuers, general market and economic conditions, and changes in interest rates.Changes in market conditions and government policies may lead to periods of heightened volatility in the bond market and reduced liquidity for certain bonds held by the Fund. In general, when interest rates rise, bond values fall and investors may lose principal value. Interest rate changes and their impact on the Fund and its share price can be sudden and unpredictable. The use of leverage results in certain risks, including, among others, the likelihood of greater volatility of net asset value and the market value of common shares. Short selling is generally considered speculative, has the potential for unlimited loss, and may involve leverage. Foreign investments are especially volatile and can rise or fall dramatically due to differences in the political and economic conditions of the host country. The use of derivatives may reduce returns and/or increase volatility. Certain investment strategies tend to increase the total risk of an investment (relative to the broader market). The Fund is exposed to subsidiary risk and smaller-company securities risk. Consult the Fund’s prospectus for additional information on these and other risks.
Please see footnotes on page 3.
2 | Wells Fargo Alternative Risk Premia Fund
Performance highlights (unaudited)
|
|
| Growth of $1,000,000 investment as of June 30, 20195 |
|
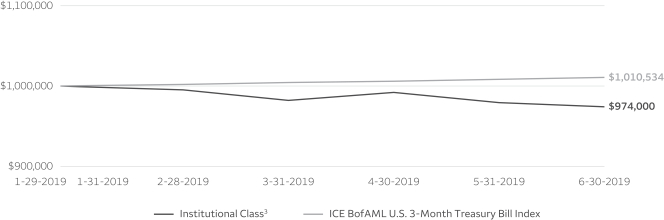
|
| ‡ | CFA® and Chartered Financial Analyst®are trademarks owned by CFA Institute. |
| 1 | Reflects the expense ratios as stated in the most recent prospectuses. The expense ratios shown are subject to change and may differ from the annualized expense ratios shown in the financial highlights of this report. |
| 2 | The manager has contractually committed through December 4, 2019, to waive fees and/or reimburse expenses to the extent necessary to cap the expenses of each class after fee waivers at the amounts shown. Brokerage commissions, stamp duty fees, interest, taxes, acquired fund fees and expenses (if any) and extraordinary expenses are excluded from the expense cap. Prior to or after the commitment expiration date, the cap may be increased or the commitment to maintain the cap may be terminated only with the approval of the Board of Trustees. Without this cap, the Fund’s returns would have been lower. The expense ratio paid by an investor is the net expense ratio (the total annual fund operating expenses after fee waivers) as stated in the prospectuses. |
| 3 | The Fund is closed to new investors, except that Class R6 shares may be purchased by funds of funds managed by Wells Fargo Funds Management, LLC. |
| 4 | The ICE BofAML3-Month U.S. Treasury Bill Index is an unmanaged index that is comprised of a single U.S. Treasury issue with approximately three months to final maturity, purchased at the beginning of each month and held for one full month. Copyright 2019. ICE Data Indices, LLC. All rights reserved. You cannot invest directly in an index. |
| 5 | The chart compares the performance of the Institutional Class shares since inception with the ICE BofAML3-Month U.S. Treasury Bill Index. The chart assumes a hypothetical $1,000,000 investment in Institutional Class shares and reflects all operating expenses. |
| 6 | The Morgan Stanley Capital International (MSCI) All Country World Index (ACWI) ex USA Index (Net) is a free-float-adjusted market-capitalization weighted index that is designed to measure the equity market performance of developed and emerging markets, excluding the U.S. Source: MSCI. MSCI makes no express or implied warranties or representations and shall have no liability whatsoever with respect to any MSCI data contained herein. The MSCI data may not be further redistributed or used as a basis for other indices or any securities or financial products. This report is not approved, reviewed, or produced by MSCI. You cannot invest directly in an index. |
| 7 | The S&P 500 Index consists of 500 stocks chosen for market size, liquidity, and industry group representation. It is a market-value-weighted index with each stock’s weight in the index proportionate to its market value. You cannot invest directly in an index. |
| 8 | The EURO STOXX 50 Index, Europe’s leading blue-chip index for the Eurozone, provides a blue-chip representation of super sector leaders in the region. The EURO STOXX 50 Index is licensed to financial institutions to serve as an underlying for a wide range of investment products such as exchange-traded funds (ETFs), futures, options and structured products worldwide. You cannot invest directly in an index. |
| 9 | The MSCI Emering Markets (EM) Index (Net) is a free-float-adjusted market-capitalization-weighted index that is designed to measure the equity market performance of emerging markets. You cannot invest directly in an index. |
| 10 | Amounts are subject to change and may have changed since the date specified. |
| * | This security was no longer held at the end of the reporting period. |
Wells Fargo Alternative Risk Premia Fund | 3
Performance highlights (unaudited)
MANAGERS’ DISCUSSION
Fund highlights
| ∎ | | The Fund underperformed its benchmark, ICE BofAML U.S.3-Month Treasury Bill Index, for the5-month period from the Fund’s inception on January 29, 2019, through June 30, 2019. |
| ∎ | | Top detractors included our equity multifactor strategy(-2.3%) and rates value strategy(-1.2%), which suffered as investors continued chasing expensive securities. |
| ∎ | | Top contributors included our cross-asset trend strategy (+2.6%) and foreign exchange (FX) carry strategy (+0.6%), both of which benefited from excess liquidity in the market and dovish central banks. |
Equity markets enjoyed a strong rebound.
Equity markets enjoyed a strong rebound following thesell-off duringliquidity-dry December last year. In the first six months of 2019, the MSCI ACWI Index (Net)6 delivered 16% (in local currencies), both the S&P 500 Index7 and the Euro Stoxx 508 rallied by 18%, and the MSCI EM Index (Net)9 returned 10.58% (in U.S. dollars). This widespread return of risk appetite was supported by more cautious and accommodative central banks across the globe as well as investors’ optimism that trade tension can be resolved in an ordered manner despite the backdrop of falling global economic activity data andon-and-off idiosyncratic events indicating that geopolitical risks are not completely off the table.
The Fund was launched at the end of January. The Fund’s portfolio managers seek to maintain low correlations with stock and bond investments while producing a positive return over a 3 to 5 year period with a target of 8% to 10% annualized Fund volatility. The Fund aims to harvest alternative risk premia such as carry, value and momentum, in a systematic way across different asset classes. With the macroeconomic backdrop in the first half of 2019, the Fund declined 2.6% within the first five months, trailing the benchmark for the same period.
Market trends caused the Fund to underperform the benchmark.
The strong investment market rebound in the first half of 2019 caused some of the Fund’s tactical strategies to detract from Fund performance. One of the Fund’s allocations that suffered was the equity multifactor strategy. The struggle for small size and value factors continued to surprise investors.Mega-cap technology stocks such as Apple Inc.*; Microsoft Corp.*; Facebook, Inc.*; Amazon.com, Inc.*; and Alphabet Inc.* reemerged as the dominant group of stocks, leading the charge for the recovery in the first half. This continued enthusiasm for these stocks had a negative impact on the strategy’s performance, as we have a tilt toward small size. In addition, given the fact that these stocks have expensive valuations, we are net short on all these names. Since the date of the Fund’s launch on January 29, 2019, the equity multifactor strategy detracted 230 bps (bps; 100 bps equal 1.00%) from overall Fund performance. Another allocation that was hurt during the first half was our rates value strategy, where the expensive markets such as Australia got even more expensive with the backdrop of sizable monthly declines in housing prices and investors’ expectations that the Reserve Bank of Australia would cut interest rates.
| | | | | | | | |
|
| Net asset exposure as of June 30, 201910 | |
| | | % of net assets | |
| | |
| | | Long
positions | | | Short
positions | |
| | | |
Stocks | | | 74 | | | | 55 | |
| | | |
Interest rate futures | | | 126 | | | | 6 | |
| | | |
Currency futures | | | 63 | | | | 74 | |
| | | |
Equity index futures | | | 19 | | | | 1 | |
| | | |
Commodity futures | | | 19 | | | | 26 | |
Our cross-asset trend strategy delivered positive performance during the period. It aims to harvest herding behavior in the market by taking long positions in assets with positive trends and shorting those with negative ones. Following the asset-price correction in the fourth quarter of 2018, it established a defensive position through a long government bond allocation established at the beginning of 2019. Therefore, it benefited when central banks turned out to be more accommodative and more patient in the current tightening cycle. The strategy also quickly started favoring equity at the end of February due to its fast responsiveness toward market movements. These two
large positions led to the contribution by the cross-asset trend strategy of roughly 260 bps at the Fund level since the Fund’s launch of January 29, 2019. Alongside the cross-asset trend strategy, another top contributor was our FX carry strategy. Using a currency carry trade, we attempt to capture the difference between the rates of a high-yielding currency and alow-yielding currency. Benign liquidity and dovish central banks are usually friends with carry trade strategies. Most of the high-yielding currencies, especially emerging market currencies such as the Indian rupee and the Russian ruble, benefited from this accommodative first-half environment. The FX carry delivered 60 bps to the Fund.
Please see footnotes on page 3.
4 | Wells Fargo Alternative Risk Premia Fund
Performance highlights (unaudited)
Looking ahead, we continue to believe that these alternative risk premia strategies will deliver positive payoff. On the macro end, we believe that strategies such as FX carry will keep enjoying the accommodative liquidity in the market while others, like cross-asset trend, will continue harvesting the behavior bias such as herding and act defensively when the tide turns. In the single equity space, we view the strengths in the large names and weakness in cheap stocks as abnormal and do not believe that this is likely to persist going forward. These expensive stocks have outperformed almost without interruption in this10-year bull market, and investors may eventually pay attention to value when they realize that there is very limited remaining potential upside for these stocks.
Please see footnotes on page 3.
Wells Fargo Alternative Risk Premia Fund | 5
Fund expenses (unaudited)
As a shareholder of the Fund, you incur ongoing costs, including management fees, and other Fund expenses. This example is intended to help you understand your ongoing costs (in dollars) of investing in the Fund and to compare these costs with the ongoing costs of investing in other mutual funds.
The example is based on an investment of $1,000 invested at the beginning of thesix-month period and held for the entire period from January 1, 2019 to June 30, 2019.
Actual expenses
The “Actual” line of the table below provides information about actual account values and actual expenses. You may use the information in this line, together with the amount you invested, to estimate the expenses that you paid over the period. Simply divide your account value by $1,000 (for example, an $8,600 account value divided by $1,000 = 8.6), then multiply the result by the number in the “Actual” line under the heading entitled “Expenses paid during period” for your applicable class of shares to estimate the expenses you paid on your account during this period.
Hypothetical example for comparison purposes
The “Hypothetical” line of the table below provides information about hypothetical account values and hypothetical expenses based on the Fund’s actual expense ratio and an assumed rate of return of 5% per year before expenses, which is not the Fund’s actual return. The hypothetical account values and expenses may not be used to estimate the actual ending account balance or expenses you paid for the period. You may use this information to compare the ongoing costs of investing in the Fund and other funds. To do so, compare this 5% hypothetical example with the 5% hypothetical examples that appear in the shareholder reports of the other funds.
“Hypothetical” linePlease note that the expenses shown in the table are meant to highlight your ongoing costs. Therefore, the line of the table is useful in comparing ongoing costs only and will not help you determine the relative total costs of owning different funds.
| | | | | | | | | | | | | | | | |
| | | Beginning
account value
1-1-2019 | | | Ending
account value
6-30-2019 | | | Expenses
paid during
the period¹ | | | Annualized net
expense ratio | |
| | | | | |
Class R6 | | | | | | | | | | | | | | | | |
| | | | |
Actual | | $ | 1,000.00 | | | $ | 974.00 | | | $ | 3.03 | | | | 0.62 | % |
| | | | |
Hypothetical (5% return before expenses) | | $ | 1,000.00 | | | $ | 1,021.72 | | | $ | 3.11 | | | | 0.62 | % |
| | | | | |
Institutional Class | | | | | | | | | | | | | | | | |
| | | | |
Actual | | $ | 1,000.00 | | | $ | 974.00 | | | $ | 3.53 | | | | 0.72 | % |
| | | | |
Hypothetical (5% return before expenses) | | $ | 1,000.00 | | | $ | 1,021.22 | | | $ | 3.62 | | | | 0.72 | % |
| 1 | Expenses paid is equal to the annualized net expense ratio of each class multiplied by the average account value over the period, multiplied by the number of days in the most recent fiscal half-year divided by the number of days in the fiscal year (to reflect theone-half-year period). |
6 | Wells Fargo Alternative Risk Premia Fund
Consolidated portfolio of investments—June 30, 2019
| | | | | | | | | | | | | | | | |
| | | Yield | | | | | | Shares | | | Value | |
Short-Term Investments: 101.11% | | | | | | | | | | | | | | | | |
| | | | |
| Investment Companies: 6.12% | | | | | | | | | | | | |
| | | | |
Wells Fargo Government Money Market Fund Select Class (l)(u)* | | | 2.33 | % | | | | | | | 2,383,220 | | | $ | 2,383,220 | |
| | | | | | | | | | | | | | | | |
| | | | |
| | | | | | | | | | | | | | | | |
| | | | | | Maturity
date | | | Principal | | | | |
| U.S. Treasury Securities: 94.99% | |
| | | | |
U.S. Treasury Bill (z)#* | | | 2.37 | | | | 8-1-2019 | | | $ | 27,500,000 | | | | 27,452,224 | |
| | | | |
U.S. Treasury Bill (z)# | | | 2.37 | | | | 9-26-2019 | | | | 9,625,000 | | | | 9,576,793 | |
| | | | |
| | | | | | | | | | | | | | | 37,029,017 | |
| | | | | | | | | | | | | | | | |
| | | | |
Total Short-Term Investments (Cost $39,394,830) | | | | | | | | | | | | | | | 39,412,237 | |
| | | | | | | | | | | | | | | | |
| | | | | | | | |
| Total investments in securities (Cost $39,394,830) | | | 101.11 | % | | | 39,412,237 | |
| | |
Other assets and liabilities, net | | | (1.11 | ) | | | (431,300 | ) |
| | | | | | | | |
| Total net assets | | | 100.00 | % | | $ | 38,980,937 | |
| | | | | | | | |
| (l) | The issuer of the security is an affiliated person of the Fund as defined in the Investment Company Act of 1940. |
| (u) | The rate represents the7-day annualized yield at period end. |
| * | A portion of the holding represents an investment held in Alt Risk Premia Special Investments (Cayman) Ltd., the consolidated entity. |
| (z) | Zero coupon security. The rate represents the current yield to maturity. |
| # | All or a portion of this security is segregated as collateral for investments in derivative instruments. |
Futures Contracts
| | | | | | | | | | | | | | | | | | | | | | | | |
| Description | | Number of
contracts | | | Expiration
date | | | Notional
cost | | | Notional
value | | | Unrealized
gains | | | Unrealized
losses | |
| | | | | | |
Long | | | | | | | | | | | | | | | | | | | | | | | | |
| | | | | | |
London Metal Exchange Copper Futures * | | | 3 | | | | 7-17-2019 | | | $ | 447,836 | | | $ | 449,400 | | | $ | 1,564 | | | $ | 0 | |
| | | | | | |
London Metal Exchange Lead Futures * | | | 7 | | | | 7-17-2019 | | | | 338,612 | | | | 336,963 | | | | 0 | | | | (1,649 | ) |
| | | | | | |
London Metal Exchange Nickel Futures * | | | 7 | | | | 7-17-2019 | | | | 509,533 | | | | 530,880 | | | | 21,347 | | | | 0 | |
| | | | | | |
London Metal Exchange Zinc Futures * | | | 21 | | | | 7-17-2019 | | | | 1,391,159 | | | | 1,336,125 | | | | 0 | | | | (55,034 | ) |
| | | | | | |
CAC 40 Index | | | 11 | | | | 7-19-2019 | | | | 669,894 | | | | 692,073 | | | | 22,179 | | | | 0 | |
| | | | | | |
Natural Gas Futures * | | | 6 | | | | 7-29-2019 | | | | 142,580 | | | | 138,480 | | | | 0 | | | | (4,100 | ) |
| | | | | | |
Hang Seng Index | | | 3 | | | | 7-30-2019 | | | | 547,514 | | | | 547,352 | | | | 0 | | | | (162 | ) |
| | | | | | |
Brent Crude Futures * | | | 19 | | | | 7-31-2019 | | | | 1,177,479 | | | | 1,230,059 | | | | 52,580 | | | | 0 | |
| | | | | | |
Gasoline RBOB Futures * | | | 14 | | | | 7-31-2019 | | | | 993,077 | | | | 1,115,201 | | | | 122,124 | | | | 0 | |
| | | | | | |
Gold 100 Ounces Futures * | | | 8 | | | | 8-28-2019 | | | | 1,127,073 | | | | 1,130,960 | | | | 3,887 | | | | 0 | |
| | | | | | |
Natural Gas Futures * | | | 23 | | | | 8-28-2019 | | | | 521,975 | | | | 524,860 | | | | 2,885 | | | | 0 | |
| | | | | | |
Gasoline RBOB Futures * | | | 1 | | | | 8-30-2019 | | | | 78,577 | | | | 77,872 | | | | 0 | | | | (705 | ) |
| | | | | | |
Euro-Bund Futures | | | 7 | | | | 9-6-2019 | | | | 1,374,018 | | | | 1,374,959 | | | | 941 | | | | 0 | |
| | | | | | |
10-Year Japanese Treasury Bonds | | | 23 | | | | 9-12-2019 | | | | 32,769,575 | | | | 32,820,573 | | | | 50,998 | | | | 0 | |
| | | | | | |
Cocoa Futures * | | | 45 | | | | 9-13-2019 | | | | 1,098,048 | | | | 1,091,250 | | | | 0 | | | | (6,798 | ) |
| | | | | | |
Corn Futures * | | | 21 | | | | 9-13-2019 | | | | 471,253 | | | | 445,988 | | | | 0 | | | | (25,265 | ) |
| | | | | | |
Wheat Futures * | | | 10 | | | | 9-13-2019 | | | | 273,412 | | | | 263,625 | | | | 0 | | | | (9,787 | ) |
| | | | | | |
London Metal Exchange Copper Futures * | | | 2 | | | | 9-18-2019 | | | | 298,745 | | | | 299,800 | | | | 1,055 | | | | 0 | |
| | | | | | |
10-Year U.S. Treasury Notes | | | 9 | | | | 9-19-2019 | | | | 1,122,914 | | | | 1,151,719 | | | | 28,805 | | | | 0 | |
| | | | | | |
S&P/TSX 60 Index | | | 6 | | | | 9-19-2019 | | | | 887,369 | | | | 895,911 | | | | 8,542 | | | | 0 | |
| | | | | | |
SPI 200 Index | | | 7 | | | | 9-19-2019 | | | | 796,388 | | | | 805,831 | | | | 9,443 | | | | 0 | |
| | | | | | |
DAX Index | | | 2 | | | | 9-20-2019 | | | | 697,873 | | | | 704,320 | | | | 6,447 | | | | 0 | |
| | | | | | |
Euro STOXX 50 Index | | | 17 | | | | 9-20-2019 | | | | 652,840 | | | | 670,002 | | | | 17,162 | | | | 0 | |
Wells Fargo Alternative Risk Premia Fund | 7
Consolidated portfolio of investments—June 30, 2019
| | | | | | | | | | | | | | | | | | | | | | | | |
| Description | | Number of
contracts | | | Expiration
date | | | Notional
cost | | | Notional
value | | | Unrealized
gains | | | Unrealized
losses | |
| | | | | | |
Long(continued) | | | | | | | | | | | | | | | | | | | | | | | | |
| | | | | | |
FTSE 100 Index | | | 8 | | | | 9-20-2019 | | | $ | 745,743 | | | $ | 748,661 | | | $ | 2,918 | | | $ | 0 | |
| | | | | | |
MSCI Emerging Markets Index | | | 9 | | | | 9-20-2019 | | | | 473,734 | | | | 474,030 | | | | 296 | | | | 0 | |
| | | | | | |
NASDAQ 100E-Mini Index | | | 3 | | | | 9-20-2019 | | | | 449,975 | | | | 461,625 | | | | 11,650 | | | | 0 | |
| | | | | | |
Russell 2000E-Mini Index | | | 11 | | | | 9-20-2019 | | | | 839,364 | | | | 861,905 | | | | 22,541 | | | | 0 | |
| | | | | | |
S&P 500E-Mini Index | | | 5 | | | | 9-20-2019 | | | | 721,263 | | | | 736,050 | | | | 14,787 | | | | 0 | |
| | | | | | |
Long Gilt Bonds | | | 82 | | | | 9-26-2019 | | | | 13,472,590 | | | | 13,568,900 | | | | 96,310 | | | | 0 | |
| | | | | | |
Silver Futures * | | | 2 | | | | 9-26-2019 | | | | 152,657 | | | | 153,410 | | | | 753 | | | | 0 | |
| | | | | | |
Short | | | | | | | | | | | | | | | | | | | | | | | | |
| | | | | | |
London Metal Exchange Aluminium Futures * | | | (33) | | | | 7-17-2019 | | | | (1,443,352 | ) | | | (1,470,356 | ) | | | 0 | | | | (27,004 | ) |
| | | | | | |
London Metal Exchange Copper Futures * | | | (3) | | | | 7-17-2019 | | | | (438,665 | ) | | | (449,400 | ) | | | 0 | | | | (10,735 | ) |
| | | | | | |
London Metal Exchange Lead Futures * | | | (21) | | | | 7-17-2019 | | | | (985,601 | ) | | | (1,010,888 | ) | | | 0 | | | | (25,287 | ) |
| | | | | | |
London Metal Exchange Nickel Futures * | | | (7) | | | | 7-17-2019 | | | | (517,060 | ) | | | (530,880 | ) | | | 0 | | | | (13,820 | ) |
| | | | | | |
London Metal Exchange Zinc Futures * | | | (5) | | | | 7-17-2019 | | | | (325,572 | ) | | | (318,125 | ) | | | 7,447 | | | | 0 | |
| | | | | | |
Lean Hogs Futures * | | | (5) | | | | 8-14-2019 | | | | (150,881 | ) | | | (152,000 | ) | | | 0 | | | | (1,119 | ) |
| | | | | | |
Soybean Futures * | | | (21) | | | | 8-14-2019 | | | | (965,134 | ) | | | (949,725 | ) | | | 15,409 | | | | 0 | |
| | | | | | |
Soybean Meal Futures * | | | (26) | | | | 8-14-2019 | | | | (846,723 | ) | | | (819,780 | ) | | | 26,943 | | | | 0 | |
| | | | | | |
Soybean Oil Futures * | | | (52) | | | | 8-14-2019 | | | | (882,454 | ) | | | (885,144 | ) | | | 0 | | | | (2,690 | ) |
| | | | | | |
WTI Crude Futures * | | | (17) | | | | 8-20-2019 | | | | (1,010,644 | ) | | | (994,840 | ) | | | 15,804 | | | | 0 | |
| | | | | | |
Live Cattle Futures * | | | (1) | | | | 8-30-2019 | | | | (42,226 | ) | | | (41,740 | ) | | | 486 | | | | 0 | |
| | | | | | |
NY HarborUltra-Low Sulfur Diesel Futures * | | | (2) | | | | 8-30-2019 | | | | (166,070 | ) | | | (163,565 | ) | | | 2,505 | | | | 0 | |
| | | | | | |
Low Sugar Gas Oil Futures * | | | (13) | | | | 9-12-2019 | | | | (783,532 | ) | | | (780,650 | ) | | | 2,882 | | | | 0 | |
| | | | | | |
TOPIX Index | | | (4) | | | | 9-12-2019 | | | | (565,158 | ) | | | (575,430 | ) | | | 0 | | | | (10,272 | ) |
| | | | | | |
KC Hard Red Winter Wheat Futures * | | | (28) | | | | 9-13-2019 | | | | (661,708 | ) | | | (646,100 | ) | | | 15,608 | | | | 0 | |
| | | | | | |
10-Year Australian Treasury Bonds | | | (19) | | | | 9-16-2019 | | | | (1,892,360 | ) | | | (1,916,142 | ) | | | 0 | | | | (23,782 | ) |
| | | | | | |
Coffee C Futures * | | | (7) | | | | 9-18-2019 | | | | (263,268 | ) | | | (287,306 | ) | | | 0 | | | | (24,038 | ) |
| | | | | | |
London Metal Exchange Aluminium Futures * | | | (4) | | | | 9-18-2019 | | | | (180,157 | ) | | | (180,025 | ) | | | 132 | | | | 0 | |
| | | | | | |
London Metal Exchange Nickel Futures * | | | (8) | | | | 9-18-2019 | | | | (610,188 | ) | | | (609,840 | ) | | | 348 | | | | 0 | |
| | | | | | |
10-Year Canadian Treasury Bonds | | | (4) | | | | 9-19-2019 | | | | (428,350 | ) | | | (436,577 | ) | | | 0 | | | | (8,227 | ) |
| | | | | | |
Sugar #11 Futures * | | | (18) | | | | 9-30-2019 | | | | (245,330 | ) | | | (254,419 | ) | | | 0 | | | | (9,089 | ) |
| | | | | | |
Cotton #2 Futures * | | | (35) | | | | 12-6-2019 | | | | (1,158,184 | ) | | | (1,156,400 | ) | | | 1,784 | | | | 0 | |
| | | | | | |
Soybean Oil Futures * | | | (3) | | | | 12-13-2019 | | | | (51,235 | ) | | | (51,894 | ) | | | 0 | | | | (659 | ) |
| | | | | | | | | | | | | | | | | | | | | | | | |
| | | | | | |
| | | | | | | | | | | | | | | | | | $ | 588,562 | | | $ | (260,222 | ) |
| | | | | | | | | | | | | | | | | | | | | | | | |
| * | Represents an investment held in Alt Risk Premia Special Investments (Cayman) Ltd., the consolidated entity. |
Forward Foreign Currency Contracts
| | | | | | | | | | | | | | |
Currency to be
received | | Currency to be
delivered | | Counterparty | | Settlement
date | | Unrealized
gains | | | Unrealized
losses | |
| | | | | |
| 33,780,881,000 IDR | | 2,363,787 USD | | Goldman Sachs | | 7-17-2019 | | $ | 23,442 | | | $ | 0 | |
| | | | | |
| 213,830,000 INR | | 3,072,270 USD | | Goldman Sachs | | 7-17-2019 | | | 19,620 | | | | 0 | |
| | | | | |
| 1,978,000 GBP | | 2,524,304 USD | | Goldman Sachs | | 7-17-2019 | | | 0 | | | | (10,433 | ) |
| | | | | |
| 672,000 BRL | | 173,361 USD | | Goldman Sachs | | 7-17-2019 | | | 1,401 | | | | 0 | |
| | | | | |
| 1,478,000 EUR | | 1,677,366 USD | | Goldman Sachs | | 7-17-2019 | | | 5,375 | | | | 0 | |
| | | | | |
| 9,128,000 TRY | | 1,543,079 USD | | Goldman Sachs | | 7-17-2019 | | | 19,466 | | | | 0 | |
| | | | | |
| 36,658,000 MXN | | 1,848,678 USD | | Goldman Sachs | | 7-17-2019 | | | 56,558 | | | | 0 | |
8 | Wells Fargo Alternative Risk Premia Fund
Consolidated portfolio of investments—June 30, 2019
| | | | | | | | | | | | | | |
Currency to be
received | | Currency to be
delivered | | Counterparty | | Settlement
date | | Unrealized
gains | | | Unrealized
losses | |
| | | | | |
| 21,009,000 ZAR | | 1,394,279 USD | | Goldman Sachs | | 7-17-2019 | | $ | 94,532 | | | $ | 0 | |
| | | | | |
| 721,846,000 JPY | | 6,697,470 USD | | Goldman Sachs | | 7-17-2019 | | | 5,682 | | | | 0 | |
| | | | | |
| 134,480,000 RUB | | 2,059,008 USD | | Goldman Sachs | | 7-17-2019 | | | 63,062 | | | | 0 | |
| | | | | |
| 431,000 CZK | | 19,052 USD | | Goldman Sachs | | 7-17-2019 | | | 228 | | | | 0 | |
| | | | | |
| 1,504,000 PLN | | 399,357 USD | | Goldman Sachs | | 7-17-2019 | | | 3,636 | | | | 0 | |
| | | | | |
| 1,444,000 BRL | | 373,329 USD | | Goldman Sachs | | 7-17-2019 | | | 2,201 | | | | 0 | |
| | | | | |
| 9,144,918,000 IDR | | 646,512 USD | | Goldman Sachs | | 7-17-2019 | | | 0 | | | | (259 | ) |
| | | | | |
| 3,399,000 CZK | | 151,904 USD | | Goldman Sachs | | 7-17-2019 | | | 146 | | | | 0 | |
| | | | | |
| 766,000 SEK | | 82,748 USD | | Goldman Sachs | | 7-17-2019 | | | 0 | | | | (166 | ) |
| | | | | |
| 7,891,000 JPY | | 73,300 USD | | Goldman Sachs | | 7-17-2019 | | | 0 | | | | (23 | ) |
| | | | | |
| 373,418,000 CLP | | 549,306 USD | | Goldman Sachs | | 7-17-2019 | | | 1,881 | | | | 0 | |
| | | | | |
| 284,000 AUD | | 198,995 USD | | Goldman Sachs | | 7-17-2019 | | | 492 | | | | 0 | |
| | | | | |
| 5,161,000 CAD | | 3,936,969 USD | | Goldman Sachs | | 7-17-2019 | | | 5,505 | | | | 0 | |
| | | | | |
| 306,000 CHF | | 313,456 USD | | Goldman Sachs | | 7-17-2019 | | | 453 | | | | 0 | |
| | | | | |
| 135,261,000 KRW | | 117,053 USD | | Goldman Sachs | | 7-17-2019 | | | 144 | | | | 0 | |
| | | | | |
| 23,697,000 NOK | | 2,785,340 USD | | Goldman Sachs | | 7-17-2019 | | | 0 | | | | (6,005 | ) |
| | | | | |
| 102,645,000 HUF | | 360,876 USD | | Goldman Sachs | | 7-17-2019 | | | 757 | | | | 0 | |
| | | | | |
| 789,462 USD | | 7,405,000 SEK | | Goldman Sachs | | 7-17-2019 | | | 0 | | | | (8,874 | ) |
| | | | | |
| 7,952,076 USD | | 11,352,000 AUD | | Goldman Sachs | | 7-17-2019 | | | 0 | | | | (21,794 | ) |
| | | | | |
| 1,851,671 USD | | 2,458,000 CAD | | Goldman Sachs | | 7-17-2019 | | | 0 | | | | (25,989 | ) |
| | | | | |
| 855,098 USD | | 592,754,000 CLP | | Goldman Sachs | | 7-17-2019 | | | 0 | | | | (19,841 | ) |
| | | | | |
| 1,978,592 USD | | 559,530,000 HUF | | Goldman Sachs | | 7-17-2019 | | | 7,287 | | | | 0 | |
| | | | | |
| 6,881,368 USD | | 59,433,000 NOK | | Goldman Sachs | | 7-17-2019 | | | 0 | | | | (89,313 | ) |
| | | | | |
| 4,634,365 USD | | 6,956,000 NZD | | Goldman Sachs | | 7-17-2019 | | | 0 | | | | (40,299 | ) |
| | | | | |
| 1,585,552 USD | | 1,872,901,000 KRW | | Goldman Sachs | | 7-17-2019 | | | 0 | | | | (37,225 | ) |
| | | | | |
| 8,066,153 USD | | 7,950,000 CHF | | Goldman Sachs | | 7-17-2019 | | | 0 | | | | (89,311 | ) |
| | | | | |
| 126,004 USD | | 188,000 NZD | | Goldman Sachs | | 7-17-2019 | | | 0 | | | | (338 | ) |
| | | | | |
| 402,925 USD | | 354,000 EUR | | Goldman Sachs | | 7-17-2019 | | | 0 | | | | (113 | ) |
| | | | | |
| 310,760 USD | | 5,974,000 MXN | | Goldman Sachs | | 7-17-2019 | | | 272 | | | | 0 | |
| | | | | |
| 899,267 USD | | 62,223,000 INR | | Goldman Sachs | | 7-17-2019 | | | 0 | | | | (451 | ) |
| | | | | |
| 196,279 USD | | 2,785,000 ZAR | | Goldman Sachs | | 7-17-2019 | | | 0 | | | | (1,081 | ) |
| | | | | |
| 398,250 USD | | 314,000 GBP | | Goldman Sachs | | 7-17-2019 | | | 0 | | | | (817 | ) |
| | | | | | | | | | | | | | |
| | | | | |
| | | | | | | | $ | 312,140 | | | $ | (352,332 | ) |
| | | | | | | | | | | | | | |
Swaps
| | | | | | | | | | | | | | | | | | | | | | | | |
| Reference asset/index | | Counterparty | | Payment
frequency | | Maturity
date | | | Notional
amount | | | Value | | | Unrealized
gains | | | Unrealized
losses | |
| | | | | | | |
| Synthetic total return swap† | | Goldman Sachs | | Monthly | | | 2-1-2024 | | | $ | 7,823,454 | | | $ | 7,841,198 | | | $ | 17,744 | | | $ | 0 | |
| † | The Fund receives or pays the difference between the total return on a portfolio of long and short positions underlying the total return swap and the return on a specified benchmark (either the Federal Funds Effective Rate or the One Month LIBOR), plus or minus a spread in a typical range of 20-75 basis points. The spread is determined based upon the country and/or currency of the individual underlying positions. Certain short positions may be subject to higher market rates. |
Wells Fargo Alternative Risk Premia Fund | 9
Consolidated portfolio of investments—June 30, 2019
The following table represents the component disclosures associated with the synthetic total return swap basket as of the end of the period.
| | | | | | | | | | | | | | | | |
| Reference asset | | | | | Shares | | | Value | | | % of swap
basket value | |
| | | | |
| Long positions | | | | | | | | | | | | | | | | |
| | | | |
Common Stocks | | | | | | | | | | | | | | | | |
| | | | |
Communication Services | | | | | | | | | | | | | | | | |
Diversified Telecommunication Services | | | | | | | | | | | | | | | | |
PCCW Limited | | | | | | | 186,000 | | | $ | 107,385 | | | | 1.37 | % |
Spark New Zealand Limited | | | | | | | 145,031 | | | | 389,727 | | | | 4.97 | |
| | | | |
Entertainment | | | | | | | | | | | | | | | | |
DeNA Company Limited | | | | | | | 33,300 | | | | 637,801 | | | | 8.13 | |
| | | | |
Interactive Media & Services | | | | | | | | | | | | | | | | |
Kakaku.com Incorporated | | | | | | | 5,100 | | | | 98,391 | | | | 1.25 | |
| | | | |
Media | | | | | | | | | | | | | | | | |
Discovery Communications Incorporated Class A | | | | | | | 2,734 | | | | 83,934 | | | | 1.07 | |
Hakuhodo DY Holdings Incorporated | | | | | | | 28,500 | | | | 479,516 | | | | 6.12 | |
Interpublic Group of Companies Incorporated | | | | | | | 13,287 | | | | 300,153 | | | | 3.83 | |
Liberty Media Corporation Class A | | | | | | | 2,856 | | | | 107,985 | | | | 1.38 | |
Pearson plc | | | | | | | 15,531 | | | | 161,615 | | | | 2.06 | |
Schibsted ASA Class B | | | | | | | 11,995 | | | | 312,725 | | | | 3.99 | |
SES SA | | | | | | | 17,369 | | | | 271,567 | | | | 3.46 | |
Singapore Press Holdings Limited | | | | | | | 57,400 | | | | 103,515 | | | | 1.32 | |
| | | | |
| | | | | | | | | | | 3,054,314 | | | | | |
| | | | | | | | | | | | | | | | |
| | | | |
Consumer Discretionary | | | | | | | | | | | | | | | | |
Auto Components | | | | | | | | | | | | | | | | |
Lear Corporation | | | | | | | 870 | | | | 121,165 | | | | 1.55 | |
Toyoda Gosei Company Limited | | | | | | | 18,700 | | | | 364,408 | | | | 4.65 | |
| | | | |
Diversified Consumer Services | | | | | | | | | | | | | | | | |
H&R Block Incorporated | | | | | | | 10,969 | | | | 321,392 | | | | 4.10 | |
| | | | |
Hotels, Restaurants & Leisure | | | | | | | | | | | | | | | | |
Chipotle Mexican Grill Incorporated | | | | | | | 249 | | | | 182,487 | | | | 2.33 | |
Darden Restaurants Incorporated | | | | | | | 2,049 | | | | 249,425 | | | | 3.18 | |
Domino’s Pizza Incorporated | | | | | | | 1,061 | | | | 295,255 | | | | 3.77 | |
| | | | |
Household Durables | | | | | | | | | | | | | | | | |
Husqvarna AB Class B | | | | | | | 22,175 | | | | 207,419 | | | | 2.65 | |
Iida Group Holdings Company | | | | | | | 7,000 | | | | 112,971 | | | | 1.44 | |
| | | | |
Internet & Direct Marketing Retail | | | | | | | | | | | | | | | | |
Wayfair Incorporated Class A | | | | | | | 1,251 | | | | 182,646 | | | | 2.33 | |
| | | | |
Multiline Retail | | | | | | | | | | | | | | | | |
Macy’s Incorporated | | | | | | | 3,995 | | | | 85,733 | | | | 1.09 | |
| | | | |
Specialty Retail | | | | | | | | | | | | | | | | |
Burlington Stores Incorporated | | | | | | | 817 | | | | 139,013 | | | | 1.77 | |
Sonic Automotive Incorporated | | | | | | | 3,567 | | | | 83,289 | | | | 1.06 | |
| | | | |
Textiles, Apparel & Luxury Goods | | | | | | | | | | | | | | | | |
Under Armour Incorporated Class A | | | | | | | 4,718 | | | | 119,601 | | | | 1.53 | |
| | | | |
| | | | | | | | | | | 2,464,804 | | | | | |
| | | | | | | | | | | | | | | | |
| | | | |
Consumer staples | | | | | | | | | | | | | | | | |
Beverages | | | | | | | | | | | | | | | | |
Coca-Cola Amatil Limited | | | | | | | 61,934 | | | | 444,373 | | | | 5.67 | |
| | | | |
Food & Staples Retailing | | | | | | | | | | | | | | | | |
Empire Company Limited Class A | | | | | | | 4,400 | | | | 110,811 | | | | 1.41 | |
Metro AG | | | | | | | 13,767 | | | | 251,645 | | | | 3.21 | |
The Kroger Company | | | | | | | 4,402 | | | | 95,567 | | | | 1.22 | |
The North West Company Incorporated | | | | | | | 6,200 | | | | 141,513 | | | | 1.80 | |
10 | Wells Fargo Alternative Risk Premia Fund
Consolidated portfolio of investments—June 30, 2019
| | | | | | | | | | | | | | | | |
| Reference asset | | | | | Shares | | | Value | | | % of swap
basket value | |
| | | | |
Food Products | | | | | | | | | | | | | | | | |
Chocoladefabriken Lindt & Spruengli AG | | | | | | | 36 | | | $ | 262,016 | | | | 3.34 | % |
Inghams Group Limited | | | | | | | 41,954 | | | | 118,404 | | | | 1.51 | |
Lamb Weston Holdings Incorporated | | | | | | | 1,312 | | | | 83,128 | | | | 1.06 | |
| | | | |
| | | | | | | | | | | 1,507,457 | | | | | |
| | | | | | | | | | | | | | | | |
| | | | |
Energy | | | | | | | | | | | | | | | | |
Oil, Gas & Consumable Fuels | | | | | | | | | | | | | | | | |
Caltex Australia Limited | | | | | | | 25,675 | | | | 446,122 | | | | 5.69 | |
HollyFrontier Corporation | | | | | | | 4,948 | | | | 228,993 | | | | 2.92 | |
Plains GP Holdings LP Class A | | | | | | | 12,371 | | | | 308,904 | | | | 3.94 | |
Washington H. Soul Pattinson & Company Limited | | | | | | | 12,575 | | | | 194,134 | | | | 2.48 | |
| | | | |
| | | | | | | | | | | 1,178,153 | | | | | |
| | | | | | | | | | | | | | | | |
| | | | |
Financials | | | | | | | | | | | | | | | | |
Banks | | | | | | | | | | | | | | | | |
Bank of Queensland Limited | | | | | | | 70,412 | | | | 471,094 | | | | 6.01 | |
OFG Bancorp | | | | | | | 3,636 | | | | 86,428 | | | | 1.10 | |
| | | | |
Capital Markets | | | | | | | | | | | | | | | | |
Investec plc | | | | | | | 18,825 | | | | 122,164 | | | | 1.56 | |
Singapore Exchange Limited | | | | | | | 42,100 | | | | 246,439 | | | | 3.14 | |
| | | | |
Diversified Financial Services | | | | | | | | | | | | | | | | |
Industrivarden AB Class C | | | | | | | 25,978 | | | | 575,725 | | | | 7.34 | |
| | | | |
Mortgage REITs | | | | | | | | | | | | | | | | |
PennyMac Mortgage Investment Trust | | | | | | | 4,908 | | | | 107,142 | | | | 1.37 | |
| | | | |
| | | | | | | | | | | 1,608,992 | | | | | |
| | | | | | | | | | | | | | | | |
| | | | |
Health Care | | | | | | | | | | | | | | | | |
Biotechnology | | | | | | | | | | | | | | | | |
Abcam plc | | | | | | | 5,803 | | | | 108,627 | | | | 1.39 | |
Genus plc | | | | | | | 2,702 | | | | 90,864 | | | | 1.16 | |
Karo Bio AB | | | | | | | 24,977 | | | | 104,199 | | | | 1.33 | |
Repligen Corporation | | | | | | | 1,052 | | | | 90,419 | | | | 1.15 | |
United Therapeutics Corporation | | | | | | | 2,416 | | | | 188,593 | | | | 2.41 | |
| | | | |
Health Care Providers & Services | | | | | | | | | | | | | | | | |
MediPal Holdings Corporation | | | | | | | 6,500 | | | | 143,426 | | | | 1.83 | |
Suzuken Company Limited | | | | | | | 7,300 | | | | 427,918 | | | | 5.46 | |
| | | | |
Pharmaceuticals | | | | | | | | | | | | | | | | |
Kyorin Company Limited | | | | | | | 4,500 | | | | 79,636 | | | | 1.02 | |
Orion Oyj Class B | | | | | | | 11,847 | | | | 434,178 | | | | 5.54 | |
Sawai Pharmaceutical Company Limited | | | | | | | 2,200 | | | | 118,759 | | | | 1.51 | |
| | | | |
| | | | | | | | | | | 1,786,619 | | | | | |
| | | | | | | | | | | | | | | | |
| | | | |
Industrials | | | | | | | | | | | | | | | | |
Building Products | | | | | | | | | | | | | | | | |
Lennox International Incorporated | | | | | | | 968 | | | | 266,200 | | | | 3.39 | |
| | | | |
Electrical Equipment | | | | | | | | | | | | | | | | |
NEL ASA | | | | | | | 107,198 | | | | 86,960 | | | | 1.11 | |
| | | | |
Industrial Conglomerates | | | | | | | | | | | | | | | | |
Keihan Electric Railway Company Limited | | | | | | | 14,900 | | | | 648,848 | | | | 8.27 | |
NWS Holdings Limited | | | | | | | 139,000 | | | | 285,769 | | | | 3.64 | |
| | | | |
Machinery | | | | | | | | | | | | | | | | |
Epiroc AB Class B | | | | | | | 12,093 | | | | 119,782 | | | | 1.53 | |
Schindler Holding AG | | | | | | | 991 | | | | 220,594 | | | | 2.81 | |
Yangzijiang Shipbuilding Holdings Limited | | | | | | | 340,200 | | | | 384,705 | | | | 4.91 | |
| | | | |
Marine | | | | | | | | | | | | | | | | |
Nippon Yusen Kabushiki Kaisha | | | | | | | 32,100 | | | | 514,779 | | | | 6.57 | |
Wells Fargo Alternative Risk Premia Fund | 11
Consolidated portfolio of investments—June 30, 2019
| | | | | | | | | | | | | | | | |
| Reference asset | | | | | Shares | | | Value | | | % of swap
basket value | |
| | | | |
Professional Services | | | | | | | | | | | | | | | | |
Manpower Incorporated | | | | | | | 3,374 | | | $ | 325,928 | | | | 4.16 | % |
| | | | |
Road & Rail | | | | | | | | | | | | | | | | |
ComfortDelGro Corporation Limited | | | | | | | 118,300 | | | | 232,578 | | | | 2.97 | |
The Go-Ahead Group plc | | | | | | | 3,387 | | | | 84,822 | | | | 1.08 | |
| | | | |
Transportation Infrastructure | | | | | | | | | | | | | | | | |
Japan Airport Terminal Company Limited | | | | | | | 8,300 | | | | 353,740 | | | | 4.51 | |
Kamigumi Company Limited | | | | | | | 25,700 | | | | 607,847 | | | | 7.75 | |
| | | | |
| | | | | | | | | | | 4,132,552 | | | | | |
| | | | | | | | | | | | | | | | |
| | | | |
Information Technology | | | | | | | | | | | | | | | | |
Electronic Equipment, Instruments & Components | | | | | | | | | | | | | | | | |
Arrow Electronics Incorporated | | | | | | | 3,666 | | | | 261,276 | | | | 3.33 | |
CDW Corporation of Delaware | | | | | | | 3,094 | | | | 343,434 | | | | 4.38 | |
Daiwabo Company Limited | | | | | | | 1,900 | | | | 90,405 | | | | 1.15 | |
| | | | |
Semiconductors & Semiconductor Equipment | | | | | | | | | | | | | | | | |
ASM Pacific Technology | | | | | | | 8,600 | | | | 88,073 | | | | 1.12 | |
| | | | |
Technology Hardware, Storage & Peripherals | | | | | | | | | | | | | | | | |
Dell Technologies Incorporated | | | | | | | 4,919 | | | | 249,885 | | | | 3.19 | |
| | | | |
| | | | | | | | | | | 1,033,073 | | | | | |
| | | | | | | | | | | | | | | | |
| | | | |
Materials | | | | | | | | | | | | | | | | |
Chemicals | | | | | | | | | | | | | | | | |
Daicel Corporation | | | | | | | 18,100 | | | | 160,829 | | | | 2.05 | |
Johnson Matthey plc | | | | | | | 6,948 | | | | 293,738 | | | | 3.75 | |
Kaneka Corporation | | | | | | | 5,900 | | | | 221,630 | | | | 2.83 | |
| | | | |
Construction Materials | | | | | | | | | | | | | | | | |
Taiheiyo Cement Corporation | | | | | | | 14,300 | | | | 432,389 | | | | 5.51 | |
| | | | |
Metals & Mining | | | | | | | | | | | | | | | | |
Asahi Holdings Incorporated | | | | | | | 6,300 | | | | 127,794 | | | | 1.63 | |
Kobe Steel Limited | | | | | | | 53,700 | | | | 351,143 | | | | 4.48 | |
Maruichi Steel Tube Limited | | | | | | | 3,500 | | | | 97,162 | | | | 1.24 | |
Mitsubishi Materials Corporation | | | | | | | 18,200 | | | | 517,396 | | | | 6.60 | |
Steel Dynamics Incorporated | | | | | | | 7,100 | | | | 214,420 | | | | 2.73 | |
| | | | |
Paper & Forest Products | | | | | | | | | | | | | | | | |
West Fraser Timber Company Limited | | | | | | | 2,900 | | | | 132,206 | | | | 1.69 | |
| | | | |
| | | | | | | | | | | 2,548,707 | | | | | |
| | | | | | | | | | | | | | | | |
| | | | |
Real Estate | | | | | | | | | | | | | | | | |
Equity REITs | | | | | | | | | | | | | | | | |
Brookfield Property REIT Class A | | | | | | | 14,473 | | | | 273,395 | | | | 3.49 | |
Granite REIT | | | | | | | 3,000 | | | | 138,116 | | | | 1.76 | |
InterRent REIT | | | | | | | 15,100 | | | | 159,123 | | | | 2.03 | |
Link REIT | | | | | | | 45,500 | | | | 559,161 | | | | 7.13 | |
NexPoint Residential Trust Incoporated | | | | | | | 1,985 | | | | 82,179 | | | | 1.05 | |
RioCan REIT | | | | | | | 5,300 | | | | 105,187 | | | | 1.34 | |
Smart REIT | | | | | | | 20,500 | | | | 519,877 | | | | 6.63 | |
| | | | |
Real Estate Management & Development | | | | | | | | | | | | | | | | |
Jones Lang LaSalle Incorporated | | | | | | | 1,552 | | | | 218,351 | | | | 2.78 | |
Swire Pacific Limited Class A | | | | | | | 44,500 | | | | 546,872 | | | | 6.97 | |
| | | | |
| | | | | | | | | | | 2,602,261 | | | | | |
| | | | | | | | | | | | | | | | |
| | | | |
Utilities | | | | | | | | | | | | | | | | |
Electric Utilities | | | | | | | | | | | | | | | | |
OGE Energy Corporation | | | | | | | 4,898 | | | | 208,459 | | | | 2.66 | |
| | | | |
Gas Utilities | | | | | | | | | | | | | | | | |
UGI Corporation | | | | | | | 7,052 | | | | 376,647 | | | | 4.80 | |
12 | Wells Fargo Alternative Risk Premia Fund
Consolidated portfolio of investments—June 30, 2019
| | | | | | | | | | | | | | | | |
| Reference asset | | | | | Shares | | | Value | | | % of swap
basket value | |
| | | | |
Independent Power & Renewable Electricity Producers | | | | | | | | | | | | | | | | |
AES Corporation | | | | | | | 8,230 | | | $ | 137,935 | | | | 1.76 | % |
| | | | |
| | | | | | | | | | | 723,041 | | | | | |
| | | | | | | | | | | | | | | | |
| | | Dividend yield | | | | | | | | | | |
| | | | |
Preferred Stock | | | | | | | | | | | | | | | | |
| | | | |
Materials | | | | | | | | | | | | | | | | |
Chemicals | | | | | | | | | | | | | | | | |
Fuchs Petrolub SE | | | 2.71 | % | | | 8,810 | | | | 346,417 | | | | 4.42 | |
| | | | | | | | | | | | | | | | |
| | | | |
| Short positions | | | | | | | | | | | | | | | | |
| | | | |
Common Stocks | | | | | | | | | | | | | | | | |
| | | | |
Communication Services | | | | | | | | | | | | | | | | |
Entertainment | | | | | | | | | | | | | | | | |
Netflix Incorporated | | | | | | | (550 | ) | | | (202,026 | ) | | | (2.58 | ) |
Nintendo Company Limited | | | | | | | (1,200 | ) | | | (439,531 | ) | | | (5.61 | ) |
| | | | |
Interactive Media & Services | | | | | | | | | | | | | | | | |
Facebook Incorporated Class A | | | | | | | (1,290 | ) | | | (248,970 | ) | | | (3.18 | ) |
| | | | |
Wireless Telecommunication Services | | | | | | | | | | | | | | | | |
Vodafone Group plc | | | | | | | (233,935 | ) | | | (384,191 | ) | | | (4.90 | ) |
| | | | |
| | | | | | | | | | | (1,274,718 | ) | | | | |
| | | | | | | | | | | | | | | | |
| | | | |
Consumer Discretionary | | | | | | | | | | | | | | | | |
Automobiles | | | | | | | | | | | | | | | | |
Toyota Motor Corporation | | | | | | | (9,500 | ) | | | (589,306 | ) | | | (7.52 | ) |
| | | | |
Hotels, Restaurants & Leisure | | | | | | | | | | | | | | | | |
Accor SA | | | | | | | (7,729 | ) | | | (331,771 | ) | | | (4.23 | ) |
William Hill plc | | | | | | | (45,938 | ) | | | (90,163 | ) | | | (1.15 | ) |
| | | | |
Household Durables | | | | | | | | | | | | | | | | |
Neinor Homes SA | | | | | | | (8,641 | ) | | | (105,135 | ) | | | (1.34 | ) |
| | | | |
Internet & Direct Marketing Retail | | | | | | | | | | | | | | | | |
Amazon.com Incorporated | | | | | | | (111 | ) | | | (210,193 | ) | | | (2.68 | ) |
Delivery Hero SE | | | | | | | (6,869 | ) | | | (311,570 | ) | | | (3.97 | ) |
| | | | |
Specialty Retail | | | | | | | | | | | | | | | | |
Nitori Holdings Company Limited | | | | | | | (4,300 | ) | | | (569,531 | ) | | | (7.26 | ) |
USS Company Limited | | | | | | | (7,400 | ) | | | (145,714 | ) | | | (1.86 | ) |
| | | | |
Textiles, Apparel & Luxury Goods | | | | | | | | | | | | | | | | |
Compagnie Financière Richemont SA | | | | | | | (3,951 | ) | | | (335,281 | ) | | | (4.28 | ) |
EssilorLuxottica SA | | | | | | | (4,891 | ) | | | (638,189 | ) | | | (8.14 | ) |
| | | | |
| | | | | | | | | | | (3,326,853 | ) | | | | |
| | | | | | | | | | | | | | | | |
| | | | |
Consumer Staples | | | | | | | | | | | | | | | | |
Beverages | | | | | | | | | | | | | | | | |
Anheuser Busch InBev SA | | | | | | | (4,897 | ) | | | (433,443 | ) | | | (5.53 | ) |
| | | | |
Food Products | | | | | | | | | | | | | | | | |
Kagome Company Limited | | | | | | | (4,100 | ) | | | (95,260 | ) | | | (1.21 | ) |
The Kraft Heinz Company | | | | | | | (11,403 | ) | | | (353,949 | ) | | | (4.51 | ) |
| | | | |
| | | | | | | | | | | (882,652 | ) | | | | |
| | | | | | | | | | | | | | | | |
| | | | |
Energy | | | | | | | | | | | | | | | | |
Energy Equipment & Services | | | | | | | | | | | | | | | | |
Dril-Quip Incorporated | | | | | | | (1,685 | ) | | | (80,880 | ) | | | (1.03 | ) |
Schlumberger Limited | | | | | | | (5,885 | ) | | | (233,870 | ) | | | (2.98 | ) |
| | | | |
Oil, Gas & Consumable Fuels | | | | | | | | | | | | | | | | |
Enbridge Incorporated | | | | | | | (6,900 | ) | | | (249,223 | ) | | | (3.18 | ) |
| | | | |
| | | | | | | | | | | (563,973 | ) | | | | |
| | | | | | | | | | | | | | | | |
Wells Fargo Alternative Risk Premia Fund | 13
Consolidated portfolio of investments—June 30, 2019
| | | | | | | | | | | | | | | | |
| Reference asset | | | | | Shares | | | Value | | | % of swap
basket value | |
| | | | |
Financials | | | | | | | | | | | | | | | | |
Banks | | | | | | | | | | | | | | | | |
Barclays plc | | | | | | | (110,199 | ) | | $ | (209,641 | ) | | | (2.67 | ) % |
CYBG plc | | | | | | | (35,829 | ) | | | (87,498 | ) | | | (1.12 | ) |
Japan Post Bank Company Limited | | | | | | | (44,500 | ) | | | (451,542 | ) | | | (5.76 | ) |
| | | | |
Capital Markets | | | | | | | | | | | | | | | | |
Credit Suisse Group AG | | | | | | | (31,394 | ) | | | (376,426 | ) | | | (4.80 | ) |
DWS Group GmbH & Company KGaA | | | | | | | (2,667 | ) | | | (93,345 | ) | | | (1.19 | ) |
The Charles Schwab Corporation | | | | | | | (7,263 | ) | | | (291,900 | ) | | | (3.72 | ) |
UBS Group AG | | | | | | | (25,398 | ) | | | (301,800 | ) | | | (3.85 | ) |
| | | | |
Insurance | | | | | | | | | | | | | | | | |
American International Group Incorporated | | | | | | | (9,252 | ) | | | (492,947 | ) | | | (6.29 | ) |
CNO Financial Group Incorporated | | | | | | | (5,773 | ) | | | (96,294 | ) | | | (1.23 | ) |
Japan Post Holdings Company Limited | | | | | | | (55,100 | ) | | | (623,494 | ) | | | (7.95 | ) |
Manulife Financial Corporation | | | | | | | (10,700 | ) | | | (194,464 | ) | | | (2.48 | ) |
Prudential plc | | | | | | | (15,793 | ) | | | (344,166 | ) | | | (4.39 | ) |
| | | | |
| | | | | | | | | | | (3,563,517 | ) | | | | |
| | | | | | | | | | | | | | | | |
| | | | |
Health Care | | | | | | | | | | | | | | | | |
Biotechnology | | | | | | | | | | | | | | | | |
Alnylam Pharmaceuticals Incorporated | | | | | | | (2,670 | ) | | | (193,735 | ) | | | (2.47 | ) |
| | | | |
Health Care Providers & Services | | | | | | | | | | | | | | | | |
Fresenius SE & Company KGaA | | | | | | | (5,072 | ) | | | (274,988 | ) | | | (3.51 | ) |
Mediclinic International plc | | | | | | | (24,451 | ) | | | (94,676 | ) | | | (1.21 | ) |
Miraca Holdings Incorporated | | | | | | | (4,600 | ) | | | (104,531 | ) | | | (1.33 | ) |
| | | | |
Life Sciences Tools & Services | | | | | | | | | | | | | | | | |
Perkinelmer Incorporated | | | | | | | (961 | ) | | | (92,583 | ) | | | (1.18 | ) |
| | | | |
Pharmaceuticals | | | | | | | | | | | | | | | | |
Bayer AG | | | | | | | (4,986 | ) | | | (345,504 | ) | | | (4.41 | ) |
Takeda Pharmaceutical Company Limited | | | | | | | (11,000 | ) | | | (390,048 | ) | | | (4.97 | ) |
| | | | |
| | | | | | | | | | | (1,496,065 | ) | | | | |
| | | | | | | | | | | | | | | | |
| | | | |
Industrials | | | | | | | | | | | | | | | | |
Commercial Services & Supplies | | | | | | | | | | | | | | | | |
Elis SA | | | | | | | (6,115 | ) | | | (110,906 | ) | | | (1.41 | ) |
| | | | |
Electrical Equipment | | | | | | | | | | | | | | | | |
Melrose Industries plc | | | | | | | (75,884 | ) | | | (174,283 | ) | | | (2.22 | ) |
Nidec Corporation | | | | | | | (1,100 | ) | | | (150,234 | ) | | | (1.92 | ) |
| | | | |
Industrial Conglomerates | | | | | | | | | | | | | | | | |
General Electric Company | | | | | | | (21,934 | ) | | | (230,307 | ) | | | (2.94 | ) |
| | | | |
Machinery | | | | | | | | | | | | | | | | |
FANUC Corporation | | | | | | | (2,400 | ) | | | (443,649 | ) | | | (5.66 | ) |
Trelleborg AB Class B | | | | | | | (7,005 | ) | | | (99,461 | ) | | | (1.27 | ) |
| | | | |
Transportation Infrastructure | | | | | | | | | | | | | | | | |
Transurban Group Stapled Security | | | | | | | (62,052 | ) | | | (642,128 | ) | | | (8.19 | ) |
| | | | |
| | | | | | | | | | | (1,850,968 | ) | | | | |
| | | | | | | | | | | | | | | | |
| | | | |
Information Technology | | | | | | | | | | | | | | | | |
Electronic Equipment, Instruments & Components | | | | | | | | | | | | | | | | |
Keyence Corporation | | | | | | | (600 | ) | | | (368,019 | ) | | | (4.69 | ) |
| | | | |
IT Services | | | | | | | | | | | | | | | | |
Worldline SA | | | | | | | (1,584 | ) | | | (115,275 | ) | | | (1.47 | ) |
Worldpay Incorporated Class A | | | | | | | (863 | ) | | | (105,761 | ) | | | (1.35 | ) |
| | | | |
Semiconductors & Semiconductor Equipment | | | | | | | | | | | | | | | | |
ASML Holding NV | | | | | | | (1,736 | ) | | | (362,704 | ) | | | (4.63 | ) |
Nvidia Corporation | | | | | | | (1,189 | ) | | | (195,269 | ) | | | (2.49 | ) |
14 | Wells Fargo Alternative Risk Premia Fund
Consolidated portfolio of investments—June 30, 2019
| | | | | | | | | | | | | | | | |
| Reference asset | | | | | Shares | | | Value | | | % of swap
basket value | |
| | | | |
Software | | | | | | | | | | | | | | | | |
Microsoft Corporation | | | | | | | (1,909 | ) | | $ | (255,730 | ) | | | (3.26 | ) % |
Tyler Technologies Incorporated | | | | | | | (509 | ) | | | (109,954 | ) | | | (1.40 | ) |
| | | | |
Technology Hardware, Storage & Peripherals | | | | | | | | | | | | | | | | |
Apple Incorporated | | | | | | | (1,162 | ) | | | (229,983 | ) | | | (2.93 | ) |
Canon Incorporated | | | | | | | (21,300 | ) | | | (621,526 | ) | | | (7.93 | ) |
| | | | |
| | | | | | | | | | | (2,364,221 | ) | | | | |
| | | | | | | | | | | | | | | | |
| | | | |
Materials | | | | | | | | | | | | | | | | |
Chemicals | | | | | | | | | | | | | | | | |
BASF SE | | | | | | | (3,592 | ) | | | (261,079 | ) | | | (3.33 | ) |
Corteva Incorporated | | | | | | | (3,471 | ) | | | (102,637 | ) | | | (1.31 | ) |
Dupont De Nemours Incorporated | | | | | | | (3,471 | ) | | | (260,568 | ) | | | (3.32 | ) |
Nutrien Limited | | | | | | | (5,900 | ) | | | (315,601 | ) | | | (4.02 | ) |
| | | | |
Metals & Mining | | | | | | | | | | | | | | | | |
First Quantum Minerals Limited | | | | | | | (10,900 | ) | | | (103,544 | ) | | | (1.32 | ) |
Royal Gold Incorporated | | | | | | | (1,094 | ) | | | (112,124 | ) | | | (1.43 | ) |
| | | | |
| | | | | | | | | | | (1,155,553 | ) | | | | |
| | | | | | | | | | | | | | | | |
| | | | |
Real Estate | | | | | | | | | | | | | | | | |
Equity REITs | | | | | | | | | | | | | | | | |
Cominar REIT | | | | | | | (13,600 | ) | | | (129,919 | ) | | | (1.66 | ) |
Land Securities Group plc | | | | | | | (9,114 | ) | | | (96,437 | ) | | | (1.23 | ) |
| | | | |
Real Estate Management & Development | | | | | | | | | | | | | | | | |
Capital & Counties Properties plc | | | | | | | (39,310 | ) | | | (108,130 | ) | | | (1.38 | ) |
The Howard Hughes Corporation | | | | | | | (951 | ) | | | (117,772 | ) | | | (1.50 | ) |
| | | | |
| | | | | | | | | | | (452,258 | ) | | | | |
| | | | | | | | | | | | | | | | |
| | | | |
Utilities | | | | | | | | | | | | | | | | |
Electric Utilities | | | | | | | | | | | | | | | | |
Power Assets Holdings Limited | | | | | | | (71,500 | ) | | | (514,395 | ) | | | (6.56 | ) |
| | | | | | | | | | | | | | | | |
| | | Dividend yield | | | | | | | | | | |
| | | | |
| Preferred Stock | | | | | | | | | | | | | | | | |
| | | | |
Consumer Discretionary | | | | | | | | | | | | | | | | |
Automobiles | | | | | | | | | | | | | | | | |
Porsche Automobil Holding SE | | | 3.86 | % | | | (4,710 | ) | | | (306,027 | ) | | | (3.90 | ) |
| | | | | | | | | | | | | | | | |
Wells Fargo Alternative Risk Premia Fund | 15
Consolidated portfolio of investments—June 30, 2019
Investments in Affiliates
An affiliated investment is an investment in which the Fund owns at least 5% of the outstanding voting shares of the issuer or as a result of other relationships, such as the Fund and the issuer having the same investment manager. Transactions with issuers that were either affiliated persons of the Fund at the beginning of the period or the end of the period were as follows:
| | | | | | | | | | | | | | | | | | | | | | | | | | | | | | | | | | | | |
| | | Shares,
beginning of
period | | | Shares
purchased | | | Shares
sold | | | Shares,
end of
period | | | Net
realized
gains
(losses) | | | Net
change in
unrealized
gains
(losses) | | | Income
from
affiliated
securities | | | Value,
end of
period | | | % of
net
assets | |
Short-Term Investments | | | | | | | | | | | | | | | | | | | | | | | | | | | | | | | | | | | | |
Investment Companies | | | | | | | | | | | | | | | | | | | | | | | | | | | | | | | | | | | | |
Wells Fargo Government Money Market Fund Select Class | | | 0 | | | | 20,272,652 | | | | 17,889,432 | | | | 2,383,220 | | | $ | 0 | | | $ | 0 | | | $ | 22,316 | | | $ | 2,383,220 | | | | 6.12 | % |
Abbreviations:
The accompanying notes are an integral part of these financial statements.
16 | Wells Fargo Alternative Risk Premia Fund
Consolidated statement of assets and liabilities—June 30, 2019
| | | | |
| | | | |
| |
Assets | | | | |
Investments in unaffiliated securities, at value (cost $37,011,610) | | $ | 37,029,017 | |
Investments in affiliated securities, at value (cost $2,383,220) | | | 2,383,220 | |
Due from broker (including foreign currency), at value (cost $57,872) | | | 57,865 | |
Receivable for dividends | | | 4,827 | |
Receivable for daily variation margin on open futures contracts | | | 167,512 | |
Unrealized gains on forward foreign currency contracts | | | 312,140 | |
Unrealized gains on swap contracts | | | 17,744 | |
Receivable from manager | | | 12,487 | |
Prepaid expenses and other assets | | | 34,857 | |
| | | | |
Total assets | | | 40,019,669 | |
| | | | |
| |
Liabilities | | | | |
Unrealized losses on forward foreign currency contracts | | | 352,332 | |
Overdraft due to custodian bank | | | 320,230 | |
Payable for daily variation margin on open futures contracts | | | 181,636 | |
Payable for investments purchased | | | 177,529 | |
Trustees’ fees and expenses payable | | | 2,821 | |
Administration fees payable | | | 970 | |
Accrued expenses and other liabilities | | | 3,214 | |
| | | | |
Total liabilities | | | 1,038,732 | |
| | | | |
Total net assets | | $ | 38,980,937 | |
| | | | |
| |
Net assets consist of | | | | |
Paid-in capital | | $ | 38,280,882 | |
Total distributable earnings | | | 700,055 | |
| | | | |
Total net assets | | $ | 38,980,937 | |
| | | | |
| |
Computation of net asset value per share | | | | |
Net assets – Class R6 | | $ | 38,956,584 | |
Shares outstanding – Class R61 | | | 3,997,500 | |
Net asset value per share – Class R6 | | | $9.75 | |
Net assets – Institutional Class | | $ | 24,353 | |
Shares outstanding – Institutional Class1 | | | 2,500 | |
Net asset value per share – Institutional Class | | | $9.74 | |
| 1 | The Fund has an unlimited number of authorized shares. |
The accompanying notes are an integral part of these financial statements.
Wells Fargo Alternative Risk Premia Fund | 17
Consolidated statement of operations—year ended June 30, 20191
| | | | |
| | | | |
| |
Investment income | | | | |
Interest | | $ | 373,383 | |
Income from affiliated securities | | | 22,316 | |
| | | | |
Total investment income | | | 395,699 | |
| | | | |
| |
Expenses | | | | |
Management fee | | | 98,818 | |
Administration fees | | | | |
Class R6 | | | 4,938 | |
Institutional Class | | | 14 | |
Custody and accounting fees | | | 9,578 | |
Professional fees | | | 64,175 | |
Registration fees | | | 18,494 | |
Shareholder report expenses | | | 40,666 | |
Trustees’ fees and expenses | | | 8,745 | |
Other fees and expenses | | | 11,241 | |
| | | | |
Total expenses | | | 256,669 | |
Less: Fee waivers and/or expense reimbursements | | | (154,547 | ) |
| | | | |
Net expenses | | | 102,122 | |
| | | | |
Net investment income | | | 293,577 | |
| | | | |
| |
Realized and unrealized gains (losses) on investments | | | | |
Net realized gains (losses) on: | | | | |
Unaffiliated securities and foreign currency | | | (12,327 | ) |
Futures contracts | | | (951,286 | ) |
Forward foreign currency contracts | | | 333,356 | |
Swap contracts | | | (1,005,675 | ) |
| | | | |
Net realized losses on investments | | | (1,635,932 | ) |
| | | | |
| |
Net change in unrealized gains (losses) on: | | | | |
Unaffiliated securities | | | 17,400 | |
Futures contracts | | | 328,340 | |
Forward foreign currency contracts | | | (40,192 | ) |
Swap contracts | | | 17,744 | |
| | | | |
Net change in unrealized gains (losses) on investments | | | 323,292 | |
| | | | |
Net realized and unrealized gains (losses) on investments | | | (1,312,640 | ) |
| | | | |
Net decrease in net assets resulting from operations | | $ | (1,019,063 | ) |
| | | | |
| 1 | For the period from January 29, 2019 (commencement of operations) to June 30, 2019 |
The accompanying notes are an integral part of these financial statements.
18 | Wells Fargo Alternative Risk Premia Fund
Consolidated statement of changes in net assets
| | | | | | | | |
| | | Year ended
June 30, 20191 | |
|
Operations | |
Net investment income | | | | | | $ | 293,577 | |
Net realized losses on investments | | | | | | | (1,635,932 | ) |
Net change in unrealized gains (losses) on investments | | | | | | | 323,292 | |
| | | | | | | | |
Net decrease in net assets resulting from operations | | | | | | | (1,019,063 | ) |
| | | | | | | | |
| | |
Capital share transactions | | | Shares | | | | | |
Proceeds from shares sold | |
Class R6 | | | 3,997,500 | | | | 39,975,000 | |
Institutional Class | | | 2,500 | | | | 25,000 | |
| | | | | | | | |
| | | | | | | 40,000,000 | |
| | | | | | | | |
Net increase in net assets resulting from capital share transactions | | | | | | | 40,000,000 | |
| | | | | | | | |
Total increase in net assets | | | | | | | 38,980,937 | |
| | | | | | | | |
| |
Net assets | | | | |
Beginning of period | | | | | | | 0 | |
| | | | | | | | |
End of period | | | | | | $ | 38,980,937 | |
| | | | | | | | |
| 1 | For the period from January 29, 2019 (commencement of operations) to June 30, 2019 |
The accompanying notes are an integral part of these financial statements.
Wells Fargo Alternative Risk Premia Fund | 19
Consolidated financial highlights
(For a share outstanding throughout the period)
| | | | |
| CLASS R6 | | Year ended June 30, 20191 | |
Net asset value, beginning of period | | | $10.00 | |
Net investment income | | | 0.07 | |
Net realized and unrealized gains (losses) on investments | | | (0.32 | ) |
| | | | |
Total from investment operations | | | (0.25 | ) |
Net asset value, end of period | | | $9.75 | |
Total return2 | | | (2.50 | )% |
Ratios to average net assets (annualized) | | | | |
Gross expenses | | | 1.56 | % |
Net expenses | | | 0.62 | % |
Net investment income | | | 1.78 | % |
Supplemental data | | | | |
Portfolio turnover rate | | | 0 | % |
Net assets, end of period (000s omitted) | | | $38,957 | |
| 1 | For the period from January 29, 2019 (commencement of class operations) to June 30, 2019 |
| 2 | Returns for periods of less than one year are not annualized. |
The accompanying notes are an integral part of these financial statements.
20 | Wells Fargo Alternative Risk Premia Fund
Consolidated financial highlights
(For a share outstanding throughout the period)
| | | | |
| INSTITUTIONAL CLASS | | Year ended June 30, 20191 | |
Net asset value, beginning of period | | | $10.00 | |
Net investment income | | | 0.07 | |
Net realized and unrealized gains (losses) on investments | | | (0.33 | ) |
| | | | |
Total from investment operations | | | (0.26 | ) |
Net asset value, end of period | | | $9.74 | |
Total return2 | | | (2.60 | )% |
Ratios to average net assets (annualized) | | | | |
Gross expenses | | | 1.68 | % |
Net expenses | | | 0.72 | % |
Net investment income | | | 1.69 | % |
Supplemental data | | | | |
Portfolio turnover rate | | | 0 | % |
Net assets, end of period (000s omitted) | | | $24 | |
| 1 | For the period from January 29, 2019 (commencement of class operations) to June 30, 2019 |
| 2 | Returns for periods of less than one year are not annualized. |
The accompanying notes are an integral part of these financial statements.
Wells Fargo Alternative Risk Premia Fund | 21
Notes to consolidated financial statements
1. ORGANIZATION
Wells Fargo Funds Trust (the “Trust”), a Delaware statutory trust organized on March 10, 1999, is anopen-end management investment company registered under the Investment Company Act of 1940, as amended (the “1940 Act”). As an investment company, the Trust follows the accounting and reporting guidance in Financial Accounting Standards Board (“FASB”)Accounting Standards Codification Topic 946, Financial Services – Investment Companies. These financial statements report on the Wells Fargo Alternative Risk Premia Fund (the “Fund”) which is a diversified series of the Trust.
2. INVESTMENT IN SUBSIDIARY
The Fund invests in direct or indirect investments in various derivatives, including commodity-linked derivatives, through Alt Risk Premia Special Investments (Cayman) Ltd. (the “Subsidiary”), a wholly owned subsidiary incorporated on October 2, 2018 under the laws of the Cayman Islands as an exempted segregated portfolio company with limited liability. As of June 30, 2019, the Subsidiary had $2,076,157 invested in securities and futures contracts representing 87.90% of its net assets. The Fund is the sole shareholder of the Subsidiary. As of June 30, 2019, the Fund held $2,361,820 in the Subsidiary, representing 6.06% of the Fund’s net assets prior to consolidation.
The consolidated financial statements of the Fund include the financial results of the Subsidiary. The Consolidated Portfolio of Investments includes positions of the Fund and the Subsidiary and the consolidated financial statements include the accounts of the Fund and the Subsidiary. Accordingly, all interfund balances and transactions between the Fund and the Subsidiary have been eliminated in consolidation.
3. SIGNIFICANT ACCOUNTING POLICIES
The following significant accounting policies, which are consistently followed in the preparation of the consolidated financial statements of the Fund, are in conformity with U.S. generally accepted accounting principles which require management to make estimates and assumptions that affect the reported amounts of assets and liabilities, disclosure of contingent assets and liabilities at the date of the financial statements, and the reported amounts of revenues and expenses during the reporting period. Actual results could differ from those estimates.
Securities valuation
All investments are valued each business day as of the close of regular trading on the New York Stock Exchange (generally 4 p.m. Eastern Time), although the Fund may deviate from this calculation time under unusual or unexpected circumstances.
Futures contracts that are listed on a foreign or domestic exchange or market are valued at the official closing price or, if none, the last sales price. If no sale occurs on the principal exchange or market that day, a fair value price will be determined in accordance with the Fund’s Valuation Procedures.
Forward foreign currency contracts are recorded at the forward rate provided by an independent foreign currency pricing source at a time each business day specified by the Wells Fargo Asset Management Pricing Committee at Wells Fargo Funds Management, LLC (“Funds Management”).
Swaps contracts are valued at the evaluated price provided by an independent pricing service or, if a reliable price is not available, the quoted bid price from an independent broker-dealer.
Debt securities are valued at the evaluated bid price provided by an independent pricing service (e.g. taking into account various factors, including yields, maturities, or credit ratings) or, if a reliable price is not available, the quoted bid price from an independent broker-dealer.
Investments in registeredopen-end investment companies are valued at net asset value.
Investments which are not valued using any of the methods discussed above are valued at their fair value, as determined in good faith by the Board of Trustees of the Fund. The Board of Trustees has established a Valuation Committee comprised of the Trustees and has delegated to it the authority to take any actions regarding the valuation of portfolio securities that the Valuation Committee deems necessary or appropriate, including determining the fair value of portfolio securities, unless the determination has been delegated to the Wells Fargo Asset Management Pricing Committee. The Board of Trustees retains the authority to make or ratify any valuation decisions or approve any changes to the Valuation Procedures as it deems appropriate. On a quarterly basis, the Board of Trustees receives reports on any valuation actions taken by the Valuation Committee or the Wells Fargo Asset Management Pricing Committee which may include items for ratification.
22 | Wells Fargo Alternative Risk Premia Fund
Notes to consolidated financial statements
Foreign currency translation
The accounting records of the Fund are maintained in U.S. dollars. The values of other assets and liabilities denominated in foreign currencies are translated into U.S. dollars at rates provided by an independent foreign currency pricing source at a time each business day specified by the Wells Fargo Asset Management Pricing Committee. Purchases and sales of securities, and income and expenses are converted at the rate of exchange on the respective dates of such transactions. Net realized foreign exchange gains or losses arise from sales of foreign currencies, currency gains or losses realized between the trade and settlement dates on securities transactions, and the difference between the amounts of dividends, interest and foreign withholding taxes recorded and the U.S. dollar equivalent of the amounts actually paid or received. Net unrealized foreign exchange gains and losses arise from changes in the fair value of assets and liabilities other than investments in securities resulting from changes in exchange rates. The changes in net assets arising from changes in exchange rates of securities and the changes in net assets resulting from changes in market prices of securities are not separately presented. Such changes are included in net realized and unrealized gains or losses from investments.
Forward foreign currency contracts
A forward foreign currency contract is an agreement between two parties to purchase or sell a specific currency for an agreed-upon price at a future date. The Fund enters into forward foreign currency contracts to facilitate transactions in foreign-denominated securities and to attempt to minimize the risk to the Fund from adverse changes in the relationship between currencies. Forward foreign currency contracts are recorded at the forward rate andmarked-to-market daily. When the contracts are closed, realized gains and losses arising from such transactions are recorded as realized gains or losses on forward foreign currency contracts. The Fund is subject to foreign currency risk and may be exposed to risks if the counterparties to the contracts are unable to meet the terms of their contracts or if the value of the foreign currency changes unfavorably. The Fund’s maximum risk of loss from counterparty credit risk is the unrealized gains on the contracts. This risk may be mitigated if there is a master netting arrangement between the Fund and the counterparty.
Futures contracts
Futures contracts are agreements between the Fund and a counterparty to buy or sell a specific amount of a commodity, financial instrument or currency at a specified price and on a specified date. The Fund may buy and sell futures contracts in order to gain exposure to, or protect against, changes in interest rates, security values, commodities, and foreign exchange rates and is subject to interest rate risk, equity price risk, commodity risk, and foreign currency risk. The primary risks associated with the use of futures contracts are the imperfect correlation between changes in market values of securities held by the Fund and the prices of futures contracts, and the possibility of an illiquid market. Futures contracts are generally entered into on a regulated futures exchange and cleared through a clearinghouse associated with the exchange. With futures contracts, there is minimal counterparty risk to the Fund since futures contracts are exchange traded and the exchange’s clearinghouse, as the counterparty to all exchange traded futures, guarantees the futures contracts against default.
Upon entering into a futures contracts, the Fund is required to deposit either cash or securities (initial margin) with the broker in an amount equal to a certain percentage of the contract value. Subsequent payments (variation margin) are paid to or from the broker each day equal to the daily changes in the contract value. Such payments are recorded as unrealized gains or losses and, if any, shown as variation margin receivable (payable) in the Consolidated Statement of Assets and Liabilities. Should the Fund fail to make requested variation margin payments, the broker can gain access to the initial margin to satisfy the Fund’s payment obligations. When the contracts are closed, a realized gain or loss is recorded in the Consolidated Statement of Operations.
Swap contracts
Swap contracts are agreements between the Fund and a counterparty to exchange a series of cash flows over a specified period. Swap agreements are privately negotiated contracts between the Fund that are entered into as bilateral contracts in the OTC market (“OTC swaps”) or centrally cleared (“centrally cleared swaps”) with a central clearinghouse.
The Fund entered into OTC swaps. For OTC swaps, any upfront premiums paid and any upfront fees received are shown as swap premiums paid and swap premiums received, respectively, in the Consolidated Statement of Assets and Liabilities and amortized over the term of the contract. The daily fluctuations in market value are recorded as unrealized gains or losses on OTC swaps in the Consolidated Statement of Assets and Liabilities. Payments received or paid are recorded in the Consolidated Statement of Operations as realized gains or losses, respectively. When an OTC swap is terminated, a realized gain or loss is recorded in the Consolidated Statement of Operations equal to the difference between the proceeds from (or cost of) the closing transaction and the Fund’s basis in the contract, if any. Generally, the basis of the contract is the premium received or paid.
Wells Fargo Alternative Risk Premia Fund | 23
Notes to consolidated financial statements
Total return basket swaps
The Fund may enter into total return basket swap contracts to obtain exposure to a custom basket of long and short securities without owning such securities. The Fund has the ability to trade in and out of the long and short positions within the swap and receives the economic benefits and risks equivalent to direct investments in these positions. Under the terms of the contract, the Fund and the counterparty exchange periodic payments based on the total return of reference assets within a basket for a specified interest rate. Benefits and risks include capital appreciation (depreciation), corporate actions and dividends received and paid, all of which are reflected in the swap’s market value. The market value also includes interest charges and credits (“financing fees”) related to the notional values of the long and short positions and cash balances within the swap. To the extent the total return of the reference assets exceeds or falls short of the offsetting interest rate obligation, the Fund will receive a payment from, or make a payment to, the counterparty. Positions within the swap are reset periodically. During a reset, any unrealized appreciation (depreciation) on positions and accrued financing fees become available for cash settlement between the Fund and the counterparty. The amounts that are available for cash settlement are recorded as realized gains or losses on swap contracts in the Consolidated Statement of Operations. Cash settlement in and out of the swap may occur at a reset date or any other date, at the discretion of the Fund and the counterparty, over the life of the agreement. Certain swaps have no stated expiration and can be terminated by either party at any time.
The Fund is exposed to risks if the counterparty defaults on its obligation to perform, or if there are unfavorable changes in the fluctuation of interest rates or in the price of the reference securities in the basket. In addition to counterparty credit risk, the Fund is subject to liquidity risk if there is no market for the contracts and is exposed to the market risk associated with the reference securities in the basket.
Security transactions and income recognition
Securities transactions are recorded on a trade date basis. Realized gains or losses are recorded on the basis of identified cost.
Interest income is accrued daily and bond discounts are accreted and premiums are amortized daily. To the extent debt obligations are placed onnon-accrual status, any related interest income may be reduced by writing off interest receivables when the collection of all or a portion of interest has been determined to be doubtful based on consistently applied procedures and the fair value has decreased. If the issuer subsequently resumes interest payments or when the collectability of interest is reasonably assured, the debt obligation is removed fromnon-accrual status.
Distributions to shareholders
Distributions to shareholders from net investment income and any net realized gains are recorded on theex-dividend date and paid at least annually. Such distributions are determined in accordance with income tax regulations and may differ from U.S. generally accepted accounting principles. Dividend sources are estimated at the time of declaration. The tax character of distributions is determined as of the Fund’s fiscal year end. Therefore, a portion of the Fund’s distributions made prior to the Fund’s fiscal year end may be categorized as a tax return of capital at year end.
Federal and other taxes
The Fund intends to qualify as a regulated investment company by distributing substantially all of its investment company taxable income and any net realized capital gains (after reduction for capital loss carryforwards) sufficient to relieve it from all, or substantially all, federal income taxes. Accordingly, no provision for federal income taxes was required.
The Subsidiary is classified as a controlled foreign corporation under Subchapter N of the Internal Revenue Code. Therefore, the Fund is required to increase its taxable income by its share of the Subsidiary’s income. Net investment losses of the Subsidiary cannot be deducted by the Fund in the current period nor carried forward to offset taxable income in future periods.
The Fund is not subject to examination by federal and state tax authorities for taxes before 2019, the year the Fund commenced operations.
As of June 30, 2019, the aggregate cost of all investments for federal income tax purposes was $39,730,455 and the unrealized gains (losses) consisted of:
| | | | |
| |
Gross unrealized gains | | $ | 426,866 | |
| |
Gross unrealized losses | | | (439,192 | ) |
| |
Net unrealized losses | | $ | (12,326 | ) |
Reclassifications are made to the Fund’s capital accounts for permanent tax differences to reflect income and gains available for distribution (or available capital loss carryforwards) under federal income tax regulations. U.S. generally accepted accounting principles require that certain components of net assets be adjusted to reflect permanent differences between financial and tax
24 | Wells Fargo Alternative Risk Premia Fund
Notes to consolidated financial statements
reporting. These reclassifications have no effect on net assets or net asset values per share. The primary permanent differences causing such reclassifications are due to foreign currency transactions, net operating losses, and losses from a controlled foreign corporation. At June 30, 2019, as a result of permanent book-to-tax differences, the following reclassification adjustments were made on the Consolidated Statement of Assets and Liabilities:
| | |
| Paid-in capital | | Total distributable
earnings |
| |
| $(1,719,118) | | $1,719,118 |
Class allocations
The separate classes of shares offered by the Fund differ principally in administration fees. Class specific expenses are charged directly to that share class. Investment income, common fund-level expenses, and realized and unrealized gains (losses) on investments are allocated daily to each class of shares based on the relative proportion of net assets of each class.
4. FAIR VALUATION MEASUREMENTS
Fair value measurements of investments are determined within a framework that has established a fair value hierarchy based upon the various data inputs utilized in determining the value of the Fund’s investments. The three-level hierarchy gives the highest priority to unadjusted quoted prices in active markets for identical assets or liabilities (Level 1) and the lowest priority to unobservable inputs (Level 3). The Fund’s investments are classified within the fair value hierarchy based on the lowest level of input that is significant to the fair value measurement. The inputs are summarized into three broad levels as follows:
| ∎ | | Level 1 – quoted prices in active markets for identical securities |
| ∎ | | Level 2 – other significant observable inputs (including quoted prices for similar securities, interest rates, prepayment speeds, credit risk, etc.) |
| ∎ | | Level 3 – significant unobservable inputs (including the Fund’s own assumptions in determining the fair value of investments) |
The inputs or methodologies used for valuing investments in securities are not necessarily an indication of the risk associated with investing in those securities.
The following is a summary of the inputs used in valuing the Fund’s assets and liabilities as of June 30, 2019:
| | | | | | | | | | | | | | | | |
| | | | |
| | | Quoted prices
(Level 1) | | | Other significant
observable inputs
(Level 2) | | | Significant
unobservable inputs (Level 3) | | | Total | |
| | | | |
Assets | | | | | | | | | | | | | | | | |
| | | | |
Investments in: | | | | | | | | | | | | | | | | |
| | | | |
Short-term investments | | | | | | | | | | | | | | | | |
| | | | |
Investment companies | | $ | 2,383,220 | | | $ | 0 | | | $ | 0 | | | $ | 2,383,220 | |
| | | | |
U.S. Treasury securities | | | 37,029,017 | | | | 0 | | | | 0 | | | | 37,029,017 | |
| | | | |
| | | 39,412,237 | | | | 0 | | | | 0 | | | | 39,412,237 | |
| | | | |
Futures contracts | | | 588,562 | | | | 0 | | | | 0 | | | | 588,562 | |
| | | | |
Forward foreign currency contracts | | | 0 | | | | 312,140 | | | | 0 | | | | 312,140 | |
| | | | |
Swap contracts | | | 0 | | | | 17,744 | | | | 0 | | | | 17,744 | |
| | | | |
Total assets | | $ | 40,000,799 | | | $ | 329,884 | | | $ | 0 | | | $ | 40,330,683 | |
| | | | |
Liabilities | | | | | | | | | | | | | | | | |
Futures contracts | | $ | 260,222 | | | $ | 0 | | | $ | 0 | | | $ | 260,222 | |
| | | | |
Forward foreign currency contracts | | | 0 | | | | 352,332 | | | | 0 | | | | 352,332 | |
| | | | |
Total liabilities | | $ | 260,222 | | | $ | 352,332 | | | $ | 0 | | | $ | 612,554 | |
Futures contracts, forward foreign currency contracts and swap contracts are reported at their cumulative unrealized gains (losses) at measurement date as reported in the tables following the Consolidated Portfolio of Investments. For futures contracts, the current day’s variation margin is reported on the Consolidated Statements of Assets and Liabilities. All other assets and liabilities are reported at their market value at measurement date.
Wells Fargo Alternative Risk Premia Fund | 25
Notes to consolidated financial statements
At June 30, 2019, the Fund did not have any transfers into/out of Level 3.
5. TRANSACTIONS WITH AFFILIATES
Management fee
Funds Management, an indirect wholly owned subsidiary of Wells Fargo & Company (“Wells Fargo”), is the manager of the Fund and provides advisory and fund-level administrative services under an investment management agreement. Under the investment management agreement, Funds Management is responsible for, among other services, implementing the investment objectives and strategies of the Fund, supervising the subadvisers and providing fund-level administrative services in connection with the Fund’s operations. As compensation for its services under the investment management agreement, Funds Management is entitled to receive a management fee at the following annual rate based on the Fund’s average daily net assets:
| | |
| |
| Average daily net assets | | Management fee |
| |
First $500 million | | 0.600% |
| |
Next $500 million | | 0.575 |
| |
Next $2 billion | | 0.550 |
| |
Next $2 billion | | 0.525 |
| |
Next $5 billion | | 0.490 |
| |
Over $10 billion | | 0.480 |
For the period from January 29, 2019 (commencement of operations) to June 30, 2019, the management fee was equivalent to an annual rate of 0.60% of the Fund’s average daily net assets.
The Subsidiary has entered into a separate advisory contract with Funds Management to manage the investment and reinvestment of its assets in conformity with its investment objectives and restrictions. Under this agreement, the Subsidiary does not pay Funds Management a fee for its services.
Funds Management has retained the services of certain subadvisers to provide daily portfolio management to the Fund. The fee for subadvisory services is borne by Funds Management. Wells Capital Management Incorporated (“WellsCap”) and Wells Fargo Asset Management (International) Limited (“WFAM(I) Ltd”), each an affiliate of Funds Management and an indirect wholly owned subsidiary of Wells Fargo, serve as subadvisers to the Fund. WellsCap receives a subadvisory fee at an annual rate starting at 0.20% and declining to 0.10% as the average daily net assets of the Fund increase. WFAM(I) Ltd receives a subadvisory fee for its asset allocation services at an annual rate of 0.10% of the Fund’s average daily net assets and a fee for portfolio management services on the assets itco-manages with WellsCap at an annual rate starting at 0.15% and declining to 0.075%. Effective August 1, 2019, Wells Fargo Asset Management (International), LLC, the existing subadviser to the Fund, had merged with WFAM(I) Ltd and WFAM(I) Ltd became the subadviser to the Fund. This transaction did not result in any changes to the services provided to the Fund or to the strategies or fees and expenses.
Administration fees
Under a class-level administration agreement, Funds Management provides class-level administrative services to the Fund, which includes paying fees and expenses for services provided by the transfer agent,sub-transfer agents, omnibus account servicers and record-keepers. As compensation for its services under the class-level administration agreement, Funds Management receives an annual fee which is calculated based on the average daily net assets of each class as follows:
| | |
| |
| | | Class-level
administration fee |
| |
Class R6 | | 0.03% |
| |
Institutional Class | | 0.13 |
Funds Management has contractually waived and/or reimbursed management and administration fees to the extent necessary to maintain certain net operating expense ratios for the Fund. When each class of the Fund has exceeded its expense cap, Funds Management has waived fees and/or reimbursed expenses from fund-level expenses on a proportionate basis and then from class specific expenses. When only certain classes exceed their expense caps, waivers and/or reimbursements are applied against class specific expenses before fund-level expenses. Funds Management has committed through December 4, 2019 to waive fees and/or reimburse expenses to the extent necessary to cap the Fund’s expenses at 0.62% for Class R6 shares and
26 | Wells Fargo Alternative Risk Premia Fund
Notes to consolidated financial statements
0.72% for Institutional Class shares. Prior to or after the commitment expiration date, the cap may be increased or the commitment to maintain the cap may be terminated only with the approval of the Board of Trustees.
Interfund transactions
The Fund may purchase or sell portfolio investment securities to certain other Wells Fargo affiliates pursuant to Rule17a-7 under the 1940 Act and under procedures adopted by the Board of Trustees. The procedures have been designed to ensure that these interfund transactions, which do not incur broker commissions, are effected at current market prices.
6. INVESTMENT PORTFOLIO TRANSACTIONS
For the period from January 29, 2019 (commencement of operations) to June 30, 2019, the Fund did not have any purchases and sales of securities, excluding any short-term securities.
7. DERIVATIVE TRANSACTIONS
During the period from January 29, 2019 (commencement of operations) to June 30, 2019, the Fund entered into futures contracts, forward foreign currency contracts, and swap contracts to gain market exposures as a substitute for taking a position in the underlying security or basket of securities aiming to achieve Fund’s risk return objective.
The volume of the Fund’s derivative activity during the period from January 29, 2019 (commencement of operations) to June 30, 2019 was as follows:
| | | | |
Futures contracts | | | | |
| |
Average notional balance on long futures | | $ | 26,983,935 | |
| |
Average notional balance on short futures | | | 18,554,061 | |
Forward foreign currency contracts | | | | |
| |
Average contract amounts to buy | | $ | 13,325,627 | |
| |
Average contract amounts to sell | | | 17,532,658 | |
Swap contracts | | | | |
| |
Average notional balance | | $ | 3,240,003 | |
The Fund’s swap transactions may contain provisions for early termination in the event the net assets of the Fund declines below specific levels identified by the counterparty. If these levels are triggered, the counterparty may terminate the transaction and seek payment or request full collateralization of the derivative transactions in net liability positions.
A summary of the location of derivative instruments on the financial statements by primary risk exposure is outlined in the following tables.
The fair value of derivative instruments as of June 30, 2019 by risk type was as follows for the Fund:
| | | | | | | | | | | | |
| | | Asset derivatives | | | Liability derivatives | |
| | | | |
| | | Consolidated Statement of
Assets and Liabilities location | | Fair value | | | Consolidated Statement of
Assets and Liabilities location | | Fair
value | |
| | | | |
Interest rate risk | | Unrealized gains on futures contracts | | $ | 177,054 | * | | Unrealized losses on futures contracts | | $ | 32,009 | * |
| | | | |
Commodity risk | | Unrealized gains on futures contracts | | | 295,543 | * | | Unrealized losses on futures contracts | | | 217,779 | * |
| | | | |
Equity risk | | Unrealized gains on futures contracts | | | 115,965 | * | | Unrealized losses on futures contracts | | | 10,434 | * |
| | | | |
| | Unrealized gains on swaps contracts | | | 17,744 | | | Unrealized losses on swaps contracts | | | 0 | |
| | | | |
Foreign currency risk | | Unrealized gains on forward foreign currency contracts | | | 312,140 | | | Unrealized losses on forward foreign currency contracts | | | 352,332 | |
| | | | |
| | | | | $ | 918,446 | | | | | $ | 612,554 | |
| * | Amount represents cumulative unrealized gains (losses) as reported in the table following the Consolidated Portfolio of Investments. |
| | Only the current day’s variation margin as of June 30, 2019 is reported separately on the Consolidated Statement of Assets and Liabilities. |
Wells Fargo Alternative Risk Premia Fund | 27
Notes to consolidated financial statements
The effect of derivative instruments on the Consolidated Statement of Operations for the period from January 29, 2019 (commencement of operations) to June 30, 2019 was as follows for the Fund:
| | | | | | | | | | | | | | | | |
| | | Amount of realized gains (losses) on derivatives | |
| | | | |
| | | Futures
contracts | | | Forward
foreign
currency
contracts | | | Swap
contracts | | | Total | |
| | | | |
Interest rate risk | | $ | 237,255 | | | $ | 0 | | | $ | 0 | | | $ | 237,255 | |
| | | | |
Commodity risk | | | (1,066,075 | ) | | | 0 | | | | 0 | | | | (1,066,075 | ) |
| | | | |
Equity risk | | | (122,466 | ) | | | 0 | | | | (1,005,675 | ) | | | (1,128,141 | ) |
| | | | |
Foreign currency risk | | | 0 | | | | 333,356 | | | | 0 | | | | 333,356 | |
| | | | |
| | | $ | (951,286 | ) | | $ | 333,356 | | | $ | (1,005,675 | ) | | $ | (1,623,605 | ) |
| |
| | | Change in unrealized gains (losses) on derivatives | |
| | | | |
| | | Futures
contracts | | | Forward
foreign
currency
contracts | | | Swap
contracts | | | Total | |
| | | | |
Interest rate risk | | $ | 145,045 | | | $ | 0 | | | $ | 0 | | | $ | 145,045 | |
| | | | |
Commodity risk | | | 77,764 | | | | 0 | | | | 0 | | | | 77,764 | |
| | | | |
Equity risk | | | 105,531 | | | | 0 | | | | 17,744 | | | | 123,275 | |
| | | | |
Foreign currency risk | | | 0 | | | | (40,192 | ) | | | 0 | | | | (40,192 | ) |
| | | | |
| | | $ | 328,340 | | | $ | (40,192 | ) | | $ | 17,744 | | | $ | 305,892 | |
For certain types of derivative transactions, the Fund has entered into International Swaps and Derivatives Association, Inc. master agreements (“ISDA Master Agreements”) or similar agreements with approved counterparties. The ISDA Master Agreements or similar agreements may have requirements to deliver/deposit securities or cash to/with an exchange or broker-dealer as collateral and allows the Fund to offset, with each counterparty, certain derivative financial instrument’s assets and/or liabilities with collateral held or pledged. Collateral requirements differ by type of derivative. Collateral or margin requirements are set by the broker or exchange clearinghouse for exchange traded derivatives while collateral terms are contract specific forover-the-counter traded derivatives. Cash collateral that has been pledged to cover obligations of the Fund under ISDA Master Agreements or similar agreements, if any, are reported separately in the Consolidated Statement of Assets and Liabilities. Securities pledged as collateral, if any, are noted in the Consolidated Portfolio of Investments. With respect to balance sheet offsetting, absent an event of default by the counterparty or a termination of the agreement, the reported amounts of financial assets and financial liabilities in the Consolidated Statement of Assets and Liabilities are not offset across transactions between the Fund and the applicable counterparty. A reconciliation of the gross amounts on the Consolidated Statement of Assets and Liabilities to the net amounts by counterparty, including any collateral exposure, for OTC derivatives is as follows:
| | | | | | | | | | | | |
| | | | |
| Counterparty | | Gross amounts
of assets in the
Consolidated
Statement of
Assets and
Liabilities | | Amounts
subject to
netting
agreements | | Collateral
received | | | Net amount
of assets | |
| | | | |
Goldman Sachs | | $329,884 | | $(329,884) | | $ | 0 | | | $ | 0 | |
| | | | |
| Counterparty | | Gross amounts
of liabilities in the
Consolidated
Statement of
Assets and
Liabilities | | Amounts
subject to
netting
agreements | | Collateral
pledged1 | | | Net amount
of liabilities | |
| | | | |
Goldman Sachs | | $352,332 | | $(329,884) | | $ | 22,448 | | | $ | 0 | |
| 1 | Collateral pledged within this table is limited to the collateral for the net transaction with the counterparty. |
28 | Wells Fargo Alternative Risk Premia Fund
Notes to consolidated financial statements
8. DISTRIBUTIONS TO SHAREHOLDERS
For period from January 29, 2019 (commencement of operations) to June 30, 2019, the Fund did not have any distributions paid to shareholders.
As of June 30, 2019, the components of distributable earnings on a tax basis were as follows:
| | |
Undistributed long-term gain | | Unrealized losses |
| |
| $712,388 | | $(12,333) |
9. INDEMNIFICATION
Under the Trust’s organizational documents, the officers and Trustees have been granted certain indemnification rights against certain liabilities that may arise out of performance of their duties to the Trust. Additionally, in the normal course of business, the Trust may enter into contracts with service providers that contain a variety of indemnification clauses. The Trust’s maximum exposure under these arrangements is dependent on future claims that may be made against the Fund and, therefore, cannot be estimated.
10. NEW ACCOUNTING PRONOUNCEMENT
In August 2018, FASB issued Accounting Standards Update (“ASU”)No. 2018-13, Fair Value Measurement (Topic 820)Disclosure Framework—Changes to the Disclosure Requirements for Fair Value Measurement. ASU2018-13 updates the disclosure requirements for fair value measurements by modifying or removing certain disclosures and adding certain new disclosures. The amendments are effective for fiscal years, and interim periods within those fiscal years, beginning after December 15, 2019. Early adoption is permitted. Management has adopted the removal and modification of disclosures early, as permitted, and will adopt the additional new disclosures at the effective date.
Wells Fargo Alternative Risk Premia Fund | 29
Report of independent registered public accounting firm
TO THE SHAREHOLDERS OF THE FUND AND BOARD OF TRUSTEES OF WELLS FARGO FUNDS TRUST:
Opinion on the Financial Statements
We have audited the accompanying consolidated statement of assets and liabilities of Wells Fargo Alternative Risk Premia Fund (the Fund), one of the funds constituting Wells Fargo Funds Trust, including the consolidated portfolio of investments, as of June 30, 2019, the related consolidated statements of operations and changes in net assets for the period from January 29, 2019 (commencement of operations) to June 30, 2019, and the related consolidated notes (collectively, the consolidated financial statements) and the consolidated financial highlights for the period from the commencement of operations to June 30, 2019. In our opinion, the consolidated financial statements and consolidated financial highlights present fairly, in all material respects, the financial position of the Fund as of June 30, 2019, the results of its operations, the changes in its net assets, and the financial highlights for the period from the commencement of operations to June 30, 2019, in conformity with U.S. generally accepted accounting principles.
Basis for Opinion
These consolidated financial statements and consolidated financial highlights are the responsibility of the Fund’s management. Our responsibility is to express an opinion on these consolidated financial statements and consolidated financial highlights based on our audits. We are a public accounting firm registered with the Public Company Accounting Oversight Board (United States) (PCAOB) and are required to be independent with respect to the Fund in accordance with the U.S. federal securities laws and the applicable rules and regulations of the Securities and Exchange Commission and the PCAOB.
We conducted our audits in accordance with the standards of the PCAOB. Those standards require that we plan and perform the audit to obtain reasonable assurance about whether the consolidated financial statements and consolidated financial highlights are free of material misstatement, whether due to error or fraud. Our audits included performing procedures to assess the risks of material misstatement of the consolidated financial statements and consolidated financial highlights, whether due to error or fraud, and performing procedures that respond to those risks. Such procedures included examining, on a test basis, evidence regarding the amounts and disclosures in the consolidated financial statements and consolidated financial highlights. Such procedures also included confirmation of securities owned as of June 30, 2019, by correspondence with the custodian and brokers, or by other appropriate auditing procedures. Our audits also included evaluating the accounting principles used and significant estimates made by management, as well as evaluating the overall presentation of the consolidated financial statements and consolidated financial highlights. We believe that our audits provide a reasonable basis for our opinion.

We have not been able to determine the specific year that we began serving as the auditor of one or more Wells Fargo Funds investment companies; however we are aware that we have served as the auditor of one or more Wells Fargo Funds investment companies since at least 1955.
Boston, Massachusetts
August 28, 2019
30 | Wells Fargo Alternative Risk Premia Fund
Other information (unaudited)
PROXY VOTING INFORMATION
A description of the policies and procedures used to determine how to vote proxies relating to portfolio securities is available, upon request, by calling1-800-222-8222, visiting our website atwfam.com, or visiting the SEC website at sec.gov. Information regarding how the proxies related to portfolio securities were voted during the most recent12-month period ended June 30 is available on the website atwfam.comor by visiting the SEC website at sec.gov.
QUARTERLY PORTFOLIO HOLDINGS INFORMATION
The Fund files its complete schedule of portfolio holdings with the SEC for the first and third quarters of each fiscal year on FormN-PORT, which is available by visiting the SEC website at sec.gov. Those forms may be reviewed and copied at the SEC’s Public Reference Room in Washington, DC. Information on the operation of the Public Reference Room may be obtained by calling1-800-SEC-0330.
Wells Fargo Alternative Risk Premia Fund | 31
Other information (unaudited)
BOARD OF TRUSTEES AND OFFICERS
Each of the Trustees and Officers1 listed in the table below acts in identical capacities for each fund in the Wells Fargo family of funds, which consists of 152 mutual funds comprising the Wells Fargo Funds Trust, Wells Fargo Variable Trust, Wells Fargo Master Trust and fourclosed-end funds (collectively the “Fund Complex”). This table should be read in conjunction with the Prospectus and the Statement of Additional Information2. The mailing address of each Trustee and Officer is 525 Market Street, 12th Floor, San Francisco, CA 94105. Each Trustee and Officer serves an indefinite term, however, each Trustee serves such term until reaching the mandatory retirement age established by the Trustees.
Independent Trustees
| | | | | | |
Name and year of birth | | Position held and length of service* | | Principal occupations during past five years or longer | | Current other public company or investment
company directorships |
| | | |
William R. Ebsworth
(Born 1957) | | Trustee,
since 2015 | | Retired. From 1984 to 2013, equities analyst, portfolio manager, research director and chief investment officer at Fidelity Management and Research Company in Boston, Tokyo, and Hong Kong, and retired in 2013 as Chief Investment Officer of Fidelity Strategic Advisers, Inc. where he led a team of investment professionals managing client assets. Prior thereto, Board member of Hong Kong Securities Clearing Co., Hong Kong Options Clearing Corp., the Thailand International Fund, Ltd., Fidelity Investments Life Insurance Company, and Empire Fidelity Investments Life Insurance Company. Audit Committee Chair and Investment Committee Chair of the Vincent Memorial Hospital Endowment(non-profit organization). Mr. Ebsworth is a CFA® charterholder. | | N/A |
| | | |
Jane A. Freeman
(Born 1953) | | Trustee,
since 2015;
Chair Liaison,
since 2018 | | Retired. From 2012 to 2014 and 1999 to 2008, Chief Financial Officer of Scientific Learning Corporation. From 2008 to 2012, Ms. Freeman provided consulting services related to strategic business projects. Prior to 1999, Portfolio Manager at Rockefeller & Co. and Scudder, Stevens & Clark. Board member of the Harding Loevner Funds from 1996 to 2014, serving as both Lead Independent Director and chair of the Audit Committee. Board member of the Russell Exchange Traded Funds Trust from 2011 to 2012 and the chair of the Audit Committee. Ms. Freeman is a Board Member of The Ruth Bancroft Garden(non-profit organization). She is also an inactive Chartered Financial Analyst. | | N/A |
| | | |
Isaiah Harris, Jr.
(Born 1952) | | Trustee,
since 2009;
Audit Committee Chairman,
since 2019 | | Retired. Chairman of the Board of CIGNA Corporation since 2009, and Director since 2005. From 2003 to 2011, Director of Deluxe Corporation. Prior thereto, President and CEO of BellSouth Advertising and Publishing Corp. from 2005 to 2007, President and CEO of BellSouth Enterprises from 2004 to 2005 and President of BellSouth Consumer Services from 2000 to 2003. Emeritus member of the Iowa State University Foundation Board of Governors. Emeritus Member of the Advisory Board of Iowa State University School of Business. Advisory Board Member, Palm Harbor Academy (private school). Advisory Board Member, Child Evangelism Fellowship(non-profit). Mr. Harris is a certified public accountant (inactive status). | | CIGNA Corporation |
| | | |
Judith M. Johnson
(Born 1949) | | Trustee,
since 2008;
Audit Committee Chairman, from 2009 to 2018 | | Retired. Prior thereto, Chief Executive Officer and Chief Investment Officer of Minneapolis Employees Retirement Fund from 1996 to 2008. Ms. Johnson is an attorney, certified public accountant and a certified managerial accountant. | | N/A |
32 | Wells Fargo Alternative Risk Premia Fund
Other information (unaudited)
| | | | | | |
Name and year of birth | | Position held and length of service* | | Principal occupations during past five years or longer | | Current other public company or investment
company directorships |
| | | |
David F. Larcker
(Born 1950) | | Trustee,
since 2009 | | James Irvin Miller Professor of Accounting at the Graduate School of Business, Stanford University, Director of the Corporate Governance Research Initiative and Senior Faculty of The Rock Center for Corporate Governance since 2006. From 2005 to 2008, Professor of Accounting at the Graduate School of Business, Stanford University. Prior thereto, Ernst & Young Professor of Accounting at The Wharton School, University of Pennsylvania from 1985 to 2005. | | N/A |
| | | |
Olivia S. Mitchell
(Born 1953) | | Trustee,
since 2006; Nominating and Governance Committee Chairman,
since 2018 | | International Foundation of Employee Benefit Plans Professor, Wharton School of the University of Pennsylvania since 1993. Director of Wharton’s Pension Research Council and Boettner Center on Pensions & Retirement Research, and Research Associate at the National Bureau of Economic Research. Previously, Cornell University Professor from 1978 to 1993. | | N/A |
| | | |
Timothy J. Penny
(Born 1951) | | Trustee,
since 1996;
Chairman,
since 2018 | | President and Chief Executive Officer of Southern Minnesota Initiative Foundation, anon-profit organization, since 2007. Member of the Board of Trustees of NorthStar Education Finance, Inc., anon-profit organization, since 2007. | | N/A |
| | | |
James G. Polisson
(Born 1959) | | Trustee,
since 2018 | | Retired. Chief Marketing Officer, Source (ETF) UK Services, Ltd, from 2015 to 2017. From 2012 to 2015, Principal of The Polisson Group, LLC, a management consulting, corporate advisory and principal investing company. Chief Executive Officer and Managing Director at Russell Investments, Global Exchange Traded Funds from 2010 to 2012. Managing Director of Barclays Global Investors from 1998 to 2010 and Global Chief Marketing Officer for iShares and Barclays Global Investors from 2000 to 2010. Trustee of the San Francisco Mechanics’ Institute, anon-profit organization, from 2013 to 2015. Board member of the Russell Exchange Traded Fund Trust from 2011 to 2012. Director of Barclays Global Investors Holdings Deutschland GmbH from 2006 to 2009. Mr. Polisson is an attorney and has a retired status with the Massachusetts and District of Columbia Bar Associations. | | N/A |
| * | Length of service dates reflect the Trustee’s commencement of service with the Trust’s predecessor entities, where applicable. |
Wells Fargo Alternative Risk Premia Fund | 33
Other information (unaudited)
Officers
| | | | |
Name and
year of birth | | Position held and length of service | | Principal occupations during past five years or longer |
| | |
Andrew Owen
(Born 1960) | | President,
since 2017 | | Executive Vice President of Wells Fargo & Company and Head of Affiliated Managers, Wells Fargo Asset Management, since 2014. In addition, Mr. Owen is currently President, Chief Executive Officer and Director of Wells Fargo Funds Management, LLC since 2017. Prior thereto, Executive Vice President responsible for marketing, investments and product development for Wells Fargo Funds Management, LLC, from 2009 to 2014. |
| | |
Jeremy DePalma1
(Born 1974) | | Treasurer,
since 2012 | | Senior Vice President of Wells Fargo Funds Management, LLC since 2009. Senior Vice President of Evergreen Investment Management Company, LLC from 2008 to 2010 and head of the Fund Reporting and Control Team within Fund Administration from 2005 to 2010. |
| | |
Alexander Kymn
(Born 1973) | | Secretary and Chief Legal Officer,
since 2018 | | Senior Company Counsel of Wells Fargo Bank, N.A. since 2018 (previously Senior Counsel from 2007 to 2018). Vice President of Wells Fargo Funds Management, LLC from 2008 to 2014. |
| | |
Michael H. Whitaker
(Born 1967) | | Chief Compliance Officer,
since 2016 | | Senior Vice President and Chief Compliance Officer since 2016. Senior Vice President and Chief Compliance Officer for Fidelity Investments from 2007 to 2016. |
| | |
David Berardi
(Born 1975) | | Assistant Treasurer, since 2009 | | Vice President of Wells Fargo Funds Management, LLC since 2009. Vice President of Evergreen Investment Management Company, LLC from 2008 to 2010. Manager of Fund Reporting and Control for Evergreen Investment Management Company, LLC from 2004 to 2010. |
| 1 | Jeremy DePalma acts as Treasurer of 87 funds and Assistant Treasurer of 65 funds in the Fund Complex. |
| 2 | The Statement of Additional Information includes additional information about the Trustees and is available, without charge, upon request, by calling1-800-222-8222 or by visiting the website atwfam.com. |
34 | Wells Fargo Alternative Risk Premia Fund
Other information (unaudited)
BOARD CONSIDERATION OF INVESTMENT MANAGEMENT ANDSUB-ADVISORY AGREEMENTS:
Wells Fargo Alternative Risk Premia Fund
Under the Investment Company Act of 1940 (the “1940 Act”), the Board of Trustees (the “Board”) of Wells Fargo Funds Trust (the “Trust”) must determine annually whether to approve the continuation of the Trust’s investment management andsub-advisory agreements. In this regard, at anin-person meeting held on May21-22, 2019 (the “Meeting”), the Board, all the members of which have no direct or indirect interest in the investment management andsub-advisory agreements and are not “interested persons” of the Trust, as defined in the 1940 Act (the “Independent Trustees”), reviewed and approved for Wells Fargo Alternative Risk Premia Fund(the “Fund”): (i) an investment management agreement (the “Management Agreement”) with Wells Fargo Funds Management, LLC (“Funds Management”); (ii) an investmentsub-advisory agreement with Wells Capital Management Incorporated (“WellsCap”), an affiliate of Funds Management; and (iii) an investmentsub-advisory agreement with Wells Fargo Asset Management (International), LLC (“WFAM International”), an affiliate of Funds Management. Thesub-advisory agreements with WellsCap and WFAM International (the“Sub-Advisers”) are collectively referred to as theSub-Advisory Agreements, and the Management Agreement andSub-Advisory Agreements are collectively referred to as the “Advisory Agreements.”
At the Meeting, the Board considered the factors and reached the conclusions described below relating to the selection of Funds Management and theSub-Advisers and the approval of the Advisory Agreements. Prior to the Meeting, including at anin-person meeting in April 2019, the Trustees conferred extensively among themselves and with representatives of Funds Management about these matters. Also, the Board has adopted a team-based approach, with each team consisting of asub-set of Trustees, to assist the full Board in the discharge of its duties in reviewing investment performance and other matters throughout the year. The Independent Trustees were assisted in their evaluation of the Advisory Agreements by independent legal counsel, from whom they received separate legal advice and with whom they met separately.
In providing information to the Board, Funds Management and theSub-Advisers were guided by a detailed set of requests for information submitted to them by independent legal counsel on behalf of the Independent Trustees at the start of the Board’s annual contract renewal process earlier in 2019. In considering and approving the Advisory Agreements, the Trustees considered the information they believed relevant, including but not limited to the information discussed below. The Board considered not only the specific information presented in connection with the Meeting, but also the knowledge gained over time through interaction with Funds Management and theSub-Advisers about various topics. In this regard, the Board reviewed reports of Funds Management at each of its quarterly meetings, which included, among other things, portfolio reviews and investment performance reports. In addition, the Board and the teams mentioned above confer with portfolio managers at various times throughout the year. The Board did not identify any particular information or consideration that wasall-important or controlling, and each individual Trustee may have attributed different weights to various factors.
After its deliberations, the Board unanimously approved the continuation of the Advisory Agreements for aone-year term and determined that the compensation payable to Funds Management and theSub-Advisers under each of the Advisory Agreements was reasonable. The Board considered the approval of the Advisory Agreements for the Fund as part of its consideration of agreements for funds across the complex, but its approvals were made on afund-by-fund basis. The following summarizes a number of important, but not necessarily all, factors considered by the Board in support of its approvals.
Nature, extent and quality of services
The Board received and considered various information regarding the nature, extent and quality of services provided to the Fund by Funds Management and theSub-Advisers under the Advisory Agreements. This information included a description of the investment advisory services and Fund-level administrative services covered by the Management Agreement, as well as, among other things, a summary of the background and experience of senior management of Wells Fargo Asset Management (“WFAM”), of which Funds Management and theSub-Advisers are a part, a summary of investments made in the business of WFAM, a summary of certain organizational and personnel changes involving Funds Management and theSub-Advisers, and a description of Funds Management’s and theSub-Advisers’ business continuity planning programs and of their approaches to data privacy and cybersecurity. The Board received and reviewed information about Funds Management’s role as administrator of the Fund’s liquidity risk management program. The Board also considered the qualifications, background, tenure and responsibilities of each of the portfolio managers primarily responsible for theday-to-day portfolio management of the Fund.
The Board evaluated the ability of Funds Management and theSub-Advisers to attract and retain qualified investment professionals, including research, advisory and supervisory personnel. The Board further considered the compliance programs and compliance records of Funds Management and theSub-Advisers. In addition, the Board took into account the full range of services provided to the Fund by Funds Management and its affiliates.
Wells Fargo Alternative Risk Premia Fund | 35
Other information (unaudited)
Fund investment performance and expenses
The Board noted that the Fund had recently commenced operations and had no performance history to review. The Board noted that it would have the opportunity to review the Fund’s performance history in connection with the Board’s future review and approval of the Fund’s Advisory Agreements.
The Board, however, received and considered information from Broadridge Inc. (“Broadridge”) regarding the Fund’s net operating expense ratios and their various components, including actual management fees, custodian and othernon-management fees, and Rule12b-1 andnon-Rule12b-1 shareholder service fees. The Board considered these ratios in comparison to the median ratios of funds in class-specific expense groups that were determined by Broadridge to be similar to the Fund (the “Groups”). The Board received a description of the methodology used by Broadridge to select the mutual funds in the expense Groups and an explanation of how funds comprising expense groups and their expense ratios may vary fromyear-to-year. Based on the Broadridge reports, the Board noted that the net operating expense ratios of the Fund were lower than the median net operating expense ratios of the expense Groups for each share class.
The Board took into account the Fund’s expense information provided to it among the factors considered in deciding tore-approve the Advisory Agreements.
Investment management andsub-advisory fee rates
The Board reviewed and considered the contractual fee rates payable by the Fund to Funds Management under the Management Agreement, as well as the contractual fee rates payable by the Fund to Funds Management for class-level administrative services under a Class-Level Administration Agreement, which include, among other things, class-level transfer agency andsub-transfer agency costs (collectively, the “Management Rates”). The Board also reviewed and considered the contractual investmentsub-advisory fee rates that are payable by Funds Management to theSub-Advisers for investmentsub-advisory services.
Among other information reviewed by the Board was a comparison of the Fund’s Management Rates with the average contractual investment management fee rates of funds in the expense Groups at a common asset level as well as transfer agency costs of the funds in the expense Groups. The Board noted that the Management Rates of the Fund were lower than the sum of these average rates for the Fund’s expense Groups for all share classes.
The Board also received and considered information about the portion of the total management fee that was retained by Funds Management after the payment of fees to each of theSub-Advisers forsub-advisory services. In assessing the reasonableness of this amount, the Board received and evaluated information about the nature and extent of responsibilities retained and risks assumed by Funds Management and not delegated to or assumed by theSub-Advisers, and about Funds Management’son-going oversight services. Given the affiliation between Funds Management and theSub-Advisers, the Board ascribed limited relevance to the allocation of fees between them.
The Board also received and considered information about the nature and extent of services offered and fee rates charged by Funds Management and theSub-Advisers to other types of clients with investment strategies similar to those of the Fund. In this regard, the Board received information about the significantly greater scope of services, and compliance, reporting and other legal burdens and risks of managing proprietary mutual funds compared with those associated with managing assets of other types of clients, including third-partysub-advised fund clients andnon-mutual fund clients such as institutional separate accounts.
Based on its consideration of the factors and information it deemed relevant, including those described here, the Board determined that the compensation payable to Funds Management under the Management Agreement and to theSub-Advisers under theSub-Advisory Agreements was reasonable.
Profitability
The Board received and considered information concerning the profitability of Funds Management, as well as the profitability of both WFAM and Wells Fargo & Co. (“Wells Fargo”) from providing services to the fund family as a whole. The Board noted that theSub-Advisers’ profitability information with respect to providing services to the Fund and other funds in the family was subsumed in the WFAM and Wells Fargo profitability analysis.
Funds Management reported on the methodologies and estimates used in calculating profitability, including a description of the methodology used to allocate certain expenses. Among other things, the Board noted that the levels of profitability reported on afund-by-fund basis varied widely, depending on factors such as the size, type and age of fund. Based on its review, the Board did not deem the profits reported by Funds Management, WFAM or Wells Fargo from services provided to the Fund to be at a level that would prevent it from approving the continuation of the Advisory Agreements.
36 | Wells Fargo Alternative Risk Premia Fund
Other information (unaudited)
Economies of scale
The Board received and considered information about the potential for Funds Management to experience economies of scale in the provision of management services to the Fund, the difficulties of calculating economies of scale at an individual fund level, and the extent to which potential scale benefits are shared with shareholders. The Board noted the existence of breakpoints in the Fund’s management fee structure, which operate generally to reduce the Fund’s expense ratios as the Fund grows in size. The Board considered that in addition to management fee breakpoints, Funds Management shares potential economies of scale from its management business in a variety of ways, including through fee waiver and expense reimbursement arrangements, services that benefit shareholders, competitive management fee rates set at the outset without regard to breakpoints, and investments in the business intended to enhance services available to shareholders.
The Board concluded that Funds Management’s arrangements with respect to the Fund, including contractual breakpoints, constituted a reasonable approach to sharing potential economies of scale with the Fund and its shareholders.
Other benefits to Funds Management and theSub-Advisers
The Board received and considered information regarding potential“fall-out” or ancillary benefits received by Funds Management and its affiliates, including theSub-Advisers, as a result of their relationships with the Fund. Ancillary benefits could include, among others, benefits directly attributable to other relationships with the Fund and benefits potentially derived from an increase in Funds Management’s and theSub-Advisers’ businesses as a result of their relationships with the Fund. The Board noted that various affiliates of Funds Management may receive distribution-related fees, shareholder servicing payments andsub-transfer agency fees in respect of shares sold or held through them and services provided.
The Board also reviewed information about soft dollar credits earned and utilized by theSub-Advisers, fees earned by Funds Management and WellsCap from managing a private investment vehicle for the fund family’s securities lending collateral, and commissions earned by an affiliated broker from portfolio transactions.
Based on its consideration of the factors and information it deemed relevant, including those described here, the Board did not find that any ancillary benefits received by Funds Management and its affiliates, including theSub-Advisers, were unreasonable.
Conclusion
At the Meeting, after considering the above-described factors and based on its deliberations and its evaluation of the information described above, the Board unanimously approved the continuation of the Advisory Agreements for aone-year term and determined that the compensation payable to Funds Management and theSub-Advisers under each of the Advisory Agreements was reasonable.
Wells Fargo Alternative Risk Premia Fund | 37
This page is intentionally left blank.
This page is intentionally left blank.
This page is intentionally left blank.

For more information
More information about Wells Fargo Funds is available free upon request. To obtain literature, please write, visit the Fund’s website, or call:
Wells Fargo Funds
P.O. Box 219967
Kansas City, MO 64121-9967
Website:wfam.com
Individual investors:1-800-222-8222
Retail investment professionals:1-888-877-9275
Institutional investment professionals:1-866-765-0778

This report and the financial statements contained herein are submitted for the general information of the shareholders of the Fund. If this report is used for promotional purposes, distribution of the report must be accompanied or preceded by a current prospectus. Before investing, please consider the investment objectives, risks, charges, and expenses of the investment. For a current prospectus and, if available, a summary prospectus, containing this information, call1-800-222-8222 or visit the Fund’s website atwfam.com. Read the prospectus carefully before you invest or send money.
Wells Fargo Asset Management (WFAM) is the trade name for certain investment advisory/management firms owned by Wells Fargo & Company. These firms include but are not limited to Wells Capital Management Incorporated and Wells Fargo Funds Management, LLC. Certain products managed by WFAM entities are distributed by Wells Fargo Funds Distributor, LLC (a broker-dealer and Member FINRA).
This material is for general informational and educational purposes only and is NOT intended to provide investment advice or a recommendation of any kind—including a recommendation for any specific investment, strategy, or plan.
INVESTMENT PRODUCTS: NOT FDIC INSURED ◾ NO BANK GUARANTEE ◾ MAY LOSE VALUE
© 2019 Wells Fargo Funds Management, LLC. All rights reserved.
404819 08-19
A295/AR295 06-19
ITEM 2. CODE OF ETHICS
(a) As of the end of the period covered by the report, Wells Fargo Funds Trust has adopted a code of ethics that applies to its President and Treasurer. A copy of the code of ethics is filed as an exhibit to this FormN-CSR.
(c) During the period covered by this report, there were no amendments to the provisions of the code of ethics adopted in Item 2(a) above.
(d) During the period covered by this report, there were no implicit or explicit waivers to the provisions of the code of ethics adopted in Item 2(a) above.
ITEM 3. AUDIT COMMITTEE FINANCIAL EXPERT
The Board of Trustees of Wells Fargo Funds Trust has determined that Judith Johnson is an audit committee financial expert, as defined in Item 3 of FormN-CSR. Mrs. Johnson is independent for purposes of Item 3 of FormN-CSR.
ITEM 4. PRINCIPAL ACCOUNTANT FEES AND SERVICES
(a), (b), (c), (d) The following table presents aggregate fees billed in each of the last two fiscal years for services rendered to the Registrant by the Registrant’s principal accountant. These fees were billed to the registrant and were approved by the Registrant’s audit committee.
| | | | | | | | |
| | | Fiscal
year ended
June 30, 2019 | | | Fiscal
year ended
June 30, 2018 | |
Audit fees | | $ | 549,800 | | | $ | 591,896 | |
Audit-related fees | | | — | | | | — | |
Tax fees (1) | | | 27,970 | | | | 31,615 | |
All other fees | | | — | | | | — | |
| | | | | | | | |
| | $ | 577,770 | | | $ | 623,511 | |
| | | | | | | | |
| (1) | Tax fees consist of fees for tax compliance, tax advice, tax planning and excise tax. |
(e) The Chairman of the Audit Committees is authorized topre-approve: (1) audit services for the mutual funds of Wells Fargo Funds Trust;(2) non-audit tax or compliance consulting or training services provided to the Funds by the independent auditors (“Auditors”) if the fees for any particular engagement are not anticipated to exceed $50,000; and(3) non-audit tax or compliance consulting or training services provided by the Auditors to a Fund’s investment adviser and its controlling entities (wherepre-approval is required because the engagement relates directly to the operations and financial reporting of the Fund) if the fee to the Auditors for any particular engagement is not anticipated to exceed $50,000. For any suchpre-approval sought from the Chairman, Management shall prepare a brief description of the proposed services. If the Chairman approves of such service, he or she shall sign the statement prepared by Management. Such written statement shall be presented to the full Committees at their next regularly scheduled meetings.
(f) Not applicable
(g) Not applicable
(h) Not applicable
ITEM 5. AUDIT COMMITTEE OF LISTED REGISTRANTS
Not applicable.
ITEM 6. INVESTMENTS
A Portfolio of Investments for each series of Wells Fargo Funds Trust is included as part of the report to shareholders filed under Item 1 of this Form.
ITEM 7. DISCLOSURE OF PROXY VOTING POLICIES AND PROCEDURES FORCLOSED-END MANAGEMENT INVESTMENT COMPANIES
Not applicable.
ITEM 8. PORTFOLIO MANAGERS OFCLOSED-END MANAGEMENT INVESTMENT COMPANIES
Not applicable.
ITEM 9. PURCHASES OF EQUITY SECURITIES BYCLOSED-END MANAGEMENT INVESTMENT COMPANY AND AFFILIATED PURCHASERS
Not applicable.
ITEM 10. SUBMISSION OF MATTERS TO A VOTE OF SECURITY HOLDERS
There have been no material changes to the procedures by which shareholders may recommend nominees to the registrant’s Board of Trustees that have been implemented since the registrant’s last provided disclosure in response to the requirements of this Item.
ITEM 11. CONTROLS AND PROCEDURES
(a) The President and Treasurer have concluded that the Wells Fargo Funds Trust disclosure controls and procedures (as defined inRule 30a-3(c) under the Investment Company Act of 1940) provide reasonable assurances that material information relating to the registrant is made known to them by the appropriate persons based on their evaluation of these controls and procedures as of a date within 90 days of the filing of this report.
(b) There were no significant changes in the registrant’s internal controls over financial reporting (as defined in Rule30a-3(d) under the Investment Company Act of 1940) that occurred during the most recent fiscal half-year of the period covered by this report that materially affected, or is reasonably likely to materially affect, the registrant’s internal control over financial reporting.
ITEM 12. DISCLOSURES OF SECURITIES LENDING ACTIVITES FORCLOSED-END MANAGEMENT INVESTMENT COMPANIES
Not applicable.
ITEM 13. EXHIBITS
(a)(1) Code of Ethics pursuant to Item 2 of FormN-CSR is filed and attached hereto as Exhibit COE.
(a)(2) Certification pursuant to Rule30a-2(a) under the Investment Company Act of 1940 (17 CFR270.30a-2(a)) is filed and attached hereto as Exhibit 99.CERT.
(b) Certification pursuant to Rule30a-2(b) under the Investment Company Act of 1940 (17 CFR270.30a-2(b)) is filed and attached hereto as Exhibit 99.906CERT.
SIGNATURES
Pursuant to the requirements of the Securities Exchange Act of 1934 and the Investment Company Act of 1940, the registrant has duly caused this report to be signed on its behalf by the undersigned, thereunto duly authorized.
| | |
| Wells Fargo Funds Trust |
| |
| By: | | |
| | /s/ Andrew Owen |
| |
| | Andrew Owen |
| | President |
| |
| Date: | | August 26, 2019 |
Pursuant to the requirements of the Securities Exchange Act of 1934 and the Investment Company Act of 1940, this report has been signed below by the following persons on behalf of the registrant and in the capacities and on the date indicated.
| | |
| Wells Fargo Funds Trust |
| |
| By: | | |
| | /s/ Andrew Owen |
| |
| | Andrew Owen |
| | President |
| |
| Date: | | August 26, 2019 |
| |
| By: | | |
| | /s/ Nancy Wiser |
| |
| | Nancy Wiser |
| | Treasurer |
| |
| Date: | | August 26, 2019 |
| | |
| By: | | |
| | /s/ Jeremy DePalma |
| |
| | Jeremy DePalma |
| | Treasurer |
| |
| Date: | | August 26, 2019 |