Table of Contents

UNITED STATES
SECURITIES AND EXCHANGE COMMISSION
Washington, D.C. 20549
FORMN-CSR
CERTIFIED SHAREHOLDER REPORT OF REGISTERED
MANAGEMENT INVESTMENT COMPANIES
Investment Company Act file number:811-09253
Wells Fargo Funds Trust
(Exact name of registrant as specified in charter)
525 Market St., San Francisco, CA 94105
(Address of principal executive offices) (Zip code)
Catherine Kennedy
Wells Fargo Funds Management, LLC
525 Market St., San Francisco, CA 94105
(Name and address of agent for service)
Registrant’s telephone number, including area code:800-222-8222
Date of fiscal year end: October 31
Registrant is making a filing for 8 of its series:
Wells Fargo Asia Pacific Fund, Wells Fargo Diversified International Fund, Wells Fargo Emerging Markets Equity Fund, Wells Fargo Emerging Markets Equity Income Fund, Wells Fargo Global Small Cap Fund, Wells Fargo International Equity Fund, Wells Fargo Intrinsic World Equity Fund, and Wells Fargo Special International Small Cap Fund.
Date of reporting period: October 31, 2019
Table of Contents
ITEM 1. REPORT TO STOCKHOLDERS
Table of Contents

Annual Report
October 31, 2019
Wells Fargo
Diversified International Fund
Beginning on January 1, 2021, as permitted by new regulations adopted by the Securities and Exchange Commission, paper copies of the Wells Fargo Funds’ annual and semi-annual shareholder reports issued after this date will no longer be sent by mail, unless you specifically request paper copies of the reports. Instead, the reports will be made available on the Funds’ website, and you will be notified by mail each time a report is posted and provided with a website address to access the report.
If you already elected to receive shareholder reports electronically, you will not be affected by this change and you need not take any action. You may elect to receive shareholder reports and other communications from the Fund electronically at any time by contacting your financial intermediary (such as a broker-dealer or bank) or, if you are a direct investor, by calling1-800-222-8222 or by enrolling at wellsfargo.com/advantagedelivery.
You may elect to receive all future reports in paper free of charge. If you invest through a financial intermediary, you can contact your financial intermediary to request that you continue to receive paper copies of your shareholder reports; if you invest directly with the Fund, you can call 1-800-222-8222. Your election to receive reports in paper will apply to all Wells Fargo Funds held in your account with your financial intermediary or, if you are a direct investor, to all Wells Fargo Funds that you hold.
Table of Contents
|
Reduce clutter. Save trees. |
Sign up for electronic delivery of prospectuses and shareholder reports atwellsfargo.com/advantagedelivery |
The views expressed and any forward-looking statements are as of October 31, 2019, unless otherwise noted, and are those of the Fund managers and/or Wells Fargo Asset Management. Discussions of individual securities, or the markets generally, or any Wells Fargo Fund are not intended as individual recommendations. Future events or results may vary significantly from those expressed in any forward-looking statements. The views expressed are subject to change at any time in response to changing circumstances in the market. Wells Fargo Asset Management and the Fund disclaim any obligation to publicly update or revise any views expressed or forward-looking statements.
INVESTMENT PRODUCTS: NOT FDIC INSURED ◾ NO BANK GUARANTEE ◾ MAY LOSE VALUE
Wells Fargo Diversified International Fund | 1
Table of Contents
Letter to shareholders (unaudited)

Andrew Owen
President
Wells Fargo Funds
We are pleased to offer you this annual report for the Wells Fargo Diversified International Fund for the 12-month period that ended October 31, 2019. After the first few months of the period featured high volatility and yielded minimal returns, U.S. investors generally saw markets recover during the second half amid intensifying market volatility, global economic growth concerns, international trade stare downs, and simmering geopolitical tensions.
Overall, both fixed-income and equity investors enjoyed healthy returns despite market volatility. For the period, U.S. stocks, based on the S&P 500 Index,1 gained 14.33% and international stocks, as measured by the MSCI ACWI ex USA Index (Net),2 returned 11.27%. The MSCI EM Index (Net)3 gained 11.86%. Among fixed income investors, the Bloomberg Barclays U.S. Aggregate Bond Index4 added 11.51%, the Bloomberg Barclays Global Aggregate ex-USD Index5 added 7.84%, the Bloomberg Barclays Municipal Bond Index6 gained 9.42%, and the ICE BofAML U.S. High Yield Index7 added 8.32%.
Investors confronted unsettling events during the fourth quarter of 2018.
During the fourth quarter of 2018, investors grew concerned about the pace and sustainability of the global economic expansion. The U.S. Bureau of Economic Analysis reported third-quarter U.S. gross domestic product (GDP) was 3.4% on an annualized basis, which was down from the second-quarter rate. A partial U.S. government shutdown occurred, which extended into January 2019. Brexit efforts stalled, causing uncertainty for the eurozone. The value of the renminbi declined even as the People’s Bank of China cut reserve requirement ratios, accelerated infrastructure spending, and cut taxes in efforts to spur economic activity.
The combination of news in the U.S. and generally weak economic indicators outside of the U.S. caused investors to seek safe havens. December’s S&P 500 Index performance was the worst since 1931. Globally, fixed-income investments fared better than stocks during the last two months of the year. Even as indicators suggested growth was restrained, the U.S. Federal Reserve (Fed) increased the federal funds rate by 25 basis points (bps; 100 bps equal 1.00%) in December 2018 to a target range of between 2.25% and 2.50%. Many observers expressed concerns that higher rates could slow the economy further.
| 1 | The S&P 500 Index consists of 500 stocks chosen for market size, liquidity, and industry group representation. It is a market-value-weighted index with each stock’s weight in the index proportionate to its market value. You cannot invest directly in an index. |
| 2 | The Morgan Stanley Capital International (MSCI) All Country World Index (ACWI) ex USA Index (Net) is a free-float-adjusted market-capitalization-weighted index that is designed to measure the equity market performance of developed and emerging markets, excluding the United States. Source: MSCI. MSCI makes no express or implied warranties or representations and shall have no liability whatsoever with respect to any MSCI data contained herein. The MSCI data may not be further redistributed or used as a basis for other indices or any securities or financial products. This report is not approved, reviewed, or produced by MSCI. You cannot invest directly in an index. |
| 3 | The MSCI Emerging Markets (EM) Index (Net) is a free-float-adjusted market-capitalization-weighted index that is designed to measure the equity market performance of emerging markets. You cannot invest directly in an index. |
| 4 | The Bloomberg Barclays U.S. Aggregate Bond Index is a broad-based benchmark that measures the investment-grade, U.S. dollar-denominated, fixed-rate taxable bond market, including Treasuries, government-related and corporate securities, mortgage-backed securities (agency fixed-rate and hybrid adjustable-rate mortgage pass-throughs), asset-backed securities, and commercial mortgage-backed securities. You cannot invest directly in an index. |
| 5 | The Bloomberg Barclays Global Aggregate ex-USD Index is an unmanaged index that provides a broad-based measure of the global investment-grade fixed-income markets excluding the U.S. dollar-denominated debt market. You cannot invest directly in an index. |
| 6 | The Bloomberg Barclays Municipal Bond Index is an unmanaged index composed of long-term tax-exempt bonds with a minimum credit rating of Baa. You cannot invest directly in an index. |
| 7 | The ICE BofAML U.S. High Yield Index is a market-capitalization-weighted index of domestic and Yankee high-yield bonds. The index tracks the performance of high-yield securities traded in the U.S. bond market. You cannot invest directly in an index. Copyright 2019. ICE Data Indices, LLC. All rights reserved. |
2 | Wells Fargo Diversified International Fund
Table of Contents
Letter to shareholders (unaudited)
The market climbs a wall of worry.
Investment returns early in 2019 appeared to reaffirm the adage that markets climb a wall of worry as the new year began. The S&P 500 Index gained 8.01% in January, the best monthly performance in 30 years. Returns for the MSCI ACWI ex USA Index (Net), the Bloomberg Barclays U.S. Aggregate Bond Index, and the Bloomberg Barclays Global Aggregate ex-USD Index also were positive.
In February 2019, signs of slowing global growth grew more ominous. The U.S. Bureau of Economic Analysis announced fourth-quarter 2018 GDP grew at an annualized 2.2% rate, down from the levels of the prior two quarters. In a February report, the Bank of England forecast the slowest growth since the financial crisis for 2019. China and the U.S. continued to wrangle over trade issues. By the end of the first quarter of 2019, more accommodative Fed sentiment and steady, if not spectacular, U.S. economic and business metrics encouraged domestic investors.
Early second-quarter 2019 enthusiasm among investors faded.
During April 2019, sustained low inflation, solid employment data, and first-quarter U.S. GDP grew at an annualized rate of 3.2% supported favorable sentiment. During May, markets tumbled on mixed investment signals. In the U.S., partisan wrangling ramped up as Democrats and Republicans set their sights on 2020 presidential politics. The U.K.’s Brexit disagreements caused Prime Minister Theresa May to resign. Boris Johnson succeeded her only to exacerbate uncertainty about Brexit’s resolution ahead of an October 2019 deadline. The European Commission downgraded the 2019 growth forecast to 1.2%. The U.S. increased tariffs on products from China, China responded, and then talks broke down. President Donald Trump threatened to turn his foreign policy tariff tool to Mexico over immigration issues.
Halfway through 2019, investors regrouped. Just as the investment horizon appeared to darken, sentiment turned and U.S. equity markets gained during June and July. The gains, primarily driven by geopolitical and monetary policy events, pushed equity markets to new highs. European Central Bank President Mario Draghi said that if the outlook doesn’t improve, the bank would cut rates or buy more assets to prop up inflation. President Trump backed off of tariff threats against Mexico and China. In the U.S., the Fed implemented a 0.25% federal funds rate cut in July.
Later in July 2019, the U.S. reversed course and threatened to impose higher tariffs on China’s exports after talks failed. China responded with tariff threats of its own and devalued the renminbi, a move that roiled global markets. Major U.S. stock market indices closed July with the worst weekly results of the year. Bond prices gained as Treasury yields fell to levels not seen since November 2016 and the yield curve inverted at multiple points along the 30-year arc.
In microcosm, August 2019 encapsulated many of the unnerving events that had plagued investors for months. The U.S.-China trade relationship swung from antagonistic to hopeful and back again with no signs of compromise. Evidence of a continued global economic slowdown continued to mount as central banks in China, New Zealand, and Thailand cut interest rates. Industrial and manufacturing data declined in China, Canada, Japan, and Germany. Adding to the uncertain environment, Italy’s prime minister resigned, many feared a crackdown in Hong Kong as protestors sustained their calls for reform, and Boris Johnson planned to suspend Parliament as Brexit’s deadline neared.
In the U.S., September 2019 saw the Fed join other central banks in cutting interest rates. U.S. manufacturing data, as reported by the Institute for Supply Management, disappointed investors. The U.S. House of Representatives announced it would pursue an impeachment investigation of President Trump. Meanwhile, the Brexit impasse showed no signs of resolution. Officials in China said that hitting the country’s economic
“In February 2019, signs of slowing global growth grew more ominous.”
Wells Fargo Diversified International Fund | 3
Table of Contents
Letter to shareholders (unaudited)
“The Fed lowered interest rates another quarter point in late October, its third rate cut in four months.”
|
For further information about your Fund, contact your investment professional, visit our website at wfam.com, or call us directly at1-800-222-8222. |
growth goals for the year would be difficult considering the weight of tariffs and trade restrictions. So while the S&P 500 Index finished the third quarter with the best year-to-date returns in more than 20 years, amid signs of equity investors taking money out of the stock market, concerns about future returns remained.
In October 2019, a relaxing of U.S.-China trade tensions and renewed optimism for a U.K. Brexit deal combined with positive macroeconomic data to support financial markets overall. The initial estimate of U.S. third-quarter GDP growth, announced in late October, was a resilient 1.9% annualized rate while the U.S. unemployment rate fell to a 50-year low of 3.5% in September. However, despite resilience among U.S. consumers, business confidence declined while manufacturing activity contracted. Concerned with a potential economic slowdown, the Fed lowered interest rates another quarter point in late October, its third rate cut in four months. This helped push the S&P 500 Index to a new all-time high while emerging market equities rallied and global bonds declined overall, reflecting a broad pickup in risk appetite.
Don’t let short-term uncertainty derail long-term investment goals.
Periods of investment uncertainty can present challenges, but experience has taught us that maintaining long-term investment goals can be an effective way to plan for the future. To help you create a sound strategy based on your personal goals and risk tolerance, Wells Fargo Funds offers more than 100 mutual funds spanning a wide range of asset classes and investment styles. Although diversification cannot guarantee an investment profit or prevent losses, we believe it can be an effective way to manage investment risk and potentially smooth out overall portfolio performance. We encourage investors to know their investments and to understand that appropriate levels of risk-taking may unlock opportunities.
Thank you for choosing to invest with Wells Fargo Funds. We appreciate your confidence in us and remain committed to helping you meet your financial needs.
Sincerely,

Andrew Owen
President
Wells Fargo Funds
4 | Wells Fargo Diversified International Fund
Table of Contents
This page is intentionally left blank.
Table of Contents
Performance highlights (unaudited)
Investment objective
The Fund seeks long-term capital appreciation.
Manager
Wells Fargo Funds Management, LLC
Subadvisers
Artisan Partners Limited Partnership
LSV Asset Management
Wells Capital Management Incorporated
Portfolio managers
Josef Lakonishok, Ph.D.
Venkateshwar (Venk) Lal
Puneet Mansharamani, CFA®‡
Menno Vermeulen, CFA®‡
Dale A. Winner, CFA®‡
Mark L. Yockey, CFA®‡
Average annual total returns (%) as of October 31, 2019
| Including sales charge | Excluding sales charge | Expense ratios1 (%) | ||||||||||||||||||||||||||||||||
| Inception date | 1 year | 5 year | 10 year | 1 year | 5 year | 10 year | Gross | Net2 | ||||||||||||||||||||||||||
| Class A (SILAX) | 9-24-1997 | 2.68 | 2.35 | 4.96 | 8.94 | 3.57 | 5.59 | 1.72 | 1.36 | |||||||||||||||||||||||||
| Class C (WFECX) | 4-1-1998 | 7.09 | 2.78 | 4.80 | 8.09 | 2.78 | 4.80 | 2.47 | 2.11 | |||||||||||||||||||||||||
| Class R6 (WDIRX)3 | 9-30-2015 | – | – | – | 9.52 | 4.00 | 5.90 | 1.29 | 0.90 | |||||||||||||||||||||||||
| Administrator Class (WFIEX) | 11-8-1999 | – | – | – | 9.07 | 3.69 | 5.74 | 1.64 | 1.26 | |||||||||||||||||||||||||
| Institutional Class (WFISX) | 8-31-2006 | – | – | – | 9.30 | 3.97 | 5.98 | 1.39 | 1.00 | |||||||||||||||||||||||||
| MSCI EAFE Index (Net)4 | – | – | – | – | 11.04 | 4.31 | 5.41 | – | – | |||||||||||||||||||||||||
Figures quoted represent past performance, which is no guarantee of future results, and do not reflect taxes that a shareholder may pay on fund distributions or the redemption of fund shares. Investment return and principal value of an investment will fluctuate so that an investor’s shares, when redeemed, may be worth more or less than their original cost. Performance shown without sales charges would be lower if sales charges were reflected. Current performance may be lower or higher than the performance data quoted, which assumes the reinvestment of dividends and capital gains. Current month-end performance is available on the Fund’s website,wfam.com.
Index returns do not include transaction costs associated with buying and selling securities, any mutual fund fees or expenses, or any taxes. It is not possible to invest directly in an index.
For Class A shares, the maximum front-end sales charge is 5.75%. For Class C shares, the maximum contingent deferred sales charge is 1.00%. Performance including a contingent deferred sales charge assumes the sales charge for the corresponding time period. Class R6, Administrator Class, and Institutional Class shares are sold without a front-end sales charge or contingent deferred sales charge.
Stock values fluctuate in response to the activities of individual companies and general market and economic conditions. Foreign investments are especially volatile and can rise or fall dramatically due to differences in the political and economic conditions of the host country. These risks are generally intensified in emerging markets. The use of derivatives may reduce returns and/or increase volatility. Certain investment strategies tend to increase the total risk of an investment (relative to the broader market). The Fund is exposed to smaller-company securities risk. Consult the Fund’s prospectus for additional information on these and other risks.
Please see footnotes on page 7.
6 | Wells Fargo Diversified International Fund
Table of Contents
Performance highlights (unaudited)
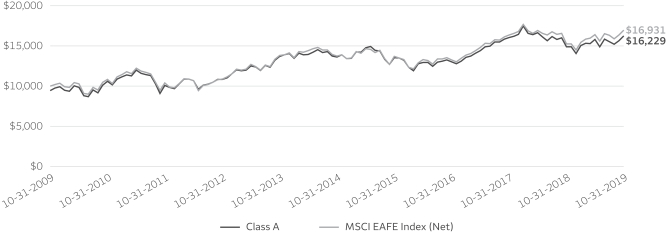
| Growth of $10,000 investment as of October 31, 20195 |
|
| ‡ | CFA® and Chartered Financial Analyst® are trademarks owned by CFA Institute. |
| 1 | Reflects the expense ratios as stated in the most recent prospectuses, which include the impact of 0.01% in acquired fund fees and expenses. The expense ratios shown are subject to change and may differ from the annualized expense ratios shown in the financial highlights of this report, which do not include acquired fund fees and expenses. |
| 2 | The manager has contractually committed through February 29, 2020, to waive fees and/or reimburse expenses to the extent necessary to cap the expenses of each class after fee waivers at 1.35% for Class A, 2.10% for Class C, 0.89% for Class R6, 1.25% for Administrator Class, and 0.99% for Institutional Class. Brokerage commissions, stamp duty fees, interest, taxes, acquired fund fees and expenses (if any), and extraordinary expenses are excluded from the expense cap. Prior to or after the commitment expiration date, the cap may be increased or the commitment to maintain the cap may be terminated only with the approval of the Board of Trustees. Without this cap, the Fund’s returns would have been lower. The expense ratio paid by an investor is the net expense ratio (the total annual fund operating expenses after fee waivers) as stated in the prospectuses. |
| 3 | Historical performance shown for Class R6 shares prior to their inception reflects the performance of the Administrator Class shares, and includes the higher expenses applicable to Administrator Class shares. If these expenses had not been included, returns for Class R6 shares would be higher. |
| 4 | The Morgan Stanley Capital International (MSCI) Europe, Australasia, Far East (EAFE) Index (Net) is a free-float-adjusted market-capitalization-weighted index that is designed to measure the equity market performance of developed markets, excluding the United States and Canada. Source: MSCI. MSCI makes no express or implied warranties or representations and shall have no liability whatsoever with respect to any MSCI data contained herein. The MSCI data may not be further redistributed or used as a basis for other indexes or any securities or financial products. This report is not approved, reviewed, or produced by MSCI. You cannot invest directly in an index. |
| 5 | The chart compares the performance of Class A shares for the most recent ten years with the MSCI EAFE Index (Net). The chart assumes a hypothetical investment of $10,000 in Class A shares and reflects all operating expenses and assumes the maximum initial sales charge of 5.75%. |
| 6 | The Purchasing Managers’ Index (PMI) is an indicator of economic health for manufacturing and service sectors. The purpose of the PMI is to provide information about current business conditions to company decision makers, analysts and purchasing managers. You cannot invest directly in an index. |
| 7 | The MSCI World Index (Net) is a free-float-adjusted market-capitalization-weighted index that is designed to measure the equity market performance of developed markets. You cannot invest directly in an index. |
| 8 | The MSCI Emerging Markets (EM) Index (Net) is a free-float-adjusted market-capitalization-weighted index that is designed to measure the equity market performance of emerging markets. You cannot invest directly in an index. |
| 9 | The MSCI ACWI ex USA Value Index (Net) measures the equity market performance of large- and mid-cap securities exhibiting overall value style characteristics across developed and emerging market countries, excluding the United States. The value investment style characteristics for index construction are defined using three variables: book value to price, 12-month forward earnings to price, and dividend yield. You cannot invest directly in an index. |
| 10 | The ten largest holdings, excluding cash, cash equivalents and any money markets, are calculated based on the value of the investments divided by total net assets of the Fund. Holdings are subject to change and may have changed since the date specified. |
| 11 | Amounts are calculated based on the total long-term investments of the Fund. These amounts are subject to change and may have changed since the date specified. |
| 12 | The MSCI EAFE Growth Index is a free-float-adjusted market-capitalization-weighted index that is designed to measure the equity market performance of growth securities within developed equity markets, excluding the United States and Canada. You cannot invest directly in an index. |
| 13 | The MSCI EAFE Value Index is a free-float-adjusted market-capitalization-weighted index that is designed to measure the equity market performance of value securities within developed equity markets, excluding the United States and Canada. You cannot invest directly in an index. |
| 14 | The MSCI EAFE Minimum Volatility Index aims to reflect the performance characteristics of a minimum variance strategy applied to the large- and mid-cap equity universe across Developed Markets countries around the world excluding the United States and Canada. You cannot invest directly in an index. |
| * | This security was no longer held at the end of the reporting period. |
Wells Fargo Diversified International Fund | 7
Table of Contents
Performance highlights (unaudited)
MANAGERS’ DISCUSSION
Fund highlights
| ∎ | The Fund underperformed its benchmark, the MSCI EAFE Index (Net), for the 12-month period that ended October 31, 2019. |
| ∎ | For most of the reporting period, value stocks underperformed growth stocks, creating a more challenging investment climate for two of the three subadvisors—LSV Asset Management (LSV) and Wells Capital Management (WellsCap). Modest exposures to China and South Korea further hindered results, in part due to international trade uncertainty and economic headwinds. From a sector perspective, investments in information technology (IT) detracted from relative performance. The most significant detractor was German internet payment solutions company Wirecard AG, which faced allegations of fraudulent accounting practices. |
| ∎ | Investments in the financials sector were significant contributors. Among the top contributors were London Stock Exchange Group plc* and Deutsche Boerse AG. London Stock Exchange agreed to acquire Refinitiv, Thomson Reuters’ old financial data and risk business, which was an immediate boost to the share price as the market reacted favorably to the news. Deutsche Boerse AG reported earnings that have beat consensus expectations for three consecutive quarters. Management continued to execute at a high level. |
WellsCap
General market concerns of a potential global recession reached a 12-month high in mid-August 2019, reflecting deteriorating investor sentiment following the announcement that the U.S. would place additional tariffs on remaining Chinese imports, a global manufacturing PMI6 that dipped further into contractionary territory, and a 20% decline in the price of Brent crude oil. In this environment, developed market equities, represented by the MSCI World Index (Net)7, returned 12.7%, modestly outperforming emerging markets, represented by the MSCI EM Index (Net)8, which returned 11.9%. Traditional value sectors underperformed growth during the period, illustrated by the MSCI ACWI ex USA Value Index (Net)9, which returned 5.9% versus 16.7% for the growth index. However, the value index did outperform growth by 271 basis points (bps; 100 bps equal 1.00%) during the last two months of the period.
| Ten largest holdings (%) as of October 31, 201910 | ||||
Linde plc | 2.36 | |||
Deutsche Boerse AG | 2.29 | |||
BP plc | 1.59 | |||
Allianz AG | 1.50 | |||
Nestle SA | 1.45 | |||
Air Liquide SA | 1.45 | |||
Airbus SE | 1.42 | |||
AIA Group Limited | 1.37 | |||
Deutsche Post AG | 1.31 | |||
GlaxoSmithKline plc | 1.25 | |||
Over the past 12 months, key detractors from relative performance included: John Wood Group plc, Sasol Limited, Nomura Holdings*, Daiwa Securities Group Incorporated, and OCI NV. WellsCap exited Sasol, a South African integrated energy and chemical producer of synthetic fuel and chemicals from coal and gas, following a stop-loss reevaluation, which concluded that the investment thesis was no longer intact and that there was more downside risk. The investment case was predicated upon the operational de-risking of the Lake Charles Chemical Project. The WellsCap team downgraded conviction from high to low in May 2019 on cost overruns and a material reduction in management credibility, and it no longer has confidence that the Sasol management team will be able to successfully deliver this project without again lowering normalized earnings power in a timely manner.
On the other hand, top contributors to performance came from: Cosan Limited, Home Capital Group Incorporated, Rheinmetall AG, Gentex Corporation, and Hitachi Mining. Rheinmetall, a German industrial split 50/50 between defense and auto benefiting from self-help catalysts from defense reorganization and growth inflection in the defense cycle, outperformed on an increase in defense sales, outweighing a decline in automotive sales during a difficult period for auto sales globally.
Artisan Partners
Non-U.S. equities advanced during the period as expectations for accommodative monetary policy and hopes of a long-term resolution to the protracted trade war between the U.S. and China mitigated concerns about slowing global growth and reduced earnings estimates. A backdrop of slowing growth and muted inflation led to bonds rallying as markets priced in additional central bank stimulus. All sectors, aside from energy, participated in the upswing. Interest-rate-sensitive stocks (for example, utilities and real estate) were especially strong. The IT, health care, and industrials sectors also produced strong gains.
Please see footnotes on page 7.
8 | Wells Fargo Diversified International Fund
Table of Contents
Performance highlights (unaudited)
Artisan’s biggest shifts in sector exposure were increased weightings in consumer discretionary and financials and decreased weightings in consumer staples and industrials. As always, sector positioning is a residual of bottom-up stock decisions.
Sector positioning was a headwind, due in part to our below-benchmark exposure to utilities and real estate. Additionally, the portfolio’s IT holdings detracted from relative results, driven by Wirecard AG, an electronic payments company, and Infineon Technologies AG*, a semiconductor company.
On the plus side, contributions due to strong stock selection were realized in several sectors, particularly among financials, materials, and industrials holdings. Top contributors in these sectors included Deutsche Boerse AG, a financial exchanges operator; Linde plc, an industrial gases supplier; and Airbus SE, an aircraft manufacturer.
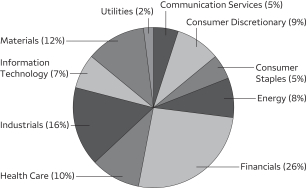
| Sector distribution as of October 31, 201911 |
 |
The backdrop for equities is challenging. Although overall corporate fundamentals remain healthy, slowing global growth, reduced earnings growth expectations, and continued uncertainty from the U.S.-China trade conflict remain headwinds. In this type of environment, Artisan is especially focused on companies with durable business models, strong cash generation, and idiosyncratic growth drivers that are independent of the broader economy. Its experience investing over several market cycles has taught Artisan the importance of focusing on companies with exposure to secular growth themes and sustainable growth characteristics: dominant or growing market positions, strong pricing power, and solid free cash flow. Consequently, management of the portfolio sleeve remains focused on themes that have led the manager to believe assets are invested in a portfolio of companies that can weather a changing political and economic environment.
LSV
While developed international equity markets posted declines in late 2018, markets quickly reversed course in early 2019 aided by accommodative monetary policies across the globe. Developed international markets, as measured by the MSCI EAFE Index (Net), finished up 11.04% for the 12-month period that ended October 31, 2019. While value stocks staged a comeback late in the period, growth stocks significantly outperformed over the trailing 12 months as the MSCI EAFE Growth Index12 advanced 16.61% while the MSCI EAFE Value Index13 was up just 5.51%. Defensive and lower-volatility stocks also did well in the period as the MSCI EAFE Minimum Volatility Index14returned 13.06%.
Defensive sectors, including utilities, health care, and real estate, led the market. IT and industrials also posted strong double-digit returns. Energy stocks struggled; it was the only sector to post negative returns. Communication services and financials stocks also lagged during the period.
The difficult environment for traditional deep value stocks combined with the strong performance of defensive low-volatility stocks, which generally are expensive, had the most significant impact on results in the period. The portfolio sleeve’s overweights to energy and financials also had a negative impact on results. However, stock selection was strong and added value in the energy, financials, and IT sectors.
Changes to the portfolio tend to be gradual given the manager’s low-turnover strategy. Over the past 12 months, the manager increased the exposure to the health care and utilities sectors and decreased the weight to consumer discretionary stocks. The LSV portion of the Fund is overweight the energy, materials, and financials sectors and is underweight consumer staples, IT, health care, and real estate. The manager continues to find many attractively priced stocks that are generating strong cash flow and earnings that the market seems to have ignored. LSV finds the discounts at which many of the Fund holdings are trading to be unwarranted. Typically when such discounts have existed in the past, value stocks and LSV portfolios have tended to do well going forward.
Please see footnotes on page 7.
Wells Fargo Diversified International Fund | 9
Table of Contents
Performance highlights (unaudited)
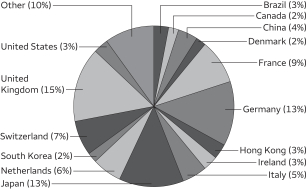
| Country allocation as of October 31, 201911 |
 |
Please see footnotes on page 7.
10 | Wells Fargo Diversified International Fund
Table of Contents
As a shareholder of the Fund, you incur two types of costs: (1) transaction costs, including sales charges (loads) on purchase payments and contingent deferred sales charges (if any) on redemptions and (2) ongoing costs, including management fees, distribution (12b-1) and/or shareholder servicing fees, and other Fund expenses. This example is intended to help you understand your ongoing costs (in dollars) of investing in the Fund and to compare these costs with the ongoing costs of investing in other mutual funds.
The example is based on an investment of $1,000 invested at the beginning of the six-month period and held for the entire period from May 1, 2019 to October 31, 2019.
Actual expenses
The “Actual” line of the table below provides information about actual account values and actual expenses. You may use the information in this line, together with the amount you invested, to estimate the expenses that you paid over the period. Simply divide your account value by $1,000 (for example, an $8,600 account value divided by $1,000 = 8.6), then multiply the result by the number in the “Actual” line under the heading entitled “Expenses paid during period” for your applicable class of shares to estimate the expenses you paid on your account during this period.
Hypothetical example for comparison purposes
The “Hypothetical” line of the table below provides information about hypothetical account values and hypothetical expenses based on the Fund’s actual expense ratio and an assumed rate of return of 5% per year before expenses, which is not the Fund’s actual return. The hypothetical account values and expenses may not be used to estimate the actual ending account balance or expenses you paid for the period. You may use this information to compare the ongoing costs of investing in the Fund and other funds. To do so, compare this 5% hypothetical example with the 5% hypothetical examples that appear in the shareholder reports of the other funds.
Please note that the expenses shown in the table are meant to highlight your ongoing costs only and do not reflect any transactional costs, such as sales charges (loads) and contingent deferred sales charges. Therefore, the “Hypothetical” line of the table is useful in comparing ongoing costs only and will not help you determine the relative total costs of owning different funds. In addition, if these transactional costs were included, your costs would have been higher.
| Beginning account value 5-1-2019 | Ending account value 10-31-2019 | Expenses paid during the period¹ | Annualized net expense ratio | |||||||||||||
Class A | ||||||||||||||||
Actual | $ | 1,000.00 | $ | 1,028.62 | $ | 6.90 | 1.35 | % | ||||||||
Hypothetical (5% return before expenses) | $ | 1,000.00 | $ | 1,018.40 | $ | 6.87 | 1.35 | % | ||||||||
Class C | ||||||||||||||||
Actual | $ | 1,000.00 | $ | 1,025.02 | $ | 10.72 | 2.10 | % | ||||||||
Hypothetical (5% return before expenses) | $ | 1,000.00 | $ | 1,014.62 | $ | 10.66 | 2.10 | % | ||||||||
Class R6 | ||||||||||||||||
Actual | $ | 1,000.00 | $ | 1,031.86 | $ | 4.56 | 0.89 | % | ||||||||
Hypothetical (5% return before expenses) | $ | 1,000.00 | $ | 1,020.72 | $ | 4.53 | 0.89 | % | ||||||||
Administrator Class | ||||||||||||||||
Actual | $ | 1,000.00 | $ | 1,029.66 | $ | 6.39 | 1.25 | % | ||||||||
Hypothetical (5% return before expenses) | $ | 1,000.00 | $ | 1,018.90 | $ | 6.36 | 1.25 | % | ||||||||
Institutional Class | ||||||||||||||||
Actual | $ | 1,000.00 | $ | 1,031.07 | $ | 5.07 | 0.99 | % | ||||||||
Hypothetical (5% return before expenses) | $ | 1,000.00 | $ | 1,020.21 | $ | 5.04 | 0.99 | % | ||||||||
| 1 | Expenses paid is equal to the annualized net expense ratio of each class multiplied by the average account value over the period, multiplied by the number of days in the most recent fiscal half-year divided by the number of days in the fiscal year (to reflect the one-half-year period). |
Wells Fargo Diversified International Fund | 11
Table of Contents
Portfolio of investments—October 31, 2019
| Shares | Value | |||||||||||||||
| Common Stocks: 95.87% | ||||||||||||||||
| Australia: 1.24% | ||||||||||||||||
AGL Energy Limited (Utilities, Multi-Utilities) | 8,500 | $ | 115,900 | |||||||||||||
Coca-Cola Amatil Limited (Consumer Staples, Beverages) | 10,800 | 75,567 | ||||||||||||||
CSR Limited (Materials, Construction Materials) | 59,900 | 170,949 | ||||||||||||||
Harvey Norman Holdings Limited (Consumer Discretionary, Multiline Retail) | 34,882 | 98,348 | ||||||||||||||
Lendlease Corporation Limited (Real Estate, Real Estate Management & Development) | 11,600 | 149,454 | ||||||||||||||
Metcash Limited (Consumer Staples, Food & Staples Retailing) | 28,500 | 55,403 | ||||||||||||||
Mineral Resources Limited (Materials, Metals & Mining) | 8,000 | 78,862 | ||||||||||||||
Origin Energy Limited (Energy, Oil, Gas & Consumable Fuels) | 18,916 | 102,492 | ||||||||||||||
Qantas Airways Limited (Industrials, Airlines) | 59,300 | 262,031 | ||||||||||||||
Rio Tinto Limited (Materials, Metals & Mining) | 1,800 | 112,767 | ||||||||||||||
| 1,221,773 | ||||||||||||||||
|
| |||||||||||||||
| Austria: 0.39% | ||||||||||||||||
OMV AG (Energy, Oil, Gas & Consumable Fuels) | 4,800 | 280,092 | ||||||||||||||
Voestalpine AG (Materials, Metals & Mining) | 4,300 | 107,665 | ||||||||||||||
| 387,757 | ||||||||||||||||
|
| |||||||||||||||
| Brazil: 1.99% | ||||||||||||||||
B3 Brasil Bolsa Balcao SA (Financials, Capital Markets) | 14,905 | 179,804 | ||||||||||||||
Banco de Brasil SA (Financials, Banks) | 10,900 | 130,865 | ||||||||||||||
Companhia de Saneamento de Minas Gerais SA (Utilities, Water Utilities) | 5,300 | 89,190 | ||||||||||||||
Cosan Limited Class A (Energy, Oil, Gas & Consumable Fuels) † | 38,583 | 648,966 | ||||||||||||||
JBS SA (Consumer Staples, Food Products) | 18,600 | 131,204 | ||||||||||||||
Petroleo Brasileiro SA ADR (Energy, Oil, Gas & Consumable Fuels) | 48,346 | 785,139 | ||||||||||||||
| 1,965,168 | ||||||||||||||||
|
| |||||||||||||||
| Canada: 2.43% | ||||||||||||||||
Canadian National Railway Company (Industrials, Road & Rail) | 2,417 | 216,007 | ||||||||||||||
Dollarama Incorporated (Consumer Discretionary, Multiline Retail) | 3,960 | 133,223 | ||||||||||||||
Home Capital Group Incorporated (Financials, Thrifts & Mortgage Finance) † | 15,400 | 316,980 | ||||||||||||||
Loblaw Companies Limited (Consumer Staples, Food & Staples Retailing) | 3,800 | 202,651 | ||||||||||||||
Lundin Mining Corporation (Materials, Metals & Mining) | 180,308 | 910,370 | ||||||||||||||
Magna International Incorporated (Consumer Discretionary, Auto Components) | 7,300 | 392,518 | ||||||||||||||
TMX Group Limited (Financials, Capital Markets) | 2,600 | 227,172 | ||||||||||||||
| 2,398,921 | ||||||||||||||||
|
| |||||||||||||||
| China: 4.23% | ||||||||||||||||
Alibaba Group Holding Limited ADR (Consumer Discretionary, Internet & Direct Marketing Retail) † | 2,074 | 366,414 | ||||||||||||||
ANTA Sports Products Limited (Consumer Discretionary, Textiles, Apparel & Luxury Goods) | 13,000 | 127,413 | ||||||||||||||
China Everbright Limited (Financials, Capital Markets) | 140,000 | 207,965 | ||||||||||||||
China Mobile Limited (Communication Services, Wireless Telecommunication Services) | 106,500 | 867,119 | ||||||||||||||
China Petroleum & Chemical Corporation H Shares (Energy, Oil, Gas & Consumable Fuels) | 218,000 | 125,192 | ||||||||||||||
China Railway Construction Corporation Limited H Shares (Industrials, Construction & Engineering) | 117,500 | 128,657 | ||||||||||||||
China Resources Cement Holdings Limited (Materials, Construction Materials) | 168,000 | 184,381 | ||||||||||||||
China Telecom Corporation Limited H Shares (Communication Services, Diversified Telecommunication Services) | 238,000 | 101,445 | ||||||||||||||
Dongfeng Motor Group Company Limited H Shares (Consumer Discretionary, Automobiles) | 106,000 | 106,596 | ||||||||||||||
HollySys Automation Technologies Limited (Information Technology, Electronic Equipment, Instruments & Components) | 19,771 | 278,969 | ||||||||||||||
Midea Group Company Limited Class A (Consumer Discretionary, Household Durables) | 99,700 | 786,501 | ||||||||||||||
PICC Property & Casualty Company Limited H Shares (Financials, Insurance) | 103,500 | 131,423 | ||||||||||||||
Shanghai Pharmaceuticals Holding Company Limited H Shares (Health Care, Health Care Providers & Services) | 261,400 | 473,032 | ||||||||||||||
Wynn Macau Limited (Consumer Discretionary, Hotels, Restaurants & Leisure) | 110,800 | 241,510 | ||||||||||||||
Yantai Changyu Pioneer Wine Company Limited Class B (Consumer Staples, Beverages) | 23,400 | 45,660 | ||||||||||||||
| 4,172,277 | ||||||||||||||||
|
| |||||||||||||||
The accompanying notes are an integral part of these financial statements.
12 | Wells Fargo Diversified International Fund
Table of Contents
Portfolio of investments—October 31, 2019
| Shares | Value | |||||||||||||||
| Denmark: 1.37% | ||||||||||||||||
Carlsberg AS Class B (Consumer Staples, Beverages) | 541 | $ | 76,109 | |||||||||||||
Danske Bank AS (Financials, Banks) | 9,300 | 132,695 | ||||||||||||||
DSV AS (Industrials, Road & Rail) | 362 | 35,126 | ||||||||||||||
Genmab AS (Health Care, Biotechnology) † | 3,637 | 792,682 | ||||||||||||||
Novo Nordisk AS Class B (Health Care, Pharmaceuticals) | 4,351 | 237,627 | ||||||||||||||
Sydbank AS (Financials, Banks) | 4,000 | 78,462 | ||||||||||||||
| 1,352,701 | ||||||||||||||||
|
| |||||||||||||||
| Finland: 0.11% | ||||||||||||||||
Nordea Bank AB (Financials, Banks) | 15,000 | 109,723 | ||||||||||||||
|
| |||||||||||||||
| France: 8.41% | ||||||||||||||||
Air Liquide SA (Materials, Chemicals) | 10,738 | 1,426,352 | ||||||||||||||
Amundi SA (Financials, Diversified Financial Services) | 3,944 | 281,519 | ||||||||||||||
Arkema SA (Materials, Chemicals) | 910 | 93,008 | ||||||||||||||
AXA SA (Financials, Insurance) | 9,200 | 243,026 | ||||||||||||||
BNP Paribas SA (Financials, Banks) | 17,382 | 907,466 | ||||||||||||||
Compagnie de Saint-Gobain SA (Industrials, Building Products) | 23,772 | 966,926 | ||||||||||||||
Compagnie Generale des Etablissements Michelin SCA (Consumer Discretionary, Auto Components) | 2,200 | 267,694 | ||||||||||||||
Credit Agricole SA (Financials, Banks) | 13,900 | 181,149 | ||||||||||||||
Eiffage SA (Industrials, Construction & Engineering) | 4,124 | 443,023 | ||||||||||||||
Engie SA (Utilities, Multi-Utilities) | 13,300 | 222,428 | ||||||||||||||
Natixis SA (Financials, Capital Markets) | 27,500 | 126,087 | ||||||||||||||
Orange SA (Communication Services, Diversified Telecommunication Services) | 40,509 | 652,394 | ||||||||||||||
Renault SA (Consumer Discretionary, Automobiles) | 3,100 | 158,212 | ||||||||||||||
Safran SA (Industrials, Aerospace & Defense) | 2,038 | 322,422 | ||||||||||||||
Sanofi SA (Health Care, Pharmaceuticals) | 7,600 | 700,310 | ||||||||||||||
Schneider Electric SE (Industrials, Electrical Equipment) | 1,512 | 140,404 | ||||||||||||||
Societe Generale SA (Financials, Banks) | 3,700 | 105,022 | ||||||||||||||
Total SA (Energy, Oil, Gas & Consumable Fuels) | 9,700 | 509,926 | ||||||||||||||
Vinci SA (Industrials, Construction & Engineering) | 4,813 | 540,015 | ||||||||||||||
| 8,287,383 | ||||||||||||||||
|
| |||||||||||||||
| Germany: 13.00% | ||||||||||||||||
Allianz AG (Financials, Insurance) | 6,037 | 1,474,541 | ||||||||||||||
Aurubis AG (Materials, Metals & Mining) | 1,600 | 78,499 | ||||||||||||||
Bayer AG (Health Care, Pharmaceuticals) | 1,900 | 147,445 | ||||||||||||||
Bayerische Motoren Werke AG (Consumer Discretionary, Automobiles) | 2,200 | 168,591 | ||||||||||||||
Beiersdorf AG (Consumer Staples, Personal Products) | 1,007 | 119,218 | ||||||||||||||
Covestro AG (Materials, Chemicals) 144A | 2,700 | 129,637 | ||||||||||||||
Daimler AG (Consumer Discretionary, Automobiles) | 5,300 | 309,800 | ||||||||||||||
Deutsche Boerse AG (Financials, Capital Markets) | 14,598 | 2,262,265 | ||||||||||||||
Deutsche Post AG (Industrials, Air Freight & Logistics) | 36,548 | 1,294,192 | ||||||||||||||
Linde plc (Materials, Chemicals) | 11,748 | 2,322,425 | ||||||||||||||
Metro AG (Consumer Staples, Food & Staples Retailing) | 23,869 | 388,668 | ||||||||||||||
Muenchener Rueckversicherungs Gesellschaft AG (Financials, Insurance) | 3,250 | 902,556 | ||||||||||||||
Rheinmetall AG (Industrials, Industrial Conglomerates) | 1,963 | 236,120 | ||||||||||||||
SAP SE (Information Technology, Software) | 5,755 | 762,524 | ||||||||||||||
Siemens AG (Industrials, Industrial Conglomerates) | 4,233 | 488,064 | ||||||||||||||
Symrise AG (Materials, Chemicals) | 3,731 | 359,027 | ||||||||||||||
Volkswagen AG (Consumer Discretionary, Automobiles) | 1,600 | 303,183 | ||||||||||||||
Wirecard AG (Information Technology, IT Services) « | 8,458 | 1,071,140 | ||||||||||||||
| 12,817,895 | ||||||||||||||||
|
| |||||||||||||||
| Hong Kong: 2.68% | ||||||||||||||||
AIA Group Limited (Financials, Insurance) | 134,400 | 1,345,552 | ||||||||||||||
CK Hutchison Holdings Limited (Industrials, Industrial Conglomerates) | 16,600 | 153,587 | ||||||||||||||
The accompanying notes are an integral part of these financial statements.
Wells Fargo Diversified International Fund | 13
Table of Contents
Portfolio of investments—October 31, 2019
| Shares | Value | |||||||||||||||
| Hong Kong (continued) | ||||||||||||||||
Kingboard Laminates Holdings Limited (Information Technology, Electronic Equipment, Instruments & Components) | 109,500 | $ | 100,613 | |||||||||||||
Nine Dragons Paper Holdings Limited (Materials, Paper & Forest Products) | 104,000 | 90,516 | ||||||||||||||
Sinotruk Hong Kong Limited (Industrials, Machinery) « | 59,500 | 90,207 | ||||||||||||||
Skyworth Digital Holdings Limited (Consumer Discretionary, Household Durables) | 320,000 | 82,900 | ||||||||||||||
Xinyi Glass Holdings Limited (Consumer Discretionary, Auto Components) | 586,000 | 660,339 | ||||||||||||||
Yue Yuen Industrial Holdings Limited (Consumer Discretionary, Textiles, Apparel & Luxury Goods) | 42,000 | 118,454 | ||||||||||||||
| 2,642,168 | ||||||||||||||||
|
| |||||||||||||||
| Hungary: 0.07% | ||||||||||||||||
Richter Gedeon (Health Care, Pharmaceuticals) | 3,500 | 64,866 | ||||||||||||||
|
| |||||||||||||||
| India: 0.70% | ||||||||||||||||
Housing Development Finance Corporation Limited (Financials, Thrifts & Mortgage Finance) | 22,834 | 686,320 | ||||||||||||||
|
| |||||||||||||||
| Ireland: 2.47% | ||||||||||||||||
C&C Group plc (Consumer Staples, Beverages) | 12,300 | 60,545 | ||||||||||||||
Greencore Group plc (Consumer Staples, Food Products) | 181,237 | 545,595 | ||||||||||||||
Medtronic plc (Health Care, Health Care Equipment & Supplies) | 8,847 | 963,438 | ||||||||||||||
Smurfit Kappa Group plc (Materials, Containers & Packaging) | 4,300 | 143,394 | ||||||||||||||
Willis Towers Watson plc (Financials, Insurance) | 3,847 | 719,004 | ||||||||||||||
| 2,431,976 | ||||||||||||||||
|
| |||||||||||||||
| Israel: 1.28% | ||||||||||||||||
Bank Hapoalim Limited (Financials, Banks) | 14,200 | 113,577 | ||||||||||||||
Check Point Software Technologies Limited (Information Technology, Software) † | 7,862 | 883,767 | ||||||||||||||
Nice Systems Limited ADR (Information Technology, Software) † | 1,664 | 262,563 | ||||||||||||||
| 1,259,907 | ||||||||||||||||
|
| |||||||||||||||
| Italy: 4.63% | ||||||||||||||||
A2A SpA (Utilities, Multi-Utilities) | 104,600 | 209,872 | ||||||||||||||
Assicurazioni Generali SpA (Financials, Insurance) | 30,032 | 608,766 | ||||||||||||||
Enel SpA (Utilities, Electric Utilities) | 94,000 | 727,577 | ||||||||||||||
Eni SpA (Energy, Oil, Gas & Consumable Fuels) | 57,552 | 871,027 | ||||||||||||||
Intesa Sanpaolo SpA (Financials, Banks) | 254,520 | 637,563 | ||||||||||||||
Leonardo-Finmeccanica SpA (Industrials, Aerospace & Defense) | 9,300 | 107,976 | ||||||||||||||
Mediobanca SpA (Financials, Banks) | 23,400 | 277,944 | ||||||||||||||
Prysmian SpA (Industrials, Electrical Equipment) | 48,483 | 1,119,853 | ||||||||||||||
| 4,560,578 | ||||||||||||||||
|
| |||||||||||||||
| Japan: 12.84% | ||||||||||||||||
Adeka Corporation (Materials, Chemicals) | 13,000 | 188,277 | ||||||||||||||
Aisin Seiki Company Limited (Consumer Discretionary, Auto Components) | 3,300 | 133,235 | ||||||||||||||
Alps Electric Company Limited (Information Technology, Electronic Equipment, Instruments & Components) | 21,500 | 466,673 | ||||||||||||||
Asahi Glass Company Limited (Industrials, Building Products) | 4,900 | 173,785 | ||||||||||||||
Astellas Pharma Incorporated (Health Care, Pharmaceuticals) | 14,200 | 244,381 | ||||||||||||||
Central Glass Company Limited (Industrials, Building Products) | 1,500 | 36,601 | ||||||||||||||
Daikin Industries Limited (Industrials, Building Products) | 600 | 84,619 | ||||||||||||||
Daiwa Securities Group Incorporated (Financials, Capital Markets) | 190,100 | 862,043 | ||||||||||||||
Denka Company Limited (Materials, Chemicals) | 6,300 | 184,059 | ||||||||||||||
DIC Incorporated (Materials, Chemicals) | 5,300 | 153,616 | ||||||||||||||
Dowa Mining Company Limited (Materials, Metals & Mining) | 1,100 | 38,300 | ||||||||||||||
Fujikura Limited (Industrials, Electrical Equipment) | 15,500 | 72,771 | ||||||||||||||
Hitachi Limited (Information Technology, Electronic Equipment, Instruments & Components) | 25,600 | 964,593 | ||||||||||||||
Isuzu Motors Limited (Consumer Discretionary, Automobiles) | 16,500 | 193,664 | ||||||||||||||
The accompanying notes are an integral part of these financial statements.
14 | Wells Fargo Diversified International Fund
Table of Contents
Portfolio of investments—October 31, 2019
| Shares | Value | |||||||||||||||
| Japan (continued) | ||||||||||||||||
Itochu Corporation (Industrials, Trading Companies & Distributors) | 14,600 | $ | 307,034 | |||||||||||||
Japan Airlines Company Limited (Industrials, Airlines) | 6,300 | 196,835 | ||||||||||||||
Kaken Pharmaceutical Company Limited (Health Care, Pharmaceuticals) | 700 | 34,485 | ||||||||||||||
KDDI Corporation (Communication Services, Wireless Telecommunication Services) | 20,000 | 555,422 | ||||||||||||||
Komatsu Limited (Industrials, Machinery) | 9,600 | 227,488 | ||||||||||||||
Maeda Road Construction Company Limited (Industrials, Construction & Engineering) | 3,400 | 73,736 | ||||||||||||||
Marubeni Corporation (Industrials, Trading Companies & Distributors) | 30,300 | 214,869 | ||||||||||||||
Mazda Motor Corporation (Consumer Discretionary, Automobiles) | 12,000 | 111,677 | ||||||||||||||
Mitsubishi Gas Chemical Company Incorporated (Materials, Chemicals) | 6,100 | 87,159 | ||||||||||||||
Mitsubishi UFJ Financial Group Incorporated (Financials, Banks) | 156,100 | 823,648 | ||||||||||||||
Mitsubishi UFJ Lease & Finance Company Limited (Financials, Diversified Financial Services) | 37,300 | 231,074 | ||||||||||||||
Mitsui Chemicals Incorporated (Materials, Chemicals) | 9,500 | 228,989 | ||||||||||||||
Mizuho Financial Group Incorporated (Financials, Banks) | 171,600 | 268,229 | ||||||||||||||
Nippon Shinyaku Company Limited (Health Care, Pharmaceuticals) | 7,800 | 707,843 | ||||||||||||||
Nippon Telegraph & Telephone Corporation (Communication Services, Diversified Telecommunication Services) | 12,500 | 622,280 | ||||||||||||||
Nissan Motor Company Limited (Consumer Discretionary, Automobiles) | 5,900 | 37,665 | ||||||||||||||
ORIX Corporation (Financials, Diversified Financial Services) | 16,500 | 260,739 | ||||||||||||||
Recruit Holdings Company Limited (Industrials, Professional Services) | 5,666 | 189,461 | ||||||||||||||
Resona Holdings Incorporated (Financials, Banks) | 62,600 | 275,408 | ||||||||||||||
Sawai Pharmaceutical Company Limited (Health Care, Pharmaceuticals) | 2,100 | 118,817 | ||||||||||||||
Sojitz Corporation (Industrials, Trading Companies & Distributors) | 77,400 | 245,123 | ||||||||||||||
Sompo Holdings Incorporated (Financials, Insurance) | 3,200 | 126,649 | ||||||||||||||
Sumitomo Corporation (Industrials, Trading Companies & Distributors) | 8,100 | 132,237 | ||||||||||||||
Sumitomo Heavy Industries Limited (Industrials, Machinery) | 6,000 | 188,629 | ||||||||||||||
Sumitomo Mitsui Financial Group Incorporated (Financials, Banks) | 8,000 | 287,434 | ||||||||||||||
Taiyo Nippon Sanso Corporation (Materials, Chemicals) | 28,000 | 661,691 | ||||||||||||||
Takeda Pharmaceutical Company Limited (Health Care, Pharmaceuticals) | 21,800 | 792,948 | ||||||||||||||
Teijin Limited (Materials, Chemicals) | 5,700 | 115,172 | ||||||||||||||
The Yokohama Rubber Company Limited (Consumer Discretionary, Auto Components) | 7,600 | 171,508 | ||||||||||||||
Toyo Ink SC Holding Company Limited (Materials, Chemicals) | 7,360 | 181,359 | ||||||||||||||
Toyo Tire & Rubber Company Limited (Consumer Discretionary, Auto Components) | 5,900 | 83,099 | ||||||||||||||
UBE Industries Limited (Materials, Chemicals) | 7,900 | 171,329 | ||||||||||||||
West Japan Railway Company (Industrials, Road & Rail) | 1,500 | 130,804 | ||||||||||||||
| 12,657,457 | ||||||||||||||||
|
| |||||||||||||||
| Malaysia: 0.47% | ||||||||||||||||
CIMB Group Holdings Bhd (Financials, Banks) | 371,423 | 466,668 | ||||||||||||||
|
| |||||||||||||||
| Netherlands: 6.20% | ||||||||||||||||
Adyen NV (Information Technology, IT Services) 144A† | 358 | 251,305 | ||||||||||||||
Aegon NV (Financials, Insurance) | 23,200 | 100,291 | ||||||||||||||
Airbus SE (Industrials, Aerospace & Defense) | 9,796 | 1,403,050 | ||||||||||||||
ING Groep NV (Financials, Banks) | 94,026 | 1,062,095 | ||||||||||||||
Koninklijke Ahold Delhaize NV (Consumer Staples, Food & Staples Retailing) | 14,600 | 363,526 | ||||||||||||||
Koninklijke DSM NV (Materials, Chemicals) | 4,055 | 480,520 | ||||||||||||||
Koninklijke Philips NV (Industrials, Industrial Conglomerates) | 20,088 | 879,811 | ||||||||||||||
NN Group NV (Financials, Insurance) | 22,868 | 871,495 | ||||||||||||||
OCI NV (Materials, Chemicals) † | 31,025 | 695,850 | ||||||||||||||
| 6,107,943 | ||||||||||||||||
|
| |||||||||||||||
| Norway: 0.92% | ||||||||||||||||
Den Norske Bank ASA (Financials, Banks) | 49,658 | 902,318 | ||||||||||||||
|
| |||||||||||||||
| Russia: 1.28% | ||||||||||||||||
Gazprom Neft ADR (Energy, Oil, Gas & Consumable Fuels) | 5,900 | 190,275 | ||||||||||||||
LUKOIL OAO ADR (Energy, Oil, Gas & Consumable Fuels) | 4,200 | 386,652 | ||||||||||||||
The accompanying notes are an integral part of these financial statements.
Wells Fargo Diversified International Fund | 15
Table of Contents
Portfolio of investments—October 31, 2019
| Shares | Value | |||||||||||||||
| Russia (continued) | ||||||||||||||||
MMC Norilsk Nickel PJSC ADR (Materials, Metals & Mining) | 3,852 | $ | 106,700 | |||||||||||||
Mobile TeleSystems PJSC ADR (Communication Services, Wireless Telecommunication Services) | 64,526 | 577,508 | ||||||||||||||
| 1,261,135 | ||||||||||||||||
|
| |||||||||||||||
| Singapore: 1.17% | ||||||||||||||||
DBS Group Holdings Limited (Financials, Banks) | 6,400 | 122,312 | ||||||||||||||
Keppel Corporation Limited (Industrials, Industrial Conglomerates) | 162,100 | 817,381 | ||||||||||||||
United Overseas Bank Limited (Financials, Banks) | 10,700 | 211,019 | ||||||||||||||
| 1,150,712 | ||||||||||||||||
|
| |||||||||||||||
| South Africa: 0.27% | ||||||||||||||||
Absa Group Limited (Financials, Banks) | 12,600 | 129,148 | ||||||||||||||
Imperial Holdings Limited (Consumer Discretionary, Distributors) | 5,500 | 20,638 | ||||||||||||||
Motus Holdings Limited (Consumer Discretionary, Specialty Retail) | 5,500 | 26,090 | ||||||||||||||
Old Mutual Limited (Financials, Insurance) | 59,600 | 78,284 | ||||||||||||||
Omnia Holdings Limited (Materials, Chemicals) | 7,600 | 13,027 | ||||||||||||||
| 267,187 | ||||||||||||||||
|
| |||||||||||||||
| South Korea: 2.28% | ||||||||||||||||
BNK Financial Group Incorporated (Financials, Banks) | 1,018 | 6,081 | ||||||||||||||
Hana Financial Group Incorporated (Financials, Banks) | 6,710 | 194,359 | ||||||||||||||
Hyundai GreenFood Company Limited (Consumer Staples, Food & Staples Retailing) | 14,600 | 140,548 | ||||||||||||||
Industrial Bank of Korea (Financials, Banks) | 16,600 | 168,361 | ||||||||||||||
JB Financial Group Company Limited (Financials, Banks) | 1,964 | 9,014 | ||||||||||||||
KT&G Corporation (Consumer Staples, Tobacco) | 2,300 | 197,688 | ||||||||||||||
LG Uplus Corporation (Communication Services, Diversified Telecommunication Services) | 9,600 | 110,980 | ||||||||||||||
Samsung Electronics Company Limited GDR (Information Technology, Technology Hardware, Storage & Peripherals) | 643 | 686,724 | ||||||||||||||
SK Telecom Company Limited (Communication Services, Wireless Telecommunication Services) | 3,096 | 630,669 | ||||||||||||||
Woori Financial Group Incorporated (Financials, Banks) | 9,800 | 98,973 | ||||||||||||||
| 2,243,397 | ||||||||||||||||
|
| |||||||||||||||
| Spain: 0.51% | ||||||||||||||||
Banco Santander Central Hispano SA (Financials, Banks) | 29,500 | 118,247 | ||||||||||||||
International Consolidated Airlines Group SA (Industrials, Airlines) | 17,900 | 123,168 | ||||||||||||||
Repsol YPF SA (Energy, Oil, Gas & Consumable Fuels) | 16,200 | 265,597 | ||||||||||||||
| 507,012 | ||||||||||||||||
|
| |||||||||||||||
| Sweden: 0.75% | ||||||||||||||||
Boliden AB (Materials, Metals & Mining) | 6,700 | 180,169 | ||||||||||||||
Hennes & Mauritz AB Class B (Consumer Discretionary, Specialty Retail) | 10,088 | 210,783 | ||||||||||||||
Volvo AB Class B (Industrials, Machinery) | 23,600 | 352,936 | ||||||||||||||
| 743,888 | ||||||||||||||||
|
| |||||||||||||||
| Switzerland: 6.96% | ||||||||||||||||
Baloise Holding AG (Financials, Insurance) | 1,400 | 258,571 | ||||||||||||||
Idorsia Limited (Health Care, Biotechnology) † | 6,621 | 150,474 | ||||||||||||||
LafargeHolcim Limited (Materials, Construction Materials) | 18,715 | 965,250 | ||||||||||||||
Lonza Group AG (Health Care, Life Sciences Tools & Services) | 1,551 | 558,140 | ||||||||||||||
Nestle SA (Consumer Staples, Food Products) | 13,401 | 1,430,708 | ||||||||||||||
Novartis AG (Health Care, Pharmaceuticals) | 10,929 | 953,753 | ||||||||||||||
Roche Holding AG (Health Care, Pharmaceuticals) | 2,960 | 890,550 | ||||||||||||||
Swiss Life Holding AG (Financials, Insurance) | 700 | 349,965 | ||||||||||||||
Swiss Reinsurance AG (Financials, Insurance) | 3,020 | 316,235 | ||||||||||||||
The accompanying notes are an integral part of these financial statements.
16 | Wells Fargo Diversified International Fund
Table of Contents
Portfolio of investments—October 31, 2019
| Shares | Value | |||||||||||||||
| Switzerland (continued) | ||||||||||||||||
UBS Group AG (Financials, Capital Markets) | 55,258 | $ | 652,005 | |||||||||||||
Valiant Holding AG (Financials, Banks) | 600 | 60,821 | ||||||||||||||
Zurich Insurance Group AG (Financials, Insurance) | 700 | 273,543 | ||||||||||||||
| 6,860,015 | ||||||||||||||||
|
| |||||||||||||||
| Taiwan: 0.53% | ||||||||||||||||
Powertech Technology Incorporated (Information Technology, Semiconductors & Semiconductor Equipment) | 51,000 | 160,838 | ||||||||||||||
Tripod Technology Corporation (Information Technology, Electronic Equipment, Instruments & Components) | 27,000 | 104,663 | ||||||||||||||
Zhen Ding Technology Holding (Information Technology, Electronic Equipment, Instruments & Components) | 55,000 | 261,987 | ||||||||||||||
| 527,488 | ||||||||||||||||
|
| |||||||||||||||
| Thailand: 0.04% | ||||||||||||||||
Bangchak Corporation PCL (Energy, Oil, Gas & Consumable Fuels) | 52,900 | 43,273 | ||||||||||||||
|
| |||||||||||||||
| United Kingdom: 14.02% | ||||||||||||||||
3i Group plc (Financials, Capital Markets) | 21,200 | 309,765 | ||||||||||||||
Amarin Corporation plc ADR (Health Care, Biotechnology) †« | 19,574 | 321,405 | ||||||||||||||
Anglo American plc (Materials, Metals & Mining) | 11,100 | 284,922 | ||||||||||||||
Aon plc (Financials, Insurance) | 5,742 | 1,109,125 | ||||||||||||||
AVEVA Group plc (Information Technology, Software) | 7,474 | 404,878 | ||||||||||||||
Aviva plc (Financials, Insurance) | 22,000 | 118,322 | ||||||||||||||
Babcock International Group plc (Industrials, Commercial Services & Supplies) | 2,100 | 15,070 | ||||||||||||||
BAE Systems plc (Industrials, Aerospace & Defense) | 56,500 | 421,705 | ||||||||||||||
Barratt Developments plc (Consumer Discretionary, Household Durables) | 23,400 | 191,324 | ||||||||||||||
Bellway plc (Consumer Discretionary, Household Durables) | 4,200 | 171,919 | ||||||||||||||
Bovis Homes Group plc (Consumer Discretionary, Household Durables) | 8,600 | 130,338 | ||||||||||||||
BP plc (Energy, Oil, Gas & Consumable Fuels) | 247,937 | 1,571,461 | ||||||||||||||
British American Tobacco plc (Consumer Staples, Tobacco) | 5,000 | 175,002 | ||||||||||||||
BT Group plc (Communication Services, Diversified Telecommunication Services) | 33,500 | 88,828 | ||||||||||||||
Centrica plc (Utilities, Multi-Utilities) | 68,900 | 64,760 | ||||||||||||||
Crest Nicholson Holdings plc (Consumer Discretionary, Household Durables) | 20,500 | 103,138 | ||||||||||||||
Diageo plc (Consumer Staples, Beverages) | 10,606 | 434,754 | ||||||||||||||
Experian Group Limited plc (Industrials, Professional Services) | 1,310 | 41,201 | ||||||||||||||
Fresnillo plc (Materials, Metals & Mining) | 54,872 | 504,657 | ||||||||||||||
GlaxoSmithKline plc (Health Care, Pharmaceuticals) | 53,570 | 1,227,265 | ||||||||||||||
Imperial Tobacco Group plc (Consumer Staples, Tobacco) | 7,800 | 170,996 | ||||||||||||||
Inchcape plc (Consumer Discretionary, Distributors) | 19,900 | 166,265 | ||||||||||||||
J Sainsbury plc (Consumer Staples, Food & Staples Retailing) | 37,300 | 98,324 | ||||||||||||||
John Wood Group plc (Energy, Energy Equipment & Services) | 179,053 | 784,641 | ||||||||||||||
Kingfisher plc (Consumer Discretionary, Specialty Retail) | 188,525 | 505,995 | ||||||||||||||
Lloyds Banking Group plc (Financials, Banks) | 134,900 | 99,254 | ||||||||||||||
Man Group plc (Financials, Capital Markets) | 148,683 | 276,376 | ||||||||||||||
Marks & Spencer Group plc (Consumer Discretionary, Multiline Retail) | 44,100 | 103,682 | ||||||||||||||
Melrose Industries plc (Industrials, Electrical Equipment) | 224,347 | 619,286 | ||||||||||||||
QinetiQ Group plc (Industrials, Aerospace & Defense) | 47,700 | 194,756 | ||||||||||||||
Redrow plc (Consumer Discretionary, Household Durables) | 23,047 | 179,721 | ||||||||||||||
RELX plc (Industrials, Professional Services) | 15,111 | 363,686 | ||||||||||||||
Royal Dutch Shell plc Class B (Energy, Oil, Gas & Consumable Fuels) | 21,300 | 611,967 | ||||||||||||||
Royal Mail plc (Industrials, Air Freight & Logistics) | 20,900 | 57,286 | ||||||||||||||
Sensata Technologies Holding plc (Industrials, Electrical Equipment) † | 12,957 | 663,269 | ||||||||||||||
Smiths Group plc (Industrials, Industrial Conglomerates) | 49,052 | 1,025,210 | ||||||||||||||
Tate & Lyle plc (Consumer Staples, Food Products) | 15,700 | 136,868 | ||||||||||||||
The Berkeley Group Holdings plc (Consumer Discretionary, Household Durables) | 1,200 | 68,410 | ||||||||||||||
| 13,815,831 | ||||||||||||||||
|
| |||||||||||||||
The accompanying notes are an integral part of these financial statements.
Wells Fargo Diversified International Fund | 17
Table of Contents
Portfolio of investments—October 31, 2019
| Shares | Value | |||||||||||||||
| United States: 2.63% | ||||||||||||||||
Alphabet Incorporated Class A (Communication Services, Interactive Media & Services) † | 324 | $ | 407,851 | |||||||||||||
Alphabet Incorporated Class C (Communication Services, Interactive Media & Services) † | 319 | 401,975 | ||||||||||||||
Amazon.com Incorporated (Consumer Discretionary, Internet & Direct Marketing Retail) † | 444 | 788,831 | ||||||||||||||
Gentex Corporation (Consumer Discretionary, Auto Components) | 20,082 | 563,300 | ||||||||||||||
Intercontinental Exchange Incorporated (Financials, Capital Markets) | 4,561 | 430,194 | ||||||||||||||
| 2,592,151 | ||||||||||||||||
|
| |||||||||||||||
Total Common Stocks (Cost $82,421,707) | 94,505,888 | |||||||||||||||
|
| |||||||||||||||
| Expiration date | ||||||||||||||||
| Participation Notes: 0.81% | ||||||||||||||||
| United Kingdom: 0.81% | ||||||||||||||||
HSBC Bank plc (Ryanair Holdings plc) (Industrial, Airlines) †(a) | 10-29-2020 | 58,787 | 791,814 | |||||||||||||
|
| |||||||||||||||
Total Participation Notes (Cost $776,144) | 791,814 | |||||||||||||||
|
| |||||||||||||||
| Dividend yield | ||||||||||||||||
| Preferred Stocks: 0.87% | ||||||||||||||||
| Brazil: 0.87% | ||||||||||||||||
Petroleo Brasileiro SA (Energy, Oil, Gas & Consumable Fuels) | 2.36 | % | 113,417 | 859,430 | ||||||||||||
|
| |||||||||||||||
Total Preferred Stocks (Cost $693,587) | 859,430 | |||||||||||||||
|
| |||||||||||||||
Rights: 0.00% | ||||||||||||||||
| South Africa: 0.00% | ||||||||||||||||
Omnia Holdings Limited (Materials, Chemicals) †(a) | 11-26-2019 | 11,006 | 0 | |||||||||||||
|
| |||||||||||||||
Total Rights (Cost $24,508) | 0 | |||||||||||||||
|
| |||||||||||||||
| Yield | ||||||||||||||||
| Short-Term Investments: 3.41% | ||||||||||||||||
| Investment Companies: 3.41% | ||||||||||||||||
Securities Lending Cash Investments LLC (l)(r)(u) | 1.99 | 1,463,510 | 1,463,656 | |||||||||||||
Wells Fargo Government Money Market Fund Select Class (l)(u) | 1.75 | 1,895,943 | 1,895,943 | |||||||||||||
Total Short-Term Investments (Cost $3,359,600) | 3,359,599 | |||||||||||||||
|
| |||||||||||||||
| Total investments in securities (Cost $87,275,546) | 100.96 | % | 99,516,731 | |||||
Other assets and liabilities, net | (0.96 | ) | (941,584 | ) | ||||
|
|
|
| |||||
| Total net assets | 100.00 | % | $ | 98,575,147 | ||||
|
|
|
| |||||
| † | Non-income-earning security |
| 144A | The security may be resold in transactions exempt from registration, normally to qualified institutional buyers, pursuant to Rule 144A under the Securities Act of 1933. |
| « | All or a portion of this security is on loan. |
| (a) | The security is fair valued in accordance with procedures approved by the Board of Trustees. |
| (l) | The issuer of the security is an affiliated person of the Fund as defined in the Investment Company Act of 1940. |
| (r) | The investment is a non-registered investment company purchased with cash collateral received from securities on loan. |
| (u) | The rate represents the 7-day annualized yield at period end. |
Abbreviations:
| ADR | American depositary receipt |
| GDR | Global depositary receipt |
The accompanying notes are an integral part of these financial statements.
18 | Wells Fargo Diversified International Fund
Table of Contents
Portfolio of investments—October 31, 2019
Forward Foreign Currency Contracts
| Currency to be received | Currency to be delivered | Counterparty | Settlement date | Unrealized gains | Unrealized losses | |||||||||
| 1,205,571 USD | 1,082,200 EUR | Credit Suisse | 12-9-2019 | $ | 0 | $ | (4,225 | ) | ||||||
| 2,259,839 USD | 1,826,000 GBP | Morgan Stanley | 12-9-2019 | 0 | (108,147 | ) | ||||||||
|
|
|
| |||||||||||
| $ | 0 | $ | (112,372 | ) | ||||||||||
|
|
|
| |||||||||||
Investments in Affiliates
An affiliated investment is an investment in which the Fund owns at least 5% of the outstanding voting shares of the issuer or as a result of other relationships, such as the Fund and the issuer having the same investment manager. Transactions with issuers that were either affiliated persons of the Fund at the beginning of the period or the end of the period were as follows:
| Shares, beginning of period | Shares purchased | Shares sold | Shares, end of period | Net realized gains (losses) | Net change in unrealized gains (losses) | Income from affiliated securities | Value, end of period | % of net assets | ||||||||||||||||||||||||||||
| Short-Term Investments | ||||||||||||||||||||||||||||||||||||
Investment Companies | ||||||||||||||||||||||||||||||||||||
Securities Lending Cash Investments LLC | 592,358 | 22,955,938 | 22,084,786 | 1,463,510 | $ | (18 | ) | $ | (3 | ) | $ | 32,686 | # | $ | 1,463,656 | |||||||||||||||||||||
Wells Fargo Government Money Market Fund Select Class | 2,648,395 | 19,738,166 | 20,490,618 | 1,895,943 | 0 | 0 | 49,672 | 1,895,943 | ||||||||||||||||||||||||||||
|
|
|
|
|
|
|
|
|
| |||||||||||||||||||||||||||
| $ | (18 | ) | $ | (3 | ) | $ | 82,358 | $ | 3,359,599 | 3.41 | % | |||||||||||||||||||||||||
|
|
|
|
|
|
|
|
|
| |||||||||||||||||||||||||||
| # | Amount shown represents income before fees and rebates. |
The accompanying notes are an integral part of these financial statements.
Wells Fargo Diversified International Fund | 19
Table of Contents
Statement of assets and liabilities—October 31, 2019
Assets | ||||
Investments in unaffiliated securities (including $1,387,756 of securities loaned), at value (cost $83,915,946) | $ | 96,157,132 | ||
Investments in affiliated securities, at value (cost $3,359,600) | 3,359,599 | |||
Foreign currency, at value (cost $259,577) | 262,905 | |||
Receivable for investments sold | 400,770 | |||
Receivable for Fund shares sold | 14,346 | |||
Receivable for dividends | 556,083 | |||
Receivable for securities lending income, net | 317 | |||
Prepaid expenses and other assets | 19,272 | |||
|
| |||
Total assets | 100,770,424 | |||
|
| |||
Liabilities | ||||
Payable upon receipt of securities loaned | 1,463,027 | |||
Payable for investments purchased | 116,509 | |||
Payable for Fund shares redeemed | 184,787 | |||
Overdraft due to custodian bank | 4,225 | |||
Unrealized losses on forward foreign currency contracts | 112,372 | |||
Management fee payable | 33,712 | |||
Contingent tax liability | 9,133 | |||
Administration fees payable | 12,186 | |||
Distribution fee payable | 824 | |||
Custodian and accounting fees payable | 174,600 | |||
Trustees’ fees and expenses payable | 3,924 | |||
Accrued expenses and other liabilities | 79,978 | |||
|
| |||
Total liabilities | 2,195,277 | |||
|
| |||
Total net assets | $ | 98,575,147 | ||
|
| |||
Net assets consist of | ||||
Paid-in capital | $ | 92,193,998 | ||
Total distributable earnings | 6,381,149 | |||
|
| |||
Total net assets | $ | 98,575,147 | ||
|
| |||
Computation of net asset value and offering price per share | ||||
Net assets – Class A | $ | 54,145,782 | ||
Shares outstanding – Class A1 | 4,184,382 | |||
Net asset value per share – Class A | $12.94 | |||
Maximum offering price per share – Class A2 | $13.73 | |||
Net assets – Class C | $ | 1,271,471 | ||
Shares outstanding – Class C1 | 106,989 | |||
Net asset value per share – Class C | $11.88 | |||
Net assets – Class R6 | $ | 25,524,681 | ||
Shares outstanding – Class R61 | 1,922,658 | |||
Net asset value per share – Class R6 | $13.28 | |||
Net assets – Administrator Class | $ | 13,125,283 | ||
Shares outstanding – Administrator Class1 | 995,098 | |||
Net asset value per share – Administrator Class | $13.19 | |||
Net assets – Institutional Class | $ | 4,507,930 | ||
Shares outstanding – Institutional Class1 | 367,062 | |||
Net asset value per share – Institutional Class | $12.28 | |||
| 1 | The Fund has an unlimited number of authorized shares. |
| 2 | Maximum offering price is computed as 100/94.25 of net asset value. On investments of $50,000 or more, the offering price is reduced. |
The accompanying notes are an integral part of these financial statements.
20 | Wells Fargo Diversified International Fund
Table of Contents
Statement of operations—year ended October 31, 2019
Investment income | ||||
Dividends (net of foreign withholding taxes of $333,974) | $ | 3,121,976 | ||
Income from affiliated securities | 83,238 | |||
|
| |||
Total investment income | 3,205,214 | |||
|
| |||
Expenses | ||||
Management fee | 837,056 | |||
Administration fees | ||||
Class A | 111,665 | |||
Class C | 3,647 | |||
Class R6 | 7,971 | |||
Administrator Class | 16,284 | |||
Institutional Class | 5,810 | |||
Shareholder servicing fees | ||||
Class A | 132,934 | |||
Class C | 4,342 | |||
Administrator Class | 31,315 | |||
Distribution fee | ||||
Class C | 13,022 | |||
Custody and accounting fees | 192,467 | |||
Professional fees | 45,606 | |||
Registration fees | 68,607 | |||
Shareholder report expenses | 50,702 | |||
Trustees’ fees and expenses | 21,658 | |||
Other fees and expenses | 70,438 | |||
|
| |||
Total expenses | 1,613,524 | |||
Less: Fee waivers and/or expense reimbursements | ||||
Fund-level | (408,236 | ) | ||
Class A | (1,618 | ) | ||
Class R6 | (7,971 | ) | ||
Administrator Class | (2,918 | ) | ||
Institutional Class | (1,505 | ) | ||
|
| |||
Net expenses | 1,191,276 | |||
|
| |||
Net investment income | 2,013,938 | |||
|
| |||
Realized and unrealized gains (losses) on investments | ||||
Net realized gains (losses) on | ||||
Unaffiliated securities | 429,300 | |||
Affiliated securities | (18 | ) | ||
Forward foreign currency contracts | 1,982 | |||
|
| |||
Net realized gains on investments | 431,264 | |||
|
| |||
Net change in unrealized gains (losses) on | ||||
Unaffiliated securities | 6,333,231 | |||
Affiliated securities | (3 | ) | ||
Forward foreign currency contracts | (198,397 | ) | ||
|
| |||
Net change in unrealized gains (losses) on investments | 6,134,831 | |||
|
| |||
Net realized and unrealized gains (losses) on investments | 6,566,095 | |||
|
| |||
Net increase in net assets resulting from operations | $ | 8,580,033 | ||
|
| |||
The accompanying notes are an integral part of these financial statements.
Wells Fargo Diversified International Fund | 21
Table of Contents
Statement of changes in net assets
| Year ended October 31, 2019 | Year ended October 31, 2018 | |||||||||||||||
Operations | ||||||||||||||||
Net investment income | $ | 2,013,938 | $ | 2,122,309 | ||||||||||||
Net realized gains on investments | 431,264 | 5,554,096 | ||||||||||||||
Net change in unrealized gains (losses) on investments | 6,134,831 | (15,065,182 | ) | |||||||||||||
|
| |||||||||||||||
Net increase (decrease) in net assets resulting from operations | 8,580,033 | (7,388,777 | ) | |||||||||||||
|
| |||||||||||||||
Distributions to shareholders from net investment income and net realized gains |
| |||||||||||||||
Class A | (1,117,631 | ) | (1,577,710 | ) | ||||||||||||
Class C | (23,783 | ) | (73,033 | ) | ||||||||||||
Class R6 | (716,722 | ) | (864,807 | ) | ||||||||||||
Administrator Class | (270,088 | ) | (347,079 | ) | ||||||||||||
Institutional Class | (126,725 | ) | (286,387 | ) | ||||||||||||
|
| |||||||||||||||
Total distributions to shareholders | (2,254,949 | ) | (3,149,016 | ) | ||||||||||||
|
| |||||||||||||||
Capital share transactions | Shares | Shares | ||||||||||||||
Proceeds from shares sold | ||||||||||||||||
Class A | 111,229 | 1,356,596 | 108,681 | 1,454,360 | ||||||||||||
Class C | 6,717 | 72,885 | 31,556 | 401,935 | ||||||||||||
Class R6 | 57,338 | 686,446 | 322,912 | 4,341,223 | ||||||||||||
Administrator Class | 158,327 | 1,962,086 | 204,027 | 2,787,392 | ||||||||||||
Institutional Class | 76,896 | 887,473 | 48,181 | 616,951 | ||||||||||||
|
| |||||||||||||||
| 4,965,486 | 9,601,861 | |||||||||||||||
|
| |||||||||||||||
Reinvestment of distributions | ||||||||||||||||
Class A | 99,537 | 1,100,884 | 115,936 | 1,551,227 | ||||||||||||
Class C | 2,096 | 21,423 | 5,516 | 67,961 | ||||||||||||
Class R6 | 17,878 | 202,018 | 63,155 | 863,957 | ||||||||||||
Administrator Class | 23,957 | 269,756 | 25,476 | 346,979 | ||||||||||||
Institutional Class | 11,996 | 125,479 | 22,284 | 283,005 | ||||||||||||
|
| |||||||||||||||
| 1,719,560 | 3,113,129 | |||||||||||||||
|
| |||||||||||||||
Payment for shares redeemed | ||||||||||||||||
Class A | (500,862 | ) | (6,110,610 | ) | (555,196 | ) | (7,393,677 | ) | ||||||||
Class C | (112,305 | ) | (1,263,134 | ) | (157,841 | ) | (1,925,792 | ) | ||||||||
Class R | N/A | N/A | (2,309 | )1 | (31,119 | )1 | ||||||||||
Class R6 | (372,557 | ) | (4,728,700 | ) | (623,428 | ) | (8,441,251 | ) | ||||||||
Administrator Class | (201,419 | ) | (2,495,504 | ) | (220,724 | ) | (2,992,288 | ) | ||||||||
Institutional Class | (119,836 | ) | (1,388,392 | ) | (306,981 | ) | (3,843,466 | ) | ||||||||
|
| |||||||||||||||
| (15,986,340 | ) | (24,627,593 | ) | |||||||||||||
|
| |||||||||||||||
Net decrease in net assets resulting from capital share transactions | (9,301,294 | ) | (11,912,603 | ) | ||||||||||||
|
| |||||||||||||||
Total decrease in net assets | (2,976,210 | ) | (22,450,396 | ) | ||||||||||||
|
| |||||||||||||||
Net assets | ||||||||||||||||
Beginning of period | 101,551,357 | 124,001,753 | ||||||||||||||
|
| |||||||||||||||
End of period | $ | 98,575,147 | $ | 101,551,357 | ||||||||||||
|
| |||||||||||||||
| 1 | For the period from November 1, 2017 to November 13, 2017. Effective at the close of business on November 13, 2017, Class R shares were liquidated and the class was subsequently closed. Class R shares are no longer offered by the Fund. |
The accompanying notes are an integral part of these financial statements.
22 | Wells Fargo Diversified International Fund
Table of Contents
(For a share outstanding throughout each period)
| Year ended October 31 | ||||||||||||||||||||
| CLASS A | 2019 | 2018 | 2017 | 2016 | 2015 | |||||||||||||||
Net asset value, beginning of period | $12.15 | $13.39 | $11.08 | $11.65 | $12.01 | |||||||||||||||
Net investment income | 0.23 | 0.21 | 0.19 | 0.17 | 0.13 | 1 | ||||||||||||||
Net realized and unrealized gains (losses) on investments | 0.81 | (1.12 | ) | 2.34 | (0.63 | ) | (0.21 | ) | ||||||||||||
|
|
|
|
|
|
|
|
|
| |||||||||||
Total from investment operations | 1.04 | (0.91 | ) | 2.53 | (0.46 | ) | (0.08 | ) | ||||||||||||
Distributions to shareholders from | ||||||||||||||||||||
Net investment income | (0.25 | ) | (0.33 | ) | (0.22 | ) | (0.11 | ) | (0.28 | ) | ||||||||||
Net asset value, end of period | $12.94 | $12.15 | $13.39 | $11.08 | $11.65 | |||||||||||||||
Total return2 | 8.94 | % | (7.00 | )% | 23.27 | % | (3.96 | )% | (0.66 | )% | ||||||||||
Ratios to average net assets (annualized) | ||||||||||||||||||||
Gross expenses | 1.77 | % | 1.71 | % | 1.80 | % | 1.79 | % | 1.85 | % | ||||||||||
Net expenses | 1.35 | % | 1.35 | % | 1.35 | % | 1.35 | % | 1.40 | % | ||||||||||
Net investment income | 1.91 | % | 1.61 | % | 1.64 | % | 1.67 | % | 1.07 | % | ||||||||||
Supplemental data | ||||||||||||||||||||
Portfolio turnover rate | 28 | % | 39 | % | 42 | % | 50 | % | 31 | % | ||||||||||
Net assets, end of period (000s omitted) | $54,146 | $54,358 | $64,347 | $61,031 | $73,891 | |||||||||||||||
| 1 | Calculated based upon average shares outstanding |
| 2 | Total return calculations do not include any sales charges. |
The accompanying notes are an integral part of these financial statements.
Wells Fargo Diversified International Fund | 23
Table of Contents
Financial highlights
(For a share outstanding throughout each period)
| Year ended October 31 | ||||||||||||||||||||
| CLASS C | 2019 | 2018 | 2017 | 2016 | 2015 | |||||||||||||||
Net asset value, beginning of period | $11.12 | $12.27 | $10.16 | $10.74 | $11.08 | |||||||||||||||
Net investment income | 0.12 | 1 | 0.10 | 1 | 0.10 | 1 | 0.10 | 1 | 0.04 | 1 | ||||||||||
Net realized and unrealized gains (losses) on investments | 0.76 | (1.02 | ) | 2.15 | (0.60 | ) | (0.20 | ) | ||||||||||||
|
|
|
|
|
|
|
|
|
| |||||||||||
Total from investment operations | 0.88 | (0.92 | ) | 2.25 | (0.50 | ) | (0.16 | ) | ||||||||||||
Distributions to shareholders from | ||||||||||||||||||||
Net investment income | (0.12 | ) | (0.23 | ) | (0.14 | ) | (0.08 | ) | (0.18 | ) | ||||||||||
Net asset value, end of period | $11.88 | $11.12 | $12.27 | $10.16 | $10.74 | |||||||||||||||
Total return2 | 8.09 | % | (7.76 | )% | 22.51 | % | (4.72 | )% | (1.44 | )% | ||||||||||
Ratios to average net assets (annualized) | ||||||||||||||||||||
Gross expenses | 2.51 | % | 2.46 | % | 2.55 | % | 2.54 | % | 2.60 | % | ||||||||||
Net expenses | 2.10 | % | 2.10 | % | 2.10 | % | 2.10 | % | 2.15 | % | ||||||||||
Net investment income | 1.08 | % | 0.81 | % | 0.92 | % | 1.01 | % | 0.33 | % | ||||||||||
Supplemental data | ||||||||||||||||||||
Portfolio turnover rate | 28 | % | 39 | % | 42 | % | 50 | % | 31 | % | ||||||||||
Net assets, end of period (000s omitted) | $1,271 | $2,340 | $4,066 | $4,351 | $3,573 | |||||||||||||||
| 1 | Calculated based upon average shares outstanding |
| 2 | Total return calculations do not include any sales charges. |
The accompanying notes are an integral part of these financial statements.
24 | Wells Fargo Diversified International Fund
Table of Contents
Financial highlights
(For a share outstanding throughout each period)
| Year ended October 31 | ||||||||||||||||||||
| CLASS R6 | 2019 | 2018 | 2017 | 2016 | 20151 | |||||||||||||||
Net asset value, beginning of period | $12.47 | $13.71 | $11.33 | $11.87 | $11.13 | |||||||||||||||
Net investment income | 0.31 | 0.31 | 0.30 | 2 | 0.26 | 2 | 0.00 | 3 | ||||||||||||
Net realized and unrealized gains (losses) on investments | 0.82 | (1.18 | ) | 2.34 | (0.68 | ) | 0.74 | |||||||||||||
|
|
|
|
|
|
|
|
|
| |||||||||||
Total from investment operations | 1.13 | (0.87 | ) | 2.64 | (0.42 | ) | 0.74 | |||||||||||||
Distributions to shareholders from | ||||||||||||||||||||
Net investment income | (0.32 | ) | (0.37 | ) | (0.26 | ) | (0.12 | ) | 0.00 | |||||||||||
Net asset value, end of period | $13.28 | $12.47 | $13.71 | $11.33 | $11.87 | |||||||||||||||
Total return4 | 9.52 | % | (6.61 | )% | 23.88 | % | (3.55 | )% | 6.65 | % | ||||||||||
Ratios to average net assets (annualized) | ||||||||||||||||||||
Gross expenses | 1.34 | % | 1.28 | % | 1.34 | % | 1.36 | % | 1.46 | % | ||||||||||
Net expenses | 0.89 | % | 0.89 | % | 0.89 | % | 0.89 | % | 0.89 | % | ||||||||||
Net investment income | 2.37 | % | 2.11 | % | 2.37 | % | 2.30 | % | 0.05 | % | ||||||||||
Supplemental data | ||||||||||||||||||||
Portfolio turnover rate | 28 | % | 39 | % | 42 | % | 50 | % | 31 | % | ||||||||||
Net assets, end of period (000s omitted) | $25,525 | $27,692 | $33,698 | $5,523 | $27 | |||||||||||||||
| 1 | For the period from September 30, 2015 (commencement of class operations) to October 31, 2015 |
| 2 | Calculated based upon average shares outstanding |
| 3 | Amount is less than $0.005. |
| 4 | Returns for periods of less than one year are not annualized. |
The accompanying notes are an integral part of these financial statements.
Wells Fargo Diversified International Fund | 25
Table of Contents
Financial highlights
(For a share outstanding throughout each period)
| Year ended October 31 | ||||||||||||||||||||
| ADMINISTRATOR CLASS | 2019 | 2018 | 2017 | 2016 | 2015 | |||||||||||||||
Net asset value, beginning of period | $12.38 | $13.64 | $11.28 | $11.87 | $12.23 | |||||||||||||||
Net investment income | 0.25 | 1 | 0.23 | 1 | 0.22 | 1 | 0.20 | 1 | 0.16 | 1 | ||||||||||
Net realized and unrealized gains (losses) on investments | 0.83 | (1.15 | ) | 2.37 | (0.66 | ) | (0.22 | ) | ||||||||||||
|
|
|
|
|
|
|
|
|
| |||||||||||
Total from investment operations | 1.08 | (0.92 | ) | 2.59 | (0.46 | ) | (0.06 | ) | ||||||||||||
Distributions to shareholders from | ||||||||||||||||||||
Net investment income | (0.27 | ) | (0.34 | ) | (0.23 | ) | (0.13 | ) | (0.30 | ) | ||||||||||
Net asset value, end of period | $13.19 | $12.38 | $13.64 | $11.28 | $11.87 | |||||||||||||||
Total return | 9.07 | % | (6.94 | )% | 23.46 | % | (3.90 | )% | (0.46 | )% | ||||||||||
Ratios to average net assets (annualized) | ||||||||||||||||||||
Gross expenses | 1.69 | % | 1.63 | % | 1.72 | % | 1.71 | % | 1.72 | % | ||||||||||
Net expenses | 1.25 | % | 1.25 | % | 1.25 | % | 1.25 | % | 1.25 | % | ||||||||||
Net investment income | 2.01 | % | 1.73 | % | 1.79 | % | 1.83 | % | 1.31 | % | ||||||||||
Supplemental data | ||||||||||||||||||||
Portfolio turnover rate | 28 | % | 39 | % | 42 | % | 50 | % | 31 | % | ||||||||||
Net assets, end of period (000s omitted) | $13,125 | $12,557 | $13,714 | $12,334 | $10,540 | |||||||||||||||
| 1 | Calculated based upon average shares outstanding |
The accompanying notes are an integral part of these financial statements.
26 | Wells Fargo Diversified International Fund
Table of Contents
Financial highlights
(For a share outstanding throughout each period)
| Year ended October 31 | ||||||||||||||||||||
| INSTITUTIONAL CLASS | 2019 | 2018 | 2017 | 2016 | 2015 | |||||||||||||||
Net asset value, beginning of period | $11.57 | $12.84 | $10.61 | $11.14 | $11.50 | |||||||||||||||
Net investment income | 0.26 | 1 | 0.25 | 1 | 0.23 | 1 | 0.23 | 1 | 0.17 | 1 | ||||||||||
Net realized and unrealized gains (losses) on investments | 0.76 | (1.07 | ) | 2.25 | (0.63 | ) | (0.20 | ) | ||||||||||||
|
|
|
|
|
|
|
|
|
| |||||||||||
Total from investment operations | 1.02 | (0.82 | ) | 2.48 | (0.40 | ) | (0.03 | ) | ||||||||||||
Distributions to shareholders from | ||||||||||||||||||||
Net investment income | (0.31 | ) | (0.45 | ) | (0.25 | ) | (0.13 | ) | (0.33 | ) | ||||||||||
Net asset value, end of period | $12.28 | $11.57 | $12.84 | $10.61 | $11.14 | |||||||||||||||
Total return | 9.30 | % | (6.68 | )% | 23.91 | % | (3.63 | )% | (0.23 | )% | ||||||||||
Ratios to average net assets (annualized) | ||||||||||||||||||||
Gross expenses | 1.44 | % | 1.38 | % | 1.49 | % | 1.46 | % | 1.47 | % | ||||||||||
Net expenses | 0.99 | % | 0.99 | % | 0.99 | % | 0.99 | % | 0.99 | % | ||||||||||
Net investment income | 2.22 | % | 1.97 | % | 2.02 | % | 2.16 | % | 1.45 | % | ||||||||||
Supplemental data | ||||||||||||||||||||
Portfolio turnover rate | 28 | % | 39 | % | 42 | % | 50 | % | 31 | % | ||||||||||
Net assets, end of period (000s omitted) | $4,508 | $4,604 | $8,146 | $24,328 | $7,106 | |||||||||||||||
| 1 | Calculated based upon average shares outstanding |
The accompanying notes are an integral part of these financial statements.
Wells Fargo Diversified International Fund | 27
Table of Contents
1. ORGANIZATION
Wells Fargo Funds Trust (the “Trust”), a Delaware statutory trust organized on March 10, 1999, is an open-end management investment company registered under the Investment Company Act of 1940, as amended (the “1940 Act”). As an investment company, the Trust follows the accounting and reporting guidance in Financial Accounting Standards Board (“FASB”) Accounting Standards Codification Topic 946, Financial Services – Investment Companies. These financial statements report on the Wells Fargo Diversified International Fund (the “Fund”) which is a diversified series of the Trust.
Effective at the close of business on November 13, 2017, Class R shares were liquidated and the class was subsequently closed. Class R shares are no longer offered by the Fund. Information for Class R shares reflected in the financial statements represents activity through November 13, 2017.
2. SIGNIFICANT ACCOUNTING POLICIES
The following significant accounting policies, which are consistently followed in the preparation of the financial statements of the Fund, are in conformity with U.S. generally accepted accounting principles which require management to make estimates and assumptions that affect the reported amounts of assets and liabilities, disclosure of contingent assets and liabilities at the date of the financial statements, and the reported amounts of revenues and expenses during the reporting period. Actual results could differ from those estimates.
Securities valuation
All investments are valued each business day as of the close of regular trading on the New York Stock Exchange (generally 4 p.m. Eastern Time), although the Fund may deviate from this calculation time under unusual or unexpected circumstances.
Equity securities that are listed on a foreign or domestic exchange or market are valued at the official closing price or, if none, the last sales price. If no sale occurs on the principal exchange or market that day, a fair value price will be determined in accordance with the Fund’s Valuation Procedures.
Forward foreign currency contracts are recorded at the forward rate provided by an independent foreign currency pricing source at a time each business day specified by the Wells Fargo Asset Management Pricing Committee at Wells Fargo Funds Management, LLC (“Funds Management”).
The values of securities denominated in foreign currencies are translated into U.S. dollars at rates provided by an independent foreign currency pricing source at a time each business day specified by the Wells Fargo Asset Management Pricing Committee.
Many securities markets and exchanges outside the U.S. close prior to the close of the New York Stock Exchange and therefore may not fully reflect trading or events that occur after the close of the principal exchange in which the foreign securities are traded, but before the close of the New York Stock Exchange. If such trading or events are expected to materially affect the value of such securities, then fair value pricing procedures approved by the Board of Trustees of the Fund are applied. These procedures take into account multiple factors including movements in U.S. securities markets after foreign exchanges close. Foreign securities that are fair valued under these procedures are categorized as Level 2 and the application of these procedures may result in transfers between Level 1 and Level 2. Depending on market activity, such fair valuations may be frequent. Such fair value pricing may result in net asset values that are higher or lower than net asset values based on the last reported sales price or latest quoted bid price. On October 31, 2019, such fair value pricing was not used in pricing foreign securities.
Investments in registered open-end investment companies are valued at net asset value. Interests in non-registered investment companies that are redeemable at net asset value are fair valued normally at net asset value.
Investments which are not valued using any of the methods discussed above are valued at their fair value, as determined in good faith by the Board of Trustees. The Board of Trustees has established a Valuation Committee comprised of the Trustees and has delegated to it the authority to take any actions regarding the valuation of portfolio securities that the Valuation Committee deems necessary or appropriate, including determining the fair value of portfolio securities, unless the determination has been delegated to the Wells Fargo Asset Management Pricing Committee. The Board of Trustees retains the authority to make or ratify any valuation decisions or approve any changes to the Valuation Procedures as it deems appropriate. On a quarterly basis, the Board of Trustees receives reports on any valuation actions taken by the Valuation Committee or the Wells Fargo Asset Management Pricing Committee which may include items for ratification.
Foreign currency translation
The accounting records of the Fund are maintained in U.S. dollars. The values of other assets and liabilities denominated in foreign currencies are translated into U.S. dollars at rates provided by an independent foreign currency pricing source at a time each business day specified by the Wells Fargo Asset Management Pricing Committee. Purchases and sales of securities, and
28 | Wells Fargo Diversified International Fund
Table of Contents
Notes to financial statements
income and expenses are converted at the rate of exchange on the respective dates of such transactions. Net realized foreign exchange gains or losses arise from sales of foreign currencies, currency gains or losses realized between the trade and settlement dates on securities transactions, and the difference between the amounts of dividends, interest and foreign withholding taxes recorded and the U.S. dollar equivalent of the amounts actually paid or received. Net unrealized foreign exchange gains and losses arise from changes in the fair value of assets and liabilities other than investments in securities resulting from changes in exchange rates. The changes in net assets arising from changes in exchange rates of securities and the changes in net assets resulting from changes in market prices of securities are not separately presented. Such changes are included in net realized and unrealized gains or losses from investments.
Participation notes
The Fund may invest in participation notes to gain exposure to securities in certain foreign markets. Participation notes are issued by banks or broker-dealers and are designed to offer a return linked to a particular underlying foreign security. Participation notes involve transaction costs, which may be higher than those applicable to the underlying foreign security. The holder of the participation note is entitled to receive from the bank or broker-dealer, an amount equal to the dividend paid by the issuer of the underlying foreign security; however, the holder is not entitled to the same rights (i.e. voting rights) as an owner of the underlying foreign security. Investments in participation notes involve risks beyond those normally associated with a direct investment in an underlying security. The Fund has no rights against the issuer of the underlying foreign security and participation notes expose the Fund to counterparty risk in the event the counterparty does not perform. There is also no assurance there will be a secondary trading market for the participation note or that the trading price of the participation note will equal the underlying value of the foreign security that it seeks to replicate.
Forward foreign currency contracts
A forward foreign currency contract is an agreement between two parties to purchase or sell a specific currency for an agreed-upon price at a future date. The Fund enters into forward foreign currency contracts to facilitate transactions in foreign-denominated securities and to attempt to minimize the risk to the Fund from adverse changes in the relationship between currencies. Forward foreign currency contracts are recorded at the forward rate and marked-to-market daily. When the contracts are closed, realized gains and losses arising from such transactions are recorded as realized gains or losses on forward foreign currency contracts. The Fund is subject to foreign currency risk and may be exposed to risks if the counterparties to the contracts are unable to meet the terms of their contracts or if the value of the foreign currency changes unfavorably. The Fund’s maximum risk of loss from counterparty credit risk is the unrealized gains on the contracts. This risk may be mitigated if there is a master netting arrangement between the Fund and the counterparty.
Securities lending
The Fund may lend its securities from time to time in order to earn additional income in the form of fees or interest on securities received as collateral or the investment of any cash received as collateral. When securities are on loan, the Fund receives interest or dividends on those securities. Cash collateral received in connection with its securities lending transactions is invested in Securities Lending Cash Investments, LLC (the “Securities Lending Fund”). Investments in Securities Lending Fund are valued at the evaluated bid price provided by an independent pricing service. Income earned from investment in the Securities Lending Fund (net of fees and rebates), if any, is included in income from affiliated securities on the Statement of Operations.
In a securities lending transaction, the net asset value of the Fund is affected by an increase or decrease in the value of the securities loaned and by an increase or decrease in the value of the instrument in which collateral is invested. The amount of securities lending activity undertaken by the Fund fluctuates from time to time. The Fund has the right under the lending agreement to recover the securities from the borrower on demand. In the event of default or bankruptcy by the borrower, the Fund may be prevented from recovering the loaned securities or gaining access to the collateral or may experience delays or costs in doing so. In such an event, the terms of the agreement allows the unaffiliated securities lending agent to use the collateral to purchase replacement securities on behalf of the Fund or pay the Fund the market value of the loaned securities. The Fund bears the risk of loss with respect to depreciation of its investment of the cash collateral.
Security transactions and income recognition
Securities transactions are recorded on a trade date basis. Realized gains or losses are recorded on the basis of identified cost.
Dividend income is recognized on the ex-dividend date, except for certain dividends from foreign securities, which are recorded as soon as the custodian verifies the ex-dividend date. Dividend income from foreign securities is recorded net of foreign taxes withheld where recovery of such taxes is not assured.
Wells Fargo Diversified International Fund | 29
Table of Contents
Notes to financial statements
Distributions to shareholders
Distributions to shareholders from net investment income and any net realized gains are recorded on the ex-dividend date and paid at least annually. Such distributions are determined in accordance with income tax regulations and may differ from U.S. generally accepted accounting principles. Dividend sources are estimated at the time of declaration. The tax character of distributions is determined as of the Fund’s fiscal year end. Therefore, a portion of the Fund’s distributions made prior to the Fund’s fiscal year end may be categorized as a tax return of capital at year end.
Federal and other taxes
The Fund intends to continue to qualify as a regulated investment company by distributing substantially all of its investment company taxable income and any net realized capital gains (after reduction for capital loss carryforwards) sufficient to relieve it from all, or substantially all, federal income taxes. Accordingly, no provision for federal income taxes was required.
The Fund’s income and federal excise tax returns and all financial records supporting those returns for the prior three fiscal years are subject to examination by the federal and Delaware revenue authorities. Management has analyzed the Fund’s tax positions taken on federal, state, and foreign tax returns for all open tax years and does not believe that there are any uncertain tax positions that require recognition of a tax liability.
As of October 31, 2019, the aggregate cost of all investments for federal income tax purposes was $88,081,207 and the unrealized gains (losses) consisted of:
Gross unrealized gains | $ | 17,721,541 | ||
Gross unrealized losses | (6,398,389 | ) | ||
Net unrealized gains | $ | 11,323,152 | ||
As of October 31, 2019, the Fund had capital loss carryforwards which consist of $7,024,446 in short-term capital losses.
Class allocations
The separate classes of shares offered by the Fund differ principally in applicable sales charges, distribution, shareholder servicing, and administration fees. Class specific expenses are charged directly to that share class. Investment income, common fund-level expenses, and realized and unrealized gains (losses) on investments are allocated daily to each class of shares based on the relative proportion of net assets of each class.
3. FAIR VALUATION MEASUREMENTS
Fair value measurements of investments are determined within a framework that has established a fair value hierarchy based upon the various data inputs utilized in determining the value of the Fund’s investments. The three-level hierarchy gives the highest priority to unadjusted quoted prices in active markets for identical assets or liabilities (Level 1) and the lowest priority to unobservable inputs (Level 3). The Fund’s investments are classified within the fair value hierarchy based on the lowest level of input that is significant to the fair value measurement. The inputs are summarized into three broad levels as follows:
| ∎ | Level 1 – quoted prices in active markets for identical securities |
| ∎ | Level 2 – other significant observable inputs (including quoted prices for similar securities, interest rates, prepayment speeds, credit risk, etc.) |
| ∎ | Level 3 – significant unobservable inputs (including the Fund’s own assumptions in determining the fair value of investments) |
The inputs or methodologies used for valuing investments in securities are not necessarily an indication of the risk associated with investing in those securities.
30 | Wells Fargo Diversified International Fund
Table of Contents
Notes to financial statements
The following is a summary of the inputs used in valuing the Fund’s assets and liabilities as of October 31, 2019:
| Quoted prices (Level 1) | Other significant observable inputs (Level 2) | Significant (Level 3) | Total | |||||||||||||
Assets | ||||||||||||||||
Investments in: | ||||||||||||||||
Common stocks | ||||||||||||||||
Australia | $ | 1,221,773 | $ | 0 | $ | 0 | $ | 1,221,773 | ||||||||
Austria | 387,757 | 0 | 0 | 387,757 | ||||||||||||
Brazil | 1,965,168 | 0 | 0 | 1,965,168 | ||||||||||||
Canada | 2,398,921 | 0 | 0 | 2,398,921 | ||||||||||||
China | 4,172,277 | 0 | 0 | 4,172,277 | ||||||||||||
Denmark | 1,352,701 | 0 | 0 | 1,352,701 | ||||||||||||
Finland | 109,723 | 0 | 0 | 109,723 | ||||||||||||
France | 8,287,383 | 0 | 0 | 8,287,383 | ||||||||||||
Germany | 12,817,895 | 0 | 0 | 12,817,895 | ||||||||||||
Hong Kong | 2,642,168 | 0 | 0 | 2,642,168 | ||||||||||||
Hungary | 64,866 | 0 | 0 | 64,866 | ||||||||||||
India | 686,320 | 0 | 0 | 686,320 | ||||||||||||
Ireland | 2,431,976 | 0 | 0 | 2,431,976 | ||||||||||||
Israel | 1,259,907 | 0 | 0 | 1,259,907 | ||||||||||||
Italy | 4,560,578 | 0 | 0 | 4,560,578 | ||||||||||||
Japan | 12,657,457 | 0 | 0 | 12,657,457 | ||||||||||||
Malaysia | 466,668 | 0 | 0 | 466,668 | ||||||||||||
Netherlands | 6,107,943 | 0 | 0 | 6,107,943 | ||||||||||||
Norway | 902,318 | 0 | 0 | 902,318 | ||||||||||||
Russia | 1,261,135 | 0 | 0 | 1,261,135 | ||||||||||||
Singapore | 1,150,712 | 0 | 0 | 1,150,712 | ||||||||||||
South Africa | 267,187 | 0 | 0 | 267,187 | ||||||||||||
South Korea | 2,243,397 | 0 | 0 | 2,243,397 | ||||||||||||
Spain | 507,012 | 0 | 0 | 507,012 | ||||||||||||
Sweden | 743,888 | 0 | 0 | 743,888 | ||||||||||||
Switzerland | 6,860,015 | 0 | 0 | 6,860,015 | ||||||||||||
Taiwan | 527,488 | 0 | 0 | 527,488 | ||||||||||||
Thailand | 43,273 | 0 | 0 | 43,273 | ||||||||||||
United Kingdom | 13,815,831 | 0 | 0 | 13,815,831 | ||||||||||||
United States | 2,592,151 | 0 | 0 | 2,592,151 | ||||||||||||
Participation Notes | ||||||||||||||||
United Kingdom | 0 | 791,814 | 0 | 791,814 | ||||||||||||
Preferred stocks | ||||||||||||||||
Brazil | 859,430 | 0 | 0 | 859,430 | ||||||||||||
Rights | ||||||||||||||||
South Africa | 0 | 0 | 0 | 0 | ||||||||||||
Short-term investments | ||||||||||||||||
Investment companies | 3,359,599 | 0 | 0 | 3,359,599 | ||||||||||||
Total assets | $ | 98,724,917 | $ | 791,814 | $ | 0 | $ | 99,516,731 | ||||||||
Liabilities | ||||||||||||||||
Forward foreign currency contracts | $ | 0 | $ | 112,372 | $ | 0 | $ | 112,372 | ||||||||
Total liabilities | $ | 0 | $ | 112,372 | $ | 0 | $ | 112,372 | ||||||||
Wells Fargo Diversified International Fund | 31
Table of Contents
Notes to financial statements
Additional sector, industry or geographic detail is included in the Portfolio of Investments.
Forward foreign currency contracts are reported at their cumulative unrealized gains (losses) at measurement date as reported in the table following the Portfolio of Investments. All other assets and liabilities are reported at their market value at measurement date.
For the year ended October 31 2019, the Fund did not have any transfers into/out of Level 3.
4. TRANSACTIONS WITH AFFILIATES AND OTHER EXPENSES
Management fee
Funds Management, an indirect wholly owned subsidiary of Wells Fargo & Company (“Wells Fargo”), is the manager of the Fund and provides advisory and fund-level administrative services under an investment management agreement. Under the investment management agreement, Funds Management is responsible for, among other services, implementing the investment objectives and strategies of the Fund, supervising the subadvisers and providing fund-level administrative services in connection with the Fund’s operations. As compensation for its services under the investment management agreement, Funds Management is entitled to receive a management fee at the following annual rate based on the Fund’s average daily net assets:
| Average daily net assets | Management fee | |||
First $500 million | 0.850 | % | ||
Next $500 million | 0.800 | |||
Next $1 billion | 0.750 | |||
Next $2 billion | 0.725 | |||
Next $1 billion | 0.700 | |||
Next $5 billion | 0.690 | |||
Over $10 billion | 0.680 | |||
For the year ended October 31, 2019, the management fee was equivalent to an annual rate of 0.85% of the Fund’s average daily net assets.
Funds Management has retained the services of certain subadvisers to provide daily portfolio management to the Fund. The fee for subadvisory services is borne by Funds Management. Artisan Partners Limited Partnership, LSV Asset Management, and Wells Capital Management Incorporated (“WellsCap”), an affiliate of Funds Management and an indirect wholly owned subsidiary of Wells Fargo, are the subadvisers to the Fund and are each entitled to receive a fee from Funds Management which is calculated based on the average daily net assets of the Fund. Artisan Partners Limited Partnership and LSV Asset Management are not affiliates of Funds Management.
| Annual subadvisory fee | ||||||||
| starting at | declining to | |||||||
Artisan Partners Limited Partnership | 0.80 | % | 0.50 | % | ||||
LSV Asset Management | 0.35 | 0.30 | ||||||
WellsCap | 0.45 | 0.40 | ||||||
Administration fees
Under a class-level administration agreement, Funds Management provides class-level administrative services to the Fund, which includes paying fees and expenses for services provided by the transfer agent, sub-transfer agents, omnibus account servicers and record-keepers. As compensation for its services under the class-level administration agreement, Funds Management receives an annual fee which is calculated based on the average daily net assets of each class as follows:
| Class-level administration fee | ||||
Class A, Class C | 0.21 | % | ||
Class R6 | 0.03 | |||
Administrator Class, Institutional Class | 0.13 | |||
32 | Wells Fargo Diversified International Fund
Table of Contents
Notes to financial statements
Waivers and/or expense reimbursements
Funds Management has contractually waived and/or reimbursed management and administration fees to the extent necessary to maintain certain net operating expense ratios for the Fund. When each class of the Fund has exceeded its expense cap, Funds Management has waived fees and/or reimbursed expenses from fund-level expenses on a proportionate basis and then from class specific expenses. When only certain classes exceed their expense caps, waivers and/or reimbursements are applied against class specific expenses before fund-level expenses. Funds Management has committed through February 29, 2020 to waive fees and/or reimburse expenses to the extent necessary to cap the Fund’s expenses at 1.35% for Class A shares, 2.10% for Class C shares, 0.89% for Class R6 shares, 1.25% for Administrator Class shares, and 0.99% for Institutional Class shares. Prior to or after the commitment expiration date, the cap may be increased or the commitment to maintain the cap may be terminated only with the approval of the Board of Trustees.
Distribution fee
The Trust has adopted a distribution plan for Class C shares of the Fund pursuant to Rule 12b-1 under the 1940 Act. A distribution fee is charged to Class C shares and paid to Wells Fargo Funds Distributor, LLC (“Funds Distributor”), the principal underwriter, at an annual rate of 0.75% of the average daily net assets of Class C shares.
In addition, Funds Distributor is entitled to receive the front-end sales charge from the purchase of Class A shares and a contingent deferred sales charge on the redemption of certain Class A shares. Funds Distributor is also entitled to receive the contingent deferred sales charges from redemptions of Class C shares. For the year ended October 31, 2019, Funds Distributor received $321 from the sale of Class A shares. No contingent deferred sales charges were incurred by Class A and Class C shares for the year ended October 31, 2019.
Shareholder servicing fees
The Trust has entered into contracts with one or more shareholder servicing agents, whereby Class A, Class C, and Administrator Class of the Fund are charged a fee at an annual rate of 0.25% of the average daily net assets of each respective class. A portion of these total shareholder servicing fees were paid to affiliates of Wells Fargo.
Interfund transactions
The Fund may purchase or sell portfolio investment securities to certain other Wells Fargo affiliates pursuant to Rule 17a-7 under the 1940 Act and under procedures adopted by the Board of Trustees. The procedures have been designed to ensure that these interfund transactions, which do not incur broker commissions, are effected at current market prices.
5. INVESTMENT PORTFOLIO TRANSACTIONS
Purchases and sales of investments, excluding U.S. government obligations (if any) and short-term securities, for the year ended October 31, 2019 were $26,839,536 and $35,250,118, respectively.
6. SECURITIES LENDING TRANSACTIONS
The Fund lends its securities through an unaffiliated securities lending agent and receives collateral in the form of cash or securities with a value at least equal to the value of the securities on loan. The value of the loaned securities is determined at the close of each business day and any increases or decreases in the required collateral are exchanged between the Fund and the counterparty on the next business day. Cash collateral received is invested in the Securities Lending Fund which seeks to provide a positive return compared to the daily Fed Funds Open Rate by investing in high-quality, U.S. dollar-denominated short-term money market instruments and is exempt from registration under Section 3(c)(7) of the 1940 Act. Securities Lending Fund is managed by Funds Management and is subadvised by WellsCap. Funds Management receives an advisory fee starting at 0.05% and declining to 0.01% as the average daily net assets of the Securities Lending Fund increase. All of the fees received by Funds Management are paid to WellsCap for its services as subadviser.
In the event of counterparty default or the failure of a borrower to return a loaned security, the Fund has the right to use the collateral to offset any losses incurred. As of October 31, 2019, the Fund had securities lending transactions with the following counterparties which are subject to offset:
| Counterparty | Value of securities on loan | Collateral received1 | Net amount | |||||||||
JPMorgan Securities LLC | $ | 1,031,149 | $ | (1,031,149 | ) | $ | 0 | |||||
Morgan Stanley & Co. LLC | 288,992 | (288,992 | ) | 0 | ||||||||
Citigroup Global Markets Inc. | 67,615 | (67,615 | ) | 0 | ||||||||
| 1 | Collateral received within this table is limited to the collateral for the net transaction with the counterparty. |
Wells Fargo Diversified International Fund | 33
Table of Contents
Notes to financial statements
7. DERIVATIVE TRANSACTIONS
During the year ended October 31, 2109, the Fund entered into forward foreign currency contracts for economic hedging purposes. The Fund had average contract amounts of $305,194 and $4,049,054 in forward foreign currency contracts to buy and forward foreign currency contracts to sell, respectively, during the year ended October 31, 2019.
The fair value, realized gains or losses and change in unrealized gains or losses, if any, on derivative instruments are reflected in the corresponding financial statement captions.
For certain types of derivative transactions, the Fund has entered into International Swaps and Derivatives Association, Inc. master agreements (“ISDA Master Agreements”) or similar agreements with approved counterparties. The ISDA Master Agreements or similar agreements may have requirements to deliver/deposit securities or cash to/with an exchange or broker-dealer as collateral and allows the Fund to offset, with each counterparty, certain derivative financial instrument’s assets and/or liabilities with collateral held or pledged. Collateral requirements differ by type of derivative. Collateral or margin requirements are set by the broker or exchange clearinghouse for exchange traded derivatives while collateral terms are contract specific for over-the-counter traded derivatives. Cash collateral that has been pledged to cover obligations of the Fund under ISDA Master Agreements or similar agreements, if any, are reported separately in the Statement of Assets and Liabilities. Securities pledged as collateral, if any, are noted in the Portfolio of Investments. With respect to balance sheet offsetting, absent an event of default by the counterparty or a termination of the agreement, the reported amounts of financial assets and financial liabilities in the Statement of Assets and Liabilities are not offset across transactions between the Fund and the applicable counterparty. A reconciliation of the gross amounts on the Statement of Assets and Liabilities to the net amounts by counterparty, including any collateral exposure, for OTC derivatives is as follows:
| Counterparty | Gross amounts of liabilities in the Statement of Assets and Liabilities | Amounts subject to netting agreements | Collateral pledged | Net amount of liabilities | ||||||||||||
Credit Suisse | $ | 4,225 | $ | 0 | $ | 0 | $ | 4,225 | ||||||||
Morgan Stanley | 108,147 | 0 | 0 | 108,147 | ||||||||||||
8. BANK BORROWINGS
The Trust (excluding the money market funds), Wells Fargo Master Trust and Wells Fargo Variable Trust are parties to a $280,000,000 revolving credit agreement whereby the Fund is permitted to use bank borrowings for temporary or emergency purposes, such as to fund shareholder redemption requests. Interest under the credit agreement is charged to the Fund based on a borrowing rate equal to the higher of the Federal Funds rate in effect on that day plus 1.25% or the overnight LIBOR rate in effect on that day plus 1.25%. In addition, an annual commitment fee equal to 0.25% of the unused balance is allocated to each participating fund.
For the year ended October 31, 2019, there were no borrowings by the Fund under the agreement.
9. DISTRIBUTIONS TO SHAREHOLDERS
The tax character of distributions paid was $2,254,949 and $3,149,016 of ordinary income for the years ended October 31, 2019 and October 31, 2018, respectively.
As of October 31, 2019, the components of distributable earnings on a tax basis were as follows:
Undistributed ordinary income | Unrealized gains | Capital loss carryforward | ||
| $2,081,516 | $11,324,079 | $(7,024,446) | ||
10. CONCENTRATION RISK
Concentration risks result from exposure to a limited number of sectors. As of the end of the period, the Fund invests a concentration of its portfolio in the financials sector. A fund that invests a substantial portion of its assets in any sector may be more affected by changes in that sector than would be a fund whose investments are not heavily weighted in any sector.
34 | Wells Fargo Diversified International Fund
Table of Contents
Notes to financial statements
11. INDEMNIFICATION
Under the Trust’s organizational documents, the officers and Trustees have been granted certain indemnification rights against certain liabilities that may arise out of performance of their duties to the Trust. At a meeting held on November 21-22, 2019, the Board of Trustees of the Fund approved a proposal to authorize the Fund to enter into a separate agreement with each Trustee that would convert indemnification rights currently existing under the Fund’s organizational documents into contractual rights that could not be changed in the future without the consent of the Trustee. Additionally, in the normal course of business, the Trust may enter into contracts with service providers that contain a variety of indemnification clauses. The Trust’s maximum exposure under these arrangements is dependent on future claims that may be made against the Fund and, therefore, cannot be estimated.
12. NEW ACCOUNTING PRONOUNCEMENT
In August 2018, FASB issued Accounting Standards Update (“ASU”) No. 2018-13, Fair Value Measurement (Topic 820)Disclosure Framework—Changes to the Disclosure Requirements for Fair Value Measurement. ASU 2018-13 updates the disclosure requirements for fair value measurements by modifying or removing certain disclosures and adding certain new disclosures. The amendments are effective for fiscal years, and interim periods within those fiscal years, beginning after December 15, 2019. Early adoption is permitted. Management has adopted the removal and modification of disclosures early, as permitted, and will adopt the additional new disclosures at the effective date.
Wells Fargo Diversified International Fund | 35
Table of Contents
Report of independent registered public accounting firm
TO THE SHAREHOLDERS OF THE FUND AND BOARD OF TRUSTEES OF WELLS FARGO FUNDS TRUST:
Opinion on the Financial Statements
We have audited the accompanying statement of assets and liabilities of Wells Fargo Diversified International Fund (the Fund), one of the funds constituting Wells Fargo Funds Trust, including the portfolio of investments, as of October 31, 2019, the related statement of operations for the year then ended, the statements of changes in net assets for each of the years in the two-year period then ended, and the related notes (collectively, the financial statements) and the financial highlights for each of the years or periods in the five-year period then ended. In our opinion, the financial statements and financial highlights present fairly, in all material respects, the financial position of the Fund as of October 31, 2019, the results of its operations for the year then ended, the changes in its net assets for each of the years in the two-year period then ended, and the financial highlights for each of the years or periods in the five-year period then ended, in conformity with U.S. generally accepted accounting principles.
Basis for Opinion
These financial statements and financial highlights are the responsibility of the Fund’s management. Our responsibility is to express an opinion on these financial statements and financial highlights based on our audits. We are a public accounting firm registered with the Public Company Accounting Oversight Board (United States) (PCAOB) and are required to be independent with respect to the Fund in accordance with the U.S. federal securities laws and the applicable rules and regulations of the Securities and Exchange Commission and the PCAOB.
We conducted our audits in accordance with the standards of the PCAOB. Those standards require that we plan and perform the audit to obtain reasonable assurance about whether the financial statements and financial highlights are free of material misstatement, whether due to error or fraud. Our audits included performing procedures to assess the risks of material misstatement of the financial statements and financial highlights, whether due to error or fraud, and performing procedures that respond to those risks. Such procedures included examining, on a test basis, evidence regarding the amounts and disclosures in the financial statements and financial highlights. Such procedures also included confirmation of securities owned as of October 31, 2019, by correspondence with the custodian, transfer agent and brokers, or by other appropriate auditing procedures. Our audits also included evaluating the accounting principles used and significant estimates made by management, as well as evaluating the overall presentation of the financial statements and financial highlights. We believe that our audits provide a reasonable basis for our opinion.

We have not been able to determine the specific year that we began serving as the auditor of one or more Wells Fargo Funds investment companies; however we are aware that we have served as the auditor of one or more Wells Fargo Funds investment companies since at least 1955.
Boston, Massachusetts
December 20, 2019
36 | Wells Fargo Diversified International Fund
Table of Contents
TAX INFORMATION
Pursuant to Section 854 of the Internal Revenue Code, $2,254,949 of income dividends paid during the fiscal year ended October 31, 2019 has been designated as qualified dividend income (QDI).
For the fiscal year ended October 31, 2019, $29,314 has been designated as interest-related dividends for nonresident alien shareholders pursuant to Section 871 of the Internal Revenue Code.
Pursuant to Section 853 of the Internal Revenue Code, the Fund expects to designate amounts as foreign taxes paid for the fiscal year ended October 31, 2019. Additional details will be available in the semiannual report.
PROXY VOTING INFORMATION
A description of the policies and procedures used to determine how to vote proxies relating to portfolio securities is available, upon request, by calling1-800-222-8222, visiting our website atwfam.com, or visiting the SEC website at sec.gov. Information regarding how the proxies related to portfolio securities were voted during the most recent 12-month period ended June 30 is available on the website atwfam.com or by visiting the SEC website at sec.gov.
QUARTERLY PORTFOLIO HOLDINGS INFORMATION
The Fund files its complete schedule of portfolio holdings with the SEC for the first and third quarters of each fiscal year on Form N-Q or Form N-PORT, which is available by visiting the SEC website at sec.gov. Those forms may be reviewed and copied at the SEC’s Public Reference Room in Washington, DC. Information on the operation of the Public Reference Room may be obtained by calling 1-800-SEC-0330.
Wells Fargo Diversified International Fund | 37
Table of Contents
Other information (unaudited)
BOARD OF TRUSTEES AND OFFICERS
Each of the Trustees and Officers1 listed in the table below acts in identical capacities for each fund in the Wells Fargo family of funds, which consists of 150 mutual funds comprising the Wells Fargo Funds Trust, Wells Fargo Variable Trust, Wells Fargo Master Trust and four closed-end funds (collectively the “Fund Complex”). This table should be read in conjunction with the Prospectus and the Statement of Additional Information2. The mailing address of each Trustee and Officer is 525 Market Street, 12th Floor, San Francisco, CA 94105. Each Trustee and Officer serves an indefinite term, however, each Trustee serves such term until reaching the mandatory retirement age established by the Trustees.
Independent Trustees
Name and year of birth | Position held and length of service* | Principal occupations during past five years or longer | Current other public company or investment company directorships | |||
William R. Ebsworth (Born 1957) | Trustee, since 2015 | Retired. From 1984 to 2013, equities analyst, portfolio manager, research director and chief investment officer at Fidelity Management and Research Company in Boston, Tokyo, and Hong Kong, and retired in 2013 as Chief Investment Officer of Fidelity Strategic Advisers, Inc. where he led a team of investment professionals managing client assets. Prior thereto, Board member of Hong Kong Securities Clearing Co., Hong Kong Options Clearing Corp., the Thailand International Fund, Ltd., Fidelity Investments Life Insurance Company, and Empire Fidelity Investments Life Insurance Company. Audit Committee Chair and Investment Committee Chair of the Vincent Memorial Hospital Endowment (non-profit organization). Mr. Ebsworth is a CFA® charterholder. | N/A | |||
Jane A. Freeman (Born 1953) | Trustee, since 2015; Chair Liaison, since 2018 | Retired. From 2012 to 2014 and 1999 to 2008, Chief Financial Officer of Scientific Learning Corporation. From 2008 to 2012, Ms. Freeman provided consulting services related to strategic business projects. Prior to 1999, Portfolio Manager at Rockefeller & Co. and Scudder, Stevens & Clark. Board member of the Harding Loevner Funds from 1996 to 2014, serving as both Lead Independent Director and chair of the Audit Committee. Board member of the Russell Exchange Traded Funds Trust from 2011 to 2012 and the chair of the Audit Committee. Ms. Freeman is a Board Member of The Ruth Bancroft Garden (non-profit organization). She is also an inactive Chartered Financial Analyst. | N/A | |||
Isaiah Harris, Jr. (Born 1952) | Trustee, since 2009; Audit Committee Chairman, since 2019 | Retired. Chairman of the Board of CIGNA Corporation since 2009, and Director since 2005. From 2003 to 2011, Director of Deluxe Corporation. Prior thereto, President and CEO of BellSouth Advertising and Publishing Corp. from 2005 to 2007, President and CEO of BellSouth Enterprises from 2004 to 2005 and President of BellSouth Consumer Services from 2000 to 2003. Emeritus member of the Iowa State University Foundation Board of Governors. Emeritus Member of the Advisory Board of Iowa State University School of Business. Advisory Board Member, Palm Harbor Academy (private school). Advisory Board Member, Child Evangelism Fellowship (non-profit). Mr. Harris is a certified public accountant (inactive status). | CIGNA Corporation | |||
Judith M. Johnson (Born 1949) | Trustee, since 2008; Audit Committee Chairman, from 2009 to 2018 | Retired. Prior thereto, Chief Executive Officer and Chief Investment Officer of Minneapolis Employees Retirement Fund from 1996 to 2008. Ms. Johnson is an attorney, certified public accountant and a certified managerial accountant. | N/A | |||
38 | Wells Fargo Diversified International Fund
Table of Contents
Other information (unaudited)
Name and year of birth | Position held and length of service* | Principal occupations during past five years or longer | Current other public company or investment company directorships | |||
David F. Larcker (Born 1950) | Trustee, since 2009 | James Irvin Miller Professor of Accounting at the Graduate School of Business, Stanford University, Director of the Corporate Governance Research Initiative and Senior Faculty of The Rock Center for Corporate Governance since 2006. From 2005 to 2008, Professor of Accounting at the Graduate School of Business, Stanford University. Prior thereto, Ernst & Young Professor of Accounting at The Wharton School, University of Pennsylvania from 1985 to 2005. | N/A | |||
Olivia S. Mitchell (Born 1953) | Trustee, since 2006; Nominating and Governance Committee Chair, since 2018 | International Foundation of Employee Benefit Plans Professor, Wharton School of the University of Pennsylvania since 1993. Director of Wharton’s Pension Research Council and Boettner Center on Pensions & Retirement Research, and Research Associate at the National Bureau of Economic Research. Previously, Cornell University Professor from 1978 to 1993. | N/A | |||
Timothy J. Penny (Born 1951) | Trustee, since 1996; Chairman, since 2018 | President and Chief Executive Officer of Southern Minnesota Initiative Foundation, a non-profit organization, since 2007. Member of the Board of Trustees of NorthStar Education Finance, Inc., a non-profit organization, since 2007. | N/A | |||
James G. Polisson (Born 1959) | Trustee, since 2018 | Retired. Chief Marketing Officer, Source (ETF) UK Services, Ltd, from 2015 to 2017. From 2012 to 2015, Principal of The Polisson Group, LLC, a management consulting, corporate advisory and principal investing company. Chief Executive Officer and Managing Director at Russell Investments, Global Exchange Traded Funds from 2010 to 2012. Managing Director of Barclays Global Investors from 1998 to 2010 and Global Chief Marketing Officer for iShares and Barclays Global Investors from 2000 to 2010. Trustee of the San Francisco Mechanics’ Institute, a non-profit organization, from 2013 to 2015. Board member of the Russell Exchange Traded Fund Trust from 2011 to 2012. Director of Barclays Global Investors Holdings Deutschland GmbH from 2006 to 2009. Mr. Polisson is an attorney and has a retired status with the Massachusetts and District of Columbia Bar Associations. | N/A | |||
Pamela Wheelock3 (Born 1959) | Trustee, since January 2020; previously Trustee from January 2018 to July 2019 | Board member of the Destination Medical Center Economic Development Agency, Rochester, Minnesota since 2019. Acting Commissioner, Minnesota Department of Human Services, July 2019 through September 2019. Human Services Manager (part-time), Minnesota Department of Human Services, October 2019 through December 2019. Chief Operating Officer, Twin Cities Habitat for Humanity from 2017 to 2019. Vice President of University Services, University of Minnesota from 2012 to 2016. Prior thereto, on the Board of Directors, Governance Committee and Finance Committee for the Minnesota Philanthropy Partners (Saint Paul Foundation) from 2012 to 2018, Interim Chief Executive Officer of Blue Cross Blue Shield of Minnesota from 2011 to 2012, Chairman of the Board from 2009 to 2012 and Board Director from 2003 to 2015. Vice President, Leadership and Community Engagement, Bush Foundation, Saint Paul, Minnesota (a private foundation) from 2009 to 2011. Executive Vice President and Chief Financial Officer, Minnesota Sports and Entertainment from 2004 to 2009 and Senior Vice President from 2002 to 2004. Executive Vice President of the Minnesota Wild Foundation from 2004 to 2008. Commissioner of Finance, State of Minnesota, from 1999 to 2002. Currently Board Chair of the Minnesota Wild Foundation since 2010. | N/A | |||
| * | Length of service dates reflect the Trustee’s commencement of service with the Trust’s predecessor entities, where applicable. |
Wells Fargo Diversified International Fund | 39
Table of Contents
Other information (unaudited)
Officers
Name and year of birth | Position held and length of service | Principal occupations during past five years or longer | ||
Andrew Owen (Born 1960) | President, since 2017 | Executive Vice President of Wells Fargo & Company and Head of Affiliated Managers, Wells Fargo Asset Management, since 2014. In addition, Mr. Owen is currently President, Chief Executive Officer and Director of Wells Fargo Funds Management, LLC since 2017. Prior thereto, Executive Vice President responsible for marketing, investments and product development for Wells Fargo Funds Management, LLC, from 2009 to 2014. | ||
Jeremy DePalma1 (Born 1974) | Treasurer, since 2012 | Senior Vice President of Wells Fargo Funds Management, LLC since 2009. Senior Vice President of Evergreen Investment Management Company, LLC from 2008 to 2010 and head of the Fund Reporting and Control Team within Fund Administration from 2005 to 2010. | ||
Michelle Rhee4 (Born 1966) | Chief Legal Officer, since 2019 | Secretary of Wells Fargo Funds Management, LLC, Chief Legal Counsel of Wells Fargo Asset Management and Assistant General Counsel of Wells Fargo Bank, N.A. since 2018. Associate General Counsel and Managing Director of Bank of America Corporation from 2004 to 2018. | ||
| Catherine Kennedy5 (Born 1969) | Secretary, since 2019 | Vice President of Wells Fargo Funds Management, LLC and Senior Counsel of the Wells Fargo Legal Department since 2010. Vice President and Senior Counsel of Evergreen Investment Management Company, LLC from 1998 to 2010. | ||
| Michael H. Whitaker (Born 1967) | Chief Compliance Officer, since 2016 | Chief Compliance Officer of Wells Fargo Asset Management since 2016. Senior Vice President and Chief Compliance Officer for Fidelity Investments from 2007 to 2016. | ||
David Berardi (Born 1975) | Assistant Treasurer, since 2009 | Vice President of Wells Fargo Funds Management, LLC since 2009. Vice President of Evergreen Investment Management Company, LLC from 2008 to 2010. Manager of Fund Reporting and Control for Evergreen Investment Management Company, LLC from 2004 to 2010. | ||
| 1 | Jeremy DePalma acts as Treasurer of 86 funds and Assistant Treasurer of 64 funds in the Fund Complex. |
| 2 | The Statement of Additional Information includes additional information about the Trustees and is available, without charge, upon request, by calling1-800-222-8222 or by visiting the website atwfam.com. |
| 3 | Ms. Wheelock was re-appointed to the Board effective January 1, 2020. |
| 4 | Michelle Rhee became Chief Legal Officer effective October 22, 2019. |
| 5 | Catherine Kennedy became Secretary effective October 22, 2019. |
40 | Wells Fargo Diversified International Fund
Table of Contents
Other information (unaudited)
BOARD CONSIDERATION OF INVESTMENT MANAGEMENT AND SUB-ADVISORY AGREEMENTS:
Wells Fargo Diversified International Fund
Under the Investment Company Act of 1940 (the “1940 Act”), the Board of Trustees (the “Board”) of Wells Fargo Funds Trust (the “Trust”) must determine annually whether to approve the continuation of the Trust’s investment management and sub-advisory agreements. In this regard, at an in-person meeting held on May 21-22, 2019 (the “Meeting”), the Board, all the members of which have no direct or indirect interest in the investment management and sub-advisory agreements and are not “interested persons” of the Trust, as defined in the 1940 Act (the “Independent Trustees”), reviewed and approved for Wells Fargo Diversified International Fund (the “Fund”): (i) an investment management agreement (the “Management Agreement”) with Wells Fargo Funds Management, LLC (“Funds Management”); (ii) an investment sub-advisory agreement with Wells Capital Management Incorporated (“WellsCap”), an affiliate of Funds Management; (iii) an investment sub-advisory agreement with Artisan Partners Limited Partnership (“Artisan”); and (iv) an investment sub-advisory agreement with LSV Asset Management (“LSV”). The sub-advisory agreements with WellsCap, Artisan and LSV (the “Sub-Advisers”) are collectively referred to as the “Sub-Advisory Agreements,” and the Management Agreement and the Sub-Advisory Agreements are collectively referred to as the “Advisory Agreements.”
At the Meeting, the Board considered the factors and reached the conclusions described below relating to the selection of Funds Management and the Sub-Advisers and the approval of the Advisory Agreements. Prior to the Meeting, including at an in-person meeting in April 2019, the Trustees conferred extensively among themselves and with representatives of Funds Management about these matters. Also, the Board has adopted a team-based approach, with each team consisting of a sub-set of Trustees, to assist the full Board in the discharge of its duties in reviewing investment performance and other matters throughout the year. The Independent Trustees were assisted in their evaluation of the Advisory Agreements by independent legal counsel, from whom they received separate legal advice and with whom they met separately.
In providing information to the Board, Funds Management and the Sub-Advisers were guided by a detailed set of requests for information submitted to them by independent legal counsel on behalf of the Independent Trustees at the start of the Board’s annual contract renewal process earlier in 2019. In considering and approving the Advisory Agreements, the Trustees considered the information they believed relevant, including but not limited to the information discussed below. The Board considered not only the specific information presented in connection with the Meeting, but also the knowledge gained over time through interaction with Funds Management and the Sub-Advisers about various topics. In this regard, the Board reviewed reports of Funds Management at each of its quarterly meetings, which included, among other things, portfolio reviews and investment performance reports. In addition, the Board and the teams mentioned above confer with portfolio managers at various times throughout the year. The Board did not identify any particular information or consideration that was all-important or controlling, and each individual Trustee may have attributed different weights to various factors.
After its deliberations, the Board unanimously approved the continuation of the Advisory Agreements for a one-year term and determined that the compensation payable to Funds Management and the Sub-Advisers under each of the Advisory Agreements was reasonable. The Board considered the approval of the Advisory Agreements for the Fund as part of its consideration of agreements for funds across the complex, but its approvals were made on a fund-by-fund basis. The following summarizes a number of important, but not necessarily all, factors considered by the Board in support of its approvals.
Nature, extent and quality of services
The Board received and considered various information regarding the nature, extent and quality of services provided to the Fund by Funds Management and the Sub-Advisers under the Advisory Agreements. This information included a description of the investment advisory services and Fund-level administrative services covered by the Management Agreement, as well as, among other things, a summary of the background and experience of senior management of Wells Fargo Asset Management (“WFAM”), of which Funds Management and WellsCap are a part, a summary of investments made in the business of WFAM, a summary of certain organizational and personnel changes involving Funds Management, and a description of Funds Management’s and the Sub-Advisers’ business continuity planning programs and of their approaches to data privacy and cybersecurity. The Board received and reviewed information about Funds Management’s role as administrator of the Fund’s liquidity risk management program. The Board also considered the qualifications, background, tenure and responsibilities of each of the portfolio managers primarily responsible for the day-to-day portfolio management of the Fund.
The Board evaluated the ability of Funds Management and the Sub-Advisers to attract and retain qualified investment professionals, including research, advisory and supervisory personnel. The Board further considered the compliance programs and compliance records of Funds Management and the Sub-Advisers. In addition, the Board took into account the full range of services provided to the Fund by Funds Management and its affiliates.
Wells Fargo Diversified International Fund | 41
Table of Contents
Other information (unaudited)
Fund investment performance and expenses
The Board considered the investment performance results for the Fund over various time periods ended December 31, 2018. The Board considered these results in comparison to the investment performance of funds in a universe that was determined by Broadridge Inc. (“Broadridge”) to be similar to the Fund (the “Universe”), and in comparison to the Fund’s benchmark index and to other comparative data. Broadridge is an independent provider of investment company data. The Board received a description of the methodology used by Broadridge to select the mutual funds in the performance Universe. The Board noted that the investment performance of the Fund (Administrator Class) was higher than or in range of the average investment performance of the Universe for all periods under review. The Board also noted that the investment performance of the Fund was in range of its benchmark index, the MSCI EAFE Index (Net), for the five- and ten-year periods under review, but lower than its benchmark index for the one- and three-year periods under review.
The Board received information concerning, and discussed factors contributing to, the underperformance of the Fund relative to the Universe and benchmark for the periods identified above. The Board took note of the explanations for the relative underperformance during these periods, including with respect to investment decisions and market factors that affected the Fund’s investment performance.
The Board also received and considered information regarding the Fund’s net operating expense ratios and their various components, including actual management fees, custodian and other non-management fees, and Rule 12b-1 and non-Rule 12b-1 shareholder service fees. The Board considered these ratios in comparison to the median ratios of funds in class-specific expense groups that were determined by Broadridge to be similar to the Fund (the “Groups”). The Board received a description of the methodology used by Broadridge to select the mutual funds in the expense Groups and an explanation of how funds comprising expense groups and their expense ratios may vary from year-to-year. Based on the Broadridge reports, the Board noted that the net operating expense ratios of the Fund’s Class A, Administrator Class and Institutional Class shares were equal to or in range of the median net operating expense ratios of the expense Groups for such classes, while the net operating expense ratio of the Fund’s Class R6 shares was higher than the median net operating expense ratio of its respective expense Group.
The Board took into account the Fund’s investment performance and expense information provided to it among the factors considered in deciding to re-approve the Advisory Agreements.
Investment management and sub-advisory fee rates
The Board reviewed and considered the contractual fee rates payable by the Fund to Funds Management under the Management Agreement, as well as the contractual fee rates payable by the Fund to Funds Management for class-level administrative services under a Class-Level Administration Agreement, which include, among other things, class-level transfer agency and sub-transfer agency costs (collectively, the “Management Rates”). The Board also reviewed and considered the contractual investment sub-advisory fee rates that are payable by Funds Management to each of the Sub-Advisers for investment sub-advisory services.
Among other information reviewed by the Board was a comparison of the Fund’s Management Rates with the average contractual investment management fee rates of funds in the expense Groups at a common asset level as well as transfer agency costs of the other funds in the expense Groups. The Board noted that the Management Rates of the Fund were higher than the sum of these average rates for the Fund’s expense Groups for all share classes. However, the Board noted that the net operating expense ratios of the Fund were equal to or in range of the median net operating expense ratios of the expense Groups for all share classes, except Class R6.
The Board also received and considered information about the portion of the total management fee that was retained by Funds Management after payment of the fee to the Sub-Advisers for sub-advisory services. The Board considered this amount in comparison to the median amount retained by advisers to funds in a sub-advised expense universe that was determined by Broadridge to be similar to the Fund. In assessing the reasonableness of this amount, the Board received and evaluated information about the nature and extent of responsibilities retained and risks assumed by Funds Management and not delegated to or assumed by the Sub-Advisers, and about Funds Management’s on-going oversight services. Given the affiliation between Funds Management and WellsCap, the Board ascribed limited relevance to the allocation of fees between them. The Board also considered that the sub-advisory fees paid to Artisan and LSV had been negotiated by Funds Management on an arm’s-length basis.
The Board also received and considered information about the nature and extent of services offered and fee rates charged by Funds Management and the Sub-Advisers to other types of clients with investment strategies similar to those of the Fund. In this regard, the Board received information about the significantly greater scope of services, and compliance, reporting and other legal burdens and risks of managing proprietary mutual funds compared with those associated with managing assets of other types of clients, including third-party sub-advised fund clients and non-mutual fund clients, such as collective funds or institutional separate accounts.
42 | Wells Fargo Diversified International Fund
Table of Contents
Other information (unaudited)
Based on its consideration of the factors and information it deemed relevant, including those described here, the Board determined that the compensation payable to Funds Management under the Management Agreement and to the Sub-Advisers under the Sub-Advisory Agreements was reasonable.
Profitability
The Board received and considered information concerning the profitability of Funds Management, as well as the profitability of both WFAM and Wells Fargo & Co. (“Wells Fargo”) from providing services to the fund family as a whole. The Board noted that WellsCap’s profitability information with respect to providing services to the Fund and other funds in the family was subsumed in the WFAM and Wells Fargo profitability analysis. The Board did not consider profitability with respect to Artisan or LSV, as the sub-advisory fees paid to Artisan and LSV had been negotiated by Funds Management on an arm’s-length basis.
Funds Management reported on the methodologies and estimates used in calculating profitability, including a description of the methodology used to allocate certain expenses. Among other things, the Board noted that the levels of profitability reported on a fund-by-fund basis varied widely, depending on factors such as the size, type and age of fund. Based on its review, the Board did not deem the profits reported by Funds Management, WFAM or Wells Fargo from services provided to the Fund to be at a level that would prevent it from approving the continuation of the Advisory Agreements.
Economies of scale
The Board received and considered information about the potential for Funds Management to experience economies of scale in the provision of management services to the Fund, the difficulties of calculating economies of scale at an individual fund level, and the extent to which potential scale benefits are shared with shareholders. The Board noted the existence of breakpoints in the Fund’s management fee structure, which operate generally to reduce the Fund’s expense ratios as the Fund grows in size. The Board considered that in addition to management fee breakpoints, Funds Management shares potential economies of scale from its management business in a variety of ways, including through fee waiver and expense reimbursement arrangements, services that benefit shareholders, competitive management fee rates set at the outset without regard to breakpoints, and investments in the business intended to enhance services available to shareholders.
The Board concluded that Funds Management’s arrangements with respect to the Fund, including contractual breakpoints, constituted a reasonable approach to sharing potential economies of scale with the Fund and its shareholders.
Other benefits to Funds Management and the Sub-Advisers
The Board received and considered information regarding potential “fall-out” or ancillary benefits received by Funds Management and its affiliates including WellsCap, and Artisan and LSV, as a result of their relationships with the Fund. Ancillary benefits could include, among others, benefits directly attributable to other relationships with the Fund and benefits potentially derived from an increase in Funds Management’s and the Sub-Advisers’ business as a result of their relationships with the Fund. The Board noted that various affiliates of Funds Management may receive distribution-related fees, shareholder servicing payments and sub-transfer agency fees in respect of shares sold or held through them and services provided.
The Board also reviewed information about soft dollar credits earned and utilized by WellsCap and Artisan, fees earned by Funds Management and WellsCap from managing a private investment vehicle for the fund family’s securities lending collateral, and commissions earned by an affiliated broker from portfolio transactions.
Based on its consideration of the factors and information it deemed relevant, including those described here, the Board did not find that any ancillary benefits received by Funds Management and its affiliates, including WellsCap, or either Artisan or LSV were unreasonable.
Conclusion
At the Meeting, after considering the above-described factors and based on its deliberations and its evaluation of the information described above, the Board unanimously approved the continuation of the Advisory Agreements for a one-year term and determined that the compensation payable to Funds Management and the Sub-Advisers under each of the Advisory Agreements was reasonable.
Wells Fargo Diversified International Fund | 43
Table of Contents
This page is intentionally left blank.
Table of Contents
For more information
More information about Wells Fargo Funds is available free upon request. To obtain literature, please write, visit the Fund’s website, or call:
Wells Fargo Funds
P.O. Box 219967
Kansas City, MO 64121-9967
Website:wfam.com
Individual investors:1-800-222-8222
Retail investment professionals:1-888-877-9275
Institutional investment professionals:1-866-765-0778

This report and the financial statements contained herein are submitted for the general information of the shareholders of the Fund. If this report is used for promotional purposes, distribution of the report must be accompanied or preceded by a current prospectus. Before investing, please consider the investment objectives, risks, charges, and expenses of the investment. For a current prospectus and, if available, a summary prospectus, containing this information, call1-800-222-8222 or visit the Fund’s website atwfam.com. Read the prospectus carefully before you invest or send money.
Wells Fargo Asset Management (WFAM) is the trade name for certain investment advisory/management firms owned by Wells Fargo & Company. These firms include but are not limited to Wells Capital Management Incorporated and Wells Fargo Funds Management, LLC. Certain products managed by WFAM entities are distributed by Wells Fargo Funds Distributor, LLC (a broker-dealer and Member FINRA).
This material is for general informational and educational purposes only and is NOT intended to provide investment advice or a recommendation of any kind—including a recommendation for any specific investment, strategy, or plan.
INVESTMENT PRODUCTS: NOT FDIC INSURED ◾ NO BANK GUARANTEE ◾ MAY LOSE VALUE
© 2019 Wells Fargo & Company. All rights reserved.
408244 12-19
A237/AR237 10-19
Table of Contents

Annual Report
October 31, 2019
Wells Fargo
International Equity Fund
Beginning on January 1, 2021, as permitted by new regulations adopted by the Securities and Exchange Commission, paper copies of the Wells Fargo Funds’ annual and semi-annual shareholder reports issued after this date will no longer be sent by mail, unless you specifically request paper copies of the reports. Instead, the reports will be made available on the Funds’ website, and you will be notified by mail each time a report is posted and provided with a website address to access the report.
If you already elected to receive shareholder reports electronically, you will not be affected by this change and you need not take any action. You may elect to receive shareholder reports and other communications from the Fund electronically at any time by contacting your financial intermediary (such as a broker-dealer or bank) or, if you are a direct investor, by calling1-800-222-8222 or by enrolling at wellsfargo.com/advantagedelivery.
You may elect to receive all future reports in paper free of charge. If you invest through a financial intermediary, you can contact your financial intermediary to request that you continue to receive paper copies of your shareholder reports; if you invest directly with the Fund, you can call 1-800-222-8222. Your election to receive reports in paper will apply to all Wells Fargo Funds held in your account with your financial intermediary or, if you are a direct investor, to all Wells Fargo Funds that you hold.
Table of Contents
|
Reduce clutter. Save trees. |
Sign up for electronic delivery of prospectuses and shareholder reports atwellsfargo.com/advantagedelivery |
The views expressed and any forward-looking statements are as of October 31, 2019, unless otherwise noted, and are those of the Fund managers and/or Wells Fargo Asset Management. Discussions of individual securities, or the markets generally, or any Wells Fargo Fund are not intended as individual recommendations. Future events or results may vary significantly from those expressed in any forward-looking statements. The views expressed are subject to change at any time in response to changing circumstances in the market. Wells Fargo Asset Management and the Fund disclaim any obligation to publicly update or revise any views expressed or forward-looking statements.
INVESTMENT PRODUCTS: NOT FDIC INSURED ◾ NO BANK GUARANTEE ◾ MAY LOSE VALUE
Wells Fargo International Equity Fund | 1
Table of Contents
Letter to shareholders (unaudited)

Andrew Owen
President
Wells Fargo Funds
Dear Shareholder:
We are pleased to offer you this annual report for the Wells Fargo International Equity Fund for the 12-month period that ended October 31, 2019. After the first few months of the period featured high volatility and yielded minimal returns, U.S. investors generally saw markets recover during the second half amid intensifying market volatility, global economic growth concerns, international trade stare downs, and simmering geopolitical tensions.
Overall, both fixed-income and equity investors enjoyed healthy returns despite market volatility. For the period, U.S. stocks, based on the S&P 500 Index,1 gained 14.33% and international stocks, as measured by the MSCI ACWI ex USA Index (Net),2 returned 11.27%. The MSCI EM Index (Net)3 gained 11.86%. Among fixed income investors, the Bloomberg Barclays U.S. Aggregate Bond Index4 added 11.51%, the Bloomberg Barclays Global Aggregate ex-USD Index5 added 7.84%, the Bloomberg Barclays Municipal Bond Index6 gained 9.42%, and the ICE BofAML U.S. High Yield Index7 added 8.32%.
Investors confronted unsettling events during the fourth quarter of 2018.
During the fourth quarter of 2018, investors grew concerned about the pace and sustainability of the global economic expansion. The U.S. Bureau of Economic Analysis reported third-quarter U.S. gross domestic product (GDP) was 3.4% on an annualized basis, which was down from the second-quarter rate. A partial U.S. government shutdown occurred, which extended into January 2019. Brexit efforts stalled, causing uncertainty for the eurozone. The value of the renminbi declined even as the People’s Bank of China cut reserve requirement ratios, accelerated infrastructure spending, and cut taxes in efforts to spur economic activity.
The combination of news in the U.S. and generally weak economic indicators outside of the U.S. caused investors to seek safe havens. December’s S&P 500 Index performance was the worst since 1931. Globally, fixed-income investments fared better than stocks during the last two months of the year. Even as indicators suggested growth was restrained, the U.S. Federal Reserve (Fed) increased the federal funds rate by 25 basis points (bps; 100 bps equal 1.00%) in December 2018 to a target range of between 2.25% and 2.50%. Many observers expressed concerns that higher rates could slow the economy further.
| 1 | The S&P 500 Index consists of 500 stocks chosen for market size, liquidity, and industry group representation. It is a market-value-weighted index with each stock’s weight in the index proportionate to its market value. You cannot invest directly in an index. |
| 2 | The Morgan Stanley Capital International (MSCI) All Country World Index (ACWI) ex USA Index (Net) is a free-float-adjusted market-capitalization-weighted index that is designed to measure the equity market performance of developed and emerging markets, excluding the United States. Source: MSCI. MSCI makes no express or implied warranties or representations and shall have no liability whatsoever with respect to any MSCI data contained herein. The MSCI data may not be further redistributed or used as a basis for other indices or any securities or financial products. This report is not approved, reviewed, or produced by MSCI. You cannot invest directly in an index. |
| 3 | The MSCI Emerging Markets (EM) Index (Net) is a free-float-adjusted market-capitalization-weighted index that is designed to measure the equity market performance of emerging markets. You cannot invest directly in an index. |
| 4 | The Bloomberg Barclays U.S. Aggregate Bond Index is a broad-based benchmark that measures the investment-grade, U.S. dollar-denominated, fixed-rate taxable bond market, including Treasuries, government-related and corporate securities, mortgage-backed securities (agency fixed-rate and hybrid adjustable-rate mortgage pass-throughs), asset-backed securities, and commercial mortgage-backed securities. You cannot invest directly in an index. |
| 5 | The Bloomberg Barclays Global Aggregate ex-USD Index is an unmanaged index that provides a broad-based measure of the global investment-grade fixed-income markets excluding the U.S. dollar-denominated debt market. You cannot invest directly in an index. |
| 6 | The Bloomberg Barclays Municipal Bond Index is an unmanaged index composed of long-term tax-exempt bonds with a minimum credit rating of Baa. You cannot invest directly in an index. |
| 7 | The ICE BofAML U.S. High Yield Index is a market-capitalization-weighted index of domestic and Yankee high-yield bonds. The index tracks the performance of high-yield securities traded in the U.S. bond market. You cannot invest directly in an index. Copyright 2019. ICE Data Indices, LLC. All rights reserved. |
2 | Wells Fargo International Equity Fund
Table of Contents
Letter to shareholders (unaudited)
The market climbs a wall of worry.
Investment returns early in 2019 appeared to reaffirm the adage that markets climb a wall of worry as the new year began. The S&P 500 Index gained 8.01% in January, the best monthly performance in 30 years. Returns for the MSCI ACWI ex USA Index (Net), the Bloomberg Barclays U.S. Aggregate Bond Index, and the Bloomberg Barclays Global Aggregate ex-USD Index also were positive.
In February 2019, signs of slowing global growth grew more ominous. The U.S. Bureau of Economic Analysis announced fourth-quarter 2018 GDP grew at an annualized 2.2% rate, down from the levels of the prior two quarters. In a February report, the Bank of England forecast the slowest growth since the financial crisis for 2019. China and the U.S. continued to wrangle over trade issues. By the end of the first quarter of 2019, more accommodative Fed sentiment and steady, if not spectacular, U.S. economic and business metrics encouraged domestic investors.
Early second-quarter 2019 enthusiasm among investors faded.
During April 2019, sustained low inflation, solid employment data, and first-quarter U.S. GDP grew at an annualized rate of 3.2% supported favorable sentiment. During May, markets tumbled on mixed investment signals. In the U.S., partisan wrangling ramped up as Democrats and Republicans set their sights on 2020 presidential politics. The U.K.’s Brexit disagreements caused Prime Minister Theresa May to resign. Boris Johnson succeeded her only to exacerbate uncertainty about Brexit’s resolution ahead of an October 2019 deadline. The European Commission downgraded the 2019 growth forecast to 1.2%. The U.S. increased tariffs on products from China, China responded, and then talks broke down. President Donald Trump threatened to turn his foreign policy tariff tool to Mexico over immigration issues.
Halfway through 2019, investors regrouped. Just as the investment horizon appeared to darken, sentiment turned and U.S. equity markets gained during June and July. The gains, primarily driven by geopolitical and monetary policy events, pushed equity markets to new highs. European Central Bank President Mario Draghi said that if the outlook doesn’t improve, the bank would cut rates or buy more assets to prop up inflation. President Trump backed off of tariff threats against Mexico and China. In the U.S., the Fed implemented a 0.25% federal funds rate cut in July.
Later in July 2019, the U.S. reversed course and threatened to impose higher tariffs on China’s exports after talks failed. China responded with tariff threats of its own and devalued the renminbi, a move that roiled global markets. Major U.S. stock market indices closed July with the worst weekly results of the year. Bond prices gained as Treasury yields fell to levels not seen since November 2016 and the yield curve inverted at multiple points along the 30-year arc.
In microcosm, August 2019 encapsulated many of the unnerving events that had plagued investors for months. The U.S.-China trade relationship swung from antagonistic to hopeful and back again with no signs of compromise. Evidence of a continued global economic slowdown continued to mount as central banks in China, New Zealand, and Thailand cut interest rates. Industrial and manufacturing data declined in China, Canada, Japan, and Germany. Adding to the uncertain environment, Italy’s prime minister resigned, many feared a crackdown in Hong Kong as protestors sustained their calls for reform, and Boris Johnson planned to suspend Parliament as Brexit’s deadline neared.
In the U.S., September 2019 saw the Fed join other central banks in cutting interest rates. U.S. manufacturing data, as reported by the Institute for Supply Management, disappointed investors. The U.S. House of Representatives announced it would pursue an impeachment investigation of President Trump. Meanwhile, the Brexit impasse showed no signs of resolution. Officials in China said that hitting the country’s
“In February 2019, signs of slowing global growth grew more ominous.”
Wells Fargo International Equity Fund | 3
Table of Contents
Letter to shareholders (unaudited)
“The Fed lowered interest rates another quarter point in late October, its third rate cut in four months.”
|
For further information about your Fund, contact your investment professional, visit our website at wfam.com, or call us directly at1-800-222-8222. |
economic growth goals for the year would be difficult considering the weight of tariffs and trade restrictions. So while the S&P 500 Index finished the third quarter with the best year-to-date returns in more than 20 years, amid signs of equity investors taking money out of the stock market, concerns about future returns remained.
In October 2019, a relaxing of U.S.-China trade tensions and renewed optimism for a U.K. Brexit deal combined with positive macroeconomic data to support financial markets overall. The initial estimate of U.S. third-quarter GDP growth, announced in late October, was a resilient 1.9% annualized rate while the U.S. unemployment rate fell to a 50-year low of 3.5% in September. However, despite resilience among U.S. consumers, business confidence declined while manufacturing activity contracted. Concerned with a potential economic slowdown, the Fed lowered interest rates another quarter point in late October, its third rate cut in four months. This helped push the S&P 500 Index to a new all-time high while emerging market equities rallied and global bonds declined overall, reflecting a broad pickup in risk appetite.
Don’t let short-term uncertainty derail long-term investment goals.
Periods of investment uncertainty can present challenges, but experience has taught us that maintaining long-term investment goals can be an effective way to plan for the future. To help you create a sound strategy based on your personal goals and risk tolerance, Wells Fargo Funds offers more than 100 mutual funds spanning a wide range of asset classes and investment styles. Although diversification cannot guarantee an investment profit or prevent losses, we believe it can be an effective way to manage investment risk and potentially smooth out overall portfolio performance. We encourage investors to know their investments and to understand that appropriate levels of risk-taking may unlock opportunities.
Thank you for choosing to invest with Wells Fargo Funds. We appreciate your confidence in us and remain committed to helping you meet your financial needs.
Sincerely,

Andrew Owen
President
Wells Fargo Funds
4 | Wells Fargo International Equity Fund
Table of Contents
This page is intentionally left blank.
Table of Contents
Performance highlights (unaudited)
Investment objective
The Fund seeks long-term capital appreciation.
Manager
Wells Fargo Funds Management, LLC
Subadviser
Wells Capital Management Incorporated
Portfolio managers
Venkateshwar (Venk) Lal
Dale A. Winner, CFA®‡
Average annual total returns (%) as of October 31, 20191
| Including sales charge | Excluding sales charge | Expense ratios2 (%) | ||||||||||||||||||||||||||||||||
| Inception date | 1 year | 5 year | 10 year | 1 year | 5 year | 10 year | Gross | Net3 | ||||||||||||||||||||||||||
| Class A (WFEAX) | 1-20-1998 | -4.87 | 2.40 | 4.37 | 0.93 | 3.62 | 4.99 | 1.40 | 1.15 | |||||||||||||||||||||||||
| Class C (WFEFX) | 3-6-1998 | -0.84 | 2.84 | 4.21 | 0.16 | 2.84 | 4.21 | 2.15 | 1.90 | |||||||||||||||||||||||||
| Class R (WFERX) | 10-10-2003 | – | – | – | 0.79 | 3.37 | 4.73 | 1.65 | 1.40 | |||||||||||||||||||||||||
| Class R6 (WFEHX)4 | 9-30-2015 | – | – | – | 1.27 | 3.91 | 5.24 | 0.97 | 0.80 | |||||||||||||||||||||||||
| Administrator Class (WFEDX)5 | 7-16-2010 | – | – | – | 0.98 | 3.64 | 5.01 | 1.32 | 1.15 | |||||||||||||||||||||||||
| Institutional Class (WFENX) | 3-9-1998 | – | – | – | 1.19 | 3.88 | 5.25 | 1.07 | 0.85 | |||||||||||||||||||||||||
| MSCI ACWI ex USA Index (Net)6 | – | – | – | – | 11.27 | 3.82 | 4.94 | – | – | |||||||||||||||||||||||||
Figures quoted represent past performance, which is no guarantee of future results, and do not reflect taxes that a shareholder may pay on fund distributions or the redemption of fund shares. Investment return and principal value of an investment will fluctuate so that an investor’s shares, when redeemed, may be worth more or less than their original cost. Performance shown without sales charges would be lower if sales charges were reflected. Current performance may be lower or higher than the performance data quoted, which assumes the reinvestment of dividends and capital gains. Current month-end performance is available on the Fund’s website,wfam.com.
Index returns do not include transaction costs associated with buying and selling securities, any mutual fund fees or expenses, or any taxes. It is not possible to invest directly in an index.
For Class A shares, the maximum front-end sales charge is 5.75%. For Class C shares, the maximum contingent deferred sales charge is 1.00%. Performance including a contingent deferred sales charge assumes the sales charge for the corresponding time period. Class R, Class R6, Administrator Class, and Institutional Class shares are sold without a front-end sales charge or contingent deferred sales charge.
Stock values fluctuate in response to the activities of individual companies and general market and economic conditions. Foreign investments are especially volatile and can rise or fall dramatically due to differences in the political and economic conditions of the host country. These risks are generally intensified in emerging markets. The use of derivatives may reduce returns and/or increase volatility. Certain investment strategies tend to increase the total risk of an investment (relative to the broader market). The Fund is exposed to smaller-company securities risk. Consult the Fund’s prospectus for additional information on these and other risks.
Please see footnotes on page 7.
6 | Wells Fargo International Equity Fund
Table of Contents
Performance highlights (unaudited)
| Growth of $10,000 investment as of October 31, 20197 |
|
| ‡ | CFA® and Chartered Financial Analyst® are trademarks owned by CFA Institute. |
| 1 | Historical performance shown prior to July 19, 2010 is based on the performance of the Fund’s predecessor, Evergreen International Equity Fund. |
| 2 | Reflects the expense ratios as stated in the most recent prospectuses, which include the impact of 0.01% in acquired fund fees and expenses. The expense ratios shown are subject to change and may differ from the annualized expense ratios shown in the financial highlights of this report, which do not include acquired fund fees and expenses. |
| 3 | The manager has contractually committed through February 29, 2020, to waive fees and/or reimburse expenses to the extent necessary to cap the expenses of each class after fee waivers at 1.14% for Class A, 1.89% for Class C, 1.39% for Class R, 0.79% for Class R6, 1.14% for Administrator Class, and 0.84% for Institutional Class. Brokerage commissions, stamp duty fees, interest, taxes, acquired fund fees and expenses (if any), and extraordinary expenses are excluded from the expense cap. Prior to or after the commitment expiration date, the cap may be increased or the commitment to maintain the cap may be terminated only with the approval of the Board of Trustees. Without this cap, the Fund’s returns would have been lower. The expense ratio paid by an investor is the net expense ratio (the total annual fund operating expenses after fee waivers) as stated in the prospectuses. |
| 4 | Historical performance shown for Class R6 shares prior to their inception reflects the performance of Institutional Class shares and includes the higher expenses applicable to Institutional Class shares. If these expenses had not been included, returns for Class R6 shares would be higher. |
| 5 | Historical performance shown for Administrator Class shares prior to their inception reflects the performance of Institutional Class shares and has been adjusted to reflect the higher expenses applicable to Administrator Class shares. |
| 6 | The Morgan Stanley Capital International (MSCI) All Country World Index (ACWI) ex USA Index (Net) is a free-float-adjusted market-capitalization-weighted index that is designed to measure the equity market performance of developed and emerging markets, excluding the Unites States. Source: MSCI. MSCI makes no express or implied warranties or representations and shall have no liability whatsoever with respect to any MSCI data contained herein. The MSCI data may not be further redistributed or used as a basis for other indexes or any securities or financial products. This report is not approved, reviewed, or produced by MSCI. You cannot invest directly in an index. |
| 7 | The chart compares the performance of Class A shares for the most recent ten years with the MSCI ACWI ex USA Index (Net). The chart assumes a hypothetical investment of $10,000 in Class A shares and reflects all operating expenses and assumes the maximum initial sales charge of 5.75%. |
| 8 | The Purchasing Managers’ Index (PMI) is an indicator of economic health for manufacturing and service sectors. The purpose of the PMI is to provide information about current business conditions to company decision makers, analysts and purchasing managers. You cannot invest directly in an index. |
| 9 | The MSCI World Index (Net) is a free-float-adjusted market-capitalization-weighted index that is designed to measure the equity market performance of developed markets. You cannot invest directly in an index. |
| 10 | The MSCI Emerging Markets (EM) Index (Net) is a free-float-adjusted market-capitalization-weighted index that is designed to measure the equity market performance of emerging markets. You cannot invest directly in an index. |
| 11 | The MSCI ACWI ex USA Value Index (Net) measures the equity market performance of large- and mid-cap securities exhibiting overall value style characteristics across developed and emerging market countries, excluding the United States. The value investment style characteristics for index construction are defined using three variables: book value to price, 12-month forward earnings to price, and dividend yield. You cannot invest directly in an index. |
| 12 | The ten largest holdings, excluding cash, cash equivalents and any money market funds, are calculated based on the value of the investments divided by total net assets of the Fund. Holdings are subject to change and may have changed since the date specified. |
| 13 | Amounts are calculated based on the total long-term investments of the Fund. These amounts are subject to change and may have changed since the date specified. |
| 14 | The price/book ratio is used to compare a stock’s market value with its book value. It is calculated by dividing the current closing price of the stock by the latest quarter’s book value per share. |
| * | This security was no longer held at the end of the reporting period. |
Wells Fargo International Equity Fund | 7
Table of Contents
Performance highlights (unaudited)
MANAGER’S DISCUSSION
Fund highlights
| ∎ | The Fund underperformed its benchmark, the MSCI ACWI ex USA Index (Net) for the 12-month period that ended October 31, 2019. |
| ∎ | Financials, energy, materials, information technology (IT), communication services, health care and consumer discretionary stocks were relative performance laggards due to a combination of negative allocation and selection effects. The portfolio’s relative performance was also hurt by not having any exposure to the utilities or real estate sectors, the second and third best performing sectors during the period after IT. Industrials and consumer staples stocks were notable contributors to performance. |
| ∎ | The Fund remained overweight Europe, including overweights to the Netherlands, Italy, and Norway, which were offset by underweights to France, Spain, and Sweden. The Fund was underweight Asia on a regional basis, including underweights to Japan, Australia, and Taiwan, offset by overweights to China/Hong Kong, Singapore, and Thailand. |
General market concerns of a potential global recession reached a 12-month high in mid-August 2019, reflecting deteriorating investor sentiment following the announcement that the U.S. would place additional tariffs on remaining Chinese imports, a global manufacturing PMI8 that dipped further into contractionary territory, and a 20% decline in the price of Brent crude oil. In this environment, developed market equities, represented by the MSCI World Index (Net)9, returned 12.7%, modestly outperforming emerging markets, represented by the MSCI EM Index (Net)10, which returned 11.9%. Traditional value sectors underperformed growth during the period, illustrated by the MSCI ACWI ex USA Value Index (Net)11, which returned 5.9% versus 16.7% for the growth index. However, the value index did outperform growth by 271 basis points (bps; 100 bps equal 1.00%) during the last two months of the period.
Our investment and risk management process of finding non-consensus undervalued equities, marrying core micro stock picking with macro risk management in each region of the globe, resulted in shifts to sector and country allocations, including an increase in exposure to consumer discretionary, the U.K., and Thailand, which was offset by reduced allocations to financials, Germany, and Brazil. Notable position changes during the period included Melrose Industries plc (a U.K.-domiciled investment company benefiting from self-help catalysts being implemented at GKN, acquired in April 2018) and Gentex Corporation (undervalued earnings growth supported by dominant market share in electrochromic mirrors for automobiles and strong industry growth). The Fund notably exited Zurich Insurance (which reached full valuation with limited potential for capital appreciation) and trimmed Cosan Limited (reduction in thesis conviction as many of the tenets of the value with catalysts thesis have played out).
| Ten largest holdings (%) as of October 31, 201912 | ||||
Smiths Group plc | 3.25 | |||
LafargeHolcim Limited | 3.14 | |||
Lundin Mining Corporation | 3.12 | |||
Compagnie de Saint-Gobain SA | 3.10 | |||
BP plc | 3.03 | |||
Eni SpA | 2.87 | |||
Prysmian SpA | 2.86 | |||
China Mobile Limited | 2.81 | |||
Check Point Software Technologies Limited | 2.81 | |||
NN Group NV | 2.80 | |||
| Sector distribution as of October 31, 201913 |
|
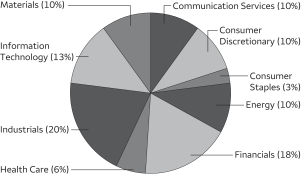
Weakness in the financials, energy, and materials sectors offset annual gains.
Weakest performers included John Wood Group, Sasol Limited, Nomura Holdings*, Daiwa Securities Group Incorporated, and HollySys Automation. We exited Sasol, a South African integrated energy and chemical producer of synthetic fuel and chemicals from coal and gas, following a stop-loss reevaluation, which concluded that the investment thesis was no longer intact and that there was more downside risk. The investment case was based on the operational de-risking of the Lake Charles Chemical Project. We downgraded conviction from high to low in May 2019 on cost overruns and a material reduction in management credibility, and we no longer have confidence that the management team will be able to successfully deliver this project in a timely manner without again lowering normalized earnings power.
Please see footnotes on page 7.
8 | Wells Fargo International Equity Fund
Table of Contents
Performance highlights (unaudited)
| Country allocation as of October 31, 201913 |
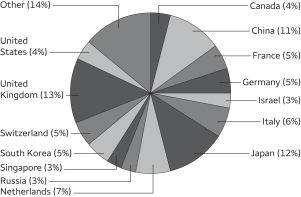 |
Over the past 12 months, contributions to performance were driven largely by stock selection.
Top contributors included Cosan, Home Capital Group, Rheinmetall AG, Gentex, and Lundin Mining Corporation. Rheinmetall, a German industrial split 50/50 between defense and auto benefited from self-help catalysts from defense reorganization and a growth inflection in the defense cycle. It outperformed on an increase in defense sales, outweighing a decline in automotive sales during a difficult period for auto sales globally. Gentex, a developer of high-quality products primarily for the automotive industry, outperformed the underlying light vehicle market given strong penetration of new products and good traction for the base interior electrochromic mirror into emerging markets.
Our short-term outlook remains neutral with a balance between risk and opportunity. First, sentiment is mixed, illustrated by a level of volatility, relative strength indicators in neutral territory for the MSCI ACWI ex USA Index (Net), and defensive assets outperforming cyclicals. Second, global earnings peaked in March and earnings revisions turned negative, reflecting a growing but slowing environment. Third, there is the potential for easier monetary policy as the U.S. Federal Reserve cut rates twice in the third quarter and ended quantitative tightening while the European Central Bank now expects to keep interest rates at their current level through the first half of 2020 and plans to restart quantitative easing in November.
Our longer-term outlook remains neutral. First, valuations are in line to slightly above long-term averages. The price/book ratio14 for the MSCI ACWI ex USA Index (Net) stands at 2.2x and the dividend yield for the index is also attractive, offering 2.5% versus bond yields in Japan, Germany, and the U.S. Second, global growth is no longer synchronized as U.S. growth peaked in the first half of 2018, coupled with a global soft patch driven by deliberate deleveraging from China, political risk in Europe, and lingering trade uncertainty. That being said, there is a low risk of a recession in the U.S. over the next one to two years, despite a flat yield curve, given that real rates are at zero, the consumer is strong, and there is potential for Chinese stimulus and/or a resolution on U.S.-China trade. Third, central banks remain accommodative and there is potential for fiscal stimulus in the U.S. and Germany.
Please see footnotes on page 7.
Wells Fargo International Equity Fund | 9
Table of Contents
As a shareholder of the Fund, you incur two types of costs: (1) transaction costs, including sales charges (loads) on purchase payments and contingent deferred sales charges (if any) on redemptions and (2) ongoing costs, including management fees, distribution (12b-1) and/or shareholder servicing fees, and other Fund expenses. This example is intended to help you understand your ongoing costs (in dollars) of investing in the Fund and to compare these costs with the ongoing costs of investing in other mutual funds.
The example is based on an investment of $1,000 invested at the beginning of the six-month period and held for the entire period from May 1, 2019 to October 31, 2019.
Actual expenses
The “Actual” line of the table below provides information about actual account values and actual expenses. You may use the information in this line, together with the amount you invested, to estimate the expenses that you paid over the period. Simply divide your account value by $1,000 (for example, an $8,600 account value divided by $1,000 = 8.6), then multiply the result by the number in the “Actual” line under the heading entitled “Expenses paid during period” for your applicable class of shares to estimate the expenses you paid on your account during this period.
Hypothetical example for comparison purposes
The “Hypothetical” line of the table below provides information about hypothetical account values and hypothetical expenses based on the Fund’s actual expense ratio and an assumed rate of return of 5% per year before expenses, which is not the Fund’s actual return. The hypothetical account values and expenses may not be used to estimate the actual ending account balance or expenses you paid for the period. You may use this information to compare the ongoing costs of investing in the Fund and other funds. To do so, compare this 5% hypothetical example with the 5% hypothetical examples that appear in the shareholder reports of the other funds.
Please note that the expenses shown in the table are meant to highlight your ongoing costs only and do not reflect any transactional costs, such as sales charges (loads) and contingent deferred sales charges. Therefore, the “Hypothetical” line of the table is useful in comparing ongoing costs only and will not help you determine the relative total costs of owning different funds. In addition, if these transactional costs were included, your costs would have been higher.
| Beginning account value 5-1-2019 | Ending account value 10-31-2019 | Expenses paid during the period¹ | Annualized net expense ratio | |||||||||||||
Class A | ||||||||||||||||
Actual | $ | 1,000.00 | $ | 968.44 | $ | 5.66 | 1.14 | % | ||||||||
Hypothetical (5% return before expenses) | $ | 1,000.00 | $ | 1,019.46 | $ | 5.80 | 1.14 | % | ||||||||
Class C | ||||||||||||||||
Actual | $ | 1,000.00 | $ | 964.81 | $ | 9.36 | 1.89 | % | ||||||||
Hypothetical (5% return before expenses) | $ | 1,000.00 | $ | 1,015.68 | $ | 9.60 | 1.89 | % | ||||||||
Class R | ||||||||||||||||
Actual | $ | 1,000.00 | $ | 968.47 | $ | 6.90 | 1.37 | % | ||||||||
Hypothetical (5% return before expenses) | $ | 1,000.00 | $ | 1,018.20 | $ | 7.07 | 1.37 | % | ||||||||
Class R6 | ||||||||||||||||
Actual | $ | 1,000.00 | $ | 970.37 | $ | 3.92 | 0.79 | % | ||||||||
Hypothetical (5% return before expenses) | $ | 1,000.00 | $ | 1,021.22 | $ | 4.02 | 0.79 | % | ||||||||
Administrator Class | ||||||||||||||||
Actual | $ | 1,000.00 | $ | 969.25 | $ | 5.66 | 1.14 | % | ||||||||
Hypothetical (5% return before expenses) | $ | 1,000.00 | $ | 1,019.46 | $ | 5.80 | 1.14 | % | ||||||||
Institutional Class | ||||||||||||||||
Actual | $ | 1,000.00 | $ | 969.86 | $ | 4.17 | 0.84 | % | ||||||||
Hypothetical (5% return before expenses) | $ | 1,000.00 | $ | 1,020.97 | $ | 4.28 | 0.84 | % | ||||||||
| 1 | Expenses paid is equal to the annualized net expense ratio of each class multiplied by the average account value over the period, multiplied by the number of days in the most recent fiscal half-year divided by the number of days in the fiscal year (to reflect the one-half-year period). |
10 | Wells Fargo International Equity Fund
Table of Contents
Portfolio of investments—October 31, 2019
| Shares | Value | |||||||||||||||
| Common Stocks: 97.48% | ||||||||||||||||
| Australia: 0.40% | ||||||||||||||||
Origin Energy Limited (Energy, Oil, Gas & Consumable Fuels) | 205,193 | $ | 1,111,795 | |||||||||||||
|
| |||||||||||||||
| Brazil: 0.51% | ||||||||||||||||
Cosan Limited Class A (Energy, Oil, Gas & Consumable Fuels) † | 85,839 | 1,443,812 | ||||||||||||||
|
| |||||||||||||||
| Canada: 4.15% | ||||||||||||||||
Home Capital Group Incorporated (Financials, Thrifts & Mortgage Finance) † | 140,600 | 2,893,984 | ||||||||||||||
Lundin Mining Corporation (Materials, Metals & Mining) | 1,737,145 | 8,770,795 | ||||||||||||||
| 11,664,779 | ||||||||||||||||
|
| |||||||||||||||
| China: 11.20% | ||||||||||||||||
Alibaba Group Holding Limited ADR (Consumer Discretionary, Internet & Direct Marketing Retail) † | 24,647 | 4,354,385 | ||||||||||||||
China Everbright Limited (Financials, Capital Markets) | 1,280,000 | 1,901,390 | ||||||||||||||
China Mobile Limited (Communication Services, Wireless Telecommunication Services) | 971,000 | 7,905,844 | ||||||||||||||
HollySys Automation Technologies Limited (Information Technology, Electronic Equipment, Instruments & Components) | 354,153 | 4,997,099 | ||||||||||||||
Midea Group Company Limited Class A (Consumer Discretionary, Household Durables) | 911,959 | 7,194,150 | ||||||||||||||
Shanghai Pharmaceuticals Holding Company Limited H Shares (Health Care, Health Care Providers & Services) | 2,837,200 | 5,134,221 | ||||||||||||||
| 31,487,089 | ||||||||||||||||
|
| |||||||||||||||
| France: 4.47% | ||||||||||||||||
Compagnie de Saint-Gobain SA (Industrials, Building Products) | 214,089 | 8,708,066 | ||||||||||||||
Orange SA (Communication Services, Diversified Telecommunication Services) | 239,094 | 3,850,592 | ||||||||||||||
| 12,558,658 | ||||||||||||||||
|
| |||||||||||||||
| Germany: 5.15% | ||||||||||||||||
Metro AG (Consumer Staples, Food & Staples Retailing) | 148,792 | 2,422,836 | ||||||||||||||
Muenchener Rueckversicherungs Gesellschaft AG (Financials, Insurance) | 14,148 | 3,929,036 | ||||||||||||||
Rheinmetall AG (Industrials, Industrial Conglomerates) | 18,631 | 2,241,031 | ||||||||||||||
SAP SE (Information Technology, Software) | 31,258 | 4,141,610 | ||||||||||||||
Siemens AG (Industrials, Industrial Conglomerates) | 15,126 | 1,744,023 | ||||||||||||||
| 14,478,536 | ||||||||||||||||
|
| |||||||||||||||
| Hong Kong: 2.29% | ||||||||||||||||
Xinyi Glass Holdings Limited (Consumer Discretionary, Auto Components) | 5,712,000 | 6,436,611 | ||||||||||||||
|
| |||||||||||||||
| India: 1.74% | ||||||||||||||||
Zee Entertainment Enterprises Limited (Communication Services, Media) | 1,331,091 | 4,890,574 | ||||||||||||||
|
| |||||||||||||||
| Ireland: 1.86% | ||||||||||||||||
Greencore Group plc (Consumer Staples, Food Products) | 1,735,149 | 5,223,482 | ||||||||||||||
|
| |||||||||||||||
| Israel: 2.81% | ||||||||||||||||
Check Point Software Technologies Limited (Information Technology, Software) † | 70,303 | 7,902,760 | ||||||||||||||
|
| |||||||||||||||
| Italy: 5.74% | ||||||||||||||||
Eni SpA (Energy, Oil, Gas & Consumable Fuels) | 533,688 | 8,077,163 | ||||||||||||||
Prysmian SpA (Industrials, Electrical Equipment) | 348,426 | 8,047,894 | ||||||||||||||
| 16,125,057 | ||||||||||||||||
|
| |||||||||||||||
| Japan: 11.44% | ||||||||||||||||
Alps Electric Company Limited (Information Technology, Electronic Equipment, Instruments & Components) | 206,500 | 4,482,230 | ||||||||||||||
The accompanying notes are an integral part of these financial statements.
Wells Fargo International Equity Fund | 11
Table of Contents
Portfolio of investments—October 31, 2019
| Shares | Value | |||||||||||||||
| Japan (continued) | ||||||||||||||||
Daiwa Securities Group Incorporated (Financials, Capital Markets) | 1,687,200 | $ | 7,650,911 | |||||||||||||
Hitachi Limited (Information Technology, Electronic Equipment, Instruments & Components) | 192,600 | 7,257,054 | ||||||||||||||
Mitsubishi UFJ Financial Group Incorporated (Financials, Banks) | 970,100 | 5,118,650 | ||||||||||||||
Takeda Pharmaceutical Company Limited (Health Care, Pharmaceuticals) | 210,200 | 7,645,760 | ||||||||||||||
| 32,154,605 | ||||||||||||||||
|
| |||||||||||||||
| Malaysia: 1.76% | ||||||||||||||||
CIMB Group Holdings Bhd (Financials, Banks) | 3,934,942 | 4,943,986 | ||||||||||||||
|
| |||||||||||||||
| Mexico: 0.95% | ||||||||||||||||
Fresnillo plc (Materials, Metals & Mining) | 290,793 | 2,674,419 | ||||||||||||||
|
| |||||||||||||||
| Netherlands: 7.14% | ||||||||||||||||
Koninklijke Philips NV (Industrials, Industrial Conglomerates) | 127,627 | 5,589,784 | ||||||||||||||
NN Group NV (Financials, Insurance) | 206,739 | 7,878,780 | ||||||||||||||
OCI NV (Materials, Chemicals) † | 294,523 | 6,605,761 | ||||||||||||||
| 20,074,325 | ||||||||||||||||
|
| |||||||||||||||
| Norway: 2.35% | ||||||||||||||||
Den Norske Bank ASA (Financials, Banks) | 363,492 | 6,604,885 | ||||||||||||||
|
| |||||||||||||||
| Russia: 2.61% | ||||||||||||||||
Mobile TeleSystems PJSC ADR (Communication Services, Wireless Telecommunication Services) | 818,172 | 7,322,639 | ||||||||||||||
|
| |||||||||||||||
| Singapore: 2.73% | ||||||||||||||||
Keppel Corporation Limited (Industrials, Industrial Conglomerates) | 1,519,200 | 7,660,489 | ||||||||||||||
|
| |||||||||||||||
| South Korea: 4.54% | ||||||||||||||||
Hana Financial Group Incorporated (Financials, Banks) | 70,573 | 2,044,188 | ||||||||||||||
Samsung Electronics Company Limited GDR (Information Technology, Technology Hardware, Storage & Peripherals) | 5,814 | 6,209,352 | ||||||||||||||
SK Telecom Company Limited (Communication Services, Wireless Telecommunication Services) | 22,133 | 4,508,592 | ||||||||||||||
| 12,762,132 | ||||||||||||||||
|
| |||||||||||||||
| Switzerland: 4.81% | ||||||||||||||||
LafargeHolcim Limited (Materials, Construction Materials) | 171,038 | 8,821,504 | ||||||||||||||
Novartis AG (Health Care, Pharmaceuticals) | 53,677 | 4,684,291 | ||||||||||||||
| 13,505,795 | ||||||||||||||||
|
| |||||||||||||||
| Thailand: 2.14% | ||||||||||||||||
Siam Commercial Bank plc (Financials, Banks) | 1,617,100 | 6,024,963 | ||||||||||||||
|
| |||||||||||||||
| United Kingdom: 12.69% | ||||||||||||||||
BP plc (Energy, Oil, Gas & Consumable Fuels) | 1,345,755 | 8,529,595 | ||||||||||||||
John Wood Group plc (Energy, Energy Equipment & Services) | 1,637,211 | 7,174,537 | ||||||||||||||
Kingfisher plc (Consumer Discretionary, Specialty Retail) | 1,277,171 | 3,427,883 | ||||||||||||||
Man Group plc (Financials, Capital Markets) | 898,827 | 1,670,764 | ||||||||||||||
Melrose Industries plc (Industrials, Electrical Equipment) | 2,069,655 | 5,713,058 | ||||||||||||||
Smiths Group plc (Industrials, Industrial Conglomerates) | 437,096 | 9,135,514 | ||||||||||||||
| 35,651,351 | ||||||||||||||||
|
| |||||||||||||||
| United States: 4.00% | ||||||||||||||||
Gentex Corporation (Consumer Discretionary, Auto Components) | 186,840 | 5,240,862 | ||||||||||||||
Sensata Technologies Holding plc (Industrials, Electrical Equipment) † | 117,470 | 6,013,289 | ||||||||||||||
| 11,254,151 | ||||||||||||||||
|
| |||||||||||||||
Total Common Stocks (Cost $255,590,253 ) | 273,956,893 | |||||||||||||||
|
| |||||||||||||||
The accompanying notes are an integral part of these financial statements.
12 | Wells Fargo International Equity Fund
Table of Contents
Portfolio of investments—October 31, 2019
| Yield | Shares | Value | ||||||||||||||
| Short-Term Investments: 0.99% | ||||||||||||||||
| Investment Companies: 0.99% | ||||||||||||||||
Wells Fargo Government Money Market Fund Select Class (l)(u) | 1.75 | % | 2,779,280 | $ | 2,779,280 | |||||||||||
|
| |||||||||||||||
Total Short-Term Investments (Cost $2,779,280 ) | 2,779,280 | |||||||||||||||
|
| |||||||||||||||
| Total investments in securities (Cost $258,369,533) | 98.47 | % | 276,736,173 | |||||
Other assets and liabilities, net | 1.53 | 4,312,161 | ||||||
|
|
|
| |||||
| Total net assets | 100.00 | % | $ | 281,048,334 | ||||
|
|
|
| |||||
| † | Non-income-earning security |
| 144A | The security may be resold in transactions exempt from registration, normally to qualified institutional buyers, pursuant to Rule 144A under the Securities Act of 1933. |
| (l) | The issuer of the security is an affiliated person of the Fund as defined in the Investment Company Act of 1940. |
| (u) | The rate represents the 7-day annualized yield at period end. |
Abbreviations:
| ADR | American depositary receipt |
| GDR | Global depositary receipt |
Forward Foreign Currency Contracts
| Currency to be received | Currency to be delivered | Counterparty | Settlement date | Unrealized gains | Unrealized losses | |||||||||
| 9,351,919 USD | 8,394,900 EUR | Credit Suisse | 12-9-2019 | $ | 0 | $ | (32,775 | ) | ||||||
| 21,029,996 USD | 16,992,700 GBP | Morgan Stanley | 12-9-2019 | 0 | (1,006,409 | ) | ||||||||
|
|
|
| |||||||||||
| $ | 0 | $ | (1,039,184 | ) | ||||||||||
|
|
|
| |||||||||||
Investments in Affiliates
An affiliated investment is an investment in which the Fund owns at least 5% of the outstanding voting shares of the issuer or as a result of other relationships, such as the Fund and the issuer having the same investment manager. Transactions with issuers that were either affiliated persons of the Fund at the beginning of the period or the end of the period were as follows:
| Shares, beginning of period | Shares purchased | Shares sold | Shares, end of period | Net realized gains (losses) | Net change in unrealized gains (losses) | Income from affiliated securities | Value, end of period | % of net assets | ||||||||||||||||||||||||||||
| Short-Term Investments | ||||||||||||||||||||||||||||||||||||
Investment Companies | ||||||||||||||||||||||||||||||||||||
Securities Lending Cash Investments LLC * | 20,988,148 | 162,645,110 | 183,633,258 | 0 | $ | (560 | ) | $ | (15 | ) | $ | 241,626 | # | $ | 0 | |||||||||||||||||||||
Wells Fargo Government Money Market Fund Select Class | 10,009,651 | 149,616,243 | 156,846,614 | 2,779,280 | 0 | 0 | 125,227 | 2,779,280 | ||||||||||||||||||||||||||||
|
|
|
|
|
|
|
|
|
| |||||||||||||||||||||||||||
| $ | (560 | ) | $ | (15 | ) | $ | 366,853 | $ | 2,779,280 | 0.99 | % | |||||||||||||||||||||||||
|
|
|
|
|
|
|
|
|
| |||||||||||||||||||||||||||
| * | No longer held at the end of the period. |
| # | Amount shown represents income before fees and rebates. |
The accompanying notes are an integral part of these financial statements.
Wells Fargo International Equity Fund | 13
Table of Contents
Statement of assets and liabilities—October 31, 2019
Assets | ||||
Investments in unaffiliated securities, at value (cost $255,590,253) | $ | 273,956,893 | ||
Investments in affiliated securities, at value (cost $2,779,280) | 2,779,280 | |||
Cash segregated for forward foreign currency contracts | 830,000 | |||
Foreign currency, at value (cost $442,919) | 437,313 | |||
Receivable for investments sold | 2,418,409 | |||
Receivable for Fund shares sold | 139,613 | |||
Receivable for dividends | 2,054,235 | |||
Prepaid expenses and other assets | 25,908 | |||
|
| |||
Total assets | 282,641,651 | |||
|
| |||
Liabilities | ||||
Payable for Fund shares redeemed | 140,595 | |||
Unrealized losses on forward foreign currency contracts | 1,039,184 | |||
Management fee payable | 130,022 | |||
Administration fees payable | 33,672 | |||
Distribution fees payable | 6,910 | |||
Custodian and accounting fees payable | 161,027 | |||
Trustees’ fees and expenses payable | 3,665 | |||
Accrued expenses and other liabilities | 78,242 | |||
|
| |||
Total liabilities | 1,593,317 | |||
|
| |||
Total net assets | $ | 281,048,334 | ||
|
| |||
Net assets consist of | ||||
Paid-in capital | $ | 277,911,783 | ||
Total distributable earnings | 3,136,551 | |||
|
| |||
Total net assets | $ | 281,048,334 | ||
|
| |||
Computation of net asset value and offering price per share | ||||
Net assets – Class A | $ | 81,110,220 | ||
Shares outstanding – Class A1 | 7,126,362 | |||
Net asset value per share – Class A | $11.38 | |||
Maximum offering price per share – Class A2 | $12.07 | |||
Net assets – Class C | $ | 10,700,131 | ||
Shares outstanding – Class C1 | 948,527 | |||
Net asset value per share – Class C | $11.28 | |||
Net assets – Class R | $ | 794,256 | ||
Shares outstanding – Class R1 | 68,439 | |||
Net asset value per share – Class R | $11.61 | |||
Net assets – Class R6 | $ | 36,505,464 | ||
Shares outstanding – Class R61 | 3,226,560 | |||
Net asset value per share – Class R6 | $11.31 | |||
Net assets – Administrator Class | $ | 1,189,400 | ||
Shares outstanding – Administrator Class1 | 106,024 | |||
Net asset value per share – Administrator Class | $11.22 | |||
Net assets – Institutional Class | $ | 150,748,863 | ||
Shares outstanding – Institutional Class1 | 13,348,619 | |||
Net asset value per share – Institutional Class | $11.29 | |||
| 1 | The Fund has an unlimited number of authorized shares. |
| 2 | Maximum offering price is computed as 100/94.25 of net asset value. On investments of $50,000 or more, the offering price is reduced. |
The accompanying notes are an integral part of these financial statements.
14 | Wells Fargo International Equity Fund
Table of Contents
Statement of operations—year ended October 31, 2019
Investment income | ||||
Dividends (net of foreign withholding taxes of $957,394) | $ | 10,069,569 | ||
Income from affiliated securities | 332,052 | |||
|
| |||
Total investment income | 10,401,621 | |||
|
| |||
Expenses | ||||
Management fee | 2,803,653 | |||
Administration fees | ||||
Class A | 181,332 | |||
Class C | 31,576 | |||
Class R | 2,597 | |||
Class R6 | 12,046 | |||
Administrator Class | 4,555 | |||
Institutional Class | 238,631 | |||
Shareholder servicing fees | ||||
Class A | 215,871 | |||
Class C | 37,591 | |||
Class R | 2,418 | |||
Administrator Class | 8,759 | |||
Distribution fees | ||||
Class C | 112,682 | |||
Class R | 3,088 | |||
Custody and accounting fees | 145,282 | |||
Professional fees | 65,830 | |||
Registration fees | 89,660 | |||
Shareholder report expenses | 72,750 | |||
Trustees’ fees and expenses | 21,652 | |||
Interest expense | 15,777 | |||
Other fees and expenses | 29,115 | |||
|
| |||
Total expenses | 4,094,865 | |||
Less: Fee waivers and/or expense reimbursements | ||||
Fund-level | (658,355 | ) | ||
Class A | (87,649 | ) | ||
Class C | (14,532 | ) | ||
Class R | (908 | ) | ||
Administrator Class | (564 | ) | ||
Institutional Class | (90,031 | ) | ||
|
| |||
Net expenses | 3,242,826 | |||
|
| |||
Net investment income | 7,158,795 | |||
|
| |||
Realized and unrealized gains (losses) on investments | ||||
Net realized gains (losses) on | ||||
Unaffiliated securities | (10,134,296 | ) | ||
Affiliated securities | (560 | ) | ||
Forward foreign currency contracts | 2,078,041 | |||
|
| |||
Net realized losses on investments | (8,056,815 | ) | ||
|
| |||
Net change in unrealized gains (losses) on | ||||
Unaffiliated securities | 1,348,099 | |||
Affiliated securities | (15 | ) | ||
Forward foreign currency contracts | (2,010,393 | ) | ||
|
| |||
Net change in unrealized gains (losses) on investments | (662,309 | ) | ||
|
| |||
Net realized and unrealized gains (losses) on investments | (8,719,124 | ) | ||
|
| |||
Net decrease in net assets resulting from operations | $ | (1,560,329 | ) | |
|
| |||
The accompanying notes are an integral part of these financial statements.
Wells Fargo International Equity Fund | 15
Table of Contents
Statement of changes in net assets
Year ended October 31, 2019 | Year ended October 31, 2018 | |||||||||||||||
Operations | ||||||||||||||||
Net investment income | $ | 7,158,795 | $ | 10,640,487 | ||||||||||||
Net realized gains (losses) on investments | (8,056,815 | ) | 10,779,848 | |||||||||||||
Net change in unrealized gains (losses) on investments | (662,309 | ) | (65,802,116 | ) | ||||||||||||
|
| |||||||||||||||
Net decrease in net assets resulting from operations | (1,560,329 | ) | (44,381,781 | ) | ||||||||||||
|
| |||||||||||||||
Distributions to shareholders from net investment income and net realized gains |
| |||||||||||||||
Class A | (3,814,733 | ) | (3,952,000 | ) | ||||||||||||
Class C | (465,349 | ) | (814,322 | ) | ||||||||||||
Class R | (49,381 | ) | (59,089 | ) | ||||||||||||
Class R6 | (1,911,254 | ) | (2,906,201 | ) | ||||||||||||
Administrator Class | (181,829 | ) | (602,675 | ) | ||||||||||||
Institutional Class | (9,669,266 | ) | (10,478,098 | ) | ||||||||||||
|
| |||||||||||||||
Total distributions to shareholders | (16,091,812 | ) | (18,812,385 | ) | ||||||||||||
|
| |||||||||||||||
Capital share transactions | Shares | Shares | ||||||||||||||
Proceeds from shares sold | ||||||||||||||||
Class A | 1,147,071 | 13,224,286 | 1,152,774 | 15,432,689 | ||||||||||||
Class C | 86,880 | 957,728 | 341,521 | 4,529,729 | ||||||||||||
Class R | 25,185 | 292,558 | 20,290 | 272,361 | ||||||||||||
Class R6 | 21,094 | 236,894 | 706,610 | 9,064,153 | ||||||||||||
Administrator Class | 120,528 | 1,364,756 | 84,981 | 1,114,286 | ||||||||||||
Institutional Class | 3,668,728 | 41,620,881 | 9,238,916 | 123,655,558 | ||||||||||||
|
| |||||||||||||||
| 57,697,103 | 154,068,776 | |||||||||||||||
|
| |||||||||||||||
Reinvestment of distributions | ||||||||||||||||
Class A | 321,829 | 3,507,776 | 271,234 | 3,601,626 | ||||||||||||
Class C | 39,404 | 419,685 | 57,378 | 751,083 | ||||||||||||
Class R | 1,096 | 12,180 | 889 | 12,001 | ||||||||||||
Class R6 | 83,623 | 906,082 | 209,719 | 2,777,828 | ||||||||||||
Administrator Class | 16,761 | 179,650 | 45,884 | 600,531 | ||||||||||||
Institutional Class | 718,102 | 7,759,106 | 609,296 | 8,034,503 | ||||||||||||
|
| |||||||||||||||
| 12,784,479 | 15,777,572 | |||||||||||||||
|
| |||||||||||||||
Payment for shares redeemed | ||||||||||||||||
Class A | (2,065,116 | ) | (23,490,494 | ) | (1,867,405 | ) | (24,377,062 | ) | ||||||||
Class C | (1,162,599 | ) | (13,124,506 | ) | (616,504 | ) | (7,877,466 | ) | ||||||||
Class R | (74,982 | ) | (874,682 | ) | (50,948 | ) | (658,133 | ) | ||||||||
Class R6 | (2,255,062 | ) | (24,783,491 | ) | (1,076,925 | ) | (14,183,411 | ) | ||||||||
Administrator Class | (474,737 | ) | (5,303,913 | ) | (1,064,217 | ) | (14,013,356 | ) | ||||||||
Institutional Class | (11,722,793 | ) | (131,578,072 | ) | (6,845,893 | ) | (88,264,185 | ) | ||||||||
|
| |||||||||||||||
| (199,155,158 | ) | (149,373,613 | ) | |||||||||||||
|
| |||||||||||||||
Net increase (decrease) in net assets resulting from capital share transactions | (128,673,576 | ) | 20,472,735 | |||||||||||||
|
| |||||||||||||||
Total decrease in net assets | (146,325,717 | ) | (42,721,431 | ) | ||||||||||||
|
| |||||||||||||||
Net assets | ||||||||||||||||
Beginning of period | 427,374,051 | 470,095,482 | ||||||||||||||
|
| |||||||||||||||
End of period | $ | 281,048,334 | $ | 427,374,051 | ||||||||||||
|
| |||||||||||||||
The accompanying notes are an integral part of these financial statements.
16 | Wells Fargo International Equity Fund
Table of Contents
(For a share outstanding throughout each period)
| Year ended October 31 | ||||||||||||||||||||
| CLASS A | 2019 | 2018 | 2017 | 2016 | 2015 | |||||||||||||||
Net asset value, beginning of period | $11.81 | $13.43 | $11.07 | $11.53 | $11.28 | |||||||||||||||
Net investment income | 0.24 | 1 | 0.27 | 0.22 | 0.22 | 0.18 | 1 | |||||||||||||
Net realized and unrealized gains (losses) on investments | (0.16 | ) | (1.40 | ) | 2.47 | (0.54 | ) | 0.57 | ||||||||||||
|
|
|
|
|
|
|
|
|
| |||||||||||
Total from investment operations | 0.08 | (1.13 | ) | 2.69 | (0.32 | ) | 0.75 | |||||||||||||
Distributions to shareholders from | ||||||||||||||||||||
Net investment income | (0.51 | ) | (0.49 | ) | (0.33 | ) | (0.14 | ) | (0.50 | ) | ||||||||||
Net asset value, end of period | $11.38 | $11.81 | $13.43 | $11.07 | $11.53 | |||||||||||||||
Total return2 | 0.93 | % | (8.81 | )% | 24.91 | % | (2.76 | )% | 6.85 | % | ||||||||||
Ratios to average net assets (annualized) | ||||||||||||||||||||
Gross expenses | 1.45 | % | 1.39 | % | 1.47 | % | 1.47 | % | 1.53 | % | ||||||||||
Net expenses | 1.14 | % | 1.14 | % | 1.14 | % | 1.12 | % | 1.09 | % | ||||||||||
Net investment income | 2.13 | % | 1.97 | % | 1.82 | % | 2.04 | % | 1.50 | % | ||||||||||
Supplemental data | ||||||||||||||||||||
Portfolio turnover rate | 49 | % | 62 | % | 59 | % | 65 | % | 27 | % | ||||||||||
Net assets, end of period (000s omitted) | $81,110 | $91,206 | $109,655 | $122,248 | $145,654 | |||||||||||||||
| 1 | Calculated based upon average shares outstanding |
| 2 | Total return calculations do not include any sales charges. |
The accompanying notes are an integral part of these financial statements.
Wells Fargo International Equity Fund | 17
Table of Contents
Financial highlights
(For a share outstanding throughout each period)
| Year ended October 31 | ||||||||||||||||||||
| CLASS C | 2019 | 2018 | 2017 | 2016 | 2015 | |||||||||||||||
Net asset value, beginning of period | $11.57 | $13.13 | $10.82 | $11.30 | $11.06 | |||||||||||||||
Net investment income | 0.12 | 1 | 0.15 | 0.14 | 0.14 | 0.08 | 1 | |||||||||||||
Net realized and unrealized gains (losses) on investments | (0.12 | ) | (1.35 | ) | 2.40 | (0.53 | ) | 0.57 | ||||||||||||
|
|
|
|
|
|
|
|
|
| |||||||||||
Total from investment operations | (0.00 | ) | (1.20 | ) | 2.54 | (0.39 | ) | 0.65 | ||||||||||||
Distributions to shareholders from | ||||||||||||||||||||
Net investment income | (0.29 | ) | (0.36 | ) | (0.23 | ) | (0.09 | ) | (0.41 | ) | ||||||||||
Net asset value, end of period | $11.28 | $11.57 | $13.13 | $10.82 | $11.30 | |||||||||||||||
Total return2 | 0.16 | % | (9.47 | )% | 23.91 | % | (3.43 | )% | 6.03 | % | ||||||||||
Ratios to average net assets (annualized) | ||||||||||||||||||||
Gross expenses | 2.19 | % | 2.14 | % | 2.22 | % | 2.22 | % | 2.28 | % | ||||||||||
Net expenses | 1.89 | % | 1.89 | % | 1.89 | % | 1.87 | % | 1.84 | % | ||||||||||
Net investment income | 1.07 | % | 1.22 | % | 1.26 | % | 1.33 | % | 0.72 | % | ||||||||||
Supplemental data | ||||||||||||||||||||
Portfolio turnover rate | 49 | % | 62 | % | 59 | % | 65 | % | 27 | % | ||||||||||
Net assets, end of period (000s omitted) | $10,700 | $22,963 | $28,919 | $27,508 | $29,080 | |||||||||||||||
| 1 | Calculated based upon average shares outstanding |
| 2 | Total return calculations do not include any sales charges. |
The accompanying notes are an integral part of these financial statements.
18 | Wells Fargo International Equity Fund
Table of Contents
Financial highlights
(For a share outstanding throughout each period)
| Year ended October 31 | ||||||||||||||||||||
| CLASS R | 2019 | 2018 | 2017 | 2016 | 2015 | |||||||||||||||
Net asset value, beginning of period | $11.98 | $13.58 | $11.20 | $11.66 | $11.40 | |||||||||||||||
Net investment income | 0.22 | 1 | 0.23 | 1 | 0.20 | 1 | 0.19 | 1 | 0.15 | 1 | ||||||||||
Net realized and unrealized gains (losses) on investments | (0.15 | ) | (1.41 | ) | 2.48 | (0.53 | ) | 0.57 | ||||||||||||
|
|
|
|
|
|
|
|
|
| |||||||||||
Total from investment operations | 0.07 | (1.18 | ) | 2.68 | (0.34 | ) | 0.72 | |||||||||||||
Distributions to shareholders from | ||||||||||||||||||||
Net investment income | (0.44 | ) | (0.42 | ) | (0.30 | ) | (0.12 | ) | (0.46 | ) | ||||||||||
Net asset value, end of period | $11.61 | $11.98 | $13.58 | $11.20 | $11.66 | |||||||||||||||
Total return | 0.79 | % | (9.03 | )% | 24.47 | % | (2.94 | )% | 6.53 | % | ||||||||||
Ratios to average net assets (annualized) | ||||||||||||||||||||
Gross expenses | 1.64 | % | 1.64 | % | 1.72 | % | 1.72 | % | 1.78 | % | ||||||||||
Net expenses | 1.37 | % | 1.39 | % | 1.39 | % | 1.37 | % | 1.34 | % | ||||||||||
Net investment income | 1.88 | % | 1.72 | % | 1.66 | % | 1.77 | % | 1.23 | % | ||||||||||
Supplemental data | ||||||||||||||||||||
Portfolio turnover rate | 49 | % | 62 | % | 59 | % | 65 | % | 27 | % | ||||||||||
Net assets, end of period (000s omitted) | $794 | $1,404 | $1,996 | $2,029 | $2,147 | |||||||||||||||
| 1 | Calculated based upon average shares outstanding |
The accompanying notes are an integral part of these financial statements.
Wells Fargo International Equity Fund | 19
Table of Contents
Financial highlights
(For a share outstanding throughout each period)
| Year ended October 31 | ||||||||||||||||||||
| CLASS R6 | 2019 | 2018 | 2017 | 2016 | 20151 | |||||||||||||||
Net asset value, beginning of period | $11.79 | $13.44 | $11.06 | $11.49 | $10.89 | |||||||||||||||
Net investment income | 0.35 | 0.31 | 0.45 | 2 | 0.24 | 0.00 | 3 | |||||||||||||
Net realized and unrealized gains (losses) on investments | (0.23 | ) | (1.40 | ) | 2.27 | (0.52 | ) | 0.60 | ||||||||||||
|
|
|
|
|
|
|
|
|
| |||||||||||
Total from investment operations | 0.12 | (1.09 | ) | 2.72 | (0.28 | ) | 0.60 | |||||||||||||
Distributions to shareholders from | ||||||||||||||||||||
Net investment income | (0.60 | ) | (0.56 | ) | (0.34 | ) | (0.15 | ) | 0.00 | |||||||||||
Net asset value, end of period | $11.31 | $11.79 | $13.44 | $11.06 | $11.49 | |||||||||||||||
Total return4 | 1.27 | % | (8.57 | )% | 25.30 | % | (2.46 | )% | 5.51 | % | ||||||||||
Ratios to average net assets (annualized) | ||||||||||||||||||||
Gross expenses | 1.01 | % | 0.96 | % | 1.03 | % | 1.04 | % | 1.05 | % | ||||||||||
Net expenses | 0.81 | % | 0.84 | % | 0.84 | % | 0.85 | % | 0.88 | % | ||||||||||
Net investment income | 2.23 | % | 2.23 | % | 3.55 | % | 2.31 | % | 0.23 | % | ||||||||||
Supplemental data | ||||||||||||||||||||
Portfolio turnover rate | 49 | % | 62 | % | 59 | % | 65 | % | 27 | % | ||||||||||
Net assets, end of period (000s omitted) | $36,505 | $63,414 | $74,405 | $26 | $26 | |||||||||||||||
| 1 | For the period from September 30, 2015 (commencement of class operations) to October 31, 2015 |
| 2 | Calculated based upon average shares outstanding |
| 3 | Amount is less than $0.005. |
| 4 | Returns for periods of less than one year are not annualized. |
The accompanying notes are an integral part of these financial statements.
20 | Wells Fargo International Equity Fund
Table of Contents
Financial highlights
(For a share outstanding throughout each period)
| Year ended October 31 | ||||||||||||||||||||
| ADMINISTRATOR CLASS | 2019 | 2018 | 2017 | 2016 | 2015 | |||||||||||||||
Net asset value, beginning of period | $11.62 | $13.20 | $10.88 | $11.33 | $11.09 | |||||||||||||||
Net investment income | 0.23 | 1 | 0.20 | 1 | 0.21 | 1 | 0.22 | 0.17 | 1 | |||||||||||
Net realized and unrealized gains (losses) on investments | (0.14 | ) | (1.31 | ) | 2.43 | (0.53 | ) | 0.57 | ||||||||||||
|
|
|
|
|
|
|
|
|
| |||||||||||
Total from investment operations | 0.09 | (1.11 | ) | 2.64 | (0.31 | ) | 0.74 | |||||||||||||
Distributions to shareholders from | ||||||||||||||||||||
Net investment income | (0.49 | ) | (0.47 | ) | (0.32 | ) | (0.14 | ) | (0.50 | ) | ||||||||||
Net asset value, end of period | $11.22 | $11.62 | $13.20 | $10.88 | $11.33 | |||||||||||||||
Total return | 0.98 | % | (8.79 | )% | 24.84 | % | (2.71 | )% | 6.89 | % | ||||||||||
Ratios to average net assets (annualized) | ||||||||||||||||||||
Gross expenses | 1.36 | % | 1.31 | % | 1.39 | % | 1.38 | % | 1.40 | % | ||||||||||
Net expenses | 1.14 | % | 1.14 | % | 1.14 | % | 1.12 | % | 1.09 | % | ||||||||||
Net investment income | 2.00 | % | 1.53 | % | 1.79 | % | 1.93 | % | 1.44 | % | ||||||||||
Supplemental data | ||||||||||||||||||||
Portfolio turnover rate | 49 | % | 62 | % | 59 | % | 65 | % | 27 | % | ||||||||||
Net assets, end of period (000s omitted) | $1,189 | $5,152 | $18,174 | $36,032 | $52,469 | |||||||||||||||
| 1 | Calculated based upon average shares outstanding |
The accompanying notes are an integral part of these financial statements.
Wells Fargo International Equity Fund | 21
Table of Contents
Financial highlights
(For a share outstanding throughout each period)
| Year ended October 31 | ||||||||||||||||||||
| INSTITUTIONAL CLASS | 2019 | 2018 | 2017 | 2016 | 2015 | |||||||||||||||
Net asset value, beginning of period | $11.76 | $13.40 | $11.05 | $11.49 | $11.25 | |||||||||||||||
Net investment income | 0.33 | 0.30 | 1 | 0.28 | 1 | 0.23 | 0.19 | 1 | ||||||||||||
Net realized and unrealized gains (losses) on investments | (0.22 | ) | (1.39 | ) | 2.43 | (0.52 | ) | 0.58 | ||||||||||||
|
|
|
|
|
|
|
|
|
| |||||||||||
Total from investment operations | 0.11 | (1.09 | ) | 2.71 | (0.29 | ) | 0.77 | |||||||||||||
Distributions to shareholders from | ||||||||||||||||||||
Net investment income | (0.58 | ) | (0.55 | ) | (0.36 | ) | (0.15 | ) | (0.53 | ) | ||||||||||
Net asset value, end of period | $11.29 | $11.76 | $13.40 | $11.05 | $11.49 | |||||||||||||||
Total return | 1.19 | % | (8.56 | )% | 25.21 | % | (2.48 | )% | 7.07 | % | ||||||||||
Ratios to average net assets (annualized) | ||||||||||||||||||||
Gross expenses | 1.11 | % | 1.06 | % | 1.14 | % | 1.14 | % | 1.15 | % | ||||||||||
Net expenses | 0.86 | % | 0.89 | % | 0.89 | % | 0.87 | % | 0.84 | % | ||||||||||
Net investment income | 2.27 | % | 2.31 | % | 2.28 | % | 2.27 | % | 1.67 | % | ||||||||||
Supplemental data | ||||||||||||||||||||
Portfolio turnover rate | 49 | % | 62 | % | 59 | % | 65 | % | 27 | % | ||||||||||
Net assets, end of period (000s omitted) | $150,749 | $243,235 | $236,946 | $182,639 | $192,799 | |||||||||||||||
| 1 | Calculated based upon average shares outstanding |
The accompanying notes are an integral part of these financial statements.
22 | Wells Fargo International Equity Fund
Table of Contents
1. ORGANIZATION
Wells Fargo Funds Trust (the “Trust”), a Delaware statutory trust organized on March 10, 1999, is an open-end management investment company registered under the Investment Company Act of 1940, as amended (the “1940 Act”). As an investment company, the Trust follows the accounting and reporting guidance in Financial Accounting Standards Board (“FASB”) Accounting Standards Codification Topic 946, Financial Services – Investment Companies. These financial statements report on the Wells Fargo International Equity Fund (the “Fund”) which is a diversified series of the Trust.
2. SIGNIFICANT ACCOUNTING POLICIES
The following significant accounting policies, which are consistently followed in the preparation of the financial statements of the Fund, are in conformity with U.S. generally accepted accounting principles which require management to make estimates and assumptions that affect the reported amounts of assets and liabilities, disclosure of contingent assets and liabilities at the date of the financial statements, and the reported amounts of revenues and expenses during the reporting period. Actual results could differ from those estimates.
Securities valuation
All investments are valued each business day as of the close of regular trading on the New York Stock Exchange (generally 4 p.m. Eastern Time), although the Fund may deviate from this calculation time under unusual or unexpected circumstances.
Equity securities that are listed on a foreign or domestic exchange or market are valued at the official closing price or, if none, the last sales price. If no sale occurs on the principal exchange or market that day, a fair value price will be determined in accordance with the Fund’s Valuation Procedures.
Forward foreign currency contracts are recorded at the forward rate provided by an independent foreign currency pricing source at a time each business day specified by the Wells Fargo Asset Management Pricing Committee at Wells Fargo Funds Management, LLC (“Funds Management”).
The values of securities denominated in foreign currencies are translated into U.S. dollars at rates provided by an independent foreign currency pricing source at a time each business day specified by the Wells Fargo Asset Management Pricing Committee.
Many securities markets and exchanges outside the U.S. close prior to the close of the New York Stock Exchange and therefore may not fully reflect trading or events that occur after the close of the principal exchange in which the foreign securities are traded, but before the close of the New York Stock Exchange. If such trading or events are expected to materially affect the value of such securities, then fair value pricing procedures approved by the Board of Trustees of the Fund are applied. These procedures take into account multiple factors including movements in U.S. securities markets after foreign exchanges close. Foreign securities that are fair valued under these procedures are categorized as Level 2 and the application of these procedures may result in transfers between Level 1 and Level 2. Depending on market activity, such fair valuations may be frequent. Such fair value pricing may result in net asset values that are higher or lower than net asset values based on the last reported sales price or latest quoted bid price. On October 31, 2019, such fair value pricing was not used in pricing foreign securities.
Investments in registered open-end investment companies are valued at net asset value. Interests in non-registered investment companies that are redeemable at net asset value are fair valued normally at net asset value.
Investments which are not valued using any of the methods discussed above are valued at their fair value, as determined in good faith by the Board of Trustees. The Board of Trustees has established a Valuation Committee comprised of the Trustees and has delegated to it the authority to take any actions regarding the valuation of portfolio securities that the Valuation Committee deems necessary or appropriate, including determining the fair value of portfolio securities, unless the determination has been delegated to the Wells Fargo Asset Management Pricing Committee. The Board of Trustees retains the authority to make or ratify any valuation decisions or approve any changes to the Valuation Procedures as it deems appropriate. On a quarterly basis, the Board of Trustees receives reports on any valuation actions taken by the Valuation Committee or the Wells Fargo Asset Management Pricing Committee which may include items for ratification.
Foreign currency translation
The accounting records of the Fund are maintained in U.S. dollars. The values of other assets and liabilities denominated in foreign currencies are translated into U.S. dollars at rates provided by an independent foreign currency pricing source at a time each business day specified by the Wells Fargo Asset Management Pricing Committee. Purchases and sales of securities, and income and expenses are converted at the rate of exchange on the respective dates of such transactions. Net realized foreign exchange gains or losses arise from sales of foreign currencies, currency gains or losses realized between the trade and settlement dates on securities transactions, and the difference between the amounts of dividends, interest and foreign withholding taxes recorded and the U.S. dollar equivalent of the amounts actually paid or received. Net unrealized foreign exchange gains and losses arise
Wells Fargo International Equity Fund | 23
Table of Contents
Notes to financial statements
from changes in the fair value of assets and liabilities other than investments in securities resulting from changes in exchange rates. The changes in net assets arising from changes in exchange rates of securities and the changes in net assets resulting from changes in market prices of securities are not separately presented. Such changes are included in net realized and unrealized gains or losses from investments.
Forward foreign currency contracts
A forward foreign currency contract is an agreement between two parties to purchase or sell a specific currency for an agreed-upon price at a future date. The Fund enters into forward foreign currency contracts to facilitate transactions in foreign-denominated securities and to attempt to minimize the risk to the Fund from adverse changes in the relationship between currencies. Forward foreign currency contracts are recorded at the forward rate and marked-to-market daily. When the contracts are closed, realized gains and losses arising from such transactions are recorded as realized gains or losses on forward foreign currency contracts. The Fund is subject to foreign currency risk and may be exposed to risks if the counterparties to the contracts are unable to meet the terms of their contracts or if the value of the foreign currency changes unfavorably. The Fund’s maximum risk of loss from counterparty credit risk is the unrealized gains on the contracts. This risk may be mitigated if there is a master netting arrangement between the Fund and the counterparty.
Securities lending
The Fund may lend its securities from time to time in order to earn additional income in the form of fees or interest on securities received as collateral or the investment of any cash received as collateral. When securities are on loan, the Fund receives interest or dividends on those securities. Cash collateral received in connection with its securities lending transactions is invested in Securities Lending Cash Investments, LLC (the “Securities Lending Fund”). Investments in Securities Lending Fund are valued at the evaluated bid price provided by an independent pricing service. Income earned from investment in the Securities Lending Fund (net of fees and rebates), if any, is included in income from affiliated securities on the Statement of Operations.
In a securities lending transaction, the net asset value of the Fund is affected by an increase or decrease in the value of the securities loaned and by an increase or decrease in the value of the instrument in which collateral is invested. The amount of securities lending activity undertaken by the Fund fluctuates from time to time. The Fund has the right under the lending agreement to recover the securities from the borrower on demand. In the event of default or bankruptcy by the borrower, the Fund may be prevented from recovering the loaned securities or gaining access to the collateral or may experience delays or costs in doing so. In such an event, the terms of the agreement allows the unaffiliated securities lending agent to use the collateral to purchase replacement securities on behalf of the Fund or pay the Fund the market value of the loaned securities. The Fund bears the risk of loss with respect to depreciation of its investment of the cash collateral.
Security transactions and income recognition
Securities transactions are recorded on a trade date basis. Realized gains or losses are recorded on the basis of identified cost.
Dividend income is recognized on the ex-dividend date, except for certain dividends from foreign securities, which are recorded as soon as the custodian verifies the ex-dividend date. Dividend income from foreign securities is recorded net of foreign taxes withheld where recovery of such taxes is not assured.
Distributions to shareholders
Distributions to shareholders are recorded on the ex-dividend date and paid from net investment income quarterly and any net realized gains are paid at least annually. Such distributions are determined in accordance with income tax regulations and may differ from U.S. generally accepted accounting principles. Dividend sources are estimated at the time of declaration. The tax character of distributions is determined as of the Fund’s fiscal year end. Therefore, a portion of the Fund’s distributions made prior to the Fund’s fiscal year end may be categorized as a tax return of capital at year end.
Federal and other taxes
The Fund intends to continue to qualify as a regulated investment company by distributing substantially all of its investment company taxable income and any net realized capital gains (after reduction for capital loss carryforwards) sufficient to relieve it from all, or substantially all, federal income taxes. Accordingly, no provision for federal income taxes was required.
The Fund’s income and federal excise tax returns and all financial records supporting those returns for the prior three fiscal years are subject to examination by the federal and Delaware revenue authorities. Management has analyzed the Fund’s tax positions taken on federal, state, and foreign tax returns for all open tax years and does not believe that there are any uncertain tax positions that require recognition of a tax liability.
24 | Wells Fargo International Equity Fund
Table of Contents
Notes to financial statements
As of October 31, 2019, the aggregate cost of all investments for federal income tax purposes was $259,646,902 and the unrealized gains (losses) consisted of:
Gross unrealized gains | $ | 36,985,343 | ||
Gross unrealized losses | (20,935,256 | ) | ||
Net unrealized gains | $ | 16,050,087 | ||
As of October 31, 2019, the Fund had capital loss carryforwards which consist of $11,301,468 in short-term capital losses and $3,067,307 in long-term capital losses.
Class allocations
The separate classes of shares offered by the Fund differ principally in applicable sales charges, distribution, shareholder servicing, and administration fees. Class specific expenses are charged directly to that share class. Investment income, common fund-level expenses, and realized and unrealized gains (losses) on investments are allocated daily to each class of shares based on the relative proportion of net assets of each class.
3. FAIR VALUATION MEASUREMENTS
Fair value measurements of investments are determined within a framework that has established a fair value hierarchy based upon the various data inputs utilized in determining the value of the Fund’s investments. The three-level hierarchy gives the highest priority to unadjusted quoted prices in active markets for identical assets or liabilities (Level 1) and the lowest priority to unobservable inputs (Level 3). The Fund’s investments are classified within the fair value hierarchy based on the lowest level of input that is significant to the fair value measurement. The inputs are summarized into three broad levels as follows:
| ∎ | Level 1 – quoted prices in active markets for identical securities |
| ∎ | Level 2 – other significant observable inputs (including quoted prices for similar securities, interest rates, prepayment speeds, credit risk, etc.) |
| ∎ | Level 3 – significant unobservable inputs (including the Fund’s own assumptions in determining the fair value of investments) |
The inputs or methodologies used for valuing investments in securities are not necessarily an indication of the risk associated with investing in those securities.
Wells Fargo International Equity Fund | 25
Table of Contents
Notes to financial statements
The following is a summary of the inputs used in valuing the Fund’s assets and liabilities as of October 31, 2019:
| Quoted prices (Level 1) | Other significant observable inputs (Level 2) | Significant (Level 3) | Total | |||||||||||||
Assets | ||||||||||||||||
Investments in: | ||||||||||||||||
Common stocks | ||||||||||||||||
Australia | $ | 1,111,795 | $ | 0 | $ | 0 | $ | 1,111,795 | ||||||||
Brazil | 1,443,812 | 0 | 0 | 1,443,812 | ||||||||||||
Canada | 11,664,779 | 0 | 0 | 11,664,779 | ||||||||||||
China | 31,487,089 | 0 | 0 | 31,487,089 | ||||||||||||
France | 12,558,658 | 0 | 0 | 12,558,658 | ||||||||||||
Germany | 14,478,536 | 0 | 0 | 14,478,536 | ||||||||||||
Hong Kong | 6,436,611 | 0 | 0 | 6,436,611 | ||||||||||||
India | 4,890,574 | 0 | 0 | 4,890,574 | ||||||||||||
Ireland | 5,223,482 | 0 | 0 | 5,223,482 | ||||||||||||
Israel | 7,902,760 | 0 | 0 | 7,902,760 | ||||||||||||
Italy | 16,125,057 | 0 | 0 | 16,125,057 | ||||||||||||
Japan | 32,154,605 | 0 | 0 | 32,154,605 | ||||||||||||
Malaysia | 4,943,986 | 0 | 0 | 4,943,986 | ||||||||||||
Mexico | 2,674,419 | 0 | 0 | 2,674,419 | ||||||||||||
Netherlands | 20,074,325 | 0 | 0 | 20,074,325 | ||||||||||||
Norway | 6,604,885 | 0 | 0 | 6,604,885 | ||||||||||||
Russia | 7,322,639 | 0 | 0 | 7,322,639 | ||||||||||||
Singapore | 7,660,489 | 0 | 0 | 7,660,489 | ||||||||||||
South Korea | 12,762,132 | 0 | 0 | 12,762,132 | ||||||||||||
Switzerland | 13,505,795 | 0 | 0 | 13,505,795 | ||||||||||||
Thailand | 6,024,963 | 0 | 0 | 6,024,963 | ||||||||||||
United Kingdom | 35,651,351 | 0 | 0 | 35,651,351 | ||||||||||||
United States | 11,254,151 | 0 | 0 | 11,254,151 | ||||||||||||
Short-term investments | ||||||||||||||||
Investment companies | 2,779,280 | 0 | 0 | 2,779,280 | ||||||||||||
Total assets | $ | 276,736,173 | $ | 0 | $ | 0 | $ | 276,736,173 | ||||||||
Liabilities | ||||||||||||||||
Forward foreign currency contracts | $ | 0 | $ | 1,039,184 | $ | 0 | $ | 1,039,184 | ||||||||
Total liabilities | $ | 0 | $ | 1,039,184 | $ | 0 | $ | 1,039,184 | ||||||||
Additional sector, industry or geographic detail is included in the Portfolio of Investments.
Forward foreign currency contracts are reported at their cumulative unrealized gains (losses) at measurement date as reported in the table following the Portfolio of Investments. All other assets and liabilities are reported at their market value at measurement date.
For the year ended October 31, 2019, the Fund did not have any transfers into/out of Level 3.
4. TRANSACTIONS WITH AFFILIATES
Management fee
Funds Management, an indirect wholly owned subsidiary of Wells Fargo & Company (“Wells Fargo”), is the manager of the Fund and provides advisory and fund-level administrative services under an investment management agreement. Under the investment management agreement, Funds Management is responsible for, among other services, implementing the investment objectives and strategies of the Fund, supervising the subadviser and providing fund-level administrative services in connection with the
26 | Wells Fargo International Equity Fund
Table of Contents
Notes to financial statements
Fund’s operations. As compensation for its services under the investment management agreement, Funds Management is entitled to receive a management fee at the following annual rate based on the Fund’s average daily net assets:
| Average daily net assets | Management fee | |||
First $500 million | 0.850 | % | ||
Next $500 million | 0.800 | |||
Next $1 billion | 0.750 | |||
Next $2 billion | 0.725 | |||
Next $1 billion | 0.700 | |||
Next $5 billion | 0.690 | |||
Over $10 billion | 0.680 | |||
For the year ended October 31, 2019, the management fee was equivalent to an annual rate of 0.85% of the Fund’s average daily net assets.
Administration fees
Under a class-level administration agreement, Funds Management provides class-level administrative services to the Fund, which includes paying fees and expenses for services provided by the transfer agent, sub-transfer agents, omnibus account servicers and record-keepers. As compensation for its services under the class-level administration agreement, Funds Management receives an annual fee which is calculated based on the average daily net assets of each class as follows:
| Class-level administration fee | ||||
Class A, Class C, Class R | 0.21 | % | ||
Class R6 | 0.03 | |||
Administrator Class, Institutional Class | 0.13 | |||
Waivers and/or expense reimbursements
Funds Management has contractually waived and/or reimbursed management and administration fees to the extent necessary to maintain certain net operating expense ratios for the Fund. When each class of the Fund has exceeded its expense cap, Funds Management has waived fees and/or reimbursed expenses from fund-level expenses on a proportionate basis and then from class specific expenses. When only certain classes exceed their expense caps, waivers and/or reimbursements are applied against class specific expenses before fund-level expenses. Funds Management has committed through February 29, 2020 to waive fees and/or reimburse expenses to the extent necessary to cap the Fund’s expenses at 1.14% for Class A shares, 1.89% for Class C shares, 1.39% for Class R shares, 0.79% for Class R6 shares, 1.14% for Administrator Class shares, and 0.84% for Institutional Class shares. Prior to or after the commitment expiration date, the cap may be increased or the commitment to maintain the cap may be terminated only with the approval of the Board of Trustees. Prior to March 1, 2019, the Fund’s expenses were capped at 0.84% for Class R6 shares and 0.89% for Institutional Class shares.
Distribution fees
The Trust has adopted a distribution plan for Class C and Class R shares of the Fund pursuant to Rule 12b-1 under the 1940 Act. Distribution fees are charged to Class C and Class R shares and paid to Wells Fargo Funds Distributor, LLC (“Funds Distributor”), the principal underwriter, at an annual rate of 0.75% of the average daily net assets of Class C shares and 0.25% of the average daily net assets of Class R shares.
In addition, Funds Distributor is entitled to receive the front-end sales charge from the purchase of Class A shares and a contingent deferred sales charge on the redemption of certain Class A shares. Funds Distributor is also entitled to receive the contingent deferred sales charges from redemptions of Class C shares. For the year ended October 31, 2019, Funds Distributor received $2,452 from the sale of Class A shares. No contingent deferred sales charges were incurred by Class A and Class C shares for the year ended October 31, 2019.
Shareholder servicing fees
The Trust has entered into contracts with one or more shareholder servicing agents, whereby Class A, Class C, Class R, and Administrator Class of the Fund are charged a fee at an annual rate of 0.25% of the average daily net assets of each respective class. A portion of these total shareholder servicing fees were paid to affiliates of Wells Fargo.
Wells Fargo International Equity Fund | 27
Table of Contents
Notes to financial statements
Interfund transactions
The Fund may purchase or sell portfolio investment securities to certain other Wells Fargo affiliates pursuant to Rule 17a-7 under the 1940 Act and under procedures adopted by the Board of Trustees. The procedures have been designed to ensure that these interfund transactions, which do not incur broker commissions, are effected at current market prices.
5. INVESTMENT PORTFOLIO TRANSACTIONS
Purchases and sales of investments, excluding U.S. government obligations (if any) and short-term securities, for the year ended October 31, 2019 were $158,873,695 and $285,291,961, respectively.
6. SECURITIES LENDING TRANSACTIONS
The Fund lends its securities through an unaffiliated securities lending agent and receives collateral in the form of cash or securities with a value at least equal to the value of the securities on loan. The value of the loaned securities is determined at the close of each business day and any increases or decreases in the required collateral are exchanged between the Fund and the counterparty on the next business day. Cash collateral received is invested in the Securities Lending Fund which seeks to provide a positive return compared to the daily Fed Funds Open Rate by investing in high-quality, U.S. dollar-denominated short-term money market instruments and is exempt from registration under Section 3(c)(7) of the 1940 Act. Securities Lending Fund is managed by Funds Management and is subadvised by Wells Capital Management Incorporated (“WellsCap”), an affiliate of Funds Management and an indirect wholly owned subsidiary of Wells Fargo. Funds Management receives an advisory fee starting at 0.05% and declining to 0.01% as the average daily net assets of the Securities Lending Fund increase. All of the fees received by Funds Management are paid to WellsCap for its services as subadviser.
In the event of counterparty default or the failure of a borrower to return a loaned security, the Fund has the right to use the collateral to offset any losses incurred. As of October 31, 2019, the Fund did not have any securities on loan.
7. DERIVATIVE TRANSACTIONS
During the year ended October 31, 2019, the Fund entered into forward foreign currency contracts for economic hedging purposes. The Fund had average contract amounts of $3,640,292 and $36,746,063 in forward foreign currency contracts to buy and forward foreign currency contracts to sell, respectively, during the year ended October 31, 2019.
The fair value, realized gains or losses and change in unrealized gains or losses, if any, on derivative instruments are reflected in the corresponding financial statement captions.
For certain types of derivative transactions, the Fund has entered into International Swaps and Derivatives Association, Inc. master agreements (“ISDA Master Agreements”) or similar agreements with approved counterparties. The ISDA Master Agreements or similar agreements may have requirements to deliver/deposit securities or cash to/with an exchange or broker-dealer as collateral and allows the Fund to offset, with each counterparty, certain derivative financial instrument’s assets and/or liabilities with collateral held or pledged. Collateral requirements differ by type of derivative. Collateral or margin requirements are set by the broker or exchange clearinghouse for exchange traded derivatives while collateral terms are contract specific for over-the-counter traded derivatives. Cash collateral that has been pledged to cover obligations of the Fund under ISDA Master Agreements or similar agreements, if any, are reported separately in the Statement of Assets and Liabilities. Securities pledged as collateral, if any, are noted in the Portfolio of Investments. With respect to balance sheet offsetting, absent an event of default by the counterparty or a termination of the agreement, the reported amounts of financial assets and financial liabilities in the Statement of Assets and Liabilities are not offset across transactions between the Fund and the applicable counterparty. A reconciliation of the gross amounts on the Statement of Assets and Liabilities to the net amounts by counterparty, including any collateral exposure, for OTC derivatives is as follows:
| Counterparty | Gross amounts of liabilities in the Statement of Assets and Liabilities | Amounts subject to netting agreements | Collateral pledged1 | Net amount of liabilities | ||||||||||||
Credit Suisse | $ | 32,775 | $ | 0 | $ | 0 | $ | 32,775 | ||||||||
Morgan Stanley | 1,006,409 | 0 | 830,000 | 176,409 | ||||||||||||
| 1 | Collateral pledged within this table is limited to the collateral for the net transaction with the counterparty. |
28 | Wells Fargo International Equity Fund
Table of Contents
Notes to financial statements
8. BANK BORROWINGS
The Trust (excluding the money market funds), Wells Fargo Master Trust and Wells Fargo Variable Trust are parties to a $280,000,000 revolving credit agreement whereby the Fund is permitted to use bank borrowings for temporary or emergency purposes, such as to fund shareholder redemption requests. Interest under the credit agreement is charged to the Fund based on a borrowing rate equal to the higher of the Federal Funds rate in effect on that day plus 1.25% or the overnight LIBOR rate in effect on that day plus 1.25%. In addition, an annual commitment fee equal to 0.25% of the unused balance is allocated to each participating fund.
During the year ended October 31, 2019, the Fund had average borrowings outstanding of $423,003 at an interest rate of 3.73% and paid interest in the amount of $15,777.
9. DISTRIBUTIONS TO SHAREHOLDERS
The tax character of distributions paid was $16,091,812 and $18,812,385 of ordinary income for the years ended October 31, 2019 and October 31, 2018, respectively.
As of October 31, 2019, the components of distributable earnings on a tax basis were as follows:
Undistributed ordinary income | Unrealized gains | Capital loss carryforward | ||
| $1,516,246 | $16,029,025 | $(14,368,775) | ||
10. INDEMNIFICATION
Under the Trust’s organizational documents, the officers and Trustees have been granted certain indemnification rights against certain liabilities that may arise out of performance of their duties to the Trust. At a meeting held on November 21-22, 2019, the Board of Trustees of the Fund approved a proposal to authorize the Fund to enter into a separate agreement with each Trustee that would convert indemnification rights currently existing under the Fund’s organizational documents into contractual rights that could not be changed in the future without the consent of the Trustee. Additionally, in the normal course of business, the Trust may enter into contracts with service providers that contain a variety of indemnification clauses. The Trust’s maximum exposure under these arrangements is dependent on future claims that may be made against the Fund and, therefore, cannot be estimated.
11. NEW ACCOUNTING PRONOUNCEMENT
In August 2018, FASB issued Accounting Standards Update (“ASU”) No. 2018-13, Fair Value Measurement (Topic 820)Disclosure Framework—Changes to the Disclosure Requirements for Fair Value Measurement.ASU 2018-13 updates the disclosure requirements for fair value measurements by modifying or removing certain disclosures and adding certain new disclosures. The amendments are effective for fiscal years, and interim periods within those fiscal years, beginning after December 15, 2019. Early adoption is permitted. Management has adopted the removal and modification of disclosures early, as permitted, and will adopt the additional new disclosures at the effective date.
Wells Fargo International Equity Fund | 29
Table of Contents
Report of independent registered public accounting firm
TO THE SHAREHOLDERS OF THE FUND AND BOARD OF TRUSTEES OF WELLS FARGO FUNDS TRUST:
Opinion on the Financial Statements
We have audited the accompanying statement of assets and liabilities of Wells Fargo International Equity Fund (the Fund), one of the funds constituting Wells Fargo Funds Trust, including the portfolio of investments, as of October 31, 2019, the related statement of operations for the year then ended, the statements of changes in net assets for each of the years in the two-year period then ended, and the related notes (collectively, the financial statements) and the financial highlights for each of the years or periods in the five-year period then ended. In our opinion, the financial statements and financial highlights present fairly, in all material respects, the financial position of the Fund as of October 31, 2019, the results of its operations for the year then ended, the changes in its net assets for each of the years in the two-year period then ended, and the financial highlights for each of the years or periods in the five-year period then ended, in conformity with U.S. generally accepted accounting principles.
Basis for Opinion
These financial statements and financial highlights are the responsibility of the Fund’s management. Our responsibility is to express an opinion on these financial statements and financial highlights based on our audits. We are a public accounting firm registered with the Public Company Accounting Oversight Board (United States) (PCAOB) and are required to be independent with respect to the Fund in accordance with the U.S. federal securities laws and the applicable rules and regulations of the Securities and Exchange Commission and the PCAOB.
We conducted our audits in accordance with the standards of the PCAOB. Those standards require that we plan and perform the audit to obtain reasonable assurance about whether the financial statements and financial highlights are free of material misstatement, whether due to error or fraud. Our audits included performing procedures to assess the risks of material misstatement of the financial statements and financial highlights, whether due to error or fraud, and performing procedures that respond to those risks. Such procedures included examining, on a test basis, evidence regarding the amounts and disclosures in the financial statements and financial highlights. Such procedures also included confirmation of securities owned as of October 31, 2019, by correspondence with the custodian and transfer agent. Our audits also included evaluating the accounting principles used and significant estimates made by management, as well as evaluating the overall presentation of the financial statements and financial highlights. We believe that our audits provide a reasonable basis for our opinion.

We have not been able to determine the specific year that we began serving as the auditor of one or more Wells Fargo Funds investment companies; however we are aware that we have served as the auditor of one or more Wells Fargo Funds investment companies since at least 1955.
Boston, Massachusetts
December 20, 2019
30 | Wells Fargo International Equity Fund
Table of Contents
TAX INFORMATION
For corporate shareholders, pursuant to Section 854 of the Internal Revenue Code, 91.75% of ordinary income dividends qualify for the corporate dividends-received deduction for the fiscal year ended October 31, 2019.
Pursuant to Section 854 of the Internal Revenue Code, $14,763,711 of income dividends paid during the fiscal year ended October 31, 2019 has been designated as qualified dividend income (QDI).
For the fiscal year ended October 31, 2019, $218,820 has been designated as interest-related dividends for nonresident alien shareholders pursuant to Section 871 of the Internal Revenue Code.
Pursuant to Section 853 of the Internal Revenue Code, the Fund expects to designate amounts as foreign taxes paid for the fiscal year ended October 31, 2019. Additional details will be available in the semiannual report.
PROXY VOTING INFORMATION
A description of the policies and procedures used to determine how to vote proxies relating to portfolio securities is available, upon request, by calling1-800-222-8222, visiting our website atwfam.com, or visiting the SEC website at sec.gov. Information regarding how the proxies related to portfolio securities were voted during the most recent 12-month period ended June 30 is available on the website atwfam.comor by visiting the SEC website at sec.gov.
QUARTERLY PORTFOLIO HOLDINGS INFORMATION
The Fund files its complete schedule of portfolio holdings with the SEC for the first and third quarters of each fiscal year on Form N-Q or Form N-PORT, which is available by visiting the SEC website at sec.gov. Those forms may be reviewed and copied at the SEC’s Public Reference Room in Washington, DC. Information on the operation of the Public Reference Room may be obtained by calling1-800-SEC-0330.
Wells Fargo International Equity Fund | 31
Table of Contents
Other information (unaudited)
BOARD OF TRUSTEES AND OFFICERS
Each of the Trustees and Officers1 listed in the table below acts in identical capacities for each fund in the Wells Fargo family of funds, which consists of 150 mutual funds comprising the Wells Fargo Funds Trust, Wells Fargo Variable Trust, Wells Fargo Master Trust and four closed-end funds (collectively the “Fund Complex”). This table should be read in conjunction with the Prospectus and the Statement of Additional Information2. The mailing address of each Trustee and Officer is 525 Market Street, 12th Floor, San Francisco, CA 94105. Each Trustee and Officer serves an indefinite term, however, each Trustee serves such term until reaching the mandatory retirement age established by the Trustees.
Independent Trustees
Name and year of birth | Position held and length of service* | Principal occupations during past five years or longer | Current other public company or investment company directorships | |||
William R. Ebsworth (Born 1957) | Trustee, since 2015 | Retired. From 1984 to 2013, equities analyst, portfolio manager, research director and chief investment officer at Fidelity Management and Research Company in Boston, Tokyo, and Hong Kong, and retired in 2013 as Chief Investment Officer of Fidelity Strategic Advisers, Inc. where he led a team of investment professionals managing client assets. Prior thereto, Board member of Hong Kong Securities Clearing Co., Hong Kong Options Clearing Corp., the Thailand International Fund, Ltd., Fidelity Investments Life Insurance Company, and Empire Fidelity Investments Life Insurance Company. Audit Committee Chair and Investment Committee Chair of the Vincent Memorial Hospital Endowment (non-profit organization). Mr. Ebsworth is a CFA® charterholder. | N/A | |||
Jane A. Freeman (Born 1953) | Trustee, since 2015; Chair Liaison, since 2018 | Retired. From 2012 to 2014 and 1999 to 2008, Chief Financial Officer of Scientific Learning Corporation. From 2008 to 2012, Ms. Freeman provided consulting services related to strategic business projects. Prior to 1999, Portfolio Manager at Rockefeller & Co. and Scudder, Stevens & Clark. Board member of the Harding Loevner Funds from 1996 to 2014, serving as both Lead Independent Director and chair of the Audit Committee. Board member of the Russell Exchange Traded Funds Trust from 2011 to 2012 and the chair of the Audit Committee. Ms. Freeman is a Board Member of The Ruth Bancroft Garden (non-profit organization). She is also an inactive Chartered Financial Analyst. | N/A | |||
Isaiah Harris, Jr. (Born 1952) | Trustee, since 2009; Audit Committee Chairman, since 2019 | Retired. Chairman of the Board of CIGNA Corporation since 2009, and Director since 2005. From 2003 to 2011, Director of Deluxe Corporation. Prior thereto, President and CEO of BellSouth Advertising and Publishing Corp. from 2005 to 2007, President and CEO of BellSouth Enterprises from 2004 to 2005 and President of BellSouth Consumer Services from 2000 to 2003. Emeritus member of the Iowa State University Foundation Board of Governors. Emeritus Member of the Advisory Board of Iowa State University School of Business. Advisory Board Member, Palm Harbor Academy (private school). Advisory Board Member, Child Evangelism Fellowship (non-profit). Mr. Harris is a certified public accountant (inactive status). | CIGNA Corporation | |||
Judith M. Johnson (Born 1949) | Trustee, since 2008; Audit Committee Chairman, from 2009 to 2018 | Retired. Prior thereto, Chief Executive Officer and Chief Investment Officer of Minneapolis Employees Retirement Fund from 1996 to 2008. Ms. Johnson is an attorney, certified public accountant and a certified managerial accountant. | N/A | |||
32 | Wells Fargo International Equity Fund
Table of Contents
Other information (unaudited)
Name and year of birth | Position held and length of service* | Principal occupations during past five years or longer | Current other public company or investment company directorships | |||
David F. Larcker (Born 1950) | Trustee, since 2009 | James Irvin Miller Professor of Accounting at the Graduate School of Business, Stanford University, Director of the Corporate Governance Research Initiative and Senior Faculty of The Rock Center for Corporate Governance since 2006. From 2005 to 2008, Professor of Accounting at the Graduate School of Business, Stanford University. Prior thereto, Ernst & Young Professor of Accounting at The Wharton School, University of Pennsylvania from 1985 to 2005. | N/A | |||
Olivia S. Mitchell (Born 1953) | Trustee, since 2006; Nominating and Governance Committee Chair, since 2018 | International Foundation of Employee Benefit Plans Professor, Wharton School of the University of Pennsylvania since 1993. Director of Wharton’s Pension Research Council and Boettner Center on Pensions & Retirement Research, and Research Associate at the National Bureau of Economic Research. Previously, Cornell University Professor from 1978 to 1993. | N/A | |||
Timothy J. Penny (Born 1951) | Trustee, since 1996; Chairman, since 2018 | President and Chief Executive Officer of Southern Minnesota Initiative Foundation, a non-profit organization, since 2007. Member of the Board of Trustees of NorthStar Education Finance, Inc., a non-profit organization, since 2007. | N/A | |||
James G. Polisson (Born 1959) | Trustee, since 2018 | Retired. Chief Marketing Officer, Source (ETF) UK Services, Ltd, from 2015 to 2017. From 2012 to 2015, Principal of The Polisson Group, LLC, a management consulting, corporate advisory and principal investing company. Chief Executive Officer and Managing Director at Russell Investments, Global Exchange Traded Funds from 2010 to 2012. Managing Director of Barclays Global Investors from 1998 to 2010 and Global Chief Marketing Officer for iShares and Barclays Global Investors from 2000 to 2010. Trustee of the San Francisco Mechanics’ Institute, a non-profit organization, from 2013 to 2015. Board member of the Russell Exchange Traded Fund Trust from 2011 to 2012. Director of Barclays Global Investors Holdings Deutschland GmbH from 2006 to 2009. Mr. Polisson is an attorney and has a retired status with the Massachusetts and District of Columbia Bar Associations. | N/A | |||
Pamela Wheelock3 (Born 1959) | Trustee, since January 2020; previously Trustee from January 2018 to July 2019 | Board member of the Destination Medical Center Economic Development Agency, Rochester, Minnesota since 2019. Acting Commissioner, Minnesota Department of Human Services, July 2019 through September 2019. Human Services Manager (part-time), Minnesota Department of Human Services, October 2019 through December 2019. Chief Operating Officer, Twin Cities Habitat for Humanity from 2017 to 2019. Vice President of University Services, University of Minnesota from 2012 to 2016. Prior thereto, on the Board of Directors, Governance Committee and Finance Committee for the Minnesota Philanthropy Partners (Saint Paul Foundation) from 2012 to 2018, Interim Chief Executive Officer of Blue Cross Blue Shield of Minnesota from 2011 to 2012, Chairman of the Board from 2009 to 2012 and Board Director from 2003 to 2015. Vice President, Leadership and Community Engagement, Bush Foundation, Saint Paul, Minnesota (a private foundation) from 2009 to 2011. Executive Vice President and Chief Financial Officer, Minnesota Sports and Entertainment from 2004 to 2009 and Senior Vice President from 2002 to 2004. Executive Vice President of the Minnesota Wild Foundation from 2004 to 2008. Commissioner of Finance, State of Minnesota, from 1999 to 2002. Currently Board Chair of the Minnesota Wild Foundation since 2010. | N/A | |||
| * | Length of service dates reflect the Trustee’s commencement of service with the Trust’s predecessor entities, where applicable. |
Wells Fargo International Equity Fund | 33
Table of Contents
Other information (unaudited)
Officers
Name and year of birth | Position held and length of service | Principal occupations during past five years or longer | ||
Andrew Owen (Born 1960) | President, since 2017 | Executive Vice President of Wells Fargo & Company and Head of Affiliated Managers, Wells Fargo Asset Management, since 2014. In addition, Mr. Owen is currently President, Chief Executive Officer and Director of Wells Fargo Funds Management, LLC since 2017. Prior thereto, Executive Vice President responsible for marketing, investments and product development for Wells Fargo Funds Management, LLC, from 2009 to 2014. | ||
Jeremy DePalma1 (Born 1974) | Treasurer, since 2012 | Senior Vice President of Wells Fargo Funds Management, LLC since 2009. Senior Vice President of Evergreen Investment Management Company, LLC from 2008 to 2010 and head of the Fund Reporting and Control Team within Fund Administration from 2005 to 2010. | ||
Michelle Rhee4 (Born 1966) | Chief Legal Officer, since 2019 | Secretary of Wells Fargo Funds Management, LLC, Chief Legal Counsel of Wells Fargo Asset Management and Assistant General Counsel of Wells Fargo Bank, N.A. since 2018. Associate General Counsel and Managing Director of Bank of America Corporation from 2004 to 2018. | ||
Catherine Kennedy5 (Born 1969) | Secretary, since 2019 | Vice President of Wells Fargo Funds Management, LLC and Senior Counsel of the Wells Fargo Legal Department since 2010. Vice President and Senior Counsel of Evergreen Investment Management Company, LLC from 1998 to 2010. | ||
Michael H. Whitaker (Born 1967) | Chief Compliance Officer, since 2016 | Chief Compliance Officer of Wells Fargo Asset Management since 2016. Senior Vice President and Chief Compliance Officer for Fidelity Investments from 2007 to 2016. | ||
David Berardi (Born 1975) | Assistant Treasurer, since 2009 | Vice President of Wells Fargo Funds Management, LLC since 2009. Vice President of Evergreen Investment Management Company, LLC from 2008 to 2010. Manager of Fund Reporting and Control for Evergreen Investment Management Company, LLC from 2004 to 2010. | ||
| 1 | Jeremy DePalma acts as Treasurer of 86 funds and Assistant Treasurer of 64 funds in the Fund Complex. |
| 2 | The Statement of Additional Information includes additional information about the Trustees and is available, without charge, upon request, by calling 1-800-222-8222 or by visiting the website atwfam.com. |
| 3 | Ms. Wheelock was re-appointed to the Board effective January 1, 2020. |
| 4 | Michelle Rhee became Chief Legal Officer effective October 22, 2019. |
| 5 | Catherine Kennedy became Secretary effective October 22, 2019. |
34 | Wells Fargo International Equity Fund
Table of Contents
Other information (unaudited)
BOARD CONSIDERATION OF INVESTMENT MANAGEMENT AND SUB-ADVISORY AGREEMENTS:
Wells Fargo International Equity Fund
Under the Investment Company Act of 1940 (the “1940 Act”), the Board of Trustees (the “Board”) of Wells Fargo Funds Trust (the “Trust”) must determine annually whether to approve the continuation of the Trust’s investment management andsub-advisory agreements. In this regard, at an in-person meeting held on May 21-22, 2019 (the “Meeting”), the Board, all the members of which have no direct or indirect interest in the investment management and sub-advisory agreements and are not “interested persons” of the Trust, as defined in the 1940 Act (the “Independent Trustees”), reviewed and approved for Wells Fargo International Equity Fund (the “Fund”): (i) an investment management agreement (the “Management Agreement”) with Wells Fargo Funds Management, LLC (“Funds Management”); and (ii) an investment sub-advisory agreement (the“Sub-Advisory Agreement”) with Wells Capital Management Incorporated (the “Sub-Adviser”), an affiliate of Funds Management. The Management Agreement and the Sub-Advisory Agreement are collectively referred to as the “Advisory Agreements.”
At the Meeting, the Board considered the factors and reached the conclusions described below relating to the selection of Funds Management and the Sub-Adviser and the approval of the Advisory Agreements. Prior to the Meeting, including at anin-person meeting in April 2019, the Trustees conferred extensively among themselves and with representatives of Funds Management about these matters. Also, the Board has adopted a team-based approach, with each team consisting of a sub-set of Trustees, to assist the full Board in the discharge of its duties in reviewing investment performance and other matters throughout the year. The Independent Trustees were assisted in their evaluation of the Advisory Agreements by independent legal counsel, from whom they received separate legal advice and with whom they met separately.
In providing information to the Board, Funds Management and the Sub-Adviser were guided by a detailed set of requests for information submitted to them by independent legal counsel on behalf of the Independent Trustees at the start of the Board’s annual contract renewal process earlier in 2019. In considering and approving the Advisory Agreements, the Trustees considered the information they believed relevant, including but not limited to the information discussed below. The Board considered not only the specific information presented in connection with the Meeting, but also the knowledge gained over time through interaction with Funds Management and the Sub-Adviser about various topics. In this regard, the Board reviewed reports of Funds Management at each of its quarterly meetings, which included, among other things, portfolio reviews and investment performance reports. In addition, the Board and the teams mentioned above confer with portfolio managers at various times throughout the year. The Board did not identify any particular information or consideration that was all-important or controlling, and each individual Trustee may have attributed different weights to various factors.
After its deliberations, the Board unanimously approved the continuation of the Advisory Agreements for a one-year term and determined that the compensation payable to Funds Management and the Sub-Adviser under each of the Advisory Agreements was reasonable. The Board considered the approval of the Advisory Agreements for the Fund as part of its consideration of agreements for funds across the complex, but its approvals were made on a fund-by-fund basis. The following summarizes a number of important, but not necessarily all, factors considered by the Board in support of its approvals.
Nature, extent and quality of services
The Board received and considered various information regarding the nature, extent and quality of services provided to the Fund by Funds Management and the Sub-Adviser under the Advisory Agreements. This information included a description of the investment advisory services and Fund-level administrative services covered by the Management Agreement, as well as, among other things, a summary of the background and experience of senior management of Wells Fargo Asset Management (“WFAM”), of which Funds Management and the Sub-Adviser are a part, a summary of investments made in the business of WFAM, a summary of certain organizational and personnel changes involving Funds Management and the Sub-Adviser, and a description of Funds Management’s and the Sub-Adviser’s business continuity planning programs and of their approaches to data privacy and cybersecurity. The Board received and reviewed information about Funds Management’s role as administrator of the Fund’s liquidity risk management program. The Board also considered the qualifications, background, tenure and responsibilities of each of the portfolio managers primarily responsible for the day-to-day portfolio management of the Fund.
The Board evaluated the ability of Funds Management and the Sub-Adviser to attract and retain qualified investment professionals, including research, advisory and supervisory personnel. The Board further considered the compliance programs and compliance records of Funds Management and the Sub-Adviser. In addition, the Board took into account the full range of services provided to the Fund by Funds Management and its affiliates.
Wells Fargo International Equity Fund | 35
Table of Contents
Other information (unaudited)
Fund investment performance and expenses
The Board considered the investment performance results for the Fund over various time periods ended December 31, 2018. The Board considered these results in comparison to the investment performance of funds in a universe that was determined by Broadridge Inc. (“Broadridge”) to be similar to the Fund (the “Universe”), and in comparison to the Fund’s benchmark index and to other comparative data. Broadridge is an independent provider of investment company data. The Board received a description of the methodology used by Broadridge to select the mutual funds in the performance Universe. The Board noted that the investment performance of the Fund (Class A) was higher than the average investment performance of the Universe for all periods under review. The Board also noted that the investment performance of the Fund was lower than its benchmark index, the MSCI ACWI ex USA Index (Net), for the one-, three- and ten-year periods under review, but higher than its benchmark for the five-year period under review.
The Board also received and considered information regarding the Fund’s net operating expense ratios and their various components, including actual management fees, custodian and other non-management fees, and Rule 12b-1 and non-Rule 12b-1 shareholder service fees. The Board considered these ratios in comparison to the median ratios of funds in class-specific expense groups that were determined by Broadridge to be similar to the Fund (the “Groups”). The Board received a description of the methodology used by Broadridge to select the mutual funds in the expense Groups and an explanation of how funds comprising expense groups and their expense ratios may vary from year-to-year. Based on the Broadridge reports, the Board noted that the net operating expense ratios of the Fund were lower than the median net operating expense ratios of the expense Groups for each share class.
The Board took into account the Fund’s investment performance and expense information provided to it among the factors considered in deciding to re-approve the Advisory Agreements.
Investment management and sub-advisory fee rates
The Board reviewed and considered the contractual fee rates payable by the Fund to Funds Management under the Management Agreement, as well as the contractual fee rates payable by the Fund to Funds Management for class-level administrative services under a Class-Level Administration Agreement, which include, among other things, class-level transfer agency and sub-transfer agency costs (collectively, the “Management Rates”). The Board also reviewed and considered the contractual investment sub-advisory fee rates that are payable by Funds Management to the Sub-Adviser for investmentsub-advisory services.
Among other information reviewed by the Board was a comparison of the Fund’s Management Rates with the average contractual investment management fee rates of funds in the expense Groups at a common asset level as well as transfer agency costs of the funds in the expense Groups. The Board noted that the Management Rates of the Fund were equal to or in range of the sum of these average rates for the Fund’s expense Groups for the Class A, Administrator Class, Institutional Class, and Class R6 share classes, but higher than the sum of these average rates for the Fund’s expense Groups for the Class R share class. However, the Board noted that the net operating expense ratios of the Fund were lower than the median net operating expense ratios of the expense Groups for each share class, including for the Class R share class.
The Board also received and considered information about the portion of the total management fee that was retained by Funds Management after payment of the fee to the Sub-Adviser for sub-advisory services. In assessing the reasonableness of this amount, the Board received and evaluated information about the nature and extent of responsibilities retained and risks assumed by Funds Management and not delegated to or assumed by the Sub-Adviser, and about Funds Management’s on-going oversight services. Given the affiliation between Funds Management and the Sub-Adviser, the Board ascribed limited relevance to the allocation of fees between them.
The Board also received and considered information about the nature and extent of services offered and fee rates charged by Funds Management and the Sub-Adviser to other types of clients with investment strategies similar to those of the Fund. In this regard, the Board received information about the significantly greater scope of services, and compliance, reporting and other legal burdens and risks of managing proprietary mutual funds compared with those associated with managing assets of other types of clients, including third-party sub-advised fund clients and non-mutual fund clients such as institutional separate accounts.
Based on its consideration of the factors and information it deemed relevant, including those described here, the Board determined that the compensation payable to Funds Management under the Management Agreement and to the Sub-Adviser under the Sub-Advisory Agreement was reasonable.
36 | Wells Fargo International Equity Fund
Table of Contents
Other information (unaudited)
Profitability
The Board received and considered information concerning the profitability of Funds Management, as well as the profitability of both WFAM and Wells Fargo & Co. (“Wells Fargo”) from providing services to the fund family as a whole. The Board noted that the Sub-Adviser’s profitability information with respect to providing services to the Fund and other funds in the family was subsumed in the WFAM and Wells Fargo profitability analysis.
Funds Management reported on the methodologies and estimates used in calculating profitability, including a description of the methodology used to allocate certain expenses. Among other things, the Board noted that the levels of profitability reported on a fund-by-fund basis varied widely, depending on factors such as the size, type and age of fund. Based on its review, the Board did not deem the profits reported by Funds Management, WFAM or Wells Fargo from services provided to the Fund to be at a level that would prevent it from approving the continuation of the Advisory Agreements.
Economies of scale
The Board received and considered information about the potential for Funds Management to experience economies of scale in the provision of management services to the Fund, the difficulties of calculating economies of scale at an individual fund level, and the extent to which potential scale benefits are shared with shareholders. The Board noted the existence of breakpoints in the Fund’s management fee structure, which operate generally to reduce the Fund’s expense ratios as the Fund grows in size. The Board considered that in addition to management fee breakpoints, Funds Management shares potential economies of scale from its management business in a variety of ways, including through fee waiver and expense reimbursement arrangements, services that benefit shareholders, competitive management fee rates set at the outset without regard to breakpoints, and investments in the business intended to enhance services available to shareholders.
The Board concluded that Funds Management’s arrangements with respect to the Fund, including contractual breakpoints, constituted a reasonable approach to sharing potential economies of scale with the Fund and its shareholders.
Other benefits to Funds Management and the Sub-Adviser
The Board received and considered information regarding potential “fall-out” or ancillary benefits received by Funds Management and its affiliates, including the Sub-Adviser, as a result of their relationships with the Fund. Ancillary benefits could include, among others, benefits directly attributable to other relationships with the Fund and benefits potentially derived from an increase in Funds Management’s and the Sub-Adviser’s business as a result of their relationships with the Fund. The Board noted that various affiliates of Funds Management may receive distribution-related fees, shareholder servicing payments and sub-transfer agency fees in respect of shares sold or held through them and services provided.
The Board also reviewed information about soft dollar credits earned and utilized by the Sub-Adviser, fees earned by Funds Management and the Sub-Adviser from managing a private investment vehicle for the fund family’s securities lending collateral, and commissions earned by an affiliated broker from portfolio transactions.
Based on its consideration of the factors and information it deemed relevant, including those described here, the Board did not find that any ancillary benefits received by Funds Management and its affiliates, including the Sub-Adviser, were unreasonable.
Conclusion
At the Meeting, after considering the above-described factors and based on its deliberations and its evaluation of the information described above, the Board unanimously approved the continuation of the Advisory Agreements for a one-year term and determined that the compensation payable to Funds Management and the Sub-Adviser under each of the Advisory Agreements was reasonable.
Wells Fargo International Equity Fund | 37
Table of Contents
This page is intentionally left blank.
Table of Contents
This page is intentionally left blank.
Table of Contents
This page is intentionally left blank.
Table of Contents
For more information
More information about Wells Fargo Funds is available free upon request. To obtain literature, please write, visit the Fund’s website, or call:
Wells Fargo Funds
P.O. Box 219967
Kansas City, MO 64121-9967
Website:wfam.com
Individual investors:1-800-222-8222
Retail investment professionals:1-888-877-9275
Institutional investment professionals:1-866-765-0778

This report and the financial statements contained herein are submitted for the general information of the shareholders of the Fund. If this report is used for promotional purposes, distribution of the report must be accompanied or preceded by a current prospectus. Before investing, please consider the investment objectives, risks, charges, and expenses of the investment. For a current prospectus and, if available, a summary prospectus, containing this information, call1-800-222-8222 or visit the Fund’s website atwfam.com. Read the prospectus carefully before you invest or send money.
Wells Fargo Asset Management (WFAM) is the trade name for certain investment advisory/management firms owned by Wells Fargo & Company. These firms include but are not limited to Wells Capital Management Incorporated and Wells Fargo Funds Management, LLC. Certain products managed by WFAM entities are distributed by Wells Fargo Funds Distributor, LLC (a broker-dealer and Member FINRA).
This material is for general informational and educational purposes only and is NOT intended to provide investment advice or a recommendation of any kind—including a recommendation for any specific investment, strategy, or plan.
INVESTMENT PRODUCTS: NOT FDIC INSURED ◾ NO BANK GUARANTEE ◾ MAY LOSE VALUE
© 2019 Wells Fargo & Company. All rights reserved.
408248 12-19
A240/AR240 10-19
Table of Contents

Annual Report
October 31, 2019
Wells Fargo Asia Pacific Fund
Beginning on January 1, 2021, as permitted by new regulations adopted by the Securities and Exchange Commission, paper copies of the Wells Fargo Funds’ annual and semi-annual shareholder reports issued after this date will no longer be sent by mail, unless you specifically request paper copies of the reports. Instead, the reports will be made available on the Funds’ website, and you will be notified by mail each time a report is posted and provided with a website address to access the report.
If you already elected to receive shareholder reports electronically, you will not be affected by this change and you need not take any action. You may elect to receive shareholder reports and other communications from the Fund electronically at any time by contacting your financial intermediary (such as a broker-dealer or bank) or, if you are a direct investor, by calling1-800-222-8222 or by enrolling at wellsfargo.com/advantagedelivery.
You may elect to receive all future reports in paper free of charge. If you invest through a financial intermediary, you can contact your financial intermediary to request that you continue to receive paper copies of your shareholder reports; if you invest directly with the Fund, you can call 1-800-222-8222. Your election to receive reports in paper will apply to all Wells Fargo Funds held in your account with your financial intermediary or, if you are a direct investor, to all Wells Fargo Funds that you hold.
Table of Contents
|
Reduce clutter. Save trees. |
Sign up for electronic delivery of prospectuses and shareholder reports atwellsfargo.com/advantagedelivery |
The views expressed and any forward-looking statements are as of October 31, 2019, unless otherwise noted, and are those of the Fund managers and/or Wells Fargo Asset Management. Discussions of individual securities, or the markets generally, or any Wells Fargo Fund are not intended as individual recommendations. Future events or results may vary significantly from those expressed in any forward-looking statements. The views expressed are subject to change at any time in response to changing circumstances in the market. Wells Fargo Asset Management and the Fund disclaim any obligation to publicly update or revise any views expressed or forward-looking statements.
INVESTMENT PRODUCTS: NOT FDIC INSURED ◾ NO BANK GUARANTEE ◾ MAY LOSE VALUE
Wells Fargo Asia Pacific Fund | 1
Table of Contents
Letter to shareholders (unaudited)

Andrew Owen
President
Wells Fargo Funds
Dear Shareholder:
We are pleased to offer you this annual report for the Wells Fargo Asia Pacific Fund for the 12-month period that ended October 31, 2019. After the first few months of the period featured high volatility and yielded minimal returns, U.S. investors generally saw markets recover during the second half amid intensifying market volatility, global economic growth concerns, international trade stare downs, and simmering geopolitical tensions.
Overall, both fixed-income and equity investors enjoyed healthy returns despite market volatility. For the period, U.S. stocks, based on the S&P 500 Index,1 gained 14.33% and international stocks, as measured by the MSCI ACWI ex USA Index (Net),2 returned 11.27%. The MSCI EM Index (Net)3 gained 11.86%. Among fixed income investors, the Bloomberg Barclays U.S. Aggregate Bond Index4 added 11.51%, the Bloomberg Barclays Global Aggregate ex-USD Index5 added 7.84%, the Bloomberg Barclays Municipal Bond Index6 gained 9.42%, and the ICE BofAML U.S. High Yield Index7 added 8.32%.
Investors confronted unsettling events during the fourth quarter of 2018.
During the fourth quarter of 2018, investors grew concerned about the pace and sustainability of the global economic expansion. The U.S. Bureau of Economic Analysis reported third-quarter U.S. gross domestic product (GDP) was 3.4% on an annualized basis, which was down from the second-quarter rate. A partial U.S. government shutdown occurred, which extended into January 2019. Brexit efforts stalled, causing uncertainty for the eurozone. The value of the renminbi declined even as the People’s Bank of China cut reserve requirement ratios, accelerated infrastructure spending, and cut taxes in efforts to spur economic activity.
The combination of news in the U.S. and generally weak economic indicators outside of the U.S. caused investors to seek safe havens. December’s S&P 500 Index performance was the worst since 1931. Globally, fixed-income investments fared better than stocks during the last two months of the year. Even as indicators suggested growth was restrained, the U.S. Federal Reserve (Fed) increased the federal funds rate by 25 basis points (bps; 100 bps equal 1.00%) in December 2018 to a target range of between 2.25% and 2.50%. Many observers expressed concerns that higher rates could slow the economy further.
| 1 | The S&P 500 Index consists of 500 stocks chosen for market size, liquidity, and industry group representation. It is a market-value-weighted index with each stock’s weight in the index proportionate to its market value. You cannot invest directly in an index. |
| 2 | The Morgan Stanley Capital International (MSCI) All Country World Index (ACWI) ex USA Index (Net) is a free-float-adjusted market-capitalization-weighted index that is designed to measure the equity market performance of developed and emerging markets, excluding the United States. Source: MSCI. MSCI makes no express or implied warranties or representations and shall have no liability whatsoever with respect to any MSCI data contained herein. The MSCI data may not be further redistributed or used as a basis for other indices or any securities or financial products. This report is not approved, reviewed, or produced by MSCI. You cannot invest directly in an index. |
| 3 | The MSCI Emerging Markets (EM) Index (Net) is a free-float-adjusted market-capitalization-weighted index that is designed to measure the equity market performance of emerging markets. You cannot invest directly in an index. |
| 4 | The Bloomberg Barclays U.S. Aggregate Bond Index is a broad-based benchmark that measures the investment-grade, U.S. dollar-denominated, fixed-rate taxable bond market, including Treasuries, government-related and corporate securities, mortgage-backed securities (agency fixed-rate and hybrid adjustable-rate mortgage pass-throughs), asset-backed securities, and commercial mortgage-backed securities. You cannot invest directly in an index. |
| 5 | The Bloomberg Barclays Global Aggregate ex-USD Index is an unmanaged index that provides a broad-based measure of the global investment-grade fixed-income markets excluding the U.S. dollar-denominated debt market. You cannot invest directly in an index. |
| 6 | The Bloomberg Barclays Municipal Bond Index is an unmanaged index composed of long-term tax-exempt bonds with a minimum credit rating of Baa. You cannot invest directly in an index. |
| 7 | The ICE BofAML U.S. High Yield Index is a market-capitalization-weighted index of domestic and Yankee high-yield bonds. The index tracks the performance of high-yield securities traded in the U.S. bond market. You cannot invest directly in an index. Copyright 2019. ICE Data Indices, LLC. All rights reserved. |
2 | Wells Fargo Asia Pacific Fund
Table of Contents
Letter to shareholders (unaudited)
The market climbs a wall of worry.
Investment returns early in 2019 appeared to reaffirm the adage that markets climb a wall of worry as the new year began. The S&P 500 Index gained 8.01% in January, the best monthly performance in 30 years. Returns for the MSCI ACWI ex USA Index (Net), the Bloomberg Barclays U.S. Aggregate Bond Index, and the Bloomberg Barclays Global Aggregate ex-USD Index also were positive.
In February 2019, signs of slowing global growth grew more ominous. The U.S. Bureau of Economic Analysis announced fourth-quarter 2018 GDP grew at an annualized 2.2% rate, down from the levels of the prior two quarters. In a February report, the Bank of England forecast the slowest growth since the financial crisis for 2019. China and the U.S. continued to wrangle over trade issues. By the end of the first quarter of 2019, more accommodative Fed sentiment and steady, if not spectacular, U.S. economic and business metrics encouraged domestic investors.
Early second-quarter 2019 enthusiasm among investors faded.
During April 2019, sustained low inflation, solid employment data, and first-quarter U.S. GDP grew at an annualized rate of 3.2% supported favorable sentiment. During May, markets tumbled on mixed investment signals. In the U.S., partisan wrangling ramped up as Democrats and Republicans set their sights on 2020 presidential politics. The U.K.’s Brexit disagreements caused Prime Minister Theresa May to resign. Boris Johnson succeeded her only to exacerbate uncertainty about Brexit’s resolution ahead of an October 2019 deadline. The European Commission downgraded the 2019 growth forecast to 1.2%. The U.S. increased tariffs on products from China, China responded, and then talks broke down. President Donald Trump threatened to turn his foreign policy tariff tool to Mexico over immigration issues.
Halfway through 2019, investors regrouped. Just as the investment horizon appeared to darken, sentiment turned and U.S. equity markets gained during June and July. The gains, primarily driven by geopolitical and monetary policy events, pushed equity markets to new highs. European Central Bank President Mario Draghi said that if the outlook doesn’t improve, the bank would cut rates or buy more assets to prop up inflation. President Trump backed off of tariff threats against Mexico and China. In the U.S., the Fed implemented a 0.25% federal funds rate cut in July.
Later in July 2019, the U.S. reversed course and threatened to impose higher tariffs on China’s exports after talks failed. China responded with tariff threats of its own and devalued the renminbi, a move that roiled global markets. Major U.S. stock market indices closed July with the worst weekly results of the year. Bond prices gained as Treasury yields fell to levels not seen since November 2016 and the yield curve inverted at multiple points along the 30-year arc.
In microcosm, August 2019 encapsulated many of the unnerving events that had plagued investors for months. The U.S.-China trade relationship swung from antagonistic to hopeful and back again with no signs of compromise. Evidence of a continued global economic slowdown continued to mount as central banks in China, New Zealand, and Thailand cut interest rates. Industrial and manufacturing data declined in China, Canada, Japan, and Germany. Adding to the uncertain environment, Italy’s prime minister resigned, many feared a crackdown in Hong Kong as protestors sustained their calls for reform, and Boris Johnson planned to suspend Parliament as Brexit’s deadline neared.
In the U.S., September 2019 saw the Fed join other central banks in cutting interest rates. U.S. manufacturing data, as reported by the Institute for Supply Management, disappointed investors. The U.S. House of Representatives announced it would pursue an impeachment investigation of President Trump. Meanwhile, the Brexit impasse showed no signs of resolution. Officials in China said that hitting the country’s economic
“In February 2019, signs of slowing global growth grew more ominous.”
Wells Fargo Asia Pacific Fund | 3
Table of Contents
Letter to shareholders (unaudited)
“The Fed lowered interest rates another quarter point in late October, its third rate cut in four months.”
|
For further information about your Fund, contact your investment professional, visit our website at wfam.com, or call us directly at1-800-222-8222. |
growth goals for the year would be difficult considering the weight of tariffs and trade restrictions. So while the S&P 500 Index finished the third quarter with the best year-to-date returns in more than 20 years, amid signs of equity investors taking money out of the stock market, concerns about future returns remained.
In October 2019, a relaxing of U.S.-China trade tensions and renewed optimism for a U.K. Brexit deal combined with positive macroeconomic data to support financial markets overall. The initial estimate of U.S. third-quarter GDP growth, announced in late October, was a resilient 1.9% annualized rate while the U.S. unemployment rate fell to a 50-year low of 3.5% in September. However, despite resilience among U.S. consumers, business confidence declined while manufacturing activity contracted. Concerned with a potential economic slowdown, the Fed lowered interest rates another quarter point in late October, its third rate cut in four months. This helped push the S&P 500 Index to a new all-time high while emerging market equities rallied and global bonds declined overall, reflecting a broad pickup in risk appetite.
Don’t let short-term uncertainty derail long-term investment goals.
Periods of investment uncertainty can present challenges, but experience has taught us that maintaining long-term investment goals can be an effective way to plan for the future. To help you create a sound strategy based on your personal goals and risk tolerance, Wells Fargo Funds offers more than 100 mutual funds spanning a wide range of asset classes and investment styles. Although diversification cannot guarantee an investment profit or prevent losses, we believe it can be an effective way to manage investment risk and potentially smooth out overall portfolio performance. We encourage investors to know their investments and to understand that appropriate levels of risk-taking may unlock opportunities.
Thank you for choosing to invest with Wells Fargo Funds. We appreciate your confidence in us and remain committed to helping you meet your financial needs.
Sincerely,

Andrew Owen
President
Wells Fargo Funds
4 | Wells Fargo Asia Pacific Fund
Table of Contents
Performance highlights (unaudited)
Investment objective
The Fund seeks long-term capital appreciation.
Manager
Wells Fargo Funds Management, LLC
Subadviser
Wells Capital Management Incorporated
Portfolio managers
Alison Shimada
Elaine Tse
Average annual total returns (%) as of October 31, 2019
| Including sales charge | Excluding sales charge | Expense ratios1 (%) | ||||||||||||||||||||||||||||||||
| Inception date | 1 year | 5 year | 10 year | 1 year | 5 year | 10 year | Gross | Net2 | ||||||||||||||||||||||||||
| Class A (WFAAX) | 7-31-2007 | 0.70 | 2.54 | 5.67 | 6.86 | 3.76 | 6.30 | 1.69 | 1.60 | |||||||||||||||||||||||||
| Class C (WFCAX) | 7-31-2007 | 5.14 | 2.99 | 5.53 | 6.14 | 2.99 | 5.53 | 2.44 | 2.35 | |||||||||||||||||||||||||
| Administrator Class (WFADX)3 | 7-30-2010 | – | – | – | 6.95 | 3.86 | 6.45 | 1.61 | 1.50 | |||||||||||||||||||||||||
| Institutional Class (WFPIX)4 | 7-30-2010 | – | – | – | 7.33 | 4.13 | 6.65 | 1.36 | 1.25 | |||||||||||||||||||||||||
| MSCI AC Asia Pacific Index (Net)5 | – | – | – | – | 12.02 | 5.37 | 6.02 | – | – | |||||||||||||||||||||||||
Figures quoted represent past performance, which is no guarantee of future results, and do not reflect taxes that a shareholder may pay on fund distributions or the redemption of fund shares. Investment return and principal value of an investment will fluctuate so that an investor’s shares, when redeemed, may be worth more or less than their original cost. Performance shown without sales charges would be lower if sales charges were reflected. Current performance may be lower or higher than the performance data quoted, which assumes the reinvestment of dividends and capital gains. Currentmonth-end performance is available on the Fund’s website,wfam.com.
Index returns do not include transaction costs associated with buying and selling securities, any mutual fund fees or expenses, or any taxes. It is not possible to invest directly in an index.
For Class A shares, the maximumfront-end sales charge is 5.75%. For Class C shares, the maximum contingent deferred sales charge is 1.00%. Performance including a contingent deferred sales charge assumes the sales charge for the corresponding time period. Administrator Class and Institutional Class shares are sold without afront-end sales charge or contingent deferred sales charge.
Stock values fluctuate in response to the activities of individual companies and general market and economic conditions. Foreign investments are especially volatile and can rise or fall dramatically due to differences in the political and economic conditions of the host country. These risks are generally intensified in emerging markets. The use of derivatives may reduce returns and/or increase volatility. Certain investment strategies tend to increase the total risk of an investment (relative to the broader market). The Fund is exposed to geographic risk and smaller-company securities risk. Consult the Fund’s prospectus for additional information on these and other risks.
Please see footnotes on page 6.
Wells Fargo Asia Pacific Fund | 5
Table of Contents
Performance highlights (unaudited)
| Growth of $10,000 investment as of October 31, 20196 |
|
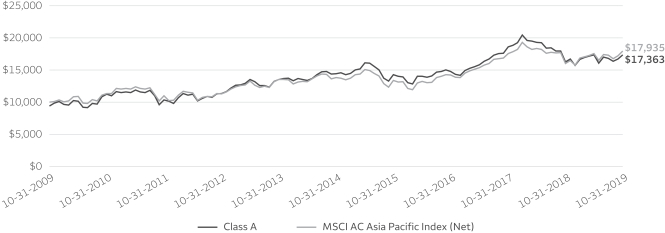
| 1 | Reflects the expense ratios as stated in the most recent prospectuses. The expense ratios shown are subject to change and may differ from the annualized expense ratios shown in the financial highlights of this report. |
| 2 | The manager has contractually committed through February 29, 2020, to waive fees and/or reimburse expenses to the extent necessary to cap the expenses of each class after fee waivers at the amounts shown. Brokerage commissions, stamp duty fees, interest, taxes, acquired fund fees and expenses (if any), and extraordinary expenses are excluded from the expense cap. Prior to or after the commitment expiration date, the cap may be increased or the commitment to maintain the cap may be terminated only with the approval of the Board of Trustees. Without this cap, the Fund’s returns would have been lower. The expense ratio paid by an investor is the net expense ratio (the total annual fund operating expenses after fee waivers) as stated in the prospectuses. |
| 3 | Historical performance shown for Administrator Class shares prior to their inception reflects the performance of Class A shares, and includes the higher expenses applicable to Class A shares. If these expenses had not been included, returns for Administrator Class shares would be higher. |
| 4 | Historical performance shown for Institutional Class shares prior to their inception reflects the performance of Class A shares, and includes the higher expenses applicable to Class A shares. If these expenses had not been included, returns for Institutional Class shares would be higher. |
| 5 | The Morgan Stanley Capital International (MSCI) All Country (AC) Asia Pacific Index (Net) is a free-float-adjusted market-capitalization-weighted index that is designed to measure the equity market performance of the developed and emerging markets in the Pacific region. Source: MSCI. MSCI makes no express or implied warranties or representations and shall have no liability whatsoever with respect to any MSCI data contained herein. The MSCI data may not be further redistributed or used as a basis for other indexes or any securities or financial products. This report is not approved, reviewed, or produced by MSCI. You cannot invest directly in an index. |
| 6 | The chart compares the performance of Class A shares for the most recent ten years with the MSCI AC Asia Pacific Index (Net). The chart assumes a hypothetical investment of $10,000 in Class A shares and reflects all operating expenses and assumes the maximum initial sales charge of 5.75%. |
| 7 | The ten largest holdings, excluding cash, cash equivalents and any money market funds, are calculated based on the value of the investments divided by total net assets of the Fund. Holdings are subject to change and may have changed since the date specified. |
| 8 | Amounts are calculated based on the total long-term investments of the Fund. These amounts are subject to change and may have changed since the date specified. |
| * | This security was no longer held at the end of the reporting period. |
6 | Wells Fargo Asia Pacific Fund
Table of Contents
Performance highlights (unaudited)
MANAGER’S DISCUSSION
Fund highlights
| ∎ | The Fund underperformed its benchmark, the MSCI AC Asia Pacific Index (Net), for the12-month period that ended October 31, 2019. |
| ∎ | Unfavorable stock selection within the consumer discretionary, financials, and health care sectors detracted from relative performance along with allocations to China, Japan, and Malaysia. |
| ∎ | Contributing to relative performance were stock selection within utilities, materials, and real estate, and the performance of holdings in Taiwan, Indonesia, and the Philippines. |
| Ten largest holdings (%) as of October 31, 20197 | ||||
Taiwan Semiconductor Manufacturing Company Limited | 3.84 | |||
Alibaba Group Holding Limited ADR | 3.42 | |||
Samsung Electronics Company Limited | 3.24 | |||
Tencent Holdings Limited | 2.70 | |||
Toyota Motor Corporation | 2.38 | |||
Mediatek Incorporated | 1.92 | |||
Hitachi Limited | 1.76 | |||
Nippon Telegraph & Telephone Corporation | 1.53 | |||
Ping An Insurance Group Company H Shares | 1.51 | |||
Mitsubishi UFJ Financial Group Incorporated | 1.50 | |||
| Sector distribution as of October 31, 20198 |
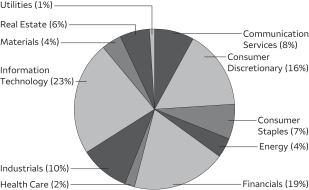 |
The MSCI AC Asia Pacific Index (Net) advanced 12.0% during a volatile period for Asian equities, characterized by sentiment fluctuating day to day based on trade negotiations, a reversal in U.S. Federal Reserve policy, subsequent rate cuts by a number of Asian central banks, and a decline in both developed and emerging market growth. In this environment, country returns varied substantially, illustrated by a 22.4% return in Taiwanese equities versus a 22.8% decline in Pakistan, as did sector returns, with information technology (IT) stocks returning 22.7% versus energy stocks declining 2.8%. Overall earnings declined 14% year over year, but that was offset by are-rating of the asset class and by currency gains versus the U.S. dollar.
During the period, the portfolio’s largest shifts included an increase in IT stocks and a decrease in financials. Within IT, the team added new names, including Wiwynn (a cloud infrastructure provider), Delta Electronics (a global provider of power and thermal management solutions), and Ase Technology (the world’s largest provider of independent semiconductor manufacturing services in assembly and test). The Fund added to positions in Taiwan Semiconductor (the largest semiconductor foundry in the world) and Samsung Electronics (a global semiconductor leader with diversified businesses in handsets, display, and TVs in Korea) given improved earnings visibility and undemanding valuations.
The team reduced its exposure to financials given an increased certainty toward rate cuts, providing support to emerging market economies at large but also putting pressure on banking sector net interest margins. As such, the team reduced its exposure to financials stocks via sales of Bank of China* (one of the big four state-owned Chinese banks), Kasikornbank* (the third-largest bank in Thailand and the leading bank serving small and medium enterprises), and Public Bank* (the third-largest bank in Malaysia), among others.
The consumer discretionary and financials sectors detracted from relative returns along with China and Japan.
Within the consumer discretionary sector, stock selection detracted from performance. Japanese holding J. Front Retailing* was weak on concerns of slower inbound tourism, and Panasonic* was negatively affected by slowing sales in appliances, automotive, and industrial systems. Genting Malaysia*, a casino, theme park, and hotel operator, also underperformed as the Malaysian government increased the gaming tax rate and Fox/Disney dissociated from Genting Malaysia’s new theme park. China/Hong Kong outperformed the index, returning 13.7% during the period. Although the portfolio was overweight, stock selection had negative results. PetroChina was hurt by a 20.2% decline in the price of Brent crude oil over theone-year period. First-half 2019 net profits were in line with expectations, up 4% year over year, and exploration and production revenue increased 8%, primarily due to a 6% increase in oil and gas production; however, the company reduced its payout ratio to 50% from 59% in the first half.
Please see footnotes on page 6.
Wells Fargo Asia Pacific Fund | 7
Table of Contents
Performance highlights (unaudited)
| Country allocation as of October 31, 20198 |
 |
On the other hand, positioning in the utilities and IT sectors as well as in Taiwan and Indonesia contributed to relative performance.
Taiwan outperformed, resulting in positive allocation effects as the team grew its allocation to the country during the period. Stock selection also contributed, particularly in the IT sector. MediaTek, a Taiwanese fabless semiconductor design company, delivered strong expansion in gross margins as smartphone and growth segments rebounded. The company also announced the industry’s first 5G system on chip, suggesting MediaTek will be part of the first wave of 5G
device launches. Indonesia outperformed over the most recentone-year period, resulting in positive allocation effects given an average overweight. Stock selection was also positive, particularly in financials, where Bank Rakyat Indonesia, a pioneer in microfinance in Indonesia, is expected to grow loans above the system average given the focus on the micro-segment and expand its return on equity due to cost savings and increased efficiency from investments in technology. Indonesian stocks also received a boost from the reelection of Jokowi and a rating upgrade from Standard & Poor’s.
Visibility on a trade resolution between the U.S. and China remains low. We expect the Chinese government will remain cautious on monetary policy in an effort to contain overall leverage and focus on financial and state-owned enterprise reforms instead to attract capital and improve efficiency. In Taiwan, our view of the semiconductor sector has been cautiously optimistic given that demand has shown signs of improvement with lower inventory levels, increasing China’s chip localization, and growing secular 5G and high-performance computing trends; however, the lingering macro risks regarding Huawei and trade war tariffs continue to exist. While we maintain our long-term structural bullish view on India, economic growth remains weak and there are risks of further downward revision of gross domestic product forecasts.
Please see footnotes on page 6.
8 | Wells Fargo Asia Pacific Fund
Table of Contents
As a shareholder of the Fund, you incur two types of costs: (1) transaction costs, including sales charges (loads) on purchase payments and contingent deferred sales charges (if any) on redemptions and (2) ongoing costs, including management fees, distribution(12b-1) and/or shareholder servicing fees, and other Fund expenses. This example is intended to help you understand your ongoing costs (in dollars) of investing in the Fund and to compare these costs with the ongoing costs of investing in other mutual funds.
The example is based on an investment of $1,000 invested at the beginning of thesix-month period and held for the entire period from May 1, 2019 to October 31, 2019.
Actual expenses
The “Actual” line of the table below provides information about actual account values and actual expenses. You may use the information in this line, together with the amount you invested, to estimate the expenses that you paid over the period. Simply divide your account value by $1,000 (for example, an $8,600 account value divided by $1,000 = 8.6), then multiply the result by the number in the “Actual” line under the heading entitled “Expenses paid during period” for your applicable class of shares to estimate the expenses you paid on your account during this period.
Hypothetical example for comparison purposes
The “Hypothetical” line of the table below provides information about hypothetical account values and hypothetical expenses based on the Fund’s actual expense ratio and an assumed rate of return of 5% per year before expenses, which is not the Fund’s actual return. The hypothetical account values and expenses may not be used to estimate the actual ending account balance or expenses you paid for the period. You may use this information to compare the ongoing costs of investing in the Fund and other funds. To do so, compare this 5% hypothetical example with the 5% hypothetical examples that appear in the shareholder reports of the other funds.
Please note that the expenses shown in the table are meant to highlight your ongoing costs only and do not reflect any transactional costs, such as sales charges (loads) and contingent deferred sales charges. Therefore, the “Hypothetical” line of the table is useful in comparing ongoing costs only and will not help you determine the relative total costs of owning different funds. In addition, if these transactional costs were included, your costs would have been higher.
| Beginning account value 5-1-2019 | Ending account value 10-31-2019 | Expenses paid during the period¹ | Annualized net expense ratio | |||||||||||||
Class A | ||||||||||||||||
Actual | $ | 1,000.00 | $ | 1,000.00 | $ | 8.07 | 1.60 | % | ||||||||
Hypothetical (5% return before expenses) | $ | 1,000.00 | $ | 1,017.14 | $ | 8.13 | 1.60 | % | ||||||||
Class C | ||||||||||||||||
Actual | $ | 1,000.00 | $ | 996.57 | $ | 11.83 | 2.35 | % | ||||||||
Hypothetical (5% return before expenses) | $ | 1,000.00 | $ | 1,013.36 | $ | 11.93 | 2.35 | % | ||||||||
Administrator Class | ||||||||||||||||
Actual | $ | 1,000.00 | $ | 1,000.82 | $ | 7.56 | 1.50 | % | ||||||||
Hypothetical (5% return before expenses) | $ | 1,000.00 | $ | 1,017.64 | $ | 7.63 | 1.50 | % | ||||||||
Institutional Class | ||||||||||||||||
Actual | $ | 1,000.00 | $ | 1,002.48 | $ | 6.31 | 1.25 | % | ||||||||
Hypothetical (5% return before expenses) | $ | 1,000.00 | $ | 1,018.90 | $ | 6.36 | 1.25 | % | ||||||||
| 1 | Expenses paid is equal to the annualized net expense ratio of each class multiplied by the average account value over the period, multiplied by the number of days in the most recent fiscal half-year divided by the number of days in the fiscal year (to reflect theone-half-year period). |
Wells Fargo Asia Pacific Fund | 9
Table of Contents
Portfolio of investments—October 31, 2019
| Shares | Value | |||||||||||||||
| Common Stocks: 97.83% |
| |||||||||||||||
| Australia: 7.61% | ||||||||||||||||
Aristocrat Leisure Limited (Consumer Discretionary, Hotels, Restaurants & Leisure) | 47,685 | $ | 1,039,402 | |||||||||||||
Australia & New Zealand Banking Group Limited (Financials, Banks) | 52,572 | 969,071 | ||||||||||||||
BHP Billiton Limited (Materials, Metals & Mining) | 35,880 | 889,183 | ||||||||||||||
Goodman Group (Real Estate, Equity REITs) | 86,000 | 853,098 | ||||||||||||||
Mirvac Group (Real Estate, Equity REITs) | 339,072 | 750,303 | ||||||||||||||
Northern Star Resources Limited (Materials, Metals & Mining) | 103,250 | 696,807 | ||||||||||||||
Qantas Airways Limited (Industrials, Airlines) | 220,163 | 972,842 | ||||||||||||||
Rio Tinto Limited (Materials, Metals & Mining) | 16,927 | 1,060,445 | ||||||||||||||
Suncorp Group Limited (Financials, Insurance) | 90,902 | 842,821 | ||||||||||||||
Woodside Petroleum Limited (Energy, Oil, Gas & Consumable Fuels) | 25,252 | 560,520 | ||||||||||||||
| 8,634,492 | ||||||||||||||||
|
| |||||||||||||||
| China: 29.25% | ||||||||||||||||
Air China Limited H Shares (Industrials, Airlines) | 644,000 | 570,366 | ||||||||||||||
Alibaba Group Holding Limited ADR (Consumer Discretionary, Internet & Direct Marketing Retail) † | 21,950 | 3,877,907 | ||||||||||||||
Beijing Capital International Airport Company Limited H Shares (Industrials, Transportation Infrastructure) | 676,000 | 640,979 | ||||||||||||||
Beijing Sinnet Technology Company Limited Class A (Information Technology, IT Services) | 220,500 | 546,596 | ||||||||||||||
China Construction Bank H Shares (Financials, Banks) | 1,943,000 | 1,564,626 | ||||||||||||||
China Life Insurance Company H Shares (Financials, Insurance) | 243,000 | 632,623 | ||||||||||||||
China Mengniu Dairy Company Limited (Consumer Staples, Food Products) | 170,000 | 680,135 | ||||||||||||||
China Merchants Shekou Industrial Zone Holdings Company Limited Class A (Real Estate, Real Estate Management & Development) | 191,896 | 510,603 | ||||||||||||||
China Mobile Limited (Communication Services, Wireless Telecommunication Services) | 66,000 | 537,369 | ||||||||||||||
China Overseas Land & Investment Limited (Real Estate, Real Estate Management & Development) | 262,000 | 829,204 | ||||||||||||||
China Petroleum & Chemical Corporation H Shares (Energy, Oil, Gas & Consumable Fuels) | 1,794,000 | 1,030,252 | ||||||||||||||
China State Construction International Holdings (Industrials, Construction & Engineering) | 1,158,000 | 1,066,975 | ||||||||||||||
China Vanke Company Limited H Shares (Real Estate, Real Estate Management & Development) | 151,700 | 554,649 | ||||||||||||||
CITIC Securities Company Limited H Shares (Financials, Capital Markets) | 331,000 | 609,963 | ||||||||||||||
COSCO Shipping Ports Limited (Industrials, Transportation Infrastructure) | 638,635 | 502,859 | ||||||||||||||
Geely Automobile Holdings Limited (Consumer Discretionary, Automobiles) | 328,000 | 623,690 | ||||||||||||||
Guangzhou Automobile Group Company Limited H Shares (Consumer Discretionary, Automobiles) | 608,000 | 609,090 | ||||||||||||||
Haier Smart Home Company Limited Class A (Consumer Discretionary, Household Durables) | 377,496 | 858,506 | ||||||||||||||
Hengan International Group Company Limited (Consumer Staples, Personal Products) | 116,000 | 811,235 | ||||||||||||||
Industrial & Commercial Bank of China Limited H Shares (Financials, Banks) | 1,673,000 | 1,204,158 | ||||||||||||||
Kunlun Energy Company Limited (Utilities, Gas Utilities) | 520,000 | 485,098 | ||||||||||||||
Lenovo Group Limited (Information Technology, Technology Hardware, Storage & Peripherals) | 1,070,000 | 748,295 | ||||||||||||||
Midea Group Company Limited Class A (Consumer Discretionary, Household Durables) | 82,400 | 650,027 | ||||||||||||||
PetroChina Company Limited H Shares (Energy, Oil, Gas & Consumable Fuels) | 1,614,000 | 792,999 | ||||||||||||||
PICC Property & Casualty Company Limited H Shares (Financials, Insurance) | 595,000 | 755,524 | ||||||||||||||
Ping An Insurance Group Company H Shares (Financials, Insurance) | 148,000 | 1,714,023 | ||||||||||||||
Sands China Limited (Consumer Discretionary, Hotels, Restaurants & Leisure) | 184,800 | 913,865 | ||||||||||||||
Sany Heavy Industry Company Limited Class A (Industrials, Machinery) | 333,097 | 637,749 | ||||||||||||||
Shimao Property Holding Limited (Real Estate, Real Estate Management & Development) | 284,500 | 956,690 | ||||||||||||||
Sinopharm Group Company Limited H Shares (Health Care, Health Care Providers & Services) | 230,400 | 827,693 | ||||||||||||||
Tencent Holdings Limited (Communication Services, Interactive Media & Services) | 74,800 | 3,062,276 | ||||||||||||||
Trip.com Group Limited ADR (Consumer Discretionary, Internet & Direct Marketing Retail) † | 29,400 | 969,906 | ||||||||||||||
Uni-President China Holdings Limited (Consumer Staples, Food Products) | 574,000 | 593,342 | ||||||||||||||
Wanhua Chemical Group Company Limited Class A (Materials, Chemicals) | 91,400 | 592,540 | ||||||||||||||
Yum China Holdings Incorporated (Consumer Discretionary, Hotels, Restaurants & Leisure) | 14,800 | 629,000 | ||||||||||||||
Zhengzhou Yutong Bus Company Limited Class A (Industrials, Machinery) | 302,800 | 615,465 | ||||||||||||||
| 33,206,277 | ||||||||||||||||
|
| |||||||||||||||
| Hong Kong: 1.77% | ||||||||||||||||
Chow Tai Fook Jewellery Company Limited (Consumer Discretionary, Specialty Retail) | 806,800 | 726,907 | ||||||||||||||
WH Group Limited (Consumer Staples, Food Products) 144A | 1,207,000 | 1,281,560 | ||||||||||||||
| 2,008,467 | ||||||||||||||||
|
| |||||||||||||||
The accompanying notes are an integral part of these financial statements.
10 | Wells Fargo Asia Pacific Fund
Table of Contents
Portfolio of investments—October 31, 2019
| Shares | Value | |||||||||||||||
| India: 6.25% |
| |||||||||||||||
HDFC Bank Limited (Financials, Banks) | 55,380 | $ | 960,637 | |||||||||||||
ICICI Bank Limited (Financials, Banks) | 259,963 | 1,697,138 | ||||||||||||||
Indian Hotels Company Limited (Consumer Discretionary, Hotels, Restaurants & Leisure) | 437,560 | 937,689 | ||||||||||||||
Infosys Limited ADR (Information Technology, IT Services) | 145,700 | 1,397,263 | ||||||||||||||
Reliance Industries Limited (Energy, Oil, Gas & Consumable Fuels) | 58,490 | 1,207,547 | ||||||||||||||
State Bank of India (Financials, Banks) † | 203,758 | 897,436 | ||||||||||||||
| 7,097,710 | ||||||||||||||||
|
| |||||||||||||||
| Indonesia: 1.67% | ||||||||||||||||
PT Bank Rakyat Indonesia Tbk (Financials, Banks) | 3,102,500 | 930,507 | ||||||||||||||
PT Telekomunikasi Indonesia Persero Tbk (Communication Services, Diversified Telecommunication Services) | 3,282,000 | 960,962 | ||||||||||||||
| 1,891,469 | ||||||||||||||||
|
| |||||||||||||||
| Japan: 28.64% | ||||||||||||||||
Bandai Namco Holdings Incorporated (Consumer Discretionary, Leisure Products) | 14,000 | 864,450 | ||||||||||||||
Ezaki Glico Company Limited (Consumer Staples, Food Products) | 14,900 | 694,018 | ||||||||||||||
FANUC Corporation (Industrials, Machinery) | 4,500 | 900,083 | ||||||||||||||
Hitachi Limited (Information Technology, Electronic Equipment, Instruments & Components) | 52,900 | 1,993,241 | ||||||||||||||
Inpex Holdings Incorporated (Energy, Oil, Gas & Consumable Fuels) | 87,000 | 812,478 | ||||||||||||||
Japan Airlines Company Limited (Industrials, Airlines) | 37,100 | 1,159,139 | ||||||||||||||
Kao Corporation (Consumer Staples, Personal Products) | 13,500 | 1,093,101 | ||||||||||||||
Keyence Corporation (Information Technology, Electronic Equipment, Instruments & Components) | 2,500 | 1,593,203 | ||||||||||||||
KOSE Corporation (Consumer Staples, Personal Products) | 5,200 | 929,345 | ||||||||||||||
Kyoritsu Maintenance Company Limited (Consumer Discretionary, Hotels, Restaurants & Leisure) | 13,300 | 592,397 | ||||||||||||||
Kyushu Railway Company (Industrials, Road & Rail) | 19,600 | 649,764 | ||||||||||||||
Matsumotokiyoshi Holdings Company Limited (Consumer Staples, Food & Staples Retailing) | 37,700 | 1,335,332 | ||||||||||||||
Mitsubishi UFJ Financial Group Incorporated (Financials, Banks) | 323,700 | 1,707,975 | ||||||||||||||
Mitsui Fudosan Company Limited (Real Estate, Real Estate Management & Development) | 52,400 | 1,349,425 | ||||||||||||||
Nintendo Company Limited (Communication Services, Entertainment) | 3,800 | 1,358,978 | ||||||||||||||
Nippon Telegraph & Telephone Corporation (Communication Services, Diversified Telecommunication Services) | 34,800 | 1,732,427 | ||||||||||||||
Obayashi Corporation (Industrials, Construction & Engineering) | 76,000 | 788,221 | ||||||||||||||
Open House Company Limited (Real Estate, Real Estate Management & Development) | 23,000 | 592,305 | ||||||||||||||
ORIX Corporation (Financials, Diversified Financial Services) | 57,600 | 910,218 | ||||||||||||||
Otsuka Corporation (Information Technology, IT Services) | 29,300 | 1,191,101 | ||||||||||||||
Recruit Holdings Company Limited (Industrials, Professional Services) | 24,300 | 812,550 | ||||||||||||||
Ryohin Keikaku Company Limited (Consumer Discretionary, Multiline Retail) | 35,000 | 785,952 | ||||||||||||||
Santen Pharmaceutical Company Limited (Health Care, Pharmaceuticals) | 84,200 | 1,500,926 | ||||||||||||||
SoftBank Group Corporation (Communication Services, Wireless Telecommunication Services) | 33,600 | 1,303,676 | ||||||||||||||
Sony Corporation (Consumer Discretionary, Household Durables) | 13,800 | 846,606 | ||||||||||||||
Sumitomo Mitsui Trust Holdings Incorporated (Financials, Banks) | 33,100 | 1,218,683 | ||||||||||||||
Tokyo Electron Limited (Information Technology, Semiconductors & Semiconductor Equipment) | 5,400 | 1,103,852 | ||||||||||||||
Toyota Motor Corporation (Consumer Discretionary, Automobiles) | 38,700 | �� | 2,702,800 | |||||||||||||
| 32,522,246 | ||||||||||||||||
|
| |||||||||||||||
| Malaysia: 1.21% | ||||||||||||||||
CIMB Group Holdings Bhd (Financials, Banks) | 546,800 | 687,017 | ||||||||||||||
Sime Darby Bhd (Industrials, Industrial Conglomerates) | 1,268,200 | 688,959 | ||||||||||||||
| 1,375,976 | ||||||||||||||||
|
| |||||||||||||||
| Philippines: 1.21% | ||||||||||||||||
Bank of the Philippine Islands (Financials, Banks) | 390,863 | 747,142 | ||||||||||||||
Metro Pacific Investments Corporation (Financials, Diversified Financial Services) | 6,577,000 | 622,122 | ||||||||||||||
| 1,369,264 | ||||||||||||||||
|
| |||||||||||||||
The accompanying notes are an integral part of these financial statements.
Wells Fargo Asia Pacific Fund | 11
Table of Contents
Portfolio of investments—October 31, 2019
| Shares | Value | |||||||||||||||
| Singapore: 1.65% |
| |||||||||||||||
DBS Group Holdings Limited (Financials, Banks) | 31,900 | $ | 609,651 | |||||||||||||
Keppel Corporation Limited (Industrials, Industrial Conglomerates) | 135,400 | 682,748 | ||||||||||||||
Oversea-Chinese Banking Corporation Limited (Financials, Banks) | 72,800 | 586,488 | ||||||||||||||
| 1,878,887 | ||||||||||||||||
|
| |||||||||||||||
| South Korea: 7.61% | ||||||||||||||||
Hyundai Motor Company (Consumer Discretionary, Automobiles) | 5,860 | 614,483 | ||||||||||||||
KB Financial Group Incorporated (Financials, Banks) | 14,871 | 536,197 | ||||||||||||||
Korea Zinc Company Limited (Materials, Metals & Mining) | 1,708 | 637,867 | ||||||||||||||
LG Chem Limited (Materials, Chemicals) | 2,173 | 574,324 | ||||||||||||||
NH Investment & Securities Company Limited (Financials, Capital Markets) | 57,673 | 599,805 | ||||||||||||||
Samsung Electronics Company Limited (Information Technology, Technology Hardware, Storage & Peripherals) | 85,014 | 3,682,759 | ||||||||||||||
Samsung SDI Company Limited (Information Technology, Electronic Equipment, Instruments & Components) | 3,389 | 662,682 | ||||||||||||||
SK Hynix Incorporated (Information Technology, Semiconductors & Semiconductor Equipment) | 18,938 | 1,334,751 | ||||||||||||||
| 8,642,868 | ||||||||||||||||
|
| |||||||||||||||
| Taiwan: 10.46% | ||||||||||||||||
ASE Technology Holding Company Limited (Information Technology, Semiconductors & Semiconductor Equipment) | 307,000 | 801,777 | ||||||||||||||
Delta Electronics Incorporated (Information Technology, Electronic Equipment, Instruments & Components) | 197,000 | 867,200 | ||||||||||||||
Ennoconn Corporation (Information Technology, Technology Hardware, Storage & Peripherals) | 73,000 | 547,971 | ||||||||||||||
Hon Hai Precision Industry Company Limited (Information Technology, Electronic Equipment, Instruments & Components) | 341,868 | 905,194 | ||||||||||||||
Mediatek Incorporated (Information Technology, Semiconductors & Semiconductor Equipment) | 163,000 | 2,184,721 | ||||||||||||||
Taiwan Semiconductor Manufacturing Company Limited (Information Technology, Semiconductors & Semiconductor Equipment) | 445,000 | 4,363,677 | ||||||||||||||
Uni-President Enterprises Corporation (Consumer Staples, Food Products) | 246,000 | 607,717 | ||||||||||||||
Wiwynn Corporation (Information Technology, Technology Hardware, Storage & Peripherals) | 84,000 | 1,597,739 | ||||||||||||||
| 11,875,996 | ||||||||||||||||
|
| |||||||||||||||
| Thailand: 0.50% | ||||||||||||||||
Bangkok Bank PCL (Financials, Banks) | 99,000 | 572,131 | ||||||||||||||
|
| |||||||||||||||
Total Common Stocks (Cost $94,769,558) |
| 111,075,783 | ||||||||||||||
|
| |||||||||||||||
| Yield | ||||||||||||||||
| Short-Term Investments: 1.56% | ||||||||||||||||
| Investment Companies: 1.56% | ||||||||||||||||
Wells Fargo Government Money Market Fund Select Class (l)(u) | 1.75 | % | 1,764,731 | 1,764,731 | ||||||||||||
|
| |||||||||||||||
Total Short-Term Investments (Cost $1,764,731) | 1,764,731 | |||||||||||||||
|
| |||||||||||||||
| Total investments in securities (Cost $96,534,289) | 99.39 | % | 112,840,514 | |||||
Other assets and liabilities, net | 0.61 | 697,877 | ||||||
|
|
|
| |||||
| Total net assets | 100.00 | % | $ | 113,538,391 | ||||
|
|
|
| |||||
The accompanying notes are an integral part of these financial statements.
12 | Wells Fargo Asia Pacific Fund
Table of Contents
Portfolio of investments—October 31, 2019
| † | Non-income-earning security |
| 144A | The security may be resold in transactions exempt from registration, normally to qualified institutional buyers, pursuant to Rule 144A under the Securities Act of 1933. |
| (l) | The issuer of the security is an affiliated person of the Fund as defined in the Investment Company Act of 1940. |
| (u) | The rate represents the7-day annualized yield at period end. |
Abbreviations:
| ADR | American depositary receipt |
| REIT | Real estate investment trust |
Investments in Affiliates
An affiliated investment is an investment in which the Fund owns at least 5% of the outstanding voting shares of the issuer or as a result of other relationships, such as the Fund and the issuer having the same investment manager. Transactions with issuers that were either affiliated persons of the Fund at the beginning of the period or the end of the period were as follows:
| Shares, beginning of period | Shares purchased | Shares sold | Shares, end of period | Net realized gains (losses) | Net change in unrealized gains (losses) | Income from affiliated securities | Value, end of period | % of net assets | ||||||||||||||||||||||||||||
| Short-Term Investments | ||||||||||||||||||||||||||||||||||||
Investment Companies | ||||||||||||||||||||||||||||||||||||
Securities Lending Cash Investments LLC* | 1,444,919 | 6,080,515 | 7,525,434 | 0 | $ | 5 | $ | 0 | $ | 18,373 | # | $ | 0 | |||||||||||||||||||||||
Wells Fargo Government Money Market Fund Select Class | 4,143,878 | 42,748,262 | 45,127,409 | 1,764,731 | 0 | 0 | 44,758 | 1,764,731 | ||||||||||||||||||||||||||||
|
|
|
|
|
|
|
|
|
| |||||||||||||||||||||||||||
| $ | 5 | $ | 0 | $ | 63,131 | $ | 1,764,731 | 1.56 | % | |||||||||||||||||||||||||||
|
|
|
|
|
|
|
|
|
| |||||||||||||||||||||||||||
| * | No longer held at the end of the period |
| # | Amount shown represents income before fees and rebates. |
The accompanying notes are an integral part of these financial statements.
Wells Fargo Asia Pacific Fund | 13
Table of Contents
Statement of assets and liabilities—October 31, 2019
Assets | ||||
Investments in unaffiliated securities, at value (cost $94,769,558) | $ | 111,075,783 | ||
Investments in affiliated securities, at value (cost $1,764,731) | 1,764,731 | |||
Foreign currency, at value (cost $334,014) | 336,968 | |||
Receivable for investments sold | 826,742 | |||
Receivable for Fund shares sold | 3,870 | |||
Receivable for dividends | 389,170 | |||
Prepaid expenses and other assets | 4,198 | |||
|
| |||
Total assets | 114,401,462 | |||
|
| |||
Liabilities | ||||
Payable for investments purchased | 479,490 | |||
Payable for Fund shares redeemed | 73,331 | |||
Management fee payable | 75,139 | |||
Administration fees payable | 18,540 | |||
Distribution fee payable | 667 | |||
Custodian and accounting fees payable | 108,856 | |||
Professional fees payable | 54,337 | |||
Trustees’ fees and expenses payable | 3,927 | |||
Accrued expenses and other liabilities | 48,784 | |||
|
| |||
Total liabilities | 863,071 | |||
|
| |||
Total net assets | $ | 113,538,391 | ||
|
| |||
Net assets consist of | ||||
Paid-in capital | $ | 102,870,481 | ||
Total distributable earnings | 10,667,910 | |||
|
| |||
Total net assets | $ | 113,538,391 | ||
|
| |||
Computation of net asset value and offering price per share | ||||
Net assets – Class A | $ | 91,543,988 | ||
Shares outstanding – Class A1 | 7,393,330 | |||
Net asset value per share – Class A | $12.38 | |||
Maximum offering price per share – Class A2 | $13.14 | |||
Net assets – Class C | $ | 1,037,456 | ||
Shares outstanding – Class C1 | 89,393 | |||
Net asset value per share – Class C | $11.61 | |||
Net assets – Administrator Class | $ | 985,193 | ||
Shares outstanding – Administrator Class1 | 80,796 | |||
Net asset value per share – Administrator Class | $12.19 | |||
Net assets – Institutional Class | $ | 19,971,754 | ||
Shares outstanding – Institutional Class1 | 1,649,873 | |||
Net asset value per share – Institutional Class | $12.11 | |||
| 1 | The Fund has an unlimited number of authorized shares. |
| 2 | Maximum offering price is computed as 100/94.25 of net asset value. On investments of $50,000 or more, the offering price is reduced. |
The accompanying notes are an integral part of these financial statements.
14 | Wells Fargo Asia Pacific Fund
Table of Contents
Statement of operations—year ended October 31, 2019
Investment income | ||||
Dividends (net of foreign withholding taxes of $292,709) | $ | 3,293,163 | ||
Income from affiliated securities | 82,801 | |||
|
| |||
Total investment income | 3,375,964 | |||
|
| |||
Expenses | ||||
Management fee | 1,220,820 | |||
Administration fees | ||||
Class A | 200,497 | |||
Class C | 2,926 | |||
Administrator Class | 1,462 | |||
Institutional Class | 31,316 | |||
Shareholder servicing fees | ||||
Class A | 238,687 | |||
Class C | 3,484 | |||
Administrator Class | 2,811 | |||
Distribution fee | ||||
Class C | 10,450 | |||
Custody and accounting fees | 148,701 | |||
Professional fees | 52,472 | |||
Registration fees | 61,888 | |||
Shareholder report expenses | 54,795 | |||
Trustees’ fees and expenses | 21,626 | |||
Other fees and expenses | 48,005 | |||
|
| |||
Total expenses | 2,099,940 | |||
Less: Fee waivers and/or expense reimbursements | ||||
Fund-level | (213,115 | ) | ||
Class A | (3,320 | ) | ||
Administrator Class | (245 | ) | ||
Institutional Class | (5,280 | ) | ||
|
| |||
Net expenses | 1,877,980 | |||
|
| |||
Net investment income | 1,497,984 | |||
|
| |||
Realized and unrealized gains (losses) on investments | ||||
Net realized gains (losses) on | ||||
Unaffiliated securities | (6,794,173 | ) | ||
Affiliated securities | 5 | |||
|
| |||
Net realized losses on investments | (6,794,168 | ) | ||
Net change in unrealized gains (losses) on investments | 13,029,545 | |||
|
| |||
Net realized and unrealized gains (losses) on investments | 6,235,377 | |||
|
| |||
Net increase in net assets resulting from operations | $ | 7,733,361 | ||
|
| |||
The accompanying notes are an integral part of these financial statements.
Wells Fargo Asia Pacific Fund | 15
Table of Contents
Statement of changes in net assets
| Year ended October 31, 2019 | Year ended October 31, 2018 | |||||||||||||||
Operations | ||||||||||||||||
Net investment income | $ | 1,497,984 | $ | 1,312,596 | ||||||||||||
Net realized gains (losses) on investments | (6,794,168 | ) | 13,610,030 | |||||||||||||
Net change in unrealized gains (losses) on investments | 13,029,545 | (33,372,381 | ) | |||||||||||||
|
| |||||||||||||||
Net increase (decrease) in net assets resulting from operations | 7,733,361 | (18,449,755 | ) | |||||||||||||
|
| |||||||||||||||
Distributions to shareholders from net investment income and net realized gains | ||||||||||||||||
Class A | (11,091,734 | ) | (536,729 | ) | ||||||||||||
Class C | (190,016 | ) | 0 | |||||||||||||
Administrator Class | (142,990 | ) | (4,325 | ) | ||||||||||||
Institutional Class | (3,159,341 | ) | (271,596 | ) | ||||||||||||
|
| |||||||||||||||
Total distributions to shareholders | (14,584,081 | ) | (812,650 | ) | ||||||||||||
|
| |||||||||||||||
Capital share transactions | Shares | Shares | ||||||||||||||
Proceeds from shares sold | ||||||||||||||||
Class A | 460,951 | 5,553,994 | 417,591 | 6,403,383 | ||||||||||||
Class C | 4,060 | 44,730 | 8,393 | 121,862 | ||||||||||||
Administrator Class | 1,605 | 20,491 | 2,010 | 31,448 | ||||||||||||
Institutional Class | 283,934 | 3,322,687 | 670,855 | 10,138,476 | ||||||||||||
|
| |||||||||||||||
| 8,941,902 | 16,695,169 | |||||||||||||||
|
| |||||||||||||||
Reinvestment of distributions | ||||||||||||||||
Class A | 929,465 | 10,709,769 | 33,563 | 518,552 | ||||||||||||
Class C | 14,292 | 154,492 | 0 | 0 | ||||||||||||
Administrator Class | 10,866 | 123,247 | 251 | 3,829 | ||||||||||||
Institutional Class | 271,654 | 3,060,443 | 17,523 | 264,942 | ||||||||||||
|
| |||||||||||||||
| 14,047,951 | 787,323 | |||||||||||||||
|
| |||||||||||||||
Payment for shares redeemed | ||||||||||||||||
Class A | (1,577,740 | ) | (18,842,496 | ) | (1,266,646 | ) | (19,208,805 | ) | ||||||||
Class C | (70,345 | ) | (791,226 | ) | (29,154 | ) | (417,293 | ) | ||||||||
Administrator Class | (31,759 | ) | (375,537 | ) | (37,442 | ) | (547,922 | ) | ||||||||
Institutional Class | (1,000,813 | ) | (11,570,785 | ) | (899,101 | ) | (13,662,192 | ) | ||||||||
|
| |||||||||||||||
| (31,580,044 | ) | (33,836,212 | ) | |||||||||||||
|
| |||||||||||||||
Net decrease in net assets resulting from capital share transactions | (8,590,191 | ) | (16,353,720 | ) | ||||||||||||
|
| |||||||||||||||
Total decrease in net assets | (15,440,911 | ) | (35,616,125 | ) | ||||||||||||
|
| |||||||||||||||
Net assets | ||||||||||||||||
Beginning of period | 128,979,302 | 164,595,427 | ||||||||||||||
|
| |||||||||||||||
End of period | $ | 113,538,391 | $ | 128,979,302 | ||||||||||||
|
| |||||||||||||||
The accompanying notes are an integral part of these financial statements.
16 | Wells Fargo Asia Pacific Fund
Table of Contents
(For a share outstanding throughout each period)
| Year ended October 31 | ||||||||||||||||||||
| CLASS A | 2019 | 2018 | 2017 | 2016 | 2015 | |||||||||||||||
Net asset value, beginning of period | $13.07 | $15.04 | $12.11 | $11.92 | $12.18 | |||||||||||||||
Net investment income | 0.14 | 0.11 | 1 | 0.08 | 0.11 | 1 | 0.04 | 1 | ||||||||||||
Net realized and unrealized gains (losses) on investments | 0.64 | (2.02 | ) | 3.00 | 0.29 | (0.16 | ) | |||||||||||||
|
|
|
|
|
|
|
|
|
| |||||||||||
Total from investment operations | 0.78 | (1.91 | ) | 3.08 | 0.40 | (0.12 | ) | |||||||||||||
Distributions to shareholders from | ||||||||||||||||||||
Net investment income | (0.09 | ) | (0.06 | ) | (0.15 | ) | (0.21 | ) | (0.14 | ) | ||||||||||
Net realized gains | (1.38 | ) | 0.00 | 0.00 | 0.00 | 0.00 | ||||||||||||||
|
|
|
|
|
|
|
|
|
| |||||||||||
Total distributions to shareholders | (1.47 | ) | (0.06 | ) | (0.15 | ) | (0.21 | ) | (0.14 | ) | ||||||||||
Net asset value, end of period | $12.38 | $13.07 | $15.04 | $12.11 | $11.92 | |||||||||||||||
Total return2 | 6.86 | % | (12.74 | )% | 25.84 | % | 3.47 | % | (0.95 | )% | ||||||||||
Ratios to average net assets (annualized) | ||||||||||||||||||||
Gross expenses | 1.78 | % | 1.69 | % | 1.66 | % | 1.69 | % | 1.72 | % | ||||||||||
Net expenses | 1.60 | % | 1.60 | % | 1.60 | % | 1.60 | % | 1.60 | % | ||||||||||
Net investment income | 1.17 | % | 0.76 | % | 0.58 | % | 0.97 | % | 0.34 | % | ||||||||||
Supplemental data | ||||||||||||||||||||
Portfolio turnover rate | 37 | % | 50 | % | 63 | % | 52 | % | 113 | % | ||||||||||
Net assets, end of period (000s omitted) | $91,544 | $99,078 | $126,265 | $120,108 | $137,578 | |||||||||||||||
| 1 | Calculated based upon average shares outstanding |
| 2 | Total return calculations do not include any sales charges. |
The accompanying notes are an integral part of these financial statements.
Wells Fargo Asia Pacific Fund | 17
Table of Contents
Financial highlights
(For a share outstanding throughout each period)
| Year ended October 31 | ||||||||||||||||||||
| CLASS C | 2019 | 2018 | 2017 | 2016 | 2015 | |||||||||||||||
Net asset value, beginning of period | $12.33 | $14.24 | $11.44 | $11.29 | $11.57 | |||||||||||||||
Net investment income (loss) | 0.04 | 1 | (0.00 | )1,2 | (0.02 | )1 | 0.02 | 1 | (0.00 | )1,2 | ||||||||||
Net realized and unrealized gains (losses) on investments | 0.62 | (1.91 | ) | 2.85 | 0.28 | (0.20 | ) | |||||||||||||
|
|
|
|
|
|
|
|
|
| |||||||||||
Total from investment operations | 0.66 | (1.91 | ) | 2.83 | 0.30 | (0.20 | ) | |||||||||||||
Distributions to shareholders from | ||||||||||||||||||||
Net investment income | 0.00 | 0.00 | (0.03 | ) | (0.15 | ) | (0.08 | ) | ||||||||||||
Net realized gains | (1.38 | ) | 0.00 | 0.00 | 0.00 | 0.00 | ||||||||||||||
|
|
|
|
|
|
|
|
|
| |||||||||||
Total distributions to shareholders | (1.38 | ) | 0.00 | (0.03 | ) | (0.15 | ) | (0.08 | ) | |||||||||||
Net asset value, end of period | $11.61 | $12.33 | $14.24 | $11.44 | $11.29 | |||||||||||||||
Total return3 | 6.14 | % | (13.41 | )% | 24.86 | % | 2.75 | % | (1.71 | )% | ||||||||||
Ratios to average net assets (annualized) | ||||||||||||||||||||
Gross expenses | 2.52 | % | 2.44 | % | 2.41 | % | 2.44 | % | 2.46 | % | ||||||||||
Net expenses | 2.35 | % | 2.35 | % | 2.35 | % | 2.35 | % | 2.35 | % | ||||||||||
Net investment income (loss) | 0.34 | % | (0.01 | )% | (0.17 | )% | 0.14 | % | (0.01 | )% | ||||||||||
Supplemental data | ||||||||||||||||||||
Portfolio turnover rate | 37 | % | 50 | % | 63 | % | 52 | % | 113 | % | ||||||||||
Net assets, end of period (000s omitted) | $1,037 | $1,744 | $2,309 | $2,223 | $3,495 | |||||||||||||||
| 1 | Calculated based upon average shares outstanding |
| 2 | Amount is more than $(0.005). |
| 3 | Total return calculations do not include any sales charges. |
The accompanying notes are an integral part of these financial statements.
18 | Wells Fargo Asia Pacific Fund
Table of Contents
Financial highlights
(For a share outstanding throughout each period)
| Year ended October 31 | ||||||||||||||||||||
| ADMINISTRATOR CLASS | 2019 | 2018 | 2017 | 2016 | 2015 | |||||||||||||||
Net asset value, beginning of period | $12.89 | $14.79 | $11.88 | $11.72 | $11.99 | |||||||||||||||
Net investment income | 0.15 | 1 | 0.12 | 1 | 0.04 | 1 | 0.12 | 0.11 | 1 | |||||||||||
Net realized and unrealized gains (losses) on investments | 0.63 | (1.99 | ) | 3.00 | 0.29 | (0.21 | ) | |||||||||||||
|
|
|
|
|
|
|
|
|
| |||||||||||
Total from investment operations | 0.78 | (1.87 | ) | 3.04 | 0.41 | (0.10 | ) | |||||||||||||
Distributions to shareholders from | ||||||||||||||||||||
Net investment income | (0.10 | ) | (0.03 | ) | (0.13 | ) | (0.25 | ) | (0.17 | ) | ||||||||||
Net realized gains | (1.38 | ) | 0.00 | 0.00 | 0.00 | 0.00 | ||||||||||||||
|
|
|
|
|
|
|
|
|
| |||||||||||
Total distributions to shareholders | (1.48 | ) | (0.03 | ) | (0.13 | ) | (0.25 | ) | (0.17 | ) | ||||||||||
Net asset value, end of period | $12.19 | $12.89 | $14.79 | $11.88 | $11.72 | |||||||||||||||
Total return | 6.95 | % | (12.60 | )% | 25.83 | % | 3.60 | % | (0.83 | )% | ||||||||||
Ratios to average net assets (annualized) | ||||||||||||||||||||
Gross expenses | 1.70 | % | 1.60 | % | 1.58 | % | 1.61 | % | 1.56 | % | ||||||||||
Net expenses | 1.50 | % | 1.49 | % | 1.50 | % | 1.47 | % | 1.40 | % | ||||||||||
Net investment income | 1.24 | % | 0.83 | % | 0.36 | % | 1.07 | % | 0.87 | % | ||||||||||
Supplemental data | ||||||||||||||||||||
Portfolio turnover rate | 37 | % | 50 | % | 63 | % | 52 | % | 113 | % | ||||||||||
Net assets, end of period (000s omitted) | $985 | $1,290 | $2,000 | $11,357 | $14,048 | |||||||||||||||
| 1 | Calculated based upon average shares outstanding |
The accompanying notes are an integral part of these financial statements.
Wells Fargo Asia Pacific Fund | 19
Table of Contents
Financial highlights
(For a share outstanding throughout each period)
| Year ended October 31 | ||||||||||||||||||||
| INSTITUTIONAL CLASS | 2019 | 2018 | 2017 | 2016 | 2015 | |||||||||||||||
Net asset value, beginning of period | $12.82 | $14.75 | $11.89 | $11.73 | $12.00 | |||||||||||||||
Net investment income | 0.18 | 0.16 | 0.21 | 0.13 | 0.15 | 1 | ||||||||||||||
Net realized and unrealized gains (losses) on investments | 0.63 | (1.98 | ) | 2.85 | 0.30 | (0.23 | ) | |||||||||||||
|
|
|
|
|
|
|
|
|
| |||||||||||
Total from investment operations | 0.81 | (1.82 | ) | 3.06 | 0.43 | (0.08 | ) | |||||||||||||
Distributions to shareholders from | ||||||||||||||||||||
Net investment income | (0.14 | ) | (0.11 | ) | (0.20 | ) | (0.27 | ) | (0.19 | ) | ||||||||||
Net realized gains | (1.38 | ) | 0.00 | 0.00 | 0.00 | 0.00 | ||||||||||||||
|
|
|
|
|
|
|
|
|
| |||||||||||
Total distributions to shareholders | (1.52 | ) | (0.11 | ) | (0.20 | ) | (0.27 | ) | (0.19 | ) | ||||||||||
Net asset value, end of period | $12.11 | $12.82 | $14.75 | $11.89 | $11.73 | |||||||||||||||
Total return | 7.33 | % | (12.43 | )% | 26.25 | % | 3.83 | % | (0.65 | )% | ||||||||||
Ratios to average net assets (annualized) | ||||||||||||||||||||
Gross expenses | 1.45 | % | 1.36 | % | 1.33 | % | 1.36 | % | 1.36 | % | ||||||||||
Net expenses | 1.25 | % | 1.25 | % | 1.25 | % | 1.25 | % | 1.25 | % | ||||||||||
Net investment income | 1.50 | % | 1.12 | % | 1.11 | % | 1.28 | % | 1.27 | % | ||||||||||
Supplemental data | ||||||||||||||||||||
Portfolio turnover rate | 37 | % | 50 | % | 63 | % | 52 | % | 113 | % | ||||||||||
Net assets, end of period (000s omitted) | $19,972 | $26,868 | $34,022 | $10,237 | $11,034 | |||||||||||||||
| 1 | Calculated based upon average shares outstanding |
The accompanying notes are an integral part of these financial statements.
20 | Wells Fargo Asia Pacific Fund
Table of Contents
1. ORGANIZATION
Wells Fargo Funds Trust (the “Trust”), a Delaware statutory trust organized on March 10, 1999, is anopen-end management investment company registered under the Investment Company Act of 1940, as amended (the “1940 Act”). As an investment company, the Trust follows the accounting and reporting guidance in Financial Accounting Standards Board (“FASB”)Accounting Standards Codification Topic 946, Financial Services – Investment Companies. These financial statements report on the Wells Fargo Asia Pacific Fund (the “Fund”) which is a diversified series of the Trust.
2. SIGNIFICANT ACCOUNTING POLICIES
The following significant accounting policies, which are consistently followed in the preparation of the financial statements of the Fund, are in conformity with U.S. generally accepted accounting principles which require management to make estimates and assumptions that affect the reported amounts of assets and liabilities, disclosure of contingent assets and liabilities at the date of the financial statements, and the reported amounts of revenues and expenses during the reporting period. Actual results could differ from those estimates.
Securities valuation
All investments are valued each business day as of the close of regular trading on the New York Stock Exchange (generally 4 p.m. Eastern Time), although the Fund may deviate from this calculation time under unusual or unexpected circumstances.
Equity securities that are listed on a foreign or domestic exchange or market are valued at the official closing price or, if none, the last sales price. If no sale occurs on the principal exchange or market that day, a fair value price will be determined in accordance with the Fund’s Valuation Procedures.
Forward foreign currency contracts are recorded at the forward rate provided by an independent foreign currency pricing source at a time each business day specified by the Wells Fargo Asset Management Pricing Committee at Wells Fargo Funds Management, LLC (“Funds Management”).
The values of securities denominated in foreign currencies are translated into U.S. dollars at rates provided by an independent foreign currency pricing source at a time each business day specified by the Wells Fargo Asset Management Pricing Committee.
Many securities markets and exchanges outside the U.S. close prior to the close of the New York Stock Exchange and therefore may not fully reflect trading or events that occur after the close of the principal exchange in which the foreign securities are traded, but before the close of the New York Stock Exchange. If such trading or events are expected to materially affect the value of such securities, then fair value pricing procedures approved by the Board of Trustees of the Fund are applied. These procedures take into account multiple factors including movements in U.S. securities markets after foreign exchanges close. Foreign securities that are fair valued under these procedures are categorized as Level 2 and the application of these procedures may result in transfers between Level 1 and Level 2. Depending on market activity, such fair valuations may be frequent. Such fair value pricing may result in net asset values that are higher or lower than net asset values based on the last reported sales price or latest quoted bid price. On October 31, 2019, such fair value pricing was not used in pricing foreign securities.
Investments in registeredopen-end investment companies are valued at net asset value. Interests innon-registered investment companies that are redeemable at net asset value are fair valued normally at net asset value.
Investments which are not valued using any of the methods discussed above are valued at their fair value, as determined in good faith by the Board of Trustees. The Board of Trustees has established a Valuation Committee comprised of the Trustees and has delegated to it the authority to take any actions regarding the valuation of portfolio securities that the Valuation Committee deems necessary or appropriate, including determining the fair value of portfolio securities, unless the determination has been delegated to the Wells Fargo Asset Management Pricing Committee.The Board of Trustees retains the authority to make or ratify any valuation decisions or approve any changes to the Valuation Procedures as it deems appropriate. On a quarterly basis, the Board of Trustees receives reports on any valuation actions taken by the Valuation Committee or the Wells Fargo Asset Management Pricing Committee which may include items for ratification.
Foreign currency translation
The accounting records of the Fund are maintained in U.S. dollars. The values of other assets and liabilities denominated in foreign currencies are translated into U.S. dollars at rates provided by an independent foreign currency pricing source at a time each business day specified by the Wells Fargo Asset Management Pricing Committee. Purchases and sales of securities, and income and expenses are converted at the rate of exchange on the respective dates of such transactions. Net realized foreign exchange gains or losses arise from sales of foreign currencies, currency gains or losses realized between the trade and settlement dates on securities transactions, and the difference between the amounts of dividends, interest and foreign withholding taxes recorded and the U.S. dollar equivalent of the amounts actually paid or received. Net unrealized foreign exchange gains and losses arise
Wells Fargo Asia Pacific Fund | 21
Table of Contents
Notes to financial statements
from changes in the fair value of assets and liabilities other than investments in securities resulting from changes in exchange rates. The changes in net assets arising from changes in exchange rates of securities and the changes in net assets resulting from changes in market prices of securities are not separately presented. Such changes are included in net realized and unrealized gains or losses from investments.
Participation notes
The Fund may invest in participation notes to gain exposure to securities in certain foreign markets. Participation notes are issued by banks or broker-dealers and are designed to offer a return linked to a particular underlying foreign security. Participation notes involve transaction costs, which may be higher than those applicable to the underlying foreign security. The holder of the participation note is entitled to receive from the bank or broker-dealer, an amount equal to the dividend paid by the issuer of the underlying foreign security; however, the holder is not entitled to the same rights (i.e. voting rights) as an owner of the underlying foreign security. Investments in participation notes involve risks beyond those normally associated with a direct investment in an underlying security. The Fund has no rights against the issuer of the underlying foreign security and participation notes expose the Fund to counterparty risk in the event the counterparty does not perform. There is also no assurance there will be a secondary trading market for the participation note or that the trading price of the participation note will equal the underlying value of the foreign security that it seeks to replicate.
Forward foreign currency contracts
A forward foreign currency contract is an agreement between two parties to purchase or sell a specific currency for an agreed-upon price at a future date. The Fund enters into forward foreign currency contracts to facilitate transactions in foreign-denominated securities and to attempt to minimize the risk to the Fund from adverse changes in the relationship between currencies. Forward foreign currency contracts are recorded at the forward rate andmarked-to-market daily. When the contracts are closed, realized gains and losses arising from such transactions are recorded as realized gains or losses on forward foreign currency contracts. The Fund is subject to foreign currency risk and may be exposed to risks if the counterparties to the contracts are unable to meet the terms of their contracts or if the value of the foreign currency changes unfavorably. The Fund’s maximum risk of loss from counterparty credit risk is the unrealized gains on the contracts. This risk may be mitigated if there is a master netting arrangement between the Fund and the counterparty.
Securities lending
The Fund may lend its securities from time to time in order to earn additional income in the form of fees or interest on securities received as collateral or the investment of any cash received as collateral. When securities are on loan, the Fund receives interest or dividends on those securities. Cash collateral received in connection with its securities lending transactions is invested in Securities Lending Cash Investments, LLC (the “Securities Lending Fund”). Investments in Securities Lending Fund are valued at the evaluated bid price provided by an independent pricing service. Income earned from investment in the Securities Lending Fund (net of fees and rebates), if any, is included in income from affiliated securities on the Statement of Operations.
In a securities lending transaction, the net asset value of the Fund is affected by an increase or decrease in the value of the securities loaned and by an increase or decrease in the value of the instrument in which collateral is invested. The amount of securities lending activity undertaken by the Fund fluctuates from time to time. The Fund has the right under the lending agreement to recover the securities from the borrower on demand. In the event of default or bankruptcy by the borrower, the Fund may be prevented from recovering the loaned securities or gaining access to the collateral or may experience delays or costs in doing so. In such an event, the terms of the agreement allows the unaffiliated securities lending agent to use the collateral to purchase replacement securities on behalf of the Fund or pay the Fund the market value of the loaned securities. The Fund bears the risk of loss with respect to depreciation of its investment of the cash collateral.
Security transactions and income recognition
Securities transactions are recorded on a trade date basis. Realized gains or losses are recorded on the basis of identified cost.
Dividend income is recognized on theex-dividend date, except for certain dividends from foreign securities, which are recorded as soon as the custodian verifies theex-dividend date. Dividend income from foreign securities is recorded net of foreign taxes withheld where recovery of such taxes is not assured.
Distributions to shareholders
Distributions to shareholders from net investment income and any net realized gains are recorded on theex-dividend date and paid at least annually. Such distributions are determined in accordance with income tax regulations and may differ from U.S. generally accepted accounting principles. Dividend sources are estimated at the time of declaration. The tax character of distributions is determined as of the Fund’s fiscal year end. Therefore, a portion of the Fund’s distributions made prior to the Fund’s fiscal year end may be categorized as a tax return of capital at year end.
22 | Wells Fargo Asia Pacific Fund
Table of Contents
Notes to financial statements
Federal and other taxes
The Fund intends to continue to qualify as a regulated investment company by distributing substantially all of its investment company taxable income and any net realized capital gains (after reduction for capital loss carryforwards) sufficient to relieve it from all, or substantially all, federal income taxes. Accordingly, no provision for federal income taxes was required.
The Fund’s income and federal excise tax returns and all financial records supporting those returns for the prior three fiscal years are subject to examination by the federal and Delaware revenue authorities. Management has analyzed the Fund’s tax positions taken on federal, state, and foreign tax returns for all open tax years and does not believe that there are any uncertain tax positions that require recognition of a tax liability.
As of October 31, 2019, the aggregate cost of all investments for federal income tax purposes was $97,053,526 and the unrealized gains (losses) consisted of:
Gross unrealized gains | $ | 20,034,547 | ||
Gross unrealized losses | (4,247,559 | ) | ||
Net unrealized gains | $ | 15,786,988 | ||
As of October 31, 2019, the Fund had capital loss carryforwards which consist of $4,034,810 in short-term capital losses and $2,763,637 in long-term capital losses.
Class allocations
The separate classes of shares offered by the Fund differ principally in applicable sales charges, distribution, shareholder servicing, and administration fees. Class specific expenses are charged directly to that share class. Investment income, common fund-level expenses, and realized and unrealized gains (losses) on investments are allocated daily to each class of shares based on the relative proportion of net assets of each class.
3. FAIR VALUATION MEASUREMENTS
Fair value measurements of investments are determined within a framework that has established a fair value hierarchy based upon the various data inputs utilized in determining the value of the Fund’s investments. The three-level hierarchy gives the highest priority to unadjusted quoted prices in active markets for identical assets or liabilities (Level 1) and the lowest priority to unobservable inputs (Level 3). The Fund’s investments are classified within the fair value hierarchy based on the lowest level of input that is significant to the fair value measurement. The inputs are summarized into three broad levels as follows:
| ∎ | Level 1 – quoted prices in active markets for identical securities |
| ∎ | Level 2 – other significant observable inputs (including quoted prices for similar securities, interest rates, prepayment speeds, credit risk, etc.) |
| ∎ | Level 3 – significant unobservable inputs (including the Fund’s own assumptions in determining the fair value of investments) |
The inputs or methodologies used for valuing investments in securities are not necessarily an indication of the risk associated with investing in those securities.
Wells Fargo Asia Pacific Fund | 23
Table of Contents
Notes to financial statements
The following is a summary of the inputs used in valuing the Fund’s assets and liabilities as of October 31, 2019:
| Quoted prices (Level 1) | Other significant observable inputs (Level 2) | Significant (Level 3) | Total | |||||||||||||
Assets | ||||||||||||||||
Investments in: | ||||||||||||||||
Common stocks | ||||||||||||||||
Australia | $ | 8,634,492 | $ | 0 | $ | 0 | $ | 8,634,492 | ||||||||
China | 33,206,277 | 0 | 0 | 33,206,277 | ||||||||||||
Hong Kong | 2,008,467 | 0 | 0 | 2,008,467 | ||||||||||||
India | 7,097,710 | 0 | 0 | 7,097,710 | ||||||||||||
Indonesia | 1,891,469 | 0 | 0 | 1,891,469 | ||||||||||||
Japan | 32,522,246 | 0 | 0 | 32,522,246 | ||||||||||||
Malaysia | 1,375,976 | 0 | 0 | 1,375,976 | ||||||||||||
Philippines | 1,369,264 | 0 | 0 | 1,369,264 | ||||||||||||
Singapore | 1,878,887 | 0 | 0 | 1,878,887 | ||||||||||||
South Korea | 8,642,868 | 0 | 0 | 8,642,868 | ||||||||||||
Taiwan | 11,875,996 | 0 | 0 | 11,875,996 | ||||||||||||
Thailand | 572,131 | 0 | 0 | 572,131 | ||||||||||||
Short-term investments | ||||||||||||||||
Investment companies | 1,764,731 | 0 | 0 | 1,764,731 | ||||||||||||
Total assets | $ | 112,840,514 | $ | 0 | $ | 0 | $ | 112,840,514 | ||||||||
Additional sector, industry or geographic detail is included in the Portfolio of Investments.
For the year ended October 31, 2019, the Fund did not have any transfers into/out of Level 3.
4. TRANSACTIONS WITH AFFILIATES
Management fee
Funds Management, an indirect wholly owned subsidiary of Wells Fargo & Company (“Wells Fargo”), is the manager of the Fund and provides advisory and fund-level administrative services under an investment management agreement. Under the investment management agreement, Funds Management is responsible for, among other services, implementing the investment objectives and strategies of the Fund, supervising the subadviser and providing fund-level administrative services in connection with the Fund’s operations. As compensation for its services under the investment management agreement, Funds Management is entitled to receive a management fee at the following annual rate based on the Fund’s average daily net assets:
| Average daily net assets | Management fee | |||
First $500 million | 1.000 | % | ||
Next $500 million | 0.950 | |||
Next $1 billion | 0.900 | |||
Next $2 billion | 0.875 | |||
Next $1 billion | 0.850 | |||
Next $5 billion | 0.840 | |||
Over $10 billion | 0.830 | |||
For the year ended October 31, 2019, the management fee was equivalent to an annual rate of 1.00% of the Fund’s average daily net assets.
Funds Management has retained the services of a subadviser to provide daily portfolio management to the Fund. The fee for subadvisory services is borne by Funds Management. Wells Capital Management Incorporated (“WellsCap”), an affiliate of Funds Management and an indirect wholly owned subsidiary of Wells Fargo, is the subadviser to the Fund and is entitled to receive a fee from Funds Management at an annual rate starting at 0.65% and declining to 0.45% as the average daily net assets of the Fund increase.
24 | Wells Fargo Asia Pacific Fund
Table of Contents
Notes to financial statements
Administration fees
Under a class-level administration agreement, Funds Management provides class-level administrative services to the Fund, which includes paying fees and expenses for services provided by the transfer agent,sub-transfer agents, omnibus account servicers and record-keepers. As compensation for its services under the class-level administration agreement, Funds Management receives an annual fee which is calculated based on the average daily net assets of each class as follows:
| Class-level administration fee | ||||
Class A, Class C, | 0.21 | % | ||
Administrator Class, Institutional Class | 0.13 | |||
Waivers and/or expense reimbursements
Funds Management has contractually waived and/or reimbursed management and administration fees to the extent necessary to maintain certain net operating expense ratios for the Fund. When each class of the Fund has exceeded its expense cap, Funds Management has waived fees and/or reimbursed expenses from fund-level expenses on a proportionate basis and then from class specific expenses. When only certain classes exceed their expense caps, waivers and/or reimbursements are applied against class specific expenses before fund-level expenses. Funds Management has committed through February 29, 2020, to waive fees and/or reimburse expenses to the extent necessary to cap the Fund’s expenses at 1.60% for Class A shares, 2.35% for Class C shares, 1.50% for Administrator Class shares, and 1.25% for Institutional Class shares. Prior to or after the commitment expiration date, the cap may be increased or the commitment to maintain the cap may be terminated only with the approval of the Board of Trustees.
Distribution fee
The Trust has adopted a distribution plan for Class C shares of the Fund pursuant to Rule12b-1 under the 1940 Act. A distribution fee is charged to Class C shares and paid to Wells Fargo Funds Distributor, LLC (“Funds Distributor”), the principal underwriter, at an annual rate of 0.75% of the average daily net assets of Class C shares.
In addition, Funds Distributor is entitled to receive thefront-end sales charge from the purchase of Class A shares and a contingent deferred sales charge on the redemption of certain Class A shares. Funds Distributor is also entitled to receive the contingent deferred sales charges from redemptions of Class C shares. For the year ended October 31, 2019, Funds Distributor received $1,645 from the sale of Class A shares. No contingent deferred sales charges were incurred by Class A and Class C shares for the year ended October 31, 2019.
Shareholder servicing fees
The Trust has entered into contracts with one or more shareholder servicing agents, whereby Class A, Class C, and Administrator Class of the Fund are charged a fee at an annual rate of 0.25% of the average daily net assets of each respective class. A portion of these total shareholder servicing fees were paid to affiliates of Wells Fargo.
Interfund transactions
The Fund may purchase or sell portfolio investment securities to certain other Wells Fargo affiliates pursuant to Rule17a-7 under the 1940 Act and under procedures adopted by the Board of Trustees. The procedures have been designed to ensure that these interfund transactions, which do not incur broker commissions, are effected at current market prices.
5. INVESTMENT PORTFOLIO TRANSACTIONS
Purchases and sales of investments, excluding U.S. government obligations (if any) and short-term securities, for the year ended October 31, 2019 were $43,533,095 and $62,492,671, respectively.
6. SECURITIES LENDING TRANSACTIONS
The Fund lends its securities through an unaffiliated securities lending agent and receives collateral in the form of cash or securities with a value at least equal to the value of the securities on loan. The value of the loaned securities is determined at the close of each business day and any increases or decreases in the required collateral are exchanged between the Fund and the counterparty on the next business day. Cash collateral received is invested in the Securities Lending Fund which seeks to provide a positive return compared to the daily Fed Funds Open Rate by investing in high-quality, U.S. dollar-denominated short-term money market instruments and is exempt from registration under Section 3(c)(7) of the 1940 Act. Securities Lending Fund is managed by Funds Management and is subadvised by WellsCap. Funds Management receives an advisory fee starting at 0.05% and declining to 0.01% as the average daily net assets of the Securities Lending Fund increase. All of the fees received by Funds Management are paid to WellsCap for its services as subadviser.
Wells Fargo Asia Pacific Fund | 25
Table of Contents
Notes to financial statements
In the event of counterparty default or the failure of a borrower to return a loaned security, the Fund has the right to use the collateral to offset any losses incurred. As of October 31, 2019, the Fund did not have any securities on loan.
7. BANK BORROWINGS
The Trust (excluding the money market funds), Wells Fargo Master Trust and Wells Fargo Variable Trust are parties to a $280,000,000 revolving credit agreement whereby the Fund is permitted to use bank borrowings for temporary or emergency purposes, such as to fund shareholder redemption requests. Interest under the credit agreement is charged to the Fund based on a borrowing rate equal to the higher of the Federal Funds rate in effect on that day plus 1.25% or the overnight LIBOR rate in effect on that day plus 1.25%. In addition, an annual commitment fee equal to 0.25% of the unused balance is allocated to each participating fund.
For the year ended October 31, 2019, there were no borrowings by the Fund under the agreement.
8. DISTRIBUTIONS TO SHAREHOLDERS
The tax character of distributions paid during the years ended October 31, 2019 and October 31, 2018 were as follows:
| Year ended October 31 | ||||||||
| 2019 | 2018 | |||||||
Ordinary income | $ | 3,701,304 | $ | 812,650 | ||||
Long-term capital gain | 10,882,777 | 0 | ||||||
As of October 31, 2019, the components of distributable earnings on a tax basis were as follows:
| Undistributed ordinary income | Unrealized gains | Capital loss carryforward | ||
| $1,676,050 | $15,790,307 | $(6,798,447) | ||
9. CONCENTRATION RISKS
Concentration risks result from exposure to a limited number of geographic regions. As of the end of the period, the Fund invests a concentration of its portfolio in China and Japan. A fund that invests a substantial portion of its assets in any country may be more affected by changes in that country than would be a fund whose investments are not heavily weighted in any country.
10. INDEMNIFICATION
Under the Trust’s organizational documents, the officers and Trustees have been granted certain indemnification rights against certain liabilities that may arise out of performance of their duties to the Trust. At a meeting held on November 21-22, 2019, the Board of Trustees of the Fund approved a proposal to authorize the Fund to enter into a separate agreement with each Trustee that would convert indemnification rights currently existing under the Fund’s organizational documents into contractual rights that could not be changed in the future without the consent of the Trustee. Additionally, in the normal course of business, the Trust may enter into contracts with service providers that contain a variety of indemnification clauses. The Trust’s maximum exposure under these arrangements is dependent on future claims that may be made against the Fund and, therefore, cannot be estimated.
11. NEW ACCOUNTING PRONOUNCEMENT
In August 2018, FASB issued Accounting Standards Update (“ASU”)No. 2018-13, Fair Value Measurement (Topic 820)Disclosure Framework—Changes to the Disclosure Requirements for Fair Value Measurement. ASU2018-13 updates the disclosure requirements for fair value measurements by modifying or removing certain disclosures and adding certain new disclosures. The amendments are effective for fiscal years, and interim periods within those fiscal years, beginning after December 15, 2019. Early adoption is permitted. Management has adopted the removal and modification of disclosures early, as permitted, and will adopt the additional new disclosures at the effective date.
12. SUBSEQUENT EVENT
After the close of business on December 6, 2019, Wells Fargo Emerging Markets Equity Income Fund acquired the net assets of the Fund in a tax-free exchange for shares of Wells Fargo Emerging Markets Equity Income Fund. Shareholders of Class A, Class C, Administrator Class, and Institutional Class shares of the Fund received corresponding shares of Wells Fargo Emerging Markets Equity Income Fund.
26 | Wells Fargo Asia Pacific Fund
Table of Contents
Report of independent registered public accounting firm
TO THE SHAREHOLDERS OF THE FUND AND BOARD OF TRUSTEES OF WELLS FARGO FUNDS TRUST:
Opinion on the Financial Statements
We have audited the accompanying statement of assets and liabilities of Wells Fargo Asia Pacific Fund (the Fund), one of the funds constituting Wells Fargo Funds Trust, including the portfolio of investments, as of October 31, 2019, the related statement of operations for the year then ended, the statements of changes in net assets for each of the years in the two-year period then ended, and the related notes (collectively, the financial statements) and the financial highlights for each of the years in the five-year period then ended. In our opinion, the financial statements and financial highlights present fairly, in all material respects, the financial position of the Fund as of October 31, 2019, the results of its operations for the year then ended, the changes in its net assets for each of the years in the two-year period then ended, and the financial highlights for each of the years in the five-year period then ended, in conformity with U.S. generally accepted accounting principles.
Subsequent Event
As described in note 12 to the financial statements, on December 6, 2019, the net assets of the Fund were acquired by Wells Fargo Emerging Markets Equity Income Fund.
Basis for Opinion
These financial statements and financial highlights are the responsibility of the Fund’s management. Our responsibility is to express an opinion on these financial statements and financial highlights based on our audits. We are a public accounting firm registered with the Public Company Accounting Oversight Board (United States) (PCAOB) and are required to be independent with respect to the Fund in accordance with the U.S. federal securities laws and the applicable rules and regulations of the Securities and Exchange Commission and the PCAOB.
We conducted our audits in accordance with the standards of the PCAOB. Those standards require that we plan and perform the audit to obtain reasonable assurance about whether the financial statements and financial highlights are free of material misstatement, whether due to error or fraud. Our audits included performing procedures to assess the risks of material misstatement of the financial statements and financial highlights, whether due to error or fraud, and performing procedures that respond to those risks. Such procedures included examining, on a test basis, evidence regarding the amounts and disclosures in the financial statements and financial highlights. Such procedures also included confirmation of securities owned as of October 31, 2019, by correspondence with the custodian, transfer agent and brokers, or by other appropriate auditing procedures. Our audits also included evaluating the accounting principles used and significant estimates made by management, as well as evaluating the overall presentation of the financial statements and financial highlights. We believe that our audits provide a reasonable basis for our opinion.

We have not been able to determine the specific year that we began serving as the auditor of one or more Wells Fargo Funds investment companies; however we are aware that we have served as the auditor of one or more Wells Fargo Funds investment companies since at least 1955.
Boston, Massachusetts
December 20, 2019
Wells Fargo Asia Pacific Fund | 27
Table of Contents
TAX INFORMATION
Pursuant to Section 852 of the Internal Revenue Code, $10,882,756 was designated as a 20% rate gain distribution for the fiscal year ended October 31, 2019.
Pursuant to Section 854 of the Internal Revenue Code, $2,859,075 of income dividends paid during the fiscal year ended October 31, 2019 has been designated as qualified dividend income (QDI).
For the fiscal year ended October 31, 2019, $16,028 has been designated as interest-related dividends for nonresident alien shareholders pursuant to Section 871 of the Internal Revenue Code.
For the fiscal year ended October 31, 2019, $2,626,515 has been designated as short-term capital gain dividends for nonresident alien shareholders pursuant to Section 871 of the Internal Revenue Code.
Pursuant to Section 853 of the Internal Revenue Code, the following amounts have been designated as foreign taxes paid for the fiscal year ended October 31, 2019. These amounts may be less than the actual foreign taxes paid for financial statement purposes. Foreign taxes paid or withheld should be included in taxable income with an offsetting deduction from gross income or as a credit for taxes paid to foreign governments. None of the income was derived from ineligible foreign sources as defined under Section 901(j) of the Internal Revenue Code.
Creditable foreign taxes paid | Per share amount | Foreign income as % of ordinary income distributions | ||
| $288,479 | $0.0313 | 93% | ||
PROXY VOTING INFORMATION
A description of the policies and procedures used to determine how to vote proxies relating to portfolio securities is available, upon request, by calling1-800-222-8222, visiting our website atwfam.com, or visiting the SEC website at sec.gov. Information regarding how the proxies related to portfolio securities were voted during the most recent12-month period ended June 30 is available on the website atwfam.comor by visiting the SEC website at sec.gov.
QUARTERLY PORTFOLIO HOLDINGS INFORMATION
The Fund files its complete schedule of portfolio holdings with the SEC for the first and third quarters of each fiscal year on Form N-Q or FormN-PORT, which is available by visiting the SEC website at sec.gov. Those forms may be reviewed and copied at the SEC’s Public Reference Room in Washington, DC. Information on the operation of the Public Reference Room may be obtained by calling1-800-SEC-0330.
28 | Wells Fargo Asia Pacific Fund
Table of Contents
Other information (unaudited)
BOARD OF TRUSTEES AND OFFICERS
Each of the Trustees and Officers1 listed in the table below acts in identical capacities for each fund in the Wells Fargo family of funds, which consists of 150 mutual funds comprising the Wells Fargo Funds Trust, Wells Fargo Variable Trust, Wells Fargo Master Trust and fourclosed-end funds (collectively the “Fund Complex”). This table should be read in conjunction with the Prospectus and the Statement of Additional Information2. The mailing address of each Trustee and Officer is 525 Market Street, 12th Floor, San Francisco, CA 94105. Each Trustee and Officer serves an indefinite term, however, each Trustee serves such term until reaching the mandatory retirement age established by the Trustees.
Independent Trustees
| Name and year of birth | Position held and length of service* | Principal occupations during past five years or longer | Current other public company or investment company directorships | |||
| William R. Ebsworth (Born 1957) | Trustee, since 2015 | Retired. From 1984 to 2013, equities analyst, portfolio manager, research director and chief investment officer at Fidelity Management and Research Company in Boston, Tokyo, and Hong Kong, and retired in 2013 as Chief Investment Officer of Fidelity Strategic Advisers, Inc. where he led a team of investment professionals managing client assets. Prior thereto, Board member of Hong Kong Securities Clearing Co., Hong Kong Options Clearing Corp., the Thailand International Fund, Ltd., Fidelity Investments Life Insurance Company, and Empire Fidelity Investments Life Insurance Company. Audit Committee Chair and Investment Committee Chair of the Vincent Memorial Hospital Endowment(non-profit organization). Mr. Ebsworth is a CFA® charterholder. | N/A | |||
| Jane A. Freeman (Born 1953) | Trustee, since 2015; Chair Liaison, since 2018 | Retired. From 2012 to 2014 and 1999 to 2008, Chief Financial Officer of Scientific Learning Corporation. From 2008 to 2012, Ms. Freeman provided consulting services related to strategic business projects. Prior to 1999, Portfolio Manager at Rockefeller & Co. and Scudder, Stevens & Clark. Board member of the Harding Loevner Funds from 1996 to 2014, serving as both Lead Independent Director and chair of the Audit Committee. Board member of the Russell Exchange Traded Funds Trust from 2011 to 2012 and the chair of the Audit Committee. Ms. Freeman is a Board Member of The Ruth Bancroft Garden(non-profit organization). She is also an inactive Chartered Financial Analyst. | N/A | |||
| Isaiah Harris, Jr. (Born 1952) | Trustee, since 2009; Audit Committee Chairman, since 2019 | Retired. Chairman of the Board of CIGNA Corporation since 2009, and Director since 2005. From 2003 to 2011, Director of Deluxe Corporation. Prior thereto, President and CEO of BellSouth Advertising and Publishing Corp. from 2005 to 2007, President and CEO of BellSouth Enterprises from 2004 to 2005 and President of BellSouth Consumer Services from 2000 to 2003. Emeritus member of the Iowa State University Foundation Board of Governors. Emeritus Member of the Advisory Board of Iowa State University School of Business. Advisory Board Member, Palm Harbor Academy (private school). Advisory Board Member, Child Evangelism Fellowship(non-profit). Mr. Harris is a certified public accountant (inactive status). | CIGNA Corporation | |||
| Judith M. Johnson (Born 1949) | Trustee, since 2008; Audit Committee Chairman, from 2009 to 2018 | Retired. Prior thereto, Chief Executive Officer and Chief Investment Officer of Minneapolis Employees Retirement Fund from 1996 to 2008. Ms. Johnson is an attorney, certified public accountant and a certified managerial accountant. | N/A | |||
Wells Fargo Asia Pacific Fund | 29
Table of Contents
Other information (unaudited)
| Name and year of birth | Position held and length of service* | Principal occupations during past five years or longer | Current other public company or investment company directorships | |||
| David F. Larcker (Born 1950) | Trustee, since 2009 | James Irvin Miller Professor of Accounting at the Graduate School of Business, Stanford University, Director of the Corporate Governance Research Initiative and Senior Faculty of The Rock Center for Corporate Governance since 2006. From 2005 to 2008, Professor of Accounting at the Graduate School of Business, Stanford University. Prior thereto, Ernst & Young Professor of Accounting at The Wharton School, University of Pennsylvania from 1985 to 2005. | N/A | |||
| Olivia S. Mitchell (Born 1953) | Trustee, since 2006; Nominating and Governance Committee Chair, since 2018 | International Foundation of Employee Benefit Plans Professor, Wharton School of the University of Pennsylvania since 1993. Director of Wharton’s Pension Research Council and Boettner Center on Pensions & Retirement Research, and Research Associate at the National Bureau of Economic Research. Previously, Cornell University Professor from 1978 to 1993. | N/A | |||
| Timothy J. Penny (Born 1951) | Trustee, since 1996; Chairman, since 2018 | President and Chief Executive Officer of Southern Minnesota Initiative Foundation, anon-profit organization, since 2007. Member of the Board of Trustees of NorthStar Education Finance, Inc., anon-profit organization, since 2007. | N/A | |||
| James G. Polisson (Born 1959) | Trustee, since 2018 | Retired. Chief Marketing Officer, Source (ETF) UK Services, Ltd, from 2015 to 2017. From 2012 to 2015, Principal of The Polisson Group, LLC, a management consulting, corporate advisory and principal investing company. Chief Executive Officer and Managing Director at Russell Investments, Global Exchange Traded Funds from 2010 to 2012. Managing Director of Barclays Global Investors from 1998 to 2010 and Global Chief Marketing Officer for iShares and Barclays Global Investors from 2000 to 2010. Trustee of the San Francisco Mechanics’ Institute, anon-profit organization, from 2013 to 2015. Board member of the Russell Exchange Traded Fund Trust from 2011 to 2012. Director of Barclays Global Investors Holdings Deutschland GmbH from 2006 to 2009. Mr. Polisson is an attorney and has a retired status with the Massachusetts and District of Columbia Bar Associations. | N/A | |||
| Pamela Wheelock3 (Born 1959) | Trustee, since January 2020; previously Trustee from January 2018 to July 2019 | Board member of the Destination Medical Center Economic Development Agency, Rochester, Minnesota since 2019. Acting Commissioner, Minnesota Department of Human Services, July 2019 through September 2019. Human Services Manager (part-time), Minnesota Department of Human Services, October 2019 through December 2019. Chief Operating Officer, Twin Cities Habitat for Humanity from 2017 to 2019. Vice President of University Services, University of Minnesota from 2012 to 2016. Prior thereto, on the Board of Directors, Governance Committee and Finance Committee for the Minnesota Philanthropy Partners (Saint Paul Foundation) from 2012 to 2018, Interim Chief Executive Officer of Blue Cross Blue Shield of Minnesota from 2011 to 2012, Chairman of the Board from 2009 to 2012 and Board Director from 2003 to 2015. Vice President, Leadership and Community Engagement, Bush Foundation, Saint Paul, Minnesota (a private foundation) from 2009 to 2011. Executive Vice President and Chief Financial Officer, Minnesota Sports and Entertainment from 2004 to 2009 and Senior Vice President from 2002 to 2004. Executive Vice President of the Minnesota Wild Foundation from 2004 to 2008. Commissioner of Finance, State of Minnesota, from 1999 to 2002. Currently Board Chair of the Minnesota Wild Foundation since 2010. | N/A | |||
| * | Length of service dates reflect the Trustee’s commencement of service with the Trust’s predecessor entities, where applicable. |
30 | Wells Fargo Asia Pacific Fund
Table of Contents
Other information (unaudited)
Officers
| Name and year of birth | Position held and length of service | Principal occupations during past five years or longer | ||
| Andrew Owen (Born 1960) | President, since 2017 | Executive Vice President of Wells Fargo & Company and Head of Affiliated Managers, Wells Fargo Asset Management, since 2014. In addition, Mr. Owen is currently President, Chief Executive Officer and Director of Wells Fargo Funds Management, LLC since 2017. Prior thereto, Executive Vice President responsible for marketing, investments and product development for Wells Fargo Funds Management, LLC, from 2009 to 2014. | ||
| Jeremy DePalma1 (Born 1974) | Treasurer, since 2012 | Senior Vice President of Wells Fargo Funds Management, LLC since 2009. Senior Vice President of Evergreen Investment Management Company, LLC from 2008 to 2010 and head of the Fund Reporting and Control Team within Fund Administration from 2005 to 2010. | ||
| Michelle Rhee4 (Born 1966) | Chief Legal Officer, since 2019 | Secretary of Wells Fargo Funds Management, LLC, Chief Legal Counsel of Wells Fargo Asset Management and Assistant General Counsel of Wells Fargo Bank, N.A. since 2018. Associate General Counsel and Managing Director of Bank of America Corporation from 2004 to 2018. | ||
| Catherine Kennedy5 (Born 1969) | Secretary, since 2019 | Vice President of Wells Fargo Funds Management, LLC and Senior Counsel of the Wells Fargo Legal Department since 2010. Vice President and Senior Counsel of Evergreen Investment Management Company, LLC from 1998 to 2010. | ||
| Michael H. Whitaker(Born 1967) | Chief Compliance Officer, since 2016 | Chief Compliance Officer of Wells Fargo Asset Management since 2016. Senior Vice President and Chief Compliance Officer for Fidelity Investments from 2007 to 2016. | ||
| David Berardi (Born 1975) | Assistant Treasurer, since 2009 | Vice President of Wells Fargo Funds Management, LLC since 2009. Vice President of Evergreen Investment Management Company, LLC from 2008 to 2010. Manager of Fund Reporting and Control for Evergreen Investment Management Company, LLC from 2004 to 2010. | ||
| 1 | Jeremy DePalma acts as Treasurer of 86 funds and Assistant Treasurer of 64 funds in the Fund Complex. |
| 2 | The Statement of Additional Information includes additional information about the Trustees and is available, without charge, upon request, by calling1-800-222-8222 or by visiting the website atwfam.com. |
| 3 | Ms. Wheelock was re-appointed to the Board effective January 1, 2020. |
| 4 | Michelle Rhee became Chief Legal Officer effective October 22, 2019. |
| 5 | Catherine Kennedy became Secretary effective October 22, 2019. |
Wells Fargo Asia Pacific Fund | 31
Table of Contents
Other information (unaudited)
BOARD CONSIDERATION OF INVESTMENT MANAGEMENT ANDSUB-ADVISORY AGREEMENTS:
Wells Fargo Asia Pacific Fund
Under the Investment Company Act of 1940 (the “1940 Act”), the Board of Trustees (the “Board”) of Wells Fargo Funds Trust (the “Trust”) must determine annually whether to approve the continuation of the Trust’s investment management andsub-advisory agreements. In this regard, at anin-person meeting held on May21-22, 2019 (the “Meeting”), the Board, all the members of which have no direct or indirect interest in the investment management andsub-advisory agreements and are not “interested persons” of the Trust, as defined in the 1940 Act (the “Independent Trustees”), reviewed and approved for Wells Fargo Asia Pacific Fund(the “Fund”): (i) an investment management agreement (the “Management Agreement”) with Wells Fargo Funds Management, LLC (“Funds Management”); and (ii) an investmentsub-advisory agreement (the“Sub-Advisory Agreement”) with Wells Capital Management Incorporated (the“Sub-Adviser”), an affiliate of Funds Management. The Management Agreement and theSub-Advisory Agreement are collectively referred to as the “Advisory Agreements.”
At the Meeting, the Board considered the factors and reached the conclusions described below relating to the selection of Funds Management and theSub-Adviser and the approval of the Advisory Agreements. Prior to the Meeting, including at anin-person meeting in April 2019, the Trustees conferred extensively among themselves and with representatives of Funds Management about these matters. Also, the Board has adopted a team-based approach, with each team consisting of asub-set of Trustees, to assist the full Board in the discharge of its duties in reviewing investment performance and other matters throughout the year. The Independent Trustees were assisted in their evaluation of the Advisory Agreements by independent legal counsel, from whom they received separate legal advice and with whom they met separately.
In providing information to the Board, Funds Management and theSub-Adviser were guided by a detailed set of requests for information submitted to them by independent legal counsel on behalf of the Independent Trustees at the start of the Board’s annual contract renewal process earlier in 2019. In considering and approving the Advisory Agreements, the Trustees considered the information they believed relevant, including but not limited to the information discussed below. The Board considered not only the specific information presented in connection with the Meeting, but also the knowledge gained over time through interaction with Funds Management and theSub-Adviser about various topics. In this regard, the Board reviewed reports of Funds Management at each of its quarterly meetings, which included, among other things, portfolio reviews and investment performance reports. In addition, the Board and the teams mentioned above confer with portfolio managers at various times throughout the year. The Board did not identify any particular information or consideration that wasall-important or controlling, and each individual Trustee may have attributed different weights to various factors.
After its deliberations, the Board unanimously approved the continuation of the Advisory Agreements for aone-year term and determined that the compensation payable to Funds Management and theSub-Adviser under each of the Advisory Agreements was reasonable. The Board considered the approval of the Advisory Agreements for the Fund as part of its consideration of agreements for funds across the complex, but its approvals were made on afund-by-fund basis. The following summarizes a number of important, but not necessarily all, factors considered by the Board in support of its approvals.
Nature, extent and quality of services
The Board received and considered various information regarding the nature, extent and quality of services provided to the Fund by Funds Management and theSub-Adviser under the Advisory Agreements. This information included a description of the investment advisory services and Fund-level administrative services covered by the Management Agreement, as well as, among other things, a summary of the background and experience of senior management of Wells Fargo Asset Management (“WFAM”), of which Funds Management and theSub-Adviser are a part, a summary of investments made in the business of WFAM, a summary of certain organizational and personnel changes involving Funds Management and theSub-Adviser, and a description of Funds Management’s and theSub-Adviser’s business continuity planning programs and of their approaches to data privacy and cybersecurity. The Board received and reviewed information about Funds Management’s role as administrator of the Fund’s liquidity risk management program. The Board also considered the qualifications, background, tenure and responsibilities of each of the portfolio managers primarily responsible for theday-to-day portfolio management of the Fund.
The Board evaluated the ability of Funds Management and theSub-Adviser to attract and retain qualified investment professionals, including research, advisory and supervisory personnel. The Board further considered the compliance programs and compliance records of Funds Management and theSub-Adviser. In addition, the Board took into account the full range of services provided to the Fund by Funds Management and its affiliates.
32 | Wells Fargo Asia Pacific Fund
Table of Contents
Other information (unaudited)
Fund investment performance and expenses
The Board considered the investment performance results for the Fund over various time periods ended December 31, 2018. The Board considered these results in comparison to the investment performance of funds in a universe that was determined by Broadridge Inc. (“Broadridge”) to be similar to the Fund (the “Universe”), and in comparison to the Fund’s benchmark index and to other comparative data. Broadridge is an independent provider of investment company data. The Board received a description of the methodology used by Broadridge to select the mutual funds in the performance Universe. The Board noted that the investment performance of the Fund (Class A) was higher than or in range of the average investment performance of the Universe for the five- andten-year periods under review, but lower than the average investment performance of the Universe for theone- and three-year periods under review. The Board also noted that the investment performance of the Fund was in range of or higher than its benchmark index, the MSCI All Country Asia Pacific Index (Net), for the five- andten-year periods under review, but lower than its benchmark for theone- and three-year periods under review.
The Board received information concerning, and discussed factors contributing to, the underperformance of the Fund relative to the Universe and benchmark for the periods identified above. The Board took note of the explanations for the relative underperformance during these periods, including with respect to investment decisions and market factors that affected the Fund’s investment performance. The Board also took note of the Fund’s stronger performance relative to the Universe and benchmark over the longer time periods under review.
The Board also received and considered information regarding the Fund’s net operating expense ratios and their various components, including actual management fees, custodian and othernon-management fees, and Rule12b-1 andnon-Rule12b-1 shareholder service fees. The Board considered these ratios in comparison to the median ratios of funds in class-specific expense groups that were determined by Broadridge to be similar to the Fund (the ���Groups”). The Board received a description of the methodology used by Broadridge to select the mutual funds in the expense Groups and an explanation of how funds comprising expense groups and their expense ratios may vary fromyear-to-year. Based on the Broadridge reports, the Board noted that the net operating expense ratios of the Fund were in range of or lower than the median net operating expense ratios of the expense Groups for each share class.
The Board took into account the Fund’s investment performance and expense information provided to it among the factors considered in deciding tore-approve the Advisory Agreements.
Investment management andsub-advisory fee rates
The Board reviewed and considered the contractual fee rates payable by the Fund to Funds Management under the Management Agreement, as well as the contractual fee rates payable by the Fund to Funds Management for class-level administrative services under a Class-Level Administration Agreement, which include, among other things, class-level transfer agency andsub-transfer agency costs (collectively, the “Management Rates”). The Board also reviewed and considered the contractual investmentsub-advisory fee rates that are payable by Funds Management to theSub-Adviser for investmentsub-advisory services.
Among other information reviewed by the Board was a comparison of the Fund’s Management Rates with the average contractual investment management fee rates of funds in the expense Groups at a common asset level as well as transfer agency costs of the funds in the expense Groups. The Board noted that the Management Rates of the Fund were higher than the sum of these average rates for the Fund’s expense Groups for all share classes. However, the Board noted that the net operating expense ratios of the Fund were lower than the median net operating expense ratios of the expense Groups for each share class.
The Board also received and considered information about the portion of the total management fee that was retained by Funds Management after payment of the fee to theSub-Adviser forsub-advisory services. In assessing the reasonableness of this amount, the Board received and evaluated information about the nature and extent of responsibilities retained and risks assumed by Funds Management and not delegated to or assumed by theSub-Adviser, and about Funds Management’son-going oversight services. Given the affiliation between Funds Management and theSub-Adviser, the Board ascribed limited relevance to the allocation of fees between them.
The Board also received and considered information about the nature and extent of services offered and fee rates charged by Funds Management and theSub-Adviser to other types of clients with investment strategies similar to those of the Fund. In this regard, the Board received information about the significantly greater scope of services, and compliance, reporting and other legal burdens and risks of managing proprietary mutual funds compared with those associated with managing assets of other types of clients, including third-partysub-advised fund clients andnon-mutual fund clients such as institutional separate accounts.
Wells Fargo Asia Pacific Fund | 33
Table of Contents
Other information (unaudited)
Based on its consideration of the factors and information it deemed relevant, including those described here, the Board determined that the compensation payable to Funds Management under the Management Agreement and to theSub-Adviser under theSub-Advisory Agreement was reasonable.
Profitability
The Board received and considered information concerning the profitability of Funds Management, as well as the profitability of both WFAM and Wells Fargo & Co. (“Wells Fargo”) from providing services to the fund family as a whole. The Board noted that theSub-Adviser’s profitability information with respect to providing services to the Fund and other funds in the family was subsumed in the WFAM and Wells Fargo profitability analysis.
Funds Management reported on the methodologies and estimates used in calculating profitability, including a description of the methodology used to allocate certain expenses. Among other things, the Board noted that the levels of profitability reported on afund-by-fund basis varied widely, depending on factors such as the size, type and age of fund. Based on its review, the Board did not deem the profits reported by Funds Management, WFAM or Wells Fargo from services provided to the Fund to be at a level that would prevent it from approving the continuation of the Advisory Agreements.
Economies of scale
The Board received and considered information about the potential for Funds Management to experience economies of scale in the provision of management services to the Fund, the difficulties of calculating economies of scale at an individual fund level, and the extent to which potential scale benefits are shared with shareholders. The Board noted the existence of breakpoints in the Fund’s management fee structure, which operate generally to reduce the Fund’s expense ratios as the Fund grows in size. The Board considered that in addition to management fee breakpoints, Funds Management shares potential economies of scale from its management business in a variety of ways, including through fee waiver and expense reimbursement arrangements, services that benefit shareholders, competitive management fee rates set at the outset without regard to breakpoints, and investments in the business intended to enhance services available to shareholders.
The Board concluded that Funds Management’s arrangements with respect to the Fund, including contractual breakpoints, constituted a reasonable approach to sharing potential economies of scale with the Fund and its shareholders.
Other benefits to Funds Management and theSub-Adviser
The Board received and considered information regarding potential“fall-out” or ancillary benefits received by Funds Management and its affiliates, including theSub-Adviser, as a result of their relationships with the Fund. Ancillary benefits could include, among others, benefits directly attributable to other relationships with the Fund and benefits potentially derived from an increase in Funds Management’s and theSub-Adviser’s business as a result of their relationships with the Fund. The Board noted that various affiliates of Funds Management may receive distribution-related fees, shareholder servicing payments andsub-transfer agency fees in respect of shares sold or held through them and services provided.
The Board also reviewed information about soft dollar credits earned and utilized by theSub-Adviser, fees earned by Funds Management and theSub-Adviser from managing a private investment vehicle for the fund family’s securities lending collateral, and commissions earned by an affiliated broker from portfolio transactions.
Based on its consideration of the factors and information it deemed relevant, including those described here, the Board did not find that any ancillary benefits received by Funds Management and its affiliates, including theSub-Adviser, were unreasonable.
Conclusion
At the Meeting, after considering the above-described factors and based on its deliberations and its evaluation of the information described above, the Board unanimously approved the continuation of the Advisory Agreements for aone-year term and determined that the compensation payable to Funds Management and theSub-Adviser under each of the Advisory Agreements was reasonable.
34 | Wells Fargo Asia Pacific Fund
Table of Contents
This page is intentionally left blank.
Table of Contents
This page is intentionally left blank.
Table of Contents
For more information
More information about Wells Fargo Funds is available free upon request. To obtain literature, please write, visit the Fund’s website, or call:
Wells Fargo Funds
P.O. Box 219967
Kansas City, MO 64121-9967
Website:wfam.com
Individual investors:1-800-222-8222
Retail investment professionals:1-888-877-9275
Institutional investment professionals:1-866-765-0778

This report and the financial statements contained herein are submitted for the general information of the shareholders of the Fund. If this report is used for promotional purposes, distribution of the report must be accompanied or preceded by a current prospectus. Before investing, please consider the investment objectives, risks, charges, and expenses of the investment. For a current prospectus and, if available, a summary prospectus, containing this information, call1-800-222-8222 or visit the Fund’s website atwfam.com. Read the prospectus carefully before you invest or send money.
Wells Fargo Asset Management (WFAM) is the trade name for certain investment advisory/management firms owned by Wells Fargo & Company. These firms include but are not limited to Wells Capital Management Incorporated and Wells Fargo Funds Management, LLC. Certain products managed by WFAM entities are distributed by Wells Fargo Funds Distributor, LLC (a broker-dealer and Member FINRA).
This material is for general informational and educational purposes only and is NOT intended to provide investment advice or a recommendation of any kind—including a recommendation for any specific investment, strategy, or plan.
INVESTMENT PRODUCTS: NOT FDIC INSURED ◾ NO BANK GUARANTEE ◾ MAY LOSE VALUE
© 2019 Wells Fargo & Company. All rights reserved.
408243 12-19
A236/AR236 10-19
Table of Contents

Annual Report
October 31, 2019
Wells Fargo Emerging Markets Equity Fund
Beginning on January 1, 2021, as permitted by new regulations adopted by the Securities and Exchange Commission, paper copies of the Wells Fargo Funds’ annual and semi-annual shareholder reports issued after this date will no longer be sent by mail, unless you specifically request paper copies of the reports. Instead, the reports will be made available on the Funds’ website, and you will be notified by mail each time a report is posted and provided with a website address to access the report.
If you already elected to receive shareholder reports electronically, you will not be affected by this change and you need not take any action. You may elect to receive shareholder reports and other communications from the Fund electronically at any time by contacting your financial intermediary (such as a broker-dealer or bank) or, if you are a direct investor, by calling1-800-222-8222 or by enrolling at wellsfargo.com/advantagedelivery.
You may elect to receive all future reports in paper free of charge. If you invest through a financial intermediary, you can contact your financial intermediary to request that you continue to receive paper copies of your shareholder reports; if you invest directly with the Fund, you can call 1-800-222-8222. Your election to receive reports in paper will apply to all Wells Fargo Funds held in your account with your financial intermediary or, if you are a direct investor, to all Wells Fargo Funds that you hold.
Table of Contents
|
Reduce clutter. Save trees. |
Sign up for |
The views expressed and any forward-looking statements are as of October 31, 2019, unless otherwise noted, and are those of the Fund managers and/or Wells Fargo Asset Management. Discussions of individual securities, or the markets generally, or any Wells Fargo Fund are not intended as individual recommendations. Future events or results may vary significantly from those expressed in any forward-looking statements. The views expressed are subject to change at any time in response to changing circumstances in the market. Wells Fargo Asset Management and the Fund disclaim any obligation to publicly update or revise any views expressed or forward-looking statements.
INVESTMENT PRODUCTS: NOT FDIC INSURED ◾ NO BANK GUARANTEE ◾ MAY LOSE VALUE
Wells Fargo Emerging Markets Equity Fund | 1
Table of Contents
Letter to shareholders (unaudited)

Andrew Owen
President
Wells Fargo Funds
Dear Shareholder:
We are pleased to offer you this annual report for the Wells Fargo Emerging Markets Equity Fund for the12-month period that ended October 31, 2019. After the first few months of the period featured high volatility and yielded minimal returns, U.S. investors generally saw markets recover during the second half amid intensifying market volatility, global economic growth concerns, international trade stare downs, and simmering geopolitical tensions.
Overall, both fixed-income and equity investors enjoyed healthy returns despite market volatility. For the period, U.S. stocks, based on the S&P 500 Index,1 gained 14.33% and international stocks, as measured by the MSCI ACWI ex USA Index (Net),2 returned 11.27%. The MSCI EM Index (Net)3 gained 11.86%. Among fixed income investors, the Bloomberg Barclays U.S. Aggregate Bond Index4 added 11.51%, the Bloomberg Barclays Global Aggregateex-USD Index5 added 7.84%, the Bloomberg Barclays Municipal Bond Index6 gained 9.42%, and the ICE BofAML U.S. High Yield Index7 added 8.32%.
Investors confronted unsettling events during the fourth quarter of 2018.
During the fourth quarter of 2018, investors grew concerned about the pace and sustainability of the global economic expansion. The U.S. Bureau of Economic Analysis reported third-quarter U.S. gross domestic product (GDP) was 3.4% on an annualized basis, which was down from the second-quarter rate. A partial U.S. government shutdown occurred, which extended into January 2019. Brexit efforts stalled, causing uncertainty for the eurozone. The value of the renminbi declined even as the People’s Bank of China cut reserve requirement ratios, accelerated infrastructure spending, and cut taxes in efforts to spur economic activity.
The combination of news in the U.S. and generally weak economic indicators outside of the U.S. caused investors to seek safe havens. December’s S&P 500 Index performance was the worst since 1931. Globally, fixed-income investments fared better than stocks during the last two months of the year. Even as indicators suggested growth was restrained, the U.S. Federal Reserve (Fed) increased the federal funds rate by 25 basis points (bps; 100 bps equal 1.00%) in December 2018 to a target range of between 2.25% and 2.50%. Many observers expressed concerns that higher rates could slow the economy further.
| 1 | The S&P 500 Index consists of 500 stocks chosen for market size, liquidity, and industry group representation. It is a market-value-weighted index with each stock’s weight in the index proportionate to its market value. You cannot invest directly in an index. |
| 2 | The Morgan Stanley Capital International (MSCI) All Country World Index (ACWI) ex USA Index (Net) is a free-float-adjusted market-capitalization-weighted index that is designed to measure the equity market performance of developed and emerging markets, excluding the United States. Source: MSCI. MSCI makes no express or implied warranties or representations and shall have no liability whatsoever with respect to any MSCI data contained herein. The MSCI data may not be further redistributed or used as a basis for other indices or any securities or financial products. This report is not approved, reviewed, or produced by MSCI. You cannot invest directly in an index. |
| 3 | The MSCI Emerging Markets (EM) Index (Net) is a free-float-adjusted market-capitalization-weighted index that is designed to measure the equity market performance of emerging markets. You cannot invest directly in an index. |
| 4 | The Bloomberg Barclays U.S. Aggregate Bond Index is a broad-based benchmark that measures the investment-grade, U.S. dollar-denominated, fixed-rate taxable bond market, including Treasuries, government-related and corporate securities, mortgage-backed securities (agency fixed-rate and hybrid adjustable-rate mortgage pass-throughs), asset-backed securities, and commercial mortgage-backed securities. You cannot invest directly in an index. |
| 5 | The Bloomberg Barclays Global Aggregateex-USD Index is an unmanaged index that provides a broad-based measure of the global investment-grade fixed-income markets excluding the U.S. dollar-denominated debt market. You cannot invest directly in an index. |
| 6 | The Bloomberg Barclays Municipal Bond Index is an unmanaged index composed of long-termtax-exempt bonds with a minimum credit rating of Baa. You cannot invest directly in an index. |
| 7 | The ICE BofAML U.S. High Yield Index is a market-capitalization-weighted index of domestic and Yankee high-yield bonds. The index tracks the performance of high-yield securities traded in the U.S. bond market. You cannot invest directly in an index. Copyright 2019. ICE Data Indices, LLC. All rights reserved. |
2 | Wells Fargo Emerging Markets Equity Fund
Table of Contents
Letter to shareholders (unaudited)
The market climbs a wall of worry.
Investment returns early in 2019 appeared to reaffirm the adage that markets climb a wall of worry as the new year began. The S&P 500 Index gained 8.01% in January, the best monthly performance in 30 years. Returns for the MSCI ACWI ex USA Index (Net), the Bloomberg Barclays U.S. Aggregate Bond Index, and the Bloomberg Barclays Global Aggregateex-USD Index also were positive.
In February 2019, signs of slowing global growth grew more ominous. The U.S. Bureau of Economic Analysis announced fourth-quarter 2018 GDP grew at an annualized 2.2% rate, down from the levels of the prior two quarters. In a February report, the Bank of England forecast the slowest growth since the financial crisis for 2019. China and the U.S. continued to wrangle over trade issues. By the end of the first quarter of 2019, more accommodative Fed sentiment and steady, if not spectacular, U.S. economic and business metrics encouraged domestic investors.
Early second-quarter 2019 enthusiasm among investors faded.
During April 2019, sustained low inflation, solid employment data, and first-quarter U.S. GDP grew at an annualized rate of 3.2% supported favorable sentiment. During May, markets tumbled on mixed investment signals. In the U.S., partisan wrangling ramped up as Democrats and Republicans set their sights on 2020 presidential politics. The U.K.’s Brexit disagreements caused Prime Minister Theresa May to resign. Boris Johnson succeeded her only to exacerbate uncertainty about Brexit’s resolution ahead of an October 2019 deadline. The European Commission downgraded the 2019 growth forecast to 1.2%. The U.S. increased tariffs on products from China, China responded, and then talks broke down. President Donald Trump threatened to turn his foreign policy tariff tool to Mexico over immigration issues.
Halfway through 2019, investors regrouped. Just as the investment horizon appeared to darken, sentiment turned and U.S. equity markets gained during June and July. The gains, primarily driven by geopolitical and monetary policy events, pushed equity markets to new highs. European Central Bank President Mario Draghi said that if the outlook doesn’t improve, the bank would cut rates or buy more assets to prop up inflation. President Trump backed off of tariff threats against Mexico and China. In the U.S., the Fed implemented a 0.25% federal funds rate cut in July.
Later in July 2019, the U.S. reversed course and threatened to impose higher tariffs on China’s exports after talks failed. China responded with tariff threats of its own and devalued the renminbi, a move that roiled global markets. Major U.S. stock market indices closed July with the worst weekly results of the year. Bond prices gained as Treasury yields fell to levels not seen since November 2016 and the yield curve inverted at multiple points along the30-year arc.
In microcosm, August 2019 encapsulated many of the unnerving events that had plagued investors for months. The U.S.-China trade relationship swung from antagonistic to hopeful and back again with no signs of compromise. Evidence of a continued global economic slowdown continued to mount as central banks in China, New Zealand, and Thailand cut interest rates. Industrial and manufacturing data declined in China, Canada, Japan, and Germany. Adding to the uncertain environment, Italy’s prime minister resigned, many feared a crackdown in Hong Kong as protestors sustained their calls for reform, and Boris Johnson planned to suspend Parliament as Brexit’s deadline neared.
In the U.S., September 2019 saw the Fed join other central banks in cutting interest rates. U.S. manufacturing data, as reported by the Institute for Supply Management, disappointed investors. The U.S. House of Representatives announced it would pursue an impeachment investigation of President Trump. Meanwhile, the Brexit impasse showed no signs of resolution. Officials in China said that hitting the country’s economic
“In February 2019, signs of slowing global growth grew more ominous.”
Wells Fargo Emerging Markets Equity Fund | 3
Table of Contents
Letter to shareholders (unaudited)
“The Fed lowered interest rates another quarter point in late October, its third rate cut in four months.”
|
For further information about your Fund, contact your investment professional, visit our website at wfam.com, or call us directly at1-800-222-8222. |
growth goals for the year would be difficult considering the weight of tariffs and trade restrictions. So while the S&P 500 Index finished the third quarter with the bestyear-to-date returns in more than 20 years, amid signs of equity investors taking money out of the stock market, concerns about future returns remained.
In October 2019, a relaxing of U.S.-China trade tensions and renewed optimism for a U.K. Brexit deal combined with positive macroeconomic data to support financial markets overall. The initial estimate of U.S. third-quarter GDP growth, announced in late October, was a resilient 1.9% annualized rate while the U.S. unemployment rate fell to a50-year low of 3.5% in September. However, despite resilience among U.S. consumers, business confidence declined while manufacturing activity contracted. Concerned with a potential economic slowdown, the Fed lowered interest rates another quarter point in late October, its third rate cut in four months. This helped push the S&P 500 Index to a newall-time high while emerging market equities rallied and global bonds declined overall, reflecting a broad pickup in risk appetite.
Don’t let short-term uncertainty derail long-term investment goals.
Periods of investment uncertainty can present challenges, but experience has taught us that maintaining long-term investment goals can be an effective way to plan for the future. To help you create a sound strategy based on your personal goals and risk tolerance, Wells Fargo Funds offers more than 100 mutual funds spanning a wide range of asset classes and investment styles. Although diversification cannot guarantee an investment profit or prevent losses, we believe it can be an effective way to manage investment risk and potentially smooth out overall portfolio performance. We encourage investors to know their investments and to understand that appropriate levels of risk-taking may unlock opportunities.
Thank you for choosing to invest with Wells Fargo Funds. We appreciate your confidence in us and remain committed to helping you meet your financial needs.
Sincerely,

Andrew Owen
President
Wells Fargo Funds
4 | Wells Fargo Emerging Markets Equity Fund
Table of Contents
This page is intentionally left blank.
Table of Contents
Performance highlights (unaudited)
Investment objective
The Fund seeks long-term capital appreciation.
Manager
Wells Fargo Funds Management, LLC
Subadviser
Wells Capital Management Incorporated
Portfolio managers
Derrick Irwin, CFA®‡
Richard Peck, CFA®‡
Yi (Jerry) Zhang, Ph.D., CFA®‡
Average annual total returns (%) as of October 31, 20191
| Including sales charge | Excluding sales charge | Expense ratios2 (%) | ||||||||||||||||||||||||||||||||
| Inception date | 1 year | 5 year | 10 year | 1 year | 5 year | 10 year | Gross | Net3 | ||||||||||||||||||||||||||
| Class A (EMGAX) | 9-6-1994 | 13.06 | 2.65 | 3.93 | 19.95 | 3.87 | 4.55 | 1.60 | 1.59 | |||||||||||||||||||||||||
| Class C (EMGCX) | 9-6-1994 | 18.09 | 3.09 | 3.76 | 19.09 | 3.09 | 3.76 | 2.35 | 2.34 | |||||||||||||||||||||||||
| Class R6 (EMGDX)4 | 6-28-2013 | – | – | – | 20.50 | 4.33 | 5.01 | 1.17 | 1.16 | |||||||||||||||||||||||||
| Administrator Class (EMGYX) | 9-6-1994 | – | – | – | 20.09 | 3.99 | 4.71 | 1.52 | 1.47 | |||||||||||||||||||||||||
| Institutional Class (EMGNX)5 | 7-30-2010 | – | – | – | 20.40 | 4.27 | 4.97 | 1.27 | 1.20 | |||||||||||||||||||||||||
| MSCI EM Index (Net)6 | – | – | – | – | 11.86 | 2.93 | 3.78 | – | – | |||||||||||||||||||||||||
Figures quoted represent past performance, which is no guarantee of future results, and do not reflect taxes that a shareholder may pay on fund distributions or the redemption of fund shares. Investment return and principal value of an investment will fluctuate so that an investor’s shares, when redeemed, may be worth more or less than their original cost. Performance shown without sales charges would be lower if sales charges were reflected. Current performance may be lower or higher than the performance data quoted, which assumes the reinvestment of dividends and capital gains. Currentmonth-end performance is available on the Fund’s website,wfam.com.
Index returns do not include transaction costs associated with buying and selling securities, any mutual fund fees or expenses, or any taxes. It is not possible to invest directly in an index.
For Class A shares, the maximumfront-end sales charge is 5.75%. For Class C shares, the maximum contingent deferred sales charge is 1.00%. Performance including a contingent deferred sales charge assumes the sales charge for the corresponding time period. Class R6, Administrator Class, and Institutional Class shares are sold without afront-end sales charge or contingent deferred sales charge.
Stock values fluctuate in response to the activities of individual companies and general market and economic conditions. Foreign investments are especially volatile and can rise or fall dramatically due to differences in the political and economic conditions of the host country. These risks are generally intensified in emerging markets. The use of derivatives may reduce returns and/or increase volatility. Certain investment strategies tend to increase the total risk of an investment (relative to the broader market). The Fund is exposed to smaller-company securities risk. Consult the Fund’s prospectus for additional information on these and other risks.
Please see footnotes on page 7.
6 | Wells Fargo Emerging Markets Equity Fund
Table of Contents
Performance highlights (unaudited)
| Growth of $10,000 investment as of October 31, 20197 |
|
| ‡ | CFA® and Chartered Financial Analyst® are trademarks owned by CFA Institute. |
| 1 | Historical performance shown prior to July 19, 2010, is based on the performance of the Fund’s predecessor, Evergreen Emerging Markets Growth Fund. |
| 2 | Reflects the expense ratios as stated in the most recent prospectuses, which include the impact of 0.01% in acquired fund fees and expenses. The expense ratios shown are subject to change and may differ from the annualized expense ratios shown in the financial highlights of this report, which do not include acquired fund fees and expenses. |
| 3 | The manager has contractually committed through February 29, 2020, to waive fees and/or reimburse expenses to the extent necessary to cap the expenses of each class after fee waivers at 1.58% for Class A, 2.33% for Class C, 1.15% for Class R6, 1.46% for Administrator Class, and 1.19% for Institutional Class. Brokerage commissions, stamp duty fees, interest, taxes, acquired fund fees and expenses (if any), and extraordinary expenses are excluded from the expense cap. Prior to or after the commitment expiration date, the cap may be increased or the commitment to maintain the cap may be terminated only with the approval of the Board of Trustees. Without this cap, the Fund’s returns would have been lower. The expense ratio paid by an investor is the net expense ratio (the total annual fund operating expenses after fee waivers) as stated in the prospectuses. |
| 4 | Historical performance shown for Class R6 shares prior to their inception reflects the performance of Institutional Class shares and includes the higher expenses applicable to Institutional Class shares. If these expenses had not been included, returns for Class R6 shares would have been higher. |
| 5 | Historical performance shown for Institutional Class shares prior to their inception reflects the performance of Administrator Class shares and includes the higher expenses applicable to Administrator Class shares. If these expenses had not been included, returns for Institutional Class shares would be higher. |
| 6 | The Morgan Stanley Capital International (MSCI) Emerging Markets (EM) Index (Net) is a free-float-adjusted market-capitalization-weighted index that is designed to measure the equity market performance of emerging markets. You cannot invest directly in an index. |
| 7 | The chart compares the performance of Class A shares for the most recent ten years with the MSCI EM Index (Net). The chart assumes a hypothetical investment of $10,000 in Class A shares and reflects all operating expenses and assumes the maximum initial sales charge of 5.75%. |
| 8 | The ten largest holdings, excluding cash, cash equivalents and any money market funds, are calculated based on the value of the investments divided by total net assets of the Fund. Holdings are subject to change and may have changed since the date specified. |
| 9 | Amounts are calculated based on the total long-term investments of the Fund. These amounts are subject to change and may have changed since the date specified. |
Wells Fargo Emerging Markets Equity Fund | 7
Table of Contents
Performance highlights (unaudited)
MANAGER’S DISCUSSION
Fund highlights
| ∎ | The Fund outperformed its benchmark, the MSCI EM Index (Net), for the12-month period that ended October 31, 2019. |
| ∎ | Stock selection was the largest driver of outperformance. Primary contributors among sectors included consumer discretionary, financials, and materials and among countries included China, Brazil, and India. |
| ∎ | The communication services sector and Russia, Chile, and South Africa were the primary detractors from performance. |
Emerging market equities rose over the period.
Emerging market equities rose during the initialsix-month period, through April 30, 2019, as many of the headwinds that bedeviled markets through most of 2018 receded and investor optimism returned. Stocks rebounded from 2018 lows after U.S. interest rates and the U.S. dollar strength eased and China stimulus appeared to take hold.
Investors were particularly encouraged by China’s aggressive economic stimulus, Brazil’s pension reform, and early progress in U.S.-China trade negotiations. Improved global liquidity and muted inflation supported lower emerging market interest rates and expectations for easier monetary and fiscal policy.
Trade talks collapsed in May 2019, and U.S.-China trade tension was alternatively a headwind and a tailwind through October. The U.S. raised additional tariffs, China’s renminbi fell through the psychologically important 7.0 level versus the U.S. dollar, and later reports of progress toward aphase-one deal boosted sentiment in September. Weak economic data in many countries in 2019, including the U.S., was also a source of market volatility and convinced the U.S. Federal Reserve and central banks across emerging markets to further guide interest rates lower in September and October.
| Ten largest holdings(%) as of October 31, 20198 | ||||
Samsung Electronics Company Limited | 4.84 | |||
Tencent Holdings Limited | 3.19 | |||
Taiwan Semiconductor Manufacturing Company Limited ADR | 3.12 | |||
China Mobile Limited | 2.70 | |||
Alibaba Group Holding Limited ADR | 2.42 | |||
Reliance Industries Limited GDR | 2.36 | |||
Li Ning Company Limited | 2.27 | |||
AIA Group Limited | 2.22 | |||
WH Group Limited | 2.19 | |||
Uni-President Enterprises Corporation | 1.94 | |||
The low conviction among many emerging market investors led to defensive positioning, and stocks that reported strong results that exceeded consensus expectations often rallied sharply. Several were companies whose valuations had fallen during the 2018 downturn to levels far below our assessment of intrinsic value and whose shares we subsequently purchased, which contributed to performance in the period.
| Sector distribution as of October 31, 20199 |
 |
| Country allocation as of October 31, 20199 |
 |
Please see footnotes on page 7.
8 | Wells Fargo Emerging Markets Equity Fund
Table of Contents
Performance highlights (unaudited)
We emphasize high-quality companies in the Fund.
We continued to make changes in the Fund as it seeks to own companies of the highest quality and to take advantage of valuation opportunities. Key new positions included China’s Koolearn Technology Holding Limited and India’s Spandana Sphoorty Financial Limited and Axis Bank Limited. Among the larger positions eliminated from the Fund were China’s Baidu, Incorporated; India’s ICICI Bank Limited; and Brazil’s Petrobras Distribuidora SA.
Positive stock selection in China, Brazil, and India was the primary driver of relative outperformance. China benefited from strong performances from Li Ning Company Limited and New Oriental Education & Technology Group Incorporated. In Brazil, B3 SA Brasil Bolsa Balcao and B2W Companhia Digital were among leading performers. In India, performance was led by Reliance Industries Limited and Bajaj Finance Limited. Country detractors included Russia and Chile due to a combination of stock performance and relative weightings. Sberbank of Russia PJSC in Russia and S.A.C.I. Falabella in Chile were among weaker stock holdings in each country.
Among sectors, consumer discretionary, financials, and materials were the leading performers due to strong stock selection. Consumer discretionary was led by the aforementioned Li Ning Company Limited and New Oriental Education & Technology. In financials, B3 SA Brasil Bolsa Balcao and AIA Group Limited were among the leading performers. In the materials sector, AngloGold Ashanti Limited and an underweight position relative to the index boosted performance. The sole sector detractor was communication services, in which stocks such as China’s SINA Corporation and China Mobile Limited and Korea’s KT Corporation lagged.
Outlook
The relative growth premium between emerging and developed economies is an indicator that provides insight to relative earnings growth and equity performance, and emerging markets have historically performed well during periods of premium expansion. Indeed, the strong rally in the first quarter of 2019 was in part driven by expectations of improving growth in emerging markets against a downshift in developed market expansion. Although the gap has since narrowed, we remain optimistic it will widen in 2020 as stimulus measures kick in and emerging market gross domestic product rebounds. Given strong company operating leverage and a depressed earnings base, we believe this tailwind should support a healthy rebound in company earnings. With valuations still attractive despite recent multiple expansion, there is room for emerging markets to perform if this scenario plays out.
Looking forward, the risks to emerging markets include weak emerging market growth and earnings, U.S. dollar strength, unpredictable trade negotiations, and geopolitical issues. We are cautiously optimistic that supportive policies are in place, including dovish monetary policy, progress on U.S.-China trade talks, and China economic stimulus.
In emerging market equities, economic growth and earnings growth have historically been important drivers of returns. We expect some turbulence in the first part of fiscal 2020, but we believe our strategy should be well positioned to weather volatility should it materialize.
Wells Fargo Emerging Markets Equity Fund | 9
Table of Contents
As a shareholder of the Fund, you incur two types of costs: (1) transaction costs, including sales charges (loads) on purchase payments and contingent deferred sales charges (if any) on redemptions and (2) ongoing costs, including management fees, distribution(12b-1) and/or shareholder servicing fees, and other Fund expenses. This example is intended to help you understand your ongoing costs (in dollars) of investing in the Fund and to compare these costs with the ongoing costs of investing in other mutual funds.
The example is based on an investment of $1,000 invested at the beginning of thesix-month period and held for the entire period from May 1, 2019 to October 31, 2019.
Actual expenses
The “Actual” line of the table below provides information about actual account values and actual expenses. You may use the information in this line, together with the amount you invested, to estimate the expenses that you paid over the period. Simply divide your account value by $1,000 (for example, an $8,600 account value divided by $1,000 = 8.6), then multiply the result by the number in the “Actual” line under the heading entitled “Expenses paid during period” for your applicable class of shares to estimate the expenses you paid on your account during this period.
Hypothetical example for comparison purposes
The “Hypothetical” line of the table below provides information about hypothetical account values and hypothetical expenses based on the Fund’s actual expense ratio and an assumed rate of return of 5% per year before expenses, which is not the Fund’s actual return. The hypothetical account values and expenses may not be used to estimate the actual ending account balance or expenses you paid for the period. You may use this information to compare the ongoing costs of investing in the Fund and other funds. To do so, compare this 5% hypothetical example with the 5% hypothetical examples that appear in the shareholder reports of the other funds.
Please note that the expenses shown in the table are meant to highlight your ongoing costs only and do not reflect any transactional costs, such as sales charges (loads) and contingent deferred sales charges. Therefore, the “Hypothetical” line of the table is useful in comparing ongoing costs only and will not help you determine the relative total costs of owning different funds. In addition, if these transactional costs were included, your costs would have been higher.
| Beginning account value 5-1-2019 | Ending account value 10-31-2019 | Expenses paid during the period¹ | Annualized net expense ratio | |||||||||||||
Class A | ||||||||||||||||
Actual | $ | 1,000.00 | $ | 1,023.06 | $ | 8.01 | 1.57 | % | ||||||||
Hypothetical (5% return before expenses) | $ | 1,000.00 | $ | 1,017.29 | $ | 7.98 | 1.57 | % | ||||||||
Class C | ||||||||||||||||
Actual | $ | 1,000.00 | $ | 1,018.84 | $ | 11.81 | 2.32 | % | ||||||||
Hypothetical (5% return before expenses) | $ | 1,000.00 | $ | 1,013.51 | $ | 11.77 | 2.32 | % | ||||||||
Class R6 | ||||||||||||||||
Actual | $ | 1,000.00 | $ | 1,025.25 | $ | 5.82 | 1.14 | % | ||||||||
Hypothetical (5% return before expenses) | $ | 1,000.00 | $ | 1,019.46 | $ | 5.80 | 1.14 | % | ||||||||
Administrator Class | ||||||||||||||||
Actual | $ | 1,000.00 | $ | 1,023.56 | $ | 7.45 | 1.46 | % | ||||||||
Hypothetical (5% return before expenses) | $ | 1,000.00 | $ | 1,017.85 | $ | 7.43 | 1.46 | % | ||||||||
Institutional Class | ||||||||||||||||
Actual | $ | 1,000.00 | $ | 1,024.47 | $ | 6.07 | 1.19 | % | ||||||||
Hypothetical (5% return before expenses) | $ | 1,000.00 | $ | 1,019.21 | $ | 6.06 | 1.19 | % | ||||||||
| 1 | Expenses paid is equal to the annualized net expense ratio of each class multiplied by the average account value over the period, multiplied by the number of days in the most recent fiscal half-year divided by the number of days in the fiscal year (to reflect theone-half-year period). |
10 | Wells Fargo Emerging Markets Equity Fund
Table of Contents
Portfolio of investments—October 31, 2019
| Shares | Value | |||||||||||||||
| Common Stocks: 95.24% | ||||||||||||||||
| Argentina: 0.31% | ||||||||||||||||
MercadoLibre Incorporated (Consumer Discretionary, Internet & Direct Marketing Retail) † | 25,016 | $ | 13,046,344 | |||||||||||||
|
| |||||||||||||||
| Brazil: 8.81% | ||||||||||||||||
Ambev SA ADR (Consumer Staples, Beverages) | 4,397,000 | 18,951,065 | ||||||||||||||
Atacadao Distribuicao Comercio e Industria Limitada (Consumer Staples, Food & Staples Retailing) | 5,570,000 | 26,541,005 | ||||||||||||||
B2W Companhia Digital (Consumer Discretionary, Internet & Direct Marketing Retail) † | 4,566,197 | 57,838,875 | ||||||||||||||
B3 Brasil Bolsa Balcao SA (Financials, Capital Markets) | 4,838,005 | 58,362,469 | ||||||||||||||
Banco Bradesco SA ADR (Financials, Banks) | 4,165,494 | 36,489,727 | ||||||||||||||
BK Brasil Operacao e Assessoria a Restaurantes SA (Consumer Discretionary, Hotels, Restaurants & Leisure) | 2,425,794 | 11,310,896 | ||||||||||||||
BRF Brazil Foods SA ADR (Consumer Staples, Food Products) † | 5,368,092 | 47,024,486 | ||||||||||||||
Hapvida Participacoes e Investimentos SA (Health Care, Health Care Providers & Services) 144A | 1,999,507 | 28,069,379 | ||||||||||||||
IRB-Brasil Resseguros SA (Financials, Insurance) | 1,889,007 | 17,799,670 | ||||||||||||||
Lojas Renner SA (Consumer Discretionary, Multiline Retail) | 2,925,175 | 37,015,991 | ||||||||||||||
Multiplan Empreendimentos Imobiliarios SA (Real Estate, Real Estate Management & Development) | 1,786,906 | 13,014,717 | ||||||||||||||
Raia Drogasil SA (Consumer Staples, Food & Staples Retailing) | 613,600 | 16,829,822 | ||||||||||||||
| 369,248,102 | ||||||||||||||||
|
| |||||||||||||||
| Chile: 1.31% | ||||||||||||||||
Banco Santander Chile SA ADR (Financials, Banks) | 1,068,392 | 25,887,138 | ||||||||||||||
S.A.C.I. Falabella (Consumer Discretionary, Multiline Retail) | 5,672,228 | 28,849,749 | ||||||||||||||
| 54,736,887 | ||||||||||||||||
|
| |||||||||||||||
| China: 30.84% | ||||||||||||||||
51job Incorporated ADR (Industrials, Professional Services) † | 526,441 | 41,467,758 | ||||||||||||||
Alibaba Group Holding Limited ADR (Consumer Discretionary, Internet & Direct Marketing Retail) † | 573,037 | 101,238,447 | ||||||||||||||
Best Incorporated ADR (Industrials, Air Freight & Logistics) †« | 4,269,527 | 24,336,304 | ||||||||||||||
Bilibili Incorporated ADR (Communication Services, Entertainment) †« | 2,497,845 | 39,440,973 | ||||||||||||||
China Distance Education ADR (Consumer Discretionary, Diversified Consumer Services) † | 973,710 | 6,815,970 | ||||||||||||||
China Life Insurance Company H Shares (Financials, Insurance) | 30,418,290 | 79,190,541 | ||||||||||||||
China Literature Limited (Communication Services, Media) †144A« | 2,735,168 | 10,768,309 | ||||||||||||||
China MeiDong Auto Holdings Limited (Consumer Discretionary, Specialty Retail) | 17,644,000 | 17,608,086 | ||||||||||||||
China Mobile Limited (Communication Services, Wireless Telecommunication Services) | 13,880,165 | 113,011,763 | ||||||||||||||
China Rapid Finance Limited ADR (Financials, Consumer Finance) †« | 826,299 | 234,256 | ||||||||||||||
Greentree Hospitality Group Limited (Consumer Discretionary, Hotels, Restaurants & Leisure) | 1,224,841 | 12,505,627 | ||||||||||||||
Hengan International Group Company Limited (Consumer Staples, Personal Products) | 1,507,000 | 10,539,067 | ||||||||||||||
Hua Medicine Limited (Health Care, Pharmaceuticals) †144A | 8,798,236 | 7,769,804 | ||||||||||||||
Huami Corporation ADR (Information Technology, Electronic Equipment, Instruments & Components) † | 2,114,991 | 19,119,519 | ||||||||||||||
IQIYI Incorporated ADR (Communication Services, Entertainment) †« | 1,065,239 | 18,567,116 | ||||||||||||||
Jianpu Technology Incorporated ADR (Financials, Consumer Finance) † | 3,093,390 | 6,496,119 | ||||||||||||||
Koolearn Technology Holding Limited (Consumer Discretionary, Diversified Consumer Services) †144A« | 7,287,115 | 17,129,851 | ||||||||||||||
Li Ning Company Limited (Consumer Discretionary, Textiles, Apparel & Luxury Goods) | 28,004,207 | 95,242,072 | ||||||||||||||
Meituan Dianping (Consumer Discretionary, Internet & Direct Marketing Retail) † | 4,427,900 | 52,919,280 | ||||||||||||||
New Oriental Education & Technology Group Incorporated ADR (Consumer Discretionary, Diversified Consumer Services) † | 649,089 | 79,227,803 | ||||||||||||||
Pinduoduo Incorporated ADR (Consumer Discretionary, Internet & Direct Marketing Retail) † | 223,141 | 9,122,004 | ||||||||||||||
PPDAI Group Incorporated ADR (Financials, Consumer Finance) | 4,082,185 | 11,430,118 | ||||||||||||||
Shandong Weigao Group Medical Polymer Company Limited H Shares (Health Care, Health Care Equipment & Supplies) | 18,024,000 | 20,724,512 | ||||||||||||||
Shanghai Junshi Bioscience H Shares (Health Care, Biotechnology) †144A« | 1,544,569 | 5,519,169 | ||||||||||||||
SINA Corporation (Communication Services, Interactive Media & Services) † | 895,807 | 35,473,957 | ||||||||||||||
Tencent Holdings Limited (Communication Services, Interactive Media & Services) | 3,267,800 | 133,782,150 | ||||||||||||||
Trip.com Group Limited ADR (Consumer Discretionary, Internet & Direct Marketing Retail) † | 1,509,213 | 49,788,937 | ||||||||||||||
Tsingtao Brewery Company Limited H Shares (Consumer Staples, Beverages) | 7,600,000 | 44,178,434 | ||||||||||||||
Vipshop Holdings Limited ADR (Consumer Discretionary, Internet & Direct Marketing Retail) † | 6,912,738 | 79,772,997 | ||||||||||||||
The accompanying notes are an integral part of these financial statements.
Wells Fargo Emerging Markets Equity Fund | 11
Table of Contents
Portfolio of investments—October 31, 2019
| Shares | Value | |||||||||||||||
| China (continued) | ||||||||||||||||
Want Want China Holdings Limited (Consumer Staples, Food Products) | 51,104,000 | $ | 43,173,895 | |||||||||||||
Weibo Corporation ADR (Communication Services, Interactive Media & Services) †« | 1,135,140 | 55,837,537 | ||||||||||||||
Wise Talent Information Technology Company Limited (Communication Services, Interactive Media & Services) † | 1,648,460 | 4,135,902 | ||||||||||||||
Xiaomi Corporation Class B (Information Technology, Technology Hardware, Storage & Peripherals) †144A« | 28,389,400 | 32,244,420 | ||||||||||||||
Zhou Hei Ya International Holding Company Limited (Consumer Staples, Food Products) 144A« | 25,803,626 | 13,007,271 | ||||||||||||||
| 1,291,819,968 | ||||||||||||||||
|
| |||||||||||||||
| Colombia: 0.55% | ||||||||||||||||
Bancolombia SA ADR (Financials, Banks) | 442,400 | 22,951,712 | ||||||||||||||
|
| |||||||||||||||
| Cyprus: 0.15% | ||||||||||||||||
Headhunter Group plc ADR (Industrials, Professional Services) « | 352,760 | 6,159,190 | ||||||||||||||
|
| |||||||||||||||
| Hong Kong: 6.35% | ||||||||||||||||
AIA Group Limited (Financials, Insurance) | 9,306,400 | 93,171,483 | ||||||||||||||
CNOOC Limited (Energy, Oil, Gas & Consumable Fuels) | 28,974,000 | 43,483,463 | ||||||||||||||
Johnson Electric Holdings Limited (Industrials, Electrical Equipment) | 4,214,250 | 7,712,191 | ||||||||||||||
Sun Art Retail Group Limited (Consumer Staples, Food & Staples Retailing) | 29,340,500 | 29,992,203 | ||||||||||||||
WH Group Limited (Consumer Staples, Food Products) 144A | 86,455,500 | 91,796,114 | ||||||||||||||
| 266,155,454 | ||||||||||||||||
|
| |||||||||||||||
| India: 9.22% | ||||||||||||||||
AU Small Finance Bank Limited (Financials, Banks) 144A | 451,041 | 4,360,097 | ||||||||||||||
Axis Bank Limited (Financials, Banks) | 2,670,819 | 27,727,227 | ||||||||||||||
Bajaj Finance Limited (Financials, Consumer Finance) | 420,281 | 23,864,833 | ||||||||||||||
Bandhan Bank Limited (Financials, Banks) 144A | 1,416,131 | 12,224,902 | ||||||||||||||
Bharti Airtel Limited (Communication Services, Wireless Telecommunication Services) | 3,361,352 | 17,735,911 | ||||||||||||||
Bharti Infratel Limited (Communication Services, Diversified Telecommunication Services) | 2,973,851 | 7,953,609 | ||||||||||||||
Fortis Healthcare Limited (Health Care, Health Care Providers & Services) † | 5,634,970 | 11,662,599 | ||||||||||||||
HDFC Bank Limited ADR (Financials, Banks) | 253,652 | 15,495,601 | ||||||||||||||
Housing Development Finance Corporation Limited (Financials, Thrifts & Mortgage Finance) | 1,115,700 | 33,534,509 | ||||||||||||||
Indusind Bank Limited (Financials, Banks) | 817,217 | 15,130,245 | ||||||||||||||
ITC Limited (Consumer Staples, Tobacco) | 9,818,960 | 35,667,554 | ||||||||||||||
Kotak Mahindra Bank Limited (Financials, Banks) | 1,057,262 | 23,469,454 | ||||||||||||||
Max Financial Services Limited (Financials, Insurance) † | 925,389 | 5,298,934 | ||||||||||||||
Oberoi Realty Limited (Real Estate, Real Estate Management & Development) | 1,064,750 | 7,609,351 | ||||||||||||||
Odisha Cement Limited (Materials, Construction Materials) | 624,658 | 7,131,777 | ||||||||||||||
Reliance Industries Limited GDR (Energy, Oil, Gas & Consumable Fuels) 144A | 2,413,174 | 99,060,793 | ||||||||||||||
SBI Life Insurance Company Limited (Financials, Insurance) 144A | 914,273 | 12,780,455 | ||||||||||||||
SH Kelkar & Company Limited (Materials, Chemicals) † | 1,244,001 | 2,174,804 | ||||||||||||||
Spandana Sphoorty Financial (Financials, Consumer Finance) † | 440,254 | 6,679,652 | ||||||||||||||
Ultra Tech Cement Limited (Materials, Construction Materials) | 286,000 | 16,706,275 | ||||||||||||||
| 386,268,582 | ||||||||||||||||
|
| |||||||||||||||
| Indonesia: 1.92% | ||||||||||||||||
PT Astra International Tbk (Consumer Discretionary, Automobiles) | 19,151,000 | 9,482,044 | ||||||||||||||
PT Bank Central Asia Tbk (Financials, Banks) | 11,349,500 | 25,428,637 | ||||||||||||||
PT Blue Bird Tbk (Industrials, Road & Rail) | 13,605,309 | 2,219,574 | ||||||||||||||
PT Link Net Tbk (Communication Services, Diversified Telecommunication Services) | 38,278,161 | 11,998,569 | ||||||||||||||
PT Matahari Department Store Tbk (Consumer Discretionary, Multiline Retail) | 10,474,600 | 2,716,217 | ||||||||||||||
PT Telekomunikasi Indonesia Persero Tbk ADR (Communication Services, Diversified Telecommunication Services) |
| 997,754 | 28,815,136 | |||||||||||||
| 80,660,177 | ||||||||||||||||
|
| |||||||||||||||
The accompanying notes are an integral part of these financial statements.
12 | Wells Fargo Emerging Markets Equity Fund
Table of Contents
Portfolio of investments—October 31, 2019
| Shares | Value | |||||||||||||||
| Malaysia: 0.56% | ||||||||||||||||
Genting Bhd (Consumer Discretionary, Hotels, Restaurants & Leisure) | 8,780,900 | $ | 12,209,412 | |||||||||||||
Genting Malaysia Bhd (Consumer Discretionary, Hotels, Restaurants & Leisure) | 14,496,300 | 11,136,322 | ||||||||||||||
| 23,345,734 | ||||||||||||||||
|
| |||||||||||||||
| Mexico: 6.03% | ||||||||||||||||
America Movil SAB de CV ADR (Communication Services, Wireless Telecommunication Services) | 1,537,320 | 24,305,029 | ||||||||||||||
Banco Santander Mexico ADR (Financials, Banks) | 2,830,236 | 18,849,372 | ||||||||||||||
Banco Santander Mexico SA (Financials, Banks) | 3,000,000 | 4,036,077 | ||||||||||||||
Becle SAB de CV ADR (Consumer Staples, Beverages) | 13,063,925 | 22,499,303 | ||||||||||||||
Cemex SAB de CV ADR (Materials, Construction Materials) | 4,041,848 | 15,237,767 | ||||||||||||||
Fibra Uno Administracion SAB de CV (Real Estate, Equity REITs) | 39,247,864 | 59,657,814 | ||||||||||||||
Fomento Economico Mexicano SAB de CV ADR (Consumer Staples, Beverages) | 826,620 | 73,585,712 | ||||||||||||||
Grupo Financiero Banorte SAB de CV (Financials, Banks) | 3,073,188 | 16,803,364 | ||||||||||||||
Wal-Mart de Mexico SAB de CV (Consumer Staples, Food & Staples Retailing) | 5,967,100 | 17,882,843 | ||||||||||||||
| 252,857,281 | ||||||||||||||||
|
| |||||||||||||||
| Peru: 0.39% | ||||||||||||||||
Compania de Minas Buenaventura SA ADR (Materials, Metals & Mining) | 1,054,495 | 16,175,953 | ||||||||||||||
|
| |||||||||||||||
| Philippines: 0.84% | ||||||||||||||||
Ayala Corporation (Industrials, Industrial Conglomerates) | 727,624 | 12,331,395 | ||||||||||||||
San Miguel Food & Beverage Incorporated (Consumer Staples, Food Products) | 3,495,810 | 6,337,856 | ||||||||||||||
SM Investments Corporation (Industrials, Industrial Conglomerates) | 812,873 | 16,499,344 | ||||||||||||||
| 35,168,595 | ||||||||||||||||
|
| |||||||||||||||
| Russia: 2.67% | ||||||||||||||||
LUKOIL PJSC ADR (Energy, Oil, Gas & Consumable Fuels) | 425,249 | 39,105,898 | ||||||||||||||
Magnit PJSC (Consumer Staples, Food & Staples Retailing) | 150,816 | 7,573,434 | ||||||||||||||
Sberbank PJSC ADR (Financials, Banks) | 1,461,195 | 21,479,567 | ||||||||||||||
Yandex NV Class A (Communication Services, Interactive Media & Services) † | 1,305,106 | 43,577,489 | ||||||||||||||
| 111,736,388 | ||||||||||||||||
|
| |||||||||||||||
| Singapore: 0.23% | ||||||||||||||||
Sea Limited ADR (Communication Services, Entertainment) †« | 320,967 | 9,551,978 | ||||||||||||||
|
| |||||||||||||||
| South Africa: 2.66% | ||||||||||||||||
AngloGold Ashanti Limited ADR (Materials, Metals & Mining) | 958,071 | 21,154,208 | ||||||||||||||
MTN Group Limited (Communication Services, Wireless Telecommunication Services) | 3,252,643 | 20,145,916 | ||||||||||||||
Oceana Group Limited (Consumer Staples, Food Products) | 363,549 | 1,611,737 | ||||||||||||||
Shoprite Holdings Limited (Consumer Staples, Food & Staples Retailing) | 2,923,100 | 26,194,829 | ||||||||||||||
Standard Bank Group Limited (Financials, Banks) | 1,770,190 | 20,321,952 | ||||||||||||||
Tiger Brands Limited (Consumer Staples, Food Products) | 1,543,333 | 21,919,506 | ||||||||||||||
| 111,348,148 | ||||||||||||||||
|
| |||||||||||||||
| South Korea: 10.04% | ||||||||||||||||
KT Corporation ADR (Communication Services, Diversified Telecommunication Services) | 4,064,813 | 45,647,850 | ||||||||||||||
KT&G Corporation (Consumer Staples, Tobacco) | 239,091 | 20,550,174 | ||||||||||||||
Naver Corporation (Communication Services, Interactive Media & Services) | 519,000 | 73,158,279 | ||||||||||||||
Samsung Electronics Company Limited (Information Technology, Technology Hardware, Storage & Peripherals) | 4,681,800 | 202,812,944 | ||||||||||||||
Samsung Life Insurance Company Limited (Financials, Insurance) | 636,337 | 38,613,943 | ||||||||||||||
SK Hynix Incorporated (Information Technology, Semiconductors & Semiconductor Equipment) | 567,500 | 39,997,421 | ||||||||||||||
| 420,780,611 | ||||||||||||||||
|
| |||||||||||||||
| Taiwan: 9.22% | ||||||||||||||||
104 Corporation (Industrials, Professional Services) | 1,655,000 | 9,242,621 | ||||||||||||||
Mediatek Incorporated (Information Technology, Semiconductors & Semiconductor Equipment) | 4,479,881 | 60,044,725 | ||||||||||||||
The accompanying notes are an integral part of these financial statements.
Wells Fargo Emerging Markets Equity Fund | 13
Table of Contents
Portfolio of investments—October 31, 2019
| Shares | Value | |||||||||||||||
| Taiwan (continued) | ||||||||||||||||
President Chain Store Corporation (Consumer Staples, Food & Staples Retailing) |
| 2,450,000 | $ | 24,467,404 | ||||||||||||
Taiwan Semiconductor Manufacturing Company Limited (Information Technology, Semiconductors & Semiconductor Equipment) | 8,205,224 | 80,460,550 | ||||||||||||||
Taiwan Semiconductor Manufacturing Company Limited ADR (Information Technology, Semiconductors & Semiconductor Equipment) | 2,531,852 | 130,719,519 | ||||||||||||||
Uni-President Enterprises Corporation (Consumer Staples, Food Products) | 32,862,368 | 81,182,966 | ||||||||||||||
| 386,117,785 | ||||||||||||||||
|
| |||||||||||||||
| Thailand: 2.39% | ||||||||||||||||
PTT Exploration & Production plc (Energy, Oil, Gas & Consumable Fuels) | 2,533,139 | 10,109,066 | ||||||||||||||
PTT plc (Energy, Oil, Gas & Consumable Fuels) | 14,459,000 | 21,668,149 | ||||||||||||||
Siam Commercial Bank plc (Financials, Banks) | 8,105,100 | 30,197,839 | ||||||||||||||
Thai Beverage plc (Consumer Staples, Beverages) | 56,927,000 | 38,287,482 | ||||||||||||||
| 100,262,536 | ||||||||||||||||
|
| |||||||||||||||
| Turkey: 0.09% | ||||||||||||||||
Avivasa Emeklilik Ve Hayat AS (Financials, Insurance) | 1,901,979 | �� | 3,875,649 | |||||||||||||
|
| |||||||||||||||
| United Arab Emirates: 0.05% | ||||||||||||||||
Emaar Malls Group (Real Estate, Real Estate Management & Development) | 3,773,147 | 2,003,305 | ||||||||||||||
|
| |||||||||||||||
| United Kingdom: 0.61% | ||||||||||||||||
Standard Chartered plc (Financials, Banks) | 2,805,244 | 25,472,752 | ||||||||||||||
|
| |||||||||||||||
Total Common Stocks (Cost $3,066,294,385) | 3,989,743,131 | |||||||||||||||
|
| |||||||||||||||
| Interest rate | Maturity date | Principal | ||||||||||||||
| Convertible Debentures: 0.00% | ||||||||||||||||
| Brazil: 0.00% | ||||||||||||||||
Lupatech SA (Energy, Energy Equipment & Services) †(a) | 6.50 | % | 4-15-2020 | $ | 303,000 | 0 | ||||||||||
|
| |||||||||||||||
Total Convertible Debentures (Cost $160,691) | 0 | |||||||||||||||
|
| |||||||||||||||
| Dividend yield | Shares | |||||||||||||||
| Preferred Stocks: 1.38% | ||||||||||||||||
| Brazil: 1.38% | ||||||||||||||||
Lojas Americanas SA (Consumer Discretionary, Multiline Retail) | 0.34 | 11,620,093 | 57,919,376 | |||||||||||||
|
| |||||||||||||||
Total Preferred Stocks (Cost $46,440,021) | 57,919,376 | |||||||||||||||
|
| |||||||||||||||
| Yield | ||||||||||||||||
| Short-Term Investments: 7.36% | ||||||||||||||||
| Investment Companies: 7.36% | ||||||||||||||||
Securities Lending Cash Investments LLC (l)(r)(u) | 1.99 | 150,280,602 | 150,295,631 | |||||||||||||
Wells Fargo Government Money Market Fund Select Class (l)(u) | 1.75 | 158,178,165 | 158,178,165 | |||||||||||||
Total Short-Term Investments (Cost $308,473,817) | 308,473,796 | |||||||||||||||
|
| |||||||||||||||
| Total investments in securities (Cost $3,421,368,914) | 103.98 | % | 4,356,136,303 | |||||
Other assets and liabilities, net | (3.98 | ) | (166,830,374 | ) | ||||
|
|
|
| |||||
| Total net assets | 100.00 | % | $ | 4,189,305,929 | ||||
|
|
|
| |||||
The accompanying notes are an integral part of these financial statements.
14 | Wells Fargo Emerging Markets Equity Fund
Table of Contents
Portfolio of investments—October 31, 2019
| † | Non-income-earning security |
| 144A | The security may be resold in transactions exempt from registration, normally to qualified institutional buyers, pursuant to Rule 144A under the Securities Act of 1933. |
| « | All or a portion of this security is on loan. |
| (a) | The security is fair valued in accordance with procedures approved by the Board of Trustees. |
| (l) | The issuer of the security is an affiliated person of the Fund as defined in the Investment Company Act of 1940. |
| (r) | The investment is anon-registered investment company purchased with cash collateral received from securities on loan. |
| (u) | The rate represents the7-day annualized yield at period end. |
Abbreviations:
| ADR | American depositary receipt |
| GDR | Global depositary receipt |
| REIT | Real estate investment trust |
Investments in Affiliates
An affiliated investment is an investment in which the Fund owns at least 5% of the outstanding voting shares of the issuer or as a result of other relationships, such as the Fund and the issuer having the same investment manager. Transactions with issuers that were either affiliated persons of the Fund at the beginning of the period or the end of the period were as follows:
| Shares, beginning of period | Shares purchased | Shares sold | Shares, end of period | Net realized gains (losses) | Net change in unrealized gains (losses) | Income from affiliated securities | Value, end of period | % of net assets | ||||||||||||||||||||||||||||
| Short-Term Investments | ||||||||||||||||||||||||||||||||||||
Investment Companies | ||||||||||||||||||||||||||||||||||||
Securities Lending Cash Investments LLC | 175,500,204 | 983,133,393 | 1,008,352,995 | 150,280,602 | $ | (4,014 | ) | $ | (21 | ) | $ | 4,029,376 | # | $ | 150,295,631 | |||||||||||||||||||||
Wells Fargo Government Money Market Fund Select Class | 163,110,726 | 560,606,045 | 565,538,606 | 158,178,165 | 0 | 0 | 3,807,835 | 158,178,165 | ||||||||||||||||||||||||||||
|
|
|
|
|
|
|
|
|
| |||||||||||||||||||||||||||
| $ | (4,014 | ) | $ | (21 | ) | $ | 7,837,211 | $ | 308,473,796 | 7.36 | % | |||||||||||||||||||||||||
|
|
|
|
|
|
|
|
|
| |||||||||||||||||||||||||||
| # | Amount shown represents income before fees and rebates. |
The accompanying notes are an integral part of these financial statements.
Wells Fargo Emerging Markets Equity Fund | 15
Table of Contents
Statement of assets and liabilities—October 31, 2019
Assets | ||||
Investments in unaffiliated securities (including $145,288,338 of securities loaned), at value (cost $3,112,895,097) | $ | 4,047,662,507 | ||
Investments in affiliated securities, at value (cost $308,473,817) | 308,473,796 | |||
Cash | 83,310 | |||
Foreign currency, at value (cost $3,706,296) | 2,695,368 | |||
Receivable for investments sold | 1,834,769 | |||
Receivable for Fund shares sold | 5,483,128 | |||
Receivable for dividends | 2,037,327 | |||
Receivable for securities lending income, net | 94,727 | |||
Prepaid expenses and other assets | 29,169 | |||
|
| |||
Total assets | 4,368,394,101 | |||
|
| |||
Liabilities | ||||
Payable upon receipt of securities loaned | 150,290,592 | |||
Payable for investments purchased | 4,950,029 | |||
Payable for Fund shares redeemed | 13,581,599 | |||
Management fee payable | 3,384,673 | |||
Contingent tax liability | 2,979,923 | |||
Administration fees payable | 437,012 | |||
Distribution fee payable | 19,220 | |||
Trustees’ fees and expenses payable | 3,941 | |||
Accrued expenses and other liabilities | 3,441,183 | |||
|
| |||
Total liabilities | 179,088,172 | |||
|
| |||
Total net assets | $ | 4,189,305,929 | ||
|
| |||
Net assets consist of | ||||
Paid-in capital | $ | 3,415,926,089 | ||
Total distributable earnings | 773,379,840 | |||
|
| |||
Total net assets | $ | 4,189,305,929 | ||
|
| |||
Computation of net asset value and offering price per share | ||||
Net assets – Class A | $ | 227,810,512 | ||
Shares outstanding – Class A1 | 9,009,347 | |||
Net asset value per share – Class A | $ 25.29 | |||
Maximum offering price per share – Class A2 | $ 26.83 | |||
Net assets – Class C | $ | 29,483,959 | ||
Shares outstanding – Class C1 | 1,398,133 | |||
Net asset value per share – Class C | $ 21.09 | |||
Net assets – Class R6 | $ | 351,828,673 | ||
Shares outstanding – Class R61 | 13,333,699 | |||
Net asset value per share – Class R6 | $ 26.39 | |||
Net assets – Administrator Class | $ | 104,868,754 | ||
Shares outstanding – Administrator Class1 | 3,957,725 | |||
Net asset value per share – Administrator Class | $ 26.50 | |||
Net assets – Institutional Class | $ | 3,475,314,031 | ||
Shares outstanding – Institutional Class1 | 131,736,699 | |||
Net asset value per share – Institutional Class | $ 26.38 | |||
| 1 | The Fund has an unlimited number of authorized shares. |
| 2 | Maximum offering price is computed as 100/94.25 of net asset value. On investments of $50,000 or more, the offering price is reduced. |
The accompanying notes are an integral part of these financial statements.
16 | Wells Fargo Emerging Markets Equity Fund
Table of Contents
Statement of operations—year ended October 31, 2019
Investment income | ||||
Dividends (net of foreign withholding taxes of $9,112,392) | $ | 69,428,422 | ||
Income from affiliated securities | 7,516,186 | |||
Interest (net of foreign withholding taxes of $47) | 195,561 | |||
|
| |||
Total investment income | 77,140,169 | |||
|
| |||
Expenses | ||||
Management fee | 39,315,460 | |||
Administration fees | ||||
Class A | 454,814 | |||
Class C | 86,430 | |||
Class R6 | 113,956 | |||
Administrator Class | 139,491 | |||
Institutional Class | 4,045,665 | |||
Shareholder servicing fees | ||||
Class A | 541,445 | |||
Class C | 102,892 | |||
Administrator Class | 267,905 | |||
Distribution fee | ||||
Class C | 308,424 | |||
Custody and accounting fees | 2,659,676 | |||
Professional fees | 63,152 | |||
Registration fees | 139,633 | |||
Shareholder report expenses | 700,364 | |||
Trustees’ fees and expenses | 21,652 | |||
Other fees and expenses | 117,012 | |||
|
| |||
Total expenses | 49,077,971 | |||
Less: Fee waivers and/or expense reimbursements | ||||
Fund-level | (62,904 | ) | ||
Class C | (94 | ) | ||
Class R6 | (119 | ) | ||
Administrator Class | (35,275 | ) | ||
Institutional Class | (1,675,321 | ) | ||
|
| |||
Net expenses | 47,304,258 | |||
|
| |||
Net investment income | 29,835,911 | |||
|
| |||
Realized and unrealized gains (losses) on investments | ||||
Net realized gains (losses) on | ||||
Unaffiliated securities | 58,897,948 | |||
Affiliated securities | (4,014 | ) | ||
Forward foreign currency contracts | (89,710 | ) | ||
|
| |||
Net realized gains on investments | 58,804,224 | |||
|
| |||
Net change in unrealized gains (losses) on | ||||
Unaffiliated securities | 621,647,004 | |||
Affiliated securities | (21 | ) | ||
|
| |||
Net change in unrealized gains (losses) on investments | 621,646,983 | |||
|
| |||
Net realized and unrealized gains (losses) on investments | 680,451,207 | |||
|
| |||
Net increase in net assets resulting from operations | $ | 710,287,118 | ||
|
| |||
The accompanying notes are an integral part of these financial statements.
Wells Fargo Emerging Markets Equity Fund | 17
Table of Contents
Statement of changes in net assets
| Year ended October 31, 2019 | Year ended October 31, 2018 | |||||||||||||||
Operations | ||||||||||||||||
Net investment income | $ | 29,835,911 | $ | 28,424,101 | ||||||||||||
Net realized gains on investments | 58,804,224 | 133,904,115 | ||||||||||||||
Net change in unrealized gains (losses) on investments | 621,646,983 | (726,816,743 | ) | |||||||||||||
|
| |||||||||||||||
Net increase (decrease) in net assets resulting from operations | 710,287,118 | (564,488,527 | ) | |||||||||||||
|
| |||||||||||||||
Distributions to shareholders from net investment income and net realized gains | ||||||||||||||||
Class A | (710,399 | ) | (404,835 | ) | ||||||||||||
Class R6 | (2,908,247 | ) | (1,790,475 | ) | ||||||||||||
Administrator Class | (528,015 | ) | (661,746 | ) | ||||||||||||
Institutional Class | (24,412,544 | ) | (25,196,461 | ) | ||||||||||||
|
| |||||||||||||||
Total distributions to shareholders | (28,559,205 | ) | (28,053,517 | ) | ||||||||||||
|
| |||||||||||||||
Capital share transactions | Shares | Shares | ||||||||||||||
Proceeds from shares sold | ||||||||||||||||
Class A | 1,832,949 | 42,913,694 | 1,350,584 | 33,600,538 | ||||||||||||
Class C | 155,464 | 2,968,853 | 291,733 | 6,178,273 | ||||||||||||
Class R6 | 4,297,288 | 100,909,236 | 10,252,838 | 266,424,444 | ||||||||||||
Administrator Class | 582,444 | 14,129,059 | 1,081,213 | 28,234,197 | ||||||||||||
Institutional Class | 34,734,070 | 844,578,848 | 34,959,495 | 889,495,518 | ||||||||||||
|
| |||||||||||||||
| 1,005,499,690 | 1,223,932,970 | |||||||||||||||
|
| |||||||||||||||
Reinvestment of distributions | ||||||||||||||||
Class A | 30,235 | 636,746 | 14,491 | 366,464 | ||||||||||||
Class R6 | 88,834 | 1,945,455 | 67,570 | 1,778,432 | ||||||||||||
Administrator Class | 23,214 | 511,866 | 24,247 | 642,315 | ||||||||||||
Institutional Class | 1,100,826 | 24,108,081 | 911,147 | 23,990,497 | ||||||||||||
|
| |||||||||||||||
| 27,202,148 | 26,777,708 | |||||||||||||||
|
| |||||||||||||||
Payment for shares redeemed | ||||||||||||||||
Class A | (2,378,845 | ) | (55,211,980 | ) | (2,647,031 | ) | (64,505,596 | ) | ||||||||
Class C | (1,529,459 | ) | (30,114,110 | ) | (858,659 | ) | (17,586,266 | ) | ||||||||
Class R6 | (5,807,534 | ) | (144,080,345 | ) | (2,986,490 | ) | (77,195,964 | ) | ||||||||
Administrator Class | (1,325,414 | ) | (32,354,466 | ) | (1,964,822 | ) | (50,914,883 | ) | ||||||||
Institutional Class | (30,356,079 | ) | (733,923,145 | ) | (41,331,810 | ) | (1,076,350,034 | ) | ||||||||
|
| |||||||||||||||
| (995,684,046 | ) | (1,286,552,743 | ) | |||||||||||||
|
| |||||||||||||||
Net increase (decrease) in net assets resulting from capital share transactions | 37,017,792 | (35,842,065 | ) | |||||||||||||
|
| |||||||||||||||
Total increase (decrease) in net assets | 718,745,705 | (628,384,109 | ) | |||||||||||||
|
| |||||||||||||||
Net assets | ||||||||||||||||
Beginning of period | 3,470,560,224 | 4,098,944,333 | ||||||||||||||
|
| |||||||||||||||
End of period | $ | 4,189,305,929 | $ | 3,470,560,224 | ||||||||||||
|
| |||||||||||||||
The accompanying notes are an integral part of these financial statements.
18 | Wells Fargo Emerging Markets Equity Fund
Table of Contents
(For a share outstanding throughout each period)
| Year ended October 31 | ||||||||||||||||||||
| CLASS A | 2019 | 2018 | 2017 | 2016 | 2015 | |||||||||||||||
Net asset value, beginning of period | $21.16 | $24.83 | $20.49 | $18.09 | $21.44 | |||||||||||||||
Net investment income (loss) | 0.10 | 0.07 | (0.03 | )1 | 0.12 | 0.08 | ||||||||||||||
Net realized and unrealized gains (losses) on investments | 4.11 | (3.70 | ) | 4.50 | 2.38 | (3.29 | ) | |||||||||||||
|
|
|
|
|
|
|
|
|
| |||||||||||
Total from investment operations | 4.21 | (3.63 | ) | 4.47 | 2.50 | (3.21 | ) | |||||||||||||
Distributions to shareholders from | ||||||||||||||||||||
Net investment income | (0.08 | ) | (0.04 | ) | (0.13 | ) | (0.10 | ) | (0.14 | ) | ||||||||||
Net asset value, end of period | $25.29 | $21.16 | $24.83 | $20.49 | $18.09 | |||||||||||||||
Total return2 | 19.95 | % | (14.65 | )% | 21.99 | % | 13.93 | % | (15.02 | )% | ||||||||||
Ratios to average net assets (annualized) | ||||||||||||||||||||
Gross expenses | 1.57 | % | 1.58 | % | 1.58 | % | 1.64 | % | 1.64 | % | ||||||||||
Net expenses | 1.57 | % | 1.57 | % | 1.58 | % | 1.60 | % | 1.64 | % | ||||||||||
Net investment income (loss) | 0.43 | % | 0.38 | % | (0.13 | )% | 0.64 | % | 0.37 | % | ||||||||||
Supplemental data | ||||||||||||||||||||
Portfolio turnover rate | 8 | % | 11 | % | 13 | % | 8 | % | 8 | % | ||||||||||
Net assets, end of period (000s omitted) | $227,811 | $201,515 | $268,384 | $874,625 | $873,992 | |||||||||||||||
| 1 | Calculated based upon average shares outstanding |
| 2 | Total return calculations do not include any sales charges. |
The accompanying notes are an integral part of these financial statements.
Wells Fargo Emerging Markets Equity Fund | 19
Table of Contents
Financial highlights
(For a share outstanding throughout each period)
| Year ended October 31 | ||||||||||||||||||||
| CLASS C | 2019 | 2018 | 2017 | 2016 | 2015 | |||||||||||||||
Net asset value, beginning of period | $17.71 | $20.92 | $17.28 | $15.28 | $18.11 | |||||||||||||||
Net investment loss | (0.07 | )1 | (0.08 | )1 | (0.08 | ) | (0.02 | )1 | (0.06 | )1 | ||||||||||
Net realized and unrealized gains (losses) on investments | 3.45 | (3.13 | ) | 3.72 | 2.02 | (2.77 | ) | |||||||||||||
|
|
|
|
|
|
|
|
|
| |||||||||||
Total from investment operations | 3.38 | (3.21 | ) | 3.64 | 2.00 | (2.83 | ) | |||||||||||||
Net asset value, end of period | $21.09 | $17.71 | $20.92 | $17.28 | $15.28 | |||||||||||||||
Total return2 | 19.09 | % | (15.34 | )% | 21.06 | % | 13.09 | % | (15.63 | )% | ||||||||||
Ratios to average net assets (annualized) | ||||||||||||||||||||
Gross expenses | 2.32 | % | 2.33 | % | 2.31 | % | 2.39 | % | 2.39 | % | ||||||||||
Net expenses | 2.32 | % | 2.32 | % | 2.31 | % | 2.35 | % | 2.39 | % | ||||||||||
Net investment loss | (0.37 | )% | (0.38 | )% | (0.43 | )% | (0.12 | )% | (0.39 | )% | ||||||||||
Supplemental data | ||||||||||||||||||||
Portfolio turnover rate | 8 | % | 11 | % | 13 | % | 8 | % | 8 | % | ||||||||||
Net assets, end of period (000s omitted) | $29,484 | $49,103 | $69,845 | $71,900 | $84,004 | |||||||||||||||
| 1 | Calculated based upon average shares outstanding |
| 2 | Total return calculations do not include any sales charges. |
The accompanying notes are an integral part of these financial statements.
20 | Wells Fargo Emerging Markets Equity Fund
Table of Contents
Financial highlights
(For a share outstanding throughout each period)
| Year ended October 31 | ||||||||||||||||||||
| CLASS R6 | 2019 | 2018 | 2017 | 2016 | 2015 | |||||||||||||||
Net asset value, beginning of period | $22.10 | $26.00 | $21.46 | $19.00 | $22.53 | |||||||||||||||
Net investment income | 0.22 | 1 | 0.23 | 1 | 0.17 | 1 | 0.23 | 1 | 0.19 | |||||||||||
Net realized and unrealized gains (losses) on investments | 4.27 | (3.92 | ) | 4.59 | 2.46 | (3.46 | ) | |||||||||||||
|
|
|
|
|
|
|
|
|
| |||||||||||
Total from investment operations | 4.49 | (3.69 | ) | 4.76 | 2.69 | (3.27 | ) | |||||||||||||
Distributions to shareholders from | ||||||||||||||||||||
Net investment income | (0.20 | ) | (0.21 | ) | (0.22 | ) | (0.23 | ) | (0.26 | ) | ||||||||||
Net asset value, end of period | $26.39 | $22.10 | $26.00 | $21.46 | $19.00 | |||||||||||||||
Total return | 20.50 | % | (14.33 | )% | 22.53 | % | 14.43 | % | (14.61 | )% | ||||||||||
Ratios to average net assets (annualized) | ||||||||||||||||||||
Gross expenses | 1.14 | % | 1.16 | % | 1.14 | % | 1.20 | % | 1.19 | % | ||||||||||
Net expenses | 1.14 | % | 1.15 | % | 1.14 | % | 1.17 | % | 1.18 | % | ||||||||||
Net investment income | 0.88 | % | 0.90 | % | 0.76 | % | 1.16 | % | 0.84 | % | ||||||||||
Supplemental data | ||||||||||||||||||||
Portfolio turnover rate | 8 | % | 11 | % | 13 | % | 8 | % | 8 | % | ||||||||||
Net assets, end of period (000s omitted) | $351,829 | $326,131 | $192,929 | $191,250 | $95,190 | |||||||||||||||
| 1 | Calculated based upon average shares outstanding |
The accompanying notes are an integral part of these financial statements.
Wells Fargo Emerging Markets Equity Fund | 21
Table of Contents
Financial highlights
(For a share outstanding throughout each period)
| Year ended October 31 | ||||||||||||||||||||
| ADMINISTRATOR CLASS | 2019 | 2018 | 2017 | 2016 | 2015 | |||||||||||||||
Net asset value, beginning of period | $22.18 | $26.08 | $21.53 | $18.99 | $22.44 | |||||||||||||||
Net investment income | 0.13 | 1 | 0.12 | 1 | 0.10 | 1 | 0.15 | 1 | 0.12 | 1 | ||||||||||
Net realized and unrealized gains (losses) on investments | 4.30 | (3.90 | ) | 4.61 | 2.50 | (3.46 | ) | |||||||||||||
|
|
|
|
|
|
|
|
|
| |||||||||||
Total from investment operations | 4.43 | (3.78 | ) | 4.71 | 2.65 | (3.34 | ) | |||||||||||||
Distributions to shareholders from | ||||||||||||||||||||
Net investment income | (0.11 | ) | (0.12 | ) | (0.16 | ) | (0.11 | ) | (0.11 | ) | ||||||||||
Net asset value, end of period | $26.50 | $22.18 | $26.08 | $21.53 | $18.99 | |||||||||||||||
Total return | 20.09 | % | (14.57 | )% | 22.10 | % | 14.07 | % | (14.91 | )% | ||||||||||
Ratios to average net assets (annualized) | ||||||||||||||||||||
Gross expenses | 1.49 | % | 1.50 | % | 1.48 | % | 1.56 | % | 1.49 | % | ||||||||||
Net expenses | 1.46 | % | 1.46 | % | 1.46 | % | 1.49 | % | 1.48 | % | ||||||||||
Net investment income | 0.54 | % | 0.48 | % | 0.42 | % | 0.76 | % | 0.58 | % | ||||||||||
Supplemental data | ||||||||||||||||||||
Portfolio turnover rate | 8 | % | 11 | % | 13 | % | 8 | % | 8 | % | ||||||||||
Net assets, end of period (000s omitted) | $104,869 | $103,740 | $144,421 | $160,657 | $181,224 | |||||||||||||||
| 1 | Calculated based upon average shares outstanding |
The accompanying notes are an integral part of these financial statements.
22 | Wells Fargo Emerging Markets Equity Fund
Table of Contents
Financial highlights
(For a share outstanding throughout each period)
| Year ended October 31 | ||||||||||||||||||||
| INSTITUTIONAL CLASS | 2019 | 2018 | 2017 | 2016 | 2015 | |||||||||||||||
Net asset value, beginning of period | $22.10 | $25.99 | $21.46 | $18.99 | $22.52 | |||||||||||||||
Net investment income | 0.19 | 0.19 | 0.19 | 1 | 0.20 | 1 | 0.17 | |||||||||||||
Net realized and unrealized gains (losses) on investments | 4.28 | (3.89 | ) | 4.55 | 2.49 | (3.45 | ) | |||||||||||||
|
|
|
|
|
|
|
|
|
| |||||||||||
Total from investment operations | 4.47 | (3.70 | ) | 4.74 | 2.69 | (3.28 | ) | |||||||||||||
Distributions to shareholders from | ||||||||||||||||||||
Net investment income | (0.19 | ) | (0.19 | ) | (0.21 | ) | (0.22 | ) | (0.25 | ) | ||||||||||
Net asset value, end of period | $26.38 | $22.10 | $25.99 | $21.46 | $18.99 | |||||||||||||||
Total return | 20.40 | % | (14.35 | )% | 22.42 | % | 14.40 | % | (14.66 | )% | ||||||||||
Ratios to average net assets (annualized) | ||||||||||||||||||||
Gross expenses | 1.25 | % | 1.25 | % | 1.23 | % | 1.31 | % | 1.24 | % | ||||||||||
Net expenses | 1.19 | % | 1.19 | % | 1.20 | % | 1.22 | % | 1.22 | % | ||||||||||
Net investment income | 0.81 | % | 0.75 | % | 0.82 | % | 1.04 | % | 0.82 | % | ||||||||||
Supplemental data | ||||||||||||||||||||
Portfolio turnover rate | 8 | % | 11 | % | 13 | % | 8 | % | 8 | % | ||||||||||
Net assets, end of period (000s omitted) | $3,475,314 | $2,790,071 | $3,423,366 | $1,826,097 | $2,146,675 | |||||||||||||||
| 1 | Calculated based upon average shares outstanding |
The accompanying notes are an integral part of these financial statements.
Wells Fargo Emerging Markets Equity Fund | 23
Table of Contents
1. ORGANIZATION
Wells Fargo Funds Trust (the “Trust”), a Delaware statutory trust organized on March 10, 1999, is anopen-end management investment company registered under the Investment Company Act of 1940, as amended (the “1940 Act”). As an investment company, the Trust follows the accounting and reporting guidance in Financial Accounting Standards Board (“FASB”)Accounting Standards Codification Topic 946, Financial Services – Investment Companies. These financial statements report on the Wells Fargo Emerging Markets Equity Fund (the “Fund”) which is a diversified series of the Trust.
2. SIGNIFICANT ACCOUNTING POLICIES
The following significant accounting policies, which are consistently followed in the preparation of the financial statements of the Fund, are in conformity with U.S. generally accepted accounting principles which require management to make estimates and assumptions that affect the reported amounts of assets and liabilities, disclosure of contingent assets and liabilities at the date of the financial statements, and the reported amounts of revenues and expenses during the reporting period. Actual results could differ from those estimates.
Securities valuation
All investments are valued each business day as of the close of regular trading on the New York Stock Exchange (generally 4 p.m. Eastern Time), although the Fund may deviate from this calculation time under unusual or unexpected circumstances.
Equity securities that are listed on a foreign or domestic exchange or market are valued at the official closing price or, if none, the last sales price. If no sale occurs on the principal exchange or market that day, a fair value price will be determined in accordance with the Fund’s Valuation Procedures.
Forward foreign currency contracts are recorded at the forward rate provided by an independent foreign currency pricing source at a time each business day specified by the Wells Fargo Asset Management Pricing Committee at Wells Fargo Funds Management, LLC (“Funds Management”).
The values of securities denominated in foreign currencies are translated into U.S. dollars at rates provided by an independent foreign currency pricing source at a time each business day specified by the Wells Fargo Asset Management Pricing Committee.
Many securities markets and exchanges outside the U.S. close prior to the close of the New York Stock Exchange and therefore may not fully reflect trading or events that occur after the close of the principal exchange in which the foreign securities are traded, but before the close of the New York Stock Exchange. If such trading or events are expected to materially affect the value of such securities, then fair value pricing procedures approved by the Board of Trustees of the Fund are applied. These procedures take into account multiple factors including movements in U.S. securities markets after foreign exchanges close. Foreign securities that are fair valued under these procedures are categorized as Level 2 and the application of these procedures may result in transfers between Level 1 and Level 2. Depending on market activity, such fair valuations may be frequent. Such fair value pricing may result in net asset values that are higher or lower than net asset values based on the last reported sales price or latest quoted bid price. On October 31, 2019, such fair value pricing was used in pricing certain foreign securities.
Debt securities are valued at the evaluated bid price provided by an independent pricing service (e.g. taking into account various factors, including yields, maturities, or credit ratings) or, if a reliable price is not available, the quoted bid price from an independent broker-dealer.
Investments in registeredopen-end investment companies are valued at net asset value. Interests innon-registered investment companies that are redeemable at net asset value are fair valued normally at net asset value.
Investments which are not valued using any of the methods discussed above are valued at their fair value, as determined in good faith by the Board of Trustees. The Board of Trustees has established a Valuation Committee comprised of the Trustees and has delegated to it the authority to take any actions regarding the valuation of portfolio securities that the Valuation Committee deems necessary or appropriate, including determining the fair value of portfolio securities, unless the determination has been delegated to the Wells Fargo Asset Management Pricing Committee. The Board of Trustees retains the authority to make or ratify any valuation decisions or approve any changes to the Valuation Procedures as it deems appropriate. On a quarterly basis, the Board of Trustees receives reports on any valuation actions taken by the Valuation Committee or the Wells Fargo Asset Management Pricing Committee which may include items for ratification.
Foreign currency translation
The accounting records of the Fund are maintained in U.S. dollars. The values of other assets and liabilities denominated in foreign currencies are translated into U.S. dollars at rates provided by an independent foreign currency pricing source at a time each business day specified by the Wells Fargo Asset Management Pricing Committee. Purchases and sales of securities, and income and expenses are converted at the rate of exchange on the respective dates of such transactions. Net realized foreign
24 | Wells Fargo Emerging Markets Equity Fund
Table of Contents
Notes to financial statements
exchange gains or losses arise from sales of foreign currencies, currency gains or losses realized between the trade and settlement dates on securities transactions, and the difference between the amounts of dividends, interest and foreign withholding taxes recorded and the U.S. dollar equivalent of the amounts actually paid or received. Net unrealized foreign exchange gains and losses arise from changes in the fair value of assets and liabilities other than investments in securities resulting from changes in exchange rates. The changes in net assets arising from changes in exchange rates of securities and the changes in net assets resulting from changes in market prices of securities are not separately presented. Such changes are included in net realized and unrealized gains or losses from investments.
Forward foreign currency contracts
A forward foreign currency contract is an agreement between two parties to purchase or sell a specific currency for an agreed-upon price at a future date. The Fund enters into forward foreign currency contracts to facilitate transactions in foreign-denominated securities and to attempt to minimize the risk to the Fund from adverse changes in the relationship between currencies. Forward foreign currency contracts are recorded at the forward rate andmarked-to-market daily. When the contracts are closed, realized gains and losses arising from such transactions are recorded as realized gains or losses on forward foreign currency contracts. The Fund is subject to foreign currency risk and may be exposed to risks if the counterparties to the contracts are unable to meet the terms of their contracts or if the value of the foreign currency changes unfavorably. The Fund’s maximum risk of loss from counterparty credit risk is the unrealized gains on the contracts. This risk may be mitigated if there is a master netting arrangement between the Fund and the counterparty.
Securities lending
The Fund may lend its securities from time to time in order to earn additional income in the form of fees or interest on securities received as collateral or the investment of any cash received as collateral. When securities are on loan, the Fund receives interest or dividends on those securities. Cash collateral received in connection with its securities lending transactions is invested in Securities Lending Cash Investments, LLC (the “Securities Lending Fund”). Investments in Securities Lending Fund are valued at the evaluated bid price provided by an independent pricing service. Income earned from investment in the Securities Lending Fund (net of fees and rebates), if any, is included in income from affiliated securities on the Statement of Operations.
In a securities lending transaction, the net asset value of the Fund is affected by an increase or decrease in the value of the securities loaned and by an increase or decrease in the value of the instrument in which collateral is invested. The amount of securities lending activity undertaken by the Fund fluctuates from time to time. The Fund has the right under the lending agreement to recover the securities from the borrower on demand. In the event of default or bankruptcy by the borrower, the Fund may be prevented from recovering the loaned securities or gaining access to the collateral or may experience delays or costs in doing so. In such an event, the terms of the agreement allows the unaffiliated securities lending agent to use the collateral to purchase replacement securities on behalf of the Fund or pay the Fund the market value of the loaned securities. The Fund bears the risk of loss with respect to depreciation of its investment of the cash collateral.
Security transactions and income recognition
Securities transactions are recorded on a trade date basis. Realized gains or losses are recorded on the basis of identified cost.
Dividend income is recognized on theex-dividend date, except for certain dividends from foreign securities, which are recorded as soon as the custodian verifies theex-dividend date.
Interest income is accrued daily and bond discounts are accreted and premiums are amortized daily. To the extent debt obligations are placed onnon-accrual status, any related interest income may be reduced by writing off interest receivables when the collection of all or a portion of interest has been determined to be doubtful based on consistently applied procedures and the fair value has decreased. If the issuer subsequently resumes interest payments or when the collectability of interest is reasonably assured, the debt obligation is removed fromnon-accrual status.
Income from foreign securities is recorded net of foreign taxes withheld where recovery of such taxes is not assured.
Distributions to shareholders
Distributions to shareholders from net investment income and any net realized gains are recorded on theex-dividend date and paid at least annually. Such distributions are determined in accordance with income tax regulations and may differ from U.S. generally accepted accounting principles. Dividend sources are estimated at the time of declaration. The tax character of distributions is determined as of the Fund’s fiscal year end. Therefore, a portion of the Fund’s distributions made prior to the Fund’s fiscal year end may be categorized as a tax return of capital at year end.
Wells Fargo Emerging Markets Equity Fund | 25
Table of Contents
Notes to financial statements
Federal and other taxes
The Fund intends to continue to qualify as a regulated investment company by distributing substantially all of its investment company taxable income and any net realized capital gains (after reduction for capital loss carryforwards) sufficient to relieve it from all, or substantially all, federal income taxes. Accordingly, no provision for federal income taxes was required.
The Fund’s income and federal excise tax returns and all financial records supporting those returns for the prior three fiscal years are subject to examination by the federal and Delaware revenue authorities. Management has analyzed the Fund’s tax positions taken on federal, state, and foreign tax returns for all open tax years and does not believe that there are any uncertain tax positions that require recognition of a tax liability.
As of October 31, 2019, the aggregate cost of all investments for federal income tax purposes was $3,460,203,450 and the unrealized gains (losses) consisted of:
Gross unrealized gains | $ | 1,304,083,374 | ||
Gross unrealized losses | (408,150,521 | ) | ||
Net unrealized gains | $ | 895,932,853 | ||
As of October 31, 2019, the Fund had capital loss carryforwards which consist of $164,103,731 in long-term capital losses.
Class allocations
The separate classes of shares offered by the Fund differ principally in applicable sales charges, distribution, shareholder servicing, and administration fees. Class specific expenses are charged directly to that share class. Investment income, common fund-level expenses, and realized and unrealized gains (losses) on investments are allocated daily to each class of shares based on the relative proportion of net assets of each class.
3. FAIR VALUATION MEASUREMENTS
Fair value measurements of investments are determined within a framework that has established a fair value hierarchy based upon the various data inputs utilized in determining the value of the Fund’s investments. The three-level hierarchy gives the highest priority to unadjusted quoted prices in active markets for identical assets or liabilities (Level 1) and the lowest priority to unobservable inputs (Level 3). The Fund’s investments are classified within the fair value hierarchy based on the lowest level of input that is significant to the fair value measurement. The inputs are summarized into three broad levels as follows:
| ∎ | Level 1 – quoted prices in active markets for identical securities |
| ∎ | Level 2 – other significant observable inputs (including quoted prices for similar securities, interest rates, prepayment speeds, credit risk, etc.) |
| ∎ | Level 3 – significant unobservable inputs (including the Fund’s own assumptions in determining the fair value of investments) |
The inputs or methodologies used for valuing investments in securities are not necessarily an indication of the risk associated with investing in those securities.
26 | Wells Fargo Emerging Markets Equity Fund
Table of Contents
Notes to financial statements
The following is a summary of the inputs used in valuing the Fund’s assets and liabilities as of October 31, 2019:
| Quoted prices (Level 1) | Other significant observable inputs (Level 2) | Significant (Level 3) | Total | |||||||||||||
Assets | ||||||||||||||||
Investments in: | ||||||||||||||||
Common stocks | ||||||||||||||||
Argentina | $ | 13,046,344 | $ | 0 | $ | 0 | $ | 13,046,344 | ||||||||
Brazil | 369,248,102 | 0 | 0 | 369,248,102 | ||||||||||||
Chile | 25,887,138 | 28,849,749 | 0 | 54,736,887 | ||||||||||||
China | 1,291,819,968 | 0 | 0 | 1,291,819,968 | ||||||||||||
Colombia | 22,951,712 | 0 | 0 | 22,951,712 | ||||||||||||
Cyprus | 6,159,190 | 0 | 0 | 6,159,190 | ||||||||||||
Hong Kong | 266,155,454 | 0 | 0 | 266,155,454 | ||||||||||||
India | 386,268,582 | 0 | 0 | 386,268,582 | ||||||||||||
Indonesia | 80,660,177 | 0 | 0 | 80,660,177 | ||||||||||||
Malaysia | 23,345,734 | 0 | 0 | 23,345,734 | ||||||||||||
Mexico | 252,857,281 | 0 | 0 | 252,857,281 | ||||||||||||
Peru | 16,175,953 | 0 | 0 | 16,175,953 | ||||||||||||
Philippines | 35,168,595 | 0 | 0 | 35,168,595 | ||||||||||||
Russia | 111,736,388 | 0 | 0 | 111,736,388 | ||||||||||||
Singapore | 9,551,978 | 0 | 0 | 9,551,978 | ||||||||||||
South Africa | 111,348,148 | 0 | 0 | 111,348,148 | ||||||||||||
South Korea | 420,780,611 | 0 | 0 | 420,780,611 | ||||||||||||
Taiwan | 386,117,785 | 0 | 0 | 386,117,785 | ||||||||||||
Thailand | 100,262,536 | 0 | 0 | 100,262,536 | ||||||||||||
Turkey | 3,875,649 | 0 | 0 | 3,875,649 | ||||||||||||
United Arab Emirates | 2,003,305 | 0 | 0 | 2,003,305 | ||||||||||||
United Kingdom | 25,472,752 | 0 | 0 | 25,472,752 | ||||||||||||
Convertible debentures | 0 | 0 | 0 | 0 | ||||||||||||
Preferred stocks | ||||||||||||||||
Brazil | 57,919,376 | 0 | 0 | 57,919,376 | ||||||||||||
Short-term investments | ||||||||||||||||
Investment companies | 308,473,796 | 0 | 0 | 308,473,796 | ||||||||||||
Total assets | $ | 4,327,286,554 | $ | 28,849,749 | $ | 0 | $ | 4,356,136,303 | ||||||||
Additional sector, industry or geographic detail is included in the Portfolio of Investments.
For the year ended October 31, 2019, the Fund did not have any transfers into/out of Level 3.
4. TRANSACTIONS WITH AFFILIATES
Management fee
Funds Management, an indirect wholly owned subsidiary of Wells Fargo & Company (“Wells Fargo”), is the manager of the Fund and provides advisory and fund-level administrative services under an investment management agreement. Under the investment management agreement, Funds Management is responsible for, among other services, implementing the investment objectives and strategies of the Fund, supervising the subadviser and providing fund-level administrative services in
Wells Fargo Emerging Markets Equity Fund | 27
Table of Contents
Notes to financial statements
connection with the Fund’s operations. As compensation for its services under the investment management agreement, Funds Management is entitled to receive a management fee at the following annual rate based on the Fund’s average daily net assets:
| Average daily net assets | Management fee | |
First $1 billion | 1.050% | |
Next $1 billion | 1.025 | |
Next $2 billion | 1.000 | |
Next $1 billion | 0.975 | |
Next $3 billion | 0.965 | |
Next $2 billion | 0.955 | |
Over $10 billion | 0.945 | |
For the year ended October 31, 2019, the management fee was equivalent to an annual rate of 1.02% of the Fund’s average daily net assets.
Funds Management has retained the services of a subadviser to provide daily portfolio management to the Fund. The fee for subadvisory services is borne by Funds Management. Wells Capital Management Incorporated (“WellsCap”), an affiliate of Funds Management and an indirect wholly owned subsidiary of Wells Fargo, is the subadviser to the Fund and is entitled to receive a fee from Funds Management at an annual rate starting at 0.65% and declining to 0.45% as the average daily net assets of the Fund increase.
Administration fees
Under a class-level administration agreement, Funds Management provides class-level administrative services to the Fund, which includes paying fees and expenses for services provided by the transfer agent,sub-transfer agents, omnibus account servicers and record-keepers. As compensation for its services under the class-level administration agreement, Funds Management receives an annual fee which is calculated based on the average daily net assets of each class as follows:
| Class-level administration fee | ||||
Class A, Class C | 0.21 | % | ||
Class R6 | 0.03 | |||
Administrator Class, Institutional Class | 0.13 | |||
Waivers and/or expense reimbursements
Funds Management has contractually waived and/or reimbursed management and administration fees to the extent necessary to maintain certain net operating expense ratios for the Fund. When each class of the Fund has exceeded its expense cap, Funds Management has waived fees and/or reimbursed expenses from fund-level expenses on a proportionate basis and then from class specific expenses. When only certain classes exceed their expense caps, waivers and/or reimbursements are applied against class specific expenses before fund-level expenses. Funds Management has committed through February 29, 2020 to waive fees and/or reimburse expenses to the extent necessary to cap the Fund’s expenses at 1.58% for Class A shares, 2.33% for Class C shares, 1.15% for Class R6 shares 1.46% for Administrator Class shares, and 1.19% for Institutional Class shares. Prior to or after the commitment expiration date, the cap may be increased or the commitment to maintain the cap may be terminated only with the approval of the Board of Trustees.
Distribution fee
The Trust has adopted a distribution plan for Class C shares of the Fund pursuant to Rule12b-1 under the 1940 Act. A distribution fee is charged to Class C shares and paid to Wells Fargo Funds Distributor, LLC (“Funds Distributor”), the principal underwriter, at an annual rate of 0.75% of the average daily net assets of Class C shares.
In addition, Funds Distributor is entitled to receive thefront-end sales charge from the purchase of Class A shares and a contingent deferred sales charge on the redemption of certain Class A shares. Funds Distributor is also entitled to receive the contingent deferred sales charges from redemptions of Class C shares. For the year ended October 31, 2019, Funds Distributor received $11,142 from the sale of Class A shares. No contingent deferred sales charges were incurred by Class A and Class C shares for the year ended October 31, 2019.
28 | Wells Fargo Emerging Markets Equity Fund
Table of Contents
Notes to financial statements
Shareholder servicing fees
The Trust has entered into contracts with one or more shareholder servicing agents, whereby Class A, Class C, and Administrator Class of the Fund are charged a fee at an annual rate of 0.25% of the average daily net assets of each respective class. A portion of these total shareholder servicing fees were paid to affiliates of Wells Fargo.
Interfund transactions
The Fund may purchase or sell portfolio investment securities to certain other Wells Fargo affiliates pursuant to Rule17a-7 under the 1940 Act and under procedures adopted by the Board of Trustees. The procedures have been designed to ensure that these interfund transactions, which do not incur broker commissions, are effected at current market prices.
5. INVESTMENT PORTFOLIO TRANSACTIONS
Purchases and sales of investments, excluding U.S. government obligations (if any) and short-term securities, for the year ended October 31, 2019 were $336,130,212 and $291,705,095, respectively.
6. SECURITIES LENDING TRANSACTIONS
The Fund lends its securities through an unaffiliated securities lending agent and receives collateral in the form of cash or securities with a value at least equal to the value of the securities on loan. The value of the loaned securities is determined at the close of each business day and any increases or decreases in the required collateral are exchanged between the Fund and the counterparty on the next business day. Cash collateral received is invested in the Securities Lending Fund which seeks to provide a positive return compared to the daily Fed Funds Open Rate by investing in high-quality, U.S. dollar-denominated short-term money market instruments and is exempt from registration under Section 3(c)(7) of the 1940 Act. Securities Lending Fund is managed by Funds Management and is subadvised by WellsCap. Funds Management receives an advisory fee starting at 0.05% and declining to 0.01% as the average daily net assets of the Securities Lending Fund increase. All of the fees received by Funds Management are paid to WellsCap for its services as subadviser.
In the event of counterparty default or the failure of a borrower to return a loaned security, the Fund has the right to use the collateral to offset any losses incurred. As of October 31, 2019, the Fund had securities lending transactions with the following counterparties which are subject to offset:
| Counterparty | Value of securities on loan | Collateral received1 | Net amount | |||||||||
Barclays Capital Inc. | $ | 32,310,283 | $ | (32,310,283 | ) | $ | 0 | |||||
BNP Paribas Securities Corp. | 1,524,258 | (1,524,258 | ) | 0 | ||||||||
BOFA Securities, Inc. | 34,559,173 | (34,559,173 | ) | 0 | ||||||||
Credit Suisse Securities (USA) LLC | 2,289,637 | (2,289,637 | ) | 0 | ||||||||
CITIGROUP Global Markets Inc. | 23,388,176 | (23,388,176 | ) | 0 | ||||||||
Deutsche Bank Securities Inc. | 2,106,899 | (2,106,899 | ) | 0 | ||||||||
JPMorgan Securities LLC | 44,972,361 | (44,972,361 | ) | 0 | ||||||||
Morgan Stanley & Co. LLC | 3,058,439 | (3,058,439 | ) | 0 | ||||||||
Scotia Capital (USA) Inc. | 568,440 | (568,440 | ) | 0 | ||||||||
UBS Securities LLC | 510,672 | (510,672 | ) | 0 | ||||||||
| 1 | Collateral received within this table is limited to the collateral for the net transaction with the counterparty. |
7. DERIVATIVE TRANSACTIONS
During the year ended October 31, 2019, the Fund entered into forward foreign currency contracts for hedging purposes. The Fund had average contract amounts of $131,876 in forward foreign currency contracts to buy, during the year ended October 31, 2019.
The fair value, realized gains or losses and change in unrealized gains or losses, if any, on derivative instruments are reflected in the corresponding financial statement captions.
Wells Fargo Emerging Markets Equity Fund | 29
Table of Contents
Notes to financial statements
8. BANK BORROWINGS
The Trust (excluding the money market funds), Wells Fargo Master Trust and Wells Fargo Variable Trust are parties to a $280,000,000 revolving credit agreement whereby the Fund is permitted to use bank borrowings for temporary or emergency purposes, such as to fund shareholder redemption requests. Interest under the credit agreement is charged to the Fund based on a borrowing rate equal to the higher of the Federal Funds rate in effect on that day plus 1.25% or the overnight LIBOR rate in effect on that day plus 1.25%. In addition, an annual commitment fee equal to 0.25% of the unused balance is allocated to each participating fund.
For the year ended October 31, 2019, there were no borrowings by the Fund under the agreement.
9. DISTRIBUTIONS TO SHAREHOLDERS
The tax character of distributions paid was $28,559,205 and $28,053,517 of ordinary income for the years ended October 31, 2019 and October 31, 2018, respectively.
As of October 31, 2019, the components of distributable earnings on a tax basis were as follows:
| Undistributed ordinary income | Unrealized gains | Capital loss carryforward | ||
| $42,522,790 | $894,969,900 | $(164,103,731) | ||
10. CONCENTRATION RISKS
Concentration risks result from exposure to a limited number of geographic regions. As of the end of the period, the Fund invests a concentration of its portfolio in China. A fund that invests a substantial portion of its assets in any geographic region may be more affected by changes in that geographic region than would be a fund whose investments are not heavily weighted in any geographic region.
11. INDEMNIFICATION
Under the Trust’s organizational documents, the officers and Trustees have been granted certain indemnification rights against certain liabilities that may arise out of performance of their duties to the Trust. At a meeting held on November 21-22, 2019, the Board of Trustees of the Fund approved a proposal to authorize the Fund to enter into a separate agreement with each Trustee that would convert indemnification rights currently existing under the Fund’s organizational documents into contractual rights that could not be changed in the future without the consent of the Trustee. Additionally, in the normal course of business, the Trust may enter into contracts with service providers that contain a variety of indemnification clauses. The Trust’s maximum exposure under these arrangements is dependent on future claims that may be made against the Fund and, therefore, cannot be estimated.
12. NEW ACCOUNTING PRONOUNCEMENTS
In August 2018, FASB issued Accounting Standards Update (“ASU”)No. 2018-13, Fair Value Measurement (Topic 820)Disclosure Framework—Changes to the Disclosure Requirements for Fair Value Measurement. ASU2018-13 updates the disclosure requirements for fair value measurements by modifying or removing certain disclosures and adding certain new disclosures. The amendments are effective for fiscal years, and interim periods within those fiscal years, beginning after December 15, 2019. Early adoption is permitted. Management has adopted the removal and modification of disclosures early, as permitted, and will adopt the additional new disclosures at the effective date.
30 | Wells Fargo Emerging Markets Equity Fund
Table of Contents
Report of independent registered public accounting firm
TO THE SHAREHOLDERS OF THE FUND AND BOARD OF TRUSTEES OF WELLS FARGO FUNDS TRUST:
Opinion on the Financial Statements
We have audited the accompanying statement of assets and liabilities of Wells Fargo Emerging Markets Equity Fund (the Fund), one of the funds constituting Wells Fargo Funds Trust, including the portfolio of investments, as of October 31, 2019, the related statement of operations for the year then ended, the statements of changes in net assets for each of the years in the two-year period then ended, and the related notes (collectively, the financial statements) and the financial highlights for each of the years in the five-year period then ended. In our opinion, the financial statements and financial highlights present fairly, in all material respects, the financial position of the Fund as of October 31, 2019, the results of its operations for the year then ended, the changes in its net assets for each of the years in the two-year period then ended, and the financial highlights for each of the years in the five-year period then ended, in conformity with U.S. generally accepted accounting principles.
Basis for Opinion
These financial statements and financial highlights are the responsibility of the Fund’s management. Our responsibility is to express an opinion on these financial statements and financial highlights based on our audits. We are a public accounting firm registered with the Public Company Accounting Oversight Board (United States) (PCAOB) and are required to be independent with respect to the Fund in accordance with the U.S. federal securities laws and the applicable rules and regulations of the Securities and Exchange Commission and the PCAOB.
We conducted our audits in accordance with the standards of the PCAOB. Those standards require that we plan and perform the audit to obtain reasonable assurance about whether the financial statements and financial highlights are free of material misstatement, whether due to error or fraud. Our audits included performing procedures to assess the risks of material misstatement of the financial statements and financial highlights, whether due to error or fraud, and performing procedures that respond to those risks. Such procedures included examining, on a test basis, evidence regarding the amounts and disclosures in the financial statements and financial highlights. Such procedures also included confirmation of securities owned as of October 31, 2019, by correspondence with the custodian, transfer agent and brokers, or by other appropriate auditing procedures. Our audits also included evaluating the accounting principles used and significant estimates made by management, as well as evaluating the overall presentation of the financial statements and financial highlights. We believe that our audits provide a reasonable basis for our opinion.

We have not been able to determine the specific year that we began serving as the auditor of one or more Wells Fargo Funds investment companies; however we are aware that we have served as the auditor of one or more Wells Fargo Funds investment companies since at least 1955.
Boston, Massachusetts
December 20, 2019
Wells Fargo Emerging Markets Equity Fund | 31
Table of Contents
TAX INFORMATION
Pursuant to Section 854 of the Internal Revenue Code, $28,559,205 of income dividends paid during the fiscal year ended October 31, 2019 has been designated as qualified dividend income (QDI).
For the fiscal year ended October 31, 2019, $810,113 has been designated as interest-related dividends for nonresident alien shareholders pursuant to Section 871 of the Internal Revenue Code.
Pursuant to Section 853 of the Internal Revenue Code, the Fund expects to designate amounts as foreign taxes paid for the fiscal year ended October 31, 2019. Additional details will be available in the semiannual report.
PROXY VOTING INFORMATION
A description of the policies and procedures used to determine how to vote proxies relating to portfolio securities is available, upon request, by calling1-800-222-8222, visiting our website atwfam.com, or visiting the SEC website at sec.gov. Information regarding how the proxies related to portfolio securities were voted during the most recent12-month period ended June 30 is available on the website atwfam.comor by visiting the SEC website at sec.gov.
QUARTERLY PORTFOLIO HOLDINGS INFORMATION
The Fund files its complete schedule of portfolio holdings with the SEC for the first and third quarters of each fiscal year on Form N-Q or FormN-PORT, which is available by visiting the SEC website at sec.gov. Those forms may be reviewed and copied at the SEC’s Public Reference Room in Washington, DC. Information on the operation of the Public Reference Room may be obtained by calling1-800-SEC-0330.
32 | Wells Fargo Emerging Markets Equity Fund
Table of Contents
Other information (unaudited)
BOARD OF TRUSTEES AND OFFICERS
Each of the Trustees and Officers1 listed in the table below acts in identical capacities for each fund in the Wells Fargo family of funds, which consists of 150 mutual funds comprising the Wells Fargo Funds Trust, Wells Fargo Variable Trust, Wells Fargo Master Trust and fourclosed-end funds (collectively the “Fund Complex”). This table should be read in conjunction with the Prospectus and the Statement of Additional Information2. The mailing address of each Trustee and Officer is 525 Market Street, 12th Floor, San Francisco, CA 94105. Each Trustee and Officer serves an indefinite term, however, each Trustee serves such term until reaching the mandatory retirement age established by the Trustees.
Independent Trustees
Name and year of birth | Position held and length of service* | Principal occupations during past five years or longer | Current other public company or investment company directorships | |||
| William R. Ebsworth (Born 1957) | Trustee, since 2015 | Retired. From 1984 to 2013, equities analyst, portfolio manager, research director and chief investment officer at Fidelity Management and Research Company in Boston, Tokyo, and Hong Kong, and retired in 2013 as Chief Investment Officer of Fidelity Strategic Advisers, Inc. where he led a team of investment professionals managing client assets. Prior thereto, Board member of Hong Kong Securities Clearing Co., Hong Kong Options Clearing Corp., the Thailand International Fund, Ltd., Fidelity Investments Life Insurance Company, and Empire Fidelity Investments Life Insurance Company. Audit Committee Chair and Investment Committee Chair of the Vincent Memorial Hospital Endowment(non-profit organization). Mr. Ebsworth is a CFA® charterholder. | N/A | |||
| Jane A. Freeman (Born 1953) | Trustee, since 2015; Chair Liaison, since 2018 | Retired. From 2012 to 2014 and 1999 to 2008, Chief Financial Officer of Scientific Learning Corporation. From 2008 to 2012, Ms. Freeman provided consulting services related to strategic business projects. Prior to 1999, Portfolio Manager at Rockefeller & Co. and Scudder, Stevens & Clark. Board member of the Harding Loevner Funds from 1996 to 2014, serving as both Lead Independent Director and chair of the Audit Committee. Board member of the Russell Exchange Traded Funds Trust from 2011 to 2012 and the chair of the Audit Committee. Ms. Freeman is a Board Member of The Ruth Bancroft Garden(non-profit organization). She is also an inactive Chartered Financial Analyst. | N/A | |||
| Isaiah Harris, Jr. (Born 1952) | Trustee, since 2009; Audit Committee Chairman, since 2019 | Retired. Chairman of the Board of CIGNA Corporation since 2009, and Director since 2005. From 2003 to 2011, Director of Deluxe Corporation. Prior thereto, President and CEO of BellSouth Advertising and Publishing Corp. from 2005 to 2007, President and CEO of BellSouth Enterprises from 2004 to 2005 and President of BellSouth Consumer Services from 2000 to 2003. Emeritus member of the Iowa State University Foundation Board of Governors. Emeritus Member of the Advisory Board of Iowa State University School of Business. Advisory Board Member, Palm Harbor Academy (private school). Advisory Board Member, Child Evangelism Fellowship(non-profit). Mr. Harris is a certified public accountant (inactive status). | CIGNA Corporation | |||
| Judith M. Johnson (Born 1949) | Trustee, since 2008; Audit Committee Chairman, from 2009 to 2018 | Retired. Prior thereto, Chief Executive Officer and Chief Investment Officer of Minneapolis Employees Retirement Fund from 1996 to 2008. Ms. Johnson is an attorney, certified public accountant and a certified managerial accountant. | N/A | |||
Wells Fargo Emerging Markets Equity Fund | 33
Table of Contents
Other information (unaudited)
Name and year of birth | Position held and length of service* | Principal occupations during past five years or longer | Current other public company or investment company directorships | |||
| David F. Larcker (Born 1950) | Trustee, since 2009 | James Irvin Miller Professor of Accounting at the Graduate School of Business, Stanford University, Director of the Corporate Governance Research Initiative and Senior Faculty of The Rock Center for Corporate Governance since 2006. From 2005 to 2008, Professor of Accounting at the Graduate School of Business, Stanford University. Prior thereto, Ernst & Young Professor of Accounting at The Wharton School, University of Pennsylvania from 1985 to 2005. | N/A | |||
| Olivia S. Mitchell (Born 1953) | Trustee, since 2006; Nominating and Governance Committee Chair, since 2018 | International Foundation of Employee Benefit Plans Professor, Wharton School of the University of Pennsylvania since 1993. Director of Wharton’s Pension Research Council and Boettner Center on Pensions & Retirement Research, and Research Associate at the National Bureau of Economic Research. Previously, Cornell University Professor from 1978 to 1993. | N/A | |||
| Timothy J. Penny (Born 1951) | Trustee, since 1996; Chairman, since 2018 | President and Chief Executive Officer of Southern Minnesota Initiative Foundation, anon-profit organization, since 2007. Member of the Board of Trustees of NorthStar Education Finance, Inc., anon-profit organization, since 2007. | N/A | |||
| James G. Polisson (Born 1959) | Trustee, since 2018 | Retired. Chief Marketing Officer, Source (ETF) UK Services, Ltd, from 2015 to 2017. From 2012 to 2015, Principal of The Polisson Group, LLC, a management consulting, corporate advisory and principal investing company. Chief Executive Officer and Managing Director at Russell Investments, Global Exchange Traded Funds from 2010 to 2012. Managing Director of Barclays Global Investors from 1998 to 2010 and Global Chief Marketing Officer for iShares and Barclays Global Investors from 2000 to 2010. Trustee of the San Francisco Mechanics’ Institute, anon-profit organization, from 2013 to 2015. Board member of the Russell Exchange Traded Fund Trust from 2011 to 2012. Director of Barclays Global Investors Holdings Deutschland GmbH from 2006 to 2009. Mr. Polisson is an attorney and has a retired status with the Massachusetts and District of Columbia Bar Associations. | N/A | |||
Pamela Wheelock3 (Born 1959) | Trustee, since January 2020; previously Trustee from January 2018 to July 2019 | Board member of the Destination Medical Center Economic Development Agency, Rochester, Minnesota since 2019. Acting Commissioner, Minnesota Department of Human Services, July 2019 through September 2019. Human Services Manager (part-time), Minnesota Department of Human Services, October 2019 through December 2019. Chief Operating Officer, Twin Cities Habitat for Humanity from 2017 to 2019. Vice President of University Services, University of Minnesota from 2012 to 2016. Prior thereto, on the Board of Directors, Governance Committee and Finance Committee for the Minnesota Philanthropy Partners (Saint Paul Foundation) from 2012 to 2018, Interim Chief Executive Officer of Blue Cross Blue Shield of Minnesota from 2011 to 2012, Chairman of the Board from 2009 to 2012 and Board Director from 2003 to 2015. Vice President, Leadership and Community Engagement, Bush Foundation, Saint Paul, Minnesota (a private foundation) from 2009 to 2011. Executive Vice President and Chief Financial Officer, Minnesota Sports and Entertainment from 2004 to 2009 and Senior Vice President from 2002 to 2004. Executive Vice President of the Minnesota Wild Foundation from 2004 to 2008. Commissioner of Finance, State of Minnesota, from 1999 to 2002. Currently Board Chair of the Minnesota Wild Foundation since 2010. | N/A | |||
| * | Length of service dates reflect the Trustee’s commencement of service with the Trust’s predecessor entities, where applicable. |
34 | Wells Fargo Emerging Markets Equity Fund
Table of Contents
Other information (unaudited)
Officers
| Name and year of birth | Position held and length of service | Principal occupations during past five years or longer | ||
| Andrew Owen (Born 1960) | President, since 2017 | Executive Vice President of Wells Fargo & Company and Head of Affiliated Managers, Wells Fargo Asset Management, since 2014. In addition, Mr. Owen is currently President, Chief Executive Officer and Director of Wells Fargo Funds Management, LLC since 2017. Prior thereto, Executive Vice President responsible for marketing, investments and product development for Wells Fargo Funds Management, LLC, from 2009 to 2014. | ||
| Jeremy DePalma1 (Born 1974) | Treasurer, since 2012 | Senior Vice President of Wells Fargo Funds Management, LLC since 2009. Senior Vice President of Evergreen Investment Management Company, LLC from 2008 to 2010 and head of the Fund Reporting and Control Team within Fund Administration from 2005 to 2010. | ||
| Michelle Rhee4 (Born 1966) | Chief Legal Officer, since 2019 | Secretary of Wells Fargo Funds Management, LLC, Chief Legal Counsel of Wells Fargo Asset Management and Assistant General Counsel of Wells Fargo Bank, N.A. since 2018. Associate General Counsel and Managing Director of Bank of America Corporation from 2004 to 2018. | ||
| Catherine Kennedy5 (Born 1969) | Secretary, since 2019 | Vice President of Wells Fargo Funds Management, LLC and Senior Counsel of the Wells Fargo Legal Department since 2010. Vice President and Senior Counsel of Evergreen Investment Management Company, LLC from 1998 to 2010. | ||
| Michael H. Whitaker (Born 1967) | Chief Compliance Officer, since 2016 | Chief Compliance Officer of Wells Fargo Asset Management since 2016. Senior Vice President and Chief Compliance Officer for Fidelity Investments from 2007 to 2016. | ||
| David Berardi (Born 1975) | Assistant Treasurer, since 2009 | Vice President of Wells Fargo Funds Management, LLC since 2009. Vice President of Evergreen Investment Management Company, LLC from 2008 to 2010. Manager of Fund Reporting and Control for Evergreen Investment Management Company, LLC from 2004 to 2010. | ||
| 1 | Jeremy DePalma acts as Treasurer of 86 funds and Assistant Treasurer of 64 funds in the Fund Complex. |
| 2 | The Statement of Additional Information includes additional information about the Trustees and is available, without charge, upon request, by calling1-800-222-8222 or by visiting the website atwfam.com. |
| 3 | Ms. Wheelock was re-appointed to the Board effective January 1, 2020. |
| 4 | Michelle Rhee became Chief Legal Officer effective October 22, 2019. |
| 5 | Catherine Kennedy became Secretary effective October 22, 2019. |
Wells Fargo Emerging Markets Equity Fund | 35
Table of Contents
BOARD CONSIDERATION OF INVESTMENT MANAGEMENT ANDSUB-ADVISORY AGREEMENTS:
Wells Fargo Emerging Markets Equity Fund
Under the Investment Company Act of 1940 (the “1940 Act”), the Board of Trustees (the “Board”) of Wells Fargo Funds Trust (the “Trust”) must determine annually whether to approve the continuation of the Trust’s investment management andsub-advisory agreements. In this regard, at anin-person meeting held on May21-22, 2019 (the “Meeting”), the Board, all the members of which have no direct or indirect interest in the investment management andsub-advisory agreements and are not “interested persons” of the Trust, as defined in the 1940 Act (the “Independent Trustees”), reviewed and approved for Wells Fargo Emerging Markets Equity Fund(the “Fund”): (i) an investment management agreement (the “Management Agreement”) with Wells Fargo Funds Management, LLC (“Funds Management”); and (ii) an investmentsub-advisory agreement (the“Sub-Advisory Agreement”) with Wells Capital Management Incorporated (the“Sub-Adviser”), an affiliate of Funds Management. The Management Agreement and theSub-Advisory Agreement are collectively referred to as the “Advisory Agreements.”
At the Meeting, the Board considered the factors and reached the conclusions described below relating to the selection of Funds Management and theSub-Adviser and the approval of the Advisory Agreements. Prior to the Meeting, including at anin-person meeting in April 2019, the Trustees conferred extensively among themselves and with representatives of Funds Management about these matters. Also, the Board has adopted a team-based approach, with each team consisting of asub-set of Trustees, to assist the full Board in the discharge of its duties in reviewing investment performance and other matters throughout the year. The Independent Trustees were assisted in their evaluation of the Advisory Agreements by independent legal counsel, from whom they received separate legal advice and with whom they met separately.
In providing information to the Board, Funds Management and theSub-Adviser were guided by a detailed set of requests for information submitted to them by independent legal counsel on behalf of the Independent Trustees at the start of the Board’s annual contract renewal process earlier in 2019. In considering and approving the Advisory Agreements, the Trustees considered the information they believed relevant, including but not limited to the information discussed below. The Board considered not only the specific information presented in connection with the Meeting, but also the knowledge gained over time through interaction with Funds Management and theSub-Adviser about various topics. In this regard, the Board reviewed reports of Funds Management at each of its quarterly meetings, which included, among other things, portfolio reviews and investment performance reports. In addition, the Board and the teams mentioned above confer with portfolio managers at various times throughout the year. The Board did not identify any particular information or consideration that wasall-important or controlling, and each individual Trustee may have attributed different weights to various factors.
After its deliberations, the Board unanimously approved the continuation of the Advisory Agreements for aone-year term and determined that the compensation payable to Funds Management and theSub-Adviser under each of the Advisory Agreements was reasonable. The Board considered the approval of the Advisory Agreements for the Fund as part of its consideration of agreements for funds across the complex, but its approvals were made on afund-by-fund basis. The following summarizes a number of important, but not necessarily all, factors considered by the Board in support of its approvals.
Nature, extent and quality of services
The Board received and considered various information regarding the nature, extent and quality of services provided to the Fund by Funds Management and theSub-Adviser under the Advisory Agreements. This information included a description of the investment advisory services and Fund-level administrative services covered by the Management Agreement, as well as, among other things, a summary of the background and experience of senior management of Wells Fargo Asset Management (“WFAM”), of which Funds Management and theSub-Adviser are a part, a summary of investments made in the business of WFAM, a summary of certain organizational and personnel changes involving Funds Management and theSub-Adviser, and a description of Funds Management’s and theSub-Adviser’s business continuity planning programs and of their approaches to data privacy and cybersecurity. The Board received and reviewed information about Funds Management’s role as administrator of the Fund’s liquidity risk management program. The Board also considered the qualifications, background, tenure and responsibilities of each of the portfolio managers primarily responsible for theday-to-day portfolio management of the Fund.
The Board evaluated the ability of Funds Management and theSub-Adviser to attract and retain qualified investment professionals, including research, advisory and supervisory personnel. The Board further considered the compliance programs and compliance records of Funds Management and theSub-Adviser. In addition, the Board took into account the full range of services provided to the Fund by Funds Management and its affiliates.
36 | Wells Fargo Emerging Markets Equity Fund
Table of Contents
Other information (unaudited)
Fund investment performance and expenses
The Board considered the investment performance results for the Fund over various time periods ended December 31, 2018. The Board considered these results in comparison to the investment performance of funds in a universe that was determined by Broadridge Inc. (“Broadridge”) to be similar to the Fund (the “Universe”), and in comparison to the Fund’s benchmark index and to other comparative data. Broadridge is an independent provider of investment company data. The Board received a description of the methodology used by Broadridge to select the mutual funds in the performance Universe. The Board noted that the investment performance of the Fund (Administrator Class) was in range of or higher than the average investment performance of the Universe for all periods under review. The Board also noted that the investment performance of the Fund was lower than its benchmark index, the MSCI Emerging Markets Index (Net), for theone-, three- and five-year periods under review, but in range of its benchmark for theten-year period under review.
The Board received information concerning, and discussed factors contributing to, the underperformance of the Fund relative to the benchmark for the periods identified above. The Board took note of the explanations for the relative underperformance during these periods, including with respect to investment decisions and market factors that affected the Fund’s investment performance. The Board also took note of the Fund’s outperformance relative to the Universe for the periods identified above in light of the Fund’s expenses.
The Board also received and considered information regarding the Fund’s net operating expense ratios and their various components, including actual management fees, custodian and othernon-management fees, and Rule12b-1 andnon-Rule12b-1 shareholder service fees. The Board considered these ratios in comparison to the median ratios of funds in class-specific expense groups that were determined by Broadridge to be similar to the Fund (the “Groups”). The Board received a description of the methodology used by Broadridge to select the mutual funds in the expense Groups and an explanation of how funds comprising expense groups and their expense ratios may vary fromyear-to-year. Based on the Broadridge reports, the Board noted that the net operating expense ratios of the Fund’s Administrator Class, Institutional Class and Class R6 shares were in range of the median net operating expense ratios of the expense Groups for their respective share classes, but that the net operating expense ratio of the Fund’s Class A shares was higher than the median net operating expense ratio of the expense Group for Class A.
The Board took into account the Fund’s investment performance and expense information provided to it among the factors considered in deciding tore-approve the Advisory Agreements.
Investment management andsub-advisory fee rates
The Board reviewed and considered the contractual fee rates payable by the Fund to Funds Management under the Management Agreement, as well as the contractual fee rates payable by the Fund to Funds Management for class-level administrative services under a Class-Level Administration Agreement, which include, among other things, class-level transfer agency andsub-transfer agency costs (collectively, the “Management Rates”). The Board also reviewed and considered the contractual investmentsub-advisory fee rates that are payable by Funds Management to theSub-Adviser for investmentsub-advisory services.
Among other information reviewed by the Board was a comparison of the Fund’s Management Rates with the average contractual investment management fee rates of funds in the expense Groups at a common asset level as well as transfer agency costs of the funds in the expense Groups. The Board noted that the Management Rates of the Fund’s Class R6 and Institutional Class shares were in range of the sum of the average rates for their respective expense Groups, but that the Management Rates of the Fund’s Class A and Administrator Class shares were higher than the sum of the average rates for their respective expense Groups. The Board also noted that the net operating expense ratio caps for each share class would be reduced.
The Board also received and considered information about the portion of the total management fee that was retained by Funds Management after payment of the fee to theSub-Adviser forsub-advisory services. In assessing the reasonableness of this amount, the Board received and evaluated information about the nature and extent of responsibilities retained and risks assumed by Funds Management and not delegated to or assumed by theSub-Adviser, and about Funds Management’son-going oversight services. Given the affiliation between Funds Management and theSub-Adviser, the Board ascribed limited relevance to the allocation of fees between them.
The Board also received and considered information about the nature and extent of services offered and fee rates charged by Funds Management and theSub-Adviser to other types of clients with investment strategies similar to those of the Fund. In this regard, the Board received information about the significantly greater scope of services, and compliance, reporting and other legal burdens and risks of managing proprietary mutual funds compared with those associated with managing assets of other types of clients, including third-partysub-advised fund clients andnon-mutual fund clients such as institutional separate accounts.
Wells Fargo Emerging Markets Equity Fund | 37
Table of Contents
Other information (unaudited)
Based on its consideration of the factors and information it deemed relevant, including those described here, the Board determined that the compensation payable to Funds Management under the Management Agreement and to theSub-Adviser under theSub-Advisory Agreement was reasonable.
Profitability
The Board received and considered information concerning the profitability of Funds Management, as well as the profitability of both WFAM and Wells Fargo & Co. (“Wells Fargo”) from providing services to the fund family as a whole. The Board noted that theSub-Adviser’s profitability information with respect to providing services to the Fund and other funds in the family was subsumed in the WFAM and Wells Fargo profitability analysis.
Funds Management reported on the methodologies and estimates used in calculating profitability, including a description of the methodology used to allocate certain expenses. Among other things, the Board noted that the levels of profitability reported on afund-by-fund basis varied widely, depending on factors such as the size, type and age of fund. Based on its review, the Board did not deem the profits reported by Funds Management, WFAM or Wells Fargo from services provided to the Fund to be at a level that would prevent it from approving the continuation of the Advisory Agreements.
Economies of scale
The Board received and considered information about the potential for Funds Management to experience economies of scale in the provision of management services to the Fund, the difficulties of calculating economies of scale at an individual fund level, and the extent to which potential scale benefits are shared with shareholders. The Board noted the existence of breakpoints in the Fund’s management fee structure, which operate generally to reduce the Fund’s expense ratios as the Fund grows in size. The Board considered that in addition to management fee breakpoints, Funds Management shares potential economies of scale from its management business in a variety of ways, including through fee waiver and expense reimbursement arrangements, services that benefit shareholders, competitive management fee rates set at the outset without regard to breakpoints, and investments in the business intended to enhance services available to shareholders.
The Board concluded that Funds Management’s arrangements with respect to the Fund, including contractual breakpoints, constituted a reasonable approach to sharing potential economies of scale with the Fund and its shareholders.
Other benefits to Funds Management and theSub-Adviser
The Board received and considered information regarding potential“fall-out” or ancillary benefits received by Funds Management and its affiliates, including theSub-Adviser, as a result of their relationships with the Fund. Ancillary benefits could include, among others, benefits directly attributable to other relationships with the Fund and benefits potentially derived from an increase in Funds Management’s and theSub-Adviser’s business as a result of their relationships with the Fund. The Board noted that various affiliates of Funds Management may receive distribution-related fees, shareholder servicing payments andsub-transfer agency fees in respect of shares sold or held through them and services provided.
The Board also reviewed information about soft dollar credits earned and utilized by theSub-Adviser, fees earned by Funds Management and theSub-Adviser from managing a private investment vehicle for the fund family’s securities lending collateral, and commissions earned by an affiliated broker from portfolio transactions.
Based on its consideration of the factors and information it deemed relevant, including those described here, the Board did not find that any ancillary benefits received by Funds Management and its affiliates, including theSub-Adviser, were unreasonable.
Conclusion
At the Meeting, after considering the above-described factors and based on its deliberations and its evaluation of the information described above, the Board unanimously approved the continuation of the Advisory Agreements for aone-year term and determined that the compensation payable to Funds Management and theSub-Adviser under each of the Advisory Agreements was reasonable.
38 | Wells Fargo Emerging Markets Equity Fund
Table of Contents
This page is intentionally left blank.
Table of Contents
This page is intentionally left blank.
Table of Contents
For more information
More information about Wells Fargo Funds is available free upon request. To obtain literature, please write, visit the Fund’s website, or call:
Wells Fargo Funds
P.O. Box 219967
Kansas City, MO 64121-9967
Website:wfam.com
Individual investors:1-800-222-8222
Retail investment professionals:1-888-877-9275
Institutional investment professionals:1-866-765-0778

This report and the financial statements contained herein are submitted for the general information of the shareholders of the Fund. If this report is used for promotional purposes, distribution of the report must be accompanied or preceded by a current prospectus. Before investing, please consider the investment objectives, risks, charges, and expenses of the investment. For a current prospectus and, if available, a summary prospectus, containing this information, call1-800-222-8222 or visit the Fund’s website atwfam.com. Read the prospectus carefully before you invest or send money.
Wells Fargo Asset Management (WFAM) is the trade name for certain investment advisory/management firms owned by Wells Fargo & Company. These firms include but are not limited to Wells Capital Management Incorporated and Wells Fargo Funds Management, LLC. Certain products managed by WFAM entities are distributed by Wells Fargo Funds Distributor, LLC (a broker-dealer and Member FINRA).
This material is for general informational and educational purposes only and is NOT intended to provide investment advice or a recommendation of any kind—including a recommendation for any specific investment, strategy, or plan.
INVESTMENT PRODUCTS: NOT FDIC INSURED ◾ NO BANK GUARANTEE ◾ MAY LOSE VALUE
© 2019 Wells Fargo & Company. All rights reserved.
408245 12-19
A238/AR238 10-19
Table of Contents

Annual Report
October 31, 2019
Wells Fargo Global Small Cap Fund
Beginning on January 1, 2021, as permitted by new regulations adopted by the Securities and Exchange Commission, paper copies of the Wells Fargo Funds’ annual and semi-annual shareholder reports issued after this date will no longer be sent by mail, unless you specifically request paper copies of the reports. Instead, the reports will be made available on the Funds’ website, and you will be notified by mail each time a report is posted and provided with a website address to access the report.
If you already elected to receive shareholder reports electronically, you will not be affected by this change and you need not take any action. You may elect to receive shareholder reports and other communications from the Fund electronically at any time by contacting your financial intermediary (such as a broker-dealer or bank) or, if you are a direct investor, by calling1-800-222-8222 or by enrolling at wellsfargo.com/advantagedelivery.
You may elect to receive all future reports in paper free of charge. If you invest through a financial intermediary, you can contact your financial intermediary to request that you continue to receive paper copies of your shareholder reports; if you invest directly with the Fund, you can call 1-800-222-8222. Your election to receive reports in paper will apply to all Wells Fargo Funds held in your account with your financial intermediary or, if you are a direct investor, to all Wells Fargo Funds that you hold.
Table of Contents
|
Reduce clutter. Save trees. |
Sign up for electronic delivery of prospectuses and shareholder reports atwellsfargo.com/advantagedelivery |
The views expressed and any forward-looking statements are as of October 31, 2019, unless otherwise noted, and are those of the Fund managers and/or Wells Fargo Asset Management. Discussions of individual securities, or the markets generally, or any Wells Fargo Fund are not intended as individual recommendations. Future events or results may vary significantly from those expressed in any forward-looking statements. The views expressed are subject to change at any time in response to changing circumstances in the market. Wells Fargo Asset Management and the Fund disclaim any obligation to publicly update or revise any views expressed or forward-looking statements.
INVESTMENT PRODUCTS: NOT FDIC INSURED ◾ NO BANK GUARANTEE ◾ MAY LOSE VALUE
Wells Fargo Global Small Cap Fund | 1
Table of Contents
Letter to shareholders (unaudited)

Andrew Owen
President
Wells Fargo Funds
Dear Shareholder:
We are pleased to offer you this annual report for the Wells Fargo Global Small Cap Fund for the 12-month period that ended October 31, 2019. After the first few months of the period featured high volatility and yielded minimal returns, U.S. investors generally saw markets recover during the second half amid intensifying market volatility, global economic growth concerns, international trade stare downs, and simmering geopolitical tensions.
Overall, both fixed-income and equity investors enjoyed healthy returns despite market volatility. For the period, U.S. stocks, based on the S&P 500 Index,1 gained 14.33% and international stocks, as measured by the MSCI ACWI ex USA Index (Net),2 returned 11.27%. The MSCI EM Index (Net)3 gained 11.86%. Among fixed income investors, the Bloomberg Barclays U.S. Aggregate Bond Index4 added 11.51%, the Bloomberg Barclays Global Aggregate ex-USD Index5 added 7.84%, the Bloomberg Barclays Municipal Bond Index6 gained 9.42%, and the ICE BofAML U.S. High Yield Index7 added 8.32%.
Investors confronted unsettling events during the fourth quarter of 2018.
During the fourth quarter of 2018, investors grew concerned about the pace and sustainability of the global economic expansion. The U.S. Bureau of Economic Analysis reported third-quarter U.S. gross domestic product (GDP) was 3.4% on an annualized basis, which was down from the second-quarter rate. A partial U.S. government shutdown occurred, which extended into January 2019. Brexit efforts stalled, causing uncertainty for the eurozone. The value of the renminbi declined even as the People’s Bank of China cut reserve requirement ratios, accelerated infrastructure spending, and cut taxes in efforts to spur economic activity.
The combination of news in the U.S. and generally weak economic indicators outside of the U.S. caused investors to seek safe havens. December’s S&P 500 Index performance was the worst since 1931. Globally, fixed-income investments fared better than stocks during the last two months of the year. Even as indicators suggested growth was restrained, the U.S. Federal Reserve (Fed) increased the federal funds rate by 25 basis points (bps; 100 bps equal 1.00%) in December 2018 to a target range of between 2.25% and 2.50%. Many observers expressed concerns that higher rates could slow the economy further.
| 1 | The S&P 500 Index consists of 500 stocks chosen for market size, liquidity, and industry group representation. It is a market-value-weighted index with each stock’s weight in the index proportionate to its market value. You cannot invest directly in an index. |
| 2 | The Morgan Stanley Capital International (MSCI) All Country World Index (ACWI) ex USA Index (Net) is a free-float-adjusted market-capitalization-weighted index that is designed to measure the equity market performance of developed and emerging markets, excluding the United States. Source: MSCI. MSCI makes no express or implied warranties or representations and shall have no liability whatsoever with respect to any MSCI data contained herein. The MSCI data may not be further redistributed or used as a basis for other indices or any securities or financial products. This report is not approved, reviewed, or produced by MSCI. You cannot invest directly in an index. |
| 3 | The MSCI Emerging Markets (EM) Index (Net) is a free-float-adjusted market-capitalization-weighted index that is designed to measure the equity market performance of emerging markets. You cannot invest directly in an index. |
| 4 | The Bloomberg Barclays U.S. Aggregate Bond Index is a broad-based benchmark that measures the investment-grade, U.S. dollar-denominated, fixed-rate taxable bond market, including Treasuries, government-related and corporate securities, mortgage-backed securities (agency fixed-rate and hybrid adjustable-rate mortgage pass-throughs), asset-backed securities, and commercial mortgage-backed securities. You cannot invest directly in an index. |
| 5 | The Bloomberg Barclays Global Aggregate ex-USD Index is an unmanaged index that provides a broad-based measure of the global investment-grade fixed-income markets excluding the U.S. dollar-denominated debt market. You cannot invest directly in an index. |
| 6 | The Bloomberg Barclays Municipal Bond Index is an unmanaged index composed of long-term tax-exempt bonds with a minimum credit rating of Baa. You cannot invest directly in an index. |
| 7 | The ICE BofAML U.S. High Yield Index is a market-capitalization-weighted index of domestic and Yankee high-yield bonds. The index tracks the performance of high-yield securities traded in the U.S. bond market. You cannot invest directly in an index. Copyright 2019. ICE Data Indices, LLC. All rights reserved. |
2 | Wells Fargo Global Small Cap Fund
Table of Contents
Letter to shareholders (unaudited)
The market climbs a wall of worry.
Investment returns early in 2019 appeared to reaffirm the adage that markets climb a wall of worry as the new year began. The S&P 500 Index gained 8.01% in January, the best monthly performance in 30 years. Returns for the MSCI ACWI ex USA Index (Net), the Bloomberg Barclays U.S. Aggregate Bond Index, and the Bloomberg Barclays Global Aggregate ex-USD Index also were positive.
In February 2019, signs of slowing global growth grew more ominous. The U.S. Bureau of Economic Analysis announced fourth-quarter 2018 GDP grew at an annualized 2.2% rate, down from the levels of the prior two quarters. In a February report, the Bank of England forecast the slowest growth since the financial crisis for 2019. China and the U.S. continued to wrangle over trade issues. By the end of the first quarter of 2019, more accommodative Fed sentiment and steady, if not spectacular, U.S. economic and business metrics encouraged domestic investors.
Early second-quarter 2019 enthusiasm among investors faded.
During April 2019, sustained low inflation, solid employment data, and first-quarter U.S. GDP grew at an annualized rate of 3.2% supported favorable sentiment. During May, markets tumbled on mixed investment signals. In the U.S., partisan wrangling ramped up as Democrats and Republicans set their sights on 2020 presidential politics. The U.K.’s Brexit disagreements caused Prime Minister Theresa May to resign. Boris Johnson succeeded her only to exacerbate uncertainty about Brexit’s resolution ahead of an October 2019 deadline. The European Commission downgraded the 2019 growth forecast to 1.2%. The U.S. increased tariffs on products from China, China responded, and then talks broke down. President Donald Trump threatened to turn his foreign policy tariff tool to Mexico over immigration issues.
Halfway through 2019, investors regrouped. Just as the investment horizon appeared to darken, sentiment turned and U.S. equity markets gained during June and July. The gains, primarily driven by geopolitical and monetary policy events, pushed equity markets to new highs. European Central Bank President Mario Draghi said that if the outlook doesn’t improve, the bank would cut rates or buy more assets to prop up inflation. President Trump backed off of tariff threats against Mexico and China. In the U.S., the Fed implemented a 0.25% federal funds rate cut in July.
Later in July 2019, the U.S. reversed course and threatened to impose higher tariffs on China’s exports after talks failed. China responded with tariff threats of its own and devalued the renminbi, a move that roiled global markets. Major U.S. stock market indices closed July with the worst weekly results of the year. Bond prices gained as Treasury yields fell to levels not seen since November 2016 and the yield curve inverted at multiple points along the 30-year arc.
In microcosm, August 2019 encapsulated many of the unnerving events that had plagued investors for months. The U.S.-China trade relationship swung from antagonistic to hopeful and back again with no signs of compromise. Evidence of a continued global economic slowdown continued to mount as central banks in China, New Zealand, and Thailand cut interest rates. Industrial and manufacturing data declined in China, Canada, Japan, and Germany. Adding to the uncertain environment, Italy’s prime minister resigned, many feared a crackdown in Hong Kong as protestors sustained their calls for reform, and Boris Johnson planned to suspend Parliament as Brexit’s deadline neared.
In the U.S., September 2019 saw the Fed join other central banks in cutting interest rates. U.S. manufacturing data, as reported by the Institute for Supply Management, disappointed investors. The U.S. House of Representatives announced it would pursue an impeachment investigation of President Trump. Meanwhile, the Brexit impasse showed no signs of resolution. Officials in China said that hitting the country’s economic
“In February 2019, signs of slowing global growth grew more ominous.”
Wells Fargo Global Small Cap Fund | 3
Table of Contents
Letter to shareholders (unaudited)
“The Fed lowered interest rates another quarter point in late October, its third rate cut in four months.”
|
For further information about your Fund, contact your investment professional, visit our website at wfam.com, or call us directly at1-800-222-8222. |
growth goals for the year would be difficult considering the weight of tariffs and trade restrictions. So while the S&P 500 Index finished the third quarter with the best year-to-date returns in more than 20 years, amid signs of equity investors taking money out of the stock market, concerns about future returns remained.
In October 2019, a relaxing of U.S.-China trade tensions and renewed optimism for a U.K. Brexit deal combined with positive macroeconomic data to support financial markets overall. The initial estimate of U.S. third-quarter GDP growth, announced in late October, was a resilient 1.9% annualized rate while the U.S. unemployment rate fell to a 50-year low of 3.5% in September. However, despite resilience among U.S. consumers, business confidence declined while manufacturing activity contracted. Concerned with a potential economic slowdown, the Fed lowered interest rates another quarter point in late October, its third rate cut in four months. This helped push the S&P 500 Index to a new all-time high while emerging market equities rallied and global bonds declined overall, reflecting a broad pickup in risk appetite.
Don’t let short-term uncertainty derail long-term investment goals.
Periods of investment uncertainty can present challenges, but experience has taught us that maintaining long-term investment goals can be an effective way to plan for the future. To help you create a sound strategy based on your personal goals and risk tolerance, Wells Fargo Funds offers more than 100 mutual funds spanning a wide range of asset classes and investment styles. Although diversification cannot guarantee an investment profit or prevent losses, we believe it can be an effective way to manage investment risk and potentially smooth out overall portfolio performance. We encourage investors to know their investments and to understand that appropriate levels of risk-taking may unlock opportunities.
Thank you for choosing to invest with Wells Fargo Funds. We appreciate your confidence in us and remain committed to helping you meet your financial needs.
Sincerely,

Andrew Owen
President
Wells Fargo Funds
4 | Wells Fargo Global Small Cap Fund
Table of Contents
This page is intentionally left blank.
Table of Contents
Performance highlights (unaudited)
Investment objective
The Fund seeks long-term capital appreciation.
Manager
Wells Fargo Funds Management, LLC
Subadviser
Wells Capital Management Incorporated
Portfolio managers
Oleg Makhorine
Robert Rifkin, CFA®‡
James M. Tringas, CFA®‡
Bryant VanCronkhite, CFA®‡, CPA
Average annual total returns (%) as of October 31, 20191
| Including sales charge | Excluding sales charge | Expense ratios2 (%) | ||||||||||||||||||||||||||||||||
| Inception date | 1 year | 5 year | 10 year | 1 year | 5 year | 10 year | Gross | Net3 | ||||||||||||||||||||||||||
| Class A (EKGAX) | 3-16-1988 | 3.44 | 7.50 | 9.76 | 9.75 | 8.78 | 10.41 | 1.55 | 1.55 | |||||||||||||||||||||||||
| Class C (EKGCX) | 2-1-1993 | 7.90 | 7.97 | 9.58 | 8.90 | 7.97 | 9.58 | 2.30 | 2.30 | |||||||||||||||||||||||||
| Administrator Class (EKGYX) | 1-13-1997 | – | – | – | 9.90 | 8.94 | 10.60 | 1.47 | 1.41 | |||||||||||||||||||||||||
| Institutional Class (EKGIX)4 | 7-30-2010 | – | – | – | 10.17 | 9.21 | 10.86 | 1.22 | 1.16 | |||||||||||||||||||||||||
| S&P Developed SmallCap Index5 | – | – | – | – | 8.08 | 7.34 | 10.60 | – | – | |||||||||||||||||||||||||
Figures quoted represent past performance, which is no guarantee of future results, and do not reflect taxes that a shareholder may pay on fund distributions or the redemption of fund shares. Investment return and principal value of an investment will fluctuate so that an investor’s shares, when redeemed, may be worth more or less than their original cost. Performance shown without sales charges would be lower if sales charges were reflected. Current performance may be lower or higher than the performance data quoted, which assumes the reinvestment of dividends and capital gains. Current month-end performance is available on the Fund’s website,wfam.com.
Index returns do not include transaction costs associated with buying and selling securities, any mutual fund fees or expenses, or any taxes. It is not possible to invest directly in an index.
For Class A shares, the maximum front-end sales charge is 5.75%. For Class C shares, the maximum contingent deferred sales charge is 1.00%. Performance including a contingent deferred sales charge assumes the sales charge for the corresponding time period. Administrator Class and Institutional Class shares are sold without a front-end sales charge or contingent deferred sales charge.
Stock values fluctuate in response to the activities of individual companies and general market and economic conditions. Foreign investments are especially volatile and can rise or fall dramatically due to differences in the political and economic conditions of the host country. These risks are generally intensified in emerging markets. The use of derivatives may reduce returns and/or increase volatility. Certain investment strategies tend to increase the total risk of an investment (relative to the broader market). The Fund is exposed to geographic risk and smaller-company securities risk. Consult the Fund’s prospectus for additional information on these and other risks.
Please see footnotes on page 7.
6 | Wells Fargo Global Small Cap Fund
Table of Contents
Performance highlights (unaudited)
| Growth of $10,000 investment as of October 31, 20196 |
|
| ‡ | CFA® and Chartered Financial Analyst® are trademarks owned by CFA Institute. |
| 1 | Historical performance shown prior to July 19, 2010, is based on the performance of the Fund’s predecessor, Evergreen Global Opportunities Fund. |
| 2 | Reflects the expense ratios as stated in the most recent prospectuses, which include the impact of 0.01% in acquired fund fees and expenses. The expense ratios shown are subject to change and may differ from the annualized expense ratios shown in the financial highlights of this report, which do not include acquired fund fees and expenses. |
| 3 | The manager has contractually committed through February 29, 2020, to waive fees and/or reimburse expenses to the extent necessary to cap the expenses of each class after fee waivers at 1.55% for Class A, 2.30% for Class C, 1.40% for Administrator Class, and 1.15% for Institutional Class. Brokerage commissions, stamp duty fees, interest, taxes, acquired fund fees and expenses (if any), and extraordinary expenses are excluded from the expense cap. Prior to or after the commitment expiration date, the cap may be increased or the commitment to maintain the cap may be terminated only with the approval of the Board of Trustees. Without this cap, the Fund’s returns would have been lower. The expense ratio paid by an investor is the net expense ratio (the total annual fund operating expenses after fee waivers) as stated in the prospectuses. |
| 4 | Historical performance shown for Institutional Class shares prior to their inception reflects the performance of Administrator Class shares, and includes the higher expenses applicable to Administrator Class shares. If these expenses had not been included, returns for Institutional Class shares would be higher. |
| 5 | The S&P Developed SmallCap Index is a free-float-adjusted market-capitalization-weighted index designed to measure the equity market performance of small-capitalization companies located in developed markets. The index is composed of companies within the bottom 15% of the cumulative market capitalization in developed markets. The index covers all publicly listed equities with float-adjusted market values of U.S. $100 million or more and annual dollar value traded of at least U.S. $50 million in all included countries. You cannot invest directly in an index. |
| 6 | The chart compares the performance of Class A shares for the most recent ten years with the S&P Developed SmallCap Index. The chart assumes a hypothetical investment of $10,000 in Class A shares and reflects all operating expenses and assumes the maximum initial sales charge of 5.75%. |
| 7 | The ten largest holdings, excluding cash, cash equivalents and any money market funds, are calculated based on the value of the investments divided by total net assets of the Fund. Holdings are subject to change and may have changed since the date specified. |
| 8 | Amounts are calculated based on the total long-term investments of the Fund. These amounts are subject to change and may have changed since the date specified. |
| * | This security was no longer held at the end of the reporting period. |
Wells Fargo Global Small Cap Fund | 7
Table of Contents
Performance highlights (unaudited)
MANAGER’S DISCUSSION
Fund highlights
| ∎ | The Fund outperformed its benchmark, the S&P Developed SmallCap Index, for the 12-month period that ended October 31, 2019. |
| ∎ | Stock selection in the industrials and consumer staples sector contributed to relative performance. |
| ∎ | Geographically, security selection in the U.S., Japan, Europe, and Asia ex-Japan all contributed. Security selection in the U.K. and Canada detracted. |
| ∎ | These gains were partly offset by stock selection in the materials and financials sectors. |
Investors focused on rising trade tensions, central bank policy decisions, Brexit negotiations, and a slowing global economy.
Global equity markets and the S&P Developed SmallCap Index saw increased volatility over the 12-month period but still managed to post a 8.08% return. The fourth quarter of 2018 saw a large sell-off as investors feared that rising trade tensions and central bank policy decisions could lead to a global recession. In 2019, equity markets rallied as central banks across the globe became more accommodative and interest rates declined. Despite the ongoing Brexit negotiations, Europe and the U.K. equity markets were the strongest regions. Information technology (IT) and real estate were the strongest sectors within the index, while energy was by far the worst-performing sector.
During the period, the team made modest changes to sector and regional exposures within the Fund based on our bottom-up reward-to-risk valuation process. As is typical of our process, security selection drove the Fund’s outperformance. As bottom-up investors, we evaluate how global macroeconomic events might affect the Fund’s holdings but we do not try to forecast the outcomes. The Fund’s security selection within the U.S. and Japan proved to be the largest contributors to relative returns. We aim to use market volatility opportunistically. We will seek to use any future volatility to the advantage of our bottom-up stock selection process.
| Ten largest holdings (%) as of October 31, 20197 | ||||
Novanta Incorporated | 2.38 | |||
WD-40 Company | 2.25 | |||
MGE Energy Incorporated | 2.19 | |||
CSW Industrials Incorporated | 2.18 | |||
Central Garden & Pet Company Class A | 2.18 | |||
CBIZ Incorporated | 2.14 | |||
Dine Brands Global Incorporated | 2.01 | |||
Nomad Foods Limited | 2.01 | |||
ACI Worldwide Incorporated | 2.00 | |||
Natus Medical Incorporated | 1.96 | |||
Stock selection in the industrials and consumer staples sectors contributed to relative performance.
In the industrials sector, CSW Industrials, Incorporated (CSWI), is a diversified industrial products and specialty chemical company. We have been attracted to the company’s asset-light model, healthy balance sheet, and strong free cash flow. CSWI has made several small acquisitions to further strengthen and diversify its product offering that produced financial results ahead of investor expectations. We expect CSWI to continue with this strategy and we continue to find its long-term prospects attractive.
Security selection in the consumer staples sector contributed to relative performance. Britvic is a U.K.-based soft drink distributor as well as a manufacturer of proprietary beverages. We have been attracted to the company’s low capital intensity, net cash balance sheet, strong brands, and high free cash flow generation. The company posted strong financial results during the period and may potentially see an inflection in free cash flow as investments made to increase distribution efficiencies take hold.
Stock selection in materials and financials detracted from relative performance.
In the materials sector, Fuji Seal, a Tokyo-based manufacturer and global distributor of shrink labeling products and machines, detracted from relative performance. Fuji’s strength lies in its status as a supplier of both labels and packaging equipment. The stock underperformed during the period primarily due to rising input costs. However, our long-term thesis remains intact and we believe the company should continue to use its strong balance sheet to find accretive opportunities to deploy capital and return cash to shareholders.
Westwood Holdings Group (WHG)* is a U.S.-based asset manager. WHG has been subject to many of the headwinds facing active managers as passive investing continues to pressure assets under management and fees. We feel WHG has the track
Please see footnotes on page 7.
8 | Wells Fargo Global Small Cap Fund
Table of Contents
Performance highlights (unaudited)
record and management in place to withstand these pressures and create shareholder value over the long term. WHG also offers a very attractive dividend yield, providing some additional downside protection.
| Sector distribution as of October 31, 20198 |
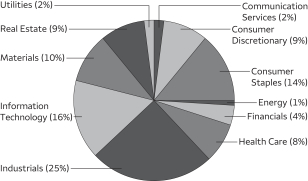 |
| Country allocation as of October 31, 20198 |
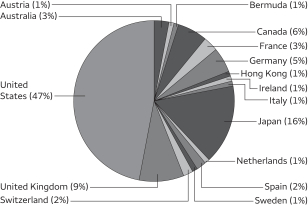 |
Our investment philosophy focuses on company-specific factors rather than on headline-dominating macroeconomic events.
As we look toward the end of 2019 and beyond, we see numerous market forces at play that could bring further volatility. Market participants continue to watch the pace of global economic growth, central bank policy, and trade conflicts. We are not experts in forecasting macro or political events. However, we believe it is always prudent to protect downside risks and be opportunistic when short-term macro or political events create valuation dislocations from a company’s long-term fundamentals.
We believe our fundamental analysis, risk management, and active investment process are well suited to take advantage of new opportunities as the equity market evolves. While volatility may increase, we believe the strong balance sheets and stable cash flow of the companies in our portfolio should support consistent long-term performance.
Please see footnotes on page 7.
Wells Fargo Global Small Cap Fund | 9
Table of Contents
As a shareholder of the Fund, you incur two types of costs: (1) transaction costs, including sales charges (loads) on purchase payments and contingent deferred sales charges (if any) on redemptions and (2) ongoing costs, including management fees, distribution (12b-1) and/or shareholder servicing fees, and other Fund expenses. This example is intended to help you understand your ongoing costs (in dollars) of investing in the Fund and to compare these costs with the ongoing costs of investing in other mutual funds.
The example is based on an investment of $1,000 invested at the beginning of the six-month period and held for the entire period from May 1, 2019 to October 31, 2019.
Actual expenses
The “Actual” line of the table below provides information about actual account values and actual expenses. You may use the information in this line, together with the amount you invested, to estimate the expenses that you paid over the period. Simply divide your account value by $1,000 (for example, an $8,600 account value divided by $1,000 = 8.6), then multiply the result by the number in the “Actual” line under the heading entitled “Expenses paid during period” for your applicable class of shares to estimate the expenses you paid on your account during this period.
Hypothetical example for comparison purposes
The “Hypothetical” line of the table below provides information about hypothetical account values and hypothetical expenses based on the Fund’s actual expense ratio and an assumed rate of return of 5% per year before expenses, which is not the Fund’s actual return. The hypothetical account values and expenses may not be used to estimate the actual ending account balance or expenses you paid for the period. You may use this information to compare the ongoing costs of investing in the Fund and other funds. To do so, compare this 5% hypothetical example with the 5% hypothetical examples that appear in the shareholder reports of the other funds.
Please note that the expenses shown in the table are meant to highlight your ongoing costs only and do not reflect any transactional costs, such as sales charges (loads) and contingent deferred sales charges. Therefore, the “Hypothetical” line of the table is useful in comparing ongoing costs only and will not help you determine the relative total costs of owning different funds. In addition, if these transactional costs were included, your costs would have been higher.
Beginning account value 5-1-2019 | Ending account value 10-31-2019 | Expenses paid during the period¹ | Annualized net expense ratio | |||||||||||||
Class A | ||||||||||||||||
Actual | $ | 1,000.00 | $ | 1,008.07 | $ | 7.74 | 1.53 | % | ||||||||
Hypothetical (5% return before expenses) | $ | 1,000.00 | $ | 1,017.49 | $ | 7.78 | 1.53 | % | ||||||||
Class C | ||||||||||||||||
Actual | $ | 1,000.00 | $ | 1,004.14 | $ | 11.52 | 2.28 | % | ||||||||
Hypothetical (5% return before expenses) | $ | 1,000.00 | $ | 1,013.71 | $ | 11.57 | 2.28 | % | ||||||||
Administrator Class | ||||||||||||||||
Actual | $ | 1,000.00 | $ | 1,008.88 | $ | 7.09 | 1.40 | % | ||||||||
Hypothetical (5% return before expenses) | $ | 1,000.00 | $ | 1,018.15 | $ | 7.12 | 1.40 | % | ||||||||
Institutional Class | ||||||||||||||||
Actual | $ | 1,000.00 | $ | 1,010.12 | $ | 5.83 | 1.15 | % | ||||||||
Hypothetical (5% return before expenses) | $ | 1,000.00 | $ | 1,019.41 | $ | 5.85 | 1.15 | % | ||||||||
| 1 | Expenses paid is equal to the annualized net expense ratio of each class multiplied by the average account value over the period, multiplied by the number of days in the most recent fiscal half-year divided by the number of days in the fiscal year (to reflect the one-half-year period). |
10 | Wells Fargo Global Small Cap Fund
Table of Contents
Portfolio of investments—October 31, 2019
| Shares | Value | |||||||||||||||
| Common Stocks: 94.23% | ||||||||||||||||
| Australia: 3.04% | ||||||||||||||||
Ansell Limited (Health Care, Health Care Equipment & Supplies) | 230,805 | $ | 4,391,310 | |||||||||||||
Domino’s Pizza Enterprises Limited (Consumer Discretionary, Hotels, Restaurants & Leisure) | 114,882 | 4,039,681 | ||||||||||||||
| 8,430,991 | ||||||||||||||||
|
| |||||||||||||||
| Austria: 0.51% | ||||||||||||||||
Mayr-Melnhof Karton AG (Materials, Containers & Packaging) | 11,645 | 1,431,241 | ||||||||||||||
|
| |||||||||||||||
| Bermuda: 1.16% | ||||||||||||||||
Third Point Reinsurance Limited (Financials, Insurance) † | 339,996 | 3,226,562 | ||||||||||||||
|
| |||||||||||||||
| Canada: 5.87% | ||||||||||||||||
BlackBerry Limited TSX (Information Technology, Software) † | 109,000 | 572,682 | ||||||||||||||
BlackBerry Limited NYSE (Information Technology, Software) †« | 296,827 | 1,561,310 | ||||||||||||||
Cott Corporation (Consumer Staples, Beverages) | 205,735 | 2,642,955 | ||||||||||||||
Enerflex Limited (Energy, Energy Equipment & Services) | 67,800 | 531,240 | ||||||||||||||
MTY Food Group Incorporated (Consumer Discretionary, Hotels, Restaurants & Leisure) | 4,800 | 191,767 | ||||||||||||||
Mullen Group Limited (Industrials, Road & Rail) | 175,991 | 1,095,685 | ||||||||||||||
Novanta Incorporated (Information Technology, Electronic Equipment, Instruments & Components) † | 74,219 | 6,609,202 | ||||||||||||||
Stantec Incorporated (Industrials, Professional Services) | 100,200 | 2,137,742 | ||||||||||||||
Western Forest Products Incorporated (Materials, Paper & Forest Products) « | 972,117 | 959,496 | ||||||||||||||
| 16,302,079 | ||||||||||||||||
|
| |||||||||||||||
| France: 3.46% | ||||||||||||||||
Alten SA (Information Technology, IT Services) | 35,965 | 3,949,002 | ||||||||||||||
M6 Métropole Télévision SA (Communication Services, Media) | 217,922 | 3,832,872 | ||||||||||||||
Mersen SA (Industrials, Electrical Equipment) | 41,892 | 1,361,950 | ||||||||||||||
Vicat SA (Materials, Construction Materials) | 10,857 | 460,135 | ||||||||||||||
| 9,603,959 | ||||||||||||||||
|
| |||||||||||||||
| Germany: 4.53% | ||||||||||||||||
Cancom SE (Information Technology, IT Services) | 22,587 | 1,205,151 | ||||||||||||||
Gerresheimer AG (Health Care, Life Sciences Tools & Services) | 38,528 | 3,104,602 | ||||||||||||||
Krones AG (Industrials, Machinery) « | 22,394 | 1,464,844 | ||||||||||||||
SMA Solar Technology AG (Information Technology, Semiconductors & Semiconductor Equipment) †« | 46,399 | 1,450,001 | ||||||||||||||
TAG Immobilien AG (Real Estate, Real Estate Management & Development) | 118,576 | 2,880,357 | ||||||||||||||
TLG Immobilien AG (Real Estate, Real Estate Management & Development) | 84,930 | 2,486,463 | ||||||||||||||
| 12,591,418 | ||||||||||||||||
|
| |||||||||||||||
| Hong Kong: 1.14% | ||||||||||||||||
Sunlight REIT (Real Estate, Equity REITs) | 4,647,000 | 3,154,951 | ||||||||||||||
|
| |||||||||||||||
| Ireland: 0.69% | ||||||||||||||||
Irish Residential Properties REIT plc (Real Estate, Equity REITs) | 979,188 | 1,917,707 | ||||||||||||||
|
| |||||||||||||||
| Italy: 1.40% | ||||||||||||||||
Autogrill SpA (Consumer Discretionary, Hotels, Restaurants & Leisure) | 75,735 | 747,957 | ||||||||||||||
De’Longhi SpA (Consumer Discretionary, Household Durables) | 93,712 | 1,724,530 | ||||||||||||||
Interpump Group SpA (Industrials, Machinery) | 51,589 | 1,413,114 | ||||||||||||||
| 3,885,601 | ||||||||||||||||
|
| |||||||||||||||
| Japan: 15.10% | ||||||||||||||||
Aeon Delight Company Limited (Industrials, Commercial Services & Supplies) | 115,400 | 4,039,374 | ||||||||||||||
Daiseki Company Limited (Industrials, Commercial Services & Supplies) | 91,700 | 2,696,060 | ||||||||||||||
DTS Corporation (Information Technology, IT Services) | 160,000 | 3,415,131 | ||||||||||||||
The accompanying notes are an integral part of these financial statements.
Wells Fargo Global Small Cap Fund | 11
Table of Contents
Portfolio of investments—October 31, 2019
| Shares | Value | |||||||||||||||
| Japan (continued) | ||||||||||||||||
Fuji Seal International Incorporated (Materials, Containers & Packaging) | 124,400 | $ | 3,110,288 | |||||||||||||
Horiba Limited (Information Technology, Electronic Equipment, Instruments & Components) | 43,200 | 2,952,273 | ||||||||||||||
Kyushu Railway Company (Industrials, Road & Rail) | 43,400 | 1,438,763 | ||||||||||||||
Meitec Corporation (Industrials, Professional Services) | 79,400 | 4,168,886 | ||||||||||||||
Nihon Parkerizing Company Limited (Materials, Chemicals) | 305,600 | 3,630,751 | ||||||||||||||
ORIX JREIT Incorporated (Real Estate, Equity REITs) | 1,926 | 4,358,870 | ||||||||||||||
OSG Corporation (Industrials, Machinery) | 52,800 | 1,142,639 | ||||||||||||||
Paramount Bed Holdings Company Limited (Health Care, Health Care Equipment & Supplies) | 43,400 | 1,677,887 | ||||||||||||||
San-A Company Limited (Consumer Staples, Food & Staples Retailing) | 54,700 | 2,603,556 | ||||||||||||||
Sumitomo Warehouse Company Limited (Industrials, Transportation Infrastructure) | 196,600 | 2,687,115 | ||||||||||||||
Taikisha Limited (Industrials, Construction & Engineering) | 81,600 | 2,663,580 | ||||||||||||||
Toyo Suisan Kaisha Limited (Consumer Staples, Food Products) | 32,200 | 1,359,681 | ||||||||||||||
| 41,944,854 | ||||||||||||||||
|
| |||||||||||||||
| Netherlands: 0.81% | ||||||||||||||||
Brunel International NV (Industrials, Professional Services) « | 101,593 | 938,179 | ||||||||||||||
IMCD Group NV (Industrials, Trading Companies & Distributors) | 16,772 | 1,307,536 | ||||||||||||||
| 2,245,715 | ||||||||||||||||
|
| |||||||||||||||
| Spain: 1.62% | ||||||||||||||||
Vidrala SA (Materials, Containers & Packaging) | 11,189 | 972,121 | ||||||||||||||
Viscofan SA (Consumer Staples, Food Products) | 64,916 | 3,517,231 | ||||||||||||||
| 4,489,352 | ||||||||||||||||
|
| |||||||||||||||
| Sweden: 0.81% | ||||||||||||||||
AAK AB (Consumer Staples, Food Products) | 43,783 | 775,839 | ||||||||||||||
Hexpol AB (Materials, Chemicals) | 166,479 | 1,482,771 | ||||||||||||||
| 2,258,610 | ||||||||||||||||
|
| |||||||||||||||
| Switzerland: 1.83% | ||||||||||||||||
Bossard Holding AG (Industrials, Trading Companies & Distributors) | 6,663 | 1,057,029 | ||||||||||||||
Bucher Industries AG (Industrials, Machinery) | 5,567 | 1,718,914 | ||||||||||||||
Dufry Group (Consumer Discretionary, Specialty Retail) | 9,525 | 826,305 | ||||||||||||||
OC Oerlikon Corporation AG (Industrials, Machinery) | 145,025 | 1,484,797 | ||||||||||||||
| 5,087,045 | ||||||||||||||||
|
| |||||||||||||||
| United Kingdom: 8.34% | ||||||||||||||||
Britvic plc (Consumer Staples, Beverages) | 292,697 | 3,742,162 | ||||||||||||||
Domino’s Pizza Group plc (Consumer Discretionary, Hotels, Restaurants & Leisure) « | 845,523 | 3,131,315 | ||||||||||||||
Elementis plc (Materials, Chemicals) | 728,673 | 1,403,559 | ||||||||||||||
Hunting plc (Energy, Energy Equipment & Services) | 144,279 | 734,484 | ||||||||||||||
Mears Group plc (Industrials, Commercial Services & Supplies) | 202,055 | 667,416 | ||||||||||||||
Morgan Advanced Materials plc (Industrials, Machinery) | 539,641 | 1,646,900 | ||||||||||||||
NCC Group plc (Information Technology, IT Services) | 730,820 | 1,774,056 | ||||||||||||||
Nomad Foods Limited (Consumer Staples, Food Products) † | 286,765 | 5,594,785 | ||||||||||||||
Savills plc (Real Estate, Real Estate Management & Development) | 111,473 | 1,324,839 | ||||||||||||||
Spectris plc (Information Technology, Electronic Equipment, Instruments & Components) | 87,436 | 2,709,185 | ||||||||||||||
Vesuvius plc (Industrials, Machinery) | 82,054 | 424,517 | ||||||||||||||
| 23,153,217 | ||||||||||||||||
|
| |||||||||||||||
| United States: 43.92% | ||||||||||||||||
ACI Worldwide Incorporated (Information Technology, Software) † | 176,600 | 5,543,473 | ||||||||||||||
Bottomline Technologies (DE) Incorporated (Information Technology, Software) † | 75,000 | 3,071,250 | ||||||||||||||
CBIZ Incorporated (Industrials, Professional Services) † | 216,739 | 5,932,146 | ||||||||||||||
The accompanying notes are an integral part of these financial statements.
12 | Wells Fargo Global Small Cap Fund
Table of Contents
Portfolio of investments—October 31, 2019
| Shares | Value | |||||||||||||||
| United States (continued) | ||||||||||||||||
Central Garden & Pet Company Class A (Consumer Staples, Household Products) † |
| 213,724 | $ | 6,044,115 | ||||||||||||
Continental Building Product (Industrials, Building Products) † | 59,016 | 1,765,169 | ||||||||||||||
CSW Industrials Incorporated (Industrials, Building Products) | 87,362 | 6,047,198 | ||||||||||||||
CyberArk Software Limited (Information Technology, Software) † | 25,300 | 2,569,974 | ||||||||||||||
Dine Brands Global Incorporated (Consumer Discretionary, Hotels, Restaurants & Leisure) |
| 76,250 | 5,577,688 | |||||||||||||
Forward Air Corporation (Industrials, Air Freight & Logistics) | 65,700 | 4,544,469 | ||||||||||||||
Gibraltar Industries Incorporated (Industrials, Building Products) † | 82,500 | 4,391,475 | ||||||||||||||
Healthcare Services Group Incorporated (Industrials, Commercial Services & Supplies) « |
| 97,000 | 2,362,920 | |||||||||||||
Horace Mann Educators Corporation (Financials, Insurance) | 82,000 | 3,571,920 | ||||||||||||||
Hostess Brands Incorporated (Consumer Staples, Food Products) † | 410,100 | 5,241,078 | ||||||||||||||
ICU Medical Incorporated (Health Care, Health Care Equipment & Supplies) † | 21,200 | 3,426,132 | ||||||||||||||
Innospec Incorporated (Materials, Chemicals) | 54,071 | 4,939,927 | ||||||||||||||
Innoviva Incorporated (Health Care, Pharmaceuticals) † | 195,987 | 2,277,369 | ||||||||||||||
Jack in the Box Incorporated (Consumer Discretionary, Hotels, Restaurants & Leisure) | 55,070 | 4,626,981 | ||||||||||||||
LogMeIn Incorporated (Information Technology, Software) | 13,800 | 906,384 | ||||||||||||||
Mayville Engineering Company Incorporated (Materials, Metals & Mining) † | 461,000 | 3,941,550 | ||||||||||||||
MGE Energy Incorporated (Utilities, Electric Utilities) | 78,992 | 6,085,544 | ||||||||||||||
Movado Group Incorporated (Consumer Discretionary, Textiles, Apparel & Luxury Goods) |
| 91,100 | 2,373,155 | |||||||||||||
National Western Life Group Class A (Financials, Insurance) | 13,207 | 3,600,228 | ||||||||||||||
Natus Medical Incorporated (Health Care, Health Care Equipment & Supplies) † |
| 162,000 | 5,456,160 | |||||||||||||
Retail Value Incorporated (Real Estate, Equity REITs) | 109,552 | 4,010,699 | ||||||||||||||
Standex International Corporation (Industrials, Machinery) | 22,351 | 1,693,759 | ||||||||||||||
Stepan Company (Materials, Chemicals) | 49,400 | 4,827,368 | ||||||||||||||
The Brink’s Company (Industrials, Commercial Services & Supplies) | 26,600 | 2,259,936 | ||||||||||||||
Virtusa Corporation (Information Technology, IT Services) † | 73,119 | 2,725,876 | ||||||||||||||
WD-40 Company (Consumer Staples, Household Products) | 33,300 | 6,240,420 | ||||||||||||||
Weingarten Realty Investors (Real Estate, Equity REITs) | 116,000 | 3,680,680 | ||||||||||||||
WPX Energy Incorporated (Energy, Oil, Gas & Consumable Fuels) † | 224,100 | 2,236,518 | ||||||||||||||
| 121,971,561 | ||||||||||||||||
|
| |||||||||||||||
Total Common Stocks (Cost $232,931,248) | 261,694,863 | |||||||||||||||
|
| |||||||||||||||
| Yield | ||||||||||||||||
| Short-Term Investments: 8.74% | ||||||||||||||||
| Investment Companies: 8.74% | ||||||||||||||||
Securities Lending Cash Investments LLC (l)(r)(u) | 1.99 | % | 9,479,729 | 9,480,677 | ||||||||||||
Wells Fargo Government Money Market Fund Select Class (I)(u) | 1.75 | 14,798,744 | 14,798,744 | |||||||||||||
Total Short-Term Investments (Cost $24,279,576) |
| 24,279,421 | ||||||||||||||
|
| |||||||||||||||
| Total investments in securities (Cost $257,210,824) | 102.97 | % | 285,974,284 | |||||
Other assets and liabilities, net | (2.97 | ) | (8,261,851 | ) | ||||
|
|
|
| |||||
| Total net assets | 100.00 | % | $ | 277,712,433 | ||||
|
|
|
| |||||
| † | Non-income-earning security |
| « | All portion of this security is on loan. |
| (l) | The issuer of the security is an affiliated person of the Fund as defined in the Investment Company Act of 1940. |
| (r) | The investment is a non-registered investment company purchased with cash collateral received from securities on loan. |
| (u) | The rate represents the 7-day annualized yield at period end. |
Abbreviations:
| REIT | Real estate investment trust |
The accompanying notes are an integral part of these financial statements.
Wells Fargo Global Small Cap Fund | 13
Table of Contents
Portfolio of investments—October 31, 2019
Investments in Affiliates
An affiliated investment is an investment in which the Fund owns at least 5% of the outstanding voting shares of the issuer or as a result of other relationships, such as the Fund and the issuer having the same investment manager. Transactions with issuers that were either affiliated persons of the Fund at the beginning of the period or the end of the period were as follows:
| Shares, beginning of period | Shares purchased | Shares sold | Shares, end of period | Net realized gains (losses) | Net change in unrealized gains (losses) | Income from affiliated securities | Value, end of period | % of net assets | ||||||||||||||||||||||||||||
| Short-Term Invesstments | ||||||||||||||||||||||||||||||||||||
Investment Companies | ||||||||||||||||||||||||||||||||||||
Securities Lending Cash Investments LLC | 2,683,969 | 124,168,333 | 117,372,573 | 9,479,729 | $ | (817 | ) | $ | (155 | ) | $ | 153,151 | # | $ | 9,480,677 | |||||||||||||||||||||
Wells Fargo Government Money Market Fund Select Class | 16,091,244 | 130,714,312 | 132,006,812 | 14,798,744 | 0 | 0 | 373,761 | 14,798,744 | ||||||||||||||||||||||||||||
|
|
|
|
|
|
|
|
|
| |||||||||||||||||||||||||||
| $ | (817 | ) | $ | (155 | ) | $ | 526,912 | $ | 24,279,421 | 8.74 | % | |||||||||||||||||||||||||
|
|
|
|
|
|
|
|
|
| |||||||||||||||||||||||||||
| # | Amount shown represents income before fees and rebates. |
The accompanying notes are an integral part of these financial statements.
14 | Wells Fargo Global Small Cap Fund
Table of Contents
Statement of assets and liabilities—October 31, 2019
Assets | ||||
Investments in unaffiliated securities (including $9,020,431 of securities loaned), at value (cost $232,931,248) | $ | 261,694,863 | ||
Investments in affiliated securities, at value (cost $24,279,576) | 24,279,421 | |||
Foreign currency, at value (cost $49,791) | 50,216 | |||
Receivable for investments sold | 2,015,717 | |||
Receivable for Fund shares sold | 270,903 | |||
Receivable for dividends | 508,857 | |||
Receivable for securities lending income, net | 4,684 | |||
Prepaid expenses and other assets | 14,828 | |||
|
| |||
Total assets | 288,839,489 | |||
|
| |||
Liabilities | ||||
Payable upon receipt of securities loaned | 9,477,928 | |||
Payable for investments purchased | 925,461 | |||
Payable for Fund shares redeemed | 286,982 | |||
Management fee payable | 213,444 | |||
Administration fees payable | 39,995 | |||
Distribution fee payable | 4,802 | |||
Trustees’ fees and expenses payable | 3,914 | |||
Accrued expenses and other liabilities | 174,530 | |||
|
| |||
Total liabilities | 11,127,056 | |||
|
| |||
Total net assets | $ | 277,712,433 | ||
|
| |||
Net assets consist of | ||||
Paid-in capital | $ | 240,974,122 | ||
Total distributable earnings | 36,738,311 | |||
|
| |||
Total net assets | $ | 277,712,433 | ||
|
| |||
Computation of net asset value and offering price per share | ||||
Net assets – Class A | $ | 141,388,428 | ||
Shares outstanding – Class A1 | 3,537,688 | |||
Net asset value per share – Class A | $39.97 | |||
Maximum offering price per share – Class A2 | $42.41 | |||
Net assets – Class C | $ | 7,566,845 | ||
Shares outstanding – Class C1 | 283,617 | |||
Net asset value per share – Class C | $26.68 | |||
Net assets – Administrator Class | $ | 24,746,123 | ||
Shares outstanding – Administrator Class1 | 588,421 | |||
Net asset value per share – Administrator Class | $42.06 | |||
Net assets – Institutional Class | $ | 104,011,037 | ||
Shares outstanding – Institutional Class1 | 2,481,218 | |||
Net asset value per share – Institutional Class | $41.92 | |||
| 1 | The Fund has an unlimited number of authorized shares. |
| 2 | Maximum offering price is computed as 100/94.25 of net asset value. On investments of $50,000 or more, the offering price is reduced. |
The accompanying notes are an integral part of these financial statements.
Wells Fargo Global Small Cap Fund | 15
Table of Contents
Statement of operations—year ended October 31, 2019
Investment income | ||||
Dividends (net of foreign withholding taxes of $312,936) | $ | 5,306,670 | ||
Income from affiliated securities | 491,530 | |||
|
| |||
Total investment income | 5,798,200 | |||
|
| |||
Expenses | ||||
Management fee | 2,739,160 | |||
Administration fees | ||||
Class A | 293,340 | |||
Class C | 27,126 | |||
Administrator Class | 35,407 | |||
Institutional Class | 141,042 | |||
Shareholder servicing fees | ||||
Class A | 349,214 | |||
Class C | 32,293 | |||
Administrator Class | 68,090 | |||
Distribution fee | ||||
Class C | 96,868 | |||
Custody and accounting fees | 109,456 | |||
Professional fees | 52,702 | |||
Registration fees | 85,195 | |||
Shareholder report expenses | 55,845 | |||
Trustees’ fees and expenses | 21,672 | |||
Other fees and expenses | 25,741 | |||
|
| |||
Total expenses | 4,133,151 | |||
Less: Fee waivers and/or expense reimbursements | ||||
Class A | (3 | ) | ||
Administrator Class | (14,026 | ) | ||
Institutional Class | (55,726 | ) | ||
|
| |||
Net expenses | 4,063,396 | |||
|
| |||
Net investment income | 1,734,804 | |||
|
| |||
Realized and unrealized gains (losses) on investments | ||||
Net realized gains (losses) on | ||||
Unaffiliated securities | 8,228,171 | |||
Affiliated securities | (817 | ) | ||
|
| |||
Net realized gains on investments | 8,227,354 | |||
|
| |||
Net change in unrealized gains (losses) on | ||||
Unaffiliated securities | 16,847,850 | |||
Affiliated securities | (155 | ) | ||
|
| |||
Net change in unrealized gains on investments | 16,847,695 | |||
|
| |||
Net realized and unrealized gains (losses) on investments | 25,075,049 | |||
|
| |||
Net increase in net assets resulting from operations | $ | 26,809,853 | ||
|
| |||
The accompanying notes are an integral part of these financial statements.
16 | Wells Fargo Global Small Cap Fund
Table of Contents
Statement of changes in net assets
| Year ended October 31, 2019 | Year ended October 31, 2018 | |||||||||||||||
Operations | ||||||||||||||||
Net investment income | $ | 1,734,804 | $ | 619,416 | ||||||||||||
Net realized gains on investments | 8,227,354 | 26,019,319 | ||||||||||||||
Net change in unrealized gains (losses) on investments | 16,847,695 | (35,532,667 | ) | |||||||||||||
|
| |||||||||||||||
Net increase (decrease) in net assets resulting from operations | 26,809,853 | (8,893,932 | ) | |||||||||||||
|
| |||||||||||||||
Distributions to shareholders from net investment income and net realized gains |
| |||||||||||||||
Class A | (11,274,268 | ) | (17,602,533 | ) | ||||||||||||
Class C | (3,147,113 | ) | (4,638,012 | ) | ||||||||||||
Administrator Class | (2,341,670 | ) | (3,376,252 | ) | ||||||||||||
Institutional Class | (9,652,016 | ) | (4,852,851 | ) | ||||||||||||
|
| |||||||||||||||
Total distributions to shareholders | (26,415,067 | ) | (30,469,648 | ) | ||||||||||||
|
| |||||||||||||||
Capital share transactions | Shares | Shares | ||||||||||||||
Proceeds from shares sold | ||||||||||||||||
Class A | 576,819 | 21,721,631 | 233,179 | 10,125,839 | ||||||||||||
Class C | 51,591 | 1,282,247 | 90,405 | 2,760,784 | ||||||||||||
Administrator Class | 84,145 | 3,339,231 | 126,648 | 5,751,220 | ||||||||||||
Institutional Class | 582,827 | 22,915,443 | 2,462,395 | 110,967,613 | ||||||||||||
|
| |||||||||||||||
| 49,258,552 | 129,605,456 | |||||||||||||||
|
| |||||||||||||||
Reinvestment of distributions | ||||||||||||||||
Class A | 292,824 | 10,332,358 | 383,761 | 16,051,908 | ||||||||||||
Class C | 129,340 | 3,066,652 | 151,690 | 4,452,102 | ||||||||||||
Administrator Class | 62,335 | 2,314,119 | 75,455 | 3,309,823 | ||||||||||||
Institutional Class | 244,000 | 9,022,788 | 103,060 | 4,511,956 | ||||||||||||
|
| |||||||||||||||
| 24,735,917 | 28,325,789 | |||||||||||||||
|
| |||||||||||||||
Payment for shares redeemed | ||||||||||||||||
Class A | (657,034 | ) | (25,025,424 | ) | (693,625 | ) | (29,950,836 | ) | ||||||||
Class C | (831,182 | ) | (20,927,562 | ) | (243,976 | ) | (7,443,741 | ) | ||||||||
Administrator Class | (225,448 | ) | (9,166,433 | ) | (169,400 | ) | (7,661,211 | ) | ||||||||
Institutional Class | (1,183,246 | ) | (47,220,970 | ) | (589,541 | ) | (26,577,364 | ) | ||||||||
|
| |||||||||||||||
| (102,340,389 | ) | (71,633,152 | ) | |||||||||||||
|
| |||||||||||||||
Net increase (decrease) in net assets resulting from capital share transactions | (28,345,920 | ) | 86,298,093 | |||||||||||||
|
| |||||||||||||||
Total increase (decrease) in net assets | (27,951,134 | ) | 46,934,513 | |||||||||||||
|
| |||||||||||||||
Net assets | ||||||||||||||||
Beginning of period | 305,663,567 | 258,729,054 | ||||||||||||||
|
| |||||||||||||||
End of period | $ | 277,712,433 | $ | 305,663,567 | ||||||||||||
|
| |||||||||||||||
The accompanying notes are an integral part of these financial statements.
Wells Fargo Global Small Cap Fund | 17
Table of Contents
(For a share outstanding throughout each period)
| Year ended October 31 | ||||||||||||||||||||
| CLASS A | 2019 | 2018 | 2017 | 2016 | 2015 | |||||||||||||||
Net asset value, beginning of period | $39.97 | $45.81 | $38.61 | $37.23 | $43.26 | |||||||||||||||
Net investment income | 0.18 | 1 | 0.10 | 0.21 | 1 | 0.26 | 1 | 0.10 | 1 | |||||||||||
Net realized and unrealized gains (losses) on investments | 3.26 | (0.72 | ) | 9.68 | 2.92 | 0.64 | ||||||||||||||
|
|
|
|
|
|
|
|
|
| |||||||||||
Total from investment operations | 3.44 | (0.62 | ) | 9.89 | 3.18 | 0.74 | ||||||||||||||
Distributions to shareholders from | ||||||||||||||||||||
Net investment income | (0.03 | ) | (0.22 | ) | (0.34 | ) | (0.21 | ) | (0.03 | ) | ||||||||||
Net realized gains | (3.41 | ) | (5.00 | ) | (2.35 | ) | (1.59 | ) | (6.74 | ) | ||||||||||
|
|
|
|
|
|
|
|
|
| |||||||||||
Total distributions to shareholders | (3.44 | ) | (5.22 | ) | (2.69 | ) | (1.80 | ) | (6.77 | ) | ||||||||||
Net asset value, end of period | $39.97 | $39.97 | $45.81 | $38.61 | $37.23 | |||||||||||||||
Total return2 | 9.75 | % | (1.82 | )% | 26.90 | % | 9.12 | % | 2.12 | % | ||||||||||
Ratios to average net assets (annualized) | ||||||||||||||||||||
Gross expenses | 1.53 | % | 1.54 | % | 1.54 | % | 1.55 | % | 1.57 | % | ||||||||||
Net expenses | 1.53 | % | 1.54 | % | 1.54 | % | 1.55 | % | 1.55 | % | ||||||||||
Net investment income | 0.47 | % | 0.16 | % | 0.52 | % | 0.73 | % | 0.27 | % | ||||||||||
Supplemental data | ||||||||||||||||||||
Portfolio turnover rate | 62 | % | 51 | % | 70 | % | 70 | % | 42 | % | ||||||||||
Net assets, end of period (000s omitted) | $141,388 | $132,906 | $155,828 | $138,805 | $151,740 | |||||||||||||||
| 1 | Calculated based upon average shares outstanding |
| 2 | Total return calculations do not include any sales charges. |
The accompanying notes are an integral part of these financial statements.
18 | Wells Fargo Global Small Cap Fund
Table of Contents
Financial highlights
(For a share outstanding throughout each period)
| Year ended October 31 | ||||||||||||||||||||
| CLASS C | 2019 | 2018 | 2017 | 2016 | 2015 | |||||||||||||||
Net asset value, beginning of period | $28.02 | $33.65 | $28.98 | $28.39 | $34.80 | |||||||||||||||
Net investment loss | (0.07 | )1 | (0.20 | ) | (0.06 | )1 | (0.01 | )1 | (0.14 | )1 | ||||||||||
Net realized and unrealized gains (losses) on investments | 2.14 | (0.43 | ) | 7.15 | 2.19 | 0.47 | ||||||||||||||
|
|
|
|
|
|
|
|
|
| |||||||||||
Total from investment operations | 2.07 | (0.63 | ) | 7.09 | 2.18 | 0.33 | ||||||||||||||
Distributions to shareholders from | ||||||||||||||||||||
Net investment income | 0.00 | 0.00 | (0.07 | ) | 0.00 | 0.00 | ||||||||||||||
Net realized gains | (3.41 | ) | (5.00 | ) | (2.35 | ) | (1.59 | ) | (6.74 | ) | ||||||||||
|
|
|
|
|
|
|
|
|
| |||||||||||
Total distributions to shareholders | (3.41 | ) | (5.00 | ) | (2.42 | ) | (1.59 | ) | (6.74 | ) | ||||||||||
Net asset value, end of period | $26.68 | $28.02 | $33.65 | $28.98 | $28.39 | |||||||||||||||
Total return2 | 8.90 | % | (2.56 | )% | 25.95 | % | 8.31 | % | 1.34 | % | ||||||||||
Ratios to average net assets (annualized) | ||||||||||||||||||||
Gross expenses | 2.28 | % | 2.29 | % | 2.29 | % | 2.30 | % | 2.32 | % | ||||||||||
Net expenses | 2.28 | % | 2.29 | % | 2.29 | % | 2.30 | % | 2.30 | % | ||||||||||
Net investment loss | (0.26 | )% | (0.59 | )% | (0.20 | )% | (0.02 | )% | (0.48 | )% | ||||||||||
Supplemental data | ||||||||||||||||||||
Portfolio turnover rate | 62 | % | 51 | % | 70 | % | 70 | % | 42 | % | ||||||||||
Net assets, end of period (000s omitted) | $7,567 | $26,167 | $31,487 | $32,863 | $36,215 | |||||||||||||||
| 1 | Calculated based upon average shares outstanding |
| 2 | Total return calculations do not include any sales charges. |
The accompanying notes are an integral part of these financial statements.
Wells Fargo Global Small Cap Fund | 19
Table of Contents
Financial highlights
(For a share outstanding throughout each period)
| Year ended October 31 | ||||||||||||||||||||
| ADMINISTRATOR CLASS | 2019 | 2018 | 2017 | 2016 | 2015 | |||||||||||||||
Net asset value, beginning of period | $41.90 | $47.78 | $40.15 | $38.65 | $44.60 | |||||||||||||||
Net investment income | 0.25 | 1 | 0.14 | 1 | 0.29 | 1 | 0.41 | 0.16 | 1 | |||||||||||
Net realized and unrealized gains (losses) on investments | 3.42 | (0.73 | ) | 10.07 | 2.95 | 0.66 | ||||||||||||||
|
|
|
|
|
|
|
|
|
| |||||||||||
Total from investment operations | 3.67 | (0.59 | ) | 10.36 | 3.36 | 0.82 | ||||||||||||||
Distributions to shareholders from | ||||||||||||||||||||
Net investment income | (0.10 | ) | (0.29 | ) | (0.38 | ) | (0.27 | ) | (0.03 | ) | ||||||||||
Net realized gains | (3.41 | ) | (5.00 | ) | (2.35 | ) | (1.59 | ) | (6.74 | ) | ||||||||||
|
|
|
|
|
|
|
|
|
| |||||||||||
Total distributions to shareholders | (3.51 | ) | (5.29 | ) | (2.73 | ) | (1.86 | ) | (6.77 | ) | ||||||||||
Net asset value, end of period | $42.06 | $41.90 | $47.78 | $40.15 | $38.65 | |||||||||||||||
Total return | 9.90 | % | (1.68 | )% | 27.04 | % | 9.30 | % | 2.27 | % | ||||||||||
Ratios to average net assets (annualized) | ||||||||||||||||||||
Gross expenses | 1.45 | % | 1.46 | % | 1.46 | % | 1.47 | % | 1.43 | % | ||||||||||
Net expenses | 1.40 | % | 1.40 | % | 1.40 | % | 1.40 | % | 1.40 | % | ||||||||||
Net investment income | 0.63 | % | 0.30 | % | 0.68 | % | 0.90 | % | 0.41 | % | ||||||||||
Supplemental data | ||||||||||||||||||||
Portfolio turnover rate | 62 | % | 51 | % | 70 | % | 70 | % | 42 | % | ||||||||||
Net assets, end of period (000s omitted) | $24,746 | $27,965 | $30,327 | $30,832 | $31,765 | |||||||||||||||
| 1 | Calculated based upon average shares outstanding |
The accompanying notes are an integral part of these financial statements.
20 | Wells Fargo Global Small Cap Fund
Table of Contents
Financial highlights
(For a share outstanding throughout each period)
| Year ended October 31 | ||||||||||||||||||||
| INSTITUTIONAL CLASS | 2019 | 2018 | 2017 | 2016 | 2015 | |||||||||||||||
Net asset value, beginning of period | $41.80 | $47.68 | $40.08 | $38.63 | $44.67 | |||||||||||||||
Net investment income | 0.36 | 0.25 | 0.38 | 0.45 | 0.20 | |||||||||||||||
Net realized and unrealized gains (losses) on investments | 3.39 | (0.74 | ) | 10.06 | 3.00 | 0.72 | ||||||||||||||
|
|
|
|
|
|
|
|
|
| |||||||||||
Total from investment operations | 3.75 | (0.49 | ) | 10.44 | 3.45 | 0.92 | ||||||||||||||
Distributions to shareholders from | ||||||||||||||||||||
Net investment income | (0.22 | ) | (0.39 | ) | (0.49 | ) | (0.41 | ) | (0.22 | ) | ||||||||||
Net realized gains | (3.41 | ) | (5.00 | ) | (2.35 | ) | (1.59 | ) | (6.74 | ) | ||||||||||
|
|
|
|
|
|
|
|
|
| |||||||||||
Total distributions to shareholders | (3.63 | ) | (5.39 | ) | (2.84 | ) | (2.00 | ) | (6.96 | ) | ||||||||||
Net asset value, end of period | $41.92 | $41.80 | $47.68 | $40.08 | $38.63 | |||||||||||||||
Total return | 10.17 | % | (1.45 | )% | 27.38 | % | 9.56 | % | 2.53 | % | ||||||||||
Ratios to average net assets (annualized) | ||||||||||||||||||||
Gross expenses | 1.20 | % | 1.21 | % | 1.21 | % | 1.22 | % | 1.18 | % | ||||||||||
Net expenses | 1.15 | % | 1.15 | % | 1.15 | % | 1.15 | % | 1.15 | % | ||||||||||
Net investment income | 0.86 | % | 0.54 | % | 1.01 | % | 1.20 | % | 0.66 | % | ||||||||||
Supplemental data | ||||||||||||||||||||
Portfolio turnover rate | 62 | % | 51 | % | 70 | % | 70 | % | 42 | % | ||||||||||
Net assets, end of period (000s omitted) | $104,011 | $118,625 | $41,087 | $12,531 | $10,369 | |||||||||||||||
The accompanying notes are an integral part of these financial statements.
Wells Fargo Global Small Cap Fund | 21
Table of Contents
1. ORGANIZATION
Wells Fargo Funds Trust (the “Trust”), a Delaware statutory trust organized on March 10, 1999, is an open-end management investment company registered under the Investment Company Act of 1940, as amended (the “1940 Act”). As an investment company, the Trust follows the accounting and reporting guidance in Financial Accounting Standards Board (“FASB”) Accounting Standards Codification Topic 946, Financial Services – Investment Companies. These financial statements report on the Wells Fargo Global Small Cap Fund (the “Fund”) which is a diversified series of the Trust.
2. SIGNIFICANT ACCOUNTING POLICIES
The following significant accounting policies, which are consistently followed in the preparation of the financial statements of the Fund, are in conformity with U.S. generally accepted accounting principles which require management to make estimates and assumptions that affect the reported amounts of assets and liabilities, disclosure of contingent assets and liabilities at the date of the financial statements, and the reported amounts of revenues and expenses during the reporting period. Actual results could differ from those estimates.
Securities valuation
All investments are valued each business day as of the close of regular trading on the New York Stock Exchange (generally 4 p.m. Eastern Time), although the Fund may deviate from this calculation time under unusual or unexpected circumstances.
Equity securities that are listed on a foreign or domestic exchange or market are valued at the official closing price or, if none, the last sales price. If no sale occurs on the principal exchange or market that day, a fair value price will be determined in accordance with the Fund’s Valuation Procedures.
The values of securities denominated in foreign currencies are translated into U.S. dollars at rates provided by an independent foreign currency pricing source at a time each business day specified by the Wells Fargo Asset Management Pricing Committee at Wells Fargo Funds Management, LLC (“Funds Management”).
Many securities markets and exchanges outside the U.S. close prior to the close of the New York Stock Exchange and therefore may not fully reflect trading or events that occur after the close of the principal exchange in which the foreign securities are traded, but before the close of the New York Stock Exchange. If such trading or events are expected to materially affect the value of such securities, then fair value pricing procedures approved by the Board of Trustees of the Fund are applied. These procedures take into account multiple factors including movements in U.S. securities markets after foreign exchanges close. Foreign securities that are fair valued under these procedures are categorized as Level 2 and the application of these procedures may result in transfers between Level 1 and Level 2. Depending on market activity, such fair valuations may be frequent. Such fair value pricing may result in net asset values that are higher or lower than net asset values based on the last reported sales price or latest quoted bid price. On October 31, 2019, such fair value pricing was not used in pricing foreign securities.
Investments in registered open-end investment companies are valued at net asset value. Interests in non-registered investment companies that are redeemable at net asset value are fair valued normally at net asset value.
Investments which are not valued using any of the methods discussed above are valued at their fair value, as determined in good faith by the Board of Trustees. The Board of Trustees has established a Valuation Committee comprised of the Trustees and has delegated to it the authority to take any actions regarding the valuation of portfolio securities that the Valuation Committee deems necessary or appropriate, including determining the fair value of portfolio securities, unless the determination has been delegated to the Wells Fargo Asset Management Pricing Committee. The Board of Trustees retains the authority to make or ratify any valuation decisions or approve any changes to the Valuation Procedures as it deems appropriate. On a quarterly basis, the Board of Trustees receives reports on any valuation actions taken by the Valuation Committee or the Wells Fargo Asset Management Pricing Committee which may include items for ratification.
Foreign currency translation
The accounting records of the Fund are maintained in U.S. dollars. The values of other assets and liabilities denominated in foreign currencies are translated into U.S. dollars at rates provided by an independent foreign currency pricing source at a time each business day specified by the Wells Fargo Asset Management Pricing Committee. Purchases and sales of securities, and income and expenses are converted at the rate of exchange on the respective dates of such transactions. Net realized foreign exchange gains or losses arise from sales of foreign currencies, currency gains or losses realized between the trade and settlement dates on securities transactions, and the difference between the amounts of dividends, interest and foreign withholding taxes recorded and the U.S. dollar equivalent of the amounts actually paid or received. Net unrealized foreign exchange gains and losses arise from changes in the fair value of assets and liabilities other than investments in securities resulting from changes in exchange rates. The changes in net assets arising from changes in exchange rates of securities and the changes in net assets resulting from changes in market prices of securities are not separately presented. Such changes are included in net realized and unrealized gains or losses from investments.
22 | Wells Fargo Global Small Cap Fund
Table of Contents
Notes to financial statements
Securities lending
The Fund may lend its securities from time to time in order to earn additional income in the form of fees or interest on securities received as collateral or the investment of any cash received as collateral. When securities are on loan, the Fund receives interest or dividends on those securities. Cash collateral received in connection with its securities lending transactions is invested in Securities Lending Cash Investments, LLC (the “Securities Lending Fund”). Investments in Securities Lending Fund are valued at the evaluated bid price provided by an independent pricing service. Income earned from investment in the Securities Lending Fund (net of fees and rebates), if any, is included in income from affiliated securities on the Statement of Operations.
In a securities lending transaction, the net asset value of the Fund is affected by an increase or decrease in the value of the securities loaned and by an increase or decrease in the value of the instrument in which collateral is invested. The amount of securities lending activity undertaken by the Fund fluctuates from time to time. The Fund has the right under the lending agreement to recover the securities from the borrower on demand. In the event of default or bankruptcy by the borrower, the Fund may be prevented from recovering the loaned securities or gaining access to the collateral or may experience delays or costs in doing so. In such an event, the terms of the agreement allows the unaffiliated securities lending agent to use the collateral to purchase replacement securities on behalf of the Fund or pay the Fund the market value of the loaned securities. The Fund bears the risk of loss with respect to depreciation of its investment of the cash collateral.
Security transactions and income recognition
Securities transactions are recorded on a trade date basis. Realized gains or losses are recorded on the basis of identified cost.
Dividend income is recognized on the ex-dividend date, except for certain dividends from foreign securities, which are recorded as soon as the custodian verifies the ex-dividend date. Dividend income from foreign securities is recorded net of foreign taxes withheld where recovery of such taxes is not assured.
Distributions to shareholders
Distributions to shareholders from net investment income and any net realized gains are recorded on the ex-dividend date and paid at least annually. Such distributions are determined in accordance with income tax regulations and may differ from U.S. generally accepted accounting principles. Dividend sources are estimated at the time of declaration. The tax character of distributions is determined as of the Fund’s fiscal year end. Therefore, a portion of the Fund’s distributions made prior to the Fund’s fiscal year end may be categorized as a tax return of capital at year end.
Federal and other taxes
The Fund intends to continue to qualify as a regulated investment company by distributing substantially all of its investment company taxable income and any net realized capital gains (after reduction for capital loss carryforwards) sufficient to relieve it from all, or substantially all, federal income taxes. Accordingly, no provision for federal income taxes was required.
The Fund’s income and federal excise tax returns and all financial records supporting those returns for the prior three fiscal years are subject to examination by the federal and Delaware revenue authorities. Management has analyzed the Fund’s tax positions taken on federal, state, and foreign tax returns for all open tax years and does not believe that there are any uncertain tax positions that require recognition of a tax liability.
As of October 31, 2019, the aggregate cost of all investments for federal income tax purposes was $261,320,875 and the unrealized gains (losses) consisted of:
Gross unrealized gains | $ | 40,758,843 | ||
Gross unrealized losses | (16,105,434 | ) | ||
Net unrealized gains | $ | 24,653,409 | ||
Class allocations
The separate classes of shares offered by the Fund differ principally in applicable sales charges, distribution, shareholder servicing, and administration fees. Class specific expenses are charged directly to that share class. Investment income, common fund-level expenses, and realized and unrealized gains (losses) on investments are allocated daily to each class of shares based on the relative proportion of net assets of each class.
3. FAIR VALUATION MEASUREMENTS
Fair value measurements of investments are determined within a framework that has established a fair value hierarchy based upon the various data inputs utilized in determining the value of the Fund’s investments. The three-level hierarchy gives the
Wells Fargo Global Small Cap Fund | 23
Table of Contents
Notes to financial statements
highest priority to unadjusted quoted prices in active markets for identical assets or liabilities (Level 1) and the lowest priority to unobservable inputs (Level 3). The Fund’s investments are classified within the fair value hierarchy based on the lowest level of input that is significant to the fair value measurement. The inputs are summarized into three broad levels as follows:
| ∎ | Level 1 – quoted prices in active markets for identical securities |
| ∎ | Level 2 – other significant observable inputs (including quoted prices for similar securities, interest rates, prepayment speeds, credit risk, etc.) |
| ∎ | Level 3 – significant unobservable inputs (including the Fund’s own assumptions in determining the fair value of investments) |
The inputs or methodologies used for valuing investments in securities are not necessarily an indication of the risk associated with investing in those securities.
The following is a summary of the inputs used in valuing the Fund’s assets and liabilities as of October 31, 2019:
Quoted prices (Level 1) | Other significant observable inputs (Level 2) | Significant unobservable inputs (Level 3) | Total | |||||||||||||
Assets | ||||||||||||||||
Investments in: | ||||||||||||||||
Australia | $ | 8,430,991 | $ | 0 | $ | 0 | $ | 8,430,991 | ||||||||
Austria | 1,431,241 | 0 | 0 | 1,431,241 | ||||||||||||
Bermuda | 3,226,562 | 0 | 0 | 3,226,562 | ||||||||||||
Canada | 16,302,079 | 0 | 0 | 16,302,079 | ||||||||||||
France | 9,603,959 | 0 | 0 | 9,603,959 | ||||||||||||
Germany | 12,591,418 | 0 | 0 | 12,591,418 | ||||||||||||
Hong Kong | 3,154,951 | 0 | 0 | 3,154,951 | ||||||||||||
Ireland | 1,917,707 | 0 | 0 | 1,917,707 | ||||||||||||
Italy | 3,885,601 | 0 | 0 | 3,885,601 | ||||||||||||
Japan | 41,944,854 | 0 | 0 | 41,944,854 | ||||||||||||
Netherlands | 2,245,715 | 0 | 0 | 2,245,715 | ||||||||||||
Spain | 4,489,352 | 0 | 0 | 4,489,352 | ||||||||||||
Sweden | 2,258,610 | 0 | 0 | 2,258,610 | ||||||||||||
Switzerland | 5,087,045 | 0 | 0 | 5,087,045 | ||||||||||||
United Kingdom | 23,153,217 | 0 | 0 | 23,153,217 | ||||||||||||
United States | 121,971,561 | 0 | 0 | 121,971,561 | ||||||||||||
Short-term investments | ||||||||||||||||
Investment companies | 24,279,421 | 0 | 0 | 24,279,421 | ||||||||||||
Total assets | $ | 285,974,284 | $ | 0 | $ | 0 | $ | 285,974,284 | ||||||||
Additional sector, industry or geographic detail is included in the Portfolio of Investments.
For the year ended October 31, 2019, the Fund did not have any transfers into/out of Level 3.
24 | Wells Fargo Global Small Cap Fund
Table of Contents
Notes to financial statements
4. TRANSACTIONS WITH AFFILIATES
Management fee
Funds Management, an indirect wholly owned subsidiary of Wells Fargo & Company (“Wells Fargo”), is the manager of the Fund and provides advisory and fund-level administrative services under an investment management agreement. Under the investment management agreement, Funds Management is responsible for, among other services, implementing the investment objectives and strategies of the Fund, supervising the subadviser and providing fund-level administrative services in connection with the Fund’s operations. As compensation for its services under the investment management agreement, Funds Management is entitled to receive a management fee at the following annual rate based on the Fund’s average daily net assets:
| Average daily net assets | Management fee | |||
First $500 million | 0.950 | % | ||
Next $500 million | 0.925 | |||
Next $1 billion | 0.900 | |||
Next $2 billion | 0.875 | |||
Next $1 billion | 0.850 | |||
Next $5 billion | 0.840 | |||
Over $10 billion | 0.830 | |||
For the year ended October 31, 2019, the management fee was equivalent to an annual rate of 0.95% of the Fund’s average daily net assets.
Funds Management has retained the services of a subadviser to provide daily portfolio management to the Fund. The fee for subadvisory services is borne by Funds Management. Wells Capital Management Incorporated (“WellsCap”), an affiliate of Funds Management and an indirect wholly owned subsidiary of Wells Fargo, is the subadviser to the Fund and is entitled to receive a fee from Funds Management at an annual rate starting at 0.55% and declining to 0.40% as the average daily net assets of the Fund increase.
Administration fees
Under a class-level administration agreement, Funds Management provides class-level administrative services to the Fund, which includes paying fees and expenses for services provided by the transfer agent, sub-transfer agents, omnibus account servicers and record-keepers. As compensation for its services under the class-level administration agreement, Funds Management receives an annual fee which is calculated based on the average daily net assets of each class as follows:
| Class-level administration fee | ||||
Class A, Class C | 0.21 | % | ||
Administrator Class, Institutional Class | 0.13 | |||
Waivers and/or expense reimbursements
Funds Management has contractually waived and/or reimbursed management and administration fees to the extent necessary to maintain certain net operating expense ratios for the Fund. When each class of the Fund has exceeded its expense cap, Funds Management has waived fees and/or reimbursed expenses from fund-level expenses on a proportionate basis and then from class specific expenses. When only certain classes exceed their expense caps, waivers and/or reimbursements are applied against class specific expenses before fund-level expenses. Funds Management has committed through February 29, 2020 to waive fees and/or reimburse expenses to the extent necessary to cap the Fund’s expenses at 1.55% for Class A shares, 2.30% for Class C shares, 1.40% for Administrator Class shares, and 1.15% for Institutional Class shares. Prior to or after the commitment expiration date, the cap may be increased or the commitment to maintain the cap may be terminated only with the approval of the Board of Trustees.
Distribution fee
The Trust has adopted a distribution plan for Class C shares of the Fund pursuant to Rule 12b-1 under the 1940 Act. A distribution fee is charged to Class C shares and paid to Wells Fargo Funds Distributor, LLC (“Funds Distributor”), the principal underwriter, at an annual rate of 0.75% of the average daily net assets of Class C shares.
Wells Fargo Global Small Cap Fund | 25
Table of Contents
Notes to financial statements
In addition, Funds Distributor is entitled to receive the front-end sales charge from the purchase of Class A shares and a contingent deferred sales charge on the redemption of certain Class A shares. Funds Distributor is also entitled to receive the contingent deferred sales charges from redemptions of Class C shares. For the year ended October 31, 2019, Funds Distributor received $5,215 from the sale of Class A shares and $153 in contingent deferred sales charges from redemptions of Class C shares. No contingent deferred sales charges were incurred by Class A for the year ended October 31, 2019.
Shareholder servicing fees
The Trust has entered into contracts with one or more shareholder servicing agents, whereby Class A, Class C, and Administrator Class of the Fund are charged a fee at an annual rate of 0.25% of the average daily net assets of each respective class. A portion of these total shareholder servicing fees were paid to affiliates of Wells Fargo.
Interfund transactions
The Fund may purchase or sell portfolio investment securities to certain other Wells Fargo affiliates pursuant to Rule 17a-7 under the 1940 Act and under procedures adopted by the Board of Trustees. The procedures have been designed to ensure that these interfund transactions, which do not incur broker commissions, are effected at current market prices. Pursuant to these procedures, the Fund had $0 and $25,233,418 in interfund purchases and sales, respectively, during the year ended October 31, 2019.
5. INVESTMENT PORTFOLIO TRANSACTIONS
Purchases and sales of investments, excluding U.S. government obligations (if any) and short-term securities, for the year ended October 31, 2019 were $168,400,122 and $202,344,340, respectively.
6. SECURITIES LENDING TRANSACTIONS
The Fund lends its securities through an unaffiliated securities lending agent and receives collateral in the form of cash or securities with a value at least equal to the value of the securities on loan. The value of the loaned securities is determined at the close of each business day and any increases or decreases in the required collateral are exchanged between the Fund and the counterparty on the next business day. Cash collateral received is invested in the Securities Lending Fund which seeks to provide a positive return compared to the daily Fed Funds Open Rate by investing in high-quality, U.S. dollar-denominated short-term money market instruments and is exempt from registration under Section 3(c)(7) of the 1940 Act. Securities Lending Fund is managed by Funds Management and is subadvised by WellsCap. Funds Management receives an advisory fee starting at 0.05% and declining to 0.01% as the average daily net assets of the Securities Lending Fund increase. All of the fees received by Funds Management are paid to WellsCap for its services as subadviser.
In the event of counterparty default or the failure of a borrower to return a loaned security, the Fund has the right to use the collateral to offset any losses incurred. As of October, 31 2019, the Fund had securities lending transactions with the following counterparties which are subject to offset:
| Counterparty | Value of securities on loan | Collateral received1 | Net amount | |||||||||
Barclays Capital Inc. | 182,980 | (182,980 | ) | 0 | ||||||||
Citigroup Global Markets Inc. | 2,734,416 | (2,734,416 | ) | 0 | ||||||||
Credit Suisse Securities (USA) LLC | 631,576 | (631,576 | ) | 0 | ||||||||
Morgan Stanley & Co. LLC | 2,937,727 | (2,937,727 | ) | 0 | ||||||||
UBS Securities LLC | 2,533,732 | (2,533,732 | ) | 0 | ||||||||
| 1 | Collateral received within this table is limited to the collateral for the net transaction with the counterparty. |
7. BANK BORROWINGS
The Trust (excluding the money market funds), Wells Fargo Master Trust and Wells Fargo Variable Trust are parties to a $280,000,000 revolving credit agreement whereby the Fund is permitted to use bank borrowings for temporary or emergency purposes, such as to fund shareholder redemption requests. Interest under the credit agreement is charged to the Fund based on a borrowing rate equal to the higher of the Federal Funds rate in effect on that day plus 1.25% or the overnight LIBOR rate in effect on that day plus 1.25%. In addition, an annual commitment fee equal to 0.25% of the unused balance is allocated to each participating fund.
For the year ended October 31, 2019, there were no borrowings by the Fund under the agreement.
26 | Wells Fargo Global Small Cap Fund
Table of Contents
Notes to financial statements
8. DISTRIBUTIONS TO SHAREHOLDERS
The tax character of distributions paid during the years ended October 31, 2019 and October 31, 2018 were as follows:
| Year ended October 31 | ||||||||
| 2019 | 2018 | |||||||
Ordinary income | $ | 4,835,730 | $ | 8,131,894 | ||||
Long-term capital gain | 21,579,337 | 22,337,754 | ||||||
As of October 31, 2019, the components of distributable earnings on a tax basis were as follows:
Undistributed ordinary income | Undistributed long-term gain | Unrealized gains | ||
| $5,687,691 | $6,403,235 | $24,654,782 | ||
9. CONCENTRATION RISKS
Concentration risks result from exposure to a limited number of sectors. As of the end of the period, the Fund invests a concentration of its portfolio in the industrials sector. A fund that invests a substantial portion of its assets in any sector may be more affected by changes in that sector than would be a fund whose investments are not heavily weighted in any sector.
10. INDEMNIFICATION
Under the Trust’s organizational documents, the officers and Trustees have been granted certain indemnification rights against certain liabilities that may arise out of performance of their duties to the Trust. At a meeting held on November 21-22, 2019, the Board of Trustees of the Fund approved a proposal to authorize the Fund to enter into a separate agreement with each Trustee that would convert indemnification rights currently existing under the Fund’s organizational documents into contractual rights that could not be changed in the future without the consent of the Trustee. Additionally, in the normal course of business, the Trust may enter into contracts with service providers that contain a variety of indemnification clauses. The Trust’s maximum exposure under these arrangements is dependent on future claims that may be made against the Fund and, therefore, cannot be estimated.
11. NEW ACCOUNTING PRONOUNCEMENT
In August 2018, FASB issued Accounting Standards Update (“ASU”) No. 2018-13, Fair Value Measurement (Topic 820)Disclosure Framework—Changes to the Disclosure Requirements for Fair Value Measurement. ASU 2018-13 updates the disclosure requirements for fair value measurements by modifying or removing certain disclosures and adding certain new disclosures. The amendments are effective for fiscal years, and interim periods within those fiscal years, beginning after December 15, 2019. Early adoption is permitted. Management has adopted the removal and modification of disclosures early, as permitted, and will adopt the additional new disclosures at the effective date.
Wells Fargo Global Small Cap Fund | 27
Table of Contents
Report of independent registered public accounting firm
TO THE SHAREHOLDERS OF THE FUND AND BOARD OF TRUSTEES OF WELLS FARGO FUNDS TRUST:
Opinion on the Financial Statements
We have audited the accompanying statement of assets and liabilities of Wells Fargo Global Small Cap Fund (the Fund), one of the funds constituting Wells Fargo Funds Trust, including the portfolio of investments, as of October 31, 2019, the related statement of operations for the year then ended, the statements of changes in net assets for each of the years in the two-year period then ended, and the related notes (collectively, the financial statements) and the financial highlights for each of the years in the five-year period then ended. In our opinion, the financial statements and financial highlights present fairly, in all material respects, the financial position of the Fund as of October 31, 2019, the results of its operations for the year then ended, the changes in its net assets for each of the years in the two-year period then ended, and the financial highlights for each of the years in the five-year period then ended, in conformity with U.S. generally accepted accounting principles.
Basis for Opinion
These financial statements and financial highlights are the responsibility of the Fund’s management. Our responsibility is to express an opinion on these financial statements and financial highlights based on our audits. We are a public accounting firm registered with the Public Company Accounting Oversight Board (United States) (PCAOB) and are required to be independent with respect to the Fund in accordance with the U.S. federal securities laws and the applicable rules and regulations of the Securities and Exchange Commission and the PCAOB.
We conducted our audits in accordance with the standards of the PCAOB. Those standards require that we plan and perform the audit to obtain reasonable assurance about whether the financial statements and financial highlights are free of material misstatement, whether due to error or fraud. Our audits included performing procedures to assess the risks of material misstatement of the financial statements and financial highlights, whether due to error or fraud, and performing procedures that respond to those risks. Such procedures included examining, on a test basis, evidence regarding the amounts and disclosures in the financial statements and financial highlights. Such procedures also included confirmation of securities owned as of October 31, 2019, by correspondence with the custodian, transfer agent and brokers, or by other appropriate auditing procedures. Our audits also included evaluating the accounting principles used and significant estimates made by management, as well as evaluating the overall presentation of the financial statements and financial highlights. We believe that our audits provide a reasonable basis for our opinion.

We have not been able to determine the specific year that we began serving as the auditor of one or more Wells Fargo Funds investment companies; however we are aware that we have served as the auditor of one or more Wells Fargo Funds investment companies since at least 1955.
Boston, Massachusetts
December 20, 2019
28 | Wells Fargo Global Small Cap Fund
Table of Contents
TAX INFORMATION
For corporate shareholders, pursuant to Section 854 of the Internal Revenue Code, 22.24% of ordinary income dividends qualify for the corporate dividends-received deduction for the fiscal year ended October 31, 2019.
Pursuant to Section 852 of the Internal Revenue Code, $21,579,337 was designated as a 20% rate gain distribution for the fiscal year ended October 31, 2019.
Pursuant to Section 854 of the Internal Revenue Code, $3,719,503 of income dividends paid during the fiscal year ended October 31, 2019 has been designated as qualified dividend income (QDI).
For the fiscal year ended October 31, 2019, $40,986 has been designated as interest-related dividends for nonresident alien shareholders pursuant to Section 871 of the Internal Revenue Code.
For the fiscal year ended October 31, 2019, $4,044,490 has been designated as short-term capital gain dividends for nonresident alien shareholders pursuant to Section 871 of the Internal Revenue Code.
PROXY VOTING INFORMATION
A description of the policies and procedures used to determine how to vote proxies relating to portfolio securities is available, upon request, by calling1-800-222-8222, visiting our website atwfam.com, or visiting the SEC website at sec.gov. Information regarding how the proxies related to portfolio securities were voted during the most recent 12-month period ended June 30 is available on the website atwfam.comor by visiting the SEC website at sec.gov.
QUARTERLY PORTFOLIO HOLDINGS INFORMATION
The Fund files its complete schedule of portfolio holdings with the SEC for the first and third quarters of each fiscal year on Form N-Q or Form N-PORT, which is available by visiting the SEC website at sec.gov. Those forms may be reviewed and copied at the SEC’s Public Reference Room in Washington, DC. Information on the operation of the Public Reference Room may be obtained by calling 1-800-SEC-0330.
Wells Fargo Global Small Cap Fund | 29
Table of Contents
Other information (unaudited)
BOARD OF TRUSTEES AND OFFICERS
Each of the Trustees and Officers1 listed in the table below acts in identical capacities for each fund in the Wells Fargo family of funds, which consists of 150 mutual funds comprising the Wells Fargo Funds Trust, Wells Fargo Variable Trust, Wells Fargo Master Trust and four closed-end funds (collectively the “Fund Complex”). This table should be read in conjunction with the Prospectus and the Statement of Additional Information2. The mailing address of each Trustee and Officer is 525 Market Street, 12th Floor, San Francisco, CA 94105. Each Trustee and Officer serves an indefinite term, however, each Trustee serves such term until reaching the mandatory retirement age established by the Trustees.
Independent Trustees
Name and year of birth | Position held and length of service* | Principal occupations during past five years or longer | Current other public company or investment company directorships | |||
| William R. Ebsworth (Born 1957) | Trustee, since 2015 | Retired. From 1984 to 2013, equities analyst, portfolio manager, research director and chief investment officer at Fidelity Management and Research Company in Boston, Tokyo, and Hong Kong, and retired in 2013 as Chief Investment Officer of Fidelity Strategic Advisers, Inc. where he led a team of investment professionals managing client assets. Prior thereto, Board member of Hong Kong Securities Clearing Co., Hong Kong Options Clearing Corp., the Thailand International Fund, Ltd., Fidelity Investments Life Insurance Company, and Empire Fidelity Investments Life Insurance Company. Audit Committee Chair and Investment Committee Chair of the Vincent Memorial Hospital Endowment (non-profit organization). Mr. Ebsworth is a CFA® charterholder. | N/A | |||
| Jane A. Freeman (Born 1953) | Trustee, since 2015; Chair Liaison, since 2018 | Retired. From 2012 to 2014 and 1999 to 2008, Chief Financial Officer of Scientific Learning Corporation. From 2008 to 2012, Ms. Freeman provided consulting services related to strategic business projects. Prior to 1999, Portfolio Manager at Rockefeller & Co. and Scudder, Stevens & Clark. Board member of the Harding Loevner Funds from 1996 to 2014, serving as both Lead Independent Director and chair of the Audit Committee. Board member of the Russell Exchange Traded Funds Trust from 2011 to 2012 and the chair of the Audit Committee. Ms. Freeman is a Board Member of The Ruth Bancroft Garden (non-profit organization). She is also an inactive Chartered Financial Analyst. | N/A | |||
| Isaiah Harris, Jr. (Born 1952) | Trustee, since 2009; Audit Committee Chairman, since 2019 | Retired. Chairman of the Board of CIGNA Corporation since 2009, and Director since 2005. From 2003 to 2011, Director of Deluxe Corporation. Prior thereto, President and CEO of BellSouth Advertising and Publishing Corp. from 2005 to 2007, President and CEO of BellSouth Enterprises from 2004 to 2005 and President of BellSouth Consumer Services from 2000 to 2003. Emeritus member of the Iowa State University Foundation Board of Governors. Emeritus Member of the Advisory Board of Iowa State University School of Business. Advisory Board Member, Palm Harbor Academy (private school). Advisory Board Member, Child Evangelism Fellowship (non-profit). Mr. Harris is a certified public accountant (inactive status). | CIGNA Corporation | |||
| Judith M. Johnson (Born 1949) | Trustee, since 2008; Audit Committee Chairman, from 2009 to 2018 | Retired. Prior thereto, Chief Executive Officer and Chief Investment Officer of Minneapolis Employees Retirement Fund from 1996 to 2008. Ms. Johnson is an attorney, certified public accountant and a certified managerial accountant. | N/A | |||
30 | Wells Fargo Global Small Cap Fund
Table of Contents
Other information (unaudited)
Name and year of birth | Position held and length of service* | Principal occupations during past five years or longer | Current other public company or investment company directorships | |||
David F. Larcker (Born 1950) | Trustee, since 2009 | James Irvin Miller Professor of Accounting at the Graduate School of Business, Stanford University, Director of the Corporate Governance Research Initiative and Senior Faculty of The Rock Center for Corporate Governance since 2006. From 2005 to 2008, Professor of Accounting at the Graduate School of Business, Stanford University. Prior thereto, Ernst & Young Professor of Accounting at The Wharton School, University of Pennsylvania from 1985 to 2005. | N/A | |||
Olivia S. Mitchell (Born 1953) | Trustee, since 2006; Nominating and Governance Committee Chair, since 2018 | International Foundation of Employee Benefit Plans Professor, Wharton School of the University of Pennsylvania since 1993. Director of Wharton’s Pension Research Council and Boettner Center on Pensions & Retirement Research, and Research Associate at the National Bureau of Economic Research. Previously, Cornell University Professor from 1978 to 1993. | N/A | |||
Timothy J. Penny (Born 1951) | Trustee, since 1996; Chairman, since 2018 | President and Chief Executive Officer of Southern Minnesota Initiative Foundation, a non-profit organization, since 2007. Member of the Board of Trustees of NorthStar Education Finance, Inc., a non-profit organization, since 2007. | N/A | |||
James G. Polisson (Born 1959) | Trustee, since 2018 | Retired. Chief Marketing Officer, Source (ETF) UK Services, Ltd, from 2015 to 2017. From 2012 to 2015, Principal of The Polisson Group, LLC, a management consulting, corporate advisory and principal investing company. Chief Executive Officer and Managing Director at Russell Investments, Global Exchange Traded Funds from 2010 to 2012. Managing Director of Barclays Global Investors from 1998 to 2010 and Global Chief Marketing Officer for iShares and Barclays Global Investors from 2000 to 2010. Trustee of the San Francisco Mechanics’ Institute, a non-profit organization, from 2013 to 2015. Board member of the Russell Exchange Traded Fund Trust from 2011 to 2012. Director of Barclays Global Investors Holdings Deutschland GmbH from 2006 to 2009. Mr. Polisson is an attorney and has a retired status with the Massachusetts and District of Columbia Bar Associations. | N/A | |||
| Pamela Wheelock3 (Born 1959) | Trustee, since January 2020; previously Trustee from January 2018 to July 2019 | Board member of the Destination Medical Center Economic Development Agency, Rochester, Minnesota since 2019. Acting Commissioner, Minnesota Department of Human Services, July 2019 through September 2019. Human Services Manager (part-time), Minnesota Department of Human Services, October 2019 through December 2019. Chief Operating Officer, Twin Cities Habitat for Humanity from 2017 to 2019. Vice President of University Services, University of Minnesota from 2012 to 2016. Prior thereto, on the Board of Directors, Governance Committee and Finance Committee for the Minnesota Philanthropy Partners (Saint Paul Foundation) from 2012 to 2018, Interim Chief Executive Officer of Blue Cross Blue Shield of Minnesota from 2011 to 2012, Chairman of the Board from 2009 to 2012 and Board Director from 2003 to 2015. Vice President, Leadership and Community Engagement, Bush Foundation, Saint Paul, Minnesota (a private foundation) from 2009 to 2011. Executive Vice President and Chief Financial Officer, Minnesota Sports and Entertainment from 2004 to 2009 and Senior Vice President from 2002 to 2004. Executive Vice President of the Minnesota Wild Foundation from 2004 to 2008. Commissioner of Finance, State of Minnesota, from 1999 to 2002. Currently Board Chair of the Minnesota Wild Foundation since 2010. | N/A | |||
| * | Length of service dates reflect the Trustee’s commencement of service with the Trust’s predecessor entities, where applicable. |
Wells Fargo Global Small Cap Fund | 31
Table of Contents
Other information (unaudited)
Officers
Name and year of birth | Position held and length of service | Principal occupations during past five years or longer | ||
Andrew Owen (Born 1960) | President, since 2017 | Executive Vice President of Wells Fargo & Company and Head of Affiliated Managers, Wells Fargo Asset Management, since 2014. In addition, Mr. Owen is currently President, Chief Executive Officer and Director of Wells Fargo Funds Management, LLC since 2017. Prior thereto, Executive Vice President responsible for marketing, investments and product development for Wells Fargo Funds Management, LLC, from 2009 to 2014. | ||
| Jeremy DePalma1 (Born 1974) | Treasurer, since 2012 | Senior Vice President of Wells Fargo Funds Management, LLC since 2009. Senior Vice President of Evergreen Investment Management Company, LLC from 2008 to 2010 and head of the Fund Reporting and Control Team within Fund Administration from 2005 to 2010. | ||
Michelle Rhee4 (Born 1966) | Chief Legal Officer, since 2019 | Secretary of Wells Fargo Funds Management, LLC, Chief Legal Counsel of Wells Fargo Asset Management and Assistant General Counsel of Wells Fargo Bank, N.A. since 2018. Associate General Counsel and Managing Director of Bank of America Corporation from 2004 to 2018. | ||
| Catherine Kennedy5 (Born 1969) | Secretary, since 2019 | Vice President of Wells Fargo Funds Management, LLC and Senior Counsel of the Wells Fargo Legal Department since 2010. Vice President and Senior Counsel of Evergreen Investment Management Company, LLC from 1998 to 2010. | ||
| Michael H. Whitaker (Born 1967) | Chief Compliance Officer, since 2016 | Chief Compliance Officer of Wells Fargo Asset Management since 2016. Senior Vice President and Chief Compliance Officer for Fidelity Investments from 2007 to 2016. | ||
David Berardi (Born 1975) | Assistant Treasurer, since 2009 | Vice President of Wells Fargo Funds Management, LLC since 2009. Vice President of Evergreen Investment Management Company, LLC from 2008 to 2010. Manager of Fund Reporting and Control for Evergreen Investment Management Company, LLC from 2004 to 2010. | ||
| 1 | Jeremy DePalma acts as Treasurer of 86 funds and Assistant Treasurer of 64 funds in the Fund Complex. |
| 2 | The Statement of Additional Information includes additional information about the Trustees and is available, without charge, upon request, by calling1-800-222-8222 or by visiting the website atwfam.com. |
| 3 | Ms. Wheelock was re-appointed to the Board effective January 1, 2020. |
| 4 | Michelle Rhee became Chief Legal Officer effective October 22, 2019. |
| 5 | Catherine Kennedy became Secretary effective October 22, 2019. |
32 | Wells Fargo Global Small Cap Fund
Table of Contents
Other information (unaudited)
BOARD CONSIDERATION OF INVESTMENT MANAGEMENT AND SUB-ADVISORY AGREEMENTS:
Wells Fargo Global Small Cap Fund
Under the Investment Company Act of 1940 (the “1940 Act”), the Board of Trustees (the “Board”) of Wells Fargo Funds Trust (the “Trust”) must determine annually whether to approve the continuation of the Trust’s investment management andsub-advisory agreements. In this regard, at an in-person meeting held on May 21-22, 2019 (the “Meeting”), the Board, all the members of which have no direct or indirect interest in the investment management and sub-advisory agreements and are not “interested persons” of the Trust, as defined in the 1940 Act (the “Independent Trustees”), reviewed and approved for Wells Fargo Global Small Cap Fund (the “Fund”): (i) an investment management agreement (the “Management Agreement”) with Wells Fargo Funds Management, LLC (“Funds Management”); and (ii) an investment sub-advisory agreement (the“Sub-Advisory Agreement”) with Wells Capital Management Incorporated (the “Sub-Adviser”), an affiliate of Funds Management. The Management Agreement and the Sub-Advisory Agreement are collectively referred to as the “Advisory Agreements.”
At the Meeting, the Board considered the factors and reached the conclusions described below relating to the selection of Funds Management and the Sub-Adviser and the approval of the Advisory Agreements. Prior to the Meeting, including at anin-person meeting in April 2019, the Trustees conferred extensively among themselves and with representatives of Funds Management about these matters. Also, the Board has adopted a team-based approach, with each team consisting of a sub-set of Trustees, to assist the full Board in the discharge of its duties in reviewing investment performance and other matters throughout the year. The Independent Trustees were assisted in their evaluation of the Advisory Agreements by independent legal counsel, from whom they received separate legal advice and with whom they met separately.
In providing information to the Board, Funds Management and the Sub-Adviser were guided by a detailed set of requests for information submitted to them by independent legal counsel on behalf of the Independent Trustees at the start of the Board’s annual contract renewal process earlier in 2019. In considering and approving the Advisory Agreements, the Trustees considered the information they believed relevant, including but not limited to the information discussed below. The Board considered not only the specific information presented in connection with the Meeting, but also the knowledge gained over time through interaction with Funds Management and the Sub-Adviser about various topics. In this regard, the Board reviewed reports of Funds Management at each of its quarterly meetings, which included, among other things, portfolio reviews and investment performance reports. In addition, the Board and the teams mentioned above confer with portfolio managers at various times throughout the year. The Board did not identify any particular information or consideration that was all-important or controlling, and each individual Trustee may have attributed different weights to various factors.
After its deliberations, the Board unanimously approved the continuation of the Advisory Agreements for a one-year term and determined that the compensation payable to Funds Management and the Sub-Adviser under each of the Advisory Agreements was reasonable. The Board considered the approval of the Advisory Agreements for the Fund as part of its consideration of agreements for funds across the complex, but its approvals were made on a fund-by-fund basis. The following summarizes a number of important, but not necessarily all, factors considered by the Board in support of its approvals.
Nature, extent and quality of services
The Board received and considered various information regarding the nature, extent and quality of services provided to the Fund by Funds Management and the Sub-Adviser under the Advisory Agreements. This information included a description of the investment advisory services and Fund-level administrative services covered by the Management Agreement, as well as, among other things, a summary of the background and experience of senior management of Wells Fargo Asset Management (“WFAM”), of which Funds Management and the Sub-Adviser are a part, a summary of investments made in the business of WFAM, a summary of certain organizational and personnel changes involving Funds Management and the Sub-Adviser, and a description of Funds Management’s and the Sub-Adviser’s business continuity planning programs and of their approaches to data privacy and cybersecurity. The Board received and reviewed information about Funds Management’s role as administrator of the Fund’s liquidity risk management program. The Board also considered the qualifications, background, tenure and responsibilities of each of the portfolio managers primarily responsible for the day-to-day portfolio management of the Fund.
The Board evaluated the ability of Funds Management and the Sub-Adviser to attract and retain qualified investment professionals, including research, advisory and supervisory personnel. The Board further considered the compliance programs and compliance records of Funds Management and the Sub-Adviser. In addition, the Board took into account the full range of services provided to the Fund by Funds Management and its affiliates.
Wells Fargo Global Small Cap Fund | 33
Table of Contents
Other information (unaudited)
Fund investment performance and expenses
The Board considered the investment performance results for the Fund over various time periods ended December 31, 2018. The Board considered these results in comparison to the investment performance of funds in a universe that was determined by Broadridge Inc. (“Broadridge”) to be similar to the Fund (the “Universe”), and in comparison to the Fund’s benchmark index and to other comparative data. Broadridge is an independent provider of investment company data. The Board received a description of the methodology used by Broadridge to select the mutual funds in the performance Universe. The Board noted that the investment performance of the Fund (Administrator Class) was higher than the average investment performance of the Universe for the one-, three- and five-year periods under review, but lower than the average investment performance of the Universe for the ten-year period under review. The Board also noted that the investment performance of the Fund was higher than its benchmark index, the S&P Developed SmallCap Index, for the one-, three- and five-year periods under review, but lower than its benchmark for the ten-year period under review.
The Board also received and considered information regarding the Fund’s net operating expense ratios and their various components, including actual management fees, custodian and other non-management fees, and Rule 12b-1 and non-Rule 12b-1 shareholder service fees. The Board considered these ratios in comparison to the median ratios of funds in class-specific expense groups that were determined by Broadridge to be similar to the Fund (the “Groups”). The Board received a description of the methodology used by Broadridge to select the mutual funds in the expense Groups and an explanation of how funds comprising expense groups and their expense ratios may vary from year-to-year. Based on the Broadridge reports, the Board noted that the net operating expense ratios of the Fund were lower than or in range of the median net operating expense ratios of the expense Groups for each share class.
The Board took into account the Fund’s investment performance and expense information provided to it among the factors considered in deciding to re-approve the Advisory Agreements.
Investment management and sub-advisory fee rates
The Board reviewed and considered the contractual fee rates payable by the Fund to Funds Management under the Management Agreement, as well as the contractual fee rates payable by the Fund to Funds Management for class-level administrative services under a Class-Level Administration Agreement, which include, among other things, class-level transfer agency and sub-transfer agency costs (collectively, the “Management Rates”). The Board also reviewed and considered the contractual investmentsub-advisory fee rates that are payable by Funds Management to the Sub-Adviser for investment sub-advisory services.
Among other information reviewed by the Board was a comparison of the Fund’s Management Rates with the average contractual investment management fee rates of funds in the expense Groups at a common asset level as well as transfer agency costs of the funds in the expense Groups. The Board noted that the Management Rates of the Fund were lower than, equal to or in range of the sum of these average rates for the Fund’s expense Groups for all share classes.
The Board also received and considered information about the portion of the total management fee that was retained by Funds Management after payment of the fee to the Sub-Adviser for sub-advisory services. In assessing the reasonableness of this amount, the Board received and evaluated information about the nature and extent of responsibilities retained and risks assumed by Funds Management and not delegated to or assumed by the Sub-Adviser, and about Funds Management’son-going oversight services. Given the affiliation between Funds Management and the Sub-Adviser, the Board ascribed limited relevance to the allocation of fees between them.
The Board also received and considered information about the nature and extent of services offered and fee rates charged by Funds Management and the Sub-Adviser to other types of clients with investment strategies similar to those of the Fund. In this regard, the Board received information about the significantly greater scope of services, and compliance, reporting and other legal burdens and risks of managing proprietary mutual funds compared with those associated with managing assets of other types of clients, including third-party sub-advised fund clients and non-mutual fund clients such as institutional separate accounts.
Based on its consideration of the factors and information it deemed relevant, including those described here, the Board determined that the compensation payable to Funds Management under the Management Agreement and to the Sub-Adviser under the Sub-Advisory Agreement was reasonable.
Profitability
The Board received and considered information concerning the profitability of Funds Management, as well as the profitability of both WFAM and Wells Fargo & Co. (“Wells Fargo”) from providing services to the fund family as a whole. The Board noted that the Sub-Adviser’s profitability information with respect to providing services to the Fund and other funds in the family was subsumed in the WFAM and Wells Fargo profitability analysis.
34 | Wells Fargo Global Small Cap Fund
Table of Contents
Other information (unaudited)
Funds Management reported on the methodologies and estimates used in calculating profitability, including a description of the methodology used to allocate certain expenses. Among other things, the Board noted that the levels of profitability reported on a fund-by-fund basis varied widely, depending on factors such as the size, type and age of fund. Based on its review, the Board did not deem the profits reported by Funds Management, WFAM or Wells Fargo from services provided to the Fund to be at a level that would prevent it from approving the continuation of the Advisory Agreements.
Economies of scale
The Board received and considered information about the potential for Funds Management to experience economies of scale in the provision of management services to the Fund, the difficulties of calculating economies of scale at an individual fund level, and the extent to which potential scale benefits are shared with shareholders. The Board noted the existence of breakpoints in the Fund’s management fee structure, which operate generally to reduce the Fund’s expense ratios as the Fund grows in size. The Board considered that in addition to management fee breakpoints, Funds Management shares potential economies of scale from its management business in a variety of ways, including through fee waiver and expense reimbursement arrangements, services that benefit shareholders, competitive management fee rates set at the outset without regard to breakpoints, and investments in the business intended to enhance services available to shareholders.
The Board concluded that Funds Management’s arrangements with respect to the Fund, including contractual breakpoints, constituted a reasonable approach to sharing potential economies of scale with the Fund and its shareholders.
Other benefits to Funds Management and the Sub-Adviser
The Board received and considered information regarding potential “fall-out” or ancillary benefits received by Funds Management and its affiliates, including the Sub-Adviser, as a result of their relationships with the Fund. Ancillary benefits could include, among others, benefits directly attributable to other relationships with the Fund and benefits potentially derived from an increase in Funds Management’s and the Sub-Adviser’s business as a result of their relationships with the Fund. The Board noted that various affiliates of Funds Management may receive distribution-related fees, shareholder servicing payments and sub-transfer agency fees in respect of shares sold or held through them and services provided.
The Board also reviewed information about soft dollar credits earned and utilized by the Sub-Adviser, fees earned by Funds Management and the Sub-Adviser from managing a private investment vehicle for the fund family’s securities lending collateral, and commissions earned by an affiliated broker from portfolio transactions.
Based on its consideration of the factors and information it deemed relevant, including those described here, the Board did not find that any ancillary benefits received by Funds Management and its affiliates, including the Sub-Adviser, were unreasonable.
Conclusion
At the Meeting, after considering the above-described factors and based on its deliberations and its evaluation of the information described above, the Board unanimously approved the continuation of the Advisory Agreements for a one-year term and determined that the compensation payable to Funds Management and the Sub-Adviser under each of the Advisory Agreements was reasonable.
Wells Fargo Global Small Cap Fund | 35
Table of Contents
This page is intentionally left blank.
Table of Contents
For more information
More information about Wells Fargo Funds is available free upon request. To obtain literature, please write, visit the Fund’s website, or call:
Wells Fargo Funds
P.O. Box 219967
Kansas City, MO 64121-9967
Website:wfam.com
Individual investors:1-800-222-8222
Retail investment professionals:1-888-877-9275
Institutional investment professionals:1-866-765-0778

This report and the financial statements contained herein are submitted for the general information of the shareholders of the Fund. If this report is used for promotional purposes, distribution of the report must be accompanied or preceded by a current prospectus. Before investing, please consider the investment objectives, risks, charges, and expenses of the investment. For a current prospectus and, if available, a summary prospectus, containing this information, call1-800-222-8222 or visit the Fund’s website atwfam.com. Read the prospectus carefully before you invest or send money.
Wells Fargo Asset Management (WFAM) is the trade name for certain investment advisory/management firms owned by Wells Fargo & Company. These firms include but are not limited to Wells Capital Management Incorporated and Wells Fargo Funds Management, LLC. Certain products managed by WFAM entities are distributed by Wells Fargo Funds Distributor, LLC (a broker-dealer and Member FINRA).
This material is for general informational and educational purposes only and is NOT intended to provide investment advice or a recommendation of any kind—including a recommendation for any specific investment, strategy, or plan.
INVESTMENT PRODUCTS: NOT FDIC INSURED ◾ NO BANK GUARANTEE ◾ MAY LOSE VALUE
© 2019 Wells Fargo & Company. All rights reserved.
408247 12-19
A239/AR239 10-19
Table of Contents

Annual Report
October 31, 2019
Wells Fargo
Intrinsic World Equity Fund
Beginning on January 1, 2021, as permitted by new regulations adopted by the Securities and Exchange Commission, paper copies of the Wells Fargo Funds’ annual and semi-annual shareholder reports issued after this date will no longer be sent by mail, unless you specifically request paper copies of the reports. Instead, the reports will be made available on the Funds’ website, and you will be notified by mail each time a report is posted and provided with a website address to access the report.
If you already elected to receive shareholder reports electronically, you will not be affected by this change and you need not take any action. You may elect to receive shareholder reports and other communications from the Fund electronically at any time by contacting your financial intermediary (such as a broker-dealer or bank) or, if you are a direct investor, by calling1-800-222-8222 or by enrolling at wellsfargo.com/advantagedelivery.
You may elect to receive all future reports in paper free of charge. If you invest through a financial intermediary, you can contact your financial intermediary to request that you continue to receive paper copies of your shareholder reports; if you invest directly with the Fund, you can call 1-800-222-8222. Your election to receive reports in paper will apply to all Wells Fargo Funds held in your account with your financial intermediary or, if you are a direct investor, to all Wells Fargo Funds that you hold.
Table of Contents
|
Reduce clutter. Save trees. |
Sign up for |
The views expressed and any forward-looking statements are as of October 31, 2019, unless otherwise noted, and are those of the Fund managers and/or Wells Fargo Asset Management. Discussions of individual securities, or the markets generally, or any Wells Fargo Fund are not intended as individual recommendations. Future events or results may vary significantly from those expressed in any forward-looking statements. The views expressed are subject to change at any time in response to changing circumstances in the market. Wells Fargo Asset Management and the Fund disclaim any obligation to publicly update or revise any views expressed or forward-looking statements.
INVESTMENT PRODUCTS: NOT FDIC INSURED ◾ NO BANK GUARANTEE ◾ MAY LOSE VALUE
Wells Fargo Intrinsic World Equity Fund | 1
Table of Contents
Letter to shareholders (unaudited)

Andrew Owen
President
Wells Fargo Funds
Dear Shareholder:
We are pleased to offer you this annual report for the Wells Fargo Intrinsic World Equity Fund for the12-month period that ended October 31, 2019. After the first few months of the period featured high volatility and yielded minimal returns, U.S. investors generally saw markets recover during the second half amid intensifying market volatility, global economic growth concerns, international trade stare downs, and simmering geopolitical tensions.
Overall, both fixed-income and equity investors enjoyed healthy returns despite market volatility. For the period, U.S. stocks, based on the S&P 500 Index,1 gained 14.33% and international stocks, as measured by the MSCI ACWI ex USA Index (Net),2 returned 11.27%. The MSCI EM Index (Net)3 gained 11.86%. Among fixed income investors, the Bloomberg Barclays U.S. Aggregate Bond Index4 added 11.51%, the Bloomberg Barclays Global Aggregateex-USD Index5 added 7.84%, the Bloomberg Barclays Municipal Bond Index6 gained 9.42%, and the ICE BofAML U.S. High Yield Index7 added 8.32%.
Investors confronted unsettling events during the fourth quarter of 2018.
During the fourth quarter of 2018, investors grew concerned about the pace and sustainability of the global economic expansion. The U.S. Bureau of Economic Analysis reported third-quarter U.S. gross domestic product (GDP) was 3.4% on an annualized basis, which was down from the second-quarter rate. A partial U.S. government shutdown occurred, which extended into January 2019. Brexit efforts stalled, causing uncertainty for the eurozone. The value of the renminbi declined even as the People’s Bank of China cut reserve requirement ratios, accelerated infrastructure spending, and cut taxes in efforts to spur economic activity.
The combination of news in the U.S. and generally weak economic indicators outside of the U.S. caused investors to seek safe havens. December’s S&P 500 Index performance was the worst since 1931. Globally, fixed-income investments fared better than stocks during the last two months of the year. Even as indicators suggested growth was restrained, the U.S. Federal Reserve (Fed) increased the federal funds rate by 25 basis points (bps; 100 bps equal 1.00%) in December 2018 to a target range of between 2.25% and 2.50%. Many observers expressed concerns that higher rates could slow the economy further.
| 1 | The S&P 500 Index consists of 500 stocks chosen for market size, liquidity, and industry group representation. It is a market-value-weighted index with each stock’s weight in the index proportionate to its market value. You cannot invest directly in an index. |
| 2 | The Morgan Stanley Capital International (MSCI) All Country World Index (ACWI) ex USA Index (Net) is a free-float-adjusted market-capitalization-weighted index that is designed to measure the equity market performance of developed and emerging markets, excluding the United States. Source: MSCI. MSCI makes no express or implied warranties or representations and shall have no liability whatsoever with respect to any MSCI data contained herein. The MSCI data may not be further redistributed or used as a basis for other indices or any securities or financial products. This report is not approved, reviewed, or produced by MSCI. You cannot invest directly in an index. |
| 3 | The MSCI Emerging Markets (EM) Index (Net) is a free-float-adjusted market-capitalization-weighted index that is designed to measure the equity market performance of emerging markets. You cannot invest directly in an index. |
| 4 | The Bloomberg Barclays U.S. Aggregate Bond Index is a broad-based benchmark that measures the investment-grade, U.S. dollar-denominated, fixed-rate taxable bond market, including Treasuries, government-related and corporate securities, mortgage-backed securities (agency fixed-rate and hybrid adjustable-rate mortgage pass-throughs), asset-backed securities, and commercial mortgage-backed securities. You cannot invest directly in an index. |
| 5 | The Bloomberg Barclays Global Aggregateex-USD Index is an unmanaged index that provides a broad-based measure of the global investment-grade fixed-income markets excluding the U.S. dollar-denominated debt market. You cannot invest directly in an index. |
| 6 | The Bloomberg Barclays Municipal Bond Index is an unmanaged index composed of long-termtax-exempt bonds with a minimum credit rating of Baa. You cannot invest directly in an index. |
| 7 | The ICE BofAML U.S. High Yield Index is a market-capitalization-weighted index of domestic and Yankee high-yield bonds. The index tracks the performance of high-yield securities traded in the U.S. bond market. You cannot invest directly in an index. Copyright 2019. ICE Data Indices, LLC. All rights reserved. |
2 | Wells Fargo Intrinsic World Equity Fund
Table of Contents
Letter to shareholders (unaudited)
The market climbs a wall of worry.
Investment returns early in 2019 appeared to reaffirm the adage that markets climb a wall of worry as the new year began. The S&P 500 Index gained 8.01% in January, the best monthly performance in 30 years. Returns for the MSCI ACWI ex USA Index (Net), the Bloomberg Barclays U.S. Aggregate Bond Index, and the Bloomberg Barclays Global Aggregateex-USD Index also were positive.
In February 2019, signs of slowing global growth grew more ominous. The U.S. Bureau of Economic Analysis announced fourth-quarter 2018 GDP grew at an annualized 2.2% rate, down from the levels of the prior two quarters. In a February report, the Bank of England forecast the slowest growth since the financial crisis for 2019. China and the U.S. continued to wrangle over trade issues. By the end of the first quarter of 2019, more accommodative Fed sentiment and steady, if not spectacular, U.S. economic and business metrics encouraged domestic investors.
Early second-quarter 2019 enthusiasm among investors faded.
During April 2019, sustained low inflation, solid employment data, and first-quarter U.S. GDP grew at an annualized rate of 3.2% supported favorable sentiment. During May, markets tumbled on mixed investment signals. In the U.S., partisan wrangling ramped up as Democrats and Republicans set their sights on 2020 presidential politics. The U.K.’s Brexit disagreements caused Prime Minister Theresa May to resign. Boris Johnson succeeded her only to exacerbate uncertainty about Brexit’s resolution ahead of an October 2019 deadline. The European Commission downgraded the 2019 growth forecast to 1.2%. The U.S. increased tariffs on products from China, China responded, and then talks broke down. President Donald Trump threatened to turn his foreign policy tariff tool to Mexico over immigration issues.
Halfway through 2019, investors regrouped. Just as the investment horizon appeared to darken, sentiment turned and U.S. equity markets gained during June and July. The gains, primarily driven by geopolitical and monetary policy events, pushed equity markets to new highs. European Central Bank President Mario Draghi said that if the outlook doesn’t improve, the bank would cut rates or buy more assets to prop up inflation. President Trump backed off of tariff threats against Mexico and China. In the U.S., the Fed implemented a 0.25% federal funds rate cut in July.
Later in July 2019, the U.S. reversed course and threatened to impose higher tariffs on China’s exports after talks failed. China responded with tariff threats of its own and devalued the renminbi, a move that roiled global markets. Major U.S. stock market indices closed July with the worst weekly results of the year. Bond prices gained as Treasury yields fell to levels not seen since November 2016 and the yield curve inverted at multiple points along the30-year arc.
In microcosm, August 2019 encapsulated many of the unnerving events that had plagued investors for months. The U.S.-China trade relationship swung from antagonistic to hopeful and back again with no signs of compromise. Evidence of a continued global economic slowdown continued to mount as central banks in China, New Zealand, and Thailand cut interest rates. Industrial and manufacturing data declined in China, Canada, Japan, and Germany. Adding to the uncertain environment, Italy’s prime minister resigned, many feared a crackdown in Hong Kong as protestors sustained their calls for reform, and Boris Johnson planned to suspend Parliament as Brexit’s deadline neared.
In the U.S., September 2019 saw the Fed join other central banks in cutting interest rates. U.S. manufacturing data, as reported by the Institute for Supply Management, disappointed investors. The U.S. House of Representatives announced it would pursue an impeachment investigation of President Trump. Meanwhile, the Brexit impasse showed no signs of resolution. Officials in China said that hitting the country’s economic
“In February 2019, signs of slowing global growth grew more ominous.”
Wells Fargo Intrinsic World Equity Fund | 3
Table of Contents
Letter to shareholders (unaudited)
“The Fed lowered interest rates another quarter point in late October, its third rate cut in four months.”
|
For further information about your Fund, contact your investment professional, visit our website at wfam.com, or call us directly at1-800-222-8222. |
growth goals for the year would be difficult considering the weight of tariffs and trade restrictions. So while the S&P 500 Index finished the third quarter with the bestyear-to-date returns in more than 20 years, amid signs of equity investors taking money out of the stock market, concerns about future returns remained.
In October 2019, a relaxing of U.S.-China trade tensions and renewed optimism for a U.K. Brexit deal combined with positive macroeconomic data to support financial markets overall. The initial estimate of U.S. third-quarter GDP growth, announced in late October, was a resilient 1.9% annualized rate while the U.S. unemployment rate fell to a50-year low of 3.5% in September. However, despite resilience among U.S. consumers, business confidence declined while manufacturing activity contracted. Concerned with a potential economic slowdown, the Fed lowered interest rates another quarter point in late October, its third rate cut in four months. This helped push the S&P 500 Index to a newall-time high while emerging market equities rallied and global bonds declined overall, reflecting a broad pickup in risk appetite.
Don’t let short-term uncertainty derail long-term investment goals.
Periods of investment uncertainty can present challenges, but experience has taught us that maintaining long-term investment goals can be an effective way to plan for the future. To help you create a sound strategy based on your personal goals and risk tolerance, Wells Fargo Funds offers more than 100 mutual funds spanning a wide range of asset classes and investment styles. Although diversification cannot guarantee an investment profit or prevent losses, we believe it can be an effective way to manage investment risk and potentially smooth out overall portfolio performance. We encourage investors to know their investments and to understand that appropriate levels of risk-taking may unlock opportunities.
Thank you for choosing to invest with Wells Fargo Funds. We appreciate your confidence in us and remain committed to helping you meet your financial needs.
Sincerely,

Andrew Owen
President
Wells Fargo Funds
4 | Wells Fargo Intrinsic World Equity Fund
Table of Contents
This page is intentionally left blank.
Table of Contents
Performance highlights (unaudited)
Investment objective
The Fund seeks long-term capital appreciation.
Manager
Wells Fargo Funds Management, LLC
Subadviser
Wells Capital Management Incorporated
Portfolio managers
Miguel E. Giaconi, CFA®‡*
Amit Kumar
Jean-Baptiste Nadal, CFA®‡
Average annual total returns (%) as of October 31, 20191
| Including sales charge | Excluding sales charge | Expense ratios2 (%) | ||||||||||||||||||||||||||||||||
| Inception date | 1 year | 5 year | 10 year | 1 year | 5 year | 10 year | Gross | Net3 | ||||||||||||||||||||||||||
| Class A (EWEAX) | 4-30-1996 | 5.60 | 6.55 | 9.30 | 12.02 | 7.82 | 9.95 | 1.47 | 1.35 | |||||||||||||||||||||||||
| Class C (EWECX) | 5-18-2007 | 10.19 | 7.02 | 9.13 | 11.19 | 7.02 | 9.13 | 2.22 | 2.10 | |||||||||||||||||||||||||
| Administrator Class (EWEIX) | 5-18-2007 | – | – | – | 12.13 | 7.98 | 10.16 | 1.39 | 1.25 | |||||||||||||||||||||||||
| Institutional Class (EWENX)4 | 7-30-2010 | – | – | – | 12.49 | 8.28 | 10.40 | 1.14 | 0.95 | |||||||||||||||||||||||||
| MSCI World Index (Net)5 | – | – | – | – | 12.69 | 7.58 | 9.48 | – | – | |||||||||||||||||||||||||
Figures quoted represent past performance, which is no guarantee of future results, and do not reflect taxes that a shareholder may pay on fund distributions or the redemption of fund shares. Investment return and principal value of an investment will fluctuate so that an investor’s shares, when redeemed, may be worth more or less than their original cost. Performance shown without sales charges would be lower if sales charges were reflected. Current performance may be lower or higher than the performance data quoted, which assumes the reinvestment of dividends and capital gains. Currentmonth-end performance is available on the Fund’s website,wfam.com.
Index returns do not include transaction costs associated with buying and selling securities, any mutual fund fees or expenses, or any taxes. It is not possible to invest directly in an index.
For Class A shares, the maximumfront-end sales charge is 5.75%. For Class C shares, the maximum contingent deferred sales charge is 1.00%. Performance including a contingent deferred sales charge assumes the sales charge for the corresponding time period. Administrator Class and Institutional Class shares are sold without afront-end sales charge or contingent deferred sales charge.
Stock values fluctuate in response to the activities of individual companies and general market and economic conditions. Foreign investments are especially volatile and can rise or fall dramatically due to differences in the political and economic conditions of the host country. These risks are generally intensified in emerging markets. The use of derivatives may reduce returns and/or increase volatility. Certain investment strategies tend to increase the total risk of an investment (relative to the broader market). The Fund is exposed to focused portfolio risk, geographic risk, and smaller company securities risk. Consult the Fund’s prospectus for additional information on these and other risks.
Please see footnotes on page 7.
6 | Wells Fargo Intrinsic World Equity Fund
Table of Contents
Performance highlights (unaudited)
| Growth of $10,000 investment as of October 31, 20196 |
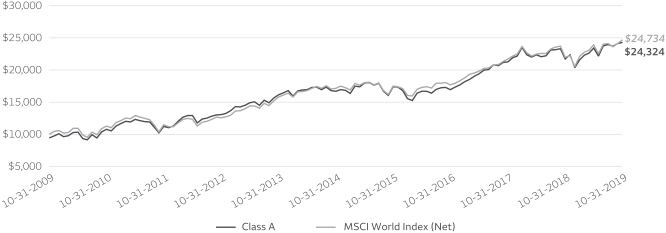 |
| ‡ | CFA® and Chartered Financial Analyst® are trademarks owned by CFA Institute. |
| * | Mr. Giaconi became a portfolio manager of the Fund on June 21, 2019. |
| 1 | Historical performance shown prior to July 19, 2010, is based on the performance of the Fund’s predecessor, Evergreen Intrinsic World Equity Fund. |
| 2 | Reflects the expense ratios as stated in the most recent prospectuses. The expense ratios shown are subject to change and may differ from the annualized expense ratios shown in the financial highlights of this report. |
| 3 | The manager has contractually committed through February 29, 2020, to waive fees and/or reimburse expenses to the extent necessary to cap the expenses of each class after fee waivers at the amounts shown. Brokerage commissions, stamp duty fees, interest, taxes, acquired fund fees and expenses (if any), and extraordinary expenses are excluded from the expense cap. Prior to or after the commitment expiration date, the cap may be increased or the commitment to maintain the cap may be terminated only with the approval of the Board of Trustees. Without this cap, the Fund’s returns would have been lower. The expense ratio paid by an investor is the net expense ratio (the total annual fund operating expenses after fee waivers) as stated in the prospectuses. |
| 4 | Historical performance shown for Institutional Class shares prior to their inception reflects the performance of Administrator Class shares, and includes the higher expenses applicable to Administrator Class shares. If these expenses had not been included, returns for Institutional Class shares would be higher. |
| 5 | The Morgan Stanley Capital International (MSCI) World Index (Net) is a free-float-adjusted market-capitalization-weighted index that is designed to measure the equity market performance of developed markets. Source: MSCI. MSCI makes no express or implied warranties or representations and shall have no liability whatsoever with respect to any MSCI data contained herein. The MSCI data may not be further redistributed or used as a basis for other indices or any securities or financial products. This report is not approved, reviewed, or produced by MSCI. You cannot invest directly in an index. |
| 6 | The chart compares the performance of Class A shares for the most recent ten years with the MSCI World Index (Net). The chart assumes a hypothetical investment of $10,000 in Class A shares and reflects all operating expenses and assumes the maximum initial sales charge of 5.75%. |
| 7 | The ten largest holdings, excluding cash and cash equivalents and any money market funds, are calculated based on the value of the investments divided by total net assets of the Fund. Holdings are subject to change and may have changed since the date specified. |
| 8 | Amounts are calculated based on the total long-term investments of the Fund. These amounts are subject to change and may have changed since the date specified. |
| ** | This security was no longer held at the end of the reporting period. |
Wells Fargo Intrinsic World Equity Fund | 7
Table of Contents
Performance highlights (unaudited)
MANAGER’S DISCUSSION
Fund highlights
| ∎ | The Fund underperformed its benchmark, the MSCI World Index (Net), for the12-month period that ended October 31, 2019. |
| ∎ | Stock selection in and an overweight to the worst-performing energy sector detracted from the Fund’s relative return. Also, stock selection in the consumer discretionary sector subtracted value. Relative sector weightings, which are aby-product of ourbottom-up stock selection process, had anet-negative effect. |
| ∎ | Stock selection was positive in the materials and consumer staples sectors. |
Global markets were volatile during the period.
The Fund underperformed its benchmark in an environment of slowing global growth, dovish monetary policies with low interest rates, the ebbs and flows of U.S.-China trade negotiations, and Brexit uncertainties. U.S. equities produced strong positive returns during the period, as the economy showed relative strength.Non-U.S. equity markets were weaker, as investors faced much weaker European growth driven partly by softening exports to China and reduced corporate earnings growth.
We adhered to the same intrinsic value investment philosophy and process and consistently applied it to investment selection for the Fund. We define intrinsic value as the present discounted value of future cash streams. Our fundamental analysis involves identifying the stocks that we believe are high-quality, value-creating businesses selling at a discount to our estimate of intrinsic or true value and that possess what we believe are identifiable catalysts that could close the valuation gap over our investment time horizon. Over the long term, we seek to add value primarily through stock selection due to our research-intensive,bottom-up investment process.
| Ten largest holdings(%) as of October 31, 20197 | ||||
Visa Incorporated Class A | 3.52 | |||
Microsoft Corporation | 3.51 | |||
Financial Select Sector SPDR Fund ETF | 3.22 | |||
Alphabet Incorporated Class C | 2.81 | |||
Motorola Solutions Incorporated | 2.73 | |||
Cigna Corporation | 2.70 | |||
Medtronic plc | 2.59 | |||
Sony Corporation | 2.56 | |||
Advance Auto Parts Incorporated | 2.56 | |||
Comcast Corporation Class A | 2.52 | |||
Our long-term investment process typically has resulted in low portfolio turnover as we seek to invest in businesses over a three- to five-year investment horizon. During the reporting period, we sold the Fund’s positions in two companies across two sectors and added positions in three new companies across three sectors. Positions sold from the Fund during the period included Diageo plc in the consumer staples sector and Bayer AG in health care. Positions added to the Fund included AXA S.A. in the financials sector, Medtronic plc in health care, and SAP SE in information technology. All buy and sell decisions were driven by company-specific, fundamental analysis rather thantop-down, sector-allocation considerations.
| Sector distribution as of October 31, 20198 |
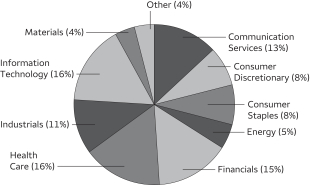 |
| Country allocation as of October 31, 20198 |
 |
Please see footnotes on page 7.
8 | Wells Fargo Intrinsic World Equity Fund
Table of Contents
Performance highlights (unaudited)
Stock selection and an overweight in the weak energy sector hindered performance.
The Fund’s relative weakness in the energy sector for the period was hurt by a U.S. shale exploration and production company, EOG Resources, Incorporated, and Schlumberger Limited**, a global leader inoil-field services.
Stock selection in several sectors was positive.
Stock selection in the materials and consumer staples sectors contributed to relative performance. In materials, Vulcan Materials Company—a supplier of construction aggregates including crushed stone, sand, and gravel that goes into construction projects—was the top contributor. In consumer staples, top performers included the world’s largest snacks and candies company, Mondelēz International, Inc., and the world’s largest food and beverage company, Nestlé S.A.
We remain confident in our investment process.
In our view, the12-month period that ended October 31, 2019, demonstrated the benefits of our intrinsic value approach and our focus on high-quality companies. Quality companies typically possess the flexibility to navigate periods of instability. The increased market volatility also bolsters the team’s approach, as valuations become more attractive and return potential surges. While U.S. markets remain elevated,non-U.S. companies possess attractive valuations and may be several years behind their U.S. peers, providing a compelling case for broad global diversification.
The intrinsic value philosophy and process reflect our willingness to buy a high-quality company’s intrinsic value at a substantive discount and to do so where we can identify internally driven catalysts that will close this value gap over a long time horizon. Our primary focus is allowing company management teams to identify the most appropriate uses of free cash. These uses may include balance sheet restructuring, share repurchases, new products, acquisitions, or marketing. We believe company management teams have superior knowledge of their markets, competitors, and customers, enabling them to identify the most effective uses of free cash.
There are some potential risks that could affect short-term returns, including protectionism and trade wars, sharp slowdown in the global and U.S. economy, the U.S. Federal Chair Powell becoming too accommodating or restrictive, U.S. politics, hard Brexit implementation, and eurozone populism. We remain cautious in our positioning and believe the Fund is positioned to perform well in this environment. The Fund could further benefit from a shift from growth to value leadership, a modest normalization of interest rates, stability in the energy markets, continued market volatility, accelerated earnings growth in Europe, and further economic reforms in Continental Europe.
Please see footnotes on page 7.
Wells Fargo Intrinsic World Equity Fund | 9
Table of Contents
As a shareholder of the Fund, you incur two types of costs: (1) transaction costs, including sales charges (loads) on purchase payments and contingent deferred sales charges (if any) on redemptions and (2) ongoing costs, including management fees, distribution(12b-1) and/or shareholder servicing fees, and other Fund expenses. This example is intended to help you understand your ongoing costs (in dollars) of investing in the Fund and to compare these costs with the ongoing costs of investing in other mutual funds.
The example is based on an investment of $1,000 invested at the beginning of thesix-month period and held for the entire period from May 1, 2019 to October 31, 2019.
Actual expenses
The “Actual” line of the table below provides information about actual account values and actual expenses. You may use the information in this line, together with the amount you invested, to estimate the expenses that you paid over the period. Simply divide your account value by $1,000 (for example, an $8,600 account value divided by $1,000 = 8.6), then multiply the result by the number in the “Actual” line under the heading entitled “Expenses paid during period” for your applicable class of shares to estimate the expenses you paid on your account during this period.
Hypothetical example for comparison purposes
The “Hypothetical” line of the table below provides information about hypothetical account values and hypothetical expenses based on the Fund’s actual expense ratio and an assumed rate of return of 5% per year before expenses, which is not the Fund’s actual return. The hypothetical account values and expenses may not be used to estimate the actual ending account balance or expenses you paid for the period. You may use this information to compare the ongoing costs of investing in the Fund and other funds. To do so, compare this 5% hypothetical example with the 5% hypothetical examples that appear in the shareholder reports of the other funds.
Please note that the expenses shown in the table are meant to highlight your ongoing costs only and do not reflect any transactional costs, such as sales charges (loads) and contingent deferred sales charges. Therefore, the “Hypothetical” line of the table is useful in comparing ongoing costs only and will not help you determine the relative total costs of owning different funds. In addition, if these transactional costs were included, your costs would have been higher.
| Beginning account value 5-1-2019 | Ending account value 10-31-2019 | Expenses paid during the period¹ | Annualized net expense ratio | |||||||||||||
Class A | ||||||||||||||||
Actual | $ | 1,000.00 | $ | 1,038.52 | $ | 6.94 | 1.35 | % | ||||||||
Hypothetical (5% return before expenses) | $ | 1,000.00 | $ | 1,018.40 | $ | 6.87 | 1.35 | % | ||||||||
Class C | ||||||||||||||||
Actual | $ | 1,000.00 | $ | 1,034.74 | $ | 10.77 | 2.10 | % | ||||||||
Hypothetical (5% return before expenses) | $ | 1,000.00 | $ | 1,014.62 | $ | 10.66 | 2.10 | % | ||||||||
Administrator Class | ||||||||||||||||
Actual | $ | 1,000.00 | $ | 1,039.69 | $ | 6.43 | 1.25 | % | ||||||||
Hypothetical (5% return before expenses) | $ | 1,000.00 | $ | 1,018.90 | $ | 6.36 | 1.25 | % | ||||||||
Institutional Class | ||||||||||||||||
Actual | $ | 1,000.00 | $ | 1,041.06 | $ | 4.89 | 0.95 | % | ||||||||
Hypothetical (5% return before expenses) | $ | 1,000.00 | $ | 1,020.42 | $ | 4.84 | 0.95 | % | ||||||||
| 1 | Expenses paid is equal to the annualized net expense ratio of each class multiplied by the average account value over the period, multiplied by the number of days in the most recent fiscal half-year divided by the number of days in the fiscal year (to reflect theone-half-year period). |
10 | Wells Fargo Intrinsic World Equity Fund
Table of Contents
Portfolio of investments—October 31, 2019
| Shares | Value | |||||||||||||||
| Common Stocks: 94.83% | ||||||||||||||||
| Belgium: 1.68% | ||||||||||||||||
Anheuser-Busch InBev NV ADR (Consumer Staples, Beverages) « | 31,400 | $ | 2,536,178 | |||||||||||||
|
| |||||||||||||||
| France: 4.82% | ||||||||||||||||
Air Liquide SA (Materials, Chemicals) | 23,485 | 3,119,564 | ||||||||||||||
AXA SA (Financials, Insurance) | 32,100 | 847,950 | ||||||||||||||
Capgemini SA (Information Technology, IT Services) | 29,500 | 3,321,390 | ||||||||||||||
| 7,288,904 | ||||||||||||||||
|
| |||||||||||||||
| Germany: 2.50% | ||||||||||||||||
Deutsche Telekom AG (Communication Services, Diversified Telecommunication Services) | 166,800 | 2,933,352 | ||||||||||||||
SAP SE (Information Technology, Software) | 6,400 | 847,985 | ||||||||||||||
| 3,781,337 | ||||||||||||||||
|
| |||||||||||||||
| Hong Kong: 3.52% | ||||||||||||||||
AIA Group Limited (Financials, Insurance) | 322,000 | 3,223,719 | ||||||||||||||
Samsonite International SA (Consumer Discretionary, Textiles, Apparel & Luxury Goods) 144A | 1,022,190 | 2,105,443 | ||||||||||||||
| 5,329,162 | ||||||||||||||||
|
| |||||||||||||||
| Ireland: 2.59% | ||||||||||||||||
Medtronic plc (Health Care, Health Care Equipment & Supplies) | 36,000 | 3,920,400 | ||||||||||||||
|
| |||||||||||||||
| Japan: 8.49% | ||||||||||||||||
Nidec Corporation (Industrials, Electrical Equipment) | 23,700 | 3,530,091 | ||||||||||||||
ORIX Corporation (Financials, Diversified Financial Services) | 164,100 | 2,593,172 | ||||||||||||||
Renesas Electronics Corporation (Information Technology, Semiconductors & Semiconductor Equipment) † | 415,900 | 2,849,949 | ||||||||||||||
Sony Corporation (Consumer Discretionary, Household Durables) | 63,140 | 3,873,530 | ||||||||||||||
| 12,846,742 | ||||||||||||||||
|
| |||||||||||||||
| Netherlands: 5.82% | ||||||||||||||||
AerCap Holdings NV (Industrials, Trading Companies & Distributors) † | 60,300 | 3,490,164 | ||||||||||||||
Airbus SE (Industrials, Aerospace & Defense) | 15,400 | 2,205,692 | ||||||||||||||
Unilever NV (Consumer Staples, Personal Products) | 52,400 | 3,104,176 | ||||||||||||||
| 8,800,032 | ||||||||||||||||
|
| |||||||||||||||
| Switzerland: 5.66% | ||||||||||||||||
Nestle SA (Consumer Staples, Food Products) | 29,500 | 3,149,458 | ||||||||||||||
Novartis AG ADR (Health Care, Pharmaceuticals) | 31,300 | 2,736,872 | ||||||||||||||
Roche Holding AG (Health Care, Pharmaceuticals) | 8,900 | 2,677,669 | ||||||||||||||
| 8,563,999 | ||||||||||||||||
|
| |||||||||||||||
| United Kingdom: 5.33% | ||||||||||||||||
Aon plc (Financials, Insurance) | 15,300 | 2,955,348 | ||||||||||||||
Royal Dutch Shell plc Class A (Energy, Oil, Gas & Consumable Fuels) | 92,000 | 2,671,388 | ||||||||||||||
Vodafone Group plc (Communication Services, Wireless Telecommunication Services) | 1,191,500 | 2,429,327 | ||||||||||||||
| 8,056,063 | ||||||||||||||||
|
| |||||||||||||||
| United States: 54.42% | ||||||||||||||||
Abbott Laboratories (Health Care, Health Care Equipment & Supplies) | 17,300 | 1,446,453 | ||||||||||||||
Advance Auto Parts Incorporated (Consumer Discretionary, Specialty Retail) | 23,800 | 3,867,024 | ||||||||||||||
Alphabet Incorporated Class C (Communication Services, Interactive Media & Services) † | 3,370 | 4,246,571 | ||||||||||||||
American International Group Incorporated (Financials, Insurance) | 66,600 | 3,527,136 | ||||||||||||||
Apple Incorporated (Information Technology, Technology Hardware, Storage & Peripherals) | 6,700 | 1,666,692 | ||||||||||||||
The accompanying notes are an integral part of these financial statements.
Wells Fargo Intrinsic World Equity Fund | 11
Table of Contents
Portfolio of investments—October 31, 2019
| Shares | Value | |||||||||||||||
| United States (continued) | ||||||||||||||||
BB&T Corporation (Financials, Banks) | 54,800 | $ | 2,907,140 | |||||||||||||
Chevron Corporation (Energy, Oil, Gas & Consumable Fuels) | 23,900 | 2,775,746 | ||||||||||||||
Cigna Corporation (Health Care, Health Care Providers & Services) | 22,870 | 4,081,380 | ||||||||||||||
CIT Group Incorporated (Financials, Banks) | 71,800 | 3,079,502 | ||||||||||||||
Comcast Corporation Class A (Communication Services, Media) | 84,900 | 3,805,218 | ||||||||||||||
Dollar Tree Incorporated (Consumer Discretionary, Multiline Retail) † | 23,500 | 2,594,400 | ||||||||||||||
Eli Lilly & Company (Health Care, Pharmaceuticals) | 21,100 | 2,404,345 | ||||||||||||||
EOG Resources Incorporated (Energy, Oil, Gas & Consumable Fuels) | 28,000 | 1,940,680 | ||||||||||||||
General Dynamics Corporation (Industrials, Aerospace & Defense) | 16,900 | 2,987,920 | ||||||||||||||
Gilead Sciences Incorporated (Health Care, Biotechnology) | 46,000 | 2,930,660 | ||||||||||||||
Honeywell International Incorporated (Industrials, Industrial Conglomerates) | 19,000 | 3,281,870 | ||||||||||||||
Intercontinental Exchange Incorporated (Financials, Capital Markets) | 31,300 | 2,952,216 | ||||||||||||||
Merck & Company Incorporated (Health Care, Pharmaceuticals) | 39,300 | 3,405,738 | ||||||||||||||
Microsoft Corporation (Information Technology, Software) | 37,000 | 5,304,690 | ||||||||||||||
Mondelez International Incorporated Class A (Consumer Staples, Food Products) | 58,100 | 3,047,345 | ||||||||||||||
Motorola Solutions Incorporated (Information Technology, Communications Equipment) |
| 24,800 | 4,124,736 | |||||||||||||
The Walt Disney Company (Communication Services, Entertainment) | 23,000 | 2,988,160 | ||||||||||||||
United Parcel Service Incorporated Class B (Industrials, Air Freight & Logistics) | 15,800 | 1,819,686 | ||||||||||||||
Verizon Communications Incorporated (Communication Services, Diversified Telecommunication Services) | 41,400 | 2,503,458 | ||||||||||||||
Visa Incorporated Class A (Information Technology, IT Services) | 29,800 | 5,330,028 | ||||||||||||||
Vulcan Materials Company (Materials, Construction Materials) | 23,140 | 3,306,012 | ||||||||||||||
| 82,324,806 | ||||||||||||||||
|
| |||||||||||||||
Total Common Stocks (Cost $102,200,958) | 143,447,623 | |||||||||||||||
|
| |||||||||||||||
Exchange-Traded Funds: 4.17% | ||||||||||||||||
| United States: 4.17% | ||||||||||||||||
Energy Select Sector SPDR Fund ETF « | 24,700 | 1,431,612 | ||||||||||||||
Financial Select Sector SPDR Fund ETF | 169,900 | 4,876,130 | ||||||||||||||
Total Exchange-Traded Funds (Cost $5,970,748) | 6,307,742 | |||||||||||||||
|
| |||||||||||||||
| Yield | ||||||||||||||||
| Short-Term Investments: 2.14% | ||||||||||||||||
| Investment Companies: 2.14% | ||||||||||||||||
Securities Lending Cash Investments LLC (l)(r)(u) | 1.99 | % | 1,698,009 | 1,698,178 | ||||||||||||
Wells Fargo Government Money Market Fund Select Class (l)(u) | 1.75 | 1,542,025 | 1,542,025 | |||||||||||||
Total Short-Term Investments (Cost $3,240,203) | 3,240,203 | |||||||||||||||
|
| |||||||||||||||
| Total investments in securities (Cost $111,411,909) | 101.14 | % | $ | 152,995,568 | ||||
Other assets and liabilities, net | (1.14 | ) | (1,718,481 | ) | ||||
|
|
|
| |||||
| Total net assets | 100.00 | % | $ | 151,277,087 | ||||
|
|
|
| |||||
| « | All or a portion of this security is on loan. |
| 144A | The security may be resold in transactions exempt from registration, normally to qualified institutional buyers, pursuant to Rule 144A under the Securities Act of 1933. |
| † | Non-income-earning security |
| (l) | The issuer of the security is an affiliated person of the Fund as defined in the Investment Company Act of 1940. |
| (r) | The investment is anon-registered investment company purchased with cash collateral received from securities on loan. |
| (u) | The rate represents the7-day annualized yield at period end. |
Abbreviations:
| ADR | American depositary receipt |
The accompanying notes are an integral part of these financial statements.
12 | Wells Fargo Intrinsic World Equity Fund
Table of Contents
Portfolio of investments—October 31, 2019
Investments in Affiliates
An affiliated investment is an investment in which the Fund owns at least 5% of the outstanding voting shares of the issuer or as a result of other relationships, such as the Fund and the issuer having the same investment manager. Transactions with issuers that were either affiliated persons of the Fund at the beginning of the period or the end of the period were as follows:
| Shares, beginning of period | Shares purchased | Shares sold | Shares, end of period | Net realized gains (losses) | Net change in unrealized gains (losses) | Income from affiliated securities | Value, end of period | % of net assets | ||||||||||||||||||||||||||||
| Short-Term Investments | ||||||||||||||||||||||||||||||||||||
Investment Companies | ||||||||||||||||||||||||||||||||||||
Securities Lending Cash Investments LLC | 2,363,341 | 59,721,090 | 60,386,422 | 1,698,009 | $ | (143 | ) | $ | 0 | $ | 67,214 | # | $ | 1,698,178 | ||||||||||||||||||||||
Wells Fargo Government Money Market Fund Select Class | 564,878 | 17,555,321 | 16,578,174 | 1,542,025 | 0 | 0 | 16,956 | 1,542,025 | ||||||||||||||||||||||||||||
|
|
|
|
|
|
|
|
|
| |||||||||||||||||||||||||||
| $ | (143 | ) | $ | 0 | $ | 84,170 | $ | 3,240,203 | 2.14 | % | ||||||||||||||||||||||||||
|
|
|
|
|
|
|
|
|
| |||||||||||||||||||||||||||
| # | Amount shown represents income before fees and rebates. |
The accompanying notes are an integral part of these financial statements.
Wells Fargo Intrinsic World Equity Fund | 13
Table of Contents
Statement of assets and liabilities—October 31, 2019
Assets | ||||
Investments in unaffiliated securities (including $1,655,113 of securities loaned), at value (cost $108,171,706) | $ | 149,755,365 | ||
Investments in affiliated securities, at value (cost $3,240,203) | 3,240,203 | |||
Foreign currency, at value (cost $78) | 76 | |||
Receivable for Fund shares sold | 4,374 | |||
Receivable for dividends | 301,135 | |||
Receivable for securities lending income, net | 499 | |||
Prepaid expenses and other assets | 10,756 | |||
|
| |||
Total assets | 153,312,408 | |||
|
| |||
Liabilities | ||||
Payable upon receipt of securities loaned | 1,698,344 | |||
Payable for Fund shares redeemed | 115,234 | |||
Management fee payable | 92,376 | |||
Administration fees payable | 25,898 | |||
Distribution fee payable | 884 | |||
Trustees’ fees and expenses payable | 3,945 | |||
Accrued expenses and other liabilities | 98,640 | |||
|
| |||
Total liabilities | 2,035,321 | |||
|
| |||
Total net assets | $ | 151,277,087 | ||
|
| |||
Net assets consist of | ||||
Paid-in capital | $ | 109,941,779 | ||
Total distributable earnings | 41,335,308 | |||
|
| |||
Total net assets | $ | 151,277,087 | ||
|
| |||
Computation of net asset value and offering price per share | ||||
Net assets – Class A | $ | 138,784,478 | ||
Shares outstanding – Class A1 | 6,433,831 | |||
Net asset value per share – Class A | $21.57 | |||
Maximum offering price per share – Class A2 | $22.89 | |||
Net assets – Class C | $ | 1,230,829 | ||
Shares outstanding – Class C1 | 59,885 | |||
Net asset value per share – Class C | $20.55 | |||
Net assets – Administrator Class | $ | 1,544,210 | ||
Shares outstanding – Administrator Class1 | 71,905 | |||
Net asset value per share – Administrator Class | $21.48 | |||
Net assets – Institutional Class | $ | 9,717,570 | ||
Shares outstanding – Institutional Class1 | 450,900 | |||
Net asset value per share – Institutional Class | $21.55 | |||
| 1 | The Fund has an unlimited number of authorized shares. |
| 2 | Maximum offering price is computed as 100/94.25 of net asset value. On investments of $50,000 or more, the offering price is reduced. |
The accompanying notes are an integral part of these financial statements.
14 | Wells Fargo Intrinsic World Equity Fund
Table of Contents
Statement of operations—year ended October 31, 2019
Investment income | ||||
Dividends (net of foreign withholding taxes of $156,207) | $ | 3,086,503 | ||
Income from affiliated securities | 76,560 | |||
|
| |||
Total investment income | 3,163,063 | |||
|
| |||
Expenses | ||||
Management fee | 1,245,409 | |||
Administration fees | ||||
Class A | 282,202 | |||
Class C | 5,384 | |||
Administrator Class | 1,988 | |||
Institutional Class | 10,457 | |||
Shareholder servicing fees | ||||
Class A | 335,955 | |||
Class C | 6,409 | |||
Administrator Class | 3,748 | |||
Distribution fee | ||||
Class C | 19,220 | |||
Custody and accounting fees | 39,368 | |||
Professional fees | 49,783 | |||
Registration fees | 67,871 | |||
Shareholder report expenses | 38,758 | |||
Trustees’ fees and expenses | 21,652 | |||
Other fees and expenses | 18,976 | |||
|
| |||
Total expenses | 2,147,180 | |||
Less: Fee waivers and/or expense reimbursements | ||||
Fund-level | (177,971 | ) | ||
Class C | (92 | ) | ||
Administrator Class | (251 | ) | ||
Institutional Class | (5,709 | ) | ||
|
| |||
Net expenses | 1,963,157 | |||
|
| |||
Net investment income | 1,199,906 | |||
|
| |||
Realized and unrealized gains (losses) on investments | ||||
Net realized losses on | ||||
Unaffiliated securities | (425,165 | ) | ||
Affiliated securities | (143 | ) | ||
|
| |||
Net realized losses on investments | (425,308 | ) | ||
Net change in unrealized gains (losses) on investments | 15,848,146 | |||
|
| |||
Net realized and unrealized gains (losses) on investments | 15,422,838 | |||
|
| |||
Net increase in net assets resulting from operations | $ | 16,622,744 | ||
|
| |||
The accompanying notes are an integral part of these financial statements.
Wells Fargo Intrinsic World Equity Fund | 15
Table of Contents
Statement of changes in net assets
| Year ended October 31, 2019 | Year ended October 31, 2018 | |||||||||||||||
Operations | ||||||||||||||||
Net investment income | $ | 1,199,906 | $ | 1,147,480 | ||||||||||||
Net realized gains (losses) on investments | (425,308 | ) | 14,917,116 | |||||||||||||
Net change in unrealized gains (losses) on investments | 15,848,146 | (12,122,849 | ) | |||||||||||||
|
| |||||||||||||||
Net increase in net assets resulting from operations | 16,622,744 | 3,941,747 | ||||||||||||||
|
| |||||||||||||||
Distributions to shareholders from net investment income and net realized gains | ||||||||||||||||
Class A | (14,576,126 | ) | (11,590,920 | ) | ||||||||||||
Class C | (592,441 | ) | (529,503 | ) | ||||||||||||
Administrator Class | (175,917 | ) | (407,346 | ) | ||||||||||||
Institutional Class | (858,807 | ) | (567,484 | ) | ||||||||||||
|
| |||||||||||||||
Total distributions to shareholders | (16,203,291 | ) | (13,095,253 | ) | ||||||||||||
|
| |||||||||||||||
Capital share transactions | Shares | Shares | ||||||||||||||
Proceeds from shares sold | ||||||||||||||||
Class A | 290,011 | 5,707,019 | 97,619 | 2,206,319 | ||||||||||||
Class C | 13,297 | 265,090 | 8,983 | 196,235 | ||||||||||||
Administrator Class | 1,768 | 36,870 | 27,473 | 617,360 | ||||||||||||
Institutional Class | 191,017 | 3,930,471 | 109,895 | 2,482,208 | ||||||||||||
|
| |||||||||||||||
| 9,939,450 | 5,502,122 | |||||||||||||||
|
| |||||||||||||||
Reinvestment of distributions | ||||||||||||||||
Class A | 748,086 | 14,204,308 | 506,636 | 11,262,955 | ||||||||||||
Class C | 30,481 | 552,615 | 23,586 | 501,242 | ||||||||||||
Administrator Class | 8,882 | 167,765 | 17,906 | 396,209 | ||||||||||||
Institutional Class | 33,977 | 643,675 | 21,129 | 469,058 | ||||||||||||
|
| |||||||||||||||
| 15,568,363 | 12,629,464 | |||||||||||||||
|
| |||||||||||||||
Payment for shares redeemed | ||||||||||||||||
Class A | (696,508 | ) | (14,099,229 | ) | (657,430 | ) | (14,893,411 | ) | ||||||||
Class C | (251,793 | ) | (4,719,953 | ) | (81,421 | ) | (1,774,406 | ) | ||||||||
Administrator Class | (14,119 | ) | (284,467 | ) | (175,686 | ) | (3,971,356 | ) | ||||||||
Institutional Class | (117,795 | ) | (2,393,973 | ) | (77,116 | ) | (1,745,497 | ) | ||||||||
|
| |||||||||||||||
| (21,497,622 | ) | (22,384,670 | ) | |||||||||||||
|
| |||||||||||||||
Net increase (decrease) in net assets resulting from capital share transactions | 4,010,191 | (4,253,084 | ) | |||||||||||||
|
| |||||||||||||||
Total increase (decrease) in net assets | 4,429,644 | (13,406,590 | ) | |||||||||||||
|
| |||||||||||||||
Net assets | ||||||||||||||||
Beginning of period | 146,847,443 | 160,254,033 | ||||||||||||||
|
| |||||||||||||||
End of period | $ | 151,277,087 | $ | 146,847,443 | ||||||||||||
|
| |||||||||||||||
The accompanying notes are an integral part of these financial statements.
16 | Wells Fargo Intrinsic World Equity Fund
Table of Contents
(For a share outstanding throughout each period)
| Year ended October 31 | ||||||||||||||||||||
| CLASS A | 2019 | 2018 | 2017 | 2016 | 2015 | |||||||||||||||
Net asset value, beginning of period | $21.70 | $23.08 | $19.53 | $22.82 | $22.39 | |||||||||||||||
Net investment income | 0.17 | 1 | 0.16 | 0.19 | 0.20 | 0.19 | ||||||||||||||
Net realized and unrealized gains (losses) on investments | 2.09 | 0.35 | 4.54 | (0.83 | ) | 0.73 | ||||||||||||||
|
|
|
|
|
|
|
|
|
| |||||||||||
Total from investment operations | 2.26 | 0.51 | 4.73 | (0.63 | ) | 0.92 | ||||||||||||||
Distributions to shareholders from | ||||||||||||||||||||
Net investment income | (0.18 | ) | (0.20 | ) | (0.23 | ) | (0.20 | ) | (0.12 | ) | ||||||||||
Net realized gains | (2.21 | ) | (1.69 | ) | (0.95 | ) | (2.46 | ) | (0.37 | ) | ||||||||||
|
|
|
|
|
|
|
|
|
| |||||||||||
Total distributions to shareholders | (2.39 | ) | (1.89 | ) | (1.18 | ) | (2.66 | ) | (0.49 | ) | ||||||||||
Net asset value, end of period | $21.57 | $21.70 | $23.08 | $19.53 | $22.82 | |||||||||||||||
Total return2 | 12.02 | % | 2.10 | % | 25.44 | % | (2.54 | )% | 4.23 | % | ||||||||||
Ratios to average net assets (annualized) | ||||||||||||||||||||
Gross expenses | 1.47 | % | 1.47 | % | 1.47 | % | 1.46 | % | 1.48 | % | ||||||||||
Net expenses | 1.35 | % | 1.35 | % | 1.35 | % | 1.37 | % | 1.40 | % | ||||||||||
Net investment income | 0.81 | % | 0.73 | % | 0.88 | % | 1.09 | % | 0.79 | % | ||||||||||
Supplemental data | ||||||||||||||||||||
Portfolio turnover rate | 13 | % | 20 | % | 21 | % | 23 | % | 32 | % | ||||||||||
Net assets, end of period (000s omitted) | $138,784 | $132,207 | $141,831 | $127,428 | $149,492 | |||||||||||||||
| 1 | Calculated based upon average shares outstanding |
| 2 | Total return calculations do not include any sales charges. |
The accompanying notes are an integral part of these financial statements.
Wells Fargo Intrinsic World Equity Fund | 17
Table of Contents
Financial highlights
(For a share outstanding throughout each period)
| Year ended October 31 | ||||||||||||||||||||
| CLASS C | 2019 | 2018 | 2017 | 2016 | 2015 | |||||||||||||||
Net asset value, beginning of period | $20.74 | $22.15 | $18.77 | $21.99 | $21.64 | |||||||||||||||
Net investment income (loss) | (0.04 | )1 | (0.00 | )1,2 | 0.03 | 1 | 0.05 | 0.01 | 1 | |||||||||||
Net realized and unrealized gains (losses) on investments | 2.06 | 0.33 | 4.38 | (0.80 | ) | 0.71 | ||||||||||||||
|
|
|
|
|
|
|
|
|
| |||||||||||
Total from investment operations | 2.02 | 0.33 | 4.41 | (0.75 | ) | 0.72 | ||||||||||||||
Distributions to shareholders from | ||||||||||||||||||||
Net investment income | (0.00 | )3 | (0.05 | ) | (0.08 | ) | (0.01 | ) | 0.00 | |||||||||||
Net realized gains | (2.21 | ) | (1.69 | ) | (0.95 | ) | (2.46 | ) | (0.37 | ) | ||||||||||
|
|
|
|
|
|
|
|
|
| |||||||||||
Total distributions to shareholders | (2.21 | ) | (1.74 | ) | (1.03 | ) | (2.47 | ) | (0.37 | ) | ||||||||||
Net asset value, end of period | $20.55 | $20.74 | $22.15 | $18.77 | $21.99 | |||||||||||||||
Total return4 | 11.19 | % | 1.33 | % | 24.54 | % | (3.26 | )% | 3.41 | % | ||||||||||
Ratios to average net assets (annualized) | ||||||||||||||||||||
Gross expenses | 2.22 | % | 2.22 | % | 2.22 | % | 2.21 | % | 2.23 | % | ||||||||||
Net expenses | 2.10 | % | 2.10 | % | 2.10 | % | 2.12 | % | 2.15 | % | ||||||||||
Net investment income (loss) | (0.18 | )% | (0.01 | )% | 0.13 | % | 0.32 | % | 0.05 | % | ||||||||||
Supplemental data | ||||||||||||||||||||
Portfolio turnover rate | 13 | % | 20 | % | 21 | % | 23 | % | 32 | % | ||||||||||
Net assets, end of period (000s omitted) | $1,231 | $5,556 | $7,015 | $7,252 | $8,958 | |||||||||||||||
| 1 | Calculated based upon average shares outstanding |
| 2 | Amount is more than $(0.005). |
| 3 | Amount is less than $0.005. |
| 4 | Total return calculations do not include any sales charges. |
The accompanying notes are an integral part of these financial statements.
18 | Wells Fargo Intrinsic World Equity Fund
Table of Contents
Financial highlights
(For a share outstanding throughout each period)
| Year ended October 31 | ||||||||||||||||||||
| ADMINISTRATOR CLASS | 2019 | 2018 | 2017 | 2016 | 2015 | |||||||||||||||
Net asset value, beginning of period | $21.60 | $22.98 | $19.43 | $22.76 | $22.33 | |||||||||||||||
Net investment income | 0.19 | 1 | 0.15 | 1 | 0.20 | 1 | 0.24 | 1 | 0.23 | 1 | ||||||||||
Net realized and unrealized gains (losses) on investments | 2.08 | 0.39 | 4.54 | (0.84 | ) | 0.75 | ||||||||||||||
|
|
|
|
|
|
|
|
|
| |||||||||||
Total from investment operations | 2.27 | 0.54 | 4.74 | (0.60 | ) | 0.98 | ||||||||||||||
Distributions to shareholders from | ||||||||||||||||||||
Net investment income | (0.18 | ) | (0.23 | ) | (0.24 | ) | (0.27 | ) | (0.18 | ) | ||||||||||
Net realized gains | (2.21 | ) | (1.69 | ) | (0.95 | ) | (2.46 | ) | (0.37 | ) | ||||||||||
|
|
|
|
|
|
|
|
|
| |||||||||||
Total distributions to shareholders | (2.39 | ) | (1.92 | ) | (1.19 | ) | (2.73 | ) | (0.55 | ) | ||||||||||
Net asset value, end of period | $21.48 | $21.60 | $22.98 | $19.43 | $22.76 | |||||||||||||||
Total return | 12.13 | % | 2.22 | % | 25.60 | % | (2.43 | )% | 4.51 | % | ||||||||||
Ratios to average net assets (annualized) | ||||||||||||||||||||
Gross expenses | 1.39 | % | 1.38 | % | 1.38 | % | 1.37 | % | 1.34 | % | ||||||||||
Net expenses | 1.25 | % | 1.25 | % | 1.25 | % | 1.22 | % | 1.15 | % | ||||||||||
Net investment income | 0.92 | % | 0.65 | % | 0.95 | % | 1.27 | % | 1.01 | % | ||||||||||
Supplemental data | ||||||||||||||||||||
Portfolio turnover rate | 13 | % | 20 | % | 21 | % | 23 | % | 32 | % | ||||||||||
Net assets, end of period (000s omitted) | $1,544 | $1,628 | $4,727 | $4,735 | $6,239 | |||||||||||||||
| 1 | Calculated based upon average shares outstanding |
The accompanying notes are an integral part of these financial statements.
Wells Fargo Intrinsic World Equity Fund | 19
Table of Contents
Financial highlights
(For a share outstanding throughout each period)
| Year ended October 31 | ||||||||||||||||||||
| INSTITUTIONAL CLASS | 2019 | 2018 | 2017 | 2016 | 2015 | |||||||||||||||
Net asset value, beginning of period | $21.69 | $23.05 | $19.51 | $22.83 | $22.40 | |||||||||||||||
Net investment income | 0.27 | 0.25 | 1 | 0.27 | 0.26 | 0.28 | ||||||||||||||
Net realized and unrealized gains (losses) on investments | 2.06 | 0.35 | 4.53 | (0.80 | ) | 0.75 | ||||||||||||||
|
|
|
|
|
|
|
|
|
| |||||||||||
Total from investment operations | 2.33 | 0.60 | 4.80 | (0.54 | ) | 1.03 | ||||||||||||||
Distributions to shareholders from | ||||||||||||||||||||
Net investment income | (0.26 | ) | (0.27 | ) | (0.31 | ) | (0.32 | ) | (0.23 | ) | ||||||||||
Net realized gains | (2.21 | ) | (1.69 | ) | (0.95 | ) | (2.46 | ) | (0.37 | ) | ||||||||||
|
|
|
|
|
|
|
|
|
| |||||||||||
Total distributions to shareholders | (2.47 | ) | (1.96 | ) | (1.26 | ) | (2.78 | ) | (0.60 | ) | ||||||||||
Net asset value, end of period | $21.55 | $21.69 | $23.05 | $19.51 | $22.83 | |||||||||||||||
Total return | 12.49 | % | 2.52 | % | 25.92 | % | (2.13 | )% | 4.72 | % | ||||||||||
Ratios to average net assets (annualized) | ||||||||||||||||||||
Gross expenses | 1.14 | % | 1.14 | % | 1.14 | % | 1.13 | % | 1.09 | % | ||||||||||
Net expenses | 0.95 | % | 0.95 | % | 0.95 | % | 0.95 | % | 0.95 | % | ||||||||||
Net investment income | 1.21 | % | 1.10 | % | 1.28 | % | 1.47 | % | 1.23 | % | ||||||||||
Supplemental data | ||||||||||||||||||||
Portfolio turnover rate | 13 | % | 20 | % | 21 | % | 23 | % | 32 | % | ||||||||||
Net assets, end of period (000s omitted) | $9,718 | $7,456 | $6,681 | $4,357 | $5,058 | |||||||||||||||
| 1 | Calculated based upon average shares outstanding |
The accompanying notes are an integral part of these financial statements.
20 | Wells Fargo Intrinsic World Equity Fund
Table of Contents
1. ORGANIZATION
Wells Fargo Funds Trust (the “Trust”), a Delaware statutory trust organized on March 10, 1999, is anopen-end management investment company registered under the Investment Company Act of 1940, as amended (the “1940 Act”). As an investment company, the Trust follows the accounting and reporting guidance in Financial Accounting Standards Board (“FASB”)Accounting Standards Codification Topic 946, Financial Services – Investment Companies. These financial statements report on the Wells Fargo Intrinsic World Equity Fund (the “Fund”) which is a diversified series of the Trust.
2. SIGNIFICANT ACCOUNTING POLICIES
The following significant accounting policies, which are consistently followed in the preparation of the financial statements of the Fund, are in conformity with U.S. generally accepted accounting principles which require management to make estimates and assumptions that affect the reported amounts of assets and liabilities, disclosure of contingent assets and liabilities at the date of the financial statements, and the reported amounts of revenues and expenses during the reporting period. Actual results could differ from those estimates.
Securities valuation
All investments are valued each business day as of the close of regular trading on the New York Stock Exchange (generally 4 p.m. Eastern Time), although the Fund may deviate from this calculation time under unusual or unexpected circumstances.
Equity securities that are listed on a foreign or domestic exchange or market are valued at the official closing price or, if none, the last sales price. If no sale occurs on the principal exchange or market that day, a fair value price will be determined in accordance with the Fund’s Valuation Procedures.
The values of securities denominated in foreign currencies are translated into U.S. dollars at rates provided by an independent foreign currency pricing source at a time each business day specified by the Wells Fargo Asset Management Pricing Committee at Wells Fargo Funds Management, LLC (“Funds Management”).
Many securities markets and exchanges outside the U.S. close prior to the close of the New York Stock Exchange and therefore may not fully reflect trading or events that occur after the close of the principal exchange in which the foreign securities are traded, but before the close of the New York Stock Exchange. If such trading or events are expected to materially affect the value of such securities, then fair value pricing procedures approved by the Board of Trustees of the Fund are applied. These procedures take into account multiple factors including movements in U.S. securities markets after foreign exchanges close. Foreign securities that are fair valued under these procedures are categorized as Level 2 and the application of these procedures may result in transfers between Level 1 and Level 2. Depending on market activity, such fair valuations may be frequent. Such fair value pricing may result in net asset values that are higher or lower than net asset values based on the last reported sales price or latest quoted bid price. On October 31, 2019, such fair value pricing was not used in pricing foreign securities.
Investments in registeredopen-end investment companies are valued at net asset value. Interests innon-registered investment companies that are redeemable at net asset value are fair valued normally at net asset value.
Investments which are not valued using any of the methods discussed above are valued at their fair value, as determined in good faith by the Board of Trustees. The Board of Trustees has established a Valuation Committee comprised of the Trustees and has delegated to it the authority to take any actions regarding the valuation of portfolio securities that the Valuation Committee deems necessary or appropriate, including determining the fair value of portfolio securities, unless the determination has been delegated to the Wells Fargo Asset Management Pricing Committee. The Board of Trustees retains the authority to make or ratify any valuation decisions or approve any changes to the Valuation Procedures as it deems appropriate. On a quarterly basis, the Board of Trustees receives reports on any valuation actions taken by the Valuation Committee or the Wells Fargo Asset Management Pricing Committee which may include items for ratification.
Foreign currency translation
The accounting records of the Fund are maintained in U.S. dollars. The values of other assets and liabilities denominated in foreign currencies are translated into U.S. dollars at rates provided by an independent foreign currency pricing source at a time each business day specified by the Wells Fargo Asset Management Pricing Committee. Purchases and sales of securities, and income and expenses are converted at the rate of exchange on the respective dates of such transactions. Net realized foreign exchange gains or losses arise from sales of foreign currencies, currency gains or losses realized between the trade and settlement dates on securities transactions, and the difference between the amounts of dividends, interest and foreign withholding taxes recorded and the U.S. dollar equivalent of the amounts actually paid or received. Net unrealized foreign exchange gains and losses arise from changes in the fair value of assets and liabilities other than investments in securities resulting from changes in exchange rates. The changes in net assets arising from changes in exchange rates of securities and the changes in net assets resulting from changes in market prices of securities are not separately presented. Such changes are included in net realized and unrealized gains or losses from investments.
Wells Fargo Intrinsic World Equity Fund | 21
Table of Contents
Notes to financial statements
Securities lending
The Fund may lend its securities from time to time in order to earn additional income in the form of fees or interest on securities received as collateral or the investment of any cash received as collateral. When securities are on loan, the Fund receives interest or dividends on those securities. Cash collateral received in connection with its securities lending transactions is invested in Securities Lending Cash Investments, LLC (the “Securities Lending Fund”). Investments in Securities Lending Fund are valued at the evaluated bid price provided by an independent pricing service. Income earned from investment in the Securities Lending Fund (net of fees and rebates), if any, is included in income from affiliated securities on the Statement of Operations.
In a securities lending transaction, the net asset value of the Fund will be affected by an increase or decrease in the value of the securities loaned and by an increase or decrease in the value of the instrument in which collateral is invested. The amount of securities lending activity undertaken by the Fund fluctuates from time to time. The Fund has the right under the lending agreement to recover the securities from the borrower on demand. In the event of default or bankruptcy by the borrower, the Fund may be prevented from recovering the loaned securities or gaining access to the collateral or may experience delays or costs in doing so. In such an event, the terms of the agreement allows the unaffiliated securities lending agent to use the collateral to purchase replacement securities on behalf of the Fund or pay the Fund the market value of the loaned securities. The Fund will bear the risk of loss with respect to depreciation of its investment of the cash collateral.
Security transactions and income recognition
Securities transactions are recorded on a trade date basis. Realized gains or losses are recorded on the basis of identified cost.
Dividend income is recognized on theex-dividend date, except for certain dividends from foreign securities, which are recorded as soon as the custodian verifies theex-dividend date. Dividend income from foreign securities is recorded net of foreign taxes withheld where recovery of such taxes is not assured.
Distributions to shareholders
Distributions to shareholders from net investment income and any net realized gains are recorded on theex-dividend date and paid at least annually. Such distributions are determined in accordance with income tax regulations and may differ from U.S. generally accepted accounting principles. Dividend sources are estimated at the time of declaration. The tax character of distributions is determined as of the Fund’s fiscal year end. Therefore, a portion of the Fund’s distributions made prior to the Fund’s fiscal year end may be categorized as a tax return of capital at year end.
Federal and other taxes
The Fund intends to continue to qualify as a regulated investment company by distributing substantially all of its investment company taxable income and any net realized capital gains (after reduction for capital loss carryforwards) sufficient to relieve it from all, or substantially all, federal income taxes. Accordingly, no provision for federal income taxes was required.
The Fund’s income and federal excise tax returns and all financial records supporting those returns for the prior three fiscal years are subject to examination by the federal and Delaware revenue authorities. Management has analyzed the Fund’s tax positions taken on federal, state, and foreign tax returns for all open tax years and does not believe that there are any uncertain tax positions that require recognition of a tax liability.
As of October 31, 2019, the aggregate cost of all investments for federal income tax purposes was $112,115,993 and the unrealized gains (losses) consisted of:
Gross unrealized gains | $ | 45,062,697 | ||
Gross unrealized losses | (4,183,122 | ) | ||
Net unrealized gains | $ | 40,879,575 | ||
As of October 31, 2019, the Fund had capital loss carryforward which consist of $440,984 in long-term capital losses.
Class allocations
The separate classes of shares offered by the Fund differ principally in applicable sales charges, distribution, shareholder servicing, and administration fees. Class specific expenses are charged directly to that share class. Investment income, common fund-level expenses, and realized and unrealized gains (losses) on investments are allocated daily to each class of shares based on the relative proportion of net assets of each class.
3. FAIR VALUATION MEASUREMENTS
Fair value measurements of investments are determined within a framework that has established a fair value hierarchy based upon the various data inputs utilized in determining the value of the Fund’s investments. The three-level hierarchy gives the highest priority to unadjusted quoted prices in active markets for identical assets or liabilities (Level 1) and the lowest priority to
22 | Wells Fargo Intrinsic World Equity Fund
Table of Contents
Notes to financial statements
unobservable inputs (Level 3). The Fund’s investments are classified within the fair value hierarchy based on the lowest level of input that is significant to the fair value measurement. The inputs are summarized into three broad levels as follows:
| ∎ | Level 1 – quoted prices in active markets for identical securities |
| ∎ | Level 2 – other significant observable inputs (including quoted prices for similar securities, interest rates, prepayment speeds, credit risk, etc.) |
| ∎ | Level 3 – significant unobservable inputs (including the Fund’s own assumptions in determining the fair value of investments) |
The inputs or methodologies used for valuing investments in securities are not necessarily an indication of the risk associated with investing in those securities.
The following is a summary of the inputs used in valuing the Fund’s assets and liabilities as of October 31, 2019:
| Quoted prices (Level 1) | Other significant observable inputs (Level 2) | Significant (Level 3) | Total | |||||||||||||
Assets | ||||||||||||||||
Investments in: | ||||||||||||||||
Common stocks | ||||||||||||||||
Belgium | $ | 2,536,178 | $ | 0 | $ | 0 | $ | 2,536,178 | ||||||||
France | 7,288,904 | 0 | 0 | 7,288,904 | ||||||||||||
Germany | 3,781,337 | 0 | 0 | 3,781,337 | ||||||||||||
Hong Kong | 5,329,162 | 0 | 0 | 5,329,162 | ||||||||||||
Ireland | 3,920,400 | 0 | 0 | 3,920,400 | ||||||||||||
Japan | 12,846,742 | 0 | 0 | 12,846,742 | ||||||||||||
Netherlands | 8,800,032 | 0 | 0 | 8,800,032 | ||||||||||||
Switzerland | 8,563,999 | 0 | 0 | 8,563,999 | ||||||||||||
United Kingdom | 8,056,063 | 0 | 0 | 8,056,063 | ||||||||||||
United States | 82,324,806 | 0 | 0 | 82,324,806 | ||||||||||||
Exchange-traded funds | 6,307,742 | 0 | 0 | 6,307,742 | ||||||||||||
Short-term investments | ||||||||||||||||
Investment companies | 3,240,203 | 0 | 0 | 3,240,203 | ||||||||||||
Total assets | $ | 152,995,568 | $ | 0 | $ | 0 | $ | 152,995,568 | ||||||||
Additional sector, industry or geographic detail is included in the Portfolio of Investments.
For the year ended October 31, 2019, the Fund did not have any transfers into/out of Level 3.
4. TRANSACTIONS WITH AFFILIATES
Management fee
Funds Management, an indirect wholly owned subsidiary of Wells Fargo & Company (“Wells Fargo”), is the manager of the Fund and provides advisory and fund-level administrative services under an investment management agreement. Under the investment management agreement, Funds Management is responsible for, among other services, implementing the investment objectives and strategies of the Fund, supervising the subadviser and providing fund-level administrative services in connection with the Fund’s operations. As compensation for its services under the investment management agreement, Funds Management is entitled to receive a management fee at the following annual rate based on the Fund’s average daily net assets:
| Average daily net assets | Management fee | |||
First $500 million | 0.850 | % | ||
Next $500 million | 0.800 | |||
Next $1 billion | 0.750 | |||
Next $2 billion | 0.725 | |||
Next $1 billion | 0.700 | |||
Next $5 billion | 0.690 | |||
Over $10 billion | 0.680 | |||
Wells Fargo Intrinsic World Equity Fund | 23
Table of Contents
Notes to financial statements
For the year ended October 31, 2019, the management fee was equivalent to an annual rate of 0.85% of the Fund’s average daily net assets.
Funds Management has retained the services of a subadviser to provide daily portfolio management to the Fund. The fee for subadvisory services is borne by Funds Management. Wells Capital Management Incorporated (“WellsCap”), an affiliate of Funds Management and an indirect wholly owned subsidiary of Wells Fargo, is the subadviser to the Fund and is entitled to receive a fee from Funds Management at an annual rate starting at 0.35% and declining to 0.20% as the average daily net assets of the Fund increase.
Administration fees
Under a class-level administration agreement, Funds Management provides class-level administrative services to the Fund, which includes paying fees and expenses for services provided by the transfer agent,sub-transfer agents, omnibus account servicers and record-keepers. As compensation for its services under the class-level administration agreement, Funds Management receives an annual fee which is calculated based on the average daily net assets of each class as follows:
| Class-level administration fee | ||||
Class A, Class C | 0.21 | % | ||
Administrator Class, Institutional Class | 0.13 | |||
Waivers and/or expense reimbursements
Funds Management has contractually waived and/or reimbursed management and administration fees to the extent necessary to maintain certain net operating expense ratios for the Fund. When each class of the Fund has exceeded its expense cap, Funds Management has waived fees and/or reimbursed expenses from fund-level expenses on a proportionate basis and then from class specific expenses. When only certain classes exceed their expense caps, waivers and/or reimbursements are applied against class specific expenses before fund-level expenses. Funds Management has committed through February 29, 2020 to waive fees and/or reimburse expenses to the extent necessary to cap the Fund’s expenses at 1.35% for Class A shares, 2.10% for Class C shares, 1.25% for Administrator Class shares, and 0.95% for Institutional Class shares. Prior to or after the commitment expiration date, the cap may be increased or the commitment to maintain the cap may be terminated only with the approval of the Board of Trustees.
Distribution fee
The Trust has adopted a distribution plan for Class C shares of the Fund pursuant to Rule12b-1 under the 1940 Act. A distribution fee is charged to Class C shares and paid to Wells Fargo Funds Distributor, LLC (“Funds Distributor”), the principal underwriter, at an annual rate of 0.75% of the average daily net assets of Class C shares.
In addition, Funds Distributor is entitled to receive thefront-end sales charge from the purchase of Class A shares and a contingent deferred sales charge on the redemption of certain Class A shares. Funds Distributor is also entitled to receive the contingent deferred sales charges from redemptions of Class C shares. For the year ended October 31, 2019, Funds Distributor received $1,509 from the sale of Class A shares. No contingent deferred sales charges were incurred by Class A and Class C shares for the year ended October 31, 2019.
Shareholder servicing fees
The Trust has entered into contracts with one or more shareholder servicing agents, whereby Class A, Class C, and Administrator Class of the Fund are charged a fee at an annual rate of 0.25% of the average daily net assets of each respective class. A portion of these total shareholder servicing fees were paid to affiliates of Wells Fargo.
Interfund transactions
The Fund may purchase or sell portfolio investment securities to certain other Wells Fargo affiliates pursuant to Rule17a-7 under the 1940 Act and under procedures adopted by the Board of Trustees. The procedures have been designed to ensure that these interfund transactions, which do not incur broker commissions, are effected at current market prices.
5. INVESTMENT PORTFOLIO TRANSACTIONS
Purchases and sales of investments, excluding U.S. government obligations (if any) and short-term securities, for the year ended October 31, 2019 were $19,498,767 and $31,397,952, respectively.
24 | Wells Fargo Intrinsic World Equity Fund
Table of Contents
Notes to financial statements
6. SECURITIES LENDING TRANSACTIONS
The Fund lends its securities through an unaffiliated securities lending agent and receives collateral in the form of cash or securities with a value at least equal to the value of the securities on loan. The value of the loaned securities is determined at the close of each business day and any increases or decreases in the required collateral are exchanged between the Fund and the counterparty on the next business day. Cash collateral received is invested in the Securities Lending Fund which seeks to provide a positive return compared to the daily Fed Funds Open Rate by investing in high-quality, U.S. dollar-denominated short-term money market instruments and is exempt from registration under Section 3(c)(7) of the 1940 Act. Securities Lending Fund is managed by Funds Management and is subadvised by WellsCap. Funds Management receives an advisory fee starting at 0.05% and declining to 0.01% as the average daily net assets of the Securities Lending Fund increase. All of the fees received by Funds Management are paid to WellsCap for its services as subadviser.
In the event of counterparty default or the failure of a borrower to return a loaned security, the Fund has the right to use the collateral to offset any losses incurred. As of October 31, 2019, the Fund had securities lending transactions with the following counterparties which are subject to offset:
| Counterparty | Value of loan | Collateral received1 | Net amount | |||||||||
Barclays Capital Inc. | $ | 298,849 | $ | (298,849 | ) | $ | 0 | |||||
Credit Suisse Securities (USA) LLC | 1,193,976 | (1,193,976 | ) | 0 | ||||||||
Jefferies LLC | 162,288 | (162,288 | ) | 0 | ||||||||
| 1 | Collateral received within this table is limited to the collateral for the net transaction with the counterparty. |
7. BANK BORROWINGS
The Trust (excluding the money market funds), Wells Fargo Master Trust and Wells Fargo Variable Trust are parties to a $280,000,000 revolving credit agreement whereby the Fund is permitted to use bank borrowings for temporary or emergency purposes, such as to fund shareholder redemption requests. Interest under the credit agreement is charged to the Fund based on a borrowing rate equal to the higher of the Federal Funds rate in effect on that day plus 1.25% or the overnight LIBOR rate in effect on that day plus 1.25%. In addition, an annual commitment fee equal to 0.25% of the unused balance is allocated to each participating fund.
For the year ended October 31, 2019, there were no borrowings by the Fund under the agreement.
8. DISTRIBUTIONS TO SHAREHOLDERS
The tax character of distributions paid during the years ended October 31, 2019 and October 31, 2018 were as follows:
| Year ended October 31 | ||||||||
| 2019 | 2018 | |||||||
Ordinary income | $ | 1,827,305 | $ | 1,951,186 | ||||
Long-term capital gain | 14,375,986 | 11,144,067 | ||||||
As of October 31, 2019, the components of distributable earnings on a tax basis were as follows:
Undistributed ordinary | Unrealized gains | Capital loss carryforward | ||
| $905,359 | $40,879,964 | $(440,984) | ||
9. INDEMNIFICATION
Under the Trust’s organizational documents, the officers and Trustees have been granted certain indemnification rights against certain liabilities that may arise out of performance of their duties to the Trust. At a meeting held on November 21-22, 2019, the Board of Trustees of the Fund approved a proposal to authorize the Fund to enter into a separate agreement with each Trustee that would convert indemnification rights currently existing under the Fund’s organizational documents into contractual rights that could not be changed in the future without the consent of the Trustee. Additionally, in the normal course of business, the
Wells Fargo Intrinsic World Equity Fund | 25
Table of Contents
Notes to financial statements
Trust may enter into contracts with service providers that contain a variety of indemnification clauses. The Trust’s maximum exposure under these arrangements is dependent on future claims that may be made against the Fund and, therefore, cannot be estimated.
10. NEW ACCOUNTING PRONOUNCEMENT
In August 2018, FASB issued Accounting Standards Update (“ASU”)No. 2018-13, Fair Value Measurement (Topic 820)Disclosure Framework—Changes to the Disclosure Requirements for Fair Value Measurement. ASU2018-13 updates the disclosure requirements for fair value measurements by modifying or removing certain disclosures and adding certain new disclosures. The amendments are effective for fiscal years, and interim periods within those fiscal years, beginning after December 15, 2019. Early adoption is permitted. Management has adopted the removal and modification of disclosures early, as permitted, and will adopt the additional new disclosures at the effective date.
26 | Wells Fargo Intrinsic World Equity Fund
Table of Contents
Report of independent registered public accounting firm
TO THE SHAREHOLDERS OF THE FUND AND BOARD OF TRUSTEES OF WELLS FARGO FUNDS TRUST:
Opinion on the Financial Statements
We have audited the accompanying statement of assets and liabilities of Wells Fargo Intrinsic World Equity Fund (the Fund), one of the funds constituting Wells Fargo Funds Trust, including the portfolio of investments, as of October 31, 2019, the related statement of operations for the year then ended, the statements of changes in net assets for each of the years in the two-year period then ended, and the related notes (collectively, the financial statements) and the financial highlights for each of the years in the five-year period then ended. In our opinion, the financial statements and financial highlights present fairly, in all material respects, the financial position of the Fund as of October 31, 2019, the results of its operations for the year then ended, the changes in its net assets for each of the years in the two-year period then ended, and the financial highlights for each of the years in the five-year period then ended, in conformity with U.S. generally accepted accounting principles.
Basis for Opinion
These financial statements and financial highlights are the responsibility of the Fund’s management. Our responsibility is to express an opinion on these financial statements and financial highlights based on our audits. We are a public accounting firm registered with the Public Company Accounting Oversight Board (United States) (PCAOB) and are required to be independent with respect to the Fund in accordance with the U.S. federal securities laws and the applicable rules and regulations of the Securities and Exchange Commission and the PCAOB.
We conducted our audits in accordance with the standards of the PCAOB. Those standards require that we plan and perform the audit to obtain reasonable assurance about whether the financial statements and financial highlights are free of material misstatement, whether due to error or fraud. Our audits included performing procedures to assess the risks of material misstatement of the financial statements and financial highlights, whether due to error or fraud, and performing procedures that respond to those risks. Such procedures included examining, on a test basis, evidence regarding the amounts and disclosures in the financial statements and financial highlights. Such procedures also included confirmation of securities owned as of October 31, 2019, by correspondence with the custodian and transfer agent. Our audits also included evaluating the accounting principles used and significant estimates made by management, as well as evaluating the overall presentation of the financial statements and financial highlights. We believe that our audits provide a reasonable basis for our opinion.

We have not been able to determine the specific year that we began serving as the auditor of one or more Wells Fargo Funds investment companies; however we are aware that we have served as the auditor of one or more Wells Fargo Funds investment companies since at least 1955.
Boston, Massachusetts
December 20, 2019
Wells Fargo Intrinsic World Equity Fund | 27
Table of Contents
TAX INFORMATION
For corporate shareholders, pursuant to Section 854 of the Internal Revenue Code, 92.25% of ordinary income dividends qualify for the corporate dividends-received deduction for the fiscal year ended October 31, 2019.
Pursuant to Section 852 of the Internal Revenue Code, $14,375,986 was designated as a 20% rate gain distribution for the fiscal year ended October 31, 2019.
Pursuant to Section 854 of the Internal Revenue Code, $1,827,305 of income dividends paid during the fiscal year ended October 31, 2019 has been designated as qualified dividend income (QDI).
For the fiscal year ended October 31, 2019, $327,189 has been designated as short-term capital gain dividends for nonresident alien shareholders pursuant to Section 871 of the Internal Revenue Code.
PROXY VOTING INFORMATION
A description of the policies and procedures used to determine how to vote proxies relating to portfolio securities is available, upon request, by calling1-800-222-8222, visiting our website atwfam.com, or visiting the SEC website at sec.gov. Information regarding how the proxies related to portfolio securities were voted during the most recent12-month period ended June 30 is available on the website atwfam.com or by visiting the SEC website at sec.gov.
QUARTERLY PORTFOLIO HOLDINGS INFORMATION
The Fund files its complete schedule of portfolio holdings with the SEC for the first and third quarters of each fiscal year on Form N-Q or FormN-PORT, which is available by visiting the SEC website at sec.gov. Those forms may be reviewed and copied at the SEC’s Public Reference Room in Washington, DC. Information on the operation of the Public Reference Room may be obtained by calling1-800-SEC-0330.
28 | Wells Fargo Intrinsic World Equity Fund
Table of Contents
Other information (unaudited)
BOARD OF TRUSTEES AND OFFICERS
Each of the Trustees and Officers1 listed in the table below acts in identical capacities for each fund in the Wells Fargo family of funds, which consists of 150 mutual funds comprising the Wells Fargo Funds Trust, Wells Fargo Variable Trust, Wells Fargo Master Trust and fourclosed-end funds (collectively the “Fund Complex”). This table should be read in conjunction with the Prospectus and the Statement of Additional Information2. The mailing address of each Trustee and Officer is 525 Market Street, 12th Floor, San Francisco, CA 94105. Each Trustee and Officer serves an indefinite term, however, each Trustee serves such term until reaching the mandatory retirement age established by the Trustees.
Independent Trustees
Name and year of birth | Position held and length of service* | Principal occupations during past five years or longer | Current other public company or investment company directorships | |||
| William R. Ebsworth (Born 1957) | Trustee, since 2015 | Retired. From 1984 to 2013, equities analyst, portfolio manager, research director and chief investment officer at Fidelity Management and Research Company in Boston, Tokyo, and Hong Kong, and retired in 2013 as Chief Investment Officer of Fidelity Strategic Advisers, Inc. where he led a team of investment professionals managing client assets. Prior thereto, Board member of Hong Kong Securities Clearing Co., Hong Kong Options Clearing Corp., the Thailand International Fund, Ltd., Fidelity Investments Life Insurance Company, and Empire Fidelity Investments Life Insurance Company. Audit Committee Chair and Investment Committee Chair of the Vincent Memorial Hospital Endowment(non-profit organization). Mr. Ebsworth is a CFA® charterholder. | N/A | |||
| Jane A. Freeman (Born 1953) | Trustee, since 2015; Chair Liaison, since 2018 | Retired. From 2012 to 2014 and 1999 to 2008, Chief Financial Officer of Scientific Learning Corporation. From 2008 to 2012, Ms. Freeman provided consulting services related to strategic business projects. Prior to 1999, Portfolio Manager at Rockefeller & Co. and Scudder, Stevens & Clark. Board member of the Harding Loevner Funds from 1996 to 2014, serving as both Lead Independent Director and chair of the Audit Committee. Board member of the Russell Exchange Traded Funds Trust from 2011 to 2012 and the chair of the Audit Committee. Ms. Freeman is a Board Member of The Ruth Bancroft Garden(non-profit organization). She is also an inactive Chartered Financial Analyst. | N/A | |||
| Isaiah Harris, Jr. (Born 1952) | Trustee, Audit Committee Chairman, | Retired. Chairman of the Board of CIGNA Corporation since 2009, and Director since 2005. From 2003 to 2011, Director of Deluxe Corporation. Prior thereto, President and CEO of BellSouth Advertising and Publishing Corp. from 2005 to 2007, President and CEO of BellSouth Enterprises from 2004 to 2005 and President of BellSouth Consumer Services from 2000 to 2003. Emeritus member of the Iowa State University Foundation Board of Governors. Emeritus Member of the Advisory Board of Iowa State University School of Business. Advisory Board Member, Palm Harbor Academy (private school). Advisory Board Member, Child Evangelism Fellowship(non-profit). Mr. Harris is a certified public accountant (inactive status). | CIGNA Corporation | |||
| Judith M. Johnson (Born 1949) | Trustee, since 2008; Audit Committee Chairman, from 2009 to 2018 | Retired. Prior thereto, Chief Executive Officer and Chief Investment Officer of Minneapolis Employees Retirement Fund from 1996 to 2008. Ms. Johnson is an attorney, certified public accountant and a certified managerial accountant. | N/A | |||
Wells Fargo Intrinsic World Equity Fund | 29
Table of Contents
Other information (unaudited)
Name and year of birth | Position held and length of service* | Principal occupations during past five years or longer | Current other public company or investment company directorships | |||
| David F. Larcker (Born 1950) | Trustee, since 2009 | James Irvin Miller Professor of Accounting at the Graduate School of Business, Stanford University, Director of the Corporate Governance Research Initiative and Senior Faculty of The Rock Center for Corporate Governance since 2006. From 2005 to 2008, Professor of Accounting at the Graduate School of Business, Stanford University. Prior thereto, Ernst & Young Professor of Accounting at The Wharton School, University of Pennsylvania from 1985 to 2005. | N/A | |||
| Olivia S. Mitchell (Born 1953) | Trustee, since 2006; Nominating and Governance Committee Chair, since 2018 | International Foundation of Employee Benefit Plans Professor, Wharton School of the University of Pennsylvania since 1993. Director of Wharton’s Pension Research Council and Boettner Center on Pensions & Retirement Research, and Research Associate at the National Bureau of Economic Research. Previously, Cornell University Professor from 1978 to 1993. | N/A | |||
| Timothy J. Penny (Born 1951) | Trustee, since 1996; Chairman, since 2018 | President and Chief Executive Officer of Southern Minnesota Initiative Foundation, anon-profit organization, since 2007. Member of the Board of Trustees of NorthStar Education Finance, Inc., anon-profit organization, since 2007. | N/A | |||
| James G. Polisson (Born 1959) | Trustee, since 2018 | Retired. Chief Marketing Officer, Source (ETF) UK Services, Ltd, from 2015 to 2017. From 2012 to 2015, Principal of The Polisson Group, LLC, a management consulting, corporate advisory and principal investing company. Chief Executive Officer and Managing Director at Russell Investments, Global Exchange Traded Funds from 2010 to 2012. Managing Director of Barclays Global Investors from 1998 to 2010 and Global Chief Marketing Officer for iShares and Barclays Global Investors from 2000 to 2010. Trustee of the San Francisco Mechanics’ Institute, anon-profit organization, from 2013 to 2015. Board member of the Russell Exchange Traded Fund Trust from 2011 to 2012. Director of Barclays Global Investors Holdings Deutschland GmbH from 2006 to 2009. Mr. Polisson is an attorney and has a retired status with the Massachusetts and District of Columbia Bar Associations. | N/A | |||
| Pamela Wheelock3 (Born 1959) | Trustee, since January 2020; previously Trustee from January 2018 to July 2019 | Board member of the Destination Medical Center Economic Development Agency, Rochester, Minnesota since 2019. Acting Commissioner, Minnesota Department of Human Services, July 2019 through September 2019. Human Services Manager (part-time), Minnesota Department of Human Services, October 2019 through December 2019. Chief Operating Officer, Twin Cities Habitat for Humanity from 2017 to 2019. Vice President of University Services, University of Minnesota from 2012 to 2016. Prior thereto, on the Board of Directors, Governance Committee and Finance Committee for the Minnesota Philanthropy Partners (Saint Paul Foundation) from 2012 to 2018, Interim Chief Executive Officer of Blue Cross Blue Shield of Minnesota from 2011 to 2012, Chairman of the Board from 2009 to 2012 and Board Director from 2003 to 2015. Vice President, Leadership and Community Engagement, Bush Foundation, Saint Paul, Minnesota (a private foundation) from 2009 to 2011. Executive Vice President and Chief Financial Officer, Minnesota Sports and Entertainment from 2004 to 2009 and Senior Vice President from 2002 to 2004. Executive Vice President of the Minnesota Wild Foundation from 2004 to 2008. Commissioner of Finance, State of Minnesota, from 1999 to 2002. Currently Board Chair of the Minnesota Wild Foundation since 2010. | N/A | |||
| * | Length of service dates reflect the Trustee’s commencement of service with the Trust’s predecessor entities, where applicable. |
30 | Wells Fargo Intrinsic World Equity Fund
Table of Contents
Other information (unaudited)
Officers
Name and year of birth | Position held and length of service | Principal occupations during past five years or longer | ||
Andrew Owen (Born 1960) | President, since 2017 | Executive Vice President of Wells Fargo & Company and Head of Affiliated Managers, Wells Fargo Asset Management, since 2014. In addition, Mr. Owen is currently President, Chief Executive Officer and Director of Wells Fargo Funds Management, LLC since 2017. Prior thereto, Executive Vice President responsible for marketing, investments and product development for Wells Fargo Funds Management, LLC, from 2009 to 2014. | ||
| Jeremy DePalma1 (Born 1974) | Treasurer, since 2012 | Senior Vice President of Wells Fargo Funds Management, LLC since 2009. Senior Vice President of Evergreen Investment Management Company, LLC from 2008 to 2010 and head of the Fund Reporting and Control Team within Fund Administration from 2005 to 2010. | ||
| Michelle Rhee4 (Born 1966) | Chief Legal Officer, since 2019 | Secretary of Wells Fargo Funds Management, LLC, Chief Legal Counsel of Wells Fargo Asset Management and Assistant General Counsel of Wells Fargo Bank, N.A. since 2018. Associate General Counsel and Managing Director of Bank of America Corporation from 2004 to 2018. | ||
| Catherine Kennedy5 (Born 1969) | Secretary, since 2019 | Vice President of Wells Fargo Funds Management, LLC and Senior Counsel of the Wells Fargo Legal Department since 2010. Vice President and Senior Counsel of Evergreen Investment Management Company, LLC from 1998 to 2010. | ||
| Michael H. Whitaker(Born 1967) | Chief Compliance Officer, since 2016 | Chief Compliance Officer of Wells Fargo Asset Management since 2016. Senior Vice President and Chief Compliance Officer for Fidelity Investments from 2007 to 2016. | ||
| David Berardi (Born 1975) | Assistant Treasurer, since 2009 | Vice President of Wells Fargo Funds Management, LLC since 2009. Vice President of Evergreen Investment Management Company, LLC from 2008 to 2010. Manager of Fund Reporting and Control for Evergreen Investment Management Company, LLC from 2004 to 2010. | ||
| 1 | Jeremy DePalma acts as Treasurer of 86 funds and Assistant Treasurer of 64 funds in the Fund Complex. |
| 2 | The Statement of Additional Information includes additional information about the Trustees and is available, without charge, upon request, by calling1-800-222-8222 or by visiting the website atwfam.com. |
| 3 | Ms. Wheelock was re-appointed to the Board effective January 1, 2020. |
| 4 | Michelle Rhee became Chief Legal Officer effective October 22, 2019. |
| 5 | Catherine Kennedy became Secretary effective October 22, 2019. |
Wells Fargo Intrinsic World Equity Fund | 31
Table of Contents
Other information (unaudited)
BOARD CONSIDERATION OF INVESTMENT MANAGEMENT ANDSUB-ADVISORY AGREEMENTS:
Wells Fargo Intrinsic World Equity Fund
Under the Investment Company Act of 1940 (the “1940 Act”), the Board of Trustees (the “Board”) of Wells Fargo Funds Trust (the “Trust”) must determine annually whether to approve the continuation of the Trust’s investment management andsub-advisory agreements. In this regard, at anin-person meeting held on May21-22, 2019 (the “Meeting”), the Board, all the members of which have no direct or indirect interest in the investment management andsub-advisory agreements and are not “interested persons” of the Trust, as defined in the 1940 Act (the “Independent Trustees”), reviewed and approved for Wells Fargo Intrinsic World Equity Fund(the “Fund”): (i) an investment management agreement (the “Management Agreement”) with Wells Fargo Funds Management, LLC (“Funds Management”); and (ii) an investmentsub-advisory agreement (the“Sub-Advisory Agreement”) with Wells Capital Management Incorporated (the“Sub-Adviser”), an affiliate of Funds Management. The Management Agreement and theSub-Advisory Agreement are collectively referred to as the “Advisory Agreements.”
At the Meeting, the Board considered the factors and reached the conclusions described below relating to the selection of Funds Management and theSub-Adviser and the approval of the Advisory Agreements. Prior to the Meeting, including at anin-person meeting in April 2019, the Trustees conferred extensively among themselves and with representatives of Funds Management about these matters. Also, the Board has adopted a team-based approach, with each team consisting of asub-set of Trustees, to assist the full Board in the discharge of its duties in reviewing investment performance and other matters throughout the year. The Independent Trustees were assisted in their evaluation of the Advisory Agreements by independent legal counsel, from whom they received separate legal advice and with whom they met separately.
In providing information to the Board, Funds Management and theSub-Adviser were guided by a detailed set of requests for information submitted to them by independent legal counsel on behalf of the Independent Trustees at the start of the Board’s annual contract renewal process earlier in 2019. In considering and approving the Advisory Agreements, the Trustees considered the information they believed relevant, including but not limited to the information discussed below. The Board considered not only the specific information presented in connection with the Meeting, but also the knowledge gained over time through interaction with Funds Management and theSub-Adviser about various topics. In this regard, the Board reviewed reports of Funds Management at each of its quarterly meetings, which included, among other things, portfolio reviews and investment performance reports. In addition, the Board and the teams mentioned above confer with portfolio managers at various times throughout the year. The Board did not identify any particular information or consideration that wasall-important or controlling, and each individual Trustee may have attributed different weights to various factors.
After its deliberations, the Board unanimously approved the continuation of the Advisory Agreements for aone-year term and determined that the compensation payable to Funds Management and theSub-Adviser under each of the Advisory Agreements was reasonable. The Board considered the approval of the Advisory Agreements for the Fund as part of its consideration of agreements for funds across the complex, but its approvals were made on afund-by-fund basis. The following summarizes a number of important, but not necessarily all, factors considered by the Board in support of its approvals.
Nature, extent and quality of services
The Board received and considered various information regarding the nature, extent and quality of services provided to the Fund by Funds Management and theSub-Adviser under the Advisory Agreements. This information included a description of the investment advisory services and Fund-level administrative services covered by the Management Agreement, as well as, among other things, a summary of the background and experience of senior management of Wells Fargo Asset Management (“WFAM”), of which Funds Management and theSub-Adviser are a part, a summary of investments made in the business of WFAM, a summary of certain organizational and personnel changes involving Funds Management and theSub-Adviser, and a description of Funds Management’s and theSub-Adviser’s business continuity planning programs and of their approaches to data privacy and cybersecurity. The Board received and reviewed information about Funds Management’s role as administrator of the Fund’s liquidity risk management program. The Board also considered the qualifications, background, tenure and responsibilities of each of the portfolio managers primarily responsible for theday-to-day portfolio management of the Fund.
The Board evaluated the ability of Funds Management and theSub-Adviser to attract and retain qualified investment professionals, including research, advisory and supervisory personnel. The Board further considered the compliance programs and compliance records of Funds Management and theSub-Adviser. In addition, the Board took into account the full range of services provided to the Fund by Funds Management and its affiliates.
32 | Wells Fargo Intrinsic World Equity Fund
Table of Contents
Other information (unaudited)
Fund investment performance and expenses
The Board considered the investment performance results for the Fund over various time periods ended December 31, 2018. The Board considered these results in comparison to the investment performance of funds in a universe that was determined by Broadridge Inc. (“Broadridge”) to be similar to the Fund (the “Universe”), and in comparison to the Fund’s benchmark index and to other comparative data. Broadridge is an independent provider of investment company data. The Board received a description of the methodology used by Broadridge to select the mutual funds in the performance Universe. The Board noted that the investment performance of the Fund (Administrator Class) was higher than the average investment performance of the Universe for all periods. The Board also noted that the investment performance of the Fund was higher than or in range of its benchmark index, the MSCI World Index (Net), for all periods under review.
The Board also received and considered information regarding the Fund’s net operating expense ratios and their various components, including actual management fees, custodian and othernon-management fees, and Rule12b-1 andnon-Rule12b-1 shareholder service fees. The Board considered these ratios in comparison to the median ratios of funds in class-specific expense groups that were determined by Broadridge to be similar to the Fund (the “Groups”). The Board received a description of the methodology used by Broadridge to select the mutual funds in the expense Groups and an explanation of how funds comprising expense groups and their expense ratios may vary fromyear-to-year. Based on the Broadridge reports, the Board noted that the net operating expense ratios of the Fund were lower than or equal to the median net operating expense ratios of the expense Groups for each share class.
The Board took into account the Fund’s investment performance and expense information provided to it among the factors considered in deciding tore-approve the Advisory Agreements.
Investment management andsub-advisory fee rates
The Board reviewed and considered the contractual fee rates payable by the Fund to Funds Management under the Management Agreement, as well as the contractual fee rates payable by the Fund to Funds Management for class-level administrative services under a Class-Level Administration Agreement, which include, among other things, class-level transfer agency andsub-transfer agency costs (collectively, the “Management Rates”). The Board also reviewed and considered the contractual investmentsub-advisory fee rates that are payable by Funds Management to theSub-Adviser for investmentsub-advisory services.
Among other information reviewed by the Board was a comparison of the Fund’s Management Rates with the average contractual investment management fee rates of funds in the expense Groups at a common asset level as well as transfer agency costs of the funds in the expense Groups. The Board noted that the Management Rates of the Fund were lower than or in range of the sum of these average rates for the Fund’s expense Groups for all share classes.
The Board also received and considered information about the portion of the total management fee that was retained by Funds Management after payment of the fee to theSub-Adviser forsub-advisory services. In assessing the reasonableness of this amount, the Board received and evaluated information about the nature and extent of responsibilities retained and risks assumed by Funds Management and not delegated to or assumed by theSub-Adviser, and about Funds Management’son-going oversight services. Given the affiliation between Funds Management and theSub-Adviser, the Board ascribed limited relevance to the allocation of fees between them.
The Board also received and considered information about the nature and extent of services offered and fee rates charged by Funds Management and theSub-Adviser to other types of clients with investment strategies similar to those of the Fund. In this regard, the Board received information about the significantly greater scope of services, and compliance, reporting and other legal burdens and risks of managing proprietary mutual funds compared with those associated with managing assets of other types of clients, including third-partysub-advised fund clients andnon-mutual fund clients such as institutional separate accounts.
Based on its consideration of the factors and information it deemed relevant, including those described here, the Board determined that the compensation payable to Funds Management under the Management Agreement and to theSub-Adviser under theSub-Advisory Agreement was reasonable.
Profitability
The Board received and considered information concerning the profitability of Funds Management, as well as the profitability of both WFAM and Wells Fargo & Co. (“Wells Fargo”) from providing services to the fund family as a whole. The Board noted that theSub-Adviser’s profitability information with respect to providing services to the Fund and other funds in the family was subsumed in the WFAM and Wells Fargo profitability analysis.
Wells Fargo Intrinsic World Equity Fund | 33
Table of Contents
Other information (unaudited)
Funds Management reported on the methodologies and estimates used in calculating profitability, including a description of the methodology used to allocate certain expenses. Among other things, the Board noted that the levels of profitability reported on afund-by-fund basis varied widely, depending on factors such as the size, type and age of fund. Based on its review, the Board did not deem the profits reported by Funds Management, WFAM or Wells Fargo from services provided to the Fund to be at a level that would prevent it from approving the continuation of the Advisory Agreements.
Economies of scale
The Board received and considered information about the potential for Funds Management to experience economies of scale in the provision of management services to the Fund, the difficulties of calculating economies of scale at an individual fund level, and the extent to which potential scale benefits are shared with shareholders. The Board noted the existence of breakpoints in the Fund’s management fee structure, which operate generally to reduce the Fund’s expense ratios as the Fund grows in size. The Board considered that in addition to management fee breakpoints, Funds Management shares potential economies of scale from its management business in a variety of ways, including through fee waiver and expense reimbursement arrangements, services that benefit shareholders, competitive management fee rates set at the outset without regard to breakpoints, and investments in the business intended to enhance services available to shareholders.
The Board concluded that Funds Management’s arrangements with respect to the Fund, including contractual breakpoints, constituted a reasonable approach to sharing potential economies of scale with the Fund and its shareholders.
Other benefits to Funds Management and theSub-Adviser
The Board received and considered information regarding potential“fall-out” or ancillary benefits received by Funds Management and its affiliates, including theSub-Adviser, as a result of their relationships with the Fund. Ancillary benefits could include, among others, benefits directly attributable to other relationships with the Fund and benefits potentially derived from an increase in Funds Management’s and theSub-Adviser’s business as a result of their relationships with the Fund. The Board noted that various affiliates of Funds Management may receive distribution-related fees, shareholder servicing payments andsub-transfer agency fees in respect of shares sold or held through them and services provided.
The Board also reviewed information about soft dollar credits earned and utilized by theSub-Adviser, fees earned by Funds Management and theSub-Adviser from managing a private investment vehicle for the fund family’s securities lending collateral, and commissions earned by an affiliated broker from portfolio transactions.
Based on its consideration of the factors and information it deemed relevant, including those described here, the Board did not find that any ancillary benefits received by Funds Management and its affiliates, including theSub-Adviser, were unreasonable.
Conclusion
At the Meeting, after considering the above-described factors and based on its deliberations and its evaluation of the information described above, the Board unanimously approved the continuation of the Advisory Agreements for aone-year term and determined that the compensation payable to Funds Management and theSub-Adviser under each of the Advisory Agreements was reasonable.
34 | Wells Fargo Intrinsic World Equity Fund
Table of Contents
This page is intentionally left blank.
Table of Contents
This page is intentionally left blank.
Table of Contents
For more information
More information about Wells Fargo Funds is available free upon request. To obtain literature, please write, visit the Fund’s website, or call:
Wells Fargo Funds
P.O. Box 219967
Kansas City, MO 64121-9967
Website:wfam.com
Individual investors:1-800-222-8222
Retail investment professionals:1-888-877-9275
Institutional investment professionals:1-866-765-0778

This report and the financial statements contained herein are submitted for the general information of the shareholders of the Fund. If this report is used for promotional purposes, distribution of the report must be accompanied or preceded by a current prospectus. Before investing, please consider the investment objectives, risks, charges, and expenses of the investment. For a current prospectus and, if available, a summary prospectus, containing this information, call1-800-222-8222 or visit the Fund’s website atwfam.com. Read the prospectus carefully before you invest or send money.
Wells Fargo Asset Management (WFAM) is the trade name for certain investment advisory/management firms owned by Wells Fargo & Company. These firms include but are not limited to Wells Capital Management Incorporated and Wells Fargo Funds Management, LLC. Certain products managed by WFAM entities are distributed by Wells Fargo Funds Distributor, LLC (a broker-dealer and Member FINRA).
This material is for general informational and educational purposes only and is NOT intended to provide investment advice or a recommendation of any kind—including a recommendation for any specific investment, strategy, or plan.
INVESTMENT PRODUCTS: NOT FDIC INSURED ◾ NO BANK GUARANTEE ◾ MAY LOSE VALUE
© 2019 Wells Fargo & Company. All rights reserved.
408249 12-19
A241/AR241 10-19
Table of Contents

Annual Report
October 31, 2019
Wells Fargo
Emerging Markets Equity Income Fund
Beginning on January 1, 2021, as permitted by new regulations adopted by the Securities and Exchange Commission, paper copies of the Wells Fargo Funds’ annual and semi-annual shareholder reports issued after this date will no longer be sent by mail, unless you specifically request paper copies of the reports. Instead, the reports will be made available on the Funds’ website, and you will be notified by mail each time a report is posted and provided with a website address to access the report.
If you already elected to receive shareholder reports electronically, you will not be affected by this change and you need not take any action. You may elect to receive shareholder reports and other communications from the Fund electronically at any time by contacting your financial intermediary (such as a broker-dealer or bank) or, if you are a direct investor, by calling1-800-222-8222 or by enrolling at wellsfargo.com/advantagedelivery.
You may elect to receive all future reports in paper free of charge. If you invest through a financial intermediary, you can contact your financial intermediary to request that you continue to receive paper copies of your shareholder reports; if you invest directly with the Fund, you can call 1-800-222-8222. Your election to receive reports in paper will apply to all Wells Fargo Funds held in your account with your financial intermediary or, if you are a direct investor, to all Wells Fargo Funds that you hold.
Table of Contents
|
Reduce clutter. Save trees. |
Sign up for electronic delivery of prospectuses and shareholder reports atwellsfargo.com/advantagedelivery |
The views expressed and any forward-looking statements are as of October 31, 2019, unless otherwise noted, and are those of the Fund managers and/or Wells Fargo Asset Management. Discussions of individual securities, or the markets generally, or any Wells Fargo Fund are not intended as individual recommendations. Future events or results may vary significantly from those expressed in any forward-looking statements. The views expressed are subject to change at any time in response to changing circumstances in the market. Wells Fargo Asset Management and the Fund disclaim any obligation to publicly update or revise any views expressed or forward-looking statements.
INVESTMENT PRODUCTS: NOT FDIC INSURED ◾ NO BANK GUARANTEE ◾ MAY LOSE VALUE
Wells Fargo Emerging Markets Equity Income Fund | 1
Table of Contents
Letter to shareholders (unaudited)

Andrew Owen
President
Wells Fargo Funds
Dear Shareholder:
We are pleased to offer you this annual report for the Wells Fargo Emerging Markets Equity Income Fund for the 12-month period that ended October 31, 2019. After the first few months of the period featured high volatility and yielded minimal returns, U.S. investors generally saw markets recover during the second half amid intensifying market volatility, global economic growth concerns, international trade stare downs, and simmering geopolitical tensions.
Overall, both fixed-income and equity investors enjoyed healthy returns despite market volatility. For the period, U.S. stocks, based on the S&P 500 Index,1 gained 14.33% and international stocks, as measured by the MSCI ACWI ex USA Index (Net),2 returned 11.27%. The MSCI EM Index (Net)3 gained 11.86%. Among fixed income investors, the Bloomberg Barclays U.S. Aggregate Bond Index4 added 11.51%, the Bloomberg Barclays Global Aggregate ex-USD Index5 added 7.84%, the Bloomberg Barclays Municipal Bond Index6 gained 9.42%, and the ICE BofAML U.S. High Yield Index7 added 8.32%.
Investors confronted unsettling events during the fourth quarter of 2018.
During the fourth quarter of 2018, investors grew concerned about the pace and sustainability of the global economic expansion. The U.S. Bureau of Economic Analysis reported third-quarter U.S. gross domestic product (GDP) was 3.4% on an annualized basis, which was down from the second-quarter rate. A partial U.S. government shutdown occurred, which extended into January 2019. Brexit efforts stalled, causing uncertainty for the eurozone. The value of the renminbi declined even as the People’s Bank of China cut reserve requirement ratios, accelerated infrastructure spending, and cut taxes in efforts to spur economic activity.
The combination of news in the U.S. and generally weak economic indicators outside of the U.S. caused investors to seek safe havens. December’s S&P 500 Index performance was the worst since 1931. Globally, fixed-income investments fared better than stocks during the last two months of the year. Even as indicators suggested growth was restrained, the U.S. Federal Reserve (Fed) increased the federal funds rate by 25 basis points (bps; 100 bps equal 1.00%) in December 2018 to a target range of between 2.25% and 2.50%. Many observers expressed concerns that higher rates could slow the economy further.
| 1 | The S&P 500 Index consists of 500 stocks chosen for market size, liquidity, and industry group representation. It is a market-value-weighted index with each stock’s weight in the index proportionate to its market value. You cannot invest directly in an index. |
| 2 | The Morgan Stanley Capital International (MSCI) All Country World Index (ACWI) ex USA Index (Net) is a free-float-adjusted market-capitalization-weighted index that is designed to measure the equity market performance of developed and emerging markets, excluding the United States. Source: MSCI. MSCI makes no express or implied warranties or representations and shall have no liability whatsoever with respect to any MSCI data contained herein. The MSCI data may not be further redistributed or used as a basis for other indices or any securities or financial products. This report is not approved, reviewed, or produced by MSCI. You cannot invest directly in an index. |
| 3 | The MSCI Emerging Markets (EM) Index (Net) is a free-float-adjusted market-capitalization-weighted index that is designed to measure the equity market performance of emerging markets. You cannot invest directly in an index. |
| 4 | The Bloomberg Barclays U.S. Aggregate Bond Index is a broad-based benchmark that measures the investment-grade, U.S. dollar-denominated, fixed-rate taxable bond market, including Treasuries, government-related and corporate securities, mortgage-backed securities (agency fixed-rate and hybrid adjustable-rate mortgage pass-throughs), asset-backed securities, and commercial mortgage-backed securities. You cannot invest directly in an index. |
| 5 | The Bloomberg Barclays Global Aggregate ex-USD Index is an unmanaged index that provides a broad-based measure of the global investment-grade fixed-income markets excluding the U.S. dollar-denominated debt market. You cannot invest directly in an index. |
| 6 | The Bloomberg Barclays Municipal Bond Index is an unmanaged index composed of long-term tax-exempt bonds with a minimum credit rating of Baa. You cannot invest directly in an index. |
| 7 | The ICE BofAML U.S. High Yield Index is a market-capitalization-weighted index of domestic and Yankee high-yield bonds. The index tracks the performance of high-yield securities traded in the U.S. bond market. You cannot invest directly in an index. Copyright 2019. ICE Data Indices, LLC. All rights reserved. |
2 | Wells Fargo Emerging Markets Equity Income Fund
Table of Contents
Letter to shareholders (unaudited)
The market climbs a wall of worry.
Investment returns early in 2019 appeared to reaffirm the adage that markets climb a wall of worry as the new year began. The S&P 500 Index gained 8.01% in January, the best monthly performance in 30 years. Returns for the MSCI ACWI ex USA Index (Net), the Bloomberg Barclays U.S. Aggregate Bond Index, and the Bloomberg Barclays Global Aggregate ex-USD Index also were positive.
In February 2019, signs of slowing global growth grew more ominous. The U.S. Bureau of Economic Analysis announced fourth-quarter 2018 GDP grew at an annualized 2.2% rate, down from the levels of the prior two quarters. In a February report, the Bank of England forecast the slowest growth since the financial crisis for 2019. China and the U.S. continued to wrangle over trade issues. By the end of the first quarter of 2019, more accommodative Fed sentiment and steady, if not spectacular, U.S. economic and business metrics encouraged domestic investors.
Early second-quarter 2019 enthusiasm among investors faded.
During April 2019, sustained low inflation, solid employment data, and first-quarter U.S. GDP grew at an annualized rate of 3.2% supported favorable sentiment. During May, markets tumbled on mixed investment signals. In the U.S., partisan wrangling ramped up as Democrats and Republicans set their sights on 2020 presidential politics. The U.K.’s Brexit disagreements caused Prime Minister Theresa May to resign. Boris Johnson succeeded her only to exacerbate uncertainty about Brexit’s resolution ahead of an October 2019 deadline. The European Commission downgraded the 2019 growth forecast to 1.2%. The U.S. increased tariffs on products from China, China responded, and then talks broke down. President Donald Trump threatened to turn his foreign policy tariff tool to Mexico over immigration issues.
Halfway through 2019, investors regrouped. Just as the investment horizon appeared to darken, sentiment turned and U.S. equity markets gained during June and July. The gains, primarily driven by geopolitical and monetary policy events, pushed equity markets to new highs. European Central Bank President Mario Draghi said that if the outlook doesn’t improve, the bank would cut rates or buy more assets to prop up inflation. President Trump backed off of tariff threats against Mexico and China. In the U.S., the Fed implemented a 0.25% federal funds rate cut in July.
Later in July 2019, the U.S. reversed course and threatened to impose higher tariffs on China’s exports after talks failed. China responded with tariff threats of its own and devalued the renminbi, a move that roiled global markets. Major U.S. stock market indices closed July with the worst weekly results of the year. Bond prices gained as Treasury yields fell to levels not seen since November 2016 and the yield curve inverted at multiple points along the 30-year arc.
In microcosm, August 2019 encapsulated many of the unnerving events that had plagued investors for months. The U.S.-China trade relationship swung from antagonistic to hopeful and back again with no signs of compromise. Evidence of a continued global economic slowdown continued to mount as central banks in China, New Zealand, and Thailand cut interest rates. Industrial and manufacturing data declined in China, Canada, Japan, and Germany. Adding to the uncertain environment, Italy’s prime minister resigned, many feared a crackdown in Hong Kong as protestors sustained their calls for reform, and Boris Johnson planned to suspend Parliament as Brexit’s deadline neared.
In the U.S., September 2019 saw the Fed join other central banks in cutting interest rates. U.S. manufacturing data, as reported by the Institute for Supply Management, disappointed investors. The U.S. House of Representatives announced it would pursue an impeachment investigation of President Trump. Meanwhile, the Brexit impasse showed no signs of resolution. Officials in China said that hitting the country’s economic
“In February 2019, signs of slowing global growth grew more ominous.”
Wells Fargo Emerging Markets Equity Income Fund | 3
Table of Contents
Letter to shareholders (unaudited)
“The Fed lowered interest rates another quarter point in late October, its third rate cut in four months.”
|
For further information about your Fund, contact your investment professional, visit our website at wfam.com, or call us directly at1-800-222-8222. |
growth goals for the year would be difficult considering the weight of tariffs and trade restrictions. So while the S&P 500 Index finished the third quarter with the best year-to-date returns in more than 20 years, amid signs of equity investors taking money out of the stock market, concerns about future returns remained.
In October 2019, a relaxing of U.S.-China trade tensions and renewed optimism for a U.K. Brexit deal combined with positive macroeconomic data to support financial markets overall. The initial estimate of U.S. third-quarter GDP growth, announced in late October, was a resilient 1.9% annualized rate while the U.S. unemployment rate fell to a 50-year low of 3.5% in September. However, despite resilience among U.S. consumers, business confidence declined while manufacturing activity contracted. Concerned with a potential economic slowdown, the Fed lowered interest rates another quarter point in late October, its third rate cut in four months. This helped push the S&P 500 Index to a new all-time high while emerging market equities rallied and global bonds declined overall, reflecting a broad pickup in risk appetite.
Don’t let short-term uncertainty derail long-term investment goals.
Periods of investment uncertainty can present challenges, but experience has taught us that maintaining long-term investment goals can be an effective way to plan for the future. To help you create a sound strategy based on your personal goals and risk tolerance, Wells Fargo Funds offers more than 100 mutual funds spanning a wide range of asset classes and investment styles. Although diversification cannot guarantee an investment profit or prevent losses, we believe it can be an effective way to manage investment risk and potentially smooth out overall portfolio performance. We encourage investors to know their investments and to understand that appropriate levels of risk-taking may unlock opportunities.
Thank you for choosing to invest with Wells Fargo Funds. We appreciate your confidence in us and remain committed to helping you meet your financial needs.
Sincerely,

Andrew Owen
President
Wells Fargo Funds
4 | Wells Fargo Emerging Markets Equity Income Fund
Table of Contents
This page is intentionally left blank.
Table of Contents
Performance highlights (unaudited)
Investment objective
The Fund seeks to achieve long-term capital appreciation and current income.
Manager
Wells Fargo Funds Management, LLC
Subadviser
Wells Capital Management Incorporated
Portfolio managers
Alison Shimada
Elaine Tse
Average annual total returns (%) as of October 31, 2019
| Including sales charge | Excluding sales charge | Expense ratios1 (%) | ||||||||||||||||||||||||||||||||
| Inception date | 1 year | 5 year | Since inception | 1 year | 5 year | Since inception | Gross | Net2 | ||||||||||||||||||||||||||
| Class A (EQIAX) | 5-31-2012 | 4.41 | 0.66 | 3.81 | 10.78 | 1.86 | 4.64 | 1.67 | 1.62 | |||||||||||||||||||||||||
| Class C (EQICX) | 5-31-2012 | 9.01 | 1.11 | 3.87 | 10.01 | 1.11 | 3.87 | 2.42 | 2.37 | |||||||||||||||||||||||||
| Class R (EQIHX)3 | 9-30-2015 | – | – | – | 10.61 | 1.62 | 4.39 | 1.92 | 1.87 | |||||||||||||||||||||||||
| Class R6 (EQIRX)4 | 9-30-2015 | – | – | – | 11.34 | 2.32 | 5.10 | 1.24 | 1.17 | |||||||||||||||||||||||||
| Administrator Class (EQIDX) | 5-31-2012 | – | – | – | 11.01 | 2.07 | 4.86 | 1.59 | 1.45 | |||||||||||||||||||||||||
| Institutional Class (EQIIX) | 5-31-2012 | – | – | – | 11.24 | 2.27 | 5.06 | 1.34 | 1.22 | |||||||||||||||||||||||||
| MSCI EM Index (Net)5 | – | – | – | – | 11.86 | 2.93 | 4.42 | * | – | – | ||||||||||||||||||||||||
| * | Return based on the inception date of Fund’s oldest class. |
Figures quoted represent past performance, which is no guarantee of future results, and do not reflect taxes that a shareholder may pay on fund distributions or the redemption of fund shares. Investment return and principal value of an investment will fluctuate so that an investor’s shares, when redeemed, may be worth more or less than their original cost. Performance shown without sales charges would be lower if sales charges were reflected. Current performance may be lower or higher than the performance data quoted, which assumes the reinvestment of dividends and capital gains. Currentmonth-end performance is available on the Fund’s website, wfam.com.
Index returns do not include transaction costs associated with buying and selling securities, any mutual fund fees or expenses, or any taxes. It is not possible to invest directly in an index.
For Class A shares, the maximumfront-end sales charge is 5.75%. For Class C shares, the maximum contingent deferred sales charge is 1.00%. Performance including a contingent deferred sales charge assumes the sales charge for the corresponding time period. Class R, Class R6, Administrator Class, and Institutional Class shares are sold without afront-end sales charge or contingent deferred sales charge.
Stock values fluctuate in response to the activities of individual companies and general market and economic conditions. Foreign investments are especially volatile and can rise or fall dramatically due to differences in the political and economic conditions of the host country. These risks are generally intensified in emerging markets. The use of derivatives may reduce returns and/or increase volatility. Certain investment strategies tend to increase the total risk of investment (relative to the broader market). The Fund is exposed to smaller-company securities risk. Consult the Fund’s prospectus for additional information on these and other risks.
Please see footnotes on page 7.
6 | Wells Fargo Emerging Markets Equity Income Fund
Table of Contents
Performance highlights (unaudited)
| Growth of $10,000 investment as of October 31, 20196 |
|
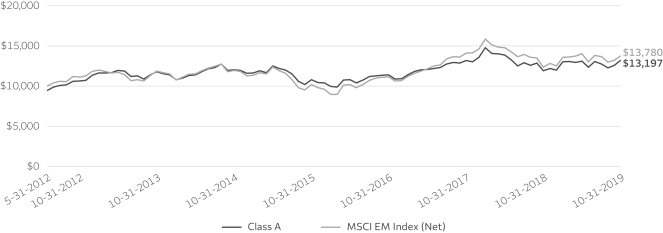
| 1 | Reflects the expense ratios as stated in the most recent prospectuses. The expense ratios shown are subject to change and may differ from the annualized expense ratios shown in the financial highlights of this report. |
| 2 | The manager has contractually committed through February 29, 2020, to waive fees and/or reimburse expenses to the extent necessary to cap the expenses of each class after fee waivers at the amounts shown. Brokerage commissions, stamp duty fees, interest, taxes, acquired fund fees and expenses (if any), and extraordinary expenses are excluded from the expense cap. Prior to or after the commitment expiration date, the cap may be increased or the commitment to maintain the cap may be terminated only with the approval of the Board of Trustees. Without this cap, the Fund’s returns would have been lower. The expense ratio paid by an investor is the net expense ratio (the total annual fund operating expenses after fee waivers) as stated in the prospectuses. |
| 3 | Historical performance shown for Class R shares prior to their inception reflects the performance of the Administrator Class shares, adjusted to reflect the higher expenses applicable to Class R shares. |
| 4 | Historical performance shown for the Class R6 shares prior to their inception reflects the performance of the Institutional Class shares, and includes the higher expenses applicable to Institutional Class shares. If these expenses had not been included, returns for Class R6 shares would be higher. |
| 5 | The Morgan Stanley Capital International (MSCI) Emerging Markets (EM) Index (Net) is a free-float-adjusted market-capitalization-weighted index that is designed to measure the equity market performance of emerging markets. You cannot invest directly in an index. |
| 6 | The chart compares the performance of Class A shares since its inception with the MSCI EM Index (Net). The chart assumes a hypothetical investment of $10,000 in Class A shares and reflects all operating expenses and assumes the maximum initial sales charge of 5.75%. |
| 7 | The ten largest holdings, excluding cash, cash equivalents and any money market funds, are calculated based on the value of the investments divided by total net assets of the Fund. Holdings are subject to change and may have changed since the date specified. |
| 8 | Amounts are calculated based on the total long-term investments of the Fund. These amounts are subject to change and may have changed since the date specified. |
| * | This security was no longer held at the end of the reporting period. |
Wells Fargo Emerging Markets Equity Income Fund | 7
Table of Contents
Performance highlights (unaudited)
MANAGER’S DISCUSSION
Fund highlights
| ∎ | The Fund underperformed its benchmark, the MSCI EM Index (Net), for the12-month period that ended October 31, 2019. |
| ∎ | Stock selection within financials, information technology (IT), and utilities was strong but was offset by unfavorable stock selection within the consumer discretionary, materials, and energy sectors. |
| ∎ | Stock selection within Taiwan, Brazil, and Indonesia drove positive performance during the period, offset by allocations to China, India, and South Africa. |
The MSCI EM Index (Net) advanced 11.9% during a volatile period for emerging markets, characterized by sentiment fluctuating day to day based on trade negotiations, a reversal in U.S. Federal Reserve policy, subsequent rate cuts by most emerging market central banks, and a decline in both developed and emerging market growth. In this environment, country returns varied substantially, illustrated by a 34.3% return in Russian equities versus a 36.8% decline in Argentina. Sector returns also were divergent, with consumer discretionary stocks returning 22.9% versus materials stocks declining 5.0%. Overall earnings declined 14% year over year, but that was offset by are-rating of the asset class and by currency gains versus the U.S. dollar.
During the period, the Fund’s largest shifts included an increase in IT stock holdings and a decrease in financials. Within IT, the team added new names including Accton Technology Corporation (a Taiwanese manufacturer of telecom and enterprise networking devices) and Largan Precision Company Limited (the world’s leading manufacturer of smartphone camera lenses). The Fund added to positions in Taiwan Semiconductor Manufactoring Company Limited (the largest semiconductor foundry in the world) and Samsung Electronics Company Limited (a global semiconductor leader with diversified businesses in handsets, display, and TVs in Korea) given improved earnings visibility and undemanding valuations.
The team reduced its exposure to financials given an increased certainty toward rate cuts, providing support to emerging market economies at large but also putting pressure on banking sector net interest margins. As such, the team reduced its exposure to financials stocks via sales of Bank of China and Agricultural Bank of China (two of the big four state-owned Chinese banks), Kasikornbank (the third-largest bank in Thailand and the leading bank serving small and medium enterprises), and Bank Pekao (Poland’s second-largest bank), among others.
| Ten largest holdings(%) as of October 31, 20197 | ||||
Taiwan Semiconductor Manufacturing Company Limited | 5.77 | |||
Samsung Electronics Company Limited | 5.35 | |||
China Construction Bank H Shares | 2.22 | |||
Industrial & Commercial Bank of China Limited H Shares | 2.06 | |||
Ping An Insurance Group Company H Shares | 2.06 | |||
Mediatek Incorporated | 1.64 | |||
Bharat Petroleum Corporation Limited | 1.63 | |||
B3 Brasil Bolsa Balcao SA | 1.51 | |||
SK Hynix Incorporated | 1.35 | |||
Itaúsa Investimentos Itaú SA | 1.33 | |||
| Sector distribution as of October 31, 20198 |
 |
Please see footnotes on page 7.
8 | Wells Fargo Emerging Markets Equity Income Fund
Table of Contents
Performance highlights (unaudited)
| Country allocation as of October 31, 20198 |
|
The consumer discretionary and financials sectors detracted from relative returns along with China and Japan.
Within the consumer discretionary sector, stock selection detracted from performance. The strategy did not hold Alibaba, as it does not pay a dividend and therefore does not qualify for inclusion in the strategy. This detracted from relative performance as Alibaba performed well. Genting Malaysia*, a casino, theme park, and hotel operator, underperformed as the Malaysian government increased the gaming tax rate and Fox/Disney dissociated from Genting Malaysia’s new theme park. India outperformed the index, returning 12.4% during the period; however, the Fund had an
average 2.2% underweight. Stock selection was also negative, as Gail Limited underperformed as the tariff order for Gail’s HVJ pipeline was significantly below market expectations, resulting in negative earnings revisions.
Visibility on a trade resolution between the U.S. and China remains low. We expect the Chinese government will remain cautious on monetary policy in an effort to contain overall leverage and focus on financial and state-owned enterprise reforms instead to attract capital and improve efficiency. In Taiwan, our view of the semiconductor sector has been cautiously optimistic given that demand has shown signs of improvement with lower inventory levels, increasing China’s chip localization, and growing secular 5G and high-performance computing trends; however, the lingering macro risks regarding Huawei and trade war tariffs continue to exist. While we maintain our long-term structural bullish view on India, economic growth remains weak and there are risks of further downward revision of gross domestic product forecasts.
On the other hand, positioning in the utilities and IT sectors as well as in Taiwan and Indonesia contributed to relative performance.
Taiwan outperformed, resulting in positive allocation effects given an average overweight, as did stock selection, particularly in the IT sector. MediaTek Incorporated, a Taiwanese fabless semiconductor design company, delivered strong expansion in gross margins as smartphone and growth segments rebounded. The company also announced the industry’s first 5G system on chip, suggesting MediaTek will be part of the first wave of 5G device launches. Brazil outperformed over the most recentone-year period, resulting in positive allocation effects given an average overweight. Stock selection was also positive, particularly in financials, where B3, the Brazilian stock exchange, reported second-quarter results including year-over-yeartop-line growth of 14%, driven by record-high average daily trading volumes.
We remain optimistic about the improving fundamentals of the Brazilian economy. Starting with an ambitious reform bill that is likely to pass in 2019, the economic policies of the new administration are proving to be credit-positive. In contrast, Mexico is experiencing a derating because the erratic economic policies of the Andrés Manuel López Obrador administration are causing a deceleration in the economy.
We remain cautious on South Africa, as reform progress remains slow and the domestic macro backdrop is challenging. Russia’s strong fiscal position, combined with undemanding valuations and attractive dividend yields, drove the market outperformance this year. However, weaker oil prices are a risk to watch. In the Middle East and North Africa region, Saudi Arabian valuations look full, but we would look to add some exposure on pullbacks to play the country’s economic reforms and the government stimulus program. Given the improving macroeconomic conditions and more stable domestic politics, we could see investor interest returning to Turkey.
Please see footnotes on page 7.
Wells Fargo Emerging Markets Equity Income Fund | 9
Table of Contents
As a shareholder of the Fund, you incur two types of costs: (1) transaction costs, including sales charges (loads) on purchase payments and contingent deferred sales charges (if any) on redemptions and (2) ongoing costs, including management fees, distribution(12b-1) and/or shareholder servicing fees, and other Fund expenses. This example is intended to help you understand your ongoing costs (in dollars) of investing in the Fund and to compare these costs with the ongoing costs of investing in other mutual funds.
The example is based on an investment of $1,000 invested at the beginning of thesix-month period and held for the entire period from May 1, 2019 to October 31, 2019.
Actual expenses
The “Actual” line of the table below provides information about actual account values and actual expenses. You may use the information in this line, together with the amount you invested, to estimate the expenses that you paid over the period. Simply divide your account value by $1,000 (for example, an $8,600 account value divided by $1,000 = 8.6), then multiply the result by the number in the “Actual” line under the heading entitled “Expenses paid during period” for your applicable class of shares to estimate the expenses you paid on your account during this period.
Hypothetical example for comparison purposes
The “Hypothetical” line of the table below provides information about hypothetical account values and hypothetical expenses based on the Fund’s actual expense ratio and an assumed rate of return of 5% per year before expenses, which is not the Fund’s actual return. The hypothetical account values and expenses may not be used to estimate the actual ending account balance or expenses you paid for the period. You may use this information to compare the ongoing costs of investing in the Fund and other funds. To do so, compare this 5% hypothetical example with the 5% hypothetical examples that appear in the shareholder reports of the other funds.
Please note that the expenses shown in the table are meant to highlight your ongoing costs only and do not reflect any transactional costs, such as sales charges (loads) and contingent deferred sales charges. Therefore, the “Hypothetical” line of the table is useful in comparing ongoing costs only and will not help you determine the relative total costs of owning different funds. In addition, if these transactional costs were included, your costs would have been higher.
| Beginning account value 5-1-2019 | Ending account value 10-31-2019 | Expenses paid during the period¹ | Annualized net expense ratio | |||||||||||||
Class A | ||||||||||||||||
Actual | $ | 1,000.00 | $ | 1,007.19 | $ | 8.20 | 1.62 | % | ||||||||
Hypothetical (5% return before expenses) | $ | 1,000.00 | $ | 1,017.04 | $ | 8.24 | 1.62 | % | ||||||||
Class C | ||||||||||||||||
Actual | $ | 1,000.00 | $ | 1,003.34 | $ | 11.97 | 2.37 | % | ||||||||
Hypothetical (5% return before expenses) | $ | 1,000.00 | $ | 1,013.26 | $ | 12.03 | 2.37 | % | ||||||||
Class R | ||||||||||||||||
Actual | $ | 1,000.00 | $ | 1,006.04 | $ | 9.46 | 1.87 | % | ||||||||
Hypothetical (5% return before expenses) | $ | 1,000.00 | $ | 1,015.78 | $ | 9.50 | 1.87 | % | ||||||||
Class R6 | ||||||||||||||||
Actual | $ | 1,000.00 | $ | 1,009.41 | $ | 5.93 | 1.17 | % | ||||||||
Hypothetical (5% return before expenses) | $ | 1,000.00 | $ | 1,019.31 | $ | 5.96 | 1.17 | % | ||||||||
Administrator Class | ||||||||||||||||
Actual | $ | 1,000.00 | $ | 1,007.54 | $ | 7.34 | 1.45 | % | ||||||||
Hypothetical (5% return before expenses) | $ | 1,000.00 | $ | 1,017.90 | $ | 7.38 | 1.45 | % | ||||||||
Institutional Class | ||||||||||||||||
Actual | $ | 1,000.00 | $ | 1,008.89 | $ | 6.18 | 1.22 | % | ||||||||
Hypothetical (5% return before expenses) | $ | 1,000.00 | $ | 1,019.06 | $ | 6.21 | 1.22 | % | ||||||||
| 1 | Expenses paid is equal to the annualized net expense ratio of each class multiplied by the average account value over the period, multiplied by the number of days in the most recent fiscal half-year divided by the number of days in the fiscal year (to reflect theone-half-year period). |
10 | Wells Fargo Emerging Markets Equity Income Fund
Table of Contents
Portfolio of investments—October 31, 2019
| Shares | Value | |||||||||||||||
| Common Stocks: 92.57% |
| |||||||||||||||
| Brazil: 5.99% | ||||||||||||||||
B3 Brasil Bolsa Balcao SA (Financials, Capital Markets) | 738,000 | $ | 8,902,740 | |||||||||||||
Banco BTG Pactual SA (Financials, Capital Markets) | 331,900 | 5,375,944 | ||||||||||||||
Banco de Brasil SA (Financials, Banks) | 247,200 | 2,967,879 | ||||||||||||||
Banco Santander Brasil SA (Financials, Banks) | 271,400 | 3,184,661 | ||||||||||||||
Neoenergia SA (Utilities, Electric Utilities) | 1,194,065 | 6,240,519 | ||||||||||||||
Petrobras Distribuidora SA (Consumer Discretionary, Specialty Retail) | 630,000 | 4,442,439 | ||||||||||||||
Vale SA (Materials, Metals & Mining) † | 365,274 | 4,298,948 | ||||||||||||||
| 35,413,130 | ||||||||||||||||
|
| |||||||||||||||
| China: 29.32% | ||||||||||||||||
Air China Limited H Shares (Industrials, Airlines) | 3,212,000 | 2,844,745 | ||||||||||||||
Beijing Capital International Airport Company Limited H Shares (Industrials, Transportation Infrastructure) | 4,966,000 | 4,708,731 | ||||||||||||||
Beijing Enterprises Water Group Limited (Utilities, Water Utilities) | 8,296,000 | 4,340,712 | ||||||||||||||
China Communications Construction Company Limited H Shares (Industrials, Construction & Engineering) | 5,168,000 | 3,937,361 | ||||||||||||||
China Communications Services Corporation Limited H Shares (Industrials, Construction & Engineering) | 7,024,000 | 4,347,450 | ||||||||||||||
China Construction Bank H Shares (Financials, Banks) | 16,305,000 | 13,129,812 | ||||||||||||||
China Life Insurance Company H Shares (Financials, Insurance) | 1,202,000 | 3,129,270 | ||||||||||||||
China Merchants Shekou Industrial Zone Holdings Company Limited Class A (Real Estate, Real Estate Management & Development) | 1,360,873 | 3,621,051 | ||||||||||||||
China Mobile Limited (Communication Services, Wireless Telecommunication Services) | 531,000 | 4,323,381 | ||||||||||||||
China Overseas Land & Investment Limited (Real Estate, Real Estate Management & Development) | 1,380,000 | 4,367,562 | ||||||||||||||
China Petroleum & Chemical Corporation H Shares (Energy, Oil, Gas & Consumable Fuels) | 9,165,600 | 5,263,586 | ||||||||||||||
China Resources Land Limited (Real Estate, Real Estate Management & Development) | 1,390,000 | 5,933,614 | ||||||||||||||
China State Construction Engineering Corporation Limited Class A (Industrials, Construction & Engineering) | 4,520,800 | 3,367,114 | ||||||||||||||
China State Construction International Holdings (Industrials, Construction & Engineering) | 5,806,000 | 5,349,616 | ||||||||||||||
China Vanke Company Limited Class A (Real Estate, Real Estate Management & Development) | 1,265,864 | 4,773,484 | ||||||||||||||
CITIC Securities Company Limited H Shares (Financials, Capital Markets) | 1,477,000 | 2,721,799 | ||||||||||||||
Dali Foods Group Company Limited (Consumer Staples, Food Products) 144A | 2,585,000 | 1,771,508 | ||||||||||||||
Geely Automobile Holdings Limited (Consumer Discretionary, Automobiles) | 1,577,000 | 2,998,654 | ||||||||||||||
Guangzhou Automobile Group Company Limited H Shares (Consumer Discretionary, Automobiles) | 3,064,000 | 3,069,494 | ||||||||||||||
Haier Smart Home Company Limited Class A (Consumer Discretionary, Household Durables) | 2,443,121 | 5,556,178 | ||||||||||||||
Hengan International Group Company Limited (Consumer Staples, Personal Products) | 558,000 | 3,902,322 | ||||||||||||||
Industrial & Commercial Bank of China Limited H Shares (Financials, Banks) | 16,952,000 | 12,201,364 | ||||||||||||||
Inner Mongolia Yili Industrial Group Company Limited Class A (Consumer Staples, Food Products) | 1,384,588 | 5,707,288 | ||||||||||||||
Kunlun Energy Company Limited (Utilities, Gas Utilities) | 2,742,000 | 2,557,957 | ||||||||||||||
Lenovo Group Limited (Information Technology, Technology Hardware, Storage & Peripherals) | 6,756,000 | 4,724,747 | ||||||||||||||
Midea Group Company Limited Class A (Consumer Discretionary, Household Durables) | 850,460 | 6,709,004 | ||||||||||||||
PetroChina Company Limited H Shares (Energy, Oil, Gas & Consumable Fuels) | 7,938,000 | 3,900,140 | ||||||||||||||
PICC Property & Casualty Company Limited H Shares (Financials, Insurance) | 2,941,000 | 3,734,448 | ||||||||||||||
Ping An Insurance Group Company H Shares (Financials, Insurance) | 1,050,500 | 12,166,090 | ||||||||||||||
Sands China Limited (Consumer Discretionary, Hotels, Restaurants & Leisure) | 994,000 | 4,915,486 | ||||||||||||||
Sany Heavy Industry Company Limited Class A (Industrials, Machinery) | 1,596,782 | 3,057,204 | ||||||||||||||
Shimao Property Holding Limited (Real Estate, Real Estate Management & Development) | 1,788,000 | 6,012,519 | ||||||||||||||
Sinopharm Group Company Limited H Shares (Health Care, Health Care Providers & Services) | 1,403,600 | 5,042,317 | ||||||||||||||
Uni-President China Holdings Limited (Consumer Staples, Food Products) | 2,134,000 | 2,205,910 | ||||||||||||||
Wanhua Chemical Group Company Limited Class A (Materials, Chemicals) | 427,300 | 2,770,156 | ||||||||||||||
Zhengzhou Yutong Bus Company Limited Class A (Industrials, Machinery) | 2,062,711 | 4,192,621 | ||||||||||||||
| 173,354,695 | ||||||||||||||||
|
| |||||||||||||||
The accompanying notes are an integral part of these financial statements.
Wells Fargo Emerging Markets Equity Income Fund | 11
Table of Contents
Portfolio of investments—October 31, 2019
| Shares | Value | |||||||||||||||
| Colombia: 0.58% | ||||||||||||||||
Bancolombia SA ADR (Financials, Banks) | 65,610 | $ | 3,403,847 | |||||||||||||
|
| |||||||||||||||
| Hong Kong: 2.28% | ||||||||||||||||
China Merchants Port Holdings Company Limited (Industrials, Transportation Infrastructure) | 2,406,000 | 3,770,529 | ||||||||||||||
Chow Tai Fook Jewellery Company Limited (Consumer Discretionary, Specialty Retail) | 3,511,000 | 3,163,325 | ||||||||||||||
WH Group Limited (Consumer Staples, Food Products) 144A | 6,168,000 | 6,549,016 | ||||||||||||||
| 13,482,870 | ||||||||||||||||
|
| |||||||||||||||
| India: 6.48% | ||||||||||||||||
Bharat Petroleum Corporation Limited (Energy, Oil, Gas & Consumable Fuels) | 1,296,336 | 9,624,455 | ||||||||||||||
Embassy Office Parks REIT (Real Estate, Equity REITs) | 1,055,200 | 6,144,904 | ||||||||||||||
Gail India Limited (Utilities, Gas Utilities) | 2,329,004 | 4,510,001 | ||||||||||||||
Hindustan Petroleum Corporation Limited (Energy, Oil, Gas & Consumable Fuels) | 936,509 | 4,294,444 | ||||||||||||||
Infosys Limited (Information Technology, IT Services) | 541,455 | 5,233,726 | ||||||||||||||
Mahanagar Gas Limited (Utilities, Gas Utilities) | 193,293 | 2,778,994 | ||||||||||||||
Tech Mahindra Limited (Information Technology, IT Services) | 550,348 | 5,734,024 | ||||||||||||||
| 38,320,548 | ||||||||||||||||
|
| |||||||||||||||
| Indonesia: 1.94% | ||||||||||||||||
PT Bank Rakyat Indonesia Tbk (Financials, Banks) | 19,517,500 | 5,853,721 | ||||||||||||||
PT Telekomunikasi Indonesia Persero Tbk (Communication Services, Diversified Telecommunication Services) | 19,265,800 | 5,640,980 | ||||||||||||||
| 11,494,701 | ||||||||||||||||
|
| |||||||||||||||
| Malaysia: 1.80% | ||||||||||||||||
CIMB Group Holdings Bhd (Financials, Banks) | 3,090,900 | 3,883,505 | ||||||||||||||
RHB Capital Bhd (Financials, Banks) | 2,122,700 | 2,921,030 | ||||||||||||||
Sime Darby Bhd (Industrials, Industrial Conglomerates) | 7,122,800 | 3,869,512 | ||||||||||||||
| 10,674,047 | ||||||||||||||||
|
| |||||||||||||||
| Mexico: 2.33% | ||||||||||||||||
Grupo Aeroportuario del Pacifico SAB de CV Class B (Industrials, Transportation Infrastructure) | 296,794 | 3,110,887 | ||||||||||||||
Grupo Financiero Banorte SAB de CV (Financials, Banks) | 606,034 | 3,313,631 | ||||||||||||||
Infraestructura Energetica Nova SAB de CV (Utilities, Gas Utilities) † | 1,011,700 | 4,470,380 | ||||||||||||||
Wal-Mart de Mexico SAB de CV (Consumer Staples, Food & Staples Retailing) | 970,928 | 2,909,781 | ||||||||||||||
| 13,804,679 | ||||||||||||||||
|
| |||||||||||||||
| Peru: 0.49% | ||||||||||||||||
Credicorp Limited (Financials, Banks) | 13,577 | 2,906,021 | ||||||||||||||
|
| |||||||||||||||
| Philippines: 1.10% | ||||||||||||||||
Bank of the Philippine Islands (Financials, Banks) | 1,775,320 | 3,393,557 | ||||||||||||||
Metro Pacific Investments Corporation (Financials, Diversified Financial Services) | 32,935,000 | 3,115,341 | ||||||||||||||
| 6,508,898 | ||||||||||||||||
|
| |||||||||||||||
| Poland: 0.64% | ||||||||||||||||
Powszechny Zaklad Ubezpieczen SA (Financials, Insurance) | 391,458 | 3,785,841 | ||||||||||||||
|
| |||||||||||||||
| Qatar: 0.54% | ||||||||||||||||
Qatar National Bank (Financials, Banks) | 600,730 | 3,167,815 | ||||||||||||||
|
| |||||||||||||||
| Russia: 4.67% | ||||||||||||||||
Aeroflot PJSC (Industrials, Airlines) | 1,870,440 | 3,134,002 | ||||||||||||||
Gazprom PAO ADR (Energy, Oil, Gas & Consumable Fuels) | 665,169 | 5,324,013 | ||||||||||||||
LUKOIL PJSC ADR (Energy, Oil, Gas & Consumable Fuels) | 57,608 | 5,297,632 | ||||||||||||||
The accompanying notes are an integral part of these financial statements.
12 | Wells Fargo Emerging Markets Equity Income Fund
Table of Contents
Portfolio of investments—October 31, 2019
| Shares | Value | |||||||||||||||
| Russia (continued) | ||||||||||||||||
Mobile TeleSystems PJSC ADR (Communication Services, Wireless Telecommunication Services) | 525,960 | $ | 4,707,342 | |||||||||||||
Sberbank of Russia ADR (Financials, Banks) | 406,102 | 5,969,699 | ||||||||||||||
Tatneft ADR (Energy, Oil, Gas & Consumable Fuels) | 45,099 | 3,156,930 | ||||||||||||||
| 27,589,618 | ||||||||||||||||
|
| |||||||||||||||
| Saudi Arabia: 0.48% | ||||||||||||||||
National Commercial Bank (Financials, Banks) | 245,551 | 2,848,164 | ||||||||||||||
|
| |||||||||||||||
| South Africa: 3.80% | ||||||||||||||||
Absa Group Limited (Financials, Banks) | 266,507 | 2,731,650 | ||||||||||||||
Growthpoint Properties Limited (Real Estate, Equity REITs) | 1,834,189 | 2,683,824 | ||||||||||||||
MTN Group Limited (Communication Services, Wireless Telecommunication Services) | 640,783 | 3,968,822 | ||||||||||||||
Sanlam Limited (Financials, Insurance) | 557,630 | 2,936,410 | ||||||||||||||
Standard Bank Group Limited (Financials, Banks) | 359,438 | 4,126,383 | ||||||||||||||
The Bidvest Group Limited (Industrials, Industrial Conglomerates) | 441,409 | 6,019,439 | ||||||||||||||
| 22,466,528 | ||||||||||||||||
|
| |||||||||||||||
| South Korea: 13.33% | ||||||||||||||||
Coway Company Limited (Consumer Discretionary, Household Durables) | 40,863 | 3,224,224 | ||||||||||||||
Hyundai Motor Company (Consumer Discretionary, Automobiles) | 28,328 | 2,970,489 | ||||||||||||||
Hyundai Robotics Company Limited (Industrials, Machinery) | 12,711 | 3,730,978 | ||||||||||||||
KB Financial Group Incorporated (Financials, Banks) | 130,885 | 4,719,262 | ||||||||||||||
Korea Zinc Company Limited (Materials, Metals & Mining) | 10,882 | 4,063,973 | ||||||||||||||
NH Investment & Securities Company Limited (Financials, Capital Markets) | 293,666 | 3,054,157 | ||||||||||||||
POSCO (Materials, Metals & Mining) | 15,994 | 2,907,500 | ||||||||||||||
S-Oil Corporation (Energy, Oil, Gas & Consumable Fuels) | 45,616 | 3,908,991 | ||||||||||||||
Samsung Electronics Company Limited (Information Technology, Technology Hardware, Storage & Peripherals) | 730,287 | 31,635,622 | ||||||||||||||
SK Hynix Incorporated (Information Technology, Semiconductors & Semiconductor Equipment) | 113,561 | 8,003,784 | ||||||||||||||
SK Innovation Company Limited (Energy, Oil, Gas & Consumable Fuels) | 35,676 | 4,906,236 | ||||||||||||||
SK Telecom Company Limited (Communication Services, Wireless Telecommunication Services) | 27,884 | 5,680,096 | ||||||||||||||
| 78,805,312 | ||||||||||||||||
|
| |||||||||||||||
| Taiwan: 13.48% | ||||||||||||||||
Accton Technology Corporation (Information Technology, Communications Equipment) | 470,000 | 2,802,352 | ||||||||||||||
Advantech Company Limited (Information Technology, Technology Hardware, Storage & Peripherals) | 373,000 | 3,694,404 | ||||||||||||||
ASE Industrial Holding Company Limited (Information Technology, Semiconductors & Semiconductor Equipment) | 1,545,000 | 4,035,003 | ||||||||||||||
Delta Electronics Incorporated (Information Technology, Electronic Equipment, Instruments & Components) | 1,073,000 | 4,723,378 | ||||||||||||||
Eclat Textile Company Limited (Consumer Discretionary, Textiles, Apparel & Luxury Goods) | 222,350 | 2,991,157 | ||||||||||||||
Ennoconn Corporation (Information Technology, Technology Hardware, Storage & Peripherals) | 349,000 | 2,619,750 | ||||||||||||||
Hon Hai Precision Industry Company Limited (Information Technology, Electronic Equipment, Instruments & Components) | 1,936,704 | 5,127,982 | ||||||||||||||
Largan Precision Company Limited (Information Technology, Electronic Equipment, Instruments & Components) | 23,000 | 3,377,408 | ||||||||||||||
Mediatek Incorporated (Information Technology, Semiconductors & Semiconductor Equipment) | 722,000 | 9,677,108 | ||||||||||||||
Taiwan Semiconductor Manufacturing Company Limited (Information Technology, Semiconductors & Semiconductor Equipment) | 3,479,000 | 34,115,126 | ||||||||||||||
Wiwynn Corporation (Information Technology, Technology Hardware, Storage & Peripherals) | 344,000 | 6,543,125 | ||||||||||||||
| 79,706,793 | ||||||||||||||||
|
| |||||||||||||||
| Thailand: 0.99% | ||||||||||||||||
Bangkok Bank PCL (Financials, Banks) | 497,200 | 2,873,370 | ||||||||||||||
PTT Exploration & Production PCL (Energy, Oil, Gas & Consumable Fuels) | 743,000 | 2,965,110 | ||||||||||||||
| 5,838,480 | ||||||||||||||||
|
| |||||||||||||||
The accompanying notes are an integral part of these financial statements.
Wells Fargo Emerging Markets Equity Income Fund | 13
Table of Contents
Portfolio of investments—October 31, 2019
| Shares | Value | |||||||||||||||
| Turkey: 0.42% | ||||||||||||||||
Tupras Turkiye Petrol Rafinerileri AS (Energy, Oil, Gas & Consumable Fuels) | 115,577 | $ | 2,516,828 | |||||||||||||
|
| |||||||||||||||
| United Arab Emirates: 0.49% | ||||||||||||||||
First Abu Dhabi Bank PJSC (Financials, Banks) | 693,732 | 2,874,849 | ||||||||||||||
|
| |||||||||||||||
| United Kingdom: 1.42% | ||||||||||||||||
Mondi plc (Materials, Paper & Forest Products) | 162,815 | 3,369,167 | ||||||||||||||
Polymetal International plc (Materials, Metals & Mining) | 308,475 | 5,054,727 | ||||||||||||||
| 8,423,894 | ||||||||||||||||
|
| |||||||||||||||
Total Common Stocks (Cost $501,531,519) | 547,387,558 | |||||||||||||||
|
| |||||||||||||||
| Dividend yield | ||||||||||||||||
| Preferred Stocks: 4.90% |
| |||||||||||||||
| Brazil: 3.87% | ||||||||||||||||
Banco Bradesco SA (Financials, Banks) | 2.42 | % | 551,099 | 4,832,852 | ||||||||||||
Companhia Energetica de Minas Gerais SA (Utilities, Electric Utilities) | 3.81 | 1,193,300 | 4,061,475 | |||||||||||||
Itaúsa Investimentos Itaú SA (Financials, Banks) | 8.77 | 2,306,319 | 7,884,212 | |||||||||||||
Petroleo Brasil SP ADR (Energy, Oil, Gas & Consumable Fuels) | 1.63 | 407,077 | 6,142,792 | |||||||||||||
| 22,921,331 | ||||||||||||||||
|
| |||||||||||||||
| South Korea: 1.03% | ||||||||||||||||
Samsung Electronics Company Limited (Information Technology, Technology Hardware, Storage & Peripherals) | 3.48 | 172,020 | 6,069,381 | |||||||||||||
|
| |||||||||||||||
Total Preferred Stocks (Cost $18,886,047) |
| 28,990,712 | ||||||||||||||
|
| |||||||||||||||
| Yield | ||||||||||||||||
| Short-Term Investments: 1.97% |
| |||||||||||||||
| Investment Companies: 1.97% | ||||||||||||||||
Wells Fargo Government Money Market Fund Select Class (l)(u) | 1.75 | 11,617,435 | 11,617,435 | |||||||||||||
|
| |||||||||||||||
Total Short-Term Investments (Cost $11,617,435) |
| 11,617,435 | ||||||||||||||
|
| |||||||||||||||
| Total investments in securities (Cost $532,035,001) | 99.44 | % | 587,995,705 | |||||
Other assets and liabilities, net | 0.56 | 3,309,015 | ||||||
|
|
|
| |||||
| Total net assets | 100.00 | % | $ | 591,304,720 | ||||
|
|
|
| |||||
| † | Non-income-earning security |
| 144A | The security may be resold in transactions exempt from registration, normally to qualified institutional buyers, pursuant to Rule 144A under the Securities Act of 1933. |
| (l) | The issuer of the security is an affiliated person of the Fund as defined in the Investment Company Act of 1940. |
| (u) | The rate represents the7-day annualized yield at period end. |
Abbreviations:
| ADR | American depositary receipt |
| REIT | Real estate investment trust |
The accompanying notes are an integral part of these financial statements.
14 | Wells Fargo Emerging Markets Equity Income Fund
Table of Contents
Portfolio of investments—October 31, 2019
Investments in Affiliates
An affiliated investment is an investment in which the Fund owns at least 5% of the outstanding voting shares of the issuer or as a result of other relationships, such as the Fund and the issuer having the same investment manager. Transactions with issuers that were either affiliated persons of the Fund at the beginning of the period or the end of the period were as follows:
| Shares, beginning of period | Shares purchased | Shares sold | Shares, end of period | Net realized gains (losses) | Net change in unrealized gains (losses) | Income from affiliated securities | Value, end of period | % of net assets | ||||||||||||||||||||||||||||
| Short-Term Investments | ||||||||||||||||||||||||||||||||||||
Investment Companies | ||||||||||||||||||||||||||||||||||||
Wells Fargo Government Money Market Fund Select Class | 9,497,532 | 260,625,136 | 258,505,233 | 11,617,435 | $ | 0 | $ | 0 | $ | 290,208 | $ | 11,617,435 | 1.97 | % | ||||||||||||||||||||||
The accompanying notes are an integral part of these financial statements.
Wells Fargo Emerging Markets Equity Income Fund | 15
Table of Contents
Statement of assets and liabilities—October 31, 2019
Assets | ||||
Investments in unaffiliated securities, at value (cost $520,417,566) | $ | 576,378,270 | ||
Investments in affiliated securities, at value (cost $11,617,435) | 11,617,435 | |||
Foreign currency, at value (cost $2,979,844) | 2,981,869 | |||
Receivable for investments sold | 7,586,590 | |||
Receivable for Fund shares sold | 498,867 | |||
Receivable for dividends | 920,072 | |||
Prepaid expenses and other assets | 9,232 | |||
|
| |||
Total assets | 599,992,335 | |||
|
| |||
Liabilities | ||||
Payable for investments purchased | 4,562,540 | |||
Payable for Fund shares redeemed | 2,507,044 | |||
Management fee payable | 451,827 | |||
Contingent tax liability | 501,883 | |||
Administration fees payable | 59,474 | |||
Distribution fees payable | 7,477 | |||
Custodian and accounting fees payable | 513,876 | |||
Trustees’ fees and expenses payable | 4,056 | |||
Accrued expenses and other liabilities | 79,438 | |||
|
| |||
Total liabilities | 8,687,615 | |||
|
| |||
Total net assets | $ | 591,304,720 | ||
|
| |||
Net assets consist of | ||||
Paid-in capital | $ | 560,994,302 | ||
Total distributable earnings | 30,310,418 | |||
|
| |||
Total net assets | $ | 591,304,720 | ||
|
| |||
Computation of net asset value and offering price per share | ||||
Net assets – Class A | $ | 20,016,734 | ||
Shares outstanding – Class A1 | 1,785,437 | |||
Net asset value per share – Class A | $11.21 | |||
Maximum offering price per share – Class A2 | $11.89 | |||
Net assets – Class C | $ | 11,958,167 | ||
Shares outstanding – Class C1 | 1,072,380 | |||
Net asset value per share – Class C | $11.15 | |||
Net assets – Class R | $ | 95,393 | ||
Shares outstanding – Class R1 | 8,498 | |||
Net asset value per share – Class R | $11.22 | |||
Net assets – Class R6 | $ | 83,480,601 | ||
Shares outstanding – Class R61 | 7,433,457 | |||
Net asset value per share – Class R6 | $11.23 | |||
Net assets – Administrator Class | $ | 4,685,844 | ||
Shares outstanding – Administrator Class1 | 414,284 | |||
Net asset value per share – Administrator Class | $11.31 | |||
Net assets – Institutional Class | $ | 471,067,981 | ||
Shares outstanding – Institutional Class1 | 41,892,701 | |||
Net asset value per share – Institutional Class | $11.24 | |||
| 1 | The Fund has an unlimited number of authorized shares. |
| 2 | Maximum offering price is computed as 100/94.25 of net asset value. On investments of $50,000 or more, the offering price is reduced. |
The accompanying notes are an integral part of these financial statements.
16 | Wells Fargo Emerging Markets Equity Income Fund
Table of Contents
Statement of operations—year ended October 31, 2019
Investment income | ||||
Dividends (net of foreign withholding taxes of $2,330,305) | $ | 21,628,966 | ||
Income from affiliated securities | 290,208 | |||
|
| |||
Total investment income | 21,919,174 | |||
|
| |||
Expenses | ||||
Management fee | 6,083,731 | |||
Administration fees |
| |||
Class A | 43,136 | |||
Class C | 27,194 | |||
Class R | 220 | |||
Class R6 | 21,981 | |||
Administrator Class | 5,971 | |||
Institutional Class | 608,329 | |||
Shareholder servicing fees |
| |||
Class A | 51,353 | |||
Class C | 32,373 | |||
Class R | 261 | |||
Administrator Class | 11,212 | |||
Distribution fees |
| |||
Class C | 97,114 | |||
Class R | 242 | |||
Custody and accounting fees | 728,941 | |||
Professional fees | 48,028 | |||
Registration fees | 103,522 | |||
Shareholder report expenses | 98,099 | |||
Trustees’ fees and expenses | 21,653 | |||
Other fees and expenses | 68,560 | |||
|
| |||
Total expenses | 8,051,920 | |||
Less: Fee waivers and/or expense reimbursements |
| |||
Fund-level | (341,934 | ) | ||
Class A | (3,255 | ) | ||
Class C | (1,918 | ) | ||
Class R6 | (21,981 | ) | ||
Administrator Class | (4,572 | ) | ||
Institutional Class | (401,202 | ) | ||
|
| |||
Net expenses | 7,277,058 | |||
|
| |||
Net investment income | 14,642,116 | |||
|
| |||
Realized and unrealized gains (losses) on investments | ||||
Net realized losses on |
| |||
Unaffiliated securities | (17,623,782 | ) | ||
Forward foreign currency contracts | (47,841 | ) | ||
|
| |||
Net realized losses on investments | (17,671,623 | ) | ||
Net change in unrealized gains (losses) on investments | 62,604,509 | |||
|
| |||
Net realized and unrealized gains (losses) on investments | 44,932,886 | |||
|
| |||
Net increase in net assets resulting from operations | $ | 59,575,002 | ||
|
| |||
The accompanying notes are an integral part of these financial statements.
Wells Fargo Emerging Markets Equity Income Fund | 17
Table of Contents
Statement of changes in net assets
| Year ended October 31, 2019 | Year ended October 31, 2018 | |||||||||||||||
Operations | ||||||||||||||||
Net investment income | $ | 14,642,116 | $ | 16,423,762 | ||||||||||||
Net realized gains (losses) on investments | (17,671,623 | ) | 14,541,219 | |||||||||||||
Net change in unrealized gains (losses) on investments | 62,604,509 | (86,709,764 | ) | |||||||||||||
|
| |||||||||||||||
Net increase (decrease) in net assets resulting from operations | 59,575,002 | (55,744,783 | ) | |||||||||||||
|
| |||||||||||||||
Distributions to shareholders from net investment income and net realized gains | ||||||||||||||||
Class A | (418,262 | ) | (525,457 | ) | ||||||||||||
Class C | (162,480 | ) | (266,035 | ) | ||||||||||||
Class R | (2,026 | ) | (1,773 | ) | ||||||||||||
Class R6 | (1,924,372 | ) | (1,110,103 | ) | ||||||||||||
Administrator Class | (96,365 | ) | (176,274 | ) | ||||||||||||
Institutional Class | (11,264,878 | ) | (13,821,796 | ) | ||||||||||||
|
| |||||||||||||||
Total distributions to shareholders | (13,868,383 | ) | (15,901,438 | ) | ||||||||||||
|
| |||||||||||||||
Capital share transactions | Shares | Shares | ||||||||||||||
Proceeds from shares sold |
| |||||||||||||||
Class A | 890,759 | 9,653,613 | 1,055,482 | 12,458,892 | ||||||||||||
Class C | 187,678 | 2,023,175 | 290,851 | 3,426,780 | ||||||||||||
Class R | 2,473 | 27,033 | 6,119 | 72,995 | ||||||||||||
Class R6 | 4,899,992 | 51,938,484 | 544,426 | 5,989,376 | ||||||||||||
Administrator Class | 64,933 | 717,682 | 365,539 | 4,353,033 | ||||||||||||
Institutional Class | 12,066,746 | 132,238,601 | 15,709,830 | 185,993,163 | ||||||||||||
|
| |||||||||||||||
| 196,598,588 | 212,294,239 | |||||||||||||||
|
| |||||||||||||||
Reinvestment of distributions |
| |||||||||||||||
Class A | 36,560 | 397,529 | 45,302 | 509,928 | ||||||||||||
Class C | 13,107 | 141,943 | 20,786 | 230,960 | ||||||||||||
Class R | 136 | 1,481 | 100 | 1,107 | ||||||||||||
Class R6 | 148,340 | 1,620,864 | 71,439 | 811,863 | ||||||||||||
Administrator Class | 8,471 | 92,927 | 14,654 | 170,162 | ||||||||||||
Institutional Class | 961,076 | 10,479,060 | 1,130,762 | 12,805,195 | ||||||||||||
|
| |||||||||||||||
| 12,733,804 | 14,529,215 | |||||||||||||||
|
| |||||||||||||||
Payment for shares redeemed |
| |||||||||||||||
Class A | (1,047,749 | ) | (11,379,904 | ) | (1,144,886 | ) | (13,380,105 | ) | ||||||||
Class C | (481,016 | ) | (5,160,401 | ) | (412,291 | ) | (4,734,240 | ) | ||||||||
Class R | (3,032 | ) | (33,352 | ) | (36 | ) | (414 | ) | ||||||||
Class R6 | (1,153,400 | ) | (12,803,248 | ) | (2,016,811 | ) | (23,813,908 | ) | ||||||||
Administrator Class | (116,130 | ) | (1,269,026 | ) | (1,108,398 | ) | (13,334,749 | ) | ||||||||
Institutional Class | (14,855,796 | ) | (160,766,339 | ) | (17,094,623 | ) | (198,267,648 | ) | ||||||||
|
| |||||||||||||||
| (191,412,270 | ) | (253,531,064 | ) | |||||||||||||
|
| |||||||||||||||
Net increase (decrease) in net assets resulting from capital share transactions | 17,920,122 | (26,707,610 | ) | |||||||||||||
|
| |||||||||||||||
Total increase (decrease) in net assets | 63,626,741 | (98,353,831 | ) | |||||||||||||
|
| |||||||||||||||
Net assets | ||||||||||||||||
Beginning of period | 527,677,979 | 626,031,810 | ||||||||||||||
|
| |||||||||||||||
End of period | $ | 591,304,720 | $ | 527,677,979 | ||||||||||||
|
| |||||||||||||||
The accompanying notes are an integral part of these financial statements.
18 | Wells Fargo Emerging Markets Equity Income Fund
Table of Contents
(For a share outstanding throughout each period)
| Year ended October 31 | ||||||||||||||||||||
| CLASS A | 2019 | 2018 | 2017 | 2016 | 2015 | |||||||||||||||
Net asset value, beginning of period | $10.33 | $11.68 | $10.27 | $9.97 | $11.33 | |||||||||||||||
Net investment income | 0.24 | 0.27 | 0.18 | 1 | 0.23 | 1 | 0.20 | |||||||||||||
Net realized and unrealized gains (losses) on investments | 0.86 | (1.36 | ) | 1.43 | 0.29 | (1.36 | ) | |||||||||||||
|
|
|
|
|
|
|
|
|
| |||||||||||
Total from investment operations | 1.10 | (1.09 | ) | 1.61 | 0.52 | (1.16 | ) | |||||||||||||
Distributions to shareholders from | ||||||||||||||||||||
Net investment income | (0.22 | ) | (0.26 | ) | (0.20 | ) | (0.22 | ) | (0.20 | ) | ||||||||||
Net asset value, end of period | $11.21 | $10.33 | $11.68 | $10.27 | $9.97 | |||||||||||||||
Total return2 | 10.78 | % | (9.47 | )% | 15.79 | % | 5.29 | % | (10.34 | )% | ||||||||||
Ratios to average net assets (annualized) | ||||||||||||||||||||
Gross expenses | 1.69 | % | 1.67 | % | 1.68 | % | 1.79 | % | 1.89 | % | ||||||||||
Net expenses | 1.62 | % | 1.62 | % | 1.63 | % | 1.65 | % | 1.65 | % | ||||||||||
Net investment income | 2.12 | % | 2.30 | % | 1.72 | % | 2.34 | % | 2.22 | % | ||||||||||
Supplemental data | ||||||||||||||||||||
Portfolio turnover rate | 73 | % | 69 | % | 80 | % | 64 | % | 84 | % | ||||||||||
Net assets, end of period (000s omitted) | $20,017 | $19,684 | $22,774 | $26,459 | $22,866 | |||||||||||||||
| 1 | Calculated based upon average shares outstanding |
| 2 | Total return calculations do not include any sales charges. |
The accompanying notes are an integral part of these financial statements.
Wells Fargo Emerging Markets Equity Income Fund | 19
Table of Contents
Financial highlights
(For a share outstanding throughout each period)
| Year ended October 31 | ||||||||||||||||||||
| CLASS C | 2019 | 2018 | 2017 | 2016 | 2015 | |||||||||||||||
Net asset value, beginning of period | $10.27 | $11.63 | $10.23 | $9.94 | $11.32 | |||||||||||||||
Net investment income | 0.15 | 0.18 | 0.13 | 0.16 | 1 | 0.14 | ||||||||||||||
Net realized and unrealized gains (losses) on investments | 0.87 | (1.35 | ) | 1.39 | 0.28 | (1.38 | ) | |||||||||||||
|
|
|
|
|
|
|
|
|
| |||||||||||
Total from investment operations | 1.02 | (1.17 | ) | 1.52 | 0.44 | (1.24 | ) | |||||||||||||
Distributions to shareholders from | ||||||||||||||||||||
Net investment income | (0.14 | ) | (0.19 | ) | (0.12 | ) | (0.15 | ) | (0.14 | ) | ||||||||||
Net asset value, end of period | $11.15 | $10.27 | $11.63 | $10.23 | $9.94 | |||||||||||||||
Total return2 | 10.01 | % | (10.20 | )% | 14.91 | % | 4.53 | % | (10.95 | )% | ||||||||||
Ratios to average net assets (annualized) | ||||||||||||||||||||
Gross expenses | 2.44 | % | 2.42 | % | 2.42 | % | 2.54 | % | 2.64 | % | ||||||||||
Net expenses | 2.37 | % | 2.37 | % | 2.38 | % | 2.40 | % | 2.40 | % | ||||||||||
Net investment income | 1.30 | % | 1.53 | % | 1.18 | % | 1.62 | % | 1.45 | % | ||||||||||
Supplemental data | ||||||||||||||||||||
Portfolio turnover rate | 73 | % | 69 | % | 80 | % | 64 | % | 84 | % | ||||||||||
Net assets, end of period (000s omitted) | $11,958 | $13,896 | $16,898 | $13,327 | $10,190 | |||||||||||||||
| 1 | Calculated based upon average shares outstanding |
| 2 | Total return calculations do not include any sales charges. |
The accompanying notes are an integral part of these financial statements.
20 | Wells Fargo Emerging Markets Equity Income Fund
Table of Contents
Financial highlights
(For a share outstanding throughout each period)
| Year ended October 31 | ||||||||||||||||||||
| CLASS R | 2019 | 2018 | 2017 | 2016 | 20151 | |||||||||||||||
Net asset value, beginning of period | $10.34 | $11.71 | $10.30 | $9.99 | $9.44 | |||||||||||||||
Net investment income (loss) | 0.20 | 0.24 | 0.18 | 0.20 | 2 | (0.01 | )2 | |||||||||||||
Net realized and unrealized gains (losses) on investments | 0.88 | (1.37 | ) | 1.40 | 0.30 | 0.56 | ||||||||||||||
|
|
|
|
|
|
|
|
|
| |||||||||||
Total from investment operations | 1.08 | (1.13 | ) | 1.58 | 0.50 | 0.55 | ||||||||||||||
Distributions to shareholders from | ||||||||||||||||||||
Net investment income | (0.20 | ) | (0.24 | ) | (0.17 | ) | (0.19 | ) | (0.00 | )3 | ||||||||||
Net asset value, end of period | $11.22 | $10.34 | $11.71 | $10.30 | $9.99 | |||||||||||||||
Total return4 | 10.61 | % | (9.70 | )% | 15.39 | % | 5.13 | % | 5.87 | % | ||||||||||
Ratios to average net assets (annualized) | ||||||||||||||||||||
Gross expenses | 1.93 | % | 1.94 | % | 1.91 | % | 2.04 | % | 2.10 | % | ||||||||||
Net expenses | 1.87 | % | 1.87 | % | 1.87 | % | 1.90 | % | 1.90 | % | ||||||||||
Net investment income (loss) | 1.97 | % | 2.64 | % | 1.69 | % | 2.08 | % | (0.90 | )% | ||||||||||
Supplemental data | ||||||||||||||||||||
Portfolio turnover rate | 73 | % | 69 | % | 80 | % | 64 | % | 84 | % | ||||||||||
Net assets, end of period (000s omitted) | $95 | $92 | $32 | $28 | $26 | |||||||||||||||
| 1 | For the period from September 30, 2015 (commencement of class operations) to October 31, 2015 |
| 2 | Calculated based upon average shares outstanding |
| 3 | Amount is less than $0.005. |
| 4 | Returns for periods of less than one year are not annualized. |
The accompanying notes are an integral part of these financial statements.
Wells Fargo Emerging Markets Equity Income Fund | 21
Table of Contents
Financial highlights
(For a share outstanding throughout each period)
| Year ended October 31 | ||||||||||||||||||||
| CLASS R6 | 2019 | 2018 | 2017 | 2016 | 20151 | |||||||||||||||
Net asset value, beginning of period | $10.34 | $11.69 | $10.29 | $9.97 | $9.42 | |||||||||||||||
Net investment income (loss) | 0.31 | 2 | 0.32 | 0.33 | 2 | 0.30 | 2 | (0.00 | )2,3 | |||||||||||
Net realized and unrealized gains (losses) on investments | 0.85 | (1.35 | ) | 1.32 | 0.27 | 0.56 | ||||||||||||||
|
|
|
|
|
|
|
|
|
| |||||||||||
Total from investment operations | 1.16 | (1.03 | ) | 1.65 | 0.57 | 0.56 | ||||||||||||||
Distributions to shareholders from | ||||||||||||||||||||
Net investment income | (0.27 | ) | (0.32 | ) | (0.25 | ) | (0.25 | ) | (0.01 | ) | ||||||||||
Net asset value, end of period | $11.23 | $10.34 | $11.69 | $10.29 | $9.97 | |||||||||||||||
Total return4 | 11.34 | % | (9.05 | )% | 16.25 | % | 5.90 | % | 5.91 | % | ||||||||||
Ratios to average net assets (annualized) | ||||||||||||||||||||
Gross expenses | 1.26 | % | 1.24 | % | 1.20 | % | 1.36 | % | 1.40 | % | ||||||||||
Net expenses | 1.17 | % | 1.17 | % | 1.17 | % | 1.20 | % | 1.20 | % | ||||||||||
Net investment income (loss) | 2.81 | % | 2.58 | % | 2.96 | % | 3.03 | % | (0.19 | )% | ||||||||||
Supplemental data | ||||||||||||||||||||
Portfolio turnover rate | 73 | % | 69 | % | 80 | % | 64 | % | 84 | % | ||||||||||
Net assets, end of period (000s omitted) | $83,481 | $36,597 | $57,765 | $2,592 | $26 | |||||||||||||||
| 1 | For the period from September 30, 2015 (commencement of class operations) to October 31, 2015 |
| 2 | Calculated based upon average shares outstanding |
| 3 | Amount is more than $(0.005). |
| 4 | Returns for periods of less than one year are not annualized. |
The accompanying notes are an integral part of these financial statements.
22 | Wells Fargo Emerging Markets Equity Income Fund
Table of Contents
Financial highlights
(For a share outstanding throughout each period)
| Year ended October 31 | ||||||||||||||||||||
| ADMINISTRATOR CLASS | 2019 | 2018 | 2017 | 2016 | 2015 | |||||||||||||||
Net asset value, beginning of period | $10.41 | $11.76 | $10.32 | $10.00 | $11.35 | |||||||||||||||
Net investment income | 0.25 | 1 | 0.22 | 1 | 0.18 | 1 | 0.25 | 1 | 0.23 | |||||||||||
Net realized and unrealized gains (losses) on investments | 0.89 | (1.29 | ) | 1.46 | 0.29 | (1.37 | ) | |||||||||||||
|
|
|
|
|
|
|
|
|
| |||||||||||
Total from investment operations | 1.14 | (1.07 | ) | 1.64 | 0.54 | (1.14 | ) | |||||||||||||
Distributions to shareholders from | ||||||||||||||||||||
Net investment income | (0.24 | ) | (0.28 | ) | (0.20 | ) | (0.22 | ) | (0.21 | ) | ||||||||||
Net asset value, end of period | $11.31 | $10.41 | $11.76 | $10.32 | $10.00 | |||||||||||||||
Total return | 11.01 | % | (9.29 | )% | 15.99 | % | 5.56 | % | (10.12 | )% | ||||||||||
Ratios to average net assets (annualized) | ||||||||||||||||||||
Gross expenses | 1.61 | % | 1.57 | % | 1.58 | % | 1.71 | % | 1.76 | % | ||||||||||
Net expenses | 1.45 | % | 1.45 | % | 1.45 | % | 1.45 | % | 1.45 | % | ||||||||||
Net investment income | 2.24 | % | 1.86 | % | 1.73 | % | 2.54 | % | 2.38 | % | ||||||||||
Supplemental data | ||||||||||||||||||||
Portfolio turnover rate | 73 | % | 69 | % | 80 | % | 64 | % | 84 | % | ||||||||||
Net assets, end of period (000s omitted) | $4,686 | $4,758 | $13,940 | $50,970 | $43,928 | |||||||||||||||
| 1 | Calculated based upon average shares outstanding |
The accompanying notes are an integral part of these financial statements.
Wells Fargo Emerging Markets Equity Income Fund | 23
Table of Contents
Financial highlights
(For a share outstanding throughout each period)
| Year ended October 31 | ||||||||||||||||||||
| INSTITUTIONAL CLASS | 2019 | 2018 | 2017 | 2016 | 2015 | |||||||||||||||
Net asset value, beginning of period | $10.35 | $11.70 | $10.30 | $9.98 | $11.34 | |||||||||||||||
Net investment income | 0.28 | 0.32 | 0.25 | 0.27 | 1 | 0.25 | 1 | |||||||||||||
Net realized and unrealized gains (losses) on investments | 0.87 | (1.36 | ) | 1.39 | 0.30 | (1.36 | ) | |||||||||||||
|
|
|
|
|
|
|
|
|
| |||||||||||
Total from investment operations | 1.15 | (1.04 | ) | 1.64 | 0.57 | (1.11 | ) | |||||||||||||
Distributions to shareholders from | ||||||||||||||||||||
Net investment income | (0.26 | ) | (0.31 | ) | (0.24 | ) | (0.25 | ) | (0.25 | ) | ||||||||||
Net asset value, end of period | $11.24 | $10.35 | $11.70 | $10.30 | $9.98 | |||||||||||||||
Total return | 11.24 | % | (9.11 | )% | 16.11 | % | 5.84 | % | (9.95 | )% | ||||||||||
Ratios to average net assets (annualized) | ||||||||||||||||||||
Gross expenses | 1.36 | % | 1.34 | % | 1.33 | % | 1.45 | % | 1.51 | % | ||||||||||
Net expenses | 1.22 | % | 1.22 | % | 1.23 | % | 1.25 | % | 1.25 | % | ||||||||||
Net investment income | 2.54 | % | 2.73 | % | 2.32 | % | 2.75 | % | 2.41 | % | ||||||||||
Supplemental data | ||||||||||||||||||||
Portfolio turnover rate | 73 | % | 69 | % | 80 | % | 64 | % | 84 | % | ||||||||||
Net assets, end of period (000s omitted) | $471,068 | $452,650 | $514,624 | $426,801 | $132,918 | |||||||||||||||
| 1 | Calculated based upon average shares outstanding |
The accompanying notes are an integral part of these financial statements.
24 | Wells Fargo Emerging Markets Equity Income Fund
Table of Contents
1. ORGANIZATION
Wells Fargo Funds Trust (the “Trust”), a Delaware statutory trust organized on March 10, 1999, is anopen-end management investment company registered under the Investment Company Act of 1940, as amended (the “1940 Act”). As an investment company, the Trust follows the accounting and reporting guidance in Financial Accounting Standards Board (“FASB”)Accounting Standards Codification Topic 946, Financial Services – Investment Companies. These financial statements report on the Wells Fargo Emerging Markets Equity Income Fund (the “Fund”) which is a diversified series of the Trust.
2. SIGNIFICANT ACCOUNTING POLICIES
The following significant accounting policies, which are consistently followed in the preparation of the financial statements of the Fund, are in conformity with U.S. generally accepted accounting principles which require management to make estimates and assumptions that affect the reported amounts of assets and liabilities, disclosure of contingent assets and liabilities at the date of the financial statements, and the reported amounts of revenues and expenses during the reporting period. Actual results could differ from those estimates.
Securities valuation
All investments are valued each business day as of the close of regular trading on the New York Stock Exchange (generally 4 p.m. Eastern Time), although the Fund may deviate from this calculation time under unusual or unexpected circumstances.
Equity securities that are listed on a foreign or domestic exchange or market are valued at the official closing price or, if none, the last sales price. If no sale occurs on the principal exchange or market that day, a fair value price will be determined in accordance with the Fund’s Valuation Procedures.
The values of securities denominated in foreign currencies are translated into U.S. dollars at rates provided by an independent foreign currency pricing source at a time each business day specified by the Wells Fargo Asset Management Pricing Committee at Wells Fargo Funds Management, LLC (“Funds Management”).
Many securities markets and exchanges outside the U.S. close prior to the close of the New York Stock Exchange and therefore may not fully reflect trading or events that occur after the close of the principal exchange in which the foreign securities are traded, but before the close of the New York Stock Exchange. If such trading or events are expected to materially affect the value of such securities, then fair value pricing procedures approved by the Board of Trustees of the Fund are applied. These procedures take into account multiple factors including movements in U.S. securities markets after foreign exchanges close. Foreign securities that are fair valued under these procedures are categorized as Level 2 and the application of these procedures may result in transfers between Level 1 and Level 2. Depending on market activity, such fair valuations may be frequent. Such fair value pricing may result in net asset values that are higher or lower than net asset values based on the last reported sales price or latest quoted bid price. On October 31, 2019, such fair value pricing was not used in pricing foreign securities.
Investments in registeredopen-end investment companies are valued at net asset value.
Investments which are not valued using any of the methods discussed above are valued at their fair value, as determined in good faith by the Board of Trustees. The Board of Trustees has established a Valuation Committee comprised of the Trustees and has delegated to it the authority to take any actions regarding the valuation of portfolio securities that the Valuation Committee deems necessary or appropriate, including determining the fair value of portfolio securities, unless the determination has been delegated to the Wells Fargo Asset Management Pricing Committee. The Board of Trustees retains the authority to make or ratify any valuation decisions or approve any changes to the Valuation Procedures as it deems appropriate. On a quarterly basis, the Board of Trustees receives reports on any valuation actions taken by the Valuation Committee or the Wells Fargo Asset Management Pricing Committee which may include items for ratification.
Foreign currency translation
The accounting records of the Fund are maintained in U.S. dollars. The values of other assets and liabilities denominated in foreign currencies are translated into U.S. dollars at rates provided by an independent foreign currency pricing source at a time each business day specified by the Wells Fargo Asset Management Pricing Committee. Purchases and sales of securities, and income and expenses are converted at the rate of exchange on the respective dates of such transactions. Net realized foreign exchange gains or losses arise from sales of foreign currencies, currency gains or losses realized between the trade and settlement dates on securities transactions, and the difference between the amounts of dividends, interest and foreign withholding taxes recorded and the U.S. dollar equivalent of the amounts actually paid or received. Net unrealized foreign exchange gains and losses arise from changes in the fair value of assets and liabilities other than investments in securities resulting from changes in exchange rates. The changes in net assets arising from changes in exchange rates of securities and the changes in net assets resulting from changes in market prices of securities are not separately presented. Such changes are included in net realized and unrealized gains or losses from investments.
Wells Fargo Emerging Markets Equity Income Fund | 25
Table of Contents
Notes to financial statements
Participation notes
The Fund may invest in participation notes to gain exposure to securities in certain foreign markets. Participation notes are issued by banks or broker-dealers and are designed to offer a return linked to a particular underlying foreign security. Participation notes involve transaction costs, which may be higher than those applicable to the underlying foreign security. The holder of the participation note is entitled to receive from the bank or broker-dealer, an amount equal to the dividend paid by the issuer of the underlying foreign security; however, the holder is not entitled to the same rights (i.e. voting rights) as an owner of the underlying foreign security. Investments in participation notes involve risks beyond those normally associated with a direct investment in an underlying security. The Fund has no rights against the issuer of the underlying foreign security and participation notes expose the Fund to counterparty risk in the event the counterparty does not perform. There is also no assurance there will be a secondary trading market for the participation note or that the trading price of the participation note will equal the underlying value of the foreign security that it seeks to replicate.
Forward foreign currency contracts
A forward foreign currency contract is an agreement between two parties to purchase or sell a specific currency for an agreed-upon price at a future date. The Fund enters into forward foreign currency contracts to facilitate transactions in foreign-denominated securities and to attempt to minimize the risk to the Fund from adverse changes in the relationship between currencies. Forward foreign currency contracts are recorded at the forward rate andmarked-to-market daily. When the contracts are closed, realized gains and losses arising from such transactions are recorded as realized gains or losses on forward foreign currency contracts. The Fund is subject to foreign currency risk and may be exposed to risks if the counterparties to the contracts are unable to meet the terms of their contracts or if the value of the foreign currency changes unfavorably. The Fund’s maximum risk of loss from counterparty credit risk is the unrealized gains on the contracts. This risk may be mitigated if there is a master netting arrangement between the Fund and the counterparty.
Security transactions and income recognition
Securities transactions are recorded on a trade date basis. Realized gains or losses are recorded on the basis of identified cost.
Dividend income is recognized on theex-dividend date, except for certain dividends from foreign securities, which are recorded as soon as the custodian verifies theex-dividend date. Dividend income from foreign securities is recorded net of foreign taxes withheld where recovery of such taxes is not assured.
Distributions to shareholders
Distributions to shareholders are recorded on theex-dividend date and paid from net investment income monthly and any net realized gains are paid at least annually. Such distributions are determined in accordance with income tax regulations and may differ from U.S. generally accepted accounting principles. Dividend sources are estimated at the time of declaration. The tax character of distributions is determined as of the Fund’s fiscal year end. Therefore, a portion of the Fund’s distributions made prior to the Fund’s fiscal year end may be categorized as a tax return of capital at year end.
Federal and other taxes
The Fund intends to continue to qualify as a regulated investment company by distributing substantially all of its investment company taxable income and any net realized capital gains (after reduction for capital loss carryforwards) sufficient to relieve it from all, or substantially all, federal income taxes. Accordingly, no provision for federal income taxes was required.
The Fund’s income and federal excise tax returns and all financial records supporting those returns for the prior three fiscal years are subject to examination by the federal and Delaware revenue authorities. Management has analyzed the Fund’s tax positions taken on federal, state, and foreign tax returns for all open tax years and does not believe that there are any uncertain tax positions that require recognition of a tax liability.
As of October 31, 2019, the aggregate cost of all investments for federal income tax purposes was $535,102,524 and the unrealized gains (losses) consisted of:
Gross unrealized gains | $ | 79,045,533 | ||
Gross unrealized losses | (26,152,352 | ) | ||
Net unrealized gains | $ | 52,893,181 | ||
As of October 31, 2019, the Fund had capital loss carryforwards which consist of $13,252,661 in short-term capital losses and $12,173,464 in long-term capital losses.
26 | Wells Fargo Emerging Markets Equity Income Fund
Table of Contents
Notes to financial statements
Class allocations
The separate classes of shares offered by the Fund differ principally in applicable sales charges, distribution, shareholder servicing, and administration fees. Class specific expenses are charged directly to that share class. Investment income, common fund-level expenses, and realized and unrealized gains (losses) on investments are allocated daily to each class of shares based on the relative proportion of net assets of each class.
3. FAIR VALUATION MEASUREMENTS
Fair value measurements of investments are determined within a framework that has established a fair value hierarchy based upon the various data inputs utilized in determining the value of the Fund’s investments. The three-level hierarchy gives the highest priority to unadjusted quoted prices in active markets for identical assets or liabilities (Level 1) and the lowest priority to unobservable inputs (Level 3). The Fund’s investments are classified within the fair value hierarchy based on the lowest level of input that is significant to the fair value measurement. The inputs are summarized into three broad levels as follows:
| ∎ | Level 1 – quoted prices in active markets for identical securities |
| ∎ | Level 2 – other significant observable inputs (including quoted prices for similar securities, interest rates, prepayment speeds, credit risk, etc.) |
| ∎ | Level 3 – significant unobservable inputs (including the Fund’s own assumptions in determining the fair value of investments) |
The inputs or methodologies used for valuing investments in securities are not necessarily an indication of the risk associated with investing in those securities.
The following is a summary of the inputs used in valuing the Fund’s assets and liabilities as of October 31, 2019:
| Quoted prices (Level 1) | Other significant observable inputs (Level 2) | Significant (Level 3) | Total | |||||||||||||
Assets | ||||||||||||||||
Investments in: | ||||||||||||||||
Common stocks | ||||||||||||||||
Brazil | $ | 35,413,130 | $ | 0 | $ | 0 | $ | 35,413,130 | ||||||||
China | 173,354,695 | 0 | 0 | 173,354,695 | ||||||||||||
Columbia | 3,403,847 | 0 | 0 | 3,403,847 | ||||||||||||
Hong Kong | 13,482,870 | 0 | 0 | 13,482,870 | ||||||||||||
India | 38,320,548 | 0 | 0 | 38,320,548 | ||||||||||||
Indonesia | 11,494,701 | 0 | 0 | 11,494,701 | ||||||||||||
Malaysia | 10,674,047 | 0 | 0 | 10,674,047 | ||||||||||||
Mexico | 13,804,679 | 0 | 0 | 13,804,679 | ||||||||||||
Peru | 2,906,021 | 0 | 0 | 2,906,021 | ||||||||||||
Philippines | 6,508,898 | 0 | 0 | 6,508,898 | ||||||||||||
Poland | 3,785,841 | 0 | 0 | 3,785,841 | ||||||||||||
Qatar | 3,167,815 | 0 | 0 | 3,167,815 | ||||||||||||
Russia | 27,589,618 | 0 | 0 | 27,589,618 | ||||||||||||
Saudi Arabia | 2,848,164 | 0 | 0 | 2,848,164 | ||||||||||||
South Africa | 22,466,528 | 0 | 0 | 22,466,528 | ||||||||||||
South Korea | 78,805,312 | 0 | 0 | 78,805,312 | ||||||||||||
Taiwan | 79,706,793 | 0 | 0 | 79,706,793 | ||||||||||||
Thailand | 5,838,480 | 0 | 0 | 5,838,480 | ||||||||||||
Turkey | 2,516,828 | 0 | 0 | 2,516,828 | ||||||||||||
United Arab Emirates | 2,874,849 | 0 | 0 | 2,874,849 | ||||||||||||
United Kingdom | 8,423,894 | 0 | 0 | 8,423,894 | ||||||||||||
Preferred stocks | ||||||||||||||||
Brazil | 22,921,331 | 0 | 0 | 22,921,331 | ||||||||||||
South Korea | 6,069,381 | 0 | 0 | 6,069,381 | ||||||||||||
Short-term investments | ||||||||||||||||
Investment companies | 11,617,435 | 0 | 0 | 11,617,435 | ||||||||||||
Total assets | $ | 587,995,705 | $ | 0 | $ | 0 | $ | 587,995,705 | ||||||||
Additional sector, industry or geographic detail is included in the Portfolio of Investments.
For the year ended October 31, 2019, the Fund did not have any transfers into/out of Level 3.
Wells Fargo Emerging Markets Equity Income Fund | 27
Table of Contents
Notes to financial statements
4. TRANSACTIONS WITH AFFILIATES
Management fee
Funds Management, an indirect wholly owned subsidiary of Wells Fargo & Company (“Wells Fargo”), is the manager of the Fund and provides advisory and fund-level administrative services under an investment management agreement. Under the investment management agreement, Funds Management is responsible for, among other services, implementing the investment objectives and strategies of the Fund, supervising the subadviser and providing fund-level administrative services in connection with the Fund’s operations. As compensation for its services under the investment management agreement, Funds Management is entitled to receive a management fee at the following annual rate based on the Fund’s average daily net assets:
| Average daily net assets | Management fee | |||
First $1 billion | 1.050 | % | ||
Next $1 billion | 1.025 | |||
Next $2 billion | 1.000 | |||
Next $1 billion | 0.975 | |||
Next $3 billion | 0.965 | |||
Next $2 billion | 0.955 | |||
Over $10 billion | 0.945 | |||
For the year ended October 31, 2019, the management fee was equivalent to an annual rate of 1.05% of the Fund’s average daily net assets.
Funds Management has retained the services of a subadviser to provide daily portfolio management to the Fund. The fee for subadvisory services is borne by Funds Management. Wells Capital Management Incorporated, an affiliate of Funds Management and an indirect wholly owned subsidiary of Wells Fargo, is the subadviser to the Fund and is entitled to receive a fee from Funds Management at an annual rate starting at 0.65% and declining to 0.45% as the average daily net assets of the Fund increase.
Administration fees
Under a class-level administration agreement, Funds Management provides class-level administrative services to the Fund, which includes paying fees and expenses for services provided by the transfer agent,sub-transfer agents, omnibus account servicers and record-keepers. As compensation for its services under the class-level administration agreement, Funds Management receives an annual fee which is calculated based on the average daily net assets of each class as follows:
| Class-level administration fee | ||
Class A, Class C, Class R | 0.21% | |
Class R6 | 0.03 | |
Administrator Class, Institutional Class | 0.13 | |
Waivers and/or expense reimbursements
Funds Management has contractually waived and/or reimbursed management and administration fees to the extent necessary to maintain certain net operating expense ratios for the Fund. When each class of the Fund has exceeded its expense cap, Funds Management has waived fees and/or reimbursed expenses from fund-level expenses on a proportionate basis and then from class specific expenses. When only certain classes exceed their expense caps, waivers and/or reimbursements are applied against class specific expenses before fund-level expenses. Funds Management has committed through February 29, 2020 to waive fees and/or reimburse expenses to the extent necessary to cap the Fund’s expenses at 1.62% for Class A shares, 2.37% for Class C shares, 1.87% for Class R shares, 1.17% for Class R6 shares, 1.45% for Administrator Class shares and 1.22% for Institutional Class shares. Prior to or after the commitment expiration date, the cap may be increased or the commitment to maintain the cap may be terminated only with the approval of the Board of Trustees.
Distribution fees
The Trust has adopted a distribution plan for Class C and Class R shares of the Fund pursuant to Rule12b-1 under the 1940 Act. Distribution fees are charged to Class C and Class R shares and paid to Wells Fargo Funds Distributor, LLC (“Funds Distributor”), the principal underwriter, at an annual rate of 0.75% of the average daily net assets of Class C shares and 0.25% of the average daily net assets of Class R shares.
28 | Wells Fargo Emerging Markets Equity Income Fund
Table of Contents
Notes to financial statements
In addition, Funds Distributor is entitled to receive thefront-end sales charge from the purchase of Class A shares and a contingent deferred sales charge on the redemption of certain Class A shares. Funds Distributor is also entitled to receive the contingent deferred sales charges from redemptions of Class C shares. For the year ended October 31, 2019, Funds Distributor received $7,482 from the sale of Class A shares. No contingent deferred sales charges were incurred by Class A and Class C shares for the year ended October 31, 2019.
Shareholder servicing fees
The Trust has entered into contracts with one or more shareholder servicing agents, whereby Class A, Class C, Class R, and Administrator Class of the Fund are charged a fee at an annual rate of 0.25% of the average daily net assets of each respective class. A portion of these total shareholder servicing fees were paid to affiliates of Wells Fargo.
Interfund transactions
The Fund may purchase or sell portfolio investment securities to certain other Wells Fargo affiliates pursuant to Rule17a-7 under the 1940 Act and under procedures adopted by the Board of Trustees. The procedures have been designed to ensure that these interfund transactions, which do not incur broker commissions, are effected at current market prices.
5. INVESTMENT PORTFOLIO TRANSACTIONS
Purchases and sales of investments, excluding U.S. government obligations (if any) and short-term securities, for the year ended October 31, 2019 were $429,053,981 and $409,110,363, respectively.
6. DERIVATIVE TRANSACTIONS
During the year ended October 31, 2019, the Fund entered into forward foreign currency contracts for hedging purposes. The Fund had average contract amounts of $50,594 and $55,314 in forward foreign currency contracts to buy and forward foreign currency contracts to sell, respectively, during the year ended October 31, 2019.
The fair value, realized gains or losses and change in unrealized gains or losses, if any, on derivative instruments are reflected in the corresponding financial statement captions.
7. BANK BORROWINGS
The Trust (excluding the money market funds), Wells Fargo Master Trust and Wells Fargo Variable Trust are parties to a $280,000,000 revolving credit agreement whereby the Fund is permitted to use bank borrowings for temporary or emergency purposes, such as to fund shareholder redemption requests. Interest under the credit agreement is charged to the Fund based on a borrowing rate equal to the higher of the Federal Funds rate in effect on that day plus 1.25% or the overnight LIBOR rate in effect on that day plus 1.25%. In addition, an annual commitment fee equal to 0.25% of the unused balance is allocated to each participating fund.
For the year ended October 31, 2019, there were no borrowings by the Fund under the agreement.
8. DISTRIBUTIONS TO SHAREHOLDERS
The tax character of distributions paid was $13,868,383 and $15,901,438 of ordinary for the years ended October 31, 2019 and October 31, 2018, respectively.
As of October 31, 2019, the components of distributable earnings on a tax basis were as follows:
Undistributed ordinary income | Unrealized gains | Capital loss carryforward | ||
| $2,837,212 | $52,899,331 | $(25,426,125) | ||
9. CONCENTRATION RISKS
Concentration risks result from exposure to a limited number of sectors or geographic regions. As of the end of the period, the Fund invests a concentration of its portfolio in the financials sector and in China. A fund that invests a substantial portion of its assets in any sector or geographic region may be more affected by changes in that sector or geographic region than would be a fund whose investments are not heavily weighted in any sector or geographic region.
Wells Fargo Emerging Markets Equity Income Fund | 29
Table of Contents
Notes to financial statements
10. INDEMNIFICATION
Under the Trust’s organizational documents, the officers and Trustees have been granted certain indemnification rights against certain liabilities that may arise out of performance of their duties to the Trust. At a meeting held on November 21-22, 2019, the Board of Trustees of the Fund approved a proposal to authorize the Fund to enter into a separate agreement with each Trustee that would convert indemnification rights currently existing under the Fund’s organizational documents into contractual rights that could not be changed in the future without the consent of the Trustee. Additionally, in the normal course of business, the Trust may enter into contracts with service providers that contain a variety of indemnification clauses. The Trust’s maximum exposure under these arrangements is dependent on future claims that may be made against the Fund and, therefore, cannot be estimated.
11. NEW ACCOUNTING PRONOUNCEMENT
In August 2018, FASB issued Accounting Standards Update (“ASU”)No. 2018-13, Fair Value Measurement (Topic 820)Disclosure Framework—Changes to the Disclosure Requirements for Fair Value Measurement. ASU2018-13 updates the disclosure requirements for fair value measurements by modifying or removing certain disclosures and adding certain new disclosures. The amendments are effective for fiscal years, and interim periods within those fiscal years, beginning after December 15, 2019. Early adoption is permitted. Management has adopted the removal and modification of disclosures early, as permitted, and will adopt the additional new disclosures at the effective date.
30 | Wells Fargo Emerging Markets Equity Income Fund
Table of Contents
Report of independent registered public accounting firm
TO THE SHAREHOLDERS OF THE FUND AND BOARD OF TRUSTEES OF WELLS FARGO FUNDS TRUST:
Opinion on the Financial Statements
We have audited the accompanying statement of assets and liabilities of Wells Fargo Emerging Markets Equity Income Fund (the Fund), one of the funds constituting Wells Fargo Funds Trust, including the portfolio of investments, as of October 31, 2019, the related statement of operations for the year then ended, the statements of changes in net assets for each of the years in the two-year period then ended, and the related notes (collectively, the financial statements) and the financial highlights for each of the years or periods in the five-year period then ended. In our opinion, the financial statements and financial highlights present fairly, in all material respects, the financial position of the Fund as of October 31, 2019, the results of its operations for the year then ended, the changes in its net assets for each of the years in the two-year period then ended, and the financial highlights for each of the years or periods in the five-year period then ended, in conformity with U.S. generally accepted accounting principles.
Basis for Opinion
These financial statements and financial highlights are the responsibility of the Fund’s management. Our responsibility is to express an opinion on these financial statements and financial highlights based on our audits. We are a public accounting firm registered with the Public Company Accounting Oversight Board (United States) (PCAOB) and are required to be independent with respect to the Fund in accordance with the U.S. federal securities laws and the applicable rules and regulations of the Securities and Exchange Commission and the PCAOB.
We conducted our audits in accordance with the standards of the PCAOB. Those standards require that we plan and perform the audit to obtain reasonable assurance about whether the financial statements and financial highlights are free of material misstatement, whether due to error or fraud. Our audits included performing procedures to assess the risks of material misstatement of the financial statements and financial highlights, whether due to error or fraud, and performing procedures that respond to those risks. Such procedures included examining, on a test basis, evidence regarding the amounts and disclosures in the financial statements and financial highlights. Such procedures also included confirmation of securities owned as of October 31, 2019, by correspondence with the custodian, transfer agent and brokers, or by other appropriate auditing procedures. Our audits also included evaluating the accounting principles used and significant estimates made by management, as well as evaluating the overall presentation of the financial statements and financial highlights. We believe that our audits provide a reasonable basis for our opinion.

We have not been able to determine the specific year that we began serving as the auditor of one or more Wells Fargo Funds investment companies; however we are aware that we have served as the auditor of one or more Wells Fargo Funds investment companies since at least 1955.
Boston, Massachusetts
December 20, 2019
Wells Fargo Emerging Markets Equity Income Fund | 31
Table of Contents
TAX INFORMATION
Pursuant to Section 854 of the Internal Revenue Code, $12,675,921 of income dividends paid during the fiscal year ended October 31, 2019 has been designated as qualified dividend income (QDI).
For the fiscal year ended October 31, 2019, $171,527 has been designated as interest-related dividends for nonresident alien shareholders pursuant to Section 871 of the Internal Revenue Code.
Pursuant to Section 853 of the Internal Revenue Code, the Fund expects to designate amounts as foreign taxes paid for the fiscal year ended October 31, 2019. Additional details will be available in the semiannual report.
PROXY VOTING INFORMATION
A description of the policies and procedures used to determine how to vote proxies relating to portfolio securities is available, upon request, by calling1-800-222-8222, visiting our website atwfam.com, or visiting the SEC website at sec.gov. Information regarding how the proxies related to portfolio securities were voted during the most recent12-month period ended June 30 is available on the website atwfam.comor by visiting the SEC website at sec.gov.
QUARTERLY PORTFOLIO HOLDINGS INFORMATION
The Fund files its complete schedule of portfolio holdings with the SEC for the first and third quarters of each fiscal year on Form N-Q or FormN-PORT, which is available by visiting the SEC website at sec.gov. Those forms may be reviewed and copied at the SEC’s Public Reference Room in Washington, DC. Information on the operation of the Public Reference Room may be obtained by calling1-800-SEC-0330.
32 | Wells Fargo Emerging Markets Equity Income Fund
Table of Contents
Other information (unaudited)
BOARD OF TRUSTEES AND OFFICERS
Each of the Trustees and Officers1 listed in the table below acts in identical capacities for each fund in the Wells Fargo family of funds, which consists of 150 mutual funds comprising the Wells Fargo Funds Trust, Wells Fargo Variable Trust, Wells Fargo Master Trust and fourclosed-end funds (collectively the “Fund Complex”). This table should be read in conjunction with the Prospectus and the Statement of Additional Information2. The mailing address of each Trustee and Officer is 525 Market Street, 12th Floor, San Francisco, CA 94105. Each Trustee and Officer serves an indefinite term, however, each Trustee serves such term until reaching the mandatory retirement age established by the Trustees.
Independent Trustees
Name and year of birth | Position held and length of service* | Principal occupations during past five years or longer | Current other public company or investment company directorships | |||
William R. Ebsworth (Born 1957) | Trustee, since 2015 | Retired. From 1984 to 2013, equities analyst, portfolio manager, research director and chief investment officer at Fidelity Management and Research Company in Boston, Tokyo, and Hong Kong, and retired in 2013 as Chief Investment Officer of Fidelity Strategic Advisers, Inc. where he led a team of investment professionals managing client assets. Prior thereto, Board member of Hong Kong Securities Clearing Co., Hong Kong Options Clearing Corp., the Thailand International Fund, Ltd., Fidelity Investments Life Insurance Company, and Empire Fidelity Investments Life Insurance Company. Audit Committee Chair and Investment Committee Chair of the Vincent Memorial Hospital Endowment(non-profit organization). Mr. Ebsworth is a CFA® charterholder. | N/A | |||
Jane A. Freeman (Born 1953) | Trustee, since 2015; Chair Liaison, since 2018 | Retired. From 2012 to 2014 and 1999 to 2008, Chief Financial Officer of Scientific Learning Corporation. From 2008 to 2012, Ms. Freeman provided consulting services related to strategic business projects. Prior to 1999, Portfolio Manager at Rockefeller & Co. and Scudder, Stevens & Clark. Board member of the Harding Loevner Funds from 1996 to 2014, serving as both Lead Independent Director and chair of the Audit Committee. Board member of the Russell Exchange Traded Funds Trust from 2011 to 2012 and the chair of the Audit Committee. Ms. Freeman is a Board Member of The Ruth Bancroft Garden(non-profit organization). She is also an inactive Chartered Financial Analyst. | N/A | |||
Isaiah Harris, Jr. (Born 1952) | Trustee, since 2009; Audit Committee Chairman, since 2019 | Retired. Chairman of the Board of CIGNA Corporation since 2009, and Director since 2005. From 2003 to 2011, Director of Deluxe Corporation. Prior thereto, President and CEO of BellSouth Advertising and Publishing Corp. from 2005 to 2007, President and CEO of BellSouth Enterprises from 2004 to 2005 and President of BellSouth Consumer Services from 2000 to 2003. Emeritus member of the Iowa State University Foundation Board of Governors. Emeritus Member of the Advisory Board of Iowa State University School of Business. Advisory Board Member, Palm Harbor Academy (private school). Advisory Board Member, Child Evangelism Fellowship(non-profit). Mr. Harris is a certified public accountant (inactive status). | CIGNA Corporation | |||
Judith M. Johnson (Born 1949) | Trustee, since 2008; Audit Committee Chairman, from 2009 to 2018 | Retired. Prior thereto, Chief Executive Officer and Chief Investment Officer of Minneapolis Employees Retirement Fund from 1996 to 2008. Ms. Johnson is an attorney, certified public accountant and a certified managerial accountant. | N/A | |||
Wells Fargo Emerging Markets Equity Income Fund | 33
Table of Contents
Other information (unaudited)
Name and year of birth | Position held and length of service* | Principal occupations during past five years or longer | Current other public company or investment company directorships | |||
David F. Larcker (Born 1950) | Trustee, since 2009 | James Irvin Miller Professor of Accounting at the Graduate School of Business, Stanford University, Director of the Corporate Governance Research Initiative and Senior Faculty of The Rock Center for Corporate Governance since 2006. From 2005 to 2008, Professor of Accounting at the Graduate School of Business, Stanford University. Prior thereto, Ernst & Young Professor of Accounting at The Wharton School, University of Pennsylvania from 1985 to 2005. | N/A | |||
Olivia S. Mitchell (Born 1953) | Trustee, since 2006; Nominating and Governance Committee Chair, since 2018 | International Foundation of Employee Benefit Plans Professor, Wharton School of the University of Pennsylvania since 1993. Director of Wharton’s Pension Research Council and Boettner Center on Pensions & Retirement Research, and Research Associate at the National Bureau of Economic Research. Previously, Cornell University Professor from 1978 to 1993. | N/A | |||
Timothy J. Penny (Born 1951) | Trustee, since 1996; Chairman, since 2018 | President and Chief Executive Officer of Southern Minnesota Initiative Foundation, anon-profit organization, since 2007. Member of the Board of Trustees of NorthStar Education Finance, Inc., anon-profit organization, since 2007. | N/A | |||
James G. Polisson (Born 1959) | Trustee, since 2018 | Retired. Chief Marketing Officer, Source (ETF) UK Services, Ltd, from 2015 to 2017. From 2012 to 2015, Principal of The Polisson Group, LLC, a management consulting, corporate advisory and principal investing company. Chief Executive Officer and Managing Director at Russell Investments, Global Exchange Traded Funds from 2010 to 2012. Managing Director of Barclays Global Investors from 1998 to 2010 and Global Chief Marketing Officer for iShares and Barclays Global Investors from 2000 to 2010. Trustee of the San Francisco Mechanics’ Institute, anon-profit organization, from 2013 to 2015. Board member of the Russell Exchange Traded Fund Trust from 2011 to 2012. Director of Barclays Global Investors Holdings Deutschland GmbH from 2006 to 2009. Mr. Polisson is an attorney and has a retired status with the Massachusetts and District of Columbia Bar Associations. | N/A | |||
| Pamela Wheelock3 (Born 1959) | Trustee, since January 2020; previously Trustee from January 2018 to July 2019 | Board member of the Destination Medical Center Economic Development Agency, Rochester, Minnesota since 2019. Acting Commissioner, Minnesota Department of Human Services, July 2019 through September 2019. Human Services Manager (part-time), Minnesota Department of Human Services, October 2019 through December 2019. Chief Operating Officer, Twin Cities Habitat for Humanity from 2017 to 2019. Vice President of University Services, University of Minnesota from 2012 to 2016. Prior thereto, on the Board of Directors, Governance Committee and Finance Committee for the Minnesota Philanthropy Partners (Saint Paul Foundation) from 2012 to 2018, Interim Chief Executive Officer of Blue Cross Blue Shield of Minnesota from 2011 to 2012, Chairman of the Board from 2009 to 2012 and Board Director from 2003 to 2015. Vice President, Leadership and Community Engagement, Bush Foundation, Saint Paul, Minnesota (a private foundation) from 2009 to 2011. Executive Vice President and Chief Financial Officer, Minnesota Sports and Entertainment from 2004 to 2009 and Senior Vice President from 2002 to 2004. Executive Vice President of the Minnesota Wild Foundation from 2004 to 2008. Commissioner of Finance, State of Minnesota, from 1999 to 2002. Currently Board Chair of the Minnesota Wild Foundation since 2010. | N/A | |||
| * | Length of service dates reflect the Trustee’s commencement of service with the Trust’s predecessor entities, where applicable. |
34 | Wells Fargo Emerging Markets Equity Income Fund
Table of Contents
Other information (unaudited)
Officers
Name and year of birth | Position held and length of service | Principal occupations during past five years or longer | ||
| Andrew Owen (Born 1960) | President, since 2017 | Executive Vice President of Wells Fargo & Company and Head of Affiliated Managers, Wells Fargo Asset Management, since 2014. In addition, Mr. Owen is currently President, Chief Executive Officer and Director of Wells Fargo Funds Management, LLC since 2017. Prior thereto, Executive Vice President responsible for marketing, investments and product development for Wells Fargo Funds Management, LLC, from 2009 to 2014. | ||
| Jeremy DePalma1 (Born 1974) | Treasurer, since 2012 | Senior Vice President of Wells Fargo Funds Management, LLC since 2009. Senior Vice President of Evergreen Investment Management Company, LLC from 2008 to 2010 and head of the Fund Reporting and Control Team within Fund Administration from 2005 to 2010. | ||
| Michelle Rhee4 (Born 1966) | Chief Legal Officer, since 2019 | Secretary of Wells Fargo Funds Management, LLC, Chief Legal Counsel of Wells Fargo Asset Management and Assistant General Counsel of Wells Fargo Bank, N.A. since 2018. Associate General Counsel and Managing Director of Bank of America Corporation from 2004 to 2018. | ||
| Catherine Kennedy5 (Born 1969) | Secretary, since 2019 | Vice President of Wells Fargo Funds Management, LLC and Senior Counsel of the Wells Fargo Legal Department since 2010. Vice President and Senior Counsel of Evergreen Investment Management Company, LLC from 1998 to 2010. | ||
| Michael H. Whitaker(Born 1967) | Chief Compliance Officer, since 2016 | Chief Compliance Officer of Wells Fargo Asset Management since 2016. Senior Vice President and Chief Compliance Officer for Fidelity Investments from 2007 to 2016. | ||
| David Berardi (Born 1975) | Assistant Treasurer, since 2009 | Vice President of Wells Fargo Funds Management, LLC since 2009. Vice President of Evergreen Investment Management Company, LLC from 2008 to 2010. Manager of Fund Reporting and Control for Evergreen Investment Management Company, LLC from 2004 to 2010. | ||
| 1 | Jeremy DePalma acts as Treasurer of 86 funds and Assistant Treasurer of 64 funds in the Fund Complex. |
| 2 | The Statement of Additional Information includes additional information about the Trustees and is available, without charge, upon request, by calling1-800-222-8222 or by visiting the website atwfam.com. |
| 3 | Ms. Wheelock was re-appointed to the Board effective January 1, 2020. |
| 4 | Michelle Rhee became Chief Legal Officer effective October 22, 2019. |
| 5 | Catherine Kennedy became Secretary effective October 22, 2019. |
Wells Fargo Emerging Markets Equity Income Fund | 35
Table of Contents
Other information (unaudited)
BOARD CONSIDERATION OF INVESTMENT MANAGEMENT ANDSUB-ADVISORY AGREEMENTS:
Wells Fargo Emerging Markets Equity Income Fund
Under the Investment Company Act of 1940 (the “1940 Act”), the Board of Trustees (the “Board”) of Wells Fargo Funds Trust (the “Trust”) must determine annually whether to approve the continuation of the Trust’s investment management andsub-advisory agreements. In this regard, at anin-person meeting held on May21-22, 2019 (the “Meeting”), the Board, all the members of which have no direct or indirect interest in the investment management andsub-advisory agreements and are not “interested persons” of the Trust, as defined in the 1940 Act (the “Independent Trustees”), reviewed and approved for Wells Fargo Emerging Markets Equity Income Fund(the “Fund”): (i) an investment management agreement (the “Management Agreement”) with Wells Fargo Funds Management, LLC (“Funds Management”); and (ii) an investmentsub-advisory agreement (the“Sub-Advisory Agreement”) with Wells Capital Management Incorporated (the“Sub-Adviser”), an affiliate of Funds Management. The Management Agreement and theSub-Advisory Agreement are collectively referred to as the “Advisory Agreements.”
At the Meeting, the Board considered the factors and reached the conclusions described below relating to the selection of Funds Management and theSub-Adviser and the approval of the Advisory Agreements. Prior to the Meeting, including at anin-person meeting in April 2019, the Trustees conferred extensively among themselves and with representatives of Funds Management about these matters. Also, the Board has adopted a team-based approach, with each team consisting of asub-set of Trustees, to assist the full Board in the discharge of its duties in reviewing investment performance and other matters throughout the year. The Independent Trustees were assisted in their evaluation of the Advisory Agreements by independent legal counsel, from whom they received separate legal advice and with whom they met separately.
In providing information to the Board, Funds Management and theSub-Adviser were guided by a detailed set of requests for information submitted to them by independent legal counsel on behalf of the Independent Trustees at the start of the Board’s annual contract renewal process earlier in 2019. In considering and approving the Advisory Agreements, the Trustees considered the information they believed relevant, including but not limited to the information discussed below. The Board considered not only the specific information presented in connection with the Meeting, but also the knowledge gained over time through interaction with Funds Management and theSub-Adviser about various topics. In this regard, the Board reviewed reports of Funds Management at each of its quarterly meetings, which included, among other things, portfolio reviews and investment performance reports. In addition, the Board and the teams mentioned above confer with portfolio managers at various times throughout the year. The Board did not identify any particular information or consideration that wasall-important or controlling, and each individual Trustee may have attributed different weights to various factors.
After its deliberations, the Board unanimously approved the continuation of the Advisory Agreements for aone-year term and determined that the compensation payable to Funds Management and theSub-Adviser under each of the Advisory Agreements was reasonable. The Board considered the approval of the Advisory Agreements for the Fund as part of its consideration of agreements for funds across the complex, but its approvals were made on afund-by-fund basis. The following summarizes a number of important, but not necessarily all, factors considered by the Board in support of its approvals.
Nature, extent and quality of services
The Board received and considered various information regarding the nature, extent and quality of services provided to the Fund by Funds Management and theSub-Adviser under the Advisory Agreements. This information included a description of the investment advisory services and Fund-level administrative services covered by the Management Agreement, as well as, among other things, a summary of the background and experience of senior management of Wells Fargo Asset Management (“WFAM”), of which Funds Management and theSub-Adviser are a part, a summary of investments made in the business of WFAM, a summary of certain organizational and personnel changes involving Funds Management and theSub-Adviser, and a description of Funds Management’s and theSub-Adviser’s business continuity planning programs and of their approaches to data privacy and cybersecurity. The Board received and reviewed information about Funds Management’s role as administrator of the Fund’s liquidity risk management program. The Board also considered the qualifications, background, tenure and responsibilities of each of the portfolio managers primarily responsible for theday-to-day portfolio management of the Fund.
The Board evaluated the ability of Funds Management and theSub-Adviser to attract and retain qualified investment professionals, including research, advisory and supervisory personnel. The Board further considered the compliance programs and compliance records of Funds Management and theSub-Adviser. In addition, the Board took into account the full range of services provided to the Fund by Funds Management and its affiliates.
36 | Wells Fargo Emerging Markets Equity Income Fund
Table of Contents
Other information (unaudited)
Fund investment performance and expenses
The Board considered the investment performance results for the Fund over various time periods ended December 31, 2018. The Board considered these results in comparison to the investment performance of funds in a universe that was determined by Broadridge Inc. (“Broadridge”) to be similar to the Fund (the “Universe”), and in comparison to the Fund’s benchmark index and to other comparative data. Broadridge is an independent provider of investment company data. The Board received a description of the methodology used by Broadridge to select the mutual funds in the performance Universe. The Board noted that the investment performance of the Fund (Administrator Class) was higher than the average investment performance of the Universe for theone- and five-year periods under review, but lower than the average investment performance of the Universe for the three-year period under review. The Board also noted that the investment performance of the Fund was in range of or higher than its benchmark index, the MSCI Emerging Markets Index (Net), for theone- and five-year periods under review, but lower than its benchmark for the three-year period under review.
The Board received information concerning, and discussed factors contributing to, the underperformance of the Fund relative to the Universe and benchmark for the period identified above. The Board took note of the explanations for the relative underperformance during such period, including with respect to investment decisions and market factors that affected the Fund’s investment performance.
The Board also received and considered information regarding the Fund’s net operating expense ratios and their various components, including actual management fees, custodian and othernon-management fees, and Rule12b-1 andnon-Rule12b-1 shareholder service fees. The Board considered these ratios in comparison to the median ratios of funds in class-specific expense groups that were determined by Broadridge to be similar to the Fund (the “Groups”). The Board received a description of the methodology used by Broadridge to select the mutual funds in the expense Groups and an explanation of how funds comprising expense groups and their expense ratios may vary fromyear-to-year. Based on the Broadridge reports, the Board noted that the net operating expense ratios of the Fund were lower than, equal to, or in range of, the median net operating expense ratios of the expense Groups for each share class.
The Board took into account the Fund’s investment performance and expense information provided to it among the factors considered in deciding tore-approve the Advisory Agreements.
Investment management andsub-advisory fee rates
The Board reviewed and considered the contractual fee rates payable by the Fund to Funds Management under the Management Agreement, as well as the contractual fee rates payable by the Fund to Funds Management for class-level administrative services under a Class-Level Administration Agreement, which include, among other things, class-level transfer agency andsub-transfer agency costs (collectively, the “Management Rates”). The Board also reviewed and considered the contractual investmentsub-advisory fee rates that are payable by Funds Management to theSub-Adviser for investmentsub-advisory services.
Among other information reviewed by the Board was a comparison of the Fund’s Management Rates with the average contractual investment management fee rates of funds in the expense Groups at a common asset level as well as transfer agency costs of the funds in the expense Groups. The Board noted that the Management Rates of the Fund were lower than, equal to, or in range of, the sum of these average rates for the Fund’s expense Groups for all share classes, except for the Administrator Class, which had a Management Rate that was higher than the sum of the average rates for its expense Group.
The Board also received and considered information about the portion of the total management fee that was retained by Funds Management after payment of the fee to theSub-Adviser forsub-advisory services. In assessing the reasonableness of this amount, the Board received and evaluated information about the nature and extent of responsibilities retained and risks assumed by Funds Management and not delegated to or assumed by theSub-Adviser, and about Funds Management’son-going oversight services. Given the affiliation between Funds Management and theSub-Adviser, the Board ascribed limited relevance to the allocation of fees between them.
The Board also received and considered information about the nature and extent of services offered and fee rates charged by Funds Management and theSub-Adviser to other types of clients with investment strategies similar to those of the Fund. In this regard, the Board received information about the significantly greater scope of services, and compliance, reporting and other legal burdens and risks of managing proprietary mutual funds compared with those associated with managing assets of other types of clients, including third-partysub-advised fund clients andnon-mutual fund clients such as institutional separate accounts.
Based on its consideration of the factors and information it deemed relevant, including those described here, the Board determined that the compensation payable to Funds Management under the Management Agreement and to theSub-Adviser under theSub-Advisory Agreement was reasonable.
Wells Fargo Emerging Markets Equity Income Fund | 37
Table of Contents
Other information (unaudited)
Profitability
The Board received and considered information concerning the profitability of Funds Management, as well as the profitability of both WFAM and Wells Fargo & Co. (“Wells Fargo”) from providing services to the fund family as a whole. The Board noted that theSub-Adviser’s profitability information with respect to providing services to the Fund and other funds in the family was subsumed in the WFAM and Wells Fargo profitability analysis.
Funds Management reported on the methodologies and estimates used in calculating profitability, including a description of the methodology used to allocate certain expenses. Among other things, the Board noted that the levels of profitability reported on afund-by-fund basis varied widely, depending on factors such as the size, type and age of fund. Based on its review, the Board did not deem the profits reported by Funds Management, WFAM or Wells Fargo from services provided to the Fund to be at a level that would prevent it from approving the continuation of the Advisory Agreements.
Economies of scale
The Board received and considered information about the potential for Funds Management to experience economies of scale in the provision of management services to the Fund, the difficulties of calculating economies of scale at an individual fund level, and the extent to which potential scale benefits are shared with shareholders. The Board noted the existence of breakpoints in the Fund’s management fee structure, which operate generally to reduce the Fund’s expense ratios as the Fund grows in size. The Board considered that in addition to management fee breakpoints, Funds Management shares potential economies of scale from its management business in a variety of ways, including through fee waiver and expense reimbursement arrangements, services that benefit shareholders, competitive management fee rates set at the outset without regard to breakpoints, and investments in the business intended to enhance services available to shareholders.
The Board concluded that Funds Management’s arrangements with respect to the Fund, including contractual breakpoints, constituted a reasonable approach to sharing potential economies of scale with the Fund and its shareholders.
Other benefits to Funds Management and theSub-Adviser
The Board received and considered information regarding potential“fall-out” or ancillary benefits received by Funds Management and its affiliates, including theSub-Adviser, as a result of their relationships with the Fund. Ancillary benefits could include, among others, benefits directly attributable to other relationships with the Fund and benefits potentially derived from an increase in Funds Management’s and theSub-Adviser’s business as a result of their relationships with the Fund. The Board noted that various affiliates of Funds Management may receive distribution-related fees, shareholder servicing payments andsub-transfer agency fees in respect of shares sold or held through them and services provided.
The Board also reviewed information about soft dollar credits earned and utilized by theSub-Adviser, fees earned by Funds Management and theSub-Adviser from managing a private investment vehicle for the fund family’s securities lending collateral, and commissions earned by an affiliated broker from portfolio transactions.
Based on its consideration of the factors and information it deemed relevant, including those described here, the Board did not find that any ancillary benefits received by Funds Management and its affiliates, including theSub-Adviser, were unreasonable.
Conclusion
At the Meeting, after considering the above-described factors and based on its deliberations and its evaluation of the information described above, the Board unanimously approved the continuation of the Advisory Agreements for aone-year term and determined that the compensation payable to Funds Management and theSub-Adviser under each of the Advisory Agreements was reasonable.
38 | Wells Fargo Emerging Markets Equity Income Fund
Table of Contents
This page is intentionally left blank.
Table of Contents
This page is intentionally left blank.
Table of Contents
For more information
More information about Wells Fargo Funds is available free upon request. To obtain literature, please write, visit the Fund’s website, or call:
Wells Fargo Funds
P.O. Box 219967
Kansas City, MO 64121-9967
Website:wfam.com
Individual investors:1-800-222-8222
Retail investment professionals:1-888-877-9275
Institutional investment professionals:1-866-765-0778

This report and the financial statements contained herein are submitted for the general information of the shareholders of the Fund. If this report is used for promotional purposes, distribution of the report must be accompanied or preceded by a current prospectus. Before investing, please consider the investment objectives, risks, charges, and expenses of the investment. For a current prospectus and, if available, a summary prospectus, containing this information, call1-800-222-8222 or visit the Fund’s website atwfam.com. Read the prospectus carefully before you invest or send money.
Wells Fargo Asset Management (WFAM) is the trade name for certain investment advisory/management firms owned by Wells Fargo & Company. These firms include but are not limited to Wells Capital Management Incorporated and Wells Fargo Funds Management, LLC. Certain products managed by WFAM entities are distributed by Wells Fargo Funds Distributor, LLC (a broker-dealer and Member FINRA).
This material is for general informational and educational purposes only and is NOT intended to provide investment advice or a recommendation of any kind—including a recommendation for any specific investment, strategy, or plan.
INVESTMENT PRODUCTS: NOT FDIC INSURED ◾ NO BANK GUARANTEE ◾ MAY LOSE VALUE
© 2019 Wells Fargo & Company. All rights reserved.
408246 12-19
A262/AR262 10-19
Table of Contents

Annual Report
October 31, 2019
Wells Fargo
Special International Small Cap Fund
Beginning on January 1, 2021, as permitted by new regulations adopted by the Securities and Exchange Commission, paper copies of the Wells Fargo Funds’ annual and semi-annual shareholder reports issued after this date will no longer be sent by mail, unless you specifically request paper copies of the reports. Instead, the reports will be made available on the Funds’ website, and you will be notified by mail each time a report is posted and provided with a website address to access the report.
If you already elected to receive shareholder reports electronically, you will not be affected by this change and you need not take any action. You may elect to receive shareholder reports and other communications from the Fund electronically at any time by contacting your financial intermediary (such as a broker-dealer or bank) or, if you are a direct investor, by calling1-800-222-8222 or by enrolling at wellsfargo.com/advantagedelivery.
You may elect to receive all future reports in paper free of charge. If you invest through a financial intermediary, you can contact your financial intermediary to request that you continue to receive paper copies of your shareholder reports; if you invest directly with the Fund, you can call 1-800-222-8222. Your election to receive reports in paper will apply to all Wells Fargo Funds held in your account with your financial intermediary or, if you are a direct investor, to all Wells Fargo Funds that you hold.
Table of Contents
|
Reduce clutter. Save trees. |
Sign up for electronic delivery of prospectuses and shareholder reports atwellsfargo.com/advantagedelivery |
The views expressed and any forward-looking statements are as of October 31, 2019, unless otherwise noted, and are those of the Fund managers and/or Wells Fargo Asset Management. Discussions of individual securities, or the markets generally, or any Wells Fargo Fund are not intended as individual recommendations. Future events or results may vary significantly from those expressed in any forward-looking statements. The views expressed are subject to change at any time in response to changing circumstances in the market. Wells Fargo Asset Management and the Fund disclaim any obligation to publicly update or revise any views expressed or forward-looking statements.
INVESTMENT PRODUCTS: NOT FDIC INSURED ◾ NO BANK GUARANTEE ◾ MAY LOSE VALUE
Wells Fargo Special International Small Cap Fund | 1
Table of Contents
Letter to shareholders (unaudited)

Andrew Owen
President
Wells Fargo Funds
“U.S. threatened to impose higher tariffs on China’s exports after talks failed.”
Dear Shareholder:
We are pleased to offer you this first annual shareholder report for the Wells Fargo Special International Small Cap Fund from the Fund’s inception on May 31, 2019 through October 31, 2019. U.S. investors generally saw markets recover during the second half of 2019 amid intensifying market volatility, global economic growth concerns, international trade stare downs, and simmering geopolitical tensions.
Overall, fixed income kept pace with domestic stocks and outperformed foreign equities. For the five-month period from the Fund’s inception, U.S. stocks, based on the S&P 500 Index,1 gained 11.22% and international stocks, as measured by the MSCI ACWI ex USA Index (Net),2 added 7.75%. The MSCI EM Index (Net)3 fell by 6.02%. Among fixed income investors, the Bloomberg Barclays U.S. Aggregate Bond Index4 added 3.87%, the Bloomberg Barclays Global Aggregate ex-USD Index5 gained 3.37%, the Bloomberg Barclays Municipal Bond Index6 increased 2.13%, and the ICE BofAML U.S. High Yield Index7 added 3.95%.
Market volatility was sparked by trade uncertainties.
During the third quarter of 2019, investors regrouped. Just as the investment horizon appeared to darken, sentiment turned and U.S. equity markets gained during June and July. The gains, primarily driven by geopolitical and monetary policy events, pushed equity markets to new highs. European Central Bank President Mario Draghi said that if the outlook doesn’t improve, the bank would cut rates or buy more assets to prop up inflation. President Trump backed off of tariff threats against Mexico and China. In the U.S., the Fed implemented a 0.25% federal funds rate cut in July.
In microcosm, August 2019 encapsulated many of the unnerving events that plagued investors for months. The U.S.-China trade relationship swung from antagonistic to hopeful and back again with no signs of compromise. Evidence of a continued global economic slowdown mounted. Central banks in China, New Zealand, and Thailand cut interest rates. Industrial and manufacturing data declined in China, Canada, Japan, and Germany. Adding to the uncertain environment, Italy’s prime minister resigned, many feared a crackdown in Hong Kong as protestors sustained their calls for reform, and Boris Johnson planned to suspend Parliament as Brexit’s deadline neared.
In the U.S., September 2019 saw the Federal Reserve (Fed) join other central banks in cutting interest rates. U.S. manufacturing data, as reported by the Institute for Supply Management, disappointed investors. The U.S. House of Representatives announced it
| 1 | The S&P 500 Index consists of 500 stocks chosen for market size, liquidity, and industry group representation. It is a market-value-weighted index with each stock’s weight in the index proportionate to its market value. You cannot invest directly in an index. |
| 2 | The Morgan Stanley Capital International (MSCI) All Country World Index (ACWI) ex USA Index (Net) is a free-float-adjusted market-capitalization weighted index that is designed to measure the equity market performance of developed and emerging markets, excluding the United States. Source: MSCI. MSCI makes no express or implied warranties or representations and shall have no liability whatsoever with respect to any MSCI data contained herein. The MSCI data may not be further redistributed or used as a basis for other indices or any securities or financial products. This report is not approved, reviewed, or produced by MSCI. You cannot invest directly in an index. |
| 3 | The MSCI Emerging Markets (EM) Index (Net) is a free-float-adjusted market-capitalization-weighted index that is designed to measure the equity market performance of emerging markets. You cannot invest directly in an index. |
| 4 | The Bloomberg Barclays U.S. Aggregate Bond Index is a broad-based benchmark that measures the investment-grade, U.S. dollar-denominated, fixed-rate taxable bond market, including Treasuries, government-related and corporate securities, mortgage-backed securities (agency fixed-rate and hybrid adjustable-rate mortgage pass-throughs), asset-backed securities, and commercial mortgage-backed securities. You cannot invest directly in an index. |
| 5 | The Bloomberg Barclays Global Aggregate ex-USD Index is an unmanaged index that provides a broad-based measure of the global investment-grade fixed-income markets excluding the U.S. dollar-denominated debt market. You cannot invest directly in an index. |
| 6 | The Bloomberg Barclays Municipal Bond Index is an unmanaged index composed of long-term tax-exempt bonds with a minimum credit rating of Baa. You cannot invest directly in an index. |
| 7 | The ICE BofAML U.S. High Yield Index is a market-capitalization-weighted index of domestic and Yankee high-yield bonds. The index tracks the performance of high-yield securities traded in the U.S. bond market. You cannot invest directly in an index. Copyright 2019. ICE Data Indices, LLC. All rights reserved. |
2 | Wells Fargo Special International Small Cap Fund
Table of Contents
Letter to shareholders (unaudited)
would pursue an impeachment investigation of President Trump. Meanwhile, the Brexit impasse showed no signs of resolution. Officials in China said that hitting the country’s economic growth goals for the year would be difficult considering the weight of tariffs and trade restrictions. So while the S&P 500 Index finished the third quarter with the best year-to-date returns in more than 20 years, amid signs of equity investors taking money out of the stock market, concerns about future returns remained.
In October 2019, a relaxing of U.S.-China trade tensions and renewed optimism for a U.K. Brexit deal combined with positive macroeconomic data to support financial markets overall. The initial estimate of U.S. third-quarter gross domestic product growth, announced in late October, was a resilient 1.9% annualized rate while the U.S. unemployment rate fell to a 50-year low of 3.5% in September. However, despite resilience among U.S. consumers, business confidence declined while manufacturing activity contracted. Concerned with a potential economic slowdown, the Fed lowered interest rates another quarter point in late October, its third rate cut in four months. This helped push the S&P 500 Index to a new all-time high while emerging market equities rallied and global bonds declined overall, reflecting a broad pickup in risk appetite.
Don’t let short-term uncertainty derail long-term investment goals.
Periods of investment uncertainty can present challenges, but experience has taught us that maintaining long-term investment goals can be an effective way to plan for the future. To help you create a sound strategy based on your personal goals and risk tolerance, Wells Fargo Funds offers more than 100 mutual funds spanning a wide range of asset classes and investment styles. Although diversification cannot guarantee an investment profit or prevent losses, we believe it can be an effective way to manage investment risk and potentially smooth out overall portfolio performance. We encourage investors to know their investments and to understand that appropriate levels of risk-taking may unlock opportunities.
Thank you for choosing to invest with Wells Fargo Funds. We appreciate your confidence in us and remain committed to helping you meet your financial needs.
Sincerely,

Andrew Owen
President
Wells Fargo Funds
“The Fed lowered interest rates another quarter point in late October, its third rate cut in four months.”
|
For further information about your Fund, contact your investment professional, visit our website atwellsfargofunds.com, or call us directly at1-800-222-8222. |
Wells Fargo Special International Small Cap Fund | 3
Table of Contents
Performance highlights (unaudited)
Investment objective
The Fund seeks long-term capital appreciation.
Manager
Wells Fargo Funds Management, LLC
Subadviser
Wells Capital Management Incorporated
Portfolio managers
Oleg Makhorine
James Tringas, CFA®‡
Bryant VanCronkhite, CFA®‡, CPA
Average annual total returns (%) as of October 31, 2019
| Since inception | Expense ratios1 (%) | |||||||||||||
| Inception date | Gross | Net2 | ||||||||||||
| Class R6 (WICRX) | 5-31-2019 | 5.80 | 1.24 | 0.95 | ||||||||||
| Institutional Class (WICIX) | 5-31-2019 | 5.70 | 1.34 | 1.05 | ||||||||||
| MSCI World ex USA Small Cap (Net)3 | – | 8.54 | * | – | – | |||||||||
| * | Return is based on Fund’s inception date. |
Figures quoted represent past performance, which is no guarantee of future results, and do not reflect taxes that a shareholder may pay on fund distributions or the redemption of fund shares. Investment return and principal value of an investment will fluctuate so that an investor’s shares, when redeemed, may be worth more or less than their original cost. Current performance may be lower or higher than the performance data quoted, which assumes the reinvestment of dividends and capital gains. Current month-end performance is available on the Fund’s website,wfam.com.
Index returns do not include transaction costs associated with buying and selling securities, any mutual fund fees or expenses, or any taxes. It is not possible to invest directly in an index.
Class R6 and Institutional Class shares are sold without a front-end sales charge or contingent deferred sales charge.
Stock values fluctuate in response to the activities of individual companies and general market and economic conditions. Foreign investments are especially volatile and can rise or fall dramatically due to differences in the political and economic conditions of the host country. These risks are generally intensified in emerging markets. The use of derivatives may reduce returns and/or increase volatility. Certain investment strategies tend to increase the total risk of an investment (relative to the broader market). The Fund is exposed to geographic risk and smaller-company securities risk. Consult the Fund’s prospectus for additional information on these and other risks.
Please see footnotes on page 5.
4 | Wells Fargo Special International Small Cap Fund
Table of Contents
Performance highlights (unaudited)
| Growth of $1,000,000 investment as of October 31, 20194 |
|
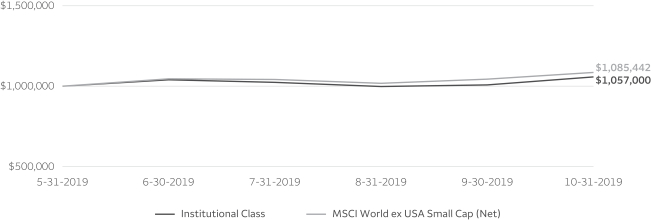
| ‡ | CFA® and Chartered Financial Analyst® are trademarks owned by CFA Institute. |
| 1 | Reflects the expense ratios as stated in the most recent prospectuses. The expense ratios shown are subject to change and may differ from the annualized expense ratios shown in the financial highlights of this report. |
| 2 | The manager has contractually committed through June 30, 2020, to waive fees and/or reimburse expenses to the extent necessary to cap the expenses of each class after fee waivers at the amounts shown. Brokerage commissions, stamp duty fees, interest, taxes, acquired fund fees and expenses (if any), and extraordinary expenses are excluded from the expense cap. Prior to or after the commitment expiration date, the cap may be increased or the commitment to maintain the cap may be terminated only with the approval of the Board of Trustees. Without this cap, the Fund’s returns would have been lower. The expense ratio paid by an investor is the net expense ratio (the total annual fund operating expenses after fee waivers) as stated in the prospectuses. |
| 3 | The Morgan Stanley Capital International (MSCI) World ex USA Small Cap Index (Net) is a free-float-adjusted market-capitalization-weighted index that is designed to measure the equity market performance of developed markets excluding the United States. You cannot invest directly in an index. |
| 4 | The chart compares the performance of the Institutional Class shares since inception with the MSCI World ex USA SmallCap Index (Net). The chart assumes a hypothetical investment of $1,000,000 in Institutional Class shares and reflects all operating expenses. |
| 5 | The ten largest holdings, excluding cash, cash equivalents and any money market funds, are calculated based on the value of the investments divided by total net assets of the Fund. Holdings are subject to change and may have changed since the date specified. |
| 6 | Amounts are calculated based on the total long-term investments of the Fund. These amounts are subject to change and may have changed since the date specified. |
Wells Fargo Special International Small Cap Fund | 5
Table of Contents
Performance highlights (unaudited)
MANAGER’S DISCUSSION
Fund highlights
| ∎ | The Fund underperformed its benchmark, the MSCI World ex USA Small Cap Index (Net), from the Fund’s inception to October 31, 2019. |
| ∎ | Stock selection in the industrials and materials sectors detracted from relative performance. |
| ∎ | Stock selection in the consumer discretionary and consumer staples sectors contributed to relative performance. |
| ∎ | Geographically, security selection in Asia ex-Japan and the U.K. were positive contributors while security selection in Europe and Canada detracted. |
Investors focused on rising global trade tensions, central bank policy decisions, Brexit negotiations, and a slowing global economy.
International equity markets and the MSCI World ex USA Small Cap Index (Net) saw a generally favorable backdrop over the five-month period and posted a 8.54% return. During the period, rising trade tensions, slowing economic data, and central bank policy decisions drove headlines. However, equity markets rallied as central banks across the globe became more accommodating and investors saw evidence of a potential soft landing to an economic slowdown. Japan was the best-performing region, and despite the ongoing Brexit negotiations in Europe and the U.K., equity markets performed largely in line with the index. Information technology and real estate were the strongest sectors within the index, while energy was the worst-performing sector.
During the period, the team made modest changes to sector and regional exposures within the Fund based on our bottom-up reward/risk valuation process. As bottom-up investors, we evaluate how global macroeconomic events might affect the Fund’s holdings but we do not try to forecast the outcomes. The Fund’s security selection within Canada and Europe were the largest detractors, while stock selection in Asia ex-Japan and the U.K. were the largest contributors to relative returns. We aim to use market volatility opportunistically. We will seek to use any future volatility to the advantage of our bottom-up stock-selection process.
| Ten largest holdings (%) as of October 31, 20195 | ||||
ORIX JREIT Incorporated | 3.38 | |||
Ansell Limited | 3.27 | |||
Meitec Corporation | 3.08 | |||
Alten SA | 3.07 | |||
Domino’s Pizza Enterprises Limited | 2.93 | |||
Aeon Delight Company Limited | 2.91 | |||
Britvic plc | 2.90 | |||
M6 Métropole Télévision SA | 2.88 | |||
Viscofan SA | 2.68 | |||
Nihon Parkerizing Company Limited | 2.58 | |||
| Sector distribution as of October 31, 20196 |
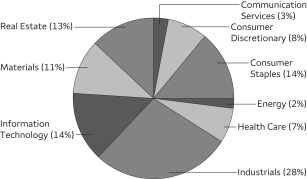 |
| Country allocation as of October 31, 20196 |
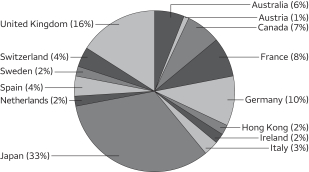 |
Stock selection in the industrials and materials sectors detracted from relative performance.
Industrials holding Brunel International N.V. detracted from relative performance as the Netherlands-based management consulting firm reported results that were below expectations. A major fixed-price contract caused the company to have large cost overruns. Brunel has indicated it will focus more on price-per-hour contracts going forward. We have been attracted to the business’s low capital intensity and strong balance sheet but have reduced our exposure to reflect ongoing contract risks.
Please see footnotes on page 5.
6 | Wells Fargo Special International Small Cap Fund
Table of Contents
Performance highlights (unaudited)
In the materials sector, Fuji Seal, a Tokyo-based manufacturer and distributor of shrink labeling products and machines globally detracted from relative performance. The stock underperformed primarily due to rising input costs. However, our long-term thesis remains intact, and we believe the company will continue to use its strong balance sheet to find accretive opportunities to deploy capital and return cash to shareholders.
Stock selection in the consumer discretionary and consumer staples sectors contributed to relative performance.
In the consumer discretionary sector, Australia-based Domino’s Pizza Enterprises is one of the largest franchisees of the Domino’s brand in Australia, New Zealand, Japan, and several European countries. The stock’s strong performance was spurred by strong results in Japan. The company generates strong free cash flows and has a tremendous amount of balance sheet flexibility and an attractive reward/risk ratio.
Security selection in the consumer staples sector contributed to relative performance. Britvic plc is a U.K.-based soft drink distributor as well as a manufacturer of proprietary beverages. We have been attracted to the company’s low capital intensity, net cash balance sheet, strong brands, and high free cash flow generation. The company posted strong financial results during the period and should see an inflection in free cash flow as investments made to increase distribution efficiencies take hold.
Our investment philosophy focuses on company-specific factors rather than on headline-dominating macroeconomic events.
As we look toward the end of 2019 and beyond, we see numerous market forces at play that could bring further volatility. Market participants continue to watch the pace of global economic growth, central bank policy, and trade conflicts. We are not experts in forecasting macro or political events. However, we believe it is always prudent to protect downside risks and be opportunistic when short-term macro or political events create valuation dislocations from a company’s long-term fundamentals.
We believe our fundamental analysis, risk management, and active investment process are well suited to take advantage of new opportunities as the equity market evolves. While volatility may increase, we believe the strong balance sheets and stable cash flows of the companies in our portfolio should support consistent long-term performance.
Please see footnotes on page 5.
Wells Fargo Special International Small Cap Fund | 7
Table of Contents
As a shareholder of the Fund, you incur ongoing costs, including management fees and other Fund expenses. This example is intended to help you understand your ongoing costs (in dollars) of investing in the Fund and to compare these costs with the ongoing costs of investing in other mutual funds.
The example is based on an investment of $1,000 invested at the beginning of the six-month period and held for the entire period from May 1, 2019 to October 31, 2019.
Actual expenses
The “Actual” line of the table below provides information about actual account values and actual expenses. You may use the information in this line, together with the amount you invested, to estimate the expenses that you paid over the period. Simply divide your account value by $1,000 (for example, an $8,600 account value divided by $1,000 = 8.6), then multiply the result by the number in the “Actual” line under the heading entitled “Expenses paid during period” for your applicable class of shares to estimate the expenses you paid on your account during this period.
Hypothetical example for comparison purposes
The “Hypothetical” line of the table below provides information about hypothetical account values and hypothetical expenses based on the Fund’s actual expense ratio and an assumed rate of return of 5% per year before expenses, which is not the Fund’s actual return. The hypothetical account values and expenses may not be used to estimate the actual ending account balance or expenses you paid for the period. You may use this information to compare the ongoing costs of investing in the Fund and other funds. To do so, compare this 5% hypothetical example with the 5% hypothetical examples that appear in the shareholder reports of the other funds.
Please note that the expenses shown in the table are meant to highlight your ongoing costs. Therefore, the “Hypothetical” line of the table is useful in comparing ongoing costs only and will not help you determine the relative total costs of owning different funds.
| Beginning account value 5-1-2019 | Ending account value 10-31-2019 | Expenses paid during the period¹ | Annualized net expense ratio | |||||||||||||
Class R6 | ||||||||||||||||
Actual | $ | 1,000.00 | $ | 1,058.00 | $ | 4.93 | 0.95 | % | ||||||||
Hypothetical (5% return before expenses) | $ | 1,000.00 | $ | 1,020.42 | $ | 4.84 | 0.95 | % | ||||||||
Institutional Class | ||||||||||||||||
Actual | $ | 1,000.00 | $ | 1,057.00 | $ | 5.44 | 1.05 | % | ||||||||
Hypothetical (5% return before expenses) | $ | 1,000.00 | $ | 1,019.91 | $ | 5.35 | 1.05 | % | ||||||||
| 1 | Expenses paid is equal to the annualized net expense ratio of each class multiplied by the average account value over the period, multiplied by the number of days in the most recent fiscal half-year divided by the number of days in the fiscal year (to reflect the one-half-year period). |
8 | Wells Fargo Special International Small Cap Fund
Table of Contents
Portfolio of investments—October 31, 2019
| Shares | Value | |||||||||||||||
| Common Stocks: 95.47% | ||||||||||||||||
Australia: 6.20% | ||||||||||||||||
Ansell Limited (Health Care, Health Care Equipment & Supplies) | 9,093 | $ | 173,004 | |||||||||||||
Domino’s Pizza Enterprises Limited (Consumer Discretionary, Hotels, Restaurants & Leisure) | 4,401 | 154,756 | ||||||||||||||
| 327,760 | ||||||||||||||||
|
| |||||||||||||||
| Austria: 1.10% | ||||||||||||||||
Mayr-Melnhof Karton AG (Materials, Containers & Packaging) | 475 | 58,380 | ||||||||||||||
|
| |||||||||||||||
| Canada: 6.68% | ||||||||||||||||
Blackberry Limited (Information Technology, Software) † | 4,400 | 23,117 | ||||||||||||||
Cott Corporation (Consumer Staples, Beverages) | 8,400 | 107,910 | ||||||||||||||
Enerflex Limited (Energy, Energy Equipment & Services) | 2,600 | 20,372 | ||||||||||||||
MTY Food Group Incorporated (Consumer Discretionary, Hotels, Restaurants & Leisure) | 200 | 7,990 | ||||||||||||||
Mullen Group Limited (Industrials, Road & Rail) | 6,900 | 42,958 | ||||||||||||||
Parex Resources Incorporated (Energy, Oil, Gas & Consumable Fuels) † | 1,900 | 25,750 | ||||||||||||||
Stantec Incorporated (Industrials, Professional Services) | 4,100 | 87,472 | ||||||||||||||
Western Forest Products Incorporated (Materials, Paper & Forest Products) | 38,300 | 37,803 | ||||||||||||||
| 353,372 | ||||||||||||||||
|
| |||||||||||||||
| France: 7.37% | ||||||||||||||||
Alten SA (Information Technology, IT Services) | 1,480 | 162,506 | ||||||||||||||
M6 Métropole Télévision SA (Communication Services, Media) | 8,654 | 152,209 | ||||||||||||||
Mersen SA (Industrials, Electrical Equipment) | 1,726 | 56,114 | ||||||||||||||
Vicat SA (Materials, Construction Materials) | 447 | 18,944 | ||||||||||||||
| 389,773 | ||||||||||||||||
|
| |||||||||||||||
| Germany: 9.71% | ||||||||||||||||
Cancom SE (Information Technology, IT Services) | 1,000 | 53,356 | ||||||||||||||
Gerresheimer AG (Health Care, Life Sciences Tools & Services) | 1,582 | 127,478 | ||||||||||||||
Krones AG (Industrials, Machinery) | 885 | 57,890 | ||||||||||||||
SMA Solar Technology AG (Information Technology, Semiconductors & Semiconductor Equipment) † | 1,893 | 59,158 | ||||||||||||||
TAG Immobilien AG (Real Estate, Real Estate Management & Development) | 4,783 | 116,185 | ||||||||||||||
TLG Immobilien AG (Real Estate, Real Estate Management & Development) | 3,399 | 99,511 | ||||||||||||||
| 513,578 | ||||||||||||||||
|
| |||||||||||||||
| Hong Kong: 2.35% | ||||||||||||||||
Sunlight REIT (Real Estate, Equity REITs) | 183,000 | 124,243 | ||||||||||||||
|
| |||||||||||||||
| Ireland: 1.45% | ||||||||||||||||
Irish Residential Properties REIT plc (Real Estate, Equity REITs) | 39,190 | 76,752 | ||||||||||||||
|
| |||||||||||||||
| Italy: 3.00% | ||||||||||||||||
Autogrill SpA (Consumer Discretionary, Hotels, Restaurants & Leisure) | 3,040 | 30,023 | ||||||||||||||
De’Longhi SpA (Consumer Discretionary, Household Durables) | 3,863 | 71,089 | ||||||||||||||
Interpump Group SpA (Industrials, Machinery) | 2,107 | 57,714 | ||||||||||||||
| 158,826 | ||||||||||||||||
|
| |||||||||||||||
| Japan: 31.12% | ||||||||||||||||
Aeon Delight Company Limited (Industrials, Commercial Services & Supplies) | 4,400 | 154,014 | ||||||||||||||
Daiseki Company Limited (Industrials, Commercial Services & Supplies) | 3,600 | 105,843 | ||||||||||||||
DTS Corporation (Information Technology, IT Services) | 6,300 | 134,471 | ||||||||||||||
Fuji Seal International Incorporated (Materials, Containers & Packaging) | 5,100 | 127,512 | ||||||||||||||
Horiba Limited (Information Technology, Electronic Equipment, Instruments & Components) | 1,700 | 116,177 | ||||||||||||||
Kyushu Railway Company (Industrials, Road & Rail) | 1,800 | 59,672 | ||||||||||||||
The accompanying notes are an integral part of these financial statements.
Wells Fargo Special International Small Cap Fund | 9
Table of Contents
Portfolio of investments—October 31, 2019
| Shares | Value | |||||||||||||||
| Japan (continued) | ||||||||||||||||
Meitec Corporation (Industrials, Professional Services) | 3,100 | $ | 162,765 | |||||||||||||
Nihon Parkerizing Company Limited (Materials, Chemicals) | 11,500 | 136,628 | ||||||||||||||
ORIX JREIT Incorporated (Real Estate, Equity REITs) | 79 | 178,791 | ||||||||||||||
OSG Corporation (Industrials, Machinery) | 1,900 | 41,118 | ||||||||||||||
Paramount Bed Holdings Company Limited (Health Care, Health Care Equipment & Supplies) | 1,700 | 65,724 | ||||||||||||||
San-A Company Limited (Consumer Staples, Food & Staples Retailing) | 2,100 | 99,954 | ||||||||||||||
Sumitomo Warehouse Company Limited (Industrials, Transportation Infrastructure) | 7,600 | 103,876 | ||||||||||||||
Taikisha Limited (Industrials, Construction & Engineering) | 3,200 | 104,454 | ||||||||||||||
Toyo Suisan Kaisha Limited (Consumer Staples, Food Products) | 1,300 | 54,894 | ||||||||||||||
| 1,645,893 | ||||||||||||||||
|
| |||||||||||||||
| Netherlands: 1.74% | ||||||||||||||||
Brunel International NV (Industrials, Professional Services) | 4,152 | 38,342 | ||||||||||||||
IMCD Group NV (Industrials, Trading Companies & Distributors) | 689 | 53,714 | ||||||||||||||
| 92,056 | ||||||||||||||||
|
| |||||||||||||||
| Spain: 3.44% | ||||||||||||||||
Vidrala SA (Materials, Containers & Packaging) | 461 | 40,053 | ||||||||||||||
Viscofan SA (Consumer Staples, Food Products) | 2,619 | 141,901 | ||||||||||||||
| 181,954 | ||||||||||||||||
|
| |||||||||||||||
| Sweden: 1.76% | ||||||||||||||||
AAK AB (Consumer Staples, Food Products) | 1,805 | 31,985 | ||||||||||||||
Hexpol AB (Materials, Chemicals) | 6,856 | 61,064 | ||||||||||||||
| 93,049 | ||||||||||||||||
|
| |||||||||||||||
| Switzerland: 3.88% | ||||||||||||||||
Bossard Holding AG (Industrials, Trading Companies & Distributors) | 264 | 41,881 | ||||||||||||||
Bucher Industries AG (Industrials, Machinery) | 229 | 70,708 | ||||||||||||||
Dufry Group (Consumer Discretionary, Specialty Retail) | 370 | 32,098 | ||||||||||||||
OC Oerlikon Corporation AG (Industrials, Machinery) | 5,888 | 60,283 | ||||||||||||||
| 204,970 | ||||||||||||||||
|
| |||||||||||||||
| United Kingdom: 15.67% | ||||||||||||||||
Britvic plc (Consumer Staples, Beverages) | 11,998 | 153,396 | ||||||||||||||
Domino’s Pizza Group plc (Consumer Discretionary, Hotels, Restaurants & Leisure) | 34,525 | 127,860 | ||||||||||||||
Elementis plc (Materials, Chemicals) | 29,809 | 57,418 | ||||||||||||||
Hunting plc (Energy, Energy Equipment & Services) | 5,920 | 30,137 | ||||||||||||||
Mears Group plc (Industrials, Commercial Services & Supplies) | 8,043 | 26,567 | ||||||||||||||
Morgan Advanced Materials plc (Industrials, Machinery) | 21,966 | 67,037 | ||||||||||||||
NCC Group plc (Information Technology, IT Services) | 30,024 | 72,883 | ||||||||||||||
Nomad Foods Limited (Consumer Staples, Food Products) † | 5,770 | 112,573 | ||||||||||||||
Savills plc (Real Estate, Real Estate Management & Development) | 4,451 | 52,899 | ||||||||||||||
Spectris plc (Information Technology, Electronic Equipment, Instruments & Components) | 3,558 | 110,244 | ||||||||||||||
Vesuvius plc (Industrials, Machinery) | 3,377 | 17,471 | ||||||||||||||
| 828,485 | ||||||||||||||||
|
| |||||||||||||||
Total Common Stocks (Cost $4,846,740) | 5,049,091 | |||||||||||||||
|
| |||||||||||||||
The accompanying notes are an integral part of these financial statements.
10 | Wells Fargo Special International Small Cap Fund
Table of Contents
Portfolio of investments—October 31, 2019
| Yield | Shares | Value | ||||||||||||||
| Short-Term Investments: 4.99% | ||||||||||||||||
| Investment Companies: 4.99% | ||||||||||||||||
Wells Fargo Government Money Market Fund Select Class (l)(u) | 1.75 | % | 263,637 | $ | 263,637 | |||||||||||
|
| |||||||||||||||
Total Short-Term Investments (Cost $263,637) | 263,637 | |||||||||||||||
|
| |||||||||||||||
| Total investments in securities (Cost $5,110,377) | 100.46 | % | 5,312,728 | |||||
Other assets and liabilities, net | (0.46 | ) | (24,257 | ) | ||||
|
|
|
| |||||
| Total net assets | 100.00 | % | $ | 5,288,471 | ||||
|
|
|
| |||||
| † | Non-income-earning security |
| (l) | The issuer of the security is an affiliated person of the Fund as defined in the Investment Company Act of 1940. |
| (u) | The rate represents the 7-day annualized yield at period end. |
Abbreviations:
| REIT | Real estate investment trust |
Investments in Affiliates
An affiliated investment is an investment in which the Fund owns at least 5% of the outstanding voting shares of the issuer or as a result of other relationships, such as the Fund and the issuer having the same investment manager. Transactions with issuers that were either affiliated persons of the Fund at the beginning of the period or the end of the period were as follows:
| Shares, beginning of period | Shares purchased | Shares sold | Shares, end of period | Net gains | Net gains | Income from affiliated securities | Value, period | % of net assets | ||||||||||||||||||||||||||||
| Short-Term Investments | ||||||||||||||||||||||||||||||||||||
Investment Companies | ||||||||||||||||||||||||||||||||||||
Wells Fargo Government Money Market Fund Select Class | 0 | 5,450,824 | 5,187,187 | 263,637 | $ | 0 | $ | 0 | $ | 2,856 | $ | 263,637 | 4.99 | % | ||||||||||||||||||||||
The accompanying notes are an integral part of these financial statements.
Wells Fargo Special International Small Cap Fund | 11
Table of Contents
Statement of assets and liabilities—October 31, 2019
Assets | ||||
Investments in unaffiliated securities, at value (cost $4,846,740) | $ | 5,049,091 | ||
Investments in affiliated securities, at value (cost $263,637) | 263,637 | |||
Foreign currency, at value (cost $27,405) | 27,451 | |||
Receivable for investments sold | 9,013 | |||
Receivable for dividends | 16,075 | |||
Receivable from manager | 25,577 | |||
Prepaid expenses and other assets | 13,292 | |||
|
| |||
Total assets | 5,404,136 | |||
|
| |||
Liabilities | ||||
Payable for investments purchased | 41,132 | |||
Administration fees payable | 139 | |||
Shareholder report expenses payable | 19,508 | |||
Custodian and accounting fees payable | 16,548 | |||
Professional fees payable | 33,232 | |||
Trustees’ fees and expenses payable | 979 | |||
Accrued expenses and other liabilities | 4,127 | |||
|
| |||
Total liabilities | 115,665 | |||
|
| |||
Total net assets | $ | 5,288,471 | ||
|
| |||
Net assets consist of | ||||
Paid-in capital | $ | 5,000,000 | ||
Total distributable earnings | 288,471 | |||
|
| |||
Total net assets | $ | 5,288,471 | ||
|
| |||
Computation of net asset value per share | ||||
Net assets – Class R6 | $ | 5,182,744 | ||
Shares outstanding – Class R61 | 490,000 | |||
Net asset value per share – Class R6 | $10.58 | |||
Net assets – Institutional Class | $ | 105,727 | ||
Shares outstanding – Institutional Class1 | 10,000 | |||
Net asset value per share – Institutional Class | $10.57 | |||
| 1 | The Fund has an unlimited number of authorized shares. |
The accompanying notes are an integral part of these financial statements.
12 | Wells Fargo Special International Small Cap Fund
Table of Contents
Statement of operations—year ended October 31, 20191
Investment income | ||||
Dividends (net of foreign withholding taxes of $4,346) | $ | 43,344 | ||
Income from affiliated securities | 2,856 | |||
| �� |
|
| ||
Total investment income | 46,200 | |||
|
| |||
Expenses | ||||
Management fee | 20,030 | |||
Administration fees | ||||
Class R6 | 620 | |||
Institutional Class | 55 | |||
Custody and accounting fees | 16,548 | |||
Professional fees | 40,749 | |||
Registration fees | 26,146 | |||
Shareholder report expenses | 39,477 | |||
Trustees’ fees and expenses | 8,687 | |||
Other fees and expenses | 12,411 | |||
|
| |||
Total expenses | 164,723 | |||
Less: Fee waivers and/or expense reimbursements | ||||
Fund-level | (143,975 | ) | ||
Class R6 | (620 | ) | ||
Institutional Class | (55 | ) | ||
|
| |||
Net expenses | 20,073 | |||
|
| |||
Net investment income | 26,127 | |||
|
| |||
Realized and unrealized gains (losses) on investments | ||||
Net realized gains on investments | 59,852 | |||
Net change in unrealized gains (losses) on investments | 202,492 | |||
|
| |||
Net realized and unrealized gains (losses) on investments | 262,344 | |||
|
| |||
Net increase in net assets resulting from operations | $ | 288,471 | ||
|
| |||
| 1 | For the period from May 31, 2019 (commencement of operations) to October 31, 2019 |
The accompanying notes are an integral part of these financial statements.
Wells Fargo Special International Small Cap Fund | 13
Table of Contents
Statement of changes in net assets
| Year ended October 31, 20191 | ||||||||
Operations | ||||||||
Net investment income | $ | 26,127 | ||||||
Net realized gains on investments | 59,852 | |||||||
Net change in unrealized gains (losses) on investments | 202,492 | |||||||
|
| |||||||
Net increase in net assets resulting from operations | 288,471 | |||||||
|
| |||||||
Capital share transactions | Shares | |||||||
Proceeds from shares sold | ||||||||
Class R6 | 490,000 | 4,900,000 | ||||||
Institutional Class | 10,000 | 100,000 | ||||||
|
| |||||||
| 5,000,000 | ||||||||
|
| |||||||
Net increase in net assets resulting from capital share transactions | 5,000,000 | |||||||
|
| |||||||
Total increase in net assets | 5,288,471 | |||||||
|
| |||||||
Net assets | ||||||||
Beginning of period | 0 | |||||||
|
| |||||||
End of period | $ | 5,288,471 | ||||||
|
| |||||||
| 1 | For the period from May 31, 2019 (commencement of operations) to October 31, 2019 |
The accompanying notes are an integral part of these financial statements.
14 | Wells Fargo Special International Small Cap Fund
Table of Contents
(For a share outstanding throughout the period)
| CLASS R6 | Year ended October 31, 20191 | |||
Net asset value, beginning of period | $10.00 | |||
Net investment income | 0.05 | |||
Net realized and unrealized gains (losses) on investments | 0.53 | |||
|
| |||
Total from investment operations | 0.58 | |||
Net asset value, end of period | $10.58 | |||
Total return2 | 5.80 | % | ||
Ratios to average net assets (annualized) | ||||
Gross expenses | 7.81 | % | ||
Net expenses | 0.95 | % | ||
Net investment income | 1.24 | % | ||
Supplemental data | ||||
Portfolio turnover rate | 14 | % | ||
Net assets, end of period (000s omitted) | $5,183 | |||
| 1 | For the period from May 31, 2019 (commencement of class operations) to October 31, 2019 |
| 2 | Returns for periods of less than one year are not annualized. |
The accompanying notes are an integral part of these financial statements.
Wells Fargo Special International Small Cap Fund | 15
Table of Contents
Financial highlights
(For a share outstanding throughout the period)
| INSTITUTIONAL CLASS | Year ended October 31, 20191 | |||
Net asset value, beginning of period | $10.00 | |||
Net investment income | 0.05 | |||
Net realized and unrealized gains (losses) on investments | 0.52 | |||
|
| |||
Total from investment operations | 0.57 | |||
Net asset value, end of period | $10.57 | |||
Total return2 | 5.70 | % | ||
Ratios to average net assets (annualized) | ||||
Gross expenses | 7.91 | % | ||
Net expenses | 1.05 | % | ||
Net investment income | 1.14 | % | ||
Supplemental data | ||||
Portfolio turnover rate | 14 | % | ||
Net assets, end of period (000s omitted) | $106 | |||
| 1 | For the period from May 31, 2019 (commencement of class operations) to October 31, 2019 |
| 2 | Returns for periods of less than one year are not annualized. |
The accompanying notes are an integral part of these financial statements.
16 | Wells Fargo Special International Small Cap Fund
Table of Contents
1. ORGANIZATION
Wells Fargo Funds Trust (the “Trust”), a Delaware statutory trust organized on March 10, 1999, is an open-end management investment company registered under the Investment Company Act of 1940, as amended (the “1940 Act”). As an investment company, the Trust follows the accounting and reporting guidance in Financial Accounting Standards Board (“FASB”) Accounting Standards Codification Topic 946, Financial Services – Investment Companies. These financial statements report on the Wells Fargo Special International Small Cap Fund (the “Fund”) which is a diversified series of the Trust.
2. SIGNIFICANT ACCOUNTING POLICIES
The following significant accounting policies, which are consistently followed in the preparation of the financial statements of the Fund, are in conformity with U.S. generally accepted accounting principles which require management to make estimates and assumptions that affect the reported amounts of assets and liabilities, disclosure of contingent assets and liabilities at the date of the financial statements, and the reported amounts of revenues and expenses during the reporting period. Actual results could differ from those estimates.
Securities valuation
All investments are valued each business day as of the close of regular trading on the New York Stock Exchange (generally 4 p.m. Eastern Time), although the Fund may deviate from this calculation time under unusual or unexpected circumstances.
Equity securities that are listed on a foreign or domestic exchange or market are valued at the official closing price or, if none, the last sales price. If no sale occurs on the principal exchange or market that day, a fair value price will be determined in accordance with the Fund’s Valuation Procedures.
The values of securities denominated in foreign currencies are translated into U.S. dollars at rates provided by an independent foreign currency pricing source at a time each business day specified by the Wells Fargo Asset Management Pricing Committee at Wells Fargo Funds Management, LLC (“Funds Management”).
Many securities markets and exchanges outside the U.S. close prior to the close of the New York Stock Exchange and therefore may not fully reflect trading or events that occur after the close of the principal exchange in which the foreign securities are traded, but before the close of the New York Stock Exchange. If such trading or events are expected to materially affect the value of such securities, then fair value pricing procedures approved by the Board of Trustees of the Fund are applied. These procedures take into account multiple factors including movements in U.S. securities markets after foreign exchanges close. Foreign securities that are fair valued under these procedures are categorized as Level 2 and the application of these procedures may result in transfers between Level 1 and Level 2. Depending on market activity, such fair valuations may be frequent. Such fair value pricing may result in net asset values that are higher or lower than net asset values based on the last reported sales price or latest quoted bid price. On October 31, 2019, such fair value pricing was not used in pricing foreign securities.
Investments in registered open-end investment companies are valued at net asset value.
Investments which are not valued using any of the methods discussed above are valued at their fair value, as determined in good faith by the Board of Trustees. The Board of Trustees has established a Valuation Committee comprised of the Trustees and has delegated to it the authority to take any actions regarding the valuation of portfolio securities that the Valuation Committee deems necessary or appropriate, including determining the fair value of portfolio securities, unless the determination has been delegated to the Wells Fargo Asset Management Pricing Committee. The Board of Trustees retains the authority to make or ratify any valuation decisions or approve any changes to the Valuation Procedures as it deems appropriate. On a quarterly basis, the Board of Trustees receives reports on any valuation actions taken by the Valuation Committee or the Wells Fargo Asset Management Pricing Committee which may include items for ratification.
Foreign currency translation
The accounting records of the Fund are maintained in U.S. dollars. The values of other assets and liabilities denominated in foreign currencies are translated into U.S. dollars at rates provided by an independent foreign currency pricing source at a time each business day specified by the Wells Fargo Asset Management Pricing Committee. Purchases and sales of securities, and income and expenses are converted at the rate of exchange on the respective dates of such transactions. Net realized foreign exchange gains or losses arise from sales of foreign currencies, currency gains or losses realized between the trade and settlement dates on securities transactions, and the difference between the amounts of dividends, interest and foreign withholding taxes recorded and the U.S. dollar equivalent of the amounts actually paid or received. Net unrealized foreign exchange gains and losses arise from changes in the fair value of assets and liabilities other than investments in securities resulting from changes in exchange rates. The changes in net assets arising from changes in exchange rates of securities and the changes in net assets resulting from changes in market prices of securities are not separately presented. Such changes are included in net realized and unrealized gains or losses from investments.
Wells Fargo Special International Small Cap Fund | 17
Table of Contents
Notes to financial statements
Security transactions and income recognition
Securities transactions are recorded on a trade date basis. Realized gains or losses are recorded on the basis of identified cost.
Dividend income is recognized on the ex-dividend date, except for certain dividends from foreign securities, which are recorded as soon as the custodian verifies the ex-dividend date. Dividend income from foreign securities is recorded net of foreign taxes withheld where recovery of such taxes is not assured.
Distributions to shareholders
Distributions to shareholders from net investment income and any net realized gains are recorded on the ex-dividend date and paid at least annually. Such distributions are determined in accordance with income tax regulations and may differ from U.S. generally accepted accounting principles. Dividend sources are estimated at the time of declaration. The tax character of distributions is determined as of the Fund’s fiscal year end. Therefore, a portion of the Fund’s distributions made prior to the Fund’s fiscal year end may be categorized as a tax return of capital at year end.
Federal and other taxes
The Fund intends to qualify as a regulated investment company by distributing substantially all of its investment company taxable income and any net realized capital gains (after reduction for capital loss carryforwards) sufficient to relieve it from all, or substantially all, federal income taxes. Accordingly, no provision for federal income taxes was required.
The Fund is not subject to examination by federal and state tax authorities for taxes before 2019, the year the Fund commenced operations.
As of October 31, 2019, the aggregate cost of all investments for federal income tax purposes was $5,153,079 and the unrealized gains (losses) consisted of:
Gross unrealized gains | $ | 340,110 | ||
Gross unrealized losses | (180,461 | ) | ||
Net unrealized gains | $ | 159,649 | ||
Class allocations
The separate classes of shares offered by the Fund differ principally in administration fees. Class specific expenses are charged directly to that share class. Investment income, common fund-level expenses, and realized and unrealized gains (losses) on investments are allocated daily to each class of shares based on the relative proportion of net assets of each class.
3. FAIR VALUATION MEASUREMENTS
Fair value measurements of investments are determined within a framework that has established a fair value hierarchy based upon the various data inputs utilized in determining the value of the Fund’s investments. The three-level hierarchy gives the highest priority to unadjusted quoted prices in active markets for identical assets or liabilities (Level 1) and the lowest priority to unobservable inputs (Level 3). The Fund’s investments are classified within the fair value hierarchy based on the lowest level of input that is significant to the fair value measurement. The inputs are summarized into three broad levels as follows:
| ∎ | Level 1 – quoted prices in active markets for identical securities |
| ∎ | Level 2 – other significant observable inputs (including quoted prices for similar securities, interest rates, prepayment speeds, credit risk, etc.) |
| ∎ | Level 3 – significant unobservable inputs (including the Fund’s own assumptions in determining the fair value of investments) |
The inputs or methodologies used for valuing investments in securities are not necessarily an indication of the risk associated with investing in those securities.
18 | Wells Fargo Special International Small Cap Fund
Table of Contents
Notes to financial statements
The following is a summary of the inputs used in valuing the Fund’s assets and liabilities as of October 31, 2019:
| Quoted prices (Level 1) | Other significant observable inputs (Level 2) | Significant (Level 3) | Total | |||||||||||||
Assets | ||||||||||||||||
Investments in: | ||||||||||||||||
Common stocks | ||||||||||||||||
Australia | $ | 327,760 | $ | 0 | $ | 0 | $ | 327,760 | ||||||||
Austria | 58,380 | 0 | 0 | 58,380 | ||||||||||||
Canada | 353,372 | 0 | 0 | 353,372 | ||||||||||||
France | 389,773 | 0 | 0 | 389,773 | ||||||||||||
Germany | 513,578 | 0 | 0 | 513,578 | ||||||||||||
Hong Kong | 124,243 | 0 | 0 | 124,243 | ||||||||||||
Ireland | 76,752 | 0 | 0 | 76,752 | ||||||||||||
Italy | 158,826 | 0 | 0 | 158,826 | ||||||||||||
Japan | 1,645,893 | 0 | 0 | 1,645,893 | ||||||||||||
Netherlands | 92,056 | 0 | 0 | 92,056 | ||||||||||||
Spain | 181,954 | 0 | 0 | 181,954 | ||||||||||||
Sweden | 93,049 | 0 | 0 | 93,049 | ||||||||||||
Switzerland | 204,970 | 0 | 0 | 204,970 | ||||||||||||
United Kingdom | 828,485 | 0 | 0 | 828,485 | ||||||||||||
Short-term investments | ||||||||||||||||
Investment companies | 263,637 | 0 | 0 | 263,637 | ||||||||||||
Total assets | $ | 5,312,728 | $ | 0 | $ | 0 | $ | 5,312,728 | ||||||||
Additional sector, industry or geographic detail is included in the Portfolio of Investments.
For period from May 31, 2019 (commencement of operations) to October 31, 2019, the Fund did not have any transfers into/out of Level 3.
4. TRANSACTIONS WITH AFFILIATES
Management fee
Funds Management, an indirect wholly owned subsidiary of Wells Fargo & Company (“Wells Fargo”), is the manager of the Fund and provides advisory and fund-level administrative services under an investment management agreement. Under the investment management agreement, Funds Management is responsible for, among other services, implementing the investment objectives and strategies of the Fund, supervising the subadviser and providing fund-level administrative services in connection with the Fund’s operations. As compensation for its services under the investment management agreement, Funds Management is entitled to receive a management fee at the following annual rate based on the Fund’s average daily net assets:
| Average daily net assets | Management fee | |||
First $500 million | 0.950 | % | ||
Next $500 million | 0.925 | |||
Next $1 billion | 0.900 | |||
Next $2 billion | 0.875 | |||
Next $1 billion | 0.850 | |||
Next $5 billion | 0.840 | |||
Over $10 billion | 0.830 | |||
For period from May 31, 2019 (commencement of operations) to October 31, 2019, the management fee was equivalent to an annual rate of 0.95% of the Fund’s average daily net assets.
Wells Fargo Special International Small Cap Fund | 19
Table of Contents
Notes to financial statements
Funds Management has retained the services of a subadviser to provide daily portfolio management to the Fund. The fee for subadvisory services is borne by Funds Management. Wells Capital Management Incorporated (“WellsCap”), an affiliate of Funds Management and an indirect wholly owned subsidiary of Wells Fargo, is the subadviser to the Fund and is entitled to receive a fee from Funds Management at an annual rate starting at 0.55% and declining to 0.40% as the average daily net assets of the Fund increase.
Administration fees
Under a class-level administration agreement, Funds Management provides class-level administrative services to the Fund, which includes paying fees and expenses for services provided by the transfer agent, sub-transfer agents, omnibus account servicers and record-keepers. As compensation for its services under the class-level administration agreement, Funds Management receives an annual fee which is calculated based on the average daily net assets of each class as follows:
| Class-level administration fee | ||||
Class R6 | 0.03 | % | ||
Institutional Class | 0.13 | |||
Waivers and/or expense reimbursements
Funds Management has contractually waived and/or reimbursed management and administration fees to the extent necessary to maintain certain net operating expense ratios for the Fund. When each class of the Fund has exceeded its expense cap, Funds Management has waived fees and/or reimbursed expenses from fund-level expenses on a proportionate basis and then from class specific expenses. When only certain classes exceed their expense caps, waivers and/or reimbursements are applied against class specific expenses before fund-level expenses. Funds Management has committed through June 30, 2020, to waive fees and/or reimburse expenses to the extent necessary to cap the Fund’s expenses at 0.95% for Class R6 shares and 1.05% for Institutional Class shares. Prior to or after the commitment expiration date, the cap may be increased or the commitment to maintain the cap may be terminated only with the approval of the Board of Trustees.
Interfund transactions
The Fund may purchase or sell portfolio investment securities to certain other Wells Fargo affiliates pursuant to Rule 17a-7 under the 1940 Act and under procedures adopted by the Board of Trustees. The procedures have been designed to ensure that these interfund transactions, which do not incur broker commissions, are effected at current market prices.
5. INVESTMENT PORTFOLIO TRANSACTIONS
Purchases and sales of investments, excluding U.S. government obligations (if any) and short-term securities, for period from May 31, 2019 (commencement of operations) to October 31, 2019 were $5,485,673 and $698,173, respectively.
6. BANK BORROWINGS
The Trust (excluding the money market funds), Wells Fargo Master Trust and Wells Fargo Variable Trust are parties to a $280,000,000 revolving credit agreement whereby the Fund is permitted to use bank borrowings for temporary or emergency purposes, such as to fund shareholder redemption requests. Interest under the credit agreement is charged to the Fund based on a borrowing rate equal to the higher of the Federal Funds rate in effect on that day plus 1.25% or the overnight LIBOR rate in effect on that day plus 1.25%. In addition, an annual commitment fee equal to 0.25% of the unused balance is allocated to each participating fund.
For period from May 31, 2019 (commencement of operations) to October 31, 2019, there were no borrowings by the Fund under the agreement.
7. DISTRIBUTIONS TO SHAREHOLDERS
For period from May 31, 2019 (commencement of operations) to October 31, 2019, the Fund did not have any distributions paid to shareholders.
As of October 31, 2019, the components of distributable earnings on a tax basis were as follows:
Undistributed ordinary income | Unrealized gains | |
| $128,659 | $159,812 | |
20 | Wells Fargo Special International Small Cap Fund
Table of Contents
Notes to financial statements
8. CONCENTRATION RISKS
Concentration risks result from exposure to a limited number of sectors or geographic regions. As of the end of the period, the Fund invests a concentration of its portfolio in the industrials sector and in Japan. A fund that invests a substantial portion of its assets in any sector or geographic region may be more affected by changes in that sector or geographic region than would be a fund whose investments are not heavily weighted in any sector or geographic region.
9. INDEMNIFICATION
Under the Trust’s organizational documents, the officers and Trustees have been granted certain indemnification rights against certain liabilities that may arise out of performance of their duties to the Trust. At a meeting held on November 21-22, 2019, the Board of Trustees of the Fund approved a proposal to authorize the Fund to enter into a separate agreement with each Trustee that would convert indemnification rights currently existing under the Fund’s organizational documents into contractual rights that could not be changed in the future without the consent of the Trustee. Additionally, in the normal course of business, the Trust may enter into contracts with service providers that contain a variety of indemnification clauses. The Trust’s maximum exposure under these arrangements is dependent on future claims that may be made against the Fund and, therefore, cannot be estimated.
10. NEW ACCOUNTING PRONOUNCEMENT
In August 2018, FASB issued Accounting Standards Update (“ASU”) No. 2018-13, Fair Value Measurement (Topic 820)Disclosure Framework—Changes to the Disclosure Requirements for Fair Value Measurement. ASU 2018-13 updates the disclosure requirements for fair value measurements by modifying or removing certain disclosures and adding certain new disclosures. The amendments are effective for fiscal years, and interim periods within those fiscal years, beginning after December 15, 2019. Early adoption is permitted. Management has adopted the removal and modification of disclosures early, as permitted, and will adopt the additional new disclosures at the effective date.
Wells Fargo Special International Small Cap Fund | 21
Table of Contents
Report of independent registered public accounting firm
TO THE SHAREHOLDERS OF THE FUND AND BOARD OF TRUSTEES OF WELLS FARGO FUNDS TRUST:
Opinion on the Financial Statements
We have audited the accompanying statement of assets and liabilities of Wells Fargo Special International Small Cap Fund (the Fund), one of the funds constituting Wells Fargo Funds Trust, including the portfolio of investments, as of October 31, 2019, the related statements of operations and changes in net assets for the period from May 31, 2019 (commencement of operations) to October 31, 2019, and the related notes (collectively, the financial statements) and the financial highlights for the period from the commencement of operations to October 31, 2019. In our opinion, the financial statements and financial highlights present fairly, in all material respects, the financial position of the Fund as of October 31, 2019, the results of its operations, the changes in its net assets, and the financial highlights for the period from the commencement of operations to October 31, 2019, in conformity with U.S. generally accepted accounting principles.
Basis for Opinion
These financial statements and financial highlights are the responsibility of the Fund’s management. Our responsibility is to express an opinion on these financial statements and financial highlights based on our audits. We are a public accounting firm registered with the Public Company Accounting Oversight Board (United States) (PCAOB) and are required to be independent with respect to the Fund in accordance with the U.S. federal securities laws and the applicable rules and regulations of the Securities and Exchange Commission and the PCAOB.
We conducted our audits in accordance with the standards of the PCAOB. Those standards require that we plan and perform the audit to obtain reasonable assurance about whether the financial statements and financial highlights are free of material misstatement, whether due to error or fraud. Our audits included performing procedures to assess the risks of material misstatement of the financial statements and financial highlights, whether due to error or fraud, and performing procedures that respond to those risks. Such procedures included examining, on a test basis, evidence regarding the amounts and disclosures in the financial statements and financial highlights. Such procedures also included confirmation of securities owned as of October 31, 2019, by correspondence with the custodian, transfer agent and brokers, or by other appropriate auditing procedures. Our audits also included evaluating the accounting principles used and significant estimates made by management, as well as evaluating the overall presentation of the financial statements and financial highlights. We believe that our audits provide a reasonable basis for our opinion.

We have not been able to determine the specific year that we began serving as the auditor of one or more Wells Fargo Funds investment companies; however we are aware that we have served as the auditor of one or more Wells Fargo Funds investment companies since at least 1955.
Boston, Massachusetts
December 20, 2019
22 | Wells Fargo Special International Small Cap Fund
Table of Contents
PROXY VOTING INFORMATION
A description of the policies and procedures used to determine how to vote proxies relating to portfolio securities is available, upon request, by calling1-800-222-8222, visiting our website atwfam.com, or visiting the SEC website at sec.gov. Information regarding how the proxies related to portfolio securities were voted during the most recent 12-month period ended June 30 is available on the website atwfam.comor by visiting the SEC website at sec.gov.
QUARTERLY PORTFOLIO HOLDINGS INFORMATION
The Fund files its complete schedule of portfolio holdings with the SEC for the first and third quarters of each fiscal year on Form N-PORT, which is available by visiting the SEC website at sec.gov. These forms may be reviewed and copied at the SEC’s Public Reference Room in Washington, DC. Information on the operation of the Public Reference Room may be obtained by calling1-800-SEC-0330.
Wells Fargo Special International Small Cap Fund | 23
Table of Contents
Other information (unaudited)
BOARD OF TRUSTEES AND OFFICERS
Each of the Trustees and Officers1 listed in the table below acts in identical capacities for each fund in the Wells Fargo family of funds, which consists of 150 mutual funds comprising the Wells Fargo Funds Trust, Wells Fargo Variable Trust, Wells Fargo Master Trust and four closed-end funds (collectively the “Fund Complex”). This table should be read in conjunction with the Prospectus and the Statement of Additional Information2. The mailing address of each Trustee and Officer is 525 Market Street, 12th Floor, San Francisco, CA 94105. Each Trustee and Officer serves an indefinite term, however, each Trustee serves such term until reaching the mandatory retirement age established by the Trustees.
Independent Trustees
Name and year of birth | Position held and length of service* | Principal occupations during past five years or longer | Current other public company or investment | |||
William R. Ebsworth (Born 1957) | Trustee, since 2015 | Retired. From 1984 to 2013, equities analyst, portfolio manager, research director and chief investment officer at Fidelity Management and Research Company in Boston, Tokyo, and Hong Kong, and retired in 2013 as Chief Investment Officer of Fidelity Strategic Advisers, Inc. where he led a team of investment professionals managing client assets. Prior thereto, Board member of Hong Kong Securities Clearing Co., Hong Kong Options Clearing Corp., the Thailand International Fund, Ltd., Fidelity Investments Life Insurance Company, and Empire Fidelity Investments Life Insurance Company. Audit Committee Chair and Investment Committee Chair of the Vincent Memorial Hospital Endowment (non-profit organization). Mr. Ebsworth is a CFA® charterholder. | N/A | |||
Jane A. Freeman (Born 1953) | Trustee, since 2015; Chair Liaison, since 2018 | Retired. From 2012 to 2014 and 1999 to 2008, Chief Financial Officer of Scientific Learning Corporation. From 2008 to 2012, Ms. Freeman provided consulting services related to strategic business projects. Prior to 1999, Portfolio Manager at Rockefeller & Co. and Scudder, Stevens & Clark. Board member of the Harding Loevner Funds from 1996 to 2014, serving as both Lead Independent Director and chair of the Audit Committee. Board member of the Russell Exchange Traded Funds Trust from 2011 to 2012 and the chair of the Audit Committee. Ms. Freeman is a Board Member of The Ruth Bancroft Garden (non-profit organization). She is also an inactive Chartered Financial Analyst. | N/A | |||
Isaiah Harris, Jr. (Born 1952) | Trustee, since 2009; Audit Committee Chairman, since 2019 | Retired. Chairman of the Board of CIGNA Corporation since 2009, and Director since 2005. From 2003 to 2011, Director of Deluxe Corporation. Prior thereto, President and CEO of BellSouth Advertising and Publishing Corp. from 2005 to 2007, President and CEO of BellSouth Enterprises from 2004 to 2005 and President of BellSouth Consumer Services from 2000 to 2003. Emeritus member of the Iowa State University Foundation Board of Governors. Emeritus Member of the Advisory Board of Iowa State University School of Business. Advisory Board Member, Palm Harbor Academy (private school). Advisory Board Member, Child Evangelism Fellowship (non-profit). Mr. Harris is a certified public accountant (inactive status). | CIGNA Corporation | |||
Judith M. Johnson (Born 1949) | Trustee, since 2008; Audit Committee Chair, from 2009 to 2018 | Retired. Prior thereto, Chief Executive Officer and Chief Investment Officer of Minneapolis Employees Retirement Fund from 1996 to 2008. Ms. Johnson is an attorney, certified public accountant and a certified managerial accountant. | N/A | |||
24 | Wells Fargo Special International Small Cap Fund
Table of Contents
Other information (unaudited)
Name and year of birth | Position held and length of service* | Principal occupations during past five years or longer | Current other public company or investment | |||
David F. Larcker (Born 1950) | Trustee, since 2009 | James Irvin Miller Professor of Accounting at the Graduate School of Business, Stanford University, Director of the Corporate Governance Research Initiative and Senior Faculty of The Rock Center for Corporate Governance since 2006. From 2005 to 2008, Professor of Accounting at the Graduate School of Business, Stanford University. Prior thereto, Ernst & Young Professor of Accounting at The Wharton School, University of Pennsylvania from 1985 to 2005. | N/A | |||
Olivia S. Mitchell (Born 1953) | Trustee, since 2006; Nominating and Governance Committee Chairman, since 2018 | International Foundation of Employee Benefit Plans Professor, Wharton School of the University of Pennsylvania since 1993. Director of Wharton’s Pension Research Council and Boettner Center on Pensions & Retirement Research, and Research Associate at the National Bureau of Economic Research. Previously, Cornell University Professor from 1978 to 1993. | N/A | |||
Timothy J. Penny (Born 1951) | Trustee, since 1996; Chairman, since 2018 | President and Chief Executive Officer of Southern Minnesota Initiative Foundation, a non-profit organization, since 2007. Member of the Board of Trustees of NorthStar Education Finance, Inc., a non-profit organization, since 2007. | N/A | |||
James G. Polisson (Born 1959) | Trustee, since 2018 | Retired. Chief Marketing Officer, Source (ETF) UK Services, Ltd, from 2015 to 2017. From 2012 to 2015, Principal of The Polisson Group, LLC, a management consulting, corporate advisory and principal investing company. Chief Executive Officer and Managing Director at Russell Investments, Global Exchange Traded Funds from 2010 to 2012. Managing Director of Barclays Global Investors from 1998 to 2010 and Global Chief Marketing Officer for iShares and Barclays Global Investors from 2000 to 2010. Trustee of the San Francisco Mechanics’ Institute, a non-profit organization, from 2013 to 2015. Board member of the Russell Exchange Traded Fund Trust from 2011 to 2012. Director of Barclays Global Investors Holdings Deutschland GmbH from 2006 to 2009. Mr. Polisson is an attorney and has a retired status with the Massachusetts and District of Columbia Bar Associations. | N/A | |||
| Pamela Wheelock3 (Born 1959) | Trustee, since January 2020; previously Trustee from January 2018 to July 2019 | Board member of the Destination Medical Center Economic Development Agency, Rochester, Minnesota since 2019. Acting Commissioner, Minnesota Department of Human Services, July 2019 through September 2019. Human Services Manager (part-time), Minnesota Department of Human Services, October 2019 through December 2019. Chief Operating Officer, Twin Cities Habitat for Humanity from 2017 to 2019. Vice President of University Services, University of Minnesota from 2012 to 2016. Prior thereto, on the Board of Directors, Governance Committee and Finance Committee for the Minnesota Philanthropy Partners (Saint Paul Foundation) from 2012 to 2018, Interim Chief Executive Officer of Blue Cross Blue Shield of Minnesota from 2011 to 2012, Chairman of the Board from 2009 to 2012 and Board Director from 2003 to 2015. Vice President, Leadership and Community Engagement, Bush Foundation, Saint Paul, Minnesota (a private foundation) from 2009 to 2011. Executive Vice President and Chief Financial Officer, Minnesota Sports and Entertainment from 2004 to 2009 and Senior Vice President from 2002 to 2004. Executive Vice President of the Minnesota Wild Foundation from 2004 to 2008. Commissioner of Finance, State of Minnesota, from 1999 to 2002. Currently Board Chair of the Minnesota Wild Foundation since 2010. | N/A | |||
| * | Length of service dates reflect the Trustee’s commencement of service with the Trust’s predecessor entities, where applicable. |
Wells Fargo Special International Small Cap Fund | 25
Table of Contents
Other information (unaudited)
Officers
Name and year of birth | Position held and length of service | Principal occupations during past five years or longer | ||
Andrew Owen (Born 1960) | President, since 2017 | Executive Vice President of Wells Fargo & Company and Head of Affiliated Managers, Wells Fargo Asset Management, since 2014. In addition, Mr. Owen is currently President, Chief Executive Officer and Director of Wells Fargo Funds Management, LLC since 2017. Prior thereto, Executive Vice President responsible for marketing, investments and product development for Wells Fargo Funds Management, LLC, from 2009 to 2014. | ||
Jeremy DePalma1 (Born 1974) | Treasurer, since 2012 | Senior Vice President of Wells Fargo Funds Management, LLC since 2009. Senior Vice President of Evergreen Investment Management Company, LLC from 2008 to 2010 and head of the Fund Reporting and Control Team within Fund Administration from 2005 to 2010. | ||
Michelle Rhee4 (Born 1966) | Chief Legal Officer, since 2019 | Secretary of Wells Fargo Funds Management, LLC, Chief Legal Counsel of Wells Fargo Asset Management and Assistant General Counsel of Wells Fargo Bank, N.A. since 2018. Associate General Counsel and Managing Director of Bank of America Corporation from 2004 to 2018. | ||
Catherine Kennedy5 (Born 1969) | Secretary, since 2019 | Vice President of Wells Fargo Funds Management, LLC and Senior Counsel of the Wells Fargo Legal Department since 2010. Vice President and Senior Counsel of Evergreen Investment Management Company, LLC from 1998 to 2010. | ||
Michael H. Whitaker (Born 1967) | Chief Compliance Officer, since 2016 | Chief Compliance Officer of Wells Fargo Asset Management since 2016. Senior Vice President and Chief Compliance Officer for Fidelity Investments from 2007 to 2016. | ||
David Berardi (Born 1975) | Assistant Treasurer, since 2009 | Vice President of Wells Fargo Funds Management, LLC since 2009. Vice President of Evergreen Investment Management Company, LLC from 2008 to 2010. Manager of Fund Reporting and Control for Evergreen Investment Management Company, LLC from 2004 to 2010. | ||
| 1 | Jeremy DePalma acts as Treasurer of 86 funds and Assistant Treasurer of 64 funds in the Fund Complex. |
| 2 | The Statement of Additional Information includes additional information about the Trustees and is available, without charge, upon request, by calling 1-800-222-8222 or by visiting the website atwfam.com. |
| 3 | Ms. Wheelock was re-appointed to the Board effective January 1, 2020. |
| 4 | Michelle Rhee became Chief Legal Officer effective October 22, 2019. |
| 5 | Catherine Kennedy became Secretary effective October 22, 2019. |
26 | Wells Fargo Special International Small Cap Fund
Table of Contents
This page is intentionally left blank.
Table of Contents
This page is intentionally left blank.
Table of Contents
For more information
More information about Wells Fargo Funds is available free upon request. To obtain literature, please write, visit the Fund’s website, or call:
Wells Fargo Funds
P.O. Box 219967
Kansas City, MO 64121-9967
Website:wfam.com
Individual investors:1-800-222-8222
Retail investment professionals:1-888-877-9275
Institutional investment professionals:1-866-765-0778

This report and the financial statements contained herein are submitted for the general information of the shareholders of the Fund. If this report is used for promotional purposes, distribution of the report must be accompanied or preceded by a current prospectus. Before investing, please consider the investment objectives, risks, charges, and expenses of the investment. For a current prospectus and, if available, a summary prospectus, containing this information, call1-800-222-8222 or visit the Fund’s website atwfam.com. Read the prospectus carefully before you invest or send money.
Wells Fargo Asset Management (WFAM) is the trade name for certain investment advisory/management firms owned by Wells Fargo & Company. These firms include but are not limited to Wells Capital Management Incorporated and Wells Fargo Funds Management, LLC. Certain products managed by WFAM entities are distributed by Wells Fargo Funds Distributor, LLC (a broker-dealer and Member FINRA).
This material is for general informational and educational purposes only and is NOT intended to provide investment advice or a recommendation of any kind—including a recommendation for any specific investment, strategy, or plan.
INVESTMENT PRODUCTS: NOT FDIC INSURED ◾ NO BANK GUARANTEE ◾ MAY LOSE VALUE
© 2019 Wells Fargo & Company. All rights reserved.
408971 12-19
A296/AR296 10-19
Table of Contents
ITEM 2. CODE OF ETHICS
(a) As of the end of the period covered by the report, Wells Fargo Funds Trust has adopted a code of ethics that applies to its President and Treasurer. A copy of the code of ethics is filed as an exhibit to this FormN-CSR.
(c) During the period covered by this report, there were no amendments to the provisions of the code of ethics adopted in Item 2(a) above.
(d) During the period covered by this report, there were no implicit or explicit waivers to the provisions of the code of ethics adopted in Item 2(a) above.
ITEM 3. AUDIT COMMITTEE FINANCIAL EXPERT
The Board of Trustees of Wells Fargo Funds Trust has determined that Judith Johnson is an audit committee financial expert, as defined in Item 3 of FormN-CSR. Mrs. Johnson is independent for purposes of Item 3 of FormN-CSR.
ITEM 4. PRINCIPAL ACCOUNTANT FEES AND SERVICES
(a), (b), (c), (d) The following table presents aggregate fees billed in each of the last two fiscal years for services rendered to the Registrant by the Registrant’s principal accountant. These fees were billed to the registrant and were approved by the Registrant’s audit committee.
| Fiscal year ended October 31, 2019 | Fiscal year ended October 31, 2018 | |||||||
Audit fees | $ | 296,285 | $ | 254,758 | ||||
Audit-related fees | — | — | ||||||
Tax fees (1) | 39,175 | 37,560 | ||||||
All other fees | — | — | ||||||
|
|
|
| |||||
| $ | 335,460 | $ | 292,318 | |||||
|
|
|
| |||||
| (1) | Tax fees consist of fees for tax compliance, tax advice, tax planning and excise tax. |
Table of Contents
(e) The Chairman of the Audit Committees is authorized topre-approve: (1) audit services for the mutual funds of Wells Fargo Funds Trust;(2) non-audit tax or compliance consulting or training services provided to the Funds by the independent auditors (“Auditors”) if the fees for any particular engagement are not anticipated to exceed $50,000; and(3) non-audit tax or compliance consulting or training services provided by the Auditors to a Fund’s investment adviser and its controlling entities (wherepre-approval is required because the engagement relates directly to the operations and financial reporting of the Fund) if the fee to the Auditors for any particular engagement is not anticipated to exceed $50,000. For any suchpre-approval sought from the Chairman, Management shall prepare a brief description of the proposed services.
If the Chairman approves of such service, he or she shall sign the statement prepared by Management.
Such written statement shall be presented to the full Committees at their next regularly scheduled meetings.
(f) Not applicable
(g) Not applicable
(h) Not applicable
ITEM 5. AUDIT COMMITTEE OF LISTED REGISTRANTS
Not applicable.
ITEM 6. INVESTMENTS
A Portfolio of Investments for each series of Wells Fargo Funds Trust is included as part of the report to shareholders filed under Item 1 of this Form.
Table of Contents
ITEM 7. DISCLOSURE OF PROXY VOTING POLICIES AND PROCEDURES FORCLOSED-END MANAGEMENT INVESTMENT COMPANIES
Not applicable.
ITEM 8. PORTFOLIO MANAGERS OFCLOSED-END MANAGEMENT INVESTMENT COMPANIES
Not applicable.
ITEM 9. PURCHASES OF EQUITY SECURITIES BYCLOSED-END MANAGEMENT INVESTMENT COMPANY AND AFFILIATED PURCHASERS
Not applicable.
ITEM 10. SUBMISSION OF MATTERS TO A VOTE OF SECURITY HOLDERS
There have been no material changes to the procedures by which shareholders may recommend nominees to the registrant’s Board of Trustees that have been implemented since the registrant’s last provided disclosure in response to the requirements of this Item.
ITEM 11. CONTROLS AND PROCEDURES
(a) The President and Treasurer have concluded that the Wells Fargo Funds Trust disclosure controls and procedures (as defined in Rule30a-3(c) under the Investment Company Act of 1940) provide reasonable assurances that material information relating to the registrant is made known to them by the appropriate persons based on their evaluation of these controls and procedures as of a date within 90 days of the filing of this report.
Table of Contents
(b) There were no significant changes in the registrant’s internal controls over financial reporting (as defined in Rule30a-3(d) under the Investment Company Act of 1940) that occurred during the most recent fiscal half-year of the period covered by this report that materially affected, or is reasonably likely to materially affect, the registrant’s internal control over financial reporting.
ITEM 12. DISCLOSURES OF SECURITIES LENDING ACTIVITIES FORCLOSED-END MANAGEMENT INVESTMENT COMPANIES
Not applicable.
ITEM 13. EXHIBITS
(a)(1) Code of Ethics pursuant to Item 2 of FormN-CSR is filed and attached hereto as Exhibit COE.
(a)(2) Certification pursuant to Rule30a-2(a) under the Investment Company Act of 1940 (17 CFR270.30a-2(a)) is filed and attached hereto as Exhibit 99.CERT.
(b) Certification pursuant to Rule30a-2(b) under the Investment Company Act of 1940 (17 CFR270.30a-2(b)) is filed and attached hereto as Exhibit 99.906CERT.
Table of Contents
SIGNATURES
Pursuant to the requirements of the Securities Exchange Act of 1934 and the Investment Company Act of 1940, the registrant has duly caused this report to be signed on its behalf by the undersigned, thereunto duly authorized.
| Wells Fargo Funds Trust | ||
| By: | ||
| /s/ Andrew Owen | ||
| Andrew Owen | ||
| President | ||
| Date: | December 19, 2019 | |
Pursuant to the requirements of the Securities Exchange Act of 1934 and the Investment Company Act of 1940, this report has been signed below by the following persons on behalf of the registrant and in the capacities and on the date indicated.
| Wells Fargo Funds Trust | ||
| By: | ||
| /s/ Andrew Owen | ||
| Andrew Owen | ||
| President | ||
| Date: | December 19, 2019 | |
Table of Contents
| By: | ||
| /s/ Jeremy DePalma | ||
| Jeremy DePalma | ||
| Treasurer | ||
| Date: | December 19, 2019 | |